Is Financial Information Influencing the Reporting on SDGs ...
34
sustainability Article Is Financial Information Influencing the Reporting on SDGs? Empirical Evidence from Central and Eastern European Chemical Companies Elena Nechita *, Cristina Lidia Manea, Elena-Mirela Nichita, Alina-Mihaela Irimescu and Diana Manea Department of Accounting and Auditing, Faculty of Accounting and Management Information Systems, Bucharest University of Economic Studies, Piat , a Romană 6, 1st District, 010374 Bucharest, Romania; [email protected] (C.L.M.); [email protected] (E.-M.N.); [email protected] (A.-M.I.); [email protected] (D.M.) * Correspondence: [email protected] Received: 9 September 2020; Accepted: 4 November 2020; Published: 6 November 2020 Abstract: Since the adoption of the sustainable development goals (SDGs) endorsed by United Nations in 2015, which envision an ambitious representation of what the world could look like in the upcoming years, companies have been employing different approaches to identify and report on their contributions to the SDGs, albeit facing various difficulties due to the goals’ novelty, legislative deficiencies, and the complexity of connections between SDGs and business performance. In this context, the relationship between sustainability practices and firms’ financial performance has attracted much attention among researchers. Consequently, this research is focusing on determining to what extent the financial indicators disclosed in the annual reports are impacting the quality of non-financial reporting based on SDGs in the case of chemical companies operating in Central and Eastern European countries (Czech Republic, Hungary, Poland, Romania and Slovakia), within the time frame of 2015–2019. To reach our objective, a score-based content analysis was applied to assess the measure of SDGs achievement, and subsequently, the SDG score was used in multiple linear regression models with several financial data-based independent variables. The main findings highlight the companies’ contribution to the SDGs, particularly to those addressing the environment and decent work conditions for employees, and suggest that the research and development costs and other intangibles represent the most influential variable in explaining the variation in the firms’ SDG score. Academics, businesses and legislative bodies may find these results valuable in their corresponding activities: theoretical, pragmatic or statutory. Keywords: sustainable development goals (SDGs); sustainability; financial and non-financial reporting; CEE countries; chemical companies; content analysis; regression models 1. Introduction The United Nations (UN) Agenda [1] proposes 17 ambitious sustainable development goals (SDGs) for a better life (as disclosed in Appendix A, Table A1) envisioning a mixture of global thinking and local acting. Additionally, the UN Agenda opens up the considerations about sustainable development and the call for new approaches to measure performance, to develop business models oriented toward sustainability, and to integrate sustainable procedures with the reporting structures. Sometimes, improvement towards one goal might reinforce or even harm progress towards another SDG and it is, therefore, critical to understand the SDGs’ relationships and to construct the most original arrangement to achieve the maximum for each goal. The interlinked nature of the goals has been researched and confirmed by recent studies [2–7]. Sustainability 2020, 12, 9251; doi:10.3390/su12219251 www.mdpi.com/journal/sustainability
-
Upload
khangminh22 -
Category
Documents
-
view
2 -
download
0
Transcript of Is Financial Information Influencing the Reporting on SDGs ...

sustainability
Article
Is Financial Information Influencing the Reporting onSDGs? Empirical Evidence from Central and EasternEuropean Chemical Companies
Elena Nechita *, Cristina Lidia Manea, Elena-Mirela Nichita, Alina-Mihaela Irimescu andDiana Manea
Department of Accounting and Auditing, Faculty of Accounting and Management Information Systems,Bucharest University of Economic Studies, Piat,a Romană 6, 1st District, 010374 Bucharest, Romania;[email protected] (C.L.M.); [email protected] (E.-M.N.); [email protected] (A.-M.I.);[email protected] (D.M.)* Correspondence: [email protected]
Received: 9 September 2020; Accepted: 4 November 2020; Published: 6 November 2020�����������������
Abstract: Since the adoption of the sustainable development goals (SDGs) endorsed by UnitedNations in 2015, which envision an ambitious representation of what the world could look like inthe upcoming years, companies have been employing different approaches to identify and reporton their contributions to the SDGs, albeit facing various difficulties due to the goals’ novelty,legislative deficiencies, and the complexity of connections between SDGs and business performance.In this context, the relationship between sustainability practices and firms’ financial performance hasattracted much attention among researchers. Consequently, this research is focusing on determiningto what extent the financial indicators disclosed in the annual reports are impacting the quality ofnon-financial reporting based on SDGs in the case of chemical companies operating in Central andEastern European countries (Czech Republic, Hungary, Poland, Romania and Slovakia), within thetime frame of 2015–2019. To reach our objective, a score-based content analysis was applied toassess the measure of SDGs achievement, and subsequently, the SDG score was used in multiplelinear regression models with several financial data-based independent variables. The main findingshighlight the companies’ contribution to the SDGs, particularly to those addressing the environmentand decent work conditions for employees, and suggest that the research and development costsand other intangibles represent the most influential variable in explaining the variation in the firms’SDG score. Academics, businesses and legislative bodies may find these results valuable in theircorresponding activities: theoretical, pragmatic or statutory.
Keywords: sustainable development goals (SDGs); sustainability; financial and non-financialreporting; CEE countries; chemical companies; content analysis; regression models
1. Introduction
The United Nations (UN) Agenda [1] proposes 17 ambitious sustainable development goals (SDGs)for a better life (as disclosed in Appendix A, Table A1) envisioning a mixture of global thinking andlocal acting. Additionally, the UN Agenda opens up the considerations about sustainable developmentand the call for new approaches to measure performance, to develop business models oriented towardsustainability, and to integrate sustainable procedures with the reporting structures.
Sometimes, improvement towards one goal might reinforce or even harm progress towardsanother SDG and it is, therefore, critical to understand the SDGs’ relationships and to construct themost original arrangement to achieve the maximum for each goal. The interlinked nature of the goalshas been researched and confirmed by recent studies [2–7].
Sustainability 2020, 12, 9251; doi:10.3390/su12219251 www.mdpi.com/journal/sustainability

Sustainability 2020, 12, 9251 2 of 34
At the business level, the preference on reporting SDGs is through non-financial information,under a variety of labels, recurrently as: Sustainability Report, Corporate Responsibility Report,Integrated Report, CSR Report, Non-financial Performance Statement, for the reason that themulti-faceted construction of the SDGs is analogous with non-financial reporting, which includesinformation concerning economic performance, environmental and social impact, health matters,demonstrating the link between corporate strategy and commitment to a sustainable global economy [8].
A valuable non-financial report should include both positive and negative impact on thesurroundings where the company is based, the company’s environmental and social data, and therelationship to sustainable development. In these circumstances, the European Union (EU) decidedto make mandatory the disclosure of non-financial information provided by large companies andgroups (defined based on the number of employees, namely, higher than 500), publishing in 2014 theNon-Financial Reporting Directive (Directive 2014/95/EU) [9].
The relationship between sustainability practices and the financial performance of companies hasattracted much attention among researchers [10–21]. Although the sustainability reports have beenincreasing in number [22–26], several authors have expressed concern with respect to the degree towhich sustainability reports accurately and completely portray corporate social and environmentalimpacts [24,27,28].
The current study aims to determine to what extent the corporates’ financial indicators impactthe quality of sustainability reporting based on SDGs in the case of chemical companies operating inCentral and Eastern European (CEE) countries during 2015–2019. To this end, firstly, we developedand assigned an SDG score using information disclosed in the non-financial reports, considering bothqualitative and quantitative aspects. Secondly, we extracted financial data in order to measure theirinfluence on the SDGs reporting, by applying four multiple linear regression models, that havethe previously computed SDG score series as dependent variable, demonstrating the accountingrigorousness to be an essential feature for attaining financial results consistent with the goals ofsustainable development [29–32].
The main conclusions highlight the preoccupation shown by companies on reporting thegoals, with an emphasis on guaranteeing decent and proper work conditions for employees,the implementation of a sustainable supply chain, promoting activities for reducing the pollution ofwater, air, as well as waste management. The corresponding SDGs were allocated with the maximumscore level (5), this also being explained by the fact that the analysed companies operate in thechemical sector. With respect to the influence of financial indicators on the quality of SDGs reporting,return on assets has the lowest impact on the quality of sustainability reporting based on the SDG score,whereas the contribution of research and development (R&D) costs and other intangibles resulted to besubstantial, as a consequence of the essential role played by R&D in the advancements to innovationand technology within the chemical industry.
The remainder of this paper is structured as follows. The next section reviews the relevantliterature debating SDGs reporting and sets the background of the study. This is followed by thepresentation of data and research methodology used in the investigation. The fourth section showsthe empirical findings and discusses the results. The final section provides some concluding remarks,implications and limitations of the research.
This exploration might be noteworthy from several perspectives: for scholars, by enriching theacademic literature discussing the association of financial and non-financial reporting related to SDGs;for investors, with an increased interest in environmental, social and governance information byhelping them understand what SDG reporting they should be looking for and requesting from thecompanies they intend to invest in; for decision makers, by offering assistance in ascertaining thefinancial indicators that have the greatest impact in contributing to the achievement of the SustainableDevelopment Goals.

Sustainability 2020, 12, 9251 3 of 34
2. Literature Review
Sustainable development refers to the overall impact of sustainable action and was initiallyonly characterised as responsible use of natural resources [33]. The idea of sustainability residesin three pillars: “economic development,” “social development” and “environmental protection,”known as the “Triple Bottom Line” approach. In 1996, Deegan and Rankin [34] alerted that only adisplay of environmental information is solely favourable to the corporation’s image, but in order tobe sustainable, companies should extensively act on all three pillars of contemporary performance:financial, environmental and social, generating a helix of transformational effects, objectively reportingboth positive and negative facts and figures.
The pathways to sustainable development will not be identified through a top-down approach,but through highly strengthening our era by building a networked problem-solving system that engagesthe world’s universities, businesses, nongovernmental organisations, governments, and especiallyyoung people, who should become the experts and leaders of these new and profoundly challengingtimes [35]. The involvement of the new talented generations will contribute to creating symbiosis andharmony between the economic, social and environmental pillars [36], in order for them to naturally andsynchronically progress together as a triple helix. This approach comes as a necessity in a global contextcharacterised by the influence of social media and information technology, where problem-solvingnetworks involving governments, international institutions, private business, academia workingtogether for achieving sustainable development will play a crucial role in the years ahead.
Sustainable development goals may require a new way of thinking, because the goals arecomplex and interconnected, and their success likely depends on partnerships between business,governments and civil society [24]. According to PwC’s survey [26], more and more companiesperceive strategic value in SDG; this study, based on 470 companies from 17 countries operatingin six broad industries, endorsed PwC to conclude that 62% companies mentioned SDGs in theirreporting. An additional study conducted by Corporate Citizenship agency [23] found that 41% ofthe 240 analysed companies have done some form of mapping or prioritization of the SDGs to whichthey most contribute. On the other hand, KPMG’s survey published in 2018 [25] underlines that75% of 250 largest companies included in their study discuss the impact of SDGs on their business,but reporting is predominantly unbalanced with most entities providing their positive impacts, but notthe negative effects.
The SDGs make available a common framework that guides corporations to be more accountableabout their influences and performance to their stakeholders, as well as to improve partnershipand collaboration opportunities to address sustainable challenges. Different companies have beenemploying different approaches to identify and report on their contributions to the SDGs, as wellas to identify opportunities to align their business strategies with the SDGs, for the reason that eachcorporation has its own personality and history just as a person does. Its body of knowledge andexpertise is unique and its circumstances are characteristic to its own experience and environment [37,38].Mori et al.’s research [38] found that significant and transparent disclosure on the measurement ofany contribution made with respect to the SDGs is not yet common practice among the assessedcompanies because non-financial reporting is newly regulated. In Europe, the UN Parliament adoptedin 2014 the Non-Financial Reporting Directive (Directive 2014/95/EU10), which requires Europe’slargest corporations to publish sustainable reports. This directive is a cornerstone of the evolutionof sustainability reporting, but not the only frontier in which such reporting is taking shape as awell-regulated framework [39,40]. Managing corporate sustainability entails the analysis of the impactsof social and environmental initiatives on the overall corporate profitability [41].
The benefits of sustainability reporting go beyond relating business financial risk and opportunityto performance along economic, social and planet dimensions and establishing certification to operate.Sustainability disclosure can serve as a differentiator in competitive industries and foster investors’confidence, trust and employees’ loyalty [42]. Tenuta [43] advocates that the sustainability report isthe most operative instrument to relate the business with its stakeholders. Investors often consider

Sustainability 2020, 12, 9251 4 of 34
a company’s sustainability disclosures in their assessment of portfolios [44,45], and reporting mayprovide corporations with better access to capital [46]. In a review of more than 7000 sustainabilityreports from around the globe, researchers found that sustainability disclosures are being used tohelp analysts determine corporations’ values and that sustainability disclosures may reduce forecastinaccuracy by approximately 10% [47].
Decades ago, Belkaoui [48] and Sturdivant and Ginter [49] investigated the relationship betweensustainability, in terms of corporate social responsibility, and performance, validating not only anassociation between management values and corporate social responsiveness, but also that companieswith strong social involvement generally enjoy better financial performance than their less responsiveindustry counterparts. Similarly, the positive relationship between sustainability and performancewas confirmed by Ameer and Othman [11], as well as Alshehhi et al. [10] when they investigated thesustainability practices influence on financial ratios, defined as return on assets, profit before taxation,and cash flow from operations. Bnouni [50] demonstrates a positive, but marginal, relationshipbetween sustainability (as CSR) and financial performance across 80 French small and medium-sizedenterprises, and reaches the conclusion that the positive effect of sustainability does not just occurin large organisations. Systematic review piloted by Muhmad and Muhamad [51] highlighted thatabout 96% of the publications reported a positive relationship between sustainability practices and thefinancial performance of companies.
On the contrary, Lopez et al. [52] studies the influence of economic, environmental and socialindicators of 55 companies on the Dow Jones Sustainability Index and 55 companies on the DowJones Global Index, concluding with a negative relationship between sustainability and corporateperformance within the analysed time frame of 1998–2004.
Contemporary times lead to improvements of reporting non-financial aspects with respect toenvironment, people, ethics and governance, and, nowadays, the corporate social responsibility isshaped and converted into sustainable development goals (SDGs). In 2017, KPMG [40] identified theincreasing role of the SDGs for corporate responsibility as a key trend and the study published by PwCin 2015 [53] acknowledged that 71% of surveyed businesses plan on developing measures to attemptmeeting the SDGs. Therefore, the academic literature is growing in assessing the progress in thecorporates’ accomplishment of SDGs, either in single-country analyses [36,38,54–58] or multi-countriesanalyses [28,59,60].
Investigations of SDGs by industries are conducted by Cosma et al. [61] proving considerationsfrom SDG reporting by European banks, Jones et al. [62] outlining the concept of SDG in informationtechnology and communications (ITC), and Rao et al. [63] addressing the contribution of agricultureand allied activities towards achieving the SDGs. At the chemical industry-level, Zimara andEidam [58] examined the sustainability disclosure highlighting the diverse structure of the 14 selectedcompanies’ reports. Complementarily, this research states that more than 70% of the companies committhemselves to the principles on human rights, labour standards, environmental protection, and fightagainst corruption.
The model of sustainable development is unfamiliar for companies operating in CEE countries and,in some way, this is considered a targeted development challenge [64,65]. For countries part of CEE,the post-communist era (1990 upward) has come with many structural ups and downs accompaniedby uncertainties; these countries face socioeconomic difficulties, as high unemployment rates, high rateof emigration, low purchasing power of households, political hesitations and the quality of legislation,to name a few.
To our knowledge, non-financial reporting, in general, and SDGs reporting, in particular, are scarcewhen it comes to European emerging economies. In this setting, the current investigation intendsto provide answers to the following research questions concerning chemical companies operating inCzech Republic (CZ), Hungary (HU), Poland (PL), Romania (RO) and Slovakia (SK):
1. Employing a score-based approach, what are these companies’ advancements in achievingthe SDGs?

Sustainability 2020, 12, 9251 5 of 34
2. To what degree do financial data influence the SDGs reporting, measured in terms of the previouslydefined score?
3. Research Methodology
The research methodology is structured hereafter in three main subsections. The first relates tothe data collection process and sample details, the second corresponds to the SDG score computationbased on content analysis, and a third section refers to the empirical approach for testing the influenceof financial indicators on sustainability reporting, based on several multiple linear regression models.
The analysis is focused on the chemical sector companies. Generally, the SDG prioritizationdepends on the company’s industry level. There are industries where a direct link can be easilyidentified between one goal and the characteristics of the companies’ activities within a sector, such asfood companies—SDG 2 Zero hunger, pharmaceutical firms—SDG 3 Good health and well-being,or energy corporates—SDG 7 Affordable and clean energy [66], but also industries with harmful effectson the environment, implying indirect connections to more different goals. Moreover, the chemicalsector is an important supplier of products and services to practically every other industry, being one ofthe most diversified of all industries [67], and thus it interacts with an extensive number of SDGs [68],such as SDG 6 Clean water and sanitation, SDG 7 Affordable and clean energy and SDG 13 Climateaction. According to the European Environment Agency (EEA) [69], the chemical industry is one ofthe top 10 main polluting industries, in terms of air and water pollution, as well as waste generation,hence having a significant impact on the sustainable development goals.
In addition, with reference to the choice of the 5 CEE countries included in the analysis, based onthe same data provided by the EEA interactive platform, the countries’ industrial pollution profilesshow that Poland, Czech Republic, Romania, Hungary and Slovakia are the greatest contributors fromthe Central and Eastern European region in terms of gross value added (GVA), as revealed in Figure 1.
Sustainability 2020, 12, 9251 5 of 36
3. Research Methodology
The research methodology is structured hereafter in three main subsections. The first relates to
the data collection process and sample details, the second corresponds to the SDG score computation
based on content analysis, and a third section refers to the empirical approach for testing the influence
of financial indicators on sustainability reporting, based on several multiple linear regression models.
The analysis is focused on the chemical sector companies. Generally, the SDG prioritization
depends on the company’s industry level. There are industries where a direct link can be easily
identified between one goal and the characteristics of the companies’ activities within a sector, such
as food companies—SDG 2 Zero hunger, pharmaceutical firms—SDG 3 Good health and well-being,
or energy corporates—SDG 7 Affordable and clean energy [66], but also industries with harmful
effects on the environment, implying indirect connections to more different goals. Moreover, the
chemical sector is an important supplier of products and services to practically every other industry,
being one of the most diversified of all industries [67], and thus it interacts with an extensive number
of SDGs [68], such as SDG 6 Clean water and sanitation, SDG 7 Affordable and clean energy and SDG
13 Climate action. According to the European Environment Agency (EEA) [69], the chemical industry
is one of the top 10 main polluting industries, in terms of air and water pollution, as well as waste
generation, hence having a significant impact on the sustainable development goals.
In addition, with reference to the choice of the 5 CEE countries included in the analysis, based
on the same data provided by the EEA interactive platform, the countries’ industrial pollution
profiles show that Poland, Czech Republic, Romania, Hungary and Slovakia are the greatest
contributors from the Central and Eastern European region in terms of gross value added (GVA), as
revealed in Figure 1.
Figure 1. Central and Eastern European (CEE) countries and their contribution to gross value added
(GVA) from industry (%), based on data from EEA [70].
Accordingly, CEE countries add up to 6.98% of the European GVA from industry, of which
5.74%—representing 82.23% of the CEE countries contribution—comes from the first five countries
included in the analysed sample (PL, CZ, RO, HU and SK). The rest of 93.02% of the total GVA from
industrial activities is generated by the other European countries.
3.1. Data Collection and Sample Information
The sample of firms used in this study was initially drawn from the ISI Emerging Markets
Group’s EMIS platform database [70], the first 20 companies operating in the chemicals industry and
sorted by their operating revenue being selected for each of the 5 CEE countries included in the
analysis. We focus on the time frame of 2015–2019, which is the period immediately following the
UN announcement of the 17 sustainable development goals. After identifying the firms, several
screens were applied in selecting the final sample. Firstly, we checked for the availability of the
2.52
1.06
1.05
0.64
0.47
0.28
0.24
0.24
0.22
0.14
0.12
0.00 0.50 1.00 1.50 2.00 2.50 3.00
Poland
Czech Republic
Romania
Hungary
Slovakia
Bulgaria
Croatia
Slovenia
Lithuania
Latvia
Estonia
Figure 1. Central and Eastern European (CEE) countries and their contribution to gross value added(GVA) from industry (%), based on data from EEA [70].
Accordingly, CEE countries add up to 6.98% of the European GVA from industry, of which5.74%—representing 82.23% of the CEE countries contribution—comes from the first five countriesincluded in the analysed sample (PL, CZ, RO, HU and SK). The rest of 93.02% of the total GVA fromindustrial activities is generated by the other European countries.
3.1. Data Collection and Sample Information
The sample of firms used in this study was initially drawn from the ISI Emerging Markets Group’sEMIS platform database [70], the first 20 companies operating in the chemicals industry and sorted by

Sustainability 2020, 12, 9251 6 of 34
their operating revenue being selected for each of the 5 CEE countries included in the analysis. We focuson the time frame of 2015–2019, which is the period immediately following the UN announcementof the 17 sustainable development goals. After identifying the firms, several screens were applied inselecting the final sample. Firstly, we checked for the availability of the companies’ reports in Englishon their websites. To this respect, all types of reports were considered, from sustainability and CSRreports to annual financial reports, and other information published on their websites. Secondly,if individual data were not available, the group reports were used instead. In order to ensure the qualityof the research data, we excluded from the initial sample firms where information was non-availableor missing, as well as those showing reports written in other languages than English (to avoid anybiases associated with translation) [71]. Hence, of the 100 companies considered at first, only 47were left in the final sample used for the SDG score analysis, after applying the selection criteriapreviously mentioned, resulting in a number of 171 firm-year observations as disclosed in Table 1.Also, Appendix B, Table A2 shows the remaining firms by countries and operating revenues.
Table 1. Descriptive statistics related to the SDG score sample.
Country Breakdown Number of Firm-YearObservations
Percentage of Firm-YearObservations
CZ 30 17.54%HU 39 22.81%PL 33 19.30%RO 35 20.47%SK 34 19.88%
Total 171 100.00%
The following step of the selection methodology is related to the second part of the study,referring to the analysis of the influence that financial information exerts on sustainability reporting.For this section, the previous 47 firms included in the SDG score analysis were subsequently checkedfor the availability of financial data disclosed in the annual reports of the considered period 2015–2019.As indicated in Appendix B, Table A2, this additional selection criterion led to a remaining number of38 companies which published the necessary financial indicators for the multiple linear regressionanalysis, resulting in a number of 153 firm-year observations. Along with the above, as part of theregression analysis, the resulted outliers have been truncated, leading to a final sample of 36 firms and147 firm-year observations. The country and year breakdown of this sample are presented in Table 2.
Table 2. Descriptive statistics related to the regression sample.
Number of Firm-YearObservations
Percentage of Firm-YearObservations
Country breakdown:CZ 24 16.33%HU 38 25.85%PL 31 21.09%RO 24 16.33%SK 30 20.41%
Total 147 100.00%
Year breakdown:2015 27 18.37%2016 29 19.73%2017 31 21.09%2018 31 21.09%2019 29 19.73%Total 147 100.00%

Sustainability 2020, 12, 9251 7 of 34
Both samples reveal a balanced structure of the firm-year observations on countries and years,with the greatest representation from Hungary (22.81% for the SDG score and 25.85% for the regression),and the lowest representation from the Czech Republic for the SDG score analysis (17.54%) and equallyfrom the Czech Republic and Romania for the regression analysis, with 16.33% each.
In terms of the number of documents that have been analysed during the data collection process,Table 3 emphasises a total of 166 reports, with details regarding their types, structure, as well astheir number by years during 2015–2019. Figure 2 reveals the graphical representation of the reports’structure by type.
Table 3. Analysed reports included in the sample, by type and years.
Type of ReportYear Reports
2015 2016 2017 2018 2019 Number Percentage
Annual report 10 13 7 8 8 46 27.71%CSR report 3 5 5 5 2 20 12.05%
Integrated report 2 3 2 2 2 11 6.63%Other non-financial report 4 4 11 12 14 45 27.11%
Sustainability report 9 7 9 11 8 44 26.51%
Total 28 32 34 38 34 166 100%
Sustainability 2020, 12, 9251 7 of 36
In terms of the number of documents that have been analysed during the data collection process,
Table 3 emphasises a total of 166 reports, with details regarding their types, structure, as well as their
number by years during 2015–2019. Figure 2 reveals the graphical representation of the reports’
structure by type.
Table 3. Analysed reports included in the sample, by type and years.
Type of Report Year Reports
2015 2016 2017 2018 2019 Number Percentage
Annual report 10 13 7 8 8 46 27.71%
CSR report 3 5 5 5 2 20 12.05%
Integrated report 2 3 2 2 2 11 6.63%
Other non-financial report 4 4 11 12 14 45 27.11%
Sustainability report 9 7 9 11 8 44 26.51%
Total 28 32 34 38 34 166 100%
For 2018, 38 reports were included in the sample, this also being the greatest number analysed
within the 5 years. The lowest number of reports is shown in 2015. In respect of their types, between
2017–2019 the number of non-financial reports was the highest, whereas in 2015–2016 the annual
financial reports had the greatest representation.
Figure 2. Structure of sampled reports by type.
The structure of the analysed reports is almost equally spread between the sustainability reports,
other non-financial reports, and annual financial reports (approximately 27% for each category),
complemented by the CSR reports with 12% and integrated reports with approximately 7%. These
findings are similar to the ones obtained by Yu et al. [57].
In addition to the hand collection of information related to the SDG score, the companies’ annual
financial statements were analysed in order to extract the financial indicators used for defining the
variables included in the regression models for the second part of the study. During the process of
hand-collecting the financial indicators, only the information disclosed in the restated version of the
financial statements was considered, in such cases. Moreover, as the financial indicators were
extracted from reports disclosing data in various currencies, all the amounts have been converted in
EUR using the official exchange rates published by the European Central Bank [72] for each year end
between 2015–2019.
3.2. Methods used for the Assessment of the Quality SDG Score Based on a Content Analysis
Approach
The first step in applying the research methods consists in determining an annual SDG score for
the sampled firms, designed to assess the quality of the companies’ sustainability reporting. For
gathering the necessary information on SDGs disclosed in the corporates’ reports, a textual and
46, 27.71%
20, 12.05%
11
6.63%45, 27.11%
44, 26.51%
Annual report
CSR report
Integrated report
Other non-financial report
Sustainability report
Figure 2. Structure of sampled reports by type.
For 2018, 38 reports were included in the sample, this also being the greatest number analysedwithin the 5 years. The lowest number of reports is shown in 2015. In respect of their types,between 2017–2019 the number of non-financial reports was the highest, whereas in 2015–2016 theannual financial reports had the greatest representation.
The structure of the analysed reports is almost equally spread between the sustainabilityreports, other non-financial reports, and annual financial reports (approximately 27% for eachcategory), complemented by the CSR reports with 12% and integrated reports with approximately 7%.These findings are similar to the ones obtained by Yu et al. [57].
In addition to the hand collection of information related to the SDG score, the companies’ annualfinancial statements were analysed in order to extract the financial indicators used for defining thevariables included in the regression models for the second part of the study. During the processof hand-collecting the financial indicators, only the information disclosed in the restated version ofthe financial statements was considered, in such cases. Moreover, as the financial indicators wereextracted from reports disclosing data in various currencies, all the amounts have been converted inEUR using the official exchange rates published by the European Central Bank [72] for each year endbetween 2015–2019.

Sustainability 2020, 12, 9251 8 of 34
3.2. Methods Used for the Assessment of the Quality SDG Score Based on a Content Analysis Approach
The first step in applying the research methods consists in determining an annual SDG scorefor the sampled firms, designed to assess the quality of the companies’ sustainability reporting.For gathering the necessary information on SDGs disclosed in the corporates’ reports, a textual andcontent analysis on the selected reports was performed [73–78]. This is a widely adopted techniquefor such academic research [79], as it is designed “for making replicable and valid inferences fromtexts (or other meaningful matter) to the contexts of their use” (p. 18), and it consists of a scientifictool that “provides new insights, increases a researcher’s understanding of particular phenomena,or informs practical actions” [74] (p. 18). In terms of analysing corporate reports, Wen [80] draws theattention on three main methods that are usually used to analyse texts: individual word-count systemsthat quantify word frequencies and other text characteristics, human-based content analysis whichallows researchers to look more closely at the aspects disclosed in the documents, and computer-aidedqualitative data analysis systems that use artificial intelligence to analyse text documents [80], citing [81].Considering these options, similar to Cosma et al. [61], the manual content analysis and interpretationwas the chosen method for this study, without the use of any specific software. Taking into account thatinformation regarding the SDGs found in the firms’ reports is frequently associated with the 17 iconscorresponding to the goals, the use of content analysis software might not have led to accurate results.
Thus, all public reports of the companies available on their official websites were screenedin full and reviewed [75,82], in order to identify the sustainable development goals that they areaddressing, as well as the qualitative and quantitative targets, efforts, or measurements for eachSDG [56,78]. By applying search queries for the occurrence of key words, such as “sustainable,”“sustainability,” “SDG,” the textual analysis [75,76] was conducted in order to determine whether thesampled companies addressed the SDGs in their reports. This was followed by the content analysis forthe score’s assessment. The entire data collection process was carefully supervised and cross validatedbetween all team members to ensure the quality, comparability and reliability of the research [78].
In order to measure the engagement of the selected chemical sector companies in reportingtheir SDG achievements, a score-based approach using a scale from 0 to 5 was developed andapplied, considering the targets, the efforts and the measurements companies have set and havemonitored during the analysed period, as shown in Table 4 (detailed information and examples areprovided in Appendix C, Table A3). The used scoring methodology is consistent with other similarstudies [61,75,77,78,83,84].
Table 4. Sustainable development goals (SDG) score assessment methodology.
5
4 Tq Tq
3 Tc Mc Mq
2 Tc Mq
1 Tc + Eq Tq Mc
0 Tc
Noinformationdisclosed
SDG withqualitativetarget only
SDG withqualitativetarget and
quantitativeefforts
invested,but no results
measured
SDG withquantitative
target,but noresults
measured
SDG withqualitativetarget andqualitative
measurementof the
result(s)
SDG withqualitativetarget and
quantitativemeasurement
of theresult(s)
SDG withquantitativetarget andqualitative
measurementof the
result(s)
SDG withquantitativetarget and
quantitativemeasurement
of theresult(s)
Note: Tc = Qualitative target; Tq = Quantitative target; Eq = Quantitative effort invested; Mc = Qualitativemeasurement of the result; Mq = Quantitative measurement of the result.
Consequently, the SDG score was assigned to a sustainable development goal either by allocatingit based on the targets and actions addressing it, or by taking into account the clearly specified SDGs

Sustainability 2020, 12, 9251 9 of 34
from the analysed reports. This process was applied for each firm-year observation. Furthermore,a score was allocated to an SDG if companies disclosed in their reports that at least one target orindicator addressing that particular SDG was impacted by the firms’ actions.
Additionally, as shown in Table 4, the score was assigned differentially based on qualitativeand quantitative aspects reported by companies. Such a distinction was necessary as determiningthe quantitative goals indicates the extent to which the concept of sustainable development is beingimplemented [63]. In line with the previous, setting quantitative targets and monitoring theirachievements reflects the effective practices applied by companies in integrating the sustainabilitydevelopment goals with their business strategies [77].
As previously mentioned, identifying each SDG was based on three possible scenarios:clearly specified SGDs in the sustainability/annual reports, allocated SDGs based on the targetsset by the United Nations or both mentioned and allocated goals.
As revealed in Figure 3, almost a quarter of the total number of companies clearly specifiedthe SDGs they were addressing, 14% particularly mentioned some SDGs, but they also presentedinformation about other SDGs without specifying them, while most of the firms preferred to disclosesustainability aspects without naming the related SDGs.
Sustainability 2020, 12, 9251 9 of 36
implemented [63]. In line with the previous, setting quantitative targets and monitoring their
achievements reflects the effective practices applied by companies in integrating the sustainability
development goals with their business strategies [77].
As previously mentioned, identifying each SDG was based on three possible scenarios: clearly
specified SGDs in the sustainability/annual reports, allocated SDGs based on the targets set by the
United Nations or both mentioned and allocated goals.
As revealed in Figure 3, almost a quarter of the total number of companies clearly specified the
SDGs they were addressing, 14% particularly mentioned some SDGs, but they also presented
information about other SDGs without specifying them, while most of the firms preferred to disclose
sustainability aspects without naming the related SDGs.
Figure 3. Structure of the SDGs identified in the reports.
3.3. Methods Applied for the Analysis of the Influence of Financial Information on Sustainability
Reporting Based on the Multiple Linear Regression Model
The academic literature shows many empirical studies that have examined the relationship
between companies’ social performance and their financial performance [85,86]. The findings of such
research papers are mostly mixed. Some studies found a negative relationship [87,88], some found a
positive relationship [17,85,89–91], and others reported inconclusive or insignificant results [92].
However, given the broad range of motives for corporate social responsibility activities, it might not
come as surprising that empirical studies analysing this association find mixed results [93].
In this context, for the analysis of the extent to which financial information is influencing
sustainable development reporting, a methodology based on multiple linear regression models is
applied. This section mentions hereafter the research design used in the study, starting with the
definition and measurement of the variables, and afterwards presenting the research models.
3.3.1. Defining the Dependent Variable—Measurement of the Sustainable Development Indicator
The dependent variable, namely the sustainable development goals quality score (SDGS), is
defined as a measure of the sustainability reporting quality and it is derived from the previous section
of the methodology. Using similar methods to the ones applied in prior studies [61,77,78,83], SDGS
is a continuous variable constructed as follows:
SDGSit = ∑ 𝑆𝐷𝐺17𝑗=1 jit (1)
where i = firm, t = year, j = goals from 1 to 17 and SDG = score from 0 to 5 assigned for each one of the
17 SDGs.
Figure 3. Structure of the SDGs identified in the reports.
3.3. Methods Applied for the Analysis of the Influence of Financial Information on Sustainability ReportingBased on the Multiple Linear Regression Model
The academic literature shows many empirical studies that have examined the relationshipbetween companies’ social performance and their financial performance [85,86]. The findings of suchresearch papers are mostly mixed. Some studies found a negative relationship [87,88], some founda positive relationship [17,85,89–91], and others reported inconclusive or insignificant results [92].However, given the broad range of motives for corporate social responsibility activities, it might notcome as surprising that empirical studies analysing this association find mixed results [93].
In this context, for the analysis of the extent to which financial information is influencingsustainable development reporting, a methodology based on multiple linear regression models isapplied. This section mentions hereafter the research design used in the study, starting with thedefinition and measurement of the variables, and afterwards presenting the research models.
3.3.1. Defining the Dependent Variable—Measurement of the Sustainable Development Indicator
The dependent variable, namely the sustainable development goals quality score (SDGS), is definedas a measure of the sustainability reporting quality and it is derived from the previous section of the

Sustainability 2020, 12, 9251 10 of 34
methodology. Using similar methods to the ones applied in prior studies [61,77,78,83], SDGS is acontinuous variable constructed as follows:
SDGSit =∑17
j=1SDG jit (1)
where i = firm, t = year, j = goals from 1 to 17 and SDG = score from 0 to 5 assigned for each one of the17 SDGs.
3.3.2. Defining the Independent Variables—Measurement of the Financial Performance Indicators
Consistent with prior studies as indicated below next to each variable, the independent continuousvariables used in the regression models are defined in Table 5.
Table 5. List of independent variables.
Variable Measurement
ROA Return on assets—net income divided by total assets [17,91,94–96]CFTURN Total cash flow divided by sales (turnover) [90]
INT Natural logarithm of interest expenses [97,98], cited by [86]RDOINT Natural logarithm of research and development costs and other intangibles [86,90]
To avoid scale problems, we applied the common practice of using the natural logarithm on someof the variables [99].
3.3.3. Defining the Control Variables
Following previous research, our study controlled for firm size [86,87,92,95,96,100,101] andleverage [17,91,94–96,100,101]. Additionally, we use two dichotomous variables to control for theavailability of sustainability reporting [77], and whether the firms’ auditor is a Big 4 company ornot, assuming that statements assured by the Big 4 auditing companies are of higher quality [101].Moreover, in order to reduce concerns on any associations between dependent and independentvariables, dummy variables for countries and years were used as well [99,102,103]. No control forindustry was necessary, as all the sampled companies are operating in the same sector. Accordingly,all control variables included in the regression models are defined as disclosed in Table 6.
Table 6. List of control variables.
Variable Measurement
PPE Property, plant, and equipment scaled by total assetsLEV Leverage—Total liabilities divided by equity book value
SR Indicator variable for the availability of sustainability reports; if the sustainability report isdisclosed on the company’s website the indicator equals 1, and 0 otherwise
AUD Indicator variable that equals 1, if the firm’s auditor is Big 4, and 0 otherwise
COUNTRY Binary dummy variable for each country (RO omitted, set as reference); the variable equals 1 ifcountry is k (where k = 1–4, for each of the countries CZ, HU, PL and SK), and 0 otherwise
YEAR Binary dummy variable for each year (2015 omitted, set as reference); the variable equals 1 if theyear is k (where k = 1–4, for each of the years 2016, 2017, 2018 and 2019), and 0 otherwise
The choice of the financial indicator as a measure of the corporates’ size was influenced by thePearson correlation coefficient obtained for the variables. Although most of the similar academicwork uses total assets [85,86,95,101,104,105] and/or sales [85,92,105] as control variables for firmsize, these financial indicators did not represent an option in our case, as both resulted to bestrongly positively correlated with two of the independent variables, INT and RDOINT, with aPearson correlation coefficient above 0.8, significant at the 0.01 level (2-tailed). Hence, to avoid anymulticollinearity issues [106], considering the recommended Pearson cut-off value [107], a variable

Sustainability 2020, 12, 9251 11 of 34
based on the value of property, plant and equipment was chosen instead, as an alternative measurementof size.
3.3.4. Regression Models
Therefore, based on the previously defined variables, the following multiple linear regressionmodels were developed and applied:
SDGSit = α0 + α1ROAit + α2SRit + α3LEVit + α4PPEit + α5AUDit + α6COUNTRYkit +
α7YEARit + εit,(2)
SDGSit = α0 + α1CFTURNit + α2SRit + α3LEVit + α4PPEit + α5AUDit + α6COUNTRYkit +
α7YEARit + εit,(3)
SDGSit = α0 + α1INTit + α2SRit + α3LEVit + α4PPEit + α5AUDit + α6COUNTRYkit +
α7YEARit + εit,(4)
SDGSit = α0 + α1RDOINTit + α2SRit + α3LEVit + α4PPEit + α5AUDit + α6COUNTRYkit +
α7YEARit + εit,(5)
where i = firm; t = year; k = 1 to 4 (number of countries minus one); all variables included in theequations are consistent with the prior definitions.
For compiling the multiple linear regression models, as well as other necessary statisticalprocedures, IBM SPSS Statistics 27 was used as software resource. In order to ensure the statisticalvalidity of the regression models, several procedures were applied for testing the followingassumptions [108]:
1. there is a linear relationship between the dependent variable and each of the independent variables,as well as the dependent variable and the independent variables collectively; this was checked byplotting a scatterplot of the studentized residuals against the (unstandardized) predicted valuesfor the first assumption, and partial regression plots between each independent variable and thedependent variable for the second;
2. data show homoscedasticity of residuals, also checked using the plot of the studentized residualsagainst the unstandardized predicted values;
3. data show no multicollinearity, insuring there are no problems in understanding whichindependent variable contributes to the variance explained in the dependent variable, as wellas technical issues in calculating a multiple regression model; we detect for multicollinearitythrough an inspection of correlation coefficients and Tolerance/ variance inflation factor (VIF)values [109], as well as the analysis of the Pearson correlation matrix;
4. there are no significant outliers, high leverage points or highly influential points; this assumptionwas verified by: detecting outliers using casewise diagnostics and studentized deleted residuals,and examining whether these residuals are greater than ±3 standard deviations; checking forleverage points considering leverage values less than 0.2 as safe, 0.2 to less than 0.5 as risky,and values of 0.5 and above as dangerous [110]; and checking for influential points using Cook’sdistance as a measure of influence, by determining if any values are above 1 [111]; furthermore,in order to detect any multivariate outliers, the Mahalanobis distance was used [112];
5. the residuals are approximately normally distributed, checked by inspecting histograms withsuperimposed normal curve and P-P plot, as well as normal Q-Q plot of the studentized residuals.
After verifying the resulted outliers based on the abovementioned procedures, 6 of the 153firm-year observations were truncated, leading to the final sample of 147 observations. The 6 deletedobservations included the ones showing a negative value of stockholder’s equity [100]. There were nostudentized deleted residuals greater than ±3 standard deviations, no leverage values greater than 0.2,

Sustainability 2020, 12, 9251 12 of 34
and values for Cook’s distance above 1. The mentioned truncated observations were multivariateoutliers detected by applying the Mahalanobis distance.
The results of the tests revealed that all the assumptions were verified and all the statistical criteriawere met in order to run the multiple linear regressions. Details related to these results are found inAppendix D.
4. Results and Discussion
4.1. Results Related to the SDG Score Quality Based on the Content Analysis Approach
4.1.1. Descriptive Statistics on SDGs Reporting at the Country Level and Maximum SDGScore Achievements
The country-level analysis revealed that 16 of the 17 SDGs were reported by all countries, SDG 16being the only goal that was missing from the Hungarian companies’ reports, as illustrated in Figure 4.Although the scores achieved by the companies on each SDG were relatively close for three of thegoals, indicating a great interest in promoting activities for reducing the pollution of water, air andmanaging the waste (SDG 6, SDG 13 and SDG 12), the diversity shown by companies in reporting theother goals is noteworthy. Considering all the SDGs, Hungary and Poland obtained the highest scoreon five different goals, Slovakia and Romania achieved the maximum score for three various SDGs,while the Czech Republic had only one goal with the best score. Thus, Hungarian companies wereinvolved predominantly in environment protection (SDG 7, SDG 13, SDG 14), in supporting industryinnovation (SDG 9) and developing partnerships to achieve the goals (SDG 17), whereas Polish entitieswere preoccupied primarily by supporting health, education and community activities (SDG 3, SDG 4and SDG 11), offering decent work for their employees (SDG 8) and implementing procedures forassuring responsible consumption and production (SDG 12). Slovak firms were interested in achievinggender equality (SDG 5), protecting terrestrial ecosystems (SDG 15) and implementing codes to reducecorruption (SDG 16), while Romanian companies paid more attention to ending poverty and hunger(SDG 1 and SDG 2) as well as reducing inequality (SGD 10). The Czech Republic succeeded to rankfirst for ensuring availability and sustainable management of water (SDG 6).
Furthermore, the analysis was conducted to assess to what extent the companies managedto achieve the maximum score of 5 for each SDG they were reporting. This score has a particularrepresentativity, since only by setting engagement objectives, implementing procedures, and measuringthe effects can companies prove their commitment to achieving the sustainability development goalsand provide a quantitative assessment of their progress towards the SDGs.
As shown in Figure 5, the information related to promoting decent work (SDG 8) obtained themaximum score by most companies, as they invested considerable efforts to ensure the health oftheir employees and continuously monitored the mitigation of the work accidents. Then once again,we detected a significant interest in reporting sustainable information related on SDG 6, SDG 12 andSDG 13, followed by SDG 7. Around 20 companies presented quantitative targets on water and wastemanagement, gas emissions and energy consumption together with their achievement stages. This maybe explained by the fact that these chemical companies are polluting the environment by the nature oftheir activities and they try to remove the negative consequences by setting targets and monitoring theresults, being aware of the sustainable environment’s importance. At the opposite side, the goals forwhich just a few companies managed to achieve the highest score were SDG 1, SDG 2, and SDG 14.For goals related to ending poverty and hunger, this may be acceptable to some extent, considering thatit is difficult to set quantitative targets, especially when these involve sponsorships, whose voluntarycharacter is intrinsic. For SDG 14, the score is significantly influenced by the companies’ locations andtheir pollution zones: companies operating near oceans, seas or rivers are more involved in conservingbiodiversity in marine and coastal ecosystems.

Sustainability 2020, 12, 9251 13 of 34
Sustainability 2020, 12, 9251 12 of 36
4. Results and Discussion
4.1. Results Related to the SDG Score Quality Based on the Content Analysis Approach
4.1.1. Descriptive Statistics on SDGs Reporting at the Country Level and Maximum SDG Score
Achievements
The country-level analysis revealed that 16 of the 17 SDGs were reported by all countries, SDG
16 being the only goal that was missing from the Hungarian companies’ reports, as illustrated in
Figure 4. Although the scores achieved by the companies on each SDG were relatively close for three
of the goals, indicating a great interest in promoting activities for reducing the pollution of water, air
and managing the waste (SDG 6, SDG 13 and SDG 12), the diversity shown by companies in reporting
the other goals is noteworthy. Considering all the SDGs, Hungary and Poland obtained the highest
score on five different goals, Slovakia and Romania achieved the maximum score for three various
SDGs, while the Czech Republic had only one goal with the best score. Thus, Hungarian companies
were involved predominantly in environment protection (SDG 7, SDG 13, SDG 14), in supporting
industry innovation (SDG 9) and developing partnerships to achieve the goals (SDG 17), whereas
Polish entities were preoccupied primarily by supporting health, education and community activities
(SDG 3, SDG 4 and SDG 11), offering decent work for their employees (SDG 8) and implementing
procedures for assuring responsible consumption and production (SDG 12). Slovak firms were
interested in achieving gender equality (SDG 5), protecting terrestrial ecosystems (SDG 15) and
implementing codes to reduce corruption (SDG 16), while Romanian companies paid more attention
to ending poverty and hunger (SDG 1 and SDG 2) as well as reducing inequality (SGD 10). The Czech
Republic succeeded to rank first for ensuring availability and sustainable management of water (SDG
6).
Figure 4. SDGs reporting at the country level.
Furthermore, the analysis was conducted to assess to what extent the companies managed to
achieve the maximum score of 5 for each SDG they were reporting. This score has a particular
Figure 4. SDGs reporting at the country level.
Sustainability 2020, 12, 9251 13 of 36
representativity, since only by setting engagement objectives, implementing procedures, and
measuring the effects can companies prove their commitment to achieving the sustainability
development goals and provide a quantitative assessment of their progress towards the SDGs.
As shown in Figure 5, the information related to promoting decent work (SDG 8) obtained the
maximum score by most companies, as they invested considerable efforts to ensure the health of their
employees and continuously monitored the mitigation of the work accidents. Then once again, we
detected a significant interest in reporting sustainable information related on SDG 6, SDG 12 and
SDG 13, followed by SDG 7. Around 20 companies presented quantitative targets on water and waste
management, gas emissions and energy consumption together with their achievement stages. This
may be explained by the fact that these chemical companies are polluting the environment by the
nature of their activities and they try to remove the negative consequences by setting targets and
monitoring the results, being aware of the sustainable environment’s importance. At the opposite
side, the goals for which just a few companies managed to achieve the highest score were SDG 1,
SDG 2, and SDG 14. For goals related to ending poverty and hunger, this may be acceptable to some
extent, considering that it is difficult to set quantitative targets, especially when these involve
sponsorships, whose voluntary character is intrinsic. For SDG 14, the score is significantly influenced
by the companies’ locations and their pollution zones: companies operating near oceans, seas or
rivers are more involved in conserving biodiversity in marine and coastal ecosystems.
Figure 5. Number of companies achieving maximum score on each SDG.
4.1.2. SDGs Correlation Analysis
For assessing the interactions among the goals, Pearson’s and Spearman’s correlation
coefficients were computed. Notably, all the correlation coefficients were positive showing direct
associations between SDGs, which is in line with the UN’s report [113] mentioning a dominance of
positive over negative interactions. The correlation coefficients are statistically significant at the level
of 1%.
Figure 6 illustrates the associations based on correlation coefficients with values above the mean.
It can be easily noticed that five goals form a core structure of association relationships available
Figure 5. Number of companies achieving maximum score on each SDG.

Sustainability 2020, 12, 9251 14 of 34
4.1.2. SDGs Correlation Analysis
For assessing the interactions among the goals, Pearson’s and Spearman’s correlation coefficientswere computed. Notably, all the correlation coefficients were positive showing direct associationsbetween SDGs, which is in line with the UN’s report [113] mentioning a dominance of positive overnegative interactions. The correlation coefficients are statistically significant at the level of 1%.
Figure 6 illustrates the associations based on correlation coefficients with values above the mean.It can be easily noticed that five goals form a core structure of association relationships available underboth Pearson and Spearman correlation methods, but with stronger Spearman correlation coefficients,as well as an extended core area.
Figure 6. SDGs correlations analysis.
The common core structure of interactions implied SDG 5, SDG 6, SDG 7, SDG 12 and SDG 13.Thus, each of the five goals is interlinked to the other four SDGs.
The interactive association between SDG 7 and SDG 6 is consistent with Mainali et al. [114]findings, as modern energy is required in pumping the ground water, for water treatment and itsdistribution (7.1, 7.2 with 6.1, 6.3). Yet again, water is crucial for most forms of energy productionand the way water is managed could impact on the energy production (6.4 is linked with 7.2). This isalso stated by Nilsson et al. [115], according to which the expansion of renewables may includehydropower, which interacts strongly with freshwater ecosystems. Furthermore, improvement inenergy efficiency required by target 7.3 positively influences the achievements related to SDG 12 andpromoting investments in energy infrastructure and clean energy technology (7.A) increases progressfor SDG 13. A significant increase in renewables and energy efficiency is essential for keeping globalwarming within limits, so that providing access to modern energy services to all (7.1), including womenand girls (SDG 5), will not exacerbate climate change [5].
Meeting SDG 6, SDG 13 and SDG 12 targets together is an efficient plan that leads to moreeffects with less efforts. For example, substantially increasing water-use efficiency across all sectors(6.4) impacts positively the achievement of the sustainable management and efficient use of naturalresources (12.2). Withal improving wastewater treatment makes a significant contribution to SDG 13by reducing greenhouse gas emissions. In this regard, Lahmouri et al. [116] showed that decentralizingwastewater management generates the least carbon footprint during both construction and operationphases. Not least, providing adequate and equitable sanitation and hygiene to all, but paying specialattention to the needs of women and girls (6.2) enhances the progress for SDG 5.
The synergy between SDG 12 and 13 was expected. The efforts made to reach the environmentallysound management of chemicals and all wastes throughout their life cycle, as required by the law,

Sustainability 2020, 12, 9251 15 of 34
and substantially reduce their release to air according to 12.4 target create great premises for reducingthe air emissions under SDG 13. Moreover, SDG 12 focuses on the development and implementationof specific tools to monitor sustainable development impacts for sustainable tourism, which createsjobs and promotes local culture and products (12.B). This leads to a great opportunity to achieve twokey targets from SDG 5: empowering women (5.B) and ensuring women’s participation for leadershipat all levels of decision-making (5.5), especially as it is well known that the tourism industries employmore female than male workers [117], both in formal and informal jobs. It is important to highlight thatalthough most people employed in tourism worldwide are female, women are not well representedin the leadership positions in the tourism industry according to United Nations World TourismOrganization (UNWTO) [118]. Therefore, it becomes necessary to pay carefully attention to tourism,which has great potential to contribute to greater gender equality. Another way to empower womenis related to the SDG 13 target: promoting mechanisms for raising capacity for effective climatechange-related planning and management, including focusing on women (13.B).
In addition, the Spearman correlation matrix also indicated the interactions of SDG 9 with the fivegoals detailed above. This may be argued by the fact that investments in clean and environmentallysound technologies (9.4) related to SDG 9 include those in energy infrastructure, clean energy technology(7.A), but also recycling and reuse technologies (6.A), showing the connections to SDG 7 and SDG6. Moreover, all these efforts are fundamental for SDG 12 and SDG 13, as they represent a source ofsignificantly reducing adverse impacts on the environment (12.4) and climate change (13.3). Not least,developing quality, reliable, sustainable and resilient infrastructure with a focus on affordable andequitable access for all (9.1), including women and girls, positively impacts targets related to SDG 5.
Besides this core structure of associations, both Pearson and Spearman statistics revealed two pairsof links. On the one hand, interlinkages between SDG 1 and SDG 2 were identified. Ensuring access tosafe, nutritious, and sufficient food for all people is inextricably linked to poverty eradication (ICSU2017 [5]), but eradicating poverty for all people in all its forms (1.1–1.3) also helps in reaching the SDG 2targets related to ending hunger and malnutrition (2.1–2.3) [114]. On the other hand, interactions amongSDG 14 and SDG 15 were indicated, as there is indeed connection between promoting appropriateaccess to the utilization of genetic resources (15.6) and providing access for small-scale artisanal fishersto marine resources (14.B).
4.2. Results Related to the Influence of Financial Information on Sustainability Reporting Based on the MultipleLinear Regression Model
4.2.1. Descriptive Statistics and Correlation Analysis
Table 7 shows the means, medians, standard deviations, minimum and maximum values for ourindependent, dependent, and control variables included in the regression models, for the entire samplecomprising 147 observations.
Table 7. Descriptive statistics (N = 147).
Variable Mean Median Std. Deviation Minimum Maximum
SDGS 48.580 48.000 15.994 4 79ROA 0.061 0.0569 0.050 −0.114 0.202
CFTURN (mil.) 2255.201 33.542 8121.092 −24,013.979 36,982.277INT 17.789 18.005 2.636 10.568 21.657
RDOINT 20.385 20.259 3.203 12.014 24.774SR 0.630 1.000 0.484 0 1
LEV 1.704 1.192 2.103 0.146 15.160PPE 0.318 0.299 0.186 0.048 0.688
AUD 0.840 1.000 0.371 0 1

Sustainability 2020, 12, 9251 16 of 34
As Table 7 emphasises, the highest value of the SDGS is of 79 (representing 92.9% of the maximumscore level for a firm-year observation), and the lowest value is 4 (representing 4.7% of the maximumachievement level of the annual score). Furthermore, the dependent variable shows a mean of 48.580,which is also very close to the median of this variable’s data series. In terms of the availability ofsustainability reports, the SR variable discloses a mean value of 0.630, hence more than half of thecompanies included in the sample published sustainable development or related non-financial reports.Moreover, we can observe that the majority of companies had their annual reports audited by Big4 firms, with a mean of the AUD variable of 0.840.
In order to determine the bivariate association between variables, as well as to assess themulticollinearity assumption, the Pearson correlation analysis was applied. Table 8 presents thePearson correlation matrix for the variables included in the regression models.
Table 8. Pearson correlation matrix.
Variables SDGS ROA CFTURN INT RDOINT SR LEV PPE
SDGS -ROA 0.144 -
CFTURN 0.332 ** 0.138 -INT 0.505 ** 0.010 0.252 ** -
RDOINT 0.656 ** 0.216 ** 0.332 ** 0.824 ** -SR 0.164 * 0.051 0.164 * 0.147 0.247 ** -
LEV 0.020 −0.163 * 0.063 0.222 ** 0.101 0.060 -PPE −0.596 ** −0.190 * −0.251 ** −0.523 ** −0.736 ** −0.375 ** −0.020 -
AUD 0.264 ** 0.248 ** 0.125 0.360 ** 0.512 ** 0.236 ** −0.043 −0.209 *
** Correlation is significant at the 0.01 level (2-tailed); * Correlation is significant at the 0.05 level (2-tailed).
Although our findings indicate some statistically significant correlations at both the 1% and5% levels, none of the variance inflation factors (VIF) exceed the critical value of 10, as reportedin Appendix D, Table A4. On the one hand, the correlation matrix highlights a medium positivecorrelation between our dependent variable (SDGS) and interest expenses (INT), of 0.505 significantat the 1% level, but also a stronger positive correlation of SDGS with the R&D and other intangiblesvariable (RDOINT), of 0.656 at the 1% statistical significance level.
On the other hand, negative correlations above average are found between SDGS and property,plant and equipment (PPE), our control variable for firm size, but also between PPE and two of theindependent variables, INT and RDOINT, respectively. All the mentioned negative correlations aresignificant at the 1% level.
As the Pearson coefficient reveals, there is a strong positive correlation of 0.824, statistically significantat the 1% level, between the independent variables INT and RDOINT, hence running a regression withall independent variables as a set [17,96] might have faced multicollinearity biases.
The study analysed the Pearson correlation coefficients to check for multicollinearity issues inaccordance with previous studies that are also using binary variables (such as SR, AUD) [75,77,95].However, for a more relevant interpretation of the correlations involving this type of variables,the Spearman’s rho coefficients are disclosed as well in Table 9.
The Spearman’s rho coefficients present the same or similar correlations to the Pearson’s matrix.In terms of the dichotomous variables, the strongest positive correlation with the auditor type is shownfor R&D and other intangibles, with a significant (1% level) medium correlation coefficient of 0.490 forthe relationship between RDOINT and AUD. The availability of sustainability reporting discloses onlya weak correlation of 0.250 with the same RDOINT variable, this result being significant at the 1% level.

Sustainability 2020, 12, 9251 17 of 34
Table 9. Spearman’s rho correlation matrix.
Variables SDGS ROA CFTURN INT RDOINT SR LEV PPE
SDGS -ROA 0.147 -
CFTURN 0.261 ** 0.218 ** -INT 0.623 ** 0.125 0.326 ** -
RDOINT 0.677 ** 0.259 ** 0.350 ** 0.868 ** -SR 0.139 0.021 0.082 0.146 0.250 ** -
LEV 0.097 −0.249 ** 0.019 0.406 ** 0.166 * 0.071 -PPE −0.603 ** −0.176 * −0.240 ** −0.587 ** −0.753 ** -0.367 ** −0.069 -
AUD 0.240 ** 0.262 ** 0.228 ** 0.396 ** 0.490 ** 0.236 ** 0.067 −0.221 **
** Correlation is significant at the 0.01 level (2-tailed); * Correlation is significant at the 0.05 level (2-tailed).
4.2.2. Regression Results
Similar to previous studies, we initially applied the four regression models only on the independentvariables, without including the control factors [103], the obtained results being disclosed in Table 10.
Table 10. Model summary on the regression of the SDGS on each independent variable withoutcontrol variables.
Independent Variable ROA CFTURN INT RDOINT
R2 0.021 0.110 0.255 0.430Adjusted R2 0.014 0.104 0.249 0.426
F-stat, df (1, 145) 3.051 * 18.007 *** 49.515 *** 109.286 ***
Significance at the level of: *** p < 0.01; * p < 0.10.
Our findings show that the regression models are statistically significant at the level of 10% forROA, and 1% for CFTURN, INT and RDOINT. Of the four independent variables, ROA has the lowestcontribution on the quality of sustainability reporting based on the SDG score, with an R2 of 2.1%.This financial performance variable is followed by CFTURN (R2 of 11%), INT (R2 of 25%) and RDOINT,the latter disclosing the highest representativity of the four models, with an R2 of 43%. The fact thatRDOINT is the most influential variable in explaining the variation in the companies’ SDG scoremight be a consequence of the association between research and development advancements andtheir contribution to innovation and technology. Hence, the more involved the firm is in researchand development activities, the highest its achievements of the SDG targets will be. This result isalso consistent with the previous findings referring to the interactions of SDG 9 with the other goals,as emphasised in Section 4.1.2 of the paper.
Table 11 shows the multiple linear regression results related to the goodness of fit and coefficientsfor the four models, after entering the control variables.
With respect to the models’ goodness of fit, after introducing the control variables, the hierarchyof the independent variables influencing the variation of the SDG quality score is the same as theprevious, starting from an R2 of 56.6% for the regression on ROA, followed by 57.4% for CFTURN,then 59.6% obtained for the regression on INT, and the highest R2 of 63.4% achieved for the regressionon RDOINT, respectively. All four models are statistically significant at the 1% level. Once again,the most influential variable is RDOINT, contrary to Seifert [90], who found no effects of R&D intensity.
In terms of the variables’ association with the variation of the sustainable development reportingquality, based on the regression coefficients disclosed in Table 11, both INT and RDOINT show apositive and statistically significant impact on SDGS at the level of 1%. On the opposite side, we findthat ROA has a negative association with SDGS, but the coefficient is not significant, whereas forCFTURN there is a positive but very weak influence on the dependent variable variation explained bythe model, significant at the 10% level. For ROA, the influence on the analysed phenomenon is negative,in accordance with some of the previous studies [88,119], but the result is insignificant, similar to

Sustainability 2020, 12, 9251 18 of 34
Seifert et al. [92]. Regarding CFTURN, although very weak, the positive correlation is consistent withSeifert et al. [91]. Moreover, referring to the positive influence of the financing cost, measured throughthe INT variable, the results are opposed to the ones found by Orens et al. [97], which showed a negativerelationship between the cost of financing and CSR disclosure. In the same line, Hoepner et al. [98]find insignificant results on the relationship between sustainability performance and the cost of debt.
Table 11. Comparison of results obtained for the four multiple linear regression models on thesustainable development goals quality score (SDGS) dependent variable with control variables.
Model/IndependentVariable
Model 1, Equation (2) Model 2, Equation (3) Model 3, Equation (4) Model 4, Equation (5)
ROA CFTURN INT RDOINT
Goodness of fit:R2 0.566 0.574 0.596 0.634
Adjusted R2 0.524 0.533 0.557 0.598F-stat, df (13, 133) 13.356 *** 13.807 *** 15.109 *** 17.700 ***
Coefficients:Intercept 62.746 *** 61.378 *** 32.730 *** 6.381
Independent variable 1 −15.510 0.000 * 1.603 *** 2.624 ***Control variables:
SR −2.545 −3.039 −1.403 −0.802LEV −0.486 −0.356 −0.916 ** −0.788 *PPE −45.658 *** −43.825 *** −34.321 *** −15.129 *
AUD 7.762 *** 7.705 *** 5.008 * 0.075CZ −4.322 −4.798 −4.481 −6.183 **HU −8.658 *** −8.506 *** −12.068 *** −13.000 ***PL −18.128 *** −18.278 *** −17.428 *** −18.429 ***SK 0.164 −3.052 −1.230 −4.065
2016 3.075 3.181 3.311 3.3992017 5.598 * 5.331 * 6.005 ** 6.308 **2018 5.940 ** 6.15 ** 6.079 ** 5.513 **2019 4.878 5.487 * 5.543 * 6.302 **
Country FE Yes Yes Yes YesYear FE Yes Yes Yes Yes
Number of firms 36 36 36 36Number of observations 147 147 147 147
1 Independent variable as per each model; significance at the level of: *** p < 0.01; ** p < 0.05; * p < 0.10.
Consistent with prior research [101], leverage has a negative association with sustainabilityreporting, shown by the negative coefficients obtained for the LEV variable, statistically significant atthe level of 5% for model 3 and at the level of 10% for model 4. This implies that the larger the leverageis, the less likely it is that a firm will disclose sustainability reporting of higher quality.
Our control measure for firm size, PPE, discloses a negative and significant influence on theevolution of the SDG quality metric, with negative coefficients at the 1% significance level forthe first 3 regression models and 10% for model 4, although some of the prior studies show theopposite [17,85,99,101]. This result might be explained by the fact that large firms that have alreadyachieved a certain level of their PPE might not be willing or interested to concentrate their efforts inadditional investments.
Table 11 also reveals that the variable measuring the influence of the Big 4 auditors (AUD) obtainedpositive significant coefficients, at the level of 1% for model 1 and 2, and 10% for model 3. Therefore,companies that have their financial statements audited by Big 4 firms are more likely to disclose ahigher quality of sustainable reporting on SDGs.
The SR variable is not statistically significant for any of the four models, interpreting these findingsas evidence that the availability of sustainability or similar non-financial reports does not influence thequality of sustainability reporting practices on SDGs. These findings are in opposition to the ones ofFonseca and Carvalho [77], where a similar SR dichotomous variable showed a positive significantimpact on their measure of SDG quality index.
We also used dummy variables for COUNTRY and YEAR to control for their fixed effects. In thisrespect, of the five countries included in the analysis (CZ, HU, PL, RO, SK), we kept as reference of

Sustainability 2020, 12, 9251 19 of 34
comparison Romania, and from the five years included in the period 2015–2019, the year chosen asreference was 2015, in order to highlight the evolution of the phenomenon compared to the first yearthe SDGs were set. Findings show that the country plays a statistically significant part in the evolutionof the SDG score in most of the cases. The resulting coefficients show a negative influence for HUand PL, compared to RO at the level of 1% in all regression models. Furthermore, for CZ and SK,only model 4, involving RDOINT as independent variable, shows a significant negative associationat the 5% level. The rest of the coefficients for these two countries are also negative, except for theone of SK in the first model, where ROA was the independent variable. Additionally, in terms of theyears’ impact on the variation of the SDGs reporting quality, all the obtained coefficients are positive,and most of them are statistically significant at the 5% and 10% level, showing an improvement onthe quality of sustainability reporting based on SDGs compared to 2015, when the goals were firstset by the UN. This favourable finding is also sustained by the fact that the years’ coefficients aremostly increasing in values and statistical significance from 2016 to 2019, with the exception of the2019 coefficient in model 1 which uses ROA as independent variable.
Additional details related to the regression results and coefficients statistics, with and withoutusing the control variables are found in Appendix E, Tables A5–A8.
5. Conclusions and Limitations
This study was undertaken in order to investigate to what extent financial indicators influencesustainability reporting on SDGs, and which are those financial indicators that have the highestimpact on the quality of SDG reporting. For conducting the analysis, the methodology involvedtwo approaches, one related to determining the SDG reporting quality score, which consists of thedependent variable included in the second part of the research, and the other was based on applyingmultiple linear regression models involving financial performance indicators.
The findings related to the first section emphasise the firms’ interest in reporting SDGs by countries,by the SDGs that were allocated with the maximum score level (5), as well as interlinkages among SDGs.
The country-level analysis indicated a great interest in promoting activities for reducing thepollution of water, air and managing the waste accordingly to SDG 6, SDG 13 and SDG 12, respectively.However, the diversity of the preoccupation shown by companies on reporting the goals is alsonoteworthy. Thus, considering all the SDGs, Hungary and Poland reached the maximum score on fivedifferent goals (SDG 7, SDG 13, SDG 14, SDG 9, SDG 17 versus SDG 3, SDG 4, SDG 11, SDG 8, SDG 12),Slovakia and Romania achieved the highest score for three various SDGs (SDG 5, SDG 15, SDG 16versus SDG 1, SDG 2, SGD 10), while the Czech Republic had only one goal with the best score (SDG 6).
Then, analysis was conducted to assess the number of companies that succeeded to reachthe maximum score of 5 for each reported SDG, allocated only if both quantitative target andquantitative/qualitative measurement of the results were disclosed, hence showing the companies’commitment to achieving the sustainability development goals. The information related to promotingdecent work (SDG 8) has obtained the maximum score by most of the companies, and an activeinvolvement of companies was noticed in reporting quantitative targets on water and wastemanagement (SDG 6 and SDG 12), gas emissions (SDG 13) and even energy consumption (SDG 7)together with their achievement stages. Operating in a polluting sector, chemical companies understoodthe sustainable environment’s importance and they try to eliminate the negative impacts by settingtargets and monitoring the results. On the contrary, just a few companies showed interest in achievingthe highest score for SDG 1, SDG 2 and SDG 14.
In many cases the achievement of one goal’s targets depends on the progress of another SDGdue to the interactive nature of the goals. Hence, using Pearson and Spearman correlation methods,the interactions among SDGs were tested. The findings were consistent with recent studies, as indicatedin Section 4.1.2. All the correlation coefficients were positive, highlighting direct associations betweenSDGs, and it was identified that there is a core structure of association relationships between five goals(SDG 5, SDG 6, SDG 7, SDG 12 and SDG 13) with some extension to another goal (SDG 9) under the

Sustainability 2020, 12, 9251 20 of 34
Spearman correlation matrix. The statistics also revealed connections between SDG 1 and SDG 2 onone hand, and SDG 14 and SDG 15 on the other hand. Detailed information was provided regardingthe linkages among the targets of each of these sustainable development goals.
In addition to the previous findings related to the SDGs analysis, the second section of the paperdiscloses the results obtained after applying the four multiple regression models. These were developedby regressing the SDGS dependent variable to each of the four independent variables based on thefollowing financial indicators: return on assets (ROA), cash flows divided by turnover (CFTURN),interest expenses (INT), research and development costs and other intangibles (RDOINT). To control forthe availability of sustainability reporting, leverage, firms’ size, as well as the influence of Big 4 auditors,the regression models also involved the following control variables: SR, LEV, PPE, AUD. Moreover,we used dummy variables to control for the fixed effects of countries and years (COUNTRY and YEAR).Our findings in terms of the models’ goodness of fit show that of the four independent variables,ROA has the lowest contribution on the quality of sustainability reporting based on the SDG score,starting from an R2 of 56.6%, followed by 57.4% for CFTURN, then 59.6% obtained for the regressionon INT, and the highest R2 of 63.4% achieved for the regression on RDOINT, respectively. All fourmodels are statistically significant at the 1% level. Hence, contrary to Seifert et al. [90], who found noeffects of the R&D intensity, RDOINT is the most influential variable in explaining the variation in thecompanies’ SDG score, which might be explained by the association between research and developmentadvancements and their contribution to innovation and technology. With respect to the coefficients’statistics, both INT and RDOINT show a positive and statistically significant impact on SDGS at thelevel of 1%. The findings related to the INT variable are contrary to those indicated by Orens et al. [96],which were highlighting a negative relationship between the cost of financing and CSR disclosure.However, these results are statistically significant, as opposed to Hoepner et al. [98], who found thatthe relationship between sustainability performance and the cost of debt is insignificant.
On the opposite side, the study provides empirical evidence that ROA has a negative associationwith SDGS, but the result is not significant, which is consistent with some of the previousresearch [88,92,119]. Similar to Seifert et al. [90], for CFTURN we found a positive but very weakinfluence on the dependent variable variation explained by the model, significant at the 10% level.
The regression models’ coefficients show that the country plays a statistically significant part inalmost all the cases in the evolution of the SDG score, showing negative coefficients for all the otheranalysed countries compared to RO (which was set as the reference country), with the exception of theSK coefficient in model 1. In terms of the years’ impact on the variation of the SDGs reporting quality,all the obtained coefficients are positive and show an increasing trend both in terms of values andstatistical significance. These results reflect an improvement on the quality of sustainability reportingbased on SDGs compared to 2015, when the goals were first set by the UN.
Like all empirical research, our study has several limitations which have to be considered whileinterpreting its results [86]. First of all, the research is based on a limited sample, which was aconsequence of the reports’ unavailability for half of the companies initially considered in the analysis.This was also related to the fact that the sample selection did not take into account whether the firmswere listed or private, as including only publicly trading entities would have probably led to anincrease of the reports’ availability, hence, of the sample. Secondly, subjectivity is an issue in anyapproach that involves textual or content analysis as a research method. This is also the case whendealing with data hand collection, which is prone to biases.
Further studies might focus on expanding the sample and emphasising a comparison betweenprivate and listed companies. Additionally, a development of the SDG score methodology could besuitable for an in-depth assessment of the SDGs’ reporting quality.
Author Contributions: All authors wrote the paper, but their primary individual contributions were as follows:introduction, E.N., C.L.M. and E.-M.N.; literature review, E.-M.N.; methodology, E.N.; data collection, E.N., C.L.M.,E.-M.N., A.-M.I. and D.M.; software, E.N. and C.L.M.; validation, E.N.; results E.N. and C.L.M.; conclusions E.N.and C.L.M.; writing—review and editing, E.N., C.L.M., E.-M.N., A.-M.I. All authors have read and agreed to thepublished version of the manuscript.

Sustainability 2020, 12, 9251 21 of 34
Funding: This research received no external funding.
Acknowledgments: This research paper has been prepared as a part of the Human Capital Operational Program2014–2020, project number POCU/380/6/13/125245 no. 36482/23.05.2019, “Excellence in interdisciplinary Ph.D. andpost-Ph.D. research, career alternatives through entrepreneurial initiative (EXCIA)”, coordinated by the BucharestUniversity of Economic Studies.
Conflicts of Interest: The authors declare no conflict of interest.
Appendix A
Table A1. List of sustainable development goals as defined by the UN’s 2030 Agenda.
Goal No. Goal Name Goal Description
SDG 1 No poverty End poverty in all its forms everywhere
SDG 2 Zero hungerEnd hunger, achieve food security and
improved nutrition and promotesustainable agriculture
SDG 3 Good health and well-being Ensure healthy lives and promote well-beingfor all at all ages
SDG 4 Quality educationEnsure inclusive and equitable quality
education and promote lifelong learningopportunities for all
SDG 5 Gender equality Achieve gender equality and empower allwomen and girls
SDG 6 Clean water and sanitation Ensure availability and sustainablemanagement of water and sanitation for all
SDG 7 Affordable and clean energy Ensure access to affordable, reliable,sustainable and modern energy for all
SDG 8 Decent work and economic growthPromote sustained, inclusive and sustainable
economic growth, full and productiveemployment and decent work for all
SDG 9 Industry, innovation and infrastructureBuild resilient infrastructure,
promote inclusive and sustainableindustrialization and foster innovation
SDG 10 Reduced inequalities Reduce inequality within andamong countries
SDG 11 Sustainable cities and communities Make cities and human settlements inclusive,safe, resilient and sustainable
SDG 12 Responsible consumption and production Ensure sustainable consumption andproduction patterns
SDG 13 Climate action Take urgent action to combat climate changeand its impacts
SDG 14 Life below waterConserve and sustainably use the oceans,
seas and marine resources forsustainable development
SDG 15 Life on land
Protect, restore and promote sustainable useof terrestrial ecosystems, sustainably manageforests, combat desertification, and halt and
reverse land degradation and haltbiodiversity loss
SDG 16 Peace, justice and strong institutions
Promote peaceful and inclusive societies forsustainable development, provide access to
justice for all and build effective,accountable and inclusive institutions at
all levels
SDG 17 Partnerships for the goalsStrengthen the means of implementation and
revitalize the global partnership forsustainable development
Source: UN 2030 Agenda [1].

Sustainability 2020, 12, 9251 22 of 34
Appendix B
Table A2. Sampled firms by countries and operating revenues.
Company Index (Based on Country Code) Operating Revenues (USD) 1 Included in theRegression Analysis
CZ 1 5,968,704,830 YesCZ 2 802,022,732 NoCZ 3 386,388,584 YesCZ 4 262,469,955 YesCZ 5 256,880,073 NoCZ 6 226,364,682 YesCZ 7 220,639,000 NoCZ 8 209,550,213 YesCZ 9 191,404,081 Yes
HU 10 1,665,506,988 YesHU 11 1,367,451,539 YesHU 12 1,261,032,841 YesHU 13 1,163,178,061 YesHU 14 682,894,884 YesHU 15 595,539,660 NoHU 16 590,802,508 YesHU 17 291,996,860 YesHU 18 259,406,869 YesHU 19 226,168,200 YesHU 20 178,725,209 YesPL 21 2,961,877,789 YesPL 22 2,157,861,581 YesPL 23 1,670,422,975 YesPL 24 1,489,296,585 YesPL 25 953,582,868 YesPL 26 856,937,347 NoPL 27 760,174,322 YesPL 28 738,711,505 YesPL 29 629,529,943 YesRO 30 3,481,218,877 YesRO 31 387,078,394 NoRO 32 346,516,670 NoRO 33 239,220,901 YesRO 34 173,969,181 YesRO 35 132,282,460 YesRO 36 93,737,228 YesRO 37 70,431,109 YesRO 38 43,210,526 YesSK 39 4,635,832,605 YesSK 40 232,277,026 NoSK 41 203,633,573 YesSK 42 146,635,175 YesSK 43 143,273,702 YesSK 44 137,150,959 YesSK 45 124,474,698 YesSK 46 120,772,521 NoSK 47 88,712,119 Yes
Number of companies included in the SDG score analysis 47Number of companies included in the regression analysis (before outliers check) 38
1 As reported on ISI Emerging Markets Group’s EMIS platform [70]: https://www.emis.com/countries.

Sustainability 2020, 12, 9251 23 of 34
Appendix C
Table A3. Details regarding the SDGs score assessment.
Score Targets Measurements Description Example Particular Case:Donations/Sponsorships Particular Case: Partnerships
0 - - No information disclosed with respect to a specific goal/no target to fulfil
1 Tc -
SDG with qualitative target, but no resultsmeasured and reported yet: there is a
qualitative ambition for the company (i.e.,narrative description about company plans to
take action on those targets), but noinformation about reporting any obtained
results on the progress towards the SDG target.
As SDG target 12.5 explains,substantially reducing waste generationis a priority for society, and the company
wants to engage in/agrees to takeactions/supports/starts projects
addressing the decrease of wastegeneration.
As SDG target 12.5 explains,substantially reducing waste
generation is a priority forsociety, and the company wants
to/agrees to/plans to make adonation/sponsorship for thedecrease of waste generation.
As SDG target 12.5 explains,substantially reducing waste
generation is a priority forsociety, and the company wantsto/plans to build partnerships forthe decrease of waste generation.
2Tc + Eq -
SDG with qualitative target and quantitativeefforts invested, but no results measured and
reported yet: there is a qualitative ambition forthe company (i.e., narrative description aboutcompany plans to take action on those targets)
and investments were made, but noinformation about reporting any obtained
results on the progress towards the SDG target.
As SDG target 12.5 explains,substantially reducing waste generation
is a priority for society, the companywants to engage in/agrees to take
actions/supports/starts projects and hasinvested the amount of X € for the
decrease of waste generation.
Not applicable for donations/sponsorships/partnerships.
Tq -
SDG with quantitative target, but no resultsmeasured and reported yet: there is a
quantitative ambition for the company (i.e.,company has set quantified measures that it isaiming for in the future), but no informationabout reporting any obtained results on the
progress towards the SDG target.
As SDG target 12.5 explains,substantially reducing waste generationis a priority for society, and the company
wants to ensure a decrease of wastegeneration with 20% (by 2025).
As SDG target 12.5 explains,substantially reducing waste
generation is a priority forsociety, and the company plans
to donate/provide a sponsorshipof X €/donate twice as many asthe previous year to ensure thedecrease of waste generation.
As SDG target 12.5 explains,substantially reducing waste
generation is a priority forsociety, and the company wants
to/plans to sign Xpartnerships/twice as many
partnerships as the previous yearfor the decrease of waste
generation.
3 Tc Mc
SDG with qualitative target and qualitativemeasurement of the result(s) reported on the
progress: there is a qualitative ambition for thecompany (i.e., narrative description about
company plans to take action on those targets)and a qualitative assessment of the obtained
results on the progress towards the SDG targetis disclosed (i.e., narrative description of the
effects of those actions).
As SDG target 12.5 explains,substantially reducing waste generation
is a priority for society, the companywants to engage in/supports the
decrease of waste generation and theentity succeeded in keeping the wastegeneration below the limit imposed by
the legislation/the target wasachieved/the target is partially achieved.
As SDG target 12.5 explains,substantially reducing waste
generation is a priority forsociety, and the company
donated goods/made adonation/provided a sponsorship
for the decrease of wastegeneration, without mentioning
any figures.
As SDG target 12.5 explains,substantially reducing waste
generation is a priority forsociety, and the company signedpartnerships for the decrease of
waste generation.

Sustainability 2020, 12, 9251 24 of 34
Table A3. Cont.
Score Targets Measurements Description Example Particular Case:Donations/Sponsorships Particular Case: Partnerships
4 Tc Mq
SDG with qualitative target and quantitativemeasurement of the result(s) reported on the
progress: there is a qualitative ambition for thecompany (i.e., narrative description about
company plans to take action on those targets)and a quantitative assessment of the obtainedresults on the progress towards the SDG target
is disclosed.
As SDG target 12.5 explains,substantially reducing waste generation
is a priority for society, the companywants to engage in/supports the decrease
of waste generation and the entitysucceeded in reducing it with 20%/with
4% compared to the previous year.
As SDG target 12.5 explains,substantially reducing waste
generation is a priority forsociety, and the companydonated a number of X
goods/made adonation/provided a sponsorshipin amount of X € for the decrease
of waste generation.
As SDG target 12.5 explains,substantially reducing waste
generation is a priority forsociety, and the company signed
partnerships which led to thedecrease of waste generation
with 5%.
5Tq Mc
SDG with quantitative target and qualitativemeasurement of the result(s) reported on theprogress: there is a quantitative ambition forthe company and a qualitative assessment ofthe obtained results on the progress towards
the SDG target is disclosed (i.e., narrativedescription of the effects of those actions).
As SDG target 12.5 explains,substantially reducing waste generation
is a priority for society, the companywants to engage in/supports the
decrease of waste generation with 50%(by 2025) and the entity succeeded in
keeping the waste generation below thelimit imposed by the legislation/the
target was achieved/the target ispartially achieved.
As SDG target 12.5 explains,substantially reducing waste
generation is a priority forsociety, the company wants
to/planned to donate X €/twicemore than the previous year forthe decrease of waste generationand the entity reached/partiallyreached its target (qualitative
assessment).
As SDG target 12.5 explains,substantially reducing waste
generation is a priority forsociety, the company wants
to/planned to sign Xpartnerships/X%/twice more
partnerships than the previousyear for the decrease of waste
generation and the entityreached/partially reached its
target (qualitative assessment).
Tq Mq
SDG with quantitative target and quantitativemeasurement of the result(s) reported on theprogress: there is a quantitative ambition for
the company and a quantitative assessment ofthe obtained results on the progress towards
the SDG target is disclosed.
As SDG target 12.5 explains,substantially reducing waste generation
is a priority for society, the companywants to engage in/supports the
decrease of waste generation with 50%(by 2025) and the entity succeeded in
reducing it with 20%/with 4% comparedto the previous year.
As SDG target 12.5 explains,substantially reducing waste
generation is a priority forsociety, the company wants
to/planned to donate X €/twicemore than the previous year forthe decrease of waste generation
and the entity donated 20% ofthe planned amount/donated Y €
(quantitative assessment).
As SDG target 12.5 explains,substantially reducing waste
generation is a priority forsociety, the company wants
to/planned to sign Xpartnerships/X%/twice more
partnerships than the previousyear for the decrease of waste
generation and the entity signedtwo partnerships/achieved 20%
of its target up to date(qualitative assessment).
Tc = Qualitative target; Tq = Quantitative target; Eq = Quantitative effort invested; Mc = Qualitative measurement of the result; Mq = Quantitative measurement of the result.

Sustainability 2020, 12, 9251 25 of 34
Appendix D
As mentioned in Section 3.3.4., Appendix D discloses the results of statistical tests applied in orderto ensure the validity of the regression models.
In order to assess the linear relationship between the dependent and the independent variables,as well as the homoscedasticity assumption, the plots of studentized residuals against the predictedvalues in Figure A1 were analysed. The visual inspection lead to the assessment that the twoassumptions are met.
Figure A1. Plots of studentized residuals against the predicted values for linearity andhomoscedasticity checks.
To test the validity of the multiple linear regression models in relation to the assumption that thesampled date should not show multicollinearity, we analysed the tolerance and VIF indicators [109].
Table A4. Tolerance and variance inflation factors (VIF) statistics of the four regression models.
Model/IndependentVariable
Model 1,Equation (2)
Model 2,Equation (3)
Model 3,Equation (4)
Model 4,Equation (5)
ROA CFTURN INT RDOINT
Tolerance VIF Tolerance VIF Tolerance VIF Tolerance VIF
Independent variable 0.801 1.249 0.614 1.629 0.456 2.192 0.251 3.983SR 0.771 1.297 0.755 1.324 0.753 1.328 0.751 1.332
LEV 0.876 1.141 0.902 1.108 0.810 1.235 0.881 1.135PPE 0.763 1.311 0.778 1.286 0.573 1.747 0.333 3.004
AUD 0.748 1.337 0.777 1.287 0.731 1.368 0.594 1.685CZ 0.554 1.806 0.549 1.821 0.555 1.803 0.546 1.832HU 0.455 2.200 0.463 2.161 0.402 2.488 0.418 2.395PL 0.527 1.897 0.528 1.893 0.529 1.891 0.530 1.888SK 0.466 2.145 0.355 2.814 0.458 2.185 0.433 2.311
2016 0.599 1.668 0.599 1.669 0.599 1.669 0.599 1.6692017 0.566 1.767 0.571 1.750 0.569 1.758 0.569 1.7592018 0.575 1.740 0.575 1.738 0.576 1.737 0.575 1.7402019 0.570 1.755 0.583 1.714 0.584 1.712 0.581 1.720
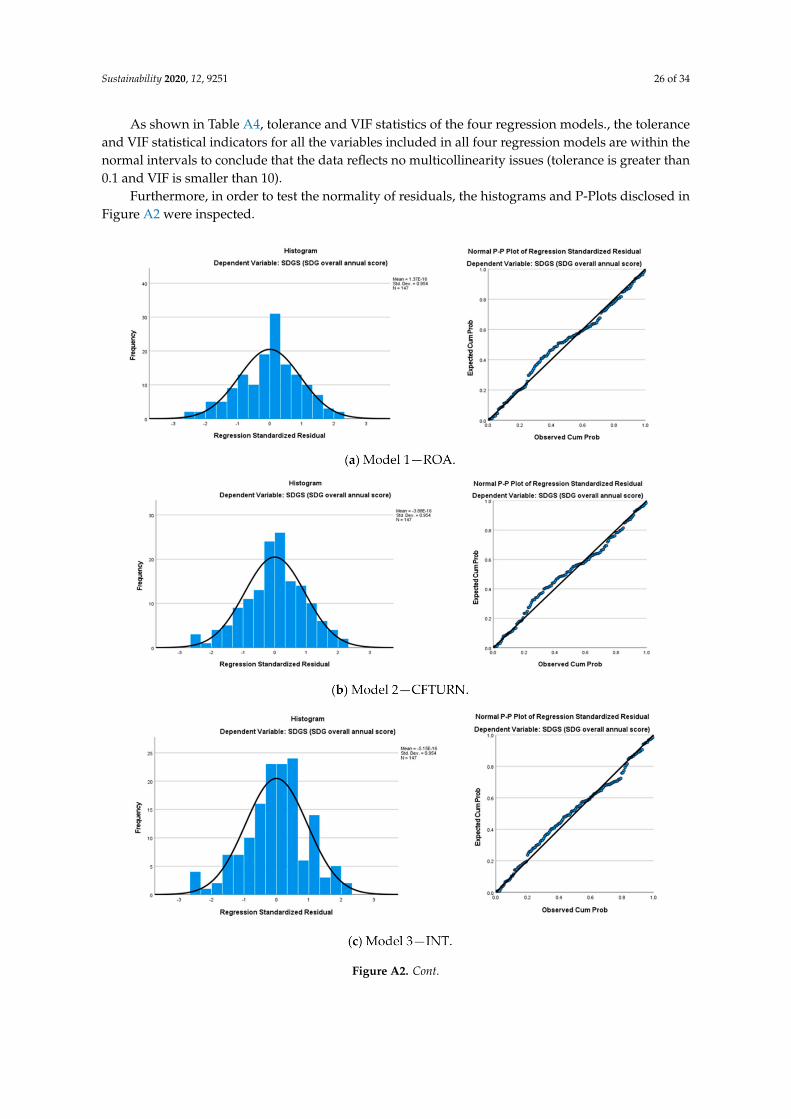
Sustainability 2020, 12, 9251 26 of 34
As shown in Table A4, tolerance and VIF statistics of the four regression models., the toleranceand VIF statistical indicators for all the variables included in all four regression models are within thenormal intervals to conclude that the data reflects no multicollinearity issues (tolerance is greater than0.1 and VIF is smaller than 10).
Furthermore, in order to test the normality of residuals, the histograms and P-Plots disclosed inFigure A2 were inspected.
Figure A2. Cont.

Sustainability 2020, 12, 9251 27 of 34Sustainability 2020, 12, 9251 28 of 35
(d) Model 4—RDOINT.
Figure A2. Histograms and P-Plots for the normality of residuals assumption check.
The visual inspection of the histograms and P-Plots leads to the assessment that the normality
of residuals is met.
Appendix E
Tables Tables A5–A8 disclose the detailed coefficients statistics of the 4 multiple linear regression
models.
Table A5. Coefficients statistics for the regression model of SDGS on ROA.
Model 1, Equation (2) B Std. Error Standardized Beta t Sig.
Without control variables:
Intercept 45.735 2.089 21.892 0.000
ROA 46.240 * 26.472 0.144 1.747 0.083
With control variables:
Intercept 62.746 *** 4.464 14.056 0.000
ROA −15.510 20.553 −0.048 −0.755 0.452
SR −2.545 2.150 −0.077 −1.184 0.239
LEV −0.486 0.464 −0.064 −1.048 0.297
PPE −45.658 *** 5.616 −0.532 −8.130 0.000
AUD 7.762 *** 2.848 0.180 2.726 0.007
Czech Republic −4.322 3.309 −0.100 −1.306 0.194
Hungary −8.658 *** 3.084 −0.238 −2.808 0.006
Poland −18.128 *** 3.073 −0.464 −5.898 0.000
Slovakia 0.164 3.307 0.004 0.050 0.961
2016 3.075 2.954 0.077 1.041 0.300
2017 5.598 * 2.966 0.143 1.887 0.061
2018 5.94 ** 2.943 0.152 2.018 0.046
2019 4.878 3.030 0.122 1.610 0.110
Significance at the level of: *** p < 0.01; ** p < 0.05; * p < 0.10.
Table A6. Coefficients statistics for the regression model of SDGS on CFTURN.
Model 2, Equation (3) B Std. Error Standardized Beta t Sig.
Without control variables:
Intercept 47.102 *** 1.296 36.345 0.000
CFTURN 0.000 *** 0.000 0.332 4.244 0.000
With control variables:
Intercept 61.378 *** 4.156 14.769 0.000
CFTURN 0.000 * 0.000 0.128 1.767 0.079
SR −3.039 2.152 −0.092 −1.412 0.160
LEV −0.356 0.453 −0.047 −0.787 0.433
PPE −43.825 *** 5.510 −0.510 −7.954 0.000
AUD 7.705 *** 2.767 0.179 2.785 0.006
Figure A2. Histograms and P-Plots for the normality of residuals assumption check.
The visual inspection of the histograms and P-Plots leads to the assessment that the normality ofresiduals is met.
Appendix E
Tables A5–A8 disclose the detailed coefficients statistics of the 4 multiple linear regression models.
Table A5. Coefficients statistics for the regression model of SDGS on ROA.
Model 1, Equation (2) B Std. Error Standardized Beta t Sig.
Without control variables:Intercept 45.735 2.089 21.892 0.000
ROA 46.240 * 26.472 0.144 1.747 0.083With control variables:
Intercept 62.746 *** 4.464 14.056 0.000ROA −15.510 20.553 −0.048 −0.755 0.452
SR −2.545 2.150 −0.077 −1.184 0.239LEV −0.486 0.464 −0.064 −1.048 0.297PPE −45.658 *** 5.616 −0.532 −8.130 0.000
AUD 7.762 *** 2.848 0.180 2.726 0.007Czech Republic −4.322 3.309 −0.100 −1.306 0.194
Hungary −8.658 *** 3.084 −0.238 −2.808 0.006Poland −18.128 *** 3.073 −0.464 −5.898 0.000
Slovakia 0.164 3.307 0.004 0.050 0.9612016 3.075 2.954 0.077 1.041 0.3002017 5.598 * 2.966 0.143 1.887 0.0612018 5.94 ** 2.943 0.152 2.018 0.0462019 4.878 3.030 0.122 1.610 0.110
Significance at the level of: *** p < 0.01; ** p < 0.05; * p < 0.10.
Table A6. Coefficients statistics for the regression model of SDGS on CFTURN.
Model 2, Equation (3) B Std. Error Standardized Beta t Sig.
Without control variables:Intercept 47.102 *** 1.296 36.345 0.000CFTURN 0.000 *** 0.000 0.332 4.244 0.000
With control variables:Intercept 61.378 *** 4.156 14.769 0.000CFTURN 0.000 * 0.000 0.128 1.767 0.079
SR −3.039 2.152 −0.092 −1.412 0.160LEV −0.356 0.453 −0.047 −0.787 0.433

Sustainability 2020, 12, 9251 28 of 34
Table A6. Cont.
Model 2, Equation (3) B Std. Error Standardized Beta t Sig.
PPE −43.825 *** 5.510 −0.510 −7.954 0.000AUD 7.705 *** 2.767 0.179 2.785 0.006
Czech Republic −4.798 3.292 −0.111 −1.458 0.147Hungary −8.506 *** 3.027 −0.234 −2.810 0.006Poland −18.278 *** 3.041 −0.468 −6.011 0.000
Slovakia −3.052 3.753 −0.077 −0.813 0.4182016 3.181 2.927 0.079 1.087 0.2792017 5.331 * 2.924 0.136 1.823 0.0712018 6.15 ** 2.914 0.157 2.111 0.0372019 5.487 * 2.966 0.137 1.850 0.067
Significance at the level of: *** p < 0.01; ** p < 0.05; * p < 0.10.
Table A7. Coefficients statistics for the regression model of SDGS on INT.
Model 3, Equation (4) B Std. Error Standardized Beta t Sig.
Without control variables:Intercept −5.871 7.822 −0.751 0.454
INT 3.061 * 0.435 0.505 7.037 0.000With control variables:
Intercept 32.730 *** 9.784 3.345 0.001INT 1.603 *** 0.495 0.264 3.240 0.002SR −1.403 2.099 −0.042 −0.668 0.505
LEV −0.916 ** 0.466 −0.120 −1.968 0.051PPE −34.321 *** 6.255 −0.400 −5.487 0.000
AUD 5.008 * 2.779 0.116 1.802 0.074Czech Republic −4.481 3.190 −0.104 −1.405 0.162
Hungary −12.068 *** 3.164 −0.331 −3.814 0.000Poland −17.428 *** 2.960 −0.446 −5.887 0.000
Slovakia −1.230 3.221 −0.031 −0.382 0.7032016 3.311 2.851 0.083 1.161 0.2482017 6.005 ** 2.855 0.154 2.104 0.0372018 6.079 ** 2.837 0.156 2.143 0.0342019 5.543 * 2.887 0.138 1.920 0.057
Significance at the level of: *** p < 0.01; ** p < 0.05; * p < 0.10.
Table A8. Coefficients statistics for the regression model of SDGS on RDOINT.
Model 4, Equation (5) B Std. Error Standardized Beta t Sig.
Without control variables:Intercept −18.148 *** 6.461 -2.809 0.006RDOINT 3.273 *** 0.313 0.656 10.454 0.000
With control variables:Intercept 6.381 11.660 0.547 0.585RDOINT 2.624 *** 0.523 0.525 5.017 0.000
SR −0.802 2.002 −0.024 −0.401 0.689LEV −0.788 * 0.425 −0.104 −1.853 0.066PPE −15.129 * 7.813 −0.176 −1.936 0.055
AUD 0.075 2.937 0.002 0.025 0.980Czech Republic −6.183 ** 3.063 −0.143 −2.018 0.046
Hungary −13.000 *** 2.957 −0.357 −4.397 0.000Poland −18.429 *** 2.817 −0.472 −6.541 0.000
Slovakia −4.065 3.155 −0.103 −1.288 0.2002016 3.399 2.715 0.085 1.252 0.2132017 6.308 ** 2.719 0.161 2.320 0.0222018 5.513 ** 2.704 0.141 2.039 0.0432019 6.302 ** 2.757 0.157 2.286 0.024
Significance at the level of: *** p < 0.01; ** p < 0.05; * p < 0.10.

Sustainability 2020, 12, 9251 29 of 34
References
1. United Nations. Transforming our world: The 2030 Agenda for Sustainable Development 2015.Available online: https://sustainabledevelopment.un.org/content/documents/21252030%20Agenda%20for%20Sustainable%20Development%20web.pdf (accessed on 30 August 2020).
2. Barbier, E.B.; Burgess, J.C. The Sustainable Development Goals and the Systems Approach to Sustainability.In Economics Discussion Papers; Kiel Institute for the World Economy: Kiel, Germany, 2017; p. 28.
3. Pradhan, P.; Costa, L.; Rybski, D.; Lucht, W.; Kropp, J.P. A systematic study of Sustainable Development Goal(SDG) interactions. Earth Future 2017, 5, 1169–1179. [CrossRef]
4. ICSU. A Guide to SDG Interactions: From Science to Implementation. Available online: https://council.science/wp-content/uploads/2017/05/SDGs-Guide-to-Interactions.pdf (accessed on 5 November 2020).
5. Singh, G.G.; Cisneros-Montemayora, A.M.; Swartz, W.; Cheung, W.; Guy, J.A.; Otak, Y. A rapid assessment ofco-benefits and trade-offs among Sustainable Development Goals. Mar. Policy 2018, 93, 223–231. [CrossRef]
6. Nerini, F.; Tomei, J.; To, L.S.; Bisaga, I.; Parikh, P.; Black, M.; Borrion, A.; Spataru, C.; Broto, V.; Anandarajah, G.;et al. Mapping synergies and trade-offs between energy and the Sustainable Development Goals. Nat. Energy2018, 3, 10–15. [CrossRef]
7. Fonseca, L.M.; Domingues, J.P.; Dima, A.M. Mapping the Sustainable Development Goals Relationships.Sustainability 2020, 12, 3359. [CrossRef]
8. European Union. EU Reporting on Sustainability and UN Development Goals Still Lacking, Warn Auditors.Available online: https://www.eca.europa.eu/en/Pages/NewsItem.aspx?nid=12287 (accessed on 30 July 2020).
9. Directive 2014/95/EU of the European Parliament and of the Council. Disclosure of non-financial and diversityinformation by certain large undertakings and groups. Off. J. Eur. Union 2014, 57, 4–5. Available online:https://eur-lex.europa.eu/eli/dir/2014/95/oj (accessed on 10 November 2020).
10. Alshehhi, A.; Nobanee, H.; Khare., N. The Impact of Sustainability Practices on Corporate FinancialPerformance: Literature Trends and Future Research Potential. Sustainability 2018, 10, 494. [CrossRef]
11. Ameer, R.; Othman, R. Sustainability Practices and Corporate Financial Performance: A Study Based on theTop Global Corporations. J. Bus. Ethics 2012, 108, 61–79. [CrossRef]
12. Arlow, P.; Gannon, M. Social responsiveness, corporate structure, and economic performance.Acad. Manag. Rev. 1982, 7, 235–241. [CrossRef]
13. Burhan, A.H.N.; Rahmanti, W. The impact of sustainable reporting on companies’ performance. J. Econ. Bus.Acc. Ventur. 2012, 15, 257–272. [CrossRef]
14. Cho, C.H.; Patten, D.M. The role of environmental disclosures as tools of legitimacy: A research note.Acc. Organ. Soc. 2007, 32, 639–647. [CrossRef]
15. Herremans, I.; Akathaporn, P.; McInnes, M. An investigation of corporate social responsibility Reputationand economic performance. Account. Organ. Soc. 1993, 18, 587–604. [CrossRef]
16. Laskar, N.; Chakraborty, T.K.; Maji, S.G. Corporate Sustainability Performance and Financial Performance:Empirical Evidence from Japan and India. Manag. Labour Stud. 2017, 42, 88–106. [CrossRef]
17. McGuire, J.B.; Sundgren, A.; Schneeweis, T. Corporate Social Responsibility and Firm Financial PerformanceSource. Acad. Manag. J. 1988, 31, 854–872.
18. McWilliams, A.; Siege, D. Corporate Social Responsibility and Financial Performance: Correlation orMisspecification? Strateg. Manag. J. 2000, 21, 603–609. [CrossRef]
19. Ortas, E.; Gallego-Alvarez, I.; Etxeberria, I.A. Financial factors influencing the quality of corporate socialresponsibility and environmental management disclosure: A quantile regression approach. Corp. Soc.Responsib. Environ. Manag. 2015, 22, 362–380. [CrossRef]
20. Siew, R.Y.J.; Balatbat, M.C.A.; Carmichael, D.G. The relationship between sustainability practices and financialperformance of construction companies. Smart Sustain. Built Environ. 2013, 2, 6–27. [CrossRef]
21. Ullmann, A. Data in search of a theory: A critical examination of the relationships among social performance,social disclosure, and economic performance. Acad. Manag. Rev. 1985, 10, 540–577.
22. Brown, H.S.; de Jong, M.; Levy, D.L. Building institutions based on information disclosure: Lessons fromGRI’s sustainability reporting. J. Clean. Prod. 2009, 17, 571–580. [CrossRef]
23. Corporate Citizenship. The SDGs: Materially impacting the bottom line 2018 Annual Review of Progress onthe Global Goals. 2018. Available online: https://corporate-citizenship.com/wp-content/uploads/The-SDGs-Materially-Impacting-the-Bottom-Line-FINAL.pdf (accessed on 20 August 2020).

Sustainability 2020, 12, 9251 30 of 34
24. EY. Why Sustainable Development Goals should be in Your Business Plan. 2017. Available online: www.ey.com/en_gl/assurance/why-sustainable-development-goals-should-be-in-your-business-plan (accessed on20 August 2020).
25. KPMG. How to Report on the SDGs: What Good Looks Like and Why it Matters. 2018. Available online: https://home.kpmg/xx/en/home/insights/2018/02/how-to-report-on-the-sdgs.html (accessed on 20 August 2020).
26. PwC. SDG Reporting Challenge 2017. Exploring Business Communication on the Global Goals. 2017.Available online: https://www.pwc.com/gx/en/sustainability/SDG/pwc-sdg-reporting-challenge-2017-final.pdf (accessed on 20 August 2020).
27. Adams, C.A.; Frost, G.R. Integrating sustainability reporting into management practices. Account. Forum2008, 32, 288–302. [CrossRef]
28. Ching, H.Y.; Gerab, F.; Toste, T.H. The Quality of Sustainability Reports and Corporate Financial Performance:Evidence from Brazilian Listed Companies. SAGE Open 2017, 1–9. [CrossRef]
29. Firmansyah, I. The Role of Accountants in Achieving Sustainable Development Goals: Academics Perspective.J. Ilm. Akunt. Dan Bisnis 2019, 14, 2.
30. Makarenko, I.; Plastun, A. The role of accounting in sustainable development. Account. Financ. Control 2017,1, 2. [CrossRef]
31. Schaltegger, S.; Etxeberria, I.A.; Ortas, E. Innovating Corporate Accounting and Reporting forSustainability—Attributes and Challenges. Sustain. Dev. 2017, 25, 113–122. [CrossRef]
32. Wackernagel, M.; Hanscom, L.; Lin, D. Making the Sustainable Development Goals Consistent withSustainability. Front. Energy Res. 2017, 5, 18. [CrossRef]
33. Beddoe, R.; Costanza, R.; Farley, J.; Garza, E.; Kent, J.; Kubiszewski, I.; Martinez, L.; McCowen, T.; Murphy, K.;Myers, N.; et al. Overcoming systemic road-blocks to sustainability: The evolutionary redesign of worldviews,institutions, and technologies. Proc. Natl. Acad. Sci. USA 2009, 106, 2483–2489. [CrossRef] [PubMed]
34. Deegan, C.; Rankin, M. Do Australian companies report environmental news objectively? An analysis ofenvironmental disclosures by firms prosecuted successfully by the Environmental Protection Authority.Account. Audit. Account. J. 1996, 9, 52–69. [CrossRef]
35. Sachs, J.D. From Millennium Development Goals to Sustainable Development Goals. Lancet 2012,379, 2206–2211. [CrossRef]
36. Maciková, L.; Smorada, M.; Dorcák, P.; Beug, B.; Markovic, P. Financial Aspects of Sustainability: An Evidencefrom Slovak Companies. Sustainability 2018, 10, 2274. [CrossRef]
37. Koch, F. The New Corporate Philanthropy. How Society and Business Can Profit; Plenum Press: New York, NY,USA, 1979.
38. Mori, R., Jr.; Wyatt, R.; Nuttall, A. ASX 20 Disclosures on the Sustainable Development GoalsCommitment, Structure, Action and Measurement. Research Report. Available online: https://www.researchgate.net/profile/Renzo_Junior/publication/337335851_SDG_Measurement_and_Disclosure_By_ASX150/links/5dd340644585156b351e9180/SDG-Measurement-and-Disclosure-By-ASX150.pdf (accessed on5 November 2020).
39. EY. Sustainability Reporting—The Time is Now. 2014. Available online: https://www.ey.com/Publication/
vwLUAssets/EY-Sustainability-reporting-the-time-is-now/$FILE/EY-Sustainability-reporting-the-time-is-now.pdf (accessed on 20 August 2020).
40. KPMG. The Road Ahead The KPMG Survey of Corporate Responsibility Reporting. 2017.Available online: https://assets.kpmg/content/dam/kpmg/xx/pdf/2017/10/kpmg-survey-of-corporate-responsibility-reporting-2017.pdf (accessed on 20 August 2020).
41. Epstein, M.J.; Roy, M.J. Sustainability in action: Identifying and measuring key performance drivers.Long Range Plan. 2001, 34, 585–604. [CrossRef]
42. EY and Boston College Center for Corporate Citizenship. Value of Sustainability Reporting; Boston CollegeCenter for Corporate Citizenship: Boston, MA, USA, 2016.
43. Tenuta, P. The measurement of sustainability. Rev. Bus. Res. 2010, 10, 163–171.44. Spicer, B.H. Investors, corporate social performance, and information disclosure: An empirical study.
Account. Rev. 1978, 53, 94–111.45. Schramade, W. Investing in the UN Sustainable Development Goals: Opportunities for Companies and
Investors. J. Appl. Corp. Financ. 2017, 29, 87–99. [CrossRef]

Sustainability 2020, 12, 9251 31 of 34
46. Dhaliwal, D.S.; Li, O.Z.; Tsang, A.; Yang, Y.G. Voluntary nonfinancial disclosure and the cost of equity capital:The Initiation of Corporate Social Responsibility Reporting. Account. Rev. 2011, 86, 59–100. [CrossRef]
47. Dhaliwal, D.S.; Radhakrishnan, S.; Tsang, A.; Yang, Y.G. Nonfinancial disclosure and analyst ForecastAccuracy: International Evidence on Corporate Social Responsibility Disclosure. Account. Rev. 2012,87, 723–759. [CrossRef]
48. Belkaoui, A. The Impact of the Disclosure of the Environmental Effects of Organizational Behavior on theMarket. Financ. Manag. 1976, 5, 26–31. [CrossRef]
49. Sturdivant, F.D.; Ginter, J.L. Corporate Social responsiveness: Management Attitudes and EconomicPerformance. Calif. Manag. Rev. 1977, 19, 30–39. [CrossRef]
50. Bnouni, I. Corporate Social Responsibility (CSR) and Financial Performance (FP): Case of French SMEs.Ph.D. Thesis, University of Valenciennes and Hainaut Cambresis, Valenciennes, France, 2010.
51. Muhmad, S.N.; Muhamad, R. Sustainable business practices and financial performance during pre- andpost-SDG adoption periods: A systematic review. J. Sustain. Financ. Invest. 2020. [CrossRef]
52. Lopez, V.M.; Garcia, A.; Rodriguez, L. Sustainable development and corporate performance: A study basedon the Dow Jones sustainability index. J. Bus. Ethics 2007, 75, 285–300. [CrossRef]
53. PwC. Make it your business: Engaging with the Sustainable Development Goals. 2015. Available online:https://www.pwc.com/gx/en/sustainability/SDG/SDG%20Research_FINAL.pdf (accessed on 20 August 2020).
54. Galli, A.; Durovic, G.; Hanscom, L.; Knezevic, J. Think globally, act locally: Implementing the sustainabledevelopment goals in Montenegro. Environ. Sci. Policy 2018, 84, 159–169. [CrossRef]
55. Izzo, M.F.; Ciaburri, M.; Tiscini, R. The Challenge of Sustainable Development Goal Reporting: The FirstEvidence from Italian Listed Companies. Sustainability 2020, 12, 3494. [CrossRef]
56. Nechita, E.; Manea, C.L.; Irimescu, A.M.; Nichita, E.M. The content analysis of reporting on sustainabledevelopment goals. Audit Financ. 2020, 18, 160.
57. Yu, S.; Sial, M.S.; Tran, D.K.; Badulescu, A.; Thu, P.A.; Sehleanu, M. Adoption and Implementation ofSustainable Development Goals (SDGs) in China—Agenda 2030. Sustainability 2020, 12, 6288. [CrossRef]
58. Zimara, V.; Eidam, S. The benefits of social sustainability reporting for companies and stakeholders—Evidencefrom the German chemical industry. J. Bus. Chem. 2015, 12, 85–100.
59. Ali, S.; Hussain, T.; Zhang, G.; Nurunnabi, M.; Li, B. The Implementation of Sustainable Development Goalsin “BRICS” Countries. Sustainability 2018, 10, 2513. [CrossRef]
60. Van Zanten, J.A.; van Tulder, R. Multinational enterprises and the Sustainable Development Goals:An institutional approach to corporate engagement. J. Int. Bus. Policy 2018, 1, 208–233. [CrossRef]
61. Cosma, S.; Venturelli, A.; Schwizer, P.; Boscia, V. Sustainable Development and European Banks:A Non-Financial Disclosure Analysis. Sustainability 2020, 12, 6146. [CrossRef]
62. Jones, P.; Wynn, M.; Hillier, D.; Comfort, D. The Sustainable Development Goals and Information andCommunication Technologies. Indones. J. Sustain. Account. Manag. 2017, 1, 1–15. [CrossRef]
63. Rao, N.C.; Bathla, S.; Kumar, A.; Jha, G.K. Agriculture and sustainable development goals: An overview andissues. Agric. Econ. Res. Rev. 2018, 31, 1–7. [CrossRef]
64. Raszkowski, A.; Bartniczak, B. Sustainable Development in the Central and Eastern European Countries(CEECs): Challenges and Opportunities. Sustainability 2019, 11, 1180. [CrossRef]
65. Zlinszky, J.; Pulay, B.H.; Bonifert, M.S. Implementation of the sustainable development goals—Experiencetransfer from Central and Eastern European countries to the EU. Iustum Aequum Salut. 2018, 14, 141–155.
66. Mhlanga, R.; Gneiting, U.; Agarwal, N. Walking the Talk: Assessing Companies’ Progress from SDG Rhetoricto Action. 2018. Available online: https://oxfamilibrary.openrepository.com/bitstream/handle/10546/620550/
dp-walking-the-talk-business-sdgs-240918-en.pdf (accessed on 26 July 2020).67. Aga, R. The strength of the chemical industry: Managing multidisciplinary business and R&D. Chem. Ind.
2012, 505, 20–29.68. World Business Council for Sustainable Development (WBCSD). Chemical Sector SDG Roadmap.
Available online: https://docs.wbcsd.org/2018/07/Chemical_Sector_SDG_Roadmap.pdf (accessed on30 June 2020).
69. European Environment Agency. Industrial Pollution Country Profiles. Available online: https://www.eea.europa.eu/themes/industry (accessed on 30 August 2020).
70. ISI Emerging Markets Group’s EMIS Platform Database. Available online: https://www.emis.com/industries/Chemicals (accessed on 4 August 2020).

Sustainability 2020, 12, 9251 32 of 34
71. Warwick, P.; Nh, C. The ‘Cost’ of Climate Change: How Carbon Emissions Allowances are Accounted forAmongst European Union Companies. Aust. Account. Rev. 2012, 22, 54–67. [CrossRef]
72. European Central Bank. Available online: https://www.ecb.europa.eu/stats/html/index.en.html (accessed on4 August 2020).
73. Baier, P.; Berninger, M.; Kiesel, F. Environmental, social and governance reporting in annual reports: A textualanalysis. Financ. Mark. Inst. Instrum. 2020, 29, 93–118. [CrossRef]
74. Krippendorff, K. Content Analysis: An Introduction to its Methodology, 2nd ed.; SAGE Publications:Thousand Oaks, CA, USA, 2004.
75. Hummel, K.; Szekely, M. Reporting on the Sustainable Development Goals—Early Evidence from Europe.2019. Available online: https://ssrn.com/abstract=3411017 (accessed on 20 July 2020).
76. Li, F. Textual Analysis of Corporate Disclosures: A survey of Literature. J. Account. Lit. 2010, 29, 143–165.77. Fonseca, L.; Carvalho, F. The Reporting of SDGs by Quality, Environmental, and Occupational Health and
Safety-Certified Organizations. Sustainability 2019, 11, 5797. [CrossRef]78. Nichita, E.-M.; Nechita, E.; Manea, C.L.; Manea, D.; Irimescu, A.M. Reporting on Sustainable Development
Goals. A score based-approach with company-level evidence from Central-Eastern Europe economies.J. Account. Manag. Inf. Syst. 2020, 19, 501–541.
79. Nicolò, G.; Zanellato, G.; Tiron-Tudor, A. Integrated Reporting and European State-Owned Enterprises:A Disclosure Analysis Pre and Post 2014/95/EU. Sustainability 2020, 12, 1908. [CrossRef]
80. Wen, J. A Business Analytics Approach to Corporate Sustainability Analysis. Master of Environmental StudiesCapstone Projects 62. 2014. Available online: http://repository.upenn.edu/mes_capstones/62 (accessed on20 August 2020).
81. van den Bogaerd, M.; Aerts, W. Applying machine learning in accounting research. Expert Syst. Appl. 2011,38, 13414–13424. [CrossRef]
82. Manes-Rossi, F.; Tiron-Tudor, A.; Nicolò, G.; Zanellato, G. Ensuring More Sustainable Reporting in EuropeUsing Non-Financial Disclosure—De Facto and De Jure Evidence. Sustainability 2018, 10, 1162. [CrossRef]
83. PwC. From Promise to Reality: Does Business Really Care about the SDGs? And What Needs to Happen to TurnWords into Action; PwC: London, UK, 2018.
84. Ionas, cu, E.; Mironiuc, M.; Anghel, I.; Huian, M.C. The Involvement of Real Estate Companies in SustainableDevelopment—An Analysis from the SDGs Reporting Perspective. Sustainability 2020, 12, 798. [CrossRef]
85. Goll, I.; Rasheed, A.A. The moderating effect of environmental munificence and dynamism on the relationshipbetween discretionary social responsibility and firm performance. J. Bus. Ethics 2004, 49, 41–54. [CrossRef]
86. Hussain, N.; Rigoni, U.; Cavezzali, E. Does it pay to be sustainable? Looking inside the black box ofthe relationship between sustainability performance and financial performance. Corp. Soc. Responsib.Environ. Manag. 2018, 25, 1198–1211. [CrossRef]
87. Jaggi, B.; Zhao, R. Environmental performance and reporting: Perceptions of managers and accountingprofessionals in Hong Kong. Int. J. Account. 1996, 31, 333–346. [CrossRef]
88. Makni, R.; Francoeur, C.; Bellavance, F. Causality between corporate social performance and financialperformance: Evidence from Canadian firms. J. Bus. Ethics 2009, 89, 409–422. [CrossRef]
89. Hart, S.L.; Ahuja, G. Does it pay to be green? An empirical examination of the relationship between emissionreduction and firm performance. Bus. Strategy Environ. 1996, 5, 30–37. [CrossRef]
90. Seifert, B.; Morris, S.A.; Bartkus, B.R. Having, giving, and getting: Slack resources, corporate philanthropy,and firm financial performance. Bus. Soc. 2004, 43, 135–161. [CrossRef]
91. Mahoney, L.; LaGore, W.; Scazzero, J.A. Corporate social performance, financial performance for firms thatrestate earnings. Issues Soc. Environ. Account. 2008, 2, 104–130. [CrossRef]
92. Seifert, B.; Morris, S.A.; Bartkus, B.R. Comparing big givers and small givers: Financial correlates of corporatephilanthropy. J. Bus. Ethics 2003, 45, 195–211. [CrossRef]
93. Christensen, H.B.; Hail, L.; Leuz, C. Economic Analysis of Widespread Adoption of CSR and SustainabilityReporting Standards, Research Report. 2018. Available online: https://ssrn.com/abstract=3315673 (accessedon 30 August 2020).
94. Mohamad Malo-Alain, A.; Melegy, M.A.H.; Ghoneim, M.R.Y. The Effects of Sustainability Disclosure on theQuality of Financial Reports in Saudi Business Environment. Acad. Account. Financ. Stud. J. 2019, 23, 5.
95. Grimaldi, F.; Caragnano, A.; Zito, M.; Mariani, M. Sustainability Engagement and Earnings Management:The Italian Context. Sustainability 2020, 12, 4881. [CrossRef]

Sustainability 2020, 12, 9251 33 of 34
96. Reverte, C. Determinants of Corporate Social Responsibility Disclosure Ratings by Spanish Listed Firms.J. Bus. Ethics 2009, 88, 351–366. [CrossRef]
97. Orens, R.; Aerts, W.; Cormier, D. Web-based non-financial disclosure and cost of finance. J. Bus. Financ. Account.2010, 37, 1057–1093. [CrossRef]
98. Hoepner, A.; Oikonomou, I.; Scholtens, B.; Schröder, M. The effects of corporate and country sustainabilitycharacteristics on the cost of debt: An international investigation. J. Bus. Financ. Account. 2016, 43, 158–190.[CrossRef]
99. Mion, G.; Loza Adaui, C.R. Mandatory Nonfinancial Disclosure and Its Consequences on the SustainabilityReporting Quality of Italian and German Companies. Sustainability 2019, 11, 4612. [CrossRef]
100. Cho, S.Y.; Lee, C.; Pfeiffer, R.J. Corporate social responsibility performance and information asymmetry.J. Account. Public Policy 2013, 32, 71–83. [CrossRef]
101. Kuzey, C.; Uyar, A. Determinants of sustainability reporting and its impact on firm value: Evidence from theemerging market of Turkey. J. Clean. Prod. 2017, 143, 27–39. [CrossRef]
102. Mummolo, J.; Peterson, E. Improving the Interpretation of Fixed Effects Regression Results. Political Sci.Res. Methods 2018, 6, 829–835. [CrossRef]
103. Bartlett, B.D. The Effect of Corporate Sustainability Reporting on Firm Valuation. CMC Senior Theses.Paper 489. 2012. Available online: http://scholarship.claremont.edu/cmc_theses/489 (accessed on30 August 2020).
104. Weber, O. Corporate sustainability and financial performance of Chinese banks. Sustain. Account. Manag.Policy J. 2017, 8, 358–385. [CrossRef]
105. Mishra, S.; Suar, D. Does corporate social responsibility influence firm performance of Indian companies?J. Bus. Ethics 2010, 95, 571–601. [CrossRef]
106. Osborne, J.W.; Waters, E. Four assumptions of multiple regression that researchers should always test.Pract. Assess. Res. Eval. 2002, 8, 2.
107. Berry, W.D.; Feldman, S. Multiple Regression in Practice. In Sage University Paper Series on QuantitativeApplications in the Social Sciences; Series No. 07-050; Sage: Newbury Park, CA, USA, 1985.
108. Laerd Statistic. Statistical Tutorials and Software Guides. 2015. Available online: https://statistics.laerd.com/
(accessed on 30 August 2020).109. Hair, J.F.; Black, W.C.; Babin, B.J.; Anderson, R.E. Multivariate Data Analysis, 7th ed.; Pearson: Harlow,
UK, 2014.110. Huber, P.J. Robust Statistics; John Wiley & Sons: New York, NY, USA, 1981.111. Cook, R.D.; Weisberg, S. Residuals and Influence in Regression; Chapman & Hall: New York, NY, USA, 1982.112. Ghorbani, H. Mahalanobis distance and its application for detecting multivariate outliers. Facta Univ. Ser.
Math. Inf. 2019, 34, 583–595. [CrossRef]113. United Nations. Independent Group of Scientists appointed by the Secretary-General. Global Sustainable
Development Report 2019: The Future is Now—Science for Achieving Sustainable Development.Available online: https://sustainabledevelopment.un.org/content/documents/24797GSDR_report_2019.pdf(accessed on 20 August 2020).
114. Mainali, B.; Luukkanen, J.; Silveira, S.; Kaivo-oja, J. Evaluating Synergies and Trade-Offs among SustainableDevelopment Goals (SDGs): Explorative Analyses of Development Paths in South Asia and Sub-SaharanAfrica. Sustainability 2018, 10, 815. [CrossRef]
115. Nilsson, M.; Chisholm, E.; Griggs, D.; Howden-Chapman, P.; McCollum, D.; Messerli, P.; Neumann, B.;Stevance, A.-S.; Visbeck, M.; Stafford-Smith, M. Mapping interactions between the sustainable developmentgoals: Lessons learned and ways forward. Sustain. Sci. 2018, 13, 1489–1503. [CrossRef]
116. Lahmouri, M.; Drewes, J.E.; Gondhaleka, D. Analysis of Greenhouse Gas Emissions in Centralizedand Decentralized Water Reclamation with Resource Recovery Strategies in Leh Town, Ladakh, India,and Potential for Their Reduction in Context of the Water–Energy–Food Nexus. Water 2019, 11, 906.[CrossRef]
117. Eurostat, Tourism industries—Employment. 2018. Available online: https://ec.europa.eu/eurostat/statistics-explained/index.php/Tourism_industries_-_employment (accessed on 20 August 2020).
118. World Tourism Organization (UNWTO) and United Nations Entity for Gender Equality and the Empowermentof Women. In Global Report on Women in Tourism 2010; UNWTO: Madrid, Spain, 2011.

Sustainability 2020, 12, 9251 34 of 34
119. Jaggi, B.; Freedman, M. An examination of the impact of pollution performance on economic and marketperformance: Pulp and paper firms. J. Bus. Financ. Account. 1992, 19, 697–713. [CrossRef]
Publisher’s Note: MDPI stays neutral with regard to jurisdictional claims in published maps and institutionalaffiliations.
© 2020 by the authors. Licensee MDPI, Basel, Switzerland. This article is an open accessarticle distributed under the terms and conditions of the Creative Commons Attribution(CC BY) license (http://creativecommons.org/licenses/by/4.0/).