Are we on track to achieve the SDGs for children ... - UNICEF
Upload
khangminh22Category
view
1download
0
Business Contribution to the
SDGs – A Student Assessment

2
“Business must be part of the solution to the world’s sustainability challenges. To do that, today’s
business students must learn these skills so they may tackle the challenges as future managers and
executives. The Business Contribution to the SDGs – A Student Assessment project is a unique
opportunity for business students to gain first-hand knowledge about many of today’s company
sustainability activities, to critically evaluate their impact on society, and to support global
knowledge sharing on the SDGs. It is my hope that this project grows to become a crucial way for the
international community to see the contribution of business to achieving the SDGs, while providing
students with key insights into how to engage a sustainable business.”
- Lise Kingo, CEO and Executive Director, United Nations Global Compact
“Participation in global and local issues - political, economic and cultural - is key for individuals. The
Bertelsmann Stiftung works to develop resources that help individuals to participate in these areas,
and to reach their full potential. Supporting The Business Contribution to the SDGs – A Student
Assessment project offers a unique opportunity to engage future leaders in direct research on
corporate performance, to empower students to analyse and develop impressions on how companies
perform on metrics relevant to the SDGs, and to develop openness and transparent dialogue between
multiple stakeholders. Not only does this approach give a voice to students, but creates an
opportunity for those voices to be heard”.
- Julia Scheerer, Project Manager, Bertelsmann Stiftung

3
Table of Contents
Letter from Head of PRME and Executive Director of WikiRate ........................................ 5
Executive Summary ........................................................................................................................... 6
Background........................................................................................................................................... 8
Assignment structure ........................................................................................................................ 9
Part I: Extract data from company COPs submitted to UN Global Compact....................................... 9 Part II: Discuss and analyse data populated on WikiRate (optional for the pilot phase) .......... 11 Learning objectives ................................................................................................................................................. 12
Data Analysis ..................................................................................................................................... 13
Employees/Social data ............................................................................................................................. 13 Decent work and Economic Growth (SDG 8) .................................................................................................. 13 Gender Equality (SDG 5) ........................................................................................................................................ 15
Environmental data ................................................................................................................................... 18 Climate Change (SDG 13 – Climate Action) .................................................................................................... 18 Environmental Fines and Sanctions (SDG 13 & SDG 14 – Life below water/on land) .................... 18 Water use (SDG 6 – Clean Water and Sanitation) ........................................................................................ 19 Waste (SDG 12 – Responsible Consumption and Production) .................................................................. 19 Energy use (SDG 7 – Affordable and Clean Energy) ..................................................................................... 21
Sector Disclosure Analysis ...................................................................................................................... 21 UN Global Compact participation .......................................................................................................... 25 Lessons for future iterations .................................................................................................................. 25
Institution and Student Experience Report ........................................................................... 28
Methodology ................................................................................................................................................. 28 Participants ................................................................................................................................................... 28 Institution Interview Analysis ............................................................................................................... 29
Curriculum Development ..................................................................................................................................... 29 Time Management ................................................................................................................................................... 30 Student Value ............................................................................................................................................................ 30
Student Survey Analysis ........................................................................................................................... 31 Future Improvements ............................................................................................................................... 32
Conclusions & Recommendations ............................................................................................. 33
Appendix – Metrics and Disclosure ........................................................................................... 35

4
Author List:
Richard Mills, Cambridge University
Belinda Gibbons, University of Wollongong
Theresa Heithaus, WikiRate
Sigrun Pahr Skudem, Principles for Responsible Management Education

5
Letter from Head of PRME and Executive Director of WikiRate
With the launch of the Sustainable Development Goals (SDGs) in 2016, the private sector was included as a contributor and stakeholder to advancing the Goals. As we move forward toward the 2030 target, there is increasing urgency to understand how the private sector is and should be working towards the Goals. One aspect of this is learning what companies are already doing and identifying areas where the private sector could contribute more, and another is helping to create a shared understanding among stakeholders and companies operating in different contexts, of what companies should be reporting and measuring, so that a collective awareness of company contributions can emerge.
In 2016, the Principles for Responsible Management Education (PRME) initiative, WikiRate, the UN Global Compact and the Bertelsmann Foundation developed Business Contribution to the SDGs – A Student Assessment, a pilot project to engage students and the next generation in contributing to the SDGs. We knew through this project that we wanted to try something new and ambitious, and to support research that increased collective awareness of the SDGs. The partners came together around a student assignment framework which aimed to shed light on corporate performance with relation to the SDGs, and to engage students in practical research where they learn the nuances and complexities of the corporate social responsibility landscape, while generating structured, publicly available company-level data that is comparable and usable for further research and analysis.
Business Contribution to the SDGs – A Student Assessment is part of the PRME SDG Student Engagement Platform that was also launched in 2016. Students and professors from Advanced PRME signatory institutions were invited to participate in the pilot project and professors interested in new ways to integrate sustainability and the SDGs into education from PRME Advanced signatories, joined. The WikiRate platform provided tools to support the students generating open data, and integrated the repository of Communication on Progress reporting from the UN Global Compact, while the Bertelsmann Foundation provided research questions for professors to use in guiding the students’ qualitative analysis through reports and presentations. Between January and June 2017, the assignment was successfully integrated into 13 courses at 9 universities from 7 countries and 5 continents.
As a project that spanned the globe, there were numerous insights and innovations, as well as successes and failures that are captured in this report. It is important to us to not only learn from the experiences and complexities of setting up such a project, but also share these with the community in a way that can be useful for others looking to advance sustainability education, and can be utilised by ourselves and the professors and students that engage in further iteration of the project.
We hope you will find the case studies and learnings within as interesting and insightful as we do, and look forward to continuing to develop opportunities like these with you.
Jonas Haertle Head, Principles for Responsible Management Education
Vishal Kapadia Executive Director, WikiRate
6
Executive Summary
The pilot project Business Contribution to the SDGs - A Student Assessment is a partnership of
the Principles for Responsible Management Education (PRME) initiative, the WikiRate Project e.V.
(WikiRate), the UN Global Compact, and the Bertelsmann Stiftung. The aims of the pilot stage of
the project were to:
1. Embed the 2030 Agenda and its Sustainable Development Goals (SDGs) in the minds of
the next generation of business leaders through active research and analysis, promoting
engagement and familiarity with companies’ reporting outputs
2. Seek structured ways of tracking company performance towards the SDGs and the UN
Global Compact’s Ten Principles, testing a broad selection of metrics of performance from
standards like the Global Reporting Initiative and UN Global Compact's Poverty Footprint.
Who participated
The pilot included 9 higher education institutions, with 13 professors in 7 countries across 5
continents, engaging 950 students and generating over 20,000 data points on corporate
sustainability performance. Student participants with different levels of education, from first year
undergraduates through master’s students, generated data through researching corporate
sustainability and annual reports of Global Compact participants submitted as Communication on
Progress reports (COPs), and added it to the WikiRate platform.
Each cohort used a research project created on WikiRate.org, specifying the companies to be
researched and a set of metric questions to be asked of their performance. The project pages
automatically generate research pages for included companies, where participants can work
through the metrics alongside relevant sources, adding answers and comments to the platform.
Metrics were selected with the guidance of the SDG Compass.1
Embedding the 2030 Agenda in the minds of the next generation of business leaders
● Professors found the chance to work with ‘real-world’ companies and ‘real’ data
extremely valuable, as it presented a different way of learning and student engagement.
● In classrooms where students were able to generate research questions based on
guidance from the professor or the project brief, students found greater value.
● Overall, 87% of students thought the assignment was relevant to their study, with 89%
learning more about the SDGs and 95% learning more about CSR.
● Innovations included students directly reaching out to companies to ask for missing data,
or to correct mistaken data. The outreach was positively received by the companies who
responded, and often the dialogue created opportunity to correct data and fill gaps.
Tracking company performance towards the SDGs
● Companies generally disclosed more information about environmental indicators2 than
social indicators3
● When considering the two most relevant metrics for a selection of SDGs, disclosure rates
were as follows (metric names in brackets): 1 WikiRate metrics and SDG Compass: http://wikirate.org/Global_Goals_for_Sustainable_Development 2 http://wikirate.org/WikiRate_SDG_Metric_design+Common_Environmental_Metrics_Reported 3 http://wikirate.org/WikiRate_SDG_Metric_design+Common_Social_Metrics_Reported
7
○ SDG 13 – Climate Action (scope 1 and 2 GHG emissions): 84%
○ SDG 5 – Gender Equality (female employees, women in management): 79%
○ SDG 3 – Good Health and Wellbeing (worker fatalities, Injuries): 63%
○ SDG 7 – Affordable and Clean Energy (total energy consumed, renewable fuel
consumption): 55%
○ SDG 6 – Clean Water and Sanitation (total water withdrawals, water recycled):
55%
● Company and metric selection for research was performed according to each course’s
topic focus, and this introduced limitations for analysis of data pooled from all pilots.
● There was a small trend whereby Global Compact Advanced signatories reported on more
indicators than Active and Learner signatories. There was a selection bias in sampling the
reports to be analysed, as reports containing little structured data were filtered out. The
trend would likely be greater were all COPs included regardless of data availability.
● There is a wide range of disclosure rates in COPs - from companies reporting few to no
structured data, to well-structured data that follows a standard comprehensively,
presented in tables and with indices.
● 44.4% of students strongly agreed that they had to look beyond the COP report to find the
information required for their assignment.
Lessons for future iterations
● Professors saw value in creating a community of sharing course development materials
such as subject outlines, assessment, and training materials
● A common core set of metrics agreed in advance to be researched by all participants, and
that will allow key questions about performance towards the SDGs to be addressed.
● Engage students more deeply in the research process: designing research questions,
structuring data collection to address those questions, and sharing their analyses.
● More developed data collection strategy can maximise the utility of the data: many
metrics used in the pilot are widely reported on and can yield insight into performance
towards the SDGs.
● Do not include the metrics rarely reported on in the core set of metrics for future
iterations, but these may be valuable to address certain focused research questions.
Next steps
The project leaders will look to refine and build upon the educational outcomes of this year’s pilot
project and develop the engagement between students and corporations around disclosure and
transparency. The ambition is to attract resources to scale the next iteration of the project in
terms of reach and also data outcome. Such ambition complements the drive for transparency and
understanding around reporting on the SDGs, complementing the work of the overall UN Global
Compact, Global Reporting Initiative, and the World Business Council for Sustainable
Development’s SDGs reporting platform.
As a next step, the project intends to double in scale the number of students and institutions
engaged, while implementing lessons learned from the first pilot.

8
Background
With the adoption of the 2030 Agenda for Sustainable Development it is of high relevance to track
and assess the contributions of business to the achievement of the Sustainable Development
Goals (SDGs). The UN Global Compact has a large repository of data and information about how
businesses act on the SDGs, particularly the Communication on Progress Reports (COPs) received
annually from its participants. To engage the next generation of business leaders and tap into
their sustainability mind-set, PRME Secretariat identified an opportunity to partner with the
independent non-profit WikiRate Project e.V. to empower students to support and advance the
SDGs by proactively identifying, aggregating, analysing, and sharing the achievements of
companies in support of the SDGs as reported in the COPs on the open-data platform
WikiRate.org.
The aim of the pilot project Business Contribution to the SDGs – A Student Assessment was to
embed the 2030 Agenda in the minds of the next generation of business leaders through active
research and analysis, while at the same time tracking the corporate sectors’ contributions
towards the SDGs and performance against the UN Global Compact's Ten Principles.
The project partners – UN Global Compact, Principles for Responsible Management Education
(PRME) initiative, WikiRate and Bertelsmann Stiftung – began the outreach to PRME Champion
and Advanced signatories in September 2016 and were pleased to secure nine schools with more
than 950 students to participate in the pilot phase, which ran over the first half of 2017.
Institution Country # Students Coordinator/Professors
Glasgow Caledonian University Scotland 110 Alec Wersun
HHL Leipzig Graduate School of
Management
Germany 8 Andreas Suchanek
Oxford Brookes Business School United
Kingdom
16 Jonathan Louw
University of London, Royal Holloway
School of Management
United
Kingdom
357 Anica Zeyen, Helen Tregidga,
Stephanos Anastasiadis
Universidad EAFIT Colombia 103 Maria Alejandra Gonzalez-Perez
University of Pretoria, Gordon Institute of
Business Science
South Africa 238 Morris Mthombeni
University of Western Australia Australia 70 Jacqueline Boaks
University of Wollongong Faculty of
Business
Australia 16 Stephanie Perkiss
Wilfrid Laurier University Canada 35 Kalyani Menon
Table 1. Participant institution list
The subsequent sections of the report will outline the structure of the pilot assignment
incorporated into participant’s classes (Part I and Part II), the approach to determining scope of
research for each course, followed by an analysis of the data generated, evaluation of the project
from the perspective of professors and students. While lessons learned are highlighted in both the
data analysis and the evaluation, the conclusion and recommendations section will pull from both
sections to tie together learnings that will be carried into the next phase of the project.

9
Assignment structure
The basic structure of the assignment was similar across participating universities, but focus of
data collection was flexible in order to fit the assignment to course topics, provide value to
professors in their own research if desired, and to support institutional objectives.
By analysing company performance through the annual sustainability reports and
Communication on Progress reports (COPs) submitted to the UN Global Compact by business
participants, students could gain an understanding of corporate sustainability, the UN sustainable
development agenda and issues of subjectivity, contextualisation of data, and comparability.
Part I: Extract data from company COPs submitted to UN Global Compact.
Data on WikiRate is generated through research into company statements, sustainability reports
and other publicly available materials. As companies typically submit their Communication on
Progress (COP) reports and other sustainability reports as PDFs or webpages, data points are
difficult to access, compare and use for research and performance assessment. This assignment
was thus structured for students to research and extract this data onto the WikiRate platform,
and then to use this data for analysis in line with their course.
The concept of Metrics is central to the WikiRate platform. A Metric is a structure for asking a
standardised question of many companies and storing the answers (for a particular company in a
particular year). Each metric answer must cite a source of evidence (in this case usually a COP
report), and researchers should provide a comment explaining where the data was found within
the source alongside any calculations or interpretation that was required to obtain the metric
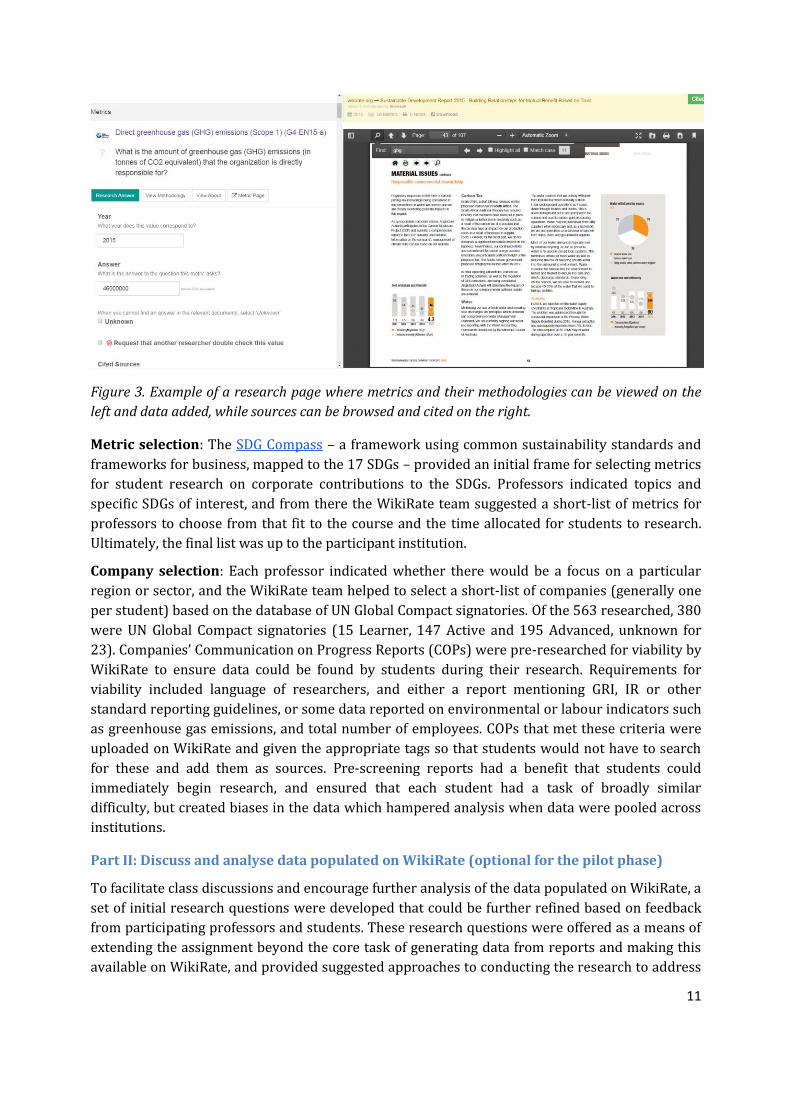
answer.4 Figure 1 shows an example of a researched metric.
Basic assignment structure: Each student researches at least one company according to the
metrics in the class’ Project page on WikiRate, and verifies or “double-checks” data on a different
company researched by a fellow student. WikiRate offers a number of tools to support setting up
and coordinating research on the platform. Figure 2 shows a project page with a description of
the project and has details of the scope of research (companies and metrics). From a project page,
clicking the “research” button next to a company takes one to the research page for that company,
where relevant sources can be viewed and data/comments added for the project’s metrics.
The activity could be done as an individual or group assignment.
4 Metric answers are produced and maintained following wiki principles, if there is disagreement about the correct answer for a company in a particular year this should be discussed and the answer edited to reflect the resolution. Metrics also include a description of how they are used and assessed, along with meta-data like tags to aid navigation.

10
Figure 1. A metric on WikiRate about employees covered by collective bargaining agreements5,
based on the GRI’s G4 standard.
Figure 2. A project page from the Gordon Institute of Business Science pilot.
5 http://wikirate.org/Global_Reporting_Initiative+Collective_bargaining_G4_11
11
Figure 3. Example of a research page where metrics and their methodologies can be viewed on the
left and data added, while sources can be browsed and cited on the right.
Metric selection: The SDG Compass – a framework using common sustainability standards and
frameworks for business, mapped to the 17 SDGs – provided an initial frame for selecting metrics
for student research on corporate contributions to the SDGs. Professors indicated topics and
specific SDGs of interest, and from there the WikiRate team suggested a short-list of metrics for
professors to choose from that fit to the course and the time allocated for students to research.
Ultimately, the final list was up to the participant institution.
Company selection: Each professor indicated whether there would be a focus on a particular
region or sector, and the WikiRate team helped to select a short-list of companies (generally one
per student) based on the database of UN Global Compact signatories. Of the 563 researched, 380
were UN Global Compact signatories (15 Learner, 147 Active and 195 Advanced, unknown for
23). Companies’ Communication on Progress Reports (COPs) were pre-researched for viability by
WikiRate to ensure data could be found by students during their research. Requirements for
viability included language of researchers, and either a report mentioning GRI, IR or other
standard reporting guidelines, or some data reported on environmental or labour indicators such
as greenhouse gas emissions, and total number of employees. COPs that met these criteria were
uploaded on WikiRate and given the appropriate tags so that students would not have to search
for these and add them as sources. Pre-screening reports had a benefit that students could
immediately begin research, and ensured that each student had a task of broadly similar
difficulty, but created biases in the data which hampered analysis when data were pooled across
institutions.
Part II: Discuss and analyse data populated on WikiRate (optional for the pilot phase)
To facilitate class discussions and encourage further analysis of the data populated on WikiRate, a
set of initial research questions were developed that could be further refined based on feedback
from participating professors and students. These research questions were offered as a means of
extending the assignment beyond the core task of generating data from reports and making this
available on WikiRate, and provided suggested approaches to conducting the research to address

12
guiding questions. Research questions were as follows: (1) How do different business sectors
contribute to achieving the SDGs? (2) What are the measurable business contributions to
achieving the SDGs on a national level? and (3) What are the measurable business contributions
to accomplish the SDGs on a global level? Classes could reply to one or more of these research
questions, and select one, or a subset, of SDGs to consider from this perspective. It was not
necessary to address a research question in relation to all 17 SDGs.
Learning objectives
The activity was structured to enable students to have a valuable learning experience by
researching companies’ sustainability efforts and understand how these relate to challenges to
achieving the SDGs. Through the pilot, students would able to:
● Engage directly with corporate social responsibility reporting in a purposeful and
structured way.
● Gain a deeper understanding of corporate social responsibility strategies, how they are
applied, tracked and reported, and why they are important.
● Gain a deeper understanding of the Sustainable Development Goals.
● Understand how companies use the Global Reporting Initiative (GRI) guidelines and
report on GRI indicators.
● Consider how corporate contributions to achieving the SDGs can be tracked with available
metrics and data.
● Discuss alternative approaches for evaluating the effectiveness of different strategies.
● Connect with peers conducting similar research.

13
Data Analysis
A total of 22,718 answers to metric questions for 563 companies were collected by students at
the 9 participating Advanced PRME signatories. Some projects included companies that were not
UN Global Compact participants and these companies have not been considered in the following
analyses. A total of 18,018 metric answers were collected for 380 UN Global Compact companies.
68% of the answers added by student participants have been checked by a second participant
with this information being fed into WikiRate. 5% of the answers added by student participants
have a “check requested” flag which flags the value as needing to be checked by a second person,
indicating some level of uncertainty on the part of the contributor who added the value.
There was some variability in the metrics selected by each institution, with some metrics being
selected for almost every project while others were selected infrequently. The choice of metrics to
research was ultimately made by the partner institution, with freedom to choose metrics that
fitted a particular course or sector focus.
Analysis of the collected data are presented below in high-level sections for Employee/Social
metrics and Environmental metrics, further broken down by the relevant Sustainable
Development Goals (SDGs), followed by a Sector Analysis, a section on Global Compact
Participation, and Lessons Learned for future iterations of the project.
As a starting point, reporting related to a selection of SDGs was considered by identifying the two
most relevant metrics for each SDG and calculating the disclosure rates for these metrics.
● SDG 13 – Climate Action (scope 1 and 2 GHG emissions): 84% ● SDG 5 – Gender Equality (female employees, women on Board): 79% ● SDG 3 – Good Health and Wellbeing (worker fatalities, Injuries): 63% ● SDG 7 – Affordable and Clean Energy (total energy consumed, renewable fuel
consumption): 55% ● SDG 6 – Clean Water and Sanitation (total water withdrawals, water recycled): 55%
A full list of metrics used by pilot participants and information about disclosure rates is included
in the Appendix at the end of this document.
Employees/Social data
Decent work and Economic Growth (SDG 8)
Total Employees was almost always reported (95%) in the COP, and male/female breakdown also
commonly reported (84%). Breakdown of temporary/permanent employees was reported less
often (60%), number of full-time employees (64%) was reported more than number of part-time
employees (49%).
Worker Fatalities (70%) are reported more than injury rates (60%) – but this could be due to
different definitions of injury rate, some of which don’t conform to GRI’s standard.
Health and safety representation is reported by 63% of the companies from which this
information was sought. More than half of the companies that reported this reported 100% health
and safety representation.
14
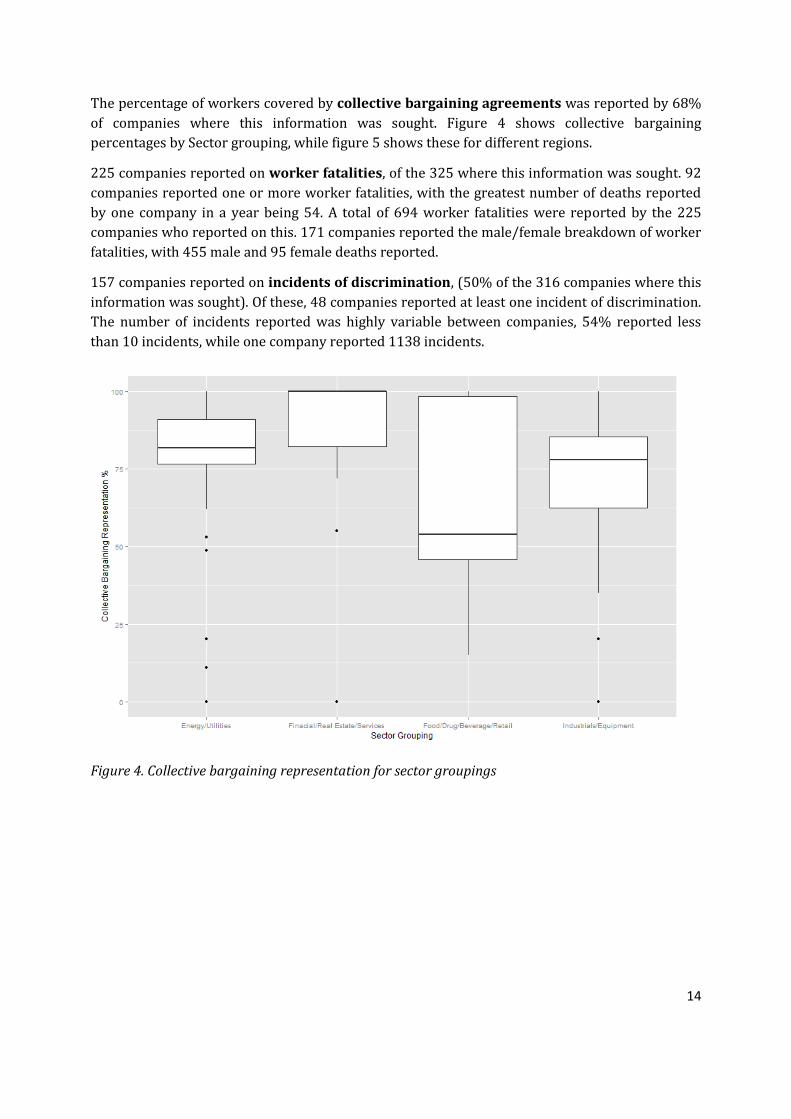
The percentage of workers covered by collective bargaining agreements was reported by 68%
of companies where this information was sought. Figure 4 shows collective bargaining
percentages by Sector grouping, while figure 5 shows these for different regions.
225 companies reported on worker fatalities, of the 325 where this information was sought. 92
companies reported one or more worker fatalities, with the greatest number of deaths reported
by one company in a year being 54. A total of 694 worker fatalities were reported by the 225
companies who reported on this. 171 companies reported the male/female breakdown of worker
fatalities, with 455 male and 95 female deaths reported.
157 companies reported on incidents of discrimination, (50% of the 316 companies where this
information was sought). Of these, 48 companies reported at least one incident of discrimination.
The number of incidents reported was highly variable between companies, 54% reported less
than 10 incidents, while one company reported 1138 incidents.
Figure 4. Collective bargaining representation for sector groupings

15
Figure 5. Percentage of employees covered by collective bargaining agreements. Some Regions have
sparse data (e.g. Northern America is represented by just 7 companies)
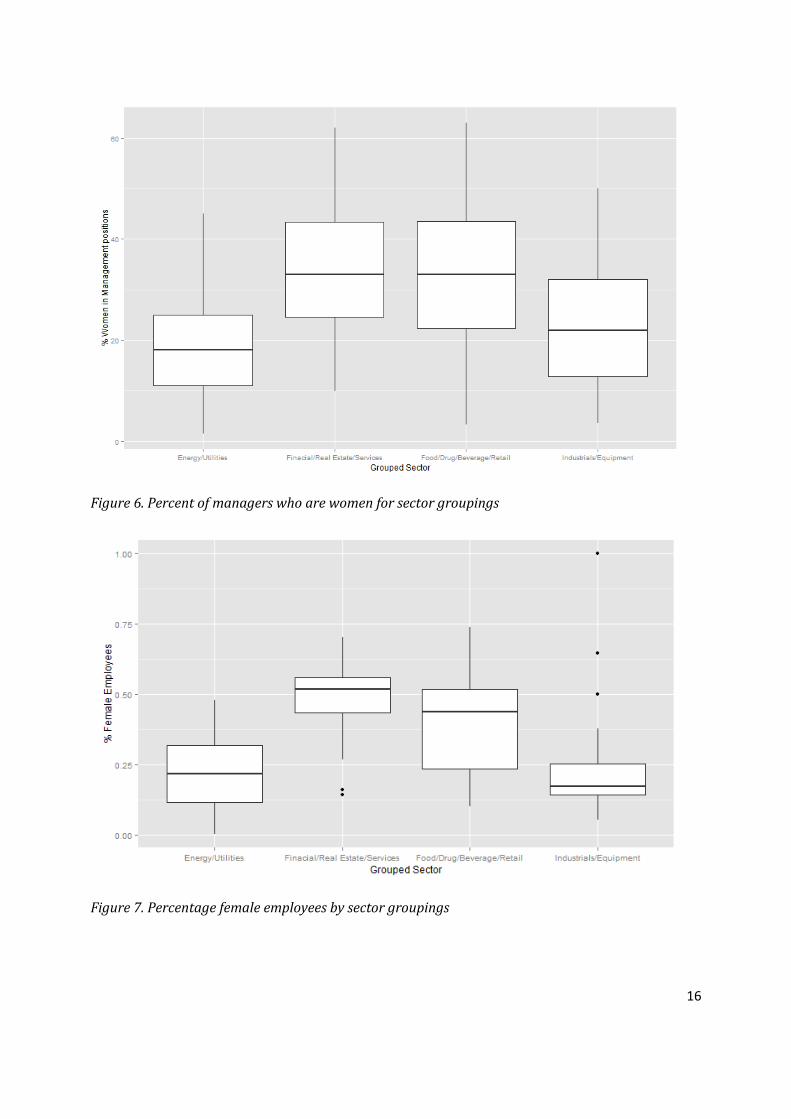
Gender Equality (SDG 5)
Women in management positions is the most often reported Gender Equality metric (75%).
Gender breakdowns of other metrics are often not reported – Male/Female worker fatalities are
most often reported (51%), Male/Female average hours of training are reported by 29% (with
67% reporting this without gender breakdown), Male/Female Injury rates are reported by 20%.
34% of companies reported on the number of employees who took parental leave, with 30%
reporting the number of female employees and 25% reporting the number of male employees.
Companies that reported on parental leave also tended to report the number of employees
returned after leave and entitled to leave.
Access to childcare services has not been reported often (8%). The poverty footprint indicators
about women in skilled (28%) and unskilled (16%) positions have also not been reported often,
but this may be because the way employees are categorised often does not map easily unto
skilled/unskilled distinction.
Figures 6-8 show a trend whereby companies in certain sector groupings tend to have more
female employees and managers. Also, irrespective of sector grouping there is a tendency for
companies who employ more women to also have a greater percentage of women in management
positions.
16
Figure 6. Percent of managers who are women for sector groupings
Figure 7. Percentage female employees by sector groupings

17
Figure 8. % Female Employees vs. % Female Managers, with a correlation of 0.53
If one considers the percentage of female employees alongside the percentage of female managers
these numbers should be roughly similar in a company where women have the same
opportunities for career progression as men. For the 72 companies that reported required data,
47 had a lower percentage of female managers than employees (i.e. women underrepresented in
management positions) while 25 had a higher percentage female managers than employees.
A calculated metric6 has been created on WikiRate, which reproduces this analysis of the
differential between female employees % and female managers % (values less than 0 indicate
that women are under-represented in management relative to their representation in the
workforce.) This metric is shown in figure 9. Calculated metrics use live data from researched
metrics (in this case total employees, female employees, and percentage women in management).
Calculated metrics are applied to all companies for which this data is available, and as data is
added or edited these calculations are automatically updated.
6 Calculated metrics are dynamically determined from other metric answers and are automatically updated when values change. There are three types of Calculated Metrics: Formula, Scoring system, or Ratings system. Formulas generate new values from existing data using free-form mathematical formulas and make use of Wolfram Language integration. Scores normalizse answer values on a 1-10 scale. WikiRatings combine scores with weighted averages.

18
Figure 9. Calculated metric showing the differential between female employees % and female
managers %7
Environmental data
Climate Change (SDG 13 – Climate Action)
Scope 1 and 2 GHG emissions are the most relevant metrics to assess performance on climate
change and these are reported by most companies (86%). It is difficult to interpret what a
company’s number of tonnes of greenhouse gas emissions (in CO2 equivalent) means for their
performance. One obvious starting point is to consider whether the company’ GHG emissions are
increasing or decreasing. Projects in this pilot generally asked participating students to collect
data only from the most recent COP and so historical data for comparison is usually absent.
However, some COPs included a table with some historical data, and students were asked to
extract all of this data where it is available. There are 46 companies in the data where scope 1 and
2 GHG emissions are available for the current and at least one previous year - for 28 of these
companies the level of GHG emissions (scope 1 and 2 combined) in the current year was lower
than the previous year, for the other 18 the level of GHG emissions increased. Ideally these
changes would be interpreted in relation to other changes in the company’s performance (i.e. did
the size of the company or level of production increase or decrease?).
Environmental Fines and Sanctions (SDG 13 & SDG 14 – Life below water/on land)
The question of whether a company reported environmental fines was asked of 249 UN Global
Compact companies and an answer found for 144. Of these 144, 115 reported $0 in
environmental fines, while 29 reported being fined. The question of whether a company reported
environmental non-monetary sanctions was asked of 253 companies, with an answer being found
for 136, of which 28 reported environmental sanctions. Most of the companies that reported
environmental fines or sanctions reported both (19 companies that were subject to both
environmental fines and sanctions).
7 http://wikirate.org/WikiRate_SDG_Metric_design+Female_workers_managers_differential

19
Environmental protection expenditure
The metric on environmental protection expenditure was researched for 181 companies, with an
answer being found for 71. The median environmental expenditure reported by these companies
was $2.8 million USD. Of the 28 companies that reported environmental fines, 12 also reported
expenditure on environmental protection.
Water use (SDG 6 – Clean Water and Sanitation)
Information on total water withdrawals was sought for 189 companies and found for 132. The
volume of water use is difficult to interpret on its own, and even when expressed as a ratio of
cubic metres per employee there is considerable variation between companies (mean 5497 cubic
metres per employee, median 127, standard deviation 16019).
The question of what percentage of water used was recycled was asked of 180 companies and an
answer found for 66. Where this is reported, the mean water recycled is 30% (median 20%).
Rates of water recycling (and reporting thereof) are higher in the Energy/Utilities and
Industrials/Equipment sector groupings. Figure 10 shows water recycling percentage by sector
grouping.
Figure 10. Water recycling percentage by sector grouping
Waste (SDG 12 – Responsible Consumption and Production)
Total waste generated was reported by 155 companies of the 213 where this information was
sought. Total waste recycled was reported by 116 companies of the 202 where this information
was sought. It was possible to calculate the percentage of waste recycled for 96 companies, and
this is shown by sector grouping in Figure 11. For companies where it was possible to calculate
the percentage of waste recycled, this had a mean and median of 53%.

20
Figure 11. Waste recycling as a percentage of waste generated by sector grouping.
Of the 217 companies where data about hazardous waste was sought, this could only be found for
71. The percentage of each organisation’s waste which was hazardous was calculated for 58
companies, and for 39 of these hazardous waste accounted for less than 10% of their total waste
generated. Figure 12 shows the percentage of hazardous waste for sector groupings.
Figure 12. Percentage of companies waste which was hazardous (N = 58)

21
Energy use (SDG 7 – Affordable and Clean Energy)
The question of how much fuel from non-renewable sources was used was asked of 203
companies and an answer found for 75. It was possible to find the amount of renewable fuel used
and to calculate the percentage renewable fuel used for 43 companies, these percentages are
shown in Figure 13. A live calculated metric showing this analysis has also been created on
WikiRate8.
Figure 13. Percentage of fuel used from renewable sources (N = 43)
Sector Disclosure Analysis
A set of metrics that are commonly reported on was defined – those metrics for which answers
have been found for at least 100 companies, excluding metrics that are obviously only relevant to
certain sectors (e.g. NOx emissions). This list was comprised of 25 metrics, 10 environmental and
15 social. Each company was profiled on the basis of how many of these metrics they provided
answers for. Calculated metrics assessing companies’ disclosure of these common social and
environmental metrics have been created on WikiRate, these are applied to all companies and use
all available data on the platform. The list of metrics included in these analyses can be seen on the
pages for the WikiRate calculated metrics, along with features to filter the data and see individual
answers for included metrics.
8 http://wikirate.org/WikiRate_SDG_Metric_design+Percentage_renewable_fuel_used

22
Figure 14. Number of answers disclosed for 10 commonly reported environmental metrics9
Figure 15. Number of answers disclosed for 15 commonly reported social metrics10
Disclosure rates for UN Global Compact participants based on data collected in the pilot are
presented on the basis of sector groupings and regions below.
9 http://wikirate.org/WikiRate_SDG_Metric_design+Common_Environmental_Metrics_Reported 10 http://wikirate.org/WikiRate_SDG_Metric_design+Common_Social_Metrics_Reported

23
Figure 16. Percentage of common environmental metrics reported on by sector grouping.
Figure 17. Percentage of common social metrics reported on by sector grouping.
Companies in the energy/utilities grouping tended to report on more of the common
environmental and social metrics than other groupings. Food/Drug/Beverage/Retail companies
reported frequently on environmental metrics but this grouping was associated with lower
reporting on social metrics.

24
When considering reporting on the basis of region, Latin American companies had the highest
rates of reporting on common social and environmental metrics. Europe, Africa and Other (MENA
and Oceania) regions were associated with similar levels of reporting on these common metrics.
Companies in North America and Asia had lower rates of reporting on both social and
environmental metrics, but it should be noted that North America was represented in this sample
by just 15 companies.
Figure 18. Percentage of common environmental metrics reported on by region.
Figure 19. Percentage of common social metrics reported on by region.
25
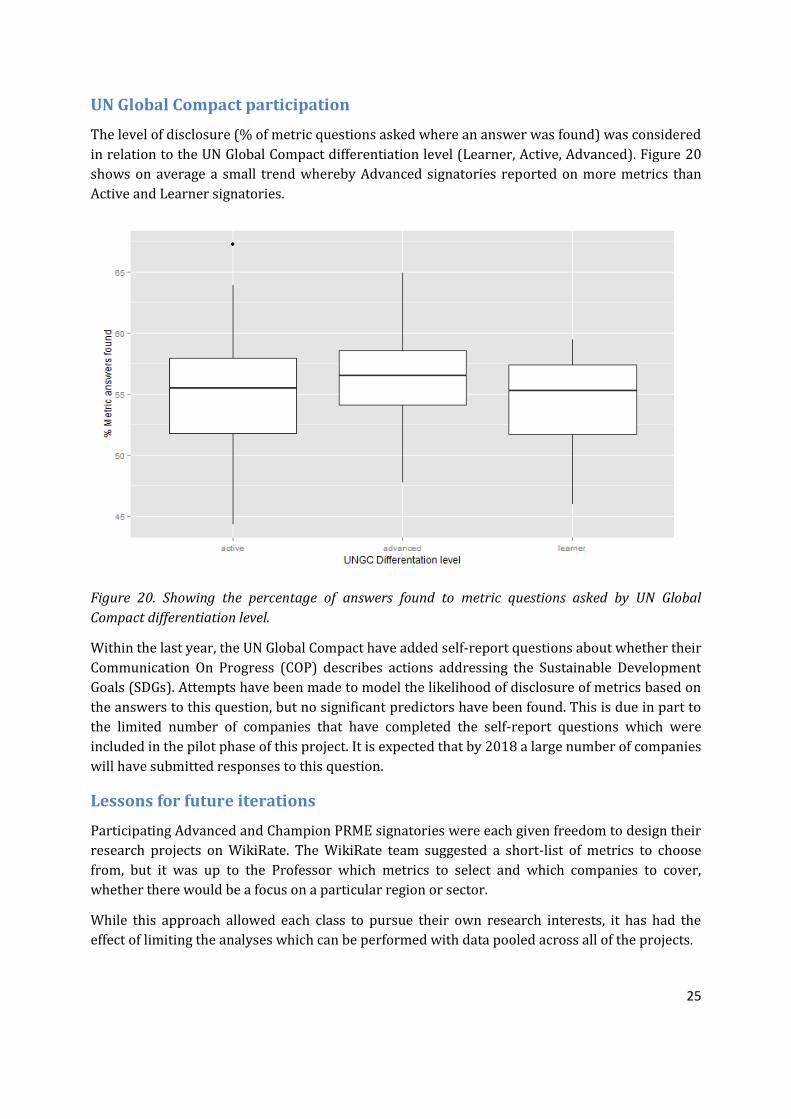
UN Global Compact participation
The level of disclosure (% of metric questions asked where an answer was found) was considered
in relation to the UN Global Compact differentiation level (Learner, Active, Advanced). Figure 20
shows on average a small trend whereby Advanced signatories reported on more metrics than
Active and Learner signatories.
Figure 20. Showing the percentage of answers found to metric questions asked by UN Global
Compact differentiation level.
Within the last year, the UN Global Compact have added self-report questions about whether their
Communication On Progress (COP) describes actions addressing the Sustainable Development
Goals (SDGs). Attempts have been made to model the likelihood of disclosure of metrics based on
the answers to this question, but no significant predictors have been found. This is due in part to
the limited number of companies that have completed the self-report questions which were
included in the pilot phase of this project. It is expected that by 2018 a large number of companies
will have submitted responses to this question.
Lessons for future iterations
Participating Advanced and Champion PRME signatories were each given freedom to design their
research projects on WikiRate. The WikiRate team suggested a short-list of metrics to choose
from, but it was up to the Professor which metrics to select and which companies to cover,
whether there would be a focus on a particular region or sector.
While this approach allowed each class to pursue their own research interests, it has had the
effect of limiting the analyses which can be performed with data pooled across all of the projects.
26
Also, in this pilot round each student was generally asked to research one company based on their
most recent COP – and while students were encouraged to extract historical data when present in
the COP, there was no structured approach to collecting historical data. It is hard to interpret
what performance on a lot of these metrics mean in isolation. For example, is 1 million tonnes of
Scope 1 Greenhouse Gas Emissions a little or a lot? The answer depends on many factors,
including the Sector the company operates in and the scale of its operations. The pilot study did
not include many metrics that could be used as “denominators” or proxies for the size of a
company – number of employees is the only metric which was routinely collected that can be
used in this way. Even with a denominator like number of employees or annual revenue, it is
difficult to interpret what a company’s Scope 1 emissions in 2016 mean when assessing its
performance. A logical next step here is to consider whether the company’s emissions per
employee or dollar revenue are on an upward or downward trend, this would indicate whether
the company is taking steps to reduce its emissions. If research questions about trends are to be
addressed in subsequent iterations, this suggests a shift towards researching a smaller number of
companies (or a smaller number of metrics per company) based not just on their most recent COP
but on their last few COPs.
The data and analysis yield of subsequent iterations can be greatly improved by consideration of
which research questions are to be answered and which metrics are needed to answer those
questions, at a high level before individual institutions start setting up their own projects. The
utility of the collected data would be maximised by agreeing a fixed methodology (metrics to
research and a standard way of selecting the companies/COPs to be studied) that would be used
by all participating institutions. However, this would come at a cost of allowing each participating
Professor to tailor the assignment to their particular course and the interests of their students.
Likely the best solution will be some sort of middle ground between the total freedom of the pilot
and a completely fixed project specification that is adopted by all groups. We propose the
following:
1. A core set of research questions which are relevant to every company regardless of sector
or geography, with an accompanying set of metrics that are included in every project. If
one research question is “Are companies reducing their GHG emissions?” this would mean
that each project includes the Scope 1 and 2 GHG emissions metrics along with suitable
denominators (like revenue or number of employees) and extracts data for these metrics
from each company’s three latest COPs.
2. A shared collaborative environment for developing additional “optional” research
questions, where again each question is developed to understand what the relevant
metrics are and how these metrics will be used to answer the question. Ideally
participating students would contribute directly to this collaborative environment, with
an opportunity to develop their own research questions and discuss the methodology for
answering those suggested by others. If we can include students in the process of framing
questions and designing methodologies for answering these, this should make the project
much more interesting for them (as data collection then becomes a means of answering
the questions that they and others have identified as important) and enhance learning
outcomes.

27
We are proposing that a stage is added at the beginning of every project where students within a
class first consider the research questions that they wish to address. This would involve
reviewing the list of possible research questions in the collaborative environment shared by all
PRME signatories, choosing existing questions or adding new ones. We suggest that this should be
a collaborative exercise within each class, so that at the end of the process the class (or
individuals/groups) selects the set of research questions they will all address (in addition to a
core set of questions that all classes are being asked to address) and the Business Contribution to
the SDGs – A Student Assessment project is constructed on that basis (i.e. including the relevant
metrics and, where questions are sector or geography specific, appropriate companies).
Some students participating in the pilot went beyond the specified assignment to 1) make contact
with companies directly with queries about their performance, and 2) design and research new
metrics that were not included in the assignment. It is encouraging that some students took this
initiative, and these approaches should be noted as possible ways to complement the core
research activity in subsequent iterations.
Company selection caused significant challenges for the pilot. Members of the WikiRate team
manually vetted the COPs of relevant companies to check that their reporting contained at least
some relevant information for the selected metrics and that these were structured in a way which
would allow students to find the data relatively easily. There is considerable variation in the type
of information contained in COPs and how this is presented, and it was felt that it would be unfair
to assign some students a company which had a “difficult” COP or one which contained little
relevant information.
The approach caused two problems:
1. The WikiRate team spent significant time on this vetting process, so it is not scalable as
the number of participating PRME signatories increases.
2. This process introduces a bias to the collected data, in that companies whose COPs
contain little relevant information were screened out.
To address this issue, we propose that company selection should be the purview of individual
student participants. We will design a process whereby an individual student can “screen” the
company they selected by answering 4-5 metric questions about their COP, for example “Does the
COP present greenhouse gas emissions data?” and “Does the COP include a GRI index?” – along
with instructions for when the student should choose an alternative company depending on the
answers to these screening questions. This approach has the advantage that the screening
process will be documented, and should include commonly reported core metrics. This will allow
the exercise to generate insights into the qualities of COPs more broadly, without the danger of
individual students being burdened with a particularly difficult or unrewarding COP to work with.
To summarise, future iterations of this project should engage students more in the design of the
research and make analysis of collected data a more central part of the project. This will deliver a
more interesting experience for students and better learning outcomes. Features for the analysis
of data on WikiRate—calculated metrics mentioned above—should be ready for use by students
in the next iteration of this project. If the use of calculated metrics can be effectively integrated
with this project, this offers the chance of capturing the insights derived from students’ analyses
alongside the collected data on the public WikiRate platform.

28
__________________________________________________________________________________________
Institution and Student Experience Report
While the first section of this report described the outcome and analysis of the data extracted and
aggregated by the student participants, the second section of this report evaluates the experience
of the institutions and the students involved in the pilot project as to inform improvements.
Methodology
Institution Data – Face-to-face qualitative interviews were conducted with higher education
institutions during April and May 2017. The interviews were conducted via Skype. A standard set
of open-ended questions were presented, although discussions evolved throughout the interview
with a number of key themes emerging. Seven (7) institutions took part in the Skype interviews.
Student Data – Students experience was sought via an online anonymous and voluntary survey.
Questions had been designed by the PRME Secretariat and WikiRate and all professors were sent
a link to the online survey to distribute to their students after completing the Business
Contribution to the SDGs – A Student Assessment pilot project. Forty-six (46) students responded
to the survey.
Participants
The higher education institutions that engaged in Skype interviews* are displayed in Table 2.
Institution Country Region Contact
Interviewed
Oxford Brookes Business School United
Kingdom
Western Europe Jonathan Louw
Universidad EAFIT Colombia Latin America Maria Alejandra
Gonzalez-Perez
University of London, Royal Holloway
School of Management
United
Kingdom
Western Europe Anica Zeyen
University of Pretoria, Gordon
Institute of Business Science
South Africa Middle East &
Africa
Morris Mthombeni
University of Western Australia Australia Australia & New
Zealand
Jacqueline Boaks
University of Wollongong Australia Australia & New
Zealand
Stephanie Perkiss
Wilfrid Laurier University Canada North America Kalyani Menon
Table 2. Interviewee list from participating pilot institutions
*Due to time constraints, the section author was not able to interview the participating professor at
Glasgow Caledonian University, while HHL Leipzig Graduate School of Management’s participation was
‘offline’ from the WikiRate platform, is therefore left out of the analysis.

29
Institution Interview Analysis
During the interviews, it was evident that the academics at the institutions saw Business
Contribution to the SDGs – A Student Assessment as an extremely valuable, different way of
learning during student engagement. By offering the chance to work with ‘real-world’ companies
and ‘real’ data, the project offers an alternate challenge alongside contributing to making the
Sustainable Development Goals a reality. A number of key themes around the pilot arose in the
interviews, particularly in the areas of curriculum development, time management and student
value, which will be discussed below.
Curriculum Development
The curriculum arose as a key theme of discussion throughout the interviews, in particular the
change management procedures that are required to implement the Business Contribution to the
SDGs – A Student Assessment pilot and the type of integration – whether on an assessed, activity
assignment or volunteer basis. In the initial phases of the pilot, project implementation in regards
to where-about the trial sat in the curriculum was considered quite risky by institutions. This risk
was associated with the related theme that emerged surrounding the type of integration. For
some countries such as Australia, the PRME director was able to work with subject coordinators
to determine where and how the Business Contribution to the SDGs – A Student Assessment pilot
would be implemented. In other countries such as UK, twelve months’ notice is required for
curriculum changes and as a consequence the pilot project was conducted as an activity rather
than an assessed piece of work. For some institutions, a considerable amount of approvals and
discussions with Teaching & Learning executives took place to ensure “the trial did not have
consequences for student learning and there were equal opportunities”. It seemed important to
institutions that a partnership between the PRME Secretariat and WikiRate existed, “WikiRate
was seen as an external entity and they did not believe the marketing material”.
While no classrooms required such outreach, students at the Gordon Institute of Business Science
(GIBS) contacted the companies when the information was discovered as incorrect. The students
tended to receive positive responses from companies that replied, as, the professor noted, “it is in
the company’s best interest to have data and reports correct”.
While integrating Business Contribution to the SDGs – A Student Assessment into the curriculum
was reported by most institutions as complex and time consuming, students enjoyed comparing
companies in different countries and having the “ability to lift the data up and look at it”. The
complexity came from the following areas;
● Initial approval from Faculty education senior management to participate in the pilot
project;
● Exploring how to integrate the project into the current curriculum. This differed
depending on the level of subject in which the pilot was being incorporated and the
number of students;
● Working out the best way to assess students on this work, if at all.

30
Time Management
Upon commencement of the pilot project, the topic of a learning curve to implement the pilot was
raised from the perspective of training (students and academics), navigating user interface, and
understanding metrics and the overall sustainability landscape.
Training of tutors emerged as a discussion area in the interviews from the perspective of large
classes with 6-7 tutors and sessional academic subject coordinators. It was very time consuming
to ensure each tutor knew how to not only navigate the system, but help when required and grade
if assessable.
Depending on the subject where the project was implemented, the student awareness of
sustainability was low in some institutions compared to others and so the terminology had to be
explained. This led to institutions considering which subjects this project should be implemented
in for future instances.
Due to the complexity of sustainability reporting metrics and the WikiRate platform, the
participating institutions mentioned the support of WikiRate as essential in completing the pilot
phase. A concern was also raised regarding the timing of the second phase. Professors need more
time to incorporate the project into the curricula of a subject than anticipated, and the material
provided from the project partners should be updated and available at an earlier stage so the
lecturers and tutors can receive training upfront.
Student Value
An interesting emerging theme was students and professors attention to the value of the project
to the students engaging in the pilot. Researching sustainability data points and entering it into
the platform is tedious, and was viewed by some students as “cheap labour.” Professors had to
explain the importance of collecting data for analysis, as well as the insights that can come out of
the research process.
Other participating schools however responded that it was a perfect way for students to
understand the importance of measuring sustainability indicators and that projects like these,
enhance critical thinking and accountability discussions in the classroom. The pilot project has
the potential to work with other students from around the world and is a brilliant vehicle if time
can be spent analysing and understanding the gap in narrative and data.
Issues around language arose numerous times throughout the interviews. Some professors
thought the international students could potentially do more analysis if they could research in
their own language. For institutions with a high number of international students a lot of jargon
used was not understood by students and needed further explanation. The varying levels of
English language proficiency were challenges discussed by all institutions where English served
as the primary teaching and research language (whereas Universidad EAFIT for example, taught
and researched primarily in Spanish). Some of this may have evolved from the restricted list of
companies to choose from, and a high number of companies and countries that were unknown to
students.

31
Institutions by nature of culture have different pedagogy practices and this was evident in how
the pilot was implemented globally. Missing data for one institution meant stress for students and
academics, as the students could not finish their entry while another institution saw this as a
learning opportunity to discuss what this missing aspect of the companies report meant and to
use the missing data as a learning outcome for students. While this could be frustrating, there is
value in identifying the “Unknowns” on the WikiRate platform, as this is where gaps can begin to
be illuminated and research questions can be applied to understand and compare companies.
Strengths
Key strengths of the project for institutions include the ability to give students a look at ‘real’
company data and the ability for an alternate learning experience that has real impact.
Difficulties
Key difficulties surrounded how to grade students on these activities and the time that was spent
supervising and ensuring that the data is correct.
Student Survey Analysis
Student responses were received from a range of participating institutions with a majority from
University of Wollongong in Australia, Wilfrid Laurier University in Canada, Glasgow Caledonian
University in Scotland and Universidad EAFIT in Colombia. It is interesting to note that 68.2% of
responses were from females compared to 31.8% male. Students were asked a number of Likert
Scale questions (ranked 1 – 5 with 1 representing strongly disagree through to 5 representing
agree) along with some qualitative text based required responses. Some key themes that arose
are outlined below, including the time to complete activity and the type of assessment, the
learning experience from what companies are or are not currently reporting, and where this type
of assessment should sit in the curriculum.
In regards to time and type of assessment, more than 61% of students took over 5 hours to
complete the research assignment with 68% completing the project as an individual assignment
compared to 27% as a team with the main assessment being the WikiRate data research and a
report. It is interesting to note that 44.4% of students strongly agreed to have had to look beyond
the COP report to find the information required for their assignment with 76% rated 3 and above
on this question. The missing information from companies led to responses from students such as
“Some organisations will do the minimum of the minimum in regards to reporting” and
“Companies are not reporting as per the guidelines, they need to be enforced” through to
“Disclosure is appalling”. Although missing data was a key issue for students, this led to some
valuable learning experiences “There’s a lot of metrics that can be used to measure a firm’s CSR
initiative, and that you often have to dig past company’s glossy reports – what’s not reported can
be just as much as an indicator as what is reported” and noted “How far companies still have to go
to be more sustainable. Just because they are partnered with UN does not mean they have met the
goals by any means”.
Throughout the WikiRate learning experience, 87% of students thought the assignment was
relevant to their study with 89% learning more about the SDGs and 95% learning more about CSR

32
throughout the process. It is interesting to note that 66% of students indicated WikiRate resulted
in a more interesting assignment while only 40% of students learnt more about PRME.
While academics recommended that the Business Contribution to the SDGs – A Student Assessment
project could be better placed in the final year undergraduate classes, students had a variety of
opinions, “I do not believe it was suitable for my level of study as a final year student. It was quite
time consuming and simplistic, so although I understand the benefit of the project, I feel it would
be more beneficial if aimed at students in early years of university…”. This is in contrast to “The
research required a higher level of research skills and team collaboration. It would be great if we
were given more time to complete…”. Possibly this could be linked to the particular student
challenge that is built around the assignment and hence the difference of opinion to this regard.
The following comment from a student is interesting to note moving forward with the trial “It was
an interesting experience, there was a bit of learning curve but I got pretty fast at checking
metrics by the end – however I think that this whole process could probably be automated with
natural language processing tools, which would improve accuracy and allow more firms to be
examined…”. This comment may link back to the institution thoughts on data entry time and time
management for this project moving forward.
Future Improvements
In considering the themes that evolved through discussions, the following ideas for improvement
were raised:
Institution suggestions:
Establish an hypothesis around what the research objective is to create student value and
more analysis of the data rather than pure data gathering and entry
Trial institutions collaborate more and share more of their work on integration and
Include subject outlines, assessment integration, training materials
Understand the resource requirements up front – labs, training hours.
All institutions would like to engage with the trial again, some indicating it needs to be at
undergraduate third year level rather than first or second year. If postgraduate level, then the
student value challenge definitely needs to be established up front.
Student suggestions:
Work linked to the grade received
Needs to be a group/team report
Using local companies may enable a better understanding
Research extended to include other methods of communicating with companies to get the
data required
Possibly make the metrics more industry specific
Add a lesson beforehand on reading/interpreting company SDG information
Enable the assignment to be around “Business Contribution to the SDGs – A Student
Assessment where ideal design would be structured based off metrics and research done

33
on the current status of the organisation and what their strengths and weaknesses are,
and then put in comparison to its competitors in the industry. Then a recommendation of
how the firm can improve the strategy they could use to do so”
Student comments reinforce the institution theme of providing ‘student value’ and a ‘challenge’
for the important learning experience to be realised.
In conclusion, the pilot project was very successful with both institutions and students finding
value in the learning experience engagement. A number of future improvements have been
provided and a final recommendation would be to work with the trial institutions to come up
with a student experience that meets the pilot project requirements, but also provides a challenge
for students that will enable them to move forward with their understanding of the SDGs.
Conclusions & Recommendations
The core ambition of the project to engage students with the SDGs and company contributions to sustainability goals was achieved – with both institutions and students finding value in the learning experience. As the project moves forward, the partners intend to double in scale the number of students and institutions engaged, while implementing lessons learned from the first pilot.
A number of insights and feedback have been gathered in this report from the perspective of project implementation, data analysis, and professor, student and institutional value. The following recommendations highlight these, and will feed into further iterations of the project, cover areas such as methodology for assignment set-up, collaboration across institutions and increased student value.
Develop a core set of research questions which are relevant to every company regardless of
sector or geography, with an accompanying set of metrics that are included in every project.
Agree upon fixed methodology for selecting companies and metrics for participating
institutions. Student company selection should be designed as a pre-screening phase, to
determine whether the company selected has reported appropriate data for research. This
will generate insights into the qualities of COPs more broadly, without the danger of
individual students being burdened with a particularly difficult or unrewarding COP to work
with. Additionally, the approach would maximise data findings, but could come at a cost of
minimising each Professor’s ability to tailor the assignment to their particular course.
Incorporate possibilities for communicating with companies to get the data required, as
appropriate to the institution.
Engage students more deeply in the research process: designing research questions,
structuring data collection to address those questions, and sharing their analyses. A pre data-
collection stage where students develop research questions and hypotheses will extend their
experience of research beyond the data collection focus of the pilot, to encompass both design
and analysis. Calculated metrics on WikiRate could be incorporate in a later analysis stage.
Professors saw value in creating a community of sharing course development materials such
as subject outlines, assessment, and training materials. This could be achieved through an
online sharing tool, a mailing list, or a place on the WikiRate or PRME website to hold shared

34
materials. Further development could include an online forum to connect professors and
students in the global community.
Expand guidance material for professors and students based on examples, learnings and
suggestions by previous participants. This will support continued improvement and
integration of lessons learned.

35
Appendix – Metrics and Disclosure
The following table was produced by considering all of the metrics included by at least one group
in the Pilot Project. For each metric, the number of distinct companies it was applied to is shown,
along with the number of distinct companies for which an answer was found (also expressed as a
percentage). This table does not reflect scenarios where a researcher added multiple answers for
different years, therefore some of the data collected in the pilot is not represented here. Data can
be viewed online by appending the metric name to www.wikirate.org. For example:
www.wikirate.org/Global Reporting Initiative+Employees G4 10 a
Metric Name Companies
Asked
Companies
Answered
% Answers
Found
Global Reporting Initiative+Employees G4 10 a 248 235 94.8%
Global Reporting Initiative+Male employees G4 10 a 248 209 84.3%
Global Reporting Initiative+Female employees G4 10 a 246 206 83.7%
Global Reporting Initiative+Direct greenhouse gas GHG emissions Scope 1 G4 EN15 a 231 202 87.4%
Global Reporting Initiative+Indirect greenhouse gas GHG emissions Scope 2 G4 EN16 a 226 185 81.9%
Global Reporting Initiative+Collective bargaining G4 11 263 179 68.1%
Global Reporting Initiative+Worker fatalities G4 LA6 a 247 172 69.6%
Poverty Footprint+Women in Management Positions 227 172 75.8%
Global Reporting Initiative+Total energy consumption within the organization G4 EN3 e 217 165 76.0%
Global Reporting Initiative+Full time employees G4 10 b 247 157 63.6%
Global Reporting Initiative+Incidents of discrimination G4 HR3 a 316 157 49.7%
Global Reporting Initiative+Average hours of training G4 LA9 a 236 157 66.5%
Global Reporting Initiative+Permanent employees G4 10 a 246 155 63.0%
Global Reporting Initiative+Total Waste Generated G4 EN23 a 213 155 72.8%
Global Reporting Initiative+Environmental fines G4 EN29 a 249 148 59.4%
Global Reporting Initiative+Injury rates G4 LA6 a 245 147 60.0%
Global Reporting Initiative+Temporary employees G4 10 a 246 147 59.8%
Global Reporting Initiative+Environmental non monetary sanctions G4 EN29 a 253 140 55.3%
Global Reporting Initiative+Total water withdrawals G4 EN8 a 189 132 69.8%
Global Reporting Initiative+Female worker fatalities G4 LA6 a 246 129 52.4%
Global Reporting Initiative+Male worker fatalities G4 LA6 a 246 127 51.6%
Global Reporting Initiative+Hazardous Waste Created G4 EN23 a 227 122 53.7%
Global Reporting Initiative+Part time employees G4 10 b 246 121 49.2%

36
Global Reporting Initiative+Total Waste Recycled G4 EN23 a 202 116 57.4%
Global Reporting Initiative+Non hazardous waste G4 EN23 a 224 106 47.3%
Global Reporting Initiative+NOx emissions G4 EN21 a 233 95 40.8%
Global Reporting Initiative+Total Waste to Landfill G4 EN23 a 183 89 48.6%
Global Reporting Initiative+Sulfur Oxide SOx emissions G4 EN21 a 229 86 37.6%
Global Reporting Initiative+Municipal water withdrawals G4 EN8 a 207 81 39.1%
Poverty Footprint+Fair Trade Mechanism 188 79 42.0%
Global Reporting Initiative+Average hours of training male G4 LA9 a 235 76 32.3%
Global Reporting Initiative+Fuel consumption from non renewable sources G4 EN3 a 203 75 36.9%
Global Reporting Initiative+Average hours of training female G4 LA9 a 235 75 31.9%
Global Reporting Initiative+Water Volume Recycled G4 EN10 a 196 72 36.7%
Global Reporting Initiative+Ground Water Withdrawals G4 EN8 a 197 72 36.5%
Poverty Footprint+Anti Corruption Declaration 73 71 97.3%
Global Reporting Initiative+Environmental Protection Expenditures G4 EN31 a 180 71 39.4%
Global Reporting Initiative+Hazardous waste recycled G4 EN23 a 217 71 32.7%
Global Reporting Initiative+Female to Male basic salary ratio G4 LA13 a 125 70 56.0%
Global Reporting Initiative+Non Hazardous Waste Recycled G4 EN23 a 200 69 34.5%
Global Reporting Initiative+Water Recycled G4 EN10 b 180 69 38.3%
Poverty Footprint+Women in Skilled Positions 227 67 29.5%
Global Reporting Initiative+Fuel consumption from renewable sources G4 EN3 b 207 66 31.9%
Global Reporting Initiative+Human rights impacts grievances filed G4 HR12 a 93 64 68.8%
Global Reporting Initiative+Surface Water Withdrawals G4 EN8 a 192 62 32.3%
Global Reporting Initiative+Reduction in energy requirements of products and services
G4 EN7
92 59 64.1%
Global Reporting Initiative+Human rights impacts resolved G4 HR12 b 92 58 63.0%
Global Reporting Initiative+Human rights impacts grievances addressed G4 HR12 b 89 56 62.9%
Global Reporting Initiative+Health and Safety representation G4 LA5 b 88 56 63.6%
Global Reporting Initiative+Labor practices screening of new suppliers G4 LA14 a 115 56 48.7%
Global Reporting Initiative+Waste Water Used G4 EN8 a 181 56 30.9%
Global Reporting Initiative+Volatile Organic Compounds VOC emissions G4 EN21 a 224 55 24.6%
Global Reporting Initiative+Male injury rate G4 LA6 a 243 54 22.2%
Poverty Footprint+Equal Opportunities Promotion 54 54 100.0%

37
Global Reporting Initiative+Recycled Input Materials G4 EN2 a 94 52 55.3%
Global Reporting Initiative+Female injury rate G4 LA6 a 244 51 20.9%
Global Reporting Initiative+Reduction of energy consumption G4 EN6 a 80 51 63.8%
Global Reporting Initiative+Employees that Took Parental Leave G4 LA3 b 174 51 29.3%
Global Reporting Initiative+Total Materials Used G4 EN1 a 83 50 60.2%
Global Reporting Initiative+Employees according to gender G4 LA12 55 50 90.9%
Global Reporting Initiative+Female Employees that Took Parental Leave G4 LA3 b 175 45 25.7%
Global Reporting Initiative+Direct Economic Value Generated G4 EC1 a 55 45 81.8%
Global Reporting Initiative+Employees Returned after Parental Leave G4 LA3 c 175 43 24.6%
Global Reporting Initiative+Male Employees that Took Parental Leave G4 LA3 b 174 40 23.0%
Global Reporting Initiative+Emissions of Ozone Depleting Substances ODS G4 EN20 a 187 40 21.4%
Global Reporting Initiative+Rate of employee turnover G4 LA1 b 57 40 70.2%
Global Reporting Initiative+Employees Entitled to Parental Leave G4 LA3 a 174 39 22.4%
Global Reporting Initiative+Female Employees Returned after Parental Leave G4 LA3 c 176 39 22.2%
Global Reporting Initiative+Female Employees Entitled to Parental Leave G4 LA3 a 173 38 22.0%
Global Reporting Initiative+Economic Value Distributed G4 EC1 a 55 38 69.1%
Poverty Footprint+Women in Unskilled Positions 227 37 16.3%
Global Reporting Initiative+Economic Value Retained G4 EC1 a 55 37 67.3%
Global Reporting Initiative+Renewable Materials Used G4 EN1 a 84 36 42.9%
Global Reporting Initiative+Particulate Matter PM emissions G4 EN21 a 219 36 16.4%
Global Reporting Initiative+Male Employees Entitled to Parental Leave G4 LA3 a 173 35 20.2%
Global Reporting Initiative+Male Employees Returned after Parental Leave G4 LA3 c 175 33 18.9%
Global Reporting Initiative+Rainwater collected directly and stored G4 EN8 a 180 32 17.8%
Global Reporting Initiative+Reduction of greenhouse gas GHG emissions G4 EN19 a 41 29 70.7%
Global Reporting Initiative+Customer satisfaction survey results reported for
organization G4 PR5 a1
28 25 89.3%
Global Reporting Initiative+Indirect greenhouse gas GHG emissions Scope 3 G4 EN17 a 31 21 67.7%
Global Reporting Initiative+Customer satisfaction survey results reported for major
product or service G4 PR5 a2
26 20 76.9%
Global Reporting Initiative+Customer satisfaction survey results reported for locations
of operation G4 PR5 a3
25 19 76.0%
Global Reporting Initiative+Water Discharge G4 EN22 a 24 18 75.0%

38
Global Reporting Initiative+Hazardous Air Pollutant HAP emissions G4 EN21 a 225 16 7.1%
Global Reporting Initiative+Persistent Organic Pollutants POP G4 EN21 a 218 12 5.5%
Global Reporting Initiative+Marketing related incidents of non compliance fined G4 PR7
a1
33 11 33.3%
Global Reporting Initiative+Product and service and labeling incidents of non
compliance fined G4 PR4 a1
25 10 40.0%
Poverty Footprint+Collective Bargaining in Value Chain 14 10 71.4%
Global Reporting Initiative+Product and service and labeling Incidents of non
compliance to voluntary codes G4 PR4 a3
22 9 40.9%
Global Reporting Initiative+Significant Spills G4 EN24 a 17 9 52.9%
Global Reporting Initiative+Risk for Incidents of Forced or Compulsory Labor by
operation G4 HR6 a
16 9 56.3%
Luis David Quintero+Sector 9 9 100.0%
Kelly Ramirez+Environmental impact 9 9 100.0%
Kelly Ramirez+Country of origin 9 9 100.0%
Kelly Ramirez+SDG13 Climate Action 9 9 100.0%
Kelly Ramirez+SDG12 Responsible Consumption and Production 9 9 100.0%
Kelly Ramirez+SDG6 Clean water and sanitation 9 9 100.0%
Global Reporting Initiative+Health and Safety incidents of non compliance fined G4 PR2
a1
20 8 40.0%
Global Reporting Initiative+Suppliers assessed for societal impact G4 SO10 a 15 8 53.3%
Global Reporting Initiative+Fines for products and services non compliance G4 PR9 a 23 7 30.4%
Global Reporting Initiative+Societal Impacts screening of new suppliers G4 SO9 a 14 7 50.0%
Global Reporting Initiative+Environmental Screening of New Suppliers G4 EN32 17 7 41.2%
Global Reporting Initiative+Volume of Significant Spills G4 EN24 b 15 7 46.7%
Kelly Ramirez+Ownership 8 7 87.5%
Global Reporting Initiative+Health and Safety incidents of non compliance voluntary
codes G4 PR2 a3
22 6 27.3%
Global Reporting Initiative+Marketing related incidents of non compliance voluntary
codes G4 PR7 a3
25 6 24.0%
Global Reporting Initiative+Marketing related incidents of non-compliance warning G4
PR7 a2
27 6 22.2%
Global Reporting Initiative+Labor practices screening of new suppliers G4 LA14 a 9 6 66.7%
Kelly Ramirez+Employee 6 6 100.0%
Global Reporting Initiative+Reclaimed Products G4 EN28 19 5 26.3%

39
Global Reporting Initiative+Product and service and labeling incidents of non-
compliance warning G4 PR4 a2
22 5 22.7%
Global Reporting Initiative+Indigenous rights violations G4 HR8 a 16 5 31.3%
Poverty Footprint+Access to Childcare Services 53 5 9.4%
Global Reporting Initiative+Health and Safety incidents of non-compliance warning G4
PR2 a2
16 4 25.0%
Global Reporting Initiative+Outside party complaints concerning breaches of customer
privacy G4 PR8 a1
24 4 16.7%
Global Reporting Initiative+Suppliers with potential negative impacts on society G4
SO10 b2
18 4 22.2%
Global Reporting Initiative+Complaints concerning breaches of customer privacy from
regulatory bodies G4 PR8 a2
21 4 19.0%
Global Reporting Initiative+Risk for Incidents of Forced or Compulsory Labor by place
G4 HR6 a
16 4 25.0%
Global Reporting Initiative+New employee hires G4 LA1 a 4 4 100.0%
Global Reporting Initiative+Total water discharge G4 EN22 a 8 4 50.0%
Global Reporting Initiative+Hazardous Waste Handled G4 EN25 a 11 3 27.3%
Global Reporting Initiative+Local suppliers spending G4 EC9 a 15 3 20.0%
Global Reporting Initiative+Suppliers with actual negative impacts on society G4 SO10
b1
15 3 20.0%
Global Reporting Initiative+Customer data leaks thefts losses G4 PR8 b 22 2 9.1%
Global Reporting Initiative+Non renewable Materials Used G4 EN1 a 7 2 28.6%
Poverty Footprint+Access to Healthcare for Work related Incidents 14 2 14.3%
Kelly Ramirez+Employees 2 2 100.0%
Global Reporting Initiative+Employee turnover G4 LA1 b 3 2 66.7%
Global reporting Initiative+Greenhouse gas GHG emissions intensity ratio G4 EN18 a 8 2 25.0%
Global Reporting Initiative+Energy Consumption Outside the Organization G4 EN4 5 2 40.0%
Global Reporting Initiative+Energy intensity G4 EN5 a 8 2 25.0%
Poverty Footprint+Access to Healthcare for Non work related Incidents 13 1 7.7%
Global Reporting Initiative+Hazardous Waste Shipped Internationally G4 EN25 b 9 0 0.0%
Global Reporting Initiative+Affected Water Bodies G4 EN26 3 0 0.0%
Global Reporting Initiative+Habitats Protected or Restored G4 EN13 a 1 0 0.0%
Table 3. Metrics asked of UN Global Compact companies as part of the pilot, the number of
companies the metric was applied to and the number of companies where an answer was found
(also expressed as percentage).
Copyright © 2022 FDOKUMEN