Chapter 6. Victoria's water institutions and their functions
Upload
khangminh22Category
view
2download
0
Investor PresentationJuly 2021

Forward Looking Statements
2
Safe Harbor Statement Under the Private Securities Litigation Reform Act of 1995
We caution that any forward-looking statements (as such term is defined in the Private Securities
Litigation Reform Act of 1995) contained in this presentation or made by our Company or our
management involve risks and uncertainties and are subject to change based on various factors,
many of which are beyond our control. Accordingly, our future performance and financial results
may differ materially from those expressed or implied in any such forward-looking statements.
Words such as “estimate,” “project,” “plan,” “believe,” “expect,” “anticipate,” “intend,” “planned,”
“potential” and any similar expressions may identify forward-looking statements. Risks associated
with the following factors, among others, in some cases have affected and in the future could affect
our financial performance and actual results and could cause actual results to differ materially from
those expressed or implied in any forward-looking statements included in this presentation or
otherwise made by our company or our management:
• the spin-off may not be consummated within the anticipated time period or at all;
• disruption to our business in connection with the proposed spin-off and that we could lose
revenue as a result of such disruption;
• the spin-off may not be tax-free for U.S. federal income tax purposes;
• a loss of synergies from separating the businesses that could negatively impact the balance
sheet, profit margins or earnings of both businesses
• or that the companies resulting from the spin-off do not realize all of the expected benefits of the
spin-off;
• the combined value of the common stock of the two publicly-traded companies will not be equal
to or greater than the value of our common stock had the spin-off not occurred;
• general economic conditions, consumer confidence, consumer spending patterns and market
disruptions including pandemics or significant health hazards, severe weather conditions, natural
disasters, terrorist activities, financial crises, political crises or other major events, or the
prospect of these events;
• the novel coronavirus (COVID-19) global pandemic has had and is expected to continue to have
an adverse effect on our business and results of operations;
• the seasonality of our business;
• divestitures or other dispositions, including a spin-off of Victoria’s Secret and related operations
and contingent liabilities from businesses that we have divested;
• difficulties arising from turnover in company leadership or other key positions;
• our ability to attract, develop and retain qualified associates and manage labor-related costs;
• the dependence on mall traffic and the availability of suitable store locations on appropriate
terms;
• our ability to grow through new store openings and existing store remodels and expansions;
• our ability to successfully operate and expand internationally and related risks;
• our independent franchise, license and wholesale partners;
• our direct channel businesses;
• our ability to protect our reputation and our brand images;
• our ability to attract customers with marketing, advertising and promotional programs;
• our ability to maintain, enforce and protect our trade names, trademarks and patents;
• the highly competitive nature of the retail industry and the segments in which we operate;
• consumer acceptance of our products and our ability to manage the life cycle of our brands,
keep up with fashion trends,
• develop new merchandise and launch new product lines successfully;
• our ability to source, distribute and sell goods and materials on a global basis, including risks
related to:
• political instability, environmental hazards or natural disasters;

Forward Looking Statements
Safe Harbor Statement Under the Private Securities Litigation Reform Act of 1995
• significant health hazards or pandemics, which could result in closed factories, reduced
workforces, scarcity of raw materials,
• and scrutiny or embargoing of goods produced in infected areas;
• duties, taxes and other charges;
• legal and regulatory matters;
• volatility in currency exchange rates;
• local business practices and political issues;
• potential delays or disruptions in shipping and transportation and related pricing impacts;
• disruption due to labor disputes; and
• changing expectations regarding product safety due to new legislation;
• our geographic concentration of vendor and distribution facilities in central Ohio;
• fluctuations in foreign currency exchange rates;
• the ability of our vendors to deliver products in a timely manner, meet quality standards and
comply with applicable laws and regulations;
• fluctuations in product input costs;
• our ability to adequately protect our assets from loss and theft;
• fluctuations in energy costs;
• increases in the costs of mailing, paper, printing or other order fulfillment logistics;
• claims arising from our self-insurance;
• our and our third-party service providers' ability to implement and maintain information
technology systems and to protect associated data;
• our ability to maintain the security of customer, associate, third-party and company information;
• stock price volatility;
• our ability to pay dividends and related effects;
• shareholder activism matters;
• our ability to maintain our credit rating;
• our ability to service or refinance our debt and maintain compliance with our restrictive
covenants;
• our ability to comply with laws, regulations and technology platform rules or other obligations
related to data privacy and security;
• our ability to comply with regulatory requirements;
• legal and compliance matters; and
• tax, trade and other regulatory matters.
We are not under any obligation and do not intend to make publicly available any update or other
revisions to any of the forward-looking statements contained in this presentation to reflect
circumstances existing after the date of this presentation or to reflect the occurrence of future events
even if experience or future events make it clear that any expected results expressed or implied by
those forward-looking statements will not be realized.
3

SpeakersMartin Waters Chief Executive Officer | VS&Co
Amy HaukChief Executive Officer | Victoria’s Secret PINK
Gregory UnisChief Executive Officer | Victoria’s Secret Beauty
Timothy JohnsonChief Financial Officer | VS&Co
Brad KramerEVP Finance | VS&Co
4
Agenda
5
1. Company Overview
2. Lines of Business
VS Lingerie
PINK
VS Beauty
3. Channels
Digital
North America Stores
International
4. Financials & Growth Opportunities
5. Appendix

New Era. New Opportunities. An All New Victoria’s Secret.Revolutionizing Our Brand
We’ve repositioned the brand because we lost relevance with
the modern woman.
She’s told us to change our focus; from telling her what’s sexy
and how to look… to being there to help her craft the story she
wants to shape for herself.
To support her in whatever way she needs. It’s her narrative,
not ours.
To win her back, we will celebrate and inspire her. To support
her desire to show up however she damn well chooses.
6

Purpose Driven, Inclusive, Authentic & Inspiring
PurposeInspire women around the
world with products and
experiences that uplift and
champion them and their
journey
MissionCreate lifelong relationships with
women by reflecting their stories,
journey and community
Create positive change for women
through the power of our products,
platform and advocacy
Vision To be the world’s leading advocate for women
7

Our Journey
2009 – 2015Growth Years
2016 – 2019Execution Missteps
2020 – 2021Rebuilding the Foundation
Recovery in process with significant
upside opportunity
8
Three Phases

We Will Pursue Four Key Pillarsto Activate the New Victoria’s Secret Brand
1BRAND REVOLUTION
Transform branding &
creative to align to our
new brand positioning
2VS COLLECTIVE
Convene accomplished
women on behalf of all
women & the VS brand
3ENTERTAINMENT
Create a digital VS
branded entertainment
platform
4AGGREGATION
Continue to build our
Brands We Love
platform
9

The Brand Revolution Started in January with New Imagery & Messaging
10
A refresh of visual
touch points for the
new Victoria’s Secret
We design a highly
emotional product,
not a commodity
Fresh & Optimistic
Visualization
Emotional Content To
Project Branding
Authentic & Natural
Imagery
Diversity and Inclusion
in Shape, Ethnicity &
Age
VALENTINE’S DAY SWIM LAUNCH SPRING MOTHER’S DAY

The VS Collective
11
MEGAN RAPINOE
LGBTQIA+ ACTIVIST
PAY EQUITY CRUSADER
PROFESSIONAL SOCCER PLAYER
EILEEN GU
WORLD CHAMPION FREE SKIER
YOUTH & WOMEN’S SPORTS ADVOCATE
MODEL
VALENTINA SAMPAIO
LGBTQIA+ ACTIVIST
ACTOR
MODEL
AMANDA DE CADENET
JOURNALIST
PHOTOGRAPHER
GIRLGAZE FOUNDER & EQUALITY ADVOCATE
ADUT AKECH
REFUGEE
MENTAL WELLNESS SUPPORTER
MODEL
PALOMA ELSESSER
BODY ADVOCATE
COMMUNITY CREATOR
MODEL
PRIYANKA CHOPRA JONAS
ACTOR
PRODUCER
ENTREPRENEUR

Two category-
defining intimates
and beauty brands
with clearly defined
purpose, mission
and vision
Global brand
awareness and
impressive customer
satisfaction scores
Growing digital
business with
proven omnichannel
foundation &
growing capabilities
Scaled, profitable
and right-sized store
footprint
Tightly controlled
and highly
responsive supply
chains
Delivering against
profit improvement
plan, with powerful
levers to drive
significant top- and
bottom-line growth
Highly talented
management team
with deep industry
experience
The VS&Co Investment Opportunity
12

$6.1B
Net Sales1
$919M
Adj. EBITDA1,2
$2.4B
E-Commerce
Business3
#1U.S. Lingerie Brand
with
~20%Market
Share4
~27M
Total active
customers in
North America5
~700M
Annual Website Visits6
~77M
Instagram Followers7
43%
Digital Penetration8
70+Countries
~1,400Global Store
Locations9
Source: Company Data, Euromonitor, NPD.1 Q1 ’21 TTM represents the period ending May 1, 2021. 2See reconciliation of reported to adjusted results in the Appendix. 3 Reported Net Sales for Digital as of Q1 ’21 TTM represents the period ending May 1, 2021. 4 Represents North America per NPD. 5 As of May 1, 2021; “active”
defined as customers who have purchased from North America stores or digital in the last twelve months. 6 Visits to vs.com and VS/PINK apps as of Q1 ’21 TTM represents the period ending May 1, 2021. 7 As of May 1, 2021; includes VS and PINK. 8 Represents digital net sales as a %
of North America net sales. 9 Includes company-operated and partner-operated locations as of Q1-2021.
Comprehensive Global Business with Unparalleled ScaleThe VS&Co Investment Opportunity
13

($87)
$200+
Q2 '20 Q2 '21E
Q2 2021 Victoria’s Secret Segment Sales & Operating Income Update
Source: Company data.
Note: See reconciliation of reported to adjusted results in the Appendix. 1 Q2 ’21 for the nine-week period ended July 3, 2021; comparable period in 2020. VS segment for both periods as per the current L Brands segment reporting.2 Q2 ’21 estimates based on VS segment guidance as provided in L Brands’ July 13, 2021 press release. Segment for both periods as per the current L Brands segment reporting. Both periods
exclude Corporate/Other costs.
Note: The expected Q2 '21 operating income is based on information available at the date of the press release and incorporate a variety of assumptions, estimates and projections, including
among others, with regard to the impact of COVID-19. Actual operating income for the second quarter will be influenced by future developments and other factors, many of which are difficult to
predict and not within the company's control, and may differ from the expected results described above.
$285M+Increase in adjusted
operating income
VS Segment Sales ($B)1 VS Segment Estimated Adjusted Operating Income ($M)2
$0.6
$1.1
Q2 '20 Q2 '21
~$500MIncrease in sales
14
The VS&Co Investment Opportunity

$207
$272 $282 $305
$331 $346
$293
$336 $363
$395 $422
$450
2007 2015 2016 2017 2018 2019 2020 2021 2022 2023 2024 2025
$75
$97 $101 $106
$112 $116
$100
$113 $121
$128 $135
$142
2006 2015 2016 2017 2018 2019 2020 2021 2022 2023 2024 2025
Source: Euromonitor
Global Intimates
Apparel ($B)
Large and Growing Addressable Markets2006 – 2021 CAGR
3%
2021 – 2025 CAGR
6%
Global
Loungewear
Apparel ($B)
2007 – 2021 CAGR
4%
2021 – 2025 CAGR
8%
The VS&Co Investment Opportunity
15

Source: Third-Party Brand Study conducted in January 2021, Euromonitor.
Note: Market sizes represent U.S. Lingerie Retail Sales as of FY2020 where available per Euromonitor, and approximate U.S. market sizes where unavailable. Brand awareness sample size of n=4,510. NPS score represents score among those purchasing intimates brands in the
past 1 year. N=1,704 for VS and N= 1,431 for PINK.
Lingerie NPS Score (%), Brand Awareness Score (%)
Bra
nd
Aw
are
ne
ss –
Lin
ge
rie
INC
RE
AS
ING
AW
AR
EN
ES
S
NPS Score – Lingerie - INCREASING NPS
Specialty Retail Peers
Department Retail Peers
21%; 84%
29%; 89% 41%; 90%
43%; 81%
49%; 51%
55%; 36%
59%; 31%
53%; 86%
58%; 87%
Leading Net Promoter Score, Awareness & ScaleThe VS&Co Investment Opportunity
16

Strong Customer Loyalty Extends Across BrandsBrand Affinity Drives Customer Engagement & Repeat Purchases
~27M
Total active customers in
North America
~57%
of active customers have
shopped online in last year
~45%
of customers shop across multiple
Lines of Business
6.2M
Active VS app customers
5.5M
Active PINK Nation customers
6.3MActive VS credit card holders
Source: Company data.
As of May 1, 2021; “active” defined as customers who have purchased from North America stores or digital in the last twelve months.
The VS&Co Investment Opportunity
17

~50%
~40%
~40%
Source: Company data.1 Q1 ’21 TTM represents the period ending May 1, 2021.2 Digital sales as a % of Digital + North America Stores net sales.
The VS&Co Investment Opportunity
Growing Digital Business
$1.7 $1.7
$2.2$2.4
2018 2019 2020 Q1 '21 TTM
24% 25%
44% 43%
2018 2019 2020 Q1 '21 TTM
Digital Sales1 ($B)
Digital Penetration1,2 (%)
Strong Online Penetration1
18

Broad-Based Store Portfolio
~94%
of North America stores are cash flow
positive1
~$0.9M
North America average cash flow per store3
Average lease term remaining is4
~3.8 years
19
Broad-Based Store Portfolio
26%
37%
13%
24%
Total North
America Stores1
867
A MALLS
B MALLSC MALLS
OTHER2
Source: Company data 1 As of Q1 2021.2 Includes street, off-mall and D/F malls.3 Q1 ’21 TTM represents the period ending May 1, 2021. 4 Simple average as of Q1 2021.
The VS&Co Investment Opportunity

Ability to quickly respond to shifting consumer trends
Impressive re-order speeds across product categories
Long-term supplier relationships
Diverse supplier relationships
Distribution flexibility
Our Business is Supportedby an Agile Supply Chain
The VS&Co Investment Opportunity
20

On Track to Deliver Expected Profit Improvement Annualized
Savings of:
Continued Execution Against Profit Improvement Plan
21
Reorganized corporate office
Merchandise margin rate expansion
Improved store profitability
Restructured international segments
The VS&Co Investment Opportunity
~$300M
Source: Company data.
Note: Expected total annualized savings for VS segment as reported by L Brands.

Highly Talented Management Team with Deep Industry Experience
Amy Hauk
Chief Executive
Officer, PINK
Greg Unis
Chief Executive
Officer, VS Beauty
Becky Behringer
Store Selling
Operations
Ishan Patel
Chief Digital
Officer
Arun Bhardwaj
International
Tim Johnson
Chief Financial
Officer
Dein Boyle
Chief Operating
Officer
Brad Kramer
EVP
Finance
Laura Miller
Chief Human
Resources Officer
Melinda McAfee
Chief Legal
Officer
Brian Leinbach
Chief Information
Officer
Martin Waters
Chief Executive
Officer, VS&Co
The VS&Co Investment Opportunity
22

Victoria’s Secret & Co.Board of Directors
Irene Chang BrittFormer President,
Pepperidge Farm
Senior Vice President,
Global Baking and
Snacking, Campbell Soup
Sarah DavisFormer President, Loblaw
Companies Limited
Donna James Managing Director, Lardon
& Associates LLC
Chair of the Board
Jacqueline HernándezFormer Chief Marketing
Officer, Hispanic
Enterprises and Content,
NBC Universal
Anne SheehanFormer Chair of the
Securities and Exchange
Commission’s Investor
Advisory Committee
Lauren PetersFormer Chief Financial
Officer, Foot Locker, Inc.
Martin WatersChief Executive Officer,
VS&CO
The VS&Co Investment Opportunity
23

Agenda
1. Company Overview
2. Lines of Business
VS Lingerie
PINK
VS Beauty
3. Channels
Digital
North America Stores
International
4. Financials & Growth Opportunities
5. Appendix
24

VS Lingerie
25
#1 in Intimates…with Renewed Strong Momentum Across Categories
Martin Waters Chief Executive Officer | VS&Co

VS Lingerie
Bras Panties Lounge
Sleep Swimwear Sport
26
#1U.S. Intimate Apparel Market Share1
$2.7BRetail Sales2
~50%
of Total North America VS Sales2,3
~50%
Sales from Digital2,4
98%
Global Brand Awareness Among U.S. Women (13 – 39 Years)5
Market Leader with Powerful & Deep Customer Connections to Drive Growth
Source: Company data 1 Source: NPD.2 North America Stores and Digital Retail sales as of Q1 ’21 TTM period ending May 1, 2021.3 Reflects VS Lingerie Sales as a % of Total North America Stores and Digital Retail Sales.4 Reflects VS Lingerie Digital Sales as a % of Total VS Lingerie Retail Sales for North America Stores and Digital.5 Source: Ypulse Brand Data for the 12 months ended July 4, 2021.

VS LingerieKey Pillars
27
Elevating
Assortment
Architecture
Enhancing
Customer
Experience
Repositioning
the BrandSimplifying
Operating
Model

VS LingerieKey Pillars
Elevated / Emotional Product
Moving From Basics to
Fashion
Re-enforce good, better, best principles
Superior quality and fit
Shift to product storytelling and tiering
stores based on product attributes vs.
store volume and space
40% choice count reduction through last
few years
Extend merchandise categories on digital
28
Elevating
Assortment
Architecture
Enhancing
Customer
Experience
Repositioning
the BrandSimplifying
Operating
Model

VS Lingerie Key Pillars
Relentless Focus on
Execution
Customer-centric omni experience
Focused training on product
knowledge and elevated selling
Elevated selling experience with bra
fit experts
Significantly improve digital capability
in user experience and fulfillment
29
Elevating
Assortment
Architecture
Enhancing
Customer
Experience
Repositioning
the BrandSimplifying
Operating
Model

VS Lingerie Key Pillars
30
Elevating
Assortment
Architecture
Enhancing
Customer
Experience
Repositioning
the BrandSimplifying
Operating
Model
Drive Growth & Maintain #1
Lingerie Market Position
Inclusive communication and branding
to strengthen customer loyalty
Emotional connections with customers
Brand evolution to remain modern and
relevant
Leverage VS Collective

VS Lingerie Key Pillars
31
Elevating
Assortment
Architecture
Enhancing
Customer
Experience
Repositioning
the BrandSimplifying
Operating
Model
Re-build the Operating
Model for Speed and
Simplicity
Focus on buying calendar, processes
and planning of products
Speed and agility, with development
cycle of <15 weeks
Assortment improvements and
disciplined inventory management drive
elevated margin rates in key categories
Focus on superior talent and training /
development

VS LingerieAdditional Growth Initiativesin 2021 & Beyond
Growth from the
CoreBra launches
Aggregation
Opportunities
New designer / brand partnerships to further develop Brands
We Love platform
Swim
(Re-introduction)
Grounded in bra fit technology
Strong core plus fashion business
Focus on frequent newness updates (6 weeks)
Year round digital (stores seasonal)
Size ExpansionAll product category participation
Digital-first focus
Maternity
Support customer through life milestones
Builds customer loyalty
Anchored in best at categories of bras / panties
Shapewear
Two-prong approach:
• Smoothing focus through VS design / manufacturing
• Technical solutions offered through third party expansion
Bridal
Support customer through life milestones
Cross-category grounded in bras, panties, lingerie
Digital-only capsule collection anchored in best-selling frames
32

VIDEO
33
Let’s Take a Closer Look…

…Creating Meaningful Products &
Experiences that Celebrate Our
Customers and Their Communities
34
Amy HaukChief Executive Officer | Victoria’s Secret PINK

Let’s Take a Closer Look…
35
VIDEO

Bras Panties Active
Swim Apparel / Lounge Logo Shop
36
We believe in empowering and supporting young adults in everything they do. Through our core
pillars of people, purpose, and planet, we’ve got their back beyond the product that’s on it.
#1Intimates Mindshare1
$2.0BRetail Sales2
~35%of Total North American VS Sales2,3
~40%Sales from Digital2,4
95%Brand Awareness5
Source: Company data 1 Source: NPD.2 North America Stores and Digital Retail sales as of Q1 ’21 TTM period ending May 1, 2021.3 Reflects VS PINK Sales as a % of Total North America Stores and Digital Retail Sales.4 Reflects VS PINK Digital Sales as a % of Total VS PINK Retail Sales for North America Stores and Digital.5 Source: Ypulse Brand Data for the 12 months ended July 4, 2021.

Key Pillars
37
Standing For Our
Brand Values:
People, Purpose,
Planet
Leveraging
Stores &
Digital
Delivering on
Innovation
Pipeline
Adhering To
Retail
Disciplines
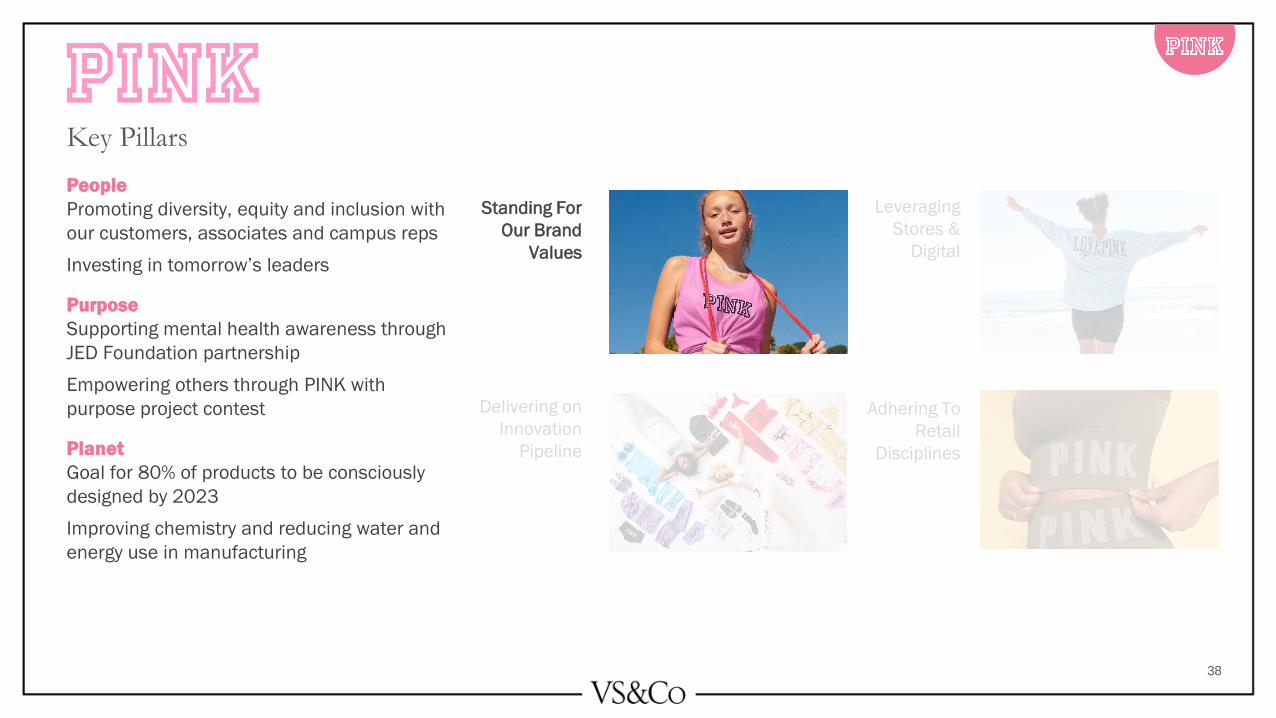
Key Pillars
People
Promoting diversity, equity and inclusion with
our customers, associates and campus reps
Investing in tomorrow’s leaders
Purpose
Supporting mental health awareness through
JED Foundation partnership
Empowering others through PINK with
purpose project contest
Planet
Goal for 80% of products to be consciously
designed by 2023
Improving chemistry and reducing water and
energy use in manufacturing
38
Standing For
Our Brand
Values
Leveraging
Stores &
Digital
Delivering on
Innovation
Pipeline
Adhering To
Retail
Disciplines


Key Pillars
Source: Company data, Ypulse, Rival IQ, TikTok.1 2021 Rival IQ social benchmark report that analyzed 2,100 companies across 14 industries (150 companies per industry). Average engagement rate for retail was 0.6% and fashion was 0.5%, and Victoria’s Secret PINK scored 5.1%, between February 1, 2021 and June 30,
2021.
Maintain best-in-class store performance
and productivity
Relaunching PINK Nation App in 2022;
evolving program and benefits
Highly connected with Gen Z:
• Instagram engagement
~8x industry benchmark1
• 2021 TikTok challenges:
9B+ total global campaign views
40
Standing For
Our Brand
Values
Leveraging
Stores &
Digital
Delivering on
Innovation
Pipeline
Adhering To
Retail
Disciplines

Key Pillars
41
Standing For
Our Brand
Values
Leveraging
Stores &
Digital
Delivering on
Innovation
Pipeline
Adhering To
Retail
Disciplines
Revamping bra product line with
fashion/innovation across Wear
Everywhere, Sports Bras, Bralettes
Innovation in panties with Period Panty
launch
Ability to quickly adapt to seasonal trends
Relaunch of swim assortment in 2021
(gym-to-swim since 2019)
Build on expanded Active Cotton legging
assortment in Fall 2021
Focus on innovation (fit, comfort,
function, fabric)

Key Pillars
42
Standing For
Our Brand
Values
Leveraging
Stores &
Digital
Simplified, streamlined process through
omnichannel execution
Robust testing agenda
Edit to focus
Aligned to key retail principles:
• Know the brand and competition;
• Connect with the customer through
storytelling;
• Focus on sales optimization;
• Maximize big ideas
Delivering on
Innovation
Pipeline
Adhering To
Retail
Disciplines
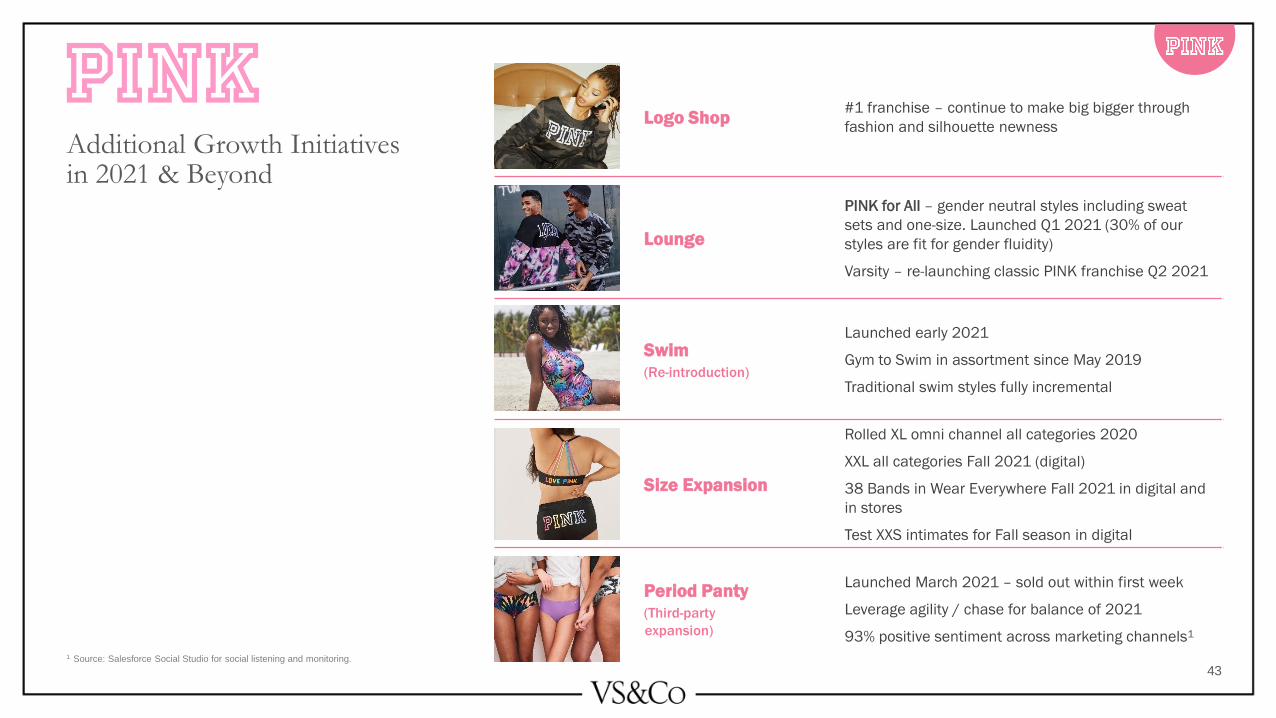
Additional Growth Initiativesin 2021 & Beyond
Logo Shop#1 franchise – continue to make big bigger through
fashion and silhouette newness
Lounge
PINK for All – gender neutral styles including sweat
sets and one-size. Launched Q1 2021 (30% of our
styles are fit for gender fluidity)
Varsity – re-launching classic PINK franchise Q2 2021
Swim
(Re-introduction)
Launched early 2021
Gym to Swim in assortment since May 2019
Traditional swim styles fully incremental
Size Expansion
Rolled XL omni channel all categories 2020
XXL all categories Fall 2021 (digital)
38 Bands in Wear Everywhere Fall 2021 in digital and
in stores
Test XXS intimates for Fall season in digital
Period Panty
(Third-party
expansion)
Launched March 2021 – sold out within first week
Leverage agility / chase for balance of 2021
93% positive sentiment across marketing channels1
1 Source: Salesforce Social Studio for social listening and monitoring.
43

Let’s Take a Closer Look…
44
VIDEO

VS Beauty
45
#1 Fragrance Brand in America…An Established & Proven Market Leader With Growth Potential
Gregory UnisChief Executive Officer | Victoria’s Secret Beauty

VS Beauty
Fine Fragrance Mist & Body Care PINK Beauty
46
#1Fragrance Brand in America1
#1Bombshell is America’s #1
Fragrance1
~$0.9BRetail Sales2
~15%
of Total North American VS
Sales2,3
~40%
Sales from Digital2,4
Source: Company data 1 Source: Euromonitor.2 North America Stores and Digital Retail sales as of Q1 ’21 TTM period ending May 1, 2021.3 Reflects VS Beauty Sales as a % of Total North America Stores and Digital Retail Sales.4 Reflects VS Beauty Digital Sales as a % of Total VS Beauty Retail Sales for North America Stores and Digital.

VS BeautyKey Pillars
47
Extending Market
Leadership
Defining Our
Clear
Competitive
Advantage
Creating Cohesive
Customer Journey
Across Brands
Growing
Extensions &
Adjacencies

VS BeautyKey Pillars
#1 Fragrance Brand in America,
headlined by Bombshell1
Own 6 of top 30 Fragrances2
Fine Fragrance anchored in five
iconic collections with
complementary mists and lotions
48
Extending
Market
Leadership
Defining
Our Clear
Competitive
Advantage
Creating Cohesive
Customer Journey
Across Brands
Growing
Extensions &
Adjacencies
1 Source: Euromonitor.2 Source: NPD.

VS BeautyKey Pillars
Scaled direct-to-consumer fine
fragrance brand
Balanced assortment
architecture – balancing value
with benefits
Strategic supply chain leverages
Beauty Park campus in central
Ohio for speed, agility and growth
49
Extending
Market
Leadership
Defining Our
Clear
Competitive
Advantage
Creating Cohesive
Customer Journey
Across Brands
Growing
Extensions &
Adjacencies
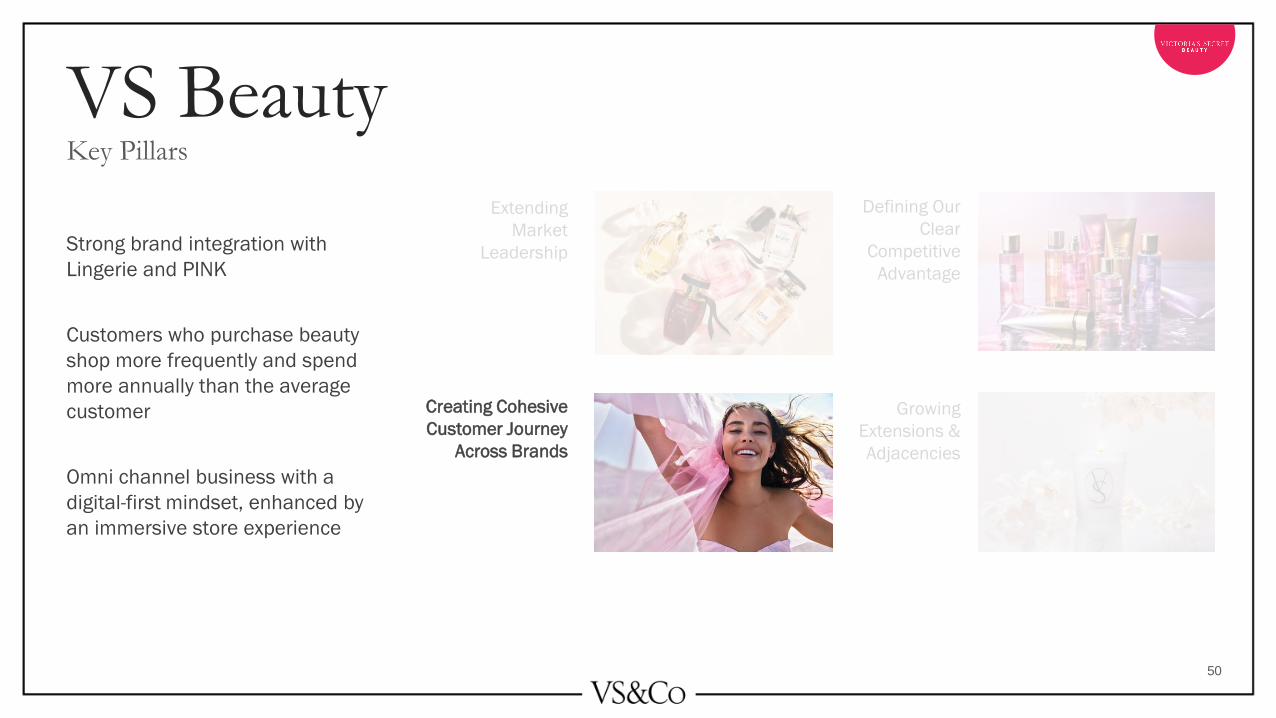
VS BeautyKey Pillars
Strong brand integration with
Lingerie and PINK
Customers who purchase beauty
shop more frequently and spend
more annually than the average
customer
Omni channel business with a
digital-first mindset, enhanced by
an immersive store experience
50
Extending
Market
Leadership
Defining Our
Clear
Competitive
Advantage
Creating Cohesive
Customer Journey
Across Brands
Growing
Extensions &
Adjacencies

VS BeautyKey Pillars
Core portfolio with opportunity to
grow extensions and adjacencies
Within PINK Beauty, build
awareness in Body Care and create
an elevated scent experience
Enhance brand positioning with
curated Home Fragrance launch,
creating a holistic experience
51
Extending
Market
Leadership
Defining Our
Clear
Competitive
Advantage
Creating Cohesive
Customer Journey
Across Brands
Growing
Extensions &
Adjacencies

VS BeautyAdditional Growth Initiatives in 2021 & Beyond
Home Fragrance
VS & PINK
Testing initial assortment this Fall
Natural Beauty
Launched first collection this spring with
initial results exceeding expectations
PINK Beauty (Body Care)
Growth through expansion of new product
forms and offerings within existing core
product lines, creating depth and price
value offerings
52

VIDEO
53
Let’s Take a Closer Look…
54
Agenda1. Company Overview
2. Lines of Business
VS Lingerie
PINK
VS Beauty
3. Channels
Digital
North America Stores
International
4. Financials & Growth Opportunities
5. Appendix
Martin Waters Chief Executive Officer | VS&Co

Delivering Across Diversified Channels
1 Q1 ’21 TTM represents the period ending May 1, 2021.2 Digital includes $0.2 billion of international digital sales that transact through North America. These sales are not included in International.3 Visits to vs.com and VS/PINK apps as of Q1 ’21 TTM period ending May 1, 2021. 55
$2.4B
40%
Digital2
$3.2B
53%
NA Stores
7%
International2
$0.4B
Highly profitable business
~700M annual website visits3
867 store locations
~94% of stores are cash flow positive
Flexible lease structure with average
remaining term of ~3.8 years
520 total locations — mix of partner and
company-owned sites
New model focused on profitability and
targeted expansion
Multiple avenues for growth across
business verticals
Q1 ‘21 TTM Net Sales1

Digital
Interconnected digital platform creates
enduring customer relationships
Seamless and Personalized Digital Experience
56

Large, Highly-Profitable & Growing Digital Business
24% 25%
44% 43%
2018 2019 2020 Q1 '21 TTM
~$400M investment over the
last five years:
• Modernized the digital platform
• State-of-the-art distribution centers
• Omni-channel focus
• Increasing use of AI-driven commerce
Digital Sales1 ($B)
Digital Penetration1, 2 (%)
57
$1.7 $1.7
$2.2$2.4
2018 2019 2020 Q1 '21 TTM
Source: Company data.1 Q1 ’21 TTM represents the period ending May 1, 2021.2 Digital net sales as a % of Digital + North America Stores net sales.

Powerful Digital Marketing Strategy Driving Consumer Engagement
~77M
Followers on Instagram
(VS & PINK)
~45M
Followers on Facebook
(VS & PINK)
~15M
Active Digital Customers
~21MTotal Email File
6.2M
Active VS App Customers
5.5M
Active PINK Nation
Customers
45%Organic Traffic
58
Source: Company data.
As of May 1, 2021; “active” defined as customers who have purchased from North America stores or digital in the last twelve months.

Our Interconnected Digital Platform Creates Enduring Customer RelationshipsSeamless and Personalized Journey Across Touchpoints
Personalized email content
pre and post transaction
Engages via
social media Omni experience
in stores
Browses and shops
online with personalized
content
Downloads app for
richer experiences
online & in stores
Shops online again
Customer care
for online and
stores
customers
START
LOOP
59

Personalized Approach
• Tailoring experiences for her creates lasting loyalty
• Creating customer-centric, timely & relevant experiences
• Driving qualified traffic & conversion
Seamless Omni-Channel Experience
• Omni-channel empowers her to select the most convenient option
• Customer choice across channels (inventory visibility, fulfillment & assortment access)
• Driving faster inventory turn, increasing fulfillment speed & reducing markdowns
Continuous Improvement of Shopping & Service
• Optimize digital interaction to ensure a memorable experience
• Create delightful shopping & service experiences
• Driving increased conversion & average order size
Increasing Mobile & App Penetration
• Accelerate commerce in fastest growing store while merging online & store experiences
• Driving increased app download / retention, average order size & conversion
Elevating the Digital Experience
60
80%+
of engagement on mobile
devices1
60%+
of all sales via mobile
devices1
Omni customer spends
more than 2x annually vs.
single channel customer,1
driven by increased
visits
Source: Company data.1 As of May 1, 2021; reflects Q1 ’21 TTM for the period ending May 1, 2021.

North America Stores
Differentiated retail experience
Best-in-class store experience provided by
passionate, knowledgeable and engaged sales force
Signature bra fit experience
Modern, feminine feel
Unique, Engaging In-StoreExperience
61

26%
37%
13%
24%
Total North
America Stores4
867
Profitable & Evolving Retail Footprint
Broad-Based Store Portfolio: ~94% of North America Stores
Cash Flow Positive1~$0.9MNorth America average cash flow per store1
~3.8 YEARS
Average NA remaining lease term2
241Targeted, permanent store closures completed during 2020
A MALLS
B MALLSC MALLS
OTHER3
62
Source: Company data. 1 Q1 ’21 TTM represents the period ending May 1, 2021.2 Simple average as of Q1 2021.3 Includes street, off-mall and D/F malls.4 As of Q1 2021.

Store of the Future & Off-Mall TestingFall 2021 & FY 2022
Completed negotiations
with majority of landlords
to address COVID
disruption and secured
meaningful rent
concessions
Flexible lease
structure & continued
pathway to further
store rationalization
Optimizing Real Estate Footprint to Drive Growth & Profitability
63
Victoria’s Secret North America Store Count
11431091
871 867
2018 2019 2020 Q1 2021 Beyond
Continued
Optimization
Efforts

Refreshing Existing Locations in 2021B
EFO
RE
AF
TE
R
FRONT OF STORE PINK BEAUTY ROOM
64
Investing in a more modern, efficient store base through space
optimization & store refresh projects
Utilizing low-cost and light touch
approach on current store fleet
Updating stores to evolve with the
brand
Addressing aged fixtures and finishes
in select locations
Enhancing the customer experience &
rebalancing square footage to drive
store productivity

Go-Forward Physical Retail Strategy
Refreshing existing stores and
building the stores of the future
Investing in field talent &
leadership development
Store labor optimization
Lower capex build-out cost per foot
Right-size inventory assortment
Fleet Investment
& RationalizationStore Talent
Omni-Channel
Enhancing in-store, online ordering
process
BOPIS is live in 200 stores and
expanding to broader fleet
Ship-From-Store roll-out to 200 stores
Profitability
Store of the
Future
1. Best-in-class customer service
2. Modern, feminine feel
3. Integrated in-store online orders & returns
4. Unique, dual-brand store layout
5. Refined staffing models
65
TESTING IN FALL 2021,
INCLUDING OFF-MALL
GOAL:
Significantly
Lower Capex

Let’s Take a Closer Look…
VIDEO
66

International
Positioned for Long-Term,
Global Growth
Successful International
Operating Model
67

International Business Evolution
2008 2009 2010 2011 2012 2013 2014 2015 2016 2017 2018 2019 2020
Victoria’s
Secret Beauty
Assortment
~375 Stores
Victoria’s Secret
Full Assortment
~145 Stores
1st VSBA
In Travel Retail
Entered Singapore,
Kuwait & Venezuela
Entered Qatar, Costa Rica,
Bahrain, Russia, Panama,
Turkey, Jordan, Oman,
Macau, Saudi Arabia,
Malaysia, Poland,
Colombia & Dominican
Republic
Entered Hong Kong,
Egypt, Indonesia,
Lebanon, Philippines
& Thailand
Entered Chile,
Mexico, Australia,
South
Africa & Sweden
Entered China,
Italy, Finland,
Greece, Denmark,
Norway & Spain
1st VSFA
in Canada
1st VSFA
in the UK
1st VSFA Franchise
Stores in Dubai &
Kuwait
Entered Saudi
Arabia, Turkey,
Lebanon
& Egypt
Entered Russia,
Mexico, Singapore,
Qatar, Jordan &
Bahrain
Entered China,
Panama, Poland
& Ireland
Entered
Peru
Entered
Indonesia
& Costa
Rica
Entered
Curacao
Entered Oman,
Chile, Peru,
France
Entered
Paraguay
Digital
200+ GeographiesCreated a dedicated
Finance & Operational
team; focus on localized
offers & messaging
Enabled
shopping in 22
local currencies
Site translations
into French, French-
Canadian, Spanish
(Castilian), German
Enabled
Fragrance
shipping
Translations into Italian,
Spanish (Universal)
New platform
First ~$100M season
and First ~$200M year
(2x 2015 demand)
70+ Countries Across the World
68

Successful International Operating ModelInternational retail sales present future upside opportunity
~$0.4BRecognized revenue1
~$1.0BRetail sales1, 2
1 Q1 ’21 TTM represents the period ending May 1, 2021.2 Sales represent retail sales and not reported sales. Includes international digital sales that transact through North America ($0.2B).
Diverse operating models capture
opportunity across markets and channels
• Franchise – Royalty-based model on Retail
Sales
• Travel Retail – Wholesale income model on
Travel Retail stores
• Joint Venture – Mix of royalty-based model
and share of earnings in the UK & Ireland
• Wholly Owned – China
We work with a small number of world-class
partners
• We work with experienced and well-
resourced partners in each Region/Channel
• Replication model: we own assortment,
pricing architecture, promotions, store
design and real estate approval
• Partners bring local knowledge, expertise in
real estate and people and make investments
in executing the brand locally
• We have associates in Region to coach, train,
expedite and escalate
International Retail Sales Split1
• International Digital – Vertical DTC model
reaching 200+ markets/territories
69
Victoria's Secret Digital
International
20%
Franchise
50%
UK Joint
Venture
6%
China
17%
Travel Retail
7%Digital sales are
reported in the
Digital segment
~30% Digital
in China
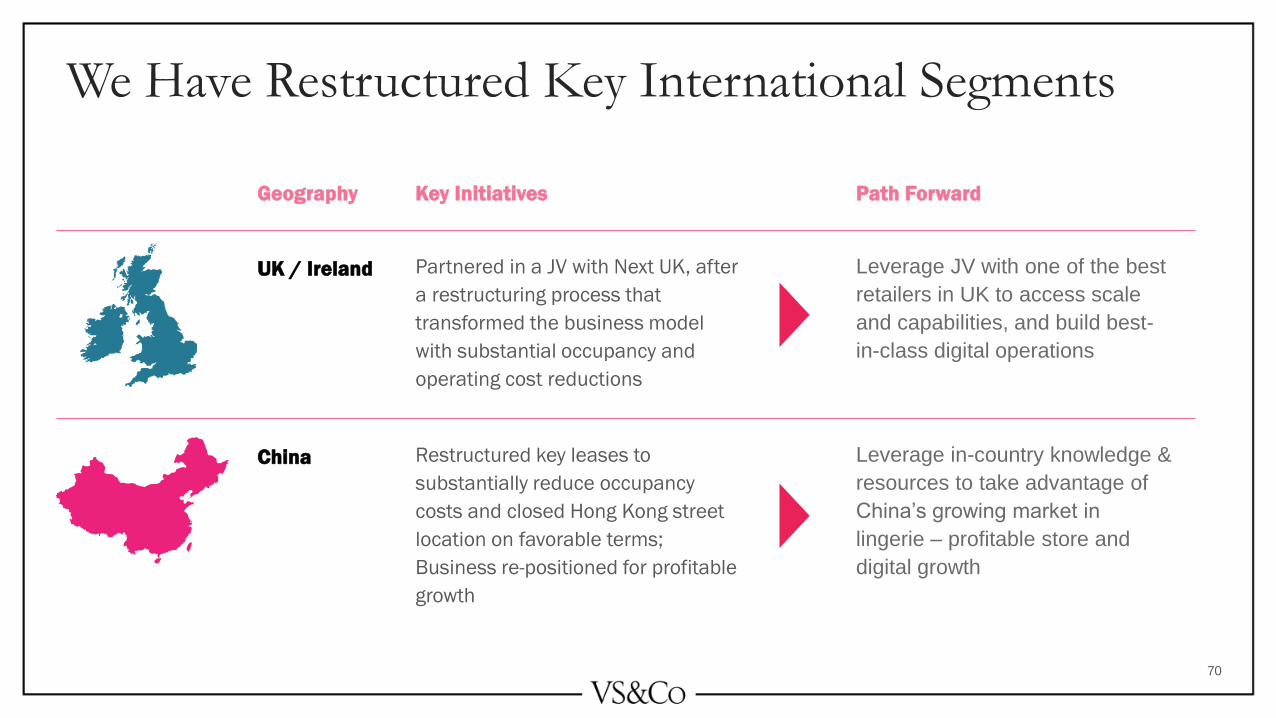
We Have Restructured Key International Segments
Geography Key Initiatives Path Forward
UK / Ireland Partnered in a JV with Next UK, after
a restructuring process that
transformed the business model
with substantial occupancy and
operating cost reductions
Leverage JV with one of the best
retailers in UK to access scale
and capabilities, and build best-
in-class digital operations
China Restructured key leases to
substantially reduce occupancy
costs and closed Hong Kong street
location on favorable terms;
Business re-positioned for profitable
growth
Leverage in-country knowledge &
resources to take advantage of
China’s growing market in
lingerie – profitable store and
digital growth
70
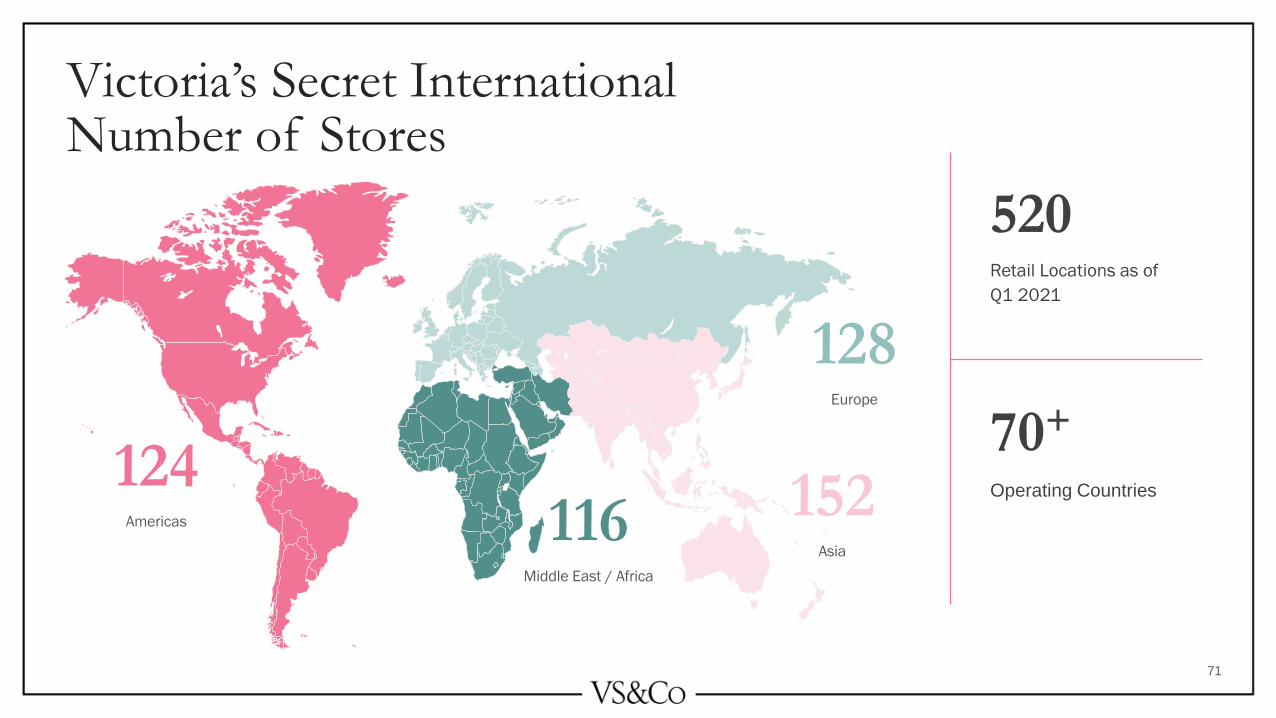
70+
Operating Countries
520Retail Locations as of
Q1 2021
Victoria’s Secret InternationalNumber of Stores
116Middle East / Africa
152Asia
124Americas
128Europe
71
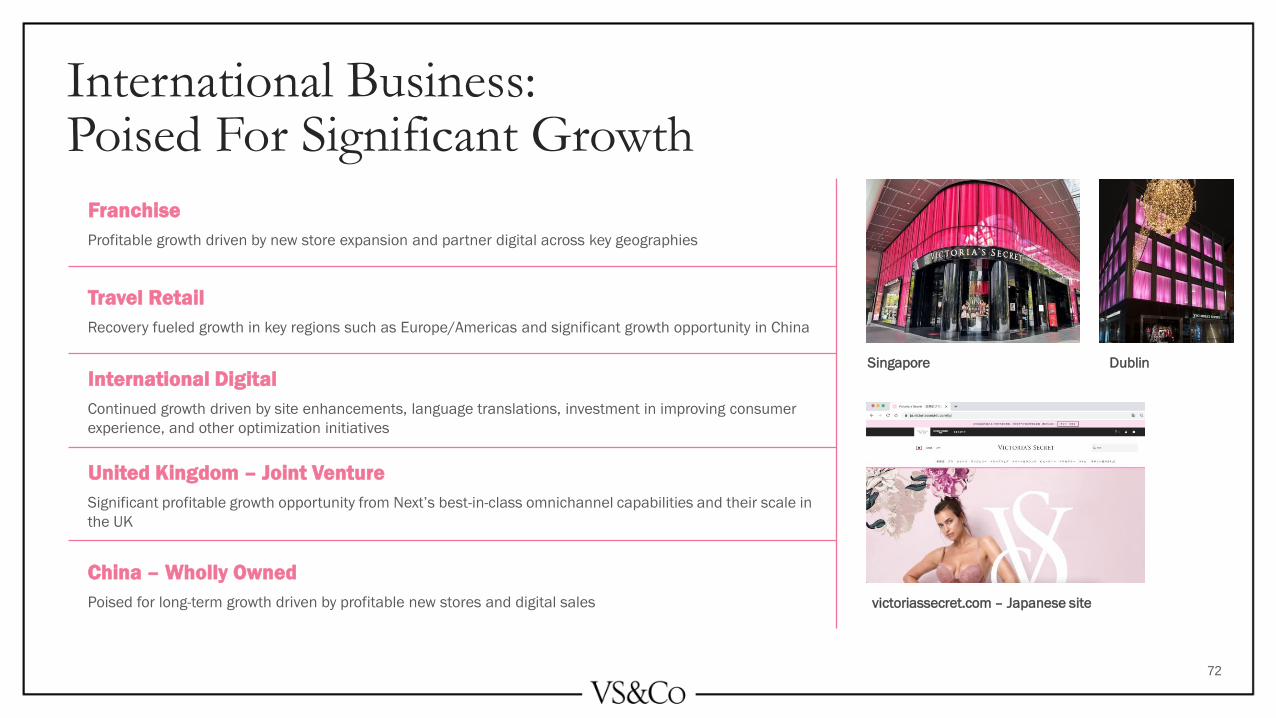
Singapore Dublin
Franchise
Profitable growth driven by new store expansion and partner digital across key geographies
Travel Retail
Recovery fueled growth in key regions such as Europe/Americas and significant growth opportunity in China
International Digital
Continued growth driven by site enhancements, language translations, investment in improving consumer
experience, and other optimization initiatives
United Kingdom – Joint Venture
Significant profitable growth opportunity from Next’s best-in-class omnichannel capabilities and their scale in
the UK
China – Wholly Owned
Poised for long-term growth driven by profitable new stores and digital sales
International Business: Poised For Significant Growth
victoriassecret.com – Japanese site
72

73
Agenda1. Company Overview
2. Lines of Business
VS Lingerie
PINK
VS Beauty
3. Channels
Digital
North America Stores
International
4. Financials & Growth Opportunities
5. Appendix
Timothy JohnsonChief Financial Officer | VS&Co
Brad KramerEVP Finance | VS&Co
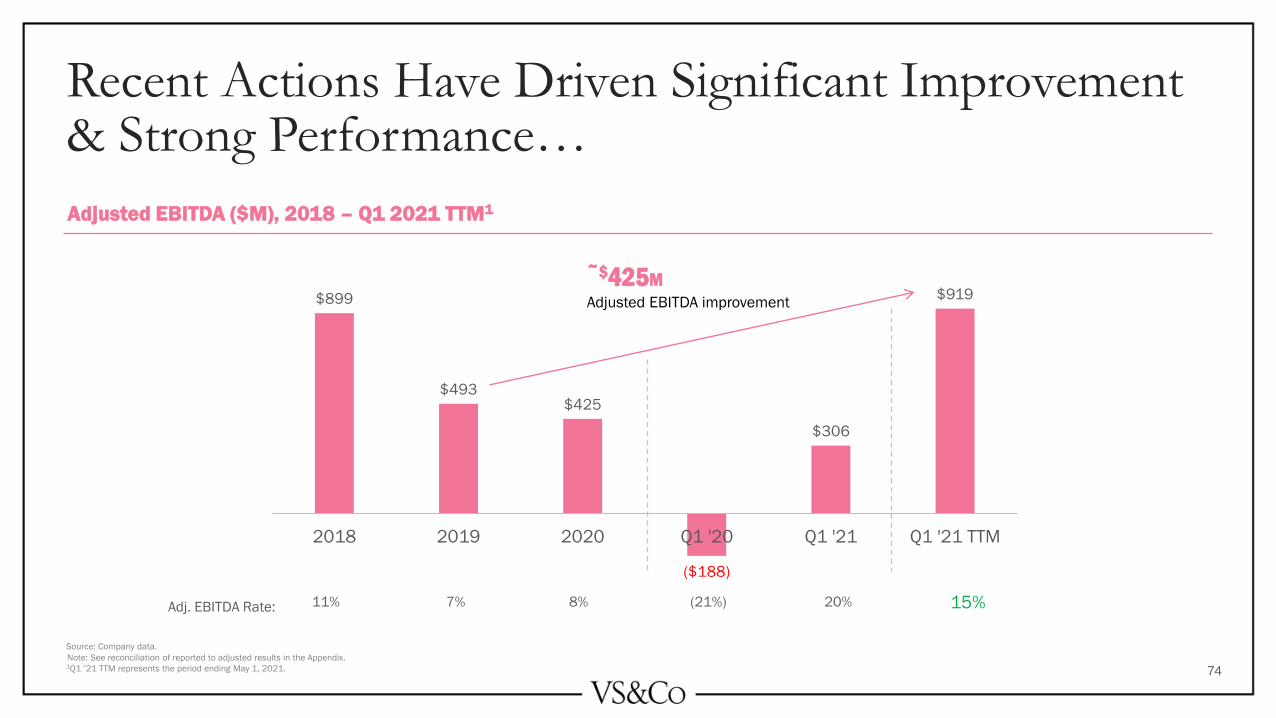
Recent Actions Have Driven Significant Improvement & Strong Performance…
Adjusted EBITDA ($M), 2018 – Q1 2021 TTM1
74
$899
$493 $425
($188)
$306
$919
2018 2019 2020 Q1 '20 Q1 '21 Q1 '21 TTM
~$425MAdjusted EBITDA improvement
Adj. EBITDA Rate:
Source: Company data.
Note: See reconciliation of reported to adjusted results in the Appendix. 1Q1 ’21 TTM represents the period ending May 1, 2021.
11% 7% 8% (21%) 20% 15%
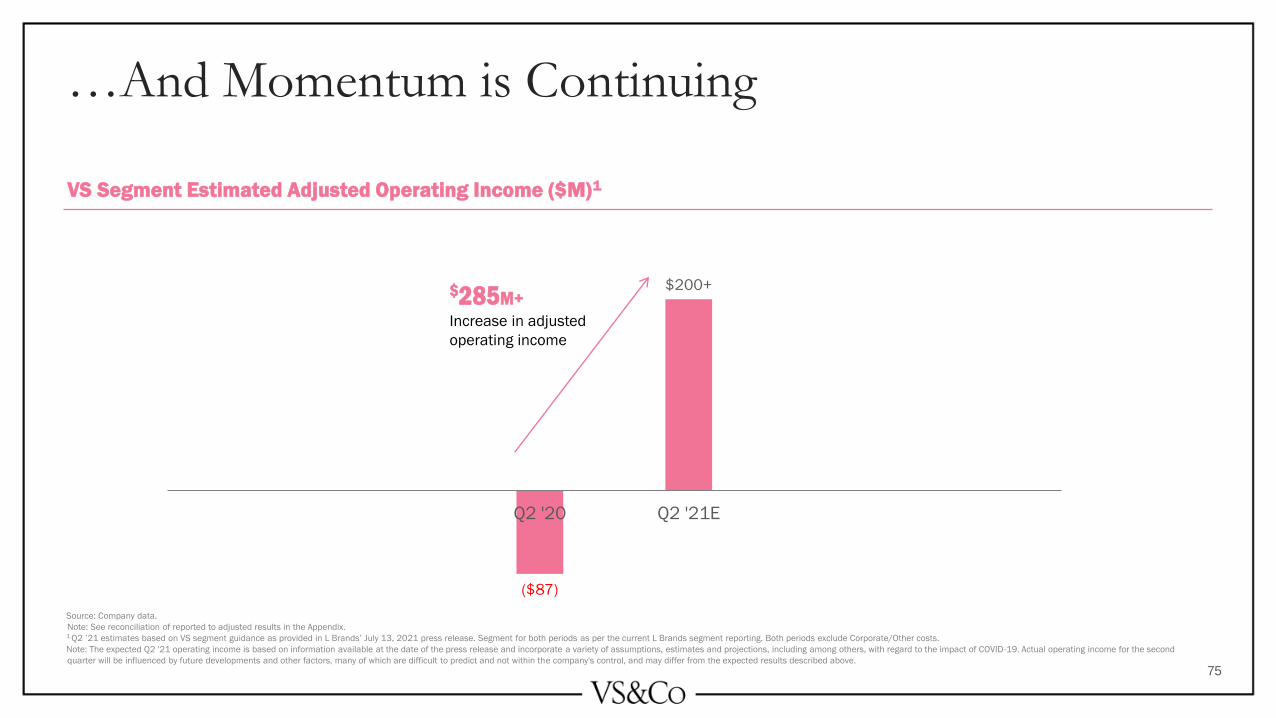
($87)
$200+
Q2 '20 Q2 '21E
…And Momentum is Continuing
75
$285M+Increase in adjusted
operating income
VS Segment Estimated Adjusted Operating Income ($M)1
Source: Company data.
Note: See reconciliation of reported to adjusted results in the Appendix. 1 Q2 ’21 estimates based on VS segment guidance as provided in L Brands’ July 13, 2021 press release. Segment for both periods as per the current L Brands segment reporting. Both periods exclude Corporate/Other costs.
Note: The expected Q2 '21 operating income is based on information available at the date of the press release and incorporate a variety of assumptions, estimates and projections, including among others, with regard to the impact of COVID-19. Actual operating income for the second
quarter will be influenced by future developments and other factors, many of which are difficult to predict and not within the company's control, and may differ from the expected results described above.

Delivering Significant & Sustainable Adjusted EBITDA Improvement
~$600M Expected Run-Rate Improvement
~$300M driven by North America comparable margin growth
• Expecting 4 consecutive quarters of comparable margin growth vs. 2019
• Improved performance across all channels and lines of business
~$300M expected via Profit Improvement Plan
~$100M One-Time Items driven by COVID-19-related occupancy concessions
76Based on VS segment guidance as provided in L Brands’ July 13, 2021 press release. Q2 ‘20 represents VS segment as reported by L Brands.
Driven by Combination of North America Margin Growth & Execution of Profit Improvement
Plan

Source: Company data.
Note: Expected total annualized savings for VS segment as reported by L Brands.
Continued Execution Against Profit Improvement Plan
77
~$300M
Reorganized corporate office
Merchandise margin rate expansion
Improved store profitability
Restructured international segments
On Track to Deliver Expected Profit Improvement Annualized
Savings of:

Metric Target
Total Sales Growth Mid-single digit
Digital Penetration ~50%
Operating Income Growth High-single digit
Operating Income Rate Mid-teens
Three-to-Five YearFinancial Targets
78

Evolve Merchandise Assortment
and Marketing
• Inspire women around the world with products and
experiences that uplift and champion them
Drive Penetration and Growth in Digital Channel
• Leverage unique platform of global brands and scaled retail footprint
in North America to continue to grow our digital business
• Deliver on omni-channel initiatives, including buy online pick-up in
store, and an increased focus on mobile and application interactions
Expand International Business
• Increase our international store count, enabled by a new store
design, lower costs and flexible store formats
• Country-specific web platforms tailored to local languages and
preferences and through additional regional expansion
Optimize Customer Experience through Elevated
and Profitable Company-Operated Stores
• Refreshing existing stores and working towards a store of the
future that will include smaller, more flexible space to meet the
needs of our customer and accommodate shifting consumer
preferences for omni-channel shopping
Focusing on Key Priorities
79
Continued Execution Creates Opportunities for Long-Term Growth

Financial Policy and Capital Allocation Framework
80
Liquidity, Leverage &
Balance Sheet Strength Targeted Investments
• Launch with ~$250M in cash and
$750M undrawn ABL
• Strong & flexible balance sheet with low
leverage
• Focus on deleveraging through EBITDA
growth and strong free cash flow
generation
• Emphasis on efficient capital spending
and working capital management to
support cash generation
• Disciplined approach to future
investment
• Primary focus on core business and
organic growth
Capital Allocation & Distribution Policy
Distributions to be made only from cash in excess of business investment needs

The VS Investment Opportunity
Two category-
defining intimates
and beauty brands
with clearly defined
purpose, mission
and vision
Global brand
awareness and
impressive customer
satisfaction scores
Growing digital
business with
proven omnichannel
foundation &
growing capabilities
Scaled, profitable
and right-sized store
footprint
Tightly controlled
and highly
responsive supply
chains
Delivering against
profit improvement
plan, with powerful
levers to drive
significant top- and
bottom-line growth
Highly talented
management team
with deep industry
experience
81


Investor Presentation
Q&AJuly 2021

Appendix
84

Quarterly Financial Information, Fiscal 2021
85
First Quarter
Victoria's Secret Segment1 Corporate / Other2 Total VS & Co.
Net Sales $ 1,554,220 $ 1,554,220
Costs of Goods Sold, Buying and Occupancy 882,079 882,079
Gross Profit 672,141 672,141
General, Administrative and Store Operating Expenses 427,625 $ 18,830 446,455
Operating Income $ 244,516 $ (18,830) $ 225,686
Gross Profit Rate 43.2% nm 43.2%
Operating Income Rate 15.7% nm 14.5%
1The Victoria's Secret segment as reported by L Brands represents company-operated retail stores located in the U.S., Canada and Greater China, company-operated Victoria's Secret digital platforms, and international stores/digital platforms operated by partners under franchise, license and
wholesale arrangements. Additionally, this segment includes the Victoria's Secret merchandise sourcing and production function serving the Company and its international partners.2Corporate/Other includes corporate infrastructure and governance functions and other non-recurring items that are deemed to be corporate in nature. The amounts included above are the L Brands' corporate costs that were allocated to Victoria's Secret & Co. for purposes of preparing its results
on a carve-out basis. As a result of the VS Spin-Off, the above operating results are not necessarily indicative of future results nor do they reflect what results of operations would have been as an independent public company during the periods presented.
Historical Reported Results - Carve Out Basis: Quarterly
$s in thousands, (Unaudited)

Quarterly Financial Information, Fiscal 2020
86
First Quarter Second Quarter Third Quarter
Victoria's Secret
Segment1
Corporate /
Other2 Total VS & Co.Victoria's Secret
Segment1,3
Corporate /
Other2 Total VS & Co.Victoria's Secret
Segment1
Corporate /
Other2 Total VS & Co.
Net Sales $ 893,607 $ 893,607 $ 1,066,334 $ 1,066,334 $ 1,353,100 $ 1,353,100
Costs of Goods Sold,
Buying and Occupancy872,846
872,846 913,720 913,720 856,315 856,315
Gross Profit 20,762 20,762 152,614
152,614 496,785 496,785
General, Administrative and
Store Operating Expenses 374,630 $ 19,526 394,156 371,314 $ 24,637 395,951 352,230 $ 17,178 369,407
Operating Income $ (353,868) $ (19,526) $ (373,395) $ (218,701) $ (24,637) $ (243,337) $ 144,555 $ (17,178) $ 127,377
Gross Profit Rate 2.3% nm 2.3% 14.3% nm 14.3% 36.7% nm 36.7%
Operating Income Rate -39.6% nm -41.8% -20.5% nm -22.8% 10.7% nm 9.4%
1The Victoria's Secret segment as reported by L Brands represents company-operated retail stores located in the U.S., Canada and Greater China, company-operated Victoria's Secret digital platforms, and international stores/digital platforms operated by partners under franchise, license and
wholesale arrangements. Additionally, this segment includes the Victoria's Secret merchandise sourcing and production function serving the Company and its international partners.2Corporate/Other includes corporate infrastructure and governance functions and other non-recurring items that are deemed to be corporate in nature. The amounts included above are the L Brands' corporate costs that were allocated to Victoria's Secret & Co. for purposes of preparing its results
on a carve-out basis. As a result of the VS Spin-Off, the above operating results are not necessarily indicative of future results nor do they reflect what results of operations would have been as an independent public company during the periods presented.3For Q2 ’20, the adjusted operating loss for the Victoria’s Secret segment was approximately $87 million, which excludes the special items described in the reconciliation of reported to adjusted results.
Historical Reported Results - Carve Out Basis: Quarterly
$s in thousands, (Unaudited)

Quarterly Financial Information, Fiscal 2020
87
1The Victoria's Secret segment as reported by L Brands represents company-operated retail stores located in the U.S., Canada and Greater China, company-operated Victoria's Secret digital platforms, and international stores/digital platforms operated by partners under franchise, license and
wholesale arrangements. Additionally, this segment includes the Victoria's Secret merchandise sourcing and production function serving the Company and its international partners.2Corporate/Other includes corporate infrastructure and governance functions and other non-recurring items that are deemed to be corporate in nature. The amounts included above are the L Brands' corporate costs that were allocated to Victoria's Secret & Co. for purposes of preparing its results
on a carve-out basis. As a result of the VS Spin-Off, the above operating results are not necessarily indicative of future results nor do they reflect what results of operations would have been as an independent public company during the periods presented.
Historical Reported Results - Carve Out Basis: Quarterly
$s in thousands, (Unaudited)
Fourth Quarter Full Year
Victoria's Secret
Segment1
Corporate /
Other2 Total VS & Co.Victoria's Secret
Segment1
Corporate /
Other2 Total VS & Co.
Net Sales $ 2,099,749 $ 2,099,749 $ 5,412,790 $ 5,412,790
Costs of Goods Sold,
Buying and Occupancy1,199,166 1,199,166
3,842,047 3,842,047
Gross Profit 900,583 900,583 1,570,744 1,570,744
General, Administrative and
Store Operating Expenses497,209 $ 15,495 512,704 1,595,383 $ 76,836 1,672,219
Operating Income $ 403,374 $ (15,495) $ 387,879 $ (24,640) $ (76,836) $ (101,475)
Gross Profit Rate 42.9% nm 42.9% 29.0% nm 29.0%
Operating Income Rate 19.2% nm 18.5% -0.5% nm -1.9%

Quarterly Financial Information, Fiscal 2019
88
First Quarter Second Quarter Third Quarter
Victoria's Secret
Segment1
Corporate /
Other2 Total VS & Co.Victoria's Secret
Segment1
Corporate /
Other2 Total VS & Co.Victoria's Secret
Segment1
Corporate /
Other2 Total VS & Co.
Net Sales $ 1,670,403 $ 1,670,403 $ 1,784,692 $ 1,784,692 $ 1,577,486 $ 1,577,486
Costs of Goods Sold,
Buying and Occupancy1,133,534 1,133,534
1,254,923 1,254,923 1,318,617
1,318,617
Gross Profit 536,869 536,869
529,769 529,769 258,869 258,869
General, Administrative and
Store Operating Expenses504,903 $ 27,489 532,392 494,392 $ 29,374 523,767 545,932 $ 25,668 571,600
Impairment of Goodwill 30,475 30,475
Operating Income $ 31,966 $ (27,489) $ 4,477 $ 35,376 $ (29,374) $ 6,002 $ (317,538) $ (25,668) $ (343,206)
Gross Profit Rate 32.1% nm 32.1% 29.7% nm 29.7% 16.4% nm 16.4%
Operating Income Rate 1.9% nm 0.3% 2.0% nm 0.3% -20.1% nm -21.8%
1The Victoria's Secret segment as reported by L Brands represents company-operated retail stores located in the U.S., Canada and Greater China, company-operated Victoria's Secret digital platforms, and international stores/digital platforms operated by partners under franchise, license and
wholesale arrangements. Additionally, this segment includes the Victoria's Secret merchandise sourcing and production function serving the Company and its international partners.2Corporate/Other includes corporate infrastructure and governance functions and other non-recurring items that are deemed to be corporate in nature. The amounts included above are the L Brands' corporate costs that were allocated to Victoria's Secret & Co. for purposes of preparing its results
on a carve-out basis. As a result of the VS Spin-Off, the above operating results are not necessarily indicative of future results nor do they reflect what results of operations would have been as an independent public company during the periods presented.
Historical Reported Results - Carve Out Basis: Quarterly
$s in thousands, (Unaudited)

Quarterly Financial Information, Fiscal 2019
89
1The Victoria's Secret segment as reported by L Brands represents company-operated retail stores located in the U.S., Canada and Greater China, company-operated Victoria's Secret digital platforms, and international stores/digital platforms operated by partners under franchise, license and
wholesale arrangements. Additionally, this segment includes the Victoria's Secret merchandise sourcing and production function serving the Company and its international partners.2Corporate/Other includes corporate infrastructure and governance functions and other non-recurring items that are deemed to be corporate in nature. The amounts included above are the L Brands' corporate costs that were allocated to Victoria's Secret & Co. for purposes of preparing its results
on a carve-out basis. As a result of the VS Spin-Off, the above operating results are not necessarily indicative of future results nor do they reflect what results of operations would have been as an independent public company during the periods presented.
Historical Reported Results - Carve Out Basis: Quarterly
$s in thousands, (Unaudited)
Fourth Quarter Full Year
Victoria's Secret
Segment1
Corporate /
Other2 Total VS & Co.Victoria's Secret
Segment1
Corporate /
Other2 Total VS & Co.
Net Sales $ 2,476,194 $ 2,476,194 $ 7,508,774 $ 7,508,774
Costs of Goods Sold,
Buying and Occupancy1,738,576 1,738,576 5,445,650 5,445,650
Gross Profit 737,618 737,618 2,063,124 2,063,124
General, Administrative and
Store Operating Expenses579,390 $ 27,765
607,155 2,124,616 $ 110,297 2,234,913
Impairment of Goodwill 689,576 689,576 720,051 720,051
Operating Income $ (531,348) $ (27,765) $ (559,113) $ (781,543) $ (110,297) $ (891,840)
Gross Profit Rate 29.8% nm 29.8% 27.5% nm 27.5%
Operating Income Rate -21.5% nm -22.6% -10.4% nm -11.9%

Adjusted EBITDA Reconciliation
90
1We recognized pre-tax impairment charges of $97 million and $117 million related to certain Victoria's Secret store and lease assets in the first and second quarter of 2020, respectively. We recognized pre-tax impairment charges of $217 million and $35 million related to certain Victoria's Secret store and lease assets
in the third and fourth quarter of 2019, respectively. We recognized pre-tax impairment charges of $81 million related to certain Victoria's Secret store assets in the third quarter of 2018.; 2
In the second quarter of 2020, we recognized pre-tax severance charges of $51 million related to restructuring activities.; 3
In the
second quarter of 2020, we recognized a net pre-tax gain of $36 million related to the closure and termination of our lease for the Victoria’s Secret Hong Kong flagship store.; 4
In the third quarter of 2020, we recognized a pre-tax gain of $30 million related to the establishment of a joint venture for the Victoria’s Secret
U.K. and Ireland business with Next PLC.; 5
In the fourth quarter of 2019, we recognized a $690 million pre-tax goodwill impairment charge related to the North America reporting unit. In the third quarter of 2019, we recognized a $30 million goodwill impairment charge related to the Greater China reporting unit.
Note: The operating income results include L Brands' corporate costs that were allocated to Victoria's Secret & Co. for purposes of preparing its results on a carve-out basis. As a result of the Spin-Off, the above operating results are not necessarily indicative of future results nor do they reflect what results of operations
would have been as an independent public company during the periods presented.
In addition to our results provided that are in accordance with accounting principles generally accepted in the United States (“GAAP”), we have also provided non-GAAP financial measures which present operating income (loss) on an adjusted basis, which remove certain special items. In addition, we present EBITDA and
adjusted EBITDA which are non-GAAP financial measures. EBITDA is defined as earnings before interest expense, income tax expense and depreciation and amortization. Adjusted EBITDA is EBITDA adjusted to remove certain special items. We believe that these special items are not indicative of our ongoing operations
due to their size and nature. We use adjusted financial information as key performance measures of results of operations for the purpose of evaluating performance internally. These non-GAAP financial measures are not intended to replace the presentation of our financial results in accordance with GAAP. Instead, we
believe that the presentation of adjusted financial information provides additional information to investors to facilitate the comparison of past and present operations. In particular, EBITDA and Adjusted EBITDA are not an alternative to operating income (loss) as a measure of operating performance or to cash flows from
operating activities as a measure of liquidity. Additionally, they are not intended to be a measure of free cash flow for management’s discretionary use, as they do not consider certain cash requirements such as interest payments, tax payments and debt service requirements. Further, our definition of adjusted financial
information may differ from similarly titled measures used by other companies and therefore may not be comparable among companies. The table above reconciles the GAAP financial measures to the non-GAAP financial measures. The non-GAAP financial measures presented should be read in conjunction with our
audited combined financial statements and the related notes, our unaudited interim combined financial statements and the related notes, “Management’s Discussion and Analysis of Financial Condition and Results of Operations” and the “Unaudited Pro Forma Condensed Combined Financial Statements” and
accompanying notes included in the Victoria’s Secret & Co. Registration Statement on Form 10, as amended.
Historical Reported Results - Carve Out Basis: Reconciliation of Operating Income (Loss) to Adjusted Operating Income (Loss) and Adjusted EBITDA
$s in thousands, (Unaudited)2018 2019 2020 2021
FY Q1 Q2 Q3 Q4 FY Q1 Q2 Q3 Q4 FY Q1
Operating Income (Loss) - As Reported $ 399,737 $ 4,477 $ 6,002 $ (343,206) $ (559,113) $ (891,840) $ (373,395) $ (243,337) $ 127,377 $ 387,879 $ (101,475) $ 225,686
Asset Impairments1 80,878 - - 217,058 35,384 252,442 96,844 117,109 --
213,953 -
Restructuring Charges2 - - - - --
- 51,236 --
51,236 -
Hong Kong Store Closure and Lease
Termination3- - - - -
-- (36,287) - - (36,287) -
Establishment of Victoria's Secret U.K. and
Ireland Joint Venture with Next PLC4- - - - - - - - (29,918) - (29,918) -
Impairment of Goodwill5 - - - 30,474 689,576 720,050 - - - - - -
Operating Income (Loss) - Adjusted $ 480,615 $ 4,477 $ 6,002 $ (95,674) $ 165,847 $ 80,652 $ (276,551) $ (111,279) $ 97,459 $ 387,879 $ 97,509 $ 225,686
Other Income (Loss) (7,339) 549 (1,117) 1,193 (102) $ 523 (1,501) 24 1,122 1,819 $ 1,464 (191)
Depreciation Expense 425,275 102,724 106,025 102,891 99,702 411,342 89,863 81,217 78,684 76,731 326,495 80,046
Adjusted EBITDA $ 898,551 $ 107,750 $110,910 $ 8,410 $ 265,447 $ 492,517 $ (188,189) $ (30,038) $ 177,265 $ 466,429 $ 425,468 $ 305,541
Copyright © 2022 FDOKUMEN