Investment Sizing India's 2070 Net-Zero Target - CEEW ...
17
Vaibhav Pratap Singh and Gagan Sidhu Issue Brief | November 2021 Image: iStock Investment Sizing India’s 2070 Net-Zero Target O n 1 November 2021, India’s Prime Minister declared that India would achieve net-zero emissions by 2070. The announcement made at COP26 in Glasgow was in tandem with a declaration of an enhancement of India’s Paris commitments. Achieving net-zero involves technology pathways as well as financial flows. These finance flows, or investments, are required to fund the construction of the associated physical infrastructure (total investment). In India’s case, such investments will run into trillions of dollars. The investment requirement curve would have been steeper if the time taken to reach net-zero was to be reduced further. The mobilisation of investments to achieve net-zero expectedly will be sourced from domestic banks, Non- Banking Finance Companies (NBFC), and debt capital markets, both domestic and international. However, a gap remains (investment gap) between the total investment required to achieve net-zero and the amount that can be reasonably mustered from conventional sources. Executive summary Along with the sectoral deployment of different technologies, India’s net-zero commitment will require immense capital investment in infrastructure. Centre for Energy Finance
-
Upload
khangminh22 -
Category
Documents
-
view
0 -
download
0
Transcript of Investment Sizing India's 2070 Net-Zero Target - CEEW ...

Investment Sizing India’s 2070 Net-Zero Target
Vaibhav Pratap Singh and Gagan Sidhu
Issue Brief | November 2021
Ima
ge:
iSto
ck
Investment Sizing India’s 2070 Net-Zero Target
On 1 November 2021, India’s Prime Minister declared that India would achieve net-zero emissions by
2070. The announcement made at COP26 in Glasgow was in tandem with a declaration of an enhancement of India’s Paris commitments. Achieving net-zero involves technology pathways as well as financial flows. These finance flows, or investments, are required to fund the construction of the associated physical infrastructure (total investment). In India’s case, such investments will run into trillions of dollars. The investment requirement curve would have been steeper if the time taken to reach net-zero was to be reduced further. The mobilisation of investments to achieve net-zero
expectedly will be sourced from domestic banks, Non-Banking Finance Companies (NBFC), and debt capital markets, both domestic and international. However, a gap remains (investment gap) between the total investment required to achieve net-zero and the amount that can be reasonably mustered from conventional sources.
Executive summary
Along with the sectoral deployment of different technologies, India’s net-zero commitment will require immense capital investment in infrastructure.
Centre forEnergy Finance
Investment Sizing India’s 2070 Net-Zero Target2
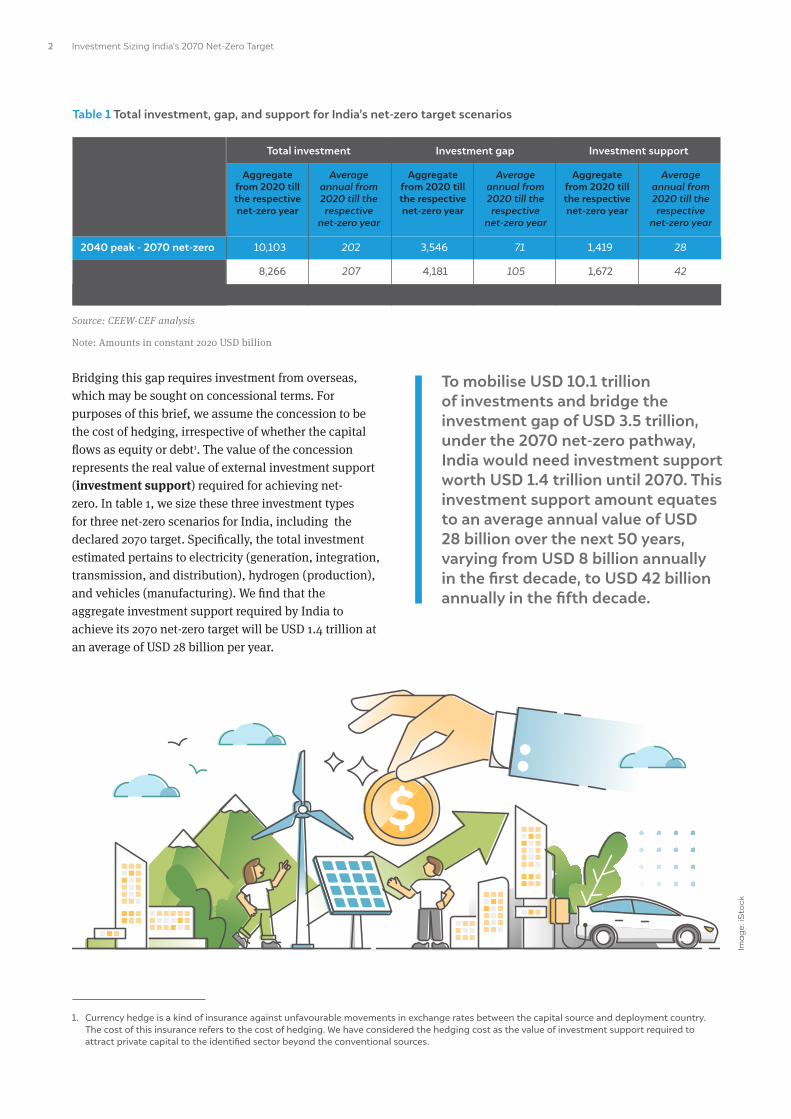
Bridging this gap requires investment from overseas, which may be sought on concessional terms. For purposes of this brief, we assume the concession to be the cost of hedging, irrespective of whether the capital flows as equity or debt1. The value of the concession represents the real value of external investment support (investment support) required for achieving net-zero. In table 1, we size these three investment types for three net-zero scenarios for India, including the declared 2070 target. Specifically, the total investment estimated pertains to electricity (generation, integration, transmission, and distribution), hydrogen (production), and vehicles (manufacturing). We find that the aggregate investment support required by India to achieve its 2070 net-zero target will be USD 1.4 trillion at an average of USD 28 billion per year.
To mobilise USD 10.1 trillion of investments and bridge the investment gap of USD 3.5 trillion, under the 2070 net-zero pathway, India would need investment support worth USD 1.4 trillion until 2070. This investment support amount equates to an average annual value of USD 28 billion over the next 50 years, varying from USD 8 billion annually in the first decade, to USD 42 billion annually in the fifth decade.
1. Currency hedge is a kind of insurance against unfavourable movements in exchange rates between the capital source and deployment country. The cost of this insurance refers to the cost of hedging. We have considered the hedging cost as the value of investment support required to attract private capital to the identified sector beyond the conventional sources.
Source: CEEW-CEF analysis
Note: Amounts in constant 2020 USD billion
10,103
8,266
5,724
202
207
191
1,419
1,672
1,363
28
42
45
3,546
4,181
3,407
71
105
114
Total investment
Aggregate from 2020 till the respective net-zero year
Average annual from 2020 till the respective
net-zero year
Aggregate from 2020 till the respective net-zero year
Average annual from 2020 till the respective
net-zero year
Aggregate from 2020 till the respective net-zero year
Average annual from 2020 till the respective
net-zero year
Investment gap Investment support
Table 1 Total investment, gap, and support for India’s net-zero target scenarios
2040 peak - 2070 net-zero
2030 peak - 2060 net-zero
2030 peak - 2050 net-zero
Ima
ge:
iSto
ck

Investment Sizing India’s 2070 Net-Zero Target 3
However, as table 2 demonstrates, the decadal investment support requirements are not flat but rather increase significantly as we near respective net-zero years. Had India chosen a 2050 net-zero target year, the average annual investment support requirements in decades two and three (USD 47bn and USD 80bn respectively) would have been 3.9x and 2.3x the corresponding values for the 2070 target year selected.
1. IntroductionDeveloping countries looking beyond conventional means to secure investments could look for support beyond their borders. They have long demanded that developed nations increase commitments towards climate finance. A number of developed nations have responded by enhancing climate finance pledges in the months leading up to COP26 and during the conference (UNCCC UK. 2021). The hope on this front is a further increase in ambition beyond the USD 100 billion and that actual flows eventually match the promises made. Further, the finalisation of the implementation guidelines relating to carbon markets under Article 6 at COP26, including the settlement of the long-standing issue of the transition of certified emission reductions (CERs) from the Kyoto Protocol regime (Dutt, Arjun. 2021), potentially offers new possibilities for channelling investment flows.
But the biggest promise lies in the USD 130 trillion in collective assets managed by banks, insurers, asset managers, and asset owners, all of whom have committed to achieve net-zero emissions by 2050 and stay on a 1.5°C pathway (UNEP,2021 and GFANZ,2021). This is an unprecedented opportunity for India’s excellent long-term policy certainty, and zero emission investment needs to match the tsunami of capital committed to global decarbonisation opportunities.
So what explains the appeal of net-zero targets? What would achieving them for a country like India would entail?
Source: CEEW-CEF analysis
Note: Amounts in constant 2020 USD billion
2020-30 (decade 1)
2030-40 (decade 2)
2040-50 (decade 3)
2050-60 (decade 4)
2060-70 (decade 5)
Aggregate from 2020 till the respective net-zero year
Average annual from 2020 till the respective net-zero year
82
122
352
442
420
1,419
-
8
12
35
44
42
-
28
90
471
801
-
-
1,363
-
9
47
80
-
-
-
45
85
405
547
635
-
1,672
-
9
40
55
64
-
-
42
2040 peak - 2070 net-zero 2040 peak -2060 net-zero 2030 peak -2050 net-zero
Aggregate Aggregate AggregateAverage annual
Average annual
Average annual
Table 2 Investment gap per decade for India’s 2070 net-zero target
Net-zero commitments by developing countries will require international banks, insurers, asset managers managing USD 130 trillion in collective assets to deliver on their pledges. Investment support measures can play a critical role in ensuring this capital flows as required.

Investment Sizing India’s 2070 Net-Zero Target
Table 3 The 16 scenarios
Source: CEEW-CEF analysis and compilation based on Chaturvedi, Vaibhav, and Ankur Malyan. 2021. Implications of a net-zero target for India’s sectoral energy transitions and climate policy. New Delhi: Council on Energy, Environment and Water.
Note: For purposes of this issue brief, we have evaluated the four scenarios represented in the bottom left quadrant. The rationale: (a) limited
visibility at present on commercial viability and costs for CCS technologies; (b) deep decarbonisation will require high hydrogen penetration
in the absence of CCS.
Hydrogen Low
Hydrogen High
2030 (peak) – 2050 (net-zero)
2030 – 2060
2040 – 2070
2050 – 2080
2030 – 2050
2030 – 2060
2040 – 2070
2050 – 2080
2030 (peak) – 2050 (net-zero)
2030 – 2060
2040 – 2070
2050 – 2080
2030 – 2050
2030 – 2060
2040 – 2070
2050 – 2080
Carbon capture & storage No
Carbon capture & storage Yes
4
Net-zero’s appeal lies in its simplicity. It means gross emissions are matched by carbon sinks that can fully absorb them. These can be natural sinks, such as forests or soil carbon sequestration. They can also be man-made and achieved through technologies such as carbon capture and storage (CCS)—although almost no progress has been made to date on CCS despite two decades of promises from the fossil fuel industry (IEA,2020). In effect, net-zero does away with the subjective parameters in various NDCs, such as the choice of base year or the choice between reductions in total emissions and reductions in emissions intensity. It simplifies the debate around emissions using a common yardstick.
Even so, two questions remain. First, what does net-zero look like? Second, how much investment does it require? Both are vital to understanding the one variable in an otherwise uniform yardstick: the year by which a country can reasonably hope to achieve net-zero. However, to assess the feasibility of any net-zero target year, it is critical to fully appreciate the physical infrastructure needed as well as the associated financial requirements.
On 12 October 2021, CEEW released a working paper titled Implications of a Net-Zero Target for India’s Sectoral Energy Transitions and Climate Policy (Chaturvedi, Vaibhav, and Ankur Malyan. 2021). It uses the Global Change Analysis Model (GCAM, CEEW version) to generate sixteen sectoral pathways, or scenarios, under which India could achieve net-zero. It then evaluates these scenarios against a reference scenario. Each scenario is a distinct combination of two variables: the choice of peaking and net-zero years, and the degree of availability of two technologies (CCS and green hydrogen). Table 3 summarises the sixteen scenarios.
The scenarios generated by the model demonstrate how five key sectors—power, transport, industrial, building, and refinery—would need to evolve to cumulatively achieve net-zero. Under each scenario, and for each sector, the pathways generated comprise a combination of sectoral interventions. Table 4 highlights the interventions considered for new investment calculations in this issue brief.
2. Net-zero’s appeal 3. What does net-zero look like?

Investment Sizing India’s 2070 Net-Zero Target 5
Table 4 Sectoral interventions under each net-zero scenario
Source: CEEW-CEF analysis and compilation based on Chaturvedi, Vaibhav, and Ankur Malyan. 2021. Implications of a net-zero target for India’s sectoral energy transitions and climate policy. New Delhi: Council on Energy, Environment and Water.
Power
Transport
Industrial
Building
Refinery
• Quantity (units) of power generated by 13 generation types (solar, wind, etc). The supporting transmission and distribution, RE integration network required to supply the electricity.
• Volumes of 6 types (2W, 3W, 4W etc) of vehicles manufactured across EV, H2 and liquids and associated manufacturing capacities.
• Volume of H2 (tonnes) produced for industrial energy (heat and feedstock) and H2 powered vehicles and associated manufacturing capacities.
• Peak year for coal use, reduction in its use beyond peak year.
• Reduction in industrial energy intensity of GDP.
• Reduction in intensity of electricity use with respect to GDP.
• Peak year for crude oil consumption, reduction in its use beyond peak year.
Interventions considered for new investment Interventions not considered for new investment
Table 5 Model output & investment sizing assumptions
Source: CEEW-CEF analysis and compilation based on Chaturvedi, Vaibhav, and Ankur Malyan. 2021. Implications of a net-zero target for India’s sectoral energy transitions and climate policy. New Delhi: Council on Energy, Environment and Water.
Power
Transport
Industrial
• Quantity (units) of power generated by 13 generation types (solar, wind, etc).
• Volumes of 6 types (2W, 3W, 4W etc) of vehicle sold across EV, H2 and liquids.
• Volume of H2 (tonnes) produced for industrial energy (heat and feedstock) and H2 powered vehicles.
• GW capacity for each of the 13 generation types (solar, wind, etc).
• Investment required per MW capacity for each generation type in constant 2020 USD ‘000. And the supporting transmission and distribution, RE integration network required to supply the electricity.
• Investment required per vehicle type per million manufacturing capacity in constant 2020 USD ‘000 (Excludes investment in the development of charging infrastructure).
• Investment required per kg of H2 production capacity in constant 2020 USD ‘000.
Model generated output
Interventions considered for new investment Associated interventions
Investment sizing assumptions
How do we connect the dots from the required sectoral interventions to the quantum of investment needed to achieve them? Table 5 outlines the approach we used to
arrive at our investment sizing assumptions. We provide details of the model-generated interventions considered for new investments under each of the selected scenarios in Annexure 1. Details of investment sizing assumptions, which remain the same across scenarios, are in Annexure 2.
4. From interventions to investments

Investment Sizing India’s 2070 Net-Zero Target6
Table 6 Quantifying the investments
Source: CEEW-CEF analysis and compilation based on Chaturvedi, Vaibhav, and Ankur Malyan. 2021. Implications of a net-zero target for India’s sectoral energy transitions and climate policy. New Delhi: Council on Energy, Environment and Water.
Note: Amounts in constant 2020 USD billion
8,412
198
1,494
10,103
6,865
128
1,273
8,266
4,854
71
799
5,724
9,751
277
1,866
11,894
4,523
202
15
4,741
168
4
30
202
172
3
32
207
162
2
27
191
163
5
31
198
90
4
0
95
3,098
--
448
3,546
3,799
--
382
4,181
3,168
--
240
3,407
1,252
--
560
1,812
497
--
5
501
62
--
9
709
95
--
10
105
106
--
8
114
21
--
9
30
10
0
10
10
1,239
-
179
1,419
1,520
--
153
1,672
1,267
--
96
1,363
501
--
224
725
199
--
2
200
25
--
4
28
38
--
4
42
42
--
3
45
8
--
4
12
4
--
0
4
Total investment Investment gap Investment support
Power
Mobility
Industrial
Total 2040 peak - 2070 net-zero
Power
Mobility
Industrial
Total 2030 peak - 2060 net-zero
Power
Mobility
Industrial
Total 2030 peak - 2050 net-zero
Power
Mobility
Industrial
Total 2050 peak - 2080 net-zero
Power (until 2070)
Mobility (until 2070)
Industrial (until 2070)
Total Reference (until 2070)
Aggregate from 2020 till the respective net-zero year
Average annual from 2020 till the respective
net-zero year
Aggregate from 2020 till the respective net-zero year
Average annual from 2020 till the respective
net-zero year
Aggregate from 2020 till the respective net-zero year
Average annual from 2020 till the respective
net-zero year
We quantified total investment, investment gap, and investment support (as defined later) for the selected 2070 and the other scenarios. Table 6 provides a sector-wise breakdown until the respective net-zero year under the 2070 and other net-zero scenarios and the reference progress as usual scenario (until 2070). We provide details of total investment at a decade level in Annexure 3. Details of the methodology we used to arrive at our investment gap and investment support figures for the power and industrial sectors are in Annexure 4 and Annexure 5, respectively.
a) Total investment: The total capital that needs to be invested in physical infrastructure to achieve the net-zero scenario.
b) Investment gap: The gap between the total investment and what the banking, NBFC, and capital markets are able to muster.
c) Investment support: The support required to mobilise finance that bridges the investment gap.
5. Investment sizing

Investment Sizing India’s 2070 Net-Zero Target8
Annexure I Model-generated outputs
40
38
202
45
6
15
346
552
215
306
61
24
52
1,209
796
286
385
73
38
58
1,636
1,274
412
463
96
77
73
2,395
1,638
496
457
108
93
68
2,860
0.01
0.00
1.44
0.07
5.28
0.00
2.45
1.31
11.23
0.00
2.35
1.71
19.13
0.00
3.37
3.43
21.41
0.00
3.58
4.14
0.75
18.23
18.53
4.50
16.67
1.65
9.12
0.84
6.87
0.64
0.01
0.64
0.16
0.43
0.04
0.04
0.22
0.01
0.01
0.07
0.00
0.00
0.04
0.00
0.00
0.00
0.02
0.00
0.00
0.00
0.00
0.00
0.00
0.00
0.00
0.00
0.00
0.00
0.00
0.00
0.00
0.00
0.20
0.00
20.52
1.00
21.52
0.00
0.00
0.87
0.38
7.86
25.99
33.85
0.01
0.00
0.92
0.63
4.92
30.49
35.42
0.08
0.00
1.00
1.57
5.21
33.41
38.62
0.19
0.00
0.96
1.77
5.18
34.44
39.61
0 2.13 4.39 7.70 9.06
Reference 2020 2040 2050 2070 2080
Power (aggregate generating capacity GW)
Solar
Wind
Coal
Hydro
Nuclear
All other
Total
Mobility (annual vehicle sales in millions)
Electric
H2
Liquids
NG
Electric
Liquids
Electric
Liquids
NG
Electric
Liquids
NG
Electric
H2
Liquids
NG
Source: CEEW-CEF analysis and compilation based on Chaturvedi, Vaibhav, and Ankur Malyan. 2021. Implications of a net-zero target for India’s sectoral energy transitions and climate policy. New Delhi: Council on Energy, Environment and Water.
4W
2W
3W
Bus
Trucks
Table A1 Model generated outputs under Reference PAU scenario
Liquids vehicles
Other vehicles (Elec, NG and H2)
Total vehicles
Hydrogen (Production, million tonnes)
Annual production (million tonnes)

Investment Sizing India’s 2070 Net-Zero Target 9
40
38
202
45
6
15
346
547
213
320
61
23
40
1,205
780
281
409
73
36
31
1,610
3,965
1,267
6
96
157
23
5,515
6,414
1,911
0
108
221
6
8,660
0.01
0.00
1.44
0.07
5.28
0.00
2.45
1.32
8.15
0.01
2.34
1.72
19.87
0.25
2.79
3.18
24.31
1.08
1.74
2.65
0.75
18.23
18.51
4.50
16.67
1.66
9.75
0.34
7.48
0.02
0.01
0.64
0.16
0.43
0.04
0.04
0.22
0.01
0.01
0.07
0.00
0.00
0.05
0.00
0.00
0.00
0.02
0.00
0.00
0.00
0.00
0.00
0.00
0.00
0.00
0.00
0.00
0.00
0.00
0.00
0.00
0.00
0.20
0.00
20.52
1.00
21.52
0.00
0.00
0.87
0.40
7.86
25.98
33.84
0.02
0.00
0.89
0.66
4.90
27.46
32.36
0.90
0.31
0.17
0.62
3.30
34.95
38.25
2.17
0.83
0.00
0.00
1.76
38.58
40.34
0 7.29 27.64 75.84 128.72
2050 peak – 2080 net-zero 2020 2040 2050 2070 2080
Power (aggregate generating capacity GW)
Solar
Wind
Coal
Hydro
Nuclear
All other
Total
Mobility (annual vehicle sales in millions)
Electric
H2
Liquids
NG
Electric
Liquids
Electric
Liquids
NG
Electric
Liquids
NG
Electric
H2
Liquids
NG
Source: CEEW-CEF analysis and compilation based on Chaturvedi, Vaibhav, and Ankur Malyan. 2021. Implications of a net-zero target for India’s sectoral energy transitions and climate policy. New Delhi: Council on Energy, Environment and Water.
4W
2W
3W
Bus
Trucks
Table A2 Model generated outputs under 2050 peak - 2080 net-zero scenario
Liquids vehicles
Other vehicles (Elec, NG and H2)
Total vehicles
Hydrogen (Production, million tonnes)
Annual production (million tonnes)

Investment Sizing India’s 2070 Net-Zero Target10
40
38
202
45
6
15
346
540
211
335
61
23
35
1,205
1,689
558
169
73
69
53
2,611
5,631
1,793
0
96
226
8
7,753
6,462
1,950
0
108
272
6
8,797
0.01
0.00
1.44
0.07
5.28
0.00
2.45
1.31
8.24
0.01
2.20
1.67
22.41
0.28
1.70
2.25
24.09
1.07
1.76
2.78
0.75
18.23
18.49
4.52
17.20
1.18
9.91
0.02
7.48
0.02
0.01
0.64
0.16
0.43
0.04
0.04
0.24
0.00
0.00
0.07
0.00
0.00
0.05
0.00
0.00
0.00
0.02
0.00
0.00
0.00
0.00
0.00
0.00
0.00
0.00
0.00
0.00
0.00
0.00
0.00
0.00
0.00
0.20
0.00
20.52
1.00
21.52
0.00
0.00
0.87
0.39
7.88
25.96
33.84
0.02
0.01
0.70
0.59
4.09
27.99
32.08
1.92
0.52
0.00
0.00
1.73
37.37
39.10
2.32
0.90
0.00
0.00
1.78
38.70
40.48
0 7.18 40.14 114.48 134.84
2040 peak – 2070 net-zero 2020 2040 2050 2070 2080
Power (aggregate generating capacity GW)
Solar
Wind
Coal
Hydro
Nuclear
All other
Total
Mobility (annual vehicle sales in millions)
Electric
H2
Liquids
NG
Electric
Liquids
Electric
Liquids
NG
Electric
Liquids
NG
Electric
H2
Liquids
NG
Source: CEEW-CEF analysis and compilation based on Chaturvedi, Vaibhav, and Ankur Malyan. 2021. Implications of a net-zero target for India’s sectoral energy transitions and climate policy. New Delhi: Council on Energy, Environment and Water.
4W
2W
3W
Bus
Trucks
Table A3 Model generated outputs under 2040 peak - 2070 net-zero scenario
Liquids vehicles
Other vehicles (Elec, NG and H2)
Total vehicles
Hydrogen (Production, million tonnes)
Annual production (million tonnes)

Investment Sizing India’s 2070 Net-Zero Target 11
202
46
7
37
40
38
370
104
61
52
79
1,360
489
2,145
2
73
116
33
2,985
1,001
4,209
0
96
268
8
5,687
1,806
7,865
0
108
319
7
6,342
1,894
8,670
0.01
0.00
1.44
0.07
5.47
0.00
2.31
1.29
8.48
0.01
1.85
1.52
22.29
0.28
1.70
2.31
24.07
1.07
1.73
2.79
0.75
18.23
20.26
3.26
18.47
0.45
10.00
0.02
7.54
0.02
0.01
0.64
0.16
0.49
0.01
0.02
0.25
0.00
0.00
0.07
0.00
0.00
0.05
0.00
0.00
0.00
0.02
0.00
0.01
0.00
0.00
0.01
0.00
0.00
0.00
0.00
0.00
0.00
0.00
0.00
0.00
0.00
0.20
0.00
20.52
1.00
21.52
0.00
0.00
0.70
0.35
6.29
27.88
34.17
0.36
0.15
0.18
0.16
2.47
29.41
31.88
2.07
0.57
0.00
0.00
1.72
37.59
39.31
2.11
0.82
0.00
0.00
1.75
38.45
40.21
0 9.87 56.67 120.14 134.77
2030 peak – 2060 net-zero 2020 2040 2050 2070 2080
Power (aggregate generating capacity GW)
Coal
Hydro
Nuclear
Others
Solar
Wind
Total
Mobility (annual vehicle sales in millions)
Electric
H2
Liquids
NG
Electric
Liquids
Electric
Liquids
NG
Electric
Liquids
NG
Electric
H2
Liquids
NG
Source: CEEW-CEF analysis and compilation based on Chaturvedi, Vaibhav, and Ankur Malyan. 2021. Implications of a net-zero target for India’s sectoral energy transitions and climate policy. New Delhi: Council on Energy, Environment and Water.
4W
2W
3W
Bus
Trucks
Table A4 Model generated outputs under 2030 peak - 2060 net-zero scenario
Liquids vehicles
Other vehicles (Elec, NG and H2)
Total vehicles
Hydrogen (Production, million tonnes)
Annual production (million tonnes)

Investment Sizing India’s 2070 Net-Zero Target12
202
46
7
37
40
38
370
65
61
62
61
1,657
595
2,501
0
73
167
15
4,559
1,500
6,314
0
96
310
9
6,470
2,041
8,926
0
108
368
6
7,105
2,128
9,714
0.01
0.00
1.44
0.07
5.47
0.00
2.30
1.28
8.82
0.01
1.23
1.14
22.27
0.28
1.68
2.32
24.02
1.07
1.76
2.81
0.75
18.23
20.10
3.17
18.13
0.04
9.79
0.02
7.41
0.02
0.01
0.64
0.16
0.50
0.01
0.01
0.24
0.00
0.00
0.07
0.00
0.00
0.05
0.00
0.00
0.00
0.02
0.00
0.01
0.00
0.00
0.01
0.00
0.00
0.00
0.00
0.00
0.00
0.00
0.00
0.00
0.00
0.20
0.00
0.00
0.00
0.71
0.32
20.52
1.00
21.52
1.40
0.33
0.00
0.00
6.19
27.69
33.89
2.00
0.55
0.00
0.00
1.28
30.09
31.36
2.23
0.87
0.00
0.00
1.70
37.29
38.99
0 10.21 62.40 119.97 134.88
2030 peak – 2050 net-zero 2020 2040 2050 2070 2080
Power (aggregate generating capacity GW)
Coal
Hydro
Nuclear
Others
Solar
Wind
Total
Mobility (annual vehicle sales in millions)
Electric
H2
Liquids
NG
Electric
Liquids
Electric
Liquids
NG
Electric
Liquids
NG
Electric
H2
Liquids
NG
Source: CEEW-CEF analysis and compilation based on Chaturvedi, Vaibhav, and Ankur Malyan. 2021. Implications of a net-zero target for India’s sectoral energy transitions and climate policy. New Delhi: Council on Energy, Environment and Water.
4W
2W
3W
Bus
Trucks
Table A5 Model generated outputs under 2030 peak - 2050 net-zero scenario
Liquids vehicles
Other vehicles (Elec, NG and H2)
Total vehicles
Hydrogen (Production, million tonnes)
Annual production (million tonnes)

Investment Sizing India’s 2070 Net-Zero Target
4We
2We
3We
Buse
Trucke
Solar-basedf
Wind-basedf
Grid-basedf
13
Annexure II Investment sizing assumptions
400
979
-
3,851
29.8
42.6
15
280
903
1,723
3,851
51 to 72
15.3
24.3
8.1
USD 64/MWh
USD 91/MWh
270
867
1,723
3,851
63 to 88
9.76
21.61
4.54
270
816
1,723
3,851
63 to 88
9.76
21.61
4.54
270
816
1,723
3,851
63 to 88
9.76
21.61
4.54
232
11.76
9.95
394
394
2020 2040 2050 2070 2080
Source: CEEW-CEF analysis and compilation based on Chaturvedi, Vaibhav, and Ankur Malyan. 2021. Implications of a net-zero target for India’s sectoral energy transitions and climate policy. New Delhi: Council on Energy, Environment and Water.
Note:
(a) The per MW cost estimates of solar, wind and coal deployment, nuclear are based on a CEEW-CEF compilation and market research; for hydro, we have used the IIT-Roorkee estimates of costs (IIT-Roorkee, 2015). Costs for all other technologies are also considered, but not depicted above given their relatively minor contribution to investment requirements.
(b) The integration cost is assumed to be USD 43-63 for 1 KW of solar and USD 60-78 for 1KW of wind capacity deployed from 2026 onwards.
(c) The distribution investment requirement assumes an annual investment of INR 0.19/unit based on the gross assets deployed at the national level from 2017 to 2020, based on the PFC report on the performance of state power utilities in 2020 and 2019 (PFC, 2021, 2020, 2021). ((INR 0.19 x 1000)/(73 INR/USD)) x 25 years life = USD 64/MWh.
(d) The transmission investment requirement is taken to be INR 0.27/unit of electricity supplied annually for the period of analysis. The charge is equivalent to 31 per cent of the transmission charges of the INR 0.85/unit transmission charges in FY20 as per the report, Analysis of Factors Impacting Retail Tariff and Measures to Address Them, by the Forum of Regulators. ((INR 0.27 x 1000)/(73 INR/USD)) x 25 years life = USD 91/MWh.
(e) The EV benchmark investment costs for producing per million vehicles have been derived using the balance sheets of prominent players in the respective segments and the methodology described in the CEEW report, Financing India’s Transition to Electric Vehicles (Singh, Vaibhav et al. 2020). The fixed costs (including R&D) and the annual production capacity have been used to derive the benchmarks, and the depreciation has been used to approximate the useful life of the assets.
(f) The investments related to hydrogen are based on estimates as under the CEEW report titled “A Green Hydrogen Economy for India: Policy and Technology Imperatives to Lower Production Cost” (Biswas, Tirtha, Deepak Yadav and Ashish Guhan.2020.). The hydrogen numbers are assumed constant post 2050.
Common assumptions for reference and four net-zero scenarios
Hydrogen (constant 2020 USD investment required per kg of hydrogen production capacity with a 25 year life)
Power (constant 2020 USD 000 per MW)
Solara
Winda
Coal (IGCC)a
Nuclear (Gen III)a
RE integrationb
Distributionc
Transmissiond
Mobility (constant 2020 USD million manufacturing capacity cost per million production for all technologies)
Table A6 Investment sizing assumptions used for the reference and analysed net-zero scenarios

Investment Sizing India’s 2070 Net-Zero Target14
Annexure III Total investment
Power
Generation
Integration
T&D
Power Total
Mobility
Hydrogen
Total
Power
Generation
Integration
T&D
Power Total
Mobility
Hydrogen
Total
Power
Generation
Integration
T&D
Power Total
Mobility
Hydrogen
Total
Power
Generation
Integration
T&D
Power Total
Mobility
Hydrogen
Total
Power
Generation
Integration
T&D
Power Total
Mobility
Hydrogen
Total
382
8
133
523
13
1
537
380
8
132
520
13
9
542
380
8
132
520
13
9
542
390
8
132
530
13
9
552
400
10
32
542
13
11
566
538
26
220
783
25
2
810
547
25
221
794
25
62
881
560
25
223
808
25
59
893
1,164
86
241
1,490
24
137
1,651
1,305
101
248
1,654
24
145
1,823
526
33
318
876
40
3
919
502
32
317
851
36
237
1,124
1,144
112
346
1,602
35
421
2,057
1,455
158
429
2,043
34
574
2,650
1,910
226
522
2,657
34
643
3,334
685
49
402
1,136
56
4
1,195
1,290
137
432
1,859
54
266
2,180
1,648
196
525
2,369
54
386
2,809
1,819
232
752
2,802
57
554
3,413
1,284
166
831
2,281
55
457
2,793
674
54
476
1,205
69
6
1,279
1,705
216
620
2,541
67
408
3,016
1,954
264
895
3,113
70
619
3,802
1,594
218
1,006
2,818
69
391
3,278
1,772
244
1,014
3,030
70
474
3,574
715
66
542
1,323
78
7
1,408
1,898
273
1,015
3,185
81
885
4,151
1,458
211
1,146
2,815
80
578
3,473
1,639
239
1,156
3,034
80
835
3,948
1,609
234
1,155
2,999
80
773
3,852
3,520
236
2,091
5,846
281
22
6,149
6,321
691
2,739
9,751
277
1,866
11,894
7,144
815
3,268
11,227
277
2,071
13,575
8,060
940
3,716
12,716
277
2,500
15,493
8,280
982
3,902
13,163
276
2,503
15,942
2020-30 2030-40 2040-50 2050-60 2060-70 2070-80 Total
Source: CEEW-CEF analysis
Note: Amounts in constant 2020 USD billion
(i) Reference
(ii) 2050 peak – 2080 net-zero
(iii) 2040 peak – 2070 net-zero
(iv) 2030 peak – 2060 net-zero
(v) 2030 peak – 2050 net-zero
Table A7 Total investments needed for power, mobility and hydrogen under different scenarios

Investment Sizing India’s 2070 Net-Zero Target
Annexure IV Investment gap & support (power sector)
Source: CEEW-CEF analysis
Note:
a. Total banking/NBFC exposure to the power sector as of March 2020 was estimated to be USD 168 billion (Garg, Shreyas, Rishabh Jain and Gagan Sidhu. 2021). This represents a 8 per cent share of the total loan books of Indian Banks and NBFCs, which was estimated to be USD 2.15 trillion (CRIF High Mark, 2021). Headroom is calculated by applying a 5 per cent annual growth rate to USD 168 billion, and assuming a 6 per cent annual principal repayment factor.
b. The total corporate domestic bond market stood at USD 452 billion as of March 2021 (Source: CRISIL Yearbook on the Indian Debt Market 2021). To derive the power sector’s share, we have applied the same 8 per cent share that power sector loans represent of total loan books of Indian Banks and NBFCs. This comes to USD 36 billion. Headroom is calculated by applying a 5 pe cent annual growth rate to USD 36 billion, and assuming a 10 per cent annual principal repayment factor (assumed average remaining life of the loan being refinanced).
c. The base for international bond market flows has been estimated to be USD 10 billion. This is based on 3x of the estimated USD 3.5 billion of international bond capital that flowed into Indian RE from January to June 2021 (Garg, Shreyas, Rishabh Jain and Gagan Sidhu. 2021). Headroom is calculated by applying a 5 per cent annual growth rate to USD 10 billion, and assuming a 10 per cent annual principal repayment factor.
d. Amounts in constant 2020 USD billion.
Total investment
Less banking/NBFC headrooma
Less domestic bond marketb Headroom
Less int’l bond market Headroomc
Investment gap
Annualised finance requirements
Investment support (Finance sought to cover the hedging costs at 4%)
Total investment
Less banking/NBFC headrooma
Less domestic bond marketb Headroom
Less int’l bond market Headroomc
Investment gap
Annualised finance requirements
Investment support (Finance sought to cover the hedging costs at 4%)
Total investment
Less banking/NBFC headrooma
Less domestic bond marketb Headroom
Less int’l bond market Headroomc
Investment gap
Annualised finance requirements
Investment support (Finance sought to cover the hedging costs at 4%)
Total investment
Less banking/NBFC headrooma
Less domestic bond marketb Headroom
Less int’l bond market Headroomc
Investment gap
Annualised finance requirements
Investment support (Finance sought to cover the hedging costs at 4%)
Total investment
Less banking/NBFC headrooma
Less domestic bond marketb Headroom
Less int’l bond market Headroomc
Investment gap
Annualised finance requirements
Investment support (Finance sought to cover the hedging costs at 4%)
(A)
(B)
(C)
(D)
E= A-B-C-D
(F)= E/10
(G)= 4%*E
(A)
(B)
(C)
(D)
E= A-B-C-D
(F)= E/10
(G)= 4%*E
(A)
(B)
(C)
(D)
E= A-B-C-D
(F)= E/10
(G)= 4%*E
(A)
(B)
(C)
(D)
E= A-B-C-D
(F)= E/10
(G)= 4%*E
(A)
(B)
(C)
(D)
E= A-B-C-D
(F)= E/10
(G)= 4%*E
523
232
68
19
204
20
8
520
232
68
19
201
20
8
520
232
68
19
201
20
8
530
232
68
19
211
21
8
542
232
68
19
223
22
9
783
379
111
31
263
26
11
794
379
111
31
274
27
11
808
379
111
31
288
29
12
1,490
379
111
31
970
97
39
1,654
379
111
31
1,135
113
45
876
617
180
50
29
3
1
851
617
180
50
4
0
0
1,602
617
180
50
755
75
30
2,043
617
180
50
1,195
120
48
2,657
617
180
50
1,810
181
72
1,136
1,005
294
82
Negative
Negative
Negative
1,859
1,005
294
82
480
48
19
2,369
1,005
294
82
989
99
40
2,802
1,005
294
82
1,422
142
57
2,281
1,005
294
82
901
90
36
1,205
1,636
478
133
Negative
Negative
Negative
2,541
1,636
478
133
294
29
12
3,113
1,636
478
133
865
87
35
2,818
1,636
478
133
570
57
23
3,030
1,636
478
133
783
78
31
1,323
2,665
779
216
Negative
Negative
Negative
3,185
2,665
779
216
Negative
Negative
Negative
2,815
2,665
779
216
Negative
Negative
Negative
3,034
2,665
779
216
Negative
Negative
Negative
2,999
2,665
779
216
Negative
Negative
Negative
5,846
6,534
1,909
530
497
9,751
6,534
1,909
530
1,252
11,227
6,534
1,909
530
3,098
12,716
6,534
1,909
530
4,369
13,163
6,534
1,909
530
4,852
2020-30 2030-40 2040-50 2050-60 2060-70 2070-80 Total(i) Reference
(ii) 2050 peak – 2080 net-zero
(iii) 2040 peak – 2070 net-zero
(iv) 2030 peak – 2060 net-zero
(v) 2030 peak – 2050 net-zero
15
Table A8 Breakdown of investment required, gap and support needed by power sector

Investment Sizing India’s 2070 Net-Zero Target16
Annexure V Investment gap & support (industrial sector)
Source: CEEW-CEF analysis
Note:
a. In the absence of any data pertaining to the share of investments in green H2 and H2 production by electrolysis, we assume the banking and NBFC share in investment needs to be 40 per cent. We also assume that domestic bond and international bond market sources will be able to meet 20 per cent and 10 per cent of the investment needs for H2-related investments.
b. Amounts in constant 2020 USD billion
Total investment
Less banking/NBFC potential or headroom
Less domestic bond market and other sources
Less int’l bond market inflows
Investment gap
Annualised finance requirements
Investment support (Finance sought to cover the hedging costs at 4%)
Total investment
Less banking/NBFC potential or headroom
Less domestic bond market and other sources
Less int’l bond market inflows
Investment gap
Annualised finance requirements
Investment support (Finance sought to cover the hedging costs at 4%)
Total investment
Less banking/NBFC potential or headroom
Less domestic bond market and other sources
Less int’l bond market inflows
Investment gap
Annualised finance requirements
Investment support (Finance sought to cover the hedging costs at 4%)
Total investment
Less Banking/NBFC potential or headroom
Less domestic bond market and other sources
Less int’l bond market inflows
Investment gap
Annualised finance requirements
Investment support (Finance sought to cover the hedging costs at 4%)
Total investment
Less banking/NBFC potential or headroom
Less domestic bond market and other sources
Less int’l bond market inflows
Investment gap
Annualised finance requirements
Investment support (Finance sought to cover the hedging costs at 4%)
(A)
(B) =40% *A
(C) = 20%*A
(D) =10% *A
(E)= A-B-C-D
(F) =E/10
(G)=4% *(E)
(A)
(B) =40% *A
(C) = 20%*A
(D) =10% *A
(E)= A-B-C-D
(F) =E/10
(G)=4% *(E)
(A)
(B) =40% *A
(C) = 20%*A
(D) =10% *A
(E)= A-B-C-D
(F) =E/10
(G)=4% *(E)
(A)
(B) =40% *A
(C) = 20%*A
(D) =10% *A
(E)= A-B-C-D
(F) =E/10
(G)=4% *(E)
(A)
(B) =40% *A
(C) = 20%*A
(D) =10% *A
(E)= A-B-C-D
(F) =E/10
(G)=4% *(E)
1
0.4
0.2
0.1
0.3
0.03
0.0
9
3
2
1
3
0
0
9
3
2
1
3
0
0
9
4
2
1
3
0
0
11
4
2
1
3
0
0
2
0.8
0.4
0.2
0.6
0.06
0.0
62
25
12
6
19
2
1
59
24
12
6
18
2
1
137
55
27
14
41
4
2
145
58
29
14
43
4
2
3
1.0
0.5
0.3
0.8
0.08
0.0
237
95
47
24
71
7
3
421
168
84
42
126
13
5
574
229
115
57
172
17
7
643
257
129
64
193
19
8
4
1.5
0.8
0.4
1.1
0.11
0.0
266
107
53
27
80
8
3
386
154
77
39
116
12
5
554
222
111
55
166
17
7
457
183
91
46
137
14
5
6
2.3
1.1
0.6
1.7
0.17
0.1
408
163
82
41
122
12
5
619
247
124
62
186
19
7
391
157
78
39
117
12
5
474
190
95
47
142
14
6
7
2.6
1.3
0.7
2.0
0.20
0.1
885
354
177
88
265
27
11
578
231
116
58
173
17
7
835
334
167
84
251
25
10
773
309
155
77
232
23
9
22
9
4
2
7
1,866
747
373
187
560
2,071
828
414
207
621
2,500
1,000
500
250
750
2,503
1,001
501
250
751
2020-30 2030-40 2040-50 2050-60 2060-70 2070-80 Total(i) Reference
(ii) 2050 peak – 2080 net-zero
(iii) 2040 peak – 2070 net-zero
(iv) 2030 peak – 2060 net-zero
(v) 2030 peak – 2050 net-zero
Table A9 Breakdown of investment required, gap and support needed by Industrial sector

Investment Sizing India’s 2070 Net-Zero Target 17
References
Dutt, Arjun. 2021. “Advancing Article 6 Negotiations: A Proposal to Resolve the Certified Emissions Reductions (CERs) Transition Deadlock” Accessed Oct 2021. https://cef.ceew.in/solutions-factory/publications/ceew_cef-advancing_article_6_ne-gotiations.
UNCCC UK. 2021. “COP26 Presidency Compilation of 2021-2025 Climate Finance Commitments”. Ac-cessed Oct 2021. https://ukcop26.org/wp-content/uploads/2021/09/21-09-28-Table-of-climate-fi-nance-commitments-Online-version.pdf.
UNEP.2021. “Global insurance and reinsurance lead-ers establish alliance to accelerate transition to net-zero emissions economy” Accessed Oct 2021. https://www.unep.org/news-and-stories/press-re-lease/global-insurance-and-reinsurance-lead-ers-establish-alliance.
UNFCCC.2021 “Updated or new NDCs submitted” Accessed Oct 2021. https://unfccc.int/pro-cess-and-meetings/the-paris-agreement/the-par-is-agreement/nationally-determined-contrinu-tions-ndcs/NDC-submissions.
Nandi, Jayashree. 2021 “India likely to update Cli-mate NDC ahead of COP26” Accessed Oct 2021. https://www.hindustantimes.com/india-news/india-likely-to-update-climate-ndc-ahead-of-cop26-101632856440281.html.
IEA.2020 ”CCUS in Clean Energy Transitions” Ac-cessed Oct 2021. https://www.iea.org/reports/ccus-in-clean-energy-transitions.
Chaturvedi, Vaibhav, and Ankur Malyan. 2021. “Impli-cations of a net-zero target for India’s sectoral energy transitions and climate policy” Accessed Oct 2021. https://www.ceew.in/publications/implications-of-net-zero-target-for-indias-sec-toral-energy-transitions-and-climate-policy.
IIT Roorkee. 2015 “Benchmark costs for small and large hydro projects” Accessed Oct 2021. https://www.iitr.ac.in/departments/HRE/uploads/pdf/SHP_Benchmark_Cost_Report_Aug_2015.pdf.
PFC. 2021 “Report on Performance of Power utilities 2019-20” Accessed Oct 2021. https://www.pfcin-
dia.com/DocumentRepository/ckfinder/files/Operations/Performance_Reports_of_State_Pow-er_Utilities/Report_on_Performance_of_Pow-er_Utilities_2019_20_29092021.pdf.
PFC. 2020 “Report on Performance of state Power utilities 2018-19” Accessed Oct 2021. https://www.pfcindia.com/DocumentRepository/ckfinder/files/Operations/Performance_Reports_of_State_Pow-er_Utilities/Report%20on%20Performance%20of%20State%20Power%20Utilities%202018-19.pdf.
PFC. 2019 “Report on Performance of State Power utilities 2017-18” Accessed Oct 2021. https://www.pfcindia.com/DocumentRepository/ckfinder/files/Operations/Performance_Reports_of_State_Pow-er_Utilities/Report_on_Performance_of_State_Power_Utilities_%202017_18.pdf.
Singh, Vaibhav, et al. 2020. “Financing India’s Tran-sition to Electric Vehicles: A USD 206 Billion Market Opportunity (FY21 - FY30)”. Accessed Oct 2021. https://cef.ceew.in/solutions-factory/publications/CEEW-CEF-financing-india-transi-tion-to-electric-vehicles.pdf.
Garg, Shreyas, Rishabh Jain and Gagan Sidhu. 2021 “Financing India’s Energy Transition Through International Bond Markets”. Accessed Oct 2021. https://cef.ceew.in/solutions-factory/publica-tions/CEEW-CEF-financing-india-energy-transi-tion-through-international-bond-markets.pdf.
CRIF High Mark.2021 “How India Lends FY2021” Ac-cessed Oct 2021. https://www.crifhighmark.com/media/2362/how-india-lends-fy2021.pdf.
Biswas, Tirtha, Deepak Yadav and Ashish Guhan.2020. “A Green Hydrogen Economy for India: Policy and Technology Imperatives to Lower Production Cost” Accessed Oct 2021. https://www.ceew.in/sites/default/files/CEEW-A-Green-Hydrogen-Econ-omy-for-India-14Dec20.pdf.
GFANZ.2021. “Amount of finance committed to achiev-ing 1.5°C now at scale needed to deliver the tran-sition” Accessed Nov 21. https://www.gfanzero.com/press/amount-of-finance-committed-to-achieving-1-5c-now-at-scale-needed-to-deliver-the-transition/.

Investment Sizing India’s 2070 Net-Zero Target
For queries contact
Vaibhav Pratap Singh | @[email protected]
Vaibhav is a Programme Lead with the CEEW Centre for Energy Finance (CEEW-CEF). His focus is on developing financing pathways to advance the energy transition. Before joining CEEW, he was with the Climate Policy Initiative, where he designed financial instruments. Prior to that, he worked with CARE Ratings, where he oversaw ratings of banks and the NBFC sector.
Gagan Sidhu [email protected]
Gagan is the Director of CEEW-CEF, where his focus is on advancing the energy transition. Before joining CEEW, he was CFO of GMR Renewable Energy, and before that he worked in the investment banking industry across multiple geographic locations, including Tokyo, Singapore, London, and Dubai. Gagan holds a BA (Hons) degree in Economics from Delhi University’s Shri Ram College of Commerce, and an MBA from Duke University.
Copyright © 2021 Council on Energy, Environment and Water (CEEW).
Open access. Some rights reserved. This work is licensed under the Creative Commons Attribution Non-commercial 4.0. International (CC BY-NC 4.0) license. To view the full license, visit: www.creativecommons.org/licenses/by-nc/4.0/legalcode.
Suggested citation: Singh, Vaibhav, and Gagan Sidhu. 2021. Investment Sizing India’s 2070 Net-Zero Target. New Delhi: Council on Energy, Environment and Water.
Disclaimer: The views expressed in this study is that of the authors. They do not necessarily reflect the views and policies of the Council on Energy, Environment and Water.
Peer reviewers: Manish Shakdwipee, Executive Director, MSCI ESG Research LLC; Raghav Anand, Senior Associate, RMI; Tim Buckley, Director Energy Finance Studies Australia/South Asia, IEEFA; Arjun Dutt, Programme Lead, CEEW- Centre for Energy Finance (CEEW-CEF) and Dr Vaibhav Chaturvedi, Fellow, Council on Energy, Environment and Water (CEEW).
Acknowledgment: We would like to thank Arjun Dutt, Programme Lead, CEEW-CEF, for his detailed comments on the climate finance methodology. We also extend our appreciation to Dr Vaibhav Chaturvedi, Fellow, CEEW, and Ankur Malyan, Programme Associate, CEEW, for providing detailed suggestions and helping us with the model-generated outputs we used for our analysis. Their valuable inputs shaped our research significantly.
Organisation: The Council on Energy, Environment and Water (CEEW) is one of Asia’s leading not-for-profit policy research institutions. The Council uses data, integrated analysis, and strategic outreach to explain – and change – the use, reuse, and misuse of resources. It prides itself on the independence of its high-quality research, develops partnerships with public and private institutions, and engages with wider public. In 2021, CEEW once again featured extensively across ten categories in the 2020 Global Go To Think Tank Index Report. The Council has also been consistently ranked among the world’s top climate change think tanks. CEEW is certified as a Great Place To Work®. Follow us on Twitter @CEEWIndia for the latest updates.
The CEEW Centre for Energy Finance (CEEW-CEF) is an initiative of the Council on Energy, Environment and Water (CEEW), one of Asia’s leading think tanks. CEF acts as a non-partisan market observer and driver that monitors, develops, tests, and deploys financial solutions to advance the energy transition. It aims to help deepen markets, increase transparency, and attract capital in clean energy sectors in emerging economies. It achieves this by comprehensively tracking, interpreting, and responding to developments in the energy markets while also bridging gaps between governments, industry, and financiers.
COUNCIL ON ENERGY, ENVIRONMENT AND WATER (CEEW)
Sanskrit Bhawan, A-10, Qutab Institutional AreaAruna Asaf Ali Marg, New Delhi - 110067, IndiaT: +91 (0) 11 4073 3300
[email protected] | ceew.in | @CEEWIndia | ceewindia
The authors