Investment in Tertiary Education: Main Determinants and Implications for Policy
36
Investment in Tertiary Education: Main Determinants and Implications for Policy Romina Boarini, Joaquim Oliveira Martins, Hubert Strauss, Christine de la Maisonneuve and Giuseppe Nicoletti Abstract Many OECD countries are aiming to reform their tertiary education (TE) systems. This work explores the determinants of the investment in TE, with a focus on institutional setting of TE systems and private incentives to undertake years of schooling beyond upper- secondary degree level. For this purpose the article first develops estimates of three main drivers of graduation patterns, namely institutional arrangements of TE supply, availability of funding for TE students and private returns to tertiary studies. Second, the article empirically assesses how these three factors affect graduation ratios. Based on this analysis, the article then discusses policy-levers of TE investment and explores possible routes of reform for TE systems in OECD countries. The main findings are as follows: graduation ratios increase with private returns to TE as well with the autonomy and accountability of the supply of education. Lack or insufficient financial help to tertiary students negatively affects graduation ratios. There is a number of policy-levers to stimulate investment in TE. They include policies affecting labour market premia, the degree of flexibility of TE provision and the availability of funding for students. (JEL codes: I21, I22, I28, J24) Keywords: Investment in tertiary education, returns to education, supply of tertiary education. 1 Introduction Tertiary Education (TE) is a key asset in knowledge-based economies: tertiary educated workers stimulate economy-wide productivity and growth, and are crucial for innovation and the use of new technologies (Aghion and Cohen 2004; Vandenbussche, Aghion and Meghir 2006). The role of higher education has often provided the case for massive public funding and regulation of this sector in many OECD countries. Yet, rising dissatisfaction with the performance of TE outcomes in a number of OECD countries has increasingly questioned the scope and the OECD Economics Department, 2 rue Andre´-Pascal, 75775 Paris Cedex 16, France. Corresponding authors are Romina Boarini, e-mail: [email protected] and Joaquim Oliveira Martins, e-mail: [email protected]. Hubert Strauss was previously at the OECD Economics Department and is currently at the European Investment Bank. We would like to thank Jorgen Elmeskov for useful comments, Laura Vartia, Jens Arnold and Clarice Saadi for assistance, as well as Paulo Santiago, Thomas Veko and Eric Charbonnier from the OECD Directorate for Education for comments and data support. The views expressed here are those of the authors and do not necessarily represent those of the OECD or its Member countries. ß The Author 2008. Published by Oxford University Press on behalf of Ifo Institute for Economic Research, Munich. All rights reserved. For permissions, please e-mail: [email protected] 277 CESifo Economic Studies, Vol. 54, 2/2008, 277–312, doi:10.1093/cesifo/ifn017
Transcript of Investment in Tertiary Education: Main Determinants and Implications for Policy

Investment in Tertiary Education: Main Determinants
and Implications for Policy
Romina Boarini, Joaquim Oliveira Martins, Hubert Strauss,Christine de la Maisonneuve and Giuseppe Nicoletti
Abstract
Many OECD countries are aiming to reform their tertiary education (TE) systems. This work
explores the determinants of the investment in TE, with a focus on institutional setting of
TE systems and private incentives to undertake years of schooling beyond upper-
secondary degree level. For this purpose the article first develops estimates of three main
drivers of graduation patterns, namely institutional arrangements of TE supply, availability
of funding for TE students and private returns to tertiary studies. Second, the article
empirically assesses how these three factors affect graduation ratios. Based on this
analysis, the article then discusses policy-levers of TE investment and explores possible
routes of reform for TE systems in OECD countries. The main findings are as follows:
graduation ratios increase with private returns to TE as well with the autonomy and
accountability of the supply of education. Lack or insufficient financial help to tertiary
students negatively affects graduation ratios. There is a number of policy-levers to stimulate
investment in TE. They include policies affecting labour market premia, the degree of
flexibility of TE provision and the availability of funding for students. (JEL codes: I21, I22,
I28, J24)
Keywords: Investment in tertiary education, returns to education, supply of tertiary
education.
1 Introduction
Tertiary Education (TE) is a key asset in knowledge-based economies:tertiary educated workers stimulate economy-wide productivity andgrowth, and are crucial for innovation and the use of new technologies(Aghion and Cohen 2004; Vandenbussche, Aghion and Meghir 2006).The role of higher education has often provided the case for massivepublic funding and regulation of this sector in many OECD countries.Yet, rising dissatisfaction with the performance of TE outcomes in anumber of OECD countries has increasingly questioned the scope and the
OECD Economics Department, 2 rue Andre-Pascal, 75775 Paris Cedex 16, France.Corresponding authors are Romina Boarini, e-mail: [email protected] andJoaquim Oliveira Martins, e-mail: [email protected]. Hubert Strauss waspreviously at the OECD Economics Department and is currently at the EuropeanInvestment Bank.
We would like to thank Jorgen Elmeskov for useful comments, Laura Vartia, JensArnold and Clarice Saadi for assistance, as well as Paulo Santiago, Thomas Veko and EricCharbonnier from the OECD Directorate for Education for comments and data support.The views expressed here are those of the authors and do not necessarily represent those ofthe OECD or its Member countries.
� The Author 2008. Published by Oxford University Presson behalf of Ifo Institute for Economic Research, Munich. All rights reserved.For permissions, please e-mail: [email protected] 277
CESifo Economic Studies, Vol. 54, 2/2008, 277–312, doi:10.1093/cesifo/ifn017

forms of public intervention. Calls for reform have been motivated by lowquality and the excessive duration of studies, the substantial drop-out andthe loose matching between qualifications and labour market-specificneeds (Jacobs and van der Ploeg 2006). In this context, OECD countriesface two main related challenges: how to make the most of publicexpenditure in TE and how to increase the overall resources invested in TEwithout further hinging on the public sector.Against this background, this article aims at informing TE reform on
several aspects. First, it documents TE outcomes, including the labourmarket rewards accruing to graduates. Second, it explores how policiesand institutions affect private incentives to invest in tertiary humancapital, the ability of individuals to finance this investment and thecharacteristics of university systems. Third, it provides some illustrativediscussion of the possible routes of actions to reform TE system. Inparticular, the article provides guidelines on the governance of TEinstitutions and argues for flanking policies to the possible increase ofprivate participation in the sector, with the objective of preserving orenhancing equality of access to higher education.In assessing how policies can affect accumulation of tertiary human
capital, the article draws on the extensive economic literature on thedeterminants of investment in TE. Traditionally, this literature hasfocused on demand-side determinants of investment (e.g. Becker 1967;Freeman 1986; Heckman, Lochner and Todd 2005) and, more recently, onthe role of the supply structure (e.g. Rostchild and White 1995; Epple,Romano and Sieg 2006). Along these lines, we develop a number ofindicators measuring the main demand-side investment determinants,namely the private rates of return to TE and the availability of individualfinancing. The role of TE supply side is assessed through specificindicators built to capture selected features of the institutional set-up ofTE sector, such as the degree of autonomy, flexibility and accountabilityof universities. The article then tests for an empirical relationship betweeninvestment in TE, as measured by graduation rates, and its main demand-side and supply-side determinants. In this context, various issues areexplored, as for instance, the relationship between short-term incentivesto undertake higher education and the long-run feedbacks from the labourmarkets.Main findings of the article are as follows: countries with incentive-
based TE systems (i.e. characterized by higher educational input andoutput flexibility and higher accountability) display higher graduationratios than countries with centralized and administrative-based systems.Private incentives to invest, measured by internal rates of return (IRR)reflecting net labour market premia, net replacement income and costsof education, are also positively related to the accumulation of tertiary
278 CESifo Economic Studies, 54, 2/2008
R. Boarini et al.

human capital. High tuition fees do not systematically lead to lower
accumulation of human capital, when comprehensive and consistent
funding systems are put in place to defray schooling and living costs for
students and when side-effects from greater reliance on household sector
lead to efficiency gains in TE systems (e.g. through lower study duration
and strengthened competition in the TE sector). From these results, the
main policy conclusions of this work are that OECD countries with
low levels of investment in TE can increase graduation patterns by:
(i) increasing returns to education, through specific policy-levers; (ii)
making individuals aware of both the cost and future returns of their
investment; (iii) further development of individual funding system together
with increased private participation in the TE sector and (iv) allowing for
more autonomy and enhancing accountability in the TE sector.
Reforming TE systems along these lines implies costs and trade-offs
with other policy objectives, which vary from country to country and with
the mix of policy options retained. While this article does not address the
latter issues explicitly, it often argues that consistent and simultaneous
policy measures are needed to achieve efficient and equitable TE systems.The article is organized as follows. Section 1 describes some stylized
facts on TE outcomes in OECD countries. Section 2 presents the
analytical framework and discusses some pieces of the literature on
determinants of graduation ratios. Section 3 discusses the key features of
supply of TE in OECD countries and describes a summary indicator.
Section 4 presents estimates of internal returns to TE. Section 5 discusses
the affordability of TE in presence of financial market imperfections and
presents an indicator measuring the availability of funding for tertiary
studies. Section 6 empirically assesses the impact of the demand and
supply indicators estimated on graduation ratios. Section 7 builds on these
empirical findings to draw policy recommendations. Section 8 concludes.
2 Cross-country differences in TE outcomes
We define investment in TE as the number of new graduates (ISCED-5/6)1
and expressed as a share of the cohorts of age 20–29.2 This measure is
harmonized across countries in that graduates are recorded by their
highest degree achieved. Thus, it makes it possible to look at the
determinants of TE investment in countries with different structure of TE
1 ISCED-5 includes Tertiary-type A programmes and the more vocationally orientedTertiary-type B programmes. ISCED-6 refers to advanced research qualifications, such asPhDs (OECD 2004b).
2 See Oliveira et al. (2007) for details about the construction of this variable.
CESifo Economic Studies, 54, 2/2008 279
Investment in Tertiary Education

studies (e.g length and type of programmes). However, it is purelyquantitative and neither accounts for the quality dimension of theinvestment, nor for its composition (i.e. TE fields). We choose to focus onthe flow of the investment in TE rather than the stock of human capital,since factors other than current policy and TE settings could have abearing on the latter. These factors are beyond the scope of this study,which is identifying the possible policy-levers of the investment.During the last two decades, graduation ratios have strongly progressed
in the OECD area, particularly so at the turn of the century. The increasein TE investment has been impressive for women, with female graduatesalmost doubling between 1994 and 2004 (Figure 1). This pattern reflects alikely catching-up with men in terms of the underlying stock of graduates.However, the companion paper Oliveira Martins et al. (2007) shows thatthe composition of investment across genders is still pretty uneven, withwomen graduating relatively more in Education, Health & Welfare andHumanities & Arts, while men’s degrees being more concentrated inScience and Engineering. The accumulation of tertiary human capital hasalso been unequal among OECD countries, as shown in Figure 2. Despitea general tendency to increasing TE investment, differences in graduationratios level remain substantial among OECD countries: New Zealand, forinstance, records almost eight times as many tertiary graduates as Turkeyand four times as many as Greece. Another interesting feature ofgraduation patterns over the 90s and early 2000s is that several smallOECD countries have recorded stronger increases than big OECDcountries with historically high levels of human capital. This is the caseof Korea, New Zealand or Ireland, where investment in TE has beenhigher than in the United States or Canada.
3 Structural and policy determinants of investment in TE:
a short literature review
The economic literature has put forward several demand-side determi-nants of investment in TE (see Becker 1967; Freeman 1986 for a seminalreview and Heckman, Lochner and Todd 2005, for a survey on recentdevelopments). These include: (i) the standard model where investmentdepends on the expected returns from an additional year of schooling netof direct and opportunity costs of schooling; (ii) liquidity constraintsand financial market failures that prevent individuals from financing theirtertiary studies through borrowing; (iii) any cyclical, structural anddemographic effects on expected future earnings, not contemplated in thestandard model (Card and Lemieux 2000; Heckman, Lochner andTodd 2005); (iv) the disutility of school versus work (Card 2001;
280 CESifo Economic Studies, 54, 2/2008
R. Boarini et al.

Heckman, Lochner and Todd 2005); (v) the quality of TE investment, as a
function of peers’ ability and resources specifically directed to enhance
quality (Hoxby 2005; Epple, Romano and Sieg 2006); (vi) gender-specific
social and behavioural determinants of the investment in TE, including the
rise in divorce rates, women’s greater responsibility for children, girls’
earlier maturity and higher level of non-cognitive skills (Goldin, Katz and
Kuziemko 2006). Some of these determinants can be estimated for OECD
1. Tertiary graduates cover all individuals, including individuals over 29.Source : OECD, EAG (2006), UNESCO education database, Eurostat and OECD calculations.
Panel A. Flow of new tertiary graduates as a share of the 20–29 population
2.5
3.0
3.5
4.0
4.5
5.0
5.5
1994 1995 1996 1997 1998 1999 2000 2001 2002 2003 2004
MalesFemales
Panel B. Stock of tertiary graduates as a share of population 25–64
17.0
18.0
19.0
20.0
21.0
22.0
23.0
24.0
25.0
26.0
1991 1992 1993 1994 1995 1996 1997 1998 1999 2000 2001 2002 2003 2004
Per
cen
tag
esP
erce
nta
ges
MalesFemales
Figure 1 Trends in tertiary human capital
CESifo Economic Studies, 54, 2/2008 281
Investment in Tertiary Education

countries, as for instance the returns to schooling and liquidity con-
straints, or at least controlled for (e.g. demographic effects and structural
trends); however, due to the lack of data on other demand drivers
(preferences, abilities, behavioural determinants), we have to neglect these
latter aspects in the analysis.
Females
1. Tertiary graduates cover all individuals, including individuals over 29.2. 1996 for Mexico and New Zealand, 1998 for Iceland, 1999 for Switzerland and 2000 for Belgium and Poland.Source: OECD, EAG (2006), UNESCO education database, Eurostat and OECD calculations.
0.0
1.0
2.0
3.0
4.0
5.0
6.0
7.0
8.0
0.0
1.0
2.0
3.0
4.0
5.0
6.0
7.0
10.0
9.0
8.0
Turke
y
Mex
ico
Greec
e
Czech
Rep
ublic
Hunga
ry
Slovak
Rep
ublic
Portu
gal
Austri
aIta
ly
Germ
any
Poland
Belgium
Canad
aSpa
in
Sweden
Norway
United
Sta
tes
Nethe
rland
s
Icelan
d
Finlan
d
Austra
lia
Franc
e
Denm
ark
United
King
dom
Switzer
land
Irelan
d
Japa
n
New Z
ealan
d
Korea
20041995 or first available year (2)
Turke
y
Mex
ico
Greec
e
Czech
Rep
ublic
Austri
a
Germ
any
Switzer
land
Slovak
Rep
ublic
Hunga
ry
Belgium Ita
ly
Nethe
rland
s
Spain
Canad
a
Franc
e
United
Sta
tes
Sweden
Poland
Austra
lia
Portu
gal
Japa
n
Norway
Finlan
d
Denm
ark
United
King
dom
Irelan
d
Icelan
d
Korea
New Z
ealan
d
20041995 or first available year (2)
Males
Figure 2 New tertiary graduates as a share of the 20–29 population by genderfor selected years
282 CESifo Economic Studies, 54, 2/2008
R. Boarini et al.

Concerning the supply determinants of TE, the literature is more recent
and the empirical evidence less well-established. There are at least two
aspects of this literature that deserve mention. First, there is some debate
on whether the Industrial Organization approach can be applied to the
supply of TE and in particular, whether objective functions of TE
institutions are identifiable (Winston 1999). Second, TE supply is rather
heterogeneous among OECD countries, with English-speaking countries
closer to a market system while continental European countries being
typically administratively based supply systems. In the latter, governments
set tuition fees almost irrespective of the production costs and of the
quality of students enrolled.3 This is opposite to the experience of TE
system in the United States (Hoxby 2005; Epple, Romano and Sieg 2006),
where students match universities along quality and quality is a function
of both initial students’ level and the resources invested by the universities.
Two issues then challenge the use of a standard TE supply-demand
framework of the schooling decision. First, as argued above, this would
not be relevant for the majority of OECD countries. Second, the data
required for the estimation (measures of ability, TE investment by family
income level, production costs at TE institution level, etc.) are lacking.
Therefore, the approach adopted here consists of explaining investment
decisions by its main drivers, without imposing a structural relationship.
The following determinants of investment in TE are considered: (i) the
institutional set-up of TE systems; (ii) the expected private returns from
engaging in TE studies and (iii) individual financing opportunities that are
made available to students. We present estimates of these three
determinants first and assess their impact on graduation ratios in turn.
4 Supply side: the institutional set-up of TE
There is a consensus that the performance of TE institutions critically
depends on three main aspects: (i) freedom in managing resources and
setting objectives; (ii) performance-based allocation of resources; (iii) and
incentive-compatible public funding rules (OECD 2003; Kis 2005; Teixeira
et al. 2004). Along these lines, we use a summary indicator of supply of
tertiary developed by Oliveira Martins et al. (2007). This indicator is
based on a survey to OECD member countries and covers three main
sub-categories (Figure 3): (i) input flexibility; (ii) output flexibility and
(iii) accountability of institutions.
3 See Jacobs and van der Ploeg (2006). The authors also observe that universities havemanaged to take in larger cohorts of students, which would suggest that supply is fairlyelastic.
CESifo Economic Studies, 54, 2/2008 283
Investment in Tertiary Education

Category level
Intermediate level
Low-level
Note: The weights of each sub-level indicator are in parentheses.
SUPPLY OF TERTIARYEDUCATION (STE)
INPUT FLEXIBILITY (1/3) OUTPUT FLEXIBILITY (1/3) ACCOUNTABILITY (1/3)
Selection of students (1/3)
Budget autonomy (1/3)
Staff policy(1/3)
Number ofstudents (1/3)
Profile ofstudents (1/3)
In case of noNumerusclausus
possibility forstudent
selection (1/3)
Sources offunding (1/2)
Structure ofspending (1/2)
Hiring/Firing(1/2)
Wages (1/2)
Course content and exams (1/5)
Offer of shortstudies (1/5)
Student choice(1/5)
Regionalmobility (1/5)
Existence of"Numerus
clausus" (1/5)
Evaluation (1/2) Funding rules (1/2)
Institutionalevaluation (1/3)
Stakeholderevaluation (1/3)
Publicinformation
(1/3)
Public funding(1/2)
Private funding(1/2)
Figure 3 The structure of the supply of TE indicator
284
CESifo
Economic
Studies,
54,2/2008
R.Boarin
iet
al.
Input flexibility measures the extent to which TE institutions are free to
allocate their resources and to shape their ‘‘production’’ function. Input
flexibility puts together criteria for students’ selection, autonomy to decide
on sources and structure of funding (e.g. level of tuition fees) and staff
policy (e.g. hiring/firing rules, wage setting, etc.). Output flexibility reflects
the capacity of TE institutions to diversify their products and provide
educational services as to better accommodate demand, such as the
possibility to decide on course content, structure (short-term, part-time,
distant learning studies). Possible restrictions to access universities are
captured by the degree of regional mobility of students and the existence of
numerus clausus for the number of diplomas attributed each year.
Accountability summarizes features of TE evaluation and funding.
Accountable systems provide incentives to excellence, by allocating
resources on a performance basis and by sanctioning unsatisfying
outcomes. Accountability is gauged through evaluation rules (independent
agency, stakeholders) and funding rules (grand-fathering, input or output
based).A composite indicator is then built by aggregating these three sub-
categories using uniform weighting. This composite indicator classifies TE
systems as ranging from administratively based (low input and output
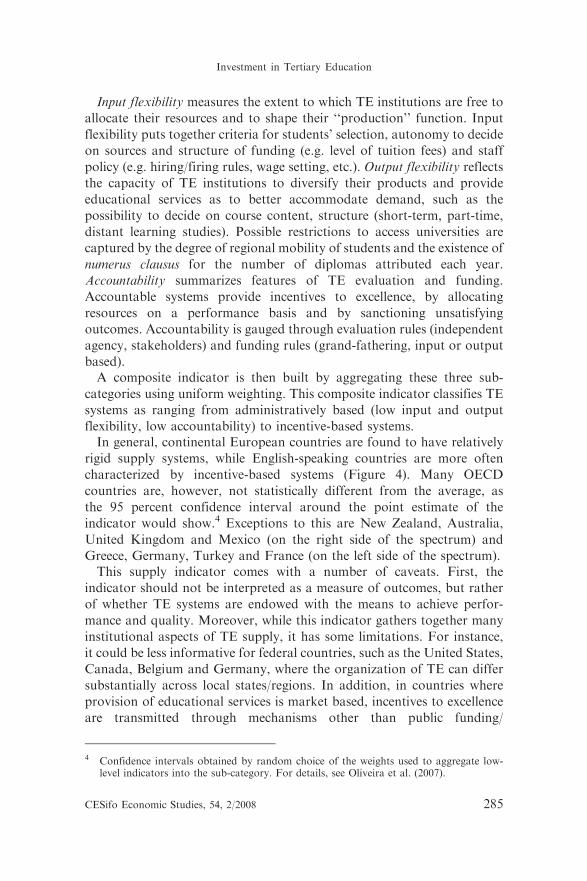
flexibility, low accountability) to incentive-based systems.In general, continental European countries are found to have relatively
rigid supply systems, while English-speaking countries are more often
characterized by incentive-based systems (Figure 4). Many OECD
countries are, however, not statistically different from the average, as
the 95 percent confidence interval around the point estimate of the
indicator would show.4 Exceptions to this are New Zealand, Australia,
United Kingdom and Mexico (on the right side of the spectrum) and
Greece, Germany, Turkey and France (on the left side of the spectrum).This supply indicator comes with a number of caveats. First, the
indicator should not be interpreted as a measure of outcomes, but rather
of whether TE systems are endowed with the means to achieve perfor-
mance and quality. Moreover, while this indicator gathers together many
institutional aspects of TE supply, it has some limitations. For instance,
it could be less informative for federal countries, such as the United States,
Canada, Belgium and Germany, where the organization of TE can differ
substantially across local states/regions. In addition, in countries where
provision of educational services is market based, incentives to excellence
are transmitted through mechanisms other than public funding/
4 Confidence intervals obtained by random choice of the weights used to aggregate low-level indicators into the sub-category. For details, see Oliveira et al. (2007).
CESifo Economic Studies, 54, 2/2008 285
Investment in Tertiary Education

evaluation. These market dimensions of accountability are not captured in
this institutional indicator.5
5 Demand side: the Internal Rate of Return to education
and its drivers
IRRs are a comprehensive measure of private incentives to undertake TE.
While several methods exist to compute IRR (Psacharopoulos 1995), we
follow here De la Fuente and Jimeno (2005). They developed an unified
framework combining a standard discount method with the estimation of
labour market premia on micro-data. In their model, individuals are
Note: For Canada we show the population-weighted average of the 7 provinces For Belgium we show the unweighted average of the three communities.The bars correspond to the 95% confidence intervals obtained through the random weight technique.Source: OECD calculations based on questionnaire answers received from member countries.
0.0
1.0
2.0
3.0
4.0
5.0
6.0
7.0
8.0
9.0
10.0
Gre
ece
Ger
man
y
Tur
key
Fra
nce
Sw
itzer
land
Beg
ium
Italy
Net
herla
nds
Nor
way
Icel
and
Aus
tria
Spa
in
Sw
eden
Por
tuga
l
Den
mar
k
Uni
ted
Sta
tes
Hun
gary
Kor
ea
Irel
and
Fin
land
Slo
vak
Rep
ublic
Cze
ch R
epub
lic
Can
ada
Japa
n
Mex
ico
Uni
ted
Kin
gdom
Aus
tral
ia
New
Zea
land
Supply indicator
Average
Figure 4 Composite supply indicator of TE (STE), 2005–2006
5 For example, higher education institutions in the United States are subject to evaluationby bond rating firms that review and assess the credit-worthiness of institutions, a featurethat is not reflected in the summary indicator above.
286 CESifo Economic Studies, 54, 2/2008
R. Boarini et al.

supposed to choose the optimal level of schooling by maximizing the
present value of the expected life-time income, net of costs associated to
education. Individual wages are a function of the number of years of
schooling and evolve over time at a constant rate given by productivity
growth and accumulation of experience. Individuals are entitled to
unemployment benefits when they are unemployed. At the end of their
working life, they receive some retirement benefits according to statutory
replacement rates. Individuals pay taxes on wages, unemployment benefits
and retirement income. In this context, the profitability of pursuing
education beyond the upper-secondary degree is measured by the ratio
comparing marginal benefits from TE to marginal costs6 (Boarini and
Strauss 2007, for a detailed presentation of the formula used to compute
IRR). Marginal benefits comprise a net wage premium, a net employ-
ability premium and a net pension premium. The marginal costs are given
by the opportunity costs and the direct costs of TE.7
The various components of the IRR are either estimated on individual-
level data by multivariate regressions8 (labour market premia) or drawn
from various OECD tax and benefit models. IRRs are computed for 21
OECD countries, between 1991 and 2005 (but with unbalanced time-
coverage) and separately for men and women.Wage and experience premia are estimated trough Mincerian wage
equations, where the log of gross hourly wage is regressed on educational
attainment (gender-specific), number of years of experience in the labour
market, working in the public sector, working part-time, tenure, having an
indefinite-term contract, size of the company, right qualification for the
job, gender and marital status.9 Wage equations are estimated by country
with repeated cross-sectional OLS. Gross wage premia are found to
vary substantially across countries; in 2001, for instance, they ranged
6 See Boarini and Strauss 2007, for a detailed presentation of the formula used to computeIRR.
7 The main assumptions behind the computation of the stream of benefits and costsassociated to education are: (i) the wage premium is an increasing and time-invariantfunction of schooling; (ii) the experience premium is constant across schooling levels; it issupposed to be a function of potential experience rather than actual years of employmentand to grow at a constant rate over time; (iii) the employment probability is an increasingand time-invariant function of schooling; (iv) individuals receive out-of-work benefits ifunemployed and pay taxes on either labour income or unemployment benefits. Benefitsand taxes are constant over the life cycle; (v) the number of working hours and the lengthof working life are the same across levels of schooling; (vi) there is no part-time studentwork.
8 The following household surveys were used: ECHP for 14 European countries; BHPS forthe United Kingdom; HILDA for Australia; CPS for the United States; SLID and CNEFfor Canada and CHER for Hungary, Poland and Switzerland.
9 See Strauss and de la Maisonneuve 2007, for more details on the construction andinterpretation of those variables.
CESifo Economic Studies, 54, 2/2008 287
Investment in Tertiary Education

from 27 to 92 percent (Figure 5). In 2001, women’s tertiary wage premia
were higher than men’s (positive interaction coefficient) in 9 of 21
countries, the difference being significant in Poland and Portugal. By
contrast, male graduates appear to yield significantly higher wage returnsthan their female counterparts in Australia, Austria, Finland and Italy. The
experience premium per year of accumulated labour market experience also
shows large cross-country variation. It is the lowest in Germany (0.23
percent) and the highest in Switzerland (1.69 percent). Overall, the TE wage
premia are found to be fairly stable over time (Boarini and Strauss 2007).
Source: the European Community Household Panel (ECHP), the Consortium of Household Panels for European Socio-Economic Research (CHER), the Cross-National Equivalent File (CNEF), and the Household, Income and Labour Dynamics in Australia Survey (HILDA) and OECD calculations.
0
10
20
30
40
50
60
70
80
90
100Men
Women
Per
cent
age
incr
ease
0
10
20
30
40
50
60
70
80
90
100
Per
cent
age
incr
ease
Figure 5 Gross Wage premia for 21 OECD countries, 2001
288 CESifo Economic Studies, 54, 2/2008
R. Boarini et al.

The gross employability premium and the conditional probability ofemployment are estimated in a two-stage approach, which jointlydetermines employment and participation probability. The two-stageapproach enables to correct for a possible selection bias, with theprobability of participation being first estimated as a function of a rangeof individual characteristics and its residual used as a control in theestimation of the employment equation. In particular, a two-stage Probitmodel is used where the probability of being active is estimated as afunction of educational attainment (gender-specific), age (quadratic),gender, marital status, having children and being a discouraged workerbecause of persistent unemployment; and the probability of beingemployed is regressed on the same variables with the exception ofhaving children and the region of residence in addition.10
As for Mincerian equations, the two-stage estimation of employmentand participation equations is done by country and by year. We find thateducation increases both the probability of participating in the labourmarket and of finding a job. In 2001, the estimated conditional probabilityof employment for an upper-secondary degree holder was around 92percent for women and 95 percent for men in most countries. With a TEdegree the employment probability increases on average by aroundtwo-percentage points (Figure 6).11 The largest employability premia(above 3–4 percentage points) are found for men in Italy,12 Poland andCanada, and for women in Hungary, Finland and Sweden. Small (or evennegative) effects are found for men in Ireland, the Netherlands, Belgium,Switzerland and France, and for women in Spain, Switzerland,Luxemburg and Italy. As showed in Boarini and Strauss (2007), theemployability premia display stronger cyclical sensitivity than the wagepremia.The next main components of IRR are fiscal parameters, comprising tax
rates, out-of-work-benefits and retirement benefits. Both progressivity andthe level of fiscal parameters matter. The additional schooling-related net
10 See Boarini and Strauss (2007) for more details on the specification and the constructionof the variables.
11 This increase is computed as the difference between the estimated employmentprobabilities for tertiary and upper-secondary graduates, using the coefficients �3 and�5 estimated in the equations above. In this calculation, the other variables are fixed ata reference level (corresponding to a single prime-age individual without children).
12 Employment probabilities refer to the average man/woman for all countries except Italy,where these probabilities are calculated for a woman/man coming from middle-incomeregions (mostly central regions). This isolates the impact of education on employmentprobabilities from the impact of idiosyncratic labour market conditions. In fact,Italy is the country where the regional characteristics of the reference individual matterthe most for the marginal effect of schooling on the employment probability. For othercountries, the marginal effects were computed without specifying the region of residence.
CESifo Economic Studies, 54, 2/2008 289
Investment in Tertiary Education

labour earnings and unemployment benefits can be decomposed into
a marginal factor (additional net hourly wage/unemployment benefit,
for a given (un)employment level) and an average factor (higher
employment probability for a given average net hourly wage/unemploy-
ment benefit). The marginal and average tax rates (on labour earnings,
unemployment benefits, retirement income) as well as marginal and
average out-of-work and retirement replacement rates take as reference
the earnings of upper-secondary degree holder. The fiscal parameters are
1. Increase in probability of employment: Tertiary degree holders relative to holders of upper secondary degree.2. Except Hungary 1997 and Poland and Switzerland 2000. Source: the European Community Household Panel (ECHP), the Consortium of Household Panels for European Socio-Economic Research (CHER), the Cross-National Equivalent File (CNEF), and the Household, Income and Labour Dynamics in Australia Survey (HILDA) and OECD calculations.
−2
−1
0
1
2
3
4
5
6
7Men
Per
cent
age
poin
t inc
reas
e
−2
−1
0
1
2
3
4
5
6
7
Per
cent
age
poin
t inc
reas
e
Average
Average
Women
Figure 6 Marginal effect of TE on the employment probability, 2001
290 CESifo Economic Studies, 54, 2/2008
R. Boarini et al.
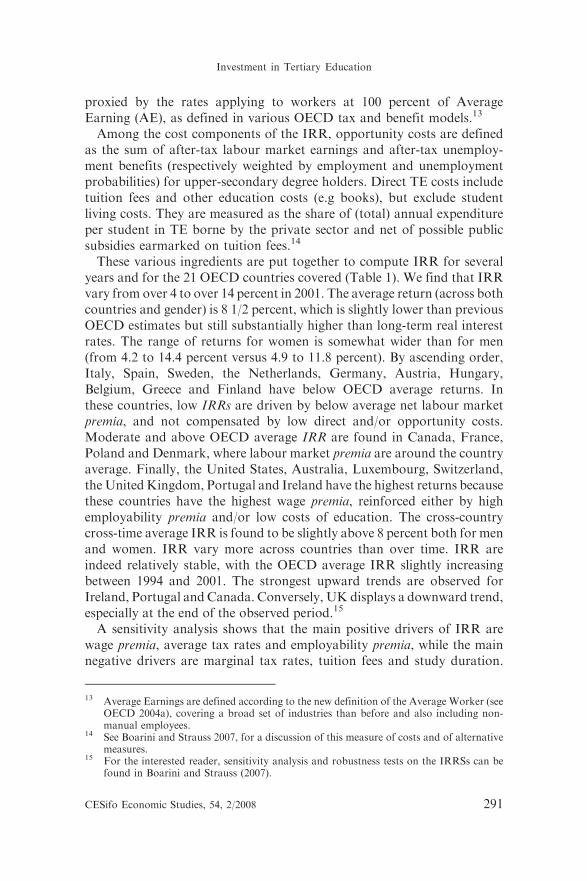
proxied by the rates applying to workers at 100 percent of AverageEarning (AE), as defined in various OECD tax and benefit models.13
Among the cost components of the IRR, opportunity costs are definedas the sum of after-tax labour market earnings and after-tax unemploy-ment benefits (respectively weighted by employment and unemploymentprobabilities) for upper-secondary degree holders. Direct TE costs includetuition fees and other education costs (e.g books), but exclude studentliving costs. They are measured as the share of (total) annual expenditureper student in TE borne by the private sector and net of possible publicsubsidies earmarked on tuition fees.14
These various ingredients are put together to compute IRR for severalyears and for the 21 OECD countries covered (Table 1). We find that IRRvary from over 4 to over 14 percent in 2001. The average return (across bothcountries and gender) is 8 1/2 percent, which is slightly lower than previousOECD estimates but still substantially higher than long-term real interestrates. The range of returns for women is somewhat wider than for men(from 4.2 to 14.4 percent versus 4.9 to 11.8 percent). By ascending order,Italy, Spain, Sweden, the Netherlands, Germany, Austria, Hungary,Belgium, Greece and Finland have below OECD average returns. Inthese countries, low IRRs are driven by below average net labour marketpremia, and not compensated by low direct and/or opportunity costs.Moderate and above OECD average IRR are found in Canada, France,Poland and Denmark, where labour market premia are around the countryaverage. Finally, the United States, Australia, Luxembourg, Switzerland,the UnitedKingdom, Portugal and Ireland have the highest returns becausethese countries have the highest wage premia, reinforced either by highemployability premia and/or low costs of education. The cross-countrycross-time average IRR is found to be slightly above 8 percent both for menand women. IRR vary more across countries than over time. IRR areindeed relatively stable, with the OECD average IRR slightly increasingbetween 1994 and 2001. The strongest upward trends are observed forIreland, Portugal and Canada. Conversely, UK displays a downward trend,especially at the end of the observed period.15
A sensitivity analysis shows that the main positive drivers of IRR arewage premia, average tax rates and employability premia, while the mainnegative drivers are marginal tax rates, tuition fees and study duration.
13 Average Earnings are defined according to the new definition of the Average Worker (seeOECD 2004a), covering a broad set of industries than before and also including non-manual employees.
14 See Boarini and Strauss 2007, for a discussion of this measure of costs and of alternativemeasures.
15 For the interested reader, sensitivity analysis and robustness tests on the IRRSs can befound in Boarini and Strauss (2007).
CESifo Economic Studies, 54, 2/2008 291
Investment in Tertiary Education

Table 1 Estimates of IRR, 1991–2005
Country Men
1991
(%)
1992
(%)
1993
(%)
1994
(%)
1995
(%)
1996
(%)
1997
(%)
1998
(%)
1999
(%)
2000
(%)
2001
(%)
2002
(%)
2003
(%)
2004
(%)
2005
(%)
Australia 10.4 10.2 10.1
Austria 8.4 8.3 7.4 7.7 8.3 8.5 7.8
Belgium 5.9 5.9 6.0 6.2 7.3 6.3 6.2 6.9
Canada 7.3 5.9 7.1 7.0 8.7 8.7 8.4
Denmark 5.4 7.0 6.5 6.7 8.1 8.5 8.4 9.6
Finland 8.5 8.7 7.6 8.6 8.8 8.6
France 9.5 9.3 9.4 9.8 10.2 9.3 10.1 9.1
Germany 5.5 5.7 5.5 5.8 6.4 7.3 6.7 6.2
Greece 5.4 5.2 5.6 5.7 4.9 5.8 6.0 6.0
Hungary 7.3 6.4 6.4 5.0 6.8 6.2
Ireland 7.2 8.1 8.5 9.8 9.0 8.8 8.6 11.8
Italy 4.8 4.6 5.3 5.5 6.1 6.0 5.7 6.1
Luxembourg 11.5 10.8 10.0 11.8 11.4 12.2 10.2
Netherlands 6.9 6.9 6.7 5.6 6.3 4.4 5.0 6.0
Poland 7.5 8.7 8.9 6.5
Portugal 11.4 13.8 15.7 13.0 13.7 12.3 13.6 11.2
Spain 5.0 5.4 5.5 4.4 3.9 3.1 2.2 4.9
Sweden 6.4 7.3 7.2 7.0 6.4
Switzerland 12.1 11.3
United Kingdom 12.4 12.2 12.5 12.2 11.6 12.2 11.9 12.1 12.2 11.7 11.8 11.5 10.9 9.9
United States 9.1 9.1 9.4 9.2 9.0 9.9 9.9 10.1 10.7 10.1 10.4 10.4
(continued)
292
CESifo
Economic
Studies,
54,2/2008
R.Boarin
iet
al.

Table 1 Continued
Country Women
1991
(%)
1992
(%)
1993
(%)
1994
(%)
1995
(%)
1996
(%)
1997
(%)
1998
(%)
1999
(%)
2000
(%)
2001
(%)
2002
(%)
2003
(%)
2004
(%)
2005
(%)
Australia 8.9 10.0 9.9
Austria 9.3 9.5 7.5 6.9 7.1 5.7 5.0
Belgium 4.4 5.1 4.4 5.4 5.5 7.4 6.0 6.4
Canada 7.3 6.6 7.5 7.4 9.5 9.4 9.3
Denmark 5.8 6.4 6.8 5.7 7.9 7.5 7.8 8.7
Finland 6.5 6.1 5.8 6.7 6.4 7.1
France 8.3 8.3 8.4 9.1 9.2 8.6 8.7 9.0
Germany 5.2 6.0 5.3 5.9 5.9 6.5 5.7 6.4
Greece 4.7 4.3 5.2 6.4 7.9 7.2 7.5 8.3
Hungary 5.7 6.3 6.9 6.8 6.7 6.5
Ireland 7.5 8.7 9.4 11.6 9.5 11.0 9.8 14.4
Italy 4.3 4.4 4.2 4.3 4.4 4.5 4.8 4.2
Luxembourg 12.2 10.4 10.1 11.2 10.5 10.9 9.9
Netherlands 5.5 5.9 5.9 4.2 4.9 4.1 4.1 6.5
Poland 9.2 10.3 11.3 11.8
Portugal 10.6 11.3 12.6 11.5 13.3 12.2 15.6 13.3
Spain 6.5 7.0 6.9 6.1 5.0 4.8 4.6 6.5
Sweden 6.2 5.8 4.4 5.2 5.4
Switzerland 10.4 10.1
United Kingdom 12.6 13.9 13.3 12.7 12.7 12.3 12.6 12.8 12.2 11.5 12.3 12.1 10.9 9.9
United States 8.6 8.6 8.9 8.7 8.5 9.0 8.9 9.1 9.4 8.7 9.2 9.1
CESifo
Economic
Studies,
54,2/2008
293
Investm
entin
Tertia
ryEducatio
n

Many are, thus, the policy-levers of private returns to TE, and
governments may use some of them as to set individual incentives toinvest in TE.
6 Financing the individual investment in TE
If financial markets were perfect, students were risk-neutral and perfectly
informed about returns to education, the latter should be perfectly
correlated to individuals’ schooling decisions. However a number of theseconditions are not fulfilled in many OECD countries, as argued by Barr
(2001). On the supply side, the imperfections are mainly related to
asymmetric information on students’ abilities and motivation, the
uncertainty about their future income and the lack of collateral. On thedemand side, students engaging in higher education are not always in
possession of all relevant information on future labour market prospects
(Romer 2000) and may display some aversion to undertake a riskyinvestment, particularly so if they come from low-income families
(Chapman 2005).For all these reasons, we need to introduce in our analysis a proxy of
availability of funding which might explain why individuals do not enrollin tertiary studies even when the private incentives to do so are
considerable. The literature has variously dealt with the impact of
financial constraints on the accumulation of human capital in differentways. Evidence is available, especially at individual-level (see for instance
Cameron and Taber 2000), while few studies explore the impact of
financial restrictions on the accumulation of human capital at aggregate
level. As to the latter, Benhabib and Spiegel (2000) approximate financialconstraints by the Gini Index (at country level), the (under) development
of financial markets and the (low) share of banking sector in total assets.
They find that only the latter variable robustly explains the accumulationof human capital. For the sake of our analysis, however, it is preferable to
build a more specific measure on the affordability of tertiary studies,
which accounts for the current financial conditions of access to TE.OECD countries funding systems are extremely heterogeneous with
respect to rules, coverage and actual take-up rates of grants/loans.
For descriptive purposes, systems can be classified along two dimensions:
the target and the composition of funding (see Oliveira Martins et al. 2007for a detailed discussion of the typology). Funding systems are either
targeted on students themselves or on the households where students live.
In addition, funding systems can either rely on loans, grants or some othermeasures (tax-credits, family allowances). Many OECD countries offer
several types of funding, but we decided to classify countries according to
294 CESifo Economic Studies, 54, 2/2008
R. Boarini et al.

the predominant funding option. Universal funding systems rely on either
grants or loans. The main feature of these systems is that they provideuniversal funding to students as individuals, i.e. irrespective of family-
income conditions. By contrast, family-based funding systems generally
offer limited help for studying, and the help is conditional on mean-test at
family level. Within individual-based systems, loans and grants schemesare quite diverse, especially with respect to the magnitude of public
subsidies available (OECD 2006b).While it is possible that the composition of funding matters for easing
liquidity constraints over and above the overall amount of fundingavailable, it is not possible to build a summary indicator reflecting the
differential impact of grants and loans on financial restrictions for
accessing TE. Essentially, this is due to the paucity of data on the actualrepayments of loans (regardless of statutory rules) and of the sometimes
awkward functioning of borrowing schemes, which makes it difficult to
conjecture about the real part of subsidy in attributed loans. For the sakeof our analysis we thus build an indicator of overall availability of
funding, which regards grants and loans in the same way. This indicator is
defined as the ratio of the overall costs of TE to the total resources
available to students to cover these costs. Costs include tuition fees(average of public and private sector) and an estimate of living costs for
students (Table 2). Resources made available to students are the sum of
specific funding in the form of grants and loans, an estimate of students’earnings from part-time work and an estimate of resources available at
household level. Students’ earnings are assumed to be equal to 80 percent
of the wage of an upper-secondary degree holder (working half-time) andadjusted for youth unemployment rate. Private resources to fund FE are
assumed to be equal to the equivalized median household disposable
income. The indicator ratio of funding availability (shown in last column
of Table 2) ranges from less than 20 percent for Nordic countries to 135percent for Mexico. While little informative in absolute terms, this
indicator allows for meaningful cross-country comparisons of the extent
to which the access to TE is likely to be restrained even for someone livingin a family with median incomes. Results on this indicator show that
financial constraints are the least (most) binding in individual (family)-
based funding systems.
7 Explaining aggregate investment in TE
The institutional set-up of TE, the IRR and the indicator on availability offunding to students are now used to explain aggregate graduation patterns
in OECD countries. As discussed in the first section, the empirical strategy
CESifo Economic Studies, 54, 2/2008 295
Investment in Tertiary Education

Table 2 Estimated total student cost and available financing per year (in US$ PPP)
(Data correspond to the latest available date up to 2006)
Average of
public and
private
sector’s
tuition feesa
Living
costsbTotal
investment
costs
Maximum
amounts
of loans and
grantsc
Expected
earnings
for student
parttime workd
Median
equivalised
disposable
incomee
Total
resources
Total
investment
costs/Total
resources
(in %)
Universal funding
Denmark 0 6,647 6,647 10,294 5,606 19,832 35,731 18.6
Finland 0 5,229 5,229 7,015 3,703 17,070 27,788 18.8
Luxembourg 0 8,325 8,325 5,020 3,176 27,403 35,599 23.4
Sweden 0 5,431 5,431 10,534 2,544 17,157 30,234 18.0
Iceland 390 5,769 6,159 11,531 4,255 18,085 33,871 18.2
Norway 630 5,769 6,399 8,711 4,119 22,131 34,962 18.3
Netherlands 1,565 4,924 6,489 8,427 5,201 20,050 33,677 19.3
United Kingdom 1,794 8,602 10,396 11,644 4,620 18,987 35,250 29.5
New Zealand 2,548 7,546 10,094 7,849 2,696 13,680 24,225 41.7
Canada 2,967 4,909 7,876 8,750 2,591 21,172 32,512 24.2
Australia 3,791 6,720 10,511 5,995 4,631 16,371 26,997 38.9
United States –
Federal loans
8,653 6,344 14,997 18,500 2,105 23,954 44,559 33.7
United States –
Private loansf8,653 6,344 14,997 40,000 2,105 23,954 66,059 22.7
Average 2,384 6,351 8,735 11,867 3,642 19,988 35,497 24.6
Family-based funding
Greece 0 3,618 3,618 2,040 11,656 13,696 26.4
(continued)
296
CESifo
Economic
Studies,
54,2/2008
R.Boarin
iet
al.

Table 2 Continued
(Data correspond to the latest available date up to 2006)
Average of
public and
private
sector’s
tuition feesa
Living
costsbTotal
investment
costs
Maximum
amounts
of loans and
grantsc
Expected
earinings
for student
parttime workd
Median
equivalised
disposable
incomee
Total
resources
Total
investment
costs/Total
resources
(in %)
Mexico 0 5,625 5,625 386 3,816 4,203 133.8
Slovak Republic 0 2,165 2,165 659 6,757 7,416 29.2
Germany 55 4,417 4,472 4,217 15,632 19,849 22.5
Czech Republic 172 2,057 2,230 923 9,411 10,334 21.6
Turkey 274 4,800 5,074 862 4,568 5,429 93.5
Hungary 426 2,995 3,421 1,155 6,743 7,898 43.3
Poland 426 1,444 1,871 654 6,308 6,962 26.9
Belgium 625 4,380 5,005 3,903 16,919 20,822 24.0
France 703 5,401 6,104 2,997 16,178 19,175 31.8
Ireland 748 4,957 5,705 3,902 17,824 21,726 26.3
Spain 801 5,563 6,364 3,047 12,084 15,131 42.1
Austria 847 5,821 6,668 2,940 16,419 19,358 34.4
Switzerland 849 4,881 5,730 1,836 23,534 25,370 22.6
Italy 1,174 4,421 5,595 3,104 14,794 17,898 31.3
Portugal 1,688 4,030 5,718 1,864 10,714 12,578 45.5
Japan 5,285 6,156 11,441 2,244 17,871 20,114 56.9
Korea 6,210 5,890 12,101 1,445 10,182 11,628 104.1
Average 1,127 4,368 5,495 2,121 12,300 14,422 38.1
(contiuned)
CESifo
Economic
Studies,
54,2/2008
297
Investm
entin
Tertia
ryEducatio
n

Table 2 Continued
(Data correspond to the latest available date up to 2006)
Average of
public and
private
sector’s
tuition feesa
Living
costsbTotal
investment
costs
Maximum
amounts
of loans and
grantsc
Expected
earinings
for student
parttime workd
Median
equivalised
disposable
incomee
Total
resources
Total
investment
costs/Total
resources
(in %)
Average excluding
Korea, Mexico, Turkey
920 4,154 5,074 2,366 13,523 15,889 31.9
aWeighted by the percentage of full-time students in public and private institutions. When range of fees was provided in OECD Education at a
Glance, a point estimate was derived by taking the middle value. Where data were not available, tuition fees were assumed to be zero. Public
institutions only for Canada, Spain and Switzerland. For Germany, the value refers to contributions paid to TE institutrions for the use of social
facilities and to other registration fees. For Ireland, the value refers to registration, examination and services charges. For Poland, tuition fees were
assumed to be the same as in Hungary.bLiving costs were derived from Usher and Cervenan (2005) and other sources. When not available in this source, living costs were estimated using
the average share of living costs to average wages of an upper-secondary educated worker (around 40%). For Czech Republic, Korea, Mexico and
Turkey, living costs are derived from International Student Guides. For Iceland and Norway, living costs were estimated as the average of Nordic
countries and for Slovak Republic as the average of Eastern European countries.cUniversal grants and loans only. For Australia, corresponding to the HECS-HELP loan.d80% of the part-time wage, calculated as 1/3 of a secondary worker’s average wage or 1/3 of a minimum wage and adjusted for youth unemployment
rate. For Iceland and Norway, income from student work was estimated as the average of Nordic countries.eThe ‘‘equivalised’’ income is the household income adjusted for household size (i.e. the household divided by the square root of household size). For
Belgium, Iceland, Korea and Slovak Republic, the equivalised disposable income was estimated as a share of GDP per capita (using the OECD
average share).fGovernment guaranteed loans, such as the Sallie Mae scheme.
Sources: OECD, Education at a Glance; Usher and Cervenan (2005) Center for Higher Education Policy Studies, Student Financial Report (for
Germany and Ireland) and Secretariat estimates.
298
CESifo
Economic
Studies,
54,2/2008
R.Boarin
iet
al.

consists of estimating the investment in TE, without identifyingrestrictions on the structural determinants. The econometric analysisassumes first that individuals take the decision to invest in TE on the basisof a pre-determined return to tertiary degrees and for a given quantity oftertiary educated graduates. In a second step, the returns to schooling arelet to be endogenous, and modelled as depending on the quantity ofhuman capital demanded and supply in labour markets and on labourmarket institutions [employment protection legislation (EPL), uniondensity, bargaining arrangements, etc.].Higher IRR are expected to lead to higher investment in TE while lower
availability of funding should have the opposite effect. The institutionalset-up of TE sector may shape investment through several channels.Highly incentive-based systems may attract more students, allowing formore and better services. Moreover, highly accountable TE systemsmay respond better to the positional component of the demand forhigher education (notably through rankings and reputation factors).In addition, more flexible systems, such as those where the edu-cational track allows students to opt out from the educational investmentmore often than rigid system, are potentially more attractive.16 Incentive-based systems may also induce faster completion of studies and lowerdrop-out.A number of other factors, for which we need to control for, may
influence the graduation ratios. First, structural trends as the increasinglabour participation of women or the increasing demand of high-skilledworkers may explain graduation ratios. More generally, all structural andcyclical components of return on skills not comprised in the baselinecalculation of the IRR could be retained as additional explanatoryvariables. In the baseline, we adopted a parsimonious specification wheregraduation ratios are solely determined by IRR, supply conditions,availability of funding, gender effects and output gaps. This specificationalso controls for common time-dummies and country-specific trends.The analysis is performed in an unbalanced panel using 19 countries17
and gender as the cross-section dimension. The maximum time spancovered is 1992–2002, but for several countries only some years areavailable.Table 3 shows the results for this specification (column ‘‘Baseline’’) and
of a number of alternative specifications (column 1–8), controlling forother explanatory variables. In the preferred specification, the explanatory
16 See Heckman, Lochner and Todd 2005 for an application of the Option Value Model tothe demand for higher education.
17 This includes all countries for which the IRRs were available except Luxembourg andPoland, where the STE indicator is not available.
CESifo Economic Studies, 54, 2/2008 299
Investment in Tertiary Education
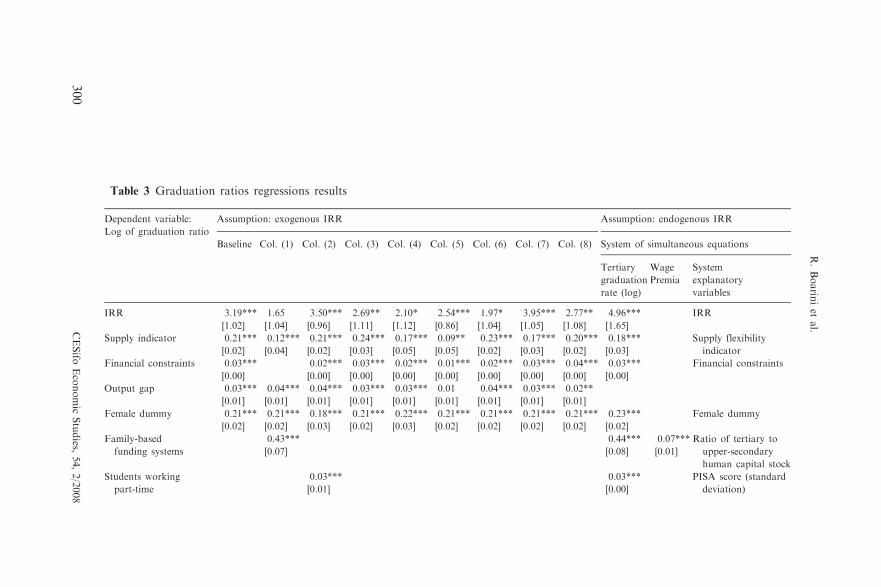
Table 3 Graduation ratios regressions results
Dependent variable:
Log of graduation ratio
Assumption: exogenous IRR Assumption: endogenous IRR
Baseline Col. (1) Col. (2) Col. (3) Col. (4) Col. (5) Col. (6) Col. (7) Col. (8) System of simultaneous equations
Tertiary
graduation
rate (log)
Wage
Premia
System
explanatory
variables
IRR 3.19*** 1.65 3.50*** 2.69** 2.10* 2.54*** 1.97* 3.95*** 2.77** 4.96*** IRR
[1.02] [1.04] [0.96] [1.11] [1.12] [0.86] [1.04] [1.05] [1.08] [1.65]
Supply indicator 0.21*** 0.12*** 0.21*** 0.24*** 0.17*** 0.09** 0.23*** 0.17*** 0.20*** 0.18*** Supply flexibility
[0.02] [0.04] [0.02] [0.03] [0.05] [0.05] [0.02] [0.03] [0.02] [0.03] indicator
Financial constraints �0.03*** �0.02*** �0.03*** �0.02*** �0.01*** �0.02*** �0.03*** �0.04*** �0.03*** Financial constraints
[0.00] [0.00] [0.00] [0.00] [0.00] [0.00] [0.00] [0.00] [0.00]
Output gap �0.03*** �0.04*** �0.04*** �0.03*** �0.03*** �0.01 �0.04*** �0.03*** �0.02**
[0.01] [0.01] [0.01] [0.01] [0.01] [0.01] [0.01] [0.01] [0.01]
Female dummy �0.21*** 0.21*** 0.18*** �0.21*** 0.22*** 0.21*** 0.21*** 0.21*** 0.21*** 0.23*** Female dummy
[0.02] [0.02] [0.03] [0.02] [0.03] [0.02] [0.02] [0.02] [0.02] [0.02]
Family-based �0.43*** 0.44*** �0.07*** Ratio of tertiary to
funding systems [0.07] [0.08] [0.01] upper-secondary
human capital stock
Students working
part-time
0.03***
[0.01]
0.03***
[0.00]
PISA score (standard
deviation)
300
CESifo
Economic
Studies,
54,2/2008
R.Boarin
iet
al.
Share of students in 0.01*** �0.02** Tertiary graduation
private institutions [0.00] [0.01] rate (log)
PISA score (mean) 0.01*** 0.01*** EPL (regular workers)
[0.00] [0.00]
PISA score 0.02*** �0.01*** EPL (temporary
(standard deviation) [0.00] [0.00] workers)
Upper-secondary 0.30** �0.05*** Bargaining
degree holders ratio [0.15] [0.01] coordination
Share of foreign students 0.88* 0.02* Trade openness
[0.45] [0.01]
Ratio of expenditure 0.26***
in tertiary education
(per student) to GDP
per capita
[0.05]
Constant �0.21 �0.09 �1.72** �0.52** 0.01 �5.05*** �2.33*** 0 0.25 �2.11*** 0.17*** Constant
[0.20] [0.26] [0.77] [0.20] [0.36] [1.61] [0.44] [0.20] [0.20] [0.44] [0.03]
Observations 266 266 266 266 266 266 266 266 266 266 266 Hansen-Sargan test
R2 0.85 0.85 0.85 0.86 0.82 0.86 0.86 0.86 0.86 0.9 0.73 Chi2(4):5.51
All the specifications include country-specific trends and year dummies.
Standard robust errors in brackets.
*Significant at 10%; **significant at 5%; ***significant at 1%.
Source: OECD calculations.
CESifo
Economic
Studies,
54,2/2008
301
Investm
entin
Tertia
ryEducatio
n

variables have the expected sign and are significant: graduation ratiosincrease with IRR,18 flexibility and accountability of TE supply and withavailability of funding. Graduation ratios are found to be negativelyaffected by the output gap, possibly reflecting relatively better employ-ment and income perspectives for non-graduates during periods of strongeconomic activity (not captured by IRR). As suggested by the effect ofthe female dummy, graduation ratios are generally higher for women thanfor men. This seems to be in line with Goldin, Katz and Kuziemko (2006),for which, in the United States, women graduates outnumber mengraduates because of changing social patterns and behavioural differ-ences19 across genders and increasing expectations in terms of high-payingcareers.In order to test for the sensitivity of these estimates several other
specifications are tested. To avoid multi-collinearity, each additionalvariable is introduced separately. In particular, two other proxies offinancial constraints are retained: a categorical dummy for countries withfamily-based systems (the reference being individual-based system) and theincidence of part-time student work (see OECD Education at a Glance,indicator C4.2a). Relying on family-based financing systems (col. 1) tendsto depress graduation ratios, probably because family-based fundingsystems tend to deliver less generous financial help than individual-funding systems, and possibly because they give less responsibility tostudents on completing their studies. The coefficient of the students’ part-time work variable has a positive sign (col. 2), suggesting that liquidityconstraints are somehow relaxed when students work.20 We also find thatcountries with high share of students in private universities display highergraduation ratios (col. 3). This may be explained by private universitiesbeing more autonomous than public institutions,21 but could also be dueto that they sometimes offer easier curricula. Both the Programme forInternational Student Assessment (PISA)22 mean score and its standard
18 In a robustness check, the basic components of IRR have been entered as separateregressors. We found that graduation ratios increase with wage premia and average taxrates and decrease with marginal tax rates. This is line with the sensitivity analysis ofIRR carried out in Boarini and Strauss (2007). The coefficients of the other variables arerobust to this specification.
19 For example, Goldin, Katz and Kuziemko (2006) report that grades K-12 boys havehigher incidence of behavioural problems; teenage boys display higher (self-reported)incidence of arrests and school suspensions than teenage girls; girls spend more timedoing homework than boys.
20 On top of relaxing liquidity constraints, student part-time work leads also to higher IRR,as shown in Boarini and Strauss (2007).
21 See Aghion et al. (2007).22 PISA (Programme for International Student Assessment) is an international study
conducted by the OECD which measures how well young adults of age 15 are preparedfor possible later studies or direct entry into the labour market.
302 CESifo Economic Studies, 54, 2/2008
R. Boarini et al.

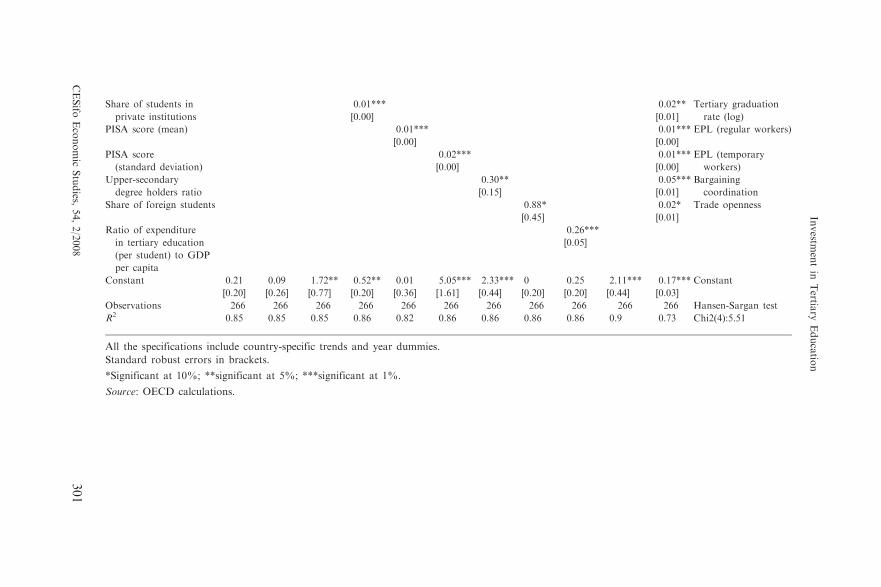
deviation have a positive influence on TE investment (col. 4 and 5). Theformer effect is not surprising: better-prepared students from the primaryand secondary-level are expected to enrol and to complete tertiary studiesmore often. The impact of PISA standard deviation is less intuitive. Onepossible interpretation is that countries where pre-tertiary systems are lesscomprehensive (i.e. less egalitarian) tend also to have more selective TEinstitutions, which lead to higher graduation ratios. Another explanationcould be that countries where PISA scores are distributed more unequally,less able students do not make it to the university or to the completion ofstudies. Not surprisingly, the size of upper-secondary graduates’ cohort isalso positively related to tertiary graduation ratios (col. 6). Graduationratios depend positively on the share of foreign students (col. 7). Thiscould be due to the positive correlation between ability and mobility, andto related peer effects. Per student expenditure23 as a share of GDP percapita is found to be positively related to graduation ratios (col. 8). Inprinciple, the direction of influence is ambiguous since expenditure perstudent could capture both the input price of factors24 and input quantitiesinvested in the production of educational services. Since the expectedcorrelation to graduation ratios would be, respectively, negative andpositive, the empirical finding would rather support the interpretation ofthis variable in terms of input quantities.In a second step, the assumption of a pre-determined IRR is relaxed.25
Two issues are considered here. First, returns to investment may fall with arising number of tertiary graduates. More specifically, an increasingsupply of tertiary graduates is likely to put downward pressure on grosswage premium. In turn, a lower wage premium reduces the incentives toinvest in TE. Second, labour market policies and institutions influencewage dispersion and hence may also affect incentives to invest in TE. Totake into account the potential simultaneity issues, we estimate a system oftwo equations modelling the investment in TE and the determination ofthe relative price of skills.26
The first equation is the same than the baseline specification estimatedabove, while in the second equation gross wage premia are regressed on the
23 This includes both private and public spending.24 The factor price usually includes the cost of academic staff and infrastructures, but this
price should also include subsidies paid to students as a result of the customer-inputtechnology used in the production of human capital (Winston 1999).
25 This approach is further developed in Boarini, Nicoletti and Oliveira Martins (2008,forthcoming).
26 The main identifying assumptions are: (i) the relative supply of skills is proxied by therelative stock of human capital in the population, i.e. the labour market participation isassumed to be constant across skills; (ii) there is no lag in the transmission of the pricesignals, i.e. wage premia and graduation ratios are determined contemporaneously;(iii) the structural relationship between IRR and wage premia is not specified.
CESifo Economic Studies, 54, 2/2008 303
Investment in Tertiary Education

log of tertiary graduation ratio, the lagged stock of human capital, EPLfor temporary workers, EPL by type of contract (temporary and regular),the degree of bargaining coordination and the trade openness of theeconomy. Indeed the specification of a wage premia equation follows astandard approach accounting for labour supply and demand forces, aswell as labour market policies and institutions (Katz and Autor 1999). Thewage level can be seen as the result of a competitive wage plus or minusa deviation due to either labour market institutions or measurementproblems.27 The competitive wage is a function of the relative supply ofskills (decomposed into the lagged levels of the tertiary and secondaryhuman capital stocks and inflows of tertiary human capital). The relativesupply of skills is let to be endogenous in the estimation procedure.Deviations from competitive wages are proxied by a number of labourmarket institutions; in the specification shown here these are the degree ofcoordination of wage setting negotiations and EPL. The equation alsocontrols for (exogenous) relative demand shifts arising from tradeopenness, and include country-specific time trends and common timedummies. The estimation is based on the standard three-stage least squareestimator (3SLS). We find that the impact of determinants of graduationratios is relatively robust to the assumption of exogenous IRR (see the lasttwo columns in Table 3). We also find that the impact of labour marketinstitutions on wage premia turns out to be considerable. EPL fortemporary contract is found to have a negative impact on wage premiawhile the opposite is obtained for EPL for regular workers. Coordinationbargaining is found to have a negative impact on wage dispersion,corroborating previous evidence in the field (Barth and Lucifora 2006).
8 Policies to enhance TE outcomes
Shortage of skills is as a serious handicap for the growth potential ofeconomies. Low efficiency of public expenditure on TE is another issue,considering the large amount of public resources allocated to TE in somecountries and the relatively modest outcome of this investment. Last butnot least, rising mobility and labour market integration across OECDcountries raise new challenges for TE systems, with TE institutionsincreasingly competing for scholars, students and resources on a globalscale. Reforms of TE systems are thus on the current agenda of manyOECD countries, with the two-fold objective of making TE systemsrespond to labour market dynamics of global economies and obtaining themost from the public financial effort in the sector.
27 Measurement problems arise from differences in non-wage compensation across jobs.
304 CESifo Economic Studies, 54, 2/2008
R. Boarini et al.

With regard to the latter, we have argued in previous sections that TEinstitutions may not operate in incentive-compatible settings in countrieswhere TE systems are little accountable and autonomous.28 Reformingthose systems by putting in place adequate governance settings whichallow for an efficient provision of high-quality educational services shouldbe seen as a priority. Getting an efficient TE system might not be enough,however, in a context of increasing search of excellence. Increasingboth the quality and quantity of tertiary graduates seems to be hardlyfeasible without injecting more resources in the system (Teixeira et al.2004). A widely shared position is that pressure on public budgets makesit difficult to increase public funds. Augmenting the role of the privatesector seems viable, not only because in many OECD countries the currentlevel of the private participation is limited but also for the potentialefficiency gains that this solution may induce. If more resources arewarranted by the household sector, typically through higher tuitionfees, students could be made more responsible with respect to completion,quality of learning and fast progression in their studies. Greater relianceon tuition fees may also have positive effect on the supply side: notablytuition fees may transmit signals on the quality of education provided,as well as increase effective competition among universities by pushinginstitutions to cost-efficient delivery of educational services. Increasedfinancial participation of the industrial sector could be appealing to theextent that it were to allow partnership between firms and universitiesand improve the matching between the education delivered andskills required by production needs. Finally, equity concerns (Barr 2001;Jacobs and van der Ploeg 2006; Oliveira Martins et al. 2007), such aspublic spending in TE being regressive and crowding out publicresources that could otherwise be earmarked for liquidity-constrainedstudents, suggest that making students paying for education and at thesame time introducing appropriate financial help such as income-contingent loans or means-tested grants, could increase both efficiencyand equity.Against this background, the empirical findings of the previous section
suggest some avenues for reform. Accordingly, we present suggestivepolicy simulations on the increase of flexibility and accountability of
28 The article does not provide a direct test of the importance of public financing of tertiaryeducation, though this dimension is partly captured by the financial constraint indicatorwhich measures the extent to which public resources are made available to financetertiary studies for a representative student in the economy. While we do not attempt toprovide an assessment of cost-effectiveness of public spending on tertiary education, ourfinding such that graduation ratios are affected by institutional set-up of supply suggeststhat efficiency-enhancing reforms in this sector may be adopted in the form of higherautonomy and accountability of education supply.
CESifo Economic Studies, 54, 2/2008 305
Investment in Tertiary Education

supply, tuition fees and availability of funding for students. The first
simulation consists of benchmarking the summary indicator of flexibility
and accountability of supply side on the best performer in the sample
(Australia). Indeed, catching-up with the Australian system would
require ambitious reforms for a number of OECD countries. The
objective here is not to suggest drastic policy changes but rather to
give a flavour of the room of high-potential returns to policy action in
the field of TE. This simulation suggests that countries such as
Greece, Germany and France would benefit the most from reforming
the supply of TE (Figure 7).In the second simulation, tuition fees are increased to the sample mean
plus two standard deviations (around 4,000 US$ at PPPs). This policy
shock is considerable in all countries where tuition fees are nil (e.g Nordic
countries, Greece, etc.) and negligible in countries which already feature
high tuition fees (Australia, United States). The increase in fees has a two-
fold negative effect (Figure 8). The first operates through a fall in the IRR
(as direct costs go up), while the second, much stronger effect, works via
stronger liquidity constraints (assuming unchanged individual-funding
systems). The cumulated negative effect can be large in absolute terms.
This result suggests that an increase in tuition fees may call for other
flanking policies.29 Given that the main effect relates to increased liquidity
constraints among possible compensating policies, a natural candidate is
the development of individual financing. Indeed, countries introducing or
raising tuition fees have usually taken simultaneous action in this field,
as in Australia, New Zealand and the United Kingdom.To assess the beneficial effect of flanking policies to the greater reliance
on tuition fees that TE system may opt for, we simulate the impact of
aligning the ratio of costs to financing resources (Table 2 above) to the
minimum in the sample. The impact ranges from nearly 1.5 percentage
points in Portugal and Spain to virtually zero in Denmark and Finland
29 A simulation where financial help to students is increased together with tuition fees (notshown here) suggests that graduation ratios would still decrease but by much less than inthe case where no flanking policies are put in place. However, the effect of higher tuitionfees is not zero because of the way the financial constraints indicator is constructed. Anincrease of tuition fees in the numerator matched by an equal increase of resources in thedenominator would still entail an increase of the overall ratio. This could be interpretedas the fact that education cost would rise comparatively to other items, notably livingcosts, and this would discourage demand for tertiary education. However, if theadditional financial help to students were made strictly conditional on paying theadditional tuition fees, this should not affect decisions of (potential) students and bothflows would be best interpreted as a zero addition to (net) costs, i.e. the indicator wouldremain unchanged. The financial constraints indicator in this article does not apply a netcost concept due to the lack of data on the breakdown of financial help to students intogrants and loans, earmarked for tuition fees or living costs.
306 CESifo Economic Studies, 54, 2/2008
R. Boarini et al.

1. Effect of aligning the STE indicator on the maximum in the sample of the regression presented in table 3.5 (Australia).Source: OECD calculations.
0
0.5
1
1.5
2
2.5
3
3.5
4P
erce
nta
ge
po
ints
Figure 7 Impact of increasing the flexibility and accountability of TE supply ongraduation ratios
1. Effect on graduation ratios of increasing tuition fees up to the sample mean plus two standard deviations.(The United States are not included because the level of net tuition fees are already above the sample mean plus two standard deviations).Source: OECD calculations.
−4
−3.5
−3
−2.5
−2
−1.5
−1
−0.5
0
Effect via IRREffect via Financial ConstraintsOverall effect
Per
cen
tag
e p
oin
ts
Figure 8 Impact of an increase in tuition fees on graduation ratios
CESifo Economic Studies, 54, 2/2008 307
Investment in Tertiary Education

(Figure 9). The simulation results are clearly more relevant in the case of
family-based systems, where liquidity constraints are likely to be more
binding. However, insofar as reforms of universal funding systems involve
use of tuition fees, easing liquidity constraints will have a positive impact
in those systems, too.
9 Summary and conclusions
In this work we have explored the main determinants of investment in TE
and focused on policy-levers of these determinants. OECD countries’ TE
systems have been shown to differ across many dimensions: in terms of the
quantitative outcome (graduation ratios), the gender-field composition,
the degree of flexibility and accountability in supplying educational
services, the private returns to tertiary studies and the financial conditions
of access to TE. It has also been shown that graduation ratios are shaped
by institutional settings of both TE systems and labour markets, as well as
by the availability of financial help to students and other structural factors
like the increasing participation of women in TE. In this context, we have
simulated the potential impact of some reforms in the TE sector. The
results suggest that, depending on the existing institutional conditions,
there is a strong potential to increase graduation ratios by introduction/
strengthening of flexibility and accountability in TE supply. In order to
1. Effect of an alignment of the ratio of investment costs to financing resources (see table 3.4) on the minimum in the sample.(This benchmark was preferred as the sample mean minus two standard deviations is below the minimum).Source: OECD calculations.
0.0
0.5
1.0
1.5
2.0
2.5
3.0
3.5
4.0P
erce
nta
ge
po
ints
Figure 9 Impact of easing liquidity constraints on graduation ratios
308 CESifo Economic Studies, 54, 2/2008
R. Boarini et al.

increase the amount of resources injected in the system without havinga detrimental effect on the graduation ratios, the increase of tuition feesrequires the introduction/extension of individual funding to TE students.Overall, the different TE indicators and their estimated relationshipsprovided in this article can provide some guidance for reforming TEsystems in many OECD countries. Future research in this field is neededto cover some of the aspects that were not sufficiently tackled by ouranalysis, as the role of public versus private funding and management ofTE institutions, as well the possible complementarity between policyactions. It would be also of great importance to look at the quality of theinvestment of human capital, since a quantitative perspective as the oneadopted by this article is necessarily restrictive. In this respect,distinguishing between graduation ratios across fields or across differenteducational programmes would be relevant and worthwhile. Finally, theanalysis of the institutional framework of TE supply could be furtherenhanced by giving consideration to the extent and shape of marketcompetition in the sector.
References
Aghion, P. and E. Cohen (2004), Education et Croissance. Paris: LaDocumentation Francaise.
Barr, N. (2001), The Welfare State as Piggy Bank: InformationRisk, Uncertainty and the Role of the State, Oxford University Press:Oxford.
Barth, E. and C. Lucifora (2006), ‘‘Wage Dispersion, Markets andInstitutions: The Effects of the Boom in Education on the WageStructure’’, IZA Discussion Paper No. 2181.
Becker, G.S. (1967), ‘‘Human Capital and the Personal Distribution ofIncome: An Analytical Approach’’.
Benhabib, J. and M.M. Spiegel (2000), ‘‘The Role of FinancialDevelopment in Growth and Investment’’, Journal of EconomicGrowth 5, 341–260.
Boarini, R. and H. Strauss (2007), ‘‘The Private Internal Rates of Returnto Tertiary Education: New Estimates for 21 OECD Countries’’, OECDEconomics Department Working Papers No. 591.
Boarini, R, G. Nicoletti and J. Oliveira Martins (2008), ‘‘Investment inTertiary Education: Does Labour Market Matter?’’, OECD EconomicsDepartment Working Papers forthcoming.
Cameron, S. and C. Taber (2000), ‘‘Borrowing Constraints and theReturns to Schooling’’, NBER Working Paper No. 7761.
CESifo Economic Studies, 54, 2/2008 309
Investment in Tertiary Education

Card, D. (2001), ‘‘Estimating the Return to Schooling: Progress on SomePersistent Econometric Problems’’, Econometrica 69(5), 1127–60.
Card, D. and T. Lemieux (2000), ‘‘Drop-out and Enrollment Trends in thePost-War Period: What Went Wrong in the 1970s?’’, NBER WorkingPaper No. 7658.
Chapman, B. (2005), ‘‘Income Contingent Loans for Higher Education:International Reform’’, Centre for Economic Policy Research, TheAustralian National University Discussion Paper No. 491.
De la Fuente, A. and J.F. Jimeno (2005), ‘‘The Private and Fiscal Returnsto Schooling and the Effect of Public Policies on Private Incentives toInvest in Education: A General Framework and Some Results for theEU’’, CESifo Working Paper No. 1392.
Epple, D., R. Romano and H. Sieg (2006), ‘‘Admission, Tuition, andFinancial Aid Policies in the Market for Higher Education’’,Econometrica 74(4), 885–928.
EUROSTAT (2003), ECHP UDB Description of Variables: DataDictionary, Codebook and Differences between Countries and Waves,Doc. PAN 166/2003-06, Eurostat, Luxembourg.
Freeman, R. (1986), ‘‘Demand for Education’’, in O. Ashenfelter andR. Layard, eds., Handbook of Labor Economics, Vol. 1, ElsevierPublications: Netherlands, pp. 357–86.
Goldin, C., L.F. Katz and I. Kuziemko (2006),‘‘The Homecoming ofAmerican College Women: The Reversal of The College Gender Gap’’,NBER Working Paper, No. 12139.
Heckman, J.J., L.J. Lochner and P.E. Todd (2005), ‘‘Earnings Functions,Rates of Return, and Treatment Effects: The Mincer Equation andBeyond’’, NBER Working Paper No. 11544.
Hoxby, C.M. (2005), ‘‘mimeo’’, The Effects of Geographic Integration andIncreasing Competition in the Market for College Education, Mime,Department of Economics, Harvard University.
Jacobs, B. and F. van der Ploeg (2006), ‘‘A Guide to Reform of HigherEducation’’, Economic Policy 21(47), 536–92.
Katz, L.F. and D.H. Autor (1999), ‘‘Changes in the Wage Structure andEarnings Inequality’’, in O. Ashenfelter and D. Card, eds., Handbook ofLabor Economics, Vol. 3, pp. 1463–553.
Kis, V. (2005), ‘‘Quality Assurance in Tertiary Education: CurrentPractices in OECD Countries and a Literature Review on PotentialEffects’’, in OECD Thematic Review of Tertiary Education: CountryBackground Reports (several issues); http://www.oecd.org/dataoecd/55/30/38006910.pdf.
310 CESifo Economic Studies, 54, 2/2008
R. Boarini et al.

OECD (2003), ‘‘Changing Patterns of Governance in Higher Education’’,
in Education Policy Analysis, Chapter 3, Paris.
OECP (2004a), Taxing Wages, Paris.
OECP (2004b), OECD Handbook for Internationally Comparative
Education Statistics: Concepts, Standards, Definitions and
Classifications, Paris.
OECP (2004c), Education at a Glance, Paris.
OECD (2005), Pensions at a Glance, Paris.
OECP (2006a), Education at a Glance, Paris.
OECD (2006b), OECD Thematic Review of Tertiary Education: Country
Background Reports (several issues); http://www.oecd.org/edu.
OECP (2006c), Taxing Wages, Paris.
OECD (2007), Economic Policy Reform: Going for Growth, Paris.
Oliveira Martins, J., R. Boarini, H. Strauss et al. (2007), ‘‘The Policy
Determinants of Investment in Tertiary Education’’, OECD Economics
Department Working Papers No. 576.
Psacharopoulos, G. (1995), ‘‘The Profitability of Investment in Education:
Concepts and Methods’’, The World Bank Human Capital
Development and Operations Policy Working Paper No. 63.
Romer, P.M. (2000), ‘‘Should the Government Subsidise Supply or
Demand in the Market for Scientists and Engineers?’’, NBER Working
Paper No. 7723.
Rostchild, M. and L.J. White (1995), ‘‘The Analytics of Pricing in Higher
Education and Other Services in Which Customers are Inputs’’, Journal
of Political Economy 3(103), 573–86.
Strauss, H. and de la Maisonneuve (2007), ‘‘The Wage Premium on
Tertiary Education: Micro-data Evidence for 21 OECD Countries’’,
OECD Economics Department Working Papers No. 581.
Teixeira, P., B. Jongbloed, D. Hill et al. (2004), Markets in Higher
Education: Rhetoric or Reality? Kluwer Academic Publishers,
Dordrecht.
Usher, A. (2005), Global Debt Patterns: An International Comparison of
Student Loans Burdens and Repayment Conditions, Educational Policy
Institute: Toronto, ON.
Usher, A. (2006), Grants for Students: What They Do, Why They Work,
Educational Policy Institute: Toronto, ON.
Usher, A. and A. Cervenan (2005), Global Higher Education Rankings
2005, Educational Policy Institute: Toronto.
CESifo Economic Studies, 54, 2/2008 311
Investment in Tertiary Education

Vandenbussche, J., P. Aghion and C. Meghir (2006), ‘‘Growth, Distanceto Frontier and Composition of Human Capital’’, Journal of EconomicGrowth 2(11), 97–127.
Watson, N. (2005), HILDA User Manual – Release 3.0, MelbourneInstitute of Applied Economic and Social Research, University ofMelbourne.
Winston, G.C. (1999), ‘‘The Awkward Economics of Higher Education’’,The Journal of Economic Perspectives 13(1), 3–12.
312 CESifo Economic Studies, 54, 2/2008
R. Boarini et al.