
investigation of temperature measurements in 300" to 1100" k ...
39
LOAN COPY: RETURN TO KlRTLAND AFB, N P\/IEX AfWL [WL!L-2) INVESTIGATION OF TEMPERATURE MEASUREMENTS IN 300" TO 1100" K LOW-DENSITY AIR USING A N ELECTRON BEAM PROBE . . -- by William W. Hunter, Jr. LangZey Research Center Langley Station, Hampton, Vu. :,+ > > NATIONAL AERONAUTICS AND SPACE ADMINISTRATION WASHINGTON, D. C. MAY 1968
-
Upload
khangminh22 -
Category
Documents
-
view
1 -
download
0
Transcript of investigation of temperature measurements in 300" to 1100" k ...
LOAN COPY: RETURN TO
KlRTLAND AFB, N P\/IEX AfWL [WL!L-2)
INVESTIGATION OF TEMPERATURE MEASUREMENTS I N 300" TO 1100" K LOW-DENSITY AIR USING A N ELECTRON BEAM PROBE
.. . - - by William W. Hunter, Jr.
LangZey Research Center Langley Station, Hampton, Vu.
:,+
> >
NATIONAL AERONAUTICS AND SPACE A D M I N I S T R A T I O N WASHINGTON, D. C. MAY 1968
INVESTIGATION OF T E M P E R A T U R E MEASUREMENTS
IN 300' t o l l O O o K LOW-DENSITY AIR USING
AN E L E C T R O N BEAM P R O B E
By W i l l i a m W. H u n t e r , Jr.
Lang ley R e s e a r c h C e n t e r
Lang ley S ta t ion , Hampton , Va .
NATIONAL AERONAUTICS AND SPACE ADMINISTRATION
Far sale by the Clearinghouse far Federal Scientific and Technical Information Springfield, Virginia 22151 - CFSTI price $3.00

INVESTIGATION OF TEMPERATURE MEASUREMENTS
IN 300° to l l O O o K LOW-DENSITY AIR USING
AN ELECTRON BEAM PROBE * By William W. Hunter, Jr. Langley Research Center
SUMMARY
Laboratory measurements of rotational and vibrational temperatures have been performed over a range from 300° to l l O O o K in static low-density air with an electron beam probe. The tests were conducted in a unique tes t chamber which permitted the selection of various combinations of test pressures and temperatures.
Rotational-temperature measurements were made from the (0,O) band of the first negative system of the nitrogen constituent of air. Some tes t s were also performed by using the (0,l) band of the first negative system of nitrogen. No substantial differences were noted between the resul ts of the (0,l) band tests and those of the (0,O) band tests.
The accuracy of the measured rotational temperatures was found to vary with gas temperature and gas number density. A difference existed between the measured rota- tional temperature and the gas temperature. This difference increased with increasing gas temperature. With the inclusion of an experimentally determined correction for the gas-number-density effect, the rotational-temperature measurements were made with an accuracy that varied from approximately 0 to -6 percent with increasing gas temperature.
Vibrational-temperature measurements were made by using the intensity ratios of the (0,l) and (1,2) bands of the first negative system of nitrogen. The measurements were found to be within *20 percent of the gas temperature.
INTRODUCTION
The present investigation was undertaken as part of a continuing instrument develop- ment program of the Langley Research Center. This particular effort was directed
* Part of the mater ia l presented in this report is included in a thesis entitled "Measurement of NzXICi Rotational and Vibrational Temperatures Over a 300° K to l l O O o K Range Using a High-Energy Electron Beam" submitted in partial fulfillment of the requirements for the degree of Master of Ar ts in Physics, The College of William and Mary in Virginia, August 1965.

towards the verification of a technique fo r measuring free-s t ream temperatures of low- density hypersonic wind tunnels which use air or nitrogen.
The technique consists of passing a beam of high-energy (10- to 30-kV) electrons through a low-density gas. The electrons have inelastic collisions with gas molecules and these excited ionized molecules provide fluorescence. A spectral analysis of the fluorescence provides a means for determining molecular gas rotational and vibrational temperatures.
The initial investigator, E. P. Muntz (ref. l), experimentally verified his theoreti- ca l model for the electron beam probe technique for two temperatures, -300° K and 373O K. These experiments were conducted in a low-velocity (0.5-m/sec) flow of nitro- gen gas, and the data were obtained from the (0,O) band of the first negative system of nitrogen. Since the original work, others (refs. 2, 3 , 4, and 5) have used the technique for diagnostic wind-tunnel measurements. In reference 4, the calculated tunnel param- e t e r s are compared with the measured rotational temperatures as a test of the theory fo r temperatures below 300° K.
The purpose of the present work was to verify experimentally the theory for rotational- and vibrational-temperature measurements for a range of temperatures f rom 300° to l l O O o K under controlled conditions in the laboratory. in a static test gas, air. obtained from the (0,O) band of nitrogen. Rotational-temperature measurements were also made from data obtained from the (0,l) band of the first negative system of nitrogen for comparison with resul ts obtained from the (0,O) band. The vibrational-temperature measurements were made from data obtained from the (0,l) and (1,2) bands. Tests were conducted in nitrogen as well as in air to determine whether there were any significant differences in the resulting temperature measurements.
These tests were conducted The rotational-temperature measurements were made from data
SYMBOLS
(A) t e rm defined by equation (25)
transition probability for emission between rotational energy s ta tes Kf A K ' K ~ and KS (see eq. (23))
Anm transition probability for emission between s ta tes n and m
AV'VZ transition probability for emission between vibrational energy s ta tes vf and vs
2

rotational constant related to vibrational level vy = 0
electronic wave function for N2B + 2 + Cu
rat io of excitation function to depopulation rate of N2B + 2 + Cu state
excitation function which described electron-molecular excitation process
speed of light
characterist ic energy of rotational energy level Ky
characterist ic energy of vibrational energy level v" 1
electron charge
initial wave function of primary electron
final wave function of primary electron
wave function of secondary electron
rotational t e rm (ref. 9)
defined by equation (30)
vibrational t e rm (ref. 9)
Planck's constant
intensity of emission for transitions between K' and Ki rotational energy levels
intensity of emission for transitions between n and m states
reference intensity of emission
intensity of emission for transitions between v' and v; vibrational energy levels
3

quantum number of total angular momentum
rotational quantum number
change of rotational quantum number
Boltzmann's constant
quantum number of a component of total angular momentum
steady-state number density population of a rotational energy level
number density population of state n
steady-state number density population of N2X1C' g
steady-state number density population of a vibrational energy level
neutr a1 nitrogen
ionized nitrogen
excited ion state of N2
ground state of N2
ground state of N2
gas number density
reference gas number density, 3 X
relative rotational line strength for excitation
relative rotational line strength for excitation for R branch and P branch,
+
+
cm-3
respectively
relative rotational line strength for emission
4

Pvf $1
Qr
Qv
R
Rij
rn
T
Tr
TV
V
W
band strength
rotational partition function
vibrational partition function
Franck-Condon factor
momentum transfer t e rm
depopulation rate of N2B + 2 + Cu
electronic transition moment for electronic states i and j
nuclei separation
distance between primary and ith orbital electrons
distance between primary and secondary electrons
position vector of ith orbital electron
position vector of primary electron with respect to point of observation
position vector of secondary electron with respect to point of observation
position vector of secondary electron with respect to molecular axis
Hbl-London factor (ref. 9)
gas temperature
rotational temperature
vibrational temperature
vibrational energy state
constant defined in equation (26)
5
I

constant in equation (23)
electronic wave function for N2X 1 + Cg
constant defined in equation (29)
constant in equations (1) and (31)
Euler angles
quantum number of resultant electronic orbital angular momentum
wave number
reference wave number
wave number of (n,m) transition
wave number of (VI,;;) transition
angular character is t ics of an orbital electron of N2X1Ci (ref. 9)
electronic- state wave function
molecular wave function
rotational-state wave function
vibrational-state wave function
Superscripts :
1 excited ionized s ta te of nitrogen, N2B 2 + Cu
I t ground s ta te of neutral nitrogen or ionized nitrogen
Subscripts:
a vibrational energy state a of excited ionized nitrogen
b vibrational energy state b of excited ionized nitrogen
6

1 + N2X Cg ground s ta te of neutral nitrogen,
ground state of ionized nitrogen, N2X 2 + Zg
EXPERIMENTAL SYSTEM
Test Chamber and Control System
The test chamber and control system, shown in figure 1, was designed to provide flexibility in temperature and vacuum test conditions. Temperature and pressure oper- ating ranges are approximately 300' to llOOo K and 6.7 to 133.3 X N/m2.
Figure 1.- Experimental apparatus. L-66-7099.1
7
I

IIIIIIII l l l l l l I I
The major component of the system is the tes t chamber (fig. 2), which consists of three concentric cylinders. The outer cylinder is a stainless-steel water-cooled jacket and is fitted with vacuum-tight water-cooled top and bottom covers. Each cover is fitted with large flanges, attached to extensions, for mounting test hardware. Three 7.6-cm- diameter optical-grade-quartz windows are located in the outer cylinder wall. The next concentric cylinder consists of a helically wound nickel-ribbon heating element and is attached to ceramic supporting rods. Electrical connections a r e made to copper electrodes which extend through the outer cylinder. diameter, 38-cm-long stainless-steel electrostatic shield and is grounded together with
The inner cylinder is a 20-cm-
ldner cylinder
Ceramic support
Figure 2.- Test chamber and electron g u n
8

the outer cylinder to prevent charge buildup on the walls. Also, the inner cylinder pro- vides a more uniform heating surface for the tes t gas than would be provided by the rib- bon heating element. The inner cylinder is equipped with end covers which have openings for passage of the electron beam. A 3.8- by 1.3-cm slit opening is provided in the cylin- de r wall and is located in line with one of the viewing windows of the outer cylinder.
Rectified heater current is supplied from a 440-V ac three-phase system. Temper- ature control is provided by coarse and fine rheostats. Temperature is regulated within &1 percent of the preset value by an on-off automatic pyrometer. An operating tempera- tu re of llOOo K is obtained for a heating-element voltage of 35 V dc and a current of 50 amperes.
A 35-psi (241-kN/m2) water-cooling system provides a heat sink for the outer chamber wall and covers and cools the diffusion pump. An interlock system prevents operation of the heating system and diffusion pump unless proper cooling flow is established.
A 5-ft3/min (0.002-m3/sec) mechanical pump, 750-liter/sec (0.75-m3/sec) diffu- sion pump, cold t rap, and necessary isolating valves comprise the vacuum pumping sys- tem. A variable leak valve with air dryer , in combination with the mechanical pump, was used to maintain the tes t chamber at the desired pressure. chamber pressure was measured with a McLeod gage.
For all experiments, the
Test-Chamber Temperature Survey
A se r i e s of tests was conducted to establish the test-chamber gas temperature. First, a survey of the inner-cylinder wall w a s made to determine the temperature varia- tion of the heating surface. to the inner-cylinder wal l and located to give reasonable coverage. The resul ts indicated that a &20° variation existed at l l O O o K. temperature.
This survey w a s performed with 12 thermocouples attached
This variation decreased with decreasing
The inner-cylinder ends were not in close proximity to the heating element and were, therefore, cooler than the side walls. effects of these cooler surfaces on the test gas at the point of observation. A thermo- couple was located on the bottom end plate near the chamber center line. The tempera- tu re of this point was the lowest temperature of the plate. The temperature along the center line was calculated from a solution of Laplace's equation in cylindrical coordinates. It was assumed in this solution that the temperature varied linearly along the length of the cylinder and was constant about the circumference. This assumption was justified on the basis of the data obtained from the tests described in the preceding paragraph.
The second test was made to determine the
9

The resul ts of the calculations show that the effects of the inner-cylinder ends would lower the gas temperature at the midpoint of the cylinder no more than 4 O at l l O O o K.
The final test was a direct measurement of the test gas translational temperature (hereafter re fer red to as gas temperature) at the point of observation. These measure- ments were made with a thermocouple whose leads were brought in along the chamber center line and the junction located at the point of observation. Two thermocouple s izes , 0.1-mm and 0.5-mm diameter, were used t o determine whether there were significant heat losses due to thermocouple conduction at the point of observation. The data show that conduction losses were negligible. The resul ts are indicated in figure 3 , which is a plot of the difference between the gas temperature, measured with the thermocouples, and the reference wall temperature as a function of the test-chamber inner-cylinder reference wall temperature. These data show that the gas temperature at the point of observation is lower than the reference wall temperature. This difference decreases with a decrease in temperature and is attributed to heat sinks provided by the observation and pumping ports.
K
I
I-
- 20
-16
-12
- 8
-4
0
Gas (air) Thermocouple number density, diameter,
cm-3 mm
o 5 x I O ' ~ ( ~ ~ P . I ) n 5 x 10 '~ (exp .2 )
I x 1 0 ' ~ ( e x p . 1 ) A I x 1016(exp.2)
r
7 4 6 8 IOXIO"
Figure 3.- Test-chamber wall temperature as a function of difference between wall temperature and gas temperature.
Electron Beam System
The electron gun (fig. 4) is a conventional point cathode system which has a directly heated hairpin tungsten filament, independent negative grid bias for current control, and cathode focusing. The beam is magnetically focused and deflected upon passage into the
10
. _.. . . . . . II I 1 1 1 1 1 1 . 1 - 1 . 1 I

drift tube. The focused beam passes through a 1.0-mm-diameter hole in a 2.5-cm-long plug which is placed in the end of the drift tube. this passage through the plug, the test chamber may be operated at pressures up to 133 N/m2 while the gun is maintained within acceptable pressure range, 52.7 cN/m2.
The beam system was operated at potentials between 25 and 30 kV and currents
Because of the low gas conductance of
between 1.0 to 1.5 mA. The beam potential and currents were held constant within *1 per- cent of the selected values for all tests.
Lower deflection
upper
Anode deflection co i l Drift tube
High- Anode
._ r i . ..,-
Figure 4.- Electron g u n and anode assembly. L-68-810
Optical and Electronic Detector System
The major component of the optical and electronic detector system is the 0.5-meter scanning spectrometer. This instrument has 16.0-W./mm dispersion in the first order and 0 . 2 - i resolution. A 13-stage venetian-blind photomultiplier tube which has an S-13 spectral response characterist ic is mounted at the exit slit. The photomultiplier output is fed into an electrometer amplifier which drives a strip-chart recorder . The overall response of the system is approximately 1 second. system was relatively slow, a 5-&'min scanning speed was used.
Because the response of the available
ROTATIONAL- TEMPERATURE MEASUREMENTS
Tes ts
Rotational-temperature measurements were made in air from the (0,O) band of the first negative system of nitrogen at approximately looo intervals f rom 3000 to 1000° K. Two se t s of tests were performed with a constant gas number density of 1 x 1016 cm-3 and the other set, with a constant gas number density of 5 X 1015 cm-3. Typical spectral t races are shown in figure 5. For all rotational-temperature tests, the width of the spec- t rometer entrance slits were selected so that the intensity of each line could be determined from the peak value of each line.
The procedure for obtaining the rotational-temperature measurement was to deter- mine the relative peak value of a rotation spectral line and to enter this value for IK'K;
11

I1 Ill I1 I I I
N; ( 0 , O ) band temp., 300" K t
Intensity
- Decreasing wavelength Band Or ig in ,3910 4 N; ( 0 , O ) band temp., 800 O K
Intensity
- Decreasing wavelength
Figure 5.- Typical spectra of N;(0,0) band. R branch .
into the following equation, which is derived in the appendix:
IK' K;/'. A plot of the value of -2.3 loglo ~. against K f ( K f + 1) provides
(K' + K; + 1)pl(.pO)q a datum point for each spectral line. The two curves in figures 6 and 7 are obtained by a least-squares fit to the data points. One curve represents the odd K' lines (strong line system) and the second curve represents the even K' lines (weak line system). The
BOhc slopes of the curves are equal to - , and from this equality the rotational temperature
kTr Tr is determined. The final value of the rotational temperature is determined from a weighted mean of the values obtained from the two curves. The weighting is in accordance
12

0 100 2 0 0 3 0 0 4 00 500 600 K ' ( K ' t I)
Figure 6.- N$(0,0) band data for 300' K experiment for Tr measurements.
I
0 0
i I i,
I O 0 200 300
Exp res-
0 Strong l ine sys tem; Tr = 8 2 2 " K ~ Weak l i ne s y s t e m ; Tr =824" K
W e i g h t e d m e a n Tr = 8 2 2 " K
-
-
~
- - Test chamber
- Wall t empera tu re , 866" K
- Pressure , 55.8 N/m' -
400 500
K' ( K ' + I )
1 i 600
i 4
i 700
Figure 7.- N;(0,0) band data for 8Wo K experiment for Tr measurements.
13

with the standard deviation of each curve with respect to its best straight-line f i t to the data points. It should be noted that the quantity [G](v/voy (see table 1) is temperature dependent and that an iteration process is required in the determination of the rotational- temperature value.
The test data are given in figures 8 and 9 as plots of the percent difference between the weighted-mean value of the rotational temperatures and the gas temperature as a func- tion of the gas temperature. The gas temperature is the wall temperature of the chamber corrected in accordance with figure 3. Two points should be noted. The first point is that the general trend of the data indicates a uniform variation in the percent difference between the measured weighted-mean value and the gas temperatures with increasing gas temperature up to approximately 1000° K. There are two data points i n figure 8 at approximately 1050' K which do not follow this trend. This is attributed to the fact that equation (1) as originally derived is assumed to hold for temperatures up to 800° K (ref. 1) and, therefore, would not apply rigorously for higher gas temperatures. The second point is that the measured rotational temperature is high at ambient temperature and that the difference increased with an increase in gas number density. This resul t indicated
0
0
200 400 600 800 I O 0 0 T, O K
! 1200
Figure 8.- Results of Tr tests for temperatures of 300' to 1O0Oo K. Gas number density of 5 X 10¹⁵
14
0
0 Exp. I
0 Exp.2
- 41 I I I I 200 400 600 800 I O 0 0
T, O K
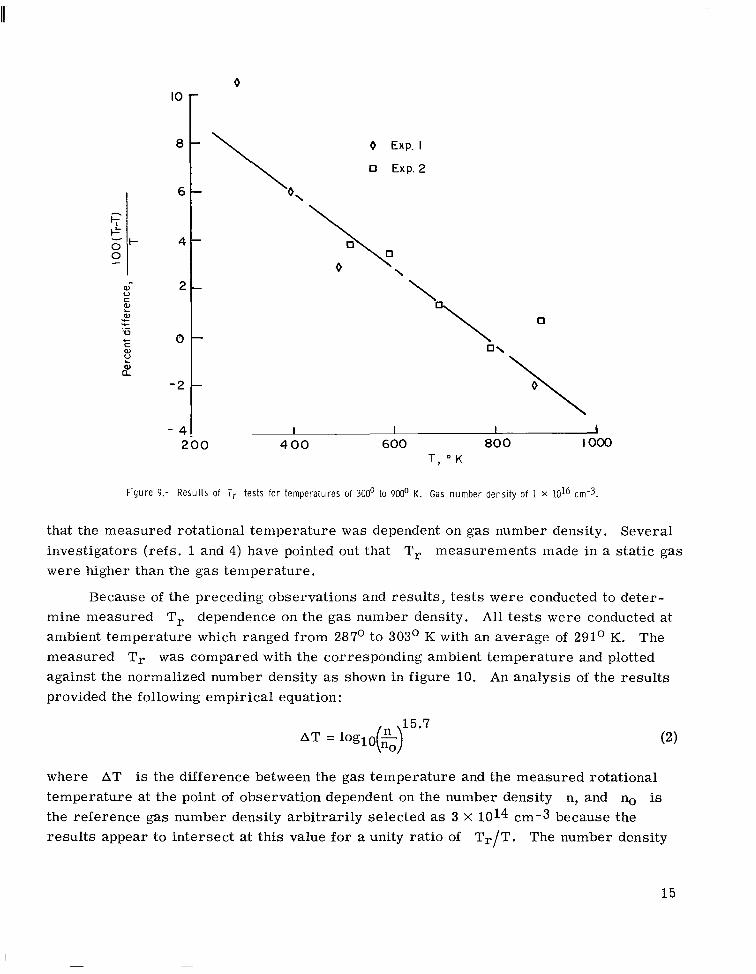
Figure 9.- Results of Tr tests for temperatures of 300' to 900' K. Gas number density of 1 x 10l6 cm-3.
that the measured rotational temperature was dependent on gas number density. investigators (refs. 1 and 4) have pointed out that were higher than the gas temperature.
Several
Tr measurements made in a static gas
Because of the preceding observations and resul ts , t es t s were conducted to deter-
The mine measured Tr dependence on the gas number density. Al l tests were conducted at ambient temperature which ranged from 287' to 303' K with an average of 291° K. measured T r was compared with the corresponding ambient temperature and plotted against the normalized number density as shown in figure 10. An analysis of the resul ts provided the following empirical equation:
where AT is the difference between the gas temperature and the measured rotational temperature at the point of observation dependent on the number density n, and no is the reference gas number density arbi t rar i ly selected as 3 X 1014 cm-3 because the resul ts appear to intersect at this value for a unity ratio of T r /T . The number density
15

0 E x p . I 0 r x p . 2
0.9 1 I I I I I I I I I I I 1 I I I I I I I
I x IO0 I x IO' I x IO2
n/n,
Figure 10.- Dependence of Tr on gas number density. no = 3 X 1014 cm-3.
n is limited to the range, On the basis of experi- mental observations, this increase in temperature is assumed to be a function of number density only and to be independent of gas temperature. Therefore, as the gas tempera- tu re increases, the change in Tr due to number density would become relatively small .
Equation (2) is assumed to be applicable to only the physical conditions of the tests
3 X 1014 cm-3 5 n 5 3 X 10¹⁶ ~ m - ~ .
reported herein. That is, effects of beam current, beam potential, and the distance of the observation point f rom the exit aperture of the electron gun were not included. All observations were made at a point 30 cm from the gun exit aperture, a beam current of 1100 PA, and a beam potential of 28.5 kV. greater will be the beam spreading for a given gas number density. If the gas heating should be dependent on the beam electron current density, spreading will be an important factor. It should be pointed out that changing the beam current by a factor of 2 did not change the measured Tr value within experimental precision. Also, the temperature of the gas at the point of observation is a function of a temperature gradient and, therefore, beam spreading again may be a factor because it could alter the gradient. However, until the exact molecular energy exchange mechanism o r process is determined, tests should be conducted for each tes t configuration. The molecular heating mechanism must be determined in order to know conclusively the effects on the rotational temperature measurements in a flowing gas.
The greater the distance from the aperture the
Tests s imilar to those of reference 4 were conducted with a dove pr ism. The dove pr ism was used to rotate the beam image so that it was perpendicular to the spectrometer
16

entrance slit. Al l other tes t s were conducted with the beam parallel to the entrance slit. The purpose of these t e s t s w a s to obtain some quantitative information about the effects of secondary electrons by imaging the beam perpendicular to the entrance slit. Thereby, the fluorescence due to primary electrons was reduced and the fluorescence from the halo region about the beam center which is attributed to secondary electrons was increased. Within the experimental precision of this work, no difference was noted between T r measurements taken with the beam image perpendicular and those taken with the beam image parallel t o the entrance slit. be drawn about the effects of secondary electrons.
This result did not permit any definite conclusions to
Results and Discussion 1
Corrections in accordance with equation (2) were applied to the measured rotational temperatures. The corrected resul ts are shown in figure '11 which is a composite plot of data shown in figures 8 and 9. The resultant scat ter of data has been reduced from +10 t o -4 percent (figs. 8 and 9) to +2 to -6 percent (fig. 11). Also, the data a r e approximately grouped about a common curve. A slight difference in the data still exists for the two different densities. This difference can be attributed to the inaccuracy of equation (2)
Gas (air) number density,
c m - 3
0 5~ 1015 N: (0 ,O) band (air)
O I x IO'O N: (0,o) band (air), (exp. I )
0 I x IO'O N; (0 ,O) band (air) (exp.2) 6r
41
-4
-6 200
0 0
a X
El n \
Y
Figure 11.- Results of Tr tests corrected for gas-number-density effect for temperatures of 300' to 1000° K.
17

because of the experimental uncertainty associated with the data on which its derivation is based. The corrected resul ts still indicate a slightly increasing difference between gas temperature and the measured rotational temperature. An analysis of equation (1) does not reveal any apparent sources of this difference. There are two possible causes. The first is possible experimental e r r o r . Careful analyses of all experimental apparatus have been made, and reasonable confidence has been established. The second possible source is found in the formulation of the theory leading to equation (1). The excitation- transition process is complex and no direct account of the effects of secondary-electron excitation processes has been made. Also, it was assumed that the rotational levels of the ground molecular s ta te N2X1C' a r e in thermal equilibrium. Because a tempera- g ture difference does exist between the gas temperature and the measured rotational tem- perature, there will exist a population distribution of the rotational levels at the point of observation which is at least slightly non-Boltzmann (ref. 6). A slight deviation from a Boltzmann distribution would not be detected within the obtainable experimental precision but would affect the measured rotational-temperature value.
Additional T r measurements were made in low-density nitrogen gas. The resul ts of these measurements are shown in figure 11 for comparison with those measurements made from the nitrogen constituent of low-density air. There does not appear to be any significant difference between those measurements performed in air and those performed in nitrogen. This result is what would be expected because nitrogen is the primary con- stituent of air and collision quenching of the fluorescence of the f i r s t negative system of nitrogen by other constituents of air would not be a problem unless it was selective and greatly disturbed the relative molecular number density population of the excited state of nitrogen .
the (0,l) band of N l . The data reduction was performed in the identical manner described in the preceding sections. The values for [ G ] ( v / v ~ ) ~ used in equation (1) a r e given in table 2. The resul ts a r e plotted in figure 11 for comparison with other results. No apparent difference exists between Tr measurements made from the (0,O) band data and those made from the (0,l) band data.
Rotational-temperature measurements were also made from the data obtained from
A relative precision of *5 percent was estimated for these measurements. The factors affecting the relative precision of the measurements were the uncertainties in gas number density, gas temperature, and rotational temperature values obtained from the graphic solutions. A value of *2 percent was calculated for the effects of density and gas temperature, and *3 percent was estimated for the uncertainty of the measured tempera- tu re based on standard e r r o r values obtained from a large number of independent measurements.
18

I
VIBRATIONAL- TEMPERATURE MEASUREMENTS
Tests -!-
The (0,l) and (1,2) bands of N2 were selected for the vibrational-temperature measurements because there is no overlapping of second positive systems of N2 at the test temperatures and because these bands are sufficiently intense to permit reasonably accurate intensity measurements. The test chamber was set to the desired temperature and a spectral trace, s imilar to that shown in figure 12, was obtained with a relatively wide spectrometer entrance slit. it permitted sufficient instrument spectral resolution to distinguish the N2 bands and provided a strong light level at the spectrometer photomultiplier cathode. The relative intensity of each band was determined by mechanically integrating the total area enclosed by each band envelope. For rotational temperatures greater than 400' K, it was neces- sa ry to correct the measured areas of each band because of the overlapping of the (0,l) band onto the (1,2) band. The relative intensity value, as determined from the spectral t races , was applied to the curve shown in figure 13, which is a plot of intensity ra t io of the (0,l) band to the (1,2) band as a function of the vibrational temperature. This curve was calculated from the following equation:
A slit width of 250 microns was used for these tests because -!-
V" 1
The derivation of this equation and a general discussion of the theory leading to its der i - vation a r e given in the appendix. Tests were conducted f o r gas temperatures of approxi- mately 300° K, 700' K, and l l O O o K. The measured intensity ra t ios of the (0,l) band to (1,2) band a r e plotted against gas vibrational temperature in figure 13. ra t ios were corrected for variation in the spectral response of the detector which was determined from a calibration made with a standard lamp. The correction factor was 0.97.
The intensity
Results and Discussion
Normally, when the electron beam technique is used, the vibrational temperature is not known. Therefore, the measured intensity ratio is plotted as a point on the curve in figure 13, and the corresponding temperature is determined. The precision of the
19

Ng(O.1) band I \
1200
1000
.y 800-
I-’
e
& 600- c 0
E
.- 5
c
- 0
c
400- >
/ Band o r i g i n , 4 2 7 4 [
-
-
Figure 12.- Typical unresolved spectrometer trace of (0,U and (1,2) bands of N;. T =: 300’ K.
2ooL 0 3 6
Intensity of N:(O,I) bond
Intensity of NZx2) bond
Figure 13.- Vibrational temperature as a function of intensity ratio of (0,l) band to (1,2) band of N;.
20
measured temperature is determined by the precision of the measured intensity ratio. The main factor affecting this precision is the ability to account properly for the over lap of the (0,l) band onto the (1,2) band. For rotational temperatures below 400° K, accounting for the overlap is not a significant problem, but the limitation is the precision of the mechanics of measuring the area under the spectral envelope of each band. It is interesting to note that in hypersonic test facilities in which this technique can be applied, a nonequilibrium condition exists between rotational and vibrational energy states. This nonequilibrium condition is such that the rotational temperature is less than 400' K, but the vibrational temperatures are much greater. Therefore, a precise determination of intensity ratios can be made.
Another factor en ters into the uncertainty of a vibrational temperature determined by this method. This factor is the accuracy of the transition probabilities used in deter- mining the curve in figure 13 from equation (3). The accuracy of the transition probabili- ties is usually taken to be between 10 and 20 percent; a 15-percent value is taken for this work.
The total uncertainty of vibrational temperatures determined with this technique may be as large as 20 percent. a fairly good estimate because the largest e r r o r was approximately 16 percent.
The resul ts of these tes t s show that this uncertainty is
DISCUSSION OF RESULTS
Two significant resul ts were noted in the work reported here. Neither result was predicted by the theoretical model developed by Muntz (ref. 1) for measuring rotational temperatures.
The first result is that the measured rotational temperature is a function of the gas number density. A theoretical explanation for this result is not known but it is apparent that there is an energy increase, o r redistribution, in the rotational energy s ta tes of the molecules as the gas number density is increased. This increase or redistribution of energy could be a result of the excitation process. It is questionable whether this effect is due to the fast primary electrons, the lower energy secondaries, or both. However, Culp and Stair (ref. 7) recently performed experiments with low-energy (19- to 300-eV) electrons, which indicate that low-energy secondaries could be responsible. A portion of the secondary electrons is believed to lie in the energy range, 220 eV (ref. 8). The experimental resul ts of Culp and Stair showed that the measured rotational temperature was a nonmonotonic function of the electron energy in the energy range of their investigation,
The second resul t is that the difference between the gas temperature and rotational temperature increases with an increase in gas temperature. The general trend of this
21

difference is indicated in figure 11 which shows that the rotational temperatures are lower than the gas temperatures. In order to obtain this result , it is necessary for the popula-
tion of the upper quantum states to be decreased by some mechanism. The resul ts of reference 4 appear t o indicate a continuation of this trend in the low-temperature region, S3OO0 K, i n which the rotational temperature is increasingly greater than the gas tempera- t u re for decreasing gas temperatures. This resul t is important because it indicates that some significant contribution to the excitation process is not accounted for in the present theory. It remains to be determined whether this resul t is due to a second-order effect which could be attributed to excitation by the fast primary electrons, to excitation by the secondary electrons, o r to some other process.
tion of the lower rotational quantum states of N2X ' 2 + Cg to be enhanced or for the popula-
Despite the differences noted in the preceding discussion, the present theory can be used for rotational-temperature measurements over the temperature range investi- gated with the expectation that the resul ts will be within * lo percent of the t rue value. It is also believed that these resul ts are pertinent to measurements performed in a flowing gas. To establish the relation between measurements i n a static gas and those in a flowing gas, additional theoretical and experimental investigations a r e required. There- fore , it is essential to establish a theoretical description of the observed resul ts and, on this basis, to ascer ta in the effects in a flowing gas.
CONCLUDING REMARKS
Laboratory measurements of rotational and vibrational temperatures have been
The tests were conducted in a unique tes t chamber which permitted the performed over a range from 300' to l l O O o K in static low-density air with an electron beam probe. selection of various combinations of test pressures and temperatures.
Rotational-temperature measurements were made from the (0,O) band of the first negative system of the nitrogen constituent of air. Some tes t s were also performed using the (0,l) band of the first negative system of nitrogen. No substantial differences were noted between the resul ts of the (0,l) band tes t s and those of the (0,O) band tes ts .
The accuracy of the measured rotational temperatures was found to vary with gas temperature and gas number density. A difference existed between the measured rota- tional temperature and the gas temperature. This difference increased with increasing gas temperature. With the inclusion of an experimentally determined correction for the gas-number-density effect, the rotational-temperature measurements were made with an accuracy that varied f rom approximately +2 to -6 percent with increasing gas temperature.
22

Vibrational-temperature measurements were made by using the intensity ra t ios of the (0,l) and (1,2) bands of the first negative system of nitrogen. The measurements were found to be within *20 percent of the gas temperature.
Langley Research Center, National Aeronautics and Space Administration,
Langley Station, Hampton, Va., November 1, 1967, 125-24-03-22-23.
23

APPENDIX
THEORY
General
The test gas used in this investigation was air, and the pr imary sources of visible and near-ultraviolet radiation were the first negative and second positive systems of nitrogen. The excitation and emission path for the first negative system is illustrated by the energy-level diagram in figure 14. A high-energy electron, designated as a primary electron, is emitted by a source and has an inelastic collision with a ground-state nitro- gen molecule, N2X1Ci. The molecule is excited to the excited ionized electronic state, N';B2Cz, f rom which it spontaneously radiates and drops into the ground energy state of the ion, N;X2Ci. The intensity and spectral distribution of the spontaneously emitted
I I
Vl.2 I
vg=2 I J v;=i -
I I I 1
N; B~ C: z I I
Figure 14.- Partial energy-level diagram of nitrogen.
24

APPENDIX
radiation reflects the rotational and vibrational characterist ics of the molecules that were in the N2Xl.Z; state.
intensity of emission equation Rotational and vibrational temperatures may be obtained from an application of the
where Nn is the number density population of the initial level of transition, hcv, is the energy of the emitted radiation as a result of the transition between states n and m, vnm is the wave number of the emitted radiation, and An, is the transition proba- bility of emission. All t e r m s of equation (4) except Nn are constants or are dependent only on the particular transition involved. Application of equation (4) requires the deter-
On the basis of the arguments presented in reference 1, it is assumed that NiB2Ci
mination of the population and its distribution in the initial electronic state, N2B + 2 Cu +*
is populated primarily by neutral molecules in N2X1C'g. Population contributions from other possible origins a r e neglected. Therefore, the population of the rotational energy states of NzB2Cz is determined by the excitation-transition process of N2X1Ci molecules.
The excitation-transition process may be described through a Born-Oppenheimer approximation of the molecular wave function
where qe is the electronic wave function with the ith electronic coordinate Ti re fer - enced to the molecular axis, is the vibrational wave function with nuclei separation rn , and +JAM (O,x,@). The Euler angles relate the molecular coordinate system t o the coordinate sys- tem of the fixed point of observation. Also, it is assumed that the interaction of the pri- mary electron with the orbital electrons can be described by a coulombic potential. Therefore, the following matrix element of this interaction may be used to describe the excitation:
qV is the rotational wave function which is a function of the Euler angles
In this expression, ep and gp represent the initial and final wave functions of the primary electrons, e, represents the secondary electron, XlC; and B2EA repre- sent the initial and final electronic wave functions, v" and v' represent the vibrational
25

APPENDIX
I$ states, and J"R"M" and J'R'M' represent the rotational states. Of course,
is the coulombic interaction t e rm in which the quantity rli is the distance between the high-energy primary electron and the ith orbital electron.
i
Because the particular transition of interest resu l t s in the removal of one orbital
electron, for simplicity
denotes the removed electron. The electronic state N2B Cu is formed f rom the elec- tronic s ta te NzXICi by the removal of a ou2s orbital electron (ref. 9). Therefore, the electronic state may be expressed as XICi E B2Czou2s. Expression (6) is now rewritten as
1 will be replaced with - where the subscript 2 2 'li '12 + 2 +
Note that K has been used in place of J. This substitution may be made by considering the applicable coupling scheme which is Hund's case (b) (ref. 9) and by suppressing the spin angular momentum.
In order to evaluate this matrix element for high-energy pr imary electrons, a plane-wave approximation is made for the primary-electron wave functions, and the inte- gration over the primary-electron coordinates is performed. This integration gives (ref. 10)
where S is the momentum transfer and F2 is the position vector of the interacting
orbit electron. A se r i e s expansion of elqar2 gives .- -
iq.1;2 = 1 + i q . r 2 - - q . r 2 I - 1(- - )" + . . . 2 e (9)
In a f i rs t -order approximation, the first two t e r m s of this expansion a r e retained. But the contribution to the matrix element by the first t e rm in equation (9) is zero because of the orthogonality of the initial and final s ta tes of the molecule. Therefore, equation (7) is given by
26

I
APPENDIX
In order to evaluate expression (10) further, the vector F2 is transformed to the - coordinates of the molecular axis through the dyadic F>(O,x,@) which relates the molec- ular coordinate axis to the fixed coordinate system of the point of observation. Therefore, expression (10) is rewritten as
where F;* is the position vector of the secondary electron with respect to the molecular
axis. The square of the absolute value of the t e rm - i4re2q is contained in an excitation
function Ce and will be suppressed in the following equations. q2
Evaluation of expression (11) shows that for A' = A" = 0, AK = kl transitions a r e allowed, whereas the AK = 0 transition is forbidden, as assumed in reference 1. Also, further analysis of expression (10) in the form of expression (11) by using higher order t e rms of equation (9) indicates that transitions for AK = *3, AK = *5, and so forth, a r e also allowed. Of course, the magnitude of the c ross sections for the excitation-transitions for AK = *3, AK = k5, and so forth, will determine the contribution to the population of the excited state. This contribution is expected to be small.
The square of the second matrix element in expression (11) is defined as the band strength or the vibrational transition probability and is designated Pv(vi~. This band strength may be approximated by assuming a mean value of the internuclear separation and may then be written as
The overlap integral of the vibrational wave functions squared 1 ( ~ ' 1 v ' ' ) ) ~ is the Franck- Condon factor, qvTvy7. Generally, equation (12) is then expressed as
Pv'v'? = lRij ( 2 q v ~ v ~ t
In order to take into account the variation of internuclear separation,
(13)
a method of F cen- troids (ref. 11) is used where I; is the expectation value of the internuclear separation r n as determined by the vibrational wave functions. Now, the band strength is given by
27

APPENDIX
where N,? is the number density population of the initial vibrational level, v t 1 7 is the wave number of the resultant radiation of the transition, and Avfv~t
2 probability of spontaneous emission for transitions between the initial vibrational level v' and a terminal vibrational level v i .
which are excited to NiB2Ci as a result of inelastic electron collisions. Therefore,
N,' and the number density population of the vibrational energy states, Nvy, of N2X1C& The steady-state relation between N,t and Nvf? as a resul t of inelastic electron-N2 collision is given by
v2 is the transition
For this work, it is assumed that N2Xl.Z; is the pr imary source of molecules
and the resultant intensity of spontaneous emission are dependent on the. distribution
1
where the product Ce 1 Pvfv,; describes the excitation and transition process between
vy and v'. The t e rm Ce is an excitation function, Pvtv; is the vibrational band strength described in the preceding section, and R is the depopulation rate. The t e r m C,/R will be designated ee henceforth. Lf it is assumed that the N2X1Ci vibrational energy states a r e in thermal equilibrium, the number of molecules in a given N f f
V 1 tional state is given by a Boltzmann distribution
V';
vibra-
N ~ ' ; = 2 e -EvY/kTv
is the "state sum" or partition function, Evy = Go v1 hc is ( I?
where Qv = >7 e -EvY$Tv
V;;
the characteristic energy of the v'; level, G o p i ) is the vibrational te rm, No is the steady-state population of N2X172+ and T, is the vibrational temperature. with the substitution of equation (19) into equation (18), the dependence of Nvi T, of N2X1Ci is established, and the relation between the vibrational temperature of N2X1Ci and the intensity of spontaneously emitted radiation (eq. (16)) can be determined.
Therefore, g,
on the
It is not necessary to make absolute-intensity measurements because T, may be determined from the rat io of intensities of two vibrational bands. The resultant equation, as derived from equations (17), (18), and (19), is
29

APPENDIX
Note that Ce, No, and Qv canceled in the preceding rat io because these t e r m s are independent of a particular v',vy transition. Therefore, with equation (20), the variation of the intensity ra t io as a function of T, may be calculated. As a n example, the calcu- lation for the intensity ra t io for the (0,l) to (1,2) bands is shown in figure 13. The t ran- sition probabilities used for this example were obtained f rom references 12 and 13.
Rotational Temperature 2 + The rotational number density, NK' , of S B Xu is a function of the excitation-
transition process, depopulation rate, and number density, NK?, of N2X1X& If it is assumed that rotational states of (ref. 9)
v'i are in thermal equilibrium, NK; is given by
I
is the rotational partition function, EK? = F(K'i)hC where Qr = 1 (2K" + l ) e
is the characterist ic energy of a rotational state, F(Ky) is the rotational t e rm, and T r is the rotational temperature. A relation to a temperature has been established through the Boltzmann factor which explicitly assumes that thermal equilibrium exists in the ground electronic state of the neutral species of N2.
- E K y p r
K'
In order to interpret this temperature dependence in the resulting intensity of radia- tion, the selection rules for transitions between various rotational energy states are applied. As a first approximation, the applicable selection rule for the excitation- transit ion process is taken to be AK = kl. The AK = *1 selection rule predicts the formation of a P branch and R branch in the rotational fine s t ructure of a vibrational band in excitation as well as emission. Figure 15 shows the R and P branches of the (0,O) band of NZ.
The following derivation is similar to that of reference 1 by E. P. Muntz. With the formation of the P and R branches, the steady-state population of NiB2C: is given
bY
30

APPENDIX
a where PRR and Pgp are the relative rotational-line strengths of absorption, pre- viously described, for the P and R branches.
With the determination of NK', the intensity of emitted radiation may be calculated as a function of the rotational temperature Tr. Before the calculation may be accom- plished, it is necessary to set up a n expression for the emission transition probability AK'K: as
(23) e A K ' K ~ = XV 3 Pv'viPR
where X is a constant, tive rotational transition probability for emission.
v is the wave number of the transition, and P i is the rela-
P Branch
Band origin, 3910i- Figure 15.- Spectrometer trace of rotational structure of N$(0,0) band. T =: 300' K.
31

APPENDIX
where
The intensity of emission for a particular R-branch transition is given by
-E K'+ l/lZTr (A) = K'e + (K' + l)e
This equation is simplified by noting that the product
where W is a constant for a particular transition. Also, the equation may be put in conventional form (ref. 9) by 2K' = K' + K';1 + 1 for R-branch t ransi- tions. Therefore,
K' + KS + 1 2(2K' + 1) Qr V;'
For Tv 5 8000 K, 99 percent of the total population is in the v'; = 0 level. Equa- tion (24) may now be written
IK' ~ $ 0 -BOK'(K'+l)hc/kTr = Yv4[GJe
K' + K: + 1
where Bo is the rotational constant related to the vy = 0 vibrational level of 1 + N2X =g,
-Ev?? kTv WPvrv;;e 1 I
Y = 2QrIo
and
32

APPENDIX
2BoK' hc/kTr -2Bo(K'+l)hc/kTr K'e + (K + l)e r i =
2K' + 1 L A
Note that a reference intensity Io has been included to permit the measurements of relative intensities. The t e rm [G] involves Tr and requires a solution of equa- tion (21) through a process of iteration.
introduced by extending the application of equation (28) to the temperature of 1000° K. This analysis was performed by calculating an effective value' for rotational constant to replace BO in equation (28).
Analysis of equation (27) also reveals that only a small e r r o r (=&l percent) will be
For ease of application, equation (28) is put in the following form:
where vo is a reference wave number used to normalize v. From reference 1, the vo value is chosen for the (3,2) transition. Also, Z is just -2.3 logloY, which is a const ant.
33

REFERENCES
1. Muntz, E. P.: Static Temperature Measurements in a Flowing Gas. Phys. Fluids, vol. 5, no. 1, Jan. 1962, pp. 80-90.
2. Sebacher, Daniel I.; and Duckett, Roy J.: A Spectrographic Analysis of a l-Foot Hypersonic-Arc-Tunnel Airs t ream Using an Electron Beam Probe. NASA TR R-214, 1964.
3. Petrie, S. L.; Pierce, G. A.; and Fishburne, E. S.: Analysis of the Thermo-Chemical State of an Expanded Air Plasma. Tech. Rept. No. AFFDL-TR-64-191, Ohio State Univ. Res. Found., Aug. 1965.
4. Robben, F.; and Talbot, L.: Measurements of Rotational Temperatures in a Low Density Wind Tunnel. Phys. Fluids, vol. 9, no. 4, Apr. 1966, pp. 644-652.
5. Muntz, E. P.; and Abel, Shirley J.: The Direct Measurement of Static Temperatures in Stock Tunnel Flows. Third Hypervelocity Techniques Symposium, Univ. of Denver and Arnold Eng. Develop. Center, Mar. 1964, pp. 51-87.
6. Kennard, Earle H.: Kinetic Theory of Gases. McGraw-Hill Book Co., Inc., 1938.
7. Culp, G.; and Stair, A. T., Jr.: Effective Rotational Temperatures of N2+ (3914 A) Excited by Monoenergetic Electrons in a Crossed Beam. J. Chim. Phys., t. 64, no. 1, Jan. 1967, pp. 57-62.
8. Muntz, E. P.; and Marsden, D. J.: Electron Excitation Applied to the Experimental Investigation of Rarefied Gas Flows. Rarefied Gas Dynamics, Vol. 11, J. A. Laurmann, ed., Academic Press, 1963, pp. 495-526.
9. Herzberg, Gerhard: Molecular Spectra and Molecular Structure. I. Spectra of Dia- tomic Molecules. Second ed., D. Van Nostrand Co., Inc., c.1950.
10. Landau, L. D.; and Lifshitz, E. M. (J. B. Sykes and J. S. Bell, trans.): Quantum Mechanics - Non-Relativistic Theory. Volume 3 of Course of Theoretical Physics, Addison-Wesley Pub. Co., Inc., c.1958.
11. Fraser, P. A.: A Method of Determining the Electronic Transition Moment for Dia- tomic Molecules. Can. J. Phys., vol. 32, no. 8, Aug. 1954, pp. 515-521.
12. Bates, D. R.: The Intensity Distribution in the Nitrogen Band Systems Emitted From the Earth 's Upper Atmosphere. Proc. Roy. SOC. (London), ser. A, vol. 196, Mar. 1949, pp. 217-250.
13. Wallace, L. V.; and Nicholls, R. W.: The Interpretation of Intensity Distributions in the N2 Second Positive and N2' First Negative Band Systems. J. Atmospheric Ter res t . Phys. (Res. Notes), vol. 7, nos. 1/2, Aug. 1955, pp. 101-105.
34

TABLE 1.- LOGlO [GJ(v/vof VALUES FOR (0,OI BAND.
I
5C.O 75.0 100.0 125.0 150.0 175.0 200.0 225.0 250.C 275.0 325.0 350.0 400.0
n 1 2 3 4 5 6 7 8 9
10
-0 .c5c7 -0.0445 -0.0325
-0.C341 -0. C 312 -0.c257
-0.0758 -0.0241 -C.O2C8 -0.0162 -0.c102 -0.0027
C.0060 0.0161
-0.0208 -0.0196 -0.0174 -0.0144 -0.0134 -9.c354
P.0?04 C.0070
-0.01 75 -0.0166 -0.01 50
-0.01 5 1 -3 .0144 -0.0131 -0.c114 -0.0092 -0 .0065 -0 .03 3 3
C.1303 0.C344 0.0090 0.0140 0.0194 0.0253 0.0316 0.0383 0.0454
-1.0133 -1.0127 -3.0117 -3.0103 -3 .0085 -2.0064 -3.0038 -5.0010
-C.0126 -0.21114 -C.O1C5 -C.OC94 -C.0079 -C.CCbl -C.C040
-0. C099 -0.0095 -0.OC38 -0.0079 -C.OC68 -C.OC55 -0.3040 -0.0323 -0.0003
C.CC18 0.0041 0.0067 o.cc94 0.0124 0.0155 0.0188
-0.0092 -0. 008 8 -0. 008 1 -0.0373 -0.0064 -0.0052 -0.CO39 -0.CO24
-3.CO86 -0.0081 -0.0076 -0.0368 -0.CCbO -0. C049 -0.C037
-0.0080 -0 .0076 -0.0071 -0.0064 -0.00 5 6 -C.O2446 -C.O036 -0 .0323
-3.0071 -3.0068 -3.0063
-1.C152 0.02773 c.0343 C.C653 0.0998
-0.C178 -0.0127 -c.c099 -0.CO63
-C.CCBb -0.co73 -C.CC58
-3.0057 -3.0050 -1.0042 -3.0032 -3.0022 -1.0011
3.0002 3.G015 3.0030 3.0045
-0.OC73 0.CC54 C.C203 -0.0')22 -C.CC40 c . c 3 7 3 C.0026
0.C080 C.0140 0.C206 0.0278 0.C354 0.0437 3.0524
- C . C C l I o.cc10 C.OC40
- c . c c 2 1 c.ccc2 o . c c 2 1 c .cc54
-0.CO24 0.1372 C-1772 0.2192
C.C562 0.C769 0.C991
0.0274 0.0398 0.0533
0.0145 0.0229 O.OP20
1.0023 3.0059 0.0099
-0.0307 0.0012 0.0332
-0.GO39 0.0008 0.0026
-0.0010 0 .0005 0 .0021 c.cc72
0.0107 0.0145 0.0186 0.023C 0.0776
11 12 13 14 15
C.2630 C.122R 0.0679 0.3418 3.0142 C.OC84 0 .0055 O.CO46 0.0067 0.0089 0.C113 0.C139 0.0166
0.0039 0.0058 0.0078 0.0100 0.0122 0.0147
0.3081 1.3544 0.4016
0.1477 0.1739 c .201c
0.0835 c. 1 o o c 0.1173
0.0524 0 . 3 6 3 8 0.0757
~~
5.0188 3.0239 3.0292
O.Cl15 C.015C C.ClR6
0 .0078 0.0104 0 .0131
3.0062 3.0080 0- 0099 0.4496 0.2291 0.1355 0.0883 0.0617 1.0348 C.C225 0.0160
16 C.4981 0 - 5 4 7 1 0.5965
0.2586 0 .1543 0.2876 0.1738 C.3177 0.1940 2.3485
0.1015 0.1152 0.1295
0.0714 0 .0816 0.C922
0 .0529 C.?607 0.3690
3.0408 I. 0471 3.0536
0.0325 0.0377 0.0431
C.C266 0.C309 c . c 3 5 5
0.0223 0.C260 0.0299
0.0191 0.0223 0 .0257 0.C292
3.0119 17 18 19
0.0194 0.0224 0.0256
0.0172 0.0199 0.0227 0.0256
3 .0140 0.0162 3.0185 G.6462
0.6961 0.7462 C.7964 0.8468
C.2147 0.1443 0.1032 0.0775 I. 0605 3.0677
0.0487 0.0546 O.CbC7 9.Ot71 c.c-737
0.3432 c . r457
3.0340 0.0382 20 21
22 23
0.3797 0.2359 0.1595 0.1752 3.1913 0.2077
0.1147 0.1265 q.1397. C.1512
C.0864 0.C957 G.1052 C.1151
0.0329 6.C238 0.0209 3.0234 3.0260 1.02.87
0 .4113 c .4433 5.4756
. ~~
0.2576 0.2797 0.3C22
1 .0751 I. 0828 3.0908
C.C504
C.Thl3 : .r557
0.0427 0.3473 0. ?52 1
0.0368 C.3408 0.2455
0.0323, 0.C358 "C395
0 .0287 C.0318 0 . 0 3 5 1
450.0 5CC.O 550.0 600.0 650.0 700.0 750.0 3nc.0 85C.C 9?C. c 950.0 1?".0 1050.0 1100.0
-0.CC64 -0.0061 -0.OC56 -0-OC51 -0.oc45 -0.0?38 -C.0030 -"CC21 -0.0011
0.0c00 0.0012 C . CC24 0.0038 C.OC52
-0.G059 -0.C055 -0.cc51 -C.CC46 -C.CC41
-0.0054 -0.0051 -0.0047 -0.0042 -0.0037 -0.003 1 -C.OC24 -0.0017 -0.0009 -0.0000
0. COO9 0.0019 O.OC30 0.0041
-C."50
-C.3043 - c . n ~ 4 7
-0. c c 4 7 -0.cc44 -0.CO49 -C.0136
-0.3045 -C.0042 -0.CO38
-1.C042 -3.0039 -3.0036
-0.OC4C -0.OC37 -c .cc34
-0.c c 3 9 - 0 . C C 3 5 -0.CC32
-0.0037 -0.0034 -0.0030
- c . r 2 3 5 -c .oc32 -0.0029 -0.0025 -0.Ol21 -0. C917 -3.0012 -0.0307
-c.o034 -0.0031 -1.C028 -0.0024 -0.00 20 -0.COlb -0.COll -0.0006 -0.0000
-0 .0033 -0.0030 -0.0026 -0.0023 -0.CO19
-1.0032 -1.0029 -5.0025 -1.0022 -1.0018 -3.0014 -3.0009 -3.0004
~ . O O C l 0.000b
-0.0639 -0.0034
- 0 . 0 0 3 4 -0.CO29 -0.0024 -0.09 1 8 -0 .co12 -0.0316
-3.0032 -0.OC33 -0.CC28 -0.0024 -C.CC19 -c .c014 -0. CC09 -0.CC03
-0.0327 -c.0022 -0. C031
-0.C326 - C . @ C Z O
-0.0027 -3.0022 -1.0017 -1.0011
-C.CC25 -C.O@21 -0.OC15
-0 .cc34 -c .cc27 -C.CC19 - C . C C l C
-C.3128 -0 .oc22 -0 .0315
-0.0018 -0.0013 -0.OCO8
-0.00 1 5 -0 .0010 -0.0005 -C.C014
-0.COO7 - C . O C l O
8 9
-O.C0?3 -0.0000
0.0099 0 .0018 0.0028 0.0038
-3.0005 -c .occ4 O-OCC!3 O.OC09 O.CC17
-0.0002 -0.0001 0.3000 -0.ccoo 0.0031
O.CJ09 0.C017
0 .0001 0.0009 C.0017
3 .0002 1 .0009 3.0017
o .ccc3 o.cc10 O.CC17
o.oco4 0.0010 0. or1 7
0.0035 0.001 1 0.0017
O.CO05 0.0011 O.rJO18
0.0906 0.0012 0.0018
10 11 12 13
O . C C 1 C o .cc21 c . c c 3 3
3.0012 3.0018 3.0025 3.0032
O.CO2b O.CO36 0.C046 0.C057 C.0368 9."9':
5 .0025 0 . 0 0 3 4 0.0044 0 .0054 0.3065 0.0076
5.0025 3.0033 3.0042 3.0052 3.0062 3.0072
O.OC24 c .cc24 O.CC32 C.CO40 O.CC49 O.CO58 C.CO67
C.OC24 0.0032
O.OC24 0.0032
0.0024 0.0032
0 .0025 0.0032 0.0039 0.0046 0.0054 0 .0063 O.CO71 0.0080 0."089 C.0"9 0.C139 0 .0119
C.CO46 C.0033 0 .cc41 O.OC50
14 15
0 - 0 0 6 7 0.0084 c.0101
O.CC59 O.CO73 O . C C 8 t
O.OC53 0.0066 0.007°
0.0049 0.0061 0.0973
0.0040 0.0049 0.0057
0.0039 0.0047 0.0056
0.0039 0.0047 0.0055
3.0039 3.0046 3.0054 S.0062 3.0070 3 .0079 l.OC88 3 . COY7 3.0107 3.0117
16 1 7 18
C.OC6O O.GC70 "0080 C.OC91 0.01c2
0 .0119 0.C104 0.0C93 0.0086 O.CC66 0 .0065 O.CO64 C.0137 C.0157 0.0177
C.Cl20 0.C137 O.Cl55
0.0108 3.0123 0 .0139
0.0099 0.0113 0 .3127
c.co92 3.0105 0.0118
0.0087 O.CO99 c . 0 1 1 1
c.OG83 3.0094 1.0106
O.CO77 C.CC88 ^ . 3 i 9 8
0.0075 3.OC85 0.0095
3.C074 J.OC83 0.3093
0.0072 0.0082 O.OC91
24 19
21 22 23
C.0199 c .c221 C..C244
0.C174 C.Cl93 C.C213
0.0156 C.0173 0.0191
0.0142 ?.L'158 ? . ' ) I74
3.9124 0 .2138 0.0152
3.0118 3 .0151 3.0144
0.0113 0.@125 5.0137
C.0109 C.Cl20 C.Cl32
O.OlC6 0.3117 ?.'I126
1.0133 3.1?114 3.'?125
0.c101 1.0111 z.0122

w a,
TABLE 2.- LOGlO [G](u,uof VALUES FOR (0,l) BAND.
5C.O 75 .0 100.9 125 .0 150.0 175 .0 200.0 225.0 25C.O 215.0 300.0 325.0 350 .0 400.0
0 1
-0.05Cl -0 .0446 -0.0326 -0.0152
O.OC73 0.C344 0.0654 0.0999 0.1315
-0. r 342 -C.G313 -0 .P258 -C.C178 -0 .co73
-0 .0259 -0 .0241 -0.0209
-0.0209 -0 .0197 -0 .1175
-1.0176 -0. C 1 6 6 -0.0150
-0 .0152 -0.C144 -0 .0132
-3 .0134 -1.0128 -3 .0117
-0 .0120 -0 .0115 -0.0106 -0.OC94 -0.OCl8 -0.OC60 -0 .oc39 -C.C015
O.OC13 O.OC43 O.CO76 0.0112 0.0151 0.0193 0.0237 0.0284
-0.0 1 0 9
-0.OC96 -0 .0086 -C.C073 -C.C051 -0.CO39 -c .cc19
0.C004 0.0030 O.CC58 O.CO88
-r .cio+ - C . O l O O -LOO96 -0.0088 -0.0079 -0.0068 -0 .0054 -0 .0038 -0.002 1 -0 .occ1
o.oc21 0.0045 0.0071 0.0100 0.0130 0.0162 0.0196
-0.0093 -0 .3058 -0.0082 -0.0073 -0 . C063 -5.0051 - 0 . 0 0 3 1
-0.0086 -0.0082 -0.0076
-0.0081 -0 .0077 -0 .0071
-3.0072 -3.0068 -3.0063 -3.0057 -3.0049 -3.0041 -3.0031 -0.0020
2 3 4
-0.0162 -0.OlC1 -0.CO26
0.0062 0.0163
-0.3144 -0.0103 -0.0054
O.COC5 O.CO72 0.0148 0 .0232 0 .0324 0.9423 0.0530 0 .0644 0.0764 0 .0891 0 .1023
-0.0127 -C.0098 -0.CO62 -0.00220
0.0028
-0 .0114 -0.009 1 -0 .0064 - @ . C O 3 2
C.OOC5 0 . 0 2 4 7 0 .0093 0 .0144 C.0199
-0.0103 -3.0085 -3.0063 -3.0037 -3.0008
-0.0068 -0.0059 -0.0048 -0.CO36 -0.c022 -0.0006
0 .0011 0.0030 O.CC50
-C.0064 -0 .0056 -0.0046 -0.0034 -0 .co22
O.CO55 0.C2C5 O.C?15
5 6 7 8 1
i n
-0.0022 -0.Q004
0 .0015 C.P565 0 .0276
0.0401 0.0537
0.0083 0.0144 0 .0210
3.0026 3 .0062 3.0103
-0.0007 0.0008 0.0025
-3.0008 0.0005 J.CO19
0.1775 0 .2196 0 .2635
C.Cl72 0.G995 0.1232
0.0036 0.0059 11
12 13 14 15
0.0684 0.0841 0.1006 0.1181 0.1363 C.1552
O . C Z 8 2 0.0360 0 .0443 0.0532 0 .0625 0.0123
3.0147 0 .0194 0.0245 3.0299 3.0356 3.0417 3.0481 3 .0548 0 .0617 3 .0690 3.0766 3 .0844 3.0925
0 .0043 1 .0034 0 .3081 0.1483 0.0259
0 .0322 0 . 0 3 9 0
0 .c121 C.0156 C.0194
0.0184 0 .0110 0.0138
O.CO72 0.0096 0.0121
0.0063 0.0084 0.01@7
3.0051 3 .0069 3.0087
C.3551 F.4024 c. 4 5c4
C.1145 0.2018 0.2299 0 .0462
0.0538 0.C233 C.C215 0.0320 C.C3b6 0.C415 0.C466
0.0168 0.0147 0 .0131 0 . 0 1 5 5
0.0107 16 0.4990
0 . 5 4 8 1 0 .5916 0.6474 0.6914 C.7476 0.798.3 0.8485
0.2588 C.2886 C.3189 0 .3497 C.3811 0 .4128 0.4449 9.4173
0.0334 0 . 0 3 8 7 0.0442
0.0232 0.0270 0.0310
0.0199 0 .0233 0.0268
0.C175 0.0205 0.0236
3.0128 3.0150 3.0173 3.0197
1 7 18 19
0 .1749 0.1951 0 .2159
~~
0.1162 0.1336 C. 1 4 5 5
0.0826 0.0933 0 .1045
0.C618 0 .0701 0 . 1 7 8 8
0.0182 0.0210 0.0239 0.0499
0 .0561 9.C672 0 .0687 C.Cl54
0.0352 0.0396 0.0441 0.0489 0.0538
0 .0305 0 .0343 0.0383 0.0424 0.0467
0.0268 0.0302 20 0.2372 0.1608 0 .1160 0 . 0 8 7 8 0 .0270 0.0223
3.0249 3.0276 3.0305
21 22 23
C. 2 590 C.2813 0.3239
0 . 1 7 6 6 0 . 1 9 2 9 0.2095
0 .1280 0.1493 0 .1530
2 .0972 0 . 1 0 6 9 c . i i 6 a
0.C518 i . c 5 7 3 0.C630
0.0337 0.0374 0 .0412
0 . 0 3 0 1 0 .0334 0 .0369
45C.O 5CO.O 550.0 60".C 650.0 700.0 750.0 3cc.o 850.0 900.0 953.0 1oco.c 1050.0 1100.0
-C.OC65 -?.CC62 -C.OC57
-0.C06O -0.0056 -0 .CG52 -0.CO46 -0.CO40 -0.0033 -0.CO25
-0 .0055 -0.0052 -0.OC4 7 -0.0042 -0.0037 -0.0030 -0.0023 -0.OC15 -C.C007
0 . 0 0 1 3 c.on03
-0.00 5 1 -0.3048 -0.0144 -0 .0339 -0 .0334 -0.ClC28 -0.0021 -0.0014 -o.c')15
0.0003 0.0013
-0.0048 -0.0045 -7. C04 1 -C.0036 - 0 . 0 0 3 1 -0.0025 -0.CO19 -0.0012 -0.COO4
0.0004 0 .0013
-0 .0045 -0 .0042
-3.0043 n 1 2 3 4 5 6 7 8 7
10
- C'. c c4 1 -0.cc39 -0.c03e -0.0034 -0 .0031 -0.0021 -0.0022 - 0 . o c 1 1 -0.3012 -0.OOC6
0.5ooc 0.0007 0.0014 o.oc22 O.OC30 0.0038 0.0047 0.0056 0 .0065 0.0076
-0.0036 -0.0033 -0.0029 -0.0025 -0.0021
-0.0035 -0.0032 -c. C028 -0.CO24 -0.co20
-0.0034 -3.0033 -3.0029 -3 . OOZb -3.0022 -3.0018
-3.0040 -3.0036 -3.0032
-C.CG38 -0.OC34 -C.0030
-0.CC36 -0 .OC32 -0.CC28
-0.0031 -0.0027 -0 .0023
-0 .0038 -0 .0034 - 0 . c 7 2 9
-0.CC51 - 0 . c c 4 4 - c . c c 3 7
-3.0027 -3 .co21
-0.0025 -0 .co23 -C.0019 -0 .0014 -0.0009 -0 .0003
0 .0003 0 .0009
-C - 0 3 2 3 -C*CC20 -0.CC14 -0 .OCO8
-0.CC18 -C.0013 - c . c 0 0 1
-C.0316 -0 .0011 -0.COO5
-0.CO15 -0.0010 -0.0004
-0.0013 -3.0008 -3.0002
-1.CO28 -0.OC19 -3.00C8
c . c c 3 3 P.OC16
-0 .0317 - c . o 0 1 1 -0.0003
0 . 3 0 0 4 0 .0013 0 .0022 0 .0031 0 .0041
-3.SCl6 -3.C009 -C.GOOZ
-0.0017 -0 .0007
C.0003 C.CO14
- c . c 0 0 1 O.OC06
-C.CGOO O.CO07
0 .0001 0.0008 0.0015 0.0322 0.0030 0.0038 0.0041 C.0:56 0.r1064 0 .0975 0.0085 0.0095 0.0107 G.0118 0.013C 'J.C'l42
0.0002 O.OC38 0 .0015 0.0022 0.0030 0.0038 0.0046 0.0055 0.0064 0 .0014
0.0003 3.0005 3.0010
3.0016 3.0023
3.0013 3 . 0 0 2 1 3.0030
O.CO13 0.0021 C.0030
C.0014 0.0022 o . c c 3 c
0.0016 0 .0023 0 .0030
r (0 0, m
I r P
11 12 13
14 15
C.0C29 O.OC43 O.OC58 O.CG75
C.'026 C,.O'J38 C.OC52 0.0066
0.0024 0.0035 0 .0047
0.0123 0.0033 0 . 0 9 4 4
o .co22 0.0032 0.0042
5.0030 3.0038 1 .0040
3.0050 O.OC39 O.CP38 0 .0038
0.0046 0 .0055 O . C O 6 3 0 .0073
0.006C 0.0014
0 .0056 0.0069 0.008 1 0.0096 0 .0110 0 .0125
C.CO53 0.0065 0 .0077 0.0090 0.C103 0 .0117
0 .0051 0 . 0 0 6 2 0 .0073 C.0386 0 .0098 0 . 0 1 1 1
0.3048 0.0058 0.0068
C.0048 O.CO57 O.CO61
3.0046 3.0054 3.0063
O.CC92 0 .3081 0.0060 1 .0070 3.0082
16 17 18
0.0109 0 .0129 0.0149
C.0097 0.0114 C . C l 3 1
0.0088 0 . 0 1 0 3 0 . 0 1 1 9
O.CC80 O.CD78 3.0072 3.0094 3.0107 3.0120 0.0133 3.0147 0 .0161
C. G O 9 1 0.0103
C.Cl28 r . 0 1 1 5
0 .0088 "0100 0 .c112
0.0986 0.0091 0.0109
0.0084 C.0094 0.0105
0 .0082 0 .0093 0.0103
0.0082 3.0091 0,0102
19 O.Cl69 0 .0191 0.0213 C.0231 0.0262
0 .0150 C.Cl69
0.0136 20 21
22 23
0.0153 0.0111 C.0189
0 .0141 0 .0157 0.0174
5 .0132 0 .3141 O.Cl63
C.0125 C.0139 m.1154
0.C189 3 . c 7 3 s C.Ci31
C.Cl24 C . P l 3 7 c . r i 5 c
0.0121 G.3133 ?.-145
0 .0116 C.Cl21 3.C139
0 .0114 0.0125 0.0137
3.0112 3.0123 3.0134
?.C141 ".C155 6.02C9 0.0192 2 .0179 C.0169
NATIONAL AERONAUTICS AND SPACE ADMINISTRATION WASHINGTON, D. C. 20546
OFFICIAL BUSINESS FIRST CLASS MAIL
POSTAGE AND FEES PAID NATIONAL AERONAUTICS ANI
SPACE ADMINISTRATION
If Undeliverable (Section 158 Postal Manual) Do Not Rerun
' T h e aeronautical and space activities of the United States shall be conducted so as t o contribute . , . t o the expansion of human knowl- edge of phenomena in the atmosphere and space. T h e Administration shall provide for the widest practicable a12d appropriate dissemination of information concerning i ts activities and the results thereof."
-NATIONAL AERONAUTICS AND SPACE ACT OF 1958
NASA SCIENTIFIC AND TECHNICAL PUBLICATIONS
TECHNICAL REPORTS: Scientific and technical information considered important, complete, and a lasting contribution to existing
TECHNICAL TRANSLATIONS : Information published in a foreign language considered to merit NASA distribution in English.
knowledge.
TECHNICAL NOTES: Information less broad in scope but nevertheless of importance as a contribution to existing knowledge.
TECHNICAL MEMORANDUMS : Information receiving limited distribution because of preliminary data, security classifica- tion, or other reasons.
CONTRACTOR REPORTS: Scientific and technical information generated under a NASA contract or grant and considered an important contribution to existing knowledge.
SPECIAL PUBLICATIONS: Information derived from or of value to NASA activities. Publications include conference proceedings, monographs, data compilations, handbooks, sourcebooks, and special bibliographies.
TECHNOLOGY UTILIZATION PUBLICATIONS: Information on technology used by NASA that may be of particular interest in commercial and other non-aerospace applications. Publications include Tech Briefs, Technology Utilization Reports and Notes, and Technology Surveys.
Details on the availability of these publications may be obtained from:
SCIENTIFIC AND TECHNICAL INFORMATION DIVISION
NATIONAL AERONAUTICS AND SPACE ADMINISTRATION Washington, D.C. PO546
. ...