Investigation of Intelligence Partitioning in Wireless Visual ...
88
Thesis for the degree of Licentiate of Technology Sundsvall 2011 Investigation of Intelligence Partitioning in Wireless Visual Sensor Networks Khursheed Khursheed Supervisors: Professor Mattias O’Nils Professor Bengt Oelmann Electronics Design Division, in the Department of Information Technology and Media Mid Sweden University, SE-851 70 Sundsvall, Sweden ISSN 1652-8948 Mid Sweden University Licentiate Thesis 65 ISBN 978-91-86694-44-9
-
Upload
khangminh22 -
Category
Documents
-
view
1 -
download
0
Transcript of Investigation of Intelligence Partitioning in Wireless Visual ...

Thesis for the degree of Licentiate of Technology
Sundsvall 2011
Investigation of Intelligence Partitioning in Wireless
Visual Sensor Networks
Khursheed Khursheed
Supervisors: Professor Mattias O’Nils
Professor Bengt Oelmann
Electronics Design Division, in the
Department of Information Technology and Media
Mid Sweden University, SE-851 70 Sundsvall, Sweden
ISSN 1652-8948
Mid Sweden University Licentiate Thesis 65
ISBN 978-91-86694-44-9

Akademisk avhandling som med tillstånd av Mittuniversitetet i Sundsvall framläggs till offentlig granskning för avläggande av teknologie licentiate examen i elektronik torsdagen den 09 Juni 2011, klockan 10:30 i sal O102, Mittuniversitetet Sundsvall. Seminariet kommer att hållas på engelska.
Investigation of Intelligence Partitioning in Wireless Visual
Sensor Networks
Khursheed Khursheed
© Khursheed Khursheed, 2011
Electronics Design Division, in the
Department of Information Technology and Media
Mid Sweden University, SE-851 70 Sundsvall
Sweden
Telephone: +46707404985
Printed by printing office, Sundsvall, Sweden, 2011

ABSTRACT
The wireless visual sensor network is an emerging field which is formed by
deploying many visual sensor nodes in the field and in which each individual
visual sensor node contains an image sensor, on board processor, memory and
wireless transceiver. In comparison to the traditional wireless sensor networks,
which operate on one dimensional data, the wireless visual sensor networks
operate on two dimensional data which requires higher processing power and
communication bandwidth. Research focus within the field of wireless visual
sensor networks has been on two different extremes, involving either sending raw
data to the central base station without local processing or conducting all
processing locally at the visual sensor node and transmitting only the final results.
This research work focuses on determining an optimal point of
hardware/software partitioning at the visual sensor node as well as partitioning
tasks between local and central processing, based on the minimum energy
consumption for the vision processing tasks. Different possibilities in relation to
partitioning the vision processing tasks between hardware, software and locality
for the implementation of the visual sensor node, used in wireless visual sensor
networks have been explored. The effect of packets relaying and node density on
the energy consumption and implementation of the individual wireless visual
sensor node, when used in a multi-hop wireless visual sensor networks have also
been explored.
The lifetime of the visual sensor node is predicted by evaluating the energy
requirement of the embedded platform with a combination of the Field
Programmable Gate Arrays (FPGA) and the micro-controller for the
implementation of the visual sensor node and, in addition, taking into account the
amount of energy required for receiving/forwarding the packets of other nodes in
the multi-hop network.
Advancements in FPGAs have been the motivation behind their choice as
the vision processing platform for implementing visual sensor node. This choice is
based on the reduced time-to-market, low Non-Recurring Engineering (NRE) cost
and programmability as compared to ASICs. The other part of the architecture of
the visual sensor node is the SENTIO32 platform, which is used for vision
processing in the software implementation of the visual sensor node and for
communicating the results to the central base station in the hardware
implementation (using the RF transceiver embedded in SENTIO32).


ACKNOWLEDGEMENTS
This thesis is the culmination of approximately two years of research
work during which I have been accompanied and supported by many people.
I would like to take this opportunity to express my sincere gratitude to all of
those who have helped me to complete my licentiate studies.
First of all I would like to thanks my Supervisor Prof. Mattias O‟Nils for
his guidance, support and encouragement throughout my studies. I was not
an expert in Embedded System Designing and Image Processing but
Prof. Mattias O‟Nils trusted my abilities and offered me the opportunity to
develop my knowledge within the research field associated with the Design of
Embedded Systems for Wireless Visual Sensor Networks and implementing
image processing algorithms on FPGAs. I want to express my sincere
appreciation to Prof. Mattias O‟Nils for his initial trust. Without his constant
encouragement, enduring supervision and brilliant suggestions throughout
my research period, I would never have completed my licentiate within two
years.
Dr. Najeem Lawal is greatly acknowledged for his contributions,
inspirations and most of all for being motivate and positive all the times. I am
grateful to Fanny Burman, Söderström Lotta and Christine Grafström for their
kind support. I further would like to thank all my colleagues at the Mid
Sweden University, my friends and my family for their support.
Most of all I want to share this thesis with my wife Anam. I am thankful
for every moment that we spend together. I am grateful to her for keeping me
from working some of the time, but her understanding in allowing me to
work at others. Without her love, care and support, this work would not have
been possible.
Sundsvall, March 2011
Khursheed Khursheed


vii
TABLE OF CONTENTS
ABSTRACT ...................................................................................................... III
ACKNOWLEDGEMENTS ................................................................................ V
TABLE OF CONTENTS ................................................................................. VII
ABBREVIATIONS AND ACRONYMS ............................................................ XI
LIST OF FIGURES ........................................................................................ XIII
LIST OF TABLES .......................................................................................... XV
LIST OF PAPERS ........................................................................................ XVII
1 INTRODUCTION ....................................................................................... 1
1.1 APPLICATIONS OF WIRELESS VISUAL SENSOR NETWORKS .................... 3 1.1.1 Remote Surveillance ................................................................. 3 1.1.2 Environmental Monitoring ......................................................... 3 1.1.3 Ambient Assisted Living and Personal Care ............................. 4 1.1.4 Virtual Reality ............................................................................ 5 1.1.5 Overall Aim and Contributions .................................................. 5
1.2 THESIS OUTLINE .................................................................................. 6
2 RELATED WORK ..................................................................................... 7
2.1 RELATED EXAMPLES ............................................................................ 9 2.1.1 SensEye .................................................................................... 9 2.1.2 Cyclops .................................................................................... 10 2.1.3 Stanford’s MeshEye ................................................................ 10 2.1.4 CMUcam3 ............................................................................... 11 2.1.5 FireFly Mosaic ......................................................................... 12 2.1.6 CITRIC .................................................................................... 12 2.1.7 DSPcam .................................................................................. 13
3 WIRELESS VISUAL SENSOR NETWORK ........................................... 15
3.1 ARCHITECTURE FOR WIRELESS VISUAL SENSOR NETWORKS ............... 15 3.1.1 Homogeneous architecture for Wireless Visual Sensor Networks 15 3.1.2 Heterogeneous architecture for Wireless Visual Sensor Networks 16
3.2 CONSTRAINTS ON INDIVIDUAL VISUAL SENSOR NODES ........................ 18 3.2.1 Effective Acquisition of the Images/Videos ............................. 18 3.2.2 Vision Processing at the Sensor Nodes .................................. 19
3.2.2.1 Digital Signal Processor (DSPs) ......................................... 20 3.2.2.2 Media Processor ................................................................. 20 3.2.2.3 Image Vision Processor ...................................................... 20
viii
3.2.2.4 Hybrid Processor / System on Chip .................................... 20 3.2.3 Power Consumption ................................................................ 21 3.2.4 Real Time Performance ........................................................... 21 3.2.5 Cost and Size .......................................................................... 22 3.2.6 Memory Usage ........................................................................ 22 3.2.7 Sensor Communication ........................................................... 22
3.3 KEY FEATURES OF WVSN ................................................................. 23 3.3.1 Lifetime .................................................................................... 23 3.3.2 Scalability................................................................................. 24 3.3.3 Cost and Ease of Deployment ................................................. 24 3.3.4 Response Time ....................................................................... 25 3.3.5 Security .................................................................................... 25 3.3.6 Sample Rate ............................................................................ 25
4 A WIRELESS SYSTEM FOR FAILURE DETECTION IN MACHINERY 29
4.1 DESCRIPTION .................................................................................... 29 4.2 MAIN ISSUES ..................................................................................... 31
4.2.1 Effect of communication on the lifetime of Visual Sensor Node 31
4.3 EXPERIMENTAL SETUP ....................................................................... 31 4.3.1 Pre-Processing ........................................................................ 31 4.3.2 Bubble Remover ...................................................................... 32 4.3.3 Pixel based bubble remover algorithm .................................... 32 4.3.4 Object based bubble remover algorithm ................................. 32 4.3.5 Labelling and Classification ..................................................... 34 4.3.6 Image Compression ................................................................ 34
5 INTELLIGENCE PARTITIONING BETWEEN LOCAL AND CENTRAL PROCESSING ......................................................................................... 37
5.1 INTELLIGENCE PARTITIONING BETWEEN VSN AND CBS ....................... 38 5.1.1 Point to Point communication between VSN and CBS ........... 38
5.1.1.1 Software Implementation of VSN ........................................ 38 5.1.1.2 Hardware Implementation ................................................... 44 5.1.1.3 Packets relaying in a multi-hop Wireless Visual Sensor Network 50 5.1.1.4 Packets Relaying in a Multi-hop WVSN for Hardware Implementation .................................................................................... 54 5.1.1.5 Packets Relaying in a Multihop WVSN for Software Implementation of VSN........................................................................ 56
6 PAPERS SUMMARY .............................................................................. 59
6.1 INTELLIGENCE PARTITIONING BETWEEN VSN AND CBS IN WVSN ........ 59 6.1.1 Paper I ..................................................................................... 59 6.1.2 Paper II .................................................................................... 59
6.2 ARCHITECTURE DEVELOPMENT FOR WIRELESS VISION SENSOR
NETWORK ..................................................................................................... 59 6.2.1 Paper III ................................................................................... 59
6.3 PACKETS RELAYING IN A MULTIHOP WIRELESS VISION SENSOR
NETWORK ..................................................................................................... 60

ix
6.3.1 Paper IV .................................................................................. 60 6.4 AUTHORS CONTRIBUTIONS ................................................................ 61
7 THESIS SUMMARY ................................................................................ 63
7.1 SOFTWARE IMPLEMENTATION OF THE VISUAL SENSOR NODE ............... 63 7.2 HARDWARE IMPLEMENTATION OF THE VISUAL SENSOR NODE .............. 64 7.3 PACKETS FORWARDING IN A MULTI-HOP NETWORK ............................. 64 7.4 CONCLUSIONS ................................................................................... 65 7.5 FUTURE WORKS ................................................................................ 66
REFERENCES ................................................................................................ 67
PAPER I ................................................ ERROR! BOOKMARK NOT DEFINED.
PAPER II ............................................... ERROR! BOOKMARK NOT DEFINED.
PAPER III .............................................. ERROR! BOOKMARK NOT DEFINED.
PAPER IV.............................................. ERROR! BOOKMARK NOT DEFINED.


xi
ABBREVIATIONS AND ACRONYMS
WVSN ............. Wireless Visual Sensor Networks
WSN ............. Wireless Sensor Networks
VSN ............. Visual Sensor Node
ASIC ............. Application Specific Integrated Circuit
FPGA ............. Field Programmble Gate Array
SIMD ............. Single Instruction Multiple Data
RISC ............. Reduced Instruction Set Computing
MV ............. Machine Vision
DSP ............. Digital Signal Processing
NRE ............. Non-Recurring Engineering
IEEE ............. Institute of Electrical and Electronics Engineers
SRAM ............. Static Random Access Memory
SDRAM ............. Synchronous Dynamic Random Access Memory
CCD ............. Charge Coupled Device
SDAC ............. The Sense Decide Act Communicate
JPEG ............. Joint Photographic Experts Group
PID ............. Passive Infrared Detector
MCU ............. Microcontroller Unit
CMOS ............. Complementary Metal Oxide Semiconductor
VGA ............. Video Graphics Array
TIFF ............. Tagged Image File Format
TDMA ............. Time Division Multiple Access
SD ............. Secure Digital
TSAM ............. Time Synchronized Application level MAX
SCN ............. Smart Camera Networks
GOPS ............. Giga Operations Per Second
ARR ............. Automated Repeat Request
FER ............. Forward Error Request
FoV ............. Fields of View

xiii
LIST OF FIGURES
Figure 1: Homogeneous architecture for WVSN......................................15 Figure 2: Heterogeneous architecture for WVSN ....................................16 Figure 3: Two-tier architecture for clustered WVSN ................................17 Figure 4: Sensor node architecture ..........................................................18 Figure 5: Tri-modal (three power states) duty-cycling principle. .............26 Figure 6: Prototype machine for hydraulic system ...................................30 Figure 7: Flow of pixel based method to measure particles ....................32 Figure 8: Flow of object based method to measure particles ..................32 Figure 9: Image at each step of object detection algorithm ....................33 Figure 10: Changes in area and location of particle ................................33 Figure 11: Algorithm flow for possible tasks partitioning between hardware and software as well as local and central
processing ...............................................................................37 Figure 12: Components of VSN for software implementation ..................39 Figure 13: Tradeoff between communication and computation
energies..................................................................................39 Figure 14: Relative energy for each strategy ..........................................43 Figure 15: Energy consumption showing sleep energy dominancy .......43 Figure 16: Lifetime of sensor node for different strategies .....................44 Figure 17: All possible intelligence partitioning between VSN
and CBS .................................................................................45 Figure 18: Point to point communication between VSN and CBS ..........46 Figure 19: Components of VSN for hardware implementation ...............46 Figure 20: Lifetime for all hardware/software partitioning strategies ......50 Figure 21: Traffic load at the VSN placed at an arbitrary distance
from the CBS in a multihop WSN ...........................................53 Figure 22: Lifetime curves for VSN with different tasks
partitioning strategies in the hardware implementation for varying node densities in the network ....................................55 Figure 23: Energy consumption for complete hardware implementation
of the VSN for varying node densities in the multihop WVSN.....................................................................................56
Figure 24: Lifetime curves for VSN with different tasks partitioning strategies in the software implementation for
varying node densities in the network ....................................57 Figure 25: Energy consumption for complete software implementation
of the VSN for varying node densities in the multihop WVSN.....................................................................................58


xv
LIST OF TABLES
Table 1. Energy consumption of individual components ........................39 Table 2. Energy of AVR 32 in SENTIO32 for fifferent tasks
partitioning strategies ................................................................41 Table 3. Energy of IEEE 802.15.4 for different strategies ......................42 Table 4. Total energy of VSN for each intelligence portioning
strategy......................................................................................42 Table 5. Energy consumption of individual operation of the
software implementation. ..........................................................47 Table 6. Power, energy and area consumed by module implemented on FPGA ...................................................................................47 Table 7. All possible hardware/software partitioning strategies ..............48 Table 8. Author’s contributions................................................................61

xvii
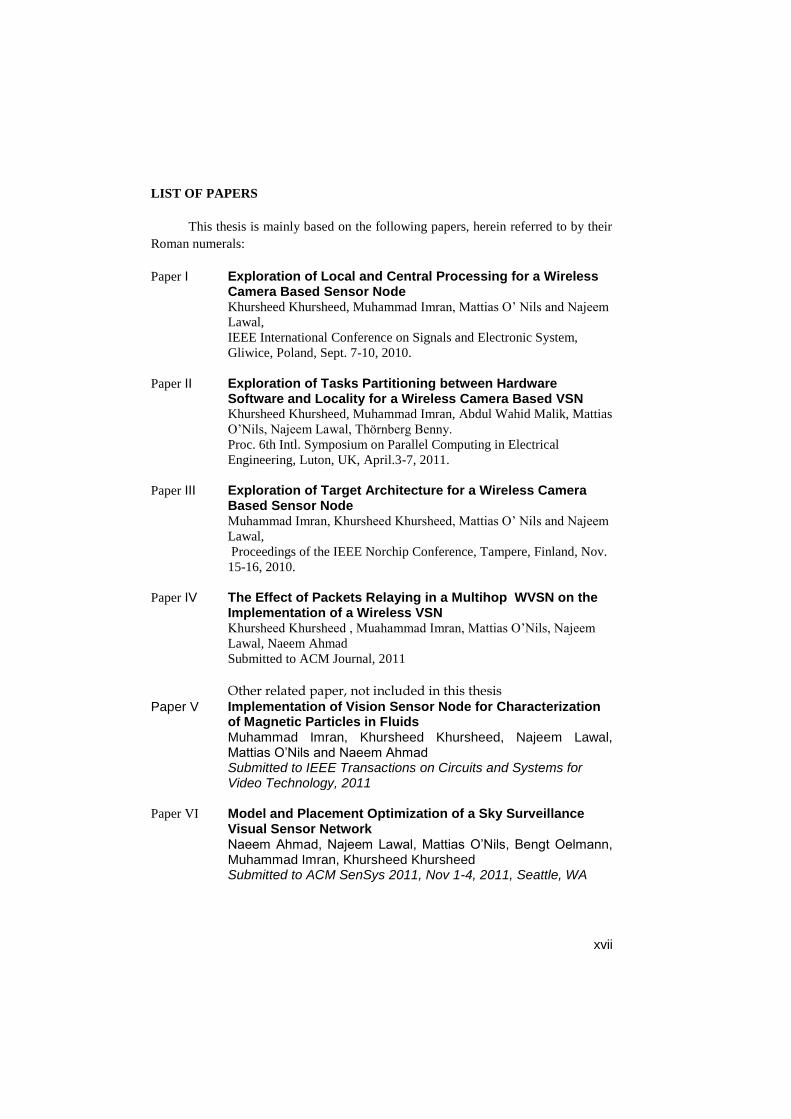
LIST OF PAPERS
This thesis is mainly based on the following papers, herein referred to by their
Roman numerals:
Paper I Exploration of Local and Central Processing for a Wireless Camera Based Sensor Node Khursheed Khursheed, Muhammad Imran, Mattias O’ Nils and Najeem
Lawal,
IEEE International Conference on Signals and Electronic System,
Gliwice, Poland, Sept. 7-10, 2010.
Paper II Exploration of Tasks Partitioning between Hardware Software and Locality for a Wireless Camera Based VSN Khursheed Khursheed, Muhammad Imran, Abdul Wahid Malik, Mattias
O’Nils, Najeem Lawal, Thörnberg Benny.
Proc. 6th Intl. Symposium on Parallel Computing in Electrical
Engineering, Luton, UK, April.3-7, 2011.
Paper III Exploration of Target Architecture for a Wireless Camera Based Sensor Node Muhammad Imran, Khursheed Khursheed, Mattias O’ Nils and Najeem
Lawal,
Proceedings of the IEEE Norchip Conference, Tampere, Finland, Nov.
15-16, 2010.
Paper IV The Effect of Packets Relaying in a Multihop WVSN on the Implementation of a Wireless VSN Khursheed Khursheed , Muahammad Imran, Mattias O’Nils, Najeem
Lawal, Naeem Ahmad
Submitted to ACM Journal, 2011
Other related paper, not included in this thesis Paper V Implementation of Vision Sensor Node for Characterization
of Magnetic Particles in Fluids Muhammad Imran, Khursheed Khursheed, Najeem Lawal, Mattias O’Nils and Naeem Ahmad Submitted to IEEE Transactions on Circuits and Systems for Video Technology, 2011
Paper VI Model and Placement Optimization of a Sky Surveillance Visual Sensor Network Naeem Ahmad, Najeem Lawal, Mattias O’Nils, Bengt Oelmann, Muhammad Imran, Khursheed Khursheed Submitted to ACM SenSys 2011, Nov 1-4, 2011, Seattle, WA


1
1 INTRODUCTION
Wireless Sensor Networks (WSNs) have remained the focus for many
researchers during the last two decades. WSNs consist of many sensor nodes and a
Central Base Station (CBS), in which each sensor node has its own sensing,
processing, communication and power resources. The sensor nodes are generally
distributed over a large area in order to monitor some physical phenomenon and
transmit the sensed/processed information to the CBS for further processing. Until
the present time, the majority of the research attention has been focused on WSN,
in which the sensing components collect scalar data such as temperature, air
pressure etc. The resource constraints of such networks are strict but are less
stringent in comparison to those for a Wireless Visual Sensor Network (WVSN)
because the sensor nodes in WSNs collect and transmit scalar data (representing
temperature, pressure etc.), which can be managed with some care and attention.
WVSN is an emerging field and in this case the sensor nodes have an
embedded camera and are capable of performing complex vision processing
algorithms. These sensor nodes take snapshots of the environment and after
performing pixel based image processing algorithms such as frame differencing,
segmentation and morphology etc. on it, transmit the processed information to the
CBS. The CBS is assumed to have quite high processing and power resources and
it is possible that it would be able to perform more complex image processing
algorithms such as labelling classification, data fusion and some other pre-
scheduled tasks. Visual Sensor Node (VSN) has strict constraints on their
resources, which poses a challenge in relation to the effective acquisition of the
environmental images, local processing, local storage and communication to the
CBS.
In the literature [1] two different approaches have been used in relation to
designing and developing the VSN. One solution suggests that a custom image
processor should be designed for the local processing at the VSN while the second
approach suggests the utilization of an off-the-shelf, general purpose
microprocessor/micro-controller for the image processing at the VSN. In this
research work, the second approach has been adopted and a general purpose
micro-controller in combination with Field Programmable Arrays (FPGAs) has
been used. The reason for this decision is that the images are very rich source of
information, and hence require high processing and power resources for both
processing at the VSN and communicating the results to the CBS. A sightless
decision in relation to performing more image processing at the VSN or at the CBS
could lead to catastrophic situations such as high communication bandwidth or
more computational time which leads to higher energy consumption and a
reduced lifetime for the VSN.
2
The research focus within the field of WVSN has been on two different
assumptions, involving either sending raw data to the CBS without local
processing [2] or conducting all processing locally at the VSN and transmitting
only the final results [3] to the CBS. To avoid such a catastrophic situation, this
thesis work focuses on how to effectively divide the workload of the vision
processing between the VSN and the CBS in order to achieve an increased lifetime
for the VSN. This thesis work is focused on determining an optimal intelligence
partitioning strategy between local and central processing and also between
hardware and software implementation of the VSN. The effect of multi-hop
networking on the energy consumption and implementation of the individual VSN
has also been explored.
The main design challenge in WVSN is in relation to coping with the strict
resource constraints placed upon the individual VSN. Embedded processors with
kilobytes of memory must implement complex vision processing algorithms and
efficient, distributed and ad-hoc networking protocols. Many constraints are based
on the fact that these devices will be produced in large quantities and must be
physically small in size and must also be inexpensive. Size reduction is essential in
order to allow devices to be produced very cheaply, as well as to be able to allow
such devices to be used in a wide range of application. The most challenging
resource constraint which must be met is in relation to the power consumption. As
the physical size of the sensor node decreases, so does the energy capacity. The
consequences of all these constraints involve computational and storage limitations
that lead to a new set of architectural issues.
Many devices, such as cell phones and pagers, reduce their power
consumption through the use of specialized communication hardware in
Application Specific Integrated Circuits (ASICs) that provide low-power
implementations of the necessary communication protocols and by relying on high
power infrastructure. However, the strength of WVSNs is their flexibility and
universality. The wide range of applications being targeted makes it difficult to
develop a single protocol, and in turn, an ASIC, that is efficient for all applications.
A WVSN platform must provide support for a suite of application-specific
protocols that drastically reduce the node size, cost, and power consumption for
their target application. This thesis focuses on intelligence partitioning between the
sensor node and the CBS in order to reduce the computational energy and an
image compression algorithm is applied in order to relax the communication
energy constraint of the WVSN.
WVSN are the research choice for the educational and industrial application
explained in the Section 1.1. Section 1.1 also provides a literature review for these
applications.

3
1.1 APPLICATIONS OF WIRELESS VISUAL SENSOR NETWORKS
1.1.1 Remote Surveillance
Airports, stadiums and other such life critical public places require real time
monitoring for safety issues. WVSN can be deployed in such places in order to
capture images, process them collaboratively and identify any possible intruders in
real time. These networks are not accumulating any data but only observing the
environment in real time. This has a significant impact on the network architecture.
Each node has to frequently check the status of its area under observation but it
only has to transmit a report when a violation has been detected. Moreover, it is
essential for this kind of WVSN that each sensor node is always active and
functioning properly. If a node has failed for any reason, it should be detected by
the network based on reliability reasons and a message should be sent to the CBS
so that this sensor node can be recovered. One simple way of implementing this
node failure detection functionality in the WVSN is that each node should be
assigned to a peer that should report if any node is not functioning properly.
The most important characteristic of this kind of WVSN is the latency. Once
a possible violation has been detected, it must be communicated immediately to
the CBS. The latency of the data communication across the network to the CBS has
a critical impact on the performance of the application. It is mandatory that alarm
situations be reported within seconds of detection. The immediate and reliable
communication of alarm messages is the main system requirement. In this kind of
WVSN, reducing latency is much more significant than reducing the energy cost of
the transmissions. If the violation has occurred, a significant amount of energy
must be dedicated to its successful transmission to the CBS. Reducing the
transmission latency leads to higher energy consumption because sensor nodes
must monitor the transmission channel more frequently. This means that sensor
nodes must be able to respond quickly to any requests from their neighbours in
relation to forwarding data. In the literature several papers have been published
within the area in relation to the tracking and detection of people [4]-[6].
1.1.2 Environmental Monitoring
An environmental monitoring application may require a biologist/scientist
to collect several sensor readings from a set of points from an environment over a
long period of time in order to detect and analyse unusual events in the area under
observation. These scientists would want to collect data from hundreds of points
spread throughout the area and then analyse the data offline. They will be
interested in collecting data over some fixed period of time in order to look for
long-term changes and seasonal trends. For the data to be meaningful, it should be
collected at regular intervals.
In an environmental monitoring application, it is difficult to change the
batteries in the sensor node, thus an energy efficient operation in these kinds of
sensor nodes becomes extremely important. One solution is to combine other types
4
of sensor nodes into the sensor network such that the camera nodes are only
triggered if an event is detected by these extra sensors in the network [7], [8].
Another alternative is to harvest energy from the environment such as the sun for
the long term operation of an environmental monitoring application. A number of
recent studies [9], [10] have quantified the amount of solar energy which can be
harvested under various environmental conditions.
At the network level, the environmental data collection application is
characterized by having a large number of sensor nodes, frequently sensing and
transmitting data to the CBSs that store the data in a large memory. Typically, the
sensor nodes will be randomly distributed over the area under observation. The
distance between adjacent nodes will be minimal but the distance across the entire
network is dependent on the chosen application. After deployment, the nodes
must firstly discover the topology of the network and then estimate optimal
routing strategies. The routing strategy can then be used to route data to the CBS.
Once the network is configured, each node periodically samples its sensors
and transmits the collected data to the CBS. For many scenarios, the interval
between these transmissions can be of the order of a few minutes up to several
hours. The typical environment parameters being monitored, such as temperature,
light intensity and humidity, normally change very gradually and do not require
higher reporting rates. In addition to large sample intervals, environmental data
collection applications do not have strict requirements with regards to latency and
response time. Samples of data can be delayed inside the network for moderate
periods of time without significantly affecting application performance because in
general the data is collected for future analysis and not for a real-time operation. In
order to meet higher lifetime requirements, the data communication event must be
precisely scheduled.
Over the passage of time, it is expected that sensor nodes will fail
occasionally. Periodically the network will have to reconfigure itself in order to
handle such a sensor node failure. The most important characteristics of the
environmental monitoring application are a long lifetime, precise synchronization,
low data rates and relatively static topologies. The data transmission can be
delayed inside the network, as necessary, in order to improve the network
efficiency.
1.1.3 Ambient Assisted Living and Personal Care
These applications for WVSN have great commercial and societal potential.
WVSN for these applications could also include other devices such as blood
pressure machine and room temperature sensor and could also be connected to TV
and personal robots. Such types of WVSN will be used to improve the quality of
life and to remotely assist elderly and disabled people. These WVSN can provide
information about unusual behaviour or an emergency situation of an elderly
person or a patient under consideration [3], [11], [12].
5
1.1.4 Virtual Reality
In these applications of WVSN, an internet user can remotely visit
interesting locations such as museums and exhibition rooms. The internet user can
change the camera angle to look at different views of the scene and thus this is able
to provide the feeling of being physically present at a remote location through
interaction with the system interface. The authors in [13] have developed a
platform for an ad hoc WSN in which they have focussed on the most essential
virtualization component. The authors in [14] have implemented a virtual reality
based modelling and understanding nanotechnology system.
Occasionally lectures and meetings may involve remote users. WVSN can be
designed for such remote user based meeting rooms and lecture halls. In these
applications, high communication bandwidth is required because of their highly
interactive nature. Remote participants at the meeting rooms or distributed halls
can enjoy a dynamic visual experience by using audio and visual sensor network
technology. The authors in [15] have implemented a distributed vision system for
tracking humans and robots in indoor smart environments. The authors in [16]
have developed a real time system for tracking a 3D object in an indoor smart
environment using multiple calibrated cameras.
1.1.5 Overall Aim and Contributions
The goal in this thesis is to develop a battery powered VSN which would
perform the local processing with the minimum energy consumption and which
will transmit compressed data over a wireless link. For practical applications, the
lifetime of the VSN must be sufficiently large and should not require any user
interaction for many years. Thus, in this thesis work, the aim is to explore the effect
of intelligence partitioning between the VSN and CBS regarding the lifetime and
implementation of the VSN.
As discussed previously, the size of VSN has to be very small for a number
of reasons and this poses a strict constraint on the energy budget of the VSN.
Energy optimization of the VSN must be explored in a clever way. The following
are the concrete goals of this thesis work.
To investigate the effect of intelligence partitioning between local
and central processing on the energy consumption of the VSN.
To explore the effect of intelligence partitioning between the
hardware and software implementation of the VSN with regards to
its lifetime.
Being a part of multi-hop WVSN, each VSN consumes a significant
portion of its energy budget on forwarding the packets of other
nodes. The effect of relaying packets in a multi-hop WVSN on the
lifetime of the VSN has also been explored in this thesis work.

6
1.2 THESIS OUTLINE
This thesis work is organized as follows. Chapter 2 discusses related work.
Chapter 3 explains wireless visual sensor networks. Chapter 4 describes a case
study on a magnetic particle detection system. Chapter 5 describes intelligence
partitioning between local and central processing. Chapter 6 summarizes the
papers. Finally Chapter 7 concludes the thesis.
7
2 RELATED WORK
Over the last two decades, a significant number of research papers have
been published in the literature within the field of Machine Vision (MV) and
Wireless Sensor Networks (WSNs). MV can, for instance be, used for recognising
persons and objects and also human behaviour such as illness. It has been used for
human identification [17]-[19]. Recently, driven by the incorporation of cameras
into cellular phones, low power Complementary Metal Oxide Semiconductor
(CMOS) image sensors exist which consume only a few mille-joules in order to
capture an image. Images captured by these sensors are of the order of a few
hundred kilo bytes and require larger memories and processing power. Due to
recent advancement in technology, researchers have become interested in
investigating the possibility of embedding image sensors in WSN.
Some system approaches had already incorporated image sensors into the
traditional wireless sensor network. One example is [20], which relies on a Passive
Infra-red Sensor, to determine whether an event of interest has occurred and this
then triggers an image capture and subsequent image transfer back to the CBS. The
Sense Decide Act Communicate (SDAC) system proposed in [21], uses an image as
part of the decision making process by performing simple local image processing
techniques to extract key features which either prove or disprove the presence of
an event and transfer only those parts of an image containing the event. While it
would be beneficial to include cameras in a wireless sensor network, but as images
are so rich in information, the power required for transmitting an image across the
wireless network can dramatically shorten the lifetime of the sensor nodes in the
WVSN.
Having wireless cameras in a network opens up the possibilities for
distributed scene analysis. However, unfortunately, almost all of the researchers
assumed that there should be a powerful central source in order to process the
sensed information and hence were transferring data to the CBS for processing. In
the WVSN, the sensed data (images and video) is information intensive and its
direct transmission over the wireless channel requires high bandwidth and high
transmission power. While the processing power of integrated circuits is
continuously increasing, the available bandwidth of the wireless links has
remained almost constant. High bandwidth requirement in a WVSN is a real
challenge and requires more consideration to be given to it by the researchers
working in this and other communication related fields. Other challenges
involving WVSNs include the memory requirement, effective acquisition of
images/video and low power design.
All these challenges have been addressed in a number of recent publications.
Stephan Hengstler [1] has written a book chapter on stereo vision in Smart Camera
Network (SCN), in which he compared two different approaches for solving some
of the challenges discussed above. One approach is to design a full custom image
8
processor, for example NXP‟s WiCa wireless Smart Camera mote [49], which is
based on vector single instruction multiple data (SIMD) architecture. Another
approach is to use a general purpose microprocessor for the vision processing at
the sensor node e.g. Stanford MeshEye mote [33] consists of a general purpose 32-
bit ARM7 processor.
More specifically, the WiCa mote deploys an application-specific image
processor based on a vector single-instruction, multiple-data architecture, which is
able to process the data streams of two VGA (Video Graphics Array) camera
modules. In contrast, Stanford's MeshEye mote deploys a low-resolution stereo
vision system requiring only a common sequential 32-bit micro-controller.
Additionally, the MeshEye mote hosts a VGA camera module for more
detailed image acquisition. These low-resolution stereo imagers can guide the
focus of attention of the higher-resolution camera and this combination is termed
as a hybrid vision system. Both vision systems are able to detect, localize, and
capture high-resolution snapshots of foreground objects. Hybrid vision is
computationally more efficient and consumes less energy for smaller objects within
its field of view. This makes it well suited for a variety of applications in smart
camera networks despite its low-resolution ranging capability. In [2], the authors
discussed the problem of power management in wireless image sensor networks.
They attempted to discover a compromise between communication and
computation power consumption by finding a suitable compression algorithm and
compression ratio.
In [22] the author discussed parallelism at different levels such as at the data
level, instruction level and task level parallelism for real time embedded image
processing systems. They used Linear Processor Array e.g. Xetal for exploiting data
level parallelism in low level image processing operations. The Xetal is a SIMD
processor including 320 processing elements each having one ALU. They argued
that instruction level parallelism can be exploited by using a very long instruction
word length processor and a superscalar processor. In [23] the authors discussed
the fact that because of the low power consumption requirement in WVSN, it is
beneficial to detect events in images at the sensor nodes and then transmit the
result to the CBS for further processing. However, no results were provided in
relation to this research.
In [24], the authors discussed some key features of wireless multimedia
sensor network such as the high data rates and temporal correlation in the images.
In their experiments they exploited these features and achieved an optimal trade-
off between communication and computation power consumption of the network.
Major advancements in sensor technology have led to numerous systems that
perform computations over measured sensor values. One of the key functions of
such systems is the detection of anomalous events, that is, sensor readings that
deviate from the rest of the sensors readings and thus can be considered outliers.
Such outliers can simply be caused by the malfunctioning of the individual sensors
and sometimes can also be due to a larger geographic area that exhibits some

9
unusual phenomena or event over time. Detecting an area where a collection of
sensors measures anomalous values, is of interest to the end user, because the
detection of such outlier regions helps to explore time-variant regional aspects. The
detection of anomalous values is discussed in detail in [25].
In [26], the authors proposed different energy aware resource management
policies. They proposed a duty cycle based power consumption approach and
according to this, sensor nodes alternate between different power consumption
states such as idle sleep and active based on the current condition of the
environment. The authors in [27], investigated an application driven design
methodology for WVSN. The methodology is somewhat inverse problem, meaning
that the output of the simulation model is known i.e. the performance metrics but
the input i.e. the operation parameter has to be determined.
In [28], the authors addressed the problem of information communication in
WVSN. They designed a new protocol for the communication and called it the
Flexible Interconnection Protocol (FLIP). The purpose of FLIP in WVSN is the same
as that of IP in the Internet. FLIP is a network-layer protocol designed to
interconnect devices with varying power, communication, and processing
capabilities. The FLIP header is flexible and can be customized to offer close to the
optimal overhead for limited-capability devices at one extreme, and yet can still
provide full functionality for more powerful devices at the other extreme. The
authors in [28] have used FLIP protocol to handle communication among sensors,
control units and between sensors and control units.
In [29] many potential applications and challenges in relation to WVSN are
discussed. Homogeneous and heterogeneous WVSN are explained very well in
[29], and the multi-tier heterogeneous WVSN is discussed in more detail.
2.1 RELATED EXAMPLES
2.1.1 SensEye
SensEye [30] is a multi-tier of heterogeneous wireless nodes and cameras
which have different capabilities across different tiers. They have used low power
elements to wakeup high power elements across different tiers. They have used
low power sensors to perform simple tasks and high power sensors to perform
complex tasks. For example during motion detection, Passive Infra-red Detector
(PID) can be used to monitor the area for the majority of the time which consumes
less energy. When an object is detected through the PID, it will trigger the high
resolution camera to take a clear snapshot of the field of view. In the single tier
approach, equal amount of energy are consumed on simple as well as complex
tasks.
In WVSN, the power consumption is the critical factor, so a heterogeneous
approach is preferable to that of a single tier network in order to increase the
lifetime of the network. SensEye is three tiers architecture. Tier 1, the lowest tier
has a 900MHz RF transceiver link and low power cameras such as Cyclops [31]. At
10
tier 2 they used a more reliable platform and camera. This tier also includes a
wakeup circuit to trigger the tier 2 from tier 1 node. Intel‟s stargate sensor platform
with an attached mote acts as a wakeup trigger. The Tier 2 nodes are equipped
with two RF transceivers, so that each tier 2 node can communicate with the other
tier 2 nodes through 802.11 protocols and with tier 1 through a 900 MHz RF
transceiver. The tier 3 node comprises high resolution pan-tilt-zoom cameras
connected to an embedded PC. Nodes in each tier and across tiers are assumed to
communicate over a wireless link with no base station.
2.1.2 Cyclops
Cyclops [31] consists of an imager, a Micro Controller Unit (MCU), a
complex programmable logic device (CPLD), an external Static Random Access
Memory (SRAM) and an external Flash. The MCU controls the Cyclops sensor. It
can set the parameters of the imager, instruct the imager to capture a frame and
run local computation on the image to produce an inference. The CPLD provides
the high speed clock, synchronization and memory control that is required for
image capture. The combination of the MCU and the CPLD provides the low
power benefits of a typical MCU with on-demand access to high speed clocking
through a CPLD. Furthermore, the CPLD can perform a limited amount of image
processing such as background subtraction or frame differentiation at capture
time. This results in an extremely economical use of resources since the CPLD is
already clocking at the capture speed. CPLD clock can be halted when it is not
required by the MCU in order to minimize the power consumption.
Cyclops uses an external SRAM to increase the necessary memory for image
storage and manipulation. The external memory provides on-demand access to
memory resources at both capture and computation times. The SRAM is retained
in a sleep state when the memory resources are not required. In addition, Cyclops
has an external flash memory. The flash memory provides permanent data storage
for functions such as template matching or local file storage. The MCU, CPLD and
both memories share a common address and data bus. This facilitates easy data
transfer between the imager, SRAM and flash memory but it also requires an
appropriate mechanism that guarantees synchronized access to such shared
resources.
2.1.3 Stanford’s MeshEye
Surveillance is one of the promising applications to which WVSN can add
sophisticated levels of intelligence. For such intelligent surveillance systems a high
degree of in-node processing in combination with distributed reasoning algorithms
are required. The ability to put these systems into practice still requires a
considerable amount of research, ranging from mote architectures, pixel-
processing algorithms, up to distributed reasoning engines. MeshEye [33], is an
11
energy-efficient smart camera mote architecture that has been designed for
intelligent surveillance applications.
MeshEye's is a unique vision system known as a hybrid vision system. In
such a system a low-resolution camera continuously determines position, range,
and size of moving objects entering its field of view and then it triggers a high
resolution camera for capturing a detailed view of the object. The Stanford‟s
MeshEye sensor node [33] uses two kilo pixel imagers for low resolution images
and one high resolution camera module for detailed object snapshots. One of the
kilo pixel imagers constantly monitors its field of view. When an object is detected
in its field of view, it then triggers a second low resolution image sensor, which
computes the location and size of the object based on stereo vision. Subsequently, a
high resolution camera is triggered so as to capture a high resolution grey or
colour image of the region of the detected object. MeshEye offers reduced
complexity, low response time, and power consumption over conventional
solutions. The authors in [33] also illustrated basic vision algorithms for object
detection, acquisition, and tracking of real-world data. They have presented a basic
power model that estimates the lifetime of the smart camera mote in a battery-
powered operation for intelligent surveillance.
2.1.4 CMUcam3
The CMUcam3 [34] is the third generation of the CMUcam system and is
designed to provide a flexible and easy to use open source development
environment together with a more powerful hardware platform. The goal of the
system is to provide simple vision capabilities to small embedded systems in the
form of an intelligent sensor that is supported by an open source community. The
hardware platform consists of a colour CMOS camera, a frame buffer, a low cost
32-bit ARM7TDMI micro-controller, and an MMC memory card slot. The
CMUcam3 also includes 4 servo ports, enabling the creation of an entire, working
robot using the CMUcam3 board as the only requisite robot processor.
Custom C code can be developed using an optimized GNU tool chain and
executables can be flashed onto the board using a serial port without external
downloading hardware. The development platform includes a virtual camera
target allowing for rapid application development exclusively on a PC. The
software environment comes with numerous open source example applications
and libraries including JPEG compression, frame differencing, colour tracking,
convolutions, the ability to produce histograms, edge detection, servo control,
connected component analysis, FAT file system support, and a face detector.

12
2.1.5 FireFly Mosaic
FireFly Mosaic [3] is a wireless sensor network image processing framework
with an operating system, networking and image processing primitives that assist
in the development of distributed vision-sensing tasks. Each FireFly Mosaic
wireless camera consists of a FireFly node [35] coupled with a CMUcam3 [34]
embedded vision processor. The FireFly nodes run the Nano-RK [36] real-time
operating system and communicate using the RT-Link [37] collision-free TDMA
link protocol.
FireFly Mosaic is used to demonstrate an assisted living application which is
capable of fusing multiple cameras with overlapping views to discover and
monitor daily activities in a home. The purpose of using the assisted living
application, is to show how an integrated platform with support for time
synchronization, a collision-free TDMA link layer, an underlying RTOS and an
interface to an embedded vision sensor, can provide a stable framework for
distributed real-time vision processing.
2.1.6 CITRIC
In [38], the authors presented a camera for a heterogeneous sensor network
performing in-network processing which reduces the communication costs. The
system performs local on-board processing, after which compressed low
dimensional features are sent over a wireless link. CITRIC is a platform which
consists of 1.3 megapixel camera, 64 MB RAM, 16 MB Flash, frequency scalable
CPU (upto 624 MHz) and IEEE 802.15.4 protocol for communication which makes
it easy to integrate with existing heterogeneous networks.
The authors choose general purpose processors with embedded Linux for
reasons of rapid prototyping and ease of programming. They used a typical
background subtraction function to estimate the power consumption. The test
utilizes all the components of the mote by both running the CPU and using the
Tmote to transmit the image coordinates of the foreground. At the processor speed
of 520 MHz, the power consumption noted was 970mW. They reported that the
current consumed is relatively constant over time, even though the voltage of the
batteries decreases with time. The calculations were made using a nominal voltage
of 6V in order to be consistent, since each experiment starts and ends with a
different voltage. The assumption was that if the camera mote consumed about 1W
and ran on batteries with 2700 mAh capacity, then the camera mote would last
over 16 hours under continuous operation.
13
2.1.7 DSPcam
The DSPcam [39] has been developed with the aim of facilitating distributed
intelligent surveillance. It has been designed with a modular architecture which
allows for easy hardware updates when required. It consists of a blackfin Processor
with 32MB SDRAM and 4MB flash and a CMOS image sensor. An open source
image processing library called camellia [40] is ported to DSPcam. It also integrates
with Firefly node [35] through which IEEE802.15.4 based communication is
available.
The DSPcam has an 802.11 RF transceiver that communicates over multiple
hops to form a mesh network. Since each camera has local processing capabilities,
it thus performs local processing in order to detect the event and annotates the
video stream for the operator who is sitting at the so called operator observation
station in the network. For example, if a DSPcam detects a walking human, it can
label the video data with a tag to represent human motion. These tags can draw
attention to the situation on the operator's screen. To avoid excessive and costly
over-provisioning of the system, the bandwidth of the video streams has to be
dynamically managed. For this purpose, the authors in [39] have developed a Time
Synchronized Application level MAX protocol (TSAM) [47].

14
15
3 WIRELESS VISUAL SENSOR NETWORK
In typical Wireless Sensor Networks (WSNs), the sensor nodes sense the
environment and transmit the sensed data to the CBS for further processing as is
mentioned previously. The amount of data in these networks is very small
compared to the WVSN. Communicating these small chunks of data to the CBS
over a wireless link is comparatively easy as compared to that involved for the
large data produced at the VSN in WVSNs. In the WVSN, the sensor nodes capture
the images of the region within its field of view, perform some vision processing
and then transmit the results to the CBS for further processing. It is obvious that
this visual data is very information intensive and requires a large energy budget
for its processing at VSN and its communication to the CBS. Since the energy
budget of VSN is fixed and also small due to its small size, the design for the VSN
must be conducted with great care.
3.1 ARCHITECTURE FOR WIRELESS VISUAL SENSOR NETWORKS
Various constraints are imposed upon different WVSN applications with
regards to their design and architecture. Before choosing one specific architecture
for some specific application, a decision must be made in relation to the
appropriate type of the sensor nodes based on cost, power consumption and
communication protocols. In [29] the authors described two main architectures for
Visual Sensor Networks i.e. Homogeneous and Heterogeneous.
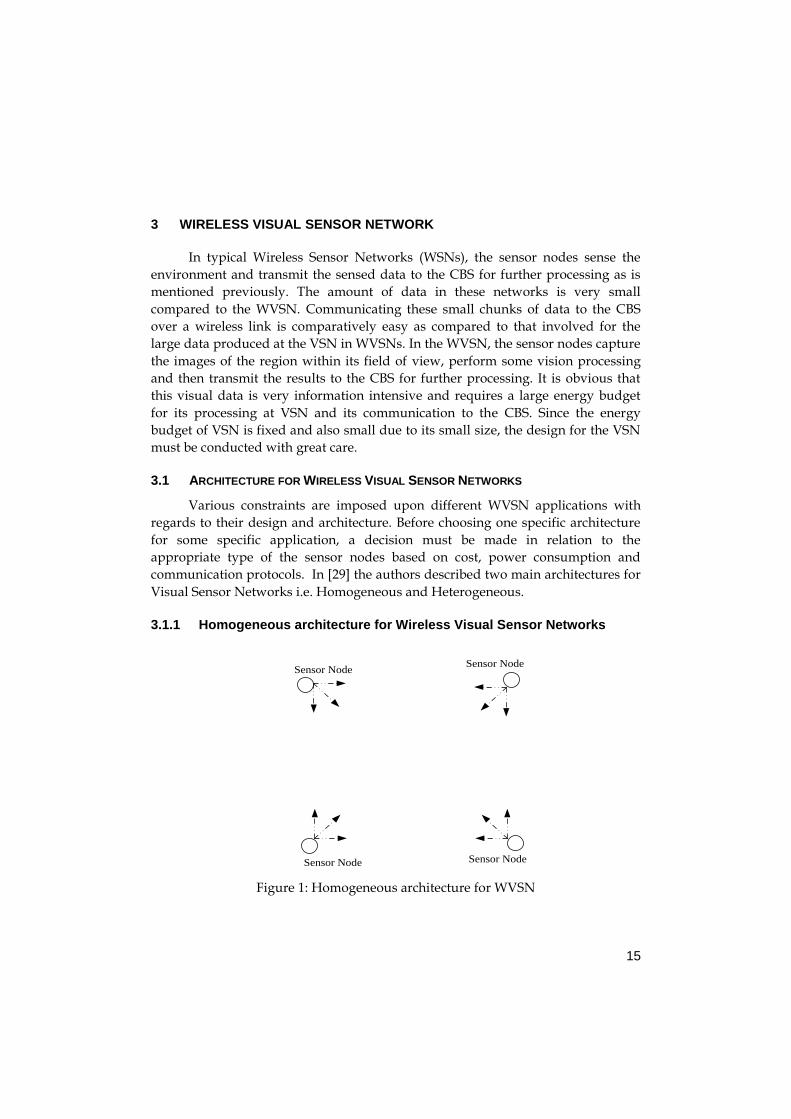
3.1.1 Homogeneous architecture for Wireless Visual Sensor Networks
Sensor Node
Sensor Node Sensor Node
Sensor Node
Figure 1: Homogeneous architecture for WVSN
16
A homogeneous WVSN is one in which the sensor nodes have similar
capabilities for vision processing, image acquisition, communication, and could
have one or more similar base stations. According to the authors in [29] a
homogeneous architecture is most suitable for a large scale WVSN because of its
scalability to a large number of sensor nodes and its self organization with little or
no central control. Such architecture could be used for environmental monitoring
such as in a forest or other hazardous areas for long periods of time. In these
applications the sensor nodes collect the environmental data and then, after a
considerable passage of time, send it to the base station. Homogeneous networks
can be organized in multi-tiers using clustering. In this multi-tier approach, any
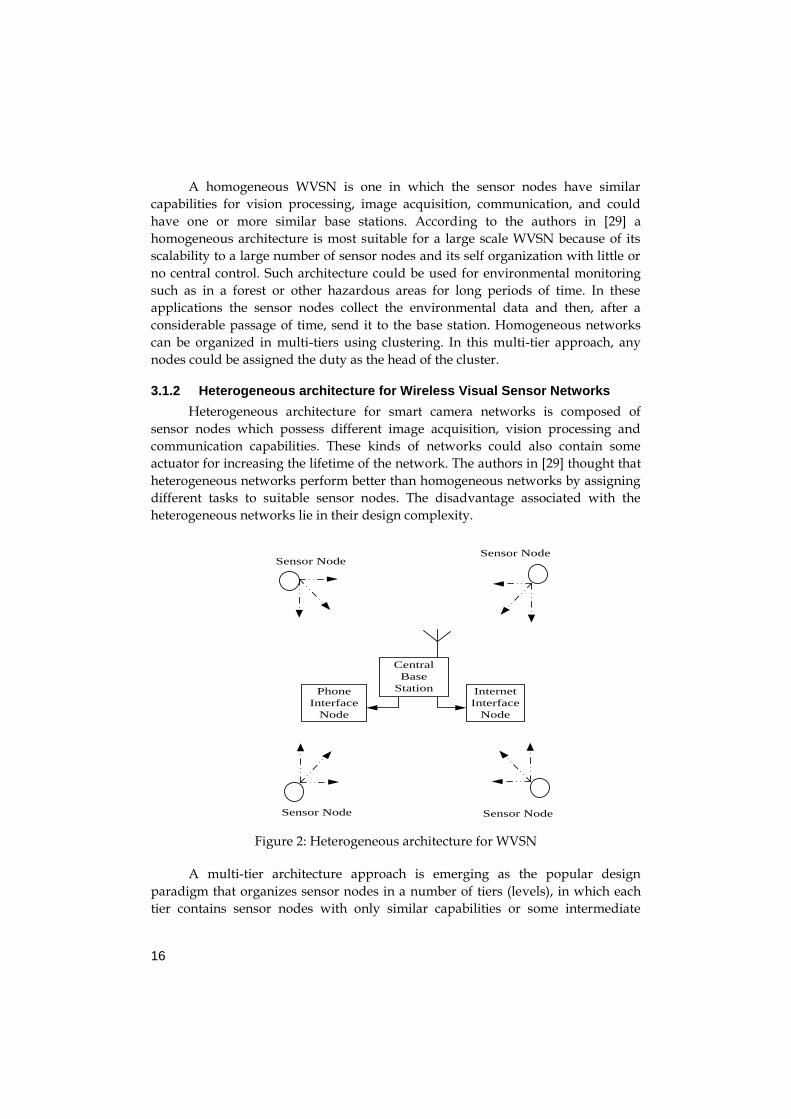
nodes could be assigned the duty as the head of the cluster. 3.1.2 Heterogeneous architecture for Wireless Visual Sensor Networks
Heterogeneous architecture for smart camera networks is composed of
sensor nodes which possess different image acquisition, vision processing and
communication capabilities. These kinds of networks could also contain some
actuator for increasing the lifetime of the network. The authors in [29] thought that
heterogeneous networks perform better than homogeneous networks by assigning
different tasks to suitable sensor nodes. The disadvantage associated with the
heterogeneous networks lie in their design complexity.
Sensor NodeSensor Node
Sensor NodeSensor Node
Central
Base
StationPhone
Interface
Node
Internet
Interface
Node
Figure 2: Heterogeneous architecture for WVSN
A multi-tier architecture approach is emerging as the popular design
paradigm that organizes sensor nodes in a number of tiers (levels), in which each
tier contains sensor nodes with only similar capabilities or some intermediate
17
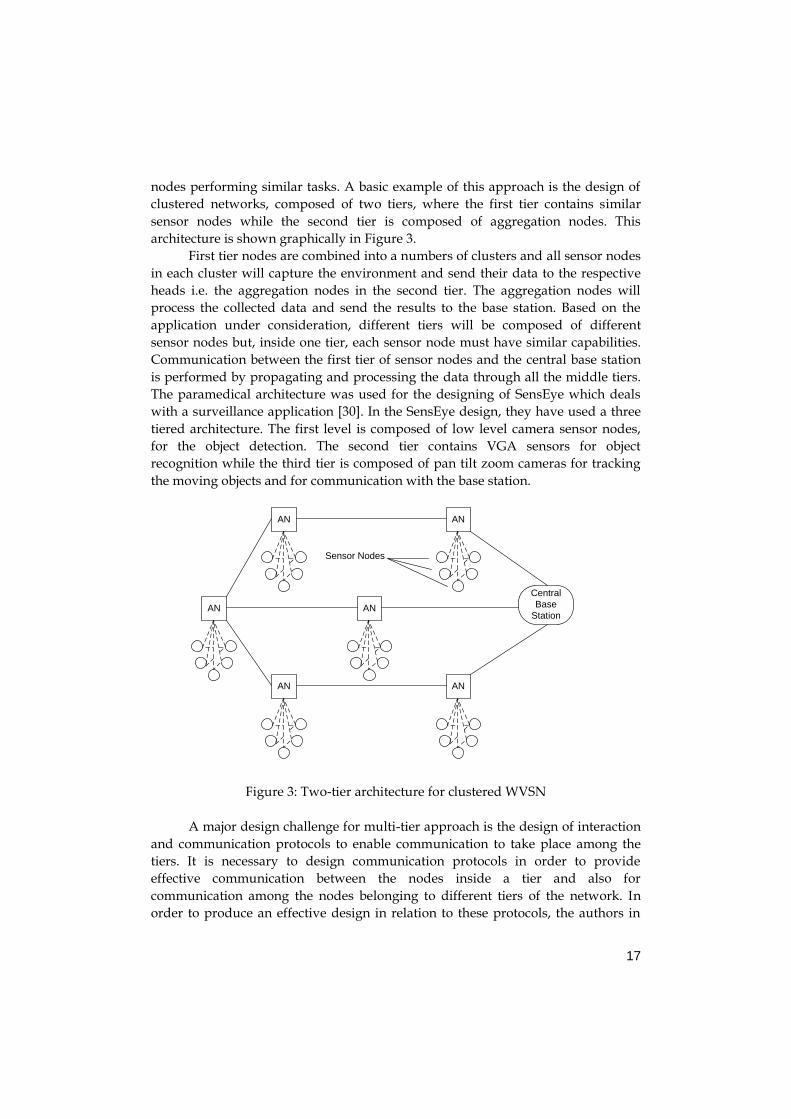
nodes performing similar tasks. A basic example of this approach is the design of
clustered networks, composed of two tiers, where the first tier contains similar
sensor nodes while the second tier is composed of aggregation nodes. This
architecture is shown graphically in Figure 3.
First tier nodes are combined into a numbers of clusters and all sensor nodes
in each cluster will capture the environment and send their data to the respective
heads i.e. the aggregation nodes in the second tier. The aggregation nodes will
process the collected data and send the results to the base station. Based on the
application under consideration, different tiers will be composed of different
sensor nodes but, inside one tier, each sensor node must have similar capabilities.
Communication between the first tier of sensor nodes and the central base station
is performed by propagating and processing the data through all the middle tiers.
The paramedical architecture was used for the designing of SensEye which deals
with a surveillance application [30]. In the SensEye design, they have used a three
tiered architecture. The first level is composed of low level camera sensor nodes,
for the object detection. The second tier contains VGA sensors for object
recognition while the third tier is composed of pan tilt zoom cameras for tracking
the moving objects and for communication with the base station.
Central
Base
Station
ANAN
ANAN
Sensor Nodes
AN AN
Figure 3: Two-tier architecture for clustered WVSN
A major design challenge for multi-tier approach is the design of interaction
and communication protocols to enable communication to take place among the
tiers. It is necessary to design communication protocols in order to provide
effective communication between the nodes inside a tier and also for
communication among the nodes belonging to different tiers of the network. In
order to produce an effective design in relation to these protocols, the authors in
18
[29] identified two issues. The first issue consists of finding efficient collaborative
image processing and coding techniques that are able to exploit the correlation in
the data collected by adjacent camera nodes. The second issue is how to reliably
send the relevant visual data from the sensor nodes to the central base station in an
energy efficient way. The interested readers are encouraged to read details in [29].
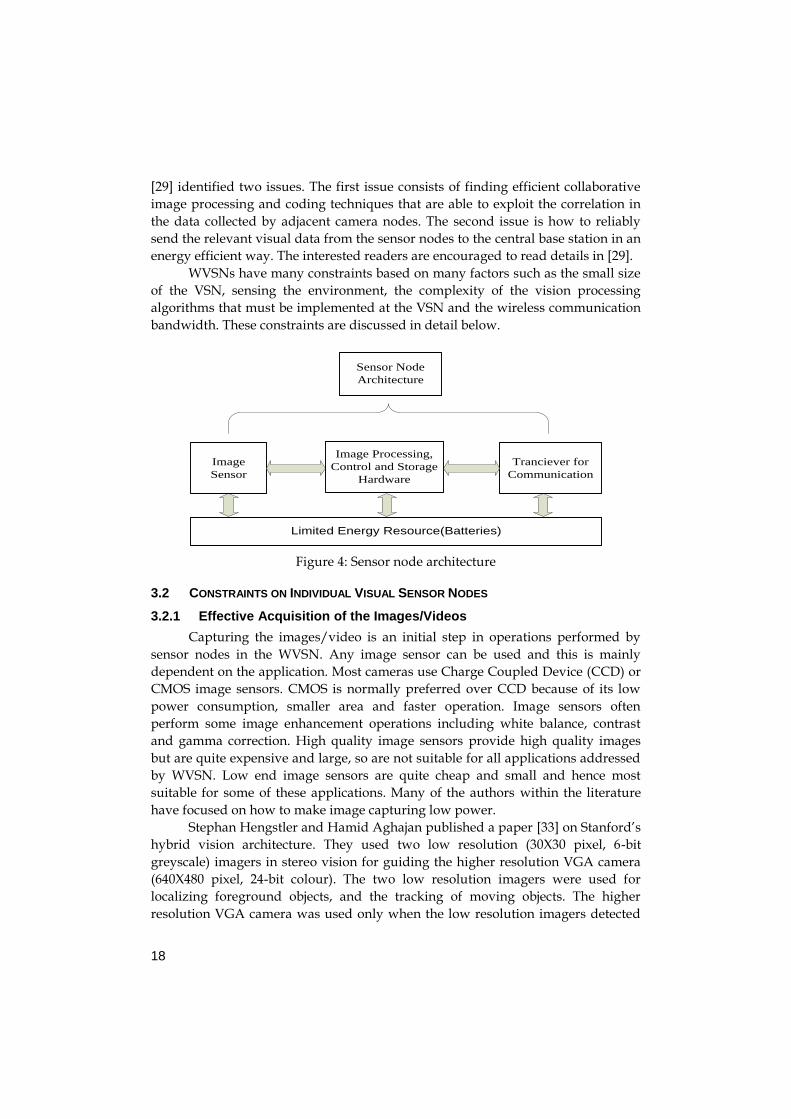
WVSNs have many constraints based on many factors such as the small size
of the VSN, sensing the environment, the complexity of the vision processing
algorithms that must be implemented at the VSN and the wireless communication
bandwidth. These constraints are discussed in detail below.
Sensor Node
Architecture
Image
Sensor
Tranciever for
Communication
Limited Energy Resource(Batteries)
Image Processing,
Control and Storage
Hardware
Figure 4: Sensor node architecture 3.2 CONSTRAINTS ON INDIVIDUAL VISUAL SENSOR NODES
3.2.1 Effective Acquisition of the Images/Videos
Capturing the images/video is an initial step in operations performed by
sensor nodes in the WVSN. Any image sensor can be used and this is mainly
dependent on the application. Most cameras use Charge Coupled Device (CCD) or
CMOS image sensors. CMOS is normally preferred over CCD because of its low
power consumption, smaller area and faster operation. Image sensors often
perform some image enhancement operations including white balance, contrast
and gamma correction. High quality image sensors provide high quality images
but are quite expensive and large, so are not suitable for all applications addressed
by WVSN. Low end image sensors are quite cheap and small and hence most
suitable for some of these applications. Many of the authors within the literature
have focused on how to make image capturing low power.
Stephan Hengstler and Hamid Aghajan published a paper [33] on Stanford‟s
hybrid vision architecture. They used two low resolution (30X30 pixel, 6-bit
greyscale) imagers in stereo vision for guiding the higher resolution VGA camera
(640X480 pixel, 24-bit colour). The two low resolution imagers were used for
localizing foreground objects, and the tracking of moving objects. The higher
resolution VGA camera was used only when the low resolution imagers detected
19
an event. This technique is more powerful both for power constraints and for
accuracy in terms of object detection and tracking. In [41] the authors argued that
by deploying a large number of low resolution imagers in the environment, the
network will perform very well in comparison to deploying a small number of
high resolution imagers. Another issue in this category is the coverage of the area
under consideration. This issue can be solved by using redundant cameras, which
will be triggered in case there are some camera sensor failures. It can be made
energy efficient by placing the redundant nodes in sleep mode. The management
of sensor nodes in sleep and active modes can be performed by means of software,
for network lifetime maximization. The interested readers are advised to study [29]
to obtain a good overview of camera coverage.
3.2.2 Vision Processing at the Sensor Nodes
Due to communication bandwidth problems in WVSN, the information that
must be communicated between the sensor node and the CBS should be reduced
as much as possible. By performing some vision processing algorithms at the
sensor nodes, the image data requiring to be sent to the CBS can be reduced. Vision
processing at the sensor node can be simple as well as complex and is truly
dependant on the application. By performing complex vision algorithms at the
sensor node, the image data can be reduced sufficiently but its overhead involve
more processing time and computational energy consumption. Thus, by reducing
the image data, the communication costs can be reduced but the computational
cost will be increased.
By performing some simple vision processing algorithms at the sensor node,
such as the subtraction of the current frame from the background in order to
detect any object, the sensor node can decide whether to send the current frame to
the base station or not(subject to the detection of the object in the current frame).
The sensor nodes can also collaborate by exchanging the detected object features,
in order to perform some higher level operation to confirm the object's appearance,
its location and behaviour etc. In sensor nodes, different kinds of vision processing
algorithms are required, based on the stated application, for the effective detection
of image features. For example, a face recognition algorithm will definitely be
different from a vehicle detection algorithm. In this research project, an attempt is
being made to detect magnetic particles in flowing oil in a hydraulic system
prototype machine. The flowing oil contains magnetic particles as well as air
bubbles.
The background image without magnetic particles and air bubbles is stored
in the RAM. The difference between the current frame and the background image
is calculated. The resultant image is thresholded using fixed thresholding method.
A number of morphological operations have then been performed in order to
achieve a high degree of accuracy. The next step is to remove the bubbles from the
images. In images, the bubbles and particles are very similar to the visual eye and
could be misleading sometimes. Thus, in order to be accurate, these bubbles should

20
be identified from the magnetic particles and should then be removed from the
images before the images are sent to the CBS for further operations. Background
subtraction and morphological operations are simple and could be implemented at
the sensor node, but, other complex operations such as labelling are very time
consuming and demand higher processing power and hence should be performed
at the CBS. Even Cyclops [31], was unable to perform blob filtering. Many different
types of currently available processors can be used for the vision processing task in
WVSN.
3.2.2.1 Digital Signal Processor (DSPs)
Many Digital Signal Processors (DSPs) intended for embedded application
have been used for the development of SCN [42]. The majority of the generally
available DSPs can be used for the image processing operation because these
normally require signal processing operations which are usually very fast on a
general DSPs platform. The problem associated with DSP is its sequential
execution of the tasks. If someone developed sensor nodes based on DSPs and
wanted to include more functionality, then either the performance will be
sacrificed or more DSPs will be necessary in order to maintain the performance as
no parallelism exists in DSPs.
3.2.2.2 Media Processor
These processors are very suitable for multimedia operations and provide a
high flexibility and cost effectiveness. Typically, the main core in these kinds of
processors are general DSPs and also include some multimedia peripherals such as
video and other fast data ports. Examples of these kinds of processors are Trimedia
(NXP), DM64X (TI), Blackfin (ADI) and BSP equator.
3.2.2.3 Image Vision Processor
Low level image processing operations such as those which are pixel based
including background and current frame subtraction for object detection are highly
parallel in nature. Highly parallel processor architecture can provide very efficient
solutions for such operations [43]. Single Instruction Multiple Data (SIMD),
processors contains multiple processing elements and is very suitable for
operations which are highly parallel in nature such as convolution and other low
level image processing operations. SIMD processors are, additionally, not power
hungry. One good example of a SIMD processor is the Xetal-II processor from NXP
which contains 320 processing elements and can achieve a performance of over 100
Giga Operations Per Second (GOPS) with less than 600 mW of power consumption
[44]. This chip has been used in WiCa wireless Smart Camera [49].
3.2.2.4 Hybrid Processor / System on Chip
Vision processing operations in Smart Cameras include both parallel and
sequential operations. Sometimes a hybrid approach is the most suitable for the
21
vision processing operation in Smart Cameras. In the hybrid approach SIMD
processors are applied to low level pixel operations which are parallel and some
general purpose DSPs are used for the other operations such as object analysis and
other decision making operations. For example the WiCa smart camera platform is
composed of a general purpose micro-controller and a SIMD Xetal (NXP) [47].
The choice between a fixed point and floating point processor is another
constraint. Floating point processors are more expensive than fixed point
processors and as images normally contain 8 bit data, for many low level
operational, fixed point processors are considered as being sufficient.
3.2.3 Power Consumption
Once deployed and configured properly, WVSNs are supposed to work
unattended for many years. To meet the multi-year functioning requirements,
individual sensor nodes must be incredibly low power. In contrast to cell phones
which have average power consumption within the range of a few hundred
milliamps and lifetimes of a few days, the average power consumption of sensor
nodes in WVSNs must be measured in the range of micro amps and must last for
several years. This ultra-low-power operation requirement can only be achieved by
combining both low-power hardware components and low duty-cycle operation
techniques.
During an active period, the communication component will use a major
portion of the sensor node‟s total energy budget. Specialized algorithms and
protocols must be developed in order to reduce the communication energy
whenever possible. This can be achieved by using localized computation to reduce
the amount of data that is required to be transmitted and through application
specific protocols for effective communication. For example, events from multiple
sensor nodes can be combined together by a local group of nodes before
transmitting a single result across the sensor network.
3.2.4 Real Time Performance
It is particularly true that surveillance applications of WVSN must process
real time data, which imposes strict constraints on the latency of data produced at
the sensor nodes and sent to the CBS. The latency is dependent on the amount of
vision processing performed at the sensor nodes, the communication bandwidth
among the sensor nodes and the CBS, the employed wireless standard and the
current load in the network. In the literature [41] it has been investigated that the
error protection scheme such as an Automated Repeat Request (ARR) and Forward
Error Request (FER), also have an impact on the latency of data in the network and
are therefore not advisable for use in WVSNs based on their strict delay
constraints.
For real time data transmission over the network, consideration should be
given to the modules that provide higher bandwidths such as those based on IEEE

22
802.11. In [45] it is stated that multi-hop routing is the preferable technique for
wireless sensor networks due to its high energy efficiency. However, the problem
associated with multi-hop technique is the latency because, due to queuing and
vision processing at the intermediate nodes, the latency from the source node to
the CBS node increases.
3.2.5 Cost and Size
The physical size and cost of an individual sensor node has a significant and
direct impact on the ease and cost of deployment of a WVSN. In a data collection
application of WVSN, scientists will often be faced with a fixed budget. The
primary goal of these scientists will be to collect data from as many locations as
possible without exceeding their fixed budget. A reduction in the cost of a single
node will result in the ability to purchase more nodes, deploy a collection network
with higher density, and collect more useful data. Physical size also has an impact
on the ease of network deployment. Smaller nodes can be placed in more locations
and used in more scenarios. In the node tracking applications, smaller, lower cost
nodes will result in the ability to track more objects.
3.2.6 Memory Usage
In the majority of the WVSN applications , the processing at the sensor
nodes is performed by some micro-controller, or some microprocessor based on
low energy consumption and for reasons associated with low cost. Sometimes
more memory is required and in these situations a mini Secure Digital (SD) card
based memory is a good choice. Also, in some applications such as the remote
monitoring of a forest, continuous transmission of data could exhaust the sensor
node battery, so it is preferable to store the data in a local memory. A vast amount
of memory is required in these applications.
Data can be reduced by performing a spatio-temporal analysis on the images
and the data that really has to be stored can be identified and hence stored in the
memory. The data can also be reduced by communication among the nodes which
have overlapping Fields of View (FoV) and then by applying some fusion
techniques to further reduce the redundant data. By providing extra memory at the
sensor nodes, some complex computation can be performed locally when the
processor is free, and hence the data that must be sent to the CBS can thus be
reduced.
3.2.7 Sensor Communication
For almost all WVSN applications it is necessary that all the sensor nodes
must be equipped with communication capabilities, in order to collaborate among
themselves and also to share their information with the CBS. It has been
investigated in [24] that communication is the most energy consuming operation in
WVSN. Communication protocols for typical wireless sensor networks in the

23
literature have focussed on the power constraints of the low data rate
communication.
In case of WVSN, in addition to energy efficiency, there must also be a
concentrated effort given to the tight quality of service requirements. From the
discussion in [46] it can be concluded that communication protocols designed for
typical wireless communication cannot be directly applied to WVSN. So the
author in [28] has used a new interconnection protocol for the sensor nodes
communication, mentioned previously as FLIP. This is a network layer protocol
designed to interconnect devices with different power consumption,
communication and processing capabilities. Due to its manageable header, FLIP
can be used in power constrained as well as powerful devices. FLIP can be used for
communication among sensor nodes, CBS and also for communication between
sensor nodes and CBS. Because of its flexible header size, it can be used to
prioritize some particular packets of data. This property of FLIP is very important
because, it can be the case that many sensor nodes detect an event and transmit
data on the network, hence causing congestion in the network and there is chance
of wasting the most important data as well. By prioritizing, the most important
data will be transferred through the network.
3.3 KEY FEATURES OF WVSN
After establishing the constraints on the individual sensor nodes, an
evaluation of some of the key characteristics of the WVSN will be discussed now.
In order to do this, it is important to bear in mind the high-level objectives of the
WVSN deployment and the intended usage of the WVSN. The key evaluation
metrics for wireless sensor networks are lifetime, coverage, cost and ease of
deployment, response time, and effective sample rate. Based on the results, the
conclusion drawn is that some of these key features are dependent on each other.
Sometimes it may be necessary to reduce the performance in one key feature, such
as sample rate, in order to increase another, such as lifetime.
Overall these key features of WVSN form a multi-dimensional space that can
be used to describe the capabilities of a WVSN. The capabilities of a platform are
represented by a volume within this multi-dimensional space, containing all of the
valid operating points. One goal of the discussion in this section is to present an
understanding of the trade-offs that link each key feature of this multi-dimensional
space.
3.3.1 Lifetime
Lifetime is a highly critical key feature of a WVSN. The goal of all
applications of WSN is to install the it once and then leave it, unattended, for
months or years. The primary limiting factor for the lifetime of a WVSN is the
energy supply. Each sensor node must be designed in such a way that it should
manage its local supply of energy for all of its local operations in order to
24
maximize the total network lifetime. In many cases the average node lifetime is not
important, but rather the minimum node lifetime is important. In the case of
surveillance applications, every node must last for multiple years. A single node
failure in this application would create vulnerability in these systems.
In most application of WVSN, a majority of the nodes will have to be self
powered. They will either have to contain sufficient stored energy to last for the
intended number of years, or they will have to be able to scavenge energy from the
environment through devices, such as solar cells. Both of these options demand
that the average energy consumption of the nodes must be as low as possible. The
most important factor in determining the lifetime of a given energy supply is the
power consumption of the communication component of each sensor node. In a
wireless sensor node, the RF transceiver consumes a great deal of the system
energy.
3.3.2 Scalability
Scalability of WVSN is very important to the end user. A user can deploy a
small trial WVSN at first and then can continually add sensor nodes to collect more
and different information. The end user is often interested in the scalability of the
network technology, in order to meet eventual needs in the future. Increasing the
number of nodes in the system can impact upon the lifetime, effective sample rate
or perhaps any other key characteristic. More and more sensor nodes will cause
more data to be transmitted which will increase the power consumption of the
network.
3.3.3 Cost and Ease of Deployment
A key feature of the WVSN is their ease of deployment. Scientists or other
end users who want to install a WVSN cannot be expected to understand the
underlying networking and communication mechanisms of the WVSN. For system
deployments to be successful, the WVSN must configure itself. Ideally, the system
would automatically configure itself for any possible physical sensor node
placement. However, WVSNs have constraints on the actual sensor node
placement. It is not possible to have nodes with an infinite range. The WVSN must
be capable of providing feedback for any sensor node failure.
In addition to an initial configuration phase, a WVSN must also adapt to
changing environmental conditions. The initial deployment and configuration is
only the first step in the WVSN life-cycle. In the long term, the total cost of
ownership for a system may have more to do with the maintenance costs than with
the initial deployment costs. When necessary, these networks should also be able
to generate requests when external maintenance is required. In a real deployment
scenario, a fraction of the total energy budget must be dedicated to system
maintenance and verification.
25
3.3.4 Response Time
Particularly in surveillance applications, the response time is a critical
performance metric. A signal must be sent immediately after the detection of an
intruder. For these kinds of applications instead of a low power operation, nodes
must be capable of having immediate, high-priority messages communicated
across the network as quickly as possible. It is important to note that these will be
infrequent events, but they may occur at any time without notice.
Many end users envision WVSNs as useful tools for industrial process
control. These systems would only be practical if response time constraints could
be satisfied. The ability to have low response time is in conflict with many of the
techniques used to increase the network lifetime. The network lifetime can be
increased by having nodes which only operate their RF transceiver for brief
periods of time. If a node only turns on its RF transceiver once per minute to
transmit and receive data, it would be impossible to meet the application
requirements for the response time of a surveillance system. Response time can be
improved by including nodes that are always powered as these can then listen for
the alarm messages and forward them immediately down to a routing backbone
when necessary.
3.3.5 Security
Maintaining privacy with regards to the information collected by WVSN is
very important from many aspects. In the wrong hands, this information can be
exploited to plan a strategic or physical attack on a company. WVSN must be
capable of retaining the information they are collecting private and not enabling it
to fall into the wrong hands. In security oriented applications, data security
becomes even more significant. Not only must the WVSN maintain privacy, it
must also be able to authenticate data communication. It should not be possible to
introduce a false alarm message or to replay an old alarm message as a current
one. The use of encryption and cryptographic authentication costs both power and
network bandwidth. Extra computation must be performed to encrypt and decrypt
data and extra authentication bits must be transmitted with each packet. This has
an impact on the application performance by decreasing the number of samples
that can be extracted from a given network and the expected network lifetime.
3.3.6 Sample Rate
In WVSN, the sample rate is a primary application performance feature and
this is the rate at which each individual sensor can transmit its data to the CBS.
Environmental data collection applications typically demand sampling rates of a
few samples per minute only. In-network data processing can be used to determine
when an interesting event has occurred and automatically trigger data storage.
Triggering is the simplest form of in-network processing and it is commonly used
in surveillance application. Effectively, each individual sensor is sampled

26
continuously, processed, and the data is sent to the CBS only when a security break
has occurred. If no local computation was occurring, a continuous stream of
redundant sensor readings would have to be transmitted. Most active components,
such as the micro-controller and RF transceiver, provide different power states,
with tremendous differences in their energy consumption.
In reality, the choice for the states to be adopted for an operation can be
quite broad and is mainly dependant on the components used. For example, a
typical MSP430 micro-controller from Texas Instruments offers seven different
states (i.e., one active mode, five low power modes, in addition to shutdown),
allowing the optimization of energy conservation by picking the most appropriate
operation mode at any given time. However, for simplification reasons, in the
following, a division will only be made between the active and inactive states.
Duty-cycling is a common approach to reducing the average energy consumption
in a WVSN. Its main principle is to achieve lower average power consumption by
being inactive whenever possible.
Tactive Tinactive
Tsample
Pinactive
Pactive
Time
Twakeup
Pwakeup
...
Figure 5: Tri-modal (three power states) duty-cycling principle.
Figure 5 shows the graphical representation of the wakeup, active and
inactive power states (tri-modal power operation). The portion of time in the active
state is denoted by Tactive and the time in the inactive state is Tinactive. The duty
cycle δ can be expressed as
1<δ<0 ,TT+T
T=δ
wakeupinactiveactive
active
3.1
T+T+T=T wakeupinactiveactivesample 3.2
Equation 3.1 and Equation 3.2 implies that

27
)TT+(T*δ=T wakeupinactiveactiveactive T*δ sample= 3.3
TT+T
T
TT+T
TT+T=δ1
wakeupinactiveactive
active
wakeupinactiveactive
wakeupinactiveactive
wakeupinactiveactive
activewakeupinactiveactive
TT+T
TTT+T
wakeupinactiveactive
wakeupinactive
TT+T
TT=
3.4
Equation 3.4 implies that
)TT+(Tδ)-(1=TT wakeupinactiveactivewakeupinactive
samplewakeupinactive T*δ)(1=TT 3.5
wakeupsampleinactive TT*δ)(1=T 3.6
TT*δ)(1=T inactivesamplewakeup 3.7
In order for this equation to be effective, the duty cycle should be
significantly less than one. Furthermore, the power consumption levels in the
active and inactive states must be considerably different in relation to each other.
In typical WVSN applications, both of these conditions are valid. Specifically, in
this application, the sampling rates are of the order of a few minutes while the
active time of the VSN is a fraction of a second. This typically leads to very low
duty cycles in the network. Consumption level differences are achieved by
toggling between the active and inactive states. Taking these factors into
consideration, duty-cycling can be applied to the different modules of the VSN. In
general the average power consumption obtained by duty-cycling can be described
as
sample
wakeupwakeupinactiveinactiveactiveactive
δT
P*TT*P +T*P=P
sample
wakeupwakeup
sample
inactiveinactive
sample
activeactive
T
P*T
T
T*P
T
T*P=
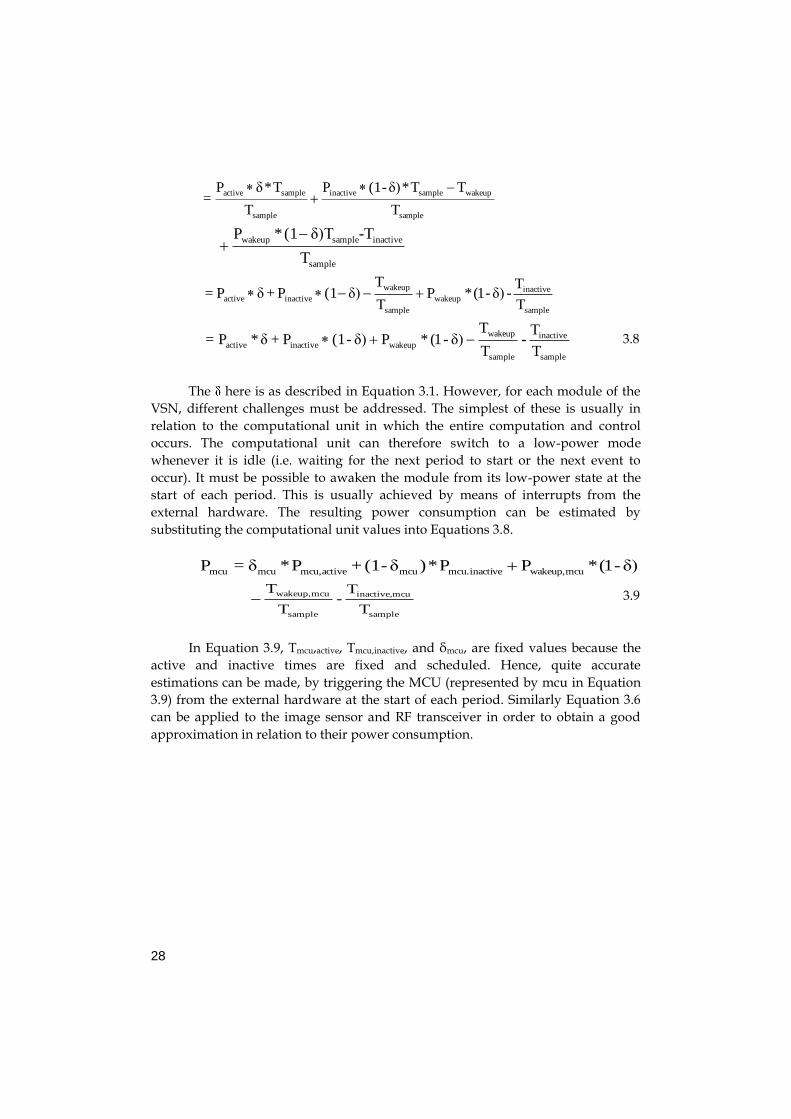
28
T
TT*δ)-(1P
T
T*δP=
sample
wakeupsampleinactive
sample
sampleactive
sample
inactivesamplewakeup
T
Tδ)T(1*P -
sample
inactivewakeup
sample
wakeup
inactiveactiveT
T-δ)-1(*P
T
T δ)(1P+δP =
sample
inactive
sample
wakeup
wakeupinactiveactiveT
T-
T
Tδ)-1(*P δ)-(1P+δ*P= 3.8
The here is as described in Equation 3.1. However, for each module of the
VSN, different challenges must be addressed. The simplest of these is usually in
relation to the computational unit in which the entire computation and control
occurs. The computational unit can therefore switch to a low-power mode
whenever it is idle (i.e. waiting for the next period to start or the next event to
occur). It must be possible to awaken the module from its low-power state at the
start of each period. This is usually achieved by means of interrupts from the
external hardware. The resulting power consumption can be estimated by
substituting the computational unit values into Equations 3.8.
δ)-1(*PP*)δ-(1+P*δ=P mcuwakeup,vemcu.inactimcumcu,activemcumcu
sample
mcuinactive,
sample
mcuwakeup,
T
T-
T
T 3.9
In Equation 3.9, Tmcu,active, Tmcu,inactive, and δmcu, are fixed values because the
active and inactive times are fixed and scheduled. Hence, quite accurate
estimations can be made, by triggering the MCU (represented by mcu in Equation
3.9) from the external hardware at the start of each period. Similarly Equation 3.6
can be applied to the image sensor and RF transceiver in order to obtain a good
approximation in relation to their power consumption.

29
4 A WIRELESS SYSTEM FOR FAILURE DETECTION IN MACHINERY
4.1 DESCRIPTION
In this thesis, the case study “A Wireless System for Failure Detection in Machinery” is a test vehicle. The main goal is to develop a vision processing/analysis tool that detects magnetic particles in the flowing liquid in machinery and measures the dimensions of these particles. This is an industrial application of video processing at low sampling rates. Achieving low energy for a battery powered wireless platform, which is capable of performing the desired vision processing algorithms is a research challenge.
Sometimes small magnetic particles detach from the engine and enter into
the oil flowing in hydraulic systems. Some bubbles will also flow into the oil. In
this project we are attempting to detect the bubbles and magnetic particles in the
oil flowing in a hydraulic system, identify the bubbles from the magnetic particles
and then determine the different dimensions such as the area and location of the
magnetic particles in the images captured in the hydraulic system. If the quantity
of magnetic particles of a certain dimension (having an area greater than or equal
to 0.1 mm) increases from the given limits, then the engine in the hydraulic system
must be changed in order to achieve effective productivity.
A prototype hydraulic system is shown in Figure 6, in which oil is flowing in
the pipe. In Figure 6, of the prototype machine, in one suitable place, a round glass
is embedded in between two pipe pieces denoted by C. At the backside of the
glass, there is a strong magnet and when the magnetic particles in the oil pass
through this magnet they become stuck to the magnet. The purpose of this glass
window is to capture the images of the magnetic particles with an image sensor
denoted by B in Figure 6. The background image, without the particles, is initially
stored in the memory (in industry this occurs at the start of the machine
installation). The magnetic particles detected by our wireless platform (denoted by
E in Figure 6) are shown on the liquid crystal display denoted by D in Figure 6.
In Figure 6, the portion denoted by A is the external light used in order to
achieve a sufficiently high signal to noise ratio. It is then possible to easily
determine the difference between the current image and the background image.
The resultant image is thresholded and this is based on a fixed threshold.
Following this, it is necessary to perform morphological operations in order to
remove one to two pixels false objects (due to illumination problem, to be
explained latter) in order to achieve high levels of accuracy. The next step is to
remove the bubbles from the images as, in these images, the bubbles and particles
are very similar to the visual eye and could, on occasions, be misleading.
The idea to identify the bubbles implemented in this platform is a very
simple one. The magnetic particles stuck to the magnet and are hence stationary,
while, at the same time, the bubbles move around in the flowing liquid. Thus by
analysing two continuous frames, the moving entities are termed as bubbles, and
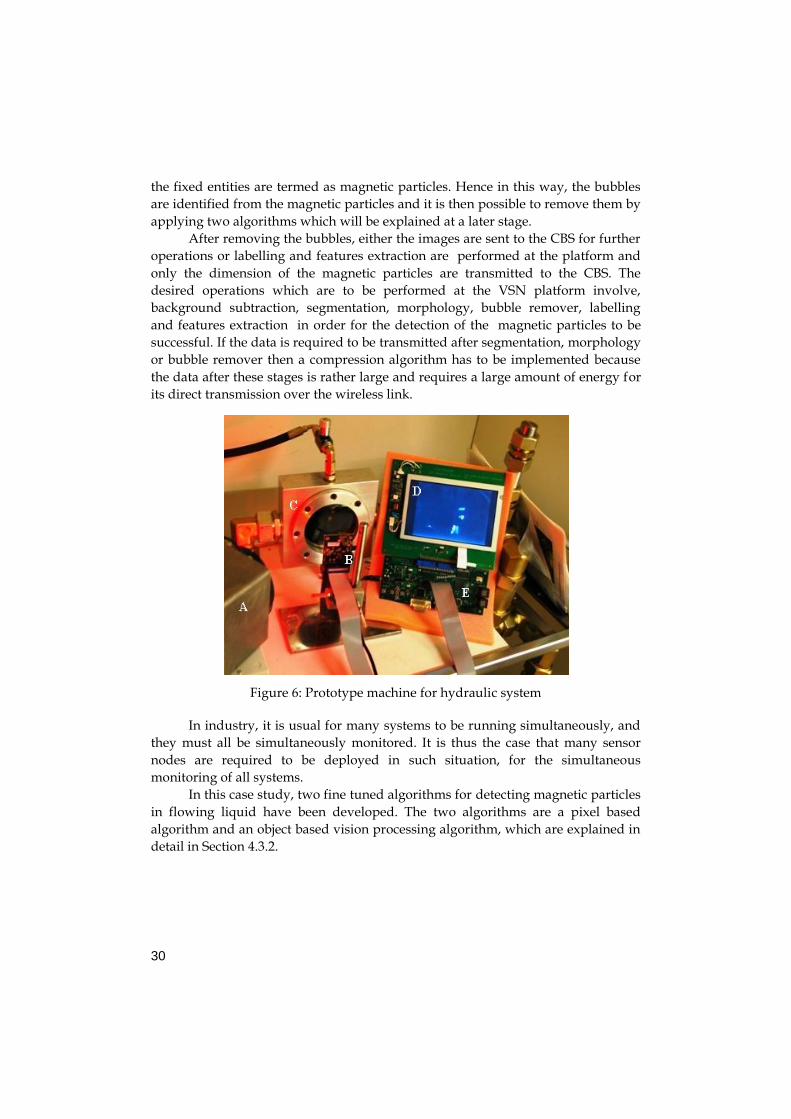
30
the fixed entities are termed as magnetic particles. Hence in this way, the bubbles
are identified from the magnetic particles and it is then possible to remove them by
applying two algorithms which will be explained at a later stage.
After removing the bubbles, either the images are sent to the CBS for further
operations or labelling and features extraction are performed at the platform and
only the dimension of the magnetic particles are transmitted to the CBS. The
desired operations which are to be performed at the VSN platform involve,
background subtraction, segmentation, morphology, bubble remover, labelling
and features extraction in order for the detection of the magnetic particles to be
successful. If the data is required to be transmitted after segmentation, morphology
or bubble remover then a compression algorithm has to be implemented because
the data after these stages is rather large and requires a large amount of energy for
its direct transmission over the wireless link.
Figure 6: Prototype machine for hydraulic system
In industry, it is usual for many systems to be running simultaneously, and
they must all be simultaneously monitored. It is thus the case that many sensor
nodes are required to be deployed in such situation, for the simultaneous
monitoring of all systems.
In this case study, two fine tuned algorithms for detecting magnetic particles
in flowing liquid have been developed. The two algorithms are a pixel based
algorithm and an object based vision processing algorithm, which are explained in
detail in Section 4.3.2.

31
4.2 MAIN ISSUES
Since complex image processing algorithms such as morphology, labelling,
features extraction and image compressions must be implemented at the VSN, it is
the case that these require large energy resources. A high energy requirement at
the VSN leads to its reduced lifetime. Hence the main problem in this case study is
the minimization of the energy consumption of the VSN implementation, in order
to achieve a reasonable lifetime for the VSN. In other words, the aim is to
maximize the lifetime of the VSN, which has a direct impact on the lifetime of the
WVSN. The lifetime of the WVSN must be of the order of a number of years in
order for the network to be used in real world applications.
4.2.1 Effect of communication on the lifetime of Visual Sensor Node
Communication is one of the major bottlenecks in the implementation and
deployment of a WVSN. The data produced at each VSN in the WVSN has to be
transmitted to the CBS for further analysis and consequently an appropriate action
is required by the end user. The wireless range of an individual sensor node (using
IEEE 802.15.4 transceiver) is limited to about 50 meters in indoor applications and
the total area of the WVSN is within the range of a few hundreds to a few
thousand meters. Thus the distance of many nodes from the CBS is larger than its
wireless range, hence each node is required to forward packets to other nodes in
the network. As it is the case that communication is very power hungry, a great
deal of the energy budget of each sensor is consumed in relation to
communicating/forwarding the results to the CBS. In this manner the lifetime of
the VSN is severely affected.
In Section 4.3, the discussion will relate to all the vision processing
operations that must be implemented either at the VSN or CBS in the desired
WVSN.
4.3 EXPERIMENTAL SETUP
The following are the main stages in relation to the desired algorithm.
4.3.1 Pre-Processing
In this step the image is subtracted from the background. In the pixel based
bubble remover algorithm, the background is initially stored in the memory and
this stored background is used for the subtraction operation. In the object based
method, a real time background is generated from the original image by using a
low pass filter. This real time estimated background is then subtracted from the
image in order to detect objects which could be magnetic particles or bubbles. All
pixels having a grey scale value less than a pre-defined threshold are assigned a
zero(representing black) value and all other pixels in the image are assigned the
value one (representing white). A morphological operation is then performed on
the segmented image in order to remove one to two pixel false objects.
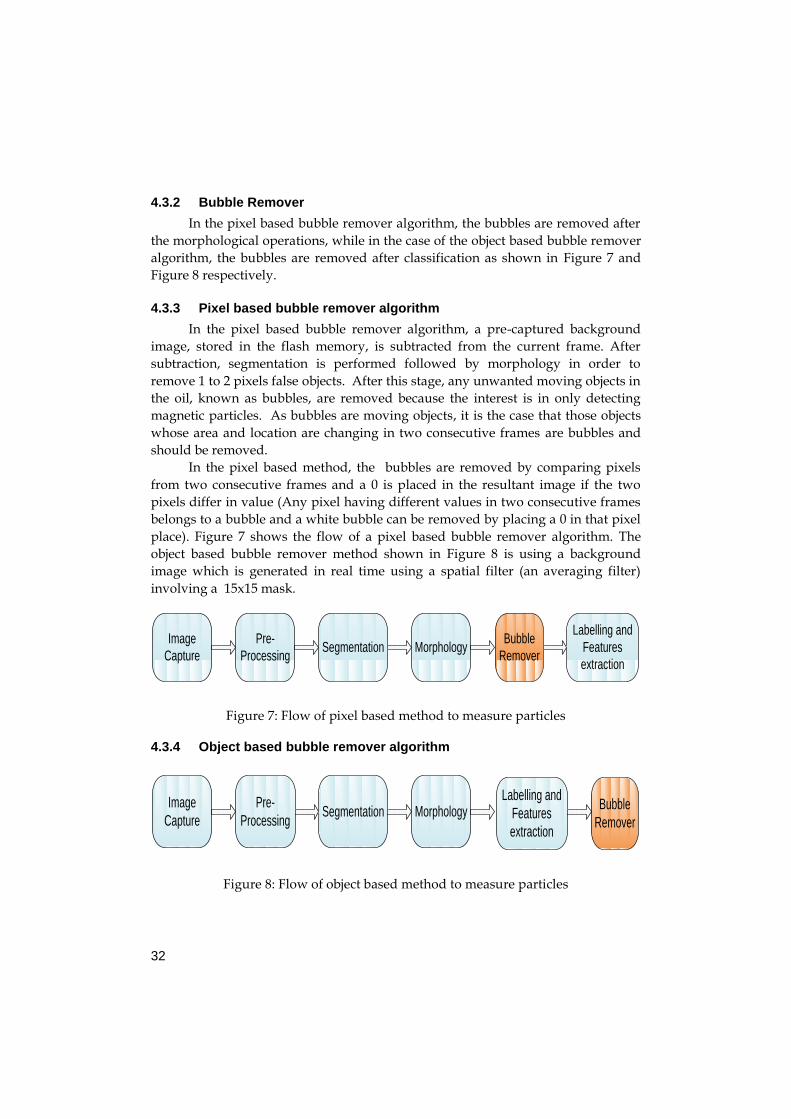
32
4.3.2 Bubble Remover
In the pixel based bubble remover algorithm, the bubbles are removed after
the morphological operations, while in the case of the object based bubble remover
algorithm, the bubbles are removed after classification as shown in Figure 7 and
Figure 8 respectively.
4.3.3 Pixel based bubble remover algorithm
In the pixel based bubble remover algorithm, a pre-captured background
image, stored in the flash memory, is subtracted from the current frame. After
subtraction, segmentation is performed followed by morphology in order to
remove 1 to 2 pixels false objects. After this stage, any unwanted moving objects in
the oil, known as bubbles, are removed because the interest is in only detecting
magnetic particles. As bubbles are moving objects, it is the case that those objects
whose area and location are changing in two consecutive frames are bubbles and
should be removed.
In the pixel based method, the bubbles are removed by comparing pixels
from two consecutive frames and a 0 is placed in the resultant image if the two
pixels differ in value (Any pixel having different values in two consecutive frames
belongs to a bubble and a white bubble can be removed by placing a 0 in that pixel
place). Figure 7 shows the flow of a pixel based bubble remover algorithm. The
object based bubble remover method shown in Figure 8 is using a background
image which is generated in real time using a spatial filter (an averaging filter)
involving a 15x15 mask.
Image
Capture
Pre-
ProcessingSegmentation Morphology
Bubble
Remover
Labelling and
Features
extraction
Figure 7: Flow of pixel based method to measure particles 4.3.4 Object based bubble remover algorithm
Image
Capture
Pre-
ProcessingSegmentation Morphology
Bubble
Remover
Labelling and
Features
extraction
Figure 8: Flow of object based method to measure particles
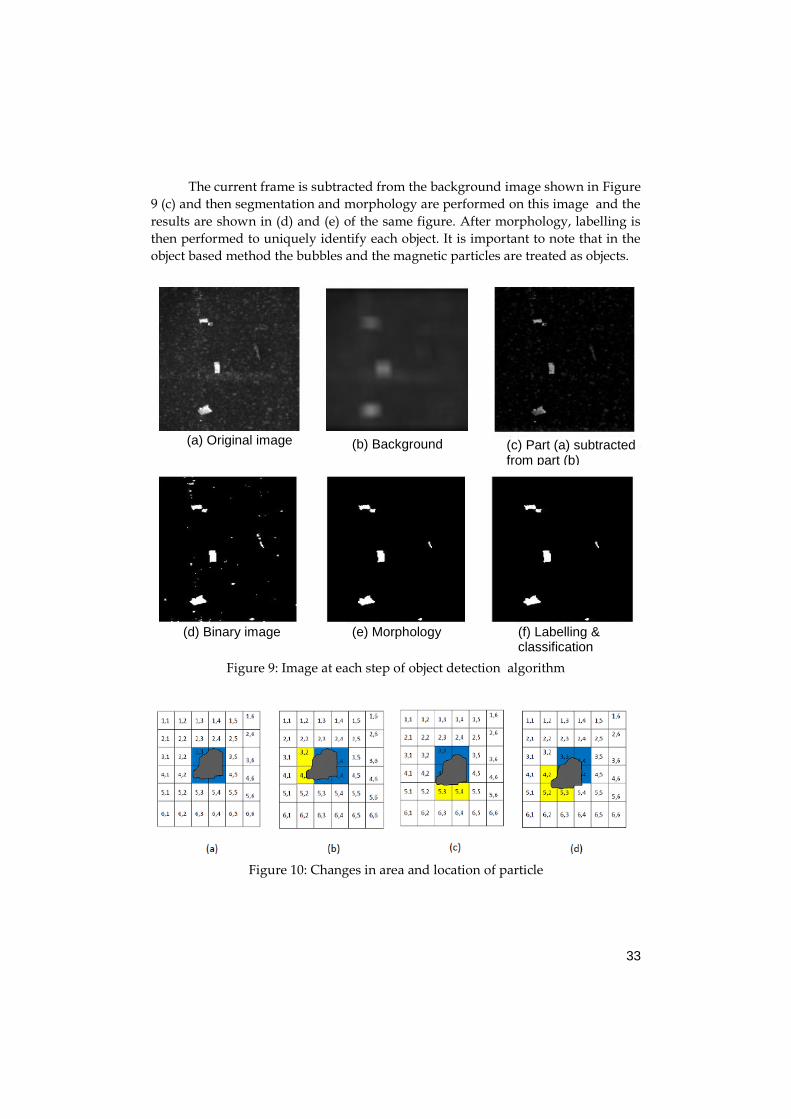
33
The current frame is subtracted from the background image shown in Figure
9 (c) and then segmentation and morphology are performed on this image and the
results are shown in (d) and (e) of the same figure. After morphology, labelling is
then performed to uniquely identify each object. It is important to note that in the
object based method the bubbles and the magnetic particles are treated as objects.
Figure 9: Image at each step of object detection algorithm
Figure 10: Changes in area and location of particle
(b) Background
(b) Background (a) Original image (c) Part (a) subtracted from part (b)
(d) Binary image (e) Morphology (f) Labelling & classification
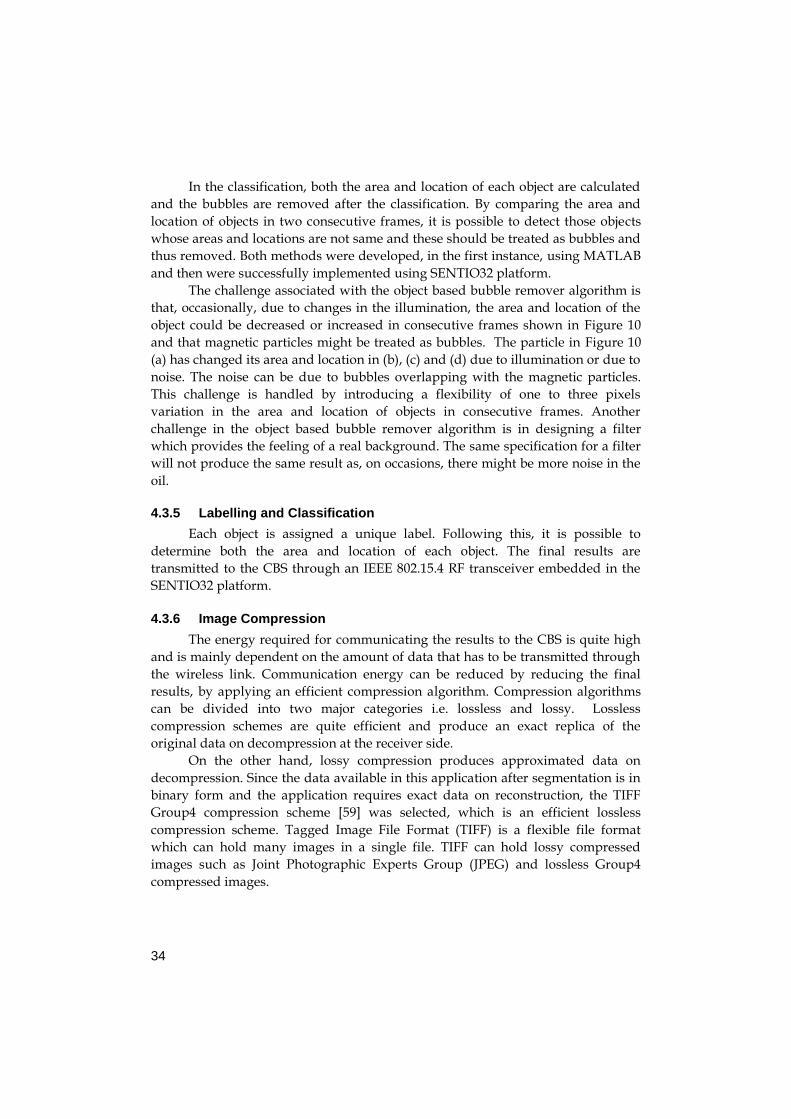
34
In the classification, both the area and location of each object are calculated
and the bubbles are removed after the classification. By comparing the area and
location of objects in two consecutive frames, it is possible to detect those objects
whose areas and locations are not same and these should be treated as bubbles and
thus removed. Both methods were developed, in the first instance, using MATLAB
and then were successfully implemented using SENTIO32 platform.
The challenge associated with the object based bubble remover algorithm is
that, occasionally, due to changes in the illumination, the area and location of the
object could be decreased or increased in consecutive frames shown in Figure 10
and that magnetic particles might be treated as bubbles. The particle in Figure 10
(a) has changed its area and location in (b), (c) and (d) due to illumination or due to
noise. The noise can be due to bubbles overlapping with the magnetic particles.
This challenge is handled by introducing a flexibility of one to three pixels
variation in the area and location of objects in consecutive frames. Another
challenge in the object based bubble remover algorithm is in designing a filter
which provides the feeling of a real background. The same specification for a filter
will not produce the same result as, on occasions, there might be more noise in the
oil.
4.3.5 Labelling and Classification
Each object is assigned a unique label. Following this, it is possible to
determine both the area and location of each object. The final results are
transmitted to the CBS through an IEEE 802.15.4 RF transceiver embedded in the
SENTIO32 platform.
4.3.6 Image Compression
The energy required for communicating the results to the CBS is quite high
and is mainly dependent on the amount of data that has to be transmitted through
the wireless link. Communication energy can be reduced by reducing the final
results, by applying an efficient compression algorithm. Compression algorithms
can be divided into two major categories i.e. lossless and lossy. Lossless
compression schemes are quite efficient and produce an exact replica of the
original data on decompression at the receiver side.
On the other hand, lossy compression produces approximated data on
decompression. Since the data available in this application after segmentation is in
binary form and the application requires exact data on reconstruction, the TIFF
Group4 compression scheme [59] was selected, which is an efficient lossless
compression scheme. Tagged Image File Format (TIFF) is a flexible file format
which can hold many images in a single file. TIFF can hold lossy compressed
images such as Joint Photographic Experts Group (JPEG) and lossless Group4
compressed images.
35
The TIFF Group4 compression scheme uses a two-dimensional line-by-line
coding method in which the position of each changing picture element is coded. In
this manner, vertical features in the source image can be used to achieve better
compression ratios. The position of each changing pixel element on the current
coding line is coded with respect to the position of a corresponding reference
element situated on either the coding line or the reference line. After the coding
line has been coded, it becomes the reference line for the next coding line.
In this implementation, three line buffers have been used in order to
implement the TIFF Group4 compression scheme on FPGA. Two of these buffers
are used to store the reference line and coding line the third line buffer is used in
order to save the current row data which is coming from the camera. When the
current line data is saved after scanning a complete row, it becomes a coding line
and the previous coding line becomes the reference line. At this point, the previous
reference line is no longer required and hence its memory is used in order to save
the pixels of the current scanning row.
The use of the TIFF Group4 compression means that the data is reduced to a
few hundred bytes from a few hundred kilo bytes. This will, in turn, lead to
reduced energy consumption for the overall system as the communication process
is more power hungry in comparison to the other processes at the VSN [2]. The
TIFF Group4 compression could be performed after stages A, B, C or D as shown
by the dashed lines in Figure 11. In Figure 11, images are taken from a set-up of the
system in which A is the image after the image has been subtracted from the
background, B is the image after segmentation and C is the result after the
morphological operation. In images A, B and C, bubbles are visible which are
removed in image E. For these images, an object based bubbles remover algorithm
has been used.

36
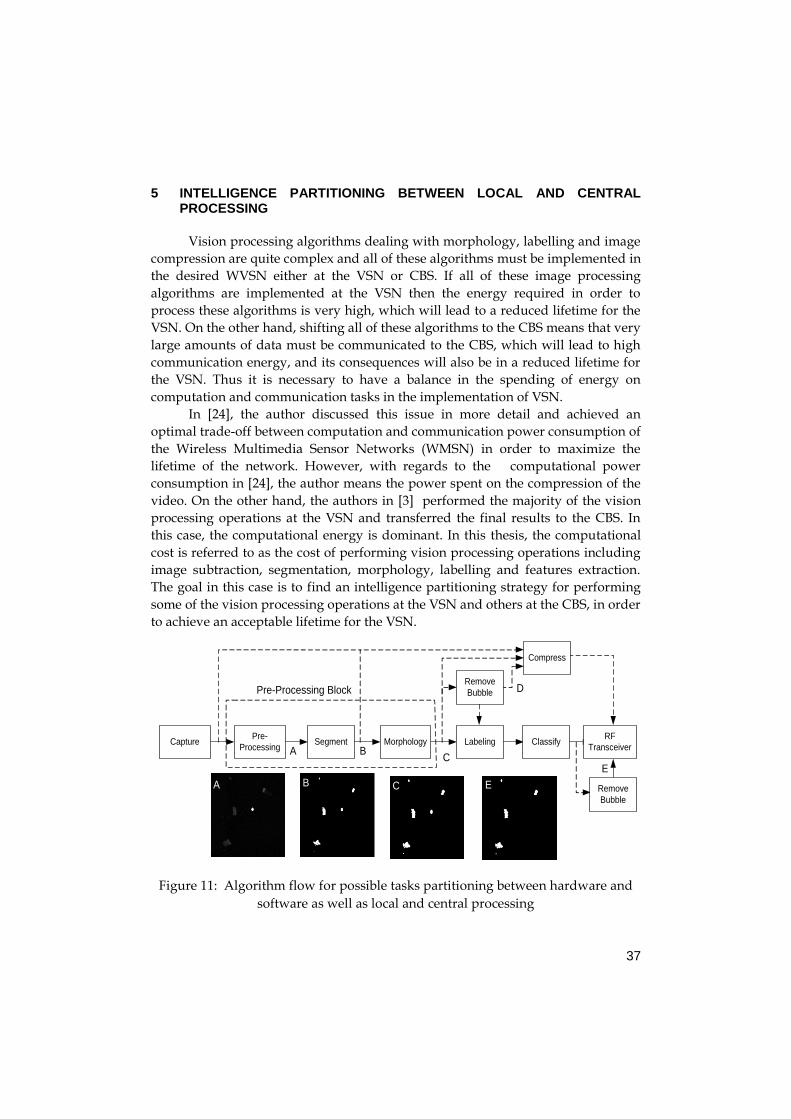
37
5 INTELLIGENCE PARTITIONING BETWEEN LOCAL AND CENTRAL PROCESSING
Vision processing algorithms dealing with morphology, labelling and image
compression are quite complex and all of these algorithms must be implemented in
the desired WVSN either at the VSN or CBS. If all of these image processing
algorithms are implemented at the VSN then the energy required in order to
process these algorithms is very high, which will lead to a reduced lifetime for the
VSN. On the other hand, shifting all of these algorithms to the CBS means that very
large amounts of data must be communicated to the CBS, which will lead to high
communication energy, and its consequences will also be in a reduced lifetime for
the VSN. Thus it is necessary to have a balance in the spending of energy on
computation and communication tasks in the implementation of VSN.
In [24], the author discussed this issue in more detail and achieved an
optimal trade-off between computation and communication power consumption of
the Wireless Multimedia Sensor Networks (WMSN) in order to maximize the
lifetime of the network. However, with regards to the computational power
consumption in [24], the author means the power spent on the compression of the
video. On the other hand, the authors in [3] performed the majority of the vision
processing operations at the VSN and transferred the final results to the CBS. In
this case, the computational energy is dominant. In this thesis, the computational
cost is referred to as the cost of performing vision processing operations including
image subtraction, segmentation, morphology, labelling and features extraction.
The goal in this case is to find an intelligence partitioning strategy for performing
some of the vision processing operations at the VSN and others at the CBS, in order
to achieve an acceptable lifetime for the VSN.
„
Figure 11: Algorithm flow for possible tasks partitioning between hardware and
software as well as local and central processing
Pre-Processing Block
A BC
D
E
MorphologyPre-
ProcessingSegment
Compress
Remove
Bubble
ClassifyLabelingCapture
Remove
Bubble
RF
Transceiver
A
C D
A B
A B C E
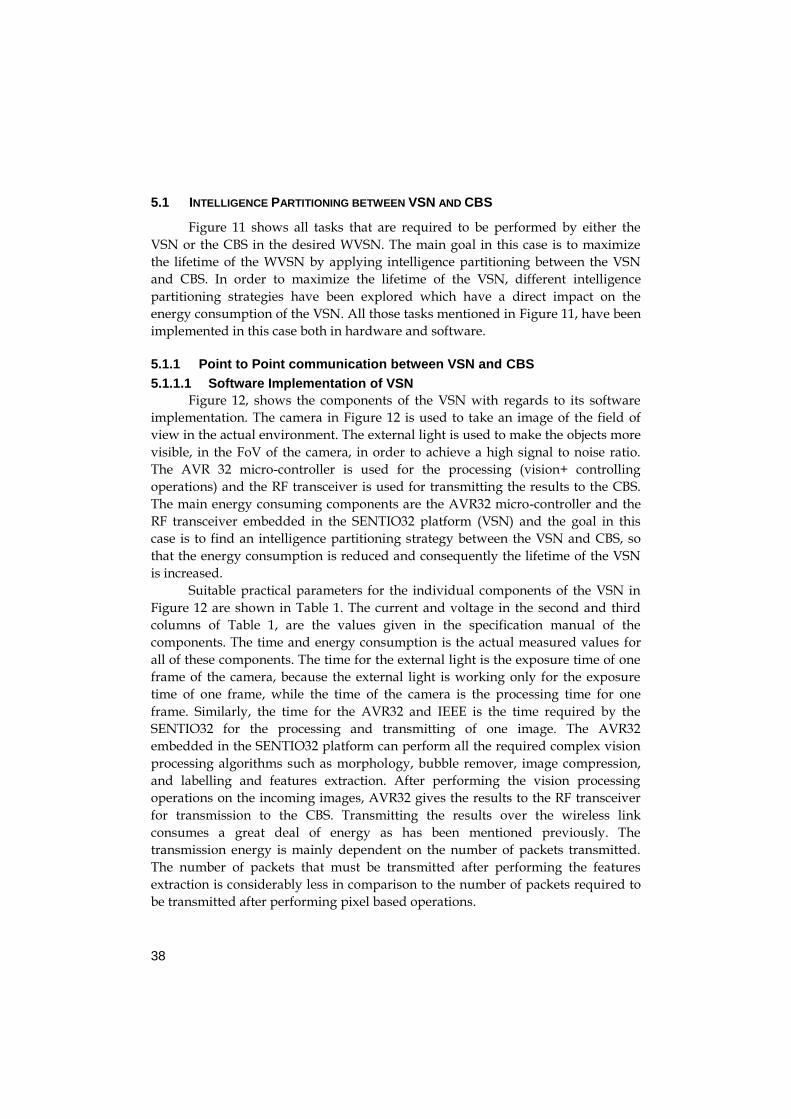
38
5.1 INTELLIGENCE PARTITIONING BETWEEN VSN AND CBS
Figure 11 shows all tasks that are required to be performed by either the
VSN or the CBS in the desired WVSN. The main goal in this case is to maximize
the lifetime of the WVSN by applying intelligence partitioning between the VSN
and CBS. In order to maximize the lifetime of the VSN, different intelligence
partitioning strategies have been explored which have a direct impact on the
energy consumption of the VSN. All those tasks mentioned in Figure 11, have been
implemented in this case both in hardware and software.
5.1.1 Point to Point communication between VSN and CBS
5.1.1.1 Software Implementation of VSN
Figure 12, shows the components of the VSN with regards to its software
implementation. The camera in Figure 12 is used to take an image of the field of
view in the actual environment. The external light is used to make the objects more
visible, in the FoV of the camera, in order to achieve a high signal to noise ratio.
The AVR 32 micro-controller is used for the processing (vision+ controlling
operations) and the RF transceiver is used for transmitting the results to the CBS.
The main energy consuming components are the AVR32 micro-controller and the
RF transceiver embedded in the SENTIO32 platform (VSN) and the goal in this
case is to find an intelligence partitioning strategy between the VSN and CBS, so
that the energy consumption is reduced and consequently the lifetime of the VSN
is increased.
Suitable practical parameters for the individual components of the VSN in
Figure 12 are shown in Table 1. The current and voltage in the second and third
columns of Table 1, are the values given in the specification manual of the
components. The time and energy consumption is the actual measured values for
all of these components. The time for the external light is the exposure time of one
frame of the camera, because the external light is working only for the exposure
time of one frame, while the time of the camera is the processing time for one
frame. Similarly, the time for the AVR32 and IEEE is the time required by the
SENTIO32 for the processing and transmitting of one image. The AVR32
embedded in the SENTIO32 platform can perform all the required complex vision
processing algorithms such as morphology, bubble remover, image compression,
and labelling and features extraction. After performing the vision processing
operations on the incoming images, AVR32 gives the results to the RF transceiver
for transmission to the CBS. Transmitting the results over the wireless link
consumes a great deal of energy as has been mentioned previously. The
transmission energy is mainly dependent on the number of packets transmitted.
The number of packets that must be transmitted after performing the features
extraction is considerably less in comparison to the number of packets required to
be transmitted after performing pixel based operations.

39
Camera
External
LightControlller AVR 32
External
Light
SENTIO32 PLATFORM
RF Transceiver
Subtraction Segmentation Compression
Image
Capture
Stored
Background
Figure 12: Components of VSN for software implementation
Table 1. Energy consumption of individual components
Component Current
(mA)
Voltage
(v)
Time (ms) Energy (mJ)
External Light 15 3.3 1.484 0.073
Camera 35 3.3 9.285 1.1
IEEE 802.15.4 40 3.3 39.78 5.250
AVR32 23.5 3.3 910.8 72.78
En
erg
y
In node processing
Vis
ion
proc
essi
ng e
nerg
y
Com
munication energy
Balance point of
communication and vision
processing energy
0
Figure 13: Tradeoff between communication and computation energies

40
Thus, in order to reduce the transmission energy, it is preferable to perform all the
vision processing up to features extraction at the VSN and then transmit the
reduced number of bytes to the CBS. However, the disadvantage associated with
this is in its increased processing time which leads to higher computational energy.
However, on the other hand, transmitting results after segmentation, morphology
or bubble remover requires a great deal of communication energy. Thus, there is a
trade off between the communication and computation energies which is shown
graphically in Figure 13.
The aim in this thesis work is to determine a balance between the
communication and computation energies which leads to a reduced total energy
and eventually an increased lifetime of the VSN. In order to achieve this goal,
many experiments have been attempted and the communication and computation
energies have been noted for all the conducted experiments. In order to calculate
the execution time on the SENTIO32 platform in relation to performing the vision
processing tasks such as background subtraction, segmentation, morphology,
bubble remover, labelling, features extraction, TIFF Group4 compression and an
averaging filter (for creating background image), a high signal is sent on one of the
output pins of the SENTIO32 platform (this pin was connected to a logic analyser)
at the initiation of the vision processing task and then this was made low when the
task completed. In this manner, a time stamp for a given vision processing task is
recorded using a logic analyser. Initially, only the image subtraction was
performed at the VSN and the results were then transmitted through the RF
transceiver embedded in the SENTIO32 platform.
In a similar manner, the subtraction and segmentation were also performed
at the VSN and then the results were transferred. The experiments were continued
by adding one more vision processing algorithm such as morphology, bubble
remover up to features extraction at a time and the communication and
computational energies were noted. It is possible to visualize that the number of
bytes required to be transmitted after performing the pixel based operation such as
segmentation, morphology and bubble remover are exactly the same (because the
size of the segmented image does not depend on the contents of the image) and
this is also quite high (30134.75 in Table 2) which requires sufficient energy for its
wireless transmission.
Due to the fact that the number of bytes that must be transmitted after the
morphology and bubble remover are the same as that for the segmentation, thus
only the one after segmentation (BINARY_AF_SEG) is mentioned in Table 2. In
order to reduce the number of bytes after the pixel based bubble remover
algorithm, an image compression algorithm (TIFF Group4) is implemented at the
VSN. All the experiments were then performed a second time and included the
TIFF Group4 compression algorithm at the VSN after each pixel based algorithm
one at a time. Now in Table 2, it must be observed that the number of bytes
required to be transmitted after performing the compression are tremendously
reduced. After performing the features extraction algorithm at the VSN, there were
41
only few bytes produced (114 bytes) and hence it is not essential to perform any
image compression at this stage.
The results of each intelligence partitioning strategy and are mentioned in
Table 2. Table 2 shows a comparison of the energy consumption of the AVR32 for
different intelligence partitioning strategies. In Table 2, E_AVR is the energy
consumed by the computation of each intelligence partitioning strategy and is
determined by multiplying the respective time of each intelligence partitioning
strategy by the power consumption of the SENTIO32 platform. The power
consumption of the SENTIO32 platform when operating is 75.9 mJ while its sleep
power consumption is 1.98 mJ. Column 3 in Table 2 shows the time spent on
performing each intelligence partitioning strategy at the SENTIO32 platform. It can
be observed from Table 2 that sending the raw image i.e. RAW_IMG (No
processing at VSN) to the CBS results in the minimum computational energy (0.835
mJ), while, on the other hand, performing all the image processing tasks at the
sensor node and only transmitting the final object features (FEATURES) to the
CBS, requires a higher computational energy (639.408mJ).
Table 2. Energy of AVR 32 in SENTIO32 for fifferent tasks partitioning strategies
Processing stages No. of bytes T_AVR(ms) E_AVR (mJ)
RAW_IMG 241078 11.01 0.835
BINARY_AF_SEG 30134 617.43 46.811
COMPRESS_AF_SEG 1218 910.838 69.96
COMPRESS_AF_MOR 1282 3244.43 247.088
COMP_BUBBLE_ REMOVER 458 3428.56 261.064
FEATURES 114 6009.53 639.408
The implication from the transmission of raw images is that more data is
sent over the wireless link, which will contribute to the higher communication
energy shown in Table 3. If only FEATURES are sent, this will contribute to a low
communication energy (1.0179 mJ in Table 3) but computational energy is much
higher (639.408 mJ in Table 2). Thus, a careful observation in relation to the
computational and communication energies for all possible intelligence
partitioning strategies is essential. Time spent on communicating the results to the
CBS using an RF transceiver embedded in the SENTIO32 platform is calculated
using Equation 5.1.
0.000192+0.00003219)+(X=T_IEEE 5.1
where X is the number of bytes transmitted and 19 is the overhead involved due to
including the header information in each packet. Factor 0.000032 in Equation 5.1 is
the processing time of one packet, while 0.000192 is the settling time of the RF

42
transceiver. In Table 3, the E_IEEE and T_IEEE are the energies consumed and the
time spent on communicating the results to the CBS respectively. The energy
consumption of the external light used in order to achieve a sufficiently high signal
to noise ratio is 0.085 mJ (This value in Paper I is different because os using a
different camera), which is included in the energy calculation of the SENTIO32 for
each intelligence partitioning strategy in Table 4. The power consumption of the
camera is 160 mW and its processing time (for processing one frame) is 33.3 ms,
thus its energy consumption for processing one frame is 5.3 mJ, which is also
included in the energy calculation of the SENTIO32 for each intelligence
partitioning strategy in the same table.
The power consumption of the IEEE 802.15.4 is 132 mW. The total energy
spent on communicating the data over the wireless link is the combination of the
individual energy consumptions of the IEEE 802.15.4 and the SENTIO32 platform
because both are running when the data is being communicated to the CBS. A
trend in the last column of Table 4 should be noted in that the total energy of the
VSN firstly decreases and then increases when going from the top to the bottom
and the minimum value occurs at the strategy COMPRESS_AF_SEG. It is
concluded that the strategy COMPRESS_AF_SEG is the most suitable, because its
energy consumption is the lowest of all the strategies.
Table 3. Energy of IEEE 802.15.4 for different strategies
Processing stages No. of bytes T_IEEE (ms) E_IEEE(mJ)
RAW_IMG 241078 7715.29 1018.419
BINARY_AF_SEG 30134.75 965.112 127.394
COMPRESS_AF_SEG 1218 39.78 5.250
COMPRESS_AF_MOR 1282 41.82 5.520
BUBBLE REMOVER 458 15.46 2.040
FEATURES 114 3.84 1.0179
Table 4. Total energy of VSN for each intelligence portioning strategy
Processing stages E_AVR
(mJ)
E_IEEE
(mJ)
E_Flash
(mJ)
E_Camera
(mJ)
Total
Energy(mJ)
RAW_IMG 0.835 1018.4 0.085 5.3 1024.639
BINARY_AF_SEG 46.811 127.39 0.085 5.3 179.59
COMPRESS_AF_SEG 69.96 5.250 0.085 5.3 80.595
COMPRESS_AF_MOR 247.08 5.520 0.085 5.3 257.993
BUBBLE REMOVER 261.06 2.040 0.085 5.3 268.489
FEATURES 639.40 1.0179 0.085 5.3 645.8109

43
Figure 14: Relative energy for each strategy
Figure 14 shows the absolute energy consumption for each intelligence
partitioning strategy between the CBS and the VSN. If the raw data (RAW_IMG) or
the compressed raw data (COMPRES_RAW) is sent from the sensor node, then the
energy consumption is higher due to the higher communication (E_IEEE 802.15.5)
cost shown in Figure 14. Transmitting results after performing the features
extraction at the VSN, shows that the communication cost is almost negligible, but
the computational cost (E_SENTIO_PROC) is quite high as is clearly shown in
Figure 14. It must be observed in Figure 14 that lowest energy consumption can be
achieved using COMPRESS_SF_SEG which means to perform TIFF Group4
compression after segmentation at the VSN and then transmit the results to the
CBS.
Figure 15: Energy consumption showing sleep energy dominancy
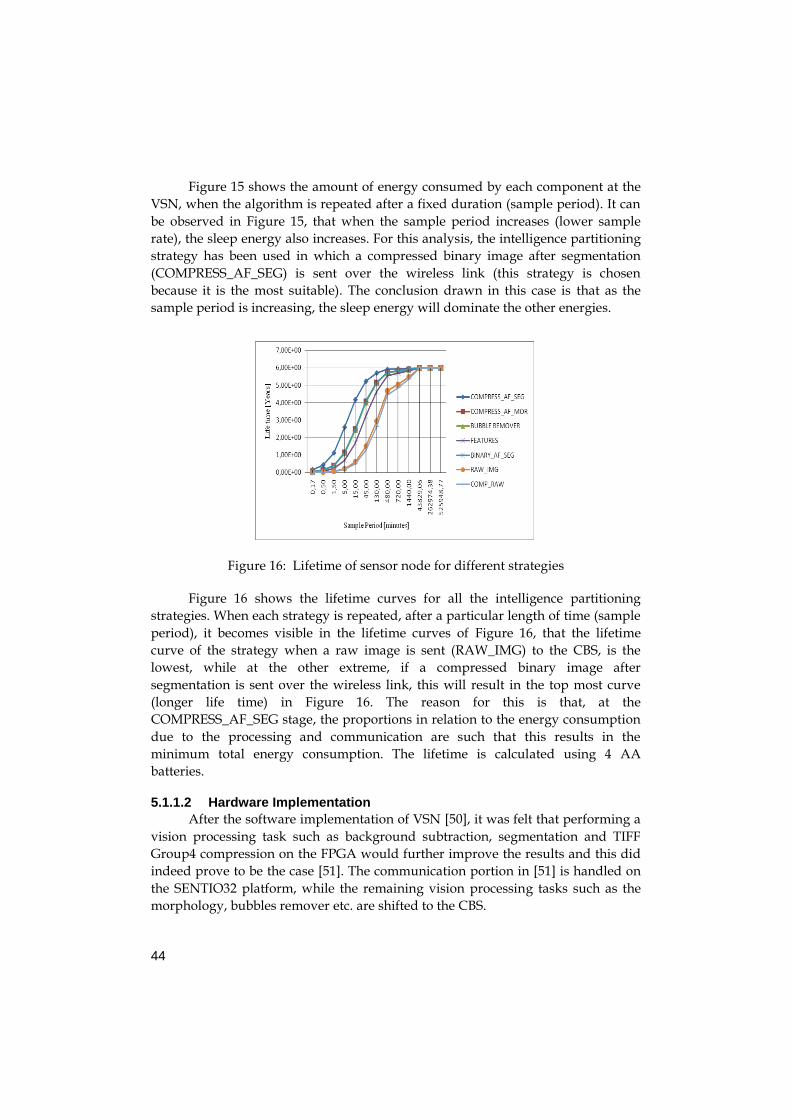
44
Figure 15 shows the amount of energy consumed by each component at the
VSN, when the algorithm is repeated after a fixed duration (sample period). It can
be observed in Figure 15, that when the sample period increases (lower sample
rate), the sleep energy also increases. For this analysis, the intelligence partitioning
strategy has been used in which a compressed binary image after segmentation
(COMPRESS_AF_SEG) is sent over the wireless link (this strategy is chosen
because it is the most suitable). The conclusion drawn in this case is that as the
sample period is increasing, the sleep energy will dominate the other energies.
Figure 16: Lifetime of sensor node for different strategies
Figure 16 shows the lifetime curves for all the intelligence partitioning
strategies. When each strategy is repeated, after a particular length of time (sample
period), it becomes visible in the lifetime curves of Figure 16, that the lifetime
curve of the strategy when a raw image is sent (RAW_IMG) to the CBS, is the
lowest, while at the other extreme, if a compressed binary image after
segmentation is sent over the wireless link, this will result in the top most curve
(longer life time) in Figure 16. The reason for this is that, at the
COMPRESS_AF_SEG stage, the proportions in relation to the energy consumption
due to the processing and communication are such that this results in the
minimum total energy consumption. The lifetime is calculated using 4 AA
batteries. 5.1.1.2 Hardware Implementation
After the software implementation of VSN [50], it was felt that performing a
vision processing task such as background subtraction, segmentation and TIFF
Group4 compression on the FPGA would further improve the results and this did
indeed prove to be the case [51]. The communication portion in [51] is handled on
the SENTIO32 platform, while the remaining vision processing tasks such as the
morphology, bubbles remover etc. are shifted to the CBS.
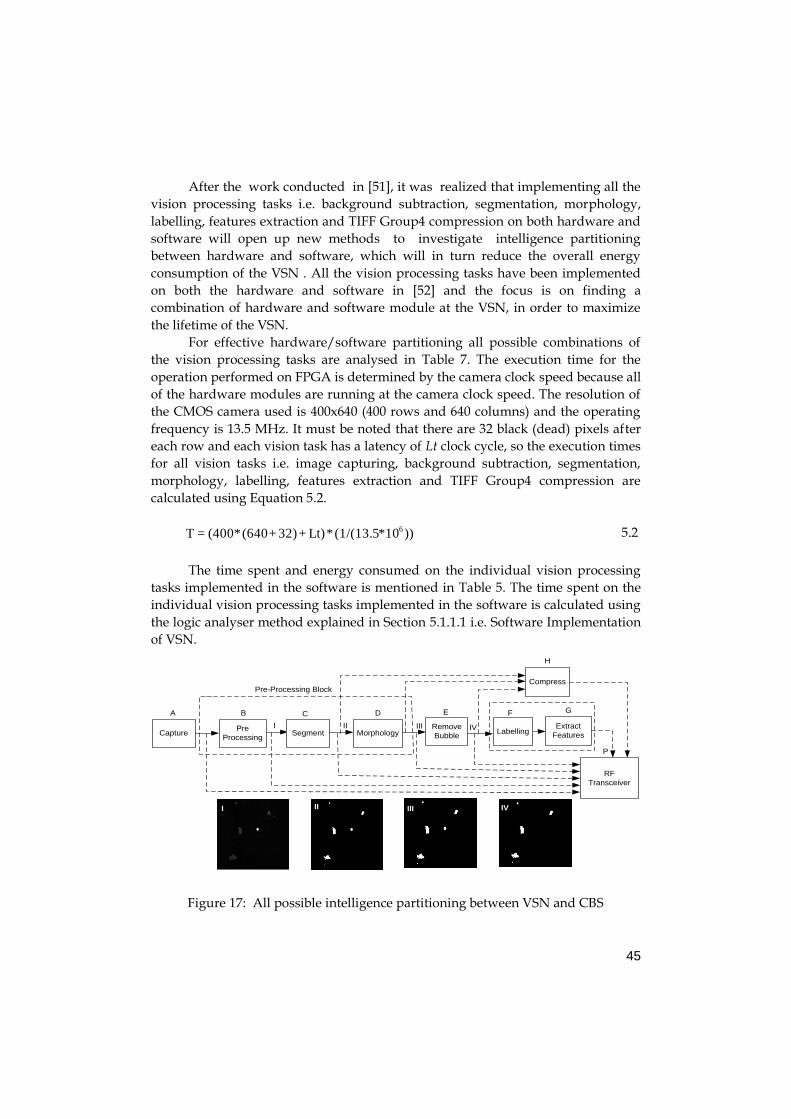
45
After the work conducted in [51], it was realized that implementing all the
vision processing tasks i.e. background subtraction, segmentation, morphology,
labelling, features extraction and TIFF Group4 compression on both hardware and
software will open up new methods to investigate intelligence partitioning
between hardware and software, which will in turn reduce the overall energy
consumption of the VSN . All the vision processing tasks have been implemented
on both the hardware and software in [52] and the focus is on finding a
combination of hardware and software module at the VSN, in order to maximize
the lifetime of the VSN.
For effective hardware/software partitioning all possible combinations of
the vision processing tasks are analysed in Table 7. The execution time for the
operation performed on FPGA is determined by the camera clock speed because all
of the hardware modules are running at the camera clock speed. The resolution of
the CMOS camera used is 400x640 (400 rows and 640 columns) and the operating
frequency is 13.5 MHz. It must be noted that there are 32 black (dead) pixels after
each row and each vision task has a latency of Lt clock cycle, so the execution times
for all vision tasks i.e. image capturing, background subtraction, segmentation,
morphology, labelling, features extraction and TIFF Group4 compression are
calculated using Equation 5.2.
))10*(1/(13.5*Lt)+32)+(640*(400=T 6 5.2
The time spent and energy consumed on the individual vision processing
tasks implemented in the software is mentioned in Table 5. The time spent on the
individual vision processing tasks implemented in the software is calculated using
the logic analyser method explained in Section 5.1.1.1 i.e. Software Implementation
of VSN.
A
C D
A B
Pre-Processing Block
MorphologySegment
Compress
CaptureRemove
Bubble
RF
Transceiver
Pre
ProcessingLabelling
Extract
Features
A B C D E F G
H
P
I II III IV
IVIIIIII
Figure 17: All possible intelligence partitioning between VSN and CBS
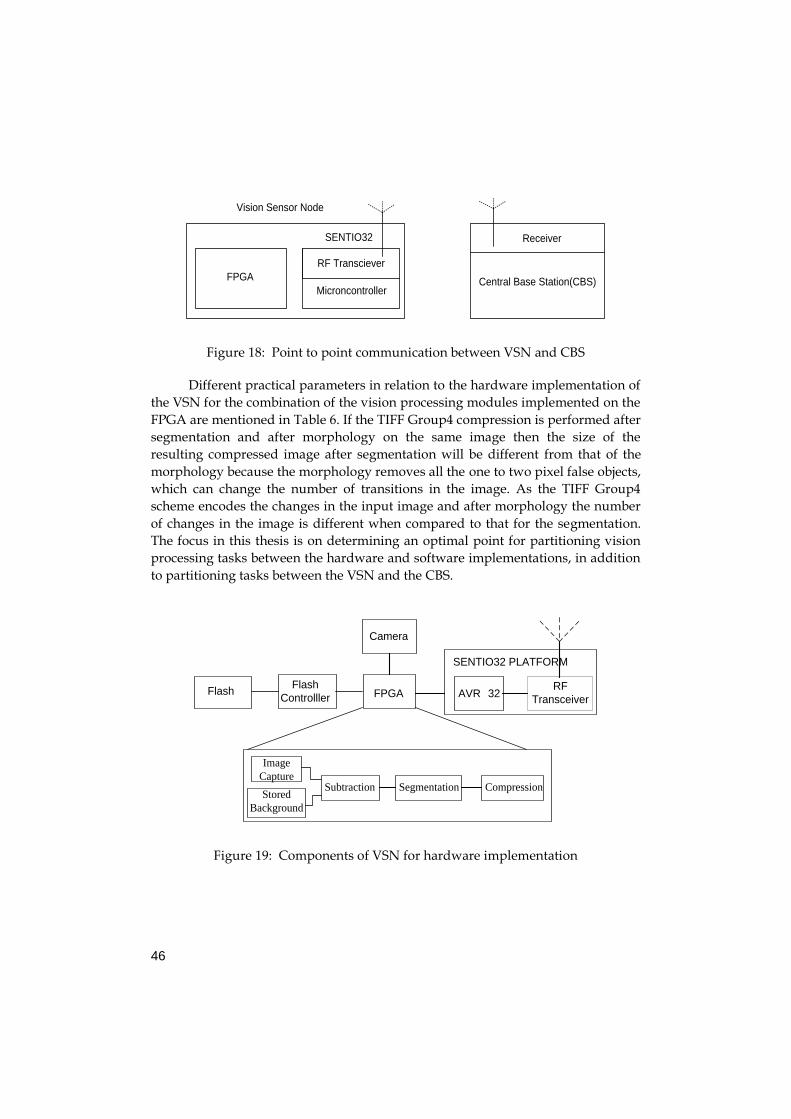
46
FPGA
SENTIO32
Central Base Station(CBS)
Vision Sensor Node
RF Transciever
Receiver
Microncontroller
Figure 18: Point to point communication between VSN and CBS
Different practical parameters in relation to the hardware implementation of
the VSN for the combination of the vision processing modules implemented on the
FPGA are mentioned in Table 6. If the TIFF Group4 compression is performed after
segmentation and after morphology on the same image then the size of the
resulting compressed image after segmentation will be different from that of the
morphology because the morphology removes all the one to two pixel false objects,
which can change the number of transitions in the image. As the TIFF Group4
scheme encodes the changes in the input image and after morphology the number
of changes in the image is different when compared to that for the segmentation.
The focus in this thesis is on determining an optimal point for partitioning vision
processing tasks between the hardware and software implementations, in addition
to partitioning tasks between the VSN and the CBS.
Camera
Flash
Controlller AVR 32RF
Transceiver Flash FPGA
SENTIO32 PLATFORM
Subtraction Segmentation Compression
Image
Capture
Stored
Background
Figure 19: Components of VSN for hardware implementation

47
Table 5. Energy consumption of individual operation of the software
implementation.
Individual Modules Time(ms) Energy(mJ)
Subtraction 332.5 25.78
Segmentation 225 17.44
Morphology 2327.1 180.46
Bubble Remover 202.5 15.70
Labelling, Extract Features 1044 202
TIFF compression 345.1 26.76
Table 6. Power, energy and area consumed by module implemented on FPGA
Modules on FPGA
Power(mW) Energy(mJ) Logic cells (Spartan 6)
Memory
A 1.44 0.029073 329 0
AB 1.78 0.035842 702 0
ABC 1.91 0.038431 705 0
ABCH 3.35 0.066913 1190 3
ABCD 3.05 0.061197 1388 4
ABCDH 4.49 0.089951 1873 7
ABCDE 3.23 0.064781 1406 5
ABCDEH 4.65 0.093139 1891 8
ABCDEFG 5.93 0.118542 2279 12
In Table 7, all hardware/software partitioning strategies are mentioned. The
TIFF compression of the raw image (after capturing or subtraction) is also a
possible strategy but as the data that has to be communicated to the CBS at these
stages is quite high, this would result in high communication costs [51]. So, these
are not considered in Table 7. In addition, for strategies 16, 17 and 22 mentioned in
Table 7, the whole frame must be stored, so all these strategies are not feasible,
however, all those in Table 7, that do produce 32000 bytes (e.g. Strategies 18, 19, 20
etc.) require buffers of 32 Kbytes and are feasible as are all the remaining strategies
in Table 7 because they require small buffers.
In Figure 17, each of the vision processing tasks is symbolized by a capital
letter such as A, B and up to P. These symbolized letters are used in Table 6 and
Table 7, in order to visualize all the possible hardware/software partitioning
strategies. Strategy3 and Strategy9, as an example, are now explained. In
Strategy3, modules symbolized by the letters A (image capture), B (subtraction)
and C (segmentation) are implemented on the hardware after which the
segmented image is then compressed (H, compression) and transmitted (P, RF
transceiver) using the SENTIO32 while the remainder of the vision processing
tasks are executed on the CBS.

48
Table 7. All possible hardware/software partitioning strategies
Strategy
FPGA Tasks SENTIO32 Tasks
CBS Tasks Total Energy (mJ)
Data sent (Bytes)
FPGA Logic cells
FPGA BRAM
1 A BCHP DEFG 83.76 1218 329 N.A.
2 AB CHP DEFG 57.99 1218 702 N.A.
3 ABC HP DEFG 40.55 1218 705 N.A.
4 ABCH P DEFG 10.21 680 1190 3
5 A BCDHP EFG 264.66 1282 329 N.A.
6 AB CDHP EFG 238.89 1282 702 N.A.
7 ABC DHP EFG 221.45 1282 705 N.A.
8 ABCD HP EFG 35.76 1282 1388 4
9 ABCDH P EFG 9.03 500 1873 7
10 A BCDEHP FG 274.84 458 329 N.A.
11 AB CDEHP FG 249.07 458 702 N.A.
12 ABC DEHP FG 231.63 458 705 N.A.
13 ABCD EHP FG 51.18 458 1388 4
14 ABCDE HP FG 35.48 458 1406 5
15 ABCDEH P FG 8.07 356 1891 8
16 A P BCDEFG 1614.94 256000 329 N.A.
17 A BP CDEFG 1640.73 256000 329 N.A.
18 A BCP DEFG 250.00 32000 329 N.A.
19 A BCDP EFG 430.47 32000 329 N.A.
20 A BCDEP FG 446.17 32000 329 N.A.
21 A BCDEFGP N.A. 448.23 114 329 N.A.
22 AB P CDEFG 1614.96 256000 702 N.A.
23 AB CP DEFG 224.24 32000 702 N.A.
24 AB CDP EFG 404.70 32000 702 N.A.
25 AB CDEP FG 420.41 32000 702 N.A.
26 AB CDEFGP N.A. 422.46 114 702 N.A.
27 ABC P DEFG 206.79 32000 705 N.A.
28 ABC DP EFG 387.26 32000 705 N.A.
29 ABC DEP FG 202.56 32000 705 N.A.
30 ABC DEFGP N.A. 405.02 114 705 N.A.
31 ABCD P EFG 206.81 32000 1388 4
32 ABCD EP FG 222.52 32000 1388 4
33 ABCD EFGP N.A. 224.57 114 1388 4
34 ABCDE P FG 206.82 32000 1406 5
35 ABCDE FGP N.A. 208.87 114 1406 5
36 ABCDEFG P N.A. 6.47 114 2279 12
49
Similarly in Strategy15,the tasks symbolized by letters A, B, C, D, E and H
are executed on the FPGA, while the compressed image is transmitted to the CBS
using the SENTIO32 (module P). The remainder of the image processing is then
performed at the CBS. It must be noted at this point that the power consumptions
of the embedded platform for strategies 4, 9, 15 and 36 are quite low (almost
similar). The reason for this is that the SENTIO32 is running for a very short time
(communication only) and all the vision processing is performed on the FPGA. The
amount of data that is required to be communicated for each strategy is shown in
Table 7 (Data sent) and it is different for different strategies because the TIFF
Group4 compression produces varying compressed data based on the input image.
In addition, the number of bytes produced for the hardware and software
implementation is different because of the two different implementations of the
TIFF Group4 compression. In Strategy9 the vision processing operation up to
morphology was performed (including morphology) and then the results were
transmitted after the TIFF Group4 compression, which can be implemented on an
Actel IGLOO Low-Power Flash FPGAs (AGL600 available with us). In strategies 15
and 36, the previous frames must be stored in order to remove the bubbles in the
current frame. The storing of a binary frame (640x400) requires 256000 bits
memory, which was not available on the used board. For this specific application
(based on Strategy9) it must be noted in Figure 20 that for a sample period of 5
minutes the predicted lifetime of the VSN is 5.1 years. Thus Strategy9 is preferable
in this specific application.
Depending on the requirements and budget of an application, any of the 36
strategies could be implemented except strategies 16, 17 and 22. All 36 strategies
have their own pros and cons. For example, Strategy36 offers the lowest power
consumption but requires the highest design and implementation times. The
design and implementation times for Strategy23 are very low but its energy
consumption is quite high and this shows that a careful analysis of the
specification for any application must be conducted prior to any starting point,
after which a suitable partitioning strategy should then be selected. In the software
implementation of the VSN [50], the lifetime of the VSN is 4.22 years for a sample
period of 15 minutes. Thus, even for higher sample rate (5 minutes) the lifetime
(5.1 years) of the VSN in the hardware implementation is more than the lower
sample rate (15 minutes) implementation.
In Table 7, one trend between design time and the lifetime of the VSN must
be noted. All strategies, in which the vision processing is performed at the FPGA
and only the communication is performed at the SENTIO32, have relatively high
lifetimes for the VSN. However, the associated disadvantage is in relation to the
high design and implementation times. Hence performing more and more tasks on
the FPGA requires sufficient design time and larger FPGA components but will
result in a longer lifetime for the VSN. However, it is also the case that if a strategy
involves less FPGA implementation and also involves more vision processing in
the SENTIO32 or CBS, then it will suffer from a limited lifetime.

50
Figure 20: Lifetime for all hardware/software partitioning strategies
The advantage in this scenario is in relation to its reduced design and
implementation times. Figure 20 shows the lifetime of the VSN for all possible
hardware/software partitioning strategies. The top most curve in this graph
represents Strategy36 in Table 7, while the second and third highest curves
represent strategies 15 and 9 respectively and these are in fact almost identical. The
lifetime of the VSN is predicted based on the energy requirement of the embedded
platform for the implementation of the VSN.
5.1.1.3 Packets relaying in a multi-hop Wireless Visual Sensor Network
In this section, the aim is to explore the effect of packet forwarding in a
multi-hop WVSN on the energy consumption and implementation of an individual
VSN. The IEEE 802.15.4 RF transceiver embedded in the SENTIO32 platform has
its own characteristics for transmitting and receiving packets in a multi-hop
WVSN. The transmitting and receiving times for X number of bytes can be
calculated using Equation 5.1 and this is used to determine the amount of energy
required for transmitting and receiving packets in the network. The wireless
transmission range of an RF transceiver (IEEE 802.15.4) is about 100 to 150 meters
in an open environment (outdoor areas) but is limited to 30 to 50 meters in
industrial applications (inside buildings). Thus, in many applications in which
VSNs are deployed in a large area, each node is required to relay the packets
generated by other far away nodes, either to other intermediate nodes or to the
CBS. Receiving and forwarding the packets of other nodes has a severe impact on
the energy consumption of the VSN.
The energy consumed by the sensor nodes in packet forwarding constitutes
a significant portion of their total energy consumption [53],[54]. Consequently, a
mathematical model that can accurately predict the communication traffic load of a
51
VSN is critical in order to design efficient vision sensor network protocols. An
analytical model that can accurately estimate the traffic load at the VSN in WSN is
described in [55], which has been used in the calculation in relation to predicting
the traffic load at each of the VSNs in this thesis. The network lifetime can be
defined as the time span from deployment to the instant when the network is
considered as being non-functional. It can also be defined as the instant when the
first sensor node dies, or a particular percentage of the sensors die or a loss of
coverage occurs.
In [55] the authors considered a typical scenario wherein, the sensor nodes
periodically sense the environment and forward the collected samples to a CBS
node using greedy geographic routing. Their results show that, irrespective of the
RF transceiver model, the traffic load generally increases as a function of the node‟s
proximity to the CBS. The traffic load of a given sensor node depends on several
factors. The first and most important is the relative distance of the node to the CBS.
In general, the closer the sensor node is to the CBS, the greater is its traffic load.
This is because those sensor nodes which are closer to the CBS have to relay more
data packets as compared to the more distant sensor nodes.
The traffic load also depends on the routing protocol employed in the
network as it determines the selection of the next hop node involved in relaying
the data towards the CBS. Lastly, the characteristic of the environment, which
affects the RF transceiver communication behaviour of the sensor nodes also, has
an impact on the traffic load. In terms of the application load, the authors in [55]
focused on periodic monitoring applications, wherein the sensor nodes sample the
environment periodically and forward the collected data (e.g. temperature,
humidity) to the CBS. With regards to the routing strategy, which is important for
selecting the next-hop node, they have considered the popular greedy routing
forwarding scheme [56], [57].
In greedy routing, a sensor node forwards its packets to a neighbour, which,
when considering all other possible neighbours, is geographically closest to the
CBS. By this means, greedy routing can find an approximation to the shortest path
in terms of hops between a sensor node and the CBS [56]. Moreover, greedy
routing provides a scalable solution for large WSN, because it requires only local
(i.e. one hop neighbourhood) information for making forwarding decisions. The
assumptions made in [55] e.g. periodic sampling, greedy routing etc. are applicable
to this specific application and thus [55] has been chosen in order to predict the
traffic load at the individual VSN. In [55] the authors have analysed two RF
transceiver models, namely, an ideal RF transceiver model and a log normal
shadowing model.
The traffic load for both the RF transceiver models under consideration have
been displayed and by carefully investigating these traffic load plots [55] it is
possible to observe that both RF transceiver models resulted in almost the same
traffic load for all sensor nodes occurring at a distance of 30 meters or more from
the CBS. In the specific applications involved in this thesis, the nearest sensor
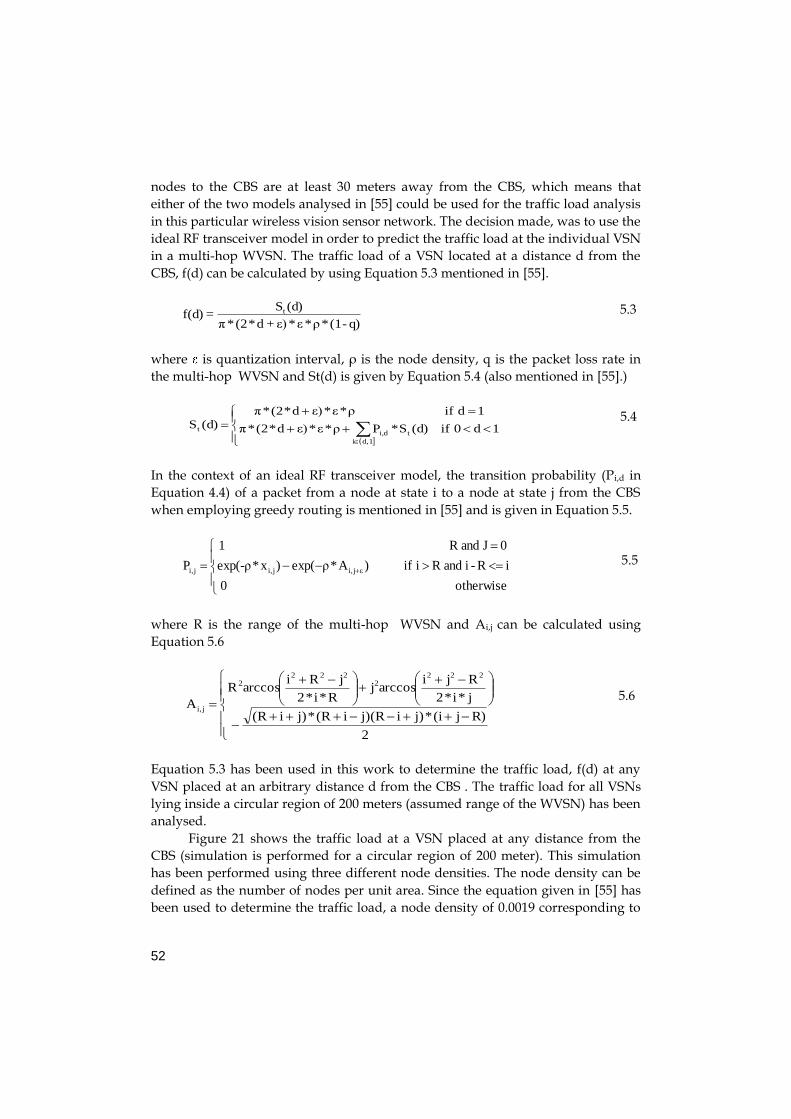
52
nodes to the CBS are at least 30 meters away from the CBS, which means that
either of the two models analysed in [55] could be used for the traffic load analysis
in this particular wireless vision sensor network. The decision made, was to use the
ideal RF transceiver model in order to predict the traffic load at the individual VSN
in a multi-hop WVSN. The traffic load of a VSN located at a distance d from the
CBS, f(d) can be calculated by using Equation 5.3 mentioned in [55].
q)-(1*ρ*ε*ε)+d*(2*π
(d)S=f(d) t 5.3
where is quantization interval, ρ is the node density, q is the packet loss rate in
the multi-hop WVSN and St(d) is given by Equation 5.4 (also mentioned in [55].)
d,1i
tdi,t 1 d 0 if (d)S*Pρ*ε*ε)d*(2*π
1d if ρ*ε*ε)d*(2*π
(d)S 5.4
In the context of an ideal RF transceiver model, the transition probability (Pi,d in
Equation 4.4) of a packet from a node at state i to a node at state j from the CBS
when employing greedy routing is mentioned in [55] and is given in Equation 5.5.
otherwise 0
i R-i and R i if )A*ρexp()x*exp(-ρ
0 J and R 1
P εji,ji,ji,
5.5
where R is the range of the multi-hop WVSN and Ai,j can be calculated using
Equation 5.6
2
R)j(i*j)ij)(Ri(R*j)i(R
j*i*2
Rjiarccosj
R*i*2
jRiarccosR
A
2222
2222
ji,
5.6
Equation 5.3 has been used in this work to determine the traffic load, f(d) at any
VSN placed at an arbitrary distance d from the CBS . The traffic load for all VSNs
lying inside a circular region of 200 meters (assumed range of the WVSN) has been
analysed.
Figure 21 shows the traffic load at a VSN placed at any distance from the
CBS (simulation is performed for a circular region of 200 meter). This simulation
has been performed using three different node densities. The node density can be
defined as the number of nodes per unit area. Since the equation given in [55] has
been used to determine the traffic load, a node density of 0.0019 corresponding to
53
240 nodes (this node density was used in [55]) in a circular region of 200 meters has
been used. For the application considered in this thesis, two values for the sensor
node densities i.e. 0.00019 and 0.00039 corresponding to 25 and 50 nodes in a
circular region of 200 meters have been analysed.
The packet loss analysis of the IEEE 802.15.4 (used in SENTIO32) was
studied in [58]. They derived an analytical equation for the packet loss analysis in
relation to the mentioned wireless standard. They verified their results by means of
simulation. They have shown the average packet loss in a graph for a varying
number of nodes, which are simultaneously transmitting their results in the
wireless network. It is apparent from their graph that for five nodes transmitting
their results simultaneously in the wireless network, an average packet loss rate is
22% (0.22).
Figure 21: Traffic load at the VSN placed at an arbitrary distance from the CBS in a
multihop WSN
In this thesis work, it is assumed that the sensor nodes are synchronized in
such a way that only one sensor node is transmitting its results to other sensor
nodes in the network at any given time. Hence, a packet loss ratio of 0.3 (a greater
value is used for more accurate analysis) has been used in relation to the traffic
54
load calculation in Figure 21, which is considered to be quite reasonable. Using this
value for the packet loss rate, the traffic load in the multi-hop WVSN is determined
for three different network densities has been determined.
Figure 21 shows that for a sensor node placed at a distance of 30 meters from
the CBS, the traffic load is 4 packets (lowest curve in Figure 21) for a node density
of 0.00019 (corresponding to 25 nodes in the whole network), which means that all
the sensor nodes lying on the ring with a radius of 30 meter centred at the CBS will
have, on average, a traffic load of 4 packets. This traffic load means that each
sensor node located at this distance from the CBS is required to receive and
transmit 4 packets in addition to its own packets. Sending and receiving 4
additional packets, consumes some additional energy, which has been included in
the calculations for the lifetime of the VSN for both the hardware and software
implementations of the VSN.
Similarly the middle curve in Fig. 3 shows that for a sensor node placed at a
distance of 30 meters from the CBS, the traffic load is 10 packets for a node density
of 0.00039 (corresponding to 50 nodes in the whole network), which means that all
sensor nodes lying on the ring with a radius of 30 meter centred at the CBS will
have, on average, a traffic load of 10 packets.
The next step is to analyse the effect of multi-hop communication between
the VSN and WVSN for both software and hardware implementations of VSN, on
the lifetime and implementation of the VSN.
5.1.1.4 Packets Relaying in a Multi-hop WVSN for Hardware
Implementation
Figure 22, shows the lifetime curves for the different task partitioning
strategies of the hardware implementation of the VSN for varying node densities
in a multi-hop WVSN. In Figure 22, four portions are marked as (a), (b), (c) and (d),
which represent different task partitioning strategies for the hardware
implementation of the VSN. In Figure 22, (a) is the task partitioning strategy in
which vision processing tasks up to and including segmentation are performed
locally at the VSN and then the compressed image is transmitted to the CBS.
Similarly (b), (c) and (d) in Figure 22 are the strategies when the vision tasks are
performed up to morphology, bubble remover and features extraction at the VSN
respectively. In both parts (b) and (c) in Figure 22, the results are compressed and
then transmitted to the CBS but in (d) in, the resultant data consists of only a few
bytes and is thus transmitted without performing any compression. The top most
curve in Figure 22 (a), shows the lifetime of the VSN when it does not form part of
a multi-hop WVSN, so the nodes are not involved in the forwarding of the packets
of others nodes, which has resulted in a higher lifetime curve.

55
Figure 22: Lifetime curves for VSN with different tasks partitioning strategies in
the hardware implementation for varying node densities in the network
The second and third top most curves in Figure 22 (a) show the lifetime
curves for the same strategy but with 25 nodes and 50 nodes in the entire network.
It should be observed that there is a trend in the lifetime curves, which is that, as
the node density increases in the network, the traffic load also increases because
more nodes will forward packets to other nodes. The result of this is an enormous
increase in the traffic in the network, which, in turn, has resulted in a reduced
lifetime for the VSNs.
Figure 23 shows the energy consumption for a complete hardware
implementation of the VSN for varying node densities in the multi-hop WVSN.
The SENTIO32_Communication and the IEEE_802.15.4 in Figure 23 are the
energies spent by the SENTIO32 platform and the RF transceiver (IEEE_802.15.4)
when only communicating the results to the CBS. It is clear from Figure 23 that for
the hardware implementation of the VSN, the sleep energy is dominant for a lower
sample rate. It is also unambiguous in the same graph that the processing energy
of the FPGA is very small.
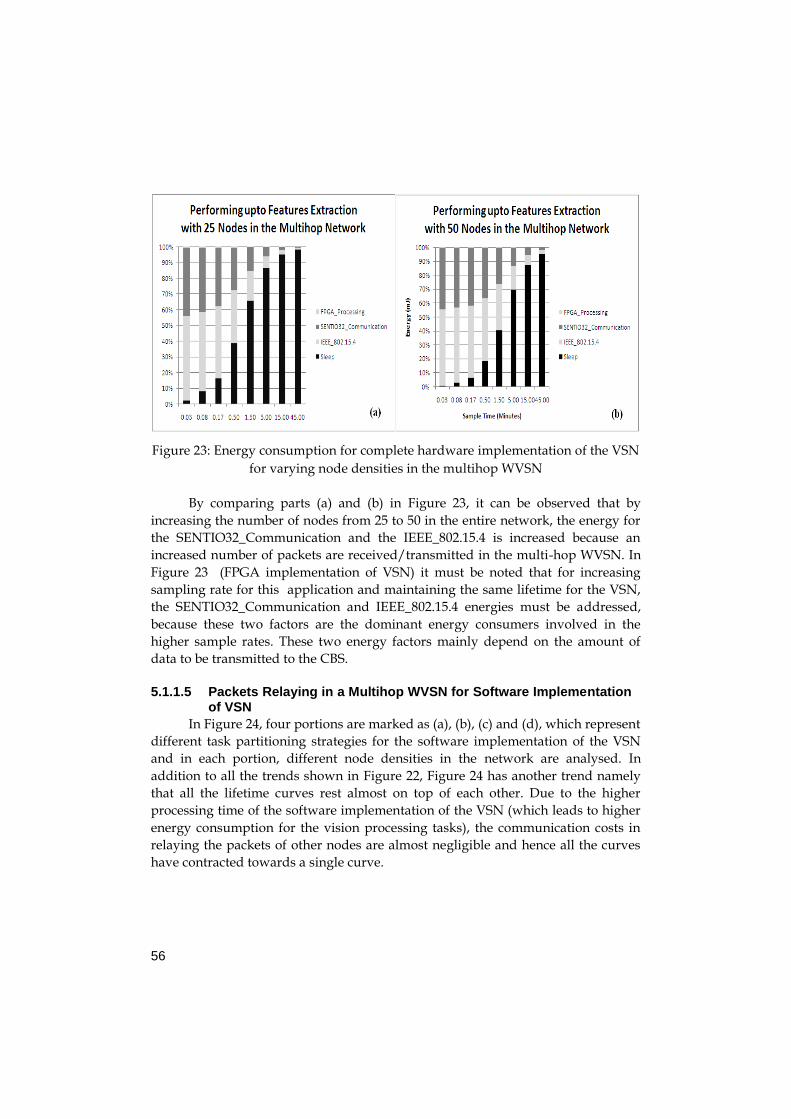
56
Figure 23: Energy consumption for complete hardware implementation of the VSN
for varying node densities in the multihop WVSN
By comparing parts (a) and (b) in Figure 23, it can be observed that by
increasing the number of nodes from 25 to 50 in the entire network, the energy for
the SENTIO32_Communication and the IEEE_802.15.4 is increased because an
increased number of packets are received/transmitted in the multi-hop WVSN. In
Figure 23 (FPGA implementation of VSN) it must be noted that for increasing
sampling rate for this application and maintaining the same lifetime for the VSN,
the SENTIO32_Communication and IEEE_802.15.4 energies must be addressed,
because these two factors are the dominant energy consumers involved in the
higher sample rates. These two energy factors mainly depend on the amount of
data to be transmitted to the CBS.
5.1.1.5 Packets Relaying in a Multihop WVSN for Software Implementation
of VSN
In Figure 24, four portions are marked as (a), (b), (c) and (d), which represent
different task partitioning strategies for the software implementation of the VSN
and in each portion, different node densities in the network are analysed. In
addition to all the trends shown in Figure 22, Figure 24 has another trend namely
that all the lifetime curves rest almost on top of each other. Due to the higher
processing time of the software implementation of the VSN (which leads to higher
energy consumption for the vision processing tasks), the communication costs in
relaying the packets of other nodes are almost negligible and hence all the curves
have contracted towards a single curve.
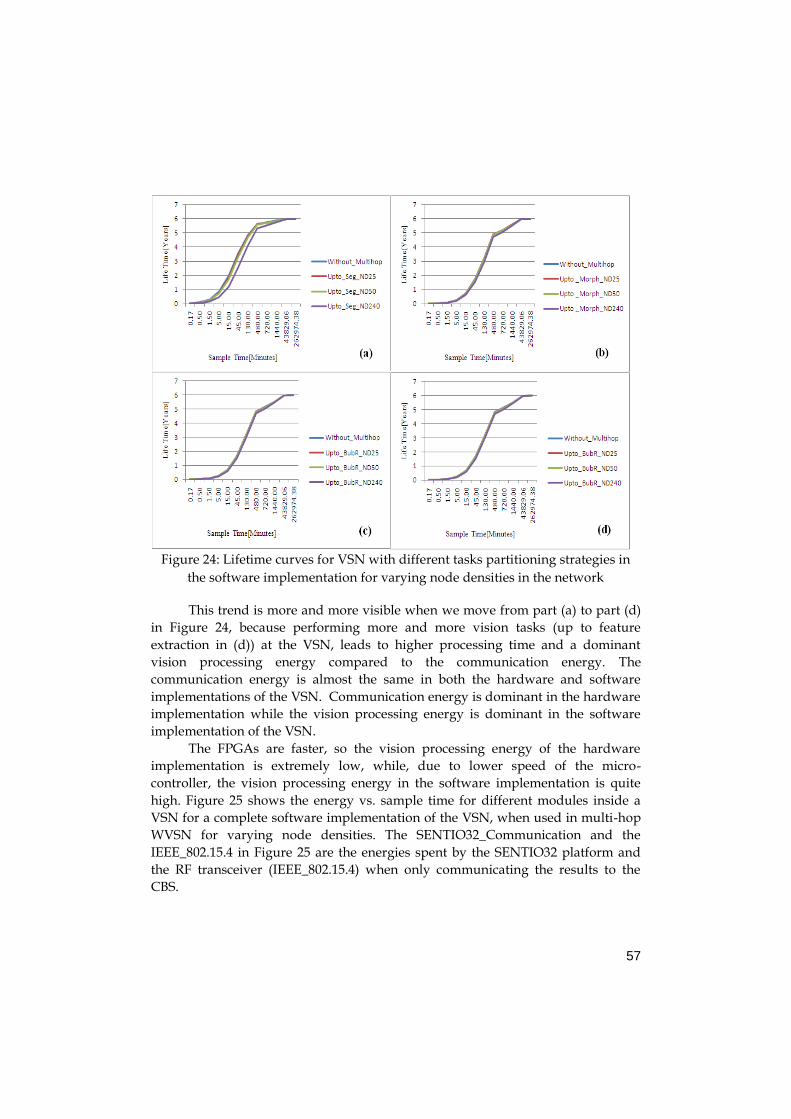
57
Figure 24: Lifetime curves for VSN with different tasks partitioning strategies in
the software implementation for varying node densities in the network
This trend is more and more visible when we move from part (a) to part (d)
in Figure 24, because performing more and more vision tasks (up to feature
extraction in (d)) at the VSN, leads to higher processing time and a dominant
vision processing energy compared to the communication energy. The
communication energy is almost the same in both the hardware and software
implementations of the VSN. Communication energy is dominant in the hardware
implementation while the vision processing energy is dominant in the software
implementation of the VSN.
The FPGAs are faster, so the vision processing energy of the hardware
implementation is extremely low, while, due to lower speed of the micro-
controller, the vision processing energy in the software implementation is quite
high. Figure 25 shows the energy vs. sample time for different modules inside a
VSN for a complete software implementation of the VSN, when used in multi-hop
WVSN for varying node densities. The SENTIO32_Communication and the
IEEE_802.15.4 in Figure 25 are the energies spent by the SENTIO32 platform and
the RF transceiver (IEEE_802.15.4) when only communicating the results to the
CBS.

58
Figure 25: Energy consumption for complete software implementation of the
VSN for varying node densities in the multihop WVSN
In the software implementation of the VSN (Figure 25) the sleep energy is
higher for a higher sample rate but the dominant energy is the
SENTIO32_processing which is required in order to perform the vision processing
task on the SENTIO32 platform. The reason for this is the higher vision processing
time on the SENTIO32 platform. In the software implementation of the VSN, it is
necessary to reduce the vision processing energy for an increasing sample rate
while still maintaining a higher lifetime for the VSN.
59
6 PAPERS SUMMARY
6.1 INTELLIGENCE PARTITIONING BETWEEN VSN AND CBS IN WVSN
6.1.1 Paper I
This paper proposed an approach for maximizing the lifetime of the sensor
node based on partitioning vision processing tasks between a visual sensor node
and the central base station. Implementation of the visual sensor node on a
software platform is evaluated for all possible intelligence partitioning strategies
for the specific application. In this paper some of the vision tasks are performed on
the sensor node, compressed data is sent over the wireless link to central base
station and the remaining vision processing tasks are performed at the CBS.
6.1.2 Paper II
In this paper we have explored different possibilities for partitioning the
tasks between hardware, software and locality for the implementation of the visual
sensor node, used in wireless vision sensor network. We focused on determining
an optimal point of hardware/software partitioning as well as partitioning
between local and central processing, based on the minimum energy consumption
of the embedded platform for vision processing operations. The lifetime of the
visual sensor node is predicted by evaluating the energy requirement of the
embedded platform with a combination of FPGA and micro-controller for the
implementation of the visual sensor node. Our results show that sending
compressed images after pixel based tasks will result in a longer battery lifetime
with reasonable hardware cost for the visual sensor node.
6.2 ARCHITECTURE DEVELOPMENT FOR WIRELESS VISION SENSOR NETWORK
6.2.1 Paper III
This paper extended Paper I and implemented the visual sensor node in the
hardware by the introduction of Field Programmable Gate Arrays (FPGAs) for
vision processing tasks. An RF transceiver embedded in the SENTIO32 platform is
used for communicating the results to the central base station. It is concluded that
the energy of the visual sensor node is reduced by using an FPGA for vision
processing tasks and an RF transceiver embedded in the SENTIO32 platform for
communicating the results to the central base station. However, the choice of a
suitable FPGA architecture is necessary in order to achieve a greater lifetime for
the visual sensor node.

60
6.3 PACKETS RELAYING IN A MULTIHOP WIRELESS VISION SENSOR NETWORK
6.3.1 Paper IV
In this paper the effect of multi-hop networking on the lifetime as well as the
implementation of the visual sensor node is analysed. The effect of node density in
the multi-hop network on the lifetime of the visual sensor node is also studied for
both a hardware and software implementation of the visual sensor node. We
concluded that for increasing lifetime of the visual sensor node for its hardware
implementation, the requirement is to focus on reducing the resultant data while
for software implementation, the requirement is for the optimization of the
implementation of the vision processing algorithms.

61
6.4 AUTHORS CONTRIBUTIONS
The exact contributions of the authors of the four papers in this thesis are
summarised in Table 8.
Table 8. Author’s contributions
Paper # Main authors Co-authors Contributions
I KK
MI
MO
NL
KK and MI have together implemented the system
on a software platform, where KK analyzed
intelligence partitioning aspects of the results and
MI has analyzed the architectural aspects of the
results.
MO: supervised the analysis.
NL: supervised the implementation work
II KK
MI
MO
NL
AW
BT
KK and MI have together analyzed the cost and
performance aspects of a visual sensor node.
MO and NL have supervised the work.
BT and AW assisted in the HW implementation of a
component.
III KK
MI
MO
NL
KK and MI have together implemented the system
on an embedded platform based on a
microcontroller and an FPGA.
MO: Supervised the analysis.
NL: Supervised the implementation work.
IV KK
MI
NL
MO
NH
Based on previous system solution on embedded
platform based on a microcontroller and an FPGA,
KK has modelled a general wireless visual sensor
networks and analyzed how the multi-hop network
affects the implementation of a specific node.
MI and NL have participated in creating the system
solution.
MO: Supervised the analysis.
NA: Discussion and review.
1. Khursheed Khursheed (KK)
2. Muhammad Imran (MI)
3. Mattias O‟Nils
4. Najeem Lawal
5. Abdul Wahid (AW)
6. Thörnberg Benny (TB)

62
63
7 THESIS SUMMARY
Intelligence partitioning between local and central computation reduces the
energy consumption in visual sensor nodes. Data transmission in the wireless
visual sensor network also affects the energy consumption in visual sensor nodes,
so data compression as well as intelligence partitioning between local and central
computation will result in less energy consumption and hence the sensor nodes
will last longer.
Intelligence partitioning strategies between the visual sensor node and the
central base station in wireless visual sensor networks for both software and
hardware implementations of the visual sensor node, in order to extend the
lifetime of the visual sensor node have been analysed and presented in this thesis
work. The effect of packet forwarding in a multi-hop network on the lifetime and
implementation of the visual sensor node has also been studied in this thesis work.
An introduction to the research area addressed in this thesis has been
presented in Chapter 1. Chapter 2 reviewed the previous related work relevant to
the research area of this thesis work and Chapter 3 presented the wireless visual
sensor networks. Chapter 4 presented the case study of a wireless system for
failure detection in machinery. Chapter 5 presented the main contribution of this
thesis work namely, intelligence partitioning strategies between a visual sensor
node and the central base station in wireless visual sensor networks for both
software and hardware implementations of the visual sensor node. Chapter 5 also
presented the effect of multi-hop networking on the lifetime and implementation
of the visual sensor node for both its hardware and software implementations.
Chapter 6 provided brief summary of the papers covered by this thesis and the
contributions of the authors to the papers.
This section presents the conclusion of the research work in this thesis and
possible future works.
7.1 SOFTWARE IMPLEMENTATION OF THE VISUAL SENSOR NODE
All vision processing algorithms such as image subtraction, segmentation,
morphology, bubble remover, labelling, features extraction and TIFF Group4
compression are executed on a SENTIO32 platform and the time stamp for each
algorithm was recorded using a logic analyser. Based on the execution time of each
algorithm, different intelligence partitioning strategies between local and central
processing have been analysed. It is concluded that transmitting compressed
images after segmentation will result in a longer lifetime for the visual sensor node
in relation to its software implementation.
For the software implementation, the processing energy of the vision
processing task at the visual sensor node is significantly greater than that of the
communication energy and it thus becomes necessary to reduce the processing
energy in order to achieve a longer lifetime for the visual sensor node.

64
So, Implementation optimization is required in relation to the software
implementation for the visual sensor node in order for it to achieve a longer
lifetime.
7.2 HARDWARE IMPLEMENTATION OF THE VISUAL SENSOR NODE
All vision processing algorithms such as image subtraction, segmentation,
morphology, bubble remover, labelling, features extraction and TIFF Group4
compression are implemented and executed on both a FPGA and the SENTIO32
platform and the time stamp and energy consumption for each algorithm is
calculated. Then based on energy consumption and design time, all possible
intelligence partitioning strategies between hardware and software
implementations for the visual sensor node as well as between local and central
processing have been analysed.
The design and development times as well as the area consumption of the
FPGA implementation are important aspects and hence are taken into account for
selecting the most suitable intelligence partitioning strategy. It is concluded that
transmitting compressed images after morphology will result in a longer lifetime
of the visual sensor node for a mixed hardware and software implementation of
the visual sensor node, and the lifetime of the visual sensor node achieved by this
method is high when compared to the software implementation of the visual
sensor node.
In order to increase the sampling rate (often required in surveillance
applications) and to maintain a higher lifetime (few years) for the hardware
implementation of the visual sensor node, it is necessary to address the challenges
involved in reducing the output data, so that the energy required for
communicating the results to the sink are reduced to as low a value as possible.
Thus, it is possible to increase the lifetime of the visual sensor node in relation to its
hardware implementation by reducing the information that is required to be
transmitted to the sink.
Duty cycling is an important technique for reducing the energy consumption
of the visual sensor node by retaining it in the lowest energy state whenever
possible. Based on these results, the conclusion drawn is that the sleep energy is
higher for lower sampling rate for both the hardware and software
implementations of the visual sensor node. In relation to a higher sampling rate,
the real bottle neck in the hardware implementation for the visual sensor node
which occurs because of the higher communication energy, which depends on the
data that is required to be transmitted.
7.3 PACKETS FORWARDING IN A MULTI-HOP NETWORK
A major constraint involved in the deployment of a wireless vision sensor
network is the energy required for receiving/forwarding other nodes packets in a
multi-hop network. The lifetime of the visual sensor node is decreased when it is

65
used in a multi-hop network because the forwarding of packets from other nodes
consumes a great deal of energy and this, in turn, leads to a reduced lifetime. The
node density in the network also has an impact on the lifetime of the visual sensor
node. An increase in the node density means that an increased number of packets
have to be relayed to other intermediate nodes or the sink and hence the lifetime of
the visual sensor node is further reduced.
7.4 CONCLUSIONS
This thesis presents all possible intelligence partitioning strategies between
hardware and software implementations of the visual sensor node as well as
between local and central processing. The effect of packets relaying in a multi-hop
WVSN on the lifetime and implementation of the visual sensor node has also been
investigated in this thesis work. Duty cycling technique for extending the lifetime
of the visual sensor node has also been applied.
FPGAs have been chosen as a part of the target platform for the visual
sensor node studied in this thesis. This choice was made due to the possibilities of
reduced time-to-market, low non-recurring engineering cost and programmability
in comparison to ASICs, and the efficiency of the hardware implementation and
the high performance of embedded systems in comparison to DSPs. The other part
of the target architecture is the SENTIO32 platform, which is used both for the
software implementation of the visual sensor node and also for communicating the
results to the central base station using the RF transceiver embedded in it for
hardware implementation.
Based on these results, it is concluded that a hardware implementation is
significantly better than the software implementation for the visual sensor node in
terms of lifetime but its disadvantage is its higher design and implementation
times. Another major constraint involved in the deployment of a wireless vision
sensor network is the energy required for communicating the results in a multi-
hop network.
The lifetime of the visual sensor node is decreased when it is used in a multi-
hop network because relaying other nodes' packets consumes a great deal of
energy and this, in turn, leads to a reduced lifetime. The node density in the
network also has a severe impact on the lifetime of the visual sensor node. An
increase in the node density means that an increased number of packets have to be
relayed to other intermediate nodes or the central base station and hence the
lifetime of the visual sensor node is further reduced. The sleep energy is higher for
a lower sampling rate for both the hardware and software implementations of the
visual sensor node.
„For the software implementation, the processing energy of the vision
processing task at the visual sensor node is significantly greater than that of the
communication energy and it thus becomes necessary to reduce the processing
energy in order to achieve a longer lifetime for the visual sensor node. Hence for

66
software implementation of the visual sensor node, implementation optimization
is required in order for it to achieve a longer lifetime. In relation to a higher
sampling rate, the real bottle neck in the hardware implementation for the visual
sensor node occurs because of the higher communication energy, which depends
on the data that is required to be transmitted. In order to increase the sampling
rate and to maintain a higher lifetime for the hardware implementation of the
visual sensor node, it is necessary to address the challenges involved in reducing
the output data, so that the energy required for communicating the results to the
central base station is reduced to as low a value as possible. Thus, it is possible to
increase the lifetime of the visual sensor node in relation to its hardware
implementation by reducing the information that is required to be transmitted to
the central base station.
7.5 FUTURE WORKS
In the future, the focus should be on developing a Computer Aided Design
(CAD) tool, for performing intelligence partitioning between a visual sensor node
and the central base station in a wireless visual sensor network in order to increase
the lifetime of the visual sensor node for any application. The CAD tool should be
able to take some parameter of the specific application such as the type of vision
processing required as an input and produce practical metrics such as lifetime,
design complexity etc. as an output in order to develop a wireless visual sensor
network for any practical application.
In this research work the focus has been on reducing the resultant data using
the TIFF Group4 compression scheme and migrating from software
implementation to hardware implementation of the visual sensor node, which has
resulted in a lifetime of almost five years for a sample rate of five minutes. If, by
some means, it becomes possible to further reduce the output data then, the
sampling rate can further be increased (often required in surveillance applications)
and this will still enable the visual sensor node to have a lifetime of several years.
One effective way of reducing the data is to transmit it only when necessary.
In this specific application involving magnetic particles detection in a flowing
liquid in machinery, it is usual for there to be very few magnetic particles within
the first two to three years of a machine installation (which shows that the system
is not in critical situation). Hence the results are not required to be transmitted to
the central base station. In this manner, the results will only be transmitted to the
central base station, when the magnetic particles detected in the flowing liquid
increase from a given limit (some fixed threshold). Thus, by applying this strategy,
it becomes possible to perform the vision processing frequently and the results will
only be transmitted to the central base station at critical situations (when the
number of detected magnetic particles increases a certain limit). Hence, it is
possible to maintain an increased lifetime for the visual sensor node even for a
higher sample rate.
67
REFERENCES
[1] S. Hengstler “Stereo Vision in Smart Camera Network,” Department of Electrical Enginering , Stanford University, United States of America.
[2] L.Ferrigno,S.Marano,V.pacielloand A. Pietrosanto “Balancing Computational and Transmission Power Consumption in Wireless Image Sensor Networks”. IEEE Int’l Conf. on Virtual Environments, Human-Computer Interfaces, and Measurement Systems, Italy, July 2005.
[3] A. Rowe, D. Goel, R. Rajkumar, “FireFly Mosaic: A Vision-Enabled Wireless Sensor Networking System,” Real-Time Systems Symposium, 2007, RTSS 2007,Dec. 3-6, pages 459.468, ISSN: 1052-8725.
[4] J. Berclaz, E Fleuret and P. Fua, “Principled Detection-by-classification from multiple Views,” Proc. of the int’l conference on Computer Vision Theory and Application, 2008.
[5] E, Fleuret, J. Berklaz, R. Lengagne, P. Fua, “Multi camera people tracking with a probabilistic occupancy map,” IEEE transaction on Pattern Analysis and Machine Intelligence 30(2)(2008) 267-282.
[6] S.M. Khan and M. Shah “A Multi View Approach to Tracking People in Crowded Scene Using a Planar Homography Constraint,” Proceeding of the European Conference on Computer Vision, 2006.
[7] M. Hefeeda and M. Bagheri “Forest Fire Modeling and Early Detection using Wireless Sensor Networks,” Ad Hoc & Sensor Wireless Networks Vol.7, pp.169–224.
[8] N. Sazaka and H. Abdullah “The Importance of Using Wireless Sensor Networks for Forest Fire Sensing and Detection in turkey,” 5th Int’l Advanced Technologies Symposium, Karabuk, Turkey, 2009.
[9] P. Corke, P. Valencia, P. Sikka, T. Wark, and L. Overs, “Long-duration solar-powered wireless sensor networks,” in EmNets, pp. 33–37, 2007.
[10] J. Taneja, J. Jeong, and D. Culler, “Design, modeling, and capacity planning for micro-solar power sensor networks,” in Information Processing in Sensor Networks (IPSN), pp. 407–418, 2008.
[11] S. Kim, S. Pakzad, G. Fenves, D. Culler, S. Glaser, J. Demmel and M.Turon, “Health Monitoring of Civil Infrastructures Using Wireless Sensor Networks,” Information Processing In Sensor Networks Proc. of the 6th int’l conference on Information processing in sensor networks Cambridge, Massachusetts, USA Pages: 254 – 263,2007.
[12] J.O. Darmola, V.C. Osamor and O.O. Oluwagbemi “A Grid Based Frame work For Pervasive Healthcare Using Wireless Sensor Networks: A case for Developing Nations,” Asian Journal of Information Technology 7 (6) 260-267, 2008.
[13] N. M. Boers · P. Gburzy, I. Nikolaidis and W. Olesi “Developing Wireless Sensor Network Applications in a Virtual Environment,” Telecommun Syst DOI 10.1007/s11235-009-9246-x.
[14] R. Pathak and S. Joshi, “Implementation of Virtual Reality and Agents Model Based Nano Domain Simulation an HPC Setup,” First Asian Himalayas International Conference on Internet AH-ICI2009 Hyatt Regency Kathmandu, KATHMUNDU, NEPAL 3- 5th of November, 2009.
[15] D. R. Karuppiah, Z. Zhu, P. Shenoy and Edward M. Riseman, “A Fault-Tolerant Distributed Vision System Architecture for Object Tracking in a Smart
68
Room,” Proc. of the Second Int’l Workshop on Computer Vision Systems Pages: 201– 219, 2001.
[16] D. Focken and R. Stiefelhagen, “Towards Vision-based 3-D People Tracking in a Smart Room,” Proc. of the 4th IEEE Int’l Conference on Multimodal Interfaces Page: 400 , 2002.
[17] O. Nomir, M. A. Muttalib. “A system for human identification from X-ray dental RF transceiver graphs,” ACM Journal on Pattern Recognition, Volume 38 Issue 8, August, 2005.
[18] D. Mazumdar, S. Mitra, S. Mitra, “Evolutionary-rough feature selection for face recognition,” ACM Journal on Transactions on rough sets XII©2010, ISBN:3-642-14466-7 978-3-642-14466-0.
[19] A. Bottino, S. Cumani “A fast and robust method for the identification of face landmarks in profile images,” ACM WSEAS Transactions on Computers, Volume 7 Issue 8, August 2008.
[20] W. M. Merrill, F. Newberg, K, Sohrabi, W, Kaiser, and G, Potti. “Collaborative networking requirements for unattended ground sensor systems,” Technical Report 0-7803-7651-X, Sensoria Corporation, 2002
[21] T. Ko, N. Berry, and R. Kyker. “A minimalistic approach to image processing for low-power sensor networks,” In SPIE Defense and Security Symposium: Visual Information Processing, April 2004.
[22] H. Boers, W. Caarls, P. Jonker and R. Kleihorst “Architecture Study for Smart camera,” Proc. EOS Conference on Industrial Imaging and Machine Vision Munich, Germany pages 2005, 39-49.
[23] R. Kleihorst, B. Schueler and A. Danilin “ Architecture and Applications Of Wireless Smart Cameras (Networks),” 1424407281/07/$20.00 ©2007 IEEE.
[24] M. Tahir and R. Farrell “Optimal Communication- Computation Trade-off for Wireless Multimedia Sensor Network Lifetime Maximization,” Proc. of the 2009 IEEE conference on Wireless Communications & Networking Conference Budapest, Hungary, Pages: 2514-2519.
[25] C. Frank and M. Gertz “Orden:Outlier Region Detection and Exploration in Sensor Networks,” Proc. of the 35th SIGMOD international conference on Management of data Providence, Rhode Island, USA Pages: 1075-1078.
[26] C. B. Margi, R. Manduchi and K. Obrackza “Energy Consumption Trade-offs In Visual Sensor Networks,” In 24th Brazilian Symposium on Computer Networks SBRC 2006.
[27] S.Hengtsler and H.Aghajan “Application Driven Design of Smart Camera Networks,” Proc. of the 1st ACM/IEEE Int’l Conference on Distributed Smart Cameras (ICDSC '07), pp. 12–19, 2007.
[28] K. Obraczka, R. Manduchi, and J. Garcia-Luna-Aceves “Managing the Information Flow in Visual Sensor Networks,” Proc of the 5th Int’l Symposium on Wireless Personal Multimedia Comm, 2002.
[29] Y.Charfi N. Wakamiya and N. W. Murata “Challenging Issues in Visual Sensor Networks,” IEEE Wireless Communications Volume 16 Pages: 44-49.
[30] P. Kulkarni, D. Ganesan, P. Shenoy and Q. Lu, “SensEye : A Multi-tier camera sensor Network,”
[31] M. Rahimi, R. Baer, O. I. Iroezi, J. C. Garcia, J. Warrior, D. Estrin, M. Srivastava, “Cyclops: In Situ Image Sensing and Interpretation in Wireless
[32] Sensor Networks,” SenSys’05, November 2–4, 2005, San Diego, California, USA.
69
[33] S. Hengstler, D. Prashanth, S. Fong, and H. Aghajan, “MeshEye: A Hybrid-Resolution Smart Camera Mote for Applications in Distributed Intelligent Surveillance,” IPSN'07 Proceedings of the 6th international conference on Information processing in sensor networks ACM New York, NY, USA ©2007. , April 25-27, 2007, Cambridge, Massachusetts, USA.
[34] Anthony R., Adam G., Dhiraj G., Illah N., “CMUcam3: An Open Programmable Embedded Vision Sensor,”
[35] R. Mangharam, A. Rowe, R. Rajkumar, ”FireFly: A Cross-Layer Platform for Wireless Sensor Networks,” Real Time Systems Journal, Special Issue on Real-Time Wireless Sensor Networks , Nov. 2006.
[36] A. Eswaran, A. Rowe, R, Rajkumar, ”Nano-RK: an Energy-aware Resource-centric RTOS for Sensor Networks,” IEEE Real-Time Systems Symposium, Dec. 2005.
[37] A. Rowe, R. Mangharam, R. Rajkumar, ”RT-Link: A Time-Synchronized Link Protocol for Energy-Constrained Multi-hop Wireless Networks,” Third IEEE International Conference on Sensors, Mesh and Ad Hoc Communications and Networks (IEEE SECON), Sep. 2006.
[38] P. Chen, P. Ahammad, C. Boyer, S.I. Huang, L. Lin, E. Lobaton, M. Meingast, S. Oh, S. Wang, P. Yan, A. Y. Yang, C. Yeo, L. C. Chang, J.D. Tygar, and S. S. Sastry, “CITRIC: A Low-Bandwidth Wireless Camera Network Platform,” 978-1-4244-2665-2/08/$25.00 c 2008 IEEE.
[39] A. Kandhalu, A. Rowe, R. Rajkumar, “DSPcam: A Camera Sensor System for Surveillance Networks,” 978-1-4244-4620-9/09/$25.00 c 2009 IEEE.
[40] http://camellia.sourceforge.net/ [41] M . Wu and C. W. Chen, “Multiple bit-stream Image Transmission Over
Wireless Sensor Networks,” In Proc. of 2d IEEE Intl Conference on Sensors vol. 2, pp. 727–731, Toronto, Canada, October 2003.
[42] M. Bramberger, A. Doblander, A. Maier, B. Rinner and H. Schwabach “Distributed Embedded Smart Cameras for Surveillance Applications, ”Computer 39(2)(2006) 68-75.
[43] P.Jonker “Why linear arrays are better image processor,” in Pro. of the IAPR Conference on Pattern recognition, 1994.
[44] A .A. Abbo, R.P. kleihorst, V. Choudry, et al, Xetal-II, “A 107 GOPS, 600mW massively parallel processor for video scene analysis,” IEEE Journal of Solid State Circuits 43(1)(2008) 192-201.
[45] S. Soro and W. Heinzelman “A Survey of Visual Sensor Networks,” Hindawi Publishing Corporation Advances in Multimedia Volume 2009, Article I D 640386, 21 pages doi:10.1155/2009/640386.
[46] S. Soro and W. B. Heinzelman, “On the coverage problem in video-based wireless sensor networks,” In Proc.of the 2nd Intl Conference on Broadband Networks pp. 9–16, 2005.
[47] R. Kleihorst, A. Abbo, A. van der Avoird, M. O. de Beeck, L. Sevat, P. Wielage, R. van Veen, and H. van Herten. “Xetal: A low-power high-performance smart camera processor,” In ISCAS 2001, (Sydney, Australia), may 2001.
[48] A. Kandhalu, A. Rowe, R. Rajkumar, “RealTime Video Surveillance over IEEE 802.11 Mesh Networks,” Real-Time Applications Symposium, 2009.
[49] R. Kleihorst, B. Schueler, A. Danilin, M. Heijligers, “Smart Camera Mote with High Performance Vision System,” ACM SenSys 2006 Workshop on Distributed Smart Cameras (DSC 2006), Oct. 2006.

70
[50] K. Khursheed, M. Imran, M. O’ Nills, N. Lawal. “Exploration of Local and Central Processing for a Wireless Camera Based Sensor Node”. Proceedings of IEEE International Conference on Signal & Electronic System, Gliwice, Poland, Sept. 7-10, 2010.
[51] M. Imran, K. Khursheed, M. O’ Nills, N. Lawal, “Exploration of Target Architecture for a Wireless Camera Based Sensor Node,” 28th Norchip Conference 15-16 November 2010, Tampere, FINLAND.
[52] K. Khursheed, M. Imran, A.W. Malik, M. O’Nils, N. Lawal, T. Benny, “Exploration of Tasks Partitioning Between Hardware Software and Locality for a Wireless Camera Based VSN,” Accepted for Proceedings of the International Symposium on Parallel Computing in Electrical Engineering (PARELEC'2011).
[53] I. F. Akyildiz, W. Su, Y. Sankarasubramaniam, E. Cayirci, “Wireless sensor networks: a survey,” Computer Networks, vol. 38, pp. 393-422.
[54] W. R. Heinzelman, A. Chandrakasan, H. Balakrishnan, ”Energy efficient communication protocol for wireless micro sensor networks,” Proceedings of 33rd Annual Hawaii International Conf. Syst. Sciences, vol. 8, p. 8020, Hawaii, USA.
[55] Q. Chen, S. S. Kanhere, M. Hassan, “Analysis of Per-node traffic load in multihop wireless sensor networks,” In IEEE Transactions on Wireless Communications, vol. 8, no. 2.
[56] B. Karp, H. T. Kung, “GPSR: Greedy perimeter stateless routing for wireless networks,” In Proceedings of 6th Annual International Conference Mobile Computing Networking, pp. 243-254, Boston, MA, USA.
[57] Y. Yu, R. Govindan, D. Estrin, “Geographical and energy aware routing: a recursive data dissemination protocol for wireless sensor networks,” UCLA Computer Science Department Technical Report, UCLA-CSD TR-01-0023.
[58] F., Shu, T., Sakurai, M., Zukerman, H. L. Vu, “Packet loss analysis of the IEEE 802.15.4 MAC without acknowledgements,” Communications Letters. IEEE Volume: 11 Issue: 1, 79 – 81.
[59] “FACSIMILE CODING SCHEMES AND CODING CONTROL FUNCTIONS FOR GROUP 4 FACSIMILE APPARATUS,” (Malaga-Torremolinos, 1984; amended at Melbourne, 1988). Recommendation T.6.