Investigation of construction failure of Harbor Cay ...
150
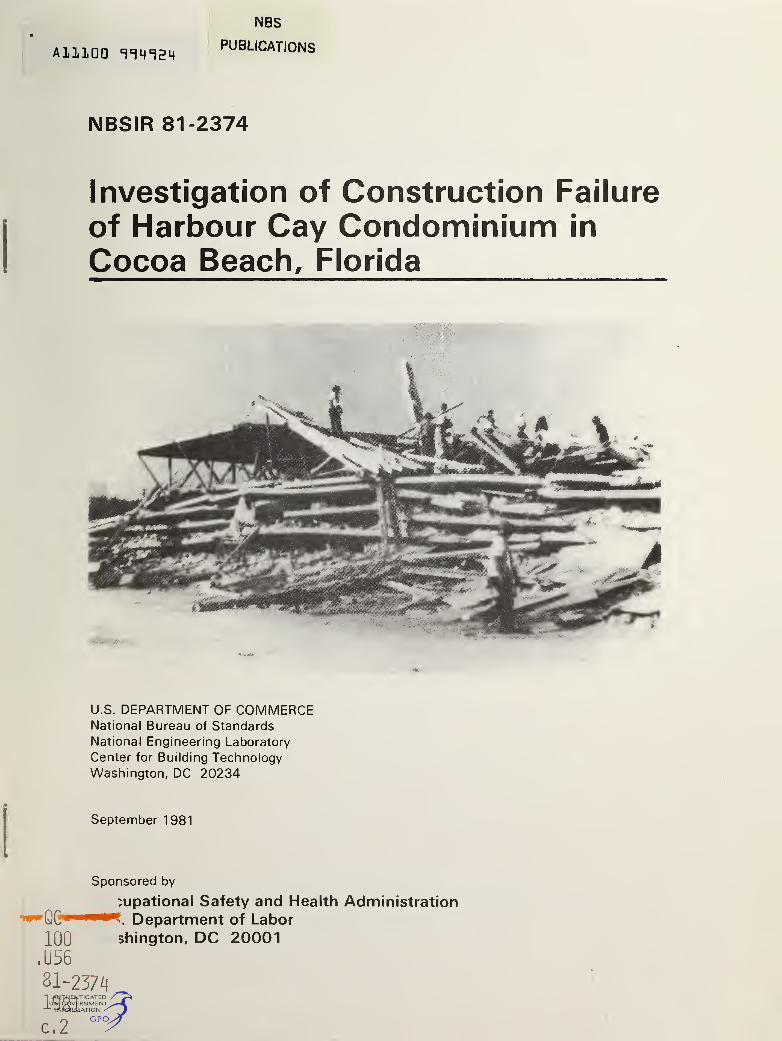
A11100 TTMTHM NBS PUBLICATIONS NBSIR 81-2374 Investigation of Construction Failure of Harbour Cay Condominium in Cocoa Beach, Florida U.S. DEPARTMENT OF COMMERCE National Bureau of Standards National Engineering Laboratory Center for Building Technology Washington, DC 20234 September 1981 Sponsored by :upational Safety and Health Administration Department of Labor 1Q0 shington, DC 20001 ,U56 31-2374 1931 c.2
-
Upload
khangminh22 -
Category
Documents
-
view
2 -
download
0
Transcript of Investigation of construction failure of Harbor Cay ...
A11100 TTMTHM
NBS
PUBLICATIONS
NBSIR 81-2374
Investigation of Construction Failure
of Harbour Cay Condominium in
Cocoa Beach, Florida
U.S. DEPARTMENT OF COMMERCENational Bureau of Standards
National Engineering Laboratory
Center for Building Technology
Washington, DC 20234
September 1981
Sponsored by
:upational Safety and Health AdministrationDepartment of Labor
1Q0 shington, DC 20001
,U56
31-2374
1931
c.2


OCT 2 2 1981
not Ore.-NBSIR 81-2374
INVESTIGATION OF CONSTRUCTION FAILURE
OF HARBOUR CAY CONDOMINIUM IN
COCOA BEACH, FLORIDA
S-H.)Af. LewN. J. Carino
S. G. Fattal
M. E. Batts
U S. DEPARTMENT OF COMMERCENational Bureau of Standards
National Engineering Laboratory
Center for Building Technology
Washington, DC 20234
September 1981
Sponsored by
Occupational Safety and Health Administration
U.S. Department of Labor
Washington, DC 20001
U.S. DEPARTMENT OF COMMERCE, Malcolm Baldrige, Secretary
NATIONAL BUREAU OF STANDARDS. Ernest Ambler, Director

:
... : ..-.'C, , :
:
,
>' ' r| |
:: V '
.
"• - -.OB >h . fKO
^ ^
;; ii .
*
Ao::r& :>
i
Or 4 '•'"A
'
:
.
'
. 'V -
.
'
,.
....
'
- :W'i &.
:'
.. :
; .
'

ABSTRACT
The investigation of the collapse of a five-story reinforced concrete flat-plate structure under construction at Cocoa Beach, Florida is presented inthis report. The investigation included onsite inspection, laboratory testsand analytical studies.
Based on the results of this investigation, it is concluded that the mostprobable cause of the failure was insufficient punching shear capacity in the
fifth-floor slab to resist the applied construction loads.
Two factors contributed to the low punching shear capacity: one in the designand the other in the construction of the building. In the design, the omissionof a check for punching shear resulted in a smaller slab thickness than neededto satisfy the Code requirements. In construction, the use of specified chairshaving insufficient height to support the top reinforcing steel resulted in
more than the cover specified in the structural drawings. Both factors contri-buted to reducing the effective depth of the slab such that it had insufficientstrength to resist the construction loads.
The analysis showed that shear stresses in the slab at many column locations onthe fifth floor exceeded the nominal shear strength. Thus, punching shear fail-ure at one of the columns precipitated a progressive failure of the slab through-out the entire fifth floor. Collapse of the fifth floor, in turn, caused thesuccessive collapse of the lower floor slabs. The analysis of the structureindicated that the failure of the fifth floor slab most likely initiated atcolumn G-2, an interior column which supported the last bay of freshly placedconcrete prior to the collapse.
Key Words: Building; collapse; concrete; concrete strength; construction;failure; flat plate; shear; strength.
iii
PREFACE
An investigation of the construction failure of a five-story reinforcedconcrete building (Harbour Cay Condominium) at Cocoa Beach, Florida onMarch 27, 1981 was carried out by the National Bureau of Standards (NBS) at
the request of the Occupational Safety and Health Administration (OSHA),Department of Labor. This investigation was conducted pursuant to aninteragency agreement between OSHA and NBS.
The NBS investigation team consisted of H. S. Lew, S. G. Fattal, N. J. Carino,and M. E. Batts. Throughout the course of this investigation, the teamreceived full cooperation from the OSHA regional and area officers. Assis-tance provided by Mr. William P. Demery, Tampa Area Director and his staff is
gratefully acknowledged by the NBS team. Without their help, it would not
have been possible to obtain the data needed to carry out this investigation.
iv

EXECUTIVE SUMMARY
The Harbour Cay Condominium, a five-story flat-plate reinforced concretebuilding, was under construction at Cocoa Beach, Florida. Shortly after 3:00p.m., March 27, 1981, during the placement of concrete for the roof slab, the
entire structure collapsed. As a result, 11 workers died, and another 23 wereinjured.
The structure had an overall length of 242 ft (74 m) and a width of 58 ft (18 m) .
The slab concrete was placed on flying forms, consisting of preassembled ply-wood decks supported by aluminum trusses. Except for the roof, which wasplanned to be cast in one day, the floor slabs were cast in two separate opera-tions, each covering one-half of the total floor area. At the time of thecollapse, concrete had been placed on seven of the nine flying forms comprisingthe entire roof area.
During the course of the investigation two site visits were made. The firstsite visit was made on March 28-30, 1981, one day after the collapse, and the
second visit was made on April 7-8, 1981. During the visits, structural compo-nents were examined visually and photographic documents were made as the com-ponents were removed for rescue operations, selected key components wereidentified and marked with paint for testing laboratory personnel to securetest samples, and measurements of member dimensions were made. In addition,construction and other documents were obtained through the OSHA area office in
Tampa
.
At the time of collapse, the flying forms were placed on the fifth floor to
receive concrete for the entire roof slab. The exact number and locations of
reshores at various floors are not certain. The first story appears to havehad only a few exterior reshores in place, and the fourth story probably hadthe full number of reshores according to the reshoring plan supplied by thegeneral contractor after the collapse. Conflicting statements were given byworkers as to the number and locations of reshores on the second and thirdstories. For the purpose of analysis, it was assumed that both the second andthird stories had the full number of reshores.
The concrete used for the structure was supplied by both the onsite batch plantand a ready-mix plant. Approximately 1/3 of the concrete used for the floorslabs was supplied by the ready-mix plant. The remainder was supplied by theonsite batch plant. The concrete produced by the onsite batch plant wasreported to have been nonuniform in consistency and finishability
.
Core samples were taken from slab and column sections which were identifiedduring the first field visit to the site. Tests of these cores were made by anindependent testing laboratory which was retained by OSHA. The compressivestrengths of cores taken from slab sections satisfied the American ConcreteInstitute 318 Standard (ACI Code) strength criteria for the specified strengthof 4000 psi (27.6 MPa). The compressive strength of cores taken from columnsections were lower than the strengths of slab cores, and the average strengthof the cores from the fifth floor columns did not satisfy the ACI criteria for
the specified strength.
v
Samples of Ingredients used for the concretes produced by the onsite batchplant and the ready-mix plant were obtained from the site. They were subjectedto chemical and physical analyses and used by NBS to make concrete mixturesrepresentative of what was used in the structure. The purpose of the NBS labo-ratory investigation was to establish the strength of the concrete at the timeof collapse. Based on the laboratory mixes and local temperature data at the
site, the estimated compressive strengths of concrete at the time of collapsewere 4000 psi (276 MPa) for the south half and 3700 psi (255 MPa) for the northhalf of the fifth floor slab.
The analysis of the structure subjected to the construction loads was made withthe ICES-STRUDL-II* finite element program. The finite element model analyzedincorporated both the structure, which is discretized by rectangular plate bend-ing elements, and the formwork system. In determining the loading conditionsfor analysis, the effect of construction load distribution between the structureand the formwork was considered along with the effects of sequential removal offlying forms. The results of the analysis show that maximum moments and shearsin the slab occur on the fifth floor. Combinations of shears and moments whichwould produce critical conditions occurred at columns B-2 and G-2 . Descriptionof the collapse by workers on the site indicate that the most probable originof the collapse was the fifth floor slab in the vicinity just below where the
roof concrete was being placed, which supports the critical nature of column G2
.
The construction documents and field measurements revealed that the top layersof reinforcing bars in the column strips were supported by individual highchairs which produced concrete cover of 1 3/4 in (44 mm) instead of 3/4 in
(19 mm) as specified in the structural drawings. This discrepancy resulted in
the reduction of the effective depth of the slab which had direct effect on the
shear resisting capacity of the slab.
The chair heights were in conformance with the steel supplier's shop drawings,which specified the number and sizes of individual high chairs required for
each floor. The record copies of these drawings show numerous check marks.One of the six pages bore the handwritten words "approved as noted" and the
signature of the design engineer of record.
Using the moments and shears obtained from the finite element analysis, punchingshear stresses resulting from direct shear forces and unbalanced moments werecomputed at slab-column connections. These shear stress values are comparedwith the shear capacity of the slab based on the predicted inplace strength of
concrete at the time of collapse. The computed beam-type shear stress underconstruction loading is considerably less than the beam shear strength of the
slab. On the other hand, the computed punching shear stresses at many columnlocations in the fifth floor exceeded the nominal punching shear capacity ofthe slab. Based on the probablistic nature of the shear strength, it is rea-soned that the collapse was most likely initiated due to punching shear failureat column G-2.
* A general purpose structural analysis program, see chapter 5 and ref. 5.5 for
further details.
vi

It is shown that high punching shear stresses resulted from use of reducedheight individual high chairs to support the top reinforcing bars in the columnstrip, thereby reducing the effective depth of the slab. The omission of a
check for punching shear capacity in the design calculations resulted in a slabthickness of 8 in (203 mm). The ACI Code would have required a thickness of11 in (279 mm) to provide adequate safety against punching shear under designloads. It is shown that this design deficiency resulted in a reduction of themargin of safety such that the slab had insufficient reserve strength to
accommodate construction errors.
It is concluded that two factors contributed to the collapse: one in thedesign and the other in the construction of the building. In design, a checkfor punching shear was omitted. In construction, the specified chairs used to
support the top reinforcing steel provided more than the cover called for inthe structural drawings. The analysis showed that the shear stresses at manycolumn locations in the fifth floor exceeded the nominal shear strength. Oncepunching shear failure had initiated at column G-2 , it propagated throughoutthe slab causing the total collapse of the fifth floor, which, in turn, causedthe successive collapse of the lower floor slabs.
vii
TABLE OF CONTENTS
Page
ABSTRACT . illPREFACE iv
EXECUTIVE SUMMARY v
1 . INTRODUCTION 1
1.1 Background 1
1.2 Objective and Scope of the Investigation 1
1.3 Organization of the Report 1
2. DESCRIPTION OF THE STRUCTURE AND THE COLLAPSE 3
2.1 Introduction 3
2.2 Documents Supplied by OSHA Field Office 3
2.3 Description of the Structure 5
2.4 Construction Method 8
2.5 Events at the Time of the Collapse 102.6 Summary 11
3. SITE INVESTIGATION 29
3.1 Introduction 29
3.2 Investigation at the Site 29
3.3 Interview Statements of Workers 30
3.3.1 Location of Reshores 30
3.3.2 Construction Deficiencies 313.3.3 Quality of Concrete 32
3.3.4 Description of the Collapse 33
3.4 Summary 34
4. LABORATORY INVESTIGATIONS 39
4.1 Introduction 394.2 Information on Field Concrete 39
4.3 Test of Samples from the Site 414.3.1 Concrete Ingredients 414.3.2 Core Strength 42
4.3.3 Petrographic Analysis 424.3.4 Chemical Analysis 43
4.4 NBS Laboratory Investigation 44
4.4.1 Sample Preparation 44
4.4.2 Test Results 464.4.3 Estimated Strength of Concrete at Time of the Collapse . 47
4.4.4 Reinforcing Steel Strength 494.5 Summary 49
5. STRUCTURAL ANALYSIS 715.1 Introduction 715.2 Background 715.3 Loads 72
viii
TABLE OF CONTENTS (Cont.)
Page
5.4 Construction Sequence 74
5.5 Method of Analysis 77
5.6 Finite Element Analysis of Entire Structure 795.7 Summary 80
6. INTERPRETATION OF ANALYSIS 94
6.1 Introduction 94
6.2 Analysis of Shear Failure of Slab 946.3 Influence of Effective Depth of Slab on Shear Capacity 96
6.4 Probable Mode of Failure 98
7. SUMMARY AND CONCLUSION 103
8. ACKNOWLEDGMENTS 1059. REFERENCES 106
APPENDIX A. RESULTS OF TESTS ON SAMPLES FROM THE SITE A-l
ix


1 INTRODUCTION1.1
BACKGROUND
The Harbour Cay Condominium, a five-story flat-plate reinforced concretebuilding, was under construction at Cocoa Beach, Florida. Shortly after
3:00 p.m., March 27, 1981, during the placement of concrete for the roofslab, the entire structure collapsed vertically with each floor slab break-ing away from the columns and landing on the ground floor. As a result, 11
workers who were performing duties at various levels of the building died,and another 23 were injured.
The structure had an overall length of 242 ft (74 m) , a width of 58 ft (18 m)
and contained nine bays. The slab concrete was placed on flying forms, con-sisting of preassembled plywood decks supported by aluminum trusses. Theconstruction system is described in detail in chapter 2. Except for theroof, which was planned to be cast in one day, the floor slabs were cast in
two separate operations, each covering one-half of the total floor area. Atthe time of the collapse, concrete had been placed on seven of the nineflying forms comprising the entire roof area.
Within one hour of the collapse, an inspection team from the OccupationalSafety and Health Administration (OSHA), Department of Labor, arrived at thesite and began an investigation of the collapse. A team from the NationalBureau of Standards (NBS) joined the OSHA team one day later on March 28, 1981.
1.2 OBJECTIVE AND SCOPE OF THE INVESTIGATION
The National Bureau of Standards was requested to assist with the fieldinvestigation being conducted by the Occupational Safety and Health Adminis-tration at the site of the collapse and to carry out a detailed study to
determine the most probable cause of the collapse.
In response to this request, NBS carried out field, laboratory, and analyticalstudies. The NBS investigators used data obtained from onsite inspections,OSHA case records, and other related documents such as the engineering calcu-lations, specifications, and drawings showing details of the buildingconstruction.
1.3 ORGANIZATION OF THE REPORT
This report is organized in nine chapters:
Chapter 2 presents the description of the structure based on the contractdrawings and the specifications and lists the various documents furnished byOSHA. In addition, it describes the method and sequence of construction ofthe structure, its appearance, and conditions before and after the collapse.
1

Chapter 3 presents observations made and information obtained from the fieldinvestigations. It summarizes the statements made by those interviewed byOSHA officials
.
Chapter 4 presents the results of concrete tests which were used to determinethe strength and stiffness of the structure at the time of failure. The testresults of the reinforcing steel obtained from the site are also presented.
Chapter 5 describes the rationale for defining the loads which were acting onthe structure at the time of the collapse. It also presents the analyticalapproach used in the investigation of the structure and the results of theanalysis
.
Chapter 6 examines the results of the analysis of the structure, comparesthem with the capacity of the structure, and presents the most probable causeand mode of failure.
Chapter 7 summarizes the findings of the investigation and presents its
conclusions
.
Chapter 8 acknowledges those individuals . who made contributions to the variousphases of the investigation and to the preparation of this report.
Chapter 9 lists the references cited in the text.
2
2 DESCRIPTION OF THE STRUCTURE AND THE COLLAPSE
2.1 INTRODUCTION
This chapter describes the structural features of the Harbour Cay condominiumand the method used in its construction. The emphasis is on structural aspectsthat are pertinent to the investigation of the collapse. The principal sourcesof information were construction documents supplied by OSHA, site investigationsof the collapse, and photographs of the structure taken before and after the
collapse
.
Section 2.2 identifies the various construction and other documents supplied byOSHA and describes briefly their uses in this investigation. The appropriatesections under which the specific contents of these documents are discussed areidentified by reference.
Section 2.3 presents selected structural data for use in subsequent analyticalinvestigations. It begins with a brief description of the layout of the build-ing, the sectional configuration of its columns and floor slabs, reinforcingplans and schedules, materials specifications, design loads and the scope ofdesign calculations. The latter part of. this section establishes the actualeffective depth of the slab at the columns. The effective depth is a criticalparameter in calculations of the shear and moment capacity of the slab.
Section 2.4 describes the falsework system and the procedure used in theconstruction of the building. The principal topics of discussion are the con-figuration and layout of the flying form system, the construction sequence, the
state of construction at the time of the collapse, and the location of reshoresin the lower stories.
A brief description of events at the time of the collapse is given insection 2.5. Section 2.6 provides a summary of the findings reported in thischapter
.
2.2 DOCUMENTS SUPPLIED BY OSHA FIELD OFFICE
NBS requested certain documents in order to carry out its investigation, whichwere subsequently provided by the OSHA area office in Tampa. The documentsprovided information on the structural aspects of the building, the construc-tion schedule, and the results of tests conducted by testing laboratories.OSHA also provided copies of personal interview statements of workers, many ofwhom were eyewitnesses to the collapse. In addition, OSHA supplied NBS withphotographs taken prior to and after the collapse.
Construction Documents
The following construction documents were supplied by OSHA: (1) architectural,structural and steel supplier’s drawings and job specifications, (2) a flyingform plan, (3) a reshoring layout (prepared after the collapse), and
(4) structural design calculations.
3

The first three documents were used extensively to develop an understanding ofthe structure and the construction scheme (sections 2.3 and 2.4), and to formu-late the analytical models (chapter 5) employed in subsequent investigations ofthe collapse (chapters 5 and 6). The flying form plan, supplemented with infor-
mation from the manufacturer (section 2.4), were the principal documents usedin the evaluation of construction loads (section 5.3).
Section 2.3 includes a commentary on the structural design calculations mainlywith regard to content and certain omissions. As discussed in that section,the question of adequacy of the design calculations for service loads is notaddressed because it is outside the scope of this investigation.
Daily Logs
Several sources were used to reconstruct the construction history. Theseincluded the daily notes of the construction manager and of the general con-tractor' s field superintendent, and the engineer's daily inspection reports.Copies of the daily reports of the onsite batch plant provided informationwhich resolved some discrepancies in the above sources with respect to the con-struction sequence. The schedule presented in section 2.4 is based primarilyon these documents.
Along with the batch plant reports, there were copies of mix design sheets forconcrete that the general contractor had used on a previous project. Thesemix design sheets were supplemented with charts to be used by the batch plantoperator to determine the quantities of concrete for different size batches andtypes of concrete. These documents are further discussed in chapter 4. In
addition, OSHA obtained copies of invoices and delivery tickets from variousmaterials and service suppliers to the general contractor.
Copies of daily weather reports obtained from Patrick Air Force Base containedhourly temperature data that were used with NBS laboratory tests to predict theinplace strength of concrete at the time of the collapse (section 4.4.3).
Testing Laboratory Reports
The general contractor employed a testing laboratory to perform qualitycontrol testing of the concrete. The information contained in these reportsis presented in section 4.2.
OSHA retained a testing laboratory to test samples taken from the site afterthe collapse. A copy of this laboratory's report was provided to NBS and theresults are summarized in section 4.3.
Interview Statements
OSHA provided copies of the statement made by workers interviewed by OSHACompliance Officers. These statements provided very useful information on the
construction of the building as discussed in section 2.4. In addition, theyprovided eyewitness accounts of the collapse. Section 3.3 summarizes some ofthe pertinent information gathered from the personal interview statements.
4
Copies of the investigation reports of the Florida Department of ProfessionalRegulation provided statements made by engineers, regulatory personnel, andconstruction managers involved in the Harbour Cay project.
2.3 DESCRIPTION OF THE STRUCTURE
The building was a five-story flat plate structure intended for residentialuse. A typical framing plan for the second through fifth floors is shown infigure 2.1. The columns were 10 x 18 in (254 x 457 mm) in cross section withthe following exceptions: the columns on lines A and K were 10 x 12 in (254 x
305 mm) and those at the exterior ends of the stairwells were 8 x 12 in (203 x305 mm) in cross section. The thickness of the floor slabs was 8 in (203 mm)
.
The thickness of the balcony slab along the west side varied from 7-1/4 in
(184 mm) at the column line to 6-1/2 in (165 mm) at the edge. The thicknessof the walkway slab along the east side (as scaled from the structural plans)was 7-1/2 in (191 mm). The first story floor slab was cast on grade. Theelevator tower was structurally detached from the building. Top of slab storyheights were 8' -8" (2.64 m) . At the foundation level, the columns weresupported by pile caps containing two to nine piles each. The exterior capswere connected by continuous wall footings.
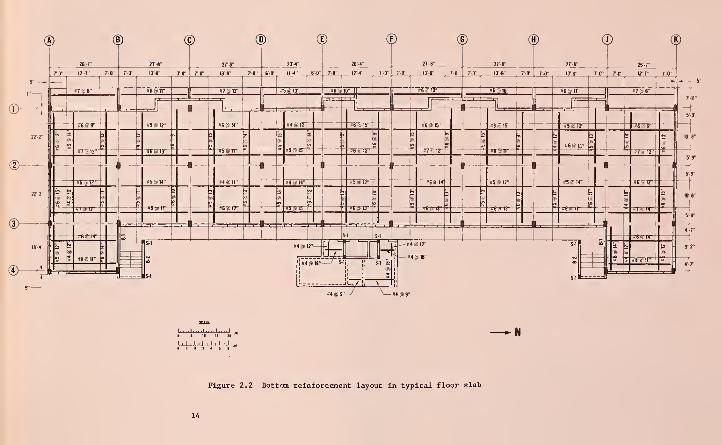
Reinforcing steel for the slabs and columns was specified as deformed barsASTM Grade 60. The framing plans in figures 2.1 and 2.2 show the top andbottom reinforcement in the slab, respectively. Table 2.1 shows the rein-forcing schedule for the columns. The structural drawings called for 4000 psi
(27.60 MPa) strength for concrete in the above-grade portion of the structure.The specified live loads were 20, 40, 60 and 100 psf (960, 1920, 2870 and4790 Pa) for the roof, floor, public balcony and stairways, respectively. Thewind design was specified to conform with the SBCC Standard Building Code,110 mph (49 m/s) wind with a 100-ye^r return period [2.2]. Concrete blockmasonry strength was specified as f = 1500 psi (10.35 MPa). Non-load bearingconcrete masonry construction was used for the exterior walls of the building.
The structural design calculations consisted of 79 consecutively numberedpages. The first page specified the material strengths and loads assumed forthe design. Pages 3 through 9 showed the axial loads in columns, computed onthe basis of tributary areas. Pages 9 through 16 contained wind load calcula-tions and the moments they produced in the assumed structure. Page 17 speci-fied the preliminary column sizes based on the computed axial loads and assumedend moments. Pages 18 through 77 contained the slab moment calculations andsizing of the flexural reinforcement. Page 78 contained the pile cap designsand page 79 showed the final column schedule.
The design calculations were not examined in detail, but the following omissionswere noted with regard to compliance with the provisions of the American ConcreteInstitute 318 Standard (hereafter referred to as the ACI Code) [2.1], which is
part of the applicable local Code [2.2] for this structure.
(1) There were no calculations to indicate whether the deflection or minimumthickness provisions of the Code were met.
5

(2) There were no calculations to indicate whether the punching shear and
beam shear provisions of the Code were met.
(3) There were no checks to determine if the column reinforcement wouldsatisfy the necessary spacing requirements specified by the Code.
(4) The steel area calculations for the flexural reinforcement in the slabswere based on ASTM Grade 40 steel. This is at variance with the Grade 60steel specified in the structural drawings.
(5) The effective depth of the slab in flexural reinforcement calculationswas not defined explicitly but appeared as part of a constant multiplierof computed moments. Back calculations showed that the designer usedthe value of "around" 6.3 in (160 mm) for the effective depth in steelarea calculations (effective depth varies somewhat with the amount andsize of steel bars; hence the use of the word "around"). For the 8-in(203-mm) slab, the effective depth used is consistent with the 3/4-in(19-mm) minimum cover specified by the ACI Code (sec. 7.5 of ref. 2.1).Explanations of "effective depth" and "cover" appear later on in this
section
.
The above statements are cited for information purposes only. Insofar as this
investigation is concerned, the structural drawings and specifications super-sede the design calculations, and therefore, are the documents referenced in
subsequent comments about the "design" of the structure. Thus, questionsrelated to consistency of the design calculations with the contract documentsare not discussed any further.
According to the contract specifications, "protection for reinforcing steel
shall be 1 in for slabs." However, a "typical balcony section" in the struc-
tural drawings shows 3/4-in (19-mm) clear cover for top and bottom bars in the
floor slab and bottom bars in the balcony slab, and 1 in (25 mm) clear coverfor top bars in the balcony slab. According to the steel supplier's drawingsand delivery tickets, a sufficient number of 3/4- in (19-mm) slab bolsters were
supplied to obtain a 3/4-in (19-mm) clear cover for the bottom bars in the
slabs regardless of bar size.
From the same sources, the quantities and sizes of individual high chairs
(IHC) supplied for the top steel in a floor slab were identified as follows:500 - 5-3/4" IHC, 470 - 4-1/4" IHC, 70 - 5" IHC, 50 - 4" IHC and 70 - 3-1/4"
IHC. In addition, #5 support bars were supplied for use with the high chairsin the middle strip to support the one-way top reinforcement in these strips(fig. 2.1). The specified spacing of high chairs was 4 ft (1.2 m) on center.
With the aid of the framing plan for top bars in the slab (fig. 2.1), and
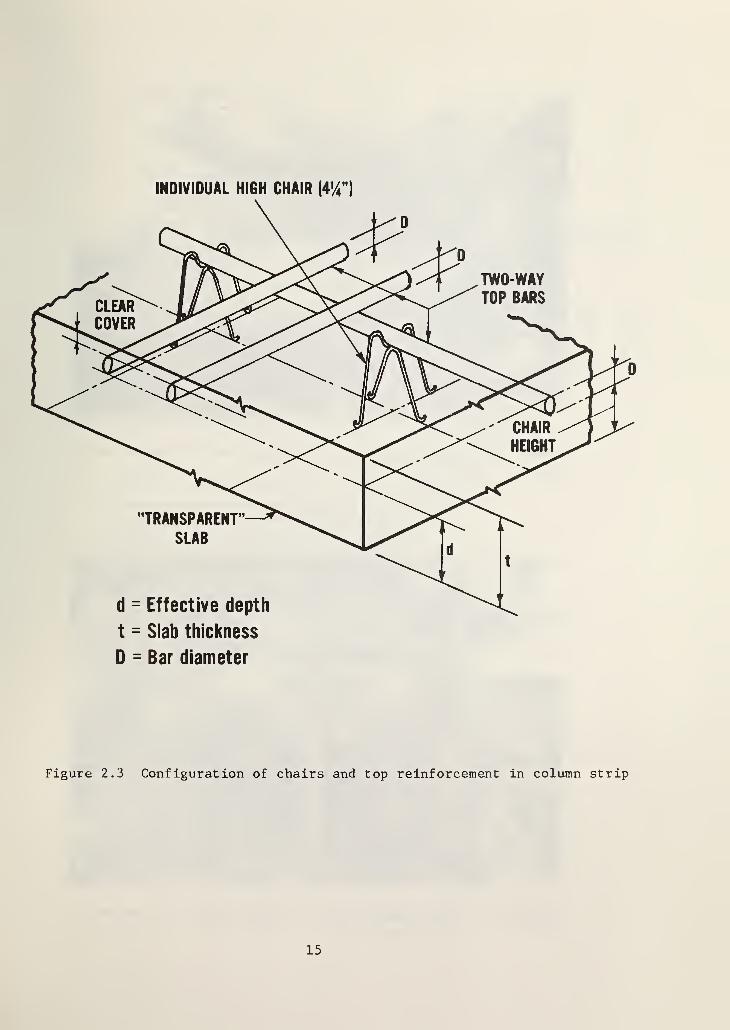
quantities of chairs of various specified sizes supplied, it was determinedthat the 5-3/4- in (146-mm) high chairs were used for the one-way top reinforce-ment in the middle strips and the 4-1/4- in (108-mm) high chairs were used forthe two-way top reinforcement in the column strips. Figure 2.3 shows the top
reinforcement layout in a column strip assuming bars in both directions have
the same diameter D. The relationship between chair height, bar diameter,effective depth, cover, and slab thickness are illustrated in the same figure.
6
Chairs having specified sizes other than these two were supplied in muchsmaller quantities for use with the top reinforcement of the thinner slabs in
the balcony and walkway, and those in the elevator tower and stairwells.
Noting that #4 to #6 bars sizes were used at the top of middle strips, the use
of 5-3/4- in (146-mm) chairs with #5 support bars would result in a clear coverof 7/8 to 1-1/8 in (22-29 mm) for the top bars in the middle strips. Thisexceeds the 3/4-in (19-mm) cover specified in the structural drawings but is
within the 3/8-in (9.5-mm) tolerance limit specified in section 7.5 of the ACICode [2.1]. According to the steel supplier’s drawings, in areas of two-waytop steel, such as the column strips, main reinforcement in one direction is
used as support bars for main reinforcement in the other direction. The useof 4-1/4-in (108-mm) chairs in these areas where the slab is 8 in (203 mm)
thick would result in a net cover ranging from a minimum of 1-5/8 in (41 mm)
for the combination of maximum bar sizes (e.g., #8 and #9 at column C2) to a
maximum of 2-1/8 in (54 mm) for the combination of minimum bar sizes (e.g., #5
and #8 at column A3). The possibility of 5-3/4-in (146-mm) chairs having beenused in the column strips is ruled out because this would have resulted in
virtually no top cover at most locations.
There is, therefore, an inconsistency in the construction documents. Thestructural drawings indicated a 3 /4-in (19-mm) cover for the top slab bars,whereas the chair height indicated on the steel supplier’s shop drawings wouldresult in more than 3/4- in cover for the top bars in the column strips of theslabs. The record copies of the shop drawings contained numerous check marks.One of the six pages bore the handwritten words "approved as noted" and thesignature of the design engineer of record.
For further verification, actual field measurements were carried out.Measurements of top bar cover and recovery of 4-1/4- in (108-mm) chairs fromslab segments salvaged from the debris of the collapsed building, (figures2.4 and 2.5, respectively), confirmed the use of 4-1/4- in (108-mm) chairs forthe two-way top reinforcement in the column strips.
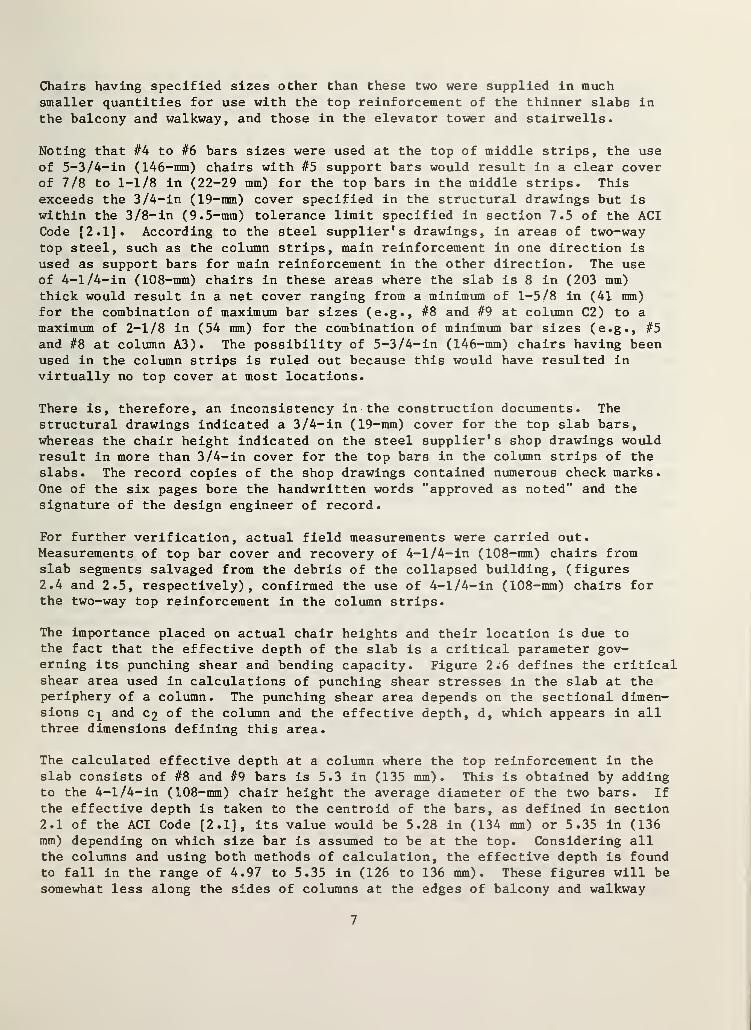
The importance placed on actual chair heights and their location is due tothe fact that the effective depth of the slab is a critical parameter gov-erning its punching shear and bending capacity. Figure 2.6 defines the criticalshear area used in calculations of punching shear stresses in the slab at theperiphery of a column. The punching shear area depends on the sectional dimen-sions c^ and C 2 of the column and the effective depth, d, which appears in allthree dimensions defining this area.
The calculated effective depth at a column where the top reinforcement in theslab consists of #8 and #9 bars is 5.3 in (135 mm). This is obtained by addingto the 4-1/4- in (108-mm) chair height the average diameter of the two bars. If
the effective depth is taken to the centroid of the bars, as defined in section2.1 of the ACI Code [2.1], its value would be 5.28 in (134 mm) or 5.35 in (136mm) depending on which size bar is assumed to be at the top. Considering allthe columns and using both methods of calculation, the effective depth is foundto fall in the range of 4.97 to 5.35 in (126 to 136 mm). These figures will besomewhat less along the sides of columns at the edges of balcony and walkway
7

slabs which are less than 8 in (203 mm) thick. The value of d = 5.3 in (135 mm)is assumed in the subsequent calculations of stresses in the structure (chapter5). Generally, these stresses are somewhat on the low side because the assumedd for the slab is high at most of the columns.
2.4 CONSTRUCTION METHOD
The falsework system consisted of flying forms in the top story to supportfreshly cast concrete in the floor directly above, and wood reshores in thelower stories.
Figure 2.7 identifies the basic components of the flying forms. The assembledform consisted of two or three parallel trusses having a specified lengthobtained by bolting together standard 30-ft (9.2-m) long truss panels and, wherenecessary, 5 ft (1.5 m) and/or 10 ft (3.1 m) spacer panels, as indicated in
the figure. The assembled configuration can be seen in figure 2.8 which showstwo relatively undamaged forms that were recovered from the debris after thecollapse. The trusses were spaced at 10 ft (3.1 m) on center and were cross-braced at vertical chord panel points. The supports were swivel type screwjacks with 4- in (102-mm) square base plates attached to the bottom chords atthe junctions of vertical and diagonal chords. These were spaced at 9'-10"
(3.0 m) on center, or at 5*-5” (1.7 m) on center where a spacer panel of thatsize was used. Standard size Aluma beams (fig. 2.7) were connected to thetrusses across the top chords at 1.6 ft (0.49 m) intervals. The Aluma beamsprojected beyond the exterior trusses by various amounts, depending on the
width of bay in which they were used. The plywood forms were nailed to nailerstrips within the U-shaped top flanges of the Aluma beams (fig. 2.7).
Figure 2.9 shows the overall layout of the shoring system. Circled lettersand numbers designate transverse and longitudinal column lines, respectively.The columns are located at the junctions of these lines and are shown as
solid rectangles. To form a floor required the use of nine flying forms,all of which were laid out in the transverse (east-west) direction. The flyingform assemblies consisted of three parallel trusses each, except in the case ofbay DE, where only two trusses were used. The flying forms had four differentconfigurations. These are identified by the letters A, B, C and D, enclosedin hexagons. The location of the screw jacks are designated by solid circles.The hollow squares designate reshores used in the lower stories. These were4 x 4 in (102 x 102 mm) nominal, 3-1/2 x 3-1/2 in (69 x 69 mm) actual, whitepine single posts. They were installed using wooden wedges at the bottom.Ellis type wood shores were used to support narrow filler form strips alongthe transverse column lines between the edges of adjacent flying forms.
Unless otherwise noted, the following sequence of construction is based onconstruction schedules supplied by the general contractor and on workerstatements
.
Figure 2.10 shows a typical forming schedule for the upper stories. Construc-tion progressed at the rate of one story per week, according to the followingcycle. The south half of a particular floor slab was cast on a Tuesday. The
placement of steel bars in the north half of the slab and casting of the columns
8
over the south half were carried out the next day, or Wednesday. On Thursday,the columns in the south half were stripped, the north half of the slab wascast and the forms below the south half of the slab were lowered. On Friday,the forms in the south half were replaced by reshores and flown to the same
location in the story directly above, and the columns over the north half werecast. The following Monday, the columns in the north half were stripped, the
steel bars in the south half of the slab above were placed, and the flying formsbelow the north half were lowered, replaced by reshores, and flown to the storydirectly above.
Figure 2.11 shows the various casting and stripping dates and the ages of thecolumns and floor slabs relative to the time of the collapse. In the case ofincomplete information or conflicting witness statements regarding the date ofa particular event, a question mark appears next to the specified date in thefigure. Note that, unlike the lower story slabs, the roof slab was scheduledto be cast in one day. At the time of the collapse, all but the two north baysof the roof slab had been cast.
The flying forms were flown out of the west side of the building where themobile crane was located. The forms under the fifth floor slab were all flownthe same day proceeding consecutively from south toward north. The procedurefor removing forms is reconstructed on the basis of worker statements and veri-fied against that recommended by the supplier. It consists of four steps asfollows: (1) the form is lifted hydraulically at the four corners, (2) thescrew jacks are then loosened and folded, (3) the form is lowered on rollersand moved out gradually, and (4) the portion vacated by the form is reshored.
Figure 2.11 shows full reshores in the second through fourth stories. A fullyreshored story conforms with the reshoring layout shown in figure 2.9. Thereis sufficient indication from worker statements to assume that the fourth storywas fully reshored at the time of the collapse. Likewise, it is known thatthere were no rehores in the first story with the exception of some peripheralreshores under the balconies and walkways (see sec. 3.3 and fig. 2.11).Although there is a question as to when the first story reshores were removed,they would have been recovered for reuse when the fourth story forms were flown.Note that the removal of reshores from the first story marks the first timewhen the forces in the total shoring system will no longer have a direct pathindependent of the columns to the foundation (slab on grade, in this case).
Based on worker statements (see section 3.3) and photographic evidence, thereis some doubt as to whether the third and second stories were fully reshoredat the time of the collapse. According to one worker account, only two linesof reshores were used in each bay of the second story. This would make thenumber of reshores in that bay about two-thirds that of a fully reshored story.Other accounts mention cracked reshores in the fourth story being replaced byreshores removed from the lower stories, or reshores being taken out to allowmasonry work to proceed, etc.
Figure 2.12 is a partial view of the east facade of the building between thesouth stairwell and the elevator tower. Because the building was viewed fromthe northeast side, it is possible to identify all the columns on column lines C
9
and D, as indicated in the figure. Within the third story, it is shown, bymeans of the superimposed graphics in the figure, that the projected spacebetween columns Cl and D3 (the distance between Cl and D3 in the figure) shouldbe occupied only by eight reshores within bay CD, assuming that story is fullyreshored. From figure 2.12 and the closer view shown in figure 2.13, the thirdstory appears to be fully reshored at the time these photographs were taken.It also appears that the number of second story reshores is comparable to thatin the third story, although their locations appear to be different. Notingthat the flying forms within the south four bays of the fourth story are inplace, the date of the photographs is placed between March 12 to March 15, or12 to 15 days before the collapse (see figs. 2.10 and 2.11). It is not knownwhether or not any of these reshores were removed in the interim.
Figure 2.14 is an aerial photograph of the building viewed from the southeastside. The direction of the shadows and the presence of the steel reinforcementfor the roof slab indicate the photograph to have been taken on the morning ofMarch 26, or the day before the collapse. The steep angle of the photographconceals the view of interior reshores in the fourth story and below. It isnoted that at the south end only one exterior reshore is in place in each bayof the fourth story while no reshores are in place at the same location in thethird story. This contradicts the reshoring plans supplied by the generalcontractor where two reshores are shown in each bay along the exterior edgesof the slabs. It is possible that some of the original reshores were removedto place masonry units in the third floor, as indicated by worker statements.
Because of the uncertainties noted above, for the purpose of analysis, allthree stories below the fifth floor were assumed to be fully reshored, whileno reshores were assumed within the first story (see fig. 2.11). The effect of
this assumption would make the calculated stresses less critical than if partialreshoring were assumed in the second and third stories.
2.5 EVENTS AT THE TIME OF THE COLLAPSE
The collapse occurred at approximately 3:00 p.m., on March 27. Based on workerstatements, it appears to have been triggered by a failure in the fifth story
slab somewhere in the center portion of the building, and propagated straightdown to the ground. This topic is discussed further in section 3.3.
Figure 2.14 provides a fairly close indication of the stage of construction at
the time of the collapse. In the south end, the exterior walls for the first
two stories were in place and stacks of masonry units were on the third floor.In the north end, construction of masonry walls was completed in the firstthree stories and masonry units were stacked on the fourth floor. Masonryloads are taken into consideration in the analysis of the building (sec. 5.3).
Figure 2.15 shows the location of the workers in the building at the time of
the collapse. Hollow and solid circles designate respectively survivors and
workers killed in the crash. The two workers in the first story were install-ing the framing for the window units. The workers in the third story weremostly masons finishing up the masonry walls in that story. The two survivorsin the fourth story were making leveling adjustments in the formwork, while the
10
third worker near the south bay was cleaning up the debris in that area. The
workers on the roof were engaged in concreting operations for the roof slab.
They were mostly within the two north bays where concrete had not yet been
placed. According to worker statements, no concrete was being delivered to the
roof at the time of the collapse.
Figures 2.16 and 2.17 are photographs of the debris taken in the wake of the
collapse. Figure 2.16 gives a full view of seven bays of the collapsed build-ing. The bays can be identified by referring to the superimposed letterscorresponding to the column lines shown in figure 2.1. Note that many of the
columns, three and four stories high, are still standing, indicating that thesecond to fourth floor slabs had been punctured at the columns on their waydown. A partial view of the flying form in the second bay from the north endcan be seen in the figure. This is one of the two flying forms at the northend (fig. 2.8) that remained relatively undamaged in the collapse because it
was not supporting freshly cast concrete. A partial side view of the sameflying form appears in figure 2.17 which was taken from the west side of thebuilding after the flying form in the north bay had been removed.
2.6 SUMMARY
The following summarizes the information about the design and construction of
the building which were used in subsequent analysis of the collapse. Thedocuments on the collapse were supplied by the OSHA area office in Tampa.
1. Based on construction documents and the superintendent's daily log, the
construction schedule, from the casting of the first floor slab up untilthe day of collapse, was established.
2. Flying forms were used to cast the slabs for the second through fifthfloors at a rate of one per week.
3. Omissions were noted in the structural design calculations. There were nocalculations to indicate that the structure would satisfy the deflectionand punching shear requirements of the ACI Code. The value of effectivedepth of the floor slabs used in the design was not defined explicity.
4. The top reinforcement within the column strips of the slab was supported by4-1/4-in (108-mm) individual high chairs, and this resulted in an effectivedepth about 1 in (25 mm) less than if 3/4 in (19 mm) cover were provided,as indicated in the structural drawings. The lower effective depth reducedthe structural strength of the slab.
5. At the time of collapse, the three stories below the flying forms werereshored. However, it could not be firmly established how many reshoreswere in the second, third and fourth stories. Consequently, for the pur-pose of subsequent analysis, full reshoring was assumed in the three storiesbelow the flying forms.
11
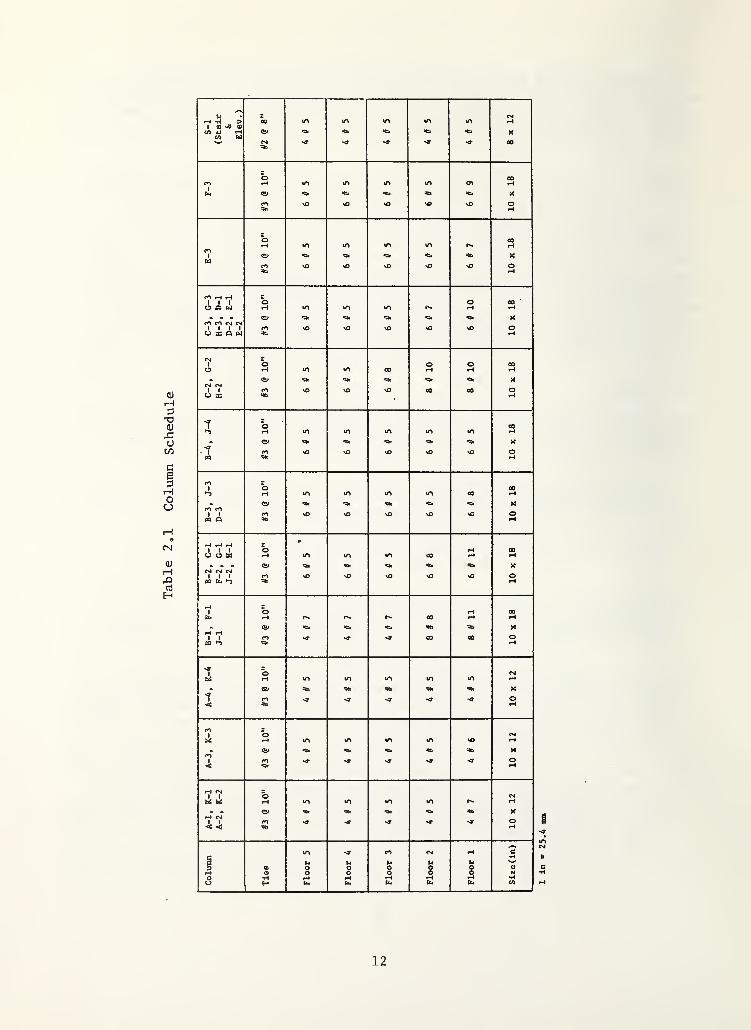
Table
2.1
Column
Schedule
12

INDIVIDUAL HIGH CHAIR (414”)
\

Table
2.1
Column
Schedule
12

I.
j
.I i I . 1 > I.aJ w
Figure 2.1 Top reinforcement layout in typical floor slab
13


INDIVIDUAL HIGH CHAIR (414”)
\
9'

. I . I 1 1 1 1 1.1 -1.J,
Figure 2.2 Bottom reinforcement layout in typical floor slab
14
INDIVIDUAL HIGH CHAIR |4!4”)
D = Bar diameter
Figure 2.3 Configuration of chairs and top reinforcement in column strip
15

Figure 2.4 Field measurement of top bar cover in column strip
Figure 2.5 Field measurement of chair heights for top bars
in column strip
16

— COLUMN
ci +d A v=2d(ci+C2+2d)
A v = Area of Critical Section
Figure 2.6 Area of critical section for punching shear
SPECIAL
NAILER
STRIP
(1
5/8”
x1
9/16”
ACTUAL
DIM
)
18
TYPICAL
PANEL
ASSEMBLIES

19
Figure
2.8
Flying
forms
from
the
two
north
bays
recovered
after
the
collapse
20
Figure
2.9
Layout
of
flying
forms
and
reshores

CONSTRUCTION CYCLE
TUESDAY
WEDNESDAY
THURSDAY
FRIDAY
MONDAY
Cast S(l/2) Slab
Place Steel N(l/2), Cast Columns S(l/2)
Strip Columns S(l/2), Cast N(l/2) Slab, Drop Forms S(l/2)
Set Forms S(l/2) Slab, Cast Columns N(l/2)
Strip Columns N(l/2), Place Steel S( 1/2) , Drop and Fly Forms N( 1/2)
Figure 2.10 Typical forming schedule
LEGEND
NO.
/NO.
:
CASTING
DATE
(month
/day)
(NO.
/NO.)
•
STRIPPING
DATE
(month/day)
(NO)
:
AGE
AT
TIME
OF
COLLAPSE
(days)
00
22
Figure
2.11
Assumed
state
of
construction
at
time
of
the
col
lap

© © © © ©©
2.12 Schematics for determining amount of reshores using
partial view of east side of building

24
Figure
2.13
Partial
view
of
bay
CD
from
east
side
of
building

25
Figure
2.14
Aerial
view
of
building
taken
from
southeast

KILLED
IN
THE
COLLAPSE
SURVIVING
WORKERS
Q.°aop%
•
\ i\l\Ni
,
\ . 1 •
°l\ 4o
o
oo
o
•
N K
ri-i -i \•
i
o• r
\ ° \ \ \° \ \\T3333TTTTa
eg
26
Figure
2.15
Location
of
workers
in
building
at
time
of
the
collapse

27
Figure
2.16
General
view
of
wreckage
after
the
collapse

28
Figure
2.17
View
of
debris
at
north
end
of
building
after
the
collapse

3 SITE INVESTIGATION
3.1 INTRODUCTION
Section 3.2 presents observations and measurements made by NBS during two sitevisits to Cocoa Beach, Florida, and sec. 3.3 summarizes the statements made byindividuals who were interviewed by the OSHA officials during the course of theinvestigation. The first site visit was made on March 28-30, 1981, one dayafter the collapse, and the second visit was made on April 7-8, 1981. Duringthe visits, the structural components were examined visually as they wereremoved for rescue operations, selected key components were identified andmarked with paint for later removal of drilled cores, and measurements of memberdimensions were made.
3.2 INVESTIGATION AT THE SITE
A thorough inspection of the undisturbed wreckage for possible clues as to the
cause of the collapse was ruled out during the rescue operation, which involvedover 200 people and was not completed until the morning of March 29. Instead,a substantial number of photographs were taken before and during the removalof debris. The stacked configuration of the second through fifth floor slabs(as seen in figure 2.17) showed no evidence of sidesways or overturning. Exam-ination of the debris and photographs did not provide any further clues thanthose supplied by workers as to the exact location of the origin of the collapse.
In order to carry out rescue operations, the floor slabs were cut into
approximately 20 ft (6 m) square pieces by air hammers and removed by mobilecranes. All slab layers (2nd, 3rd, 4th, and 5th floor) were removed in thismanner. Some of the slab sections and columns were salvaged and their locationin the building was identified (figure 3.1). They were the source of core sam-ples which were subsequently tested for ingredient content and compressivestrength (chapter 4). The slab sections were also used to determine size andlocation of reinforcing bars and support chairs (sec. 2.3).
Careful examination of a number of column pieces revealed the following:
1. The slabs broke away from the columns at the slab-column interface(figure 3.2).
2. One or two bottom slab bars were placed through some columns. In manyother columns no such evidence was noted.
3. In some cases, the vertical reinforcement above the floor level was bent
severely during fabrication (figure 3.2).
4. Column size measurements agreed with the structural drawings.
It was also noted from the first-story column sections still standing on the
ground level that where 8- # 10 or 8- # 11 bars were lapped, in a 10 x 18 in
(250 x 460 cm) column section, the total steel area exceeded considerably the
maximum limit of four percent of the gross area of the concrete allowed by the
29

ACI Code [2.1]. As shown in figure 3.3, the vertical reinforcement was socongested that there was hardly any space left between adjacent bars to allowthe flow of concrete during placement.
The slab thickness was measured at several locations where concrete cores weretaken. In all cases, the thickness was within +1/8 in (3 mm) of 8 in (200 mm).Further data on slab thickness were obtained from measurements of the lengthsof the core samples (chapter 4). These measurements confirmed the agreement ofthe slab thicknesses with the construction drawings.
The onsite batch plant, located southeast of the building, had a singlecompartment hopper into which a front-end loader deposited both coarse andfine aggregate. The cement was weighed by a separate hopper. The onsite batchplant was equipped with large tanks containing the various admixtures that wereadded to the concrete. Smaller admixture tanks on the west side of the build-ing contained the superplasticizer that was added prior to discharge of theconcrete truck.
The weighed materials were deposited into a 15 cubic yard (11.5 m^) ready-mixconcrete truck for mixing and delivery to the discharge point adjacent to thebuilding under construction. The distance of travel of the truck between the
onsite plant to the discharge point was about 150 yd (137 m)
.
Samples of concrete-making materials were obtained from the onsite plant andfrom the ready-mix plant which also supplied concrete for the project. Somesamples were sent to a testing laboratory for analysis, and others were sent to
NBS for use in making concrete mixtures (see chapter 4).
3.3 INTERVIEW STATEMENTS OF WORKERS
As part of the investigation, OSHA compliance officers interviewed workers andothers who were involved in the construction of the building. The statementsobtained from the interviews provided valuable information which served as
source documents in reconstructing the events prior to the collapse. This sec-tion summarizes their contents pertinent to the investigation. These includethe location of reshores on the day of the collapse; deficiencies encounteredin the performance of the building as it was being constructed; quality of theconcrete; and eyewitness descriptions of the collapse. In the following sec-
tions, the numbers in parentheses refer to numbers assigned to the interviewstatements
.
3.3.1 Location of Reshores
One of the critical elements in the determination of the cause of the collapseis the location and number of reshores in the building at the time of the
collapse. The interview statements contained conflicting testimony. Four
employees (#7, #50, #53, #65) stated that reshores were in position on the
second, third, and fourth floors. On the other hand, others (#8, #9, #12, #22,
#25, #40) indicated that there may not have been the full amount of reshores on
the second and third floors. One of the workers (#8) claimed that reshoreswere removed from the lower floors for use on upper stories, but it was also
30
stated (#39) that enough posts were put into the building to fully reshorethree floors. Other workers (#6A, #8, #37, #40) said they saw masons removesome posts or saw posts fall down which were not replaced. These statementswere contradicted by others who said the masons did not touch the posts whileplacing concrete block walls (#63) or that posts were periodically replaced(#7).
Several workers (#7, #10, #18, #22, #24, #32, #44, #45) stated that they sawbowed reshores and two workers (#32, #44) saw two reshores on the fourth floorbreak or fall while concrete was being placed on the roof.
According to a supervisory worker (#7) there was no reshoring plan to follow,and one of the superintendents directed him to change from two to three rows
of reshores per bay for the third floor and above. There were only two workerswho described how the reshores were installed (#45, #53); the reshores wereheld in position by wedges inserted between the floor slab and the reshores.There is no indication that the wedges were driven in so as to lift the slaband relieve its self weight.
In summary, based on the personal interview statements, it is not possible to
determine firmly the reshoring layout at the time of collapse. The fourthfloor probably contained the full number of reshores as indicated on the
reshore drawing supplied by the general contractor after the collapse. Thefirst floor probably contained no interior reshores (some shores were probablypresent along the balcony and walkway beneath the block walls placed on thesecond floor) . The precise number and locations of reshores which existed onthe second and third floors is unknown.
3.3.2 Construction Deficiencies
There were many statements by workers of different trades concerning theexistence of cracks in all the slabs. The testimonies indicate that the crackswere noticed shortly after the flying forms were removed and that they werelocated around the columns and near the midspans. These cracks were markedwith crayon by one of the superintendents. On March 10, 1981 the structuralengineer inspected the building; the second and third floors were in place bythat time. According to one of the superintendents, the engineer suggestedthat additional reinforcing bars be added in the midspan of the walkways.Similar cracks subsequently developed in the fourth and fifth floor slabs. Aworker (#34) described them as "spider cracks," and reported that upon removingplumbing sleeves from floor slabs, the cracks could be seen extending to a
depth of 4 to 5 in (102 to 127 mm) into the slabs.
In addition to the cracks, it was reported that noticeable deflections occurredin the slabs after the forms were removed. According to one of the superinten-dents, the deflections were most evident in the north and south end apartmentunits; on the second floor, a deflection of 1-3/4 in (45 mm) was noted in theend apartment on the north side of the building.
Four employees (#2, #4, #38, #63) mentioned another significant problem whichoccurred during construction. During placement of the roof, a water puddle
31

formed on the east side near the elevator tower, indicating that a low pointexisted. Additional concrete (an unspecified quantity) was added to thedepressed area but it was reported (#2, #4) that the water puddle reappearedafter refinishing the area. Apparently (according to #38 and #63), the sameproblem occurred at the same location during placement of the fourth floor.
Three workers (#40, #45, #73) mentioned that the construction joints at themiddle of the building were not of good quality. They were described as"ragged", "cracked", and "honeycombed". Two workers (#45, #14) mentioned thatthey saw rebars showing on the faces of some columns. The incomplete fillingof the column forms was probably due to congestion of steel (see figure 3.3),which, according to a supervisor (#72) was so severe in some of the second andthird floor columns that the top reinforcing steel in the slabs could not passthrough. In order to pass slab bars through some columns, the protruding columnreinforcement was "bunched together" and the slab bars were placed alongsidethe column bars (figure 3.2).
3.3.3 Quality of Concrete
The concrete for the building was supplied by an onsite batch plant operatedby the general contractor and by a ready-mix company. According to the onsitebatch plant operator (#67), the ready-mix company supplied about one-third ofthe concrete used in the floor slabs. All of the concrete for the columns camefrom the onsite batch plant. Chapter 4 will contain more details of the mixproportions and the results of strength tests by the testing laboratory. Inthis section, workers' impressions of the concrete quality is presented.
Based on the Department of Professional Regulation's report and the diaries of
the construction manager and the general contractor's superintendent, it wasdetermined that the developer's superintendent, who usually oversaw the batchplant operation, was absent from February 2, 1981 until March 9, 1981. Duringthe week of March 2, 1981, the general contractor's superintendent was also onvacation. A worker (#4) stated that during the placement of the second andthird floors, the concrete appeared to have erratic slump; he estimated thatthe slump varied from three to nine inches. Referring back to the constructionschedule (section 2.4), it is seen that the third floor was placed while bothjob superintendents were absent. The same concrete finisher stated that thetexture and slump became more consistent after the developer's superintendentreturned to the job site.
Several workers (#37, #74, #22, #34, #63) who talked to masons mentioned thatsome of the concrete was difficult to finish and tended to set up quickly.This may be attributed to the slump loss [3.1] associated with the use of
superplasticizers (which was added to the concrete in the trucks prior to
placement). Apparently on some batches with lower than normal water contents,it was necessary to add more than the usual quantity of superplastercizer to
produce the proper consistency for placement (see section 4.2). By the time
finishing operations were performed, the workability was reduced due to slump
loss; during finishing the concrete reflected its low water content. Accordingto the statements of two workers (#34, #74), this problem occurred only withthe concrete prepared on site.
32

3.3.4 Description of the Collapse
Descriptions of the collapse were provided by 28 persons, 13 of whom werelocated in the building. Ten of those in the building who described the col-lapse were on the roof, one was on the fifth floor, another on the fourth, andone on the third floor. The remainder were on the ground at various locationswith respect to the building.
According to those on the roof at the time of the collapse, concrete was beingplaced at approximately column line H (see figure 2.1). Thus, the two flyingforms at the north end of the building did not have concrete on them. Oneworker (#4) said he had felt the building tremble two or three times during theday without any apparent reason. He was on the form between column lines H andJ and near the west side when the collapse occurred, and he described the ply-wood as tilting toward the south and east. He described the fall as "one longslide with one thump." Another worker (#7), who was also on a dry form, statedthat his "feet were suddenly knocked out from under" him and noticed that thefinishing crew had fallen to a lower level. An employee (#18) working 50 to
60 ft (15 to 18 m) south of the finishers heard a rumble and saw the roof cav-ing in at the position of the pour; the "wave" moved toward him as he turnedaway toward the south. Other witnesses (#2, #6, #26, #38) also indicated thatthe apparent origin of the roof collapse was in the vicinity of the boundaryof freshly placed concrete, i.e., column line H. A worker (#26) who rode downon the dry form near the north end stated that he "could see that the middle ofeach floor gave way as each floor was collapsing."
A person working on the fifth floor (#8) said he heard a "pop” about 5 to 10
minutes prior to the collapse. He was standing near the center of the buildingnear column line H when "the fifth floor fell out from under" him. He furtherstated that "the floor fell straight down with slight hesitation at the fourthand third floors."
A worker on the fourth floor (#74) also believed the collapse originated inthe middle of the building but could not say which floor fell first. However,he stated that he didn’ t think it was the top floor otherwise he would havebeen "hit on the head." A person (#3) on the third floor who was working on a
block wall near column line F stated that he "heard a crack overhead, looked to
the southeast and saw a big hole and it was coming towards him." He furtherstated that he tried to run but the floor fell out from under him.
A person (#22) who was working at the garage northeast of the building offeredthis account of the collapse: "I heard a crack and the center of the fifthfloor started down followed by the rest of the floor, and then the fourth,third, and second floors right on top of each other with the roof of wet con-crete following. The floors appeared to slide right down around and over the
columns." The same general description was also supplied by others on theground (#15, #25, #27, #29, #40). An employee (#29) who was at the northwestcorner of the building stated that "the fifth floor, about the second set ofcolumns from north end of floor gave out and the building came down." A worker(#40) who was north of the building also described hearing a crack and seeing
33

the fourth and fifth floors coming down to meet the third floor; he also sawthe middle of the building "go in" first.
Different descriptions were provided by persons at other vantage points. Aworker (#39) who was on the northwest side near the second bay from the northend he stated: "I saw the extreme northwest corner of the fourth floor nearthe columns starting to fall, tilting eastward, then the rest of the fourthfloor fell, then the fifth floor and the flying forms caught up with the fourthfloor and the whole building collapsed."
A person (#42) working north of the building said he heard a loud crack likewood splitting, looked up and saw the flying form going down while the fifthfloor was still in place. Another laborer (#43) who was 50 ft (15 m) away andwalking toward the northeast corner, heard cracking noises and witnessed thesouth end of the building at the top falling first toward the north followedby the collapse of all the columns.
3.4 SUMMARY
Based on the site visits, the following conclusions were drawn:
1) The failure mode appeared to be of the punching- shear type, because theslabs had broken away from the columns at the slab-column interfaces.
2) There was no evidence that sidesway or overturning of the building hadoccurred
.
3) Measurements of the outside dimensions of selected column and slab sectionsindicated conformity with the structural drawings.
4) The reinforcing steel in some first-story columns did not meet the clearspacing requirements of the ACI code.
The worker interview statements gave valuable information on the circumstancesprior and up to the collapse, and provided eyewitness accounts of the failure.The following were some of the significant findings from these statements:
1) It was not possible to establish the exact layout of reshores at the timeof collapse. The first floor appears to have had only a few exteriorreshores in place, and the fourth floor probably had the full amount ofreshores. Conflicting statements were given as to the number of reshoreson the second and third floors.
2) Extensive cracking occurred in floor slabs when supporting formwork wasremoved. The structural engineer was made aware of this problem.
3) The concrete produced by the onsite batch plant was non-uniform in termsof consistency and finishability . The greatest problems were reportedduring the absence of both job superintendents.
34

4) Descriptions of the collapse by workers on the site indicate that the mostprobable origin of the collapse was in the fifth floor slab in the vicinitybeneath where the roof concrete was being placed.
35

36
section
of
the
fourth
floor

37
Figure
3.2
Severely
bent
column
reinforcement

38
Figure
3.3
Congested
reinforcement
in
a
first
-story
column

4. LABORATORY INVESTIGATIONS
4.1 INTRODUCTION
The objective of the laboratory investigations was to establish the strengthof concrete in the structure at the time of the collapse. The approach usedinvolved gathering data from the site and preparing concrete mixtures represen-tative of the inplace concrete. A commercial testing laboratory was contractedby OSHA to carry out tests on concrete cores from the site. This laboratorytook drilled core samples from identified portions of the structure as directedby NBS. The cores were used for compressive strength tests, petrographic exam-ination, and chemical analysis. In addition, samples of the ingredients usedin the concrete were taken and subjected to physical and chemical analyses.
Based on the available mix design information, three concrete mixtures wereprepared at NBS from which specimens were cast for strength testing at specifiedages. The results of these tests were compared with the core strength data.
Section 4.2 discusses the information provided by OSHA dealing with theprescribed concrete mix proportions and the results of quality control testsperformed on the concrete.
Section 4.3 summarizes the results of tests conducted on samples of concreteingredients and drilled cores taken from the site after the collapse.
Section 4.4 presents the results of the NBS laboratory investigation. Thisincludes the strength-gaining characteristics of the concrete mixes, and thepredicted strengths of various portions of the structure at the time of collapse.
4.2 INFORMATION ON FIELD CONCRETE
OSHA interviewed the onsite batch plant operator (Univel) and the president of
the ready-mix company (Dixie) to determine the mix designs that were beingfollowed. Table 4.1 shows the stated mix proportions (saturated surface drybasis) for one cubic yard of 4000 psi (27.6 MPa) concrete. The onsite batchplant used the same proportions for the floor slab and column concrete, exceptthat 3/8 in (10 mm) maximum size aggregate was used for the columns, whereas3/4 in (20 mm) maximum size was used for the slabs. The ready-mix plant onlyprovided concrete for the slabs and used 1 in (25 mm) maximum size aggregate.All mixtures contained an air entraining agent (AEA) and a water reducer/setretarder (WR/SR). In addition, a high range water reducer (HRWR) ,
or super-plasticizer, was added by the general contractor prior to discharge from the
concrete truck mixers. According to the onsite batch plant operator, 2 gal* of
superplasticizer were added to 10 or 11 cubic yard* trucks and 1-1/2 gal wereadded to 9 cubic yard trucks. A waterproofing admixture was added along with
* 1 gallon = 3.785 x 10“3 m3
1 cubic yard = 0.7645 dP1 ounce = 2.457 x 10~^ m^100 pounds = 45.36 kg
39

superplasticizer to concrete placed for balconies and walkways. The dosagereported by the batch plant operator was 4-1/2 to 5 gals per truck. The manu-facturer's recommended dosage for these admixtures were as follows: AEA, 3/4to 3 oz per hundred pounds of cement; WR/SR, 5 to 8 oz per hundred pounds ofcement; HRWR, 15 to 20 oz per hundred pounds of cement.
The ready-mix company had a computer-controlled batch plant and employed amoisture meter in the sand bin. The onsite plant did not make moisture contentdeterminations, and based aggregate weights on assumed moisture contents of 1
percent and 3 percent for the coarse aggregate and sand, respectively.
Based on the available testimony, it appears that water was added until theconcrete reached a slump in the range of 3 to 5 in (76 to 127 mm) . The batchplant operator stated that he performed slump tests on the first two truckseach day, but made no record of these values. Additional water had to beadded to mixes that "tightened up" in the mixer, possibly due to absorption ofwater by the highly absorptive stone when it was mixed in a dry condition.
Daily reports of the onsite batch plant indicated: the size of the batches;the type of concrete; the truck number; the batch weights of cement, sand,coarse aggregate, water reducer and air entraining agent. The quantities ofingredients shown on the reports agreed with the quantities called for in the4000 psi (27.6 MPa) mix design. However, in most of the reports, the columnlabeled "Gals. Water" contained no entry of the quantity of water added. Whenthe quantity of water was reported, it was observed that widely different quan-tities were reported for batches of the same size. This may reflect changes inthe moisture content of the aggregates, or that dissimilar concrete mixtureswere being produced . There were no copies of the delivery tickets of theready-mix concrete.
The general contractor employed a testing laboratory to inspect samples ofconcrete prior to placement and prepare standard 6 x 12 in (152 x 305 mm)cylinders for quality control testing. On the days of floor slab placement,samples were taken from one truck from the ready-mix plant and one truck fromthe onsite plant. Concrete used for the columns which was supplied by theonsite plant was not sampled. Table 4.2 summarizes the information containedin the test reports: the first column indicates the date and time of sampling;the second and third columns indicate the supplier and where the concrete wasplaced, respectively; the fourth column is the slump, which was measured afterthe addition of the superplasticizer; the fifth and sixth columns give the testage and compressive strength of the cylinders; and the last column indicatesthe quantity of superplasticizer added. Note that only one cylinder was testedat early ages, while two were tested at 28 days. Some 28-day strengthsapparently exceeded the capacity of the testing machine and may account for the"+" after some strength values.
A study of table 4.2 reveals several significant facts. The typical slump wasin the range of 8 to 10 in (203 to 254 mm) except for samples of the onsiteplant concrete taken during the placement of the north half of the secondfloor and both halves of the third floor. One might infer that these sampleshad lower than normal water content, and this is borne out by the very high
40

early strengths of the corresponding cylinders. Both job superintendentstestified that the early age strength results were used to determine if suffi-cient strength had been reached for form removal. They testified that formswere removed only if the cylinder strength exceeded 2/3 to 3/4 of 4000 psi
(27.6 MPa). In general, the reported test ages agree with the formwork removalschedule. However, it appears that the fifth floor samples were not tested
at ages corresponding to the formwork removal times. The practice of usinglaboratory-cured cylinders intended for quality control testing for the pur-poses of scheduling formwork removal may be an unsafe approach if the inplacematurity (see section 4.4.3) at test age is less than the maturity of the con-trol cylinder. Finally, only three test reports give the quantity of plastic-izer added to the mixes, and in each case it exceeded the quantity specifiedby the batch plant operator. This may indicate that these mixes had lower thanaverage initial slumps and that more admixture was required to produce thetypical 8 to 10 in (203 to 254 mm) slump.
The strength and age data in table 4.2 are shown in figures 4.1 and 4.2 for theonsite plant and ready-mix concretes, respectively. Also shown are the bestfitcurves to represent the data. In figure 4.1 two curves are shown, the solidcurve includes all the data, while the dashed curve excludes those data of thelow slump samples for the north half of the second floor and both halves of the
third floor. In general, these data indicate that the 28-day strengths are con-sistent with the specified strength of 4000 psi (27.6 MPa). However, samplesof concrete from the fifth floor are weaker than samples from other floors.
4.3 TESTS OF SAMPLES FROM THE SITE
A commercial testing laboratory was retained by 0SHA to secure samples from the
site and carry out the pertinent tests. This section summarizes the informationobtained from the report of the testing labortory
4.3.1 Concrete Ingredients
Samples of cement, aggregates, water, and admixtures were secured from theonsite plant and from the ready-mix plant. Appendix A contains the reportedresults of physical and chemical tests on the samples. Table A.l shows the
physical characteristics of sand and coarse aggregate samples. The coarseaggregates had higher than typical absorption capacities for normal weightaggregates. The sands were finer than typical concrete sands, and the coarseaggregates did not, in general, have uniform particle size distributions whichmay explain some of the finishing difficulties mentioned in section 3.4.3.
The results of chemical analyses of cement samples are presented in table A. 2.
Except for differences in setting times, there were no significant differencesbetween the samples from the two batch plants. The samples meet the require-ments of ASTM C150 [4.1] for Type I cement. Because samples were taken onlyafter the collapse, it is not known whether all cement in the structure agreedwith the results in table A. 2.
41

Tables A. 3 and A. 4 show the results of tests on water and admixture samples.Although a pond water sample was chemically analyzed, there were no indicationsfrom the available data that pond water was used in the concrete.
4.3.2 Core Strength
Core samples were drilled from column and slab sections from April 1 to
April 3, 1981. Some cores were used for compressive strength determinationsand others for petrographic and chemical analyses. Table 4.3 indicates theidentification numbers and locations in the structure, as identified by NBS,of six column sections and 14 slab sections from which cores were drilled.Also shown are the number of cores tested in compression from each section.An attempt was made to obtain at least six strength values from each floorlevel in the structure.
The cores from each part of the structure were tested at three ages: soonafter core samples were obtained and at seven and 14 days subsequent to thefirst test. The samples were stored in plastic bags to preserve the inplacemoisture conditions until tested. Table A. 5 gives the dimensions, ages andstrengths of the tested cores. The cores had nominal 2, 3, and 4 in (51, 76,and 102 mm) diameters. The reported compressive strengths include the standard(ASTM C 42 Standard Method of Obtaining and Testing Drilled Cores and SawedBeams of Concrete) correction factors for cores with an aspect ratio less thantwo [4.1]. Figure 4.3 shows the floor slab core strengths as a function oftheir test ages. Cores from the south half are identified by a shaded symbol.Except for two 23-days old cores from the south half of the fifth floor (and aseverely damaged core from slab section 13), the strengths were greater thanthe specified strength of 4000 psi (27.6 MPa). However, all cores (except thedamaged one), satisfy the "85 percent of specified strength" criterion in
section 4. 8. 4. 4 of the ACI Code [2.1].
Figure 4.4 shows the compressive strengths of cores drilled from columns. Sinceit was not known whether the column sections were from the north or south halvesof the building, the age shown in Figure 4.4 is the average age of the north andsouth columns on each floor. It is evident that the concrete in the columns wasweaker than that in the floor slabs. The average strength of the fifth storycores does not satisfy the ACI Code strength criterion mentioned above.
The lengths of unbroken cores from the slab sections had an average value of
8-1/16 in (205 mm) with a standard deviation of about 3/16 in (5 mm). Fourcores were about 6-1/2 in (165 mm) long which indicates cores from the walkwayor balcony areas.
4.3.3 Petrographic Analysis
Nineteen 6 in (152 mm) diameter cores were used for subsequent petrographicand chemical analyses. Eleven cores were from column sections and eight fromslab sections as indicated in table 4.3. Polished sections were examined witha stereo-microscope according to ASTM C 856 (Standard Practice for PetrographicExamination of Hardened Concrete [4.1]. The polished sections were also exam-ined according to ASTM C 457 (Standard Practice for Microscopical Determination
42

of Air-Void Content and Parameters of the Air-Void System in Hardened Concrete)
[4.1], from which the volume fractions of paste, sand, coarse aggregate and airwere measured. In addition, specific gravity, percent absorption and percentvoids were measured according to ASTM C 642 (Standard Test Method for SpecificGravity, Absorption and Voids in Hardened Concrete) [4.1].
Table A. 6 in appendix A gives the results of the above analyses for each core;
these results are summarized in table 4.4. For quantitative determinationsthe numbers in table 4.4 represent the average values and the numbers withinparentheses are the standard deviations of the averages. The similarity of
the slab and column cores in terms of percent volumes of the ingredientsconfirms the statements that the same mix proportions were used in the columnsand in the slabs. An unexplained finding is the color of the cement paste:most of the fifth floor cores were gray, while the cores from the other floorswere buff colored. The columns had slightly higher air content than the slabs,but in each case the air bubbles were characteristic of entrapped air (largesize, large spacing) rather than entrained air. This phenomenon is consistentwith a reported effect of superplasticizers [3.1].
4.3.4 Chemical Analysis
In addition to petrographic analysis, the core samples were used for chemicalanalyses to determine cement and admixture content. Analysis for cement wascarried out in accordance with ASTM C 85 (Standard Test Method for Cement Con-tent of Hardened Portland Cement Concrete) [4.1]. However, it is recognizedthat the method is imprecise when the concrete contains significant amounts ofcalcareous aggregates, which is the situation in this case since the coarseaggregate was calcareous and the sands also contained shell fragments. Separatetests were performed on samples of fine and coarse aggregates so that an allow-ance for the lime in the aggregates could be made when computing the cement con-tent. Cement analyses were performed on seven column cores and six slab cores.The calculated cement contents, expressed as percentages of the unit dry weightsof the concrete samples, are given on the last line of table A. 6. Using theweight percent of cement and the corresponding dry specific gravity of eachsample, the cement content was expressed in pounds per cubic yard of concrete.These quantitites are given in table A. 7 of appendix A, and the average valuesare given in table 4.5. Using the volume percentage of paste (table A. 6) andcement content, the approximate water content was calculated and the values areshown in table A. 7, while the average values are given in table 4.5. Likewise,using the percentage volumes of sand and coarse aggregate, and their correspond-ing specific gravities (saturated surface dry), the weights of sand and coarseaggregate per cubic yard of concrete were calculated. Table 4.5 also shows theaverage aggregate contents for the column and slab cores.
Study of table 4.5 revealed the following points: (1) The calculated weightsof sand and coarse aggregate are in excellent agreement with the quantities of
the mix designs shown in table 4.1. (2) The calculated cement contents aresignificantly lower than the mix design values. (3) The calculated averagewater cement ratios are 0.65 and 0.72 for the columns and slabs, respectively.The low cement contents and corresponding high water-cement ratios are incon-sistent with the core strengths. It is highly improbable that these high water
43

cement ratios would result in the strengths shown in figures 4.3 and 4.4. Thisleads one to suspect that the calculated cement contents are not precise.
In addition to cement content analyses, the cores were examined for theiradmixture contents. The general procedure involved making reference samples ofconcretes with different admixture combinations; then, a solution of calciumcarbonate was used to extract the admixtures from the samples; finally, theextractions were analyzed by infrared spectrometry and a comparison was madebetween the reference samples and samples from the cores. The procedure isbest suited for sulfonated admixtures which include the water reducer/ setretarder and superplasticizer that were used on the job. Table 4.6 summarizesthe results of the analyses. The cores are identified in terms of their loca-tion as described in table 4.3. The quantities of admixture are expressed asa percent of the weight of concrete. According to the infrared analyses, thecore samples had signature spectra that corresponded with reference samplesmade with the water reducer/set retarder or with a combination of superplastic-izers (HRWR) and accelerating admixture. At the bottom of the table are shownthe quantities of the admixtures used in the laboratory mixes (to be discussedin the next section) representing the ideal mix designs, and the manufacturer'srecommended dosages for a cement content of 530 lbs per cubic yard (315 kg perm3) .
There are several contradictions between table 4.6 and the information obtainedfrom the site. First is the appearance of the accelerating admixture, whichaccording to the onsite batch plant operator was not used in the columns orfloor slabs. For the columns, the measured quantities of water reducer/ setretarder are greater than the mix design values for the onsite plant. For thefloor slabs, the measured quantities of superplasticizer and accelerator are in
general lower than the mix design values.iSome cores from the fifth and fourth
floors had higher than expected quantities of water reducer/set retarder.
In summary, some of the chemical analysis results contradict or areinconsistent with other information. It is difficult to conclude whether suchdifferences are real, or whether they are due to the difficult nature of the
chemical analyses and the inherent uncertainties in the results.
4.4 NBS LABORATORY INVESTIGATION
The purpose of the NBS laboratory investigation was to establish the strengthof the concrete in the structure at the time of the collapse. This was to beaccomplished by developing the strength-maturity relations of the column andslab concretes. In addition, it was necessary to determine the elastic moduliof the concretes for inclusion in the structural analyses of the structure.Finally, it had to be established whether the concretes had typical tensilestrength properties.
4.4.1 Sample Preparation
Samples of aggregate, cement, and admixtures were obtained from the onsitebatch plant and from the ready-mix plant. These materials were used to prepare
44

the concrete mixtures to be discussed. The original plan called for thepreparation of concrete batches according to the stated mix designs as indi-cated in table 4.1, and if necessary, for the preparation of mixes accordingto the results of the petrographic and chemical analyses of the core samples.Thus, three mixes were initially prepared: Mix I represented the concretesupplied by the ready-mix plant; Mix II, the onsite batch plant concrete for
the floor slabs; and Mix III, the onsite plant concrete for the columns. It
was assumed that the column concrete contained superplasticizer in the sameproportion as the slab mixes.
In order to minimize the quantity of concrete that had to be mixed, 4 x 8 in
(102 x 203 mm) cylindrical specimens were used. However, some 6 x 12 in
(152 x 305 mm) cylinders were made for checking the results of the smallerspecimens. Forty-five, 4 x 8 in (102 x 203 mm) cylinders and seven 6 x 12 in
(152 x 305 mm) cylinders were molded from a 4-1/2 cu ft (0.13 m^) batch ofeach mix. A 9 cu ft (0.25 m^) capacity, revolving drum mixer was used.
Table 4.7 shows the batch quantities used for each mix. Coarse aggregate, sandand cement were placed in the mixer in that order. Water was added in two por-tions, one portion contained the air entraining agent, the other contained thewater reducer/set retarder. The initial quantity of water was less than shownin table 4.7. After a period of initial mixing, a slump test was performed andadditional water was added as needed to achieve a slump of three to five inches.When the desired slump was attained, superplasticizer was mixed into the con-crete and slump, air content and unit weight determinations were made. Asshown in table 4.7, addition of superplasticizer at the dosage rate of 2 galper 10 cubic yards (9.9 x 10”^ m^ per m^) of concrete produced an increase inslump of about 3 in (76 mm) Referring back to table 4.2, which shows the slumpvalues for samples from the job, it may be concluded that in most cases eithermore than the above dosage of superplasticizer was used or the initial slumpswere greater than about 5 in (127 mm)
The air contents of the three mixes are in good agreement with the results ofthe petrographic analyses of core samples (table 4.4). Note that Mix I (repre-senting the ready-mix concrete) contained more air than Mix II (the onsite plantconcrete), which is consistent with the higher quantity of air entraining agentin Mix I. Mix III (containing small aggregate) had the highest air content,which is consistent with the known effect of aggregate size on air content:small aggregates tend to entrap more air in the mix than large aggregates.
When the aggregates were being weighed, samples were taken for moisture contentdetermination. The moisture content values along with the batch weights and
specific gravities, were used to calculate the volume percentages of paste and
aggregates in each mix. Table 4.8 shows the results of these calculations, andfor comparison the values from the petrographic analyses of the cores are alsoshown. There is good agreement between the laboratory mixes and the concretein the structure. Thus, it was concluded that concrete used in the buildingagreed fairly well with the stated mix designs in terms of the relative volumesof paste, air and aggregates.
45

After completing the fresh concrete tests, the cylinder molds were filled asfollows: the 6 x 12 in (152 x 305 mm) molds were filled in the standard mannerusing three layers and 25 strokes of the tamping rod; the 4 x 8 in (102 x203 mm) plastic molds were filled in two layers, and each layer was compactedby striking the outside of the mold 25 times with a rubber mallet. It was feltthat rodding the small specimens would tend to cause segregation of the coarseaggregate toward the bottom of the molds. Specimen preparation was completedabout two hours after mixing was begun.
Since the available information suggests that no special curing procedures wereemployed during construction, the molded specimens were kept in their moldswith the top surfaces uncovered and allowed to cure in the laboratory at anambient temperature of about 70°F (21°C). For comparison, seven 4 x 8 in
(102 x 203 mm) specimens and the seven 6 x 12 in (152 x 305 mm) specimens werecovered with plastic and subsequently cured under water at 70°F (21 °C). Foreach batch, thermocouples were placed in two uncovered small cylinders, in onecovered small cylinder and in one 6 x 12 in (152 x 305 mm) cylinder. Tempera-tures were monitored by a data logger at regular time intervals, and the result-ing data was used to calculate maturity of the specimens when they were tested.
4.4.2 Test Results
The cylinders were used for compression tests according to ASTM C 39
(Standard Test for Compressive Strength of Cylindrical Concrete Specimens) andfor splitting tensile tests according to ASTM C 496 (Standard Test for SplittingTensile Strength of Cylindrical Concrete Specimens) [4.1]. In addition stress-strain curves were recorded during the compression tests of all 4 x 8 in (102 x203 mm) cylinders. The moist-cured cylinders were not tested for splittingtensile strength. Specimens were tested at the following ages: 0.5 days, 1.3days, 3 days, 7 days, 14 days, and 28 days. Figure 4.5 shows the compressivestrength as a function of age. Each point represents the average of threecylinders. The shaded data points represent the average strengths of the moist-cured specimens which were tested at 7 and 28 days. It appears that the methodof curing plays a more significant role on strength development in the weakerconcrete. The results of Mix III were significant. Apparently, the increasedair content and increased water demand of the small aggregate mix resulted insignificantly lower compressive strength than the other mixes.
Table 4.9 compares the average strengths and standard deviations of moist-cured4 x 8 in (102 x 203 mm) and 6 x 12 in (152 x 305 mm) cylinders. The resultsindicate that there were no statistically significant differences between thetwo sizes, and confirm that using the smaller specimens is an acceptablealternative
.
In order to check whether the strength-gaining properties of the laboratorymixes were consistent with the core strengths, the best-fit curves in figure4.5 were superimposed on the core strength versus age data. Figure 4.6 showsthe curves for Mixes I and II compared with the core strengths of the slabconcretes. The agreement is reasonable. The third floor core strengths agreewith the strength development curve of Mix I. The generally greater strengthfor the third floor cores is consistent with the results of the inspection
46

laboratory reports (table 4.2), which showed that the slumps for the onsiteplant concrete used on the third floor were lower than normal. Mix II has a
strength development curve consistent with the core strengths of the second,fourth and fifth floor slabs.
Figure 4.7 compares Mix III with the column core strengths. The laboratory mixis consistent with these core tests.
The overall agreements noted above led to the conclusions that, in general, thelaboratory mixes were representative of the concrete in the structure. Thus,the strength development characteristics of these mixes were used for estimat-ing the inplace strength of various parts of the structure at the time of thecollapse
.
Figure 4.8 shows the increase with age of the secant modulus of elasticity at
50 percent of the ultimate strength for the laboratory mixes. Mixes I and IIgave nearly identical results, while the weaker Mix III was significantly lessstiff. Note that the development of stiffness occurs at a faster rate thanstrength, and the stiffness reaches its limiting value sooner than strength.
The results of the splitting tensile tests were used to determine whether the
tensile strength characteristic of concrete made with the job-site materialswas similar to typical normal weight concrete. Figure 4.9 shows the indirecttensile strength (average of three specimens) as a function of the compressivestrength of companion specimens tested at the same age. Also shown is the
function
ft
= (fc)0 * 73
(*-D
which is known to be a good representation of the relation between splittingtensile strength (f t ) and compressive strength (
f
c )
.
The data indicate thatconcrete made with the materials from the job site would have tensile strengthproperties that are typical of normal weight concrete.
In summary, the three mixes prepared and tested by NBS are in agreement withthe strength of cores from the structure, and it may be concluded that theyare representative of concrete in the structure. As a result, it becameunnecessary to make additional mixes to correspond with the results of the
chemical analyses of the cores.
The next section describes the development of the strength-maturity functionsfor the laboratory mixes, which were used in making in place strengthpredictions at the time of collapse.
4.4.3 Estimated Strength of Concrete at Time of the Collapse
In order to make the best possible estimate of the strength of concrete in the
structure at the time of collapse, the maturity concept was employed [4.2].The maturity concept attempts to represent the combined effects of temperature
and time on the strength development of concrete by means of a single quantity
47
called "maturity", which is calculated from the temperature- time history ofthe concrete.
The premise of the maturity concept is that strength of concrete is a single-valued function of maturity, independent of the actual temperature- time his-tory. Thus, a given concrete possesses a unique strength-maturity relation;and once this relation is established under any particular (but measured)curing history, it can be used to predict strength due to any other curingcondition. For this investigation, the strength-maturity functions of thelaboratory mixes were developed and used to predict the inplace strength.Reference [4.3] provides additional information on the nature of the strength-maturity function of concrete.
As discussed in section 4.4.1, thermocouples were installed in two 4 x 8 in
(102 x 203 mm) cylinders of each laboratory mix. Temperatures were recordedautomatically every hour, from the filling of the molds until the last cylinderwas tested. The average temperature of the two cylinders was used to representthe thermal history of each mix. Maturity was calculated for each test age,and the resulting compressive strength versus maturity data are shown in
figure 4.10. For each mix, least squares curve fitting was used to determinethe curves shown in figure 4.10. Each curve is an hyperbola with the generalequation
Su K (M-Mq )
1 + K (M-M0 )
(4.2)
where, S = compressive strength for maturity MSu = limiting strength as maturity approaches infinityM0 = maturity when strength development is assumed to beginK = slope of curve at Mq divided by Su
The results of the least-squares fit gave 6125, 4870 and 3870 psi (42.2, 33.6,and 26.7 MPa) as the best fit values of the limiting strengths for Mixes I,
II, and III, respectively. The strengths for each mix were divided by theircorresponding limiting strengths, and the normalized strengths were plotted asfunction of maturity as shown in figure 4.11. The equation of the best-fitfunction was found to be as follows:
S = 0.0209 (M-11.4) f4.3Su 1 + (M-11.4)
where maturity is expressed in °F-days. Equation (4.3) was used to estimatethe fraction of ultimate strength in various portions of the structure at the
time of the collapse.
In order to use eq. (4.3), the maturity of the concrete in the structure had
to be established from the inplace temperature history. Since such a historywas not available, an approximation was used. It was assumed that the thermalhistory of the structure was equal to the air-temperature history obtainedfrom Patrick Air Force Base, located about five miles south of the structure.
48

Maturity at the time of the collapse was calculated for each portion of thestructure and the results are given in table 4.10.
Based on the computed maturities, the corresponding values of concrete strengthas a fraction of ultimate strength were calculated according to eq. (4.3).These values are also given in table 4.10. Finally, using the NBS laboratorydata and the core strength information, the relative strengths were convertedto absolute values. The limiting strength of Mix III was assumed to be repre-sentative of the column concrete. While for the slab concrete, the limitingstrength of Mix I was assumed to be representative of the third floor, and the
limiting strength of Mix II was used for the remaining floor slabs. The lastthree columns in table 4.10, give the estimated strengths, rounded off to thenearest 100 psi (0.7 MPa), for the various components of the structure at thetime of the collapse.
4.4.4 Reinforcing Steel Strength
Samples of reinforcing steel were obtained from the site and had the identifica-tion markings of Grade 60 bars. One bar of each size (#4 to #11) was tested inuniaxial tension and the measured yield strengths varied from 61 to 67.5 ksi(420 to 465 MPa). Thus, tests confirmed that Grade 60 steel was used in thestructure as required by the contract documents.
4.5 SUMMARY
Based on the information supplied by OSHA and the results of the NBS laboratorystudy, the following conclusions were drawn relative to the constructionmaterials used on the project:
1) There was insufficient documentation of the quantities of ingredientsused in each batch of concrete.
2) The compressive strength of cores taken from slab sections satisfiedthe ACI Code strength criteria for a specified strength of 4000 psi
(27.6 MPa)
.
3) The compressive strength of cores taken from column sections werelower than the strength of slab cores, and the average strength of the
cores from the fifth floor columns did not satisfy the ACI Code
criteria for the specified strength.
4) Core strength values had high variability.
5) Petrographic analyses of core samples revealed that the volumetricproportions of paste and aggregate were in agreement with the stated
mix designs. The proportions, however, did show high variability.
6) The computed cement contents based on the chemical analysis of core
samples were lower than stated in the mix designs. Since the low
values are inconsistent with the core strengths, it was concluded
that the calculated cement content values were imprecise.
49

7) The strength development curves of the three mixes prepared by NBSwere consistent with the average value of the core strengths.
8) The tensile strength characteristics of the NBS mixes were typical ofnormal weight concrete.
9) The reinforcing steel was Grade 60.
In summary, there are no indications that a gross error was committed in
concrete proportioning that would have resulted in seriously deficient concrete.The high variability of the concrete, as indicated by core strengths and otherdata, is significant and its importance is discussed in chapter 6.
50

Table 4.1. Mix Designs (S.S.D. Basis)Quantities Per Cubic Yard
Ingredient UNIVEL* DIXIE*
Cement* (lbs) 526 545
Sand (lbs) 1178 1230
CoarseAggregate (lbs) 1772 1600
Water (lbs) __ 250
WR/SR (oz) 5.3 28
AEA (oz) 1 .6 4
* Type I
Univel = Onsite batch plantDixie = Ready-mix plant1 lb = 0.4536 kg1 oz = 2.957 x 10“5 m3
51

Table 4.2. Summary of Testing Laboratory Results
SamplingDate (hour) Supplier Floor (N/S)
Slump(in)
Test Age(days)
Strength(psi)
Plasticizer(gal)
2/13 - (800) Univel* 1 (S) 10 7 5260 (1)* *
28 5660+2/13 - (930) Dixie* 1 (S) 9 1/2 7 4500 (1) —
28 56502/19 - (930) Univel TTn) 10 5 3940 (1) —
28 53802/19 - (900) Dixie l 00 8 5 4060 (1) —
28 5660+2/26 - (900) Univel 2 (S) 9 2 3680 (1) 8
7 5310 (1)28 6010+
2/26 - (815) Dixie 2 (S) 7 1/2 2 2020 (1) 3 1/27 4240 (1)
28 5860
2/27 - (920) Univel 2 (N) 4 3 4560 (1) —7 5250 (1)
28 58502/27 - (945) Dixie 2 (N) 9 3 3250 (1) —
7 4360 (1)28 4780
3/3 - (830) Univel 3 (S) 3 3/4 2 4300 —
-
7 5060
28 62603/3 - (840) Dixie 3 (S) 9 l/4 2 3050 —
7 358028 5870
3/5 - (1025) Univel 3 (N) 5 l/2 1 4190 (1) —7 5660+(l)
28 5840+3/5 - (1000) Dixie 3 (N) • 9 1 1450 (1)
7 3760 (1)28 5200
3/10 - (1035) Univel 4 (S) 9 l/2 2 2940 (1) 5
7 4040 (1)28 5050
3/12 - (900) Univel 4 (N) 8 l/2 4 4000 (1) —7 4780 (1)
28 5360 \
3/12 - (845) Dixie 4 (N) 8 1/2 4 3470 (1) —7 4260 (1)
28 52903/17 - (900) Univel 5 (S) 9 1/2 2 2790 (1) —
7 3650 (1)28 4710
3/17 - (945) Dixie 5 (S) 10 2 2640 (1)7 4260 (1)
28 5510
3/19 - (850) Univel 5 (N) 8 1/2 2 2310 (1) —7 3750 (1)
28 47403/19 - (840) Dixie 5 (N) 8 2 1490 (1) —
7 3180 (1)28 4320
3/27 - (230) Dixie R 6 4 3360 (1) Hydrocel*7 4390
28 5050
3/27 - (215) Univel R 8 4 2940 (1) Hydrocel7 3710
28 4600
* (1) Indicates one cylinder tested— Indicates quantity not given in the reportHydrocel is a waterproofing admixtureUnivel is the onsite batch plantDixie is the ready-mix plant1 in = 25.4 mm100 psi «* 0.69 MPa1 gal - 3.785 x 10⁻³ m3
52

Table 4.3. Location and Number of Cores Tested
Number of CoresSectionNumber Location
Comp.
StrengthPetr/ ChemAnalysis
c
0 1C 4th-5th floor 1 2
L 2C 4th-5th floor 2 2
u 3C 5th floor 2 1
M 4C 4th-5th floor 4 2
N 5C 4th-5th floor 2 2
S 6C 3rd-4th floor 8 2
1 5th floor, N.W. Tower, E. side 1
2 5th floor, N.W. Tower, @ 4th Col. 7 1
3 4th floor, N.W. of Tower, E. sidebetween 2 and 3
3
4 4th floor N.W. 2 1
s 5 3rd floor N.W. of Tower, E. side 3 1
L 6 3rd floor 2
A 7 2nd floor East side. North end 3 1
B 8 2nd floor N.E. side of Tower 4
S 9 4th floor 1
10 3rd floor N.W. 1
11 4th floor North12 3rd floor South 6 1
13 4th floor South 5 1
14 5th floor South 6 1
53
Table 4.4. Petrographic Analysis Average Results
Columns Slabs
ASTM C856 (Comments)
Pastecolor buff (4 gray - 7 buff) buff (2 gray - 6 buff)texture medium mediumuniform ok variablehydration ok ok
Voidsentrained slight- some slightentrapped mostly mostlywater gain some instances few instances
Re tempering some instances some instancesCracks none noneAggregate
fine ok okcoarse ok ok
Other - -
ASTM C457 (percent by volume]
Paste 27 (1.9) 28 (2.5)Fine Aggregate 27 (2.3) 27 (1.9)Coarse Aggregate 41 (2.9) 41 (3.6)Air Voids 4.2 (1.1) 3.2 (1.6)Spacing Factor, in. 0.025 (0.006) 0.024 (0.007)
ASTM C642 (after immersionand boiling)
Absorption, % 9.1 (0.6) 8.6 (0.7)Specific Gravity, dry 2.02 (0.02) 2.07 (0.04)Specific Gravity, SSD 2.20 (0.02) 2.25 (0.03)Voids, permeable, % 18.4 (1.0) 17.8 (1.2)
1 in = 25.4 mm
54
Table 4.5. Average of Approximate Material Proportions in Concrete
Column Slab
Cement* (lbs/yd3 ) 483 (29)+ 442 (41)Fine Aggregate (lbs/yd3 ) 1208 (103) 1213 (83)Coarse Aggregate (lbs/yd3 ) 1750 (123) 1743 (149)Water (lbs/ yd3 ) 315 (38) 320 (42)
Unit Weight, SSD,
lbs/ft3** 137.5 (1.4) 139.6 (1.4)Air Voids, % 4.2 (1.1) 3.2 (1.6)Water Cement Ratio 0.65 (0.11) 0.72 (0.15)
Notes
:
+ Standard deviation.
* Cement content determined from ASTM C 85, ModifiedASTM C85 and dehydration to allow for calcareouscoarse aggregate (limerock and calcareous material(shell) present in fine aggregate.
** Unit weight SSD estimate by using bulk SSD specificgravity (ASTM C 642) after immersion and boiling.
1 lb/yd3 = 0.5933 kg/m3
1 lb/ft 3 = 16.02 kg/m3
55

Table 4.6. Results of Admixture Analysis
Core I.D.
LocationSection (Floor)
Admixture(% concrete wt.) WR/SR HRWR ACC.
P01 1C (5) 0.02 X*P02 2C (5) 0.01 X
c P03 3C (5) 0.02 X0 P04 4C (5) 0.01 X XL P05 5C (5) 0.06 Xu P06 1C (4) 0.05M P07 6C (4) 0.08 XN P08 2C (4) 0.06 XS P09 5C (4) 0.09 X
P10 4C (4) 0.02 XPll 6C (3) 0.02 X XP12 1 (5) 0.02 X X
S P13 2 (5) 0.10 XL P14 14 (5) 0.08 XA P15 4 (4) 0.08 XB P16 13 (4) 0.09 X XS P17 5 (3) 0.01 X X
P18 12 (3) 0.01 X XP19 7 (2) 0.02 X
Mix Design:On-site 0.01 0.05 0
Ready Mix 0.06 0.05 0
Manufacture r+ 0.05-0.09
0.11-0.27
0.12-0.37
* An "X" indicates presence of this admixture.+ Quantities based on manufacturer's recommended dosages and assuming
530 lbs of cement per cubic yard (315 kg per m^) of concrete.

Table 4.7. Summary of Laboratory Mixes
Mix I Mix II Mix III
Cement (lbs) 93.6 86.5 86.5Water (lbs) 40.6 48.4 53.1
Sand (lbs) 216 198 198
C. Aggregate (lbs) 278 291 284Moisture Content (%)
Sand 1.5 1.1 1.7
C. Aggregate 2.1 -1.3 -1 .7
Slump (in)
Before HRWR 4 1/2 4 1/2 4 3/4After HRWR 7 7 1/2 7 3/4
Air Content (%) 3.8 2.9 4.9Unit Weight (pcf) 140.2 142.9 136.0
1 lb = 0.4536 kg
1 in = 25.4 mm1 pcf = 16.02 kg/m^
Table 4.8. Calculated Volume Percentages of Ingredients in LaboratoryMixes Compared with Measured Values from Cores
Mix I Mix II
MeasuredSlab* Mix III
MeasuredColumn*
Paste 28.5 27.1 28 (2.5) 27.9 27 (1.9)
Sand 28.7 26.9 27 (1.9) 26.1 27 (2.3)
C. Aggregate 39.1 43.1 41 (3.6) 41 .1 41 (2.9)
Air 3 .8 2.9 3.2 (1.6) 4.9 4.2 (1.1)
* From petrographic analysis of cores from structure. Quanti-ties in parentheses are standard deviations of average values.
57

Table 4.9. Comparison of Compressive Strength of4 x 8 in and 6 x 12 in Cylinders
AverageCompressive Strength*
MixAge
(days) 4 x 8 in 6 x 12 (in)
I 7 5060 (68) 5125 (69)28 5815 (42) 6010 (97)
II 7 4185 (113) 4115 (144)28 5350 (124) 5490 (221)
III 7 3270 (80) 3250 (54)28 4345 (112) 4250 (84)
* Average of three specimens, numberin parentheses are standarddeviations
.
1 in = 25.4 mm1000 psi =6.9 MPa
58

Table 4.10 Estimated Maturities and Strengths at Time of Collapse
Floor PortionApprox
.
Age (Days)
CalculatedMaturity(F-Days)
PredictedS/Su
Strength (psi)Column
Su = 3900Slab
Su - 4900 Su * 6100
C-N* 7 148 0.74 2900
5 S-N* 8 163 0.76 3700C-S 9 192 0.79 3100
S-S 10 213 0.81 4000
C-N 14 305 0.86 34004 S-N 15 329 0.87 4300
C-S 16 351 0.88 3400
S-S 17 375 0.88 4300
C-N 21 467 0.90 35003 S-N 22 492 0.91 4500 5600
C-S 23 520 0.91 3500S-S 24 544 0.92 4500 5600
C-N 27 621 0.93 36002 S-N 28 643 0.93 4600
C-S 28 643 0.93 3600
S-S 29 662 0.93 4600
C-N 35 791 0.94 37001 S-N 36 815 0.94 4600
C-S 39 895 0.95 3700S-S « 969 0.95 4700
* C-N denotes the columns in the north-half while S-N denotes the slab in the north-half;C-S and S-S are the columns and slab in the south half.F-days = 0.555 C-days1000 psi * 6.9 MPa
59

CONTROL
CYLINDER
STRENGTH
CO
qj
fH
!CO
EOu
X3(1)
Unj
aQJ
1-1
a,
CO
nQJ
T3
.5
CO QJ
4-1
QJ *r-l
> CO
•H CCO OCO
QJ QJ
u x:Cu 4J
6O *4-1
o o
I—
I
<r
QJ
14
350•H
60
AGE
(DAYS)
UNIUEL
CONCRETE

CONTROL
CYLINDER
STRENGTH
©
©cn
©ru
©
co
a)
rH
a
co
eoLHH
a>
lcd
aCD
daCO
Li
<d
C•H
MU ?CO I
K*'*
CD H3r*•H ai
co Lico
CD CD
LCL -W
eO 4-1
O O
CN
CD
L350*HPi
UihaUIZOhl
61
AGE
(DAYS)
DIXIE
CONCRETE

CORE
STRENGTHS
(LRU
ENGR
£
< <3
V
liQ X
ft X Oh X© OftKH QO QM3Si ux•J UIOh ftu is
4000
• •00
O 00 Q
OO no
© 0 0 ©© ©> © ©© © ® ©00 <0 T OJ
(AhKUJZOhX
62
AGE
(DAYS)
SLAB
CONCRETE
Figure
4.3
Compressive
strength
of
drilled
cores
from
floor
slab
sections
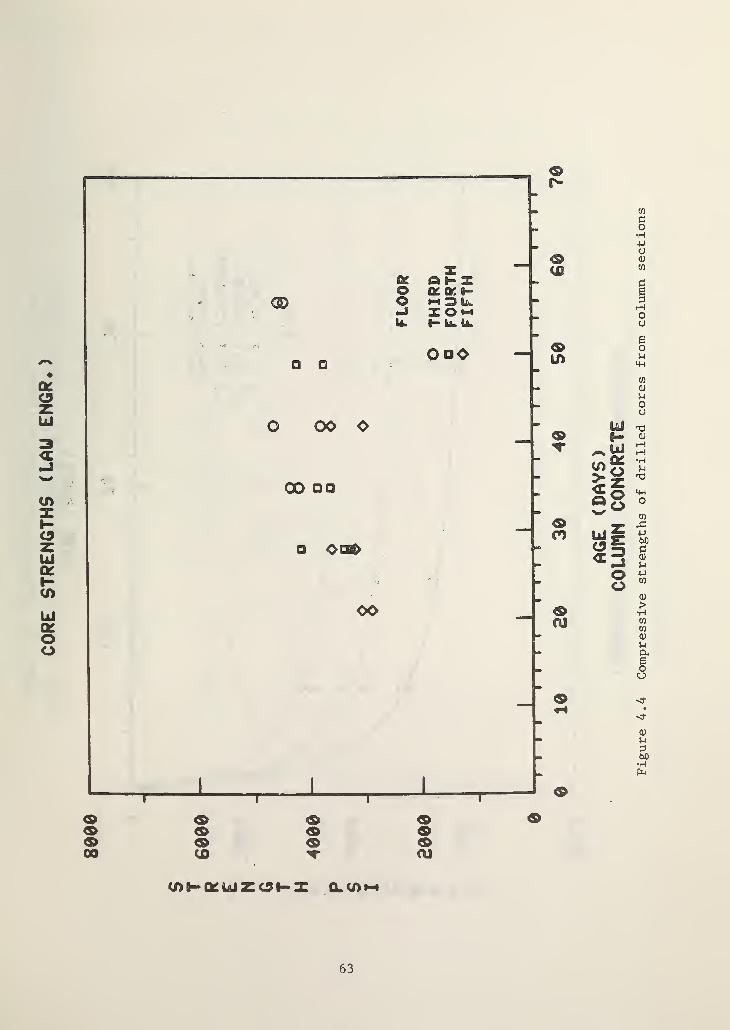
CORE
STRENGTHS
(LAU
ENGR
r-
(3D
o
oo
IQhltt or. HH3tl.X O »-«
h >L L
OoO
o oo o
00
OQ&
OO
Q ® <s><9 <9 <9 <9<9 «>00 a) 'r OJ
<A9-Q£UJZCit-X Q.y)H
co
co•H4-1
O<U
to
Cg3rHOO
eon
<4-4
co
a)
uoo
CD
>•HCO
CO
<u
aeou
«sf
sr
cu
M3toO
•H
63
AGE
(DAYS)
COLUMN
CONCRETE

LABORATORY
CYLINDER
STRENGTHS
(AhKUJZOhZ Q.<n»-i
64
Figure
4.5
Compressive
strength
of
laboratory
mixes

CORE
STRENGTHS
COMPARED
UITH
LAB
NIXES
<D
M&•U•H&
w43a)
w
uoorHLH
um
o B
OUcO
i-l
a O6 rDO CO
CJ iH
v£>
'•O’
0)
300•HP-l
65
AGE
(DAVS)
SLAB
CONCRETE
CORE
STRENGTHS
COMPARED
KITH
LAB
NIXES
oiO
LO
<S>n
©CU
UlI-
«o2§wUlC9
•Joo
009CO CU
(AhtfUZOhZ QL COh
66
Figure
4.7
Comparison
of
strength
of
cores
from
columns
with
the
laboratory
mix

SECANT
MODULUS
OF
ELASTICITY
AT
50X
ULTIMATE
n
OJ
o>>Q
UJO
U3
<9Oru
coo
67
Figure
4.8
Secant
modulus
of
elasticity
versus
age
for
laboratory
mixes

SPLITTING
STRENGTH
US.
COHPRESSIUE
STRENGTH
0)
>*rt
COCO
0)
u&
o
CCO
4-1
60
•rl 604-1 CcO CU
rH }-i
0) 4-1
PS CO
CTi
<0)
u060
ft.
(ftdjHhi-Hzo V) i-a lu z:o i-
x
68
C0NPRESSIUE
STRENGTH
(PSI)

STRENGTH-PIATURITY
FUNCTIONS
whaujzoi-i
w<u
x•He
j-i
o•un3
o
nj
MOm
vu
4-1
C/3
a)
uPbO•H
69
MATURITY
(F-DAYS)

STRENGTH-RATIO
OS.
MATURITY
70
MATURITY
(F-DAYS)

5. STRUCTURAL ANALYSIS
5.1 INTRODUCTION
This chapter presents the analytical investigation of the Harbour Cay structureunder conditions existing at the time of the collapse. Section 5.2 providesbackground information with the intent to acquaint the reader with the complexforce transfer mechanisms in shored building construction. The definition of
loads and the bases used in their calculations are the topics discussed in
section 5.3. The possible effect of the reshoring sequence, including the
sequence of removal of flying forms from a story, is examined in section 5.4.
The basis for selecting the method of analysis is discussed in section 5.5.
The results of the analysis are presented and explained in section 5.6. Asummary of major findings in this chapter is presented in section 5.7.
5.2 BACKGROUND
In multistory flat plate building construction, it is common practice to
support the freshly cast slab by a shoring system which distributes the load to
lower floors. The number of stories requiring shores* and reshores* dependsprimarily on the magnitude of imposed construction loads, curing characteris-tics of the concrete, and the rate of construction. The convention ns+nr is
sometimes used to designate the number of shored and reshored stories, respec-tively. Shoring combinations in which 1 ns _< 3 and 0 nr 5 (other thanns+nr
= l) have been used in the past.
Shoring systems commonly utilize metal frames and/or single posts. In systemswithout reshores (nr=0) ,
a newly placed slab remains shored until the n s_ifloors above it have been cast. In mixed systems, an intermediate step occurswhen the story under a particular floor is reshored. Depending on the methodused, the forces on the reshores may vary from almost zero to levels comparableto those existing in the shores they replace.
Regardless of the shoring scheme used, as construction progresses upward, thebuilding is subjected to unidentical cycles of loading and unloading which pro-duce residual forces in the structure. At a certain stage of construction,when a new floor is cast, the forces introduced combine with the residual forcesin the structure to produce the highest load on a particular slab, which is themaximum load any slab will experience during the construction of the building.The magnitude of this load does depend on the shoring scheme (n s+nr ) used, as
well as on the stiffness properties of the partially matured concrete structureand, where nr>0, on the amount of precompression in the reshores when they are
first installed. It should be pointed out, however, that insofar as the mostcritical condition is governed by available capacity as well as loads, it maynot necessarily occur in the slab which develops the peak load.
* Shores are vertical members which support formwork and freshly cast concrete.Reshores are vertical members used to support new structural members aftershores and formwork are removed.
71
In the case of the Harbour Cay building, flying forms were used in lieu ofconventional shores (frames and/or posts) in one story (ns=l). At the time ofthe collapse, three stories were reshored with wood posts. This identifiesthe shoring scheme as ns+nr=l+3. A flying form is an integrated system whichincorporates shores and formwork into a large unit capable of forming severalbays at a time. The method of replacing flying forms with reshores (describedin section 2.3) results in unloading a tier of bays at a time (2 or 3 bays inthis case), allowing the floor above that area to deflect under its own weight,before reshores are installed. Consequently, the forces on the reshores may beminimal; that is, they are installed snug enough to keep them from falling down.The supposition that reshores were not subjected to appreciable precompressionis corroborated by interview statements (section 3.4) of several instances ofworkers restoring fallen reshores.
5.3 LOADS
The following list identifies possible sources of loading on the structure atthe time of the collapse.
(1) The self weight of the structure
(2) The weight of fresh concrete in the roof slab
(3) The weight of the shoring system(4) The weight of construction workers, equipment and materials(5) Wind
(6) Impact
Impact loads due to the placement of concrete could be significant only ifconcrete were being discharged from the bucket at the time of the collapse. Ithas been established that concrete was not being discharged onto the forms atthe time of the collapse (chapter 2) and no other materials were being deliv-ered to the roof. The prevailing wind was estimated at 9 mph (4 m/s) from thenorthwest direction based on weather reports from nearby Partick Air ForceBase. This corresponds to wind pressures which are less than one percent ofthe design wind pressures stipulated by the applicable Code [2]. The ratio ofactual-to-design wind forces on the structure may be even smaller due to theabsence of the upper story walls and roof parapet. Thus, compared to gravityloads, the effect of wind on the structure is not significant.
Figure 2.13 shows the approximate location of the workers who were in thebuilding at the time of the collapse. Very few workers were in the storiesbelow the roof and they appeared to be dispersed. There was a concentration of13 workers near the edge of the completed portion of the roof. If they are allassumed to be in bay HJ (fig. 2.1), the load in that bay due to their combinedweight (assuming 200 lb or 90 kg per worker) would be slightly over 4 psf(190 Pa). No evidence was discovered of any heavy equipment (such as compres-sors) in the building. Miscellaneous other equipment in the building, such ashand-operated concrete finishing tools, vibrators, etc., are light and too fewto make a significant contribution to existing gravity loads.
Loads attributed to the self-weight of the structure were calculated as auniform load of 105 psf (5030 Pa) for the second through fifth floor slabs, of
72

which 100 psf (4790 Pa) represents the weight of concrete in the 8-in (203-mm)
slab based on a unit weight of 150 pcf (2400 kg/m^) for the concrete. Theadditional 5 psf (240 Pa) load accounts for the weight of reinforcing bars in
the slab, determined in accordance with the reinforcing plans shown in the
structural drawings.
Loads attributed to the cast portion of the roof slab (between column lines Ato H, figure 2.1) were likewise calculated as 105 psf on the same basis as
above. Loads attributed to the weight of flying forms were estimated as a
5 psf (240 Pa) uniform load based on information supplied by the manufacturer.For the purpose of analysis, the flying form loads were lumped with the roofloads so that a total load of 110 psf (5270 Pa) was assumed acting on the fly-ing form at the roof level where concrete was in place. A load of 10 psf
(480 Pa), representing the combined weight of reinforcement and flying forms,
was applied to the portion of the roof which was void of concrete (the areabetween column lines H and K, figure 2.1).
The weight of the masonry walls on the periphery of the structure plus stackedmasonry pallets on the north bay of the fourth floor (bay JK, fig. 2.1) and the
south bay of the third floor (fig. 2.12 and bay AB, fig. 2.1) were included inthe analysis of the structure. The walls were in place in the first, secondand most of the third stories (see figure 2.1 for the location of masonry wallsin a completed story). The wall loads for the second and third stories wereestimated at 0.3 kips per lineal ft (4.4 kN/m) based on 35 lb (15.9 kg) unitweight for the masonry. The pallet loads were estimated at about 2 kips (9 kN)
per end bay (south or north). Both wall loads and pallet loads were convertedto equivalent concentrated loads and were placed at the appropriate nodes inthe finite element model of the structure.
Based on the foregoing comments, only the first three sources of loadingdefined above were considered in the analysis of the structure. It should be
noted that according to independent laboratory investigations subsequent to
the collapse (see table A. 7), the unit weight of concrete was closer to 140 pcf(2240 kg/m^) than the 150-pcf (2400-kg/m^) assumed in load calculations.However, this difference is compensated by other load effects not consideredin the analysis, such as items (4) and (5) cited above, the additional weightof concrete placed in the slab where ponding occurred (see section 3.3), andthe weight of reshores in the second through fifth stories.
Figure 5.1 shows a partial drawing of flying form types A and B within the two
bays at the north end of the building to assist in vizualizing the layout.Note that in the case of form type A, instead of a continuous beam, two shorterbeams are used at each location that overlap at the middle truss.
Referring to figures 2.7 and 2.9, it is noted that roof loads are transmittedto the fifth floor as concentrated loads through the flying form reactionpoints. The widths of the flying forms were 25.0, 26.0, 24.5 and 21.0 ft
(7.63, 7.93, 7.47, 6.41 m) for types A to D, respectively (the widths of formsA and B are shown in fig. 5.1). Since the widths of the transverse bays werealso different, the filler panels (figures 2.9 and 5.1) had, in general, dif-ferent widths as well. The lengths of the Aluma beams for types A, C and D
73
are the same as the corresponding widths of the forms. The Aluma beams fortypes B and C are therefore continuous over the center truss. No continuityoccurs in the case of type D which has only two trusses.
Each flying form was assumed to support the entire load within its bay.Therefore, the portion of loads on the filler strips between the edge of theform and column centerline was assumed as a uniform line load applied to thetop of the exterior truss of the form. The Aluma beam reactions at the trusseswere calculated taking into consideration the effect of continuity where suchwas the case. These reactions were also applied at the top of the trusses asa uniform line load. The truss reactions were then determined on the basis oftributary spans for simplicity. In the case of form B, the tributary reactionswere compared with those obtained by analysis using the sectional and materialproperties of the trusses supplied by the manufacturer and assuming continoustop and bottom chords and pinned verticals and diagonals. This comparisonshowed that the differences between corresponding reactions were within 12
percent. In the analysis of the structure, forces opposite to the tributaryreactions were applied to the fifth floor as point loads.
5.4 CONSTRUCTION SEQUENCE
The forming and reshoring sequence at various stages of construction wasexamined in the analysis of the Harbour Cay building because it affects theload paths in the system. An analytical approach to evaluating the effect ofloading history on the interaction between slabs and falsework was first formu-lated by Neilsen [5.1], taking into consideration the deformation characteris-tics of the slabs and the shores. Grundy and Kabaila [5.2] developed a simpli-fied method for analyzing the distribution of loads between slabs and falseworkbased on the assumption of rigid shores. For a single bay structure, withoutreshores (nr = 0, sec. 5.1) this approach yielded a maximum load ratio of 2.36(i.e., the maximum load on a slab divided by its dead load). This was close tothe more rigorous analysis by Nielsen which yielded a maximum load ratio of2.56.
Both of these analyses assume a shored system (no reshores). To reduce theload ratios, Taylor [5.3] proposed a scheme which involved physically relievingreshore loads prior to the placement of a new concrete floor. This reduced themaximum load ratio to 1.44. The method of construction in the Harbour Caybuilding (sections 2.4 and 5.2) allows the slab to deflect under its own weightin the reshoring operation. This results in a reduction of the maximum loadratio in a manner similar to that described by Taylor.
Vertical Construction Sequence
To examine the effect of the construction history on the Harbour Cay building,an analysis was performed according to the method proposed by Grundy and Kabaila[5.1] assuming no loads are taken by the reshores when they replace the flyingforms. The results of this analysis are schematically summarized in figure5.2. The numbers on the right side of each sketch are load ratios (definedabove). In this analysis, reshores are assumed to be weightless and axiallyrigid and the stiffness of the slabs to be equal. A step-by-step explanation
74
(steps a through n) of the shoring sequence and corresponding load ratios,(designated by r) follows. In the case of reshores, r designates the load onreshores in a story divided by the dead load of the slab.
(a) Second floor placed. Flying form ("form," in brief) takes entireload.
(b) Form removed. First floor assumes self weight (r=l).
(c) Reshores are installed snug in first story (r=0). First floor stillcarries its own weight (r=l).
(d) Flying forms are placed in the second story and the third floor is cast.Flying form carries third floor's weight (r=l) which in turn is trans-ferred directly to the first story reshores (r=l). The first floor slabstill carries its own weight (r=l).
(e) Flying form removed causing third floor to carry its own weight (r=l).
First story reshores are relieved (r=0).
(f) Reshores are installed in a snug fit.
(g) to (j) is the same as the cycle from (d) to (f).
(k) Reshores in the first story are removed. (For the Harbour Cay building,it was assumed that the reshores in the first story were removed beforethe flying forms in the fourth story were flown since the reshores wouldbe needed on hand to replace the flying forms as they were removed.) Theload relieved from the vacated reshores (r=l) is equally shared by floors2 to 4 (r=l/3 each). The load in the second story reshores are relievedby two-thirds (r=-2/3) since one-third of the vacated reshore load is
carried by the second floor slab. The third story reshores are unloadedby one-third (r=-l/3) since an additional one-third of the vacated reshoreload is carried by the third floor slab.
(l) Flying forms in the fourth story are removed. The fifth floor assumesits own self weight (r=l). Floors 2 to 4 are unloaded equally (r=-l/3each). The loads in the reshores in the third story are relieved bytwo-thirds (r=-2/3) since one-third of the vacated flying form load is
taken by the fourth floor slab. The loads in the reshores in the secondstory are relieved by one-third (r=-l/3) since another one-third of the
vacated flying form load is taken by the third floor slab.
(m) The result of (1), i.e., the reshores are unloaded (r=0).
(n) Finally the reshores are installed snug in the fourth story.
To summarize, this analysis shows that prior to placement of the roof, allthe floor slabs are supporting their own weight and the reshores are unloaded;i.e., the reshores are not involved in transmitting the slab weights of the
second through fourth floors.
75

The values of the load ratios would be somewhat different if actual reshore and
slab stiffnesses were considered in the analysis.
It should be kept in mind that this is a simplified analysis that highlights theresponse of a single bay plane structure to a particular shoring scheme andsequence of construction. In a multibay space structure there are other con-struction effects that need to be examined. This topic is discussed below.
Effect of Lateral Form Removal
Because the Harbour Cay building was a multibay structure, the possibilityexists that the sequence of form removal from a particular story will have aneffect on load distribution. Specifically, the question to resolve is whetheror not the replacement of flying forms with reshores in a multibay storycauses the entire slab above to carry its own weight.
As explained in chapter 2, the sequence of form removal was from the southside bays to the north side bays. All indications are that the forms wereremoved sequentially, beginning with bay AB and ending with bay JK. Withthis sequence, an analysis of the effect of the lateral removal of the flyingforms is depicted in figure 5.3. The steps of the analysis are explainedbelow.
Figure 5.3 (a) shows a cast slab being supported by the flying forms. In(b) the flying forms are removed from the first bay. This loads the frame by
an amount equal to the floor dead weight in that slab (2.35 k/ft or 34.3 kN/m).A frame analysis of the structure in (b) shows that the flying form in theadjacent bay BC is unloaded by 13.5 kips (60.1 kN) ,
6.5 kips (29.0 kN), and0 kips as shown in (c). The effect of unloading the first bay causes negligibleforces in all bays but the adjacent bay.
Next, reshores are inserted in a snug fit in the first bay and the flyingforms in the second bay are removed. This loads the frame by the slab weightof that bay. However, that load is reduced by the amount caused by the removalof the flying forms from the first bay, i.e., the 13.5 kips (60.1 kN), 6.5 kips(29.0 kN), and 0 kips. This net loading of the frame results in an unloadingof the flying forms in the adjacent bays by 9.3 kips (41.4 kN), 4.4 kips(19.6 kN), and 0 kips. Again the effect of removing the flying forms inducesnegligible forces in all bays but the adjacent bays. Since in (c) the reshoresin the first bay were simply inserted in a snug fit, i.e. zero load, a reductionin the load in these reshores caused by removing the flying form in the secondbay would cause them to go into tension.
Since reshores cannot develop tension, it is reasonable to assume that theywere installed just tight enough to keep them from falling down when forms inadjacent bays are lowered. Thus, in (d), with the removal of the flying formin the third bay, the load in the reshores in the first bay would still bezero. The removal of this flying form again loads the frame by the slab deadweight of that bay less the amount caused by the removal of the flying form inthe second bay, i.e., 9.3 kips (41.4 kN), 4.4 kips (19.6 kN), and 0 kips.
76

This process is repeated until the north bay is reshored, at which time, the
forces in the reshores are all zero or nearly so, and the slab is supportingits own dead weight as assumed in the analysis shown in figure 5.1.
Definition of Analysis Models
The above analyses indicate that when the flying form system is used, the
reshores are effective in transferring only the newly placed concrete loads to
the lower floors. When the flying forms are removed, the forces in the reshoresrevert to zero and the slabs carry their own dead weight. As a result, it is
reasonable to assume that before the roof is cast the fifth, fourth, third,and second floor slabs are supporting their own weight and the reshores areunloaded (as indicated in fig. 5.2, step n) . When the roof is cast, the loadwill be shared by all the floor slabs through the action of the reshores. Thus,to determine the state of stress at the time of collapse, two separate casesshould be analyzed. In the first case, the structure without reshores is
loaded by the dead weight of floors 2 through 5 as shown in figure 5.4a. Inthe second case, the reshored structure is loaded with the dead weight of theroof as shown in figure 5.4b. The final result is obtained by adding theresults from the two analyses.
5.5 METHOD OF ANALYSIS
The design of a flat plate structure such as the Harbour Cay Condominiumtypically involves either a simplified "direct design" analysis in which the
structure is designed for assumed upper and lower bounds of bending and shearstresses based on tributary areas, or, the structure is designed to resistmoments and shears determined by analysis using the equivalent frame method(EFM). The equivalent frame method involves modeling the structure as a seriesof plane frames along the column lines, where the slabs between the centerlinesof adjacent spans are modeled as wide beams. As specified in the ACI Code
[2.1], the actual column stiffnesses in the EFM are modified after Corley andJirsa [5.4] to better represent the transfer of bending moments at theslab-column connections (table 5.1).
The EFM is a simple method to use. However, since the Harbour Cay condominiumwas reshored irregularly in addition to having irregularly spaced flying formloads, the EFM analysis was compared to results of a finite element method(FEM) of analysis which can model the three-dimensional aspect of the loading.
Equivalent Frame Analysis of Fifth Floor
The comparison was made using only the fifth story of the structure andassuming the columns were fixed at the base and the reshores pinned at bothends, as shown in figure 5.5a (see section 2.4 for the number and location of
reshores). The EFM analysis summarized in figure 5.5 was the frame alongcolumn line 2. The loading including the distributed dead weight of the fifthfloor slab (106 psf or 5.08 kPa) plus the weight of the flying forms and thenewly cast roof up to column line H (figure 2.1), applied as joint loads. Theroof loads were calculated as explained in section 5.3. The pertinent struc-tural data for the EFM is summarized in table 5.1. The results of the analysis
77

as summarized in figure 5.5(a) are for the frame with reshores and in figure5.5(b) for the frame without reshores. These results were then compared to a
FEM analysis of the fifth floor alone using the same loading conditions as
above.
Table 5.1. Structural Data for Fifth Floor only EFM
Areshores= 302.25) = 36.75 in2 (237 cm2 ) Ereshores
= 1.600,000 psl(= 11 GPa)
bs iab= 266 in. (6.76 m)
’slab“ H350 in Interior col
* 566 i"4
lexterior col“ ^4 *n
Ec = 4,280,000 psi (29.5 GPa)
WD = (0.106) (22 .2' ) = 2.35 klf (34,300 N/m)
Finite Element Analysis of Fifth Floor
The finite element software used in the analysis was the Sperry Univacimplementation of ICES-STRUDL-II [5.5]. Rectangular plate bending elements(type BPR) were used. This element is described in reference 5.6. The finiteelement mesh used for the fifth floor is shown in figure 5.6. The rationalebehind the fairly dense mesh can be seen upon a careful examination of a planview of the fifth floor (figure 5.7). Nodal points were necessary at the loca-tions of the flying form truss jacks and at the locations of the reshores under-neath the slab. Nodal points were added between the flying form trusses to
reduce the maximum aspect ratio of the plate bending elements from 5.0 to 2.5.
The FEM model of the fifth floor consisted of the plate bending mesh shown infigure 5.6 supported by columns fixed at their base. As before, two differentanalyses were made: one for the structure with reshores and one for the struc-ture without reshores.
The results for the column forces for the FEM fifth-floor model with reshoresare shown in figure 5.8. Due to almost symmetric loading and closeness of spanlengths, the column moments are all relatively small. A comparison of axialforces in columns on column line 2 with those obtained from the EFM analysis(fig. 5.5a) shows poor agreement between the two sets of results.
The results for the column forces for the FEM model without the reshores areshown in figure 5.9. The largest column force is 146 kips (650 kN) occurringin column B-2. This value compares well with the value of 144 kips (641 kN)for the EFM results summarized in figure 5.5(b). The other column forces alsoagree reasonably well.
The results for column axial forces from the EFM and FEM analyses agree fairlywell for the case without reshores since the axial force is primarily due totributary area loads. With the addition of reshores, the load transmission
78
becomes three-dimensional and the EFM column axial forces do not match the
FEM results even reasonably well; for this reason, a three-dimensional FEManalysis is required.
5.6 FINITE ELEMENT ANALYSIS OF ENTIRE STRUCTURE
Due to the absence of flying forms in the second through fourth floors a
coarse FEM mesh, as shown in figure 5.10, could be used for modeling theselevels. The fifth floor mesh (figure 5.6) was retained for this analysis.The columns were modeled as three-dimensional beam-column elements and thereshores were modeled as three-dimensional truss elements.
The structural geometry is defined in chapter 2. The values for the modulusof elasticity of concrete, E c ,
(as described in chapter 4) are summarized in
table 5.2. Poisson's ratio was assumed as 0.2. The modulus of elasticity ofthe reshores was taken as 1,600 ksi (11 GPa).
Table 5-2. Assumed Concrete Modulus of Elasticity
Ec5th Floor Slab 4,150 ksi (28.6 GPa)
4th Story Columns 3,590 ksi (24.7 GPa)4th Floor Slab 4,270 ksi (29.4 GPa)
3rd Story Columns 3,630 ksi (25.0 GPa)3rd Floor Slab 4,310 ksi (29.7 GPa)
2nd Story Columns 3,650 ksi (25.2 GPa)2nd Floor Slab 4,340 ksi (29.9 GPa)
1st Story Columns 3,660 ksi (25.7 GPa)
As described in section 5.4, two cases are analyzed. In the first case, thestructure without reshores is loaded with the dead weight of the floors, asshown in figure 5.4(a). In the other case, the structure with reshores in thesecond, third, and fourth stories, as shown in figure 5.4 (b), is loaded withthe flying forms and the roof slab, which was cast from column line A to columnline H. Superposition of the results of these two analyses yield the finalresults which are discussed below.
The FEM analysis of a large structure such as this (5328 members, 2543 nodes,12679 degrees of freedom) causes problems as to the most efficient manner of
presenting the results. Since it was suspected that failure was due to punchingshear, shear forces at the columns and top column moments are presented. Thesequantities are used to calculate punching shear stresses in the slab.
Although the typical failure mode of a flat plate structure of this type is bypunching shear, in the interest of completeness, various failure modes werechecked prior to the complete analysis of the structure.
Bending stresses were checked according to the ACI Code [2.1] direct designmethod. The steel ratios in the slabs were also checked and found to be less
79
than the balanced ratio as required. Column slenderness effects were alsoinvestigated; however due to the nature of the collapse, i.e., vertical withno sidesway component, this mode of failure was not suspected. Axial stressesin the columns were checked for tributary area loads and found to be well belowallowable. Initial estimates of punching shear stresses (from tributary areas)showed the degree of safety to be marginal for this mode of failure.
Figure 5.11 shows the combined results of punching shear forces (differencebetween column axial forces at the slab-column connections) for the slab-columnconnections along column line B. Figure 5.12 shows the same results for columnline 2. These figures indicate that the fifth floor was the most heavilyloaded floor (in punching shear) as suspected from the load path analysis insection 5.4. The punching shear and unbalanced column moments for all thefifth floor slab column connections are tabulated in figure 5.13. The mostheavily loaded connections are on the fifth floor at column B-2 and G-2; 102
kips and 100 kips (454 kN and 445 kN), respectively. The analysis of punchingshear stresses corresponding to the axial forces and moments shown in figure5.13 is presented in the next chapter.
5.7 SUMMARY
The following are the major points resulting from the analysis of the structureunder construction loads;
1) At the time of collapse, gravity loads were the only significant kindsof loading on the structure.
2) Using a simplified and approximate analysis of the load distributionduring construction, it is shown that at the stage just before the roofloads are applied each slab carries its own weight and there are no
loads in the reshores. When the roof is cast, the reshores are effec-tive in distributing the roof load to the slabs of the reshored stories.
3) The final analysis of the construction load effects was obtained bysuperposition of the results of two analyses. In one case, the unshoredstructure was loaded by the self weight of floor slabs 2 through 5.
In the second case, the shored structure was loaded with the roof load.
4) In order to account for the three-dimensional response of the shoredstructure, the finite element method was used for the final analysis.
5) The results of the analysis indicate that the most heavily loadedslab-column connections are in the fifth floor at columns B-2 and G-2.
80

//^ /^// ^ /~^^7
ASSUMED SUPPORT CONDITIONS OF ALUMA BEAMS
Figure 5.1 Configurations of flying forms A and B in north bays
81

rv s, i
a) b)
SHORED STORY (TYP)
r-t
flpepQft 0
1
1
1
VT VTh)
c) 4)
r-t
e)
RESHORED STORY (TYP)
0
i)
VTA
j)
VTTTTT
f)
k)
l) m)
v \ '
n)
Figure 5.2 Effect of vertical construction sequence
82

83
Figure
5.3
Lateral
sequence
of
flying
form
removal

1 v j if \l M \> W
u | { u v j 1 1
1 V I V u 1 \< H
V V { 1 { 1 v n
yy/yyyyyyyyyyyyyyyyyy/yyyy
a) Unshored structure
supporting self-weight
of floor slabs
I I I I ' 1 1 1 I'
;><;
\*\
yyyyyyyyyyyy/yyyyyyywyyyy
b) Shored structure
supporting weight of
roof slab
Figure 5.4 Two cases analyzed to obtain final solution
84

85
Figure
5.5
Results
of
FEM
analysis
of
fifth
floor
only
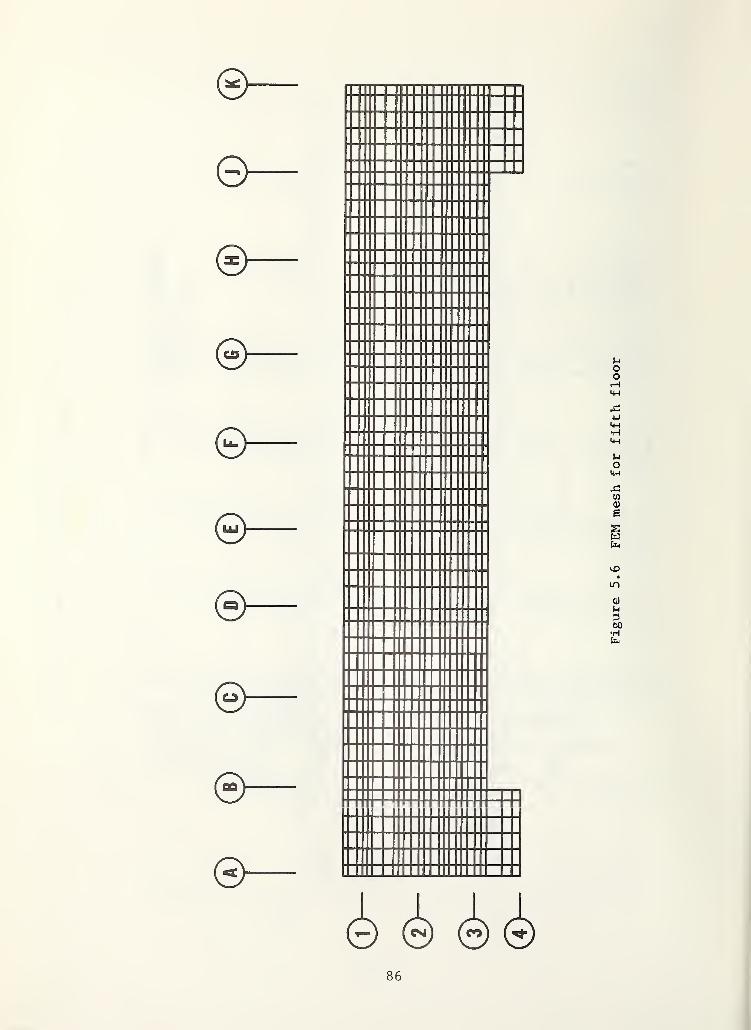
86
Figure
5.6
FEM
mesh
for
fifth
floor

87
Figure
5.7
Plan
view
of
fifth
floor
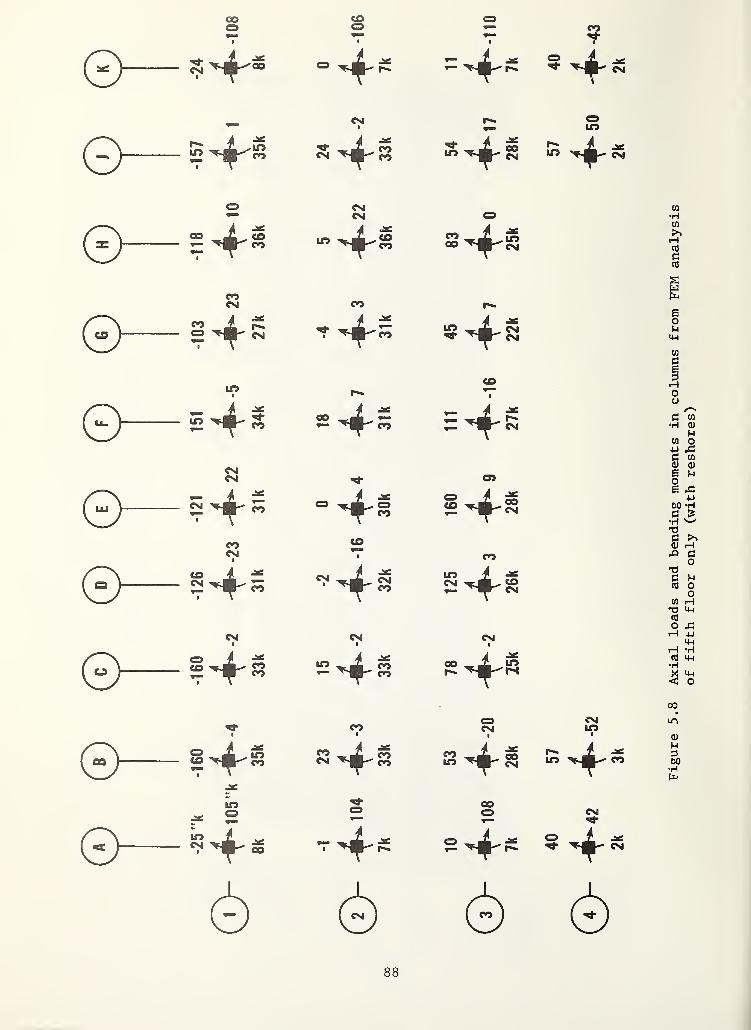
COCD
COCD CD
<=> =^S 9^
0—CM
s ©S- S
S ® 40 MF«^p
?-f s s^-g
©—COCM
« ISCO
"f 5^ 3
m
184-7 31k
CO
=4s
©— °-f ICO
©CM
i
CO 4
£! co-2
32k
CO
IO -*
S2
CM
— § S3 154--2
33k
©—“sa-
il
o 1 mCO
-SC
CO1
CO ACM
Si CMCM 40
• 1
S3 ^
to <o
v
COCD CMs— Ml-
S2 ^ 5
6 (~) (z> (*)
CSI
CM
co
CM
88
Figure
5.8
Axial
loads
and
bending
moments
in
columns
from
FEM
analysis
of
fifth
floor
only
(with
reshores)

©- s-fa
o
° ^Hcm °©sCM
?4 S
0—o
— i
o
o
SM^So
COCOCM
T m
in
CO0CO
©—inCO
m A ^°o ^m^oo
incp
j JCO COCO ^gj^o l-fs
©—in in
s-fl
inin
S 4 -as
©- 200-4^20
113k
oCO
o J in
CM '*'^'"£2
in
I’f8
©—in
? -
in
OCO
g i co
in
inc\j
14-s
CD
©— o 4 co !©§OO
f^S
©- i^fl
in
in aQ® i -*CO M^m-'OO
't00
©—o
g ± c5
CDCO
«*ff
0inCO
CDOCO
0 A .
0—oo>CO
§
oCO
0COin
2 1;
6 (~) (r) 6
CM
CMCM
89
Figure
5.9
Axial
loads
and
bending
moments
in
column
from
FEM
analysis
of
fifth
floor
only
(without
reshores)

90
Figure
5.10
FEM
mesh
for
second
through
fourth
floors

91

CN
92
Figure
5.12
Punching
shear
forces
along
column
line
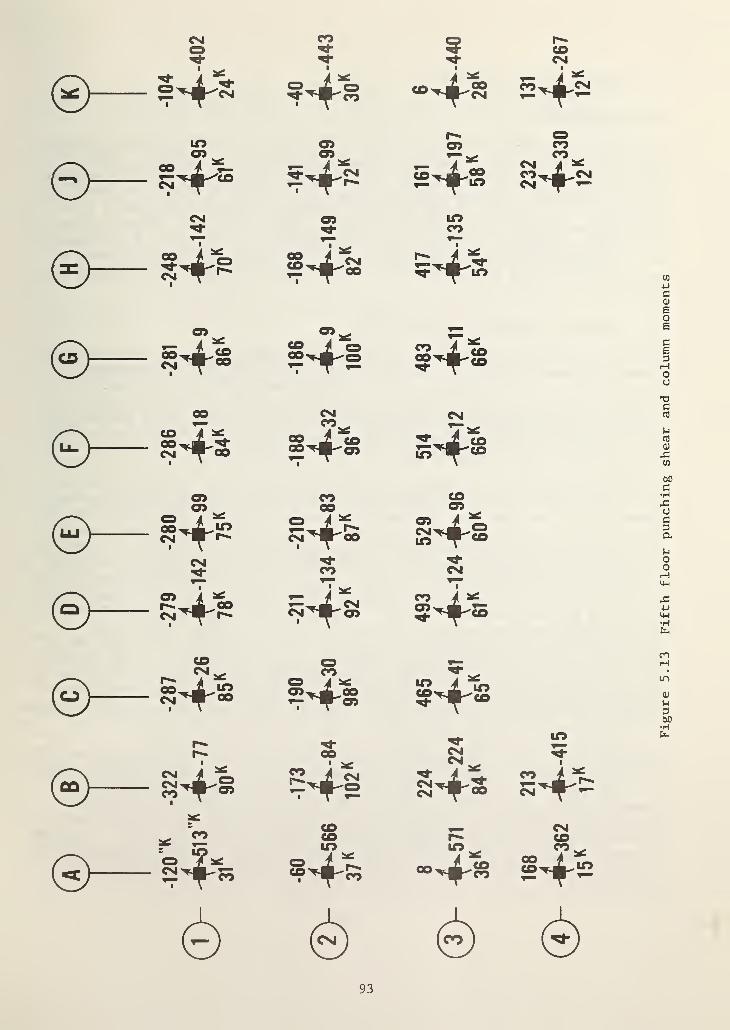
CM-443 -440
r-*COCM
©—-2-4-3 “>-4'ls
LOCD
CDmr*»05 CO
oo i ss^gCM i ^PO.j -CM
CM 05 LOCO
©— s-ffe1
?4» 5-is
@—or> 05
I^I s^-i
OO CMC*s
CM
00 7OO^nlL^CM °°
7^oo f co 05
O*IFrFh
CO{©O
CO05
©— -280 75k w* 05 i qS^s
CMCO CM
e4* s4‘« CO _4 ^5^ik«o
COCM
r» i
e^^oo S^-8 S^Sr—r-. oo CM
LO
m i oSMf'S
1'
1 ^
S4§ S+» s4--
COCDtf%
CMfA
©-:*: 4-
-4* s^ps
6 (~) (~) (*)
93
Figure
5.13
Fifth
floor
punching
shear
and
column
moments
6. INTERPRETATION OF ANALYSIS
6.1 INTRODUCTION
This chapter evaluates the results of the analysis of the structure and drawsconclusions therefrom on the most probable cause of the collapse. First, insection 6.2 shear stresses at the critical sections are computed and comparedwith the capacity of the structural elements. Second, in section 6.3 thethickness of the slab is examined to see whether the slab thickness of 8 in(203 mm) was adequate to support the design loads and if not, to what extentthe design inadequacy contributed to the collapse. In section 6.4 the causeof the collapse is established based on this analysis, and the most probablemode of failure and the reason for the occurrence of progressive collapse aregiven.
6.2 ANALYSIS OF SHEAR FAILURE OF SLAB
It has been shown in a number of studies [6.1] that flat plate structures areinherently weak in shear at the slab-column connection and, when punchingshear failure occurs, the structure is highly susceptible to progressivecollapse unless it is adequately designed and carefully constructed [6.2, 6.3].Judging from the manner in which the Harbour Cay structure failed and in theabsence of any evidence of ductile failure, it was suspected that the structurehad experienced shear failure at slab-column connections.
To verify that such a failure had occurred, punching shear stresses resultingfrom direct shear forces and unbalanced moments were computed at slab-columnconnections using the shear and moment values for construction loads given infigure 5.13. These shear stress values were compared with the shear capacityof the slab based on the predicted inplace strength of concrete at the time of
collapse. Because the punching shear stress values are maximum at the fifthfloor level (see figures 5.12 and 5.13), the shear stresses are evaluated onlyfor this level. The guidelines given in the ACI Code [2.1] are followed incomputing the punching shear stress. Figure 6.1(a) shows the critical sectionin the slab around an interior column. The critical section where shearstresses are evaluated is taken perpendicular to the plane of the slab and a
distance a half of the effective depth away from the periphery of the column.The assumed distribution of shear stresses at the critical section is shown infigure 6.1(b). The critical sections for edge and corner columns and corre-sponding assumed shear stress distributions at these critical sections are shownin figure 6.2(a) and (b) and figure 6.3(a) and (b), respectively.
The results of the punching shear stress calculations are listed in figure 6.4.
In this figure, the numbers given in parentheses are the shear stresses result-ing from the direct shear only and the other numbers are the shear stressesresulting from the combined effect of the direct shear and the unbalancedbiaxial bending moments. The negative values shown at the edge and cornercolumns are upward shear stresses resulting from the combined effect. Negativestresses occur on a side of the critical section when the absolute value of the
moment-induced shear stress exceeds the absolute value of the direct shearstress
.
94

It is seen from figure 6.4 that maximum shear stresses resulting from directshear occur at columns B-2 and G-2 with shear stress values of 250 psi
(1.72 MPa) and 244 psi (1.70 MPa), respectively. Except for the edge columnsin line A and corner column B-4, maximum combined shear stresses occur also
at columns B-2 and G-2. It needs to be pointed out that the large shearstresses at the edge and corner columns may not develop as a result of momentredistribution to the interior columns due to cracking of the slab in the
vicinity of exterior columns caused by high moments [6.4]. If this redistri-
bution of moments takes place, the moment-induced stress would increase at
the columns in line B and J and would decrease at the edge columns in line Aand K. Because combined shear stresses at these edge and corner columnswould be limited by cracking in the slab and because shear stresses due to
vertical loads are relatively small, it is less likely that punching shearfailure would develop at these column locations, and they are not consideredas the critical locations in the failure analysis.
For the purpose of design, the nominal shear strength specified by the ACI Code
[2.1] is 2 / f Q for beam-type shear and 4 / f£ for punching shear whereis the compressive strength of concrete.
For the south half of the fifth floor, the beam-type shear strength given bythe ACI Code would be 126 psi (0.87 MPa) while the punching shear strengthwould be 253 psi (1.74 MPa) for an estimated compressive strength ( f£) of
4000 psi (27.6 MPa) at the time of collapse. The corresponding strengths forthe nor^h half would be 121 psi (0.83 MPa) and 243 psi (1.66 MPa) for an esti-mated f
cof 3700 psi (25.5 MPa). It should be recalled that the south half
of the slab was two days older than the north half.
The computed beam-type shear stress under construction loading is 51 psi(352 kPa) and 49 psi (338 kPa) , respectively, at the critical sections corre-sponding to columns B-2 and G-2. These values are considerably less than thebeam shear strength of the slab. Therefore, it is concluded that beam-typeshear failure did not precipitate the collapse.
When the ACI Code punching shear strengths are compared with the computedshear stresses, it appears that the punching shear stresses at many columns inthe fifth floor exceeded the nominal punching shear capacity of the slab. Thiswould suggest that failure should have occurred prior to the placement of con-crete to column line H. To examine why failure did not occur earlier requiresa review of the ACI provision of 4 / f ^. Figure 6.5 shows experimental punch-ing shear strengths, normalized by bd / f^, versus c/d where b is the peri-meter of critical section, c is the side length of column and d is the effectivedepth of the slab [6.1]. It is clearly seen in this figure that the punchingshear strength is a probabilistic parameter which exhibits a high degree of
variability. It is evident that 4 / f '
c as used in the ACI Code is a lowerbound strength, that would be justified for the purpose of design. For failureanalysis, however, the actual shear strength should be used, and it would be
greater than 4 / f £ . According to the data shown in figure 6.5, the meanpunching shear strength could be as high as 7 / f£ and the probability of a
punching shear strength of 4 / f£ occurring at any given location in the
structure is relatively low. However, the probability of failure initiating at
95

some location in the entire structure increases rapidly with the number of
locations where the shear stresses are in the neighborhood of 4 / f^,.
According to figure 6.4, there are at least 30 such locations in the fifthfloor slab.
If, for the sake of illustrat ion, the probability of failure at any givenlocation where a stress of 4 f £ occurs is assumed to be two percent (P^ =
.02), which is quite plausible in light of the data shown in figure 6.5, theprobability of failure, ?2 , of an element in a system consisting of 30 suchlocations would be (assuming indepdence)
P2 = 1 - (1-P
1 )30 = 0.45,
or 45 percent. If a value of 0.03 (or 3 percent) is assumed for P]_, P2 wouldincrease to 0.60 (or 60 percent), and so on. This means that even though theprobability of failure at each column location is relatively low, the probabilityof the entire structure having a failure is relatively high.
The likelihood of failure having initiated at B2 or G2, where the shear stressesare maximum, will be somewhat greater than at other locations (except thoseexcluded along column line A for reasons stated above). In fact, in terms ofthe paramet er / f
'
Ci the shear stresses at B2 and G2 are virtually equal(4.57 / f£ and 4.52 /" f respectively); an indication that failure couldhave occurred at either location. The supposition that failure initiated atcolumn G2 rather than B2 is borne out by witness statements (as discussed in
sec. 3.3) indicating that the collapse started somewhere in the region whereconcrete was being cast. However, from a probabilistic view, this is not anabsolute certainty (failure could have been initiated at location other thanB2 and G2).
It should be pointed out that the data shown in figure 6.5 was obtained fromlaboratory experiments where, in general, much better quality control can beexercised than in the field. Therefore, it is reasonable to expect that if
actual field conditions were simulated, the data would have shown greaterscatter and a lower expected value than indicated in figure 6.5. Both factorsimply a greater probability of strength below 4 / f There is evidence,as discussed in chapter 4, that the concrete used in the structure had highvariability in terms of composition and strength.
6.3 INFLUENCE OF EFFECTIVE DEPTH OF SLAB ON SHEAR CAPACITY
Without special reinforcement at the slab-column connection, the effectivedepth of slab at the critical section must be sufficient to resist punchingshear failure around the column. Both the thickness of slab and the locationof tension reinforcement govern the effective depth. It was discussed in
section 2.3 that the 4-1/4 inch (108 mm) individual high chairs used to supportthe top reinforcing bars in the column strips produced more than the 3/4-in(19 mm) minimum coverage required by the structural drawing. This resulted inan effective depth of the slab of 5.3 in (135 mm). Had higher size individualhigh chairs been used, to just meet the 3/4-in coverage requirements, the slabcould have had a 6.3 in (160 mm) effective depth.
96

The increase in effective depth by 1 inch (25.4 mm) increases the criticalcross sectional area to resist the punching shear by 25 percent, which, inturn, decreases the shear stress acting on the critical section.
Because under construction loads the computed shear stresses in the slab atmany of the column locations exceeded the shear strength of 4 / f '
c ,the slab
thickness of 8 inch (203 mm) was checked to see whether it was adequatelydesigned to resist punching shear stresses due to the design loads. Therequired thickness for the slab was computed following the equivalent framemethod described in the ACI Code [2.1] in accordance with the following threeload combinations in the code:
(1) U = 1.4 D + 1.7 L
(2) U = 0.75(1.4 D + 1.7 L + 1.7 W),and
(3) U = 0.9 D + 1.3 W
where U is the required strength to resist factored loads,
D is dead load,
L is live load , and
W is wind load.
The strength reduction factor of 0.85 is applied to 4 / f£ in computing the
design shear strength.
It was mentioned in section 2.3 that the original design calculations wereexamined and that no computation was noted for checking the punching shearcapacity of the slab. For the dead load of the required thickness slab, thesame live loads used in the design (see section 2.3) and the wind load speci-fied in the Southern Standard Building Code [2.2], the required slab thicknessshould have been 11 in (279 mm) instead of 8 in (203 mm) for the column sizeof 10 x 18 in (254 mm x 457 mm) . The slab thickness is governed by the loadcombination of (1.4 D + 1.7 L) . This clearly indicates that the design ofthe slab was inadequate to support the design loads with the margin of safetyimplied by the ACI Code. Table 6.1 lists the punching shear stresses at columnG-2 for the 11-in slab with a 3/4-in (19 mm) cover and with a 1 3/4-in cover(44 mm) for the same construction condition which existed in the structure.In addition, the punching shear stresses at column G-2 for the 8-in slab witha 3/4-in cover and with a 1 3/4-in cover are also listed.
It is seen in table 6.1 that for the 11-in slab with the tension reinforcementplaced such that it has a 3/4- in cover (d = 9.3 in), the punching shear stressunder the construction loads is 174 psi (1.19 MPa) which is considerably lessthan 4 / f£ = 243 psi (1.66 MPa). With 1 3/4-in cover for the tension rein-forcement (d = 8.3 in), the punching shear stress would still be lower than
the nominal strength, 205 psi vs. 243 psi. It is also clear that had propersize high chairs been used for the 8-in slab such that the tension reinforcementhad a 3/4 in cover (d = 6.3), the punching shear stress would have been lessthan the nominal strength, 218 psi vs. 243 psi. Only when the design error(which resulted in an 8- in slab) and the use of improper size chairs (whichresulted in 1 3/4-in cover) occur simultaneously, the punching shear stressexceeds the nominal strength, 275 psi vs. 243 psi at column G-2. Thus,
97

Table 6.1 Punching Shear Stresses at Column G-2 for 11 and8 in Slab Under Actual Construction Loads
8-in Slab 11-in Slab
d = 6.3 in (3/4 in cover)v = 218 psi
v/(4 / f£) = 0.90
d = 9.3 in (3/4 in cover)v = 174 psi
v/(4 /~f£) = 0.72
d = 5.3 in (1 3/4 in cover)v = 275 psi
v/(4 /"fj) = 1.13
d = 8.3 in (1 3/4 in cover)v = 205 psi
v/(4 /~fj) = 0.84
1 in = 25.4 mm
100 psi = 0.69 MPa
the lack of consideration of punching shear in the design of the slab resultedin a reduction of the margin of safety such that the slab had little reservestrength to accommodate construction errors. Based on this analysis, it is
clear that both the design error and the use of chairs having insufficientheight contributed to the collapse.
6.4 PROBABLE MODE OF FAILURE
The analysis of the structure has shown that failure of the fifth floor wasmost likely initiated at column G-2. This conclusion was corroborated by the
witness accounts. The loss of support at column G-2 was due to punchingshear failure of the slab rather than failure of the column below theslab. The computed strength of the column at the time of failure was morethan three times the stress produced by the loading.
When the slab failed, the portion of loads originally resisted in shear at the
four sides of column G-2 was transferred to four adjacent columns (columns F-2
,
G-l , G-3 ,and H-2). This transfer action resulted in a substantial increase
in the total shear in the slab-column connection at these four columns. Like-wise, moments transferred to these four columns would also have increased the
moment- induced shear stresses. Because shear stresses in the slab-columnconnection at these columns were already near the limiting shear strength of
the slab, this transfer action would have precipitated punching shear failure
at these four locations, which in turn would have triggered failures at othercolumn locations. The propagation of punching shear failure continued untilit swept through the entire fifth floor slab.
Once the fifth floor had failed and landed on the fourth floor, punchingshear failure of that slab was inevitable. The total weight of the roof and
the fifth floor slab was more than enough to produce shear stresses greater
98
than the shear strength of the fourth floor slab. The third and second floorslabs failed by the same process. Thus, collapse of the entire structure wasinitiated by punching shear failure of the slab at the fifth floor level.
It is concluded that the most probable cause of the failure was the lack of
adequate punching shear capacity in the fifth-floor slab at several of thecolumns to resist the applied construction loads. This deficiency was broughtabout by the design inadequacy which resulted in the slab thickness of 8 ininstead of 11-in and by the placement of the top reinforcement at the columnstrips with significantly greater cover than that which would have met thecover requirement specified by the structural drawings. This resulted in aninsufficient effective depth of the fifth floor slab to resist punching shearunder construction loads.
99

(a) (b)
Figure 6.1' Shear stress distribution at interior column
Figure 6.2 Shear stress distribution at edge column
(a) (b)
Figure 6.3 Shear stress distribution at corner column
100
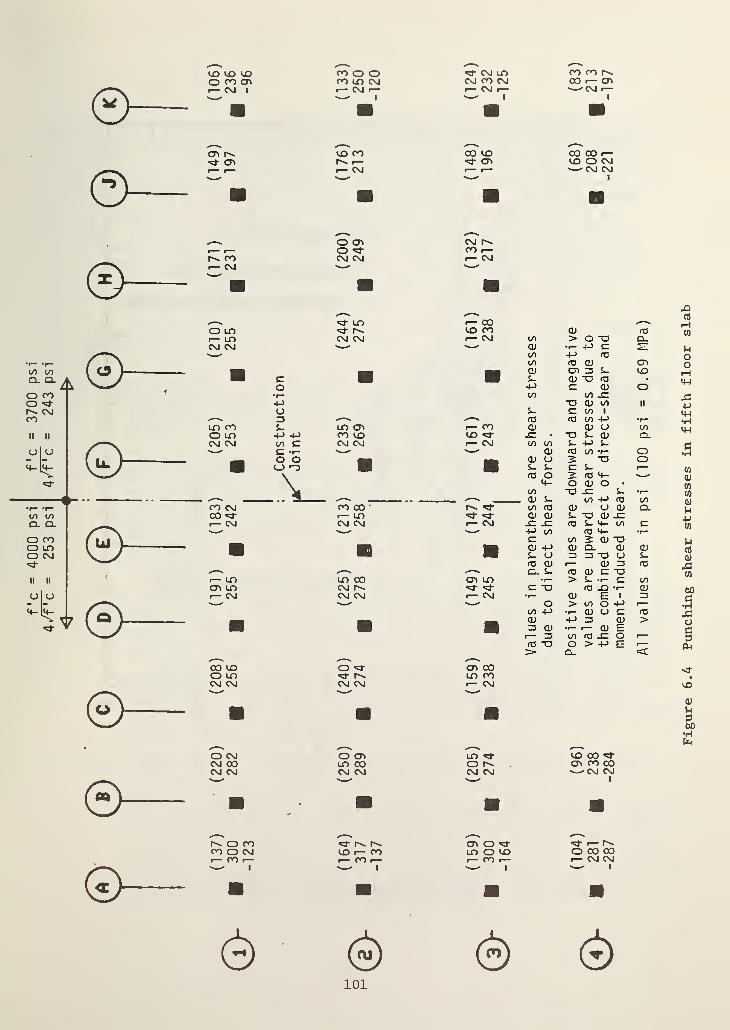
4000
psi
f'c
=
3700
psi
253
psi
4/Pc
=
243
psi
n n
o4-
O
CO UO UO CO 0 0 o- cm un CO CO NO CO CT> CO LO CM CM CO CM 00 r— <n1— CM 1 <— CM 1
—1— CM 1
— CM 1—
- " 0'
| 1
a a
cn UO co co uo 00 00 r-«=i- cn r~^ 1
— cn UO O CM1— r— r- CM r- r— CM CM
* 1
m a m a
^—
*
0 cn cm n-,— r— 0 <et- CO 1
—r-~ co CM CM CMr— CM >—V,
a mrOCQ
„ mT un f— 00 S' ^ rHO LT> uo CO cu n3 CO1— ID CM CM 1— CM 00 > 0 -a ClCM CM " '* cu •
1- -P 3
}-l' + CO 40 ro 0
CO res cu cn 0e a a cu
z.cn 3 3cu "a res
UO rH*4H0 +-> 3 as 0
•r— CO LO .0+j TD CU UO 11 jj0 s_ £C UO 1 m
^ V 3 *—
^
03 res uo +-> •1—
UO CO 5- un cn 1— CO cu cu 0 00 440 cn +j +j co uo UO «vf sz • "o s~ as ClCM CM 10 C CM CM r— CM to CO 3 -t-> 3
ti** " C -r- ' + cu res UO •!— O •HO OO *-D a O) u
3 Z.2 XJ3 3
OCO
_Y_TO O
4-IOCU s-uo ro
2 ro 4-0 as 0 •or 3
00 +4 ro
cu u cu
•r“OOQ-
CU
ww<u
CO CM co 00CO «3- 1— un o> CU 3 -O CD -3 Jjr— CM CM CM r- CM -3 -3 ro S- 4- uo 3
Cfl* V -» '
' +-> uo ro 4- •r~3 to 2 CD "O ua a cu +->
Z. 0CD CL CU3 3 "O O
CDZ.
CO
0)rei O) r— CU 3 03 o
X > ^—
V
^ N CL 3 ro CU C "O w1 LO un co cn un •I— > 3 •!- O 00cn un CM I""- e "o ro O t- CD CxOr— CM CM CM r— CM •1
—
CD E 1 3 cV " V—
^
V " 0 > 00 O 4-> r— •HUO 4-> •r— CU O 3 ro ,0
a a CU3 CU
+-> 3 CD•r- r— CD E
> ac1— 3 to ro -3 O 1
res "O O > +-> E 1
FU> C_ <^ X ^ s ^CO uo 0 «=!- cn co0 un ^ r^. un co •
CM CM CM CM 1— CM uO' " V ^ *S ^
CU
a a 360•HpH
O CM 0 cn LO ^ UO CO M-CM CO un co O cn co 00CM CM CM CM CM CM CM CM—
"
1
• a a B^
^
^ xNO O *3- CTiOuf *3- r—CO O CM uo *— co un 0 uo O 00 CO1— CO r— r— CO 1
— .— CO 1— 1— CM CM
'— 1 — 1 —- 1w 1
a a m
6) '
(S) (^) (Z>101

16
14
a<9
10
VTEST
bd/F7
C = column width
d = effective slab depth
h = perimeter of critical section
08 m
* gfsj 7.
^ < f-
O
Q> §o
for illustration purposes only
i . i
10
c/d
Figure 6.5 Results of punching shear tests of slab-columnconnections (ref. 6.1)
102
7 SUMMARY AND CONCLUSION
As a result of the collapse of a five story reinforced concrete building duringconstruction at Cocoa Beach, Florida, the National Bureau of Standards (NBS)
was requested by the Occupational Safety and Health Administration (OSHA) to
carry out an in-depth study aiming at the determination of the most probablecause of the collapse. In response to this request, NBS has carried out com-prehensive field and laboratory investigations, including tests of concreteand reinforcing steel. NBS also performed analytical evaluation of the
response of the structure under the loading condition which existed at the
time of the collapse. The findings based on the results of the NBS studyare presented in this report, together with other information such as struc-tural drawings and calculations and OSHA case records. The conclusions drawnfrom this study are summarized in the following statements:
(1) The structure as built had a number of deviations from standard practiceof construction.
(a) A number of columns examined disclosed that the inclined portion ofoffset bars above the floor level were bent more than 1 in 6 asrequired by the ACI Code. Furthermore, the bars were not placedparallel to the axis of the column above the offset bend.
(b) The placement of a large number of large-size reinforcing bars(12 - #8 through 16 - #11) for lap splices in 10 in x 18 in (254 mm x
457 mm) columns created a congestion of bars which violated the ACICode requirement for clear spacing. Examination of columns showedthat such a congestion prevented flow of concrete into the spacebetween reinforcing bars. This lack of concrete prevented the
development of adequate bond between reinforcing bars.
(c) Both the reinforcing steel shop drawings and field measurementsrevealed that 4-1/4 in (108 mm) individual high chairs were used to
support the two-way top layer reinforcing steel for the slabs at thecolumn strips. This resulted in a net concrete cover ranging from1-5/8 in (41 mm) to 2-1/8 in (54 mm) with an average effective depthof the slab of 5.3 in (135 mm). This was about 1 in (25 mm) lessthan the effective depth corresponding to the 3/4 in (9.5 mm) coverspecified in the structural drawings. Excessive concrete coverreduced the effective depth of the slab, thereby reducing the punchingshear capacity of the slab.
(2) The results of tests on core samples and laboratory prepared specimenswere used to predict the strength of concrete at the time of failure.
(a) The results of tests on cores obtained from the floor slabs indicatedthat the compressive strength of the slab concrete met the specifica-tion value. That is, the compressive strength of cores exceeded 85
percent of the specified value of 4000 psi (27.6 MPa). However, the
average compressive strength of cores obtained from the fifth-storycolumns fell below the 85 percent requirement. The strengths of the
103
cores obtained from the third- and fourth-story columns meet thisrequirement
.
(b) There are no indications that a gross error was committed in concreteproportioning. However, the petrographic analysis of core samplesrevealed high variability in volumetric proportions of paste andaggregate. High variability was also noted in core strengths.
(c) The result of the NBS laboratory tests and the results of core testsagreed well. Based on the laboratory tests, the estimated compressivestrength of concrete at the time of collapse was 3700 psi (25.5 MPa)and 4000 psi (27.6 MPa), respectively, for the north- and south-halvesof the fifth floor slab, and 2900 psi (20.0 MPa) and 3100 psi(21.4 MPa), respectively, for the north- and south-halves of thefifth-story columns.
(3) The analysis of the structure showed there are two major contributingfactors which caused the collapse.
(a) The use of lower individual chairs for supporting the top layerreinforcing bars in the column strips than required to provide the3/4 in (19 mm) cover called for in the structural drawings reducedthe effective depth and punching shear capacity of the slab.
(b) Omission in the slab design of a check for punching shear resulted inan 8-in (203-mm) slab whih was shallower than needed to safely supportthe design loads for the completed structure. This reduced the marginof safety such that the slab had insufficient reserve strength to
accommodate the use of 4-1/4-in (108-mm) individual high chairs withinthe column strips.
(4) The analysis showed that failure of the slab most likely initiated at
Column G-2. The analysis also showed that the shear stresses at manycolumn locations on the fifth floor exceeded the nominal shear strength.Once punching shear failure had initiated at column G-2, it propagatedthroughout the slab causing the total collapse of the fifth floor, which,in turn, caused the successive collapse of the lower floor slabs.
104

8 ACKNOWLEDGMENTS
The authors acknowledge the contributions made by the following persons:
Dr. E. 0. Pfrang provided technical guidance and constructive criticism;Dr. E. V. Leyendecker and Dr. W. C. Stone critically reviewed the report;and the staff of the CBT Word Processing Center typed the manuscript.
105

9. REFERENCES
2.1 ACI Standard 318-77, Building Code Requirements for Reinforced Concrete,American Concrete Institute, Detroit, Michigan, 1977.
2.2 Standard Building Code, Southern Building Code Congress International,Birmingham, Alabama, 1979.
3.1 Malhotra, V. M., Superplasticizers: Their Effect on Fresh and HardenedConcrete, Concrete International, V3, No. 5, pp. 66-81, May 1981.
4.1 Annual ASTM Standards , Part 14, American Society for Testing andMaterials, Philadelphia, PA, 1981.
4.2 Plowman, J. M., Maturity and Strength of Concrete, Magazine of ConcreteResearch 8_, No. 22, pp. 13-22, March 1956.
4.3 Carino, N. J., Temperature Effects on the Strength-Maturity Relation of
Mortar, National Bureau of Standards (U.S.), NBSIR 81-224, 98 pp, March1981.
5.1 Nielson, K. E. C., Loads on Reinforced Concrete Floor Slabs and theirDeflections During Construction, Bulletin No. 15, Swedish Cement andConcrete Research Institute, Royal Institute of Technology, Stockholm,1952.
5.2 Grundy, P., and Kabaila, A., Construction Loads on Slabs with ShoredFormwork in Multistory Buildings, ACI Proceedings, V. 60
,No. 12,
pp. 1729-1738, December 1963.
5.3 Taylor, P. J., Effect of Formwork Stripping Time on Deflections of FlatSlabs and Plates, Australian Civil Engineering and Construction (Mel-bourne), V. 8 , No. 2., pp. 31-35, February 1967.
5.4 Corley, W. G. and Jirsa, J., Equivalent Frame Analysis for Slab Design,
J. American Concrete Institute, V. 67, No. 11, pp. 875-885, November1970.
5.5 ICES STRUDL-II Engineering User’s Manual, MIT, Report R68-91, November1968.
5.6 Przemieniecki, J. J., Theory of Matrix Structural Analysis , McGraw-Hill, N.Y., 1968.
6.1 ACI-ASCE Committee 426, The Shear Strength of Reinforced ConcreteMembers - Slabs, Journal of the Structural Division, ASCE, V. 100, August1974.
6.2 Leyendecker, E. V. and Fattal, S. G., Investigation of the Skyline PlazaCollapse in Fairfax County, Virginia, Nat. Bur. Stand. (U.S.), Bldg. Sci.
Ser. 94, June 1973.
106

6.3 Litle, W. A., The Boston Collapse at 2000 Commonwealth Avenue, Boston,Mass., Symposium on Progressive Collapse, ACI Annual Convention, Boston,April 1975.
6.4 Neth, U. W., DePaiva, H. A. R., and Long, A. E., Behavior of Models of
Reinforced Concrete Flat Plate Edge-Column Connection, J. AmericanConcrete Institute, V. 78
,
No. 4, pp. 269-275, July-August 1981.
107


APPENDIX A
RESULTS OF TESTS ON SAMPLES FROM
THE SITE
A-l

TABLE
A.
1
AGGREGATE
TEST
RESULTS
co oO o o om N© —* ma n
g • o m m 8 uo oV) O O C7N CM< z ^ i) 11 6 8 8 i i i i ii i i i t ii i i i i
U3©X ^t-l —
«
O <o ^ ON 4 N HO O' vO h ll(S
OOnnONOOO<r cooooo-^oo• ••••••••oocnoooooooo
*4“
co
. 2i-J *HW ©> a8—I — C0
35 -2 CU3 < ©
cau
co ©ro ao ©*
QO
s .
m O< 2
O NO n N N vOo ® sr n
8 —
oo o o^ fO H (A18 0 1o^oooo © ->*
8 18-1
On Or- m
8 8 0 8 8
8 8 8 8 9
ONN^OvOcO^cnOOOOcooOCOOOOOOOOOO
v©
8 8 8 8 1 1 8 8 9 8
qo
CO
J£~4 CO2 On <
gsCO< O
8 0 8 —
•
WM CO
*-* <Q
Ow <>H-
4
2 CM
= 3
o 00 00 COO O' CO
8 8 8 9 8
m m• ®m cm
8 9 8
O O X —
«
oomoooa •HHCO'Snn 0CO6 8 8 6 9 9 9Oinoow"»o<N»ncoOOCOaNh •
8—« CM
CM
8 co
aaaHVt
o
vOCMfO—«O°000~HCMOOOOCMOO
g?•HaaB 8 9 8 8
a04
a >
co
<r v©o n© o co cm —iOv© mo O' N (M ••• 0 gO
8—« o CM CM H 0 3
oCO
on inocoooa'CcmnnO'C ^rO O' ON O' N N • ® *M.9 8 9 O CM CM H O
goO O' (M ^ CO CM CO —* vO i©O On ON vO CM ••• •
8 ~4 O CM CM H o
I I I • » 8 8 i I I
0©0©0<^<n0vO — ©OOOCNIO©• o ••••••»•r^MTOOOOOOOO
8 19 9
O^^^O'Cv©'©-^OOOOCOOOGOONOOOOOOOO
OOO—•O'O-—m ooooocm^o• ©ooosoo©r^^oooooooo
aooa©0000a
COOOOOOOOOO Mh
6co
oo©aex
>
3cra
£a©co
•g
cCO U
T3a ao @D
ff-H £ a3 § apa 5 ©
© cxa u o X
m > •H •H a3 © a © 8
a *—
4
—
i
a >\ © a3 > ©>
S~5 >-l a ©a *© a a ^ a n X a H>n o © H c o © a aH X. o Ou Ci < © a © aa o| © > B B a a ac a © •H -* u 3 3 © c a a a< O o a •H u
4-jj a a © i •H a o T3 a *—
<
8 V© o o o o a *© •H a © —
i
O 3 m e a c X) •H © xa CM G© co in CM C C kd *rH a 3 •H a 3 a o © © a 3> 2 8 S QJ U a 0 B -© O C *H a X' a o VW c—
4
a CM CO C a cc crJ a m C H co-o © © u H H Of-4 8 s O O © o o o O •v-4 a © x| X o © a o o a •H X 3 COCO co —
*
co 2 z 2 2 2 z 2 Ca* co o <1 u O. CJ o r to o< o OQ o CO •K
A-
2

TABLE A.
2
CEMENT ANALYSIS RESULTS
SAMPLE
PHYSICAL DATA:Time of setting, Gillmore
Initial, hrrminFinal, hr:min
Autoclave Expansion, Z
Fineness Blaine, m2/kgCompressive Strength, psi
1 day3 days
7 days28 days
Air Content, Z vol
CHEMICAL ANALYSIS :
Silicon Dioxide, XAluminum Oxide, XFerric Oxide, XCalcium Oxide, XMagnesium Oxide, XSulfur Trioxide, XAlkalies, XLoss on Ignition, XInsoluble Residue, XTricalcium Silicate, C3S, XDicalcium Silicate, C2S, XTricalcium Aluminate, C3A, XTetracalcium Aluminoferrite, C4AF,
AOl A12 ASTMUNIVEL DIXIE C150,TYPE
3:00 1:42 1:00 min.
4:46 2:54 10:00 max+0.04 +0.06 0.80 max.400 392 • 280 min.
1490 1640 —
3030 2810 1800 min.
3890 3870 2800 min.5460 5370 3500 min.
7.7 6.5 12.0 max.
20.1 19.2 -
3.7 4.5 -
3.0 3.3 -
60.0 61.3 -
3.9 0.7 6.0 max.3.0 2.9 3.0 max.
•
0.64 0.42 0.60 max.*0.90 1.43 3.0 max.0.42 0.04 0.75 max.
56 60 -
15 10 -
4.7 6.5 -
9 10 -
For low alkali cement

TABLE A.
3
WATER TEST RESULTS
SAMPLE AO A AOS A15
MIXUNIVEL
PONDDIXIEMIX
pH, electrometric 7.2
ANALYSIS
7.6 7.9Alkalinity as ppm CaC03
Phenolphthalein 0.0 0.0 0.0
Total 70 204 46Total Hardness as ppm
CaC03 60 612 74
Calcium, ppm 20.1 142.0 16.0Magnesium, ppm 2.
A
62.7 8.3
Sodium, ppm 80 370 75
Potassium, ppm 5 25 4
Manganese, ppm * * *
Phosphorus, ppm 0.1 0.1 0.1Iron, ppm A.O 0.4 0.6Carbonate, ppm 0.0 0.0 0.0Bicarbonate, ppm 85.4 248.9 56.1
Chloride, ppm 300 2080 320Sulfate, ppm 60.0 82.8 58.0Conductivity, micromhos
per cm 580 2400 520
*Less than 0.05 ppm
A-4

TABLE A.
A
ADMIXTURE TEST RESULTS
SAMPLE AO6 AO 7 AO 8 AO 9
UNIVELDAREX 79 19 TYPE 3
Specific Gravity@ 75 C 1.016 1.229 1.175
Total Solids, % 5.9 A1.8 34.
5
1.157
31.1
A16 A17DIXIE
DAREX 79
1.013 1.182
5.7 39.734.5

Table A. 5. Core Compressive Strength Test Results
ri
SectionNo. Core No.
T1
Dia.
(in)
Length (in)
DrilledI Test
Age at Test(days)
CompressiveStrength (psi)
rComments
1 3rd Floor I 6C 2 T 2.95 10 5 7/8 34 36 4360| |
1 r 6C 3 T 2.95 10 5 7/8 34 36 4190| |
1 r 6C 41 2.95 10 5 1/2 41 43 4650
| |
c 1 i 6C 5 12.95 6 1/4* 5 3/4 41 43 3810
| |
1 r 6C 6 T 2.95 10 5 7/8 55 57 4460| |
0 1 i 6C 7 T 2.95 10 5 7/8 55 - 57 4560| |
1 4th Floor | 6C 41 3.95 10 7 7/8 27 30 3270
| |
L 1 1 4C 7 T 3.95 10 7 7/8 27 30 3390 steel embedment at 2 loca-
1 1 1tlons, 1 ” in from each end
U 1 1 4C 81 3.95 10 7 7/8 27 - 30 4170
| |
1 r 5C 213.95 10 7 7/8 34 37 3860
| |
M 1 i 6C 5 T 3.95 10 7 7/8 34 37 3630| |
1 r 4C 3 T 3.95 10 7 7/8 48 51 3750| |
N 1 i 2C 6 T 3.95 10 7 7/8 48 51 4230| |
1 5th Floor| 1C 1 T 3.95 10 7 7/8 20 22 2900
| |
S 1 1 3C 7 T 3.95 10 7 7/8 20 22 3080| |
1 f 2C 3 1 3.95 10 7 7/8 27 - 29 3620
1 1 4C 5 1 3.95 10 7 7/8 27 “ 29 3190
1 1 3C 4! 3.95 7 3/4* 5 7/8 41 - 43 3040
1 1 5C 61 3.95 10 7 7/8 41 43 3610
1 2nd Floor I7 2A (top) T 2.18 8 1/2 4 1/2 41 4870
1 (north) | 2B ( bottom) I 2.18 8 1/2 4 1/4 41 5050 wire mesh embedment1 1 8 6
12.95 8 5 7/8 41 4930 crack in tested core with initial
1 1 1fracture at crack location
1 17 3
12.18 7 3/4* 4 1/4 48 5320 crack in one face, extending 3"
1 1 1 into core1 1
8 41 2.95 5 1/4* 4 1/4 48 5420 core has thin spall (approx. 2
"
1 1 1 length) on one end; tested with1 1 1 this shaved section1 1 8 7
12.95 6 l/2* 5 l/2 62 4710
1 1 8 812.18 5 1/2* 4 1/4 62 5130
1 3rd Floor I 5 312.95 6 1/2* 5 5/8 35 5110
1 (north)| 10 7
1 2.95 8 1/4 6 35 5490
1 1 5 212.95 7 1/2* 5 7/8 42 6090 horizontal crack around 50 percent
1 1 1 of perimeter1 1 6 5
1 2.95 6 1/2 5 7/8 42 5790
1 1 5 412.95 8 5 5/8 56 4640
1 f 6 61 2.95 6 1/2 5 56 6640
i 3rd Floor I 12 2 T 2.95 8 6 37 60201 (south) | 12 6
12.95 8 5 7/8 37 4540
| |
1 1 12 4 T 2.95 7 3/4 5 1/2 44 6180
1 1 12 7I2.95 8 1/4 5 7/8 44 5490
1 1 12 31 2.95 7* 5 5/8 58 5640
1 1 12 5 1 2.95 8 5 7/8 58 5730S 1 4th Floor |
4 31 2.95 6 1/4 3 7/8 28 4100
1 (north)| 3 5
12.95 8 5 7/8 28 4270
L 1 1 4 2! 2.18 6 1/2 4 1/4 35 4360 crack in one face, extending
1 1 14" into core
A 1 1 3 41 2.95 8 5 7/8 35 4900 horizontal crack around 50
1 1 1 percent of perimeter, did notB 1 I 1 break at crack
1 1 3 612.95 6* 5 1/4 49 5200
S 1 !9 7
1 2.95 8 5 1/4 49 55001 4th Floor
|13 2
12.95 8 5 7/8 30 4960
1 (south) | 13 51 2.95 8 4 3/4 30 2640 2 intersecting cracks on one face.
1 1 13 cracks extending 6" into core
1 1 13 3 T 2.95 5 1/2* 4 3/8 37 5220 ;
1 1 131
41 2.95 6* 4 51 4900 I 1
1 1 13 612.95 8 5 l/2 51 4300 horizontal, semicircular crack
1 11
around 50 percent of perimeter.
1 1 1 not intersecting faces; crack1 1 1 within tested section1 5th Floor
|2 3 T 2.95 8 5 7/8 21 5010
1 (north)| 2 4 T 2.95 5 1/2* 4 5/8 21 4050
1 1 2 2 T 2.95 5 l/2* 4 1/2 28 5190 hairline crack extending length of
1 1 1core; crack across one face
1 f 2 6A ( top) T 2.18 8 3 1/2 28 62601 1 6b ( bottom) 1
2.18 8 4 28 48901 1 2 5
1 2.95 8 5 7/8 42 57901 1 2 7 T 2.18 6* 3 1/4 42 51501 5th Floor
| 14 31 2.95 8 1/8 5 7/8 23 3690
1 (south)|
14 41 2.95 6 1/4* 5 7/8 23 3740
1 f 14 21 2.95 8 1/8 5 30 4140 cracks 2 1/2" into core at 2 loca-
1 11 tions after trimming
1 114 6 T 2.95 7 7/8* 5 7/8 30 4680 i
!
1 1 14 5 T 2.95 8 5 1/2 44 4710 | 1
1 1 14 71 2.95
|8 5 1/4 44 5020 1 1
* Broken core not extending through structure.1 In “ 25.4 mm1000 psi « 6.9 MPa
A-
6
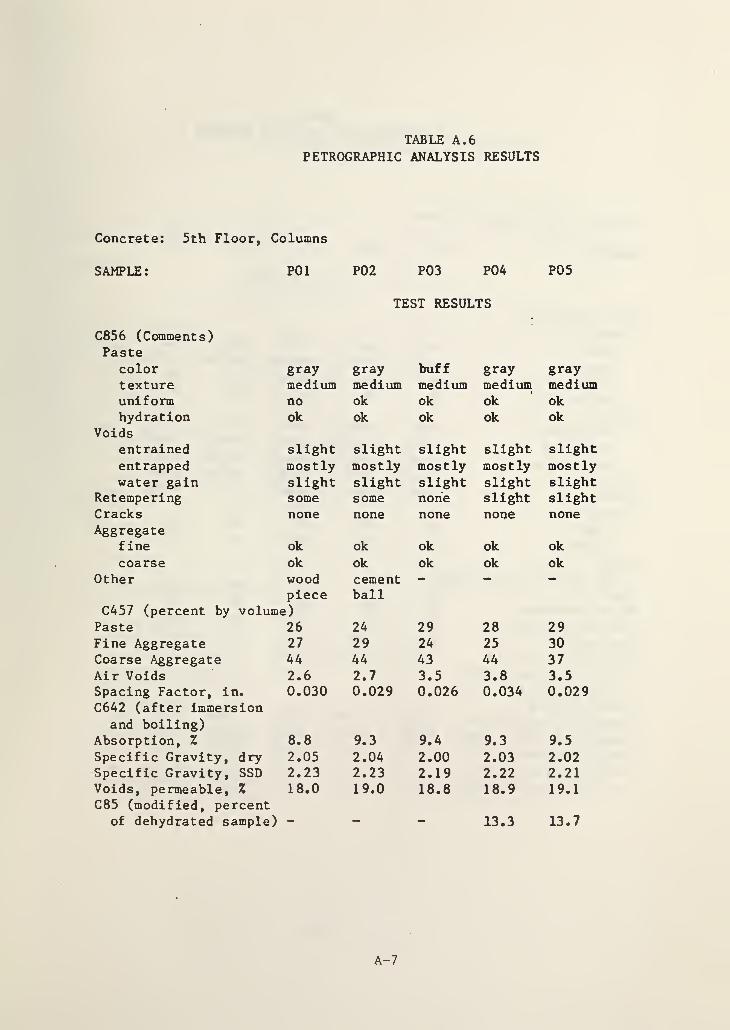
TABLE A.
6
PETROGRAPHIC ANALYSIS RESULTS
Concrete: 5th Floor, Columns
SAMPLE: P01 P02 P03 P04 P05
TEST RESULTS
C856 (Comments)Paste
color gray gray buff gray graytexture medium medium medium medium mediumuniform no ok ok ok okhydration ok ok ok ok ok
Voidsentrained slight slight slight slight slightentrapped mostly mostly mostly mostly mostlywater gain slight slight slight slight slight
Retempering some some none slight slightCracksAggregate
none none none none none
fine ok ok ok ok ok
coarse ok ok ok ok okOther wood cement - - -
piece ballC457 (percent by volume)Paste 26 24 29 28 29Fine Aggregate 27 29 24 25 30Coarse Aggregate 44 44 43 44 37Air Voids 2.6 2.7 3.5 3.8 3.5Spacing Factor, in.
C642 (after immersion0.030 0.029 0.026 0.034 0.029
and boiling)Absorption, Z 8.8 9.3 9.4 9.3 9.5
Specific Gravity, dry 2.05 2.04 2.00 2.03 2.02Specific Gravity, SSD 2.23 2.23 2.19 2.22 2.21Voids, permeable, Z
C85 (modified, percent18.0 19.0 18.8 18.9 19.1
of dehydrated sample) - - - 13.3 13.7
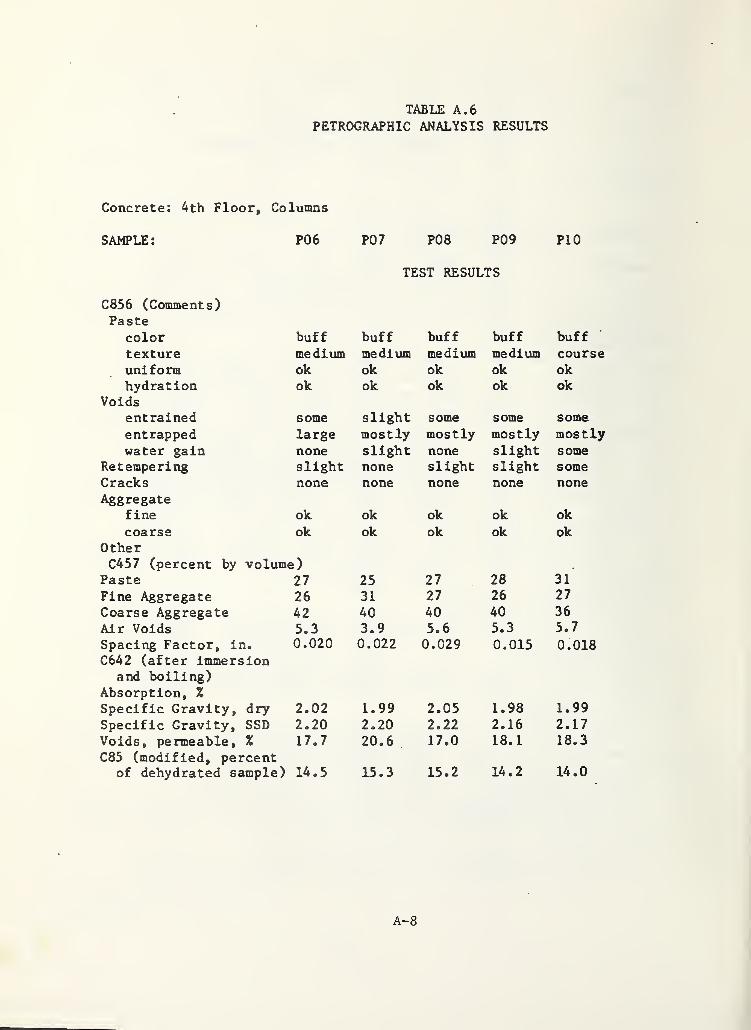
TABLE A.
6
PETROGRAPHIC ANALYSIS RESULTS
Concrete: 4th Floor, Columns
SAMPLE: P06 P07 P08 P09 P10
C856 (Comments)Paste
color buff
TEST RESULTS
buff buff buff buff'
texture medium medium medium medium courseuniform ok ok ok ok okhydration ok ok ok ok ok
Voidsentrained some slight some some someentrapped large mostly mostly mostly mostlywater gain none slight none slight some
Retempering slight none slight slight someCracks none none none none noneAggregate
f ine ok ok ok ok ok
coarse ok ok ok ok okOtherC457 (percent by volume)
Paste 27 25 27 28 31
Fine Aggregate 26 31 27 26 27
Coarse Aggregate 42 40 40 40 36
Air Voids 5.3 3.9 5.6 5.3 5.7
Spacing Factor, in. 0.020 0.022 0.029 0.015 0.018C642 (after immersion
and boiling)Absorption, %
Specific Gravity, dry 2.02 1.99 2.05 1.98 1.99
Specific Gravity, SSD 2.20 2.20 2.22 2.16 2.17Voids, permeable, % 17.7 20.6 17.0 18.1 18.3
C85 (modified, percentof dehydrated sample) 14.5 15.3 15.2 14.2 14.0
A-8

TABLE A.
6
PETROGRAPHIC ANALYSIS RESULTS
Concrete: 3rd Floor, Columns
SAMPLE: Pll
TEST RESULTS
C856 (Comments)Paste
color bufftexture mediumuniform okhydration ok
Voidsentrained someentrapped mostlywater gain none
Re tempering someCracks noneAggregate
f ine ok
coarse okOther -
C457 (percent by volume)Paste 27
Fine Aggregate 24
Coarse Aggregate 45
Air Voids 4.3Spacing Factor, in. 0.019C642 (after immersion
and boiling)Absorption, Z 8.5Specific Gravity, dry 2.03Specific Gravity, SSD 2.20Voids, permeable, Z 17.2
C85 (modified, percentof dehydrated sample) —

TABLE A.
6
PETROGRAPHIC ANALYSIS RESULTS
Concrete: 5th Floor, Slab
SAMPLE: P12 P13 P14
C856 (Comments)Paste
TEST RESULTS
color gray gray bufftexture medium fine coarseuniform ok ok okhydration
Voidsok ok ok
entrained slight some slightentrapped mostly mostly mostlywater gain none slight none
Retempering some some someCracksAggregate
none none none
fine ok ok ok
coarse "dry" ok okOther -
C457 (percent by volume)
«
Paste 30 28 27
Fine Aggregate 30 30 26Coarse Aggregate 36 39 44
Air Voids 4.3 2.6 3.2Spacing Factor, in.
C642 (after immersionand boiling)
0.026 0.017 0.023
Absorption, I 9.7 9.5 8.7Specific Gravity, dry 2.02 2.04 2.08Specific Gravity, SSD 2.22 2.23 2.26Voids, permeable, Z
C85 (modified, percent19.7 19.4 18.2
of dehydrated sample) — 11.0 12.41
A-10

TABLE A.
6
PETROGRAPHIC ANALYSIS RESULTS
Concrete: 4th Floor, Slab
SAMPLE: P15 P16
C856 (Comments)Paste
TEST RESULTS
color buff bufftexture coarse coarseuniform ok okhydration
Voidsok ok
entrained some slightentrapped mostly mostlywater gain some none
Retempering some someCracksAggregate
none none
fine ok ok
coarse ok okOther - -
C457 (percent by volume)Paste 27 24
Fine Aggregate 28 25Coarse Aggregate 39 47
Air Voids 6.3 3.3Spacing Factor, in.
C642 (after immersionand boiling)
0.012 0.022
Absorption, X 8.3 7.9Specific Gravity, dry 2.04 2.10Specific Gravity, SSD 2.21 2.26Voids, permeable, %
C85 (modified, percent16.9 16.5
of dehydrated sample) 14.4 12.6
A-ll
TABLE A.
6
PETROGRAPHIC ANALYSIS RESULTS
Concrete: 3rd Floor, Slab
SAMPLE: P17 PI 8
C856 (Comments)Paste
TEST RESULTS
color buff bufftexture medium mediumuniform no nohydration
Voidsok ok
entrained slight slightentrapped mostly mostlywater gain none none
Retempering slight someCracksAggregate
none none
f ine ok ok
coarse ok okOther - -
C457 (percent by volume)Paste 27 31
Fine Aggregate 27 25
Coarse Aggregate 44 43
Air Voids 2*4 1.3Spacing Factor, in®
C642 (after immersionand boiling)
0*034 0.027
Absorption, % 7.9 8.1Specific Gravity, dry 2.12 2.12Specific Gravity, SSD 2.29 2.29Voids, permeable, Z
C85 (modified, percent16.7 17.2
of dehydrated sample) 13.3 12.2
A-12
TABLE A.
6
PETROGRAPHIC ANALYSIS RESULTS
Concrete: 2nd Floor, Slab
SAMPLE: PI 9
TEST RESULTS
C856 (Comments)Paste
color bufftexture mediumuniform nohydration ok
Voidsentrained slightentrapped mostlywater gain none
Retempering slightCracks noneAggregate
fine ok
coarse okOther -
C457 (percent by volume)Paste 31
Fine Aggregate 27Coarse Aggregate 40
Air Voids 1.8Spacing Factor, in.
C642 (after immersionand boiling)
Absorption, Z 8.7Specific Gravity, dry 2.07Specific Gravity, SSD 2.23Voids, permeable. Z 18.0C85 (modified, percent
of dehydrated sample)
A-13

TABLE A.
6
PETROGRAPHIC ANALYSIS RESULTS
Concrete: Average Results
SAMPLE: COLUMNS SLABS.
C856 (Comments)Paste
color
TEST RESULTS
buff (4 gray - 7 buff) buff (2 gray - 6 buff)texture medium mediumuniform ok variablehydration ok ok
Voidsentrained slight- some slightentrapped mostly mostlywater gain some instances few instances
Retempering some instances some instancesCracks none noneAggregate
fine ok okcoarse ok ok
Other - -
C457 (percent by volume)Paste 27 (1.9) 28 (2.5)Fine Aggregate 27 (2.3) 27 (1.9)Coarse Aggregate 41 (2.9) 41 (3.6)Air Voids 4.2 (1.1) 3.2 (1.6)Spacing Factor, in. 0.025 (0.006) 0.024 (0.007)C642 (after immersion
and boiling)Absorption, Z 9.1 (0.6) 8.6 (0.7)Specific Gravity, dry 2.02 (0.02) 2.07 (0.04)Specific Gravity, SSD 2.20 (0.02) 2.25 (0.03)Voids, permeable, Z 18.4 (1.0) 17.8 (1.2)C85 (modified, percent
of dehydrated sample) 14.3 (0.8) 12.7 (1.2)
A-14
\
TABLE A.
7
SUMMARY OF CONCRETE TESTS
Concrete 5th Floor, Columns
SAMPLE: P01 P02 P03 P04 P05
Material Proportions,approximate, lbs./yd^
Cement* 454 451Fine Aggregate 1210 1299 1099 1112 1353Coarse Aggregate 1866 1874 1814 1844 1582Water** - - - 327 345
Admixture, X *** 0.02 0.01 0.02 0.01 0.06WRDA 79 X X X - XWRDA 19 - - - X -
Type III — — X —
Unit Weight, SSD,lbs. /ft. 3**** 139.2 139.2 136.7 138.5 137.9
Air Voids, X 2.6 2.7 3.5 3.8 3.5
Spacing Factor, in. 0.030 0.029 0.026 0.034 0.029
Absorption, X 8.8 9.3 9.4 9.3 9.5Permeable Voids, X 18.0 19.0 18.8 18.9 19.1
Notes:
*Cement content determined from C85, Modified C85 and dehydration to allowfor calcareous coarse aggregate (limerock) and calcareous material (shell)present in fine aggregate.
**Water estimate determined by using percentage of paste volume and calculatedcement content.
***Admixtures extracted from concrete using carbonate method forsulfonates. (X) indicates presence of admixture.
****Unit weight SSD estimate by using bulk SSD specific gravity (C642)after immersion and boiling.
A-15

TABLE A.
7
SUMMARY OF CONCRETE TESTS
Concrete 4th Floor, Columns
SAMPLE: P06 P07 P08 P09 P10
Material Proportions,approximate, lbs./yd3
Cement* 494 513 526 475 470Fine Aggregate 1166 1380 1210 1180 1223Coarse Aggregate 1771 1690 1696 1696 1523Water** 297 258 287 320 372
Admixture, % *** 0.05 0.08 0.06 0.09 0.02WRDA 79 - X X X XWRDA 19 - - - - -
Type III — — — — —
Unit Weight, SSD,lbs. /ft. 3**** 137.3 137.3 138.5 134. 8 135.4
Air Voids, % 5.3 3.9 5.6 5.3 5.7Spacing Factor, in. - 0.020 0.022 0.029 0.015 0.018
Absorption, Z 8.7 10.3 8.3 9.1 9.2Permeable Voids, % 17.7 20.6 17.0 18.1 18.3
Notes:
*Cement content determined from C85, Modified C85 and dehydration to allowfor calcareous coarse aggregate (limerock) and calcareous material (shell)
present in fine aggregate.
**Water estimate determined by using percentage of paste volume and calculatedcement content.
***Admixtures extracted from concrete using carbonate method forsulfonates. (X) indicates presence of admixture.
****Unit weight SSD estimate by using bulk SSD specific gravity- (C642)after immersion and boiling.
A-16
TABLE A.
7
SUMMARY OF CONCRETE TESTS
Concrete 3rd floor. Columns
SAMPLE: Pll
Material Proportions,approximate, lbs./yd^
Cement* -
Fine Aggregate - 1058Coarse Aggregate 1890
Water** -
Admixture, Z *** 0.02WRDA 79WRDA 19 XType III X
Unit Weight, SSD,lbs. /ft. 3**** 137.3
Air Voids, Z 4.3Spacing Factor, in., 0.019
Absorption, ' % 8.5
Permeable Voids, Z 17.2
Notes:
*Cement content determined from C85, Modified C85 and dehydration to allowfor calcareous coarse aggregate (limerock) and calcareous material (shell)present in fine aggregate.
** Water estimate determined by using percentage of paste volume and calculatedcement content.
***Admixtures extracted from concrete using carbonate method forsulfonates. (X) indicates presence of admixture.
****Unit weight SSD estimate by using bulk SSD specific gravity-(C642)after immersion and boiling.
A-17

TABLE A.
7
SUMMARY OF CONCRETE TESTS
Concrete 5th Floor, Slab
SAMPLE: P12 P13 . P14
Material Proportions,approximate, lbs./yd3
Cement* - 375 427Fine Aggregate 1323 1326 1148Coarse Aggregate 1517 1660 1852Water** — 352 319
Admixture, Z *** 0.02 0.10 0.08WRDA 79 - X XWRDA 19 X - -
Type III X — —
Unit Weight, SSD,lbs. /ft. 3**** 138.5 139.2 141.0
Air Voids, % 4.3 2.6 3.2Spacing Factor, in. 0.026 0.017 0.023
Absorption, Z 9.7 9.6 8.7Permeable Voids, Z 19.7 19.4 18.2
Notes:
*Cement content determined from C85, Modified C85 and dehydration to allowfor calcareous coarse aggregate (limerock) and calcareous material (shell)
present in fine aggregate.
** Water estimate determined by using percentage of paste volume andcalculated cement content.
***Admixtures extracted from concrete using carbonate method forsulfonates. (X) indicates presence of admixture.
****Unit weight SSD estimate by using bulk SSD specific gravity_ (C642)after immersion and boiling.
A-18
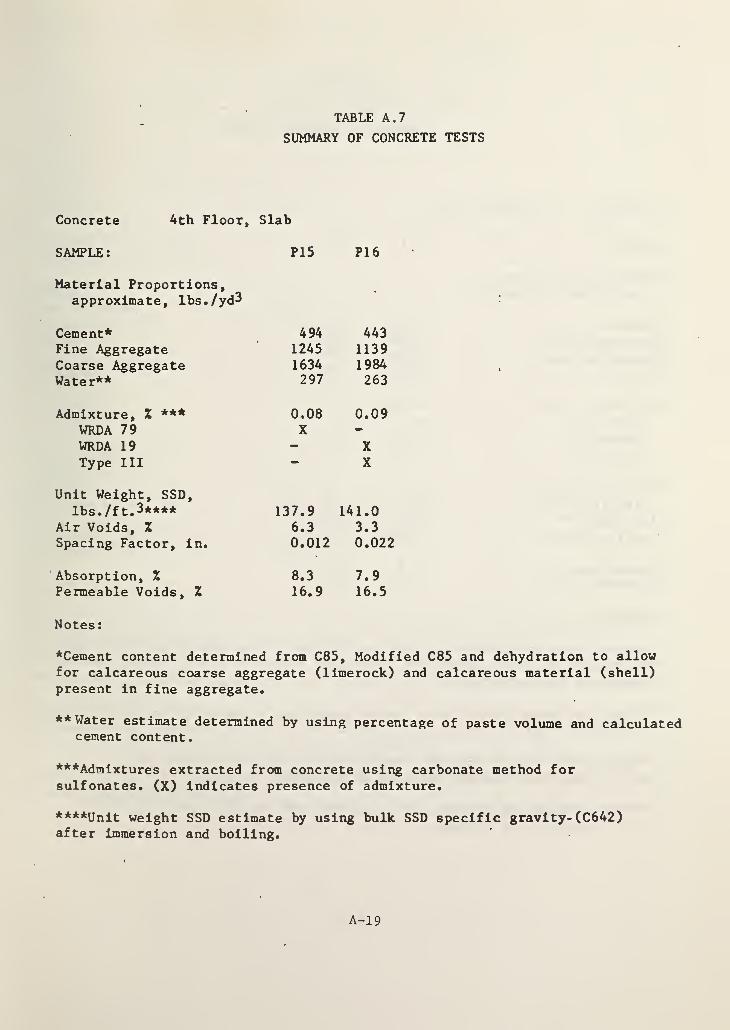
TABLE A.
7
SUMMARY OF CONCRETE TESTS
Concrete 4th Floor, Slab
SAMPLE: P15 P16
Material Proportions,approximate, lbs./yd^
Cement*Fine AggregateCoarse AggregateWater**
Admixture, Z ***
WRDA 79WRDA 19
Type III
Unit Weight, SSD,
lbs. /ft. 3****
Air Voids, Z
Spacing Factor, in.
Absorption, Z
Permeable Voids, Z
Notes:
*Cement content determined from C85, Modified C85 and dehydration to allowfor calcareous coarse aggregate (limerock) and calcareous material (shell)present in fine aggregate.
** Water estimate determined by using percentage of paste volume and calculatedcement content.
***Admixtures extracted from concrete using carbonate method forsulfonates. (X) indicates presence of admixture.
****Unit weight SSD estimate by using bulk SSD specific gravity- (C642)after immersion and boiling.
494 4431245 11391634 1984297 263
0.08 0.09X
XX
137.9 141.06.3 3.30.012 0.022
8.3 7.916.9 16.5
A-19

TABLE A.
7
SUMMARY OF CONCRETE TESTS
Concrete 3rd Floor, Slab
SAMPLE: ' P17 P18
Material Proportions,approximate, lbs./yd3
Cement* 475 435Fine Aggregate 1196 1102Coarse Aggregate 1833 1798Water** 303 383
Admixture, Z *** 0.01 0.01WRDA 79 - -
WRDA 19 X XType III X X
Unit Weight, SSD,
lbs. /ft. 3**** 137.9 141.0Air Voids, Z 2.4 '1.3
Spacing Factor, In. 0.034 0.027
Absorption, Z 7.9 8.1Permeable Voids, Z 16.7 17.2
Notes:
*Cement content determined from C85, Modified C85 and dehydration to allowfor calcareous coarse aggregate (limerock) and calcareous material (shell)present in fine aggregate.
** Water estimate determined by using percentage of paste volume and calculatedcement content.
***Admixtures extracted from concrete using carbonate method forsulfonates. (X) indicates presence of admixture.
****Unit weight SSD estimate by using bulk SSD specific gravity- (C642)after immersion and boiling.
A-20

TABLE A.
7
SUMMARY OF CONCRETE TESTS
Concrete 2nd Floor, Slab
SAMPLE: P19
Material Proportions,approximate, lbs. /yd3
Cement* -
Fine Aggregate 1223Coarse Aggregate 1669
Water** -
Admixture, Z *** 0.02WRDA 79 XWRDA 19
Type III ~
Unit Weight, SSD,lbs. /ft. 3**** 140.4
Air Voids, Z 1.8Spacing Factor, in. 0.030
Absorption, Z 8.7
Permeable Voids, Z 18.0
Notes:
*Cement content determined from C85, Modified C85 and dehydration to allowfor calcareous coarse aggregate (limerock) and calcareous material (shell)present in fine aggregate.
** Water estimate determined by using percentage of paste volume and calculatedcement content.
***Admixtures extracted from concrete using carbonate method forsulfonates. (X) indicates presence of admixture.
****Unit weight SSD estimate by using bulk SSD specific gravity. (C642)after immersion and boiling.
A-21
NBS-I14A (rev. 2-bc)
U.S. DEPT. OF COMM.
4.
BIBLIOGRAPHIC DATASHEET (See instructions)
TITLE AND SUBTITLE
PUBLICATION ORREPORT NO.
2. Performing Organ. Report No. 3. Publication Date
81-2374
INVESTIGATION OF CONSTRUCTION FAILURE OF HARBOUR CAY CONDOMINIUM IN COCOA BEACH,FLORIDA
5. AUTHOR(S)
H. S. Lew, N. J. Carino, S. G. Fattal, and M. E. Batts5. PERFORMING ORGANIZATION (If joint or other than NBS, see instructions) 7. Contract/Grant No.
NATIONAL BUREAU OF STANDARDSDEPARTMENT OF COMMERCE 8. Type of Report & Period Covered
WASHINGTON, D.C. 20234
9. SPONSORING ORGANIZATION NAME AND COMPLETE ADDRESS (Street. City . State, ZIP)
Occupational Safety and Health AdministrationU. S. Department of LaborWashington, D.C. 20001
10. SUPPLEMENTARY NOTES
Document describes a computer program; SF-185, FIPS Software Summary, is attached.
11. ABSTRACT (A 200-word or less factual summary of most significant information. If document includes a significantbi bliography or literature survey, mention it here)
The investigation of the collapse of a five-story reinforced concrete flat -platestructure under construction at Cocoa Beach, Florida is presented in this report. Theinvestigation included onsite inspection, laboratory tests and analytical studies.
Based on the results of this investigation, it is concluded that the most probablecause of the failure was insufficient punching shear capacity in the fifth-floor slabto resist the applied construction loads.
Two factors contributed to the low punching shear capacity: one in the design andthe other in the construction of the building. In the design, the omission of a checkfor punching shear resulted in a smaller slab thickness than needed to satisfy theCode, requirements. In construction, the use of specified chairs having insufficientheight to support the top reinforcing steel resulted in more than the cover specifiedin the structural drawings. Both factors contributed to reducing the effective depthof the slab such that it had insufficient strength to resist the construction loads.
The analysis showed that shear stresses in the slab at many column locations on the
fifth floor exceeded the nominal shear strength. Thus, punching shear failure at one
of the columns precipitated a progressive failure of the slab throughout the entirefifth floor. Collapse of the fifth floor, in turn, caused the successive collapse of
the lower floor slabs. The failure of the fifth floor slab most likely initiated at
column G-2 , an interior column which supported the last bay of freshly placed roofconcrete prior to the collapse.12. KEY WORDS (Six to twelve entries; alphabetical order; capitalize only proper names; and separate key words by semicolon s)
Building; collapse; concrete; concrete strength; construction; failure; flat plate;
shear; strength
13. AVAILABILITY 14. NO. OF
Unlimited
1
.for Official Distribution. Do Not Release to NTIS
H Order From Superintendent of Documents, U.S. Government Printing Office, Washington, D.C.
PRINTED PAGES
15. Price20402.
[22 Order From National Technical Information Service (NTIS), Springfield, VA. 22161
USCOMM-DC 6043-P80


I
I
i
I


![1986-12-25 - Newport Harbor Ensign[Icon]](https://static.fdokumen.com/doc/165x107/631b1d25f6a8ee1ff700a4c5/1986-12-25-newport-harbor-ensignicon.jpg)