Neoplasmatic Design: Design Experimentation With Bio-Architectural Composites

Journal of Chemical Technology and Biotechnology J Chem Technol Biotechnol 79:1228–1242 (online: 2004)DOI: 10.1002/jctb.1117
Investigating the use of cooling surfaces insolid-state fermentation tray bioreactors:modelling and experimentationMorteza Khanahmadi,1∗ Reza Roostaazad,1 Aliakbar Safekordi,1
Ramin Bozorgmehri1 and David A Mitchell21Chemical Engineering Department, Sharif University of Technology, P 11365-9465, Azadi St, Tehran, Iran2Departamento de Bioquimica e Biologia Molecular, Universidade Federal do Parana, Cx P 19046 Centro Politecnico, Curitiba 81531-990,Parana, Brasil
Abstract: The effect of wall cooling in tray-type solid-state fermenters was investigated by cultivationof Aspergillus niger ATCC 10 864 on wheat bran. Temperature, moisture, pH and glucoamylase activityin the bed were monitored. Application of the heat exchanger plate reduced the overall water loss butincreased the heterogeneity of moisture distribution in the bed. Moisture content increased markedlyclose to the heat transfer plate while the upper regions of the bed dried out. The thermal conductivityof the bed was measured to be 0.19 W m−1 K−1. At these conditions and depending on the air flow rate,58–82% of the metabolic heat was removed via conduction towards the plate. A mathematical model wasdeveloped to describe the behaviour of the system. Model predictions were in good agreement with theexperimental results. Diffusion coefficients of water vapour and oxygen in the bed were estimated to bearound 1.3×10⁻⁵ m2 s−1 and 1×10⁻⁵ m2 s−1 respectively. Based on these values the mathematical modeldescribes the way oxygen and water vapour diffusion influences biomass growth and moisture distributionin the bed. 2004 Society of Chemical Industry
Keywords: solid-state fermentation; tray; heat transfer; mass transfer; Aspergillus niger (ATCC 10864); coolingplate
1 INTRODUCTIONSolid-state fermentation (SSF) is claimed to haveadvantages over submerged culture for the productionof certain microbial products, particularly from fungalprocesses.1 However, removal of metabolic heatfrom the bed remains a serious obstacle in theoperation of large-scale commercial processes. Variousbioreactor designs have been proposed to tackle thisproblem including trays, packed beds, stirred beds,rotating drums and fluidized beds. Tray and packed-bed designs are based on a static or infrequentlymixed mode of operation, which is necessary incases in which continuous or frequent mixing aredeleterious. In traditional tray bioreactors moist airis circulated around the bed but the build-up oftemperature and gas phase concentration gradientsin the bed limits the maximum workable bedthickness and hence lowers the volumetric productivityof the bioreactor.2–5 Packed beds in which airis blown through the bed are another alternative.They have been characterized experimentally andanalysed theoretically via mathematical simulation.
In this design a temperature profile develops alongthe bed height due to the convective air flow.6,7
Increasing the superficial air velocity may reducethe temperature gradient. This is at the expense ofincreasing the pressure drop, a problem that becomesmore pronounced as the fermentation proceeds sincethe fungal growth may reduce the bed porosity.8,9
Bed height is restricted by the allowable axialtemperature difference and rarely happens to bemore than 20–40 cm.10 Another problem is thatthe air temperature increase as it flows through thebed promotes evaporation from the bed. This candry out the column to such an extent that growthbecomes limited by low water activity. Moreover, beddrying together with fungal growth may cause bedshrinkage which creates cracks through which air flowspreferentially, leaving parts of the bed non-aerated.
In an SSF bioreactor temperature and moisturegradients occur in the bed, even at laboratory scale.These gradients are expected to be more problematicwhen the process is scaled-up to full industrialproduction.11 To minimize this problem, conductive
∗ Correspondence to: Morteza Khanahmadi, Chemical Engineering Department, Sharif University of Technology, P 11365-9465, Azadi St,Tehran, IranE-mail: [email protected](Received 31 August 2003; revised version received 4 May 2004; accepted 11 May 2004)Published online 7 September 2004
2004 Society of Chemical Industry. J Chem Technol Biotechnol 0268–2575/2004/$30.00 1228

Use of cooling surfaces in solid-state fermentation tray bioreactors
cooling has been adopted in a particular designto improve heat removal. In the so-called Zymotisdesign, water-cooled vertical heat exchanger platesare mounted in a packed bed. In this way the axialtemperature difference and therefore bed drying havebeen claimed to reduce significantly.11 However, thelow thermal conductivity of the solid bed materialimposes restrictions on scale-up. In order to avoid largetemperature gradients between the plates, they shouldbe spaced not more than 5 cm apart. This increasesthe bioreactor cost and at the same time loadingand unloading of the bioreactor becomes tedious.Moreover, Zymotis is not applicable for processesin which fungal growth causes bed shrinkage.12 Intwo recent tray-type patented bioreactors, a thinlayer of substrate was spread over horizontal coolingplates.12,13 Therefore the Zymotis’ disadvantages areremoved and intermittent mixing of the bed ismade possible. In these designs air is blown intothe bed forcefully but it is also possible to applysurface aeration mode. Characteristics of this mode ofoperation are as yet poorly elucidated.
In this work, application of cooling surfaces hasbeen analysed in detail. In particular moisture andtemperature gradients within the bed have beeninvestigated via experimentation and the contributionof the cooling plate to the overall heat removal hasbeen quantified. Aside from experimental studies,a comprehensive model has been developed todemonstrate the inherent characteristics of theintroduced bioreactor system. This improves the fewother attempts published in the literature to describesystems with similarities to one described in this work.For example in one attempt a mathematical simulationwas used to investigate the optimal combinationof bed thickness and air temperature. It has beenshown that the two parameters interact in a complexmanner.14 This simulation did not take into accountevaporation and diffusion of water, which is crucialin tray-type bioreactors fitted with cooling surfaces.In another attempt evaporation and vapour diffusionhave been considered, however, due to assumption ofideal boundary conditions and under-estimation of thevapour diffusion coefficient, vapour diffusion was notfound to be important.15 Boundary conditions used inthis work allow the model to predict the water lossesfrom the bed and show the importance of vapourdiffusion in the performance of tray bioreactors withcooled surfaces.
2 MATERIALS AND METHODS2.1 Fermentation2.1.1 MicroorganismAspergillus niger ATCC 10 864, was propagated onpotato dextrose agar slants at 30 ◦C and stored at 4 ◦Cuntil use. The spore suspension was prepared by fillingthe slant with water to which two drops of Tween 80were added. A glass rod was used to enhance removalof spores from the slant surface.
2.1.2 Solid substrateTable 1 presents the composition of the solid substrateused in the flask and fermenter cultivations.
2.1.3 Flask cultureIn flask fermentations 30 g of the medium was placedin 250 cm3 conical flasks and autoclaved for 30 min at121 ◦C. Each flask was inoculated with 2.5 cm3 of asuspension having 1 × 10⁸ spores cm−3 and incubatedin a 30 ◦C bath. At different times one flask was takenand its pH, dry weight, and glucoamylase content weremeasured.
2.1.4 Fermenter cultureA 2800 g portion of solid substrate was autoclaved at121 ◦C for 45min and inoculated with an appropriateamount of spore suspension after it was cooled to roomtemperature. The bioreactor was then loaded with theinoculated substrate.
2.2 Experimental set-up (Figs 1 and 2)The fermenter was a properly insulated 100 cmlong horizontal cylinder, 28.5 cm in diameter andtilted with an angle of 10◦. Inside the fermentera longitudinal plate-type heat exchanger acted as atray base on which solid medium was spread at thedesired dimensions (80 × 23 × 3 cm3). Cooling waterat a controlled temperature flowed through the trayat a constant flow rate. A water ring blower suppliedair. The saturated air was demisted in a surge tankand sterilized by passing through a 0.01 µm ceramicfilter. It was then blown over the surface of the bed ata rate controlled via a rotameter. Temperatures of thecooling water and air were measured at the entranceand exit of the fermenter. Temperature readings weretransferred to a computer and recorded in the Labviewenvironment. Moreover, two sets of PT100 sensorswere used to measure the bed temperature profileduring fermentations. Each set included five probesplaced at 0.3, 1.5, 2.5, 3.5 and 4.5 cm above thecooling plate. Each probe had a thickness of 1 mm,so that its reading could be assumed to be the truetemperature at the point of its location. Averagereadings of two probes at the same elevation wereused to illustrate the temperature profile of the bed.
Table 1. Composition of solid substrate
Wheat brana 45.6%Corn flour 0.94%HCl (28% w/w) 0.94%Ammonium sulfate 0.3%Ferrous sulfate 0.01%Zinc sulfate 0.01%Copper sulfate 0.001%Water 52.2%Sum 100%Measured moisture 55%Initial bed weight (g) 2800
a Particle size distribution, mm (w/w): 2 (0%), 1–2(7.7%), 0.7–1(8.9%),0.5–0.7(27.7%), 0.35–0.5(32%), 0.25–0.35(20.6%), 0.35 > (3.1%).
J Chem Technol Biotechnol 79:1228–1242 (online: 2004) 1229

M Khanahmadi et al
32.8 32.8 32.8 32.8 32.8
8
10
7
9
5
15
4
3
1
11
2
1 – Water ring blower, 2 – chiller, 3 – demister, 4 – trap and filter, 5 – rotameter, 6 – PT100 sensors, 7 – bioreactor,8 – bed, 9 – cooling plate, 10 – insulator, 11 – peristaltic pump, 12 – heater, 13 – chiller, 14 – temperature monitors, 15 – computer.
15
13
12
32.86
7
10
14
Figure 1. Experimental set-up of the solid-state fermentation.
20 cm
3 cm
Q WV
x
40 cm 20 cm
CO2
O2
3 cm
Air flow
water flow
Insulator
bottom layer
mid layer
top layer
1.5 cm
Figure 2. Inside details of solid-state fermenter.
2.3 SamplingDuring fermentation runs samples were taken bycutting a cube from the bed. It was then substitutedby inoculated substrate in order to minimize theinfluence of sample removal on the fermentation.Each sample was cut into three 1 cm thick layers andnamed as bottom layer (adjacent to the cooling plate),top layer (adjacent to the headspace) and mid layer.Glucoamylase activity, pH and moisture content weremeasured separately for each layer.
To assay the enzyme activity, 10 g of the samplewas slurry-washed twice with 100 cm3 of water ina 250 cm3 shaken flask for 30 min and filtered. A0.250 cm3 aliquot of the filtrate was added to 2 cm3
of 1% (w/v) starch solution in 0.1 mol cm−3 citratebuffer (pH 4) and incubated at 60 ◦C for 15 min.The enzyme activity was then stopped by heating themixture in boiling water for 5 min. Then, 0.250 cm3
of the mixture was added to 1 cm3 of di-nitro salicylicacid reagent and heated for another 5 min in boilingwater followed by cooling in icy water. Ten cm3 ofwater was added to the mixture and its absorbancewas read at 540 nm. Readings were corrected forglucose content of the sample, which was determinedby following the same procedure except that theenzyme was inactivated by boiling prior to additionof starch solution. A calibration curve was producedusing standard glucose solutions.
1230 J Chem Technol Biotechnol 79:1228–1242 (online: 2004)

Use of cooling surfaces in solid-state fermentation tray bioreactors
To determine the moisture content, 10 g of samplewas dried at 85 ◦C for 24 h in an oven and the weightreduction was measured.
For pH measurement, 5 g of the sample was mixedthoroughly with 10 cm3 of water and its pH wasmeasured
Dry matter was measured by taking a cut of the bed,precisely measuring its dimensions and its dry weight.
3 MATHEMATICAL MODEL3.1 BiokineticsA logistic model has been used to describe Aniger growth in studies reported in the literature.16
According to this work, considerable growth occursat 50 ◦C however, reported experimental results showno growth of A niger ATCC 10 864 on wheat branabove 45 ◦C.17 To account for the present observation,the logistic model used in this study was modifiedto incorporate an empirical second order polynomialfactor in temperature in the range of 40–50 ◦C andwas set to zero above 50 ◦C. Thus, the adopted kineticmodel is:
∂b∂t
= µb(
1 − bbm
)(1)
in which µ is defined as:
µ =
∣∣∣∣∣∣∣∣∣
µopt(µwµT)0.5 T < 40 ◦Cµopt(µwµT)0.5(e1T2 + e2T + e3) 40 ◦C < T
< 50 ◦C
0 50 ◦C < T(2)
While:
µw = exp(D1a3w + D2a2
w + D3aw + D4) (3)
µT = 1µopt
Af exp(−EA1
RT
)
1 + B exp(−EA2
RT
) (4)
Oxygen consumption and CO2 production wererelated to growth and maintenance, while heatproduction was related to O2 consumption as:
rO2 = −(
1YX/O2
1b
∂b∂t
+ mO2
)bCdm0 (5)
rCO2 =(
1YX/CO2
1b
∂b∂t
+ mCO2
)bCdm0 (6)
rH = −YQ/O2rO2 (7)
Assuming that the only volatile metabolites are H2Oand CO2:
γ O2 + δCH1.75O0.68N0.05 −−−→ αCO2 + βH2O
+ biomass + non-volatiles (8)
The change in the total dry matter in the bed may beevaluated as:
rw = (β/α)MH2OrCO2 (9)
rdm = −rw − MCO2 rCO2 − MO2rO2 (10)
3.2 Mass and energy balancesIn a related work, an energy balance of the bed hasbeen developed as:15
∂T∂t
=
rH + k∂2T
∂x2 + �Hw{Dwv
∂∂x
(ε ∂∂x
(Cwvε
))−∂Cwv
∂t
}+(T−Tref ){
Cpdm∂Cdm
∂t +Cpw∂Cw∂t +Cpwv
∂Cwv∂t
}CpdmCdm + CpwCw + CpwvCwv
(11)
However the mass balances were changed in thiswork to incorporate bed porosity in the formulations.In this case a more realistic diffusion coefficient,concentration, and transfer area replace the apparentones. Noticing that bed porosity changes in timeand space through the course of fermentation, thistreatment introduces the true gradients as the drivingforces of mass transfer in the bed.
Liquid flow in beds of solid particles is a complicatedprocess caused by gravity, capillary flow, shrinkageand diffusion. The relative contributions of thesemechanisms depend on the structure and moisturecontent of the solid. In addition, liquid diffusivityin solids is under the influence of the moisture.18,19
Having said that it was assumed in this work that liquidflow in the bed is Fickian with a constant ‘diffusioncoefficient’ of Dw. Therefore the material balances forwater, oxygen, and carbon dioxide and dry matter areas follows:
∂Cw
∂t= rw −
{∂Cwv
∂t− Dwv
∂
∂x
(ε
∂
∂x
(Cwv
ε
))}
+ Dw∂
∂x
((1 − ε)
∂
∂x
(Cw
1 − ε
))(12)
∂CO2
∂t= rO2 + DO2
∂
∂x
(ε
∂
∂x
(CO2
ε
))(13)
∂CCO2
∂t= rCO2 + DCO2
∂
∂x
(ε
∂
∂x
(CCO2
ε
))(14)
∂Cdm
∂t= rdm (15)
It should be noted that A niger, like other filamentousfungi, is a strict aerobe so it is of crucial importancefor the growth that sufficient oxygen be available inall points within the bed. The fungi that produceabundant aerial hyphae take the major part of requiredoxygen directly from gas phase.20 Consequently, gasphase oxygen concentration is a measure of oxygenavailability for the fungi.
J Chem Technol Biotechnol 79:1228–1242 (online: 2004) 1231

M Khanahmadi et al
Assuming the gas phase in the bed void spaces tobe in equilibrium with moist solid phase, the apparentvapour water concentration could be given as:
Cwv = εawCsat (16)
∂(Cwv/ε)
∂t= aw
∂Csat
∂t+ Csat
∂aw
∂t(17)
in which Csat is the vapour content of saturated airgiven by the Antoine correlation as:
Csat = exp(10.652 − 4111/T) (18)
The empirical relationship for the water activity ofwheat bran has been reported as:15
aw = 0.7254 + 0.267
1 + 0.043(
Cdm
Cw
)2.2 (19)
In a solid–liquid–gas three phase system, the ‘gasphase porosity’ may be written as:21
ε = 1 − Cdm
ρdm− Cw
ρw(20)
3.3 Boundary conditionsAssuming direct evaporation from the top surface tobe negligible as compared with vapour diffusion fromthe bed interior to the air stream, water and energybalances lead to two independent boundary conditionsat this boundary:
−Dwvε∂
∂x
(Cwv
ε
)= hmε
(Cwv@x=L
ε− Cwva
)(21)
−k∂T∂x
= hh(T@x=L − Ta) (22)
Moreover the relevant boundary conditions for oxygenand carbon dioxide at this surface are:
−DO2ε∂
∂x
(CO2
ε
)= hmε
(CO2@x=L
ε− CO2a
)(23)
−DCO2ε∂
∂x
(CCO2
ε
)= hmε
(CCO2@x=L
ε− CCO2a
)
(24)
At the bed/cooling plate interface it is assumed thatthe water vapour gets to the plate via diffusion throughthe void space, condenses and diffuses bock into thebed. Therefore the relevant mass balance gives:
Dwv∂
∂x
(ε
∂
∂x
(Cwv
ε
))= −Dw
∂
∂x
((1 − ε)
∂
∂x(
Cw
1 − ε)
)
(25)
The bed temperature at the plate is assumed to beequal to that of cooling water:
T@x=0 = Tc (26)
As to the oxygen and carbon dioxide concentrations,the appropriate conditions are:
∂
∂x
(CO2
ε
)= 0 (27)
∂
∂x
(CCO2
ε
)= 0 (28)
3.4 Balances of the flowing airEnergy transfer from the bed into the flowing airstream takes place via both conduction and waterevaporation. The governing equations are:
qac = Ahh(T@x=L − Ta) (29)
wa = Ahmε(Cwv@x=L/ε − Cwva) (30)
qav = �Hwwa (31)
qa = qav + qac (32)
Air flow past the bed surface is assumed to be atpseudo steady state conditions. Using this assumption,the characteristic features of the air are given as:
Tao = Tai + qac/Cpa/ma (33)
Ta = (Tao + Tai)/2 (34)
Cwvao = Cwvai + wa/(ma/ρa) (35)
Cwva = (Cwvao + Cwvai)/2 (36)
3.5 Energy balance for cooling water flowEnergy transfer from the bed into the cooling watertakes place via both conduction and water vapourcondensation:
qwc = Ak(
∂T∂x
)x=0
(37)
qwv = −�HwvADwv∂
∂x
(ε
∂
∂x
(Cwv
ε
))x=0
(38)
qw = qwv + qwc (39)
Tco = Tci + qw/Cpw/mw (40)
Tc = (Tco + Tci)/2 (41)
3.6 Parameter estimationTable 2 presents all the parameters and variablesappearing in the model formulation. Several physicaland biological parameters incorporated in the modelare listed in the table together with their values andthe references from which they were taken. Parametersmeasured or estimated directly in this study arediscussed below:
3.6.1 Thermal conductivityThe thermal conductivity of the bed was determinedby studying the non-steady-state cooling behaviour of
1232 J Chem Technol Biotechnol 79:1228–1242 (online: 2004)

Use of cooling surfaces in solid-state fermentation tray bioreactors
Table 2. Notation and values used for parameters
Symbol Value and units Significance Reference
aw — Water activity of the bedA 0.8 × 0.23 = 0.184 m2 Interfacial area of bed-air and bed-cooling plateAf 7.483 × 10⁷ s−1 Frequency factor for the numerator of eqn (4) 27
b kg kg-IDW∗−1 Dry biomass concentrationbm 0.25 kg kg-IDW−1 Maximum possible dry biomass concentrationB 1.3 × 1047 Fitting constant for the denominator of eqn (4) 27
CCO2 mol m-bed−3 Concentration of CO2 in the bedCCO2a mol m−3 Concentration of CO2 in the bulk airCdm kg m-bed−3 Concentration of dry matter in the bedCdm0 kg m-bed−3 Initial concentration of dry matter in the bedCO2 mol m-bed−3 Concentration of O2 in the bedCO2a mol m−3 Concentration of O2 in the bulk airCpa 1180 J kg−1 K−1 Moist air heat capacity 18
Cpdm 2500 J kg−1 K−1 Specific heat capacity of dry matter 15
Cpw 4216 J kg−1 K−1 Specific heat capacity of liquid water 18
Cpwv 2000 J kg−1 K−1 Specific heat capacity water vapour 15
Csat kg m−3 Concentration of water vapour in the saturated airCw kg m-bed−3 Concentration of liquid water in the bedCwv kg m-bed−3 Concentration of water vapour in the bedCwva kg m−3 Average concentration of water vapour in airCwvai kg m−3 Concentration of water vapour in air at bioreactor
inletCwvao kg m−3 Concentration of water vapour in air at bioreactor
outletDc 0.056 m Equivalent diameter of air channel in the
bioreactorDCO2 m2 s−1 Diffusion coefficient of CO2 in the bedDO2 m2 s−1 Diffusion coefficient of O2 in the bedDw m2 s−1 Diffusion coefficient of liquid water in the bedDwv m2 s−1 Diffusion coefficient of water vapour in the bedD1 618.9218 Fitting constant of eqn (3) 16
D2 −1863.527 Fitting constant of eqn (3) 16
D3 1865.097 Fitting constant of eqn (3) 16
D4 −620.6684 Fitting constant of eqn (2) 16
e1 0.010418 K−2 Fitting constant of eqn (2)e2 −6.706 K−1 Fitting constant of eqn (2)e3 1079.2 Fitting constant of eqn (2)EA1 70 225 J mol−1 Activation energy for the numerator of eqn (4) 16
EA2 283 356 J mol−1 Activation energy for the denominator of eqn (4) 16
Ga kg m−2 s−1 Mass velocity of air flow in the bioreactorhh W m−2 K−1 Heat transfer coefficient between bed surface
and air flowhm m s−1 Mass transfer coefficient between bed surface
and air flowk W m−1 K−1 Heat conductivity in the bedL 0.03 m Bed heightma kg s−1 Mass flow rate of air in the bioreactormCO2 0.00014 mol kg−1 s−1 Maintenance coefficient for CO2 AssumedmO2 0.00014 mol kg−1 s−1 Maintenance coefficient for O2 Assumedmw kg s−1 Mass flow rate of cooling water in the cooling
plateMCO2 0.044 kg mol−1 Molecular weight of CO2
18
MH2O 0.018 kg mol−1 Molecular weight of water 18
MO2 0.032 kg mol−1 Molecular weight of O218
qa W Rate of heat removal from bioreactor via air flowqac W Rate of heat transfer into air via convectionqav W Rate of energy transfer into air via evaporation of
waterqw W Rate of heat removal from bioreactor via water
flow
J Chem Technol Biotechnol 79:1228–1242 (online: 2004) 1233

M Khanahmadi et al
Table 2. Continued
Symbol Value and units Significance Reference
qwc W Rate of heat transfer into cooling water viaconduction
qwv W Rate of heat transfer into cooling water viavapour condensation
Qtot kJ Total heat removed from the bed duringfermentation
Qw kJ Total heat transferred into cooling water duringfermentation
rCO2 mol m-bed−3 s−1 Volumetric CO2 production raterdm kg m-bed−3 s−1 Volumetric dry matter consumption raterH mol m-bed−3 s−1 Volumetric heat production raterO2 mol m-bed−3 s−1 Volumetric O2 consumption raterw mol m-bed−3 s−1 Volumetric water production rateR 8.314 J mol−1 K−1 Universal gas constant 18
t s Timet90% h Fermentation time needed to reach 0.9bm
T K TemperatureTa K Mean temperature of air in the bioreactorTai K Air temperature at bioreactor inletTao K Air temperature at bioreactor outletTc K Mean temperature of cooling water in the
bioreactorTci K Temperature of cooling water at bioreactor inletTco K Temperature of cooling water at bioreactor outletTref 267 K Reference temperaturewa kg s−1 Rate of evaporation of water from the bed into
the airWa g Water carried out from the bed via air flow during
fermentationx m Vertical position coordinateYX/CO2 0.0285 kg mol−1 Biomass production per mole CO2 produced Equal to YX/O2
26
YX/O2 0.0285 kg mol−1 Biomass production per mole O2 consumed 28
YQ/O2 4.6 × 10⁵ J mol−1 Metabolic heat released per mole of consumedO2
29
α,β,δ,γ Stoichiometric coefficients of eqn (8)β/α 1.2 Ratio of metabolic water to the metabolic CO2 Assumed24
�Hw 22.7 × 10⁵ J kg−1 Latent heat of evaporation of water 18
ε — Porosity of the bedµ s−1 Specific growth rateµopt 9 × 10⁻⁵ s−1 Optimum specific growth rate 16
µT Fractional specific growth rate on the basis oftemperature
µw Fractional specific growth rate on the basis of aw
ρa kg m−3 Density of moist airρdm 840 kg m−3 Density of dry substrate particle 26
ρw 994 kg m−3 Density of liquid water 18
τ 2 Tortuosity of the bed Assumed
∗ IDW: Initial dry weight.
the heated bed when subject to a cold heat sink. To dothis, the bioreactor was loaded by autoclaved substrateat 40 ◦C to give a bed thickness of 5 cm. The upperpart of the bed was insulated and water at 10 ◦Cwas passed at the bottom. Transient temperatureprofiles of the bed were recorded and compared withtheoretical data generated by the mathematical modelrun for the same conditions. A thermal conductivityof 0.19 W m−1 K−1 gave the best fit of theoretical andexperimental data.
3.6.2 Heat and mass transfer coefficientsThe heat transfer coefficient was taken from thatdeveloped for air drying operations as:18
hh = 8.8G0.8
a
D0.2c
(42)
At low air velocities this correlation fails to give realisticfigures. At these conditions a minimum value of
1234 J Chem Technol Biotechnol 79:1228–1242 (online: 2004)
Use of cooling surfaces in solid-state fermentation tray bioreactors
hh = 1.5 W m−2 K−1 was used which corresponds toa free convection system.
The mass transfer coefficient was estimated fromthe heat transfer coefficient using the psychrometricratio for the air–water vapour system:22
hm = hh/950 (43)
These correlations must be used with care due tothe inherent differences between SSF and air-dryingoperations which they have been originally developedfor. Bed-drying in SSF is the result of internal heatgeneration; consequently the heat and mass fluxeshave the same direction while they occur in oppositedirections in air-drying.
3.6.3 Diffusion coefficients of water vapour, O2 andCO2 in the bedIn modelling of SSF trays, mass transfer is usuallyanalysed based on the total cross-sectional area andhence an effective diffusion coefficient is adopted.14,15
For porous media with large pores, the effectivediffusion coefficient is related to the porosity andtortuosity as:18
Deffwv = Db
wvε/τ (44)
The Dbwv is the diffusion coefficient of water vapour in
the bulk air, having a value of 2.58 × 10⁻⁵ m2 s−1.22
It should be noted that through the course of solid-state fermentation, large changes in porosity occur asa result of, particularly, water vapour condensation.To account for this phenomenon, all gas phase masstransfers were analysed based on the free cross-sectional area of pores. Consequently the diffusioncoefficient is estimated as:
Dwv = Dwvb/τ (45)
Noting that the bed is composed of coarse particles, atortuosity as low as 2 was used resulting in Dwv = 1.3 ×10⁻⁵ m2 s−1. This value produced realistic modelpredictions of moisture distribution in the bed.
Using the same methodology, DO2 and DCO2 wereestimated to be DO2 = DCO2 = 1 × 10⁻⁵ m2 s−1. Thesevalues suggest no oxygen limitation and/or CO2 buildup in the bed, which is in agreement with ourexperimental results and the cited literature.3,15
3.6.4 Diffusion coefficient of waterAs described before, a diffusion coefficient for waterwas adopted in this work. The value used for thisparameter was taken as 1 × 10⁻¹⁰ m2 s−1 to fit bestthe experimental data, and particularly the moisturecontent of the bed layer adjacent to the cooling plate.
3.7 Model solutionTo solve the system of partial differential equations,the spatial differences were approximated by finitedifferences using equal size elements. The resultingordinary differential equations were solved via theexplicit method with appropriate time steps.
4 RESULTSThe results obtained in experiments and modelsolutions are presented below. At first, the validityof the model is checked. Then the growth in thebioreactor is investigated using various means. Finally,the effects of cooling plate and air flow on performanceof bioreactor are discussed.
4.1 Model validationValidation of developed model was investigated viacomparing its predictions with the results of threefermentations carried out in different conditions in
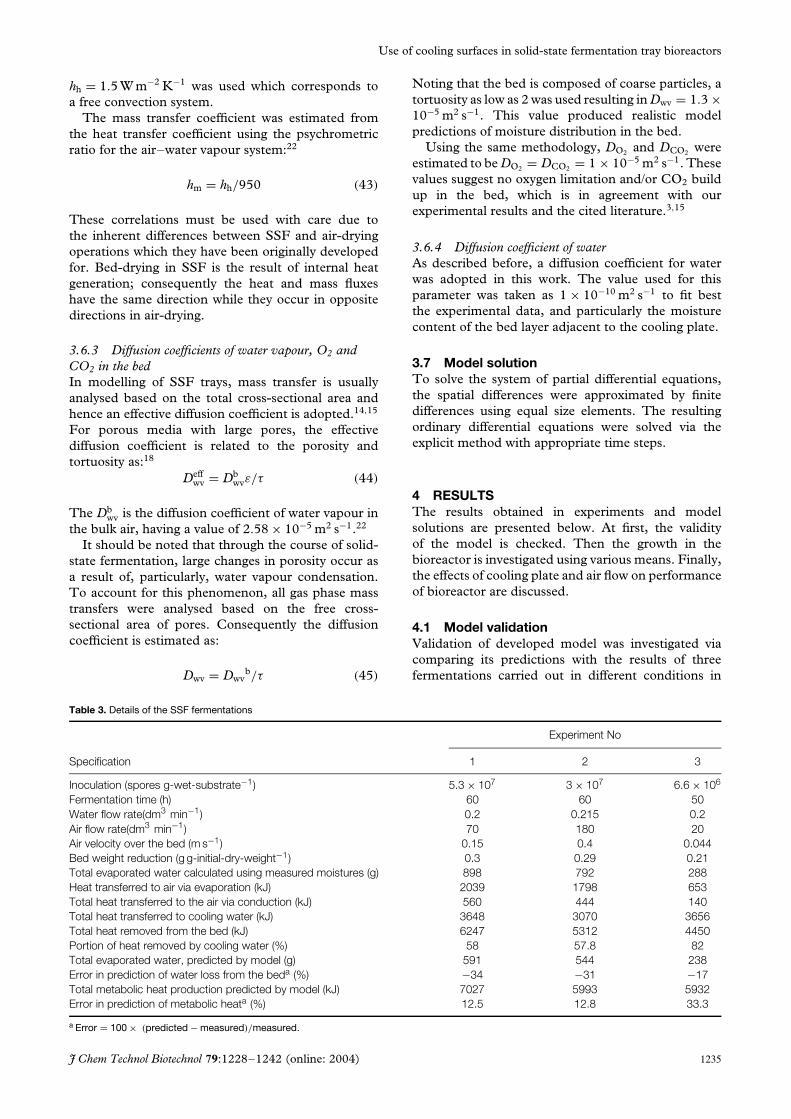
Table 3. Details of the SSF fermentations
Experiment No
Specification 1 2 3
Inoculation (spores g-wet-substrate−1) 5.3 × 10⁷ 3 × 10⁷ 6.6 × 10⁶
Fermentation time (h) 60 60 50Water flow rate(dm3 min−1) 0.2 0.215 0.2Air flow rate(dm3 min−1) 70 180 20Air velocity over the bed (m s−1) 0.15 0.4 0.044Bed weight reduction (g g-initial-dry-weight−1) 0.3 0.29 0.21Total evaporated water calculated using measured moistures (g) 898 792 288Heat transferred to air via evaporation (kJ) 2039 1798 653Total heat transferred to the air via conduction (kJ) 560 444 140Total heat transferred to cooling water (kJ) 3648 3070 3656Total heat removed from the bed (kJ) 6247 5312 4450Portion of heat removed by cooling water (%) 58 57.8 82Total evaporated water, predicted by model (g) 591 544 238Error in prediction of water loss from the beda (%) −34 −31 −17Total metabolic heat production predicted by model (kJ) 7027 5993 5932Error in prediction of metabolic heata (%) 12.5 12.8 33.3
a Error = 100 × (predicted − measured)/measured.
J Chem Technol Biotechnol 79:1228–1242 (online: 2004) 1235

M Khanahmadi et al
this study. Table 3 presents the details of theseexperiments. Using the measured temperature rise ofcooling water, the rate of heat transfer to the coolingplate was calculated and its integration gave the totalheat removed via the cooling plate during the course offermentation. Heat transfer to the air via conductionwas calculated in the same way. Energy transfer toair via water evaporation was estimated via measuringboth dry and wet weight loss of the bed. Sum of thesetwo values gave total energy transferred to the air inthe course of fermentation. Neglecting the amountof energy accumulated within the bed, the rate ofmetabolic heat generation will be equal to the sumof heat transfer to the air and cooling water. Thisparameter may be regarded as a measure of averagegrowth rate within the bed.
Detailed results of the experiments are givenin Figs 3–5. Predicted and measured temperaturesof several locations within the bed are depictedin Figs 3(A), 4(A) and 5(A). Figures 3(B), 4(B)and 5(B) compare simulated and measured moisturecontent of the three bed layers. Measured andpredicted temperature of cooling water at thebioreactor outlet is presented in Figs 3(C), 4(C)and 5(C). Figures 3(D), 4(D) and 5(D) depict bothmeasured and predicted outlet air temperatures.
Referring to the mentioned figures and Table 3,the model predictions agree reasonably well with theexperimental results, although some deviations arevisible. In all cases the model slightly over-predictstemperatures of both the air and the cooling wateroutlet. Temperatures in the upper parts of the bedare also over-predicted. This is apparently as aconsequence of an over-prediction of the heat releaserate (Table 3), which in turn may result from the factthat a constant value for YX/O2
was used in the model,whereas for growth of Trichoderma reesei on wheat bran,its value is reported to vary widely with temperature.23
Another source of error may be deviations of thegrowth kinetics from the logistic model. As will bediscussed later, growth of A niger ATCC 10 864 onwheat bran shows a slight diauxic growth pattern onsome occasions. Another source of over-predictionof heat release that becomes important in the finalhours of the fermentation is that a death phase wasnot incorporated into the model. Inaccuracy of thecorrelations shown in eqns (42) and (43) in predictionof heat and mass transfer coefficients corresponding toair flow rate of 180 dm3 min−1 seem to be partlyresponsible for larger errors in bed temperatureprediction.
The later occurrences of exponential growth inexperiment 3 may have two reasons. Accordingto Table 3 its inoculation was nearly an orderof magnitude smaller than that of the other twoexperiments. In addition according to Fig 5, the bedtemperature of experiment 3 was nearly 26 ◦C duringfirst 10 h of fermentation while it was 30 ◦C for theother two experiments.
28
29
30
31
32
33
34
35
0 20 30 40 50 60
D
30
31
32
33
34
35C
30
32
34
36
38
40
42
44
Tem
pera
ture
(°C
)T
empe
ratu
re (
°C)
Tem
pera
ture
(°C
)
x=0.3 cmx=1.5 cmx=2.5 cm
A
0.0
0.1
0.2
0.3
0.4
0.5
0.6
0.7
0.8
Moi
stur
e (g
g-1
)
bottom layermid layertop layer
B
Fermentation time (h)
10
Figure 3. Experimental data (points and thick lines) and modelpredictions (thin lines) for various parameters during the course offermentation with an air flow rate of 70 dm3 min−1. A: Temperaturesat different distances from the cooling plate; B: average moisturecontent of the bed layers; C: cooling water temperature at thebioreactor inlet and outlet; D: air temperature at the bioreactor inletand outlet. All other experimental parameters are as indicated inTables 1–3.
4.2 Monitoring of growthDirect determination of biomass is generally impossi-ble in most SSF systems. Even the estimation methodbased on glucosamine is usually questionable since the
1236 J Chem Technol Biotechnol 79:1228–1242 (online: 2004)

Use of cooling surfaces in solid-state fermentation tray bioreactors
30
32
34
36
38
40
42
44
A
0
0.1
0.2
0.3
0.4
0.5
0.6
0.7
0.8
bottom layermid layertop layer
B
30
31
32
33
34
35
C
28
29
30
31
32
33
34
35
0 10 20 30 40 50 60
D
Tem
pera
ture
(°C
)x=0.3 cm
x=1.5 cm
x=2.5 cm
Moi
stur
e (g
g-1
)
Fermentation time (h)
Tem
pera
ture
(°C
)T
empe
ratu
re (
°C)
Figure 4. Experimental data (points and thick lines) and modelpredictions (thin lines) for various parameters during the course of afermentation with an air flow rate of 180 dm3 min−1. A: Temperaturesat different distances from the cooling plate; B: average moisturecontent of bed layers; C: cooling water temperature at the bioreactorinlet and outlet; D: air temperature at the bioreactor inlet and outlet.All other parameters are as indicated in Tables 1–3.
glucosamine content of the biomass varies widely dur-ing fermentation.24 However, some trend of changesin other parameters such as dry matter, pH and glu-coamylase activity could be monitored as indirectmeasures of growth.
2426283032343638404244
Tem
pera
ture
(°C
)
x=0.3 cmx=1.5 cmx=2.5 cm
A
26
28
30
32
34
36
0 10 20 30 40 50
Fermentation time (h)
Tem
pera
ture
(°C
)
D
23
24
25
26
27
28
29
30
31T
empe
ratu
re (
°C)
C
0
0.1
0.2
0.3
0.4
0.5
0.6
0.7
0.8
Moi
stur
e (g
g-1
)
bottom layer
mid layer
top layer
B
Figure 5. Experimental data (points and thick lines) and modelpredictions (thin lines) for various parameters during the course offermentation with an air flow rate of 20 dm3 min−1. A: Temperaturesat different distances from the cooling plate; B: average moisturecontent of bed layers; C: cooling water temperature at the bioreactorinlet and outlet; D: air temperature at the bioreactor inlet and outlet.All other parameters are as indicated in Tables 1–3.
4.2.1 Growth in flask cultureThe parameters monitored during the course of growthin the flask culture are given in Fig 6. A logical patternof change is observed for all of the parameters.
A niger growth in non-buffered media is accompa-nied by a well known pattern of pH change, whichis the decrease in fast growth phase and increase inlater phases (Fig 6). pH reduction may result from
J Chem Technol Biotechnol 79:1228–1242 (online: 2004) 1237

M Khanahmadi et al
3
3.5
4
4.5
5
5.5
0 10 20 30 40 50 60 70 80
Fermentation time (h)
pH &
dry
mat
ter
(g/1
0g-iw
)
0
100
200
300
400
500
GA
A (
µmol
glu
cose
min
-1 g
-dw
-1)pH
dry matterGAA
Figure 6. Trend of various measures of growth during the course offermentation in flask culture of A niger ATCC 10 864 on wheat bran at30 ◦C. Dry matter content is presented as g/10 g of initialmoist substrate.
production of organic acids and/or consumption ofammonia. Consumption of acids and/or release ofammonia caused by use of protein as a carbon sourcewill increase the pH in the later phases of fermentation.
Dry matter content of the media reduces as aresult of consumption of non-volatile substrates andproduction of volatile metabolites, namely carbondioxide and water. According to Fig 6, dry matterchange illustrates a diauxic growth trend in a reversemanner. After a lag phase of constant dry matter,there is a fast decrease, indicating a logarithmicgrowth phase. It is followed by a slower dry weightreduction, indicating continuation of growth under areduced rate. This trend seems to have resulted fromthe composition of the substrate. Wheat bran has afew percentages of free sugars in it.25,26 This may beincreased further as a result of prolonged sterilizationof acidified moist bran. It seems that the fungusfeeds on these sugars in the early stages of growthuntil it falls below a threshold value. Then, release ofhydrolysing enzymes and, in particular, glucoamylasestarts (Fig 6). The shift of carbon source from freesugars to polymeric carbohydrates and/or protein maycause occurrence of the diauxic growth pattern anddeviations of the growth kinetics from the mentionedlogistic model, a phenomenon which is reported inother related studies as well.17
4.2.2 Extent of growth in the bioreactorMeasuring the same parameters as in the flaskcultivations, the biomass growth was estimated indifferent layers within the bed (Fig 7). According toFig 7(A), dry matter loss in the bottom layer is fasterthan that of the average of the three layers, indicatingfast growth at the bottom. This is confirmed by thetrend of pH and glucoamylase activity as depicted inFig 7(B and C). Model prediction of biomass growthagrees well with the mentioned results (Fig 7(D)).The model predicts a fast growth at the bottom layerwhich starts at hour 10 and reaches a maximum
0
0.05
0.1
0.15
0.2
0.25
0.3
0 10 20 30 40 50 60
Fermentation time (h)
Bio
mas
s (k
g kg
-1)
bottom layer
mid layer
top layer
D
0
100
200
300
400
500G
AA
(µm
ol g
luco
se m
in-1
g-d
w-1
)
bottom layer
mid layer
top layer
C
4.0
4.5
5.0
5.5
6.0
6.5
pH
bottom layermid layertop layer
B
3
3.5
4
4.5
5
5.5
Dry
mat
ter
(g/1
0 g-
iw) average of all layers
bottom layer
A
Figure 7. Monitoring various means of growth in the bed. A:Predicted and measured variations of dry matter concentration inbottom layer and in average of three layers; B: measured pH; C:measured glucoamylase activity; D: model prediction of growth;conditions are the same as those in experiment 1 as presented inTables 1–3. Dry matter content is presented as g/10 g of initialmoist substrate.
biomass at hour 25 of fermentation. Growth in themid and top layers starts at the same time butit is slowed down later. As a result the maximumbiomass is attained in the mentioned layers only afterhour 40 and 60 of fermentation respectively. Thedecreased growth in the upper layers is due to thehigh temperature and low water activity caused byevaporation.
1238 J Chem Technol Biotechnol 79:1228–1242 (online: 2004)

Use of cooling surfaces in solid-state fermentation tray bioreactors
0
0.2
0.4
0.6
0.8
1(C
O2/
ε) /
CO
2a x=0 cmx=1 cmx=2 cmx=3 cm
A
0
0.2
0.4
0.6
0.8
1
0 10 20 30 40 50 60
Fermentation time (h)
(CO
2/ε
) / C
O2a
B
Figure 8. Model prediction of oxygen concentration in the bed duringfermentation, A: DO2 = 1 × 10⁻⁵ m2 s−1; B: DO2 = 3 × 10⁻⁶ m2 s−1;the legends are the same for both figures. Conditions are the same asthose in experiment 1 as presented in Tables 1–3.
Fast growth at the bottom layer indicates thatoxygen is not limiting at the bed depth. This factallows estimation of an appropriate value of DO2. Themodel predictions for oxygen concentration duringthe fermentation for two different values of oxygendiffusivity are shown in Fig 8. It is clear that withDO2 = 3 × 10⁻⁶ m2 s−1 oxygen concentration at thebottom layer would be growth limiting while DO2 =1 × 10⁻⁵ m2 s−1 predicts that oxygen concentrationremains sufficiently high in the bottom layer so as notto limit the growth. This suggests that the assumedvalue of tortuosity and hence DO2 lies close to theactual value.
4.3 Tray performanceIn the conventional tray-type bioreactors, air is usedfor both oxygen-supplying and heat removal from thebed. The air, flowing both over and under the trays,removes heat via conduction and evaporative cooling.If the tray is perforated, evaporative cooling takes placefrom both sides. In the tray design studied in this workair flow under the tray is replaced by a flow of coolingwater. As a result both the cooling plate and air flowcould affect tray performance and their effects areanalysed in this section at a constant bed height.
4.3.1 Effect of cooling plateThe mentioned effect could be visualized via inves-tigation of profiles of different parameters within thebed at the time of maximum metabolic heat gener-ation (Fig 9). Replacing air flow with the water flow
30
32
34
36
38
40
42
44
T (
°C)
A
1
D
0
1
0 1 2 3
E
50
60
70
80
90C
0
20
40
60
80 B
moi
stur
e (%
)
100
100
wat
er v
apou
r (g
m-3
)w
ater
act
ivity
0.95
0.85
0.8
0.9
0.8
poro
sity
0.4
0.6
0.2
x (cm)0.5 1.5 2.5
Figure 9. Profiles of model predicted. A: Temperature, B: moisturecontent of solids, C: concentration of water vapour in the gas phase,D: water activity and E: porosity within the bed in hour 20 offermentation. Points in A are measured temperatures. Conditions arethe same as those in experiment 1 as presented in Tables 1–3.
under the tray diminishes heat transfer resistance inthe fluid side so that the temperature of the bedat air/cooling water interface could be assumed to be
J Chem Technol Biotechnol 79:1228–1242 (online: 2004) 1239

M Khanahmadi et al
equal to cooling water temperature. As a consequence,steep temperature gradients will develop due to lowthermal conductivity of the bed. Figure 9(A) showsboth measured and model-predicted temperature pro-files. Temperature gradients higher than 5 ◦C cm−1
were developed close to the plate; such a large tem-perature gradient will enhance heat transfer, but itmay cause non-uniform growth. On the other handthe profile near to the air flow was almost flat becauseof high thermal resistance of the air. This resistancecould be reduced via increase of air velocity.
Moisture content of solids is another importantparameter affecting uniformity of growth. According toFig 9(B) moisture distribution is highly non-uniformwithin the bed; while the section close to the airflow dried, the section adjacent to the plate gainedmoisture. The mentioned water distribution suggestsconsiderable water displacements within the bed,which occurs mainly via water vapour transfer. Theconcentration profile of water vapour in the gas phasewithin the bed governs the extent and direction ofits transfer (Fig 9(C)). According to the shape ofthis profile the bed is divided into an upper regionin which water vapour flows into air and the lowerregion in which the water vapour diffuses towardsplate. In other words, the shape of this profile showsthat water vapour is entrapped in the lower regionof the bed. Despite the flat temperature profile atthe top of the bed, a steep water vapour gradient waspredicted to develop in this region which caused dryingof this part of the bed. This results from gradientsin the water activity of solids which was developedas a consequence of gradual water loss (Fig 9(D)).Temperature gradients close to the plate induce largewater vapour concentration gradients which enforcewater vapour diffusion towards the plate. Water vapourwill then condense on the plate and diffuse back intothe bed.
Porosity of the bed at each point affects the extentof water vapour diffusion via providing a free area formass transfer. In the upper parts of the bed porositywas increased as a consequence of water and drymatter loss. On the other hand, the accumulation ofwater near the plate drastically reduces the porosity. Inthis way water vapour flux was enhanced in the upperparts while it decreased in the lower part. It should bementioned that a considerable portion of the increasein the moisture value results from the reduction indry matter and production of metabolic water. A 30%reduction in dry matter increases the moisture contentfrom 55% to nearly 65% without gaining any quantityof water.
4.3.2 Effect of air flowIt is desirable to maximize heat removal from the bedand at the same time preserve the bed moisture. Thisrequires that the conduction mechanism is maximizedand evaporation is minimized. One way to suppressthe evaporation driving force is saturation of the inletair. Conductive heat transfer may be enhanced using
lower inlet air temperatures, however this will alsoincrease the evaporation driving force. On the otherhand the presence of the cooling plate makes it possibleto diminish both heat and vapour transfer to air bydynamic adjustment of the inlet air temperature to beequal to the temperature of the bed surface. In this waytotal metabolic heat will be transferred to the coolingwater and air flow is used solely to supply oxygen andpurge CO2.
The effect of air flow rate on both heat and masstransfer from the bed is complicated and in fact it maynot be quantified more simply than that presented bythe model. Figure 10 illustrates the influence of airflow rate on several measures of the bed performanceas predicted by the model. According to the figure, asair flow rate increases, the amount of evaporated waterreaches a maximum and decreases afterwards. Thistrend could be explained qualitatively by referring toeqn (30). Increasing air flow rate will increase the masstransfer coefficient, hm. However, at the same time theconvective heat transfer coefficient will be increased,leading to enhanced heat transfer from the bed whichcauses a reduction of bed temperature, especially inthe vicinity of the air stream interface. This in turnwill decrease bed water vapour concentration at thisboundary, Cwv@x=L. Consequently the air flow rate hasa dual effect on evaporation; its increase to a definitevalue will enhance evaporation while its increasefrom this value afterward will reduce evaporation.According to Fig 10, for the conditions used in theexperiments, the air flow rate value corresponding tomaximum evaporation lies somewhere between 70 and180 dm3 min−1. It is noticeable that the average watervapour concentration of the air stream, Cwva, is alsounder the influence of air flow rate. At sufficiently lowair flow rates, the amount of water evaporated from thebed will increase Cwva significantly. This is the reasonwhy, in Fig 10, evaporation is seen to decrease sosharply at very low air flow rates. The fact that both lowand high air flow rates reduce water loss is confirmedby the experimental results (Table 3). However in thecase of low air flow rates, temperature gradients inthe bed are higher, leading to non-uniform growthand a reduced average growth rate as characterized byt90%, the time required to attain 90% of the maximumbiomass concentration. An increase in the air flow ratereduced the portion of metabolic heat carried out bycooling water from 80% to 50% (Table 3 and Fig 10).
5 CONCLUDING REMARKSThis work allows a quantitative evaluation of the effectof cooling plates placed at the bottom of SSF beds.Application of the plate incorporates three clear effects.The primary effect of the cooling plate is that it de-couples the aeration requirements from the coolingrequirements. Consequently, any kind of atmospherecould be maintained in the reactor that is optimal forproductivity.13 In addition it diminishes the externalheat transfer resistance at this boundary to the extent
1240 J Chem Technol Biotechnol 79:1228–1242 (online: 2004)

Use of cooling surfaces in solid-state fermentation tray bioreactors
20
30
40
50
60
70
80
0 200 400 600 800 1000350
400
450
500
550
600
650
Wa
Air flow rate (dm3 min-1)
Wa
(g)
t 90%
(h)
& Q
w/Q
tot (
%)
Qw/Qtot
t90%
Figure 10. Predicted effect of air flow rate on bed water loss (Wa),portion of metabolic heat removed via cooling water (Qw/Qtot), andtime required to attain 90% of maximum biomass (t90%). Inlet air andcooling water temperatures are both 30 ◦C and bed height is 3 cm.
that the boundary temperature of the bed may becomeequal to the bulk temperature of cooling fluid. Thisis the direct result of elimination of the heat transferresistance in the fluid side. This seems to be achievablealternatively at sufficiently large air velocities. Thethird effect is that the cooling plate prevents moistureloss through condensation of the escaping watervapour. Despite these developments however, thelow thermal conductivity and very slow diffusionof liquid water introduce temperature and moisturegradients which may adversely affect the uniformityof fungal growth and metabolite production. Theseproblems could be tackled using means such assmall bed thickness, applying alternating forcedaeration and intermittent mixing. Another method toenhance bioreactor performance could be applicationof dynamic control of air and water temperature aswell as air flow rate. Water flow rate seems to haveno effect on heat removal as long as it is large enoughto keep the outlet water temperature close to its inletvalue.
The detailed model with appropriate boundaryconditions and reasonable values of parametersdeveloped in this work was shown to properly simulatethe system. Profiles of various measured variablesincluding the spatial temperature and moisture, ratesof heat transfer to the air and cooling water, lossof water from the bed and reduction in bed dryweight were predicted by the model with an acceptableaccuracy. The model predicted fast growth andabsence of oxygen limitation in the bed layer adjacentto the cooling plate which was confirmed by specificsymptoms in this region. The model can be used asa useful tool to optimize the design and operation ofthis type of bioreactor with confidence.
ACKNOWLEDGEMENTFinancial support by the Iranian Agricultural Engi-neering Research Institute (IAERI) is highly appreci-ated.
REFERENCES1 Pandey A, Soccol CR and Mitchell DA, New developments
in solid state fermentation: I—bioprocesses and products.Process Biochem 35:1153–1169 (2000).
2 Rajagopalan S and Modak JM, Heat and mass transfersimulation studies for solid-state fermentation processes.Chemical Engineering Science 49:2187–2193 (1994).
3 Ghildyal NP, Ramakrishna M, Lonsane BK and Karanth NG,Gaseous concentration gradients in tray type solid-statefermenters—effect on yields and productivities. BioprocessEng 8:67–72 (1992).
4 Rathburn BL and Shuler ML, Heat and mass transfer effectsin static solid-substrate fermentations: design of fermentationchambers. Biotechnol Bioeng 25:929–938 (1983).
5 Mitchell DA, von Meien OF and Krieger N, Recent develop-ments in modeling of solid state fermentation: heat and masstransfer in bioreactors. Biochem Eng J 13:137–147 (2003).
6 Sangsurasak P and Mitchell DA, Validation of a modeldescribing 2-dimensional heat transfer during solid-statefermentation in packed bed bioreactors. Biotechnol Bioeng60:739–749 (1998).
7 Ashley VM, Mitchell DA and Howes T, Evaluating strategiesfor overcoming overheating problems during solid statefermentation in packed bed bioreactors. Biochem Eng J3:141–150 (1999).
8 Auria R, Morales M, Villegas E and Revah S, Influence of moldgrowth on the pressure drop in aerated solid state fermentors.Biotechnol Bioeng 41:1007–1013 (1993).
9 Auria R, Ortiz I, Villegas E and Revah S, Influence of growthand high mould concentration on the pressure drop in solidstate fermentations. Process Biochem 30:751–756 (1995).
10 Sato K and Sudo S, Small scale solid state fermentations, inManual of Industrial Microbiology and Biotechnology, ed byDavies JE. ASM Press, Washingtown, DC, pp 61–79 (1999).
11 Mitchell DA and von Meien OF, Mathematical modeling as atool to investigate the design and operation of the zymotisbioreactor for solid state fermentation. Biotechnol Bioeng68:(2): 127–135 (2000).
12 Durand A, Bioreactor designs for solid state fermentation.Biochem Eng J 13:113–125 (2003).
13 Suryanarayan S, Current industrial practice in solid statefermentations for secondary metabolite production: thebiocon india experience. Biochem Eng J 13:189–195 (2003).
14 Rajagopalan S and Modak JM, Modeling of heat and mass-transfer for solid-state fermentation process in tray bioreactor.Bioprocess Eng 13:161–169 (1995).
15 Smits JP, van Sonsbeek HM, Tramper J, Knol W, Geelhoed W,Peeters M and Rinzema A, Modelling fungal solid-statefermentation: the role of inactivation kinetics. Bioprocess Eng20:(391–404) (1999).
16 Von Meien OF and Mitchell DA, A two-phase model for waterand heat transfer within an intermittently-mixed solid-statefermentation bioreactor with forced aeration. Biotechnol Bioeng79:416–428 (2002).
17 Hamidi Z, Strategies for temperature and moisture control in packedbed solid-state bioreactors. PhD thesis, Faculty of Engineering,Tarbiat Modaress University, Tehran, Iran (2003).
18 Green DW, Perry’s Chemical Engineers Handbook, 7th edn.McGraw Hill, New York (1999).
19 Keey RB, Drying of Loose and Particulate Materials. Hemisphere,New York (1992).
20 Yovita SPR, Weber FJ, le Comte EP, Tramper J, andRinzema A, Contribution of aerial hyphae of Aspergillus oryzaeto respiration in a model solid-state fermentation system.Biotechnol Bioeng 78:539–544 (2002).
21 Jowitt R, Escher F, Hallstrom B, Meffert HFT, Spiess WELand Vos G, Physical Properties of Foods. Applied SciencePublishers, London (1983).
22 Treybal RE, Mass Transfer Operations, 3rd edn. McGraw Hill,Singapore (1981).
23 Smits JP, Rinzema A, Tramper J, van Sonsbeek HM, Hage JC,Kaynak A and Knol W, The influence of temperature on
J Chem Technol Biotechnol 79:1228–1242 (online: 2004) 1241

M Khanahmadi et al
kinetics in solid-state fermentation. Enzyme Microb Technol22:50–57 (1998).
24 Nagel JI, Tramper J, Bakker MSN and Rinzema A, Modelfor online moisture content control during solid statefermentation. Biotechnol Bioeng 72:231–243 (2001).
25 Kent DW and Amos AJ, Modern Cereal Chemistry. Food TradePress, London (1967).
26 Smits JP, Rinzema A, Tramper J, Van Sonsbeek HM andKnol W, Solid-state fermentation of wheat bran by Tricho-derma reesei QM9414: substrate composition changes, Cbalance, enzyme production, growth and kinetics. Appl Micro-biol Biotechnol 46:489–496 (1996).
27 Saucedo-Casteneda G, Gutierrez-Rojas M, Bacquet G, Raim-bault M and Viniegra-Gonzalez G, Heat transfer simulationin solid substrate fermentation. Biotechnol Bioeng 35:802–808(1990).
28 Nishio N, Tai K and Nagai S, Hydrolase production byAspergillus niger in solid-state cultivation. European Journalof Applied Microbiology and Biotechnology 8:263–270 (1979).
29 Bailey JE and Ollis DF, Bichemical Engineering Fundamentals.McGraw-Hill, New York (1986).
1242 J Chem Technol Biotechnol 79:1228–1242 (online: 2004)
Copyright © 2022 FDOKUMEN