
Signaling Pathways and Natural Compounds in Triple ... - MDPI
Upload
independentCategory
view
0download
0
Geophys. J. Int. (2005) 163, 775–787 doi: 10.1111/j.1365-246X.2005.02736.x
GJI
Tec
toni
csan
dge
ody
nam
ics
Inverse models of gravity data from the Red Sea–Aden–East Africanrifts triple junction zone
Christel Tiberi,1∗ Cynthia Ebinger,1 Valerie Ballu,2 Graham Stuart3 and BefekaduOluma4
1Department of Geology, Royal Holloway University of London, Egham TW20 0EX, UK2Laboratoire de Gravimetrie et Geodynamique, Institut de Physique du Globe, Case 89, 4 place Jussieu, Paris 75252, Cedex 05, France3School of Earth Sciences, University of Leeds, Leeds LS2 9JT, UK4Geological Survey of Ethiopia, Geophysics Department, Addis Ababa, Ethiopia
Accepted 2005 July 4. Received 2005 June 29; in original form 2004 October 22
S U M M A R YThe combined effects of stretching and magmatism permanently modify crustal structure incontinental rifts and volcanic passive margins. The Red Sea–Gulf of Aden–Ethiopian rift triplejunction zone provides a unique opportunity to examine incipient volcanic margin formationabove or near an asthenospheric upwelling. We use gravity inversions and forward modellingto examine lateral variations in crust and upper mantle structure across the Oligocene floodbasalt province, which has subsequently been extended to form the Red Sea, Gulf of Aden andMain Ethiopian rifts. We constrain and test the obtained models with new and existing seismicestimates of crustal thickness. In particular, we predict crustal thickness across the upliftedplateaux and rift valleys, and calibrate our results with recent receiver function analyses. Wediscuss the results together with a 3-D distribution of density contrasts in terms of magmaticmargin structure. The main conclusions are: (1) a denser (+240 kg m−3) and/or a thinner crust(23 km) in the triple junction zone of the Afar depression; (2) a shallower Moho is foundalong the Main Ethiopian rift axis, with crustal thickness values decreasing from 32–33 kmin the south to 24 km beneath the southern Afar depression; (3) thicker crust (∼40 km) ispresent beneath the broad uplifted Oligocene flood basalt province, suggesting that crustalunderplating compensates most of the plateau uplift and (4) possible magmatic underplatingor a segmentation in the rift structure is observed at ∼8◦N, 39◦W beneath several collapsedcaldera complexes. These results indicate that magmatism has profoundly changed crustalstructure throughout the flood basalt province.
Key words: crustal thickness, density distribution, gravity inversion, magmatism, triplejunction zone.
I N T RO D U C T I O N
The majority of passive margins worldwide are classified as ‘mag-matic margins’ based on the characteristics of thick sequences ofextrusive volcanic rocks extruded prior to or during rifting, andevidence for crustal underplating (e.g. Coffin & Eldholm 1994;Menzies et al. 2002). The large volumes of erupted basaltic ma-terial require elevated mantle temperatures, indicating that mag-matic margins formed above or near mantle plumes (e.g. White &McKenzie 1989) or upper mantle convective upwellings (e.g. King& Anderson 1998). Despite the predominance of magmatic mar-gins, there is no consensus on the nature of crust underlying the
∗Now at: Universite Pierre et Marie Curie-Paris 6, Laboratoire deTectonique-CNRS/UMR 7072 4 place jussieu, 75252 Paris, Cedex 05France. E-mail: [email protected]
thick, riftward-dipping volcanic sequences, nor on the location ofthe ocean–continent boundary (e.g. Korenaga et al. 2000; Menzieset al. 2002). Studies of ancient passive margins provide only a partialpicture of transitional continental crust because:
(1) the boundary is difficult to image beneath thick, seaward-dipping volcanic sequences that accumulate prior to or immediatelyafter breakup (e.g. Holbrook & Kelemen 1993; Boutilier & Keen1999) and
(2) the velocity contrast between more felsic continental crustand basic oceanic crust is less clear along magmatic margins owingto the dyke and sill emplacement during rifting (e.g. Cox 1980;Ebinger & Casey 2001). Likewise, little is known of the modificationof crust and mantle lithosphere by plume processes during the latesyn-rift stages (e.g. Buck 2004).
An alternative approach to studies of the continental breakupprocess is to probe lithospheric structure along incipient magmatic
C© 2005 RAS 775

776 C. Tiberi et al.
Figure 1. Tectonic setting of the southern Red Sea, Aden and MainEthiopian rifts and their junction in the Afar depression. Bold dashed linesoutline margins of rift valleys. DH is Danakil horst; MER is Main Ethiopianrift; KR is Kenya or Eastern rift. Arrows indicate extension directions.Pre-rift configuration crudely indicated by overlaying two large dots (afterWolfenden et al. 2004).
margins prior to the modifying effects of post-rift sedimentation,erosion of the uplifted rift flanks and thermal decay. The upliftedEthiopia–Yemen flood basalt province, which includes the Afartriple junction, represents one such area (Fig. 1). The three armsof the Red Sea–Gulf of Aden–Main Ethiopian rift triple junctionshow diversity in structure and evolution; the southern Red Sea riftand western Gulf of Aden rifts comprise successfully rifted and in-cipient magmatic margins (e.g. Manighetti et al. 1997; Ghebreab &Talbot 2000), and the northern Main Ethiopian rift (MER) compriseshighly evolved continental rifts and incipient seafloor spreading (e.g.Ebinger & Casey 2001; Keranen et al. 2004). Receiver function, to-mography and seismic refraction studies of the Ethiopian plateauand rift valleys all suggest that large volumes of magmatic materialhave been added to the crust, but the lateral extent of these intrusionsand underplate remains unclear (Keranen et al. 2004; Wolfendenet al. 2004; Dugda et al. 2005; Kendall et al. 2005; Mackenzieet al. 2005). Similarly, the compositions of rhyolites erupted fromthe Oligocene flood basalt episode to Pliocene time show increas-ing amounts of crustal contamination, indicating modification of thecrust by magmatic processes (Ayalew & Yirgu 2003; Ayalew et al.2005).
In this study we use a new compilation of gravity data from north-eastern Africa to study modification of crust by tectonic and mag-matic processes. We apply gravity data inversion methods and for-ward models to examine lateral variations in crust and upper mantlestructure across this Cenozoic flood basalt province and superposedtriple junction zone, testing models with new and existing seismicestimates of crustal thickness (Mechie & Prodehl 1988; Maguireet al. 2003; Dugda et al. 2005; Mackenzie et al. 2005). Gravity datacompiled from northeastern Africa provide the regional perspec-tive needed to evaluate lateral variations in crust and upper mantlestructure within the triple junction zone (Oldenburg 1974). We then
directly invert gravity data for lateral variations in density at specificdepth levels (e.g. Widiwijayanti et al. 2004). The integrated resultsof the study are presented in a forward model of crustal structurealong a rift-axis profile, which can explain available geological andgeophysical data from the Main Ethiopian rift. Integrating our re-sults with existing geophysical, geological and geochemical datafrom the region, we assess the role of magmatic modification ofcontinental lithosphere during and after breakup.
G R AV I T Y A N D T O P O G R A P H Y DATA
A compilation of onshore and offshore gravity data from open filesources described in Ebinger & Hayward (1996), as well as gravitydata acquired by the Geological Survey of Ethiopia during the period1994–2001 are used in this study. All data are referenced to IGSNstation values, but information on terrain corrections is not alwaysavailable.
The merged data set contains a number of data of various vin-tages, and with varying height controls. We examined data in regionsof closed contours of amplitude greater than 10 mGals, and deletedthese values if there were no comparable values within <5 km. Theresulting map shows many small-scale anomalies around geother-mal prospects within the MER where data coverage is best. Hence,many of the shortest wavelength variations occur in Quaternary lavafields and eruptive centres (e.g. Mahatsente et al. 1999). Prior tospectral analyses, all gravity and topography data were transformedto UTM coordinates and then gridded with a 5-km-grid cell spacing(Figs 2 and 3).
T E C T O N I C P ROV I N C E S
The Ethiopia–Yemen plateaux and flood basalt provinces have longbeen proposed as the expression of a mantle plume, and recent stud-ies support this model (e.g. Courtillot et al. 2003; Montelli et al.2004). A synthesis of 40Ar/39Ar data shows that up to 2 km of floodbasalts and rhyolites were erupted throughout the southernmost Red
0
500
1000
1500
2000
2500
3000
3500
4000
4500
34 36 38 40 42 444
6
8
10
12
14
16
A
A'
B B'C
C'
D
D'
Altitu
de (m
)
0 100 200
km
Figure 2. Topographic relief showing broad uplifted Ethiopian plateau(data from Gtopo30). Circles indicate seismological stations used to con-strain forward model of Bouguer gravity anomalies designed to test inver-sion results (Fig. 6). Triangles mark midpoints of seismic refraction profilesdescribed in Berckhemer et al. (1975) and Mechie & Prodehl (1988). ProfilesAA′, BB′, CC′, DD′ of Figs 4(a)–(d) are shown by bold lines.
C© 2005 RAS, GJI, 163, 775–787

Inverse models of gravity data from the Red Sea–Aden–East African rift zone 777
-300 -250 -200 -150 -100 -50 0 50 100Bouguer Anomaly (mGal)
-200
-200
-200
-200
-100
-100
-100
0
0
0
34 36 38 40 42 44
4
6
8
10
12
14
16
36 40 44
4
8
12
16
A
A'
B B'C
C'
D'
D
0 100 200
km
Figure 3. Bouguer gravity anomaly map. Bold lines indicate locations ofprofiles AA′, BB′, CC′ and DD′ of observed gravity, topography, and crustalthickness predicted from 3-D gravity inversion (Figs 4a–d). Inset is the dis-tribution of the gravity stations used to prepare the map. Data include unpub-lished values from the Geological Survey of Ethiopia, as well as the com-pilation used in Ebinger & Hayward (1996) and data from the Tadjouradenexperiment (Hebert et al. 2001).
Sea region at ∼31 Ma (e.g. Hofmann et al. 1997; Pik et al. 2003), al-though less widespread and possibly related volcanism affected SWEthiopia at ∼40 Ma (e.g. Ebinger et al. 1993; George et al. 1998).The volcanic units overlying uplifted Mesozoic marine sequencesnow form a ca. 2500-m-high plateau on both sides of the southernRed Sea and western Gulf of Aden (Fig. 2).
The triple junction between the Red Sea, Gulf of Aden and theMER, the northernmost sector of the East African rift system, lieswithin the Afar depression west of the Danakil microplate (e.g.Manighetti et al. 1997; Tesfaye et al. 2003) (Fig. 1). The geographi-cal position of plate boundaries, however, has changed considerablysince initial rifting in the southern Red Sea and Gulf of Aden at∼30 Ma (e.g. Tesfaye et al. 2003). Extension in the southernmostsector of the Red Sea, which terminates at ∼10◦N, commencedconcurrent with or immediately after the emplacement of thick,widespread rhyolites at ∼28 Ma (Wolfenden et al. 2005). Timingconstraints in the Gulf of Aden are sparse, but extension had com-menced by 30 Ma as Arabia and Africa began to separate (e.g.Cochran 1981; Bellahsen et al. 2003). Seafloor spreading in theeastern Gulf of Aden propagated toward the Afar depression since18 Ma (e.g. Manighetti et al. 1997); seafloor spreading in parts ofthe Red Sea commenced at ∼4 Ma, with incipient seafloor spread-ing on the western (SW Red Sea) and east (SE Red Sea) of theDanakil microplate (Cochran 1983; Tesfaye et al. 2003) (Figs 1 and2). WNW-directed extension within the third arm of the triple junc-
tion, the MER commenced at ∼18 Ma in southwestern Ethiopia,and propagated northward into the Afar depression after 11 Ma(WoldeGabriel et al. 1990; Wolfenden et al. 2004). Thus, the MERis a much younger, and less evolved, rift than the Red Sea and Gulfof Aden rifts, which it now cross-cuts.
Seismic data from the Ethiopian plateau region provide criti-cal constraints on the depths to density contrasts within and be-low the plates. Tomographic models reveal low-velocity materialwithin the upper mantle, but the relationship between this hot zoneand the deep mantle low-velocity zones beneath southern Africaare debated (e.g. Ritsema & van Heijst 2000; Montelli et al. 2004).Hadiouche et al. (1989) and Knox et al. (1998) report anomalouslylow S-wave velocities in the upper mantle beneath Afar at depths of∼60 and 130 km depth, implying the presence of partial melt, basedon analyses of interstation Rayleigh and surface wave phase veloc-ities between Addis Ababa and Djibouti. Higher resolution P- andS-wave tomography models indicate that mantle lithosphere is<40 km thick beneath the northern MER (Bastow et al. 2005), andupper mantle velocities are anomalously low beneath the southernpart of Arabia (Benoit et al. 2003).Below we discuss the main features of the Bouguer anomaly field,and summarize existing constraints on crust and upper mantle struc-ture beneath each of the three rift arms and the uplifted plateau region(Figs 2–4).
Ethiopian plateau (Nubian plate) and Somaliaplateau (Somalia plate)
The Ethiopian plateau is ∼1000 km wide, and has a mean elevationof ∼2500 m (Figs 2 and 4c). Much of the now elevated plateau laybelow sea level through early Cretaceous time when ∼800 m of ma-rine clastic and carbonate sequences were deposited (e.g. Boselliniet al. 2001). The Mesozoic marine sequences overlying Precambrianbasement thicken to the southeast (Bosellini et al. 2001). The floodvolcanic sequences above the Mesozoic strata reach 2 km near thepresent-day southern Red Sea rift (e.g. Wolfenden et al. 2005), butthin to <1 km to the west and south across the plateau (e.g. Georgeet al. 1998; Kieffer et al. 2004).
Seismic refraction and receiver function data show crustal thick-nesses of 35–44 km beneath the plateau south of Addis Ababa(Berckhemer et al. 1975; Hebert & Langston 1985; Ayele et al. 2004;Dugda et al. 2005) (Fig. 4c). Crustal thickness is slightly less (31–41km) on the Somalia plateau, the southern side of the MER (Dugdaet al. 2005; Mackenzie et al. 2005) (Fig. 4). Both plateaux are as-sociated with long wavelength low amplitude Bouguer anomaly(ca. −250 mGal, Figs 3 and 4c and d). Woldetinsae & Gotze(2005) analysed a similar gravity data base and found that mostof the long-wavelength gravity signal could be explained by an Airyisostasy model, with a small component of dynamic support for thebroad plateau uplift. Considering the gaps in data coverage and thepresence of two or more mid-ocean ridges within the flood basaltprovince, we can add little new to the earlier studies of Ebinger et al.(1989) and Woldetinsae & Gotze (2005) (Fig. 3).
Southwestern Red Sea
The southwestern Red Sea is the region of relatively positiveBouguer anomalies lying between the plateau and the Danakil horst,and lying north of 10◦N (Figs 1 and 4a). This sector includes the∼3000-m-high Western escarpment, which bounds the OligoceneRed Sea rift basins (Wolfenden et al. 2005) (Figs 1–3, 4a and b).
C© 2005 RAS, GJI, 163, 775–787

778 C. Tiberi et al.
-4000
-3000
-2000
-1000
0
1000
2000
3000
4000
0 100 200 300 400 500 600 700
Danakil horst
SE Red Sea
SW Red SeaPlateau Plateau
WSW ESE
Profile AA'
km
M S
-300
-200
-100
0
100
200
0
mG
al
100 200 300 400 500 600 700
Bouguer Anomaly
- 5 0
- 4 0
- 3 0
- 2 0
- 1 0
Crustal thickness
0
0 1 0 0 2 0 0 3 0 0 4 0 0 5 0 0 6 0 0 7 0 0
km s
ubsu
rfac
e
A A'
km
km
met
res
Topography
Figure 4. Profiles of topography, Bouguer gravity anomaly, and crustalthickness estimates obtained in the 3-D inversion of filtered Bougueranomaly data (Fig. 6). Circles indicate depths estimated from receiver func-tion studies; squares, estimates from refraction profiles. Locations of profilesshown in Figs 2 and 3. (a) AA′ transect of Ethiopian margin, Afar depression,Danakil horst, Red Sea, and Yemen margin. Note the very steep, symmet-rical anomalies on marking both volcanic passive margins. (b) BB′ transectof Ethiopian plateau, uplifted flank to southern Red Sea, and superposedMER. The steep gradient corresponds to thick riftward-dipping sequencesof basaltic lavas analogous to seaward-dipping reflector sequences (SDR)on magmatic margins worldwide (Wolfenden et al. 2004). (c) CC′ transectof northern Main Ethiopian rift showing southeastward decrease in plateauelevation. Maximum crustal thickness is predicted beneath the 2500 m-highplateau. (d) DD′ transect of central Main Ethiopian rift crossing the Butajiravolcanic lineament and water-filled collapsed calderas. The eastern margintraverses the flank of Pliocene Chilalo volcano.
Topographic and structural transects of the margin show that thesteep gravity gradient on the western margin corresponds to steeplydipping basaltic lavas analogous to seaward-dipping reflector se-quences on passive continental margins (Wolfenden et al. 2005)(Figs 4a and b). The central depression (Danakil depression) ismarked by the Quaternary ‘axial volcanic ranges’ of Barberi &Varet (1977) (Fig. 4a). The segmented axial ranges are alignedchains of primarily basaltic eruptive centres, characterized by seg-mented positive Bouguer anomalies (e.g. Hayward & Ebinger 1996)(Fig. 4a). The high heat flux and broad, low form of Erta ‘Ale rangeled Oppenheimer & Francis (1997) to propose that new igneouscrust is being formed by magmatic intrusion into the axial ranges(magmatic segments).
Previous teleseismic, seismic refraction, and gravity studiesshow an increase in crustal thinning from south to north in the Afar
-3000
-2000
-1000
0
1000
2000
3000SDR zone
4000
5000
0 100 200 300 400 500
W E
Northern MER(Quaternary)
600
S Red Sea rift(Oligocene)
-400
-300
-200
-100
0
100
0 100 200 300 400 500 600km
mG
al
Bouguer anomaly
-50
-40
-30
-20
-10
km s
ubsu
rfac
e
0
0 100 200 300 400 500km
Crustal thickness
600
km
B B'
Profile BB'Topography
me
tre
s
- 2 0 0 0
- 1 0 0 0
0
1 0 0 0
2 0 0 0
3 0 0 0
4 0 0 0
5 0 0 0
6 0 0 0
0 5 0 1 0 0 1 5 0 2 0 0
Kesem R.
km 2 5 0 3 0 0 3 5 0
Northern MER
M S
- 4 0 0
- 3 0 0
- 2 0 0
- 1 0 0
0
1 0 0
0 5 0 1 0 0 1 5 0 2 0 0 2 5 0 3 0 0 3 5 0
Bouguer Anomaly
mG
al
- 5 0
- 4 0
- 3 0
- 2 0
- 1 0
0
0
km s
ubsu
rfac
e
5 0 1 0 0 1 5 0 2 0 0 2 5 0km 3 0 0 3 5 0
Crustal thickness
CHAE
AREE
BOREE46
km
me
tre
s
Profile CC'
C C'
Topography
Figure 4 (Continued.)
C© 2005 RAS, GJI, 163, 775–787
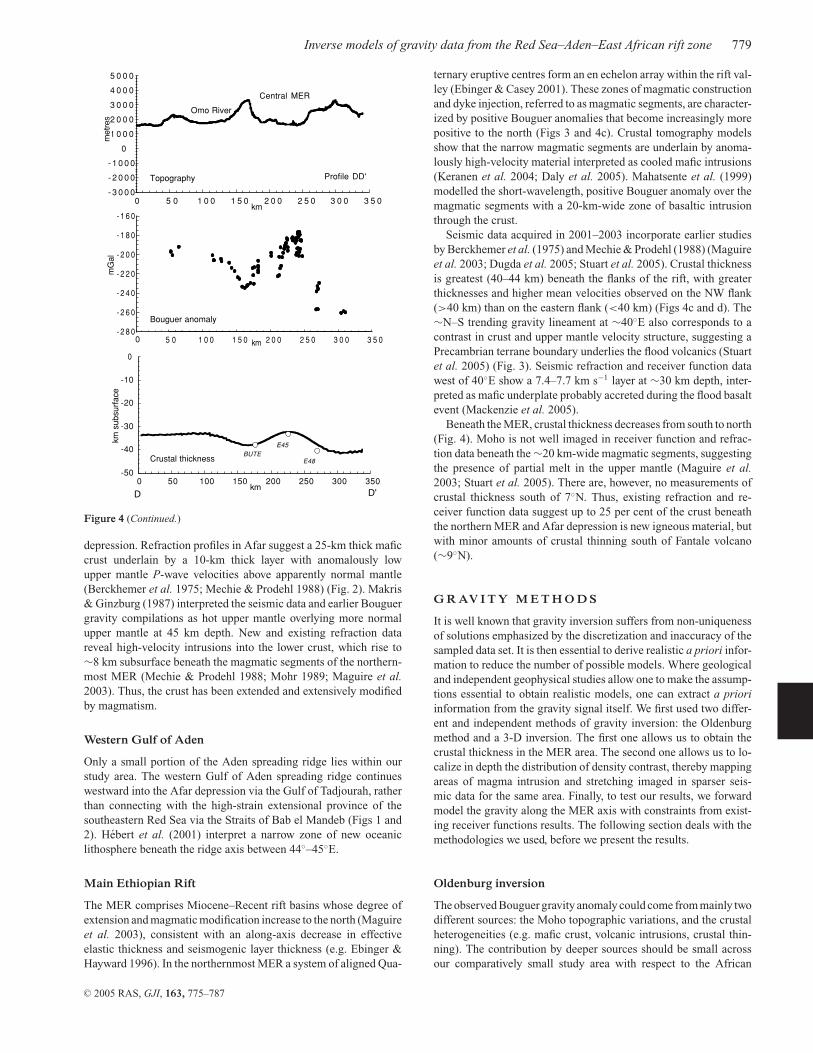
Inverse models of gravity data from the Red Sea–Aden–East African rift zone 779
- 3 0 0 0
- 2 0 0 0
- 1 0 0 0
0
1 0 0 0met
res2 0 0 0
3 0 0 0
4 0 0 0
5 0 0 0
0 5 0 1 0 0 1 5 0 2 0 0km
Central MER
Omo River
2 5 0 3 0 0 3 5 0
- 2 8 0
- 2 6 0
- 2 4 0
- 2 2 0
- 2 0 0
- 1 8 0
- 1 6 0
5 0 1 0 0 1 5 0 2 0 0 2 5 0 3 0 0 3 5 0
-50
-40
-30
-20
-10
0
km s
ubsu
rfac
e
0 50 100 150 200 250 300 350km
Crustal thicknessBUTE
E45
E48
km
Profile DD'
D D'
Topography
mG
al
0
Bouguer anomaly
Figure 4 (Continued.)
depression. Refraction profiles in Afar suggest a 25-km thick maficcrust underlain by a 10-km thick layer with anomalously lowupper mantle P-wave velocities above apparently normal mantle(Berckhemer et al. 1975; Mechie & Prodehl 1988) (Fig. 2). Makris& Ginzburg (1987) interpreted the seismic data and earlier Bouguergravity compilations as hot upper mantle overlying more normalupper mantle at 45 km depth. New and existing refraction datareveal high-velocity intrusions into the lower crust, which rise to∼8 km subsurface beneath the magmatic segments of the northern-most MER (Mechie & Prodehl 1988; Mohr 1989; Maguire et al.2003). Thus, the crust has been extended and extensively modifiedby magmatism.
Western Gulf of Aden
Only a small portion of the Aden spreading ridge lies within ourstudy area. The western Gulf of Aden spreading ridge continueswestward into the Afar depression via the Gulf of Tadjourah, ratherthan connecting with the high-strain extensional province of thesoutheastern Red Sea via the Straits of Bab el Mandeb (Figs 1 and2). Hebert et al. (2001) interpret a narrow zone of new oceaniclithosphere beneath the ridge axis between 44◦–45◦E.
Main Ethiopian Rift
The MER comprises Miocene–Recent rift basins whose degree ofextension and magmatic modification increase to the north (Maguireet al. 2003), consistent with an along-axis decrease in effectiveelastic thickness and seismogenic layer thickness (e.g. Ebinger &Hayward 1996). In the northernmost MER a system of aligned Qua-
ternary eruptive centres form an en echelon array within the rift val-ley (Ebinger & Casey 2001). These zones of magmatic constructionand dyke injection, referred to as magmatic segments, are character-ized by positive Bouguer anomalies that become increasingly morepositive to the north (Figs 3 and 4c). Crustal tomography modelsshow that the narrow magmatic segments are underlain by anoma-lously high-velocity material interpreted as cooled mafic intrusions(Keranen et al. 2004; Daly et al. 2005). Mahatsente et al. (1999)modelled the short-wavelength, positive Bouguer anomaly over themagmatic segments with a 20-km-wide zone of basaltic intrusionthrough the crust.
Seismic data acquired in 2001–2003 incorporate earlier studiesby Berckhemer et al. (1975) and Mechie & Prodehl (1988) (Maguireet al. 2003; Dugda et al. 2005; Stuart et al. 2005). Crustal thicknessis greatest (40–44 km) beneath the flanks of the rift, with greaterthicknesses and higher mean velocities observed on the NW flank(>40 km) than on the eastern flank (<40 km) (Figs 4c and d). The∼N–S trending gravity lineament at ∼40◦E also corresponds to acontrast in crust and upper mantle velocity structure, suggesting aPrecambrian terrane boundary underlies the flood volcanics (Stuartet al. 2005) (Fig. 3). Seismic refraction and receiver function datawest of 40◦E show a 7.4–7.7 km s−1 layer at ∼30 km depth, inter-preted as mafic underplate probably accreted during the flood basaltevent (Mackenzie et al. 2005).
Beneath the MER, crustal thickness decreases from south to north(Fig. 4). Moho is not well imaged in receiver function and refrac-tion data beneath the ∼20 km-wide magmatic segments, suggestingthe presence of partial melt in the upper mantle (Maguire et al.2003; Stuart et al. 2005). There are, however, no measurements ofcrustal thickness south of 7◦N. Thus, existing refraction and re-ceiver function data suggest up to 25 per cent of the crust beneaththe northern MER and Afar depression is new igneous material, butwith minor amounts of crustal thinning south of Fantale volcano(∼9◦N).
G R AV I T Y M E T H O D S
It is well known that gravity inversion suffers from non-uniquenessof solutions emphasized by the discretization and inaccuracy of thesampled data set. It is then essential to derive realistic a priori infor-mation to reduce the number of possible models. Where geologicaland independent geophysical studies allow one to make the assump-tions essential to obtain realistic models, one can extract a prioriinformation from the gravity signal itself. We first used two differ-ent and independent methods of gravity inversion: the Oldenburgmethod and a 3-D inversion. The first one allows us to obtain thecrustal thickness in the MER area. The second one allows us to lo-calize in depth the distribution of density contrast, thereby mappingareas of magma intrusion and stretching imaged in sparser seis-mic data for the same area. Finally, to test our results, we forwardmodel the gravity along the MER axis with constraints from exist-ing receiver functions results. The following section deals with themethodologies we used, before we present the results.
Oldenburg inversion
The observed Bouguer gravity anomaly could come from mainly twodifferent sources: the Moho topographic variations, and the crustalheterogeneities (e.g. mafic crust, volcanic intrusions, crustal thin-ning). The contribution by deeper sources should be small acrossour comparatively small study area with respect to the African
C© 2005 RAS, GJI, 163, 775–787

780 C. Tiberi et al.
Superplume province (e.g. Ritsema & van Heijst 2000). We canmake the assumption that short wavelengths are mainly the ex-pression of small-scale crustal heterogeneities, whereas long wave-lengths mostly result from relief on the Moho boundary. The pres-ence of a 10–15 km thick underplate zone complicates, but does notprevent an inversion for crustal thickness. Firstly, subcrustal mantlevelocity is ∼8.1 km s−1 except beneath the ∼20 km-wide mag-matic segments where velocities are lower (Mackenzie et al. 2005;Maguire et al. 2003). Secondly, the presence of thick, high-velocitycrustal layer reduces the density contrast at the Moho, but the un-derplate is not representative of the mean crustal density. Instead, arelatively high density contrast at the Moho is needed to account forthe underplate (see below).
We separate the wavelengths by upward continuation of the signalto a horizontal plane 15 km above the plateau elevation. We thenuse the approach of Oldenburg (1974) to image crustal thicknessvariations throughout the Ethiopian plateau and triple junction zone.
This method is based on the direct formula of Parker (1972) thatcalculates the gravity signal of a 2-D uneven layer with a constantdensity:
F(�g(x)) = −2πG�ρe−|k|z0
∞∑
n=1
|k|n−1
n!F(hn(x)). (2)
Here F indicates the Fourier Transformation, �g is the gravity sig-nal, k is the wavenumber, x the horizontal coordinate, G is Newton’sgravitational constant, z0 is a reference depth, n is an integer and�ρ is the density contrast between the two media. The function h(x)represents the topography of the interface. In this application, wesum to n = 4.
Oldenburg (1974) solved the inverse problem by an iterative ap-proach, and thus he retrieved the layer’s thickness from the gravitysignal. The problem is typically non-unique and requires one to fixfirst a reference depth from which the topographic variation is calcu-lated and second a constant density contrast between the two layers.The additional use of a cosine taper during the inversion helps theinversion to stabilize (Oldenburg 1974).
We use here a reference depth of 28 km, which represents a meanthickness for the broad Afar depression, rift valleys, and plateau
-220
-200
-200
-180
-180
-160
-160
-140
-140
-120
-120
-100
-100
-80-60
-40
34 36 38 40 42 44
4
6
8
10
12
14
16
Initial Data
-220
-200
-200
-180-180
-160
-160
-140
-140
-120
-120
-100
-100
-80-60
-40
34 36 38 40 42 44
4
6
8
10
12
14
16
Calculated gravity
34 36 38 40 42 44
4
6
8
10
12
14
16
Obs - Calc
-250 -200 -150 -100 -50 0 50 100 -5 0 5
Anomaly (mGal) Residuals (mGal)
0
km0
km
0
km200 200 200
Figure 5. The initial gravity signal and the retrieved signal from Oldenburg inversion are shown in (a) and (b), respectively. (c) represents the residuals(observed–calculated). This comparison reveals few differences, and the principal features are very well retrieved.
areas, and a density contrast of 530 kg m−3 that corresponds tothe difference between a crust of 2670 kg m−3 (value used for theBouguer anomaly calculation) and a mantle of 3200 kg m−3. Clearly,this density contrast is too high for areas of underplating and intensemagmatic intrusion, and lateral variations in density will be mappedinto variations of crustal thickness. Hence, a variety of density con-trasts is tested against the available seismic data, as discussed be-low. We used a cosine taper between 70 and 170 km as advised byOldenburg (1974). The gravity signal was mirrored to ease the workin the space domain, and to get rid of boundary effects.
The results are shown in Figs 5 and 6. Convergence was ob-tained after five iterations, with a final root mean square (rms) of1.068 mGal, compared to the initial of 1.926 mGal. The gravity sig-nal calculated from the resulting topography is extremely close tothe initial one. The longest wavelengths are retrieved, and the residu-als (Fig. 5c) only affect very small areas and present low amplitudes(±7 mGal), which is less than 5 per cent of the initial amplitude ofthe signal. The main features in Fig. 6 are located along the majortectonic structures identified at the surface: thin crust beneath theDanakil depression and along the rift axis in a N–S direction, andthicker crust outside the rift, beneath the uplifted plateau (Figs 5and 6).
Of course, these are only relative results, because the amount ofcrustal thinning and thickening is strongly dependent on the choiceof the reference depth and the density contrast (Oldenburg 1974).The deeper the reference, the greater the relative topography andthe greater the density contrast, the smaller the relative topography.Moreover, this method does not take into account the lateral changesin the density contrast. Especially, in the case of mafic crust, the sig-nal due to the increased mass of denser material increases, and theselateral density contrasts can explain a significant part of the grav-ity signal. The high observed �g (Fig. 3) is partly coming fromthe mafic crust imaged in seismic data. What we account for inOldenburg’s inversion is only a density contrast at the Moho, butwe require a higher density contrast to invert the entire signal(Christensen & Mooney 1995). Thus, we expect our results to over-estimate the crustal thinning where the crust is believed to be moremafic, such as in the highly stretched and intruded Afar depression(Fig. 1).
C© 2005 RAS, GJI, 163, 775–787

Inverse models of gravity data from the Red Sea–Aden–East African rift zone 781
34 36 38 40 42 444
6
8
10
12
14
16
34 36 38 40 42 444
6
8
10
12
14
16
0 200
km
20 25 30 35 40 45
Moho depth (km)
A
A'
B B'C
C'
D
D'L
L'
Arabia
Africa
Aden
RSR
MELE
Figure 6. Topographic relief at the base of the crust obtained from theOldenburg-type inversion. Estimates of crustal thickness from regional re-fraction profiles of Berckhemer et al. (1975) are shown in triangles with thecolour scale representative of their value. Crustal thickness estimates fromreceiver functions are also shown with the circles (same colour scale thanthe Moho depth). Line LL′ marks longitudinal profile for forward modelshowing in Fig. 9. Station MELE has been noted for being more extensivelydiscussed in the text.
Table 1 summarizes different tests we perform to illustrate thetrade-off between �ρ and z0. Our aim is not to provide a completeand exhaustive list of the different combinations of possible (�ρ, z0)couples, but rather to show some relevant examples. The comparisonis made with the receiver function of Stuart et al. (2005). To accountfor large �g as observed, we can either chose moderate depth z0 withhigh �ρ (Table 1, case ref.), or very shallow depth z0 with moderate�ρ (Table 1, case 4). The first thing we observe is that upraisingz0 too much with moderate �ρ leads to unrealistic Moho depthvalues between 2 km and 38 km (Table 1, case 4). Second, when we
Table 1. Comparison between different inversions with parameters variations. We have changed the density contrast and thedepth reference to estimate the variation in the resulting Moho depth. This estimation has been made by comparing the Mohodepth obtained from the gravity inversion at the seismic stations locations with the one from the corresponding receiver functions(hereafter referred as mean difference). The values in bold represent the ones that have changed compared to the reference test.
Test �ρ (g cm−3) z0 (km) Min. max. Moho depth (km) Mean difference Root meanfrom gravity inversion (km) with RF square
Ref. 0.53 28 17.7/43.2 (diff. = 25.5) 2.57 3.281 0.3 28 11.6/59.6 (diff. = 48.0) −0.66 5.912 0.63 28 19.2/40.4 (diff. = 21.2) 3.28 3.033 0.53 30 19.1/46.0 (diff. = 27.0) 0.67 3.424 0.3 15 1.9/37.9 (diff. = 36.0) 11.44 3.915 0.4 30 16.2/52.6 (diff. = 36.4) −0.70 4.43
Table 2. Comparison between crustal thickness resulting from gravity in-version and from receiver function analysis (Stuart et al. 2005). The valuesfrom gravity modelling are those interpolated for the station locations rep-resented on Figs (2)–(4) and 6.
Stations Moho depth (km) from Moho depth (km) from Vp/Vs ratiogravity seismology
E32 28.4 32 1.9E34 32.9 39 1.9E45 32.9 33 1.9E46 28.1 30 1.9E47 30.9 34 1.9E48 37.1 40 1.9E53 33.1 38 1.9E54 33.4 39 1.9E63 32.5 33 1.9E75 33.6 39 1.9E77 32.7 31 1.9E79 32.9 39 1.9E80 30.1 33 1.9ADEE 35.0 38 1.8AMME 31.2 38 1.9AREE 33.4 32 1.9BORE 28.5 32 1.9BUTE 37.4 32 2.0CHAE 39.3 38 1.8DIKE 38.6 43 1.9GTFE 26.7 31 2.0HIRE 36.1 39 1.8LEME 35.4 33 2.0MELE 26.5 35 2.1SHEE 36.8 36 2.1WANE 26.5 30 2.0
take a lower density contrast, it induces unlikely large Moho depthvariations for a reasonable range of z0 (Table 1, case 1). So we finallyare limited for the choice of �ρ and z0. We investigate the case of amore likely value of �ρ (= 400 kg m−3) with a slightly deeper z0 (=30 km) in case 5, but the difference between the gravity results andthe receiver function results is bigger than for the reference values(see e.g. the rms value in Table 1). We thus choose the densitycontrast to be 530 kg m−3, with the knowledge that this value is notrepresentative of the density contrast at the Moho.
One way to test our results is to compare our crustal thicknessestimates from Oldenburg’s method with crustal thickness estimatesfrom seismic studies (Figs 4 and 6) (Stuart et al. 2005; Dugdaet al. 2005; Mackenzie et al. 2005; Maguire et al. 2003). A se-lection of the 80 receiver function estimates are reported in Fig. 6and Table 2. Fig. 6 shows the depth of the interface comparedwith crustal thickness estimates from broadband stations of the
C© 2005 RAS, GJI, 163, 775–787

782 C. Tiberi et al.
Figure 7. Parametrization for the initial model of the 3-D gravity inversion. The model is composed of six layers, each of them gridded into rectangularblocks shown by the light grey lines. The inside bold rectangle represents the area of data with coast lines indicated in thin black lines. We introduced a prioriconstraints by associated different standard errors to each blocks. Standard error is initially set to 0.05 in all blocks for every layer, except in two areas: the RedSea and the Gulf of Aden. For these two locations, the two first layers have high standard errors (0.1, shown in black) whereas the deeper layers (3–6) showlower standard errors (0.01, light grey).
EAGLE passive array (Stuart et al. 2005) and Dugda et al. (2005).Thickness estimates were made by assuming an average velocity of6.0 km s−1 (average crustal velocity from Mackenzie et al. 2005)and a varying Vp/Vs ratio between 1.8 and 2.1 (Table 2). The cor-relation between the Oldenburg inversion and the receiver functionanalysis is very good (Figs 4 and 6). Notably, we retrieve a shal-low Moho at the rift axis with an average depth of about 27–30 km(e.g. stations E46, E77), and a thick crust at the edges with valuesranging from 35 to more than 40 km (e.g. LEME, CHAE, DIKE,ADEE). One special attention should be drawn for the station MELE(Table 2). The receiver function result shows an interface at 35 kmdepth, that is 7 km more than the estimate from the refraction profilenear MELE (28 km, Maguire et al. 2003). Thus our estimate fromOldenburg (∼27 km) coincides more with the refraction Moho atthis location (Fig. 6).
3-D density model
To take into account the possible lateral changes in density contrast,we perform a 3-D gravity inversion. The aim of the inversion isto obtain a distribution of density variations in a 3-D model spacethat can fit the observed gravity data in a least-squares sense. Thecausative sources of the local complete Bouguer gravity anomalyare assumed to be distributed in N horizontal layers of thicknessHi, i = 1, 2, . . . , N , in the upper lithosphere. Every layer is subdi-vided into a number of rectangular blocks in which an initially ho-
mogeneous density contrast is assigned (Fig. 7). The average densityvariation per layer is assumed to be zero, and the mean density con-trast is subtracted after each iteration to maintain this condition ineach layer. The final density contrasts retrieved by the inversion arethen relative to each layer, and cannot be directly compared betweendepths.
The method we use is based on a Bayesian approach in whichany a priori information can be introduced in order to reducethe set of possible solutions (e.g. Widiwijayanti et al. 2004).We invert the same data set as for the Oldenburg inversion (i.e.15 km upward-continued, 4019 data). As a consequence, we neglectsurficial density variations, and we start our model at 10 km depth.Six layers constitute the initial model down to 50 km depth. Eachlayer is equally divided into 50 × 50 km blocks in the central area,and with larger blocks on the edges (Fig. 7). We chose a moredetailed gridding in the central part characterized by shorter wave-lengths. The grid becomes cruder on the edges, first to be consistentwith the data distribution, and second to widen the model to elimi-nate possible boundary effects (Fig. 7). No initial density variation isentered within the layer. We start the inversion with a homogeneousdensity contrast model. However, we enter a priori information viathe standard deviation in two specific areas: the southern Red Seaand Aden spreading ridges. The standard deviation for all layersand blocks is set to 0.05, except in the Red Sea and Gulf of Adenareas, where it is set to 0.1 for layers 1 and 2, and 0.01 for layers 3to 6, respectively (Fig. 7). By increasing the parameters’ standard
C© 2005 RAS, GJI, 163, 775–787
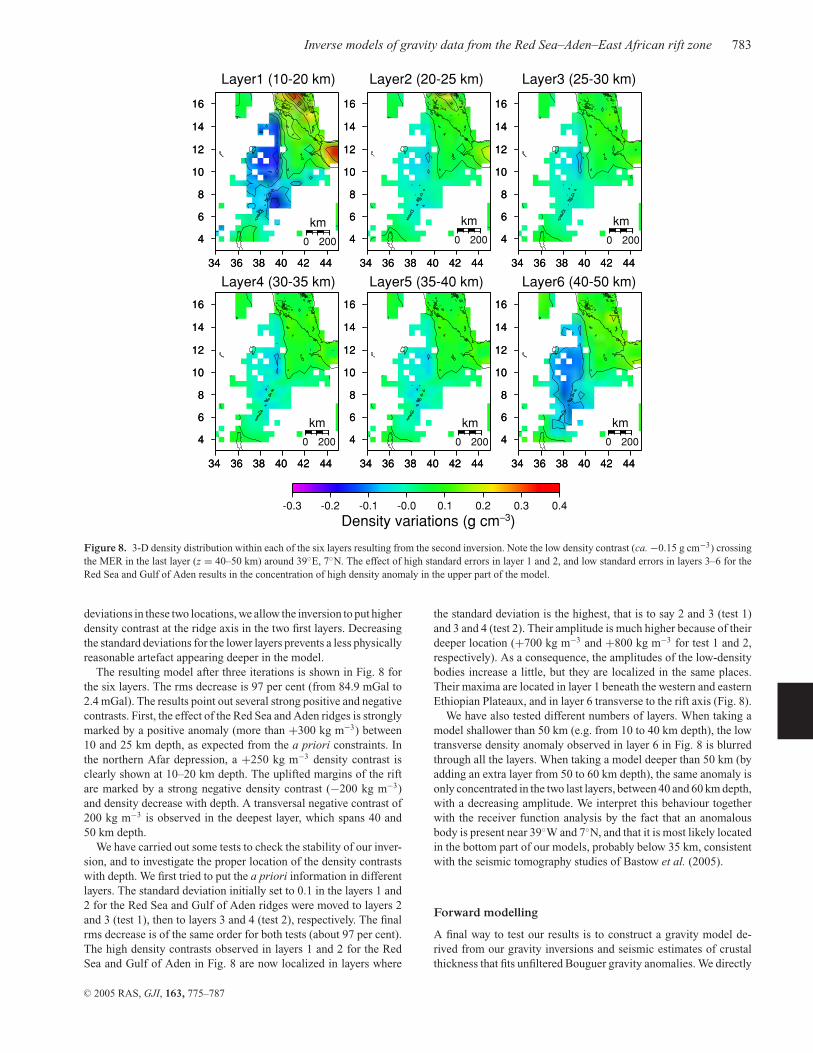
Inverse models of gravity data from the Red Sea–Aden–East African rift zone 783
34 36 38 40 42 44
4
6
8
10
12
14
16
34 36 38 40 42 44
4
6
8
10
12
14
16
34 36 38 40 42 44
4
6
8
10
12
14
16
34 36 38 40 42 44
4
6
8
10
12
14
16
34 36 38 40 42 44
4
6
8
10
12
14
16
34 36 38 40 42 44
4
6
8
10
12
14
16
34 36 38 40 42 44
4
6
8
10
12
14
16
34 36 38 40 42 44
4
6
8
10
12
14
16
34 36 38 40 42 44
4
6
8
10
12
14
16
34 36 38 40 42 44
4
6
8
10
12
14
16
34 36 38 40 42 44
4
6
8
10
12
14
16
34 36 38 40 42 44
4
6
8
10
12
14
16
-0.3 -0.2 -0.1 -0.0 0.1 0.2 0.3 0.4
Density variations (g cm−3)
Layer1 (10-20 km) Layer2 (20-25 km)
Layer4 (30-35 km)
Layer3 (25-30 km)
Layer5 (35-40 km) Layer6 (40-50 km)
0 200
km0 200
km
0 200
km
0 200
km
0 200
km
0 200
km
Figure 8. 3-D density distribution within each of the six layers resulting from the second inversion. Note the low density contrast (ca. −0.15 g cm−3) crossingthe MER in the last layer (z = 40–50 km) around 39◦E, 7◦N. The effect of high standard errors in layer 1 and 2, and low standard errors in layers 3–6 for theRed Sea and Gulf of Aden results in the concentration of high density anomaly in the upper part of the model.
deviations in these two locations, we allow the inversion to put higherdensity contrast at the ridge axis in the two first layers. Decreasingthe standard deviations for the lower layers prevents a less physicallyreasonable artefact appearing deeper in the model.
The resulting model after three iterations is shown in Fig. 8 forthe six layers. The rms decrease is 97 per cent (from 84.9 mGal to2.4 mGal). The results point out several strong positive and negativecontrasts. First, the effect of the Red Sea and Aden ridges is stronglymarked by a positive anomaly (more than +300 kg m−3) between10 and 25 km depth, as expected from the a priori constraints. Inthe northern Afar depression, a +250 kg m−3 density contrast isclearly shown at 10–20 km depth. The uplifted margins of the riftare marked by a strong negative density contrast (−200 kg m−3)and density decrease with depth. A transversal negative contrast of200 kg m−3 is observed in the deepest layer, which spans 40 and50 km depth.
We have carried out some tests to check the stability of our inver-sion, and to investigate the proper location of the density contrastswith depth. We first tried to put the a priori information in differentlayers. The standard deviation initially set to 0.1 in the layers 1 and2 for the Red Sea and Gulf of Aden ridges were moved to layers 2and 3 (test 1), then to layers 3 and 4 (test 2), respectively. The finalrms decrease is of the same order for both tests (about 97 per cent).The high density contrasts observed in layers 1 and 2 for the RedSea and Gulf of Aden in Fig. 8 are now localized in layers where
the standard deviation is the highest, that is to say 2 and 3 (test 1)and 3 and 4 (test 2). Their amplitude is much higher because of theirdeeper location (+700 kg m−3 and +800 kg m−3 for test 1 and 2,respectively). As a consequence, the amplitudes of the low-densitybodies increase a little, but they are localized in the same places.Their maxima are located in layer 1 beneath the western and easternEthiopian Plateaux, and in layer 6 transverse to the rift axis (Fig. 8).
We have also tested different numbers of layers. When taking amodel shallower than 50 km (e.g. from 10 to 40 km depth), the lowtransverse density anomaly observed in layer 6 in Fig. 8 is blurredthrough all the layers. When taking a model deeper than 50 km (byadding an extra layer from 50 to 60 km depth), the same anomaly isonly concentrated in the two last layers, between 40 and 60 km depth,with a decreasing amplitude. We interpret this behaviour togetherwith the receiver function analysis by the fact that an anomalousbody is present near 39◦W and 7◦N, and that it is most likely locatedin the bottom part of our models, probably below 35 km, consistentwith the seismic tomography studies of Bastow et al. (2005).
Forward modelling
A final way to test our results is to construct a gravity model de-rived from our gravity inversions and seismic estimates of crustalthickness that fits unfiltered Bouguer gravity anomalies. We directly
C© 2005 RAS, GJI, 163, 775–787

784 C. Tiberi et al.
0
20
40
0 100 200 300 400
-250
-200
-150
-100
-50
0 100 200 300 400
C A G B K
E79
E45 E77
E75 E53E54
E63
E80E47
E46
BOREGTFE
WANE
LD
Observed gravityModelled gravity
+180 kg.m-3
+130 kg.m-3
-170 kg.m-3
Volcano position
Receiver function estimation
F D
+530 kg.m-3
Oldenburg gravity
Moho from Oldenburg inversion
Dep
th (
km)
Bou
guer
(m
Gal
)
Distance along the profile (km)
U
Figure 9. Model and predicted Bouguer anomaly data along profile LL′(Fig. 6). Circles represent the Moho depth estimate from receiver functions.Triangles represent Quaternary shield volcanoes or large calderas (C = Cor-betti; A = Aluto; G = Gedemsa; B = Boset; K = Kone; F = Fantale;D = Dofen). U is magmatic underplate interpreted in this study. LD arelow-density bodies interpreted as sedimentary layers. Density contrasts arerelative to the crustal value. Also indicated is the Moho estimation fromOldenburg inversion (dotted line in the bottom panel), and its respectivegravity signal (dotted line in the upper panel). One can show that the crustalthickness rather well explains the long wavelength of gravity, whereas theshorter wavelengths are to be modelled by intrusive bodies.
model gravity anomalies with the GM-SYS Geosoft software on aprofile LL′ that runs along the rift axis (Figs 6 and 9). We use thecomplete Bouguer anomaly from point data shown in Fig. 2, andwe constrain our model with Moho depths estimated from receiverfunction analyses for 13 seismological stations, including WANEfrom Dugda et al. (2005) (Figs 2 and 3). The aligned chains of Qua-ternary eruptive centres in the magmatic segments are character-ized by short-wavelength, positive Bouguer gravity anomalies (e.g.Mahatsente et al. 1999) (e.g. Figs 4a–d). Following the suggestionsof Keranen et al. (2004) and Ebinger & Casey (2001) we includemafic intrusions that feed magma reservoirs and dike intrusion zonesin the shallow upper crust. In our forward models, we make no at-tempt to determine the width or depth extent of the intrusive bodies;our aim is to test the crustal thickness estimates derived from in-verse models of gravity data. As our model is only 2-D, it does notprevail on any extension or variation perpendicular to this axis. Byassuming an infinite size for the body in the direction perpendicularto LL′, we minimized the section of the bodies required to explainthe shortest wavelength features. Fig. 9 could be regarded as a lowerbound for the section of the bodies.
The resulting 2-D model is shown Fig. 9, which shows a southto north decrease in crustal thickness, with a zone of thicker crustbetween E79 and E47. The long wavelength component of the signalcan be well explained by a Moho discontinuity that runs through thereceiver function maximum depth. The signal of the high-densitybodies beneath the large eruptive centres is superposed on the re-gional signal emanating from crustal thickness variations; these ar-eas may also be underplated. A shallow, low-density body (LD onFig. 9) is included between Aluto and Gedemsa volcanoes to simu-late the effect of 600 m of lacustrine and volcaniclastic strata con-tained in the caldera lakes (LeTurdu et al. 1999); these low-densitybodies may account for local variations in gravity anomalies. The
forward model explains both the seismic and inverse model esti-mates of crustal thickness variations along the length of the riftsystem, validating our interpretations, with the addition of shallowcrustal features to explain short wavelength features not present inthe filtered data.
D I S C U S S I O N
The above Oldenburg and 3-D inversions alone are unable to pre-cisely locate the anomalies with depth, even if we could assumeafter our tests that the low density transverse to the rift at 39◦W and7◦N is deep and should correspond to a lower crustal body. To gofurther in the interpretation, we require more information which wecan extract from the receiver function results.
Receiver functions show the thickest crust along the axial pro-file lies at 8◦N, 39◦E, but this thickening is seen only in the 3-Ddensity model. The zone of locally thicker crust may be too short awavelength to be seen in the Oldenburg solution (stations AMME,E54, E53, E75, E79). From the 3-D density model we retrieve deep,low-density sources at this location (layer 6, Fig. 8). The directionof this perturbation is transverse to the main rift axis, and correlatesvery well with a deep interface retrieved by the receiver functionsand seismic refraction data (Maguire et al. 2003). We are fully awarethat this kind of 3-D inversion is not well enough constrained to beunique. The fact that this result is seen in a totally independent dataset, however, advocates its close approximation to the structure ofthe Ethiopian plateau and superposed rift valleys. Its low densityvalue (ca. −150 kg m−3) compared to the background mantle value(layer 6, Fig. 8) and its location argue for an underplated crust.
Calibration of our results with independent seismic data allowsus to map crustal thickness variations across the region, and exam-ine the effects of magmatism and rifting on crustal structure. Thecomparison between the inversion for crustal thickness, 3-D gravityinversion and receiver function results shows the following princi-pal features, which provide insights into modification of continentallithosphere by plume and continental breakup processes.
(1) Thin crust is predicted beneath the magmatic segments (axialvolcanic ranges) in the northern Afar depression (Figs 1 and 4a).The low, broad form of Erta ‘Ale and its persistent lava lake suggestthat it forms largely through intrusion, and functions as an incipientslow-spreading mid-ocean ridge (Oppenheimer & Francis 1997).In light of these observations, we interpret the inversion results asa combination of crustal thinning and a lateral increase in densitycorresponding to magmatic intrusions feeding the volcanic chains.Assuming each end member, we obtain a minimum crustal thick-ness of 23 km (no lateral density contrast), or a density contrast of240 kg m−3 (with no thinning).
(2) A shallower Moho is found along the rift axis, with crustalthickness values decreasing from 32 to 33 km in the south to24 km beneath southern Afar. These estimates concur with acrossand along-axis seismic refraction profiles (Maguire et al. 2003;Keller et al. 2004; Mackenzie et al. 2005) and receiver function es-timates of crustal thickness beneath the rift zone (Fig. 6). From ourgravity analyses, no significant crustal density signature or crustalthickness variation is observed within the Afar depression. Thereare no profound changes from north to south, despite the com-plex tectonic history within a migrating triple junction zone (e.g.Eagles et al. 2002; Manighetti et al. 2001). There may be, however,smaller-scale variations at wavelengths excluded from our analyses.
(3) Crustal thickness predicted in the inversions increases tomore than 40 km beneath the ∼2500-m-high Ethiopian plateau
C© 2005 RAS, GJI, 163, 775–787

Inverse models of gravity data from the Red Sea–Aden–East African rift zone 785
flanking the southern Red Sea margins, consistent with receiverfunction estimates of crustal thickness (Fig. 6). Our inversions un-derpredict crustal thickness on the plateau because the inversiondoes not take into account the higher density of the underplate. Thethickest crust corresponds to the region of thickest Oligocene floodbasalts, which crop out along the southwestern margin of the south-ern Red Sea. There is an apparent asymmetry across the MER, withthinner crust predicted beneath the southeastern side of the MER(Somali plate) than on the northeastern side (Nubia plate) (Fig. 6).This asymmetry has been noted in teleseismic delay times, whichdecrease to the south and are interpreted as thinner, higher veloc-ity crust and upper mantle (Bastow et al. 2005). The coincidenceof thick extrusive volcanic piles and thicker crust suggest that thelocus of magmatic underplating coincides with the margins of the∼28 Ma southern Red Sea rift, which terminated at ∼10◦N untillinkage with the MER was achieved at ∼10 Ma (Wolfenden et al.2004, 2005).These crustal thickness variations have implications for evolution ofthe Oligocene plume province. The 1.5 to 2 km-thick flood basaltsact as a load on the plate, partially countering the buoyancy effectsof underplating and hot mantle. Thus, stripping off the effects of thevolcanic leads to ∼70 m of uplift above the mean plateau elevation,assuming 2800 kg m−3 basalt layer. Assuming Airy isostatic com-pensation for the crustal thickness variations observed throughoutthe study region, a mean crustal density of 2700 kg m−3, an uppermantle density of 3200 kg m−3, and a compensating root of 14 kmrelative to the 28-km-thick crust outside the flood basalt provinceprovides an estimate of 2.5 km of plateau uplift. Thus, our com-bined interpretation of gravity and seismic data indicates that mostof the plateau uplift is isostatically compensated by magmatic un-derplating, most of which is probably associated with the ∼31–29 Ma flood basalt event along the southern Red Sea region. Giventhe variation in underplate thickness estimates and possible errors inpre-rift crustal thickness, there may be a few hundred metres of dy-namic uplift from a plume tail, which may now be south of the studyarea (e.g. Ebinger & Sleep 1998), or beneath the Afar depression(e.g. Montelli et al. 2004).
(4) A girdle of thicker crust underlies the MER valley in the re-gion of the lakes, which fill faulted calderas (Fig. 6). The crust iseither thicker (40 km from the receiver function analysis) or lessdense (−150 kg m−3). This can reflect either a segmentation in therift structure or a considerable thickness of magmatic underplatebeneath the surface expression of explosive volcanism. The less ex-tended southern rift sector also lacks magmatic segments, suggest-ing that higher levels of magmatic intrusion accompany magmaticsegment development.
Our estimates of crustal thickness differ considerably with pat-terns predicted in the 3-D forward models of Mahatsente et al.(1999), who predict a decrease in crustal thickness southward alongthe MER, and a greater crustal thickness beneath the southeasternflank than the northwestern rift flank. Some of these differencesmay be caused by the limited size of their study region, as well asdifferences in model assumptions.
New and existing data document significant along-axis variationsin the amount of crustal stretching, and provide information on mag-matic intrusion and underplating of the crust beneath the flood basaltprovince. Rifting commenced concurrent with or immediately afterthe flood basalt episode, so we reference crustal stretching to the40-km-thick crust beneath the plateau. Assuming that this crustalthickness is the one before MER extension (i.e. at ∼11 Ma), andconsidering the crustal thickness we obtain in this study, the crustal
stretching factor β is ∼2 within the Afar depression from WANEnorth, but is ∼1.2 in the central MER (Fig. 6). Clearly, these areminimum stretching estimates considering the seismic evidence forunderplating and intrusion beneath magmatic segments. The stationWANE is located near the palaeotriple junction, north of which crusthas experienced a longer stretching and magmatic history.
C O N C L U S I O N S
Gravity data inversions constrained by seismic data allow us to mapcrustal thickness and/or density variations across the uplifted andrifted Cenozoic flood basalt province. Inversion results for the riftvalleys and supporting seismic data indicate that the faulted and vol-canically active Main Ethiopian, southern Red Sea, and easternmostGulf of Aden rift valleys are underlain by thinner, denser crust thanunderlies the adjacent plateaux. Crustal thickness decreases fromsouth to north along the length of the MER, with a sharp decreaseinto the Afar depression. Forward and inverse models predict a lensof underplate beneath the rift south of ∼8◦N; this layer is absentin rift sectors with magmatic segments. Crustal thickness beneaththe uplifted Ethiopian plateau along the southern Red Sea margin(Nubian plate) is >40 km, consistent with receiver function esti-mates of crustal thickness (44 km) and seismic refraction data. Theseestimates indicate that almost the entire part of the 2.5 km plateauuplift is isostatically supported by crustal thickness variations, andmagmatic underplating.
Our inverse models and their comparisons with forward modelsand seismic data document indicate that the crust beneath the up-lifted plateau and the rift valleys has been modified by magmatic un-derplating and intrusion. Crust beneath the rifts has been stretched,with amount of stretching increasing from south to north into theAfar depression. Within the southern Red Sea rift where seismic con-straints are few and rifting has occurred over a longer time period, ourestimates of crustal thinning may be overestimates. Thus, magmaticprocesses prior to and during rifting have fundamentally changedthe density structure of the crust prior to continental breakup.
A C K N O W L E D G M E N T S
Many thanks to Olivia, Come, Lysandre, Adele and Antonin, fortheir welcome interruptions. Ketema Tadesse, Abiy Hunegnaw,Moges Tegabe and Ketsela Tadesse are thanked for providing accessto Geological Survey of Ethiopia gravity data. We thank Eve Dalyfor her careful review. Helene Hebert is greatly thanked for provid-ing us the Tadjoura-Aden gravity data. We would like also to thankR. Holme, M. Kaban and an anonymous reviewer for their helpfulsuggestions to improve this manuscript. Almost all figures were pre-pared with the Generic Mapping Tool developed by P. Wessel andW. Smith (1995). CT acknowledges a Marie Curie post-doctoral fel-loswhip HPMF-CT-2000-00630. CE is grateful for support from theLeverhulme Trust and NERC grant NER/T/S/2000/00647. This isIPGP contribution n◦ 2080.
R E F E R E N C E S
Ayalew, D. & Yirgu, G., 2003. Crustal contribution to the genesis ofEthiopian plateau rhyolitic ignimbrites: basalt and rhyolite geochemicalprovinciality, J. geol. Soc. Lond., 160, 47–56.
Ayalew, D., Bourdon, E., Ebinger, C., Wolfenden, E. & Yirgu, G., 2005. Tem-poral compositional variation of early syn-rift rhyolites along the westernRed Sea margin and northern Main Ethiopian rift, submitted to Yirgu, G.,
C© 2005 RAS, GJI, 163, 775–787

786 C. Tiberi et al.
Ebinger, C., and Maguire, P., Structure and dynamics of the East Africanrift system in the Afar volcanic province, Geol. Soc. London Spec. Pub.,submitted.
Ayele, A., Stuart, G. & Kendall, J.M., 2004. Insights into rifting from shear-wave splitting in press: an example from Ethiopia, Geophys. J. Int., 157,354–362.
Barberi, F. & Varet, J., 1977. Volcanism of Afar: Small-scale plate tectonicimplications, Bull. geol. Soc. Am., 56, 903–915.
Bastow, I.D., Stuart, G.W., Kendall, J.-M. & Ebinger, C.J., 2005. Upper-mantle seismic structure in a region of incipient continental breakup:northern Ethiopian rift, Geophys. J. Int., 162, 479–493.
Bellahsen, N., Faccenna, C., Funiciello, F., Daniel, J.M. & Jolivet, L., 2003.Why did Arabia separate from Africa? Insights from 3-D laboratory ex-periments, Earth planet. Sci. Lett., 216, 365–381.
Benoit, M.H., Nyblade, A.A., VanDecar, J.C. & Gurrola, H., 2003.Upper mantle P wave velocity structure and transition zone thick-ness beneath the Arabian Shield, Geophys. Res. Lett., 30, 1531,doi:10.1029/2002GL016436.
Berckhemer, H. et al., 1975. Deep seismic soundings in the Afar region andon the highland of Ethiopia, in Afar Between Continental and OceanicRifting, pp. 89–107, eds. Pilger, A. & Rosler, A., Schweizerbart Stuttgart.
Bosellini, A., Russo, A. & Assefa, G., 2001. The Mesozoic succession ofDire Dawa, Harar province, Ethiopia, J. Afri. Earth Sci., 32, 403–417.
Boutilier, R. & Keen, C., 1999. Small-scale convection and divergent plateboundaries, J. geophys. Res., 104, 7389–7403.
Buck, W.R., 2004. Consequences of athenospheric variability on continentalrifting, in Rheology and Deformation of the Lithosphere at ContinentalMargins, pp. 1–30, eds. Karner, G.D., Taylor, B., Driscoll, N. & Kohlstedt,D., Columbia University Press, New York.
Christensen, N. & Mooney, W., 1995. Seismic velocity structure and com-position of the continental crust: a global view, J. Geophys. Res., 100,9761–9788.
Cochran, J.R., 1981. The Gulf of Aden: structure and evolution of a youngocean basin and continental margin, J. geophys. Res., 86, 263–288.
Cochran, J.R., 1983. A model for development of the Red Sea, AAPG Bull.,67, 41–69.
Coffin, M. & Eldholm, O., 1994. Large igneous provinces: crustal structure,dimensions, and external consequences, Rev. Geophys., 32, 1–36.
Courtillot, V., Davaille, A., Besse, J. & Stock, J., 2003. Three distinct typesof hotspots in the Earth’s mantle, Earth planet. Sci. Lett., 205, 295–308.
Cox, K., 1980. A model for flood basalt volcanism, J. Petrol., 21, 629–650.Daly, E., Keir, D., Ebinger, C. & Stuart, G., 2005, Along-axis segmentation of
a transitional continental rift from crustal tomography studies in Ethiopia,submitted to J. geophys. Res., submitted.
Dugda, M., Nyblade, A., Julia, J., Langston, C.A., Ammon, C. & Simiyu,S., 2005. Crustal structure in Ethiopia and Kenya from receiver functionanalyses: Implication for rift development in eastern Africa, J. geophys.Res., 110, B01303, doi:10.1029/2004JB003065.
Eagles, G., Gloaguen, R. & Ebinger, C., 2002. A model for the creation of amicroplate: kinematics of the Danakil microplate, Earth planet. Sci. Lett.,203, 607–620.
Ebinger, C.J. & Hayward, N., 1996. Soft plates and hot spots: Constraintsfrom the Ethiopian and Afar rifts, J. geophys. Res., 101, 21 859–21 876.
Ebinger, C.J. & Sleep, N.H., 1998. Cenozoic magmatism in central and eastAfrica resulting from impact of one large plume, Nature, 395, 788–791.
Ebinger, C.J. & Casey, M., 2001. Continental breakup in magmaticprovinces: an Ethiopian example, Geology, 29, 527–530.
Ebinger, C., Bechtel, T., Forsyth, D. & Bowin C., 1989. Effective elasticplate thickness beneath the East-African and Afar plateaus and dynamiccompensation of the uplifts, J. geophys. Res., 94, 2883–2901.
Ebinger, C.J., Yemane, T., WoldeGabriel, G., Aronson, J.L. & Walter R.C.,1993. Late Eocene–Recent volcanism and faulting in the southern mainEthiopian rift, J. geol. Soc. Lond., 150, 99–108.
George, R., Rogers, N. & Kelly, S., 1998. Earliest magmatism in Ethiopia:Evidence for two mantle plumes in one flood basalt province, Geology,26, 923–926.
Ghebreab, W. & Talbot, C., 2000. Red Sea extension influenced by Pan-African tectonic grain in eastern Eritrea, J. Struc. Geology, 22, 931–946.
Hadiouche, O., Jobert, N. & Montagner, J.-P., 1989. Anisotropy of the Africancontinent inferred from surface waves, Phys. Earth planet. Int., 58, 61–81.
Hayward, N. & Ebinger, C.J., 1996. Variations in along-axis segmentationof the Afar Rift System, Tectonics, 15, 244–257.
Hebert, H., Deplus, C., Huchon, P. & Khanbari, K., 2001. Lithospheric struc-ture of a nascent spreading ridge inferred from gravity data: the westernGulf of Aden, J. geophys. Res., 106, 26 345–26 364.
Hebert, L. & Langston, C.A., 1985. Crustal thickness estimates at AAE andNAI using teleseismic P-wave conversions, Tectonophysics, 111, 299–327.
Hofmann, C., Courtillot, V., Feraud, G., Rochette, P., Yirgu, G., Ketefo, E. &Pik, R., 1997. Timing of the Ethiopian flood basalt event and implicationsfor plume birth and global change, Nature, 389, 838–841.
Holbrook, W.S. & Kelemen, P., 1993. Large igneous province on the US At-lantic margin and implications for magmatism during continental breakup,Nature, 364, 433–436.
Keller, G.R., Harder, S.H., O’Reilly, B., Mickus, K., Tadesse, K., Maguire,P.K.M. & the EAGLE Working Group, 2004. A preliminary analysis ofcrustal structure variations along the Ethiopian Rift, in Yirgu, G. et al.,eds, Proceedings of the International Conference on the East African RiftSystem, June 20–24, 2004, Addis Ababa, Ethiopia, Ethiopian Geoscienceand Mineral Engineering Association, pp. 97–101.
Kendall, J.-M., Stuart, G., Ebinger, C., Bastow, I. & Keir, D., 2005. Magma-assisted rifting in Ethiopia, Nature, 433, 146–148.
Keranen, K., Klemperer, S., Gloaguen, R. & EAGLE Working Group, 2004.Three-dimensional seismic imaging of a protoridge axis in the MainEthiopian rift, Geology, 32, 949—952.
Kieffer, B. et al., 2004. Flood and shield basalts from Ethiopia: Magmasfrom the African Superswell, J. Petrol., 45, 793—834.
King, S. & Anderson, D., 1998. Edge-driven convection, Earth planet. Sci.Lett., 160, 289–296.
Knox, R., Nyblade, A. & Langston, C., 1998. Upper mantle S wave velocitiesbeneath Afar and western Saudi Arabia from Rayleigh wave dispersion,Geophys. Res. Lett., 25, 4233–4236.
Korenaga, J., Holbrook, W.S., Kent, G.M., Keleman, P.B., Detrick, R.S.,Larsen, H-C., Hopper, J.R. & Dahl-Jensen, T., 2000. Crustal structureof the southeast Greenland margin from joint refraction and reflectionseismic tomography, J. geophys. Res., 105, 21 591–21 614.
LeTurdu, C. et al., 1999. The Ziway-Shala lake basin system, Main Ethiopianrift: influence of volcanism, tectonics, and climatic forcing on basin for-mation and sedimentation, Palaeo., 150, 135–177.
Mackenzie, G.D., Thybo, H. & Maguire, P.K.H., 2005. Crustal velocity struc-ture across the Main Ethiopian Rift: Results from two-dimensional wide-angle seismic modelling, Geophys. J. Int., 162, 994–1006.
Maguire, P. et al., 2003. Geophysical project in Ethiopia studies continentalbreakup, EOS, Trans. Am. geophys. Un., 84, 337–340.
Mahatsente, R., Jentzsch, G. & Jahr, T., 1999. Crustal structure of theMain Ethiopian rift from gravity data: 3-dimensional modelling, Tectono-physics, 313, 363–382.
Makris, J. & Ginzburg, A., 1987. The transition between continental riftingand sea-floor spreading, Tectonophysics, 141, 199–214.
Manighetti, I., Tapponnier, P., Courtillot, V., Gruszow, S. & Gillot, P.-Y.,1997. Propagation of rifting into along the Arabia-Somalia plate bound-ary: the Gulfs of Aden and Tadjurah, J. geophys. Res., 102, 2681–2710.
Manighetti, I., Tapponnier, P., Courtillot, V., Gallet, Y., Jacques, E. & Gillot,P.-Y., 2001. Strain transfer between disconnected, propagating rifts in Afar,J. geophys. Res., 106, 13 613–13 666.
Mechie, J. & Prodehl, C., 1988. Crustal and uppermost mantle structurebeneath the Afro-Arabian Rift System, Tectonophysics, 153, 103–121.
Menzies, M., Klemperer, S., Ebinger, C. & Baker, J., 2002. Characteristicsof volcanic rifted margins, volcanic rifted margins, Geol. Soc. Am. Spec.Pap. 362.
Mohr, P., 1989. Nature of the crust under Afar—New igneous not thinnedcontinental, Tectonophysics, 167, 1–11.
Montelli, R., Nolet, G., Dahlen, F.A., Masters, G., Engdahl, E.R. & Hung,S.-H., 2004. Finite-frequency tomography reveals a variety of plumes inthe mantle, Science, 303, 338–343.
C© 2005 RAS, GJI, 163, 775–787

Inverse models of gravity data from the Red Sea–Aden–East African rift zone 787
Oldenburg, D.W., 1974. The inversion and interpretation of gravity anoma-lies, geophysics, 39, 526–536.
Oppenheimer, C. & Francis, P., 1997. Remote sensing of heat, lava, andfumarole emissions fomr Erta ‘Ale volcano, Ethiopia, Int. J. Remote Sens.,18, 1661–1692.
Parker, R.L., 1972. The rapid calculation of potential anomalies, Geophys.J. R. astr. Soc., 31, 447—455.
Pik, R., Marty, B., Carignan, J. & Lave, J., 2003. Stability of the upper Niledrainage network (Ethiopia) deduced from (U-Th)/He thermochronom-etry: implications for uplift and erosion of the Afar plume dome, Earthplanet. Sci. Lett., 215, 73–88.
Ritsema, J. & van Heijst, H., 2000. A new model for the upper mantlestructure beneath Africa, Geology, 28, 63–66.
Stuart, G., Bastow, I. & Ebinger, C., 2005. Crustal structure of the northernMain Ethiopian rift from receiver function studies, submitted to Yirgu, G.,Ebinger, C., and Maguire, P., Structure and dynamics of the East Africanrift system in the Afar volcanic province, Geol. Soc. London Spec. Pub.,submitted.
Tesfaye, S., Kusky, T.T. & Harding, D., 2003. Early Continental breakupboundary and migration of the Afar triple junction, Ethiopia, Geol. Soc.Am. Bull., 115, 1053–1067.
Wessel, P. & Smith, W.H.F., 1991. Free software helps map and display data,EOS Trans. Am. Geophys. Um., 72, 445–446.
White, R. & McKenzie, D., 1989. Magmatism at rift zones: The generationof volcanic continental margins and flood basalts, J. Geol. Res., 94, 7685–7729.
Widiwijayanti, C., Tiberi, C., Deplus, C., Diament, D., Mikhailov, V. &Louat, R., 2004. Geodynamic evolution of the northern Molucca Sea area(eastern Indonesia) constrained by 3-D gravity field inversion, Tectono-physics, 386, 203–222.
WoldeGabriel, G., Aronson, J.L. & Walter, R.C., 1990. Geology, geochronol-ogy and rift basin development in the central sector of the Main EthiopianRift, Geol. Soc. Am. Bull., 102, 439–485.
Woldetinsae, G. & Gotze, H-J., 2005. Gravity field and isostatic stateof Ethiopia and its adjacent areas, J. Afri. Earth Sciences, 41, 103–117.
Wolfenden, E., Yirgu, G., Ebinger, C., Ayalew, D. & Deino, A., 2004. Evo-lution of the northern Main Ethiopian rift: birth of a triple junction, Earthplanet. Sci. Lett., 224, 213–228.
Wolfenden, E., Ebinger, C., Yirgu, G., Renne, P. & Kelley, S.P., 2005. Evo-lution of a volcanic rifted margin: Southern Red Sea, Ethiopia, Geol. Soc.Am. Bull, 117, 846–864.
C© 2005 RAS, GJI, 163, 775–787
Copyright © 2022 FDOKUMEN