Invasive alien plants increase CH4 emissions from a subtropical tidal estuarine wetland
Upload
khangminh22Category
view
2download
0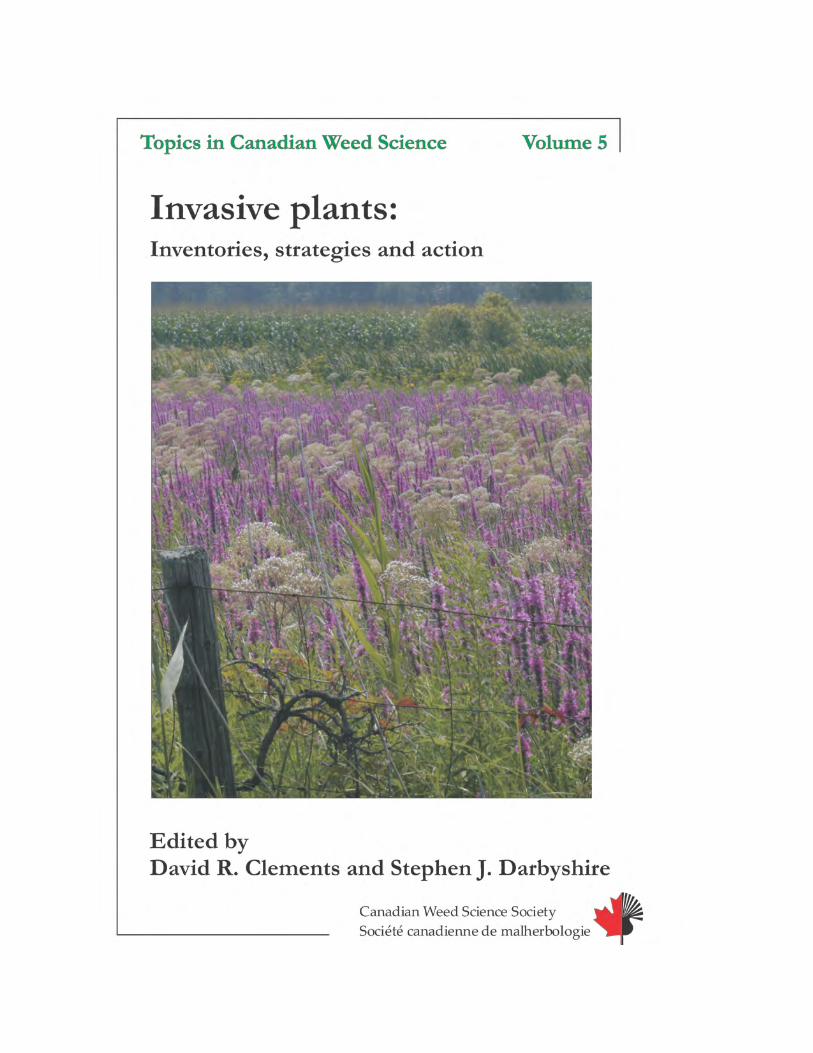


Topics in Canadian Weed Science Volume 5
Invasive plants: Inventories, strategies
and action Edited by
David R. Clements1 and Stephen J. Darbyshire2 1Biology and Environmental Studies, Trinity Western University, Langley, British Columbia, Canada 2Agriculture and Agri-Food Canada, Eastern Cereal and Oilseed Research Centre, Ottawa, Ontario, Canada
Canadian Weed Science Society – Société canadienne de malherbologie Sainte Anne de Bellevue, Québec, Canada

ii
Disclaimer
All rights reserved. No part of this publication may be reproduced or transmitted in any form or by any means, electronic or mechanical, including photocopy, recording, or any other information storage or retrieval system, without the written permission of the publisher. This publication is designed to provide accurate and authoritative information. It is sold or distributed with the understanding that the publisher is not engaged in rendering professional services. If advice or expert assistance is required, the services of a competent professional person should be sought. Neither the publisher nor authors are responsible for errors or omissions. It remains the responsibility of the readers to follow product information contained on the product label. While every effort has been made to ensure accuracy, CWSS-SCM, its executive, committee members and contractors do not accept responsibility for any publication errors or any consequences resulting from the use of this publication. To order copies of this publication, please contact our office or visit our web site at: www.cwss-scm.ca
© Copyright 2007 (ISBN 978-0-9688970-5-8)
Canadian Weed Science Society Société canadienne de malherbologie
(CWSS-SCM) P.O. Box 222
Sainte Anne de Bellevue (Québec) H9X 3R9
Telephone: + 1 514 630-4658 Fax: + 1 514 695-2365 E-mail: [email protected] Citation for Volume: Clements, D. R. and S. J. Darbyshire, eds. 2007. Invasive plants:
Inventories, strategies and action. Topics in Canadian Weed Science, Volume 5. Sainte Anne de Bellevue, Québec: Canadian Weed Science Society – Société canadienne de malherbologie. 165 pp.
Citation for Chapter: Author(s). 2007. Title. Pages xx-xx in D. R. Clements and S. J. Darbyshire,
eds. Invasive plants: Inventories, strategies and action. Topics in Canadian Weed Science, Volume 5. Sainte Anne de Bellevue, Québec: Canadian Weed Science Society – Société canadienne de malherbologie.

iii
Foreword
The Canadian Weed Science Society (CWSS) – la Société canadienne de malherbologie (SCM) is a vibrant national society dedicated to the study and understanding of weeds and invasive plant species, and their impact on the agricultural landscape and on habitats beyond. CWSS members are dedicated to a proactive, integrated approach to weed and invasive plant management. The CWSS aims to provide knowledge and services to its members and interested parties nationally and internationally. The society strives to deliver the latest information on weeds and invasive plant species and their management by supporting a dynamic web site (www.cwss-scm.ca), organizing timely symposia on critical issues at the annual meeting, and through various publications.
Over the past 50 years, emphasis in weed science has shifted from herbicide discovery and evaluation to broader environmental and ecological issues such as alternative weed management strategies for cropping systems, the agro-ecological impact of gene flow from transgenic crops, and management of invasive plant species. Because of the strategic importance of these various issues, weed scientists and practitioners are involved in conducting research and delivering information which secures Canada’s economic prosperity while fostering innovations that ensure environmental sustainability.
Maintaining biodiversity and environmental quality is essential to the integrity of ecosystems, including the agroecosystem. A number of ecosystems are currently facing severe challenges, including the challenge from invasive plant species. Weed scientists and practitioners across Canada and throughout the world are currently examining the historic and current impact of invasive species, and are developing tools for risk assessment, early detection and rapid response. Canada benefits substantially from the contribution of weed science in identifying and alerting the public about potential invasive aliens and noxious weeds.
To address the invasive plant issue, the CWSS held a Symposium at its 2006 national meeting. The Proceedings of this Symposium are presented in this fifth volume of the series – “Topics in Canadian Weed Science”. The publication of this new volume confirms CWSS’ commitment to the delivery of information of the highest quality to the widest audience. However, such a publication can only exist thanks to the contributions of authors, reviewers and editors. On behalf of the society, I would like to express our most sincere gratitude to all who so generously participated in this endeavour. Anne Légère President, CWSS – Présidente, SCM 2005-2006


v
Preface
The Canadian Weed Science Society – Société canadienne de malherbologie (CWSS-SCM) is pleased to present “Invasive plants: Inventories, strategies, and action”, the fifth volume of Topics in Canadian Weed Science. This volume is a compilation of peer-reviewed papers that were presented during the plenary session at the 2006 CWSS-SCM annual meeting held in Victoria, British Columbia.
Topics in Canadian Weed Science is intended to advance the knowledge of weed science and increase awareness of the consequences of weeds in agroecosystems, forestry, and natural habitats. The volumes cover a wide range of topics and provide a diverse source of information for weed science professionals and the general public.
The plenary session topics at the CWSS-SCM annual meeting are of both national and international interest, and we invite weed science professionals to attend our annual meetings. The annual meeting is usually held in late November, with locations alternating between Eastern and Western Canada. Meeting details are available on the website (www.cwss-scm.ca).
The CWSS-SCM Board of Directors expresses their gratitude to David Clements and Stephen Darbyshire, the Victoria Local Arrangements Committee, the contributing authors, and the reviewers who have made this publication possible. Other volumes of Topics in Canadian Weed Science include:
Vol. 1: Field boundary habitats: Implications for weed, insect, and disease
management; Vol. 2: Weed management in transition; Vol. 3: Soil residual herbicides: Science and management; Vol. 4: The first decade of herbicide-resistant crops in Canada. These volumes are available for purchase and can be ordered through the
CWSS-SCM website.
Eric Johnson Publications Director CWSS-SCM

vi
Acknowledgements
Cover
Photograph: Purple loosestrife (Lythrum salicaria) and common reed (Phragmites australis) invading a low area at the edge of a corn (Zea mays) field. This image provided by Daniel Cloutier, Beaconsfield, Québec, Canada. Cover design for the Series: Ralph Underwood, Agriculture and Agri-Food Canada, Saskatoon Research Centre, Saskatoon, SK.
Publication funding: We acknowledge a generous grant from the Invasive Alien Species Partnership Program through Environment Canada in support of the costs of the symposium in Victoria as well as the production, printing and distribution of this volume.
Reviewers
The editors would like to thank the following people for their assistance in reviewing the papers contained in this volume.
W. Crins P. Gobster E. Haber P. Holloran C. Jarnevich A. McClay
T. McIntosh L. Milbrath N. Page D. Panetta M. Pitcairn
P. Pyšek L. Rew G. Schrader E. Snyder A. Watson
This volume was prepared for publication by the following persons: Copy Editors: David R. Clements, Biology and Environmental Studies,
Trinity Western University, Langley, British Columbia, Canada V2Y 1Y1
Stephen J. Darbyshire, Agriculture and Agri-Food Canada, Eastern Cereal and Oilseed Research Centre, Ottawa, Ontario, Canada K1A 0C6
Production Editor: Daniel Cloutier, AgroByte, 102 Brentwood Rd., Beaconsfield,
QC H9W 4M3

Contents
Introduction David R. Clements and Stephen J. Darbyshire ...................................................... 1 Invasive plant management strategies: An Australian perspective Amanda Moncrieff ................................................................................................... 5 The Australian weed risk assessment system: Does it work in Hawai‘i? Would it work in Canada? Curtis C. Daehler and Julie S. Denslow................................................................. 27 Tracking long-term changes in the arable weed flora of Canada A. Gordon Thomas and Julia Y. Leeson ................................................................. 43 Eradicating carpet burweed (Soliva sessilis Ruiz & Pavón) in Canada Dave Polster ........................................................................................................... 71 Towards an invasive plant action plan for Ontario’s forests Michael Irvine ........................................................................................................ 83 Use of the Invasive Alien Plant Program Application to implement applied biological control in British Columbia Susan Turner .......................................................................................................... 95 Farming weed biocontrol agents: A Canadian test case in insect mass-production Rosemarie A. De Clerck-Floate, Jim R. Moyer, Brian H. Van Hezewijk and Elwin G. Smith ................................................................................................................. 111 Thirteen ways of looking at invasive species Brendon M. H. Larson........................................................................................... 131 Index...................................................................................................................... 157

SYMPOSIUM
Invasive plants: Inventories, strategies and action
David R. Clements Biology and Environmental Studies, Trinity Western University, Langley, BC V2Y 1Y1
Stephen J. Darbyshire Agriculture and Agri-Food Canada, Eastern Cereal and Oilseed Research Centre, Ottawa,
ON K1A 0C6 [email protected]
Introduction
The term “weed” is notoriously difficult to unambiguously define, but may be summed up as “a plant that interferes with human activities or welfare”. Humans are, however, multifaceted in their relationships with plants and the pest of one person may be a benefit for another; undesirable in one circumstance, a plant may be of great value in another. For those involved with weed science, targets of study have been traditionally those plants which are interlopers in environments associated with agricultural production or horticultural ornament, plants which compromise societal infrastructures, and plants having direct impacts on human health. In the last few decades several factors have broadened, not only the community of weeds, but also the perceived notions of human welfare. Globalization of trade has increased both the traffic between the world’s floristic regions and the pathways facilitating widespread plant dispersal. At the same time that plants have been spreading and establishing in new areas through human activities, greater knowledge and appreciation has developed in terms of the ways in which non-indigenous plant species affect our environment and impinge on societal concerns such as ecological processes and biological diversity. Thus, at the same time that the number of weeds has been increasing, we are also beginning to realize that there are many more ways in which they can affect our prosperity. Perhaps the moniker of “invasive plants” (usually meaning competitive non-native plants) has made them appear even more threatening.
The field of invasive species biology has taken off in the last 10 years with many conferences, symposia and new journals devoted to the topic. Traditional

2 Introduction
weed scientists who have been quick to appreciate the importance of the harmonized coordination of agro-ecosystem management tools through integrated pest management must now expand their vision to encompass broader landscapes and processes. Governments have also recognized the economic implications and biosecurity threats posed by these “new weeds” and have initiated programs to support research on and management of invasive alien plants. Likewise, at the grassroots level there is a strong movement to grapple with invasive species issues, as evidenced by provincial invasive plant councils formed in British Columbia and Alberta and under development in other provinces (e.g., Ontario), which are comprised of a wide array of affected stakeholders. Members of the Canadian Weed Science Society – Société canadienne de malherbologie (CWSS-SCM), with their expertise in plant biology and vegetation management are important participants in the emerging field of invasive species biology. The field of invasive species is a broader landscape than that of traditional weed science, but still, “weeds are weeds.”
The hallmark of all biological systems is their complexity. Even in the relatively “simple” ecosystem of an arable field, change of one parameter, no matter how fugacious, inevitably has cascading repercussions of greater or lesser extent throughout the network of interdependent elements and relationships. Internal stability of the system is also constantly affected by external influences. Complexity is in fact the key to buffering the stability of most ecological systems. Complexity in our approach to the management of biological systems is the most likely way in which we will be able to shift changes in a favoured direction while maintaining the over-all stability of the system, or at least reducing undesirable collateral effects of our actions.
The symposium organized for the 2006 meetings of the CWSS-SCM in Victoria, BC, was an attempt to look at some of the increasing complexities surrounding our relationships with that group of “weeds” that we have come to label as “invasive” and to which a non-native status is usually implied. The title of the symposium, Invasive plants: Inventories, strategies and action, was originally coined under the all to ambitious notion that these topics could be summarized in a day’s discussion. Although the surface was barely scratched and some themes lead in unexpected directions, the impressive list of scientists and weed specialists who kindly agreed to make presentations did provide many insights and much food for thought. In addition to the presenters whose work is featured in this volume, presentations were also made by Sarah Reichard (University of Washington) - “The good, the bad, and the ugly and how to tell them apart”, Glen Sampson (Nova Scotia Agricultural College) - “Managing alien plant invasion in Eastern Canada: Challenges and the quest for solutions” and Clark Brenzil (Saskatchewan Agriculture and Food) - “Against the Law: How does legislation fit in the management of invasive alien plant species?”
Many problems plague those concerned with management of invasive plants and each facet of an integrated strategy presents its own obstacles or
Clements and Darbyshire 3
limitations. Altered or enhanced difficulties are encountered depending on the biology of the organism in question and the goals of the management strategy. What then do we do? Careful planning of strategy and action is an important requirement for even qualified successes. Prevention and precaution are age-old techniques that are imbedded in hundreds of worldly proverbs and clichés. Experimentation (including observation) and learning are among the most powerful problem-solving tools at our disposal. Risk analysis and assessment are techniques we apply everyday to the most mundane tasks and problems of life without even being aware of our doing so. And finally, philosophy and attitude have a profound affect on what we can and do accomplish; “paradigm shift” has become a common jargon phrase used to express the utility of modifying one’s point of view. None of these principles are wholly independent of each other and, used together, they constitute a powerful approach to problem-solving.
Throughout this symposium, speakers have addressed or applied some or all of these principles. Each of these presentations adds a bit more to our understanding of human-plant interactions. Perhaps not surprisingly most conclusions point to our behaviour as being the primary source of the irritation in our relationships with “invasive” plants. Weed science is never devoid of a human element since we are managing plants for our own interests. We see this in the first two papers on risk assessment and management systems, with Amanda Moncrieff (Southwest Australia Department of Environment and Conservation) providing a dynamic comparison between the more established Australian weed risk assessment system and the relatively new Canadian approach and Curtis Daehler (University of Hawai‘i) likewise comparing the Canadian approach to the Hawaiian system. How best do we assess and deal with these risks in a Canadian context? The remaining papers by Canadians provide some answers. Part of the answer lies with better tracking of long-term invasion trends through comprehensive surveying, as elucidated for the prairie region by Gord Thomas and Julia Leeson (Agriculture and Agri-Food Canada, Saskatoon). There is need for comprehensive strategizing over such large geographic areas, as voiced for Ontario’s forests by Michael Irvine (Ontario Ministry of Natural Resources). In some cases, eradication of nascent invaders can be attempted, and Dave Polster (Polster Consulting, Duncan, BC) provides with a fascinating case study involving carpet burweed (Soliva sessilis). However, many invasive plants quickly get beyond the possibilities of eradication, and the best course of action may often involve unleashing new alien species via classical biological control. Rose De Clerck-Floate (Agriculture and Agri-Food, Lethbridge) and Susan Turner (BC Ministry of Forests, Kamloops) have been tirelessly pursuing these options in western Canada and each of them presents examples of how biological control agents can be strategically deployed.
As initially stated, the weed concept is difficult to define, but often we think we have defined it and quickly move on from there without reviewing or questioning our first impressions. Brendon Larson concludes the volume by prompting us to think much harder about how we frame, and therefore approach the
4 Introduction
problem of invasive species in his contribution “Thirteen ways of looking at invasive species: The spectrum from bad to good.” We need strategies, inventories and action, but Larson reminds us that in the midst of planning and action we also need perspective.
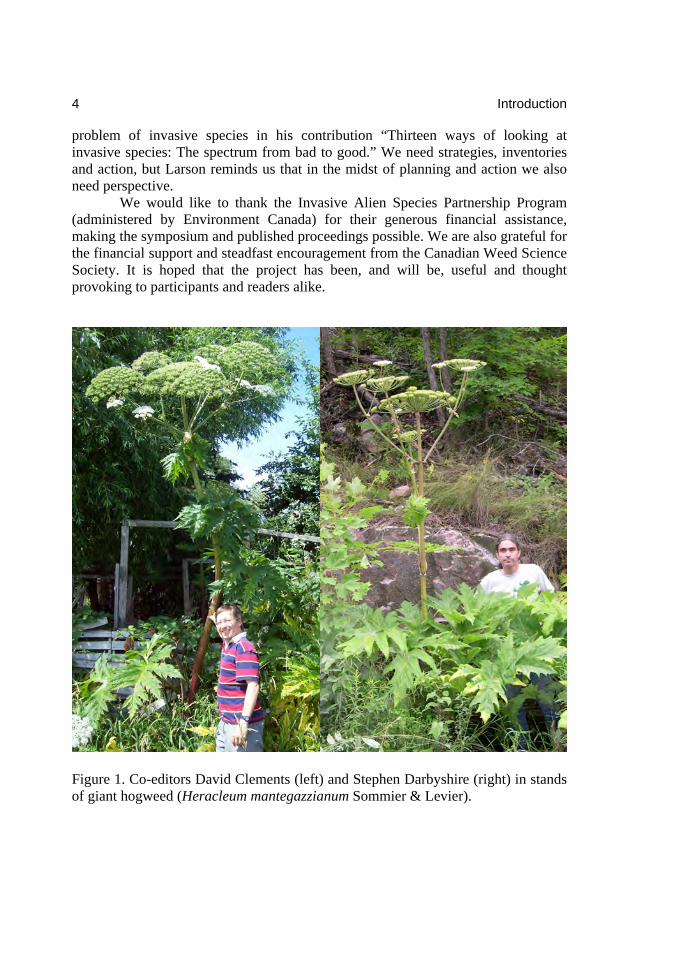
We would like to thank the Invasive Alien Species Partnership Program (administered by Environment Canada) for their generous financial assistance, making the symposium and published proceedings possible. We are also grateful for the financial support and steadfast encouragement from the Canadian Weed Science Society. It is hoped that the project has been, and will be, useful and thought provoking to participants and readers alike. Figure 1. Co-editors David Clements (left) and Stephen Darbyshire (right) in stands of giant hogweed (Heracleum mantegazzianum Sommier & Levier).

Invasive plant management strategies: An Australian perspective
Amanda Moncrieff Department of Environment and Conservation, Locked Bag 104, Bentley Delivery Centre,
WA, 6983, Australia. [email protected]
This article provides an outline of some of the strategic strengths and weaknesses in the field of invasive plant management in Australia, including weed risk assessment and quarantine processes, early detection rapid response models, and biological control research frameworks. A unique opportunity has been presented to the author in experiencing invasive plant management strategies that are employed by government and non-government organizations in both Australia and Canada, and a comparative discussion of strategies employed to manage invasive plants in Canada is provided. A number of striking differences have been noted between invasive plant management in Australia and Canada, in particular: communication and coordination frameworks, the dissemination of information, the application of weed risk assessment and quarantine measures, and the application of early detection rapid response models.
Introduction
This paper provides comment on a number of strategic areas in the field of invasive plant management in Australia, from my perspective as an Australian working in State government invasive plant policy development and coordination, and after spending a year working within government and non-government realms of invasive plant management in British Columbia.
Some strategic management areas that are considered to be strengths of invasive plant management in Australia include: weed risk assessment; early detection rapid response models; and, biological control and research frameworks. Areas where past and current management of invasive plants has not been as effective also exist, such as: past risk assessment and quarantine processes; management and coordination models; and, funding arrangements.
Whilst completing a work exchange to Canada, some significant differences were noted when comparing Australian management strategies to those employed in Canada. Some of these differences, such as communication and coordination frameworks, the dissemination of information, the application of weed risk assessment and quarantine measures, and the application of early detection rapid response models are discussed further. Thus this paper reflects the insights and
6 Invasive plant management strategies: An Australian perspective
views of the author as a result of a unique opportunity to experience invasive plant management in two different countries.
Background
Definitions For the purposes of this paper, the following definitions regarding invasive
plants have been used, as adapted from Richardson et al. (2000): weed: any plant not wanted where it is found, as it creates negative impacts alien: non-native species, due to intentional or accidental introduction naturalized: alien plants that reproduce consistently and sustain populations
over multiple generations without human intervention invasive: naturalized plants that produce offspring in large numbers and
spread over a considerable area
A Western Australian perspective The author works as the Environmental Weeds Coordinator for the
Department of Environment and Conservation (DEC) in Perth, Western Australia. DEC is responsible for land management activities (including invasive species) over an area of 25 million hectares of conservation reserves including national parks, nature reserves, State forest and conservation parks; and, for the partial management (fire, pest animals and environmental weeds) of 89 million hectares of Crown land, consisting predominantly of semi-arid lands used primarily by the pastoral industry. The Department also has statewide responsibility for the conservation of flora and fauna, including species at risk, according to the Wildlife Conservation Act 1950.
Approximately 80 percent of Australia’s flowering plants, mammals and reptiles are unique to the continent (Department of Environment, Sport and Territories 1996). Western Australia is home to a diverse and unique suite of native flora and fauna that displays a high level of endemism. The south-west of Western Australia is one of 34 biodiversity hotspots recognized internationally (Conservation International 2006). The flora and fauna have largely evolved in isolation, within low rainfall areas and on nutrient poor soils. The lack of glaciation over millions of years and a consequent lack of disturbance has led to speciation occurring in situ, resulting in a rapid turnover of species across the landscape (Hopper et al. 1996).
A key challenge facing Australia and Western Australia specifically is the conservation of these unique biodiversity values over a landscape that is both fragile and enormous in its scale, in the face of threatening processes that include dryland secondary salinity, inappropriate fire regimes, dieback diseases (Phytophthora spp.), introduced vertebrate pest animals and invasive plants. These processes also pose significant threats to Australia’s pastoral and agricultural sectors, and significant

Moncrieff 7
regulatory, educational and management resources are directed to minimizing their impacts.
A three tiered approach is applied to biosecurity in Australia: Prevention and exclusion Surveillance and response Pest and disease management
The focus first on prevention and exclusion, with surveillance, response and management as secondary factors is a theme apparent throughout many of the strategic areas of invasive plant management discussed in this paper. Australia possesses somewhat of a natural advantage, as its geographic isolation restricts biological introduction unaided by human activity, and also assists in the logistics of management.
Some facts and figures Australia still has a substantial number of invasive animal and plant pests to
manage, largely due to just over 200 years of a biological “free-for-all” since European settlement. Some are famous world-wide, such as the introduction of cane toads (Bufo marinus Barbour) to manage pest insects in the sugar fields of Queensland. Some statistics specific to invasive plants in Australia are (CRC for Australian Weed Management 2003a):
In the last 200 years over 28,000 foreign plants have been introduced to Australia - some introductions are accidental, but most have been imported for pasture, horticulture or ornamental purposes.
Of nearly 300 plants known as naturalized between 1971 and 1995, two-thirds were introduced as ornamentals.
Of 460 pasture species trialed between 1947 to 1985, 60 became weeds, 13 serious crop weeds, and only 4 proved useful. This legacy has prompted the development and implementation of a broad
range of preventative and management strategies to better manage invasive plants.
Weed risk assessment
Weed risk assessment in Australia A Weed Risk Assessment (WRA) system has been operated by Biosecurity
Australia and the Australian Quarantine Inspection Service (AQIS) since 1996 to underpin decisions to allow or prevent the introduction of new exotic plants. Most countries throughout the world operate under a “prohibited list” system, where problematic species are listed and prohibited from entry, but all other species are free to be imported. In Australia, all plant imports operate under a “permitted list”, where every species is assessed as to whether it poses a weed risk for entry into Australia. Species may be placed on the “permitted list” following the completion

8 Invasive plant management strategies: An Australian perspective
of a WRA; all other species are prohibited for import. The WRA system is used on all new plant imports whether they enter Australia as seeds, nursery stock or tissue culture and regardless of their intended use in Australia (Department of Agriculture, Forestry and Fisheries 2007).
This preventative approach was strengthened in 1997, when Western Australia introduced a State WRA process. The south-west of Western Australia is separated from the eastern side of the continent by a broad expanse of desert, allowing a second tier of preventative measures and supporting the objective to protect valuable agricultural industries and biodiversity assets. Importation of every plant species not currently found in Western Australia, irrespective of whether it is found elsewhere in Australia, requires a positive completed WRA. The process is managed by the State Department of Agriculture and Food (Department of Agriculture and Food 2006a), and at present over 14,000 species are on the “permitted list”. Importantly, risk assessment outcomes are linked to legislation - conditions of entry into the State for each species are linked to Plant Diseases Regulations.
In order to develop the initial permitted list in Western Australia, 1,000 importers who had imported material into the State in the previous five years were contacted in order to supply their stock lists. Of these, 120 responses were received. Utilizing this information, two people worked over three months to compile a list containing over seven thousand species (McFadyen 2005).
Both the National and State WRA processes are based on the Pheloung model (Pheloung 1995) of risk assessment. As explained on both the National Department of Agriculture, Forestry and Food and the State Department of Agriculture and Food websites, the process utilizes a Microsoft Excel application, incorporating:
Form A: Weed Risk Assessment question sheet, with 49 questions on domestication, climate and distribution, behaviour elsewhere, undesirable traits, plant type, reproduction, dispersal mechanisms and persistence attributes
Form B: Weed Risk Assessment Scoring Sheet Responses to questions are used to generate a numerical score that then
determines the outcome: accept, reject or further evaluation. Note that it is the obligation of the proponent to provide an appropriate level of information on the species proposed for import to allow assessment against the questions. Proponents who do not provide an adequate level of information do so at the risk of a negative outcome based on inability to assess.
The “Quarantine Loophole” Since 1996 an obvious “loophole” has existed in the national quarantine
process - the “Permitted List” included listings by genus. This meant that any plant species within a considerable number of genera (including species that are already causing significant problems in Australia and elsewhere), some of them “Weeds of
Moncrieff 9
National Significance” (such as Asparagus spp. and Rubus spp.), could be imported without a WRA being completed.
A review of the list was to be undertaken at the national level, but by 2001 the list still permitted many entire genera. The issue started to garner growing attention, aided by a Best Paper award at the 14th Australian Weeds Conference in 2004 (Spafford-Jacob et al. 2004), consistent lobbying by the Cooperative Research Centre (CRC) for Australian Weed Management and substantial media interest. This culminated in a formal recommendation to the Environment, Communications, Information Technology and the Arts References Committee, that was conducting a review into the regulation, control and management of invasive species, that Biosecurity Australia remove all listed genera immediately. Early in 2004 an announcement was made by the Federal Conservation and Forestry Minister. A review of the Schedule 5 Permitted List was to occur in two stages, with the first stage being removal of approximately 4,000 known weedy species to be completed within six months. The second stage, removal of all genera and their replacement by only those species already in Australia, was to be completed by the end of 2006.
Consequences of import laws and loopholes Australia has many past examples of invasive plant species being legally
imported with significant environmental or agricultural negative impacts resulting and a substantial societal cost being incurred. Many of these species surface within the nursery trade. Legal importation of Mexican feathergrass (Nassella tenuissima (Trin.) Barkworth) - a close relative of serrated tussock (Nassella trichotoma (Nees) Hack. ex Archav.) - occurred when it was introduced in 1996 as an ornamental grass under the name Stipa tenuissima Trin., at a time when due to the genus loophole, all Stipa species were permitted while all Nassella species were prohibited. By 2004 it had naturalized and the CRC for Australian Weed Management estimated an economic impact on agriculture of $50 million per year (McLaren et al. 1999). Bear-skin fescue (Festuca gautieri (Hack.) K. Richt.) is another example of a potentially significant grazing weed that was legally imported in 2003 and being advertised for sale by late 2004 (Martin 2005).
Alternatively, species that are prohibited from entry also often show up in the nursery trade. Orange hawkweed (Hieracium aurantiacum L.) and the Northern Australia Quarantine Service target Ceylon hill cherry (Rhodomyrtus tomentosa (Aiton) Hassk.) are two recent examples. Many of these prohibited species are listed in the “Aussie Plant Finder” (Hibbert 2002), often under a different name (e.g., orange hawkweed being listed as Pilosella aurantiaca (L.) F. W. Schultz & Sch. Bip.) (CRC for Australian Weed Management 2003c). Internet trade is an ongoing issue; Ceylon hill cherry is advertised on several Australian-based internet sites. Substantial resources are allocated in Australia to checking and regulating the plant trade industry, with prohibited plants being shipped to nurseries regularly being intercepted by quarantine officers. Correct identification and labelling is another regulatory issue, with past occurrences such as the mistaken labelling and

10 Invasive plant management strategies: An Australian perspective
confiscation from a nursery of plants incorrectly identified as rubbervine (Cryptostegia grandiflora (R. Br.) R. Br.). However, despite a high level of vigilance, inconsistencies between quarantine legislation and the ability to legally sell a given species across the various states will result in ongoing difficulties in achieving optimal results in this area.
The application of weed risk assessment A fundamental aspect of the WRA process in Australia is that it is applied
to pre-barrier (preventative) importation and quarantine decisions. As noted by a prominent Australian risk assessor “weed risk assessment systems are not designed for post entry assessments of impacts or spread which is what ranking or prioritization exercises are meant to be used for” (Rod Randall, personal communication). A WRA process following the elements of the Pheloung model (Pheloung 1995) is not designed to address post-border resource allocation decisions. It appears that there is a focus within Canada, at both a Federal and Provincial level, of applying this type of WRA to decision-making processes to address whether to allocate resources to the management of specific invasive plants already present within Canada. Many post-border prioritization models exist to address this need that involve WRA methods, but are better suited to determining where resources should be allocated for management action once species are already present.
WRA in Australia operates within very clearly defined parameters and is considered a purely “science-based process” that takes potential impacts (economic, social, environmental) and level of threat posed by the species proposed for importation into account. The purported economic benefit from a proposed species is not part of this assessment process. There is no precedent in Western Australia for an economic or political decision to override the outcome of a WRA process and allow the importation of a “reject” species. Neither is there precedent for proponents to formally appeal a “reject” decision.
At a National level, some general complaints were made to inspectors when the system was introduced, however no written or formal complaints about the permitted list system itself were lodged. Some complaints were lodged over individual WRA outcomes and these were by groups promoting the use of particular species that were listed as quarantine (rejected) weeds.
In Western Australia most horticultural importers accept WRA as “just another bureaucratic requirement” (McFadyen 2005) and accept that checking the State list prior to importation to ensure all species are permitted and listing the species names on the consignment note are essential steps to be followed (McFadyen 2005). The Australian WRA process is a good example of societal good being held above the potential (economic) benefit of the individual. Further information from a global as well as Australian context, is provided in the major reference on WRA, as applied to the invasion ecology of plants, by Groves et al. (2001).

Moncrieff 11
Early detection and rapid response
Early detection rapid response models are based on a number of simple premises (adapted from Department of Sustainability and Environment and Department of Primary Industries 2005):
early identification and response provide the highest likelihood of being successful in minimizing or even eradicating a species from a given area
prevention and early intervention of new incursions is by far the most cost-effective approach to managing invasive species
risk analysis (threats posed, level of risk and likelihood of introduction) is an essential part of resource allocation decision-making
it provides opportunity for raising community awareness and involvement, and a cooperative multi-stakeholder approach across jurisdictions
it is not reasonable to expect that a well established species can be eradicated, but should be prevented from spreading to other valued areas at risk
Early detection rapid response initiatives Relatively good examples of early detection rapid response (EDRR) type
systems being developed within Australia can be found. In Western Australia, several excellent examples exist of reporting and eradication/containment systems for agricultural weeds. A notable example is kochia (Kochia scoparia (L.) Schrad) where a successful detection and eradication program was implemented after the species was introduced legally as part of a revegetation program to address salinized agricultural landscapes. The species naturalized after only two years of planting. An intensive detection and eradication program was successfully completed by 2000 (Department of Environment and Heritage and CRC for Australian Weed Management 2003), acknowledging the advantage of known infestation point sources. Note that it was the legal introduction of kochia that started Western Australia on the path to the permitted list approach to plant importations (Sandy Lloyd, personal communication).
Another example of an agricultural detection and control program in Western Australia, but over a far longer timeframe, is skeleton weed (Chondrilla juncea L.). Since 1974, the program has aimed to detect and eradicate skeleton weed infestations from agricultural land, and prevent new infestations. The eradication program costs approximately $3 million per year and is funded (89%) from a levy on all grain sold in the state ($0.35 per tonne since 2001-02, Department of Agriculture and Food 2006b). A Trust Fund managed by the State Department of Agriculture and Food is allocated to surveillance, detection and implementation of quarantine procedures. However, individual grain producers are responsible for the cost of treating the weed on their farms. Note that eradication has not been achieved for this species, providing an example of the difficulties in achieving eradication even when considerable resources are employed.

12 Invasive plant management strategies: An Australian perspective
Systems for EDRR specific to environmental weeds are less developed, with funding and responsibility parameters being key barriers. In the past the State biodiversity and land management agency was criticized for its lack of prioritization and capacity to deal with existing and emerging environmental weed incursions. However, this has recently changed somewhat with the (former) Department of Conservation and Land Management receiving in 2005 additional human resources in the form of 40 new staff to work primarily on wildfire prevention and suppression activities, but directed to invasive species management tasks for three or four months per year. These staff, along with additional operational funding, has given the Department a new capacity to deliver on-ground results in invasive plant management. Regions now bid for projects, a central committee assesses priorities and on-ground projects (usually population surveys and the application of herbicide and/or mechanical removal of plants) are delivered in collaboration with other stakeholders, including the Department of Agriculture and Food, pastoral (grazing) lease holders and Regional Natural Resource Management groups.
Examples of these EDRR type responses in 2005-06 include a rubbervine (Cryptostegia grandiflora) infestation in north-western Western Australia, “Quobba cactus” (Cylindropuntia fulgida (Engelm.) F.M. Knuth) in the mid-west of the State and tamarix (Tamarix aphylla (L.) Karst.) in the central goldfields. In each instance, the additional resourcing has allowed intensive management of invasive plant incursions, with the objective of eradicating the relatively small sized infestations that have been determined to pose a high level of threat (both environmentally and economically).
Early detection rapid response models A National web based early detection system exists in Australia (and can be
found at http://www.weeds.org.au/reportalert.htm). However, this system is limited to “Alert Weeds” only - a National priority species list that identifies 28 species in the early stages of establishment that have potential to become a significant threat to biodiversity if not managed (Australian Weeds Committee 2006b). An expanded national detection and response model is required.
The State of Victoria possesses a well structured EDRR system, detailed in the Weed Alert Rapid Response Plan Victoria 2004 / 2005 (Department of Sustainability and Environment and Department of Primary Industries 2005). It is a protocol for surveillance, notification of suspected new introductions and infestations, and rapid response actions and responsibilities, ensuring timely implementation of effective management measures. The document also guides further developments required in surveillance, collection, identification, assessment and response for priority weeds.
A “Weed Alert Network” has been created under this system, including a network of “Weed Spotters” who carry out weed surveillance and collection, supported with training opportunities and an email discussion group. New weed incursions undergo a risk and threat assessment by a Weed Assessment Panel and
Moncrieff 13
are classed as requiring a high, medium or low response, according to a recommendation made to an inter-agency committee. An Incident Response Plan is then developed and for high level of responses, a Weed Incursion Management Team is created for the implementation phase. The response process is highly structured, and follows the wildfire response model of Incident Control System according to the Australian Interservice Incident Management System.
Tasmania also has a “State Response Plan to New Weed Incursions” as part of its Weed Plan (Tasmanian Weed Management Committee 2005). It consists of a “Weed Alert Network” of some seventy members including professional land managers, environmental groups, horticultural and gardening clubs. It is coordinated by the Weed Alert Taskforce, which provides initial training and communicates to members via weed alert bulletins and a newsletter. A Weed Incursion Response Group is responsible for identification, status of distribution, risk assessment and the response brief. As with most early detection processes in Australia, the issuing of “Alerts” is based on a scientific risk assessment procedure.
The CRC for Australian Weed Management, in partnership with the Queensland State government, has initiated a “National Weed Detection Project”. This initiative highlights that a more substantial body of botanical expertise exists across regional areas than is generally recognized and aims to harness the knowledge held by retired professionals, accomplished amateurs, people currently employed in agriculture, horticultural sectors and other fields of vegetation management (CRC for Australian Weed Management 2004b). A pilot project in Queensland will identify this expertise, develop and train a network focused on detection of new weed incursions that is connected to and supported by the Queensland Herbarium. One hundred and twenty five people have registered for the “Weed Spotter” network, six regional workshops have been conducted focusing on weed collection techniques, and “Weed Spotters” have been given a kit of weed collection resources with all training material aligned to national training standards.
Eradication versus containment It is acknowledged that in the vast majority of cases it is extremely difficult to achieve eradication of an invasive species, and the paucity of examples in the literature attest to this. The management of invasive plants in Western Australia often recognizes this with containment being the key objective for larger infestations that still pose significant risk to surrounding areas. Mesquite (Prosopis spp.) is an example of this - a 150,000 ha infestation, which originated from homestead plantings in the 1930s, occurs within the northern pastoral zone. Mesquite spreads rapidly after cyclonic rain events and as eradication is not a feasible objective; the priority is to prevent spread to other properties, utilizing a 2 km wide containment line. Biocontrol in the form of a leaf moth has been employed as a management strategy, again with control rather than eradication as the objective.

14 Invasive plant management strategies: An Australian perspective
Other invasive plant management strategies
Biological control Many examples exist in Australia of collaborative research and funding
arrangements being used to enhance the outcomes of invasive plant research, particularly in the field of biological control. Examples include use of a rust fungus and a leaf hopper in the management of bridal creeper (Asparagus asparagoides (L.) Druce) in south-western and south-eastern Australia and the sponsorship by both State environmental and agricultural agencies in research by the Australian Commonwealth Scientific and Industrial Research Organization (CSIRO) on the application of rust strains to manage blackberry (Rubus fruticosus L.) in Western Australia. Collaborative research has also resulted in successfully determining the cost-benefit ratio (23:1) of combining insect, rust and fire control methods on rubbervine in Queensland (Page and Lacey 2006).
Targets for biological control in Australia are nominated and endorsed as priorities at a national (rather than State) level, which ensures sound allocation of scarce resources and greater efficiency of efforts. All potential stakeholders are made aware of proposed biocontrol projects, resulting in fewer research gaps and overlap occurring in this field. The process is coordinated by the inter-agency Australian Weeds Committee (AWC) that provides a list of fifty target species approved for biological control research. Any party is free to nominate a new biocontrol research candidate, and this is often driven by academia as well as government. The AWC calls for input from relevant government contacts in each State, to provide general comment on nominations for biological control research (i.e., support or oppose).
CRC for Australian Weed Management The Cooperative Research Centre for Australian Weed Management is one
of dozens of CRCs that have been created in Australia over the last decade to improve the way in which scientists, policy makers and extension workers collaborate on a broad range of sustainability issues. The CRCs are a funding partnership between the National and State governments, tertiary institutes and private organizations. The CRC for Australian Weed Management is nearing completion of its second seven-year term and has been hugely successful in completing meaningful research and presenting it in a format that is widely distributed, easily accessed and in a format easily understood. The CRC conducts three main programs:
Research - weed incursion and risk management - sustainable cropping systems - landscape management
Moncrieff 15
Community Empowerment Program Education and Training Program
The Weeds CRC is an excellent model for generating and sharing knowledge, creating change and facilitating science-based decision making. Information is distributed to the research community, weed management stakeholders and the broader community in a variety of media, including:
Weeds CRC website (www.weeds.crc.org.au): The Weeds CRC website is a widely recognized and utilized website that successfully brings together a large amount of information on the impacts and management of invasive plants. The website is well structured and easy to use, and provides a “one-stop-shop” source of information for many invasive plant initiatives across Australia.
Technical Series: an ongoing series of research papers that are widely recognized regarding their scientific vigour, but are in a user-friendly format. The Technical Series (there are currently 11 papers published) have a strong focus on economic impacts of invasive plants.
Weed Watch Newsletter: the newsletter is published three times per year and has a broad target audience including scientists, policy makers, land managers and the general public. It also often focuses on economic impacts of invasive plants; e.g., “Weeds cost farmers 14 per cent of income” (CRC for Australian Weed Management 2004a) and “Counting the cost of weed seed added to the seed bank” (CRC for Australian Weed Management 2003b).
Media releases: the Weeds CRC regularly produces media releases on current topics and recently completed research. This has facilitated an increase in the amount of invasive plant related information reported in the popular media. An overarching message communicated by the Weeds CRC is that research conducted clearly demonstrates that available control measures for invasive plants are cost-effective and can save society substantial amounts in lost production and management costs; e.g., “The economics of invasion” (CRC for Australian Weed Management 2006a) and “Biocontrol delivers a $10Bn result” (CRC for Australian Weed Management 2006b). The CRC has contributed to an increased interest in invasive plant issues by
the Australian media, a better understanding by the broader community of invasive plant issues, and a vastly improved exchange of knowledge and communication within the network of people and organizations involved in invasive plant management. The CRC has found a sound balance between agricultural, environmental and educational programs, and the economic impacts caused by invasive plants.

16 Invasive plant management strategies: An Australian perspective
The garden and nursery industry Significant attention has been paid to the impacts and regulation of plants
introduced to Australia for ornamental purposes. Of 2,779 introduced plant species known to be established in the Australian environment, 1,831 (or 66%) are escaped garden plant species and 72 (40%) of the 178 invasive garden plants declared as noxious by one or more Australian States are available for sale in Australia (Groves et al. 2005).
A significant problem exists within Australia regarding inconsistencies in what can legally be sold; a species prohibited for sale in one State is often available for sale in the neighbouring State. It has proved a lengthy process to apply State legislation to national requirements, although some success has been achieved recently with nationwide prohibition of the sale of the 20 “Weeds of National Significance” (Australian Weeds Committee 2006a). However, a national approach to regulation and enforcement, linked to national quarantine laws and improved engagement with the nursery industry is still required.
At a State level, varying degrees of success have been achieved regarding negotiations with the nursery industry on voluntary measures to withdraw from sale identified invasive species. In some instances these negotiations have been prolonged and largely unsuccessful. Industry has also suggested that regulation is preferred over voluntary measures, to avoid “rogue” traders taking advantage of others withdrawing species from trade. A combination of voluntary trade measures, appropriate regulation and raised public and industry sector awareness is suggested.
The 2005 publication of Jumping the garden fence: Invasive garden plants in Australia and their environmental and agricultural impacts (Groves et al. 2005), a CSIRO report prepared for WWF-Australia, has succeeded in raising the profile of this issue in Australia, and in providing an excellent source of quality statistics and information on the impacts of garden plants, plus a number of recommendations for further action.
The current situation Despite the array of preventative, educational and management initiatives
aimed at minimizing the environmental, economic and societal impacts of invasive plants being implemented in Australia, a broad consensus exists that far more needs to be done (Martin 2003; Environment, Communications, Information Technology and the Arts References Committee 2004; Groves et al. 2005). Over 27,000 known alien plant species have been introduced to Australia and of these, 2,779 or about 10% are now established in Australia’s environment - this number is rising by about 10 species per year, and the rate is increasing (Groves et al. 2005).
Key challenges in Australia include: raising public awareness and understanding; achieving long term strategy and investment, including appropriate funding levels for the management of Crown lands and general invasive species coordination; and, aligning National and State legislation, policy and management frameworks.
Moncrieff 17
Some of the “worst offenders” across the Australian landscape include (Australian Weeds Committee 2006a):
Blackberry 8 million ha (nationally) Prickly acacia 7 million ha (Queensland) Lantana 4 million ha (nationally) Mesquite 800,000 ha (Western Australia and Queensland) Rubbervine 700,000 ha (across 20% of Queensland) Mimosa 80,000 ha (Northern Territory)
All of these species are Weeds of National Significance (WoNS); among the 20 species chosen for their high level of impact and potential distribution. The WoNS each have nationally coordinated strategy, a multi-stakeholder management committee to coordinate management responses, and substantial levels of Commonwealth funding available for management activities. This approach, developed to complement the National Weeds Strategy (Agriculture and Resource Management Council of Australia and New Zealand, Australian and New Zealand Environment and Conservation Council and Forestry Ministers 1999), has been highly effective, however it has been at the exclusion of a broader suite of priority species and management strategies, which is currently being addressed through the revision of this strategy.
In addition to the WoNS, a second priority list at a National level has been developed - the National Alert List for Environmental Weeds. This list of 28 species are “sleeper” weeds; those species that are present, have not yet had significant impact in Australia, but have substantial potential distributions and potentially pose a high level of impact. These species are also a national funding priority, but remain a State responsibility to manage. It is important to note that for both national lists the objective and consequence of a given species being on (or off) the list is clearly understood.
Coordination of invasive plant management A significant level of “siloing” occurs in Western Australia between the
management of agricultural and environmental weeds. The two areas are regulated by different legislation and different State government agencies, with gaps occurring in the legislated regulation of environmental weeds. This will in part be addressed by the establishment of the Biosecurity and Agriculture Management Bill, however, prior to this some action had been implemented to improve the coordinated management of weeds in this State.
In 2001 the State Weed Plan was launched by both the Minister for Agriculture and the Minister for the Environment (State Weed Plan Steering Group 2001). This occurred due to growing scientific and community concerns about the lack of proactive and coordinated management of weeds in Western Australia. A multi-stakeholder (government and non-government) State Weed Plan Steering Group was responsible for producing the plan, that listed nine key management components or action areas, with recommendations, strategic actions and partners
18 Invasive plant management strategies: An Australian perspective
listed for each component. Despite an unofficial estimation at the time that $13 million would be required over a five year period to implement recommended actions, no funding was provided by the State government and no significant changes to agency programs occurred.
One of the key recommended actions of the State Weed Plan was the creation of a central coordinating group to oversee implementation of the Plan. By 2004 this had not occurred and growing community concern at the lack of action, much of it expressed to the two relevant Ministers, resulted in the creation of the Western Australian Weeds Committee (WAWC) in May 2004. The WAWC was responsible for providing central coordination and liaison between all relevant stakeholders, the identification of priorities, issues and gaps in weed management in Western Australia, and providing comment on relevant policy documents.
The WAWC included representation from key agencies, community and industry groups. Members were chosen using selection criteria and an application process, with the government agencies making a final recommendation to be approved by the Ministers for Agriculture and Environment. However a key barrier to the group becoming functional has been the lack of support and resources accessible to the group. Uncertainties regarding secure funding and reliance on volunteer effort have greatly compromised the capacity of the group to realize its goals.
The funding issue The provision of adequate levels of funding has been an ongoing issue in
Australia at both state and national levels. Invasive plants are often cited as second only to land clearing or habitat destruction as the most threatening process to biodiversity, yet current resource investment does not match this position. A worthy comparison provided by the CRC for Australian Weed Management is that salinity costs Australia $200M per annum and receives substantial community and government recognition - the National Action Plan (to address salinity) expenditure is $1.4B, more than 10 times the expenditure on invasive plants. In Australia we are able to clearly demonstrate that available control measures for invasive plants are cost-effective, however increased awareness, strategic planning and long term investment are required.
Communicating economic impacts Improving the way in which we communicate the real cost of invasive
plants to society results in an increase in understanding and awareness of the broader community and in influencing decision-makers responsible for resource allocation and development strategic management programs. The issue has gained broader acknowledgement in Australia, with the Prime Minister’s Science, Engineering and Innovation Council stating in May 2002 that limiting the spread of pests, weeds and imported diseases is one of four areas of investment likely to
Moncrieff 19
return the greatest level of impact (Environment, Communications, Information Technology and the Arts References Committee 2004).
The CRC for Australian Weed Management has been instrumental in researching, collating and communicating statistics and information on the economic impacts of invasive plants to agricultural and environmental systems, and to the broader community. This information is the focus of many of the CRC’s varied publications, including the Weed Watch newsletter, the Technical Series and regular media releases. Examples of documents from the Technical Series include Economic impact assessment of Australian weed biological control (Page and Lacey 2006) and The economic impact of weeds in Australia (Sinden et al. 2004).
Unfortunately several difficulties exist in continuing this capacity to communicate the cost of invasive plants to the broader community. These include: maintaining the interest of the mainstream media in an “unsexy” topic such as weeds; securing funding for groups such as the Weeds CRC, which have to compete for funding against other groups that more easily meet criteria for economic benefit; and, the difficulty in accessing data and calculating the true cost of environmental weeds.
Key areas of difference - Australia and Canada
My experiences over a year working in British Columbia have highlighted many similarities as well as a number of differences in invasive plant management. Areas where I found striking differences are the application of weed risk assessment, border management issues, early detection rapid response processes, and communication and coordination models.
The logistical feasibility of a stringent quarantine system in Australia is in part due to geographical isolation. The proximity of neighbours and volume of transactions facing Canada is a completely different situation, and impinges upon the type of “pre-barrier” or preventative approaches that can feasibly be implemented. Australia’s isolation contributes to the ability to have such a “black and white” quarantine system, and Canadians working in the field of weed risk assessment express surprise at the relative ease with which the permitted list approach was introduced, the industry acceptance of the new system, and the lack of appeals that occur as a result of negative assessments.
Australia has a different approach to Canada in terms of the potential (or purported) economic value of species being proposed for importation – the system is absolute in its rejection of species that are not on the permitted list or have not received a positive weed risk assessment outcome. External pressures do not impact on the risk assessment outcome or its application to quarantine legislation. Canada appears to have a slightly “greyer” approach to the relationship between weed risk assessment and regulation of plant imports – there is no precedent for a negative weed risk assessment to result in the prohibition of a given species for importation.

20 Invasive plant management strategies: An Australian perspective
It appears that political processes hold greater sway in terms of influencing decision-making in regard to species that may hold economic value if imported. Australia’s approach is more orientated around the greater societal good than the rights of the individual.
The overall approach to pre- versus post-border management of invasive plants also differs between the two countries. There is a desire within Canada to apply WRA processes to determine whether a given species is a priority that should have resources redirected to its management. As discussed above, WRA (based on the Pheloung model) is not designed for resource allocation priorities - many other prioritization models exist for this objective. More information is required as to whether or how a version of the Australian WRA model could apply to assessment of species proposed for importation, as opposed to the assessment of species that could be inadvertently introduced, or as opposed to post-barrier prioritization processes. There appears to be a lack of clarity as to which processes could apply to these different objectives.
The Invasive Plants Council of British Columbia is currently in the process of developing an early detection rapid response system. An EDRR pilot has been proposed for carpet burweed (Soliva sessilis Ruiz & Pavón), a ground cover species found in natural environments and grassed areas (Invasive Plant Council of British Columbia 2006; see Polster in this volume). It has a high nuisance value due to its prolific spiny seeds, which detract from recreational values. However, it has been acknowledged that the species has been present on numerous sites in the lower mainland (including protected areas) since 1996, making the concepts of “early” and “rapid” difficult to apply. Additionally, the Canadian Food Inspection Agency (CFIA) has applied a WRA process to this species, although the objective of doing so is unclear. A paradigm shift is needed for true EDRR principles to apply in the management of species that are determined to be a priority for eradication - including the ability to make rapid decisions about resource allocation and preventative measures such as the closing of access to public areas. These decisions should be considered as part of a risk analysis incorporating long term management costs and ecological impacts.
One very apparent difference between the two jurisdictions is the superior coordination, communication and management frameworks for invasive plants within BC compared to Western Australia. The Inter-Ministry Invasive Plants Committee is an excellent model, consisting of representatives from each Provincial Ministry with some responsibility in the field of invasive plant management (Ministry of Agriculture and Lands 2005), an equivalent of which does not exist for Western Australia. The network of regional invasive plant committees, supported partially by the Ministry of Agriculture and Lands, is another example of a worthwhile coordination framework with no equivalent in the Australian context.
The (non-government) Invasive Plant Council of British Columbia (IPC) is far more effective than any example found in Australia. The IPC has far better capacity than groups such as the Western Australian Weeds Committee in terms of
Moncrieff 21
funding (at least in the short-term), executive support and direction, stakeholder involvement and the contribution of an active Board of Directors. The Council is also an example of an organization effectively bringing together government and non-government perspectives, and bridging the gap between those perspectives without compromising the objectives of represented organizations, individuals or the IPC itself. This is in part due to the representation process used (members are elected by each predetermined perspective or interest group) and partly due to the consistent vision and direction that the group has been able to engender. The IPC has been able to make a real contribution to the way in which invasive plant management is coordinated in British Columbia, it provides a model that is being emulated by other Provinces across Canada (see Irvine in this volume).
An active and genuine community involved in invasive plant management is present in British Columbia, supported by an effective coordination and management framework at a Provincial and Regional level. Although a high level of government restructuring does not support a long-term strategic vision that is required in a field such as invasive plant management, there is a genuine desire within the Province to build on existing programs and address funding and other deficiencies where possible. “Siloing” of the management of invasive plants that impact agricultural versus environmental values is not readily apparent which is a strength of the implementation of management strategies in British Columbia.
Two areas exist where invasive plant coordination and communication appears to not be as strong in Canada. The prioritization and communication processes for biological control research lack central coordination and information-sharing amongst stakeholders. A centrally coordinated nomination system (preferably at a national level such as in Australia) would assist in ensuring resources are pooled into priority projects, with all relevant stakeholders collaboratively involved. Academia is not involved to the same degree as in Australia, where partnerships of this kind create a strong biological control research program. Additionally, Canada does not appear to have any equivalent group to the CRC for Australian Weed Management, in terms of generating research, collaborative projects, communicating outcomes and information and generating a greater level of media and community interest in invasive plants, their impacts and their management.
Conclusions
A unique opportunity has been presented to the author in experiencing invasive plant management strategies that are employed by government and non-government organizations in both Australia and Canada. Australia is often viewed as a leader in this field, and areas of strategic management that are considered to be strengths of Australia, including weed risk assessment, early detection rapid response models, biological control and research frameworks, have been discussed.
22 Invasive plant management strategies: An Australian perspective
Some past and current weaknesses in Australian processes also exist, including: examples of past risk assessment and quarantine errors; management and coordination models; and, funding arrangements.
A number of key differences have been noted between invasive plant management in Australia and Canada, in particular: application of weed risk assessment processes; application of early detection rapid response models; biological control prioritization and communication frameworks; use of research on economic impacts of invasive plants; and, general communication and coordination models. Differences between the two countries vary from subtle in terms communication styles and frameworks, to quite different approaches, such as for the application of WRA and biological control research frameworks. Each country possesses strengths and weaknesses in different areas, and it is hoped that this summary helps to illustrate where differences in strategies can be utilized to improve the delivery of invasive plant management programs.
Acknowledgements
First and foremost, I would like to acknowledge the sponsorship of my employer, the Department of Environment and Conservation (formerly the Department of Conservation and Land Management), Western Australia, for making the work placement to British Columbia possible. I would like to thank the BC Ministry of Environment (Cariboo Regional Office), for their support and exposure to a wonderful array of experiences throughout 2006. Particular thanks must go to Glen Davidson, John Youds, Steve Mazur, and Laura Darling. Also, I can not thank enough Gail Wallin, Executive Director of the Invasive Plants Council of British Columbia. Gail and the Directors of the Council have allowed me exposure to a broad range of interesting projects (and people!) involved in the management of invasive plants in British Columbia, greatly enhancing the quality of my experience in this Province. Finally, I would like to thank Sandy Lloyd from the Department of Agriculture and Food, Western Australia for her time in reviewing this paper and for her valuable comments.
Literature cited
Agriculture and Resource Management Council of Australia and New Zealand, Australian and New Zealand Environment and Conservation Council and Forestry Ministers. 1999. The national weeds strategy: a strategic approach to weed problems of national significance, revised edition. Commonwealth of Australia. 60 p. http://mincos.gov.au/pdf/nat_weeds_strategy.pdf. Accessed June 28, 2007.

Moncrieff 23
Australian Weeds Committee. 2006a. Weeds of national significance. http://www.weeds.org.au/natsig.htm. Accessed Mar. 29, 2006.
Australian Weeds Committee. 2006b. Report an alert weed. http://www.weeds.org. au/reportalert.htm. Accessed Nov. 23, 2006.
Conservation International. 2006. Biodiversity Hotspots. www.biodiversityhotspots. org/ xp/Hotspots. Accessed Nov. 24, 2006.
CRC for Australian Weed Management. 2003a. Facts and figures - environmental and agricultural weeds. http://www.weeds.crc.org.au/main/facts_figures.html. Accessed Mar. 23, 2006.
CRC for Australian Weed Management. 2003b. Counting the cost of weed seed added to the seed bank. Weed Watch. Newsletter of the Cooperative Research Centre for Australian Weed Management. Edition 4, Volume 2 November 2003:4. http://www.weeds.crc.org.au/documents/weed_watch_vol2_no4.pdf. Accessed Apr. 2, 2007.
CRC for Australian Weed Management. 2003c. The grey areas of the black list system. Weed Watch. Newsletter of the Cooperative Research Centre for Australian Weed Management. Edition 2, Volume 2 March 2003:1-2. http://www.weeds.crc.org.au/documents/awm_030403_n_letter_ed2.pdf. Accessed Apr. 2, 2007.
CRC for Australian Weed Management. 2004a. Weeds cost farmers 14 per cent of income. Weed Watch. Newsletter of the Cooperative Research Centre for Australian Weed Management. Edition 6, Volume 2 July 2004:1-2. http://www.weeds.crc.org.au/documents/weed_watch_vol2_no6.pdf. Accessed Apr. 2, 2007.
CRC for Australian Weed Management. 2004b. Early weed detection - early response capabilities. Weed Watch. Newsletter of the Cooperative Research Centre for Australian Weed Management. Edition 6, Volume 2 July 2004:11. http://www.weeds.crc.org.au/documents/weed_watch_vol2_no6.pdf. Accessed Apr. 2, 2007.
CRC for Australian Weed Management. 2006a. The economics of invasion. http://www.weeds.crc.org.au/documents/mr_economics_invasion_101006.pdf. Accessed Nov. 23, 2006.
CRC for Australian Weed Management. 2006b. Biocontrol delivers a $10Bn result. http://www.weeds.crc.org.au/documents/mr_economics_report_150806.pdf. Accessed Nov. 23, 2006.
Department of Agriculture and Food. 2006a. Permitted and quarantine species lists. http://www.agric.wa.gov.au/pls/portal30/docs/FOLDER/IKMP/PW/WEED/PERMITTED_PROHIBITED.HTM. Accessed March 29, 2006.
Department of Agriculture and Food. 2006b. Declared plant in Western Australia. Skeleton weed (Chondrilla juncea). http://agspsrv34.agric.wa.gov.au/dps /version02/01_plantview.asp?page=8&contentID=67& Accessed Nov. 23, 2006.

24 Invasive plant management strategies: An Australian perspective
Department of Agriculture, Forestry and Fisheries. 2007. Weed assessment of new plant imports. http://www.daff.gov.au/ba/reviews/weeds. Accessed June 22, 2007.
Department of Environment and Heritage and the CRC for Australian Weed Management. 2003. Kochia (Bassia scoparia). Alert list for environmental weeds: weed management guide. http://www.environment.gov.au/biodiversity/ invasive/publications/b-scoparia.html. Accessed Nov. 23, 2006.
Department of Environment, Sport and Territories. 1996. National strategy for the conservation of Australia’s biological diversity. http://www.environment.gov. au/ biodiversity/publications/strategy/index.html. Accessed June 22, 2007.
Department of Sustainability and Environment and Department of Primary Industries. 2005. Weed alert rapid response plan Victoria 2004 / 2005: A surveillance and response plan for potential, new and emerging weeds in Victoria. Melbourne, Australia: Department of Primary Industries. 62 p.
Environment, Communications, Information Technology and the Arts References Committee. 2004. Turning back the tide - the invasive species challenge: report on the regulation, control and management of invasive species and the Environment Protection and Biodiversity
Conservation Amendment (Invasive Species) Bill 2002, Report to the Australian Senate. Canberra, Australia. 262 p.
Groves, R. H., R. Boden, and W. M. Lonsdale. 2005. Jumping the garden fence: Invasive garden plants in Australia and their environmental and agricultural impacts. CSIRO report prepared for WWF-Australia. Sydney, Australia. 173 p. http://wwf.org.au/publications/jumping_the_garden_fence/. Accessed Apr. 2, 2007.
Groves, R. H., F. D. Panetta, and J. G. Virtue, eds. 2001. Weed Risk Assessment. Collingwood, Australia: CSIRO Publishing. 246 p.
Hibbert, M. 2002. Aussie Plant Finder 2002 for 2. Glebe, Australia: Florilegium. 383 p.
Hopper, S. D., M. S. Harvey, J. A. Chappill, A. R. Mair, and B. Y. Main. 1996. The Western Australian biota as Gondwanan heritage - a review. Pages 1-46 in S.D. Hopper, J.A. Chappill, M.S. Harvey and A.S. George, eds. Gondwanan Heritage. Chipping Norton, Australia: Surrey Beatty and Sons.
Invasive Plant Council of British Columbia. 2006. Early Detection and Rapid Response Action Plan. Carpet Burweed (Soliva sessilis). A collaborative approach to preventing establishment in BC. Williams Lake, BC: Invasive Plant Council of British Columbia. 25 p.
Martin, P. 2003. Killing us softly Australia’s green stalkers: A call to action on invasive plants, and a way forward. Glen Osmond, Australia: CRC for Australian Weed Management. 16 p.
Martin, P. 2005. Closing the door to new weeds: benefits for the sheep and wool industries. Briefing Note CRC for Australian Weed Management.
Moncrieff 25
http://www.weeds.crc.org.au/documents/bn%20_sheep_wool.pdf. Accessed Nov. 23, 2006.
McFadyen. R. 2005. Western Australia's experience: a permitted list with all genera removed. Briefing Note CRC for Australian Weed Management. http://www.weeds.crc.org.au/documents/bn%20_wa_experience.pdf. Accessed June 22, 2007.
McLaren, D. A., M. Whattam, K. Blood, V. Stajsic, and R. Hore. 1999. Mexican feathergrass (Nassella tenuissima): a potential disaster for Australia. Proceedings of the 12th Australian Weed Conference, p. 12-16 September 1999. Hobart, Australia: 658-662.
Ministry of Agriculture and Lands. 2005. Summary Report on Invasive Plant Management in British Columbia 2004/05 and 2005/06. Victoria, Canada: Government of British Columbia. 34 p.
Page, A.R., and K. L. Lacey. 2006. Technical Series #10: Economic impact assessment of Australian weed biological control. Report to the CRC for Australian Weed Management http://www.weeds.crc.org.au/documents/ tech_series_10.pdf. Accessed Apr. 2, 2007.
Pheloung, P.C. 1995. Determining the weed potential of new plant introductions to Australia. Perth, Australia: Agriculture Protection Board. 33 p.
Richardson, D.M., P. Pyšek, M. Rejmanek, M.G. Barbour, F. D. Panetta, and C. J. West. 2000. Naturalization and Invasion of alien Plants: concepts and definitions. Divers. Distrib. 6:93-107.
Sinden, J., R. Jones, S. Hester, D. Odom, C. Kalisch, R. James, and O. Cacho. 2004. Technical Series #8: The economic impact of weeds in Australia. CRC for Australian Weed Management. http://www.weeds.crc.org.au/documents/ tech_series_8.pdf. Accessed Apr. 2, 2007.
Spafford-Jacob, H., R. Randall, and S. Lloyd. 2004. Front Door Wide Open to Weeds: An examination of the weed species permitted for import without risk assessment. A Weeds CRC and University of Western Australia report prepared for WWF-Australia. Sydney, Australia: WWF-Australia. vii + 120 p. http://wwf.org.au/publications/wide_open_to_weeds/. Accessed June 28, 2007.
State Weed Plan Steering Group. 2001. A weed plan for Western Australia. Western Australia Department of Agriculture Bulletin 4490. http://www.agric.wa.gov. au/pls/portal30/docs/FOLDER/IKMP/PW/WEED/BULL4490_0.PDF. Accessed Mar. 28, 2006.
Tasmanian Weed Management Committee. 2005. Weed Plan: Tasmania’s weed management strategy, second edition. http://www.dpiw.tas.gov.au/inter.nsf/ Attachments/LVAE-53V5FT/$FILE/WeedPlan.pdf. Accessed Apr. 2, 2007.

The Australian weed risk assessment system: Does it work in Hawai‘i? Would it work in
Canada?
Curtis C. Daehler Department of Botany, University of Hawai‘i Manoa, Honolulu, HI 96822
Julie S. Denslow Institute of Pacific Islands Forestry, USDA Forest Service, 60 Nowelo St., Hilo, HI 96720
The Australian weed risk assessment (WRA) model is a general system for identifying all types of pest plants, and its structure allows it to be easily adapted to other locations. We adapted the Australian WRA for use in Hawai‘i and added a second screening to reduce the number of species rated as “evaluate further”. Our Hawai‘i-Pacific WRA (HPWRA) correctly predicted 95% of major pests while also correctly classifying 92% of non-pests. Measures of the accuracy of any WRA system are affected by how one determines which plants are actually pests. The threshold for tolerance for minor pests can easily be adjusted, but there is a trade-off between increased detection of minor pests and misclassification of non-pests as pests. In Hawai‘i, HPWRA is used on a voluntary basis for screening new plant introductions, as well as for making planting decisions and prioritizing species for control or eradication. Whereas HPWRA is predictive, the Hawai‘i Exotic Plant Evaluation Protocol (HEPEP) was developed as an extension of HPWRA to document actual impacts of plants already present, as well as the likelihood of further spread and difficulty of control. Information from HPWRA and HEPEP can be used to support noxious weed designations. HPWRA (including the second screening) has been successfully used to predict major pests in Florida and Central Europe, and it could be adapted for use in Canada. Relative to risk assessment procedures used at the Federal level in the United States (USDA-APHIS), the modified Australian WRA has a better-documented ability to identify most serious invaders, and it requires less time per species, thereby allowing more assessments to be made at lower cost.
Introduction
The Hawaiian Islands represent less than 0.3% of the land area in the United States, but they are home to nearly 30% of all endangered and threatened plants in the United States. Invasive plants appear to be one of the most significant
28 Australian weed risk assessment system in Hawai‘i and Canada?
threats to native plant conservation and rare plant restoration in the Hawaiian Islands (Smith 1985). More than 90% of the invasive plants that have invaded natural areas were deliberately introduced to Hawai‘i for forestry, food, ornamental plantings, or other human uses (Daehler and Carino 1999).
The Hawai‘i Noxious Weed Rules and the Federal Noxious Weed List are two legal instruments that can be used to protect Hawai‘i from deliberate importation of weeds, but their past and present effectiveness is questionable. The Federal list regulates mainly temperate weeds, whereas most of Hawai‘i’s environmental and economic weeds are tropical or sub-tropical species. The Hawai‘i State noxious weed list had traditionally sought to regulate weeds of economic crops such as sugar cane and pineapple, and it has not prevented importation of most environmental weeds. Accounting for cross-listing of species between Federal and State noxious weed lists, 182 plant species are regulated in Hawai‘i, plus several listed genera. Of at least 260,000 known angiosperm species (Stevens 2001), more than 99.9% currently can be legally imported into Hawai‘i without any consideration of their potential to become pests.
Recognizing the increasing economic and environmental costs of invasive species (Vitousek et al. 1997; Wilcove et al. 1998; Pimentel et al. 2005), substantial recent attention has focused on management of current invasive plants and prevention of new introductions of invasive plants into Hawai‘i. At the federal level, Executive Order 13112 (Anonymous 1999) helped guide efforts and motivate the search for objective criteria that could be used in identifying high-risk plants.
Executive Order 13112 states that a federal agency shall “not authorize, fund, or carry out actions that it believes are likely to cause or promote the introduction or spread of invasive species… unless the agency has determined and made public its determination that the benefits of such actions clearly outweigh the potential harm… and that all feasible and prudent measures to minimize risk of harm will be taken in conjunction with the actions.” Although this executive order only directs federal agencies, in principle, it can influence the activities of state agencies, private contractors and even the general public, since federal funds are often used to support state programs, which in turn transfer funds to local organizations or individuals.
In Hawai‘i, the Kaulunani Urban and Community Forestry Program is a state-administered program that uses federal funds to promote beautification projects around the state. In particular, they fund proposals for tree-planting and landscaping projects that have been submitted by local organizations, companies, or individuals. Grants are awarded by a committee, which includes representatives of state and federal agencies, as well as plant industry groups. Some committee members expressed concerns about funding proposals to plant invasive species. Several lists of invasive species had been published in the Internet, but each list included different species, and the criteria for listing were not clear. In the absence of any objective assessments of invasiveness, it was difficult to justify denied funding based on invasiveness or perceived invasiveness of plants proposed for
Daehler and Denslow 29
planting. Executive Order 13112 helped to spotlight key information needs. At the same time, the USDA Forest Service Institute for Pacific Islands Forestry (IPIF) recognized the need to assess invasiveness and risks of forestry species that they were promoting in Hawai‘i as well as on other administered Pacific Islands. To help address these issues, the Kaulunani Program and IPIF directed funding in 2001 towards further testing of a modified Australian weed risk assessment (WRA) system (Pheloung et al. 1999) that had showed promise as a predictive tool in Hawai‘i (Daehler and Carino 2000).
Recognizing a need to effect greater awareness of invasive plant problems and screening tools among landscaping and horticulture professional and industry groups, the Kaulunani Program organized a two-day workshop in December 2001 that was attended by a wide range of stakeholders. The attendees agreed that there was a need “to develop and implement new practical tools, policies and processes to tackle existing problems, minimize the risks of introducing new invasive taxa and to balance conservation, economic and horticultural needs” (Truman-Madriaga 2001). Similar needs have been identified for Canada (Anonymous 2004). In this paper, we will discuss the use of a modified Australian WRA system in Hawai‘i, emphasizing some practical issues involved in testing and applying WRA. We then conclude with speculation about whether a modified Australian WRA would be useful for Canada.
How well does WRA work in Hawai‘i?
After examining WRA systems for Australia (Pheloung et al. 1999), North America (Reichard and Hamilton 1997) and South African fynbos (Tucker and Richardson 1995), the Australian system was identified as the best option for a number of reasons: 1) Most questions address risk factors that are sufficiently general to apply broadly around the world, or questions can be easily adapted for Hawai‘i with minor changes in wording; 2) It could be applied to woody and herbaceous plants; 3) It was designed to identify all types of weeds (economic, environmental and nuisance); 4) Assessments could be completed even with missing information; and, 5) It had the highest rate of correct identification of invaders (Daehler and Carino 2000). In this paper, we refer to WRA in Hawai‘i as HPWRA (Hawai‘i-Pacific WRA) to indicate that the Australian system has been modified for use in Hawai‘i and on other Pacific Islands. Based on retrospective testing using plants known to be invasive in Hawai‘i, 93% of invasive species had been correctly identified while 79% of non-invasive species were correctly classified using HPWRA (Daehler and Carino 2000).
Despite these promising results, several issues needed to be resolved before use of the WRA system in Hawai‘i could be more confidently endorsed by stakeholders. Firstly, the initial tests were done using only species that could be easily pre-classified at one of two extremes: widely recognized invasive pests
30 Australian weed risk assessment system in Hawai‘i and Canada?
versus cultivated species that had failed to escape outside of cultivation (non-pests). There was a need to test the WRA system with plants that exhibited a more representative range of behaviours typical of deliberate introductions. Secondly, we found that the WRA designated 20-30% of assessed species as “evaluate further”. This high rate of indecision was not acceptable to many in the plant industry.
To assess performance of the WRA system using a more representative group of plants, we evaluated 172 species from current planting lists for Hawai‘i and the Western Pacific islands, without considering their behaviour in Hawai‘i (Daehler et al. 2004). To obtain an independent assessment of the pest status of these plants, we surveyed 25 plant experts with experience in Hawai‘i and other Pacific islands, asking them to rate each species as a major pest, minor pest or not a pest based on their direct, local field experience. The plant experts included native forest managers, agriculture professionals, botanists and ecologists. Because field experiences differed among experts, we did not expect agreement among all experts. We classified a species as a major pest if at least three experts agreed. Minor pests were similarly determined by agreement of at least three experts, whereas non-pests were defined as species that received at least three “not a pest” ratings and did not meet the criteria for major or minor pests.
To reduce the number of species in the “evaluate further” category, we developed a second screening for species that initially fell in that category. The secondary screening consisted of a decision tree that used the answers from a few key questions in the WRA (Figure 1). This allowed most species to be rated as either high risk or low risk, although some species remained as “evaluate further” due to missing information (often lack of information on shade tolerance) or because of specific plant characteristics identified in the WRA. For example, a plant, initially rated as “evaluate further”, that is bird-dispersed, shade tolerant and requires a long time to reproductive maturity would remain in the “evaluate further” category (Figure 1), acknowledging the high degree of uncertainty for this combination of traits.
For the species taken from planting lists, and before applying the second screening, the WRA correctly identified 95% of major pests and 66% of non-pests, but 24% of species were rated as “evaluate further” (Table 1). After applying the second screening, only 8% remained in the “evaluate further” category, and the WRA correctly identified 95% of major pests and 92% of non-pests (the former is sometimes reported as “specificity”, while the latter is “1-sensitivity”, as in Caley and Kuhnert (2006)). However, one effect of applying the second screening was the increase in the proportion of minor pests identified as non-pests from 26% to 36% (Table 1). Nevertheless, we concluded that the second screen successfully reduced the proportion of false positives.
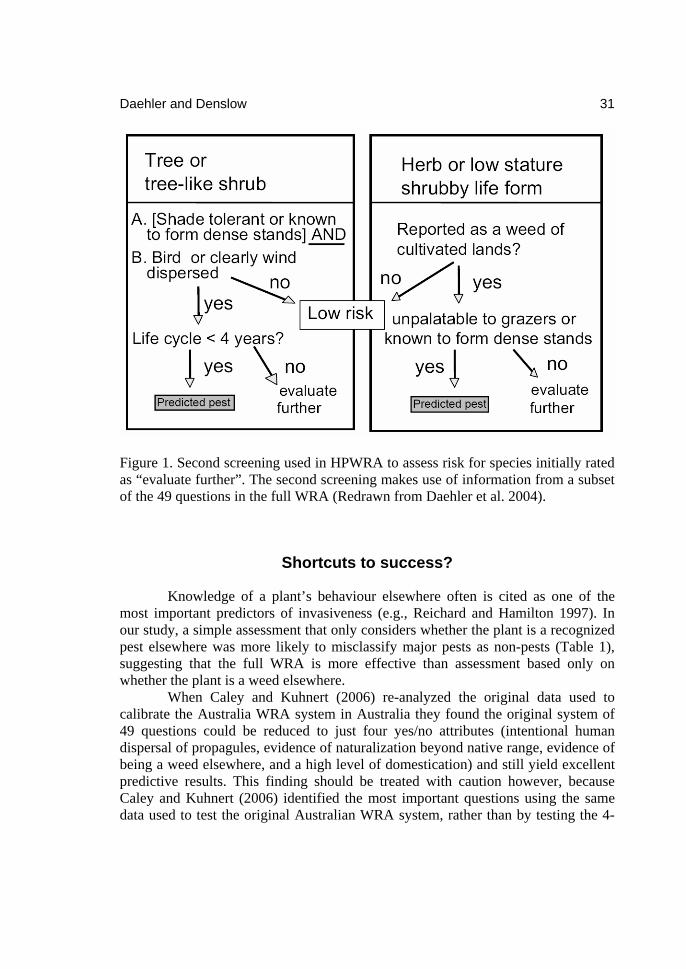
Daehler and Denslow 31
Figure 1. Second screening used in HPWRA to assess risk for species initially rated as “evaluate further”. The second screening makes use of information from a subset of the 49 questions in the full WRA (Redrawn from Daehler et al. 2004).
Shortcuts to success?
Knowledge of a plant’s behaviour elsewhere often is cited as one of the most important predictors of invasiveness (e.g., Reichard and Hamilton 1997). In our study, a simple assessment that only considers whether the plant is a recognized pest elsewhere was more likely to misclassify major pests as non-pests (Table 1), suggesting that the full WRA is more effective than assessment based only on whether the plant is a weed elsewhere.
When Caley and Kuhnert (2006) re-analyzed the original data used to calibrate the Australia WRA system in Australia they found the original system of 49 questions could be reduced to just four yes/no attributes (intentional human dispersal of propagules, evidence of naturalization beyond native range, evidence of being a weed elsewhere, and a high level of domestication) and still yield excellent predictive results. This finding should be treated with caution however, because Caley and Kuhnert (2006) identified the most important questions using the same data used to test the original Australian WRA system, rather than by testing the 4-
32 Australian weed risk assessment system in Hawai‘i and Canada?
question model independently. Under these circumstances, it is possible that the good performance of the reduced model is a quirk of the original Australian data. Table 1. Relative performance of different WRA methods based on screening 172 species when species rated as low risk are admitted (allowed entry). Each column represents an independent measure of performance based on comparison with expert opinion. Single expert criterion indicates performance of the HPWRA + 2nd screening when pests are defined by the opinion of any expert, whereas all other results are based on pests being defined by agreement by at least three experts (modified from Daehler et al. 2004). Major pests
admitted (%)
Minor pests admitted
(%)
Non-pests admitted
(%)
Evaluate further (%)
Pest elsewhere criterion alone
18 24 86 0
HPWRA without 2nd screening
5 26 66 24
HPWRA + 2nd screening
5 36 92 8
Single expert criterion 22 73 98 8
Gordon et al. (2006) compared the performance of the reduced Caley and Kuhnert (2006) model with that of the full WRA (49 questions) and found that the full 49 questions were far superior for identifying invaders in Florida. Although reduction in the number of questions to save time or remove extraneous information is an attractive idea, each question in the assessment relates logically and/or statistically to some aspect of invasiveness. It is acknowledged generally that different factors can contribute to invasiveness or pest status for different species. For this reason, it may be risky to reduce the WRA model to a very small number of questions. The time-savings may not be large once a routine has been established for finding information. Pre-defined resources can be consulted for answers to each question, and after consulting these sources, unanswered questions can be left blank.
Developing an ideal WRA system: Ideas and impediments
An ideal WRA system should be objective, repeatable, and accurate (Mack et al. 2002). Although the questions on the WRA seem objective and straightforward to answer, translating relevant information into “yes” or “no”

Daehler and Denslow 33
answers is not so simple in practice. To help ensure objectivity in answering questions for the WRA, we established pre-defined criteria for answers to each question based on different types of information. We also recorded the information and the source for each answer directly onto a WRA spreadsheet and made the information publicly available on a website. This allowed the information to be checked by any interested person. The public was invited to report inconsistencies; very few inconsistencies were identified. We feel that our standardization and review processes help to ensure objectivity.
We did not explicitly test repeatability by having the same species assessed by two different people, because the answers to questions are based on published material, not personal opinions of the screener. Clear guidelines were established regarding where to search for information and how to answer each question based on different types of information, so the process should be repeatable.
It is a challenge to evaluate the accuracy of the WRA protocol. The crux of the problem lies in determining which species are pests and which species are not pests in reality so that the predictions generated by a WRA system can be tested. We independently and arbitrarily defined pests based on consensus of three experts (out of 25 people surveyed). If we shift the consensus requirement up or down, different rates of accuracy are obtained for the WRA. For example, if we define pests as species judged as pests by one or more experts, then fewer species are classified as non-pests, and those species have a higher rate of correct identification (98%). On the other hand, the WRA system is then less successful at screening out major pests (22% admitted as non-pests) and fully 73% of minor pests are admitted (Table 1). One possible solution would be to define pests based on quantitative thresholds of economic or environmental harm and then use this information to judge whether WRA categorizes species correctly. Unfortunately, economic and ecological impacts have not been quantified for most plants and in practice this information is difficult to obtain.
Even if plants could be quantitatively rated for their impacts, allowing purely objective testing of the accuracy of WRA, there still remains the difficult question of what threshold of harm is acceptable. The WRA can be calibrated to screen out species that are likely to have minor harmful effects, but the trade-off is a greater error rate in terms of misclassifying benign species as pests (Caley et al. 2006). Advocates of the precautionary principle often favor the later option (e.g., Ruesink et al. 1995; VanDriesche and VanDriesche 2001), while many plant industry groups are not willing to accept high rates of misclassification of benign species. Our secondary screening exemplifies this trade-off: the misclassification rate of benign species is reduced, but more minor pests are classified as low risk species.

34 Australian weed risk assessment system in Hawai‘i and Canada?
Uses of WRA in Hawai‘i
The idea of using WRA to evaluate risks of deliberate introductions initially caused concern among some plant industry groups. Although many plant experts in the nursery industry had thorough knowledge of plant behaviour in human-dominated environments, most were not aware of the invasiveness of ornamentals in natural areas, and they did not see a compelling need for screening. Several field trips were organized to show plant industry leaders some of the problems caused by escaped ornamentals in natural areas, and general agreement was reached on the need to develop screening tools (Truman-Madriaga 2001).
Naturally, there were objections from plant industry groups to the possibility of increased regulation or restrictions on plant importations. Increased regulation potentially could affect economic viability of the plant industry, as well as create an additional inconvenience to doing business. There were also concerns about evaluations of species that were already present in Hawai‘i. Professionals who had planted species newly labelled as “invasive” might be branded as irresponsible, and nurseries that had invested in growing these species could face economic losses.
Discussions were necessary to explore misconceptions of what HPWRA does and does not do, and carefully worded explanations were crafted for use on our website. For example, we originally had used the terminology adopted in Australia, where species are rated as “accept” or “reject”. These terms allude to regulatory action, and this was a concern for the plant industry. After some discussion, we settled on the terms “high risk” and “low risk” and developed clear definitions, emphasizing that the WRA generates a prediction, and it is not a definite indicator of behaviour in Hawai‘i. Therefore, decisions to remove established plants should not be based solely on a “high risk” WRA rating. There were concerns that HPWRA ratings would be used to justify removal of street trees considered as nuisances to some. As more people learned the facts about the WRA process, and the opportunities it presented for the nursery industry (e.g., opportunities for public recognition of environmentally friendly practices and opportunities to market low-risk alternatives to higher risk species), positive interests developed within plant industry groups.
Currently, WRA in Hawai‘i is used for three purposes: 1) assessing risks of proposed introductions; 2) making planting recommendations or decisions for species already present; and, 3) helping to prioritize control or eradication of species already present but not yet widespread in distribution. Assessment of proposed introductions is done on a voluntary basis. Several plant industry groups have agreed to Codes of Conduct that include HPWRA for new plant introductions. The WRAs are completed by a weed risk specialist employed by the State of Hawai‘i, and there is no cost to the importer. The Hawai‘i Department of Agriculture also recommends but does not require WRA for all importers. It is hoped that some importers will chose not to bring in species with high risk ratings, or at least that the behaviour of these species will be monitored by growers before proceeding to
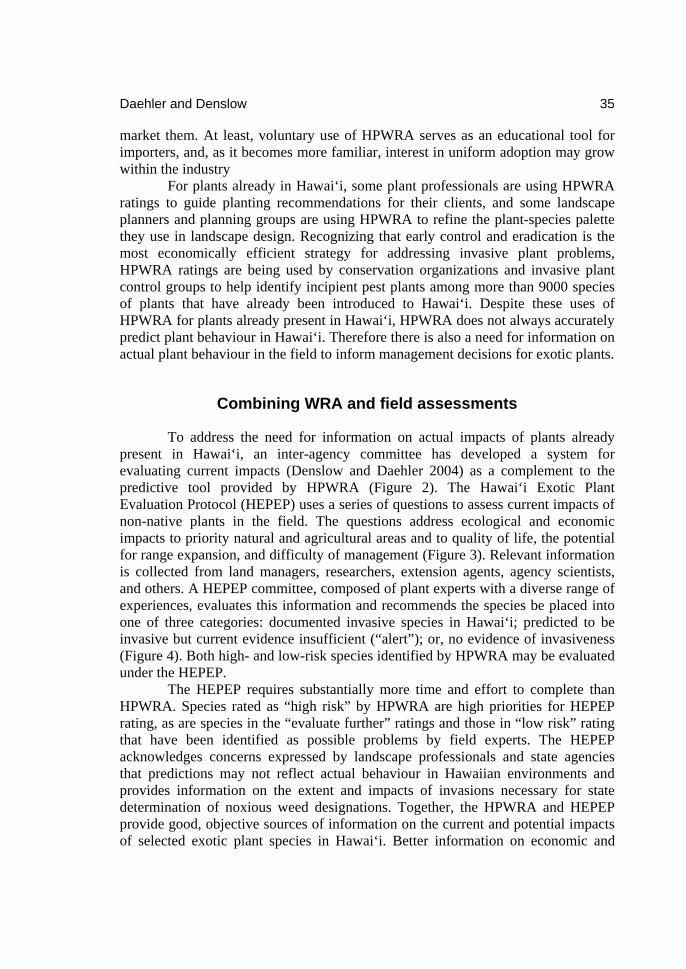
Daehler and Denslow 35
market them. At least, voluntary use of HPWRA serves as an educational tool for importers, and, as it becomes more familiar, interest in uniform adoption may grow within the industry
For plants already in Hawai‘i, some plant professionals are using HPWRA ratings to guide planting recommendations for their clients, and some landscape planners and planning groups are using HPWRA to refine the plant-species palette they use in landscape design. Recognizing that early control and eradication is the most economically efficient strategy for addressing invasive plant problems, HPWRA ratings are being used by conservation organizations and invasive plant control groups to help identify incipient pest plants among more than 9000 species of plants that have already been introduced to Hawai‘i. Despite these uses of HPWRA for plants already present in Hawai‘i, HPWRA does not always accurately predict plant behaviour in Hawai‘i. Therefore there is also a need for information on actual plant behaviour in the field to inform management decisions for exotic plants.
Combining WRA and field assessments
To address the need for information on actual impacts of plants already present in Hawai‘i, an inter-agency committee has developed a system for evaluating current impacts (Denslow and Daehler 2004) as a complement to the predictive tool provided by HPWRA (Figure 2). The Hawai‘i Exotic Plant Evaluation Protocol (HEPEP) uses a series of questions to assess current impacts of non-native plants in the field. The questions address ecological and economic impacts to priority natural and agricultural areas and to quality of life, the potential for range expansion, and difficulty of management (Figure 3). Relevant information is collected from land managers, researchers, extension agents, agency scientists, and others. A HEPEP committee, composed of plant experts with a diverse range of experiences, evaluates this information and recommends the species be placed into one of three categories: documented invasive species in Hawai‘i; predicted to be invasive but current evidence insufficient (“alert”); or, no evidence of invasiveness (Figure 4). Both high- and low-risk species identified by HPWRA may be evaluated under the HEPEP.
The HEPEP requires substantially more time and effort to complete than HPWRA. Species rated as “high risk” by HPWRA are high priorities for HEPEP rating, as are species in the “evaluate further” ratings and those in “low risk” rating that have been identified as possible problems by field experts. The HEPEP acknowledges concerns expressed by landscape professionals and state agencies that predictions may not reflect actual behaviour in Hawaiian environments and provides information on the extent and impacts of invasions necessary for state determination of noxious weed designations. Together, the HPWRA and HEPEP provide good, objective sources of information on the current and potential impacts of selected exotic plant species in Hawai‘i. Better information on economic and

36 Australian weed risk assessment system in Hawai‘i and Canada?
cultural consequences of management alternatives to stakeholders is needed, but currently we lack data to support any but the most general analyses. For example, we do not know volumes and values of different species in the horticultural trade.
Figure 2. Flow chart of the Hawai‘i Exotic Plant Evaluation Protocol (HEPEP) for species already present in Hawai‘i. HEPEP supplements Hawai‘i-Pacific Weed Risk Assessment (HPWRA) by incorporating information on actual plant behaviour in Hawai‘i. Priority areas were defined as native ecosystems, and land managed for economic production or human recreation. Although introduced plants are often found in human-disturbed, unmanaged areas, the presence of non-native species in these areas was considered a lower priority because non-native species usually have ambiguous economic or native ecosystem impacts in these areas.
HPWRA and HEPEP can be used to inform decision-making processes among government agencies to determine appropriate management responses for each species. Restrictions on importation of potentially invasive species not yet present may be a cost-effective approach to reduce new problems introduced through the horticultural trade. Management of species already present and incurring ecological and economic costs is more challenging, because it involves considerable investment of resources, cooperation across agencies and stakeholder groups and, at some level, societal agreement on priorities. Nevertheless such
WRAHPWRA
LOW RISKLOW RISK
NONO YESYES
PREDICTED PEST or PREDICTED PEST or EVALUATE FURTHEREVALUATE FURTHER
FIELD FIELD EVALUATIONEVALUATIONLOW RISKLOW RISK
NATURALIZATION IN PRIORITY NATURALIZATION IN PRIORITY AREAS IN HAWAI? ?AREAS IN HAWAI? ?
NONO YESYES
NATURALIZATION IN PRIORITY NATURALIZATION IN PRIORITY AREAS IN HAWAI? ?AREAS IN HAWAI‘I?
NONO YESYES
FIELD FIELD EVALUATIONEVALUATION
WIDELY PLANTED WIDELY PLANTED FOR A LONG TIMEFOR A LONG TIME
ALERT
YESYES NONO
LOW RISKLOW RISK
CONCERN FROM FIELD CONCERN FROM FIELD BOTANISTS?BOTANISTS?
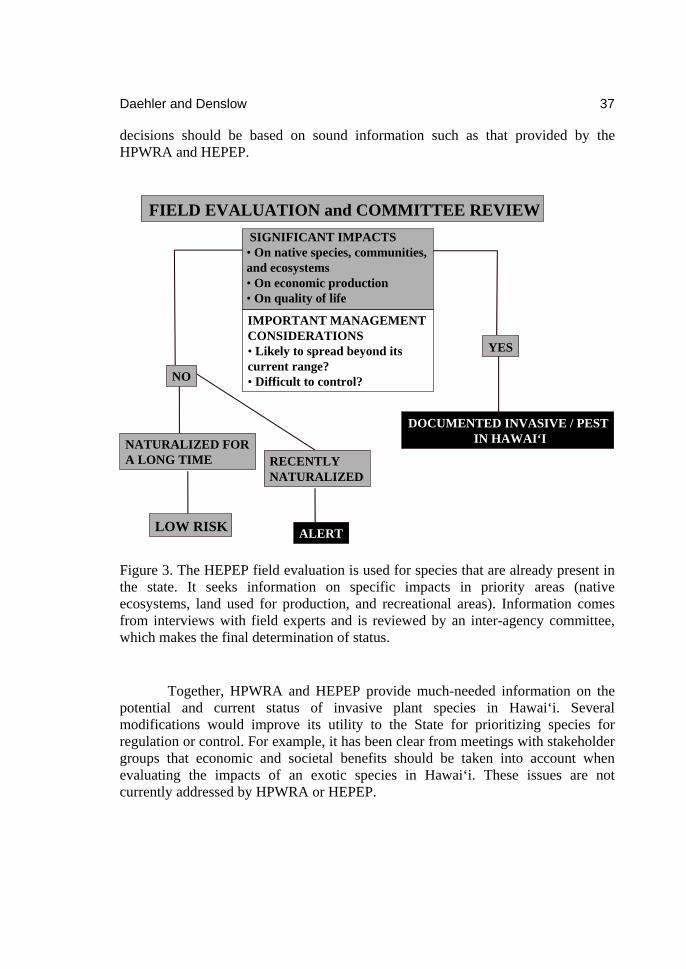
Daehler and Denslow 37
decisions should be based on sound information such as that provided by the HPWRA and HEPEP.
Figure 3. The HEPEP field evaluation is used for species that are already present in the state. It seeks information on specific impacts in priority areas (native ecosystems, land used for production, and recreational areas). Information comes from interviews with field experts and is reviewed by an inter-agency committee, which makes the final determination of status.
Together, HPWRA and HEPEP provide much-needed information on the potential and current status of invasive plant species in Hawai‘i. Several modifications would improve its utility to the State for prioritizing species for regulation or control. For example, it has been clear from meetings with stakeholder groups that economic and societal benefits should be taken into account when evaluating the impacts of an exotic species in Hawai‘i. These issues are not currently addressed by HPWRA or HEPEP.
FIELD EVALUATION and COMMITTEE REVIEW
NONO
YES
ALERT
DOCUMENTED INVASIVE / PEST IN HAWAI‘I
RECENTLY RECENTLY NATURALIZEDNATURALIZED
NATURALIZED FOR NATURALIZED FOR A LONG TIMEA LONG TIME
LOW RISKLOW RISK
IMPORTANT MANAGEMENT CONSIDERATIONS• Likely to spread beyond its current range?• Difficult to control?
SIGNIFICANT IMPACTS • On native species, communities, and ecosystems• On economic production• On quality of life
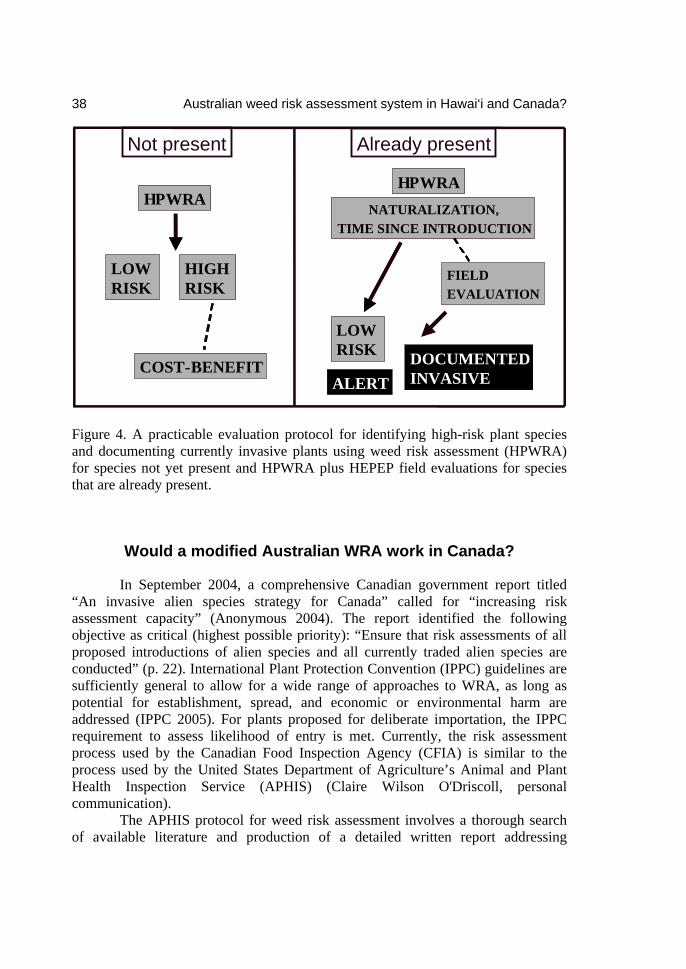
38 Australian weed risk assessment system in Hawai‘i and Canada?
Figure 4. A practicable evaluation protocol for identifying high-risk plant species and documenting currently invasive plants using weed risk assessment (HPWRA) for species not yet present and HPWRA plus HEPEP field evaluations for species that are already present.
Would a modified Australian WRA work in Canada?
In September 2004, a comprehensive Canadian government report titled “An invasive alien species strategy for Canada” called for “increasing risk assessment capacity” (Anonymous 2004). The report identified the following objective as critical (highest possible priority): “Ensure that risk assessments of all proposed introductions of alien species and all currently traded alien species are conducted” (p. 22). International Plant Protection Convention (IPPC) guidelines are sufficiently general to allow for a wide range of approaches to WRA, as long as potential for establishment, spread, and economic or environmental harm are addressed (IPPC 2005). For plants proposed for deliberate importation, the IPPC requirement to assess likelihood of entry is met. Currently, the risk assessment process used by the Canadian Food Inspection Agency (CFIA) is similar to the process used by the United States Department of Agriculture’s Animal and Plant Health Inspection Service (APHIS) (Claire Wilson O'Driscoll, personal communication).
The APHIS protocol for weed risk assessment involves a thorough search of available literature and production of a detailed written report addressing
HH-PWRANATURALIZATION,NATURALIZATION,
TIME SINCE INTRODUCTIONTIME SINCE INTRODUCTION
FIELD FIELD EVALUATIONEVALUATION
LOW LOW RISKRISK
ALERTALERTDOCUMENTEDDOCUMENTEDINVASIVEINVASIVE
HH-PWRA
LOW LOW RISKRISK
HIGH HIGH RISKRISK
COSTCOST--BENEFITBENEFIT
Not present Already present

Daehler and Denslow 39
taxonomy of the species as well as factors contributing to risk: potential habitat suitability; reproduction and spread; economic harm; ecological harm; and, likelihood of introduction. Based on the information in the written report, each of these risk factors is rated high, medium or low, and a decision to allow or deny importation is based the composite of the ratings. While these detailed written reports contain much useful information, there are some drawbacks to this form of assessment. Firstly, relative to the Australian WRA, the APHIS written report requires much more time and effort to produce. For example, a recent combined assessment for Senecio inaequidens and S. madagascariensis required 136 hours of research and writing to complete (Anthony Koop, personal communication). If the objective is to assess every proposed plant introduction, the full APHIS risk assessment is probably not a feasible option. Secondly, there are no data on which to judge how well the APHIS risk assessment procedure excludes true pest plants and allows entry of non-pests. This is because the APHIS system has never been tested by evaluating known pests and non-pests and calculating the rates of correct decisions. The APHIS system uses much of the same information as the Australian WRA, but the information is not necessarily weighed in the same way, so we cannot infer that the rates of correct predictions will be the same. The APHIS system might be better or worse than the Australian WRA, but there is currently no way to determine this. If there was no difference in predictive accuracy of the two systems, then the Australian system would probably be better in practice because of the time savings, which allows more species to be evaluated with lower costs.
One clear difference between the APHIS WRA and the Australian WRA is that the former system permits consideration of unique information or circumstances. Rather than being restricted to specific questions, the assessor can use any information that might be relevant to the consequences of introduction or the probability of introduction. Furthermore, the written justifications of high, medium, or low ratings permit greater flexibility in assigning the ratings. High ratings are sometimes justified based on uncertainty, which errs on the precautionary side, although the effect of this practice on rates of correctly classifying pests and non-pests is unknown. Again, a significant attraction of the Australian WRA is that retrospective testing has been used to independently validate its predictive ability.
There is no reason to believe that a modified Australian WRA would not work for Canada. The HPWRA (including the second screening) was recently tested in Central Europe (Krivánek and Pyšek 2006) and Florida (Gordon et al. 2006). In both places, HPWRA correctly identified most major pests. In a test conducted in the Chicago area (geographically, the closest test to Canada so far), a modified version of the Australian WRA successfully identified all invaders while correctly identifying 85% of non-invaders (Jefferson et al. 2004). The Australian WRA is currently being tested in Japan (R. H. Groves, personal communication). We are not aware of any countries or regions where a modified version of the Australian WRA

40 Australian weed risk assessment system in Hawai‘i and Canada?
was properly tested and not found to be useful as a tool for screening out major pests.
A recent report noted that when it comes to new plant imports, the USDA (APHIS) policy “is outdated and does not provide U.S. agriculture and the environment with adequate protection against the introduction of noxious weeds” (USDA 2005). The main deficiencies identified were not in the WRA procedure per se, but rather in the USDA’s “black list” policy, which prevents importation only of species that have been listed on the Federal Noxious Weed List (fewer that 200 species). Proposed changes would create a new category of plants termed Not Authorized for Import Pending Risk Analysis (NAPRA) (USDA 2005). It is not yet clear how species will be assigned to the NAPRA category, or how many species would need to be placed in NAPRA in order to provide adequate protection against invasive weeds. Assuming that about 1% of introduced plants become significant weeds, there are probably around 2000 weeds in the world angiosperm flora that have not yet been introduced to the United States. In Australia, all new plant imports are in a NAPRA category. A policy such as this would be difficult for APHIS to manage using their current, labour-intensive, WRA system because it would require assessment of all plants proposed for entry.
If Canada’s objective is to assess risk for all proposed plant introductions, then a full, APHIS-style WRA seems unfeasible, and it is worth considering a modified version of the Australian WRA. The Australian WRA has already been applied with success in other temperate regions. No WRA system can be 100% accurate, but the Australian WRA can be expected to correctly identify more than 90% of major pests and 70-90% of non-pests. There is no evidence to suggest that the more time-consuming APHIS WRA can yield better results than the Australian WRA. Adding a second screening, such as the one developed by Daehler et al. (2004) can improve rates of correctly classifying non-pests (Gordon et al. 2006; Krivánek and Pyšek 2006).
Acknowledgements
Our research to evaluate a modified version of the Australian WRA was supported by grants from the Kaulunani Urban Forestry Program (Hawai‘i Department of Land and Natural Resources, Division of Forestry and Wildlife) and the U. S. Department of Agriculture Forest Service.
Literature cited
Anonymous. 1999. Invasive Species. Executive Order 13112 of February 3, 1999. Federal Register 64(25):6183–6186.

Daehler and Denslow 41
Anonymous. 2004. An invasive alien species strategy for Canada. 40 p. http://www.cbin.ec.gc.ca/issues/ias/documents/Final_IAS_Strategic_Plan_smaller_e.pdf. Accessed May 15, 2007.
Caley, P., and P. M. Kuhnert. 2006. Application and evaluation of classification trees for screening unwanted plants. Austral Ecol. 31:647-655.
Caley, P., W. Lonsdale, and P. Pheloung. 2006. Quantifying uncertainty in predictions of invasiveness. Biol. Invasions 8:277-286.
Daehler, C. C., and D. A. Carino. 1999. Threats of invasive plants to the conservation of biodiversity. Pages 21-27 in C. H. Chou, G. R. Waller, and C. Reinhardt, eds. Biodiversity and allelopathy: from organisms to ecosystems in the Pacific. Taipei: Academia Sinica.
Daehler, C. C., and D. A. Carino. 2000. Predicting invasive plants: prospects for a general screening system based on current regional models. Biol. Invasions 2:92-103.
Daehler, C. C., J. S. Denslow, S. Ansari, and H. Kuo. 2004. A risk assessment system for screening out invasive pest plants from Hawai‘i and other Pacific Islands. Conserv. Biol. 18:360-368.
Denslow, J.S. and Daehler 2004 Hawai‘i exotic plant evaluation protocol. Draft version 8. http://www.botany.hawaii.edu/faculty/daehler/WRA/hepep_v8.pdf. Accessed May 15, 2007.
Gordon, D. R., A. M. Fox, and R. K. Stocker. 2006. Testing a predictive screening tool for reducing introduction of invasive plants to Florida. Final Report to USDA APHIS-PPQ Contract 05-8100-1078-CA. 27 p.
IPPC. 2005. International standards for phytosanitary measures. Secretariat of the International Plant Protection Convention, Rome: Food and Agriculture Organization of the United Nations. 297 p.
Jefferson, L., K. Havens, and J. Ault. 2004. Implementing invasive screening procedures: The Chicago Botanic Garden model. Weed Technol. 18:1434-1440.
Krivánek, M., and P. Pyšek. 2006. Predicting invasions by woody species in a temperate zone: a test of three risk assessment schemes in the Czech Republic (Central Europe). Divers. Distrib. 12:319-327.
Mack, R. N., S. C. H. Barrett, P. L. Defur, W. l. Macdonald, L. V. Madden, D. S. Marshall, D. G. Mccullough, P. B. Mcevoy, J. P. Nyrop, S. E. H. Reichard, K. J. Rice, and S. A. Tolin. 2002. Predicting invasions of nonindigenous plants and plant pests. Washington, D.C.: National Academy Press. 198. p.
Pheloung, P.C., Williams P.A. and Halloy S.R. 1999. A weed risk assessment model for use as a biosecurity tool evaluating plant introductions. J. Environ. Manag. 57:239-251.
Pimentel, D., R. Zuniga, and D. Monison. 2005. Update on the environmental and economic costs associated with alien-invasive species in the United States. Ecol. Econ. 52:273-288.
Reichard, S. H., and C. W. Hamilton. 1997. Predicting invasions of woody plants introduced into North America. Conserv. Biol. 11:193-203.
42 Australian weed risk assessment system in Hawai‘i and Canada?
Ruesink, J. L., I. M. Parker, M. J. Groom, and P. M. Kareiva. 1995. Reducing the risks of nonindigenous species introductions. BioScience 45:465-477.
Smith, C. W. 1985. Impact of alien plants on Hawai‘i 's native biota. Pages 180-250 in C. P. Stone, and J. M. Scott, eds. Hawai‘i's terrestrial ecosystems: Preservation and management. Honolulu, HI: Cooperative National Park Resources Studies Unit, University of Hawaii. 584 p.
Stevens, P. F. 2001 onwards. Angiosperm Phylogeny Website. Version 7. http://www.mobot.org/MOBOT/research/APweb. Accessed May 15, 2007.
Truman-Madriaga, T. 2001. From urban landscapes to native forests: Invasive species in Hawaii. Honolulu, HI: DLNR Division of Forestry and Wildlife. 21 p. http://www.state.hi.us/dlnr/dofaw/pubs/invsppproc.pdf. Accessed May 15, 2007.
Tucker, K.C .and Richardson D.M. 1995. An expert system for screening potentially invasive alien plants in South African fynbos. J. Environ. Manag. 44: 309-338
USDA. 2005. Addressing the risks associated with the importation of plants for planting: A white paper. 9 p. http://www.aphis.usda.gov/ppq/Q37/whitepaper .pdf. Accessed May 15, 2007
VanDriesche, J., and R. VanDriesche. 2001. Guilty until proven innocent. Conserv. Biol. Practice 2:2-10.
Vitousek, P. M., C. M. D'Antonio, L. L. Loope, M. Rejmanek, and R. Westbrooks. 1997. Introduced species: A significant component of human-caused global change. N. Z. J. Ecol. 21:1-16.
Wilcove, D. S., D. Rothstein, J. Dubow, A. Phillips, and E. Losos. 1998. Quantifying threats to imperiled species in the United States. Bioscience 48:607-615.
Tracking long-term changes in the arable weed flora of Canada
A. Gordon Thomas and Julia Y. Leeson Agriculture and Agri-Food Canada, Saskatoon Research Centre, 107 Science Place,
Saskatoon, SK S7N 0X2. [email protected]
The weed flora of arable fields in Canada is largely the result of the accidental or intentional introduction of many alien species as documented by weed surveys from the 1900s to the 2000s. The objectives of this paper are to review the various methodologies that have been used in Canada to survey for cropland weeds since the early 1900s and to examine these data for long-term changes in the number, frequency, abundance, and distribution of alien and native weed species. The first contemporary survey was initiated in 1973 and this methodology, with minor modifications, has been used for surveys in nine Canadian provinces from the 1970s to the 2000s. Alien weed species accounted for 52% of the weeds recorded in these surveys. Earlier weed surveys in the Prairie Provinces from the 1900s to the 1960s were used for retrospective analysis of the general trends in weed populations. About two-thirds of the 36 most abundant species in the 2000s were present or considered bad weeds in the early 1900s. The percentage of alien weed species has increased from 43% to nearly 70% during this time period. Alien weed species accounted for 93 to 96% of the total relative abundance index in the contemporary surveys in the prairie region; however, the density of alien weed species has declined significantly since the 1970s from approximately 100 to 30 plants m-2. While the abundance of many weed species, such as cow cockle, is greatly reduced, weed species such as cleavers, kochia, and barnyard grass have expanded in range and/or abundance based on distribution maps constructed from survey data. The relative abundance index and density of native weed species are insignificant in comparison. While the methodology used in the contemporary weed surveys discussed in this paper are not designed to detect the early stages of weed invasions, they are effective for the long-term monitoring of shifts in the arable alien and native weed species during the later stages of invasion.
Introduction
Pyšek et al. (2004) define weeds as native or alien plants that grow where they are not wanted and have detectable economic and/or environmental impact. They further classify all alien weed species as invasive. The Invasive Species Working Group of the European Weed Research Society (Bohren 2006) expand the definition of invasive plants to include native species: “plants exotic ...... and not

44 Tracking long-term changes in the arable weed flora of Canada
exotic ...... whose establishment and spreading damages crop yields and/or threatens native biodiversity.” In Canada, weed species that interfere with crop production have been recognized in the invasive alien species strategy (Government of Canada 2004) as indicated by the following quote. “Invasive alien species also have significant impacts in the agriculture sector. Many significant pests affecting agriculture are not native to Canada - for example, 80 percent of agricultural weeds are invasive aliens - and many crops cannot be grown without protection from invasive alien species.”
Canadian producers, extension specialists, and weed scientists treat alien and native weed species as a real or perceived threat to crop productivity and economic profitability. This threat was mitigated in the early years primarily by mechanical weed control and in the later years by herbicides. New crops, extended rotations, summer fallow reduction, conservation tillage systems, efficient fertilizer use, and enhanced herbicide options have been introduced during the last few decades. The adoption of these farming practices would be expected to change the arable weed flora over time. The weed flora would also be expected to vary among agroecoregions in Canada due to climatic differences. Changes in the regional weed flora may also occur by the accidental or intentional introduction of species from outside the country or by the range expansion of species already present in Canada. To track these changes, a long-term monitoring program is required. Regular monitoring is a fundamental requirement for developing ecologically and economically sustainable strategies to manage agricultural weed species.
A complete inventory of weed species in all major field crops within a large area such as a province is obviously impossible because of the enormous time and effort required. Instead, a survey of a representative portion of a province’s arable area is used to assess the status of the weed populations. Assessments of the identity, location, and abundance of weed species conducted at regular intervals allow the detection of temporal trends. Effective long-term monitoring is dependent on the use of standardized methodology to quantitatively measure changes in distribution and abundance. A long-term monitoring program is necessary to discern trends because annual fluctuations in temperature and rainfall and crop production inputs will influence weed species abundance, potentially masking underlying changes.
The aims of this paper are (1) to review the various methodologies that have been used in Canada since the early 1900s to survey for arable weed species, (2) to determine the prevalence of alien and native weed species and the long-term changes in frequency, abundance, and distribution of weed species based on these surveys, and (3) to discuss weed species of arable crops in the context of invasive species biology.

Thomas and Leeson 45
Weed survey methodology used in Canada
Contemporary surveys in the Prairie Provinces The first in a series of quantitative weed surveys was initiated in 1973 by
Don Dew in Alberta (Thomas and Wise 1985). His pioneering efforts in conducting quantitative surveys greatly influenced the development of similar weed survey initiatives in Saskatchewan and Manitoba (Thomas and Wise 1983b, 1984). This methodology with minor modifications, primarily made possible with advances in computer processing power, has been used for a series of surveys conducted in each of the Prairie Provinces in the 1970s, 1980s, 1990s, and 2000s (Leeson et al. 2005a).
The standardized survey methodology used for the Prairie Provinces since the 1970s enabled direct comparisons among survey years so that the changes in abundance and distribution could be quantified. The surveys were based on a stratified random sample of fields (Leeson et al. 2005a). The strata changed from political (townships, extension districts) to ecological (ecodistricts) in the 1990s. With the exception of Alberta in the 1970s, the number of fields selected in each stratum was proportional to the area of the selected crops grown. In the 1970s and 1980s, extra sites were added to strata that did not meet criteria for meaningful summarization. These differences in strata allocation are easily overcome by weighting the data prior to making comparisons between surveys (Leeson et al. 2005a).
After quarter sections (65 ha) were randomly selected within each stratum, a site qualification process occurred. The quarter section had to include a minimum-sized field planted to one of the crops of interest and to be accessible by road. Starting in the 1980s, producer permission was also required to conduct the survey. Land use databases greatly improved the efficiency of the site selection and qualification process in the 2000s surveys.
The weeds were counted in July or August prior to harvest. This time was chosen for several reasons. The weeds in the field were, in part, a result of agronomic management decisions (e.g., crop rotation, time and type of tillage, rate and placement of fertilizer, and selection, rate and effectiveness of herbicide used) made by the farm operator at various times during the crop year. Counts at this time of the year showed the size and extent of troublesome weed species. This survey time had additional advantages. Identification was simplified because many of the plants were mature. Also, the field crew had more time to work on the survey during the late summer than during the period immediately after crop seeding.
After the 1970s surveys in Alberta, weeds were enumerated using a set pattern to reduce any potential surveyor bias (Thomas 1985). The surveyor walked 100 paces along the edge of the field, turned at right angles, and walked 100 paces

46 Tracking long-term changes in the arable weed flora of Canada
into the field (Figure 1). The inverted W-pattern began at this point, avoiding potential edge effect. Five locations were sampled along each arm of the pattern, giving 20 locations. Locations were 20 paces apart. The number of individuals of each weed species was determined in a 0.25 m² quadrat (50 cm by 50 cm) at each of the 20 locations. The procedure was modified when necessary to compensate for sloughs, odd-shaped fields, and other irregularities.
100
pace
s
5
1 10
15
20
20 paces
100 paces
(A) (B)
0.5 m2 by 0.5 m2 quadrat Potential sample location Road
805 m
805
m
100
pace
s
5
1 10
15
20
20 paces
100 paces
(A) (B)
0.5 m2 by 0.5 m2 quadrat Potential sample location Road
805 m
805
m
Figure 1. Weed sampling protocol. (A) Inverted W-pattern used to place quadrats and count weeds in fields. (B) Relative area of quarter section (65 ha) covered by the sampling pattern and potential sample locations surveyed based on random starting points along two roads.
Data from each of the weed surveys were summarized in terms of frequency, field uniformity, density, and relative abundance index (RAI) as described in Thomas (1985). Frequency is the number of fields in which a particular weed species occurred, expressed as a percentage of the total number of fields surveyed. Field uniformity is the number of quadrats in which a particular weed species occurred, expressed as a percentage of all the quadrats surveyed. Field density is a measure of the number of plants of a weed species counted in a quadrat averaged over all fields surveyed. RAI is a combination of the frequency, field uniformity, and field density values for each weed species. Each of the component values is expressed as a percentage of the total for all weed species and summed, such that the total of the RAI values for all weed species equals 300. In this paper, weed species with RAI values of 10.0 or more were classed as abundant, with values of 1.0 to 9.9 as common, with values of 0.1 to 0.9 as occasional, and with values less than 0.1 as rare.
Thomas and Leeson 47
Contemporary surveys in other provinces Provincial surveys have been conducted only once in Québec, New
Brunswick, Prince Edward Island, and Nova Scotia (Table 1). In two of the provinces, Ontario and British Columbia, a complete provincial dataset is lacking since only a portion of the geographic area has been surveyed. These single point-in-time surveys have provided good baseline data on the status of weed species in each province but they need to be repeated to document any changes that may have taken place. A time series of weed surveys exists only in Alberta, Saskatchewan, and Manitoba. With the exception of Québec, surveys in the other provinces have used a similar methodology to that used in the Prairie Provinces. Although quadrat data comparative to the other provinces were collected in the Québec survey, it was not reported (Doyon et al. 1982). Therefore, the only results available for Québec were based on a complete inventory of all the weed species present in each surveyed field.
Early comprehensive surveys Early weed surveys in the prairie region, conducted prior to the initiation of
the current monitoring program in 1973, can be used for a retrospective analysis of the general trends in weed species’ frequencies. Unlike the provincial weed surveys discussed in the previous section, these early surveys conducted between 1897 and 1965 were not based on probability sampling methods (Table 2). Although each of these early surveys used a different non-probability sampling method to provide information on the weed flora, they are still useful for identifying gross changes. This retrospective examination of trends is primarily based on three comprehensive surveys (Fletcher 1897, Groh and Frankton 1949, Alex 1966) in the prairies. The surveys by Bedford and Lee (1910) and by Mason (1932) were not included because they contained information on the distribution and prevalence of only 12 and seven species, respectively.
The arable weed species dataset for the early 1900s used in this paper was a composite list of species found in Manitoba and Northwest Territories (Districts of Assiniboia, Saskatchewan, and Alberta). Species occurring in the area were extracted from a checklist of prominent weed species in Canada compiled by Fletcher (1897) and supplemented with information from similar lists compiled by the Manitoba Department of Agriculture and Immigration (1897), the Government of the Northwest Territories (1898), and Smith (1917). Prominent weeds were defined as species that received the most frequent inquiries for identification and control methods (Fletcher 1897). Some species were marked as “bad weeds” that needed to be destroyed wherever they were found. The checklists also included information on the habitats were the weed species were prevalent. If a weed species was only found in roadside, garden, lawn, meadow, pasture, prairie, hay land, waste land, farm yard or railway habitats it was excluded from the dataset. Many of the scientific names used in these check lists were outdated and had to be cross-

48 Tracking long-term changes in the arable weed flora of Canada
referenced with synonyms given in Scoggan (1957), Scoggan (1978-1979), and Darbyshire (2003) to confirm inclusion in the dataset.
Table 1. Contemporary weed surveys of major annual crops in Canada. Provincea
Year
Fields
Field sampling pattern
Species
Source
No. No. BCb 1978-80 1128 Inverted W 131 Thomas and Wise (1983a) AB 1973-77 3109 Representative
locationsc 44d Thomas and Wise (1985)
AB 1987-89 1086 Inverted W 134 Maurice et al. (1990) AB 1997 665 Inverted W 102 Thomas et al. (1998a) AB 2001 1141 Inverted W 105 Leeson et al. (2002) SK 1976-79 4385 Inverted W 157 Thomas and Wise (1983b) SK 1986 1145 Inverted W 111 Thomas and Wise (1987) SK 1995 1178 Inverted W 122 Thomas et al. (1996) SK 2003 2036 Inverted W 116 Leeson et al. (2003) MB 1978-81 1384 Inverted W 127 Thomas and Wise (1984) MB 1986 498 Inverted W 95 Thomas and Wise (1988) MB 1997 451 Inverted W 90 Thomas et al. (1998b) MB 2002 629 Inverted W 98 Leeson et al. (2002) ONe 1988-89 159 Inverted W 91 Frick et al. (1990) QC 1980-84 3314 Complete
inventory 313 Doyon et al. (1986a, 1986b, 1986c,
1986d, 1986e), Lemieux et al. (1988a, 1988b)
NB 1986-87 187 Inverted W 81 Thomas et al. (1994) PEI 1978-79 536 Inverted W 85 Ivany (1980), Ivany and Thomas
(1983) NS 1999 154 Inverted W 89 Thomas (unpublished)
a BC - British Columbia, AB - Alberta, SK - Saskatchewan, MB - Manitoba, ON - Ontario, QC - Québec, NB - New Brunswick, PEI - Prince Edward Island, NS - Nova Scotia.
b Only the Peace River Region of British Columbia was surveyed. c The area sampled in five quadrats was the same as the inverted W sampling
pattern. d Data limited to 44 frequently occurring species. e Only south-western Ontario was surveyed.
The Canadian Weed Survey was conducted by the Canada Department of Agriculture between 1922 and 1947 (Groh and Frankton 1949). It is best described as a reconnaissance survey providing thorough, but broadly generalized, information on the presence of weed species and their frequency of occurrence in sites across Canada. Only sites that were easily accessed along major routes of travel, usually railroads, were sampled. This type of method is convenience, haphazard or accidental sampling (Statistics Canada 2006). A survey site included

Thomas and Leeson 49
all types of habitats in the agricultural landscape. Rarely were only farm fields surveyed at a site. It was assumed that most weeds of farm land would also be present in waysides, towns, railway lines, and yards and that these types of habitats would reflect the weed flora found in the fields. Data for frequently occurring weed species were grouped by dividing the country into eight belts of longitude, which did not correspond to provincial boundaries. To create a dataset comparable to other decades, three longitudinal belts extending from 92° to 115° were selected to represent the Prairie Provinces; however, these belts included sites from north-western Ontario and excluded sites from the Peace River region of north-western Alberta. Locations of infrequently occurring species were also listed in the report (Groh and Frankton 1949). Species were extracted from both the frequent and infrequent lists and only species known to occur in arable fields were retained. Table 2. Early comprehensive weed surveys in the prairie region.
Area Year Sites Methodology Species Source No. No. MB, NWTa 1897-1917 -b Checkist 121 Fletcher (1897), Manitoba
Department of Agriculture and Immigration (1897), Government of the Northwest Territories (1898), Smith (1917)
AB, SK, MBc 1922-47 983 Reconnaissance 250 Groh and Frankton (1949) AB, SK, MB 1963-65 484 Census 189d Alex (1966)
a NWT - Northwest Territories (Districts of Assiniboia, Saskatchewan and Alberta). b The number of sites is not applicable when using the checklist methodology. c Included sampling locations between 92° and 115° longitude from north-western
Ontario to western Alberta excluding surveys from the Peace River region in the north-west.
d Data on 45 weed species were requested but respondents had the option of including additional species.
The first attempt to obtain quantitative information on the distribution, density, and proportional area infested by weed species on cultivated land across the Prairie Provinces was organized by Alex (1966). Lacking resources for a detailed survey of fields, he chose to conduct a census of about 500 municipal units in the Prairie Provinces. Agricultural Representatives, District Agrologists, and/or Weed Supervisors were asked to complete a survey form for their municipal unit in 1963 or 1964, indicating the presence or absence of 45 frequently occurring weed species listed on the form. In 1965, Alex conducted field surveys in most of the municipal units from which reports had not been received. If a weed species was present in a municipal unit, then the respondents were asked to assign it to one of four classes based on the proportion of cultivated land that was occupied by the weed species in
50 Tracking long-term changes in the arable weed flora of Canada
each of three density levels. The distribution and abundance of the 45 weed species were mapped and published in a report (Alex 1966). Space was also provided on the form to add other species but these data were not included in the report. We recently gained access to these records and now have a dataset that contains information for 144 additional weed species. The data for these additional species are likely less reliable than that for the 45 species because respondents may not have provided information even if a weed species was present, particularly if it was rare or their knowledge of the distribution of the species was incomplete. The 1960s data are presented in this paper as percentages of cultivated acres calculated as the sum of median value of the area of infestation class at each density level in each municipal unit multiplied by the total cultivated acres for that municipal unit and divided by the total cultivated area in the survey.
Determination of origins of surveyed species Species were classed as either native or alien to the survey area based on
Darbyshire (2003) as the primary and Scoggan (1978-1979) as the secondary source. The precise identification of some closely-related species is difficult in the field. In these cases, the species entry in the survey list may include two or more species. These species complexes may contain only native species, only alien species, or both alien and native species. For example, Scoggan (1978-1979) considers lamb’s-quarters, Chenopodium album L., as a species complex with several closely related microspecies. The complex includes the alien species, C. album and the native net-seeded lamb’s-quarters, C. berlandieri Moq. Furthermore, two varieties of C. album are recognized; variety album has ascending branches and variety lanceolatum (Muhl.) Coss. & Germ. has spreading branches. When known species complexes were reported in the surveys as single species, each species known to be present in the area was counted separately; however, abundance was assigned to the dominant member of the complex.
Changes in the weed flora of the Prairie Provinces
An increase in the percentage of alien species in the arable weed flora in the Prairie Provinces from the 1900s to 2000s is clearly illustrated (Figure 2), despite differences in sampling methodologies. In the early 1900s, the native prairie region had been recently broken and cleared for agricultural production. Many native species persisted in the cultivated fields in part because of the inclusion of hay crops in the rotation, a general lack of attention to weed management, and limited options for control. By the 1940s, the number of alien species exceeded the number of natives and the percentage of aliens remained constant from the 1940s to the 1970s. From the 1970s to the 1990s, the percentage of aliens increased because of a decline in the number of native species. This trend is correlated with intensification of crop production in the prairie region but the specific factors responsible for the decline in

Thomas and Leeson 51
native species are unknown. Many new weed species were included in the weed surveys in the 1940s, with twice as many aliens as natives added. From the 1970s onward, less than 20 new species were added by subsequent surveys and in the most recent survey only two native species and four alien species (all volunteer crops) were recorded for the first time.
Num
ber o
f wee
d sp
ecie
s
020406080
100120140160
1900s 1940s 60s 70s 80s 90s 00sWeed survey decade
01020304050607080
Perc
ent a
lien
spec
ies (
)
New alien
AlienNative
New native
Num
ber o
f wee
d sp
ecie
s
020406080
100120140160
1900s 1940s 60s 70s 80s 90s 00sWeed survey decade
01020304050607080
Perc
ent a
lien
spec
ies (
)
New alien
AlienNative
New native
Figure 2. Number of alien and native species and percentage of aliens found in weed surveys in the Prairie Provinces. The sampling methodology differed among the early surveys (1900s to 1960s) and was different from the contemporary surveys (1970s to 2000s). The sampling intensity differed between each survey; therefore, comparisons of total numbers of species should not be made between decades. The new alien and new native weed species were not reported in any of the preceding surveys.
Only four of the 36 species classed as abundant or common in the 2000s provincial surveys are native: field horsetail, pineappleweed, foxtail barley, and thyme-leaved spurge (Table 3). Many of the alien species have been part of the weed flora since the 1900s and several have remained more or less constant in frequency during this period. Sixteen of the abundant and common species were either absent from the 1900s surveys or were not recognized as weeds of annual crops. Dandelion, field horsetail, perennial sow-thistle, flixweed, pineappleweed, common groundsel, and foxtail barley were frequently found in annual crops by the 1940s. Barnyard grass and flax were less frequent but were also recorded for the first time in annual crops in the 1940s. Kochia, narrow-leaved hawk’s-beard, clover species, and thyme-leaved spurge were first recorded in annual crops in the 1960s survey. Cleavers did not appear until the 1970s surveys and has increased to a frequency of 12% in the 2000s. In addition, two volunteer crops, wheat and barley,
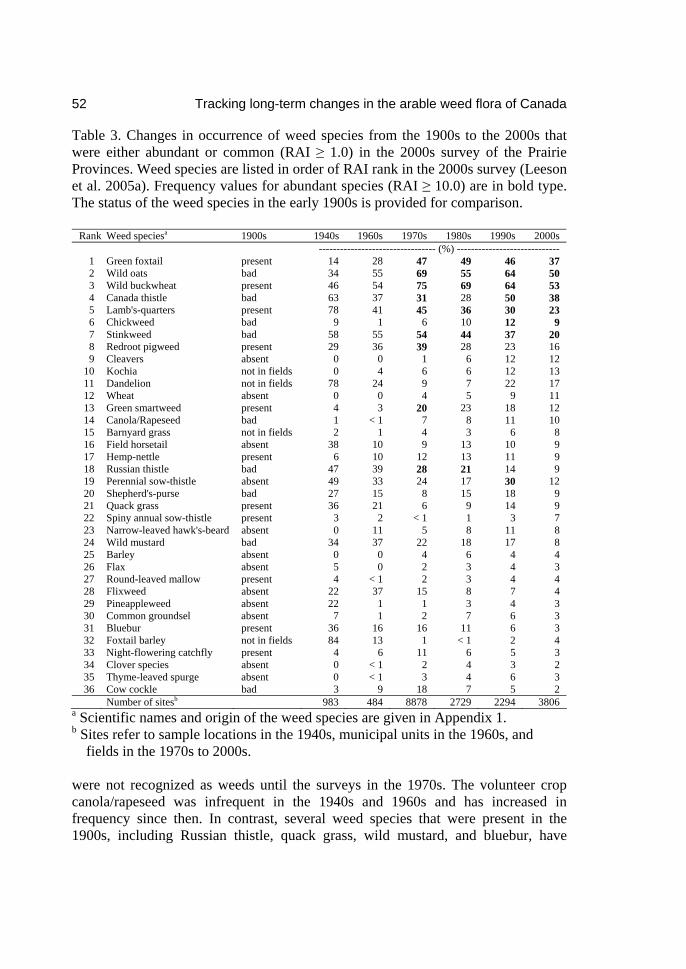
52 Tracking long-term changes in the arable weed flora of Canada
Table 3. Changes in occurrence of weed species from the 1900s to the 2000s that were either abundant or common (RAI ≥ 1.0) in the 2000s survey of the Prairie Provinces. Weed species are listed in order of RAI rank in the 2000s survey (Leeson et al. 2005a). Frequency values for abundant species (RAI ≥ 10.0) are in bold type. The status of the weed species in the early 1900s is provided for comparison.
Rank Weed speciesa 1900s 1940s 1960s 1970s 1980s 1990s 2000s --------------------------------- (%) -----------------------------
1 Green foxtail present 14 28 47 49 46 37 2 Wild oats bad 34 55 69 55 64 50 3 Wild buckwheat present 46 54 75 69 64 53 4 Canada thistle bad 63 37 31 28 50 38 5 Lamb's-quarters present 78 41 45 36 30 23 6 Chickweed bad 9 1 6 10 12 9 7 Stinkweed bad 58 55 54 44 37 20 8 Redroot pigweed present 29 36 39 28 23 16 9 Cleavers absent 0 0 1 6 12 12
10 Kochia not in fields 0 4 6 6 12 13 11 Dandelion not in fields 78 24 9 7 22 17 12 Wheat absent 0 0 4 5 9 11 13 Green smartweed present 4 3 20 23 18 12 14 Canola/Rapeseed bad 1 < 1 7 8 11 10 15 Barnyard grass not in fields 2 1 4 3 6 8 16 Field horsetail absent 38 10 9 13 10 9 17 Hemp-nettle present 6 10 12 13 11 9 18 Russian thistle bad 47 39 28 21 14 9 19 Perennial sow-thistle absent 49 33 24 17 30 12 20 Shepherd's-purse bad 27 15 8 15 18 9 21 Quack grass present 36 21 6 9 14 9 22 Spiny annual sow-thistle present 3 2 < 1 1 3 7 23 Narrow-leaved hawk's-beard absent 0 11 5 8 11 8 24 Wild mustard bad 34 37 22 18 17 8 25 Barley absent 0 0 4 6 4 4 26 Flax absent 5 0 2 3 4 3 27 Round-leaved mallow present 4 < 1 2 3 4 4 28 Flixweed absent 22 37 15 8 7 4 29 Pineappleweed absent 22 1 1 3 4 3 30 Common groundsel absent 7 1 2 7 6 3 31 Bluebur present 36 16 16 11 6 3 32 Foxtail barley not in fields 84 13 1 < 1 2 4 33 Night-flowering catchfly present 4 6 11 6 5 3 34 Clover species absent 0 < 1 2 4 3 2 35 Thyme-leaved spurge absent 0 < 1 3 4 6 3 36 Cow cockle bad 3 9 18 7 5 2
Number of sitesb 983 484 8878 2729 2294 3806 a Scientific names and origin of the weed species are given in Appendix 1. b Sites refer to sample locations in the 1940s, municipal units in the 1960s, and
fields in the 1970s to 2000s. were not recognized as weeds until the surveys in the 1970s. The volunteer crop canola/rapeseed was infrequent in the 1940s and 1960s and has increased in frequency since then. In contrast, several weed species that were present in the 1900s, including Russian thistle, quack grass, wild mustard, and bluebur, have
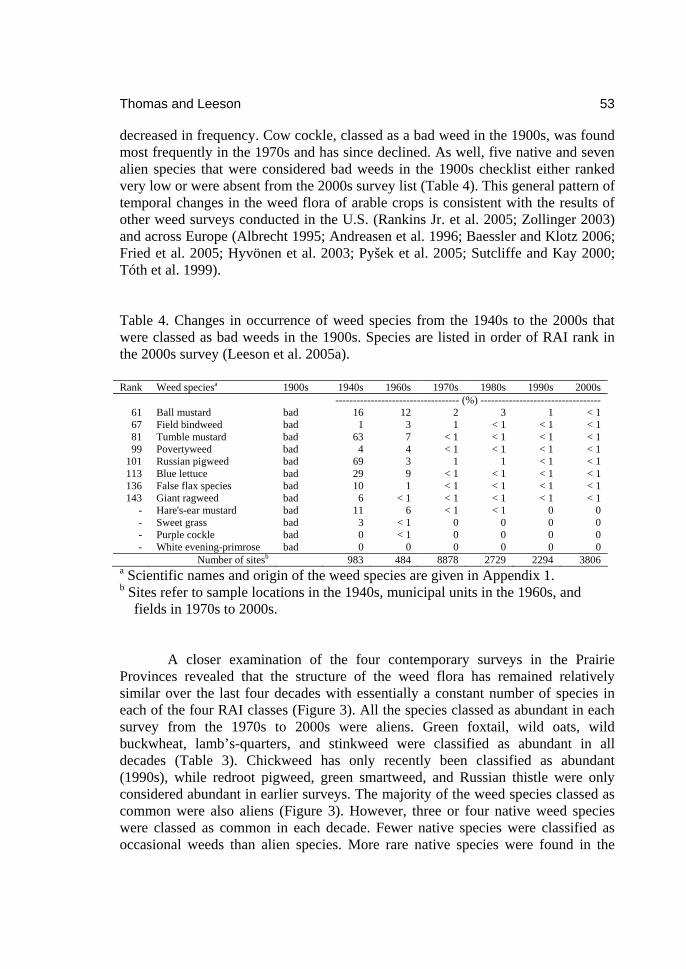
Thomas and Leeson 53
decreased in frequency. Cow cockle, classed as a bad weed in the 1900s, was found most frequently in the 1970s and has since declined. As well, five native and seven alien species that were considered bad weeds in the 1900s checklist either ranked very low or were absent from the 2000s survey list (Table 4). This general pattern of temporal changes in the weed flora of arable crops is consistent with the results of other weed surveys conducted in the U.S. (Rankins Jr. et al. 2005; Zollinger 2003) and across Europe (Albrecht 1995; Andreasen et al. 1996; Baessler and Klotz 2006; Fried et al. 2005; Hyvönen et al. 2003; Pyšek et al. 2005; Sutcliffe and Kay 2000; Tóth et al. 1999). Table 4. Changes in occurrence of weed species from the 1940s to the 2000s that were classed as bad weeds in the 1900s. Species are listed in order of RAI rank in the 2000s survey (Leeson et al. 2005a). Rank Weed speciesa 1900s 1940s 1960s 1970s 1980s 1990s 2000s
----------------------------------- (%) ---------------------------------- 61 Ball mustard bad 16 12 2 3 1 < 1 67 Field bindweed bad 1 3 1 < 1 < 1 < 1 81 Tumble mustard bad 63 7 < 1 < 1 < 1 < 1 99 Povertyweed bad 4 4 < 1 < 1 < 1 < 1
101 Russian pigweed bad 69 3 1 1 < 1 < 1 113 Blue lettuce bad 29 9 < 1 < 1 < 1 < 1 136 False flax species bad 10 1 < 1 < 1 < 1 < 1 143 Giant ragweed bad 6 < 1 < 1 < 1 < 1 < 1
- Hare's-ear mustard bad 11 6 < 1 < 1 0 0 - Sweet grass bad 3 < 1 0 0 0 0 - Purple cockle bad 0 < 1 0 0 0 0 - White evening-primrose bad 0 0 0 0 0 0 Number of sitesb 983 484 8878 2729 2294 3806
a Scientific names and origin of the weed species are given in Appendix 1. b Sites refer to sample locations in the 1940s, municipal units in the 1960s, and
fields in 1970s to 2000s.
A closer examination of the four contemporary surveys in the Prairie Provinces revealed that the structure of the weed flora has remained relatively similar over the last four decades with essentially a constant number of species in each of the four RAI classes (Figure 3). All the species classed as abundant in each survey from the 1970s to 2000s were aliens. Green foxtail, wild oats, wild buckwheat, lamb’s-quarters, and stinkweed were classified as abundant in all decades (Table 3). Chickweed has only recently been classified as abundant (1990s), while redroot pigweed, green smartweed, and Russian thistle were only considered abundant in earlier surveys. The majority of the weed species classed as common were also aliens (Figure 3). However, three or four native weed species were classed as common in each decade. Fewer native species were classified as occasional weeds than alien species. More rare native species were found in the
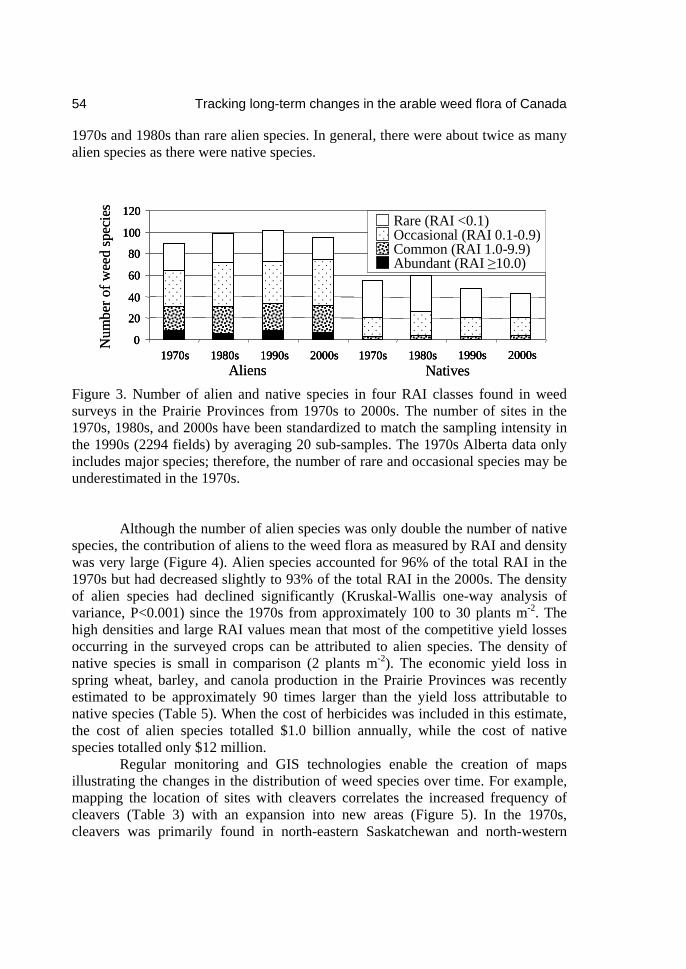
54 Tracking long-term changes in the arable weed flora of Canada
1970s and 1980s than rare alien species. In general, there were about twice as many alien species as there were native species.
0
20
40
60
80
100
120
1970s 1980s 1990s 2000s 1970s 1980s 1990s 2000sNatives
Num
ber o
f wee
d sp
ecie
s
Aliens
Rare (RAI <0.1)Occasional (RAI 0.1-0.9)Common (RAI 1.0-9.9)Abundant (RAI ≥10.0)
0
20
40
60
80
100
120
1970s 1980s 1990s 2000s 1970s 1980s 1990s 2000s0
20
40
60
80
100
120
1970s 1980s 1990s 2000s 1970s 1980s 1990s 2000sNatives
Num
ber o
f wee
d sp
ecie
s
Aliens
Rare (RAI <0.1)Occasional (RAI 0.1-0.9)Common (RAI 1.0-9.9)Abundant (RAI ≥10.0)
Rare (RAI <0.1)Occasional (RAI 0.1-0.9)Common (RAI 1.0-9.9)Abundant (RAI ≥10.0)
Figure 3. Number of alien and native species in four RAI classes found in weed surveys in the Prairie Provinces from 1970s to 2000s. The number of sites in the 1970s, 1980s, and 2000s have been standardized to match the sampling intensity in the 1990s (2294 fields) by averaging 20 sub-samples. The 1970s Alberta data only includes major species; therefore, the number of rare and occasional species may be underestimated in the 1970s.
Although the number of alien species was only double the number of native species, the contribution of aliens to the weed flora as measured by RAI and density was very large (Figure 4). Alien species accounted for 96% of the total RAI in the 1970s but had decreased slightly to 93% of the total RAI in the 2000s. The density of alien species had declined significantly (Kruskal-Wallis one-way analysis of variance, P<0.001) since the 1970s from approximately 100 to 30 plants m-2. The high densities and large RAI values mean that most of the competitive yield losses occurring in the surveyed crops can be attributed to alien species. The density of native species is small in comparison (2 plants m-2). The economic yield loss in spring wheat, barley, and canola production in the Prairie Provinces was recently estimated to be approximately 90 times larger than the yield loss attributable to native species (Table 5). When the cost of herbicides was included in this estimate, the cost of alien species totalled $1.0 billion annually, while the cost of native species totalled only $12 million.
Regular monitoring and GIS technologies enable the creation of maps illustrating the changes in the distribution of weed species over time. For example, mapping the location of sites with cleavers correlates the increased frequency of cleavers (Table 3) with an expansion into new areas (Figure 5). In the 1970s, cleavers was primarily found in north-eastern Saskatchewan and north-western
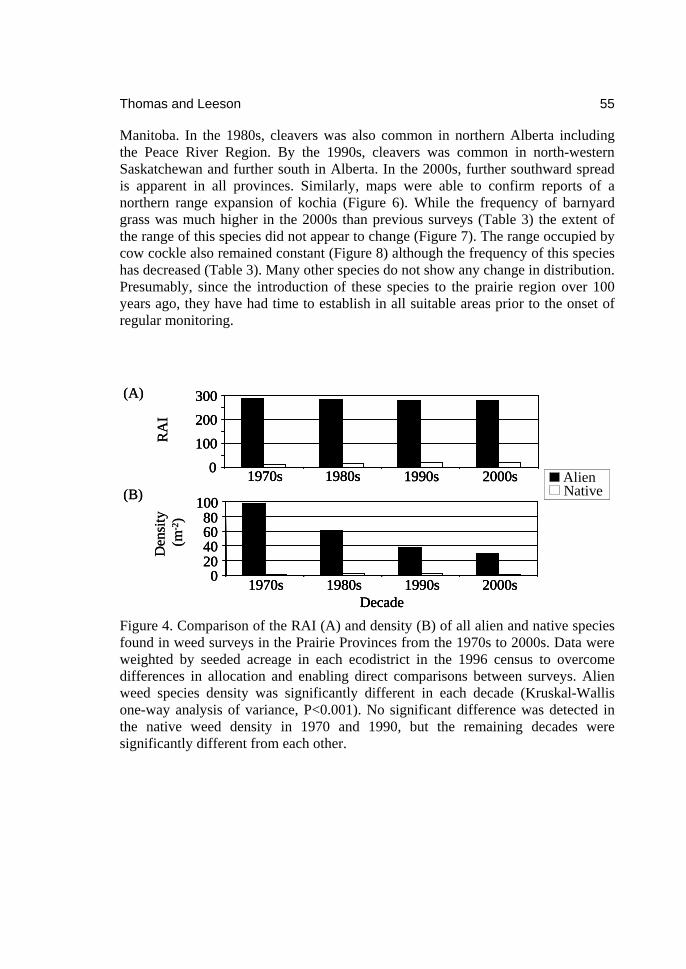
Thomas and Leeson 55
Manitoba. In the 1980s, cleavers was also common in northern Alberta including the Peace River Region. By the 1990s, cleavers was common in north-western Saskatchewan and further south in Alberta. In the 2000s, further southward spread is apparent in all provinces. Similarly, maps were able to confirm reports of a northern range expansion of kochia (Figure 6). While the frequency of barnyard grass was much higher in the 2000s than previous surveys (Table 3) the extent of the range of this species did not appear to change (Figure 7). The range occupied by cow cockle also remained constant (Figure 8) although the frequency of this species has decreased (Table 3). Many other species do not show any change in distribution. Presumably, since the introduction of these species to the prairie region over 100 years ago, they have had time to establish in all suitable areas prior to the onset of regular monitoring.
AlienNative
RA
ID
ensi
ty(m
-2)
0
100200
300
1970s 1980s 1990s 2000s
Decade
020406080
100
1970s 1980s 1990s 2000s
(A)
(B)AlienNativeAlienNative
RA
ID
ensi
ty(m
-2)
0
100200
300
1970s 1980s 1990s 2000s
Decade
020406080
100
1970s 1980s 1990s 2000s
0
100200
300
1970s 1980s 1990s 2000s
Decade
020406080
100
1970s 1980s 1990s 2000s
(A)
(B)
Figure 4. Comparison of the RAI (A) and density (B) of all alien and native species found in weed surveys in the Prairie Provinces from the 1970s to 2000s. Data were weighted by seeded acreage in each ecodistrict in the 1996 census to overcome differences in allocation and enabling direct comparisons between surveys. Alien weed species density was significantly different in each decade (Kruskal-Wallis one-way analysis of variance, P<0.001). No significant difference was detected in the native weed density in 1970 and 1990, but the remaining decades were significantly different from each other.

56 Tracking long-term changes in the arable weed flora of Canada
Table 5. Economic impact of alien and native weed species in wheat, barley, and canola production in the Prairie Provinces. Cost estimates are based on unpublished data obtained from a farm management questionnaire distributed in conjunction with the 2000s prairie weed survey (Leeson et al. 2005a). Source of costsa Alien weed species Native weed species ($ million) ($ million) Herbicides 739.9 8.0 Application of herbicides 172.0 3.1 Yield loss from weeds 117.9 1.3 Total costs 1029.8 12.4
a Table derived from a poster presentation by J. Y. Leeson, A. G. Thomas, and J. T. O=Donovan at the annual meeting of the Canadian Weed Science Society, November 27, 2006 in Victoria, BC.
Prevalence of alien species in contemporary provincial surveys
The combined contemporary provincial surveys have recorded 457 weed species. Over half (237) are alien species, representing 22% of the 1084 alien species estimated to exist in Canada (Darbyshire 2002). The sampling intensity (number of fields) differed among the surveys (Table 1); therefore, comparisons of total numbers of species should not be made between provinces. The relationship between the number of fields surveyed and the number of species follows a typical species-area curve (Figure 9) with additional rare species found as the number of fields surveyed increases. The importance of using similar sampling methods is emphasized by the position of the Québec survey in relation to the fitted curve. The Québec survey has more species than would be expected because the sampling intensity within each field was much greater than in the other provinces.
Aliens represented 52% of the total species in the combined surveys compared with 55 to 83% in the individual provinces (Figure 10). This apparent discrepancy can be explained by the fact that the alien species are more frequently found in fields and have a broader geographic distribution than the native species that are rarer and have more restricted distributions. For example, 54% of the native weed species were found in only one province compared to only 28% of the alien weed species (data not presented). Generally, provinces with higher sampling intensities are represented by a higher proportion of natives, indicating that the rarer species detected with increased sampling tend to be natives more often than aliens (Figure 10). In comparison to the estimate that 80% of agricultural weed species are aliens given in the invasive alien species strategy for Canada (Government of Canada 2004), our value of 52% is lower. This difference may be due to the inclusion of many less common native species in the survey datasets.
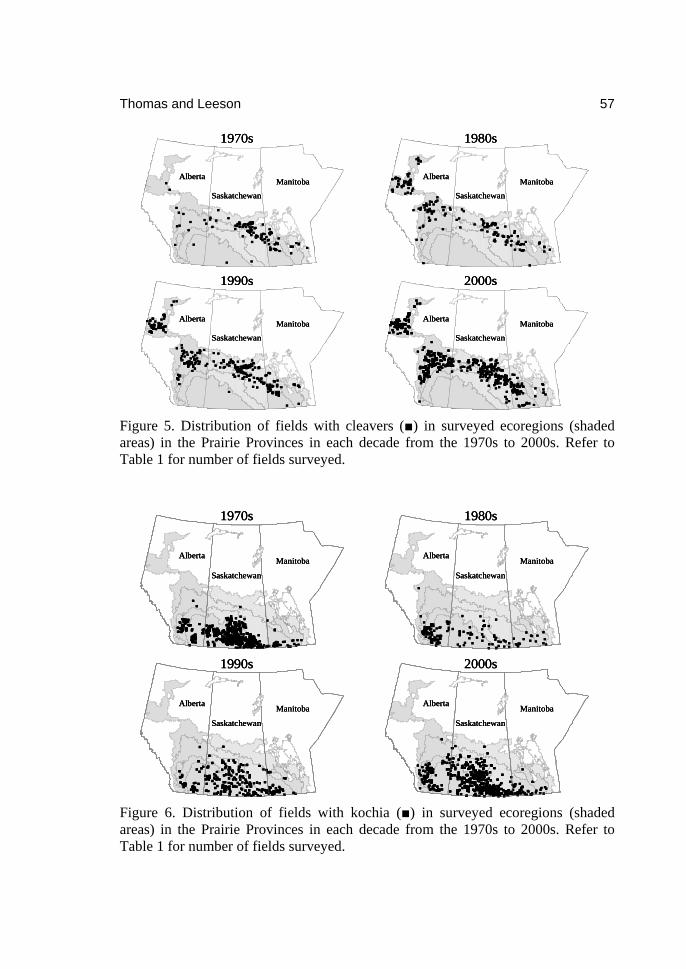
Thomas and Leeson 57
■ ■■■■■■■■
■ ■■■■■■■■■
■■■■■ ■■■■■■■■■■■
■■■■■■■■ ■■ ■■■
■■■■■■■ ■■ ■■■■
■
■■■■■ ■■■■■■■■■■■■ ■■■■■■■■■ ■■■■
■■■ ■■■■■■■■■■■ ■■■■■■■■ ■■■■■■■■■ ■■■■■ ■■ ■■■■
■ ■■■■■■■
■■■■■■■■■■
■■
■■■■■■■■
■
■■■■■■■■ ■■■■■■■■■■■
■■■■
■
■■■
■
■
■■■■■■■■■
■■■■■ ■■■■■■■
■■■■
■■■■ ■■■■■
■■■■■■■ ■
■
■
■■■
■■■
■
■■■■■■■■■■■■■ ■■
■■■■■
■■■■■■■■■ ■■ ■■■
■
■■■■■■■■■■■■■ ■■■ ■■
■
■■■■■■■■■■
■■■■■■■■■
■■■
■■
■■■■■
■■■■■■
■■■■■■■■■■
■■ ■ ■■■
■■■■■■
■■■■■■■■■■■
■■■■■■■■■■■■■■■■■
■■■■■■■■■■■
■
■
■
■ ■
■■■■■
■■
■
■■
■■■
■■■■
■
■■■■■■■■■■■
■■■■■■■■■■■■■■■■■■■■■
■■■
■■■■
■
■■
■■■■■■■■■■
■■
■
■■
■
■ ■■
■■■■
■
■■
■
■■■■■■■■
■
■■■
■
■■■■■ ■■■
■
■
■
■■■■
■■
■
■■
■
■
■
■
■
■■
■
■■■■■ ■■■
■■
■■■■■■
■■
■■■
■■■■■
■■■
■
■
■
■
■■
■■■■■
■
■■
■■
■■■
■
■
■
■■
■■ ■■
■
■ ■■
■
■■
■
■■■■■
■■■
■■■■■■
■■
■■■ ■
■
■■■■■■■
■
■
■
■■■■■■■■■■■■■■ ■
■■■■■■
■■■■
■■■■■■■■■■ ■■■■■■■■
■■■■■■■■■■■■■■■■■■■■■■■■■■■■■■■
■ ■■■■■■■
■■■■■■■■■■■■ ■■■■
■
■
■■■■■■■■■■■■
■
■
■■■
■
■■■■■■■
■
■■■
■■■
■■■
■
■ ■■■■■■ ■■■■■■■ ■■■■■■ ■■■
■■■■
■■■■■■■■■■■■ ■■■■■■
■■■■■ ■■ ■■■■ ■■■ ■■■■ ■■■■ ■■■■■■ ■■ ■
■■■
■■
■
■
■
■■■
■
■
■
■
■
■
■
■
■
■
■■
■
■
■
■■
■■
■
■
■
■
■■
■ ■
■
■
■
■
■
■
■
■
■■■
■
■
■■
■■
■
■ ■■■
■■
■
■
■
■■
■
■
■
■
■
■
■
■■
■
■
■■
■
■■
■
■
■
■
■
■
■
■
■
■
■
■
■
■
■
■
■
■
■
■
■
■■
■
■■
■
■
■
■
■ ■
■■■■■■
■■■■ ■■■■■ ■■■■■■■
■■■
■■■■■■■
■■■■■■■
■■■■■■■■■■■■■■■
■
■■■■■■ ■■■■■■
■
■■
■■■■■■ ■■■ ■ ■■ ■■■■■■■■■
■■
■
■■■■ ■ ■■■
■
1970s
1990s
1980s
2000s
Alberta
Saskatchewan
Manitoba Alberta
Saskatchewan
Manitoba
Alberta
Saskatchewan
Manitoba Alberta
Saskatchewan
Manitoba
■ ■■■■■■■■
■ ■■■■■■■■■
■■■■■ ■■■■■■■■■■■
■■■■■■■■ ■■ ■■■
■■■■■■■ ■■ ■■■■
■
■■■■■ ■■■■■■■■■■■■ ■■■■■■■■■ ■■■■
■■■ ■■■■■■■■■■■ ■■■■■■■■ ■■■■■■■■■ ■■■■■ ■■ ■■■■
■ ■■■■■■■
■■■■■■■■■■
■■
■■■■■■■■
■
■■■■■■■■ ■■■■■■■■■■■
■■■■
■
■■■
■
■
■■■■■■■■■
■■■■■ ■■■■■■■
■■■■
■■■■ ■■■■■
■■■■■■■ ■
■
■
■■■
■■■
■
■■■■■■■■■■■■■ ■■
■■■■■
■■■■■■■■■ ■■ ■■■
■
■■■■■■■■■■■■■ ■■■ ■■
■
■■■■■■■■■■
■■■■■■■■■
■■■
■■
■■■■■
■■■■■■
■■■■■■■■■■
■■ ■ ■■■
■■■■■■
■■■■■■■■■■■
■■■■■■■■■■■■■■■■■
■■■■■■■■■■■
■
■
■
■ ■
■■■■■
■■
■
■■
■■■
■■■■
■
■■■■■■■■■■■
■■■■■■■■■■■■■■■■■■■■■
■■■
■■■■
■
■■
■■■■■■■■■■
■■
■
■■
■ ■■■■■■■■
■ ■■■■■■■■■
■■■■■ ■■■■■■■■■■■
■■■■■■■■ ■■ ■■■
■■■■■■■ ■■ ■■■■
■
■■■■■ ■■■■■■■■■■■■ ■■■■■■■■■ ■■■■
■■■ ■■■■■■■■■■■ ■■■■■■■■ ■■■■■■■■■ ■■■■■ ■■ ■■■■
■ ■■■■■■■
■■■■■■■■■■
■■
■■■■■■■■
■
■■■■■■■■ ■■■■■■■■■■■
■■■■
■
■■■
■
■
■■■■■■■■■
■■■■■ ■■■■■■■
■■■■
■■■■ ■■■■■
■■■■■■■ ■
■
■
■■■
■■■
■
■■■■■■■■■■■■■ ■■
■■■■■
■■■■■■■■■ ■■ ■■■
■
■■■■■■■■■■■■■ ■■■ ■■
■
■■■■■■■■■■
■■■■■■■■■
■■■
■■
■■■■■
■■■■■■
■■■■■■■■■■
■■ ■ ■■■
■■■■■■
■■■■■■■■■■■
■■■■■■■■■■■■■■■■■
■
■■■
■
■■■
■
■
■■■■■■■■■
■■■■■ ■■■■■■■
■■■■
■■■■ ■■■■■
■■■■■■■ ■
■
■
■■■
■■■
■
■■■■■■■■■■■■■ ■■
■■■■■
■■■■■■■■■ ■■ ■■■
■
■■■■■■■■■■■■■ ■■■ ■■
■
■■■■■■■■■■
■■■■■■■■■
■■■
■■
■■■■■
■■■■■■
■■■■■■■■■■
■■ ■ ■■■
■■■■■■
■■■■■■■■■■■
■■■■■■■■■■■■■■■■■
■■■■■■■■■■■
■
■
■
■ ■
■■■■■
■■
■
■■
■■■
■■■■
■
■■■■■■■■■■■
■■■■■■■■■■■■■■■■■■■■■
■■■
■■■■
■
■■
■■■■■■■■■■
■■
■
■■
■
■ ■■
■■■■
■
■■
■
■■■■■■■■
■
■■■
■
■■■■■ ■■■
■
■
■
■■■■
■■
■
■■
■
■
■
■
■
■■
■
■■■■■ ■■■
■■
■■■■■■
■■
■■■
■■■■■
■■■
■
■
■
■
■■
■■■■■
■
■■
■■
■■■
■
■
■
■■
■■ ■■
■
■ ■■
■
■■
■
■■■■■
■■■
■■■■■■
■■
■■■ ■
■
■■■■■■■
■
■
■
■■■■■■■■■■■■■■ ■
■■■■■■
■■■■
■■■■■■■■■■ ■■■■■■■■
■■■■■■■■■■■■■■■■■■■■■■■■■■■■■■■
■ ■■■■■■■
■■■■■■■■■■■■ ■■■■
■
■
■■■■■■■■■■■■
■
■
■■■
■
■■■■■■■
■
■■■
■■■
■■■
■
■ ■■
■■■■
■
■■
■
■■■■■■■■
■
■■■
■
■■■■■ ■■■
■
■
■
■■■■
■■
■
■■
■
■
■
■
■
■■
■
■■■■■ ■■■
■■
■■■■■■
■■
■■■
■■■■■
■■■
■
■
■
■
■■
■■■■■
■
■■
■■
■■■
■
■
■
■■
■■ ■■
■
■ ■■
■
■■
■
■■■■■
■■■
■■■■■■
■■
■■■ ■
■
■■■■■■■
■
■
■
■■■■■■■■■■■■■■ ■
■■■■■■
■■■■
■■■■■■■■■■ ■■■■■■■■
■■■■■■■■■■■■■■■■■■■■■■■■■■■■■■■
■ ■■■■■■■
■■■■■■■■■■■■ ■■■■
■
■
■■■■■■■■■■■■
■
■
■■■
■
■■■■■■■
■
■■■
■■■
■■■
■
■ ■■■■■■ ■■■■■■■ ■■■■■■ ■■■
■■■■
■■■■■■■■■■■■ ■■■■■■
■■■■■ ■■ ■■■■ ■■■ ■■■■ ■■■■ ■■■■■■ ■■ ■
■■■
■■
■
■
■
■■■
■
■
■
■
■
■
■
■
■
■
■■
■
■
■
■■
■■
■
■
■
■
■■
■ ■
■
■
■
■
■
■
■
■
■■■
■
■
■■
■■
■
■ ■■■
■■
■
■
■
■■
■
■
■
■
■
■
■
■■
■
■
■■
■
■■
■
■
■
■
■
■
■
■
■
■
■
■
■
■
■
■
■
■
■ ■■■■■■ ■■■■■■■ ■■■■■■ ■■■
■■■■
■■■■■■■■■■■■ ■■■■■■
■■■■■ ■■ ■■■■ ■■■ ■■■■ ■■■■ ■■■■■■ ■■ ■
■■■
■■
■
■
■
■■■
■
■
■
■
■
■
■
■
■
■
■■
■
■
■
■■
■■
■
■
■
■
■■
■ ■
■
■
■
■
■
■
■
■
■■■
■
■
■■
■■
■
■ ■■■
■■
■
■
■
■■
■
■
■
■
■
■
■
■■
■
■
■■
■
■■
■
■
■
■
■
■
■
■
■
■
■
■
■
■
■
■
■
■
■
■
■
■■
■
■■
■
■
■
■
■ ■
■■■■■■
■■■■ ■■■■■ ■■■■■■■
■■■
■■■■■■■
■■■■■■■
■■■■■■■■■■■■■■■
■
■■■■■■ ■■■■■■
■
■■
■■■■■■ ■■■ ■ ■■ ■■■■■■■■■
■■
■
■■■■ ■ ■■■
■
■
■
■
■
■■
■
■■
■
■
■
■
■ ■
■■■■■■
■■■■ ■■■■■ ■■■■■■■
■■■
■■■■■■■
■■■■■■■
■■■■■■■■■■■■■■■
■
■■■■■■ ■■■■■■
■
■■
■■■■■■ ■■■ ■ ■■ ■■■■■■■■■
■■
■
■■■■ ■ ■■■
■
1970s
1990s
1980s
2000s
Alberta
Saskatchewan
Manitoba Alberta
Saskatchewan
Manitoba
Alberta
Saskatchewan
Manitoba Alberta
Saskatchewan
Manitoba
1970s
1990s
1980s
2000s
Alberta
Saskatchewan
ManitobaAlberta
Saskatchewan
Manitoba Alberta
Saskatchewan
ManitobaAlberta
Saskatchewan
Manitoba
Alberta
Saskatchewan
ManitobaAlberta
Saskatchewan
Manitoba Alberta
Saskatchewan
ManitobaAlberta
Saskatchewan
Manitoba
Figure 5. Distribution of fields with cleavers (■) in surveyed ecoregions (shaded areas) in the Prairie Provinces in each decade from the 1970s to 2000s. Refer to Table 1 for number of fields surveyed.
■■■■■■■
■■■■■■ ■■■■■
■■■ ■■ ■■■■ ■■ ■■ ■■■■ ■■ ■■ ■ ■■■■ ■■ ■■ ■■■■ ■■■ ■■ ■■■■■
■ ■■ ■
■
■■
■
■ ■■■■
■
■
■■ ■■ ■
■
■
■■■
■
■■■
■■■■
■■■
■■■■
■
■■■
■■
■
■■ ■■
■ ■■ ■■■■
■
■
■
■■■
■
■
■ ■
■■■
■■
■■■■
■
■
■■
■
■
■
■■
■
■■■
■■
■
■
■
■
■■■■
■■■■■
■
■■■■■■■■
■ ■■■
■■■■■■■■
■■
■ ■■■■■■
■■■■■■ ■■■■■■■ ■■■
■■■■■■■■■■ ■
■■■■■■■■ ■■■■■■■■■■■■■■■■■■■■■■■■■■■■■■■■■■■■■■■ ■■■■■■■■■■■■■■■■■■■■■■■■■■■■■■■■■■■■■■■■■■■■■
■■■■■■■■■■■■■■■■■■■■■■■■■■■■■■■■■■■■■ ■■■■■■■■■■■■■■■■■■■■■■■
■■■■■■■■■■■
■ ■■■■■■■■■■■■■■■■■■■■■■■■■■■■■■■■■ ■■■■■■■■■■■■■■■■■
■■■■
■■■■■■■ ■■
■■■■■■■■■■■■■■■■■■ ■■■■■■■■■■■■■■■■■■■■■■■■■ ■■■■■■■■■■■■■■■■■■■■■■■■■■■■■■■■■■■■■■■■■■■
■■■■■■■ ■■■■■■■■■■■■■■■■■■■■■■■■■■ ■■■■■■■■■■■■■■■■ ■■■■■■■■■■■■■■■■■■■
■ ■■■■■
■■■■■■■■■■■■■
■■■
■
■ ■■■■■■■■■ ■ ■■■■■■■ ■■ ■■■
■ ■■■
■■
■
■
■
■
■■■■
■■■■ ■■■
■■■■■■■■■■■■■■■■■■■
■■■■■ ■■
■
■■■■■■■■■■■ ■■■■■■■■
■■
■■ ■■■
■■
■ ■■■■
■■■■
■
■
■ ■■■
■
■■■■■
■
■
■■■
■
■■■■
■
■■■■■■■
■
■■
■■
■
■
■
■
■
■■
■■■■■■
■
■■■■■■
■■
■■
■ ■■
■■■■
■
■■
■ ■■■
■■
■■ ■
■
■■■■■■
■■■■
■
■■■■
■
■■
■
■■
■■■■■■
■■■
■■
■
■■ ■■■
■
■ ■■■
■■ ■
■
■■■
■■■
■■■■■■■■■■
■■■
■
■■■ ■■
■
■■■■ ■■
■
■■■■■
■
■
■■
■■■
■■■
■■■■ ■■■■
■■ ■■■■ ■
■■■■
■■
■■■
■■■■■■■■
■■■■ ■■■■ ■■■■■■■■■■■■■■■■ ■■■ ■■ ■■■■ ■■■■■■■
■■■ ■
■■■
■■■■■■■■■■■ ■■
■■■■■■■■■■ ■■
■■■■■■■■■■■■■■
■■■■■ ■■■■■■ ■■■■■■■■■■ ■■■
■■ ■■■■■■
■■ ■■■ ■■ ■■
■■■
■
■■■ ■■ ■■
■■■■■■
■■■■■■■■■■■■ ■■■■■■■■
■■■■■ ■■ ■■■■■■■■■■■■■■■■
■■ ■■■ ■■■■
■■■■■■■ ■■■■■■■ ■■ ■■■
■■■■■ ■■■■■
■■■■■■
■■■■■■■■■■
■■■■■
■■■
■■■
■■■■■■■■■■■■■■
■■■■ ■■■■■■■■
■■■■■■■■■■■■■■■
■■■■■■
■■■■■ ■■■
■■ ■■■■
■■
■
■■■■■■
■■
■■■■
■■■ ■■■■■■■
■
■
■
■■■
■■■■ ■■■■■■■
■■■■■■ ■
■■■■
■■■■■■■■■■
■■■■■■■■ ■■■■
■■■■■■
■■■ ■■■■■■■■■■■■■
■■■■■
■ ■■■
■■
■
■■■■■■■■■
■
■■
■■
■■■■■■■
■■■■■■■■■■■■■■■■
■■■■■■■■■■■■■ ■
1970s
1990s
1980s
2000s
Alberta
Saskatchewan
Manitoba Alberta
Saskatchewan
Manitoba
Alberta
Saskatchewan
Manitoba Alberta
Saskatchewan
Manitoba
■■■■■■■
■■■■■■ ■■■■■
■■■ ■■ ■■■■ ■■ ■■ ■■■■ ■■ ■■ ■ ■■■■ ■■ ■■ ■■■■ ■■■ ■■ ■■■■■
■ ■■ ■
■
■■
■
■ ■■■■
■
■
■■ ■■ ■
■
■
■■■
■
■■■
■■■■
■■■
■■■■
■
■■■
■■
■
■■ ■■
■ ■■ ■■■■
■
■
■
■■■
■
■
■ ■
■■■
■■
■■■■
■
■
■■
■
■
■
■■
■
■■■
■■
■
■
■
■
■■■■■■■■
■■■■■■ ■■■■■
■■■ ■■ ■■■■ ■■ ■■ ■■■■ ■■ ■■ ■ ■■■■ ■■ ■■ ■■■■ ■■■ ■■ ■■■■■
■ ■■ ■
■
■■
■
■ ■■■■
■
■
■■ ■■ ■
■
■
■■■
■
■■■
■■■■
■■■
■■■■
■
■■■
■■
■
■■ ■■
■ ■■ ■■■■
■
■
■
■■■
■
■
■ ■
■■■
■■
■■■■
■
■
■■
■
■
■
■■
■
■■■
■■
■
■
■
■
■■■■
■■■■■
■
■■■■■■■■
■ ■■■
■■■■■■■■
■■
■ ■■■■■■
■■■■■■ ■■■■■■■ ■■■
■■■■■■■■■■ ■
■■■■■■■■ ■■■■■■■■■■■■■■■■■■■■■■■■■■■■■■■■■■■■■■■ ■■■■■■■■■■■■■■■■■■■■■■■■■■■■■■■■■■■■■■■■■■■■■
■■■■■■■■■■■■■■■■■■■■■■■■■■■■■■■■■■■■■ ■■■■■■■■■■■■■■■■■■■■■■■
■■■■■■■■■■■
■ ■■■■■■■■■■■■■■■■■■■■■■■■■■■■■■■■■ ■■■■■■■■■■■■■■■■■
■■■■
■■■■■■■ ■■
■■■■■■■■■■■■■■■■■■ ■■■■■■■■■■■■■■■■■■■■■■■■■ ■■■■■■■■■■■■■■■■■■■■■■■■■■■■■■■■■■■■■■■■■■■
■■■■■■■ ■■■■■■■■■■■■■■■■■■■■■■■■■■ ■■■■■■■■■■■■■■■■ ■■■■■■■■■■■■■■■■■■■
■ ■■■■■
■■■■■■■■■■■■■
■■■
■
■ ■■■■■■■■■ ■ ■■■■■■■ ■■ ■■■
■ ■■■
■■
■
■■■
■■■■■
■
■■■■■■■■
■ ■■■
■■■■■■■■
■■
■ ■■■■■■
■■■■■■ ■■■■■■■ ■■■
■■■■■■■■■■ ■
■■■■■■■■ ■■■■■■■■■■■■■■■■■■■■■■■■■■■■■■■■■■■■■■■ ■■■■■■■■■■■■■■■■■■■■■■■■■■■■■■■■■■■■■■■■■■■■■
■■■■■■■■■■■■■■■■■■■■■■■■■■■■■■■■■■■■■ ■■■■■■
■■■■■
■
■■■■■■■■
■ ■■■
■■■■■■■■
■■
■ ■■■■■■
■■■■■■ ■■■■■■■ ■■■
■■■■■■■■■■ ■
■■■■■■■■ ■■■■■■■■■■■■■■■■■■■■■■■■■■■■■■■■■■■■■■■ ■■■■■■■■■■■■■■■■■■■■■■■■■■■■■■■■■■■■■■■■■■■■■
■■■■■■■■■■■■■■■■■■■■■■■■■■■■■■■■■■■■■ ■■■■■■■■■■■■■■■■■■■■■■■
■■■■■■■■■■■
■ ■■■■■■■■■■■■■■■■■■■■■■■■■■■■■■■■■ ■■■■■■■■■■■■■■■■■
■■■■
■■■■■■■ ■■
■■■■■■■■■■■■■■■■■■ ■■■■■■■■■■■■■■■■■■■■■■■■■ ■■■■■■■■■■■■■■■■■■■■■■■■■■■■■■■■■■■■■■■■■■■
■■■■■■■ ■■■■■■■■■■■■
■■■■■■■■■■■■■■■■■■■■■■■■■■■■■■■
■ ■■■■■■■■■■■■■■■■■■■■■■■■■■■■■■■■■ ■■■■■■■■■■■■■■■■■
■■■■
■■■■■■■ ■■
■■■■■■■■■■■■■■■■■■ ■■■■■■■■■■■■■■■■■■■■■■■■■ ■■■■■■■■■■■■■■■■■■■■■■■■■■■■■■■■■■■■■■■■■■■
■■■■■■■ ■■■■■■■■■■■■■■■■■■■■■■■■■■ ■■■■■■■■■■■■■■■■ ■■■■■■■■■■■■■■■■■■■
■ ■■■■■
■■■■■■■■■■■■■
■■■
■
■ ■■■■■■■■■ ■ ■■■■■■■ ■■ ■■■
■ ■■■
■■
■
■
■
■
■■■■
■■■■ ■■■
■■■■■■■■■■■■■■■■■■■
■■■■■ ■■
■
■■■■■■■■■■■ ■■■■■■■■
■■
■■ ■■■
■■
■ ■■■■
■■■■
■
■
■ ■■■
■
■■■■■
■
■
■■■
■
■■■■
■
■■■■■■■
■
■■
■■
■
■
■
■
■
■■
■■■■■■
■
■■■■■■
■■
■■
■ ■■
■■■■
■
■■
■ ■■■
■■
■■ ■
■
■■■■■■
■■■■
■
■■■■
■
■■
■
■■
■■■■■■
■■■
■■
■
■■ ■■■
■
■ ■■■
■■ ■
■
■■■
■■■
■■■■■■■■■■
■■■
■
■■■ ■■
■
■■■■ ■■
■
■■■■■
■
■
■■
■■■
■■■
■
■
■
■■■■
■■■■ ■■■
■■■■■■■■■■■■■■■■■■■
■■■■■ ■■
■
■■■■■■■■■■■ ■■■■■■■■
■■
■■ ■■■
■■
■ ■■■■
■■■■
■
■
■ ■■■
■
■■■■■
■
■
■■■
■
■■■■
■
■■■■■■■
■
■■
■■
■
■
■
■
■
■■
■■■■■■
■
■■■■■■
■■
■■
■ ■■
■■■■
■
■■
■ ■■■
■■
■■ ■
■
■■■■■■
■■■■
■
■■■■
■
■■
■
■■
■■■■■■
■■■
■■
■
■■ ■■■
■
■
■
■
■
■■■■
■■■■ ■■■
■■■■■■■■■■■■■■■■■■■
■■■■■ ■■
■
■■■■■■■■■■■ ■■■■■■■■
■■
■■ ■■■
■■
■ ■■■■
■■■■
■
■
■ ■■■
■
■■■■■
■
■
■■■
■
■■■■
■
■■■■■■■
■
■■
■■
■
■
■
■
■
■■
■■■■■■
■
■■■■■■
■■
■■
■ ■■
■■■■
■
■■
■ ■■■
■■
■■ ■
■
■■■■■■
■■■■
■
■■■■
■
■■
■
■■
■■■■■■
■■■
■■
■
■■ ■■■
■
■ ■■■
■■ ■
■
■■■
■■■
■■■■■■■■■■
■■■
■
■■■ ■■
■
■■■■ ■■
■
■■■■■
■
■
■■
■■■
■■■
■■■■ ■■■■
■■ ■■■■ ■
■■■■
■■
■■■
■■■■■■■■
■■■■ ■■■■ ■■■■■■■■■■■■■■■■ ■■■ ■■ ■■■■ ■■■■■■■
■■■ ■
■■■
■■■■■■■■■■■ ■■
■■■■■■■■■■ ■■
■■■■■■■■■■■■■■
■■■■■ ■■■■■■ ■■■■■■■■■■ ■■■
■■ ■■■■■■
■■ ■■■ ■■ ■■
■■■
■
■■■ ■■ ■■
■■■■■■
■■■■■■■■■■■■ ■■■■■■■■
■■■■■ ■■ ■■■■■■■■■■■■■■■■
■■ ■■■ ■■■■
■■■■■■■ ■■■■■■■ ■■ ■■■
■■■■■ ■■■■■
■■■■■■
■■■■■■■■■■
■■■■■
■■■
■■■
■■■■■■■■■■■■■■
■■■■ ■■■■■■■■
■■■■■■■■■■■■■■■
■■■■■■
■■■■■ ■■■
■■ ■■■■
■■
■
■■■■■■
■■
■■■■
■■■ ■■■■■■■
■
■
■
■■■
■■■■ ■■■■■■■
■■■■■■ ■
■■■■
■■■■■■■■■■
■■■■■■■■ ■■■■
■■■■■■
■■■ ■■■■■■■■■■■■■
■■■■■
■ ■■■
■■
■
■■■■■■■■■
■
■■
■■
■■■■■■■
■■■■■■■■■■■■■■■■
■■■■■■■■■■■■■ ■
■■■■ ■■■■
■■ ■■■■ ■
■■■■
■■
■■■
■■■■■■■■
■■■■ ■■■■ ■■■■■■■■■■■■■■■■ ■■■ ■■ ■■■■ ■■■■■■■
■■■ ■
■■■
■■■■■■■■■■■ ■■
■■■■■■■■■■ ■■
■■■■■■■■■■■■■■
■■■■■ ■■■■■■ ■■■■■■■■■■ ■■■
■■ ■■■■■■
■■ ■■■ ■■ ■■
■■■
■
■■■ ■■ ■■
■■■■■■
■■■■■■■■■■■■ ■■■■■■■■
■
■■■■ ■■■■
■■ ■■■■ ■
■■■■
■■
■■■
■■■■■■■■
■■■■ ■■■■ ■■■■■■■■■■■■■■■■ ■■■ ■■ ■■■■ ■■■■■■■
■■■ ■
■■■
■■■■■■■■■■■ ■■
■■■■■■■■■■ ■■
■■■■■■■■■■■■■■
■■■■■ ■■■■■■ ■■■■■■■■■■ ■■■
■■ ■■■■■■
■■ ■■■ ■■ ■■
■■■
■
■■■ ■■ ■■
■■■■■■
■■■■■■■■■■■■ ■■■■■■■■
■■■■■ ■■ ■■■■■■■■■■■■■■■■
■■ ■■■ ■■■■
■■■■■■■ ■■■■■■■ ■■ ■■■
■■■■■ ■■■■■
■■■■■■
■■■■■■■■■■
■■■■■
■■■
■■■
■■■■■■■■■■■■■■
■■■■ ■■■■■■■■
■■■■■■■■■■■■■■■
■■■■■■
■■■■■ ■■■
■■ ■■■■
■■
■
■■■■■■
■■
■■■■
■■■ ■■■■■■■
■
■
■
■■■
■■■■ ■■■■■■■
■■■■■■ ■
■■■
■■■■ ■■ ■■■■■■■■■■■■■■■■
■■ ■■■ ■■■■
■■■■■■■ ■■■■■■■ ■■ ■■■
■■■■■ ■■■■■
■■■■■■
■■■■■■■■■■
■■■■■
■■■
■■■
■■■■■■■■■■■■■■
■■■■ ■■■■■■■■
■■■■■■■■■■■■■■■
■■■■■■
■■■■■ ■■■
■■ ■■■■
■■
■
■■■■■■
■■
■■■■
■■■ ■■■■■■■
■
■
■
■■■
■■■■ ■■■■■■■
■■■■■■ ■
■■■■
■■■■■■■■■■
■■■■■■■■ ■■■■
■■■■■■
■■■ ■■■■■■■■■■■■■
■■■■■
■ ■■■
■■
■
■■■■■■■■■
■
■■
■■
■■■■■■■
■■■■■■■■■■■■■■■■
■■■■■■■■■■■■■ ■
1970s
1990s
1980s
2000s
Alberta
Saskatchewan
Manitoba Alberta
Saskatchewan
Manitoba
Alberta
Saskatchewan
Manitoba Alberta
Saskatchewan
Manitoba
1970s
1990s
1980s
2000s
Alberta
Saskatchewan
ManitobaAlberta
Saskatchewan
Manitoba Alberta
Saskatchewan
ManitobaAlberta
Saskatchewan
Manitoba
Alberta
Saskatchewan
ManitobaAlberta
Saskatchewan
Manitoba Alberta
Saskatchewan
ManitobaAlberta
Saskatchewan
Manitoba
Figure 6. Distribution of fields with kochia (■) in surveyed ecoregions (shaded areas) in the Prairie Provinces in each decade from the 1970s to 2000s. Refer to Table 1 for number of fields surveyed.
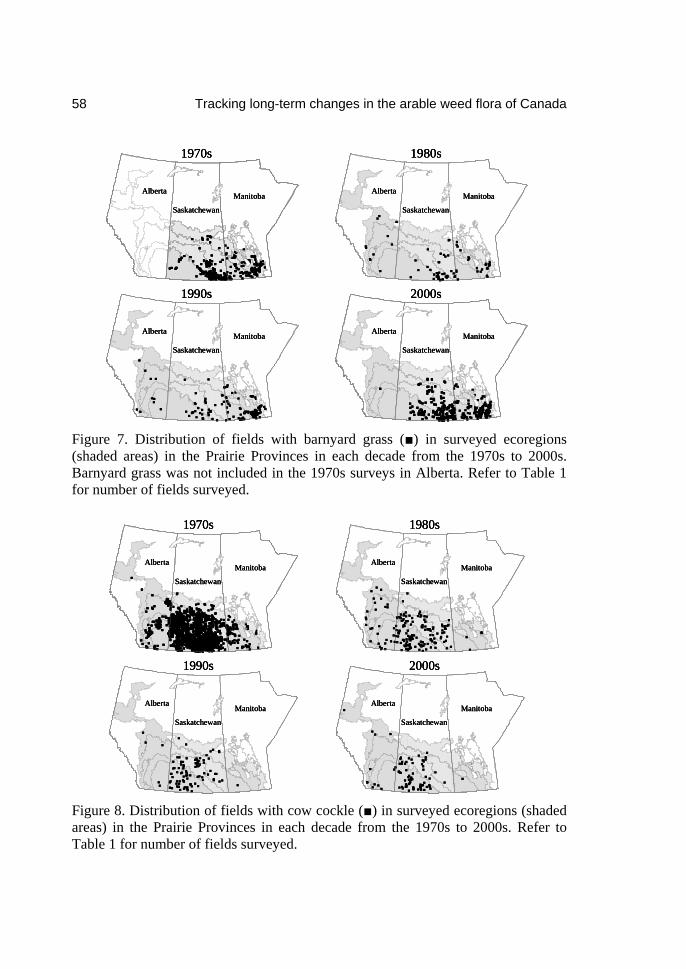
58 Tracking long-term changes in the arable weed flora of Canada
■ ■■■■■■■ ■■■■
■■■■■■
■■■■■■■■■■■■■■■■■■■■■■■■■■■■■■■■■■■■■■■■■■■■■■■■■■■■■■■■■■■■■
■■■■■■■■■■■■■■■■■■■■■■■■■■■■■■■■■■■■■■■ ■■■
■■■■■■■■
■ ■■
■
■■■■■■■■■■
■■■■■■ ■■■ ■■■■
■■■■
■
■■■■■
■■■■■■ ■■
■■■■ ■ ■■■■
■■■ ■■ ■■■■■■■■■■■■■■■■■■ ■■■■■ ■■■■■
■■■■■■ ■■■ ■■■■■■■■■■■■■■■■■ ■■■ ■■■■■■■■■■■■■■■■■■■■■■■■■■■■■■
■■■ ■
■■■
■■ ■ ■■■■ ■■■■■■
■
■ ■■■■■■■
■■■■
■■■■
■■■ ■ ■■■ ■ ■■■■ ■■■■■■■■
■■■■
■■■■■■ ■■ ■■ ■■■■■■■ ■■■ ■■ ■■ ■■ ■■■■■
■■■■■
■■
■
■
■
■■
■■
■
■
■
■
■■■■■■ ■■■■
■■■ ■■■
■■ ■
■■■■■■■■■■■■■
■■■■ ■■■■■■■
■■■■■■■■■ ■■■■■ ■■■■■ ■■■ ■■■ ■■■■■
■■■■■■■■■■■■■■■ ■
■■■■■■■■■■■■■ ■■■■■■■■ ■■
■■■
■■■■■
■■■■■ ■■ ■■■■■ ■■■■■■
■■■■ ■■■■■■■ ■■■■■■■■■ ■■ ■■
■■■■
■■■
■■■ ■■■
■■■■■
■■■■■■■■■■■■■■■■■■■■■■ ■■■■■■
■■
■■■■■■■
■■■■■■■■■■
■■■
■■■■
■■■■■■■■■■
■■■■■■■■
■■■■■■■■■■■■■■■■■■
■■■■■■■
■■■■■■■
■■■■■■ ■
■■■■■
■■■■■■■■■
■
■■■■■■■■■■■■■
■
■
■■ ■■
■■■
■■■
■
■■
■■■
■■ ■
■
■
■■■
■
■
■■
■■
■
■
■■■■■■■■■■■
■
■
■■■
■
■■
■■■
■
■■ ■■■■■■■■■■■■■■■■■■■ ■■■■■■■■■
■■
■■
■■
■■■■■
■■
■ ■■■■
■■
■■
■■
■
■
■■
■■■■
■■■■
■
■■■
■
■
■
■ ■
■■■
■
■■
■■■■
■
■
1970s
1990s
1980s
2000s
Alberta
Saskatchewan
Manitoba Alberta
Saskatchewan
Manitoba
Alberta
Saskatchewan
Manitoba Alberta
Saskatchewan
Manitoba
■ ■■■■■■■ ■■■■
■■■■■■
■■■■■■■■■■■■■■■■■■■■■■■■■■■■■■■■■■■■■■■■■■■■■■■■■■■■■■■■■■■■■
■■■■■■■■■■■■■■■■■■■■■■■■■■■■■■■■■■■■■■■ ■■■
■■■■■■■■
■ ■■
■
■■■■■■■■■■
■■■■■■ ■■■ ■■■■
■■■■
■
■■■■■
■■■■■■ ■■
■■■■ ■ ■■■■
■■■ ■■ ■■■■■■■■■■■■■■■■■■ ■■■■■ ■■■■■
■■■■■■ ■■■ ■■■■■■■■■■■■■■■■■ ■■■ ■■■■■■■■■■■■■■■■■■■■■■■■■■■■■■
■■■ ■
■■■
■■ ■ ■■■■ ■■■■■■
■
■ ■■■■■■■
■■■■
■ ■■■■■■■ ■■■■
■■■■■■
■■■■■■■■■■■■■■■■■■■■■■■■■■■■■■■■■■■■■■■■■■■■■■■■■■■■■■■■■■■■■
■■■■■■■■■■■■■■■■■■■■■■■■■■■■■■■■■■■■■■■ ■■■
■■■■■■■■
■ ■■
■
■■■■■■■■■■
■■■■■■ ■■■ ■■■■
■■■■
■
■■■■■
■■■■■■ ■■
■■■■ ■ ■■■■
■■■ ■■ ■■■■■■■■■
■ ■■■■■■■ ■■■■
■■■■■■
■■■■■■■■■■■■■■■■■■■■■■■■■■■■■■■■■■■■■■■■■■■■■■■■■■■■■■■■■■■■■
■■■■■■■■■■■■■■■■■■■■■■■■■■■■■■■■■■■■■■■ ■■■
■■■■■■■■
■ ■■
■
■■■■■■■■■■
■■■■■■ ■■■ ■■■■
■■■■
■
■■■■■
■■■■■■ ■■
■■■■ ■ ■■■■
■■■ ■■ ■■■■■■■■■■■■■■■■■■ ■■■■■ ■■■■■
■■■■■■ ■■■ ■■■■■■■■■■■■■■■■■ ■■■ ■■■■■■■■■■■■■■■■■■■■■■■■■■■■■■
■■■ ■
■■■
■■ ■ ■■■■ ■■■■■■
■
■ ■■■■■■■
■■■■
■■■■
■■■ ■ ■■■ ■ ■■■■ ■■■■■■■■
■■■■
■■■■■■ ■■ ■■ ■■■■■■■ ■■■ ■■ ■■ ■■ ■■■■■
■■■■■
■■
■
■
■
■■
■■
■
■
■
■
■■■■
■■■ ■ ■■■ ■ ■■■■ ■■■■■■■■
■■■■
■■■■■■ ■■ ■■ ■■■■■■■ ■■■ ■■ ■■ ■■ ■■■■■
■■■■■
■■
■
■
■
■■
■■
■
■
■
■
■■■■■■ ■■■■
■■■ ■■■
■■ ■
■■■■■■■■■■■■■
■■■■ ■■■■■■■
■■■■■■■■■ ■■■■■ ■■■■■ ■■■ ■■■ ■■■■■
■■■■■■■■■■■■■■■ ■
■■■■■■■■■■■■■ ■■■■■■■■ ■■
■■■
■■■■■
■■■■■ ■■ ■■■■■ ■■■■■■
■■■■ ■■■■■■■ ■■■■■■■■■ ■■ ■■
■■■■
■■■
■■■ ■■■
■■■■■
■■■■■■■■■■■■■■■■■■■■■■ ■■■■■■
■■
■■■■■■■
■■■■■■■■■■
■■■
■■■■
■■■■■■■■■■
■■■■■■■■
■■■■■■■■■■■■■■■■■■
■■■■■■■
■■■■■■■
■■■■■■ ■
■■■■■
■■■■■■■■■
■
■■■■■■■■■■■■■
■
■
■■ ■■
■■■
■■■
■
■■■■■■ ■■■■
■■■ ■■■
■■ ■
■■■■■■■■■■■■■
■■■■ ■■■■■■■
■■■■■■■■■ ■■■■■ ■■■■■ ■■■ ■■■ ■■■■■
■■■■■■■■■■■■■■■ ■
■■■■■■■■■■■■■ ■■■■■■■■ ■■
■■■
■■■■■
■■■■■ ■■ ■■■■■ ■■■■■■
■■■■ ■■■■■■■ ■■■■■■■■■ ■■ ■■
■■■■
■■■
■■■ ■■■
■■■■■
■■■■■■■■■■■■■■■■■
■■■■■■ ■■■■
■■■ ■■■
■■ ■
■■■■■■■■■■■■■
■■■■ ■■■■■■■
■■■■■■■■■ ■■■■■ ■■■■■ ■■■ ■■■ ■■■■■
■■■■■■■■■■■■■■■ ■
■■■■■■■■■■■■■ ■■■■■■■■ ■■
■■■
■■■■■
■■■■■ ■■ ■■■■■ ■■■■■■
■■■■ ■■■■■■■ ■■■■■■■■■ ■■ ■■
■■■■
■■■
■■■ ■■■
■■■■■
■■■■■■■■■■■■■■■■■■■■■■ ■■■■■■
■■
■■■■■■■
■■■■■■■■■■
■■■
■■■■
■■■■■■■■■■
■■■■■■■■
■■■■■■■■■■■■■■■■■■
■■■■■■■
■■■■■■■
■■■■■■ ■
■■■■■
■■■■■■■■■
■
■■■■■■■■■■■■■
■
■
■■ ■■
■■■
■■■
■
■■
■■■
■■ ■
■
■
■■■
■
■
■■
■■
■
■
■■■■■■■■■■■
■
■
■■■
■
■■
■■■
■
■■ ■■■■■■■■■■■■■■■■■■■ ■■■■■■■■■
■■
■■
■■
■■■■■
■■
■ ■■■■
■■
■■
■■
■
■
■■
■■■■
■■■■
■
■■■
■
■
■
■ ■
■■■
■
■■
■■■■
■
■
■■
■■■
■■ ■
■
■
■■■
■
■
■■
■■
■
■
■■■■■■■■■■■
■
■
■■■
■
■■
■■■
■
■■ ■■■■■■■■■■■■■■■■■■■ ■■■■■■■■■
■■
■■
■■
■■■■■
■■
■ ■■■■
■■
■■
■■
■
■
■■
■■■■
■■■■
■
■■■
■
■
■
■ ■
■■■
■
■■
■■■■
■
■
1970s
1990s
1980s
2000s
Alberta
Saskatchewan
Manitoba Alberta
Saskatchewan
Manitoba
Alberta
Saskatchewan
Manitoba Alberta
Saskatchewan
Manitoba
1970s
1990s
1980s
2000s
Alberta
Saskatchewan
ManitobaAlberta
Saskatchewan
Manitoba Alberta
Saskatchewan
ManitobaAlberta
Saskatchewan
Manitoba
Alberta
Saskatchewan
ManitobaAlberta
Saskatchewan
Manitoba Alberta
Saskatchewan
ManitobaAlberta
Saskatchewan
Manitoba
Figure 7. Distribution of fields with barnyard grass (■) in surveyed ecoregions (shaded areas) in the Prairie Provinces in each decade from the 1970s to 2000s. Barnyard grass was not included in the 1970s surveys in Alberta. Refer to Table 1 for number of fields surveyed.
■■■■■
■■■■■■■■■■■■■■■■■■
■■■■■ ■
■
■
■■■■
■
■■■
■
■■
■■■
■
■■
■
■
■
■ ■■■■■
■
■■
■■■■
■■■■■■■■■■■■■■■■■■■■■■■
■
■
■■■■■■■■
■
■■■■■■■■■■■■■■■■■■■■■■■■■■■■■■■■■■■■■■■■■ ■■■■■■■■■■■■■■■■■■■■■■■■■■■■■■■■■■■■■■■■
■■■■■■■■■■■■■■■■■■■■■■■■■■■■■■■ ■■■■■■■■■■■■■■■■■■■■■■■■■■■■■■■■■■■■■■■■■■■■■■■■■■■■■■■■■■■■■■■■■■■■■■■■■■■■■■■■■■■■■■■
■■■ ■■■■■■■■■■■■■■■■■■■■■■■■■■■■■■■■■■■■■■■■■■■■■■■■■■■■■■■■■■■■■■■■■■■■■■■■■■■■■■■■■■
■■■■■■■■ ■■■■■■■■■■■■■■■■■■■■■■■■■■■■■■■■■■■■■■■■■■■■■■■■■■■■■■■■■■■■■■■■■
■■■■■■■ ■■■■■■■■■■■■■■■■■■■■■■■■■■■■■■■■■■■
■■■■■■■■■■■■■■■■■■ ■■■■
■■■■■■■■■■■■■■■■■■■■■■■■■■■■■■■■■■■■■■■■■■■■■■■■■■■■■■■■■■■■■■■
■■ ■■■■■■■■■■■■■■■■■■■■■■■■■■■■■■■■■■■■■■■■■■■■■■■■■■■■■■■■■
■■■ ■■■■■■■■■■■■■■■■■ ■■■■■■■■■■■■ ■■■■■■■■■■■■■■■■■■■■■ ■■■■■■■■■■■■■■■■■■■■■■■■■■■■■■
■■■■■■■■■■
■■■■■■■■■■■■■ ■■■■■■■■■■■■■■■■■■■■■■■■■■■■■■■■■■■■■■■■■■■■■■■■■■■■■■■■■■■■■■■■■■■■■■■■■■■■■■■■■■■■■■■■■■■■■■■■■■■■■■■■■
■■■■■■■■■■■■■■■■■■■■■■■■■■■■■■■■■■■■■■■■■■■■■■■■■■■■■■■■■■■■■■■■■■■■■■■■■■■ ■■■■■■■■■■■■■■■■■■■■■■■■■■■■■■■■■■■■■■■■ ■■■■■■■■■■■■■■■■■■■■■■■■■■■■■■■■■■■■■■■
■■■■■■■■■■■■ ■■■■■■■■■■■■■■■■■■■■■■■■■■■ ■■■■■■■■■■■■■■■■■■■■■■■■
■■■■■■■■■ ■■■■■■■■■■■■■■■■■■■■■■■■■■■■■■■■■■■■■■■■■■■■■■■■■■■■■■■■■■■■■■■■■■■
■■■ ■■■■■■■■■■■■■■■■■■
■■■■■■■■■■■■■■■■■■■■■■■ ■■■■■■■■■■■■■■■■■■■■■■■■■■■■■■■■■■■■■■■■■■■ ■■■■■■■■■■■■■■■■■■■
■■■■■■■■■■■■■■■■ ■■■■■■■■■■■■■■■
■ ■■■■■■■■■■ ■■■■■■■■■■■■■■■■■■■■■■■■■■■■■■■■■■■■■■■■■■■
■■■■
■■■■■■■■■■ ■■■■■■■■■■■■■■■■■■■ ■■■■■■■■■■■■ ■■■■■■■■■■■■■■■■■■■■■■■■■■■■■■■■■■■■
■■■■■■■■■■ ■■■■■■■■■
■■■■■■■ ■■■■■ ■■■■■■■■■
■■■■■■■■■■ ■■■■■ ■ ■■■■■■■■
■■■■■■■
■■
■ ■■■■■■ ■■■■■■ ■■■■■■ ■■ ■■ ■■■■■■■
■■■
■■■■ ■■■■■■■
■■■■■■■■■■■■ ■■■■■■■
■■■■
■
■■■■■■■■■ ■■■■■■■■
■■■■■■ ■■
■
■■■
■ ■■ ■■■■■ ■ ■■■ ■■ ■■ ■■■■■ ■■■■ ■■■■ ■■■ ■■ ■■■■ ■ ■■ ■ ■■ ■■■ ■■■ ■■ ■■■ ■■■ ■■ ■■■■■ ■ ■■ ■■■■■ ■■■■ ■■ ■■■ ■■■■■ ■■■■■■ ■■ ■ ■■■■■ ■■ ■■ ■■■■ ■■■■■ ■ ■■■ ■■ ■■■■ ■■■■■ ■■■■■■ ■■ ■
■
■
■
■
■
■
■ ■
■
■
■
■
■
■
■■
■
■
■
■
■■
■
■
■
■
■■■
■■■
■■■
■■
■
■
■■■■■■ ■■■
■■■■■
■■
■■■■■ ■■■■ ■■■■
■■■■■■■■■■■
■■■■■
■■
■■
■■
■
■■ ■■
■■■■
■■
■■■
■
■■■■
■ ■
■
■
■
■■
■
■
■■
■■■■■
■
■■
■■■
■
■
■
■■
■
■
■
■
■ ■■■■■
■ ■■■
■■■■■
■■ ■■
■
■■■■■■■■■■■■
■
■
■■ ■■■■■■■ ■■
■■■■ ■■■■■■
■
■■■■
■
■
■■
■ ■■
■■■■
1970s
1990s
1980s
2000s
Alberta
Saskatchewan
ManitobaAlberta
Saskatchewan
Manitoba
Alberta
Saskatchewan
Manitoba Alberta
Saskatchewan
Manitoba
■■■■■
■■■■■■■■■■■■■■■■■■
■■■■■ ■
■
■
■■■■
■
■■■
■
■■
■■■
■
■■
■
■
■
■ ■■■■■
■
■■
■■■■
■■■■■■■■■■■■■■■■■■■■■■■
■
■
■■■■■■■■
■
■■■■■■■■■■■■■■■■■■■■■■■■■■■■■■■■■■■■■■■■■ ■■■■■■■■■■■■■■■■■■■■■■■■■■■■■■■■■■■■■■■■
■■■■■■■■■■■■■■■■■■■■■■■■■■■■■■■ ■■■■■■■■■■■■■■■■■■■■■■■■■■■■■■■■■■■■■■■■■■■■■■■■■■■■■■■■■■■■■■■■■■■■■■■■■■■■■■■■■■■■■■■
■■■ ■■■■■■■■■■■■■■■■■■■■■■■■■■■■■■■■■■■■■■■■■■■■■■■■■■■■■■■■■■■■■■■■■■■■■■■■■■■■■■■■■■
■■■■■■■■ ■■■■■■■■■■■■■■■■■■■■■■■■■■■■■■■■■■■■■■■■■■■■■■■■■■■■■■■■■■■■■■■■■
■■■■■■■ ■■■■■■■■■■■■■■■■■■■■■■■■■■■■■■■■■■■
■■■■■■■■■■■■■■■■■■ ■■■■
■■■■■■■■■■■■■■■■■■■■■■■■■■■■■■■■■■■■■■■■■■■■■■■■■■■■■■■■■■■■■■■
■■ ■■■■■■■■■■■■■■■■■■■■■■■■■■■■■■■■■■■■■■■■■■■■■■■■■■■■■■■■■
■■■ ■■■■■■■■■■■■■■■■■ ■■■■■■■■■■■■ ■■■■■■■■■■■■■■■■■■■■■ ■■■■■■■■■■■■■■■■■■■■■■■■■■■■■■
■■■■■■■■■■
■■■■■■■■■■■■■ ■■■■■■■■■■■■■■■■■■■■■■■■■■■■■■■■■■■■■■■■■■■■■■■■■■■■■■■■■■■■■■■■■■■■■■■■■■■■■■■■■■■■■■■■■■■■■■■■■■■■■■■■■
■■■■■■■■■■■■■■■■■■■■■■■■■■■■■■■■■■■■■■■■■■■■■■■■■■■■■■■■■■■■■■■■■■■■■■■■■■■ ■■■■■■■■■■■■■■■■■■■■■■■■■■■■■■■■■■■■■■■■ ■■■■■■■■■■■■■■■■■■■■■■■■■■■■■■■■■■■■■■■
■■■■■■■■■■■■ ■■■■■■■■■■■■■■■■■■■■■■■■■■■ ■■■■■■■■■■■■■■■■■■■■■■■■
■■■■■■■■■ ■■■■■■■■■■■■■■■■■■■■■■■■■■■■■■■■■■■■■■■■■■■■■■■■■■■■■■■■■■■■■■■■■■■
■■■ ■■■■■■■■■■■■■■■■■■
■■■■■■■■■■■■■■■■■■■■■■■ ■■■■■■■■■■■■■■■■■■■■■■■■■■■■■■■■■■■■■■■■■■■ ■■■■■■■■■■■■■■■■■■■
■■■■■■■■■■■■■■■■ ■■■■■■■■■■■■■■■
■ ■■■■■■■■■■ ■■■■■■■■■■■■■■■■■■■■■■■■■■■■■■■■■■■■■■■■■■■
■■■■
■■■■■■■■■■ ■■■■■■■■■■■■■■■■■■■ ■■■■■■■■■■■■ ■■■■■■■■■■■■■■■■■■■■■■■■■■■■■■■■■■■■
■■■■■■■■■■ ■■■■■■■■■
■■■■■■■ ■■■■■ ■■■■■■■■■
■■■■■■■■■■ ■■■■■ ■ ■■■■■■■■
■■■■■■■
■■
■ ■■■■■■ ■■■■■■ ■■■■■■ ■■ ■■ ■■■■■■■
■■■
■■■■ ■■■■■■■
■■■■■■■■■■■■ ■■■■■■■
■■■■
■
■■■■■■■■■ ■■■■■■■■
■■■■■■ ■■
■■■■■
■■■■■■■■■■■■■■■■■■
■■■■■ ■
■
■
■■■■
■
■■■
■
■■
■■■
■
■■
■
■
■
■ ■■■■■
■
■■
■■■■
■■■■■■■■■■■■■■■■■■■■■■■
■
■
■■■■■■■■
■
■■■■■■■■■■■■■■■■■■■■■■■■■■■■■■■■■■■■■■■■■ ■■■■■■■■■■■■■■■■■■■■■■■■■■■■■■■■■■■■■■■■
■■■■■■■■■■■■■■■■■■
■■■■■
■■■■■■■■■■■■■■■■■■
■■■■■ ■
■
■
■■■■
■
■■■
■
■■
■■■
■
■■
■
■
■
■ ■■■■■
■
■■
■■■■
■■■■■■■■■■■■■■■■■■■■■■■
■
■
■■■■■■■■
■
■■■■■■■■■■■■■■■■■■■■■■■■■■■■■■■■■■■■■■■■■ ■■■■■■■■■■■■■■■■■■■■■■■■■■■■■■■■■■■■■■■■
■■■■■■■■■■■■■■■■■■■■■■■■■■■■■■■ ■■■■■■■■■■■■■■■■■■■■■■■■■■■■■■■■■■■■■■■■■■■■■■■■■■■■■■■■■■■■■■■■■■■■■■■■■■■■■■■■■■■■■■■
■■■ ■■■■■■■■■■■■■■■■■■■■■■■■■■■■■■■■■■■■■■■■■■■■■■■■■■■■■■■■■■■■■■■■■■■■■■■■■■■■■■■■■■
■■■■■■■■ ■■■■■■■■■■■■■■■■■■■■ ■■■■■■■■■■■■■■■■■■■■■■■■■■■■■■■■■■■■■■■■■■■■■■■■■■■■■■■■■■
■■■■■■■■■■■■■■■■■■■■■■■■■■■■■■■■ ■■■■■■■■■■■■■■■■■■■■■■■■■■■■■■■■■■■■■■■■■■■■■■■■■■■
■■■■■■■■■■■■■■■■■■■■■■■■■■■■■■■■■■■■■■■ ■■■■■■■■■■■■■■■■■■■■■■■■■■■■■■■■■■■■■■■■■■■■■■■■■■■
■■■■■■■■■■■■■■■■■■■■■ ■■■■■■■■■■■■■■■■
■■■■■■■■■■■■■■■■■■■■■■■■■■■■■■■■■■■■■ ■■■■
■■■■■■■■■■■■■■■■■■■■■■■■■■■■■■■■■■■■■■■■■■■■■■■■■■■■■■■■■■■■■■■
■■ ■■■■■■■■■■■■■
■■■■■■■■■■■■■■■■■■■■■■■■■■■■■■■■■■■■■■■■■■■■■■■
■■■■■■■■■■■■■■■■■■ ■■■■■■■■■■■■■■■■
■■■■■■■■■■■■■■■■■■■■■■■■■■■■■■■■■■■■■ ■■■■
■■■■■■■■■■■■■■■■■■■■■■■■■■■■■■■■■■■■■■■■■■■■■■■■■■■■■■■■■■■■■■■
■■ ■■■■■■■■■■■■■■■■■■■■■■■■■■■■■■■■■■■■■■■■■■■■■■■■■■■■■■■■■
■■■ ■■■■■■■■■■■■■■■■■ ■■■■■■■■■■■■ ■■■■■■■■■■■■■■■■■■■■■ ■■■■■■■■■■■■■■■■■■■■■■■■■■■■■■
■■■■■■■■■■
■■■■■■■■■■■■■ ■■■■■■■■■■■■■■■■■■■■■■■■■■■■■■■■■■■■■■■■■■■■■■■■■■
■■■■■■■■■■■■■■■■■■■■■■■■■■■■■■■■■■■■■■■■■■■■
■■■ ■■■■■■■■■■■■■■■■■ ■■■■■■■■■■■■ ■■■■■■■■■■■■■■■■■■■■■ ■■■■■■■■■■■■■■■■■■■■■■■■■■■■■■
■■■■■■■■■■
■■■■■■■■■■■■■ ■■■■■■■■■■■■■■■■■■■■■■■■■■■■■■■■■■■■■■■■■■■■■■■■■■■■■■■■■■■■■■■■■■■■■■■■■■■■■■■■■■■■■■■■■■■■■■■■■■■■■■■■■
■■■■■■■■■■■■■■■■■■■■■■■■■■■■■■■■■■■■■■■■■■■■■■■■■■■■■■■■■■■■■■■■■■■■■■■■■■■ ■■■■■■■■■■■■■■■■■■■■■■■■■■■■■■■■■■■■■■■■ ■■■■■■■■■■■■■■■■■■■■■■■■■■■■■■
■■■■■■■■■■■■■■■■■■■■■■■■■■■■■■■■■■■■■■■■■■■■■■■■■■■■■■■
■■■■■■■■■■■■■■■■■■■■■■■■■■■■■■■■■■■■■■■■■■■■■■■■■■■■■■■■■■■■■■■■■■■■■■■■■■■ ■■■■■■■■■■■■■■■■■■■■■■■■■■■■■■■■■■■■■■■■ ■■■■■■■■■■■■■■■■■■■■■■■■■■■■■■■■■■■■■■■
■■■■■■■■■■■■ ■■■■■■■■■■■■■■■■■■■■■■■■■■■ ■■■■■■■■■■■■■■■■■■■■■■■■
■■■■■■■■■ ■■■■■■■■■■■■■■■■■■■■■■■■■■■■■■■■■■■■■■■■■■■■■■■■■■■■■■■■■■■■■■■■■■■
■■■ ■■■■■■■■■■■■■■■■■■
■■■■■■■■■■■■■■■■■■■■■■■ ■■■■■■■■
■■■■■■■■■■■■■■■■■■■■■ ■■■■■■■■■■■■■■■■■■■■■■■■■■■ ■■■■■■■■■■■■■■■■■■■■■■■■
■■■■■■■■■ ■■■■■■■■■■■■■■■■■■■■■■■■■■■■■■■■■■■■■■■■■■■■■■■■■■■■■■■■■■■■■■■■■■■
■■■ ■■■■■■■■■■■■■■■■■■
■■■■■■■■■■■■■■■■■■■■■■■ ■■■■■■■■■■■■■■■■■■■■■■■■■■■■■■■■■■■■■■■■■■■ ■■■■■■■■■■■■■■■■■■■
■■■■■■■■■■■■■■■■ ■■■■■■■■■■■■■■■
■ ■■■■■■■■■■ ■■■■■■■■■■■■■■■■■■■■■■■■■■■■■■■■■■■■■■■■■■■
■■■■
■■■■■■■■■■ ■■■■■■■■■■■■■■■■■■■ ■■■■■■■■■■■■ ■■■■■■■■■■■■■■■■ ■■■■■■■■■■■■■■■■■■■■■■■■■■■■■■■■■■■ ■■■■■■■■■■■■■■■■■■■
■■■■■■■■■■■■■■■■ ■■■■■■■■■■■■■■■
■ ■■■■■■■■■■ ■■■■■■■■■■■■■■■■■■■■■■■■■■■■■■■■■■■■■■■■■■■
■■■■
■■■■■■■■■■ ■■■■■■■■■■■■■■■■■■■ ■■■■■■■■■■■■ ■■■■■■■■■■■■■■■■■■■■■■■■■■■■■■■■■■■■
■■■■■■■■■■ ■■■■■■■■■
■■■■■■■ ■■■■■ ■■■■■■■■■
■■■■■■■■■■ ■■■■■ ■ ■■■■■■■■
■■■■■■■
■■
■ ■■■■■■ ■■■■■■ ■■■■■■ ■■ ■■ ■■■■■■■
■■■
■■■■ ■■■■■■■
■■■■■■■■■■■■ ■■■■■■■
■■■■
■
■■■■■■■■■ ■■■■■■■■
■■■■■■ ■■
■
■■■
■ ■■ ■■■■■ ■ ■■■ ■■ ■■ ■■■■■ ■■■■ ■■■■ ■■■ ■■ ■■■■ ■ ■■ ■ ■■ ■■■ ■■■ ■■ ■■■ ■■■ ■■ ■■■■■ ■ ■■ ■■■■■ ■■■■ ■■ ■■■ ■■■■■ ■■■■■■ ■■ ■ ■■■■■ ■■ ■■ ■■■■ ■■■■■ ■ ■■■ ■■ ■■■■ ■■■■■ ■■■■■■ ■■ ■
■
■
■
■
■
■
■ ■
■
■
■
■
■
■
■■
■
■
■
■
■■
■
■
■
■
■■■
■■■
■
■■■
■ ■■ ■■■■■ ■ ■■■ ■■ ■■ ■■■■■ ■■■■ ■■■■ ■■■ ■■ ■■■■ ■ ■■ ■ ■■ ■■■ ■■■ ■■ ■■■ ■■■ ■■ ■■■■■ ■ ■■ ■■■■■ ■■■■ ■■ ■■■ ■■■■■ ■■■■■■ ■■ ■ ■■■■■ ■■ ■■ ■■■■ ■■■■■ ■ ■■■ ■■ ■■■■ ■■■■■ ■■■■■■ ■■ ■
■
■
■
■
■
■
■ ■
■
■
■
■
■
■
■■
■
■
■
■
■■
■
■
■
■
■■■
■■■
■■■
■■
■
■
■■■■■■ ■■■
■■■■■
■■
■■■■■ ■■■■ ■■■■
■■■■■■■■■■■
■■■■■
■■
■■
■■
■
■■ ■■
■■■■
■■
■■■
■
■■■■
■ ■
■
■
■■■
■■
■
■
■■■■■■ ■■■
■■■■■
■■
■■■■■ ■■■■ ■■■■
■■■■■■■■■■■
■■■■■
■■
■■
■■
■
■■ ■■
■■■■
■■
■■■
■
■■■■
■ ■
■
■
■
■■
■
■
■■
■■■■■
■
■■
■■■
■
■
■
■■
■
■
■
■
■ ■■■■■
■ ■■■
■■■■■
■■ ■■
■
■■■■■■■■■■■■
■
■
■■ ■■■■■■■ ■■
■■■■ ■■■■■■
■
■■■■
■
■
■■
■ ■■
■■■■
■
■■
■
■
■■
■■■■■
■
■■
■■■
■
■
■
■■
■
■
■
■
■ ■■■■■
■ ■■■
■■■■■
■■ ■■
■
■■■■■■■■■■■■
■
■
■■ ■■■■■■■ ■■
■■■■ ■■■■■■
■
■■■■
■
■
■■
■ ■■
■■■■
1970s
1990s
1980s
2000s
Alberta
Saskatchewan
ManitobaAlberta
Saskatchewan
Manitoba
Alberta
Saskatchewan
Manitoba Alberta
Saskatchewan
Manitoba
1970s
1990s
1980s
2000s
Alberta
Saskatchewan
ManitobaAlberta
Saskatchewan
ManitobaAlberta
Saskatchewan
ManitobaAlberta
Saskatchewan
Manitoba
Alberta
Saskatchewan
ManitobaAlberta
Saskatchewan
Manitoba Alberta
Saskatchewan
ManitobaAlberta
Saskatchewan
Manitoba
Figure 8. Distribution of fields with cow cockle (■) in surveyed ecoregions (shaded areas) in the Prairie Provinces in each decade from the 1970s to 2000s. Refer to Table 1 for number of fields surveyed.

Thomas and Leeson 59
y = 32.9 ln(x) - 89.4r2 = 0.91
050
100150200250300350
0 1500 3000 4500 6000 7500 9000Number of fields
Num
ber o
f wee
d sp
ecie
s
SKAB
QC
MB
PEINS, ON, NB
Equation for fitted curve with Québec excludedBCy = 32.9 ln(x) - 89.4
r2 = 0.910
50100150200250300350
0 1500 3000 4500 6000 7500 9000Number of fields
Num
ber o
f wee
d sp
ecie
s
SKAB
QC
MB
PEINS, ON, NB
Equation for fitted curve with Québec excludedBC
Figure 9. Relationship between sampling intensity (number of fields) and number of species based on contemporary surveys in nine provinces. Alberta surveys from 1970s were excluded as data were only available for the frequently occurring weed species. Sampling methodology within fields was similar in each province except Québec where complete field inventories were conducted.
y = -5.57 ln(x) + 104.9
r2 = 0.71
0
20
40
60
80
100
0 1500 3000 4500 6000 7500 9000
Number of fields
Perc
enta
ge o
f alie
n sp
ecie
s
SKAB
QC
MBPEI
NS
BC
ON
NB
Equation for fitted curvey = -5.57 ln(x) + 104.9
r2 = 0.71
0
20
40
60
80
100
0 1500 3000 4500 6000 7500 9000
Number of fields
Perc
enta
ge o
f alie
n sp
ecie
s
SKAB
QC
MBPEI
NS
BC
ON
NB
Equation for fitted curve
Figure 10. Relationship between sampling intensity (number of fields) and percentage of alien species based on contemporary surveys in nine provinces. Alberta surveys from 1970s were excluded as data were only available for frequently occurring weed species. Sampling methodology within fields was similar in each province except Québec where complete field inventories were conducted.
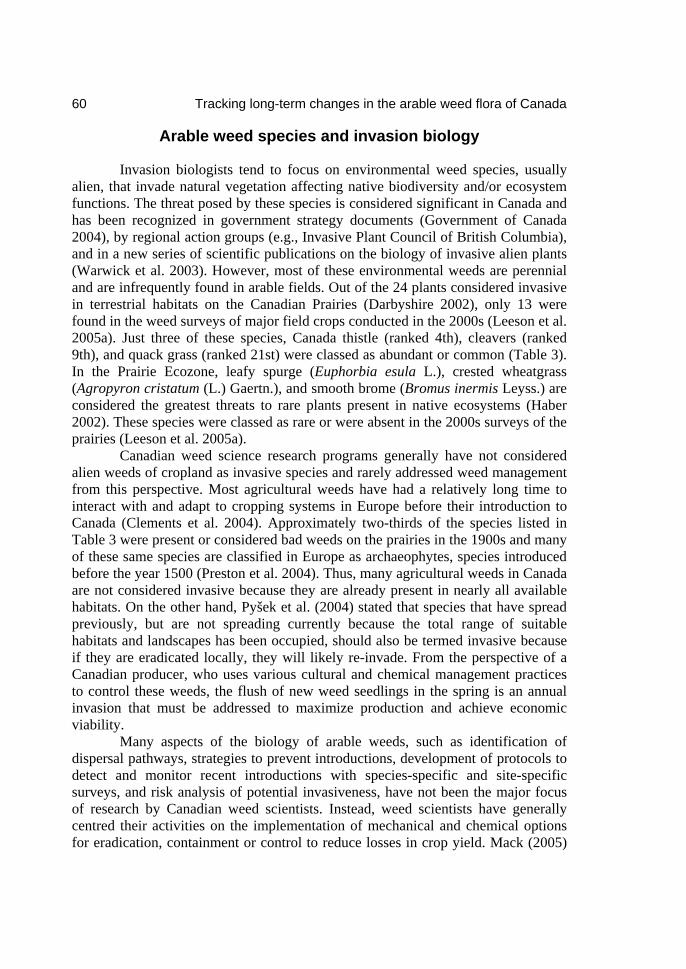
60 Tracking long-term changes in the arable weed flora of Canada
Arable weed species and invasion biology
Invasion biologists tend to focus on environmental weed species, usually alien, that invade natural vegetation affecting native biodiversity and/or ecosystem functions. The threat posed by these species is considered significant in Canada and has been recognized in government strategy documents (Government of Canada 2004), by regional action groups (e.g., Invasive Plant Council of British Columbia), and in a new series of scientific publications on the biology of invasive alien plants (Warwick et al. 2003). However, most of these environmental weeds are perennial and are infrequently found in arable fields. Out of the 24 plants considered invasive in terrestrial habitats on the Canadian Prairies (Darbyshire 2002), only 13 were found in the weed surveys of major field crops conducted in the 2000s (Leeson et al. 2005a). Just three of these species, Canada thistle (ranked 4th), cleavers (ranked 9th), and quack grass (ranked 21st) were classed as abundant or common (Table 3). In the Prairie Ecozone, leafy spurge (Euphorbia esula L.), crested wheatgrass (Agropyron cristatum (L.) Gaertn.), and smooth brome (Bromus inermis Leyss.) are considered the greatest threats to rare plants present in native ecosystems (Haber 2002). These species were classed as rare or were absent in the 2000s surveys of the prairies (Leeson et al. 2005a).
Canadian weed science research programs generally have not considered alien weeds of cropland as invasive species and rarely addressed weed management from this perspective. Most agricultural weeds have had a relatively long time to interact with and adapt to cropping systems in Europe before their introduction to Canada (Clements et al. 2004). Approximately two-thirds of the species listed in Table 3 were present or considered bad weeds on the prairies in the 1900s and many of these same species are classified in Europe as archaeophytes, species introduced before the year 1500 (Preston et al. 2004). Thus, many agricultural weeds in Canada are not considered invasive because they are already present in nearly all available habitats. On the other hand, Pyšek et al. (2004) stated that species that have spread previously, but are not spreading currently because the total range of suitable habitats and landscapes has been occupied, should also be termed invasive because if they are eradicated locally, they will likely re-invade. From the perspective of a Canadian producer, who uses various cultural and chemical management practices to control these weeds, the flush of new weed seedlings in the spring is an annual invasion that must be addressed to maximize production and achieve economic viability.
Many aspects of the biology of arable weeds, such as identification of dispersal pathways, strategies to prevent introductions, development of protocols to detect and monitor recent introductions with species-specific and site-specific surveys, and risk analysis of potential invasiveness, have not been the major focus of research by Canadian weed scientists. Instead, weed scientists have generally centred their activities on the implementation of mechanical and chemical options for eradication, containment or control to reduce losses in crop yield. Mack (2005)
Thomas and Leeson 61
has divided the study of invasive alien species into five stages or imperatives: eradication at time of entry, assessment of establishment in new range, identification of effective control measures, implementation of these measures, and evaluating success or failure of control measures. The alien weed populations recorded in the contemporary surveys of arable fields in Canada are a result of the failure to recognize and implement most of these imperatives when these species first appeared in Canadian agroecosystems. These surveys mainly deal with alien weeds for which effective management options are generally available; therefore, they correspond to Mack’s fifth imperative where the effects of these control measures are continuously being evaluated.
The chance of detecting a weed species in the early stages of introduction is small using the contemporary survey methodology discussed in this paper. The 3806 fields included in the most recent set of surveys across the Prairie Provinces represented 1% of all the area in the surveyed crops. This level of sampling intensity was only possible with the cooperation and coordination of nearly 200 individuals. If a field occupying a quarter section (65 ha) was entirely infested, the probability of randomly visiting that field would be one in a hundred. Because only a small portion of the field is surveyed (1.6%), the chances are greatly reduced if the size of the infestation is smaller (Figure 1).
A different approach is needed to detect the occurrence of new alien species that occur at low densities in a few scattered locations. Rew et al. (2006) evaluated various survey methods to detect the presence and spatial distribution of alien species in natural ecosystems and concluded that a targeted transect method was the most reliable. The targeted transect method used rights of way as starting points for randomly placed transects that are aligned perpendicular to the right of way. This method assumes that anthropogenic disturbances like rights of way provide a suitable habitat for the establishment of alien species populations. For example, Gelbard and Belnap (2003) have shown that roads, especially improved roads, can be a major factor contributing to the spread of alien plants into adjacent non-arable land. A study of arable field margins in Saskatchewan concluded that species diversity was highest in the boundary area between annual crop fields and grassy roadside ditches and these field margins may represent potential habitats for new weed infestations (Leeson et al. 2005b). The field sampling pattern used in contemporary weed surveys (Figure 1) avoids these field margins because they are not usually representative of the main portion of the field. The above studies suggest that using a transect method to survey field margins along major transportation corridors would increase the likelihood of detecting new alien weed species.
Clements et al. (2004) reviewed how evolutionary change in weeds may facilitate future weed invasions of cropland. They argued that weeds are not the static entities that many in weed science have assumed but rather, arable weeds are capable of undergoing rapid genetic change that may affect their abundance and distribution in the future. In addition to the many biological characteristics of the species that are related to potential invasiveness, the invasion risk may also be
62 Tracking long-term changes in the arable weed flora of Canada
related to selection pressure from future changes in agronomic practices, weed control management, and agricultural policy, as well as environmental factors such as climate change. Most of the weed species classed as occasional in the contemporary prairie surveys have either decreased in RAI rank or have remained unchanged from the 1970s to the 2000s but a few species have increased, potentially indicating active invasion. For example, stork’s-bill (Erodium cicutarium (L.) L'Hér. ex Aiton) has risen from a rank of 58th in the 1970s to 38th in the 2000s (Leeson et al. 2005a). However, it is beyond the scope of this paper to address the future invasive risk of this species or of any of the other 58 occasional and 53 rare species that were recorded during the 2000s prairie surveys.
Most arable weed species in Canada are introduced, which by definition makes them invasive according to some sources (e.g. Pyšek et al. 2004). Some of the native weed species also show invasive characteristics, negatively impacting crop production. Weed surveys discussed in this paper illustrate changes that have occurred in the weed flora and enable the quantification of the last stage of invasion (Mack 2005). The specific information on weed species biology, ecology, and population dynamics required to understand these changes is mainly unknown or not applicable to local conditions (Thomas et al. 2004). More research in these areas is necessary to better understand the invasiveness of weeds in arable fields. In fact, the lessons learned from management of alien weed species in agricultural production systems may improve the effectiveness of managing invasive alien species in other ecosystems (Smith et al. 2006).
Literature cited
Albrecht, H. 1995. Changes in the arable weed flora of Germany during the last five decades. Pages 41-48 in Proceedings of the 9th European Weed Research Society Symposium on Challenges for Weed Science in a Changing Europe, Budapest, Hungary.
Alex, J. F. 1966. Survey of the weeds of cultivated land in the Prairie Provinces. Regina, SK: Agriculture Canada, Experimental Farm. 68 p.
Andreasen, C., H. Stryhn, and J. C. Streibig. 1996. Decline of the flora in Danish arable fields. J. Appl. Ecol. 33:619-626.
Baessler, C. and S. Klotz. 2006. Effects of changes in agricultural land-use on landscape structure and arable weed vegetation over the last 50 years. Agric. Ecosyst. Environ. 115:43-50.
Bedford, S. A. and C. H. Lee. 1910. Twelve noxious weeds. Bulletin 2. Winnipeg, MB: Manitoba Agricultural College. 34 p.
Bohren, C. 2006. Report of the inaugural meeting of the working group on invasive plants, 6th February 2006. European Weed Research Society. http://www.ewrs. org/IW/working_group_meeting.htm. Accessed: June 26, 2007.
Thomas and Leeson 63
Clements, D. R., A. DiTommaso, N. Jordan, B. D. Booth, J. Cardina, D. Doohan, C. L. Mohler, S. D. Murphy, and C. J. Swanton. 2004. Adaptability of plants invading North American cropland. Agric. Ecosyst. Environ. 104:379-398.
Darbyshire, S. 2002. Pathways and transportation. Pages 21-42 in B. Tellman, ed. Weeds Across Borders: Proceedings of a North American Conference Held in Tucson, Arizona May 2002. Tucson, AZ: The Arizona-Sonora Desert Museum.
Darbyshire, S. J. 2003. Inventory of Canadian agricultural weeds. http://sci.agr.ca/ ecorc/weeds_herbes/title-titre_e.htm. Accessed: June 26, 2007.
Doyon, D., C. J. Bouchard, et R. Néron. 1986a. Inventaire des mauvaises herbes dans les cultures du Québec (1980-1984): Principales données des relevés floristiques et agronomiques des région agricole de Québec (02). Vol. 1. Québec, QC: Gouvernement du Québec, Ministère de l'Agriculture, des Pêcheries et de l'Alimentation. 41 p.
Doyon, D., C. J. Bouchard, et R. Néron. 1986b. Inventaire des mauvaises herbes dans les cultures du Québec (1980-1984): Principales données des relevés floristiques et agronomiques des région agricole des Cantons de l'Est (05). Vol. 2. Québec, QC: Gouvernement du Québec, Ministère de l'Agriculture, des Pêcheries et de l'Alimentation. 49 p.
Doyon, D., C. J. Bouchard, et R. Néron. 1986c. Inventaire des mauvaises herbes dans les cultures du Québec (1980-1984): Principales données des relevés floristiques et agronomiques des région agricole du Richelieu (06). Vol. 3. Québec, QC: Gouvernement du Québec, Ministère de l'Agriculture, des Pêcheries et de l'Alimentation. 93 p.
Doyon, D., C. J. Bouchard, et R. Néron. 1986d. Inventaire des mauvaises herbes dans les cultures du Québec (1980-1984): Principales données des relevés floristiques et agronomiques des région agricole du sud-ouest de Montréal (07). Vol. 4. Québec, QC: Gouvernement du Québec, Ministère de l'Agriculture, des Pêcheries et de l'Alimentation. 102 p.
Doyon, D., C. J. Bouchard, et R. Néron. 1986e. Inventaire des mauvaises herbes dans les cultures du Québec (1980-1984): Principales données des relevés floristiques et agronomiques des région agricole de l'Assomption (10). Vol. 5. Québec, QC: Gouvernement du Québec, Ministère de l'Agriculture, des Pêcheries et de l'Alimentation. 131 p.
Doyon, D., J.-M. Deschênes, C. J. Bouchard, et R. Rioux. 1982. Inventaire des mauvaises herbes dans les principales cultures au Québec. I. Buts et méthodologie. Phytoprotection 63:10-21.
Fletcher, J. 1897 [reprinted 1907]. Weeds. Bulletin No. 28. Ottawa, ON: Canada Department of Agriculture, Central Experimental Farm. 43 p.
Frick, B., A. G. Thomas, and R. F. Wise. 1990. Weeds of corn, soybean, and winter wheat fields under conventional, conservation, and no-till management systems in southwestern Ontario 1988 and 1989. Weed Survey Series Publ. 90-1. Regina, SK: Agriculture Canada, Regina Research Station. 239 p.
64 Tracking long-term changes in the arable weed flora of Canada
Fried, G., M. Bombarde, M. Delos, J. Gasquez, et X. Reboud. 2005. Évolution de la flore du mais: Mauvaises herbes, ce qui a changé en 30 ans. Phytoma 586:47-51.
Gelbard, J. L. and J. Belnap. 2003. Roads as conduits for exotic plant invasions in a semiarid landscape. Conserv. Biol. 17:420-432.
Government of Canada. 2004. An invasive alien species strategy for Canada. http://www.cbin.ec.gc.ca/issues/ias_invasives.cfm?lang=e. Accessed: June 26, 2007.
Government of Northwest Territories. 1898. Noxious weeds and how to destroy them. Bulletin No. 1. Department of Agriculture. 29 p.
Groh, H. and C. Frankton. 1949. Canadian weed survey. Seventh Report – 1948. Ottawa, ON: Canadian Department of Agriculture, Science Service, Division of Botany and Plant Pathology. 144 p.
Haber, E. 2002. Spread and impact of alien plants across Canadian landscapes. Pages 43-57 in R. Claudi, P. Nantel, and E. Muckle-Jeffs, eds. Alien Invaders in Canada’s Waters, Wetlands, and Forests. Ottawa, ON: Canadian Forest Service, National Resources Canada.
Hyvönen, T., E. Ketoja, and J. Salonen. 2003. Changes in the abundance of weeds in spring cereal fields in Finland. Weed Res. 43:348-356.
Ivany, J. A. 1980. The 1978 weed survey of grain fields in Prince Edward Island. Weed Survey Series Publ. 80-2. Regina, SK: Agriculture Canada, Regina Research Station. 59 p.
Ivany, J. A. and A. G. Thomas. 1983. The 1979 weed survey of grain fields in Prince Edward Island. Weed Survey Series Publ. 83-3. Regina, SK: Agriculture Canada, Regina Research Station. 60 p.
Leeson, J. Y., A. G. Thomas, T. Andrews, K. R. Brown, and R. C. Van Acker. 2002. Manitoba weed survey of cereal and oilseed crops in 2002. Weed Survey Series Publ. 02-2. Saskatoon, SK: Agriculture and Agri-Food Canada, Saskatoon Research Centre. 191 p.
Leeson, J. Y., A. G. Thomas, and C. A. Brenzil. 2003. Saskatchewan weed survey of cereal, oilseed and pulse crops in 2003. Weed Survey Series Publ. 03-1. Saskatoon, SK: Agriculture and Agri-Food Canada, Saskatoon Research Centre. 342 p.
Leeson, J. Y., A. G. Thomas, and L. M. Hall. 2002. Alberta weed survey of cereal, oilseed and pulse crops in 2001. Weed Survey Series Publ. 02-1. Saskatoon, SK: Agriculture and Agri-Food Canada, Saskatoon Research Centre. 263 p.
Leeson, J. Y., A. G. Thomas, L. M. Hall, C. A. Brenzil, T. Andrews, K. R. Brown, and R. C. Van Acker. 2005a. Prairie weed surveys of cereal, oilseed and pulse crops from the 1970s to the 2000s. Weed Survey Series Publ. 05-1. Saskatoon, SK: Agriculture and Agri-Food Canada, Saskatoon Research Centre. 395 p.
Leeson, J. Y., A. G. Thomas, and J. W. Sheard. 2005b. Weed distribution across field boundaries adjacent to roadsides. Pages 185-199 in A. G. Thomas, ed. Field Boundary Habitats: Implications for Weed, Insect and Disease
Thomas and Leeson 65
Management. Topics in Canadian Weed Science, Volume 1. Sainte-Anne-de-Bellevue, QC: Canadian Weed Science Society - Société canadienne de malherbologie.
Lemieux, C., A. Larouche, A. Légère, J.-M. Deschênes, et R. Rioux. 1988a. Inventaire des mauvaises herbes au Québec: Cultures céréalières. Bulletin d’extension no 2. Sainte-Foy, QC: Agriculture Canada, Station de recherches. 84 p.
Lemieux, C., A. Larouche, A. Légère, J.-M. Deschênes, et R. Rioux. 1988b. Inventaire des mauvaises herbes au Québec: Cultures de maïs, de pommes de terre et de fraises. Bulletin d’extension no 3. Sainte-Foy, QC: Agriculture Canada, Station de recherches. 45 p.
Mack, R. N. 2005. Assessing biotic invasions in time and space: The second imperative. Pages 179-208 in H. A. Mooney, R. N. Mack, J. A. McNeely, L. E Neville, P. J. Schei, and J. K. Waage, eds. Invasive Alien Species. Scope Series 63. Washington, DC: Island Press.
Manitoba Department of Agriculture and Immigration. 1897. Noxious weeds and how to destroy them. No. 3. Winnipeg, MB: Government of Manitoba. (CIHN/ICMH microfiche series no. 61000)
Mason, J. M. 1932. Weed survey of the Prairie Provinces. Report No. 26. Ottawa, ON: National Research Council. 34 p.
Maurice, D. C., J. T. O’Donovan, and D. J. Pickle. 1990. Alberta cereals & oilseeds crop protection survey - final population results. Edmonton, AB: Alberta Agriculture, Crop Protection Branch.
Preston, C. D., D. A. Pearman, and A. R. Hall. 2004. Archaeophytes in Britain. Bot. J. Linn. Soc. 145:257-294.
Pyšek, P., V. Jarošík, Z. Kropáč, M. Chytrý, J. Wild, and L Tichý. 2005. Effects of abiotic factors on species richness and cover in Central European weed communities. Agric. Ecosyst. Environ. 109:1-8.
Pyšek, P., D. M. Richardson, M. Rejmánek, G. L. Webster, M. Williamson, and J. Kirschner. 2004. Alien plants in checklists and floras: Towards better communication between taxonomists and ecologists. Taxon 53:131-143.
Rankins Jr., A., J. D. Byrd Jr., D. B. Mask, J. W. Barnett, and P. D. Gerard. 2005. Survey of soybean weeds in Mississippi. Weed Tech. 19:492-498.
Rew, L. J., B. D. Maxwell, F. L. Dougher, and R. Aspinall. 2006. Searching for a needle in a haystack: Evaluating survey methods for non-indigenous plant species. Biol. Invasions 8:523-539.
Scoggan, H. J. 1957. Flora of Manitoba. National Museum of Canada Bulletin No. 140. Ottawa, ON: National Museum of Canada. 619 p.
Scoggan, H. J. 1978-1979. The flora of Canada. Publications in Botany No. 7 (Parts 1-4). Ottawa, ON: National Museum of Natural Sciences. 1711 p.
Smith, J. D. 1917. Weeds of Alberta. Seed and Weed Branch Bulletin No. 2. Edmonton, AB: Alberta Department of Agriculture. 104 p.
66 Tracking long-term changes in the arable weed flora of Canada
Smith, R. G., B. D. Maxwell, F. D. Menalled, and L. J. Rew. 2006. Lessons from agriculture may improve the management of invasive plants in wildland systems. Front. Ecol. Environ. 4:428-434.
Statistics Canada. 2006. Statistics: Power from data! http://www.statcan.ca/english/ edu/power/toc/contents.htm. Accessed: June 26, 2007.
Sutcliffe, O. L. and Q. O. N. Kay. 2000. Changes in the arable flora of central southern England since the 1960s. Biol. Conserv. 93:1-8.
Thomas, A. G. 1985. Weed survey system used in Saskatchewan for cereal and oilseed crops. Weed Sci. 33:34-43.
Thomas, A. G., D. A. Derksen, R. E. Blackshaw, R. C. Van Acker, A. Légère, P. R. Watson, and G. C. Turnbull. 2004. A multistudy approach to understanding weed population shifts in medium- to long-term tillage systems. Weed Sci. 52:874-880.
Thomas, A. G., D. J. Doohan, and K. V. McCully. 1994. Weed survey of spring cereals in New Brunswick. Phytoprotection 75:113-124.
Thomas, A. G., B. L. Frick, and L. M. Hall. 1998a. Alberta weed survey of cereal and oilseed crops in 1997. Weed Survey Series Publ. 98-2. Saskatoon, SK: Agriculture and Agri-Food Canada, Saskatoon Research Centre. 241 p. + 41 maps.
Thomas, A. G., B. L. Frick, R. C. Van Acker, S. Z. Knezevic, and D. Joosse. 1998b. Manitoba weed survey of cereal and oilseed crops in 1997. Weed Survey Series Publ. 98-1. Saskatoon, SK: Agriculture and Agri-Food Canada, Saskatoon Research Centre. 192 p. + 36 maps.
Thomas, A. G. and R. F. Wise. 1983a. Peace River region of British Columbia weed survey of cereal and oilseed crops - 1978, 1979 and 1980. Weed Survey Series Publ. 83-4. Regina, SK: Agriculture Canada, Regina Research Station. 171 p.
Thomas, A. G. and R. F. Wise. 1983b. Weed surveys of Saskatchewan cereal and oilseed crops from 1976 to 1979. Weed Survey Series Publ. 83-6. Regina, SK: Agriculture Canada, Regina Research Station. 260 p.
Thomas, A. G. and R. F. Wise. 1984. Weed surveys of Manitoba cereal and oilseed crops from 1978, 1979 and 1981. Weed Survey Series Publ. 84-1. Regina, SK: Agriculture Canada, Regina Research Station. 230 p.
Thomas, A. G. and R. F. Wise. 1985. Dew's Alberta weed survey (1973-1977). Weed Survey Series Publ. 85-3. Regina, SK: Agriculture Canada, Regina Research Station. 134 p.
Thomas, A. G. and R. F. Wise. 1987. Weed survey of Saskatchewan cereal and oilseed crops (1986). Weed Survey Series Publ. 87-1. Regina, SK: Agriculture Canada, Regina Research Station. 251 p.
Thomas, A. G. and R. F. Wise. 1988. Weed survey of Manitoba cereal and oilseed crops (1986). Weed Survey Series Publ. 88-1. Regina, SK: Agriculture Canada, Regina Research Station. 201 p.
Thomas, A. G., R. F. Wise, B. L. Frick, and L. T. Juras. 1996. Saskatchewan weed survey of cereal, oilseed and pulse crops in 1995. Weed Survey Series Publ. 96-
Thomas and Leeson 67
1. Saskatoon, SK: Agriculture and Agri-Food Canada, Saskatoon Research Centre. 419 p.
Tóth, Á., G. Benécs-Bárdi, and G. Balzás. 1999. Results of national weed surveys in arable land during the past 50 years in Hungary. Pages 805-810 in Proceedings of the 1999 Brighton Crop Protection Conference – Weeds. Farnham, UK: The British Crop Protection Council.
Warwick, S. I., P. B. Cavers, and S. Darbyshire. 2003. A new series – The biology of invasive alien plants in Canada. Instructions for preparation of accounts. Can. J. Plant Sci. 83:655-659.
Zollinger, R. K. 2003. Survey of weeds in North Dakota – 2000. http://www.ag.ndsu.edu/weeds/ER83/ER83.htm. Accessed: June 26, 2007.
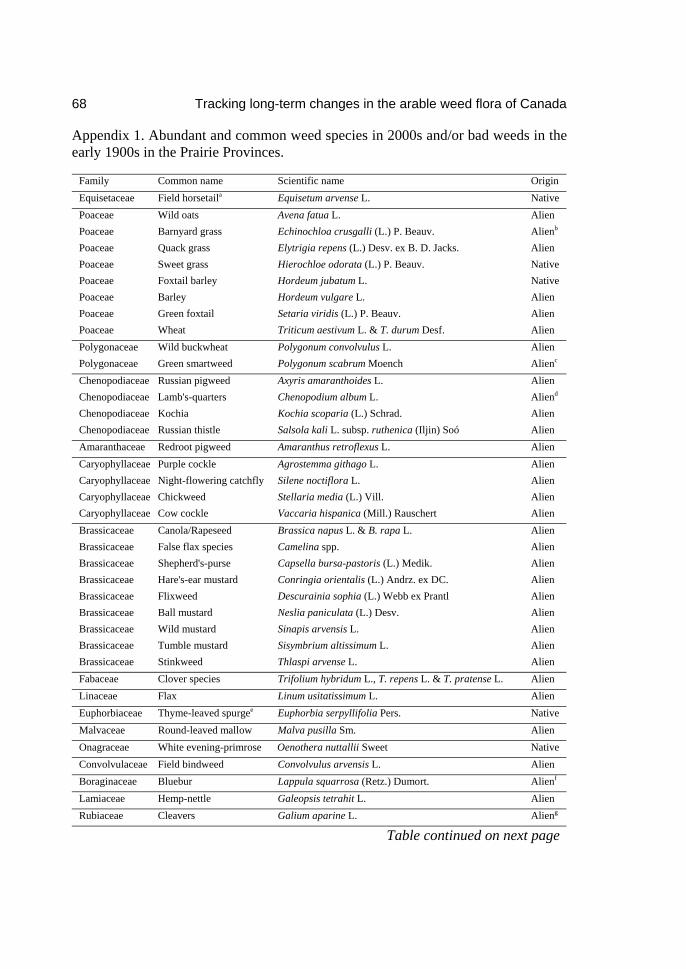
68 Tracking long-term changes in the arable weed flora of Canada
Appendix 1. Abundant and common weed species in 2000s and/or bad weeds in the early 1900s in the Prairie Provinces.
Family Common name Scientific name Origin Equisetaceae Field horsetaila Equisetum arvense L. Native Poaceae Wild oats Avena fatua L. Alien Poaceae Barnyard grass Echinochloa crusgalli (L.) P. Beauv. Alienb Poaceae Quack grass Elytrigia repens (L.) Desv. ex B. D. Jacks. Alien Poaceae Sweet grass Hierochloe odorata (L.) P. Beauv. Native Poaceae Foxtail barley Hordeum jubatum L. Native Poaceae Barley Hordeum vulgare L. Alien Poaceae Green foxtail Setaria viridis (L.) P. Beauv. Alien Poaceae Wheat Triticum aestivum L. & T. durum Desf. Alien Polygonaceae Wild buckwheat Polygonum convolvulus L. Alien Polygonaceae Green smartweed Polygonum scabrum Moench Alienc Chenopodiaceae Russian pigweed Axyris amaranthoides L. Alien Chenopodiaceae Lamb's-quarters Chenopodium album L. Aliend Chenopodiaceae Kochia Kochia scoparia (L.) Schrad. Alien Chenopodiaceae Russian thistle Salsola kali L. subsp. ruthenica (Iljin) Soó Alien Amaranthaceae Redroot pigweed Amaranthus retroflexus L. Alien Caryophyllaceae Purple cockle Agrostemma githago L. Alien Caryophyllaceae Night-flowering catchfly Silene noctiflora L. Alien Caryophyllaceae Chickweed Stellaria media (L.) Vill. Alien Caryophyllaceae Cow cockle Vaccaria hispanica (Mill.) Rauschert Alien Brassicaceae Canola/Rapeseed Brassica napus L. & B. rapa L. Alien Brassicaceae False flax species Camelina spp. Alien Brassicaceae Shepherd's-purse Capsella bursa-pastoris (L.) Medik. Alien Brassicaceae Hare's-ear mustard Conringia orientalis (L.) Andrz. ex DC. Alien Brassicaceae Flixweed Descurainia sophia (L.) Webb ex Prantl Alien Brassicaceae Ball mustard Neslia paniculata (L.) Desv. Alien Brassicaceae Wild mustard Sinapis arvensis L. Alien Brassicaceae Tumble mustard Sisymbrium altissimum L. Alien Brassicaceae Stinkweed Thlaspi arvense L. Alien Fabaceae Clover species Trifolium hybridum L., T. repens L. & T. pratense L. Alien Linaceae Flax Linum usitatissimum L. Alien Euphorbiaceae Thyme-leaved spurgee Euphorbia serpyllifolia Pers. Native Malvaceae Round-leaved mallow Malva pusilla Sm. Alien Onagraceae White evening-primrose Oenothera nuttallii Sweet Native Convolvulaceae Field bindweed Convolvulus arvensis L. Alien Boraginaceae Bluebur Lappula squarrosa (Retz.) Dumort. Alienf Lamiaceae Hemp-nettle Galeopsis tetrahit L. Alien Rubiaceae Cleavers Galium aparine L. Alieng
Table continued on next page
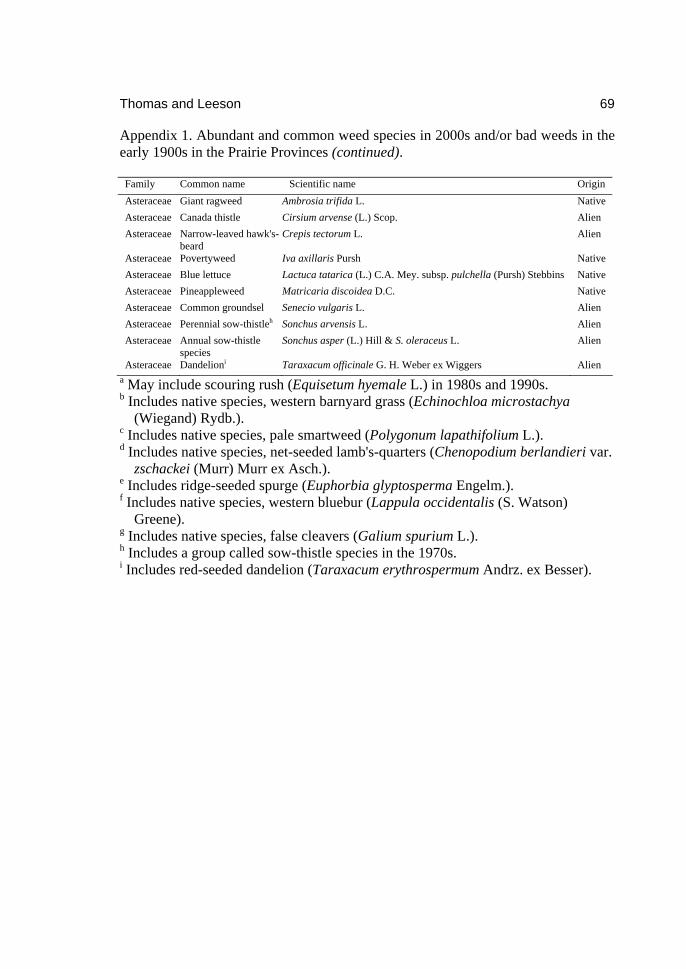
Thomas and Leeson 69
Appendix 1. Abundant and common weed species in 2000s and/or bad weeds in the early 1900s in the Prairie Provinces (continued). Family Common name Scientific name Origin Asteraceae Giant ragweed Ambrosia trifida L. Native Asteraceae Canada thistle Cirsium arvense (L.) Scop. Alien Asteraceae Narrow-leaved hawk's-
beard Crepis tectorum L. Alien
Asteraceae Povertyweed Iva axillaris Pursh Native Asteraceae Blue lettuce Lactuca tatarica (L.) C.A. Mey. subsp. pulchella (Pursh) Stebbins Native Asteraceae Pineappleweed Matricaria discoidea D.C. Native Asteraceae Common groundsel Senecio vulgaris L. Alien Asteraceae Perennial sow-thistleh Sonchus arvensis L. Alien Asteraceae Annual sow-thistle
species Sonchus asper (L.) Hill & S. oleraceus L. Alien
Asteraceae Dandelioni Taraxacum officinale G. H. Weber ex Wiggers Alien a May include scouring rush (Equisetum hyemale L.) in 1980s and 1990s. b Includes native species, western barnyard grass (Echinochloa microstachya
(Wiegand) Rydb.). c Includes native species, pale smartweed (Polygonum lapathifolium L.). d Includes native species, net-seeded lamb's-quarters (Chenopodium berlandieri var.
zschackei (Murr) Murr ex Asch.). e Includes ridge-seeded spurge (Euphorbia glyptosperma Engelm.). f Includes native species, western bluebur (Lappula occidentalis (S. Watson)
Greene). g Includes native species, false cleavers (Galium spurium L.). h Includes a group called sow-thistle species in the 1970s. i Includes red-seeded dandelion (Taraxacum erythrospermum Andrz. ex Besser).


Eradicating carpet burweed (Soliva sessilis Ruiz & Pavón) in Canada
David F. Polster Polster Environmental Services Ltd. 5953 Deuchars Drive, Duncan. BC V9L 1L5.
Carpet burweed, Soliva sessilis, is well adapted to the mild, moist winters and dry summers of coastal British Columbia. Originally from South America, carpet burweed was first found in Canada at Ruckle Provincial Park on Salt Spring Island, BC, in 1996. In 2005, it was found at three other provincial parks as well as at a major City of Victoria park and at a site in the new Gulf Islands National Park reserve. Funding was acquired by the Invasive Plant Council of British Columbia (IPC) from four levels of government and a program designed to eradicate this plant in Canada was established. Two forums were held by the IPC with all interested parties to garner support. An initial assessment of the potential economic impacts of this species was conducted. Two botanists were hired to search for the plant at likely locations on southern Vancouver Island and the associated Gulf Islands. An additional search crew was hired to visit all of the private campgrounds and recreational vehicle parks on southern Vancouver Island. Over 175 sites were searched by the two search teams in 2006. Carpet burweed had been found at 23 sites by 2006. A crew was hired to treat all of the sites where carpet burweed was found. Treatments consisted of either hand pulling where population levels were low or burning with propane torches. A total of 53 person days were spent controlling carpet burweed in this program. Eradication success is not assured, although failure to act at this point would ensure that the plant would become well established in Canada.
Introduction
Management of alien invasive plants is becoming an increasingly important part of maintaining the ecological integrity of natural ecosystems and protecting the economic values of human endeavours (Myers and Bazely 2003; Polster et al. 2006). It is clear that prevention of invasions is the most effective strategy for avoiding the impacts associated with these species. Failing that, the early detection and rapid eradication of the invading species is much more effective than waiting until the plant is well established when significant expenditures may fail to provide satisfactory management of the species (Barnard and Jackson 2005). The Invasive Plants Council of British Columbia (IPC) was founded in 2003 to provide coordination of invasive plant issues in the province. Recognizing that carpet
72 Eradicating carpet burweed in Canada
burweed (Soliva sessilis Ruiz & Pavón) was at an early stage of invasion in BC and that a number of different parties were involved in dealing with this plant, IPC decided that a coordinated effort was required if this plant was to be eradicated.
Eradication of an invasive species is a difficult task and one that has rarely been accomplished once the species is well established (Rejmánek and Pitcairn 2002). On small islands or as isolated occurrences eradication has been accomplished (Myers et al. 2000; Panetta 2007). However, over broader areas where there are a variety of locations to which the species can move, eradication of invasive species becomes increasingly difficult. The goal of eradicating carpet burweed in Canada was recognized as an ambitious undertaking by the stakeholders. However, failure to act at an early stage would eliminate or severely inhibit the possibility of eradication in the future. This paper provides a synopsis of the steps that IPC and other organizations have taken in an attempt to eradicate carpet burweed. It is recognized that the outcome of this program is very much in doubt and it may be that significant resources will be devoted to this project only to find that the plant is too well established and that repeated introductions will prevent permanent eradication. The only satisfaction from such a situation arises from the fact that eradication was attempted, a heightened awareness of this species was established and it provides the lesson that efforts to tackle newly established invasive species must be started earlier and with more vigour.
Brief history of the carpet burweed invasion in British Columbia
Carpet burweed was first found in Canada in Ruckle Provincial Park on Salt Spring Island, BC in 1996. It is unknown how it was introduced into Canada or even if Ruckle Provincial Park was indeed the first site in Canada where this species has established. The plant is well known in the United States and was first recorded in California in 1836. In addition to California, it is currently found in Alabama, Arkansas, Florida, Georgia, Louisiana, North Carolina, Oregon, South Carolina, Tennessee, Texas, Virginia and Washington (USDA Plant Profile http://plants.usda.gov/java/profile?symbol=SOSE2). In 2005 it was found at three additional provincial park sites (Rathtrevor, Cowichan River and French Beach), a city park (Beacon Hill Park in Victoria, BC) and on D’Arcy Island, part of Gulf Islands National Park reserve. In 2006 the plant was discovered in another provincial park (Smelt Bay), a municipal park (Uplands Park in Oak Bay, a suburb of Victoria) and 15 privately owned campgrounds, including one in Tsawwassen on the BC mainland.

Polster 73
Biology of carpet burweed
Figure 1. Carpet burweed (Soliva sessilis Ruiz & Pavón) grows well in lawns and grassy areas.
Carpet burweed (Figure 1) is a small, prostrate annual (Ray 1987) that has been found to germinate intermittently in BC from October through the winter until July (IPC 2006). It is a member of the Asteraceae with finely dissected leaves. The flowers form in the axils of the leaves and/or branches or for late germinating plants at the root crown. Each inflorescence produces 10 to 12 achenes, each with a single sharp spine. The ripe achenes sit on the receptacle pointing upward and attach readily to any soft object that contacts them. The plants dry over the summer although the achenes remain pointing upward, ready to attach to any soft object (e.g. tires, shoes, foot, tent floor, back pack, etc.) that comes in contact with them. Most seeds are dropped within a few meters of where they are picked up, although in
74 Eradicating carpet burweed in Canada
some cases, the seeds can be carried great distances on fabric such as tent floors and backpacks.
Eradication efforts
Two discrete but interconnected methodologies were applied: 1) development of consensus among land owners and managers with carpet burweed on their sites; and, 2) on the ground eradication efforts. These are discussed in the following sections.
Developing consensus The IPC recognizes that effective invasive species management requires
cooperation among those who have the plant on land they own or manage. There is little point in mounting management campaigns on particular sites while the plant to grow unchecked in neighbouring areas. The first step in the development of a cooperative program of carpet burweed management was the organization of a meeting among affected parties on February 21, 2006. The current status of the plant was confirmed and information on the potential environmental and economic impacts of unchecked spread of the plant was outlined at this meeting. The meeting also sought to obtain a consensus for further work on carpet burweed.
Prior to the meeting a report on the economic, social, and environmental impacts of carpet burweed in other parts of the world was commissioned by IPC (Cranston 2006a). Although little information was found on the direct economic impacts of the plant, the study documented that carpet burweed has become a major nuisance weed where it has become established outside its natural range. A follow-up report was prepared by Cranston (2006b) summarizing discussions with researchers around the world. Internationally carpet burweed is seen as a pest of poorly maintained lawns and playing fields. A number of international experts encouraged the IPC to attempt to eradicate carpet burweed in Canada (Cranston 2006b).
A second meeting was held on May 9, 2006. Results of work conducted since the February meeting were presented and the participants decided to work together to eradicate carpet burweed in Canada, if possible. This meeting resulted in the field program discussed in the following section as well as the commitment to have an additional meeting in the winter to re-assess the status of carpet burweed and plan future actions.
On the ground efforts On the ground efforts organized by the IPC to address the spread of carpet
burweed consisted of two phases: 1) searching for sites with carpet burweed present; and 2) treating the populations that were found. Clearly defining where infestations are located is the first step in development of a treatment plan. The
Polster 75
original area of infestation was thought to be Ruckle Provincial Park, so search efforts were directed towards similar habitats elsewhere. A total of 54 coastal bluff sites were searched. A second search was undertaken by two teams of searchers. This search focused on the private campgrounds and recreational vehicle sites. A total of 108 sites were searched during this second phase. An additional 12 sites were searched by others. In addition, stakeholders were advised to search all sites in their jurisdiction that might have carpet burweed.
Once carpet burweed was found at a site, the site manager or owner was notified and treatment was arranged. During the 2006 season, treatments consisted of either hand pulling small patches of a few plants, or burning patches with more than a few plants using propane fired hand torches (Figure 2). Small pin flags were used to identify locations of patches in larger lawn areas. This allowed one person to search for carpet burweed while another person followed with the torch. Where large, continuous patches required burning, two people were engaged in burning. The City of Victoria, one of the stakeholders, modified an asphalt heater to serve as a carpet burweed burner. This was towed behind a tractor and could burn approximately 1 m2 at a time. At some sites, the infested areas were fenced to prevent movement of carpet burweed seeds from plants that had been missed in the burning to other areas.
Preliminary outcomes of eradication efforts
A total of 53 person days were spent burning and picking carpet burweed patches by the IPC crew in 2006. Stakeholder crews spent additional time treating carpet burweed. Table 1 provides a summary of the locations where carpet burweed was found and treated during the 2006 season and the approximate extent of the infestation at each location. A total infested area of slightly over 8 ha was treated. Given that this is much less than the 1,000 ha that Rejmánek and Pitcairn (2002) estimate as the upper limit of infested areas that might theoretically be eradicated, there appears to be the potential to achieve eradication. However, Panetta and Timmins (2004) suggest that the only way to achieve eradication is to have the rate of plant removal greater than the rate of increase at all population densities. As can be seen with the example of Ruckle Provincial Park discussed below, once population densities reach a low level, finding and removing the last remaining plants becomes increasingly difficult.
Large infestations occur at Ruckle Provincial Park where the species was first found and at the Thetis Lake RV and Campground. However, these infestations differ in their characteristics. The infestation at Ruckle Provincial Park has been treated by various means (chemical, hot water, and hand picking) over the past 10 years and the number of plants within the large (5.5 ha) infestation is relatively low, while the Thetis Lake RV and Campground site was not previously treated and the carpet burweed formed a dense carpet over much of the ground. It is possible that

76 Eradicating carpet burweed in Canada
had control efforts not been undertaken continuously at Ruckle Provincial Park, the carpet burweed cover would have been similar to the population found at the Thetis Lake RV and Campground site.
Figure 2. Patches of carpet burweed are burned (as demonstrated by Dave Polster) using hand held propane fired roofing torches.
In some cases, it was possible to fence the infested areas so that carpet
burweed seed would not be tracked into new areas by vehicles and people. However, many of the private campgrounds were not fenced and it is possible that carpet burweed plants that were not treated during the 2006 season have gone to seed and will continue to spread. The case of Ruckle Provincial Park illustrates this point. Treatment at Ruckle Park has been constrained by the presence of a rare plant, Macoun’s meadow-foam (Limnanthes macounii Trel.). Many native coastal bluff species would be killed if an herbicide or burning were widely used in an attempt to kill isolated individual carpet burweed plants. For this reason, and due to reluctance on the part of Salt Spring Island residents to accept the use of herbicides for invasive species control, herbicides have not been used at Ruckle Park (although

Polster 77
herbicides were tested on a limited basis at Ruckle Provincial Park). Hand picking and burning have been the methods of control of choice for Ruckle Provincial Park. However, single carpet burweed plants growing among grasses and other herbaceous species are extremely difficult to see and to treat. This allows the plants to complete their life cycle and without measures to prevent vehicles and people from accessing the area, seeds may potentially spread over a wider area. However, if access is controlled these undetected plants flower and set seed without the seed being spread and the resulting second generation of plants forms a clump surrounding the parent plant. These clumps are easy to see and to treat. Controlling access may be as simple as establishing formal tent pads and trails so that park users are not walking through or erecting tents in areas that are potentially infested with carpet burweed. Care would be required to prevent damage to the sensitive ecosystems from the tent pads and trails.
The distribution of infested areas suggests that the spread of carpet burweed plants from areas of infestation into non-infested areas follows several pathways. For short distances, the seeds are carried on the soles of shoes and this method of dispersal is probably the manner in which the plant is spread around a campground such as Ruckle Provincial Park or Thetis Lake RV and Campground. However, over long distances, seed is carried on the floor of tents, or on backpacks and other camping equipment. The case of the Cattle Point population in Uplands Park appears to have resulted from camping equipment being either loaded or unloaded from kayaks. A second small location at Cattle Point could well have arisen from the initial infested area by foot traffic. The D’Arcy Island site may have resulted from a tent floor because the plants were found in an ideal natural tenting area. The most heavily infested area of the Thetis Lake RV and Campground site was the tenting area, suggesting that the plants were brought in on the floor of a tent and then spread from there. The infestation in Thetis Lake Regional Park probably resulted from the adjacent Thetis Lake RV and Campground site through two separate introductions. The parking lot infestation probably resulted from seed carried on camping equipment that had been moved from the infested Thetis Lake RV and Campground site and placed in the grass beside the parking lot as a vehicle was unloaded. The infestation by the beach in the regional park site was clearly created by foot traffic from the Thetis Lake RV and Campground site as the plants were found on a direct line along the trail to the Thetis Lake RV and Campground site to the beach.
The distribution of carpet burweed in Rathtrevor Provincial Park showed similar patterns. The three main areas of infestation are tenting sites. The small location adjacent to the two larger group camping area sites is along a pathway towards the beach and probably resulted from foot traffic. The two smaller walk-in locations are sites where park users would have walked such as garbage can locations and towards the beach. The Parking Lot 5 site at Rathtrevor is probably where gear was loaded from vehicles coming from infested areas to the beach,

78 Eradicating carpet burweed in Canada
Table 1. Sites where carpet burweed was present and treated in 2006.
UTM Coordinates(zone 10 U)
Site
Northing Easting
Jurisdiction Area of infestation
(m2) (approx.)
Beachcomber RV 5378403 473193 Private campground 2002 Beacon Hill Park (dog run) 5361792 472831 City of Victoria park 1001 Beacon Hill Park (playground) 5362404 473167 City of Victoria park 2001 Bella Pacifica Campground Tofino 5445741 288490 Private campground 1502 Big Tent RV and Campground 5463682 406553 Private campground 1502 Cattle Point (Uplands Park) 5365045 478306 Muni. of Oak Bay 1001 Cowichan River Provincial Park 5402576 434003 Provincial Park 101 D’Arcy Island (GI National Park) 5379525 479885 National Park 101 French Beach Provincial Park 5360418 430036 Provincial Park 1001 Island View RV Campground 5380501 472830 Private campground 6002 Jordan River Campground 5363606 421962 Forest Company site 1002 KOA Victoria West Campground 5377260 458218 Private campground 2002 Living Forests RV Site 5442762 433260 Private campground 6002 Rathtrevor Group Site 1 5463459 407661 Provincial Park 2001 Rathtrevor Group Site 2 5463477 407679 Provincial Park 1501 Rathtrevor Group Site 3 5463467 407734 Provincial Park 101 Rathtrevor Walk-in Site 1 5464231 407994 Provincial Park 2001 Rathtrevor Walk-in Site 2 5464082 407954 Provincial Park 101 Rathtrevor Walk-in Site 3 5464085 407928 Provincial Park 101 Rathtrevor Parking Lot 5 5463331 408069 Provincial Park 501 Ruckle Provincial Park 5402068 472933 Provincial Park 50,0001,3
Ruckle Provincial Park (exclosure) 5402117 472996 Provincial Park 5,0001,3 Smelt Bay Provincial Park (Cortes Is.) 5544059 357004 Provincial Park 101 Sooke River RV Site 5360242 447469 Private campground 2002 Sunny Shores Resort & Marina 5359888 450701 Private campground 4002 Thetis Lake Regional Park 5368064 465330 Regional Park (CRD) 2001 Thetis Lake RV & Campground 5367811 465350 Private campground 22,0002 Westwood Lake RV & Campground 5446134 427473 Private campground 1002 Ucluelet Campground 5424727 312705 Private campground 1502 Total 81,160
1 Site treated by stakeholder 2 Site treated by ICP Crew 3 Work on carpet burweed reductions at Ruckle Provincial Park has reduced
numbers but not the extent of the infestation so although the infested area is large, the plant density is very low.

Polster 79
although the parking lot was sometimes used as an overflow camping area and it may be that the carpet burweed arrived via a tent floor. The Cowichan River Provincial Park site was located in the parking lot immediately adjacent to the walk-in camp pads, a logical spot for carpet burweed seed to be dislodged from camping equipment carried from other walk-in campgrounds. By understanding the modes of movement of this species, searches and treatments can be focused in areas where this plant is likely to occur.
The carpet burweed infestations that were found in the private RV and campground sites tended to be relatively large and suggest that the plant has been in these areas for a number of years. It may be that these infestations represented independent introductions from infested areas such as the western United States, although it may be that these infestations arose by spread from older Canadian populations. The possibility of continued introductions from sites outside of Canada could make eradication of this plant in Canada impossible but if visitor information and phytosanitary programs were established, the re-introduction of carpet burweed populations could be minimized.
Carpet burweed on southern Vancouver Island and the Gulf Islands area appears to germinate over an extended period from October to May with some seeds remaining un-germinated right through the winter. This delayed germination makes finding the plant very difficult as areas can be searched early in the season with no plants found while the same site may show plants later in the season. In addition, the ability of this plant to act as a true annual, as well as a winter annual, with seed set in the summer dormant until spring germination may extend its range into colder areas. It is clear that there are significant areas in Canada into which this plant could spread if it was able to survive winter conditions.
Conclusions
Eradication of carpet burweed in Canada may be impossible because re-introductions may re-establish populations of this species after control activities. The frequent occurrence of this in swards of grass among rare species limits treatment methods such as burning or herbicides that may be applied. The small stature of individual plants makes searches difficult. Furthermore effective seed dispersal, adapted to human assistance, militates against assured eradication. Educating people to control carpet burweed has proven difficult because carpet burweed plant appears similar to a number of other plants that are often found in similar sites and false positive reports of occurrences have been received.
Although eradication may not be possible, the program conducted by IPC has significantly reduced carpet burweed populations in Canada and has allowed management to move in the direction of eradication. Management efforts also educate those responsible for sites with carpet burweed present and may help improve prospects for future management given this greater awareness.
80 Eradicating carpet burweed in Canada
The process that IPC used to establish collaboration among stakeholders and then implement an eradication program could be applied to a wide range of invasive plants. If effective management of new introductions is to be achieved, programs like this, which build cooperation among affected parties and provide on-the-ground programs that are tailored to the specific species, will need to be developed. The carpet burweed program has demonstrated that such a model is possible, although we will have to wait and see if it is effective in the long term.
Literature cited
Barnard, P., and Jackson L. 2005. Invasive species – a global issue, with global solutions. in Proceedings of Biodiversity Loss and Species Extinctions: Managing Risk in a Changing World, a Global Synthesis Workshop convened at the IUCN World Conservation Forum, 18-20 November, 2004, Bangkok, Thailand. 4 p. http://www.iucn.org/congress/2004/documents/outputs/ biodiversity-loss/global-issue-barnard-jackson.pdf. Accessed July 3, 2007.
Cranston, R. 2006a. Carpet Burweed (Soliva sessilis). Further Investigations – Economic, social and environmental impacts. Unpublished report prepared for the Invasive Plant Council of British Columbia, Williams Lake, BC. March, 2006. 8 p.
Cranston, R. 2006b. Carpet Burweed (Soliva sessilis) Further Investigations – Economic, social and environmental impacts. Unpublished report prepared for the Invasive Plant Council of British Columbia, Williams Lake, BC. May, 2006. 11 p.
IPC (Invasive Plants Council of British Columbia). 2006. Early detection and rapid response action plan. Carpet Burweed (Soliva sessilis). A collaborative approach to preventing establishment in BC. Williams Lake, BC: Invasive Plant Council of British Columbia. http://www.invasiveplantcouncilbc.ca/ invasiveplants/carpetburweed/BurweedEDRR.pdf. Accessed July 3, 2007
Myers, J. H., D. Simberloff, A. M. Kuris, and J. R. Carey. 2000. Eradication Revisited - Dealing with exotics. Trends Ecol. Evol. 15:316-321.
Myers, J. H., and D. R. Bazely. 2003. Ecology and Control of Introduced Plants. Cambridge, UK: Cambridge University Press. 313 p.
Panetta, F. D. 2007. Evaluation of weed eradication programs: containment and extirpation. Divers. Distrib. 13:33-41.
Panetta, F. D., and S. M. Timmins. 2004. Evaluating the feasibility of eradication for terrestrial weed incursions. Plant Prot. Q. 19:5-11.
Polster, D. F., J. Soll, and J. Myers. 2006. Managing northwest invasive vegetation. Pages 374-392 in Apostol, D. and M. Sinclair, eds. Restoring the Pacific Northwest: The art and science of ecological restoration in Cascadia. Washington, DC: Island Press. 475 p.

Polster 81
Ray, M. F. 1987. Soliva (Asteraceae: Anthemideae) in California. Madroño. 34:228-239.
Rejmánek M., and M. J. Pitcairn. 2002. When is eradication of exotic pest plants a realistic goal? Pages 249-253 in C.R. Veitch and M. N. Clout, eds. Turning the Tide: the eradication of invasive species. Gland, Switzerland and Cambridge, UK: IUCN SSC Invasive Species Specialist Group. IUCN.

Towards an invasive plant action plan for Ontario’s forests
Michael Irvine Ontario Ministry of Natural Resources, 70 Foster Drive, Suite 400, Sault Ste Marie, ON
P6A 6V5 [email protected]
Invasive alien plants are a cause for concern in Ontario because of their potential for environmental degradation and their impact on native species. Ontario’s Crown forests are a special challenge for invasive plant management because of their great size, their extensive management, and the statutory requirement to maintain their biodiversity. An invasive plant action plan that will protect Ontario’s forests will also include other land uses in Ontario. Significant steps have been taken, including the work of the Ontario Invasive Plants Working Group and the establishment of an Ontario Biodiversity Council. Establishing systems for early detection and response to invasive plants will require coordination and cooperation between government and non-government groups, and developing linkages with adjacent jurisdictions.
Introduction
Ontario’s forests are huge; they cover over 70 million hectares (OMNR 2002). They have a low human population density and a low economic value per hectare. Because they are public land, there are few restrictions on access, and they are extensively used for camping, hunting, fishing and other recreational activities. Ontario’s forests are used for recreation by people across central North America, an area that is home to many millions of people. Linear developments like pipelines and transmission lines, and the movement of people and equipment associated with forestry and resource extraction contribute to non-native plant introductions. There is great potential for movement of invasive plants from other parts of Canada and the United States.
Most forests in Ontario are semi-natural systems, with low inputs and extensive management. Invasive plants do not respect arbitrary distinctions between forestry and other land uses; indeed these distinctions are hard to make when one considers semi-natural areas within cities, farm woodlots, industrial corridors within the commercial forest zone, etc. Any invasive plant action plan targeting Ontario’s forests will necessarily include other land uses.
According to the Flora Ontario database (Newmaster et al. 2005), Ontario’s flora comprises 4717 species, of which 1087 (23%) are considered introduced. Among the vascular plants, the percentage of introduced species is 34%, reflecting Ontario’s status as a meeting place, not with a long history of being visited by
84 Towards an invasive plant action plan for Ontario’s forests
travelers as Great Britain (46%, Crawley 1987 as cited in Newmaster et al. 2005), but more heavily visited than continental Alberta (16%, Rejmánek and Randall 1994).
Ecological principles
Richardson et al. (2000) provided a useful model for understanding plant invasions. Consistent with this model, only a tiny proportion of plant species that reach Ontario are able to invade natural habitats. Species such as garlic mustard (Alliaria petiolata (M. Bieb.) Cavara & Grande) that are able to invade natural habitats and prevent tree seedling establishment are of particular concern in forestry; natural recruitment is an important and sometimes the only means of renewal in many forest systems.
Following Pearl’s (1925) idealized model for species invading new environments, invasive plants tend to follow a logistic growth curve with a long lag phase (as the plant adapts to the new environment), an exponential growth phase, which slows as density dependent feedback limitations enforce an asymptotic approach to some maximum level or carrying capacity.
It is useful to think of where we would place some of our invasive plant species along this curve. For example, purple loosestrife (Lythrum salicaria L.) was asymptotically approaching carrying capacity in Ontario, as it has successfully invaded most suitable habitats. The introduction of the biological control agents Galerucella calmariensis and G. pusilla (Coleoptera: Chrysomelidae) have reduced the abundance and environmental impact of purple loosestrife (Blossey 1996).
Some other species such as garlic mustard, common buckthorn (Rhamnus cathartica L.), and dog-strangling vine (Cynanchum rossicum (Kleopow) Bordihi [= Vincetoxicum rossicum (Kleopow) Barbar.]) are now in the exponential growth phase, or beyond, but have not yet reached carrying capacity in Ontario. This is when they are most likely to catch the attention of a concerned public, and when calls for action toward their control will be loudest (see Figure 1). These species may be beyond the point when an eradication effort is likely to succeed.
Species like oriental bittersweet (Celastrus orbiculata Thunb.), giant hogweed (Heracleum mantegazzianum Sommier & Levier) or marsh sow-thistle (Sonchus palustris L.) may still be limited enough in distribution to be effectively eradicated in Ontario. Still other plant species are probably in the early lag phase, and have so far escaped detection. Mile-a-minute weed (Polygonum perfoliatum L.) and Japanese stilt grass (Microstegium vimineum (Trin.) A. Camus) are in New York State within a few hundred kilometres of Ontario, where they are causing havoc in forest ecosystems, and are adapted to our climate (T. Weldy and E. McGowan, personal communications). Either of these species may already be established in Ontario.

Irvine 85
Figure 1. Dog-strangling vine (Cynanchum rossicum (Kleopow) Bordihi) infestation in a red pine (Pinus resinosa Ait.) plantation at the Orono Forest Station at Orono, Ontario. Photo credit: Darren Derbowka, Ontario Forest Research Institute.
Both the boreal and the Great Lakes-St. Lawrence forests are disturbance-
adapted ecosystems. Depending on the nature of disturbance (fire, wind, insect infestation), sites are quickly dominated by seed banking species, sprouting species, wind borne species and species with serotinous cones. We can think of forest plant invasions as a special case of succession (Davis et al. 2001). Following Pickett et al. (1987), the determinants of succession are site availability, differential species availability and differential species performance.
Site availability Invasibility of natural systems (i.e., site availability in the language of
succession) is related to species richness and the degree to which available niches are occupied (Tilman 1997). Consider the case of an afforestation site on old agricultural land north-east of Toronto. The site contains red pine (Pinus resinosa Ait.) but native flora which once occupied the site is gone (G. Bales personal
86 Towards an invasive plant action plan for Ontario’s forests
communication; M. Irvine personal observation). This is a community that is susceptible to invasions because of the many unfilled niches (Tilman 1997) following species lost in the transformation from forest to agriculture and back again. Compare this to a natural stand of eastern white pine (Pinus strobus L.) on a site near the Ottawa River. The eastern white pine site has been minimally disturbed except for periodic selective harvests, and still contains its native understorey flora. In the first site we have failed to follow the wise counsel of American forester and conservationist Aldo Leopold (1953) who advised that “To keep every cog and wheel is the first precaution of intelligent tinkering”. We have lost some critical parts of that forest plant community, which may explain why it has been invaded by dog-strangling vine.
Differential species availability Conditions or disturbances that result in unnaturally high numbers of
herbivores will shift differential species performances. A plant with natural defences against herbivores like Hercules' club (Aralia spinosa L.) will differentially prosper in environments with high ungulate populations because its stems are covered with sharp spines.
Recruitment is an important consideration in forest dynamics, and is the species availability part of Pickett’s model. Plant species that produce large numbers of wind-blown seed, or produce berries with seeds distributed by birds, have a great advantage in terms of differential species availability since the average dispersal distance for many of our forest species is mere metres per generation (Ribbens et al. 1994). Invasive species such as princess tree (Paulownia tomentosa (Thunb.) Sieb. & Zucc. ex Steud.) with its windborne seeds or mile-a-minute weed with its enticing berries will be differentially more available to fill disturbed sites.
Differential species performance Baker (1965) proposed a list of characteristics of weeds. Broad germination
requirements, extended seed longevity, rapid growth, continuous seed production, self-compatibility, wind pollinated or no reliance on specialized pollinators, high fecundity, broad seed production requirements, and adaptations for short- and long-range dispersal, are characteristics frequently found among invasive plants and contribute to differential species performance. For example, dog-strangling vine (Figure 1) has many of these characteristics, including broad germination requirements, self-pollination, adaptations for non-specialist insect pollination, high seed production, and adaptations for long-range dispersal (DiTommaso et al. 2005).
Towards a multi-agency action plan for invasive plants
The Ontario Invasive Plants Working Group published “Sustaining Biodiversity: A Strategic Plan for Managing Invasive Plants in Southern Ontario”

Irvine 87
(Havinga 2000). This document is a call to action on invasive plants; it provides a framework and strategy for further action. This document states that, “It is hoped that the strategic plan will be widely endorsed, supported and implemented, and that many partners will come forward to participate in this endeavour.” This is indeed necessary if the spirit of this strategy is to be expanded to include all of Ontario and all agencies involved in invasive plant management.
In Ontario, the Ontario Ministry of Agriculture and Food is responsible for the Weed Control Act, a law written to protect agricultural interests. Invasive plants in forests or natural areas that are not a threat to agricultural production are not subject to this act. The current list of noxious weeds in the associated regulation includes wild carrot (Daucus carota L.), Canada thistle (Cirsium arvense (L.) Scopoli) and other species that are widely distributed across the province. The noxious list also includes native species such as milkweeds, several of which are provincially rare and possibly at risk. The Weed Control Act has the power to be an effective tool in managing invasive plants, but to do this its focus needs to be expanded beyond agriculture, and the list of noxious weeds revised periodically to reflect new priorities and a broader understanding of the environmental and economic impacts of invasive plants.
The Ontario Ministry of Natural Resources (MNR) is responsible for the Crown Forest Sustainability Act under which “large healthy, diverse and productive Crown forests and their associated ecological processes and biological diversity should be conserved”. Recognition of the need to conserve biodiversity led to Ontario’s Biodiversity Strategy (OMNR 2005). This strategy calls for the establishment of a broad-based Ontario Biodiversity Council that will guide its implementation. This council can coordinate implementation and planning, if invasive plants are identified as a priority. The council comprises executives from many stakeholder groups and the Minister of Natural Resources; it has an important role to play in an Ontario plan for managing invasive plants.
When purple loosestrife was expanding in Ontario, the Ontario Federation of Anglers and Hunters (OFAH) developed a program with MNR. Project Purple promoted public awareness and control of purple loosestrife. This project was also active in introducing the biocontrol agents (Galerucella spp.) that have controlled purple loosestrife. An Invading Species Awareness Program has been implemented as a cooperative effort between the MNR and the OFAH, and was originally focussed on aquatic pests, but the scope of this program is being expanded to include terrestrial invaders as well.
Other provincial and federal ministries have a role to play in invasive plant management. For example, the Canadian Food Inspection Agency (CFIA) is responsible for terrestrial plants and plant pests. The capacity of the CFIA to address the threat posed by invasive terrestrial plants has recently been increased. The CFIA has initiated an eradication program against Eriochloa villosa (Thunb.) Kunth in southern Québec, and is planning to eradicate a new infestation of jointed goatgrass (Aegilops cylindrica Host) in Ontario. Other agencies, including Ontario

88 Towards an invasive plant action plan for Ontario’s forests
Ministry of Environment and Environment Canada, have mandates with direct or indirect connections to invasive plants.
Invasive plant management
The principles of invasive plant management include risk assessment, prevention, early detection, eradication, containment and control. Of these, the first four aspects are most important, and where most effort should be focussed. These are also the areas that tend to be ignored, focussing instead on invasive plants when they become conspicuous problems, once the time for eradication has passed.
Integrated weed management (IWM) is a strategic approach that is also useful for invasive plants in forests. Effective IWM is knowledge-based, requiring thorough understanding of the plant’s biology, knowledge of the forest system, and control strategies available. It is management by objective; with invasive plants, the objective should be to prevent their introduction or the elimination of nascent foci wherever it is feasible to do so. For species not yet in Ontario, the action threshold would be reached when the first individual of that new invasive plant arrived. For species whose arrival is imminent, public awareness and development of response plans would precede this, though these are not usually considered “action” in the IWM sense. As a management strategy, IWM is integrated and embedded within ecological and social systems. For instance, a proposed biocontrol agent must be screened for its interaction with native or economic species. Social considerations, such as municipal herbicide restrictions, will also affect control strategies.
What needs to be done to create an action plan for invasive plants in Ontario’s forests?
The steps required in creating an action plan for invasive plants in Ontario’s forests are discussed below in terms of five key elements: risk assessment, prevention, detection, response and research.
Risk Assessment The Canadian Food Inspection Agency is building capacity to conduct risk
assessment of species not yet in Canada, or of very limited occurrence, that have the potential to become economic or environmental pests. This is also an essential part of an Ontario plan for managing invasive plants.
The Midwest Invasive Plants Network (MIPN) comprises the states of North and South Dakota, Illinois, Indiana, Michigan, Minnesota, Ohio and Wisconsin. This network has been useful for documenting invasive plants in adjacent states, facilitating knowledge transfer and producing extension materials.
Irvine 89
Ontario’s interaction with this group provides valuable intelligence on the status of potential invaders. Among its many activities, MIPN has developed an early detection-rapid response (EDRR) list for terrestrial plants in the Midwest (MIPN 2006) and is developing a similar list for aquatic plants.
Prevention Many current species of concern [e.g. oriental bittersweet, Norway maple
(Acer platanoides L.), Scots pine (Pinus sylvestris L.), tree of heaven (Ailanthus altissima (Mill.) Swingle)] and potential problem species (e.g. princess tree) are the result of deliberate introductions. Linkages with the horticulture and landscape industries are needed to reduce these.
Knowledge of specific invasive plants of interest from neighbouring states and provinces can provide early warning. For example, knowing that New York has developing infestations of mile-a-minute weed and Japanese stilt grass (Troy Weldy and Ed McGowan, personal communication) gives us warning and time to plan for the protection of natural areas and forest regeneration. This knowledge can also help us to focus our communication efforts and prioritize the application of resources.
Detection There is currently no comprehensive database that shows spatial
distribution of invasive species of interest. The Ontario Invasive Plant Information Service (OIPIS) database is based at the herbarium of the Biodiversity Institute of Ontario (BIO), University of Guelph. The OIPIS database (Newmaster et al. 2005) will integrate existing databases with new reports, in a web-based environment. Empowering amateur collectors is a way to multiply the effectiveness of detection. This was once a role of the Ontario Weed Alert program. Likewise the Northern Ontario Plant Database (NOPD) (Meades 2006) is a website that provides free public access to herbarium records housed in northern Ontario educational and government institutions. Currently, there are over 55,000 herbarium records included in the NOPD.
Dedicated surveys are needed to establish the range or presence of species of interest, and to provide data on undersurveyed areas (Newmaster et al. 2005). The North American Weed Management Association (NAWMA 2002) has developed mapping standards that are being adopted across the continent. Any databases developed in Ontario should be compatible with NAWMA standards.
The Natural Resources and Values Information System (NRVIS 2006) database is the Ontario government’s Geographical Information System (GIS) for managing tabular and spatial geographic information. NRVIS is a natural home for a standardized geo-referenced database of the location of invasive plant species of interest. The challenge will be to link the OIPIS, NOPD, and other records for relevant species in a spatial NRVIS layer, following NAWMA standards.
90 Towards an invasive plant action plan for Ontario’s forests
Response This combined database will be an important tool to identify nascent foci
(Newmaster et al. 2005), and facilitate early detection and rapid response (EDRR), a philosophy that has been successfully applied elsewhere (Westbrooks 2004). For example, although black dog-strangling vine (Cynanchum louiseae (L.) Kartesz & Gandi [= Vincetoxicum nigrum (L.) Moench]) has been in Canada for at least 50 years, and dog-strangling vine has been here for twice that long (DiTommaso et al. 2005), and although both species have been identified as an ecological threat in Ontario for at least 20 years (Kirk, 1985 as cited in DiTommaso et al. 2005), there has been no coordinated response.
Marsh sow-thistle is known in only two locations in North America, both in Ontario (Darbyshire 2002). Given this limited distribution, and the weedy nature of other Sonchus species, this species should be given a high priority for response.
A successful response will include elements of prioritization, coordination, and resource availability. Since this problem goes beyond the area of responsibility of individual Ontario government ministries, and is of vital interest to many stakeholder groups, the response will likewise be multifaceted. An invasive plant action plan for Ontario will detail a mechanism and structure to bring together government and stakeholder groups. With the formation of Ontario’s Biodiversity Council (OMNR 2005), many of the relevant groups have an outlet at the executive levels of their organizations. At an operational or technical level, this may be a role for a reinvigorated Ontario Weed Committee, or a new invasive plant council, following the models of Alberta or British Columbia (IPCBC 2004).
Research Development of effective chemical control including herbicide efficacy
testing, determining the most effective control methods (Lawlor and Raynal 2002), and registration of these products and use-patterns is needed in the short-term for invasive plant management. Non-chemical methods should also be explored, but programs constrained by philosophical anti-herbicide policies are unlikely to be successful for some species such as Phragmites australis (Cav.) Trin. ex Steud. (Warren et al. 2001). For species further along in the invasion process, at the exponential or asymptotic phase, effective management will probably only be achieved with the development of biocontrol agents. Research, especially with species not well known in their homeland, will elucidate the life history of invasive plants, and may provide clues to vulnerable life stages. For example, there are several current research programs to find effective biological control agents for dog-strangling vine (Milbrath 2006; Weed et al. 2007). As in agricultural weed control, control methods will have to be developed for each species in most cases.

Irvine 91
Summary
Ontario’s forests are a unique challenge for invasive plant management, and must be a part of any provincial plan for invasive plants. A successful plan will stress risk assessment, prevention, detection, response and research, recognizing invasions as succession, and following the principles of integrated weed management. There are successful models from other jurisdictions and geographic areas that can be considered as we develop an Ontario plan. The Ontario Biodiversity Strategy is the umbrella under which a plan for managing invasive plants can be developed to conserve Ontario’s biodiversity.
Acknowledgements
I am grateful to two anonymous reviewers who provided helpful and necessary changes, and to David Clements and Stephen Darbyshire for their hard work with this manuscript.
Literature cited
Baker, H. G. 1965. Characteristics and modes of origin of weeds. Pages 147-172 in H. G. Baker and G. L. Stebbins, eds. The genetics of colonizing species. New York, NY: Academic Press. 588 p.
Blossey, B. 1996. The search for patterns or what determines the increased competitive ability of invasive non-indigenous plants? 1996 Symposium Proceedings. California Exotic Plant Council http://www.cal-ipc.org/symposia/ archive/pdf/1996_symposium_proceedings1831.pdf. Accessed July 5, 2007.
Crawley, M. J. 1987. What makes a community invasible? Pages 429-453 in A. J. Gray, M. J. Crawley and P. J. Edwards, eds. Colonization, succession and stability: The 26th Symposium of the British Ecological Society Held Jointly With the Linnean Society of London (Symposia of the British Ecological Society). Oxford, UK: Blackwell Scientific Publications. 494 p.
Darbyshire, S. 2002. Sonchus palustris L. http://nas.er.usgs.gov/taxgroup/plants/ images/Sonchus_palustris_lq.jpg. Accessed July 6, 2007.
Davis, M. A., K. Thompson, and J. P. Grime. 2001. Charles S. Elton and the dissociation of invasion ecology from the rest of ecology. Divers. Distrib. 7:97-102.
DiTommaso, A., F. M. Lawlor and S. J. Darbyshire. 2005. The Biology of Invasive Alien Plants in Canada. 2. Cynanchum rossicum (Kleopow) Borhidi [=Vincetoxicum rossicum (Kleopow) Barbar.] and Cynanchum louisae (L.) Kartesz & Gandhi [= Vincetoxicum nigrum (L.) Moench]. Can. J. Plant Sci. 85: 243-263.

92 Towards an invasive plant action plan for Ontario’s forests
Havinga, D. 2000. Sustaining Biodiversity: A Strategic plan for Managing Invasive Plants in Southern Ontario. Ontario Invasive Plants Working Group. Toronto, ON: City of Toronto. 29 p.
IPCBC (Invasive Plant Council of British Columbia). 2004. Invasive plant Strategy for British Columbia. http://www.invasiveplantcouncilbc.ca. Accessed July 5, 2007.
Kirk, M. 1985. Vincetoxicum spp. (Dog-strangling vines): Alien invaders of natural ecosystems in southern Ontario. Plant Press (Mississauga) 3:130-131.
Lawlor, F. and D. J. Raynal. 2002. Response of swallow-wort to herbicides. Weed Sci. 50:179-185.
Leopold, A. 1953. Round River. New York, NY: Oxford University Press. 146 p. Meades, S. J. 2006. Northern Ontario Plant Database. http://www.
northernontarioflora.ca. Accessed July 5, 2007. Milbrath, L. R. 2006. Swallow-worts (Vincetoxicum spp.): a new target for
biological control. Weed Science Society of America Meeting Abstracts. Vol. 46, No. 126. Lawrence, KS: Weed Science Society of America.
MIPN (Midwest Invasive Plant Network). 2006. Keep a look out for new invasive plants in the Midwest! http://www.mipn.org/ Accessed July 19, 2007.
Newmaster, S. G., S. Ragupathy, C. A. Lacroix, J. Levac, D. R. Clements, B. Booth, M. Irvine, F. W. Bell, M. Cowbrough and J. Alex. 2005. Invasive Alien Plants in Ontario. Popular Summary from Eastern Canadian Vegetation Management Associations Conference. October 4-6, Kingston, Ontario.
NRVIS (Natural Resource Values Information System). 2006. http://www. showcaseontario.com/2000/naturalresourcesvaluesinformationsystem.htm. Accessed July 5, 2007.
NAWMA (North American Weed Management Association). 2002. North American Invasive Plant Mapping Standards. North American Weed Management Association 2002. 34 p.
OMNR (Ontario Ministry of Natural Resources). 2002. Forest Resources of Ontario 2001. State of the Forest Report 2001. Appendix 1. Ontario Ministry of Natural Resources. Toronto, ON: Queen’s Printer for Ontario. 137 p.
OMNR (Ontario Ministry of Natural Resources). 2005. Protecting what sustains us: Ontario’s Biodiversity Strategy. Toronto, ON: Queen’s Printer for Ontario. 44 p.
Pearl, R. 1925. The biology of population growth. New York, NY: Knopf. 260 p. Pickett, S. T. A., S. L. Collins and J. J. Armesto. 1987. Models, mechanisms and
pathways of succession. Bot. Rev. 53:335-371. Rejmánek, M. and J. M. Randall. 1994. Invasive alien plants in California: 1993
summary and comparison with other areas in North America. Madroño 41:161-177.
Ribbens, E., J. A. Silander and S. W. Pacala. 1994. Seedling recruitment in forests: calibrating models to predict patterns of tree seedling dispersion. Ecology 75:1794-1806.

Irvine 93
Richardson, D. M., P. Pyšek, M. Rejmánek, M. G. Barbour, F. D. Panetta and C. J. West. 2000. Naturalization and invasion of alien plants: concepts and definitions. Divers. Distrib. 6:93-107.
Tilman, D. 1997. Community invisibility, recruitment limitation, and grassland biodiversity. Ecology 78:81-92.
Warren, R. S., P. E. Fell, J. L. Grimsby, E. L. Buck, G. C. Rilling, R. A. Fertik. 2001. Rates, pattern and impacts of Phragmites australis expansion and effects of experimental Phragmites control on vegetation, macroinvertebrates and fish within tidelands of the lower Connecticut River. Estuaries 24:90-107.
Weed, A. S., R. A. Casagrande and A. Gassmann. 2007. Prospects for classical biological control of swallow-worts (Vincetoxicum) by insects in North America: search and evaluation of candidate species. Ecology of Rhode Island Conference: Invasive Species: A Threat to Rhode Island’s Biodiversity http://www.uri.edu/ce/rinhs/abstract2007.htm. Accessed July 5, 2007.
Westbrooks, R. 2004. New approaches for early detection and rapid response to invasive plants in the United States. Weed Technol. 18:1468-1471.


Use of the Invasive Alien Plant Program Application to implement applied biological
control in British Columbia
Susan Turner Ministry of Forests and Range, 515 Columbia Street, Kamloops, BC V1S 1E6.
British Columbians have a strong societal sense for protecting their environment and its resources. When faced with the invasion of alien plant species, BC uses the principles of Integrated Pest Management: prevention, inventory surveys and a multitude of treatment tools including mechanical, chemical and biological control. The provincial government’s Invasive Alien Plant Program (IAPP) Application houses the data for management of invasive alien plants in BC: planning, inventory, mechanical, chemical and biological control, the monitoring of each of these activities and biological control agent dispersal. The IAPP Application is structured to track sites and their characteristics as geographic locations. Multiple invasive species with multiple surveys can be inputted for a single geographical site. This allows recording of the change in the invasive plant community over time as well as the level of success of our treatment efforts. A compilation of these data allows assessment of the current set of biocontrol agents in the province for a target plant species. By comparing the spread of Dalmatian toadflax (Linaria dalmatica) to the habitat requirements of the biocontrol agents, it is possible to determine whether sufficient suitable agents exist in the province or whether additional agents must be screened for those areas where current agents do not establish.
Introduction
British Columbians have a strong societal sense for protecting their environment and its resources. These values are reflected in their provincial government, its legislation and its management of Crown lands which consist of approximately 885,600 square km or 93 % of the province (Anonymous 1997) depicted in Appendix 1. The Ministry of Forests and Range’s (MFR) mission also reflects this commitment: To protect, manage and conserve forest and range values through a high performing organization.
When faced with the invasion of alien plant species, BC uses the principles of Integrated Pest Management: prevention, inventory surveys and a multitude of treatment tools including mechanical, chemical and biological control. For example, upon initial sightings of an invasive alien species, mechanical treatment may be used when the infestation is of a size to be managed by this method or when the
96 Implementation of applied biological control in British Columbia
plants reside in a herbicide-restricted area. Chemical treatment (herbicide application) is a necessary and effective tool, however, it is a tool used judiciously.
British Columbia’s legislation for herbicide use, administered by the Ministry of Environment, is protective of the natural environment. For example, the pesticide-free zone required around or along bodies of water, dry streams and classified wetlands is 10 m and BC has no herbicides registered for use against invasive plants in water. Additionally, the herbicide Transline (clopyralid), which can be sprayed within the dripline of a tree, has only been available since 1995 (D. Ralph, personal communication) When an invasive alien species has spread to a significant area where repeated spraying is viewed as not economically feasible, a containment strategy is employed. Under this strategy a perimeter boundary around a heavy infestation is established and no mechanical or chemical treatment is carried out within the perimeter except in special circumstances. Any invasive plant found beyond the boundaries is aggressively treated in an attempt to contain the infestation.
Once an invasive species has spread beyond the ability to manage with mechanical or chemical treatment methods the area is considered to require restoration. Restoration of infested areas is through the use of good resource management practices and the encouragement of healthy biological control agent populations, where available, unless the use of other treatment techniques can be justified with a long-term cost/benefit analysis.
Biological control
Biological control is a key tool used for restoration of environments infested with invasive alien plant species. The BC MFR staff interact with scientists in the international community pursuing biological control agents for our invasive alien plant species of concern. Consortiums of funding agencies are formed to plan and pursue biological control research. The invasive plant’s country of origin is investigated for insects, pathogens, etc., that attack the target plant species. Through these cooperative efforts BC funds research into host specific biological control agents. Host specificity refers to whether a biological control agent only attacks its intended target.
When screening, many candidate biological control agents are investigated. With very little known about many insects, pathogens, and other potential agents around the globe, original lists of candidate agents contain several species that have been found to attack the host plant in its native habitat. Agents that are known to feed on a variety of plant species are excluded. The list may contain agents that attack various parts of the target plant, for example, root-feeders, seed-feeders or defoliators. Over a series of years the candidate agents are put through many screening trials. The target plant and closely related plant species of concern from the participating countries are exposed to the agents at various stages in their life
Turner 97
cycles. The intent of the screening is to determine if the agent can attack and reproduce on the target plant and if it will only do this on the target plant, i.e., is it host specific? If they do attack and develop on non-target plants, they are either removed from the screening process; or, further testing is conducted to determine if these species are less preferred than the target invasive plant or whether it would be avoided in the field if the agent were released (i.e., testing of the species’ ecological host range). Screening also is used to determine which biological control agents will be effective in controlling the target plant.
When an agent has successfully passed the screening process and approval for importation has been obtained, the new biological control agents are shipped into the country, passed through an Agriculture and Agri-Food Canada quarantine facility (Lethbridge, Alberta) and received in BC. Once in BC, the agents are released at pre-determined sites for optimum establishment. These sites are determined from information on the agent’s native habitat, investigation into the provincial government’s Invasive Alien Plant Program (IAPP) Application and ground-truthing. The release sites are in turn tracked in the IAPP Application.
Invasive Alien Plant Program (IAPP) application
The IAPP Application, a web-based Oracle software application launched in fall 2005, houses records of all activities pursued in the management of invasive alien plants in BC: planning, inventory, mechanical, chemical and biological control treatments, the monitoring of each of these activities and biological control agent dispersal. The IAPP Application is structured to track sites and their characteristics as geographic locations. Invasive plant species that invade the sites are then recorded. Multiple invasive species with multiple surveys can be inputted on a single site. This allows recording of the change in the invasive plant community over time as well as the level of success of our treatment efforts.
The IAPP Application consists of two components, a password-accessed Data Entry module and a public-accessed Map Display module. IAPP provides access to multiple organizations for the recording of information where the data are visible to all participants but it is protected so each organization’s data cannot be manipulated by another. Efforts to manage invasive alien plants in BC can, therefore, be coordinated among all participants. The IAPP Application can be accessed on-line at http://www.for.gov.bc.ca/hfp/invasive/index.htm.
With respect to biological control, sites are chosen where restoration is required and where there is a minimal chance of conflicting treatment regimes. Sites are selected following a comparison of habitat requirement information from the countries of origin with existing habitats in BC. Through knowledgeable field staff and recorded and digitized information, such as that contained within the Biogeoclimatic Ecosystem Classification (BEC) system, viewed as a layer in the IAPP Application, extensive information is available for BC.

98 Implementation of applied biological control in British Columbia
The BEC is an ecological classification grouping similar landscapes called ecosystems into hierarchical classifications. The BEC in BC is defined as a particular plant community and its associated physiography, soil and climate that occupy a segment of the landscape (Meidinger and Pojar 1991). For more information on BEC, go to http://www.for.gov.bc.ca/hre/becweb/. The BEC and other layers viewed in IAPP, including the invasive plant layers, are stored in a warehouse housing hundreds of layers containing a variety of data about the landscape of BC. All provincial government ministries store their data layers in this warehouse, the Land Resource Data Warehouse (LRDW), administered by the Integrated Land Management Bureau (ILMB). It is possible to access the LRDW, with permission, and, while using a program such as Arcview, create maps containing the various layers for increasing levels of analysis.
Once a biological control agent has been released on a site, a treatment record is entered into IAPP’s Data Entry module. The sites are viewed in IAPP’s Map Display as spatial polygons of varying sizes: a minimum polygon to represent a UTM co-ordinate; a slightly larger polygon to represent a ‘protected’ location for biological control agents still in the developmental stage; and, polygons that have been digitized to represent the actual size and shape of an invasive plant infestation. Thereafter, a site is monitored to determine if the agent is established and whether any change has occurred in its target host plant population such as changes in density, area and distribution code. Distribution code is a derived combination of density and plant cover. See Part IV Appendices of the MOF Invasive Alien Plant Program (IAPP) Reference Guide for additional information (http://www.for.gov.bc.ca/hfp/invasive/index.htm).
Additionally, the IAPP Application has the ability to house biological control agent dispersal information. This is the tracking of agents as they disperse from the original release site. Dispersal information is used to determine further location requirements for collecting and releasing additional biological control agents on a particular plant species and the habitat preferences of the agents themselves.
Together, the release and dispersal locations, overlaid with a variety of spatial layers displayed in the IAPP Application that depict environmental features such as topography, BEC, wetlands, etc., allow for an increased understanding of the habitat requirements of a particular biological control agent. Predictions can be made of the agent’s ability to infest particular habitat types and locations. In turn, this can give invasive alien plant managers and scientists direction for pursuing new biological control agents and the habitat types they are required to fill.

Turner 99
Applied biological control for Dalmatian toadflax
An example of applied biological control can be seen with Dalmatian toadflax (Linaria dalmatica (L.) Miller) and its complement of biological control agents, in particular, Mecinus janthinus and Rhinusa antirrhini.
Dalmatian toadflax is a short-lived perennial herb that was introduced as an ornamental in the USA in 1894. It originates from the Mediterranean region, from Yugoslavia to Iran, and was cultivated as an ornamental in Europe in the 1500’s (Robocker 1974). Dalmatian toadflax spreads by creeping root stock and seed, each plant potentially producing up to 500,000 seeds (Robocker 1974) that are dispersed mainly by wind and browsing animals. Mature plants are 60 to 120 cm tall. The stems, several per plant, are smooth and light-green and the flowers are ‘snapdragon’ shaped (Powell et al. 1994). The plant is toxic to livestock, however, cattle tend to avoid grazing in toadflax infested stands (De Clerck-Floate and Harris 2002).
Dalmatian toadflax is a stress tolerant plant able to grow in conditions of low temperatures, coarse textured soils and summer drought. Soil types range from sand to gravelly loam and silt loam. Dalmatian toadflax seldom becomes established in healthy, closed plant communities but is located in disturbed soils, cultivated fields, waste areas, gardens, open grassland and transitional forest-grassland (Powell et al. 1994). Dalmatian toadflax is known to exist in the BC BEC zones of Bunchgrass, Ponderosa pine, Interior Douglas-fir, Interior cedar-hemlock, Coastal Douglas-fir, Coastal Western hemlock, Montane spruce and the Sub-boreal spruce.
Efforts to acquire biological control agents for BC Dalmatian toadflax began in the 1960s (De Clerck-Floate and Harris 2002). Since then, several agents have been released:
• Calophasia lunula (defoliating moth) – 1965 • Brachypterolus pulicarius (flower-feeding beetle) – adventive, 1989 • Rhinusa netum (seed-feeding weevil) – adventive • Mecinus janthinus (stem-boring weevil) – 1991 • Eteobalea intermediella (root-feeding moth) – 1991 • Rhinusa antirrhini (seed-feeding weevil) – 1993 • Rhinusa linariae (root-galling weevil) – 1996
Although B. pulicarius and R. netum were not screened for host specificity and petitioned for importation, subsequent research has been conducted on both these insects following their arrival to North America and BC, respectively. Mecinus janthinus, R. antirrhini and R. linariae are actively being spread, by collection and release, across the province while the remaining agents are either spreading of their own accord with minimal assistance (C. lunula, B. pulicarius, and R. netum) or have been unsuccessful to date in the tented conditions previously attempted in Kamloops, BC (E. intermediella).
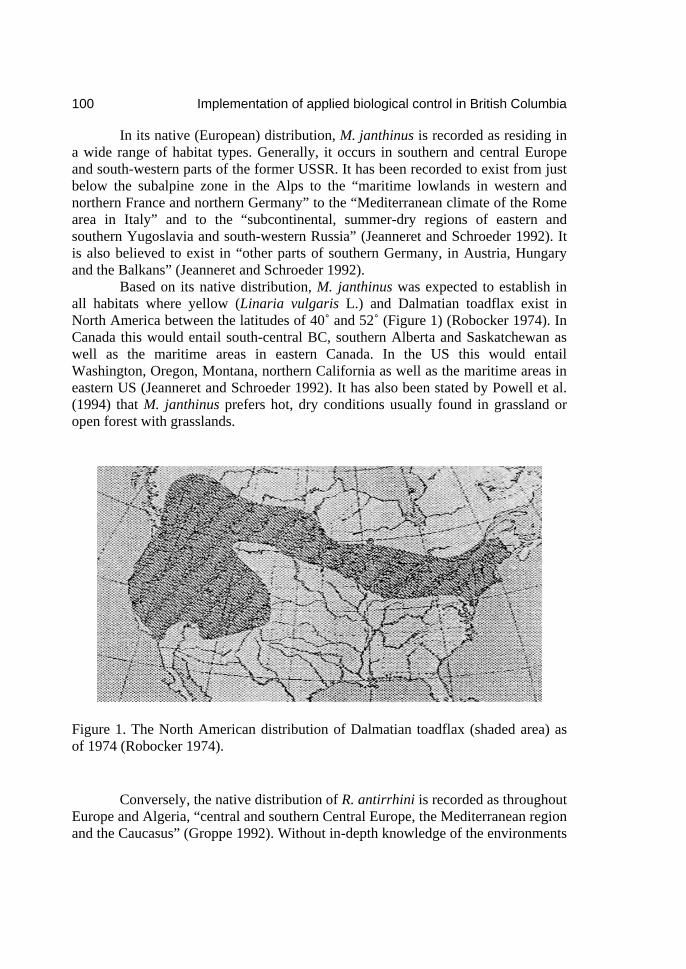
100 Implementation of applied biological control in British Columbia
In its native (European) distribution, M. janthinus is recorded as residing in a wide range of habitat types. Generally, it occurs in southern and central Europe and south-western parts of the former USSR. It has been recorded to exist from just below the subalpine zone in the Alps to the “maritime lowlands in western and northern France and northern Germany” to the “Mediterranean climate of the Rome area in Italy” and to the “subcontinental, summer-dry regions of eastern and southern Yugoslavia and south-western Russia” (Jeanneret and Schroeder 1992). It is also believed to exist in “other parts of southern Germany, in Austria, Hungary and the Balkans” (Jeanneret and Schroeder 1992).
Based on its native distribution, M. janthinus was expected to establish in all habitats where yellow (Linaria vulgaris L.) and Dalmatian toadflax exist in North America between the latitudes of 40˚ and 52˚ (Figure 1) (Robocker 1974). In Canada this would entail south-central BC, southern Alberta and Saskatchewan as well as the maritime areas in eastern Canada. In the US this would entail Washington, Oregon, Montana, northern California as well as the maritime areas in eastern US (Jeanneret and Schroeder 1992). It has also been stated by Powell et al. (1994) that M. janthinus prefers hot, dry conditions usually found in grassland or open forest with grasslands.
Figure 1. The North American distribution of Dalmatian toadflax (shaded area) as of 1974 (Robocker 1974).
Conversely, the native distribution of R. antirrhini is recorded as throughout Europe and Algeria, “central and southern Central Europe, the Mediterranean region and the Caucasus” (Groppe 1992). Without in-depth knowledge of the environments
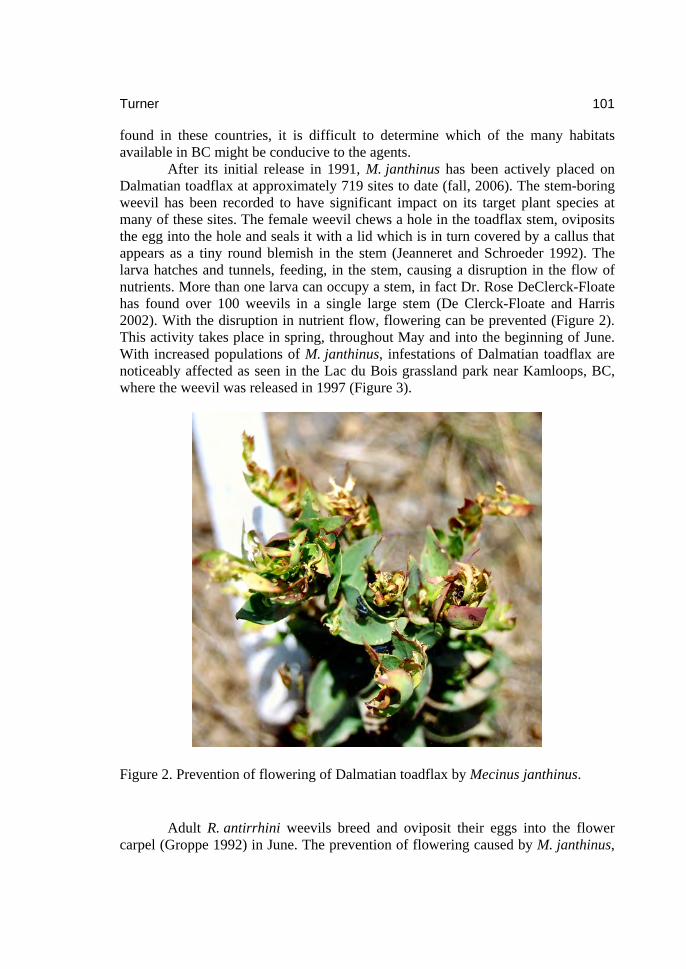
Turner 101
found in these countries, it is difficult to determine which of the many habitats available in BC might be conducive to the agents.
After its initial release in 1991, M. janthinus has been actively placed on Dalmatian toadflax at approximately 719 sites to date (fall, 2006). The stem-boring weevil has been recorded to have significant impact on its target plant species at many of these sites. The female weevil chews a hole in the toadflax stem, oviposits the egg into the hole and seals it with a lid which is in turn covered by a callus that appears as a tiny round blemish in the stem (Jeanneret and Schroeder 1992). The larva hatches and tunnels, feeding, in the stem, causing a disruption in the flow of nutrients. More than one larva can occupy a stem, in fact Dr. Rose DeClerck-Floate has found over 100 weevils in a single large stem (De Clerck-Floate and Harris 2002). With the disruption in nutrient flow, flowering can be prevented (Figure 2). This activity takes place in spring, throughout May and into the beginning of June. With increased populations of M. janthinus, infestations of Dalmatian toadflax are noticeably affected as seen in the Lac du Bois grassland park near Kamloops, BC, where the weevil was released in 1997 (Figure 3).
Figure 2. Prevention of flowering of Dalmatian toadflax by Mecinus janthinus.
Adult R. antirrhini weevils breed and oviposit their eggs into the flower carpel (Groppe 1992) in June. The prevention of flowering caused by M. janthinus,
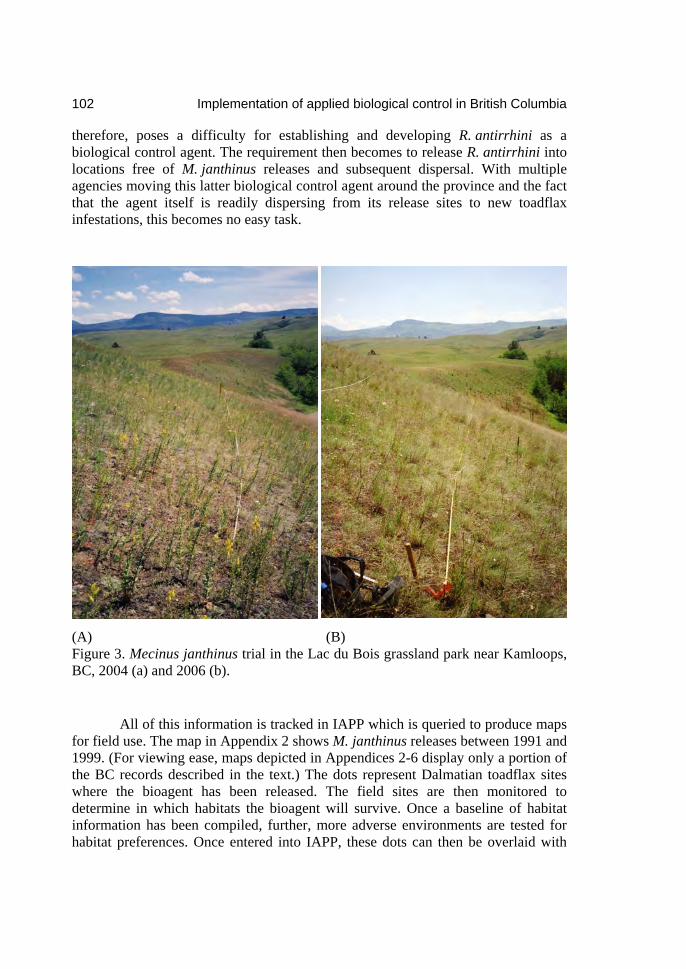
102 Implementation of applied biological control in British Columbia
therefore, poses a difficulty for establishing and developing R. antirrhini as a biological control agent. The requirement then becomes to release R. antirrhini into locations free of M. janthinus releases and subsequent dispersal. With multiple agencies moving this latter biological control agent around the province and the fact that the agent itself is readily dispersing from its release sites to new toadflax infestations, this becomes no easy task.
(A) (B) Figure 3. Mecinus janthinus trial in the Lac du Bois grassland park near Kamloops, BC, 2004 (a) and 2006 (b).
All of this information is tracked in IAPP which is queried to produce maps for field use. The map in Appendix 2 shows M. janthinus releases between 1991 and 1999. (For viewing ease, maps depicted in Appendices 2-6 display only a portion of the BC records described in the text.) The dots represent Dalmatian toadflax sites where the bioagent has been released. The field sites are then monitored to determine in which habitats the bioagent will survive. Once a baseline of habitat information has been compiled, further, more adverse environments are tested for habitat preferences. Once entered into IAPP, these dots can then be overlaid with
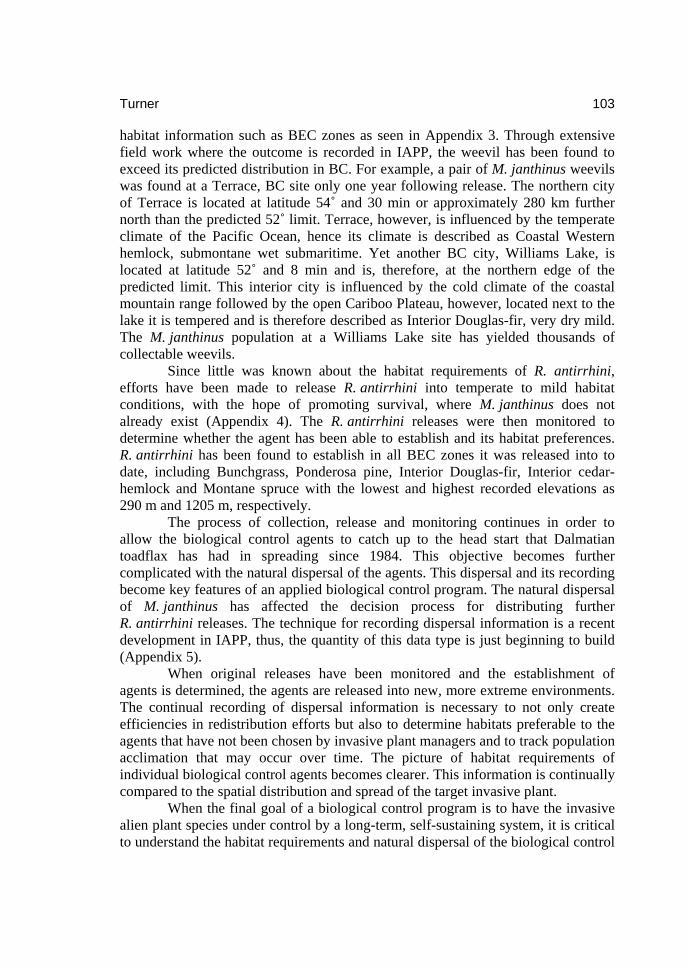
Turner 103
habitat information such as BEC zones as seen in Appendix 3. Through extensive field work where the outcome is recorded in IAPP, the weevil has been found to exceed its predicted distribution in BC. For example, a pair of M. janthinus weevils was found at a Terrace, BC site only one year following release. The northern city of Terrace is located at latitude 54˚ and 30 min or approximately 280 km further north than the predicted 52˚ limit. Terrace, however, is influenced by the temperate climate of the Pacific Ocean, hence its climate is described as Coastal Western hemlock, submontane wet submaritime. Yet another BC city, Williams Lake, is located at latitude 52˚ and 8 min and is, therefore, at the northern edge of the predicted limit. This interior city is influenced by the cold climate of the coastal mountain range followed by the open Cariboo Plateau, however, located next to the lake it is tempered and is therefore described as Interior Douglas-fir, very dry mild. The M. janthinus population at a Williams Lake site has yielded thousands of collectable weevils.
Since little was known about the habitat requirements of R. antirrhini, efforts have been made to release R. antirrhini into temperate to mild habitat conditions, with the hope of promoting survival, where M. janthinus does not already exist (Appendix 4). The R. antirrhini releases were then monitored to determine whether the agent has been able to establish and its habitat preferences. R. antirrhini has been found to establish in all BEC zones it was released into to date, including Bunchgrass, Ponderosa pine, Interior Douglas-fir, Interior cedar-hemlock and Montane spruce with the lowest and highest recorded elevations as 290 m and 1205 m, respectively.
The process of collection, release and monitoring continues in order to allow the biological control agents to catch up to the head start that Dalmatian toadflax has had in spreading since 1984. This objective becomes further complicated with the natural dispersal of the agents. This dispersal and its recording become key features of an applied biological control program. The natural dispersal of M. janthinus has affected the decision process for distributing further R. antirrhini releases. The technique for recording dispersal information is a recent development in IAPP, thus, the quantity of this data type is just beginning to build (Appendix 5).
When original releases have been monitored and the establishment of agents is determined, the agents are released into new, more extreme environments. The continual recording of dispersal information is necessary to not only create efficiencies in redistribution efforts but also to determine habitats preferable to the agents that have not been chosen by invasive plant managers and to track population acclimation that may occur over time. The picture of habitat requirements of individual biological control agents becomes clearer. This information is continually compared to the spatial distribution and spread of the target invasive plant.
When the final goal of a biological control program is to have the invasive alien plant species under control by a long-term, self-sustaining system, it is critical to understand the habitat requirements and natural dispersal of the biological control

104 Implementation of applied biological control in British Columbia
agents. Appendix 6 shows the releases and dispersal of both M. janthinus and R. antirrhini.
Conclusion
Eventually, the compilation of these data will allow an assessment of the current set of biological control agents in the province for a target plant species. Over time, by comparing the spread of Dalmatian toadflax, which will continue until it reaches its ecological limits, to the habitat requirements of the biological control agents, it is possible to determine whether sufficient suitable agents exist in the province and to what efforts invasive plant managers must go to spread these agents, or whether screening of additional biocontrol agents must be pursued.
Literature cited
Anonymous. 1997. Provincial statistics. B. C. Ministry of Sustainable Resource Management.
De Clerck-Floate, R. A. and P. Harris. 2002. Linaria dalmatica (L.) Miller, Dalmation toadflax (Scrophulariaceae), Pages 368-374 in P. G. Mason and J. T. Huber, eds. Biological Control Programmes in Canada, 1981-2000. Wallingford, Oxon, UK: CABI Publishing.
Groppe, K. 1992. Gymnaetron antirrhini Paykull (Col.: Curculionidae). A candidate for biological control of Dalmatian toadflax in North America. European Station Report. Delemont, Switzerland: CAB IIBC, European
Station. 39 p. Jeanneret, P. and D. Schroeder. 1992. Biology and host specificity of Mecinus
janthinus Germar (Col.: Curculionidae), a candidate for the biological control of yellow and Dalmatian toadflax, Linaria vulgaris (L.) Mill. and Linaria dalmatica (L.) Mill. (Scrophulariaceae) in North America. Delemont, Switzerland: CAB IIBC, European Station. 34 p.
Meidinger, D. and J. Pojar. 1991. Ecosystems of British Columbia. B.C. Min. For. Res. Br. Special Report Series 6. 330 p.
Powell, G., A. Sturko, B. Wikeem and P. Harris. 1994. Field Guide to the Biological Control of Weeds in British Columbia. B.C. Min. For. Res. Br. Land Management Handbook Number 27. 163 p.
Robocker, W. C. 1974. Life history, ecology, and control of Dalmatian toadflax. Wash. Agric. Exp. Stn. Tech. Bull. 79. 20 p

Turner 105
Appendix 1. Jurisdictions of British Columbia.
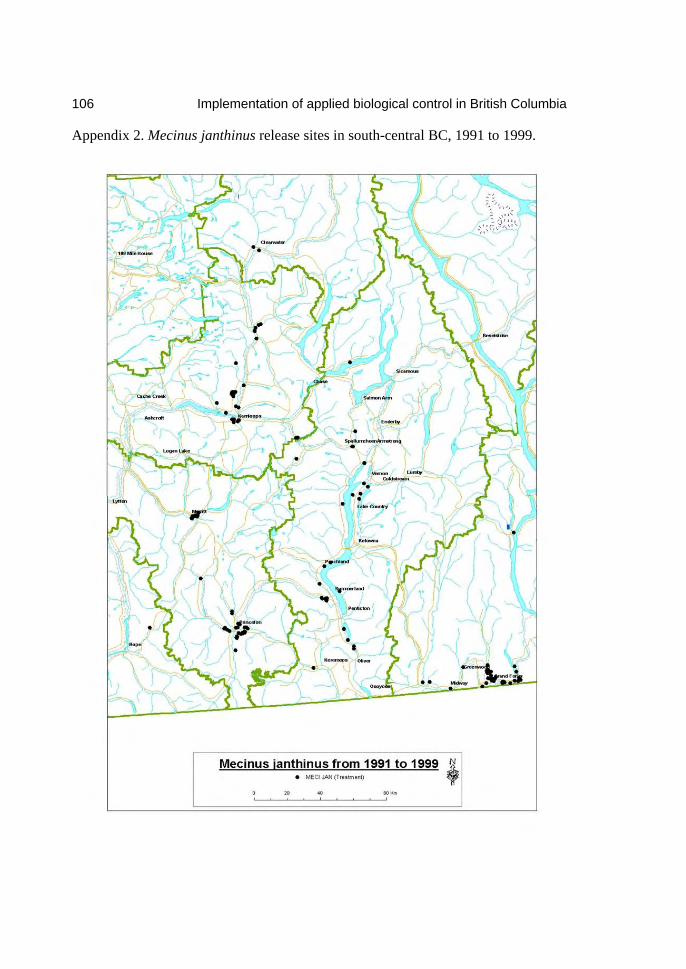
106 Implementation of applied biological control in British Columbia
Appendix 2. Mecinus janthinus release sites in south-central BC, 1991 to 1999.

Turner 107
Appendix 3. Mecinus janthinus release sites in south-central BC with BEC zones, 1991 to 1999.

108 Implementation of applied biological control in British Columbia
Appendix 4. Mecinus janthinus and Rhinusa antirrhini release sites in south-central BC, 1991 to 1999.

Turner 109
Appendix 5. Mecinus janthinus release and dispersal sites in south-central BC, from 1991 to 2006.
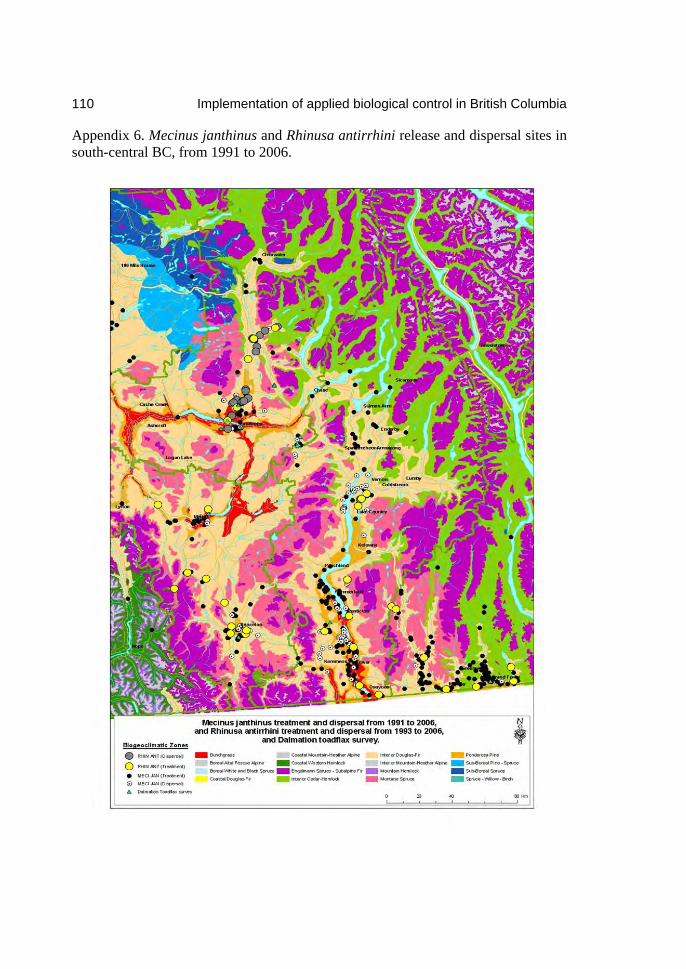
110 Implementation of applied biological control in British Columbia
Appendix 6. Mecinus janthinus and Rhinusa antirrhini release and dispersal sites in south-central BC, from 1991 to 2006.

Farming weed biocontrol agents: A Canadian test case in insect mass-production.
Rosemarie A. De Clerck-Floate, Jim R. Moyer, Brian H. Van Hezewijk and Elwin G. Smith
Agriculture and Agri-Food Canada, Lethbridge Research Centre, P.O. Box 3000, Lethbridge, AB T1J 4B1 [email protected]
Recent research has shown that the European weevil, Mogulones cruciger, is effective in the biological control of the invasive rangeland weed, hound’s-tongue (Cynoglossum officinale). Because the weevil is difficult to collect en masse from field sites, requests for the insect quickly outstrip supply. A research project was initiated to develop a cost-effective method of mass-producing the weevil to help meet this demand. The unique method, developed over 4 years, involved growing hound’s-tongue as a crop, ‘seeding’ the weevil into the crop for multiple generations of propagation, and harvesting the weevil for distribution. The main project objectives were to: 1) develop best management practices for growing hound’s-tongue as a crop while maximizing root growth for weevil propagation; 2) determine which of the agronomic practices increased weevil production; 3) develop a method for weevil harvest; and, 4) determine the cost of weevil production using the best management method. The project also was designed to test the general feasibility of a farming approach for the mass-production of weed biocontrol insects. Hound’s-tongue can be consistently grown as a crop for biocontrol agent propagation by: sowing the weed in October at a row spacing of 67 cm (i.e., seeding rate of 13 seeds m-2); applying fertilizer in the following spring at a rate recommended for cereal crop production; applying glyphosate at about 1.25 l ha-1 in late fall or early spring before hound’s-tongue seedlings emerge to control winter annual weeds; applying either imazamox + imazethapyr or nicosulfuron and using inter-row cultivation to control annual weeds that emerge after hound’s-tongue emergence; and regularly applying propiconazole for powdery mildew control. Hound’s-tongue plants survived in drought conditions and did not require irrigation. Any agronomic practice that increased hound’s-tongue root size increased weevil production because the weevil prefers large plants for feeding and egg-laying. In particular, the addition of nitrogen fertilizer increased both root size and larval numbers per root in some site-years, and increased weevil egg production by 25% when adult females were fed nitrogen rich leaves in a laboratory experiment. Fall versus spring planting of hound’s-tongue also increased weevil production. Herbicide applications did not appear to affect larval numbers per root. Wet-dry vacuum cleaners were used to harvest the weevils from hound’s-tongue trap plants and cardboard box ‘separators’ were used to sort the weevils from vacuumed debris. The harvest of adult weevils may be improved by planting
112 Farming weed biocontrol agents
additional hound’s-tongue around and within the crop 1−1.5 yrs prior to weevil harvest to ensure that sufficient trap plants are available. Once all fixed and variable costs of producing M. cruciger within a best management system for growing hound’s-tongue are considered, the total cost of production was $0.10−0.12 per weevil. The costs are considerably lower than those estimated for the production of other weed biocontrol insects reared in a manipulated outdoor setting.
Introduction
Classical weed biological control, which involves the use of exotic insects, mites or pathogens to control invasive alien plant species, is the predominant strategy in weed biocontrol (McFadyen 1998). The method typically aims to establish a thriving and self-spreading population of the control agent with one or a few introductions into the new environment. Although there are examples of spectacular success using the classical approach (Room et al. 1981; McEvoy et al. 1991; Blossey and Hunt-Joshi 2003), it often takes many years to achieve the agent establishment and population increase needed before weed control can be realized, especially when releasing only a small number of available agents each time (McFadyen 1998). Recent attempts to increase the predictability of agent establishment and to speed the process of biological control are leading to a more strategic approach to agent use, whereby practitioners strive to release the optimum number of insects to achieve desired outcomes (Grevstad 1999; Shea and Possingham 2000).
Once a particular agent has been proven successful, and an effective strategy for agent use has been developed, the next challenge is in filling the demand for the agent. Such has been the case with the European root weevil, Mogulones cruciger Herbst, which was first released in Canada in 1997 to control the invasive biennial rangeland weed, hound’s-tongue (Cynoglossum officinale L.). The weevil has successfully established at the majority of sites where it has been released in British Columbia (BC) and Alberta (De Clerck-Floate and Schwarzländer 2002), and based on field studies in BC, is reducing hound’s-tongue populations and dispersing to new patches of the weed within a relatively short period of time (De Clerck-Floate et al. 2005). News of its success quickly reached the BC ranching community, thereby creating a large demand for the agent. However, unlike many other successful weed biocontrol insects, M. cruciger is secretive in behaviour and not easily collected from previous release sites (i.e., nursery field sites). Moreover, it does not remain in high numbers locally for very long prior to dispersing, thus making it more difficult to establish productive, long-term collection sites. Although it can be easily reared in a laboratory setting, the method is time and energy consuming, and requires special facilities and technical expertise.
De Clerck-Floate et al. 113
Given the unique challenge of delivering M. cruciger to those requiring hound’s-tongue biocontrol, a unique method was proposed and experimentally developed for mass-producing the weevil. The method involved growing hound’s-tongue as a crop in a farm field setting, ‘seeding’ the weevil into the crop for multiple generations of propagation, and harvesting it for distribution. Only a few examples exist in the literature on the development of manipulative methods for field propagation of classical weed biocontrol insects, and these make use of cages or containers and were not at the scale we were proposing (e.g., Story et al. 1994; Story et al. 1996; Blossey and Hunt 1999). Our study had the following objectives: 1) to determine best management practices for growing hound’s-tongue, with a focus on maximizing root growth for weevil production; 2) to determine which agronomic practices optimized weevil production; 3) to develop an easy-to-use and cost-effective method of harvesting the weevils; and, 4) to develop an economic model of the costs of weevil production. The current paper summarizes the key results and lessons learned from our 4 year study, which also served to test the general feasibility of a farming approach to the mass-production of classical weed biocontrol insects.
Best management practices for growing a weed for insect propagation
Our initial premise for the project was that large, vigorous hound’s-tongue plants should produce the greatest number of, hopefully, high quality M. cruciger adults (e.g., vigorous individuals with high fitness). Hence we set out to develop best management practices for growing hound’s-tongue as a crop, while optimizing the size of the plants. Particular attention was paid to optimizing root growth, as the root provides the needed food resources for M. cruciger larval development, and thus, weevil propagation. For the purpose of providing context to the insect rearing part of the project, this section of our paper briefly summarizes the key agronomic results, some of which are reported in more detail in Moyer et al. (2007).
Experiments to investigate the effects of various agronomic treatments were conducted on cultivated farmland; replicated in time (2002−2003 and 2003−2004) and place (Lethbridge, AB and Creston, BC) (Moyer et al. 2007). All experiments were arranged as factorials in a randomized complete block design with four replications. Hound’s-tongue seed (i.e., barbed nutlets) used in the experiments was hand collected from hound’s-tongue infestations in the BC interior in 2002, tested for viability by determining percentage germination in the laboratory, and prepared for seeding by manually rubbing the rough pericarp surfaces with sand paper, thus preventing the ‘burrs’ from sticking together during flow through the seeder. All seeding, except where nutlets were broadcast, was performed with a plot seeder equipped with no-tillage disc openers. A row spacing of 67.5 cm was used, except in an experiment where seeding rate was examined. The seeding depth was 2 cm,

114 Farming weed biocontrol agents
except in an experiment where depth of seeding was examined. In all experiments, sufficient nutlets were supplied to distribute the nutlets over the length of the plots at a rate of 10 nutlets m-1. The plot dimensions were 4 × 6 m for all plots seeded in 2002 and 5 × 6 m for all plots seeded in 2003. Note that M. cruciger was released in small numbers into the 2002−2003 and 2003−2004 experimental plots in mid-July of 2003 and 2004, respectively, such that herbivory effects on the agronomy results were non-existent or kept to a minimum through delay.
All experiments examined the effects of treatments on both hound’s-tongue seedling emergence and root growth. However, in terms of relevance to the optimization of M. cruciger production, we will focus on summarizing the root growth data in this paper. Differences in root growth were quantified by non-destructively measuring the root crown diameter of randomly selected plants on a weekly basis throughout the summer (9 wks). Similar to De Jong et al. (1986), we found that root crown diameter was a good indicator of hound’s-tongue root biomass (i.e., r2 = 0.87 for the equation, Equation 1: Root biomass = -0.248 + 0.124(root crown diameter) + 0.004(root crown diameter)2; Moyer et al. 2007). The mean root crown diameters presented in this paper are an average of what was measured over all sampling dates within each treatment, year and location, and subjected to ANOVA. Following are descriptions of the experiments, treatments and associated results.
Tillage-groundcover and fertilizer level. The effects of tillage-groundcover and fertilizer on hound’s-tongue were
examined by establishing factorial experiments at Lethbridge, and Creston, in October of 2002 and 2003. Tillage-groundcover treatments included: a) bare soil – tilled; b) grain stubble – no till (hound’s-tongue seeded directly into post-harvest wheat straw residue); and, c) straw mulch added – no till (hound’s-tongue seeded directly into normal post-harvest wheat straw residue without tillage, and extra straw added). Fertilizer treatments included: a) 0 kg N ha-1 and 0 kg P2O5 ha-1; b) 50 kg N ha-1 and 25 kg P2O5 ha-1; and, c) 100 kg N ha-1 and 50 kg P2O5 ha-1.
Root crown diameter measurements indicated that hound’s-tongue growth was similar with tilled and zero tillage seeding systems in 3 of 4 site-years (Table 1). The extra straw treatment had a very inconsistent effect on mean root crown diameter compared to the tilled treatment, ranging from a negative effect at Lethbridge in both years to a positive effect in Creston in 2004.
Fertilization affected root size only in 1 of 4 site-years (i.e., 2003 at Lethbridge; Table 1). There also was a significant fertilizer-by-day interaction at Lethbridge and Creston in 2003 (P < 0.05; Moyer et al. 2007). Thus for at least some site-years there was a small growth response to fertilizer application in soils that had marginal levels of available N and P for annual crop production. Estimated available nitrate-N levels in soil prior to fertilizer application were about 40 kg NO-
3-N ha-1 in the spring of 2003 and 2004 at Lethbridge and 42 and 64 kg NO-3-N ha-1
at Creston in the spring of 2003 and 2004, respectively. These levels are considered
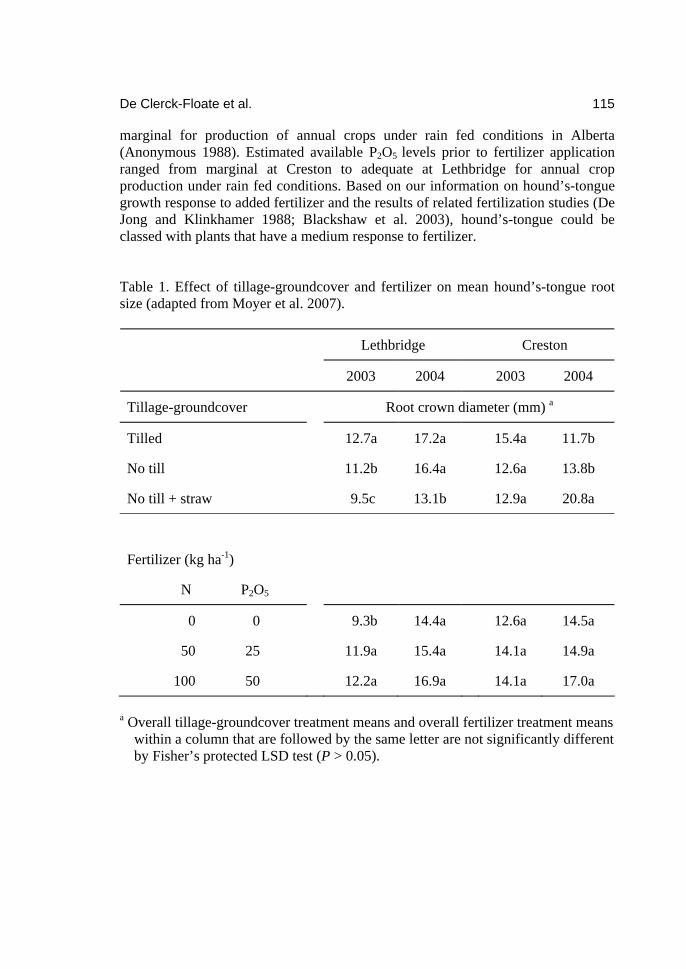
De Clerck-Floate et al. 115
marginal for production of annual crops under rain fed conditions in Alberta (Anonymous 1988). Estimated available P2O5 levels prior to fertilizer application ranged from marginal at Creston to adequate at Lethbridge for annual crop production under rain fed conditions. Based on our information on hound’s-tongue growth response to added fertilizer and the results of related fertilization studies (De Jong and Klinkhamer 1988; Blackshaw et al. 2003), hound’s-tongue could be classed with plants that have a medium response to fertilizer. Table 1. Effect of tillage-groundcover and fertilizer on mean hound’s-tongue root size (adapted from Moyer et al. 2007).
a Overall tillage-groundcover treatment means and overall fertilizer treatment means within a column that are followed by the same letter are not significantly different by Fisher’s protected LSD test (P > 0.05).
Lethbridge Creston
2003 2004 2003 2004
Tillage-groundcover Root crown diameter (mm) a
Tilled 12.7a 17.2a 15.4a 11.7b
No till 11.2b 16.4a 12.6a 13.8b
No till + straw 9.5c 13.1b 12.9a 20.8a
Fertilizer (kg ha-1)
N P2O5
0 0 9.3b 14.4a 12.6a 14.5a
50 25 11.9a 15.4a 14.1a 14.9a
100 50 12.2a 16.9a 14.1a 17.0a

116 Farming weed biocontrol agents
Seeding method and rate In this experiment, the effect of seeding method and rate on hound’s-tongue
emergence and growth was examined using plots set up at Lethbridge and Creston in October of 2002 and 2003. Seeding method treatments included: a) hound’s-tongue seeded at a depth of 2 cm with the drill; and, b) seed broadcast on the soil surface followed by incorporation. Seeding rate treatments were: a) 20 seeds m-2; b) 13 seeds m-2; and, c) 10 seeds m-2.
Hound’s-tongue root growth was not significantly affected by seeding method, seeding rate, or the seeding method by rate interaction (P > 0.05). Although there tended to be a lower plant density after broadcast seeding versus when seed was drilled into rows (Moyer et al. 2007), the growth of plants that emerged was not affected by seeding method. Moreover, the results indicated that plant densities in the highest seeding rate were not high enough to reduce root crown diameters through competition among plants compared to the lowest seeding rate.
Seeding time and depth This experiment included treatments that examined the effect of seeding
time and seeding depth on hound’s-tongue emergence and growth. Data were taken in 2003 and 2004 at Lethbridge and in 2004 in Creston. Plots were seeded in September, October, and April at depths of 2 cm and 5 cm.
Overall mean root crown diameters were not affected by depth of seeding, but the month of seeding had a significant effect on root size at Lethbridge in both years, with the spring-seeded plants being smaller in root size (Table 2). Although there was a trend toward smaller roots for April seeded hound’s-tongue at Creston in mid-July, the differences among overall seeding time means were not significant.
Herbicide applications An experiment also was conducted to determine what herbicides could be
used to control emergent weeds (grass or broad-leaved) in a hound’s-tongue crop. Nine herbicides (Table 3) and an untreated check were compared in 2003 and 2004 at Lethbridge and in 2004 at Creston using the overall root crown diameters for these years. Applications of herbicides were made on seedling hound’s-tongue and repeated on established plants 1 year later.
In all site-years, hound’s-tongue root crowns were similar for plants treated with imazamox + imazethapyr (Odyssey) or nicosulfuron (Accent) and in the check plots (Table 3). These herbicides are capable of controlling several broadleaf weeds and annual grasses, and therefore could likely be used for weed control within hound’s-tongue crops without reducing food supply for M. cruciger. Other herbicides that had no negative effect on hound’s-tongue growth in the experiment (i.e., quizalofop, sethoxydim and flucarbazone; Table 3) only control grass species in a field situation, and thus would have limited use within a hound’s-tongue crop where broadleaf weeds are problematic. Even with the compatible broad spectrum herbicides, established winter annuals such as flixweed (Descurainia sophia (L.)
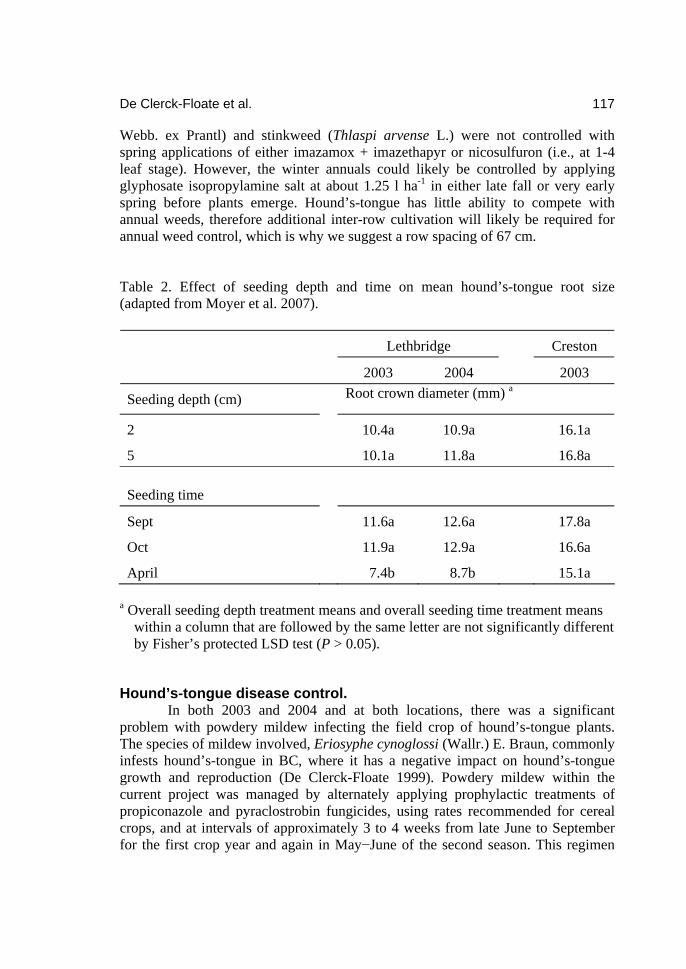
De Clerck-Floate et al. 117
Webb. ex Prantl) and stinkweed (Thlaspi arvense L.) were not controlled with spring applications of either imazamox + imazethapyr or nicosulfuron (i.e., at 1-4 leaf stage). However, the winter annuals could likely be controlled by applying glyphosate isopropylamine salt at about 1.25 l ha-1 in either late fall or very early spring before plants emerge. Hound’s-tongue has little ability to compete with annual weeds, therefore additional inter-row cultivation will likely be required for annual weed control, which is why we suggest a row spacing of 67 cm. Table 2. Effect of seeding depth and time on mean hound’s-tongue root size (adapted from Moyer et al. 2007).
Lethbridge Creston
2003 2004 2003
Seeding depth (cm) Root crown diameter (mm) a
2 10.4a 10.9a 16.1a
5 10.1a 11.8a 16.8a Seeding time
Sept 11.6a 12.6a 17.8a
Oct 11.9a 12.9a 16.6a
April 7.4b 8.7b 15.1a
a Overall seeding depth treatment means and overall seeding time treatment means within a column that are followed by the same letter are not significantly different by Fisher’s protected LSD test (P > 0.05).
Hound’s-tongue disease control. In both 2003 and 2004 and at both locations, there was a significant
problem with powdery mildew infecting the field crop of hound’s-tongue plants. The species of mildew involved, Eriosyphe cynoglossi (Wallr.) E. Braun, commonly infests hound’s-tongue in BC, where it has a negative impact on hound’s-tongue growth and reproduction (De Clerck-Floate 1999). Powdery mildew within the current project was managed by alternately applying prophylactic treatments of propiconazole and pyraclostrobin fungicides, using rates recommended for cereal crops, and at intervals of approximately 3 to 4 weeks from late June to September for the first crop year and again in May−June of the second season. This regimen

118 Farming weed biocontrol agents
appeared to suppress mildew outbreaks adequately without affecting populations of the weevils. Table 3. Effect of herbicide applications on hound’s-tongue root size. Treatment (herbicide/adjuvant)a Rateb Lethbridge Creston
2003 2004 2004
Mean root crown diameter (mm)c
Check (hand weeded) 0 18.6 7.1 8.8
Quizalofop/Sure-mix 35.5/0.5 12.5 9.4 8.5
Imazamox+imazethapyr/Merge 29.4/0.5 12.1 8.9 8.8
Nicosulfuron/Agral 90 25/0.2 15.2 8.1 10.4
Sethoxydim/Merge 211/1.0 16.7 12.8 11.6
Flucarbazone/Agral 90 30/0.25 14.7 8.2 9.1
Imazamethabenz/Acidulate 500/375 7.3 4.3 8.5
2,4-D-amine 560 9.8 6.3 7.4
2,4-D-amine and dicamba 394 & 114 10.2 7.3 7.3
Thifensulfuron+tribenuron/Agral 90 15/0.2 6.4 7.7 10.1 a Adjuvants: Sure-mix = 35.6% surfactant blend and 60% paraffinic petroleum oil;
Merge = 50% surfactant blend and 50% petroleum hydrocarbon; Agral 90 = 93% alkylphenol ethoxylate and 7% isobutanol; Acidulate = mixture of citric, hydroxyacetic and gluconic acid.
b Herbicide rates are in g a.i. ha-1 except for 2,4-D-amine and dicamba which are in
g a.e. ha-1. Adjuvant rates are in percent of total volume. c Underlined means are significantly different from the check by Fisher’s protected
LSD test (P < 0.05).

De Clerck-Floate et al. 119
Controlling the spread of hound’s-tongue from our crop. Beginning in late May in Creston and early June in Lethbridge, the biennial
hound’s-tongue produced flower stalks (i.e., bolted) and began setting seed. To reduce the production of seed, shoots in early bolt were removed using power hedge trimmers, with repeated trimming of regrowth shoots as required throughout the summer. It was later determined that a swather could be used for the same task. Although hound’s-tongue plants emerged from dropped seed following our experiments, these plants did not appear to compete strongly enough with succeeding wheat crops to reduce wheat yield. Furthermore, hound’s-tongue growth at the end of the experiments was severely suppressed by M. cruciger present in the area, and we had to transplant hound’s-tongue back into plots at Lethbridge so that there were trap plants available for spring collection of emerging weevils. However, if necessary, hound’s-tongue can be further suppressed by herbicides such as 2,4-D-amine or 2,4-D plus dicamba, which were highly damaging to hound’s-tongue during our experiments (Table 3). Fall cultivation also can be used to control any hound’s-tongue that persists after the land has been used for M. cruciger propagation; especially because hound’s-tongue does not have a long-lived seed bank (Upadhyaya et al. 1988).
Weevil production within the hound’s-tongue crop
Basic information on the biology of M. cruciger and its interaction with its host weed helped guide us in project design. The biology of the weevil has been described by Schwarzlaender (1997). Adult weevils emerge in early spring to feed, mate and oviposit into their host plant. Eggs tend to be laid into the petioles of hound’s-tongue rosette leaves, and the young larvae tunnel into the root where they feed and undergo three larval instars before exiting the root to pupate in the soil. Emergence of adults can occur in late summer, or the larvae and/or pupae can overwinter and emerge as adults the following spring. Although the weevil produces only one generation per year, it is flexible in its life cycle such that successful establishment can be attained regardless of when adults are released during the spring or summer (De Clerck-Floate and Schwarzländer 2002). We waited until mid-July to ‘seed’ the weevil into our first-year hound’s-tongue crop for propagation, as by then the plants had grown sufficiently to host the first generation of weevil larvae. The weevil then underwent a second generation during the second year of the biennial hound’s-tongue crop, which proceeded to bolt and senesce at the end of the year. The mature larvae, pupae or emerged adults of M. cruciger, remained in the soil or dead roots of their host plants to overwinter. It was this generation that we harvested upon its emergence in April (Creston) or May (Lethbridge) of the third season of the crop.
To determine which agronomic method produced the largest number of weevils, we had to catch the first generation of weevils before they emerged as

120 Farming weed biocontrol agents
adults and dispersed from the experimental plots. Hence, for Lethbridge only, root samples were taken from all plots of the 2002−2003 and 2003−2004 hound’s-tongue crops in April, 2004 and 2005, respectively. One quarter of the sampled plants were dissected in the laboratory and the number of weevil larvae was counted. The remaining three quarters was placed in emergence traps for subsequent estimation of the number of emerging adult weevils. The experimental factors examined as potentially affecting weevil numbers were the same as for the agronomic experiments: groundcover and fertilization; seeding method and rate; seeding depth and time; and, herbicide treatment.
In all four experiments there was a significant and positive effect of increasing root crown diameter on the average number of weevil larvae per root (Figure 1). Previous studies report that M. cruciger females prefer large plants for egg-laying (Prins et al. 1992; Schwarzlaender 1997), which suggests that more eggs are being laid into larger plants to produce our observed results. This would suggest that any agronomic treatment that increases root crown diameter will also increase weevil production, and overall, this relationship was confirmed. Figure 1. The relationship between larval production and hound’s-tongue root size (i.e., root crown diameter) at Lethbridge in 2004. Equation 2: Number of weevil larvae per plant = e -0.417014 + 0.032842 (root crown diameter); P < 0.001, 61.8% of deviance explained.
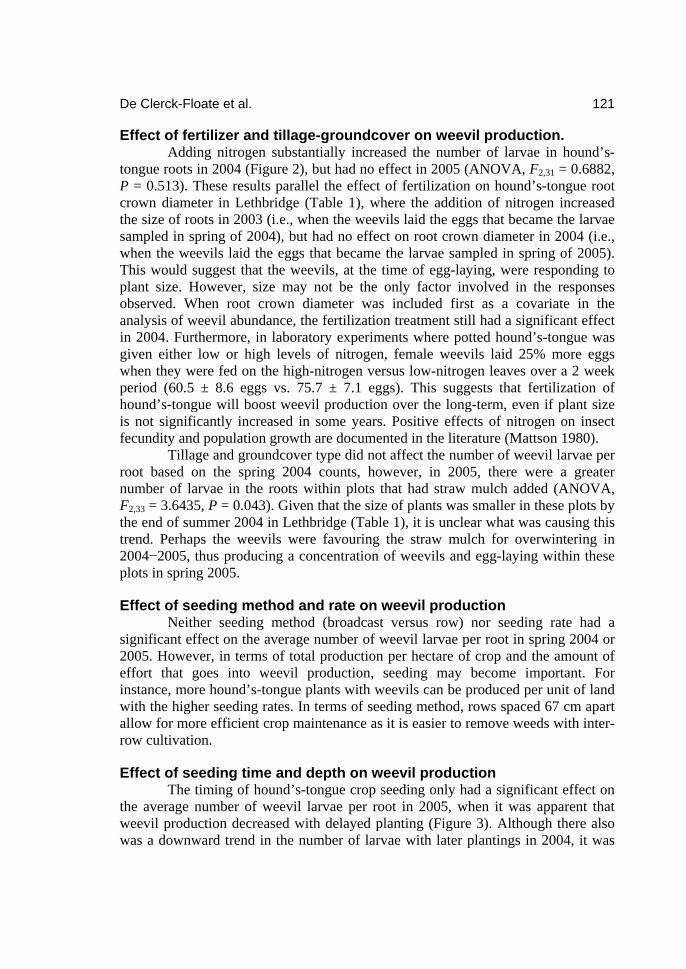
De Clerck-Floate et al. 121
Effect of fertilizer and tillage-groundcover on weevil production. Adding nitrogen substantially increased the number of larvae in hound’s-
tongue roots in 2004 (Figure 2), but had no effect in 2005 (ANOVA, F2,31 = 0.6882, P = 0.513). These results parallel the effect of fertilization on hound’s-tongue root crown diameter in Lethbridge (Table 1), where the addition of nitrogen increased the size of roots in 2003 (i.e., when the weevils laid the eggs that became the larvae sampled in spring of 2004), but had no effect on root crown diameter in 2004 (i.e., when the weevils laid the eggs that became the larvae sampled in spring of 2005). This would suggest that the weevils, at the time of egg-laying, were responding to plant size. However, size may not be the only factor involved in the responses observed. When root crown diameter was included first as a covariate in the analysis of weevil abundance, the fertilization treatment still had a significant effect in 2004. Furthermore, in laboratory experiments where potted hound’s-tongue was given either low or high levels of nitrogen, female weevils laid 25% more eggs when they were fed on the high-nitrogen versus low-nitrogen leaves over a 2 week period (60.5 ± 8.6 eggs vs. 75.7 ± 7.1 eggs). This suggests that fertilization of hound’s-tongue will boost weevil production over the long-term, even if plant size is not significantly increased in some years. Positive effects of nitrogen on insect fecundity and population growth are documented in the literature (Mattson 1980).
Tillage and groundcover type did not affect the number of weevil larvae per root based on the spring 2004 counts, however, in 2005, there were a greater number of larvae in the roots within plots that had straw mulch added (ANOVA, F2,33 = 3.6435, P = 0.043). Given that the size of plants was smaller in these plots by the end of summer 2004 in Lethbridge (Table 1), it is unclear what was causing this trend. Perhaps the weevils were favouring the straw mulch for overwintering in 2004−2005, thus producing a concentration of weevils and egg-laying within these plots in spring 2005.
Effect of seeding method and rate on weevil production Neither seeding method (broadcast versus row) nor seeding rate had a
significant effect on the average number of weevil larvae per root in spring 2004 or 2005. However, in terms of total production per hectare of crop and the amount of effort that goes into weevil production, seeding may become important. For instance, more hound’s-tongue plants with weevils can be produced per unit of land with the higher seeding rates. In terms of seeding method, rows spaced 67 cm apart allow for more efficient crop maintenance as it is easier to remove weeds with inter-row cultivation.
Effect of seeding time and depth on weevil production The timing of hound’s-tongue crop seeding only had a significant effect on
the average number of weevil larvae per root in 2005, when it was apparent that weevil production decreased with delayed planting (Figure 3). Although there also was a downward trend in the number of larvae with later plantings in 2004, it was
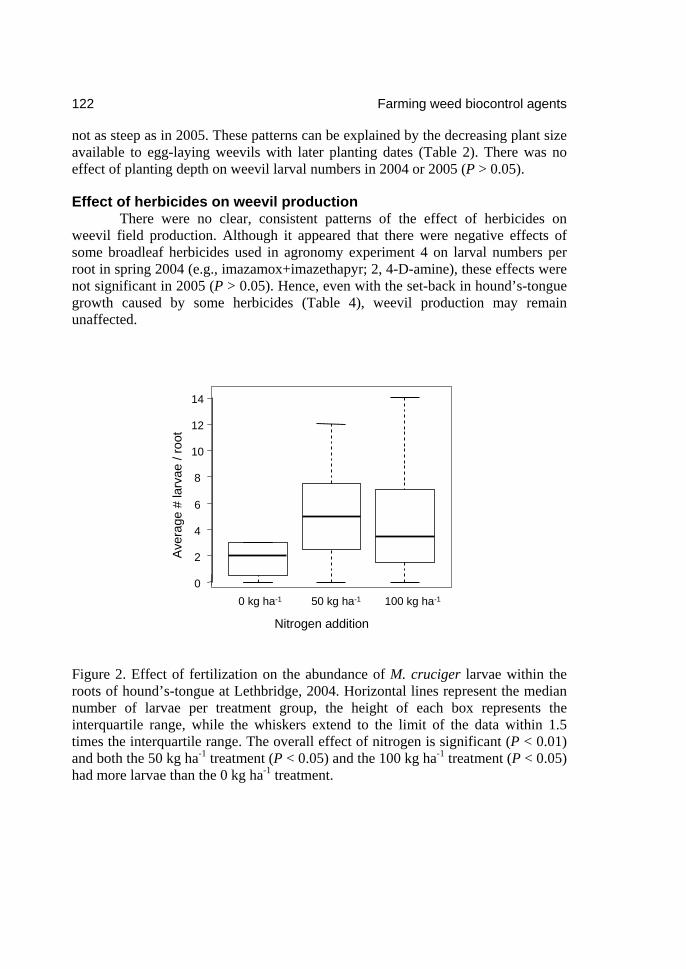
122 Farming weed biocontrol agents
not as steep as in 2005. These patterns can be explained by the decreasing plant size available to egg-laying weevils with later planting dates (Table 2). There was no effect of planting depth on weevil larval numbers in 2004 or 2005 (P > 0.05).
Effect of herbicides on weevil production There were no clear, consistent patterns of the effect of herbicides on
weevil field production. Although it appeared that there were negative effects of some broadleaf herbicides used in agronomy experiment 4 on larval numbers per root in spring 2004 (e.g., imazamox+imazethapyr; 2, 4-D-amine), these effects were not significant in 2005 (P > 0.05). Hence, even with the set-back in hound’s-tongue growth caused by some herbicides (Table 4), weevil production may remain unaffected.
Nitrogen addition
0 kg ha-1 50 kg ha-1 100 kg ha-1
0
2
4
6
8
10
12
14
Aver
age
#la
rvae
/ ro
ot
Figure 2. Effect of fertilization on the abundance of M. cruciger larvae within the roots of hound’s-tongue at Lethbridge, 2004. Horizontal lines represent the median number of larvae per treatment group, the height of each box represents the interquartile range, while the whiskers extend to the limit of the data within 1.5 times the interquartile range. The overall effect of nitrogen is significant (P < 0.01) and both the 50 kg ha-1 treatment (P < 0.05) and the 100 kg ha-1 treatment (P < 0.05) had more larvae than the 0 kg ha-1 treatment.
De Clerck-Floate et al. 123
Sept Oct Apr
5
10
15
Ave
rage
# la
rvae
/ ro
ot
Figure 3. Effect of time of hound’s-tongue seeding on weevil production at Lethbridge in 2005. Horizontal lines represent the median number of larvae per treatment group. The April seeding produced fewer larvae than September (P = 0.003) but not compared with October seeding (P = 0.064). September and October seedings did not differ (P = 0.257). Box-and-whisker plots are described in Figure 2.
Insect ‘harvest’ and handling
Another objective of our project was the development of an efficient, cost-effective and easy-to-use method of harvesting adult weevils from our hound’s-tongue crop. We determined that the optimum time to collect the weevils was early spring (April−May), when hound’s-tongue plants are beginning to grow and adult weevils are emerging en masse from their overwintering sites in the ground or leaf litter. Knowing that the hound’s-tongue crop used in weevil production would be dead by the third spring, but that emerging weevils would be attracted to green hound’s-tongue plants for feeding and oviposition (De Clerck-Floate et al. 2005), we established trap rows of hound’s-tongue in the season ahead of harvest. It was from these plants that the weevils were collected.
124 Farming weed biocontrol agents
We found through trial-and-error, that a wet-dry vacuum powered by a portable electric generator worked for collecting the weevils from around hound’s-tongue plants; especially since the adults drop to the base of plants whenever disturbed, thus making other methods of insect collection difficult (e.g., sweep nets). In a small experiment where known number of weevils were added to plants and then vacuumed up, it was determined that we were about 70% effective in recovering the released weevils, and all weevils survived the vacuuming. However, the largest challenge in use of the vacuum method of harvest was in how to efficiently separate the weevils from the other debris that gets picked up while vacuuming. A simple and inexpensive design for a ‘separator’ was developed. A hole was cut into a closed cardboard box (ca. 0.5 m-3 in size), and the lip of a large, clear, plastic bag was glued securely around the hole so that the bag hung like a sock on the outside of the box. Weevils and debris were dumped into the boxes, fresh hound’s-tongue leaves were added to the bags as bait, and then all was left for about 24 hrs in a bright location, but with diffused lighting, so that the weevils did not overheat (e.g., a shed with windows or a shaded greenhouse). The adult weevils thus emerged from the debris, and crawled toward the light and food source where they dropped into the bag. They were then counted and sorted using forceps within white plastic trays, placed into paper towel lined plastic containers with a few fresh hound’s-tongue leaves (ca. 100 weevils per 0.5−1.0 l container), and refrigerated for up to 1 wk until enough shipping units of 100 weevils were ready to fill each request (ca. 10−15 units per request). Shipping by bus was ideal as they were generally received the next day if shipped within-province. The weevils, within their containers, were shipped in styrofoam-filled boxes with ice packs.
The economics of insect ‘farming’
If a manipulative approach is required for rearing biocontrol insects, then it is essential that it be cost-effective so that it will be economical to control the targeted invasive weeds. Commonly, mass-production of classical weed biocontrol insects is done in laboratories using artificial diets or greenhouse grown plants (e.g., Nieman 1991; Goodman et al. 2006), or by using small-scale garden field nurseries (e.g., Story et al. 1994, 1996). These methods often are labour intensive, and the laboratory methods especially, either require specialized, energy-consuming facilities (e.g., greenhouses and growth cabinets) or expert labour that makes them costly (Parrella and Kok 1979). A simplified, field-based rearing technique was regarded as something that could not only reduce the cost of insect production, but might also increase yield per amount of rearing effort. In a recent study on the mass-rearing of biocontrol beetles for purple loosestrife (Lythrum salicaria L.), Blossey and Hunt (1999) found that field rearing repeatedly produced 2−5 times more insects than greenhouse rearing, and the insects also were more fecund.
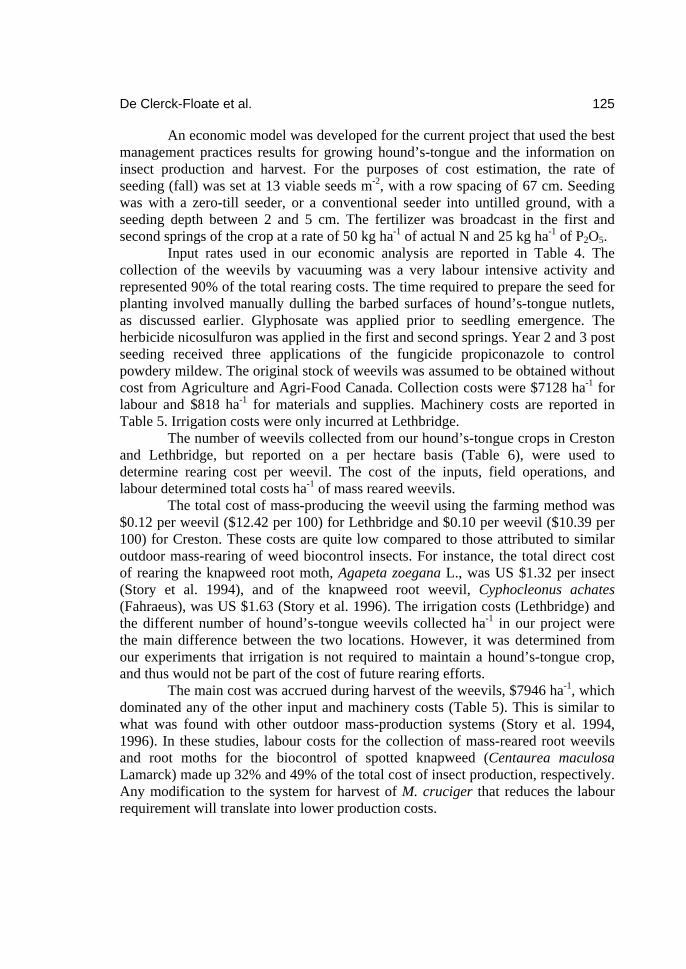
De Clerck-Floate et al. 125
An economic model was developed for the current project that used the best management practices results for growing hound’s-tongue and the information on insect production and harvest. For the purposes of cost estimation, the rate of seeding (fall) was set at 13 viable seeds m-2, with a row spacing of 67 cm. Seeding was with a zero-till seeder, or a conventional seeder into untilled ground, with a seeding depth between 2 and 5 cm. The fertilizer was broadcast in the first and second springs of the crop at a rate of 50 kg ha-1 of actual N and 25 kg ha-1 of P2O5.
Input rates used in our economic analysis are reported in Table 4. The collection of the weevils by vacuuming was a very labour intensive activity and represented 90% of the total rearing costs. The time required to prepare the seed for planting involved manually dulling the barbed surfaces of hound’s-tongue nutlets, as discussed earlier. Glyphosate was applied prior to seedling emergence. The herbicide nicosulfuron was applied in the first and second springs. Year 2 and 3 post seeding received three applications of the fungicide propiconazole to control powdery mildew. The original stock of weevils was assumed to be obtained without cost from Agriculture and Agri-Food Canada. Collection costs were $7128 ha-1 for labour and $818 ha-1 for materials and supplies. Machinery costs are reported in Table 5. Irrigation costs were only incurred at Lethbridge.
The number of weevils collected from our hound’s-tongue crops in Creston and Lethbridge, but reported on a per hectare basis (Table 6), were used to determine rearing cost per weevil. The cost of the inputs, field operations, and labour determined total costs ha-1 of mass reared weevils.
The total cost of mass-producing the weevil using the farming method was $0.12 per weevil ($12.42 per 100) for Lethbridge and $0.10 per weevil ($10.39 per 100) for Creston. These costs are quite low compared to those attributed to similar outdoor mass-rearing of weed biocontrol insects. For instance, the total direct cost of rearing the knapweed root moth, Agapeta zoegana L., was US $1.32 per insect (Story et al. 1994), and of the knapweed root weevil, Cyphocleonus achates (Fahraeus), was US $1.63 (Story et al. 1996). The irrigation costs (Lethbridge) and the different number of hound’s-tongue weevils collected ha-1 in our project were the main difference between the two locations. However, it was determined from our experiments that irrigation is not required to maintain a hound’s-tongue crop, and thus would not be part of the cost of future rearing efforts.
The main cost was accrued during harvest of the weevils, $7946 ha-1, which dominated any of the other input and machinery costs (Table 5). This is similar to what was found with other outdoor mass-production systems (Story et al. 1994, 1996). In these studies, labour costs for the collection of mass-reared root weevils and root moths for the biocontrol of spotted knapweed (Centaurea maculosa Lamarck) made up 32% and 49% of the total cost of insect production, respectively. Any modification to the system for harvest of M. cruciger that reduces the labour requirement will translate into lower production costs.
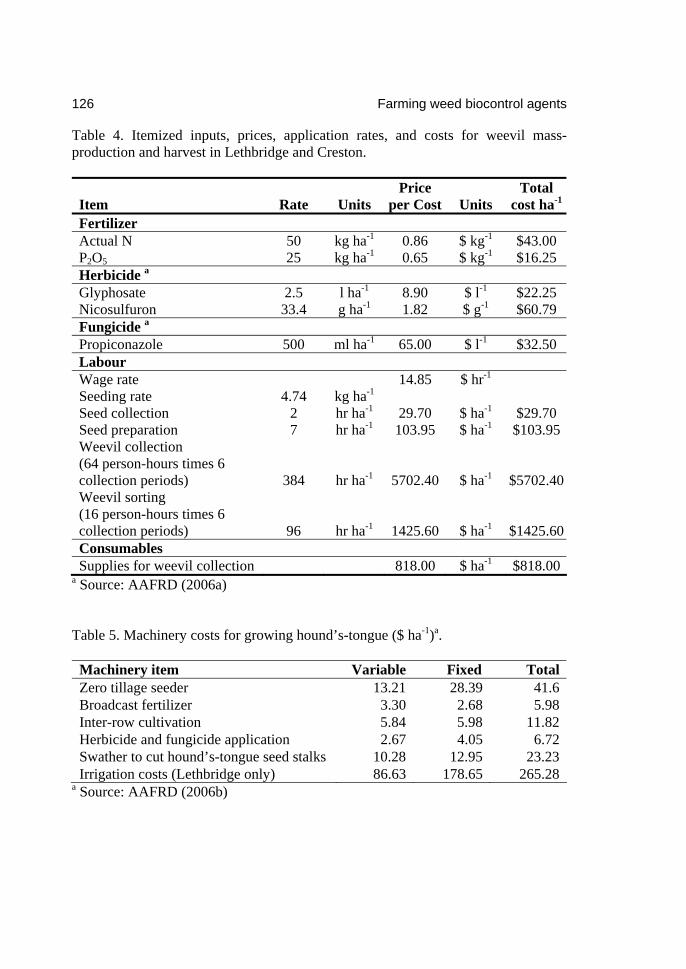
126 Farming weed biocontrol agents
Table 4. Itemized inputs, prices, application rates, and costs for weevil mass-production and harvest in Lethbridge and Creston.
Item Rate Units Price
per Cost Units Total
cost ha-1
Fertilizer Actual N 50 kg ha-1 0.86 $ kg-1 $43.00 P2O5 25 kg ha-1 0.65 $ kg-1 $16.25 Herbicide a Glyphosate 2.5 l ha-1 8.90 $ l-1 $22.25 Nicosulfuron 33.4 g ha-1 1.82 $ g-1 $60.79 Fungicide a Propiconazole 500 ml ha-1 65.00 $ l-1 $32.50 Labour Wage rate 14.85 $ hr-1
Seeding rate 4.74 kg ha-1 Seed collection 2 hr ha-1 29.70 $ ha-1 $29.70 Seed preparation 7 hr ha-1 103.95 $ ha-1 $103.95 Weevil collection (64 person-hours times 6 collection periods) 384 hr ha-1 5702.40 $ ha-1 $5702.40 Weevil sorting (16 person-hours times 6 collection periods) 96 hr ha-1 1425.60 $ ha-1 $1425.60 Consumables Supplies for weevil collection 818.00 $ ha-1 $818.00
a Source: AAFRD (2006a) Table 5. Machinery costs for growing hound’s-tongue ($ ha-1)a.
Machinery item Variable Fixed Total Zero tillage seeder 13.21 28.39 41.6 Broadcast fertilizer 3.30 2.68 5.98 Inter-row cultivation 5.84 5.98 11.82 Herbicide and fungicide application 2.67 4.05 6.72 Swather to cut hound’s-tongue seed stalks 10.28 12.95 23.23 Irrigation costs (Lethbridge only) 86.63 178.65 265.28
a Source: AAFRD (2006b)
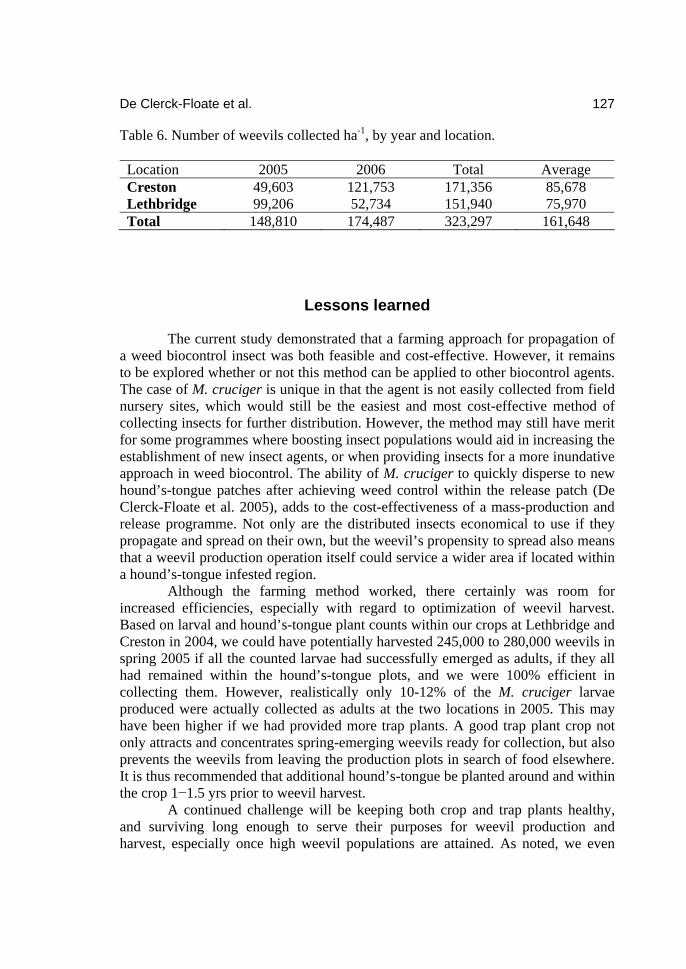
De Clerck-Floate et al. 127
Table 6. Number of weevils collected ha-1, by year and location. Location 2005 2006 Total Average Creston 49,603 121,753 171,356 85,678 Lethbridge 99,206 52,734 151,940 75,970 Total 148,810 174,487 323,297 161,648
Lessons learned
The current study demonstrated that a farming approach for propagation of a weed biocontrol insect was both feasible and cost-effective. However, it remains to be explored whether or not this method can be applied to other biocontrol agents. The case of M. cruciger is unique in that the agent is not easily collected from field nursery sites, which would still be the easiest and most cost-effective method of collecting insects for further distribution. However, the method may still have merit for some programmes where boosting insect populations would aid in increasing the establishment of new insect agents, or when providing insects for a more inundative approach in weed biocontrol. The ability of M. cruciger to quickly disperse to new hound’s-tongue patches after achieving weed control within the release patch (De Clerck-Floate et al. 2005), adds to the cost-effectiveness of a mass-production and release programme. Not only are the distributed insects economical to use if they propagate and spread on their own, but the weevil’s propensity to spread also means that a weevil production operation itself could service a wider area if located within a hound’s-tongue infested region.
Although the farming method worked, there certainly was room for increased efficiencies, especially with regard to optimization of weevil harvest. Based on larval and hound’s-tongue plant counts within our crops at Lethbridge and Creston in 2004, we could have potentially harvested 245,000 to 280,000 weevils in spring 2005 if all the counted larvae had successfully emerged as adults, if they all had remained within the hound’s-tongue plots, and we were 100% efficient in collecting them. However, realistically only 10-12% of the M. cruciger larvae produced were actually collected as adults at the two locations in 2005. This may have been higher if we had provided more trap plants. A good trap plant crop not only attracts and concentrates spring-emerging weevils ready for collection, but also prevents the weevils from leaving the production plots in search of food elsewhere. It is thus recommended that additional hound’s-tongue be planted around and within the crop 1−1.5 yrs prior to weevil harvest.
A continued challenge will be keeping both crop and trap plants healthy, and surviving long enough to serve their purposes for weevil production and harvest, especially once high weevil populations are attained. As noted, we even
128 Farming weed biocontrol agents
had to transplant hound’s-tongue back into our plots for the second crop harvest because of the effectiveness of the weevil in killing the original plants. This balancing act between agent and host plant is typically not an issue in laboratory rearing of agents, as an insect-free population of food plants can be kept separate from the insect colony until needed for propagation.
Even if the farming method is not used for future production of M. cruciger, our test case produced some useful technology and information for follow-up. For instance, the vacuum and sorting methods of harvesting the weevil may be useful for limited field collections. We also may be able to use the information on fertilization to enhance existing field populations of M. cruciger, either for propagation and harvest purposes or to simply increase the rate of hound’s-tongue control. At the very least, our experiments taught us much about the biology of both weed and insect that can be applied in the improvement of weed management.
Acknowledgements
We would like to gratefully acknowledge the sponsoring partners of this project for their financial support and faith in its success. Funding was provided by AAFC Matching Investment Initiative, British Columbia Transmission Corporation, Canadian Pacific Railway, Cattle Industry Development Council of BC, Grand Forks Stockbreeder’s Association, Inter-Ministry Invasive Plant Council, Investment Agriculture Foundation of BC, Kettle River Stockmen’s Association, Kootenay Livestock Association, Rock Creek Farmer’s Institute, Southern Interior Stockmen’s Association, Terasen Gas, Tembec Industries Kootenay East Region and Wyoming Weed and Pest Districts. In kind support was provided by AAFC, BC Ministry of Forests and Range, the Boundary Weed Management Committee and the Creston Valley Beefgrowers Association. We also are very grateful to Barb Stewart for the time she spent in project coordination and promotion.
Literature cited
[AAFRD] Alberta Agriculture, Food, and Rural Development. 2006a. Estimated Herbicide Application Costs and Estimated Fungicide Application Costs. http://www.agric.gov.ab.ca/ app23 /pesticides Accessed Mar. 6, 2006.
[AAFRD] Alberta Agriculture, Food, and Rural Development. 2006b. Machine Cost Calculator. http://www.agric.gov.ab.ca/costcalculators/machinery/ getmachimpls.jsp Accessed June 1, 2006.
Anonymous. 1988. Soil test recommendations for Alberta: Technical manual. Alberta Agriculture, Food and Rural Development, Edmonton, AB, Canada, 49 p.

De Clerck-Floate et al. 129
Blackshaw, R. E., R. N. Brandt, H. H. Janzen, T. Entz, C. A. Grant, and D. A. Derksen. 2003. Differential response of weed species to added nitrogen. Weed Sci. 51:532-539.
Blossey, B., and T. R. Hunt. 1999. Mass rearing methods for Galerucella calmariensis and G. pusilla (Coleoptera: Chrysomelidae), biological control agents of Lythrum salicaria (Lythraceae). J. Econ. Entomol. 92:325-334.
Blossey, B., and T. R. Hunt-Joshi. 2003. Belowground herbivory by insects: Influence on plants and aboveground herbivores. Ann. Rev. Entomol. 48:521-547.
De Clerck-Floate, R. 1999. Impact of Erysiphe cynoglossi on the growth and reproduction of the rangeland weed, Cynoglossum officinale. Biol. Control. 15:107-112.
De Clerck-Floate, R. A., and M. Schwarzländer. 2002. Cynoglossum officinale (L.) Houndstongue (Boraginaceae). Pages 337-343 in P.G. Mason and J.T. Huber, eds. Biological Control Programmes in Canada, 1981-2000, Wallingford, Oxon, UK: CABI Publishing. 583 p.
De Clerck-Floate, R., B. Wikeem, and R. S. Bourchier. 2005. Early establishment and dispersal of the weevil, Mogulones cruciger (Coleoptera: Curculionidae) for biological control of houndstongue (Cynoglossum officinale) in British Columbia, Canada. Biocontrol Sci. Technol. 15:173-190.
De Jong, T. J., and P. G. L. Klinkhamer. 1988. Seedling establishment of the biennials Cirsium vulgare and Cynoglossum offincinale in a sand dune area: The importance of water for differential survival and growth. J. Ecol. 76:393-402.
De Jong, T. J., P. G. L. Klinkhamer, and A. H. Prins. 1986. Flowering behaviour of the monocarpic perennial Cynoglossum officinale L. New Phytol. 103:219-229.
Goodman, C. L., S. J. Phipps, R. M. Wagner, P. Peters, M. Knop Wright, H. Nabli, S. Saathoff, B. Vickers, J. J. Grasela, and A. H. McIntosh. 2006. Growth and development of the knapweed root weevil Cyphocleonus achates, on a meridic larval diet. Biol. Control 36:238-246.
Grevstad, F. S. 1999. Experimental invasions using biological control introductions: the influence of release size on the chance of population establishment. Biol. Invasions 1:313-323.
Mattson, W. J. 1980. Herbivory in relation to plant nitrogen content. Ann. Rev. Ecol. Syst. 11:119-161.
McEvoy P. B., C. S. Cox, and E. M. Coombs. 1991. Successful biological control of ragwort. Ecol. Applic. 1:430-432.
McFadyen, R. E. C. 1998. Biological control of weeds. Ann. Rev. Entomol. 43:369-393.
Moyer, J. R., R. A. De Clerck-Floate, B. H. Van Hezewijk, and L. J. Molnar. 2007. Agronomic practices for growing houndstongue as a crop for mass-producing a weed biocontrol agent. Weed Sci. 55:273-280.
130 Farming weed biocontrol agents
Nieman, E. 1991. The introduction of Mimorista pulchellalis (Lepidoptera: Pyraustidae) into South Africa for the biological control of jointed cactus, Opuntia aurantiaca. 1. Biology and mass-rearing techniques. Entomophaga 36:69-76.
Parrella, M. P., and L. T. Kok. 1979. Oidaematophorus monodactylus as a biocontrol agent of hedge bindweed: Development of a rearing program and cost analysis. J. Econ. Entomol. 72:590-592.
Prins, A. H., H. W. Nell, and P. G. L. Klinkhamer. 1992. Size-dependent root herbivory on Cynoglossum officinale. Oikos 65:409-413.
Room, P. M., K. L. S. Harley, I. W. Forno, and D. P. A. Sands. 1981. Successful biological control of the floating weed salvinia. Nature 294:78-80.
Schwarzlaender, M. 1997. Bionomics of Mogulones cruciger (Coloeptera: Curculionidae), a below-ground herbivore for the biological control of hound’s-tongue. Environ. Entomol. 26:357-365.
Shea, K., and H. P. Possingham. 2000. Optimal release strategies for biological control agents: an application of stochastic dynamic programming to population management. J. Appl. Ecol. 37:77-86.
Story, J. M., W. R. Good, and L. J. White. 1994. Propagation of Agapeta zoegana L. (Lepidoptera, Cochylidae) for biological control of spotted knapweed: Procedures and cost. Biol. Control 4:145-148.
Story, J. M., L. J. White, and W. R. Good. 1996. Propagation of Cyphocleonus achates (Fahraeus) (Coleoptera: Curculionidae) for biological control of spotted knapweed: procedures and cost. Biol. Control 7:167-171.
Upadhyaya, M. K., H. R. Tilsner, and M. D. Pitt. 1988. The biology of Canadian weeds. 87. Cynoglossum officinale L. Can. J. Plant Sci. 68:763-774.

Thirteen ways of looking at invasive species
Brendon M. H. Larson Department of Environment and Resource Studies, University of Waterloo, Waterloo, ON
N2L 3G1 [email protected]
Humans have recently been transporting species around the planet at a faster rate than they previously dispersed on their own. A fraction of these species spread in their new place and have tremendous ecological and economic impacts. We thus call them “invasive species,” yet in so doing we frame the process in a way that emphasizes its negative dimensions and makes it difficult to step back and look at it anew. Since most of these species will not go away—and in fact will probably become more abundant, it is essential that we continually revisit how we conceptualize them to ensure a flexible and evolving relationship. In this paper, I present thirteen ways of looking at these species to help draw attention to some of the shortcomings with the entrenched way of conceptualizing them. In addition to viewing these species as invaders, we can also see them as terrorists, piggy-backers, opportunists, spawn, mirrors, providers, hybrids, tricksters, matrices, transients, founts and teachers. In presenting these alternatives, I wish to nurture a richer appreciation for the complexities involved and a concomitant sense of humility rather than denying that there is a problem.
One minute you’re waiting for the sky to fall; The next you’re dazzled by the beauty of it all.
Bruce Cockburn, “Lovers in a Dangerous Time”
Introduction
During my teens, I wandered for long hours around fields and woodlands in southern Ontario looking for new plants. I was obsessed by the search for species that I had never seen before and began to amass a collection and to consult with experts about what I had found. At age sixteen, I proudly collected a new weed for the province of Ontario, lesser wart-cress (Coronopus didymus (L.) J. E. Smith). At that age I drew little distinction between native and non-native species. I was aware that this was a weed, but had little experience with how problematic weeds could become. Soon thereafter, invasive garlic mustard (Alliaria petiolata (M. Bieb.) Cavara and Grande) became more and more abundant in the understorey at Point Pelee National Park, a short distance from where I grew up. I soon adopted a

132 Thirteen ways of looking at invasive species
general distaste for species such as this that threatened the flora with which I was familiar. They threatened my past and my roots, both as a naturalist and a biologist. A decade later, however, I began to wonder why we view these species the way we do.
I suspect that we dislike these species because they threaten to rupture our way of relating to the natural world. We single them out because they are “un-natural” in that humans have assisted their transgression of ancient biogeographic barriers. Yet this is only the case if we think of ourselves as separate from nature, as cultural entities rather than natural ones. The alternative, however, seems to be a slippery slope towards acceptance and apathy. Instead, I think this dilemma is a consequence of the stories we tell. In his Massey Lecture on the importance of narrative to Native peoples, King (2003) reiterates again and again that “The truth about stories is that that’s all we are [p. 2].” So how are we in relation to invasive species? Our standard narrative about them might go something like this: “These species do not belong here. They are plaguing the landscape, with untold economic and biodiversity impacts. We need to eradicate them whenever possible. This is war.” I propose that this narrative will not sustain itself in the long-run. It belies a denial of what is, a fear of change, and a methodology of hierarchical control.
We need a new story. We will have to learn to live with these species, for many of them are here to stay (Soulé 1990). The trends suggest that they will continue to increase in numbers and that we will at most be able to restrict the spread of the more problematic ones. If the only model we have is one that opposes these changes, we will be limited in our potential responses and in our capacity to accept when we need to do so. We will be constantly frustrated by the way the world is. I am not suggesting that we should take a laissez-faire attitude towards these species, but instead that we need to reconsider how we relate to them in order to wend a path between the extremes of apathy and antipathy (Larson 2007). We will not accept them all the time, but perhaps we need to accept them more often (see Smith et al. 2006). A new narrative can guide us in deciding when and where. It will also assist our children in their encounter with a world that contains many non-native species. If we teach them that non-native species are bad, will we effectively teach them that the natural world is bad, or even that humans are bad and guilty? What would be the consequences of this narrative?
Here, I will offer a number of ways of characterizing these species to promote the challenging, but essential task of reframing our image of them. The notion of reframing comes from cognitive science and was recently publicized by Lakoff (2004) prior to the 2004 U.S. Presidential election. He began by demonstrating the power of a linguistic frame with the following exercise he gives to students in his cognitive science 101 course: “Don’t think of an elephant. Whatever you do, do not think of an elephant [p. 3].” Of course, none of them—or us—can do this, for the word “elephant” evokes the cognitive frame of a behemoth with floppy ears and a lengthy snout. Lakoff then demonstrated how conservative politicians in the U.S. have adopted the same principle to unify themselves and to

Larson 133
thereby defeat the non-unified Democrats. Take the example of the “Clear Skies Act,” which was introduced by the Republicans. While it would likely contribute to increased air pollution, it is framed to give the opposite impression (a necessary step since nobody favours air pollution). However, if those who oppose this act continue to use its name, they are reinforcing the notion that it will lead to “clear skies” every time. They are working against themselves.
“Invasive species” presents an analogous case. In a classic paper, Schön (1979) argued that “the essential difficulties in social policy have more to do with problem setting than with problem solving, more to do with ways in which we frame the purposes to be achieved than with the selection of optimal means for achieving them [p. 255].” This applies to invasive species in that we restrict ourselves by thinking of them the way that we do. The phrase activates a particular frame of thought, one that has begun to seem self-evident and inexorable because it has been repeated so often. This is all the more reason to interrogate it, particularly since its repetition is conducive to a fundamentalism that it is the right view (see Hull 2006). Consequently, in this paper I will limit use of the phrase “invasive species,” for it only reinforces our tendency to think of this phenomenon in a certain way. Instead, I will use the acronym “IS”. While its referent is unlikely to drop from our lexicon anytime soon, we will obtain perspective through exploration of alternative possibilities. To avoid the prevailing connotation that “invasive species are our enemies,” I cannot just promote the alternative that “invasive species are our friends.” As in “don’t think of an elephant,” notice that they are invasive species, which still activates our associations about invaders, even if unconsciously—which is where cognitive scientists tell us that most cognition happens anyway (Lakoff and Johnson 1999).
This paper assumes that there is no single nature, but only a “diversity of contested natures” (Macnaughten and Urry 1998). This does not deny that there is a nature “out there.” Instead, it assumes that we cannot avoid human interpretation (Figure 1). Meinig (1979), for example, notes that if you “Take a small but varied company to any convenient viewing place overlooking some portion of city and countryside and have each, in turn, describe the ‘landscape’, … It will soon become apparent that even though we gather together and look in the same direction at the same instant, we will not—we cannot—see the same landscape [p. 33].” Among the ways that people could view it, depending on “what lies within their heads,” he lists landscape as nature, as habitat, as artefact, as system, as problem, as wealth, as ideology, as history, as place, and as aesthetic (see also Hull 2006). With regard to an agricultural field, for example, a weed scientist might see particular weed species and their life histories; a farmer, the history of his/her family as well as its future; a developer, “wasted space”; a family, the possibility of a new home in the country; a conservationist, soil. I wish to encourage such perspective for IS, by attending to some of the myriad ways we already conceptualize them—or might.
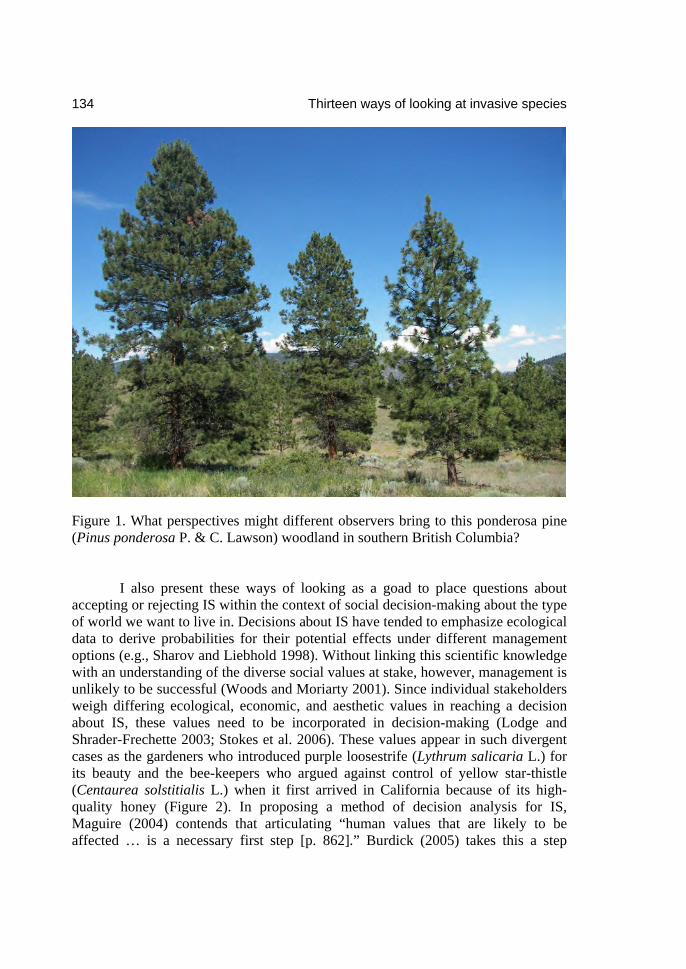
134 Thirteen ways of looking at invasive species
Figure 1. What perspectives might different observers bring to this ponderosa pine (Pinus ponderosa P. & C. Lawson) woodland in southern British Columbia?
I also present these ways of looking as a goad to place questions about
accepting or rejecting IS within the context of social decision-making about the type of world we want to live in. Decisions about IS have tended to emphasize ecological data to derive probabilities for their potential effects under different management options (e.g., Sharov and Liebhold 1998). Without linking this scientific knowledge with an understanding of the diverse social values at stake, however, management is unlikely to be successful (Woods and Moriarty 2001). Since individual stakeholders weigh differing ecological, economic, and aesthetic values in reaching a decision about IS, these values need to be incorporated in decision-making (Lodge and Shrader-Frechette 2003; Stokes et al. 2006). These values appear in such divergent cases as the gardeners who introduced purple loosestrife (Lythrum salicaria L.) for its beauty and the bee-keepers who argued against control of yellow star-thistle (Centaurea solstitialis L.) when it first arrived in California because of its high-quality honey (Figure 2). In proposing a method of decision analysis for IS, Maguire (2004) contends that articulating “human values that are likely to be affected … is a necessary first step [p. 862].” Burdick (2005) takes this a step
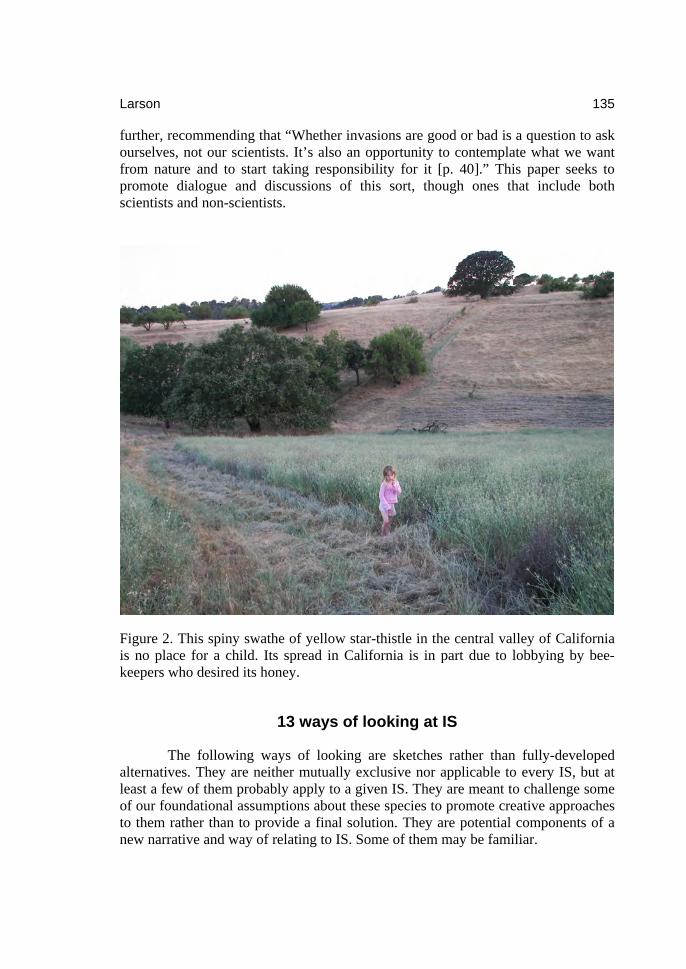
Larson 135
further, recommending that “Whether invasions are good or bad is a question to ask ourselves, not our scientists. It’s also an opportunity to contemplate what we want from nature and to start taking responsibility for it [p. 40].” This paper seeks to promote dialogue and discussions of this sort, though ones that include both scientists and non-scientists.
Figure 2. This spiny swathe of yellow star-thistle in the central valley of California is no place for a child. Its spread in California is in part due to lobbying by bee-keepers who desired its honey.
13 ways of looking at IS
The following ways of looking are sketches rather than fully-developed alternatives. They are neither mutually exclusive nor applicable to every IS, but at least a few of them probably apply to a given IS. They are meant to challenge some of our foundational assumptions about these species to promote creative approaches to them rather than to provide a final solution. They are potential components of a new narrative and way of relating to IS. Some of them may be familiar.
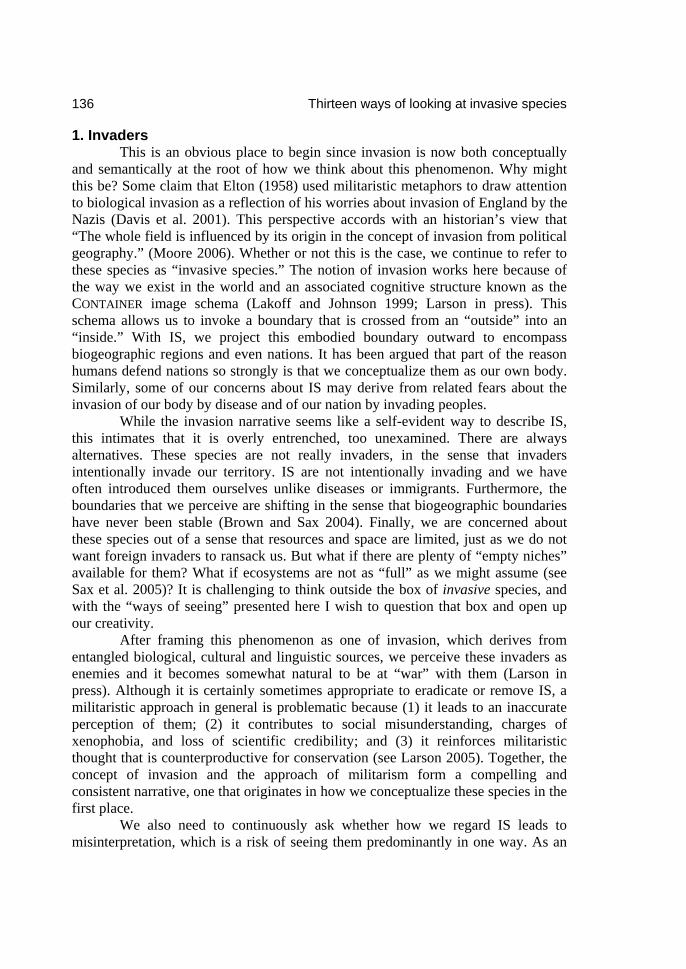
136 Thirteen ways of looking at invasive species
1. Invaders This is an obvious place to begin since invasion is now both conceptually
and semantically at the root of how we think about this phenomenon. Why might this be? Some claim that Elton (1958) used militaristic metaphors to draw attention to biological invasion as a reflection of his worries about invasion of England by the Nazis (Davis et al. 2001). This perspective accords with an historian’s view that “The whole field is influenced by its origin in the concept of invasion from political geography.” (Moore 2006). Whether or not this is the case, we continue to refer to these species as “invasive species.” The notion of invasion works here because of the way we exist in the world and an associated cognitive structure known as the CONTAINER image schema (Lakoff and Johnson 1999; Larson in press). This schema allows us to invoke a boundary that is crossed from an “outside” into an “inside.” With IS, we project this embodied boundary outward to encompass biogeographic regions and even nations. It has been argued that part of the reason humans defend nations so strongly is that we conceptualize them as our own body. Similarly, some of our concerns about IS may derive from related fears about the invasion of our body by disease and of our nation by invading peoples.
While the invasion narrative seems like a self-evident way to describe IS, this intimates that it is overly entrenched, too unexamined. There are always alternatives. These species are not really invaders, in the sense that invaders intentionally invade our territory. IS are not intentionally invading and we have often introduced them ourselves unlike diseases or immigrants. Furthermore, the boundaries that we perceive are shifting in the sense that biogeographic boundaries have never been stable (Brown and Sax 2004). Finally, we are concerned about these species out of a sense that resources and space are limited, just as we do not want foreign invaders to ransack us. But what if there are plenty of “empty niches” available for them? What if ecosystems are not as “full” as we might assume (see Sax et al. 2005)? It is challenging to think outside the box of invasive species, and with the “ways of seeing” presented here I wish to question that box and open up our creativity.
After framing this phenomenon as one of invasion, which derives from entangled biological, cultural and linguistic sources, we perceive these invaders as enemies and it becomes somewhat natural to be at “war” with them (Larson in press). Although it is certainly sometimes appropriate to eradicate or remove IS, a militaristic approach in general is problematic because (1) it leads to an inaccurate perception of them; (2) it contributes to social misunderstanding, charges of xenophobia, and loss of scientific credibility; and (3) it reinforces militaristic thought that is counterproductive for conservation (see Larson 2005). Together, the concept of invasion and the approach of militarism form a compelling and consistent narrative, one that originates in how we conceptualize these species in the first place.
We also need to continuously ask whether how we regard IS leads to misinterpretation, which is a risk of seeing them predominantly in one way. As an
Larson 137
example, there have been a number of recent studies concerning whether purple loosestrife is really so harmful, partly initiated by claims that its deleterious effects were an “untested hypothesis” (Hager and McCoy 1998). While the upshot of these studies is still unclear, there is some indication that the situation has been mis-framed. Houlahan and Findlay (2004), for example, surveyed 58 Ontario wetlands and found that exotic (including purple loosestrife) and native species were equally likely to affect native plant communities negatively. If we are focused on the exotic/native distinction, however, we might overlook the possibility that “the key to conservation of inland wetland biodiversity is to discourage the spread of community dominants, regardless of geographical origin [p. 1132].” Meiners et al. (2001) came to a similar conclusion in their study of the effect of native and non-native species invading abandoned agricultural land.
While some will counter that the joint invasion-militarism frame aptly draws public attention to the problem of IS (Simberloff 2006), there are two assumptions here. First, that we need to dupe people into thinking there is a problem rather than having open dialogue about it. Second, that such language will effect change. By questioning these assumptions, we seek more inclusive and productive frames with the objective of a long-term, sustainable relation between humans and the planet (Gobster 2005; Larson 2005). The following ways of looking aim to break the stranglehold of one particular way of relating: IS are bad, they are an enemy to be destroyed, and we are at war against them.
2. Terrorists Meyerson and Reaser (2003) stated that “A terrorist attack on the
environment [with IS] would have economic consequences …but the greater impact might be on the national psyche, if, for example, a national park and/or highly charismatic wildlife species were targeted [p. 307].” Whether or not one thinks this is likely, it shows how invasion biology resonates within a particular socio-political context. There are numerous parallels between how we relate to IS and how we related to potential terrorists after 9-11: 1) We need to define the enemy with a clear boundary. In the case of IS, this is
often difficult since it can be challenging to assess nativity (Woods and Moriarty 2001). Similarly, it was difficult to find a boundary defining al-Qaeda, and hence critiques of the war on terrorism focused on the challenge of attacking a decentralized organization.
2) We develop a grand plan to prevent future outbreaks. In both cases, border control is intensified, but the irony is that attacks are nearly impossible to prevent because one small oversight could undermine our efforts. The next attack could come from any direction at any time, so a tone of paranoia typifies border control. In these ways, our attempt to prevent future IS from entering our borders resemble those seeking to prevent terrorist attacks on airplanes.
3) We become anxious about naturalized individuals. Biologists seek to identify traits that predict whether these species will become invasive, which presents
138 Thirteen ways of looking at invasive species
huge challenges given that many of them might be “preparing” during an initial lag phase when they are nearly invisible—or perhaps veritably so in the case of cryptic invasion (e.g., common reed, Phragmites australis (Cav.) Trin. ex Steudel, see Saltonstall 2002). For similar reasons, the Bush Administration forced Arab-Americans to register themselves. In both cases, these attempts have led to further problems: some have claimed that we are being xenophobic in our response to IS, that we tar all non-native species as bad or potentially bad (Slobodkin 2001), analogous to charges of racial profiling by the Bush Administration.
4) We justify non-target effects to control the enemy. In the case of IS control programs, these may result from herbicide and pesticide spraying or the escape of potential biocontrol agents. Analogously, the war on Iraq led to many civilian casualties.
5) We leave victory ill-defined. With IS, it appears that we are engaging in an act of purification that will endure until the end of humanity. Similarly, many prognosticators predicted that terrorism would thrive even if bin Laden had been caught, perhaps even becoming more powerful. It was destined to be an extended war on an evasive quarry.
6) We are distracted from alternative causal factors by both battles. Just as we underestimate the extent to which IS are an effect of other human activities (see below), the war on terrorism neglects American involvement in the establishment of al-Qaeda and the declining condition of the United States economy and civil rights (Lakoff 2003).
These parallels may give pause to standard conceptualization of IS by suggesting that our response to them must be considered in the context of larger cultural patterns (Chew and Laubichler 2003; Fine and Christoforides 1991; Larson in press). While the response to terrorists after 9-11 may have seemed “natural” to some, it was nonetheless questioned by others. Both situations may also draw attention to the challenges we face in combating any quarry of our own making.
3. Piggy-backers IS piggy-back on human beings and our habits in order to arrive in new
locations. This is comparable to phoresy, the process by which animals move around in association with one another. A classic example is provided by the phoretic mites that move around on the bodies of various beetles and which depend on them for their dispersal (Figure 3). They are specialized for this dispersal, though not necessarily “invasive” once they arrive. IS similarly rely on us to move them around (Bright 1999). Though they may move on their own without our assistance, we often speed up this process (but see Brown and Sax 2005). We travel the seas, emptying bilge water. We bring home souvenirs, on purpose or unknowingly. We order seeds from foreign lands to grow plants that we desire. Even as biologists, we insist on traveling the world. In each case we increase the probability of introducing organisms that would not have made it here otherwise. Like the beetles that transmit

Larson 139
phoretic mites, we are essential to their dispersal and there is no way to imagine these species without us.
Figure 3. Half a dozen phoretic mites cling to the thorax of this burying beetle (Nicrophorus sp.), which is their dispersal agent.
4. Opportunists We not only transport these species, but also provide them with homes.
Once they arrive, they typically do well in places that we have created for them, particularly disturbed habitats. We can choose to malign their resourcefulness or to appreciate it. Jenkins and Pimm (2003) concluded that about 23% of the world’s ice-free land area is disturbed, forming a “global weed patch” favorable for IS. We have changed global climate and nitrogen deposition patterns and created eutrophic wetlands. Some have argued that due to the scale of these human disturbances there is no longer any “nature” (McKibben 1989). Either way, we have certainly contributed to the capacity for IS to “survive and thrive” in new places. They are symbionts of ours. They are a consequence of how we live on the earth.

140 Thirteen ways of looking at invasive species
An emerging body of literature confirms that IS may not be so much a cause as a consequence. In the Garry oak (Quercus garryana Dougl. ex Hook.) savannah of British Columbia, for example, MacDougall and Turkington (2005) attempted to tease apart whether IS “drive” ecological change or, rather, just respond (as “passengers”) to prior and ongoing ecological change (see also Didham et al. 2005; Farnsworth 2004; Gurevitch and Padilla 2004). While the presence of IS has often been associated with the decline of native species, implying that they are the primary cause, an alternative possibility is that human disturbance is at least a coequal causal agent. MacDougall and Turkington (2005) found that the passenger model better explains the success of exotic species since removal of two dominant exotic grasses, Kentucky bluegrass (Poa pratensis L.) and orchard grass (Dactylis glomerata L.), did not generally lead to recovery of native species, probably because the latter were recruitment-limited. In northern Wisconsin and Michigan, Wiegmann and Waller (2006) came to a similar finding. They resurveyed 62 upland forests that had been initially inventoried around 1950 and found that 21 “loser” species declined in frequency whereas 21 “winner” species increased. Perhaps surprisingly, only five of the winners were exotic species, whereas the remaining species were common, native ones. The losers were mostly rare animal-dependent forbs that were sensitive to desiccation and disturbance, but overall they suggest that the “key driver” of their decline was grazing by white-tailed deer (Odocoileus virginiana). Studies such as these raise questions about whether IS are too often scapegoats; they may be as much a result of landscape changes we have caused as the cause of such changes themselves. Perhaps IS even necessitate that we replace our emphasis on human versus non-human causality with a focus on human/non-human co-dependence.
5. Spawn We could look at these opportunistic symbionts of ours neutrally, but if we
wish to lament them we could consider them as our spawn rather than as invaders for which we have no responsibility. Their occurrence outside their historical distribution results from our actions, from the choices we have made as a species (and as individuals), and from our habits: our consumption, our travel, our never-ending search for greater efficiency, productivity and speed. It is in part because of these patterns that IS are out of control.
I am reminded of the story of the “Sorceror’s Apprentice.” A sorcerer leaves an apprentice in his home one day with orders to do some housework. When the apprentice gets bored carrying water to fill a bath, she decides to break the rules and cast a spell so that a broom carries the water for her. Soon, the bath overflows, however, and she is powerless in not knowing the incantation needed to stop the broom. In desperation, she hacks the broom in half with an axe, but each half then begins to carry water so the problem becomes worse. She is nearly drowning when the sorcerer returns to save her.
Larson 141
Though I suspect there is no sorcerer to save us from these spawn-species of ours, it is certainly our actions that have created them. In his history of weed control in the Canadian Prairies, Evans (2002) notes how the main legacy of agricultural bureaucracy and legislation was to “help preserve the ecologically unsound, weed-friendly style of farming that persists on the Prairies to this day. They did so by reinforcing the popular notion that weeds were the ‘enemy’; by diverting attention away from the fact that the true enemy was the extensive system of grain farming practiced by the farmers themselves [p. x].” Similar accounts have been told in the southern U.S. for both the rise of tamarisk (Tamarix spp.) in response to how we have changed the hydrological regime (Rodman 1993) and for the spread of fire ants because of the “bulldozer revolution” (Buhs 2002). Some of our efforts at control merely intensify the problem or create additional ones, including errant biological control efforts, unintended consequences of pesticide spraying, and recolonization by non-native species after extermination of an IS (e.g., Smith et al. 2006).
Vonnegut (1973) provides an entertaining example of IS as spawn in his fictional novel Breakfast of Champions:
Leo Trout … guard[ed] the only nesting place in the world for Bermuda Erns, … the largest creatures ever to fly under their own power on the planet. … These great green sea eagles eventually became extinct, despite anything anyone could do. … After all the Erns were dead, it was discovered what had killed them. It was a fungus, which attacked their eyes and brains. Men had brought the fungus to their rookery in the innocent form of athlete’s foot [pp. 30-31].
We have created IS. They are our progeny. We would have to remove ourselves—the greatest IS of them all—to get rid of them.
6. Mirrors It is too convenient to see the problem of IS “out there”, as one of species
moving around and causing harm, but our everyday actions are tied up in their spread as described above. Consequently, we may dislike IS because we observe something in their behaviour that we dislike about our own. We observe them spreading, expanding, and going into the wrong places. In the process they reflect our own behaviour: 1) Among U.S. States, human population size and years of statehood account for 75% of the variation in non-native plant species richness, with the former being the best single predictor (McKinney 2001); 2) Higher real estate value leads to more alien species (Taylor and Irwin 2004); 3) In nature reserves, IS presence increases with human visitation rates (Lonsdale 1999). These results emphasize how interwoven we are with the spread of IS (Figure 4).
In his book, Faces of the Enemy, Keen (1987) observes that “In the image of the enemy we will find the mirror in which we may see our own faces most clearly [p. 11].” We characterize IS as amoral in terms of numerous traits—aggressiveness and lack of control, in particular—that “represent forbidden sides of
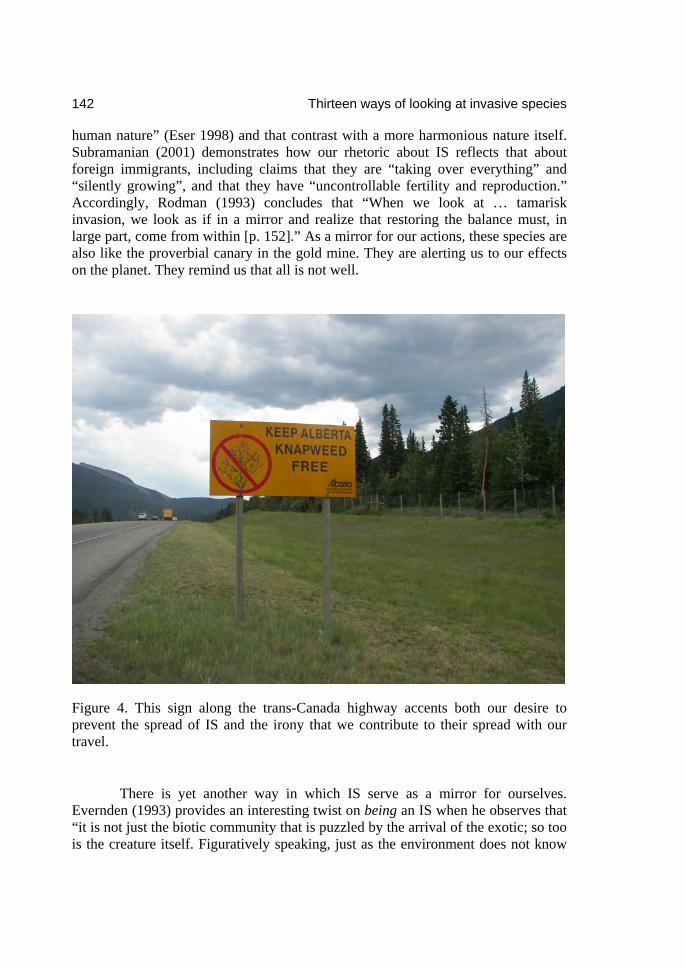
142 Thirteen ways of looking at invasive species
human nature” (Eser 1998) and that contrast with a more harmonious nature itself. Subramanian (2001) demonstrates how our rhetoric about IS reflects that about foreign immigrants, including claims that they are “taking over everything” and “silently growing”, and that they have “uncontrollable fertility and reproduction.” Accordingly, Rodman (1993) concludes that “When we look at … tamarisk invasion, we look as if in a mirror and realize that restoring the balance must, in large part, come from within [p. 152].” As a mirror for our actions, these species are also like the proverbial canary in the gold mine. They are alerting us to our effects on the planet. They remind us that all is not well.
Figure 4. This sign along the trans-Canada highway accents both our desire to prevent the spread of IS and the irony that we contribute to their spread with our travel.
There is yet another way in which IS serve as a mirror for ourselves. Evernden (1993) provides an interesting twist on being an IS when he observes that “it is not just the biotic community that is puzzled by the arrival of the exotic; so too is the creature itself. Figuratively speaking, just as the environment does not know
Larson 143
how to cope with the new creature, neither does the exotic know what it ought to do.” Whether or not we ascribe too much personification to this view of organisms, he proposes that we might emphathize with this aspect of exotics because we are exotics too—our placelessness, our technologies, and our minds have set us adrift in the world. Non-indigenous species—especially IS—may serve as a stark reminder of our lack of an existential niche.
7. Providers Non-native species comprise most of the plants that humans grow for food,
especially here in Canada. They are our lifeblood. Yet from the perspective of the land, they are just as harmful as IS. I think one of the great ironies of invasion biology is that as the settlers moved westward in North America, they despised wilderness and eradicated it and its denizens to replace it with non-native species to supply their food. As Evans (2002) observes, “Between 1800 and the 1860s [in Ontario], settlers waged a relentless war against forest species: plants out of place in the eyes of farmers [p. 70].” We once killed off native species to make way for our introduced ones, yet now we revere wilderness and eradicate non-native species (especially invasive ones) to recover those earlier species.
It is intriguing to reflect on what this story tells us about our values. Why is it that we accept some non-native species but not others? We accept non-native plants that we cultivate, but not the weeds that affect their growth. We do not accept non-native plants that we introduce for particular reasons, including garlic mustard and purple loosestrife, once they escape. We accept native plants when they are in their place, but not non-native species that affect them. It appears that what bothers us is “nature out of place” (Milton 2000), nature that disrupts our plans, whether the gardens we maintain for food or the gardens in which we try to conserve biodiversity. We support those species that continue to encourage our own invasive spread, producing more IS as we do. Just as history suggests that we cannot have crops without weeds, we may not be able to set landscapes apart without IS. So, by acknowledging the importance of tamed invaders to our lives, we gain yet another perspective on the fine line between non-native and native, invasive or not, and its dependence on our desires and preferences.
8. Hybrids Non-native plant species often hybridize with native ones. While
interspecific hybridization often exacerbates invasiveness and/or contributes to the demise of native species (Mooney and Cleland 2001), in other cases it may lead to the evolution of new species (Ellstrand and Schierenbeck 2000). There are examples in a variety of genera, including Helianthus, Senecio, Spartina, Tamarix, and Tragopogon. How we classify these species will depend in large part on how we conceptualize the place of humans in the natural world.
IS also represent hybrids of nature and culture. While we tend to think in neat categories of natural entities versus human creations, IS contain inextricable
144 Thirteen ways of looking at invasive species
elements of both. They are “natural” in that they are species like any other. They are “cultural” in that they have been brought somewhere new by humans, whether intentionally or not. While we might wish to classify a species at one end or the other of the nature-culture pole, both will ultimately be unsatisfactory. If we treat them as “natural”, perhaps by just ignoring them, we may have to contend with greater effects than we wish. If we treat them as merely “cultural,” wishing to control them, we will soon be faced with their “natural” abilities, their evolutionary capacities. As an example, consider the dramatic increase in forest cover in southern Ontario and in much of the north-eastern U. S. over the past few decades. These forests have diverged from “pre-settlement” ones, however, not least because they are so “disturbed” that they now represent nature-culture hybrids—regardless of the extent to which their species are native or not.
Robbins (2001) provides an informative case study of the hybridity of our landscapes. In Rajasthan, India, people formerly harvested food, medicines, and other products from local woodlands and incorporated fallow land into their agro-pastoral production. Over the past few decades, governmental policies have segregated these woodlands as wilderness reserves, in contrast with intensified use of fallow lands and the planting of non-native fast-growing trees (especially mesquite, Prosopis juliflora DC.) to provide fuel-wood plantations. That is, they have applied a bureaucratic classification scheme to the land that derives from a partitioning between what is “natural” and what is “social.” Unfortunately, this effort has backfired since the invasive mesquite has created a hybrid “quasiforest” that is a “nuisance to farmers, a crisis for locals, and a novel ecology that has proven impossible to control or quarantine [p. 639].” It comprised most of the 50% increase in forest cover observed between 1986 and 1999. This growth is a complex consequence of the biological properties of mesquite (drought and browse resistance, nitrogen fixing ability, and allelopathic properties), its popularity among foresters, and the recent shift in disturbance regime caused by government policies. Robbins (2001) concludes that “The more we attempt to partition and measure the land in discrete modern packages, the more unexpected … crosses, mixes, and effects are evident [p. 639].” This may be the way the world is, with our boundaries being only transient fixes against the flux (Larson and Milburne, in preparation).
9. Tricksters In many Native American traditions, the coyote is the trickster who
disobeys normal rules of conduct and creates problems for human beings by upsetting their plans. Sometimes he playfully mocks the control that people seek, their attempt to figure everything out and to keep it in place. IS may play an analogous role for us as they serve as a reminder—even if we would prefer not to listen—that life is outside our control. We continue to seek control, however, even while IS (and many other features of the world) undermine it. As historian Fiege (1999) states, “Unwanted living things … could be counted among life’s few certainties [p. 77].” We may now perceive the spread of mesquite in Rajasthan in a
Larson 145
different light, as a trickster that has disrupted our rationalized approach to landscapes. Or, as Ehrenfeld (1993) asserts with regard to our wish to rid our lawns and lives of dandelions (Taraxacum officinale Weber), “Dandelions are the supreme symbol of the failure of human control [p. 100].”
The trickster reminds us of our place in the cosmos. We live in an era of great faith in science and rationality, and we extend this faith to our approach to IS, thinking that some day, with sufficient border control, rapid detection, and efficient extermination, we can overcome this problem. And we can defend this faith, especially at times of success such as the “rapid response” to eradicate the alga Caulerpa taxifolia (Vahl) C. Agardh when it was detected in California (Anderson 2005). Nonetheless, this view runs the risk of becoming soteriological, a source of ultimate salvation that is based on the success of scientific prediction and control. However, it lacks the exploration of meaning inherent in traditional religious soteriology. It also lacks in humility. We might heed the words of Berry (2000):
Though we have life, it is beyond us. We do not know how we have it, or why. We do not know what is going to happen to it, or to us. It is not predictable; though we can destroy it, we cannot make it. It cannot, except by reduction and the grave risk of damage, be controlled. It is, as Blake said, holy. To think otherwise is to enslave life, and to make, not humanity, but a few humans its predictably inept masters [p. 9].
We probably first became biologists because of our appreciation and respect for organisms. As many of us were educated, this became a concern for biodiversity. How is it that this has become a desire to kill some organisms and to replace them with others? Does our esteem for others only hold if they are a certain way? The trickster encourages us to ask again what we seek for the future with regard to IS, between the extremes of “a return to a prior Eden” and “a fall to hell and Brimstone.”
10. Matrices In many cases, IS have established themselves to such an extent that they
have become components of a habitat matrix that we have no choice but to accept (Soulé 1990). Sometimes this matrix may appear dysfunctional, but this often remains to be seen. As an example, non-indigenous tree species play a critical role in the regeneration of forested landscapes on Puerto Rico, beginning as monocultures but later contributing to the colonization of native tree species and giving rise to unique mixo-communities after 60-80 years (Lugo 2004). Similarly, Wilkinson (2004) describes how “terra-forming” by the introduction of diverse plant species has transformed Green Mountain on Ascension Island in the south Atlantic Ocean. In 1836, Darwin complained that it was an “island entirely devoid of trees,” whereas now there is a cloud forest. Although it is composed almost entirely of non-native species, Wilkinson (2004) argues that it provides an example of how humans can create complex systems simply by removing dispersal barriers, potentially even overcoming a lack of coevolutionary history. Systems such as this
146 Thirteen ways of looking at invasive species
may not be beneficial for endemic species (e.g., Gray 2004), but they could serve other roles. Furthermore, if you try to remove dominant IS such as these, new ones may simply arrive to replace them (Hulme and Bremner 2006; Zavaleta et al. 2001). For related reasons, the matrix formed by IS often plays a critical role in restoration projects (Ewel and Putz 2004).
Occasionally, habitat dominated by an IS supports rare species that we care about. In California, the endangered Southwestern willow flycatcher (Empidonax traillii extimus) nests in tamarisk, the rapidly-declining tricolored blackbird (Agelaius tricolor) nests preferentially in Himalayan blackberry (Rubus armeniacus Focke), and monarch butterflies (Danaus plexippus) overwinter in Eucalyptus (Eucalyptus sp.) groves. MacDougall and Turkington (2005) suggest that dominant exotic grasses help to maintain the open structure of Garry oak savannah by preventing succession to exotic woodland in the absence of fire. These and other examples demonstrate how IS have already become a component of functioning biological systems.
11. Transients Invasion happens. Species come and go, they always have, and they always
will (Brown and Sax 2004; Vermeij 2005). We will never be able to capture them and thereby trap communities in a particular state. Ash (Fraxinus spp.) trees in southern Ontario are currently being eliminated by emerald ash borer (Agrilus planipennis), and there is no doubt that this has tremendous aesthetic, ecological, and economic implications (Poland and McCullough 2006). Nonetheless, any defense in terms of the loss of “native” forest is weak, since the forest has already lost American chestnut (Castanea dentata (Marshall) Borkh.) and American elm (Ulmus americana L.) trees, the former dominants, to earlier “waves of invaders” (Figure 5). IS remind us that life is characterized by change, and that our concerns derive from trying to keep things as we know them.
Nativity is always relative to a particular time and place—it must be carefully indexed or it is meaningless. At what scale is something native? If we disperse a native species to a new location 100 meters away, is it non-native there? Could it become invasive with respect to the native species already there? But we have reached an impasse if this is an invasion because many species that we now consider “native” were moved over various scales by indigenous peoples.
IS are also transient in terms of our changing perceptions of them, which provides another impetus to stretch our conceptual flexibility. For example, kudzu (Pueraria montana var. lobata (Willd.) Maesen & S. M. Almeida) was originally promoted as a beneficial “miracle vine” in the south-eastern United States (Alderman 2004). North American black cherry trees (Prunus serotina Ehrh.) were once planted in Europe as a timber tree and later seen as a weedy pest, but now they are to a large extent accepted as part of the flora (Starfinger et al. 2003). We know we will have to accept some of these species, but we need to bring this realization even to our interactions with those species that we really do not want.

Larson 147
Figure 5. This rich Carolinian woodland in southern Ontario lacks dominant trees of a century ago that were lost to IS.
12. Founts We think of IS as forces of death and destruction, yet we could alternatively
think of them as long-term forces of life and creation. By introducing species to new locations, we are creating new evolutionary possibilities. Of course, introduced species will not always evolve, especially on short time scales, but one would expect they will eventually. They will encounter new, evolving competitors, herbivores and predators as well as slightly different climatic regimes. They will gradually develop new interactions with other species (Mitchell et al. 2006), in some cases causing reciprocal adaptive change in the pre-existing flora and fauna (Strauss et al. 2006a). Over time, they may evolve to be distinct from their place of their origin (Mooney and Cleland 2001), perhaps even becoming new species. For example, Schwarz et al. (2005) documented hybrid speciation of a fruit fly, the “Lonicera fly” (Rhagoletis sp.), in a host shift to invasive honeysuckle (Lonicera sp.) in the north-eastern United States. While we may be a greater factor in the origin of such species, they can in the long-run be seen in this light as a process of creation rather than destruction. I agree with Cassey et al. (2005) that “The fact that
148 Thirteen ways of looking at invasive species
we can look forward to ecological systems recovering from these assaults in the next 10 million years or so is not … a great consolation [p. 479]”, yet we nonetheless must acknowledge that many of these changes are happening whether we like them or not. We cannot recover the past.
We may also view IS as a fount of future communities. Hobbs et al. (2006) review the character of “novel ecosystems” around the world, including those mentioned in the “matrices” section above. Many of them contain IS at the expense of endemics, which prompted one reviewer of their paper to declare that “it is hard to make lemonade out of these lemons.” They countered that “we are heading towards a situation where there are more lemons than lemonade, and we need to recognize this and determine what to do with the lemons [p. 5]”. These ecosystems may not serve all of our needs or requirements, but that may not be the only justification for their existence.
IS may also help to create new habitats that are more species-rich by certain definitions and at certain scales. The loss of some endemics to IS is more than offset by gains in local species richness due to non-native species (Sax and Gaines 2003). Reviewing such claims, Davis (2003) emphasizes that “the breakdown of the world’s dispersal barriers will result in a homogenization of Earth’s biota, [but] homogenization is not synonymous with low diversity. In the future, different regions of the world will be more similar than they are now. They will also be more diverse [p. 488, see also Rosenzweig 2001].” It is crucial to recognize, however, that these claims prioritize the richness component of diversity over its evenness, and that there may be a lag period before we recognize the full effect of these species. Nonetheless, diversity may also increase in a more subtle sense: Strauss et al. (2006b), for example, demonstrate that invasive grass species in California are less closely related (phylogenetically) to native grass species than are non-invasive non-native ones. Though these studies are optimistic and oriented to long time scales, IS may contribute to novelty at all levels of biological organization.
13. Teachers IS are teachers in the sense that they encourage us to recognize some of our
deepest assumptions about the natural world and our relationship to it. This process may be an emotional and even painful one, so we may learn more by paying attention to our response to IS than from other humans who share our assumptions about nature. For example, Burdick (2005) claims that the real crime of IS “isn’t against nature; it’s against us and our self-serving ideas of what nature is supposed to be [p. 36].” If nature is supposed to behave, we might be frustrated at the economic costs of IS and how they force us to reckon with our ideals for continued growth. If nature is supposed to obey, we might be upset that we cannot control many IS. If nature is supposed to be a particular kind of functioning system to support us, we might be afraid that IS will cause the system to fail. If nature is supposed to be diverse and heterogeneous, we might be terrified at how IS might contribute to the continued loss of endemic species and perhaps to a more
Larson 149
homogeneous landscape. Or, if society is supposed to listen to scientists, we might be angry at the “system” or the “naïve public” who will not listen to the image of IS that we paint.
I have seldom heard discussion of the emotional undertones of invasion biology. For the most part, we merely label these species, in one way or another, as “bad.” But this substitutes for a range of emotions we may experience: anger and loathing because of how they are changing “nature”, fear of their potential effects, frustration that we can only do so much about it, sorrow for our losses, regret for the choices made by previous individuals (and even by our species), and maybe even guilt that we too are an IS. Canadian poet-philosopher Zwicky (2004) captures these emotions eloquently for the specter of climate change in Canada:
We hope because … we have good reason to believe that beauty will be here: there will be trees and grass and rivers and, unless we are staggeringly stupid, a few humans around to appreciate them. We grieve because we also have reason to believe that this beauty—at least some among these copses, these grasslands, these shorelines—will not survive [p. 9].
To avoid feeling the weight of this and related issues, we may choose apathy, denial, or a retrenchment to objective problem-solving. Instead, we may need to acknowledge and discuss these responses, much as Macy (1983) has nurtured people to better handle the nuclear threat. In this way, IS can help us grow in humanity and in wisdom.
Conclusion
Having considered these diverse ways of looking at IS, we may now have a better sense of why these species are not solely “invaders”. As invasion biologists and weed scientists we may still hold to a particular perspective on their character, but we hopefully will have greater openness to alternatives (Figure 6). I hope that the “ways of looking” presented here may assist in articulating these values and in re-storying our landscapes together. The intention of reviewing these alternatives is not to condone IS, but to emphasize that our conceptualization of them needs to be more complex than one based in dualities of good-bad, insider-outsider, natural-unnatural. Many of us will still feel antipathy towards invasive species, either because of their economic impact or their effects on familiar species and communities, yet we must communicate our concerns to those who have different perspectives on the issue. Furthermore, these alternatives highlight that different IS require different responses that need to be evaluated in context.

150 Thirteen ways of looking at invasive species
Figure 6. Flowering garlic mustard dominates the spring understory in this woodland at Point Pelee National Park. This is one of the least popular IS in southern Ontario. While views of it seem unlikely to change anytime soon, its occurrence in the region points to many of the alternative ways of seeing discussed herein.
Larson 151
“Invasive species” has negative connotations, so most of us quickly skip to “How do we get rid of them?” “IS”, instead, allowed a brief pause. When I used this shorthand herein, did you have a tendency to translate it into “invasive species” rather than to accept what IS? The acronym conveniently reminds us that we may relate to IS as what is. We may thus reconsider the “is-ness” of IS, a phenomenon that Wallace Stevens explores more generally in his poem “Thirteen Ways of Looking at a Blackbird” which partly inspired this chapter. By considering IS in the context of what is, we may be less driven by blame and regret about how we have reached this point, based on past actions, or by fears about the shape of the future. Is not only leads to greater acceptance of our place in the cosmos, but also to a better source of action. “To be” is one of the most basic and powerful verbs in the English language. We normally take it for granted, yet it is a pointer to the question “Why is there something rather than nothing?”, an ontological mystery we have not answered (Evernden 1993; Heidegger 1962). And by asking this question, we must confront whether we are as in control of what is—or of IS—as we might think.
Finally, a word on “ways of looking.” Vision is our predominant sense, yet looking distances us in contrast to other sensual capacities. It may encourage us to take the perspective of looking outward on a world flowing by, as isolated individual subjects. But we are immersed in this world and in the phenomenon of IS. Rather than dwelling in it, however, we attempt to act as the universal agent of control. As anthropologist Ingold (2000) states,
What is perhaps most striking about the contemporary discourse of global environmental change is the immensity of the gulf that divides the world as it is lived and experienced by the practitioners of this discourse, and the world of which they speak under the rubric of ‘the globe.’ No-one, of course, denies the seriousness of the problems they address; there is good reason to believe, however, that many of these problems have their source in that very alienation of humanity from the world of which the notion of the global environment is a conspicuous expression [p. 215].
The truth about stories is that that’s all we are. They are not just stories or ways of looking, but hopefully they point as well to “ways of being” with regard to IS, ones that are more fully embodied in the world and better address our own agency rather than standing outside of it as an alien. In this way, IS may provide an opportunity to walk a path between “waiting for the sky to fall” and being “dazzled by the beauty of it all.” The former tends toward fear and loathing, whereas the latter breeds courage and hope.
Acknowledgements
I thank David Clements for the opportunity to participate in this symposium on IS. I also appreciate comments on the manuscript from David Clements, Stephen Darbyshire, George Francis, Karolyne Pickett, and two anonymous reviewers.

152 Thirteen ways of looking at invasive species
Literature cited
Alderman, D. H. 2004. Channing Cope and the making of a miracle vine. Geog. Rev. 94:157-177.
Anderson, L. W. J. 2005. California's reaction to Caulerpa taxifolia: A model for invasive species rapid response. Biol. Invasions 7:1003-1016.
Berry, W. 2000. Life is a Miracle: An Essay Against Modern Superstition. Washington, D. C.: Counterpoint. 153 p.
Bright, C. 1999. Invasive species: Pathogens of globalization. Foreign Policy 116:50-64.
Brown, J. H. and D. F. Sax. 2004. An essay on some topics concerning invasive species. Austral Ecol. 29:530-536.
Brown, J. H. and D. F. Sax. 2005. Biological invasions and scientific objectivity: Reply to Cassey et al. (2005). Austral Ecol. 30:481-483.
Buhs, J. B. 2002. The fire ant wars: Nature and science in the pesticide controversies of the late twentieth century. Isis 93:377-400.
Burdick, A. 2005. Are invasive species really so bad? Discover 26:34-41. Cassey, P., T. M. Blackburn, R. P. Duncan and S. L. Chown. 2005. Concerning
invasive species: Reply to Brown and Sax. Austral Ecol. 30:475-480. Chew, M. K. and M. D. Laubichler. 2003. Natural enemies - Metaphor or
misconception? Science 301:52-53. Davis, M. A. 2003. Biotic globalization: Does competition from introduced species
threaten biodiversity? BioScience 53:481-489. Davis, M. A., K. Thompson and J. P. Grime. 2001. Charles S. Elton and the
dissociation of invasion ecology from the rest of ecology. Divers. Distrib. 7:97-102.
Didham, R. K., J. M. Tylianakis, M. A. Hutchison, R. M. Ewers and N. J. Gemmell. 2005. Are invasive species the drivers of ecological change? Trends Ecol. Evol. 20:470-474.
Ehrenfeld, D. 1993. Beginning Again: People and Nature in the New Millennium. New York, NY: Oxford University Press. 216 p.
Ellstrand, N. and K. Schierenbeck. 2000. Hybridization as a stimulus for the evolution of invasiveness in plants? Proc. Natl. Acad. Sci. U.S.A. 97:7043-7050.
Elton, C. S. 1958. The Ecology of Invasions by Animals and Plants. London: Methuen. 181 p.
Eser, U. 1998. Assessment of plant invasions: Theoretical and philosophical fundamentals. Pages 95-107 in U. Starfinger, K. Edwards, I. Kowarik and M. Williamson, eds. Plant Invasions: Ecological Mechanisms and Human Responses. Leiden, Netherlands: Backhuys Publishers.
Evans, C. L. 2002. The War on Weeds in the Prairie West: An Environmental History. Calgary, AB: University of Calgary Press. 305 p.

Larson 153
Evernden, N. 1993. The Natural Alien: Humankind and Environment. 2nd Edition. Toronto, ON: University of Toronto Press. 172 p.
Ewel, J. J. and F. E. Putz. 2004. A place for alien species in ecosystem restoration. Front. Ecol. Env. 7:354-360.
Farnsworth, E. 2004. Patterns of plant invasions at sites with rare plant species throughout New England. Rhodora 106:97-117.
Fiege, M. 1999. Irrigated Eden: The Making of an Agricultural Landscape in the American West. Seattle, WA: University of Washington Press. 323 p.
Fine, G. A. and L. Christoforides. 1991. Dirty birds, filthy immigrants, and the English sparrow war: Metaphorical linkage in constructing social problems. Symbol. Interact. 14:375-393.
Gobster, P. H. 2005. Invasive species as ecological threat: Is restoration an alternative to fear-based resource management? Ecol. Rest. 23:261-270.
Gray, A. 2004. The parable of Green Mountain: massaging the message. J. Biogeog. 31:1549-1550.
Gurevitch, J. and D. K. Padilla. 2004. Are invasive species a major cause of extinctions? Trends Ecol. Evol. 19:470-474.
Hager, H. A. and K. D. McCoy. 1998. The implications of accepting untested hypotheses: A review of the effects of purple loosestrife (Lythrum salicaria) in North America. Biodiv. Conserv. 7:1069-1079.
Heidegger, M. 1962. Being and Time. New York, NY: Harper and Row. 589 p. Hobbs, R., S. Arico, J. Aronson, J. Baron, P. Bridgewater, V. Cramer, P. Epstein, J.
Ewel, C. Klink, A. Lugo, D. Norton, D. Ojima, D. Richardson, E. Sanderson, F. Valladares, M. Vila, R. Zamora and M. Zobel. 2006. Novel ecosystems: theoretical and management aspects of the new ecological world order. Glob. Ecol. Biogeog. 15:1-7.
Houlahan, J. E. and C. S. Findlay. 2004. Effect of invasive plant species on temperate wetland plant diversity. Conserv. Biol. 18:1132-1138.
Hull, R. B. 2006. Infinite Nature. Chicago, IL: University of Chicago Press. 258 pp. Hulme, P. E. and E. T. Bremner. 2006. Assessing the impact of Impatiens
glandulifera on riparian habitats: partitioning diversity components following species removal. J. Appl. Ecol. 43:43-50.
Ingold, T. 2000. The Perception of the Environment: Essays in Livelihood, Dwelling and Skill. New York, NY: Routledge. 465 p.
Jenkins, C. and S. Pimm. 2003. How big is the global weed patch? Ann. Mo. Bot. Gard. 90:172-178.
Keen, S. 1987. Faces of the Enemy: Reflections of the Hostile Imagination. New York, NY: Harper and Row. 199 p.
King, T. 2003. The Truth About Stories: A Native Narrative. Toronto, ON: House of Anansi Press. 172 p.
Lakoff, G. 2003. Metaphor and war, again. http://www.alternet.org/story.html ?StoryID=15414. Accessed Nov. 23, 2006.
154 Thirteen ways of looking at invasive species
Lakoff, G. 2004. Don't Think of an Elephant: Know Your Values and Frame the Debate - The Essential Guide for Progressives. White River Junction, VT: Chelsea Green Publishing Co. 144 p.
Lakoff, G. and M. Johnson. 1999. Philosophy in the Flesh: The Embodied Mind and its Challenge to Western Thought. New York, NY: Basic Books. 624 p.
Larson, B. M. H. 2005. The war of the roses: Demilitarizing invasion biology. Front. Ecol. Environ. 3:495-500.
Larson, B. M. H. 2007. An alien approach to invasive species: Objectivity and society in invasion biology. Biol. Invasions (published online first, DOI: 10.1007/s10530-007-9095-z).
Larson, B. M. H. in press. Entangled biological, cultural and linguistic origins of the war on invasive species. in R. Frank, R. Dirven, J. Zlatev and T. Ziemke, eds. Body, Language and Mind. Volume 2: Sociocultural Situatedness. New York, NY: Mouton de Gruyter.
Lodge, D. M. and K. Shrader-Frechette. 2003. Nonindigenous species: Ecological explanation, environmental ethics, and public policy. Conserv. Biol. 17:31-37.
Lonsdale, W. 1999. Global patterns of plant invasions and the concept of invasibility. Ecology 80:1522-1536.
Lugo, A. 2004. The outcome of alien tree invasions in Puerto Rico. Front. Ecol. Environ. 2:265-273.
MacDougall, A. S. and R. Turkington. 2005. Are invasive species the drivers or passengers of change in degraded ecosystems? Ecology 86:42-55.
Macnaughten, P. and J. Urry. 1998. Contested Natures. Thousand Oaks, CA: Sage Publications. 320 p.
Macy, J. 1983. Despair and Personal Power in the Nuclear Age. Gabriola Island, BC: New Society Publishers. 194 p.
Maguire, L. A. 2004. What can decision analysis do for invasive species management? Risk Analysis 24:859-868.
McKibben, B. 1989. The End of Nature. New York, NY: Random House. 226 p. McKinney, M. L. 2001. Effects of human population, area, and time on non-native
plant and fish diversity in the United States. Biol. Conserv. 100:243-252. Meiners, S. J., S. T. A. Pickett and M. L. Cadenasso. 2001. Effects of plant
invasions on the species richness of abandoned agricultural land. Ecography 24:633-644.
Meinig, D. W. 1979. The beholding eye: Ten versions of the same scene. Pages 33-48 in D. W. Meinig and J. B. Jackson, eds. The Interpretation of Ordinary Landscapes: Geographical Essays. New York, NY: Oxford University Press.
Meyerson, L. A. and J. K. Reaser. 2003. Bioinvasions, bioterrorism, and biosecurity. Front. Ecol. Environ. 1:307-314.
Milton, K. 2000. Ducks out of water: Nature conservation as boundary maintenance. Pages 229-246 in J. Knight, ed. Natural Enemies: People-Wildlife Conflicts in Anthropological Perspective. New York, NY: Routledge.
Larson 155
Mitchell, C. E., A. A. Agrawal, J. D. Bever, G. S. Gilbert, R. A. Hufbauer, J. N. Klironomos, J. L. Maron, W. F. Morris, I. M. Parker, A. G. Power, E. W. Seabloom, M. E. Torchin and D. P. Vazquez. 2006. Biotic interactions and plant invasions. Ecol. Lett. 9:726-740.
Mooney, H. A. and E. E. Cleland. 2001. The evolutionary impact of invasive species. Proc. Natl. Acad. Sci. U.S.A. 98:5446-5451.
Moore, J. 2006. Revolution of the space invaders: Darwin and Wallace on the geography of life. Pages 106-132 in D. N. Livingstone and C. W. J. Withers, eds. Geography and Revolution. Chicago, IL: University of Chicago Press.
Poland, T. and D. McCullough. 2006. Emerald ash borer: Invasion of the urban forest and the threat to North America's ash resource. J. Forest. 104:118-124.
Robbins, P. 2001. Tracking invasive land covers in India, or why our landscapes have never been modern. Ann. Assoc. Amer. Geog. 91:637-659.
Rodman, J. 1993. Restoring nature: Natives and exotics. Pages 139-153 in J. Bennett and W. Chaloupka, eds. In the Nature of Things: Language, Politics, and the Environment. Minneapolis, MN: University of Minnesota Press.
Rosenzweig, M. L. 2001. The four questions: What does the introduction of exotic species do to diversity? Evol. Ecol. Res. 3:361-367.
Saltonstall, K. 2002. Cryptic invasion by a non-native genotype of the common reed, Phragmites australis, into North America. Proc. Natl. Acad. Sci. U.S.A. 99:2445-2449.
Sax, D. F. and S. D. Gaines. 2003. Species diversity: From global decreases to local increases. Trends Ecol. Environ. 18:561-566.
Sax, D. F., J. J. Stachowicz and S. D. Gaines, eds. 2005. Species Invasions: Insights into Ecology, Evolution, and Biogeography. Sunderland, MA: Sinauer Associates. 495 p.
Schön, D. A. 1979. Generative metaphor: A perspective on problem-setting in social policy. Pages 254-283 in A. Ortony, ed. Metaphor and Thought. Cambridge, U.K.: Cambridge University Press.
Schwarz, D., B. M. Matta, N. L. Shakir-Botteri and B. A. McPheron. 2005. Host shift to an invasive plant triggers rapid animal hybrid speciation. Nature 436:546-549.
Sharov, A. A. and A. M. Liebhold. 1998. Bioeconomics of managing the spread of exotic pest species with barrier zones. Ecol. Appl. 8:833-845.
Simberloff, D. 2006. Invasional meltdown 6 years later: important phenomenon, unfortunate metaphor, or both? Ecol. Lett. 9:912-919.
Slobodkin, L. B. 2001. The good, the bad and the reified. Evol. Ecol. Res. 3:1-13. Smith, R. G., B. D. Maxwell, F. D. Menalled and L. J. Rew. 2006. Lessons from
agriculture may improve the management of invasive plants in wildland systems. Front. Ecol. Environ. 4:428-434.
Soulé, M. E. 1990. The onslaught of alien species, and other challenges in the coming decades. Conserv. Biol. 4:233-239.

156 Thirteen ways of looking at invasive species
Starfinger, U., I. Kowarik, M. Rode and H. Schepker. 2003. From desirable ornamental plant to pest to accepted addition to the flora? - The perception of an alien tree species through the centuries. Biol. Invasions 5:323-335.
Stokes, K. E., K. P. O'Neill, W. I. Montgomery, J. T. A. Dick, C. A. Maggs and R. A. McDonald. 2006. The importance of stakeholder engagement in invasive species management: A cross-jurisdictional perspective in Ireland. Biodiv. Conserv. 15:2829-2852.
Strauss, S. Y., J. A. Lau and S. P. Carroll. 2006a. Evolutionary responses of natives to introduced species: what do introductions tell us about natural communities? Ecol. Lett. 9:354-371.
Strauss, S. Y., C. O. Webb and N. Salamin. 2006b. Exotic taxa less related to native species are more invasive. Proc. Natl. Acad. Sci. U.S.A. 103:5841-5845.
Subramaniam, B. 2001. The aliens have landed! Reflections on the rhetoric of biological invasions. Meridians 2:26-40.
Taylor, B. W. and R. E. Irwin. 2004. Linking economic activities to the distribution of exotic plants. Proc. Natl. Acad. Sci. U.S.A. 101:17725-17730.
Vermeij, G. J. 2005. Invasion as expectation: A historical fact of life. Pages 315-336 in D. F. Sax, J. J. Stachowicz and S. D. Gaines, eds. Species Invasions: Insights into Ecology, Evolution, and Biogeography. Sunderland, MA: Sinauer Associates.
Vonnegut, K. 1973. Breakfast of Champions. New York, NY: Dell Publishing Co. 303 p.
Wiegmann, S. and D. Waller. 2006. Fifty years of change in northern upland forest understories: Identity and traits of "winner" and "loser" plant species. Biol. Conserv. 129:109-123.
Wilkinson, D. 2004. The parable of Green Mountain: Ascension island, ecosystem construction and ecological fitting. J. Biogeog. 31:1-4.
Woods, M. and P. V. Moriarty. 2001. Strangers in a strange land: The problem of exotic species. Environ. Values 10:163-191.
Zavaleta, E. S., R. J. Hobbs and H. A. Mooney. 2001. Viewing invasive species removal in whole-ecosystem context. Trends Ecol. Evol. 16:454-459.
Zwicky, J. 2004. Introduction. Pages 1-10 in H. Coward and A. J. Weaver, eds. Hard Choices: Climate Change in Canada. Waterloo, ON: Wilfrid Laurier University Press.
Index
2,4-D, 118, 119 Abundance, 43, 44, 45, 46, 50, 51, 52,
53, 60, 61, 84, 121, 122, 131 Accuracy, 27, 32, 33, 39, 40 Acer platanoides, 89 Action, 1, 2, 3, 4, 10, 16, 17, 18, 34, 60,
83, 84, 86, 87, 88, 90, 151 Adaptation, 6, 11, 27, 29, 60, 71, 79, 84,
86, 115, 117, 147 Aegilops cylindrica, 87 Aesthetic, 133, 134, 146 Afforestation, 85 Agelaius tricolor, 146 Agral 90, 118 Agrilus planipennis, 146 Agroecoregion, 44 Agroecosystem, 61 Agronomy, 45, 62, 111, 113, 119, 120,
122 Agropyron cristatum, 60 Agrostemma githago, 53, 68 Ailanthus altissima, 89 Alabama, 72 Alberta, 2, 45, 47, 48, 49, 54, 55, 58, 59,
84, 90, 97, 100, 112, 115 Alga, 145 Alien, 2, 3, 4, 6, 16, 38, 43, 44, 50, 51, 53,
54, 55, 56, 59, 60, 61, 62, 68, 69, 71, 83, 95, 96, 97, 98, 103, 112, 141, 151
Alliaria petiolata, 84, 131, 143, 150 Amaranthus retroflexus, 52, 53, 68 Ambrosia trifida, 53, 69 American chestnut, 146 American elm, 146 Animal and Plant Health Inspection
Service (APHIS), 27, 38, 39, 40 Annual sow-thistle, 69 Ant, 141 Antipathy, 132, 149 Apathy, 132, 149 Arkansas, 72 Ash, 146 Asparagus, 9 Asparagus asparagoides, 14 Australia, 3, 5, 6, 7, 8, 9, 10, 11, 12, 13,
14, 15, 16, 17, 18, 19, 20, 21, 22, 29, 31, 34, 40
Avena fatua, 52, 68
Awareness, 3, 14, 16, 18, 29, 34, 39, 72, 79, 87, 88, 131
Axyris amaranthoides, 53, 68 Ball mustard, 53, 68 Barley, 51, 52, 54, 56, 68 Barnyard grass, 43, 51, 52, 55, 58, 68, 69 Bear-skin fescue, 9 Bee-keeper, 134, 135 Beetle, 124, 138 Behaviour, 3, 8, 30, 31, 34, 35, 36, 112,
141 Benefit, 1, 10, 14, 19, 28, 37, 96 Benign species, 33 Berries, 86 Biodiversity, 1, 6, 8, 12, 18, 35, 44, 60,
61, 83, 86, 87, 89, 90, 91, 132, 133, 134, 137, 143, 145, 148, 149
Biogeoclimatic Ecosystem Classification, 97, 98, 99, 103, 107
Biogeographic, 132, 136 Biological control, 3, 5, 13, 14, 15, 19, 21,
22, 88, 90, 95, 96, 97, 98, 99, 102, 103, 104, 111, 112, 113, 124, 125, 127, 138, 141 Classical, 3, 112, 113, 124 Inundative approach, 127
Biologist, 60, 132, 137, 138, 145, 149 Biology, 1, 2, 3, 44, 60, 62, 73, 88, 119,
128, 137, 143, 149 Biosecurity, 2, 7, 9, 17 Black cherry, 146 Black dog-strangling vine, 90 Blackberry, 9, 17
Himalayan, 146 Blue lettuce, 53, 69 Bluebur, 52, 68
Western, 69 Border, 10, 19, 20, 137, 145 Botanist, 13, 30, 71 Boundary, 49, 61, 96, 136, 137, 144 Brachypterolus pulicarius, 99 Brassica napus, 52, 54, 56, 68 Bridal creeper, 14 British Columbia, 2, 3, 5, 19, 20, 21, 22,
47, 48, 56, 60, 71, 72, 73, 90, 95, 96, 97, 98, 99, 100, 101, 102, 105, 106, 107, 108, 109, 110, 112, 113, 117, 128, 134, 140
158 Index
Bromus inermis, 60 Bufo marinus, 7 Bureaucracy, 10, 141, 144 Burning, 71, 75, 76, 79 California, 72, 100, 134, 135, 145, 146,
148 Calophasia lunula, 99 Camelina, 53, 68 Campground, 71, 72, 75, 76, 79 Camping, 77, 79, 83 Canada thistle, 52, 60, 69, 87 Canadian Food Inspection Agency
(CFIA), 20, 38, 87, 88 Canadian Prairies, 3, 43, 45, 47, 49, 50,
51, 52, 53, 54, 55, 56, 57, 58, 60, 61, 62, 68, 69, 141
Cane toad, 7 Canola, 52, 54, 56, 68 Carpet burweed, 3, 20, 71, 72, 73, 74, 75,
76, 77, 78, 79, 80 Carrying capacity, 84 Castanea dentata, 146 Caulerpa taxifolia, 145 Celastrus orbiculata, 84, 89 Centaurea maculosa, 125 Centaurea solstitialis, 134, 135 Ceylon hill cherry, 9 Chenopodium album, 50, 68 Chenopodium berlandieri var. zschackei,
50, 69 Chickweed, 52, 53, 68 Chondrilla juncea, 11 Cirsium arvense, 52, 60, 69, 87 City, 71, 72, 75, 78, 83, 103, 133 Classification, 13, 27, 29, 30, 33, 39, 40,
43, 46, 49, 50, 51, 53, 54, 60, 62, 96, 115, 143, 144
Cleavers, 43, 51, 52, 54, 57, 60, 68, 69 False, 69
Climate, 8, 44, 62, 84, 98, 100, 103, 139, 147, 149
Clover, 51, 52, 68 Colonization, 145 Common buckthorn, 84 Common groundsel, 51, 52, 69 Common reed, 90, 138 Communication, 5, 9, 10, 11, 13, 15, 16,
18, 19, 20, 21, 22, 38, 39, 86, 89, 96, 149
Community, 11, 15, 18, 19, 21, 28, 112, 149
Concerns, 17, 18, 34, 35, 84 Complaint, 10 Confiscation, 10 Conservation, 3, 6, 9, 12, 17, 22, 28, 29,
35, 44, 86, 87, 91, 95, 133, 136, 137, 143
Conspicuous, 88, 151 Containment, 11, 13, 60, 88, 96, 97, 148 Convolvulus arvensis, 53, 68 Cooperation, 11, 36, 61, 74, 80, 83, 87,
96 Coordination, 2, 5, 6, 13, 14, 16, 17, 18,
19, 20, 21, 22, 61, 71, 72, 83, 87, 90, 97, 128
Coronopus didymus, 131 Cost, 9, 11, 14, 15, 18, 19, 20, 27, 28, 34,
36, 39, 54, 56, 96, 111, 112, 113, 123, 124, 125, 126, 127, 148
Cost-effectiveness, 11, 15, 18, 36, 111, 113, 123, 124, 127
Cow cockle, 43, 52, 53, 55, 58, 68 Crepis tectorum, 51, 52, 69 Crested wheatgrass, 60 Critical, 38, 86, 103, 145 Cropland, 43, 60, 61 Crown land, 6, 16, 95 Cryptostegia grandiflora, 10, 12, 14, 17 Cultivation, 30, 111, 117, 119, 121, 126 Cylindropuntia fulgida, 12 Cynanchum louiseae, 90 Cynanchum rossicum, 84, 85, 86, 90 Dactylis glomerata, 140 Dakota
North and South, 88 Dalmatian toadflax, 95, 99, 100, 101, 102,
103, 104 Danaus plexippus, 146 Dandelion, 51, 52, 145
Red-seeded, 69 Daucus carota, 87 Decision, 7, 10, 11, 15, 18, 20, 27, 30, 34,
35, 36, 39, 45, 103, 134 Density, 43, 46, 49, 54, 55, 61, 75, 78, 83,
84, 98, 116 Descurainia sophia, 51, 52, 68, 116 Detection, 5, 11, 12, 13, 19, 20, 21, 22,
27, 43, 44, 55, 56, 60, 61, 71, 77, 83, 84, 88, 89, 90, 91, 145
Dicamba, 118, 119
Index 159
Discussion, 2, 5, 7, 12, 20, 21, 29, 34, 43, 44, 47, 61, 62, 74, 75, 88, 125, 135, 149, 150
Dispersal, 1, 8, 30, 31, 60, 77, 79, 86, 95, 97, 98, 99, 102, 103, 109, 110, 112, 120, 127, 131, 138, 139, 145, 146, 148
Distribution, 8, 13, 14, 15, 17, 34, 49, 55, 56, 57, 58, 86, 87, 90, 98, 100, 111, 113, 114, 127
Disturbance, 6, 36, 61, 85, 86, 99, 124, 139, 140, 144
Dog-strangling vine, 84, 85, 86, 90 Domestication, 8, 31 Domination, 34, 85, 125, 146, 150 Eastern white pine, 86 Echinochloa crusgalli, 43, 51, 52, 55, 58,
68, 69 Echinochloa microstachya, 69 Ecodistrict, 45, 55 Ecology, 1, 2, 10, 20, 30, 33, 35, 36, 39,
44, 45, 62, 71, 84, 87, 88, 90, 97, 98, 104, 131, 134, 140, 141, 144, 146, 148
Economics, 2, 9, 10, 12, 15, 16, 18, 19, 22, 28, 29, 33, 34, 35, 36, 37, 38, 39, 43, 44, 54, 56, 60, 71, 74, 83, 87, 88, 96, 113, 124, 125, 131, 132, 134, 137, 138, 146, 148, 149
Ecoregion, 44, 57, 58 Ecosystem, 2, 36, 37, 60, 61, 62, 71, 77,
84, 85, 98, 136, 148 Education, 7, 15, 16, 35, 79, 89, 145 Elytrigia repens, 52, 60, 68 Emerald ash borer, 146 Empidonax traillii extimus, 146 Endangered, 27, 146 Endemic, 6, 146, 148 Entry, 7, 8, 9, 10, 32, 38, 39, 40, 50, 61 Equisetum arvense, 51, 52, 68, 69 Equisetum hyemale, 69 Eradication, 3, 11, 12, 13, 20, 27, 34, 35,
60, 71, 72, 74, 75, 79, 80, 84, 87, 88, 132, 136, 143, 145
Eriochloa villosa, 87 Erodium cicutarium, 62 Escape, 16, 30, 34, 138, 143 Establishment, 1, 3, 11, 12, 16, 17, 32,
33, 34, 38, 44, 55, 61, 71, 72, 74, 77, 79, 80, 83, 84, 87, 89, 95, 96, 97, 98, 99, 100, 102, 103, 112, 114, 116, 119, 123, 127, 138, 145
Eteobalea intermediella, 99
Eucalyptus, 146 Euphorbia esula, 60 Euphorbia glyptosperma, 69 Euphorbia serpyllifolia, 51, 52, 68 Europe, 7, 27, 39, 43, 53, 60, 99, 100,
111, 112, 146 European root weevil, 111, 112, 113, 114,
116, 119, 120, 122, 125, 127, 128 Eutrophic, 139 Evaluation, 8, 27, 30, 32, 34, 35, 36, 37,
38, 39, 61, 149 Evolution, 61, 143, 144, 145, 147 Exclusion, 7, 17, 39, 47, 49, 59, 96 Exotic, 7, 27, 35, 36, 37, 43, 44, 112, 137,
140, 142, 146 Expansion
See Range expansion Experimentation, 3, 111, 113, 114, 116,
119, 120, 121, 122, 124, 125, 128 Expertise, 2, 13, 30, 32, 33, 34, 35, 37,
74, 112, 124, 131 Exponential growth phase, 84, 90 Extermination, 141, 145 Fallow, 44, 144 False flax, 53, 68 Fauna, 6, 147 Fecundity, 86, 121 Fence, 16, 75, 76 Fertilization, 44, 45, 111, 114, 115, 120,
121, 122, 125, 126, 128 Festuca gautieri, 9 Field, 2, 7, 13, 30, 34, 35, 43, 44, 45, 46,
47, 49, 50, 52, 53, 54, 56, 57, 58, 59, 60, 61, 62, 74, 99, 131, 133
Field bindweed, 53, 68 Field horsetail, 51, 52, 68, 69 Fire, 6, 12, 13, 14, 75, 76, 85, 141, 146 Flax, 51, 52, 68 Flixweed, 51, 52, 68, 116 Flora, 6, 40, 43, 44, 47, 49, 50, 51, 53,
54, 62, 83, 85, 132, 146, 147 Florida, 27, 32, 39, 72 Flucarbazone, 116, 118 Forb, 140 Forest, 3, 6, 8, 9, 17, 28, 29, 30, 78, 83,
84, 85, 86, 87, 88, 89, 91, 95, 99, 100, 128, 140, 143, 144, 145, 146
Foxtail barley, 51, 52, 68 Framework, 5, 16, 20, 21, 22, 87 Fraxinus, 146

160 Index
Frequency, 43, 44, 46, 47, 48, 49, 51, 52, 54, 56, 59, 79, 86, 140
Funding, 5, 11, 12, 14, 16, 17, 18, 19, 21, 22, 28, 71, 96, 128
Fungicide, 117, 125, 126 Fynbos, 29 Galeopsis tetrahit, 52, 68 Galerucella calmariensis, 84 Galerucella pusilla, 84 Galium aparine, 43, 51, 52, 54, 57, 60,
68, 69 Galium spurium, 69 Garlic mustard, 84, 131, 143, 150 Garry oak, 140, 146 Generation, 6, 77, 86, 111, 113, 119 Genus, 8, 9, 28, 143 Geographic
Distribution, 56 Isolation, 6, 7, 19 Location, 95, 97 Origin, 137
Geographical Information System (GIS), 54, 89
Georgia, 72 Germination, 73, 79, 86, 113 Giant hogweed, 4, 84 Giant ragweed, 53, 69 Glyphosate, 111, 117, 125, 126 Government, 2, 5, 13, 14, 17, 18, 21, 36,
38, 60, 71, 83, 89, 90, 95, 97, 98, 144 Grain, 11, 114, 141 Grazing, 9, 12, 99, 140 Green foxtail, 52, 53, 68 Green smartweed, 52, 53, 68 Growth, 84, 86, 111, 113, 114, 116, 117,
119, 121, 122, 124, 143, 144, 148 Guide, 12, 28, 35, 87, 119, 132 Guideline, 33, 38 Habitat, 18, 39, 47, 49, 60, 61, 75, 84, 95,
96, 97, 98, 100, 101, 102, 103, 104, 133, 139, 145, 146, 148
Hand weeding, 71, 75, 77, 113 Hawai‘i, 3, 27, 28, 29, 30, 34, 35, 36, 37 Hawai‘i Exotic Plant Evaluation Protocol
(HEPEP), 27, 35, 36, 37, 38 Hawai‘i-Pacific Weed Risk Assessment
(HPWRA), 27, 29, 31, 32, 34, 35, 36, 37, 38, 39
Hay, 47, 50 Helianthus, 143
Hemp-nettle, 52, 68 Heracleum mantegazzianum, 4, 84 Herbarium, 13, 89 Herbicide, 12, 44, 45, 54, 56, 60, 75, 76,
79, 88, 90, 95, 96, 97, 111, 116, 118, 119, 120, 122, 125, 126, 138
Herbivore, 86, 147 Herbivory, 114 Hieracium aurantiacum, 9 Hierochloe odorata, 53, 68 Homogeneity, 148, 149 Honey, 134, 135 Honeysuckle, 147 Hordeum jubatum, 51, 52, 68 Hordeum vulgare, 51, 52, 54, 56, 68 Hot water, 75 Hybridization, 131, 143, 144 Identification, 9, 11, 12, 13, 16, 18, 27,
28, 29, 30, 31, 32, 33, 35, 38, 39, 40, 44, 45, 47, 50, 60, 75, 87, 90, 137
Illinois, 88 Imazamethabenz, 118 Imazamox, 111, 116, 118, 122 Imazethapyr, 111, 116, 118, 122 Impact, 1, 6, 7, 9, 10, 15, 16, 17, 18, 19,
20, 21, 22, 27, 33, 35, 36, 37, 43, 44, 56, 62, 71, 74, 83, 84, 87, 101, 117, 131, 132, 137, 149
Implementation, 7, 11, 12, 13, 16, 17, 18, 19, 21, 29, 60, 80, 87, 95
Importation, 7, 8, 9, 10, 18, 19, 20, 28, 34, 36, 38, 39, 40, 97, 99
Inconsistency, 10, 16, 33 India, 144 Indiana, 88 Industry, 9, 16, 18, 19, 28, 29, 30, 33, 34 Infestation, 11, 12, 13, 49, 61, 74, 75, 76,
77, 78, 79, 85, 87, 89, 95, 96, 98, 99, 101, 102, 113, 117, 127
Information, 5, 8, 9, 10, 15, 16, 19, 20, 21, 27, 29, 30, 31, 32, 33, 35, 36, 37, 39, 47, 48, 49, 62, 74, 79, 89, 97, 98, 102, 103, 115, 119, 125, 128
Input, 14, 44, 83, 125, 126 Insect, 7, 14, 96, 99, 111, 112, 113, 123,
124, 125, 127 Integrated pest management (IPM), 2, 95 Integrated weed management (IWM), 88,
91 Inter-agency, 13, 14, 35, 37 Intervention, 6, 11
Index 161
Introduction, 6, 7, 9, 11, 12, 16, 20, 27, 28, 29, 30, 34, 35, 36, 38, 39, 40, 43, 44, 55, 60, 61, 62, 72, 77, 79, 80, 83, 84, 87, 88, 89, 112, 134, 136, 138, 143, 145, 147 Accidental, 6, 7, 43, 44, 48 Deliberate, 6, 28, 30, 31, 34, 38, 43,
44, 89, 136, 144 Invasion, 2, 3, 10, 15, 35, 43, 60, 61, 62,
71, 72, 84, 85, 86, 90, 91, 95, 135, 136, 137, 138, 143, 146, 149
Invasive Alien Plant Program, 95, 97, 98, 102, 103
Invasiveness, 28, 31, 32, 34, 35, 60, 61, 62, 143
Inventory, 1, 2, 4, 44, 47, 48, 59, 95, 97, 140
Involvement, 1, 11, 15, 21, 22, 29, 72, 87, 111, 113, 117, 121, 125, 131, 138
Iva axillaris, 53, 69 Japan, 39 Japanese stilt grass, 84, 89 Jointed goatgrass, 87 Jurisdiction, 11, 20, 75, 78, 83, 91 Kentucky bluegrass, 140 Knowledge, 1, 13, 15, 31, 34, 50, 88, 89,
100, 134 Kochia, 11, 43, 51, 52, 55, 57, 68 Kochia scoparia, 11, 43, 51, 52, 55, 57,
68 Kudzu, 146 Label, 2, 9, 34, 149 Lactuca tatarica, 53, 69 Lag, 84, 138, 148 Lamb’s-quarters, 50, 68 Landscape, 2, 6, 11, 14, 17, 35, 49, 60,
89, 98, 132, 133, 140, 143, 144, 145, 149
Lantana, 17 Lappula occidentalis, 69 Lappula squarrosa, 52, 68 Leafy spurge, 60 Legislation, 2, 8, 9, 10, 11, 16, 17, 19, 28,
95, 96, 141 Lesser wart-cress, 131 Limnanthes macounii, 76 Linaria dalmatica, 95, 99, 100, 101, 102,
103, 104 Linaria vulgaris, 100
Linkage, 8, 16, 83, 89, 134 Linum usitatissimum, 51, 52, 68 Location, 27, 44, 46, 49, 52, 53, 54, 61,
71, 72, 75, 77, 89, 90, 98, 102, 114, 117, 124, 125, 127, 138, 146, 147
Logistic growth curve, 84 Logistics, 7, 19 Lonicera, 147 Loophole, 8, 9 Louisiana, 72 Lythrum salicaria, 84, 87, 124, 134, 137,
143 Macoun’s meadow-foam, 76 Malva pusilla, 52, 68 Manitoba, 45, 47, 48, 49, 55 Mapping, 43, 50, 54, 89, 98, 102 Marsh sow-thistle, 84, 90 Matricaria discoidea, 51, 52, 69 Matrices, 131, 145 Mecinus janthinus, 99, 100, 101, 102,
103, 104, 106, 107, 108, 109, 110 Media, 9, 15, 19, 21, 68 Mesquite, 13, 17, 144 Michigan, 88, 140 Microstegium vimineum, 84, 89 Mile-a-minute weed, 84, 86, 89 Milkweed, 87 Mimosa, 17 Minnesota, 88 Mirror, 131, 141, 142 Misclassification, 27, 31, 33 Mite, 112, 138, 139 Mogulones cruciger, 111, 112, 113, 114,
116, 119, 120, 122, 125, 127, 128 Monarch butterfly, 146 Monitoring, 34, 43, 44, 47, 54, 60, 95, 97,
98, 102, 103 Montana, 100 Narrow-leaved hawk's-beard, 51, 52, 69 Native, 1, 6, 28, 30, 36, 37, 43, 44, 50,
51, 53, 54, 55, 56, 60, 62, 68, 69, 76, 83, 85, 87, 88, 96, 97, 100, 131, 132, 137, 140, 143, 144, 145, 146, 148
Naturalization, 6, 7, 9, 11, 31, 137 Neighbour, 16, 19, 74, 89 Neslia paniculata, 53, 68 Net-seeded lamb's-quarters, 50, 69 New Brunswick, 47, 48 New York, 84, 89 Newsletter, 13, 15, 19
162 Index
Niche, 85, 136, 143 Nicosulfuron, 111, 116, 118, 125, 126 Night-flowering catchfly, 52, 68 Non-government, 5, 17, 20, 21, 83 Non-native, 1, 2, 6, 35, 36, 44, 83, 131,
132, 137, 138, 141, 143, 144, 145, 146, 148
Non-pest, 27, 30, 31, 32, 33, 39, 40 North Carolina, 72 Northwest Territories, 47, 49 Norway maple, 89 Not Authorized for Import Pending Risk
Analysis (NAPRA), 40 Nova Scotia, 2, 47, 48 Noxious, 16, 27, 28, 35, 40, 87 Nursery industry, 8, 9, 16, 34, 112, 127 Objectivity, 28, 32, 35, 149 Odocoileus virginiana, 140 Oenothera nuttallii, 53, 68 Ohio, 88 Ontario, 2, 3, 47, 48, 49, 83, 84, 85, 86,
87, 88, 89, 90, 91, 131, 137, 143, 144, 146, 147, 150
Orange hawkweed, 9 Orchard grass, 140 Oregon, 72, 100 Organization, 5, 14, 15, 21, 28, 35, 72,
74, 90, 95, 97, 137, 148 Oriental bittersweet, 84, 89 Ornamental, 1, 7, 9, 16, 28, 34, 99 Overwinter, 119, 121, 123, 146 Pale smartweed, 69 Park, 6, 71, 72, 75, 76, 77, 78, 79, 101,
102, 131, 137, 150 Partnership, 4, 13, 14, 17, 21, 87, 128 Pasture, 7, 47 Patch, 75, 76, 112, 127, 139 Pathogen, 96, 112 Paulownia tomentosa, 86, 89 Perennial sow-thistle, 51, 52, 69 Permitted list, 7, 8, 9, 10, 11, 19 Pesticide, 96, 138, 141 Pheloung model, 8, 10, 20, 29 Phoresy, 138, 139 Phragmites australis, 90, 138 Piggy-backers, 131, 138 Pilosella aurantiaca, 9 Pineapple, 28 Pineappleweed, 51, 52, 69 Pinus resinosa, 85
Pinus strobus, 86 Pinus sylvestris, 89 Plan, 17, 18, 74, 86, 87, 88, 89, 91, 96,
137, 143, 144 Action, 18, 83, 86, 88, 90 Response, 12, 13 State Weed, 13, 17, 18
Planting, 11, 27, 28, 30, 34, 35, 111, 121, 125, 144
Poa pratensis, 140 Policy, 5, 14, 15, 16, 18, 29, 40, 62, 90,
133, 144 Politics, 10, 20, 45, 132, 136, 137 Pollination, 86 Polygonum convolvulus, 52, 53, 68 Polygonum lapathifolium, 69 Polygonum perfoliatum, 84, 86, 89 Polygonum scabrum, 52, 53, 68 Population, 6, 12, 43, 44, 61, 62, 71, 74,
75, 76, 77, 79, 83, 86, 96, 98, 101, 103, 112, 118, 121, 127, 128, 141
Povertyweed, 53, 69 Prairie Provinces, 3, 43, 45, 47, 49, 50,
51, 52, 53, 54, 55, 56, 57, 58, 60, 61, 62, 68, 69, 141
Precaution, 3, 33, 39, 86 Prediction, 27, 29, 31, 33, 34, 35, 39, 103,
112, 137, 138, 145 Prevention, 3, 7, 8, 10, 11, 12, 13, 16, 19,
20, 28, 40, 60, 71, 72, 75, 77, 84, 88, 89, 91, 95, 101, 113, 127, 137, 142, 146
Prickly acacia, 17 Prince Edward Island, 47, 48 Princess tree, 89 Prioritization, 10, 12, 13, 14, 17, 18, 20,
21, 22, 27, 34, 35, 36, 37, 38, 87, 89, 90, 148
Procedure, 11, 13, 27, 39, 40, 46 Producer, 11, 15, 34, 44, 60, 133, 141,
143, 144 Prohibited list, 7, 9, 16, 19 Propagation, 111, 113, 119, 127, 128 Propagule, 31 Propiconazole, 111, 117, 125, 126 Prosopis juliflora, 13, 17, 144 Protocol, 12, 27, 33, 35, 36, 37, 38, 46,
60 Provider, 131, 143 Prunus serotina, 146 Publication, 16, 19 Pueraria montana var. lobata, 146
Index 163
Purple cockle, 53, 68 Purple loosestrife, 84, 87, 124, 134, 137,
143 Pyraclostrobin, 117 Quack grass, 52, 60, 68 Quadrat, 46, 47, 48 Quarantine, 5, 7, 8, 9, 10, 11, 16, 19, 22,
97, 144 Québec, 47, 48, 56, 59, 87 Quercus garryana, 140, 146 Quizalofop, 116, 118 Quobba cactus, 12 Rainfall, 6, 13, 44, 115 Range expansion, 31, 35, 43, 44, 55, 61,
74, 79, 86 Rare, 28, 46, 50, 53, 54, 56, 60, 62, 76,
79, 87, 140, 146 Recognition, 2, 6, 13, 15, 18, 28, 29, 31,
34, 35, 44, 50, 51, 52, 60, 61, 71, 72, 74, 148
Recolonization, 141 Recommendation, 9, 13, 16, 17, 18, 34,
35, 111, 117, 127, 135 Recreation, 20, 36, 37, 71, 75, 83 Recruitment, 84, 86, 140 Red pine, 85 Redroot pigweed, 52, 53, 68 Region, 1, 3, 12, 13, 20, 21, 22, 39, 40,
43, 44, 47, 48, 49, 50, 55, 60, 77, 78, 99, 100, 127, 128, 136, 148, 150
Regulation, 7, 8, 9, 16, 17, 19, 28, 34, 37, 87
Repeatability, 33 Representation, 18, 20, 21, 28, 56, 61,
79, 125 Reproduction, 6, 8, 30, 39, 97, 117, 142 Requirement, 3, 8, 10, 12, 16, 18, 20, 21,
27, 30, 33, 34, 35, 38, 39, 40, 44, 45, 62, 72, 74, 75, 77, 83, 86, 88, 95, 96, 97, 98, 102, 103, 104, 111, 112, 117, 119, 124, 125, 148, 149
Research, 2, 5, 9, 14, 15, 21, 22, 35, 39, 43, 60, 62, 85, 88, 90, 91, 96, 99, 111
Reserve, 6, 71, 72, 141, 144 Resource, 3, 7, 9, 10, 11, 12, 13, 14, 17,
18, 20, 21, 32, 36, 49, 72, 83, 89, 90, 95, 96, 98, 113, 136 Allocation, 9, 10, 11, 14, 18, 20, 45, 55
Response, 5, 7, 8, 11, 12, 13, 17, 19, 20, 21, 22, 36, 83, 88, 89, 90, 91, 114, 121, 132, 138, 141, 145, 148, 149
Responsibility, 6, 11, 12, 13, 17, 18, 20, 34, 50, 79, 87, 90, 135, 140
Restoration, 28, 96, 97, 142, 146 Restriction, 7, 34, 36, 39, 56, 83, 88, 96,
132, 133 Revegetation, 11 Review process, 33 Rhamnus cathartica, 84 Rhinusa antirrhini, 99, 100, 101, 103, 104,
108, 110 Rhinusa linariae, 99 Rhinusa netum, 99 Rhodomyrtus tomentosa, 9 Ridge-seeded spurge, 69 Risk, 3, 5, 6, 7, 8, 10, 11, 12, 13, 14, 19,
20, 21, 22, 27, 28, 29, 34, 38, 60, 61, 87, 88, 91, 136, 145 Assessment, 3, 5, 7, 8, 10, 12, 13, 19,
21, 22, 27, 29, 31, 36, 38, 40, 88, 91
High, 28, 30, 34, 35, 38 Low, 30, 32, 33, 34, 35
Rotation, 44, 45, 50 Round-leaved mallow, 52, 68 Rubbervine, 10, 12, 14, 17 Rubus, 9 Rubus armeniacus, 146 Rubus fruticosus, 14, 17 Russian pigweed, 53, 68 Russian thistle, 52, 53, 68 Salinity, 6, 11, 18 Salsola kali, 52, 53, 68 Sampling, 46, 47, 48, 49, 50, 51, 52, 53,
54, 56, 59, 61, 114, 120, 121 Saskatchewan, 2, 45, 47, 48, 49, 54, 61,
100 Savannah, 140, 146 Scots pine, 89 Scouring rush, 69 Screening, 27, 29, 30, 31, 32, 33, 34, 39,
40, 88, 95, 96, 97, 99, 104 Searching, 28, 33, 38, 71, 74, 75, 79,
127, 131, 140 Seed, 8, 15, 20, 73, 75, 76, 77, 79, 85,
86, 96, 99, 111, 113, 116, 119, 125, 126, 138
Selection, 18, 45, 62, 86, 133 Senecio, 143
164 Index
Senecio inaequidens, 39 Senecio madagascariensis, 39 Senecio vulgaris, 51, 52, 69 Setaria viridis, 52, 53, 68 Sethoxydim, 116, 118 Silene noctiflora, 52, 68 Sinapis arvensis, 52, 68 Sisymbrium altissimum, 53, 68 Skeleton weed, 11 Smooth brome, 60 Society, 1, 9, 10, 15, 16, 18, 20, 36, 37,
74, 88, 95, 133, 134, 136, 144, 149 Soliva sessilis, 3, 20, 71, 72, 73, 74, 75,
76, 77, 78, 79, 80 Sonchus arvensis, 51, 52, 69 Sonchus asper, 69 Sonchus oleraceus, 69 Sonchus palustris, 84, 90 South Carolina, 72 Southwestern willow flycatcher, 146 Spartina, 143 Spatial distribution, 61, 89, 103 Spawn, 131, 140, 141 Spiny annual sow-thistle, 52 Spotted knapweed, 125 Spraying, 96, 138, 141 Spreading, 1, 6, 10, 11, 13, 18, 27, 28,
38, 39, 44, 50, 55, 60, 61, 74, 76, 77, 79, 95, 96, 99, 103, 104, 112, 119, 127, 131, 132, 135, 137, 141, 142, 143, 144
Stakeholder, 2, 11, 12, 14, 15, 17, 18, 21, 29, 36, 37, 72, 75, 78, 80, 87, 90, 134
Standard, 13, 33, 44, 45, 54, 89, 132, 138 Statistics, 7, 16, 19, 32 Stellaria media, 52, 53, 68 Stinkweed, 52, 53, 68, 117 Stipa tenuissima, 9 Stork’s-bill, 62 Strategy, 1, 2, 4, 5, 7, 13, 14, 16, 17, 18,
21, 22, 35, 38, 44, 56, 60, 71, 86, 87, 88, 91, 96, 112
Succession, 85, 91, 146 Sugar cane, 28 Surveillance, 7, 11, 12 Sustainability, 6, 11, 12, 14, 44, 86, 87,
132, 137 Sweet grass, 53, 68 Symbionts, 139, 140 Tamarix, 141, 142, 143, 146 Tamarix aphylla, 141, 142, 146
Taraxacum erythrospermum, 69 Taraxacum officinale, 51, 52, 145 Taxonomy, 39 Teacher, 131, 132, 148 Tennessee, 72 Terrorist, 131, 137, 138 Testing, 29, 30, 31, 33, 39, 77, 90, 97,
102, 111, 113, 115, 117, 118, 128 Texas, 72 Thifensulfuron, 118 Thlaspi arvense, 52, 53, 68, 117 Threat, 1, 2, 6, 10, 11, 12, 18, 27, 28, 44,
60, 87, 90, 132, 149 Threshold, 27, 33, 88 Thyme-leaved spurge, 51, 52, 68 Tillage, 44, 45, 113, 114, 115, 121, 125,
126 Tracking, 3, 43, 44, 76, 95, 97, 98, 102,
103 Tragopogon, 143 Training, 12, 13, 15 Transect, 61 Transient, 131, 144, 146 Transmission line, 83 Transportation, 61, 131, 139 Treatment, 11, 31, 44, 71, 74, 75, 76, 78,
79, 95, 96, 97, 98, 113, 114, 115, 116, 117, 118, 120, 121, 122, 123, 144
Tree of heaven, 89 Tribenuron, 118 Trickster, 131, 144, 145 Tricolored blackbird, 146 Trifolium, 51, 52, 68 Tumble mustard, 53, 68 Ulmus americana, 146 Uncertainty, 18, 30, 39 Understanding, 3, 14, 15, 16, 17, 18, 62,
79, 84, 87, 88, 98, 103, 134, 136 Understorey, 86, 131 Undesirable, 1, 2, 8 United States, 27, 38, 40, 53, 72, 79, 83,
132, 138, 141, 146, 147 United States Department of Agriculture
(USDA), 27, 29, 40, 72 Vaccaria hispanica, 43, 52, 53, 55, 58, 68 Validation, 39 Vigilance, 10 Vincetoxicum nigrum, 90 Vincetoxicum rossicum, 84, 85, 86, 90 Virginia, 72

Index 165
Voluntary, 16, 27, 34 Volunteer, 18, 51, 52 Washington, 2, 72, 100 Website, 8, 12, 15, 33, 34, 89, 97 Weed Risk Assessment, 7, 8, 9, 10, 20,
22, 27, 29, 30, 31, 32, 33, 34, 35, 38, 39, 40
Western barnyard grass, 69 Wetland, 96, 98, 137, 139 Wheat, 51, 52, 54, 56, 68, 114, 119 White evening-primrose, 53, 68 White-tailed deer, 140 Wild buckwheat, 52, 53, 68
Wild carrot, 87 Wild mustard, 52, 68 Wild oats, 52, 53, 68 Wilderness, 53 Wildlife, 6, 137, 143, 144 Wind, 85, 86, 99 Wisconsin, 88, 140 Woodland, 131, 134, 144, 146, 147, 150 Woodlot, 83 Yellow star-thistle, 134, 135 Yellow toadflax, 100 Yield, 31, 40, 44, 54, 60, 119, 124


Copyright © 2022 FDOKUMEN