Accused Persons arrested in Kottayam district from 05.04 ...
Upload
khangminh22Category
view
1download
0
1
Introduction
Albumin is an umbrella term for a type of protein which is water soluble.
Numerous types of albumin can be found in different living beings and two of the
most familiar albumin can be found in egg white and in human blood, known as
ovalbumin and serum albumin respectively. They are virtually important to Health
and well being for many organisms.
Researches already done shows that the properties of egg albumin and
human serum albumin are similar in many properties. The human Serum Albumin
and Egg Albumin is similar in their features. Both are utilised in many possible
applications like drug loading, spectral properties etc. The natural function of both
include activity as carrier for a variety of ligands including fatty acids, amino
acids, steroids etc. Albumins are able to transport the hydrophobic ligands
throughout the body. It was one of the first proteins to be crystallised and for
which the standard purification protocol was developed.
Preparation and application of metal protein conjugates have long been
reported. Calcium complex of milk protein casein has been prepared and applied
2
for developing of a drug delivery system. Most of the reported work involving
albumin have used either Human Serum Albumin or Bovine Serum Albumin.
Albumin metal complexes, and their uses in many diagnostic studies such as
diagnostic radiology are active research fields .BSA imprinted Polyacrylamide gel
beads incorporating functional groups with negative charge are prepared . Such bio
imprinted macromolecules are of use in medicine for diagnostics, as biosensors
and bio seperation .
Preparation of celecoxib-loaded albumin micro spheres and its application in
bio-distribution micro spheres loaded with drug after intravenous administration is
reported by Thakkar H and others. Micro spheres were prepared using a natural
polymer BSA using emulsification chemical cross-linking method. The prepared
micro spheres were characterized for entrapment efficiency, particle size, and in
vitro drug release. Surface morphology was studied by scanning electron
microscopy. The geometric mean diameter of the micro spheres was found to be
5.46 µm. In vitro release studies indicated that the micro spheres sustained the
release of the drug for 6 days .
Synthesis of metallo protein complexes and the study of the influence of
metal ions on the structure of carrier proteins reveals that the biological activity of
metal is connected with their capacity to bind with metals. Complexes of metals
3
with natural biopolymers may prove useful in elucidating the role of their
structural conformational changes in various pathologies , including malignant
degeneration of cells .
Egg albumin is a natural biodegradable non toxic protein. Any preparation
from such a natural product could be used for developing drug release system for
oral delivery . It will not have any immunochemical response.
Ovalbumin is one of the major protein found in egg white, making up to60-
65% of the total protein It is a globular protein and hence soluble in water.
Ovalbumin is a carrier protein commonly used as a molecular weight marker for
calibrating electrophoresis gel.
Ovalbumin is a natural protein able to form complexes in various shapes. This
protein is biocompatible, biodegradable, nontoxic, and non immunogenic. Due to
these features, albumin particles are a good system for drug and antigen delivery. It
is a versatile protein carrier for drug delivery, has been shown to be nontoxic, non-
immunogenic, biocompatible and biodegradable. Therefore, it is ideal material to
fabricate nano particles for drug delivery. Albumin nano particles have gained
considerable attention owing to their high binding capacity of various drugs and
being well tolerated without any serious side-effects.
4
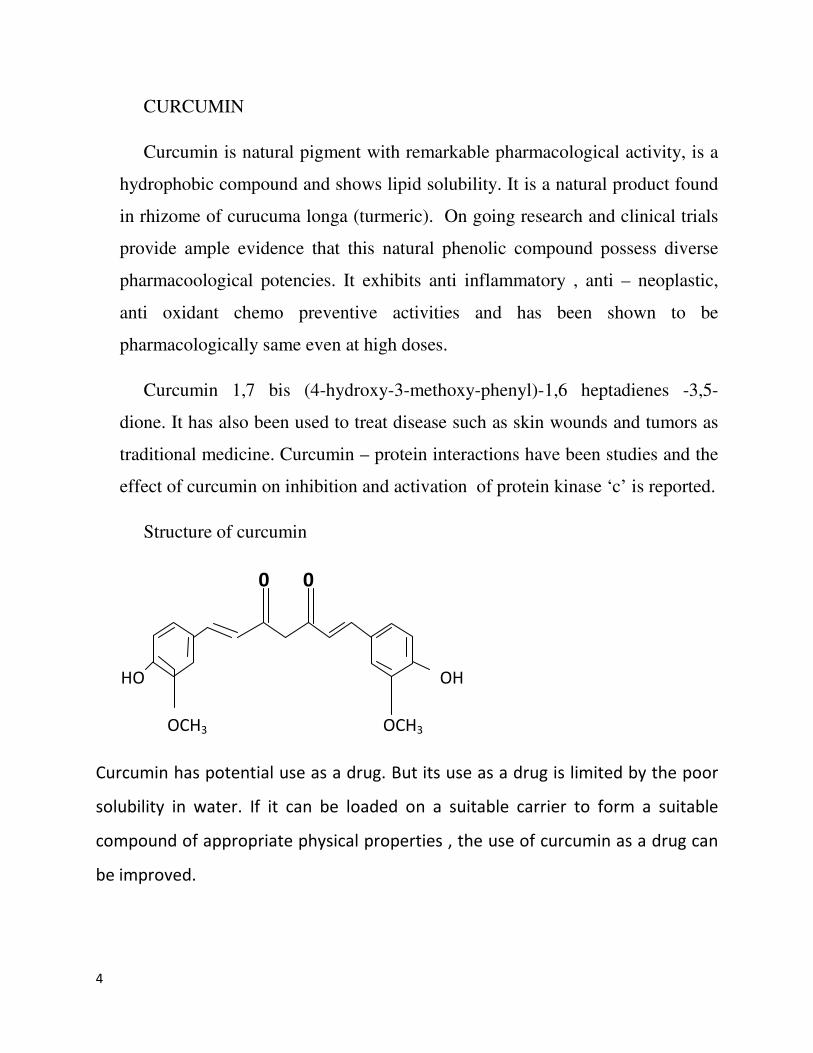
CURCUMIN
Curcumin is natural pigment with remarkable pharmacological activity, is a
hydrophobic compound and shows lipid solubility. It is a natural product found
in rhizome of curucuma longa (turmeric). On going research and clinical trials
provide ample evidence that this natural phenolic compound possess diverse
pharmacoological potencies. It exhibits anti inflammatory , anti – neoplastic,
anti oxidant chemo preventive activities and has been shown to be
pharmacologically same even at high doses.
Curcumin 1,7 bis (4-hydroxy-3-methoxy-phenyl)-1,6 heptadienes -3,5-
dione. It has also been used to treat disease such as skin wounds and tumors as
traditional medicine. Curcumin – protein interactions have been studies and the
effect of curcumin on inhibition and activation of protein kinase ‘c’ is reported.
Structure of curcumin
0 0
HO OH
OCH3 OCH3
Curcumin has potential use as a drug. But its use as a drug is limited by the poor
solubility in water. If it can be loaded on a suitable carrier to form a suitable
compound of appropriate physical properties , the use of curcumin as a drug can
be improved.
5
Aim of the Project
This project to prepare and characterize conjugates of albumin with metal ions like
Zinc ,Magnesium, etc. Conjugates involving two drugs curcumin and 5-flouro
uracil are also prepared. Drops of solutions are mixed in varying ratios on
microscope slides , allowed to dry and the residues examined under a polarized
microscope. Anisotropy of crystals are identified with polarized light. Techniques
employed for characterization include IR and UV spectrum analysis, particle size
analysis and SEM analysis.
6
MATERIALS AND METHODS
Egg albumin / Ovalbumin
Egg albumin flakes (protein-95%) from NICE chemical (P) Ltd.
Zinc sulphate (ZnSO4)
ZnSO4 AR-99.5%, from NICE chemical (p) Ltd.
Solvents
Petroleum Ether and Toluene are used as solvents. Ordinary soap solution is used
as surfactant.
Drug
Curcumin and 5-Fluoro Uracil from Loba are purchased.
Methods
Preparation of saturated egg albumin solution
About 7mg of egg albumin is accurately weighed in an electronic balance. It
is then dissolved in minimum amount of water, then successively into 20ml of
distilled water in a clean 100 ml beaker. The solution is then centrifuged to get a
clear solution.
Preparation of standard ZnSO4
About 28.744g of ZnSO4 is accurately weighed and transferred into a 100ml
standard flask. It is then dissolved in minimum amount of water and made up to
the mark.

7
Instruments
IR Spectrometer
An important tool used to gather information about compound’s structure,
asses its purity and sometimes to identify it. Here infrared radiation is absorbed by
molecules and converted into energy of molecular vibration, either stretching or
bending. An IR spectrum is a plot of wave number (X-axis) Vs percentage of
transmittance (Y-axis).
IR is useful in measuring the degree of polymerisation in polymer manufacture. It
has also been successfully utilised in the field of semiconductor microelectronics.
Fourier transforms infrared (FTIR) Spectroscopy
It is a measurement technique for collecting infrared spectra. When the
frequency of the infrared light is varied, IR light is guided through an
interferometer. After passing through the sample, the measured signal is the
interferogram. Performing a mathematical Fourier transform on this signal result in
a spectrum identical to that from conventional infrared spectroscopy.
UV Visible Absorption Spectrophotometer
The instrument used in ultra violet spectroscopy is called a UV/VIS
spectrophotometer. It measures the intensity of light passing through the sample (I)
and compares it to the intensity of light before it passes through the sample (Io).
The ration I/Io is called the transmittance, and usually expressed as a percentage
(%I).
An ultraviolet spectrum is essentially, a graph of light absorbance Vs
wavelength in a range of ultraviolet or visible region.
UV/Visible spectroscopy is routinely used in analytical chemistry for the
quantitative determination of different analytes, such as transition metal ions,
highly conjugated organic compounds and biological macromolecules.
8
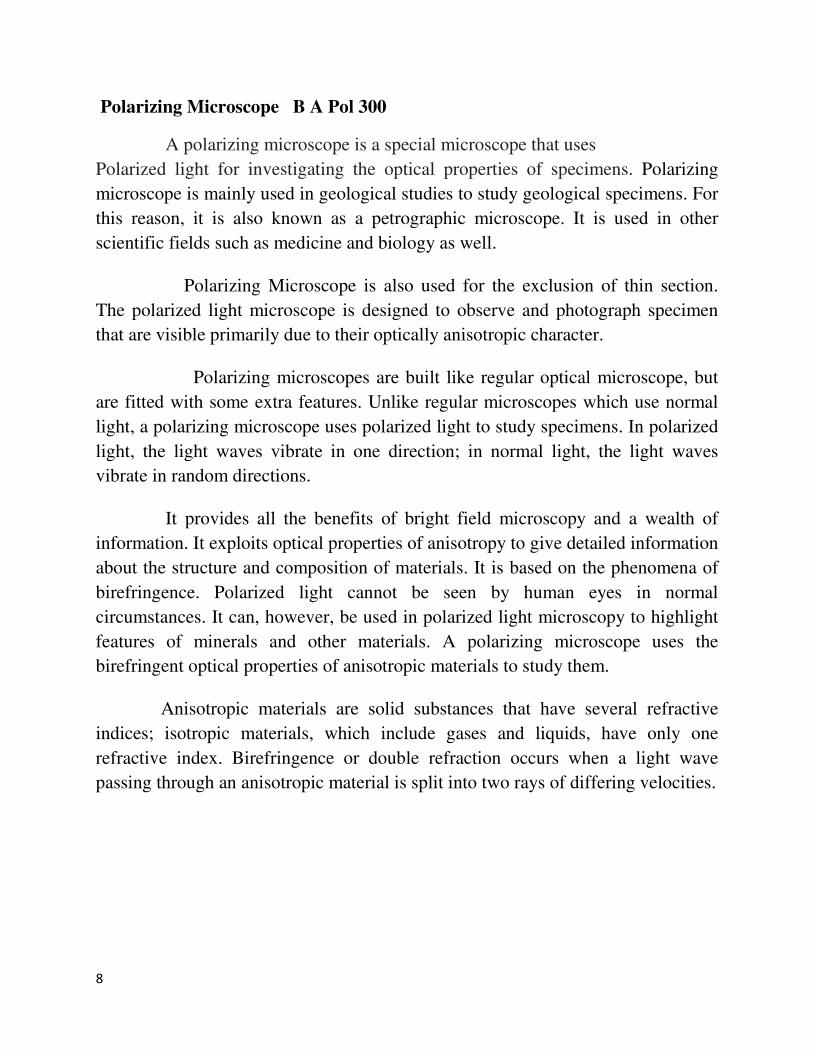
Polarizing Microscope B A Pol 300
A polarizing microscope is a special microscope that uses
Polarized light for investigating the optical properties of specimens. Polarizing
microscope is mainly used in geological studies to study geological specimens. For
this reason, it is also known as a petrographic microscope. It is used in other
scientific fields such as medicine and biology as well.
Polarizing Microscope is also used for the exclusion of thin section.
The polarized light microscope is designed to observe and photograph specimen
that are visible primarily due to their optically anisotropic character.
Polarizing microscopes are built like regular optical microscope, but
are fitted with some extra features. Unlike regular microscopes which use normal
light, a polarizing microscope uses polarized light to study specimens. In polarized
light, the light waves vibrate in one direction; in normal light, the light waves
vibrate in random directions.
It provides all the benefits of bright field microscopy and a wealth of
information. It exploits optical properties of anisotropy to give detailed information
about the structure and composition of materials. It is based on the phenomena of
birefringence. Polarized light cannot be seen by human eyes in normal
circumstances. It can, however, be used in polarized light microscopy to highlight
features of minerals and other materials. A polarizing microscope uses the
birefringent optical properties of anisotropic materials to study them.
Anisotropic materials are solid substances that have several refractive
indices; isotropic materials, which include gases and liquids, have only one
refractive index. Birefringence or double refraction occurs when a light wave
passing through an anisotropic material is split into two rays of differing velocities.
9
EXPERIMENTS
Preparation of the metal protein complex
Egg albumin flakes from Nice Chemicals are used for the following preparation.
The preparation method adopted is direct reaction between a saturated aqueous
solution of albumin with aqueous salt solution. Mixture of petroleum ether and
toluene is used as an immiscible solvent system to distribute albumin . It is made
to react with metal ion by adding 1 M Zinc Sulphate solution. 1 ml petroleum ether
saturated with surfactant liquid is taken in a test tube. It is mixed with 2ml toluene.
Shaken well 0.3 ml albumin solution is added and again shaken well. 0.3 ml of
zinc metal solution is poured into the mixture solution. A thick white precipitate is
obtained on vigorous shaking. The whole matter in the test tube is transferred into
a centrifuging tube. A few drops of dilute sulphuric acid is added .It is centrifuged
for 5 minutes. The supernatant liquid is poured out. The precipitate is washed with
distilled water and centrifuged again.
The process is repeated for several times with the same amounts of reagents. The
final thick white precipitate is suspended in water. The solid matter is collected
together. The complexes obtained are then analysed. The albumin zinc metal
10
complexes we obtained are washed with several times with water and centrifuged.
Then we obtained the pure albumin zinc metal complexes. After the washing
processes the albumin zinc metal complexes are separated and made free from the
solvents used. The albumin zinc metal complex obtained is then allowed to dry.
This dry albumin zinc metal complex is then used for further studies.
The amount of albumin and salt solutions are optimised by trying with variable
volumes and viewing under an optical microscope. Calcium complex is also
prepared by similar method. The amount of calcium salt solution added is 0.2 ml
for 0.3 ml albumin solution.
Particle size analysis is conducted for both the complexes using Malvern Particle
size analyser.
Zinc Albumin Conjugate - Bulk preparation.
1 ml Petroleum ether saturated with surfactant liquid is taken in a test
tube. It is mixed with 2ml toluene and shaken well. 3ml Zinc metal solution is
added from burette to the mixture solution. 3ml ovalbumin solution and 4ml
curcumin are added and vigorously shaken . A thick precipitate is obtained. The
whole matter in the test tube is transfered into a 250 ml beaker.
The process repeated. The whole substance in the beaker is then stirred
countinuously for about 5 minutes using an electric stirrer.
11
The metal ovalbumin-curcumin complex is formed is then transferred into
vaccum evaporator. The temperature of the vaccum evaporator is then set as
80o. The process is carried out for about 30 minutes. After this process we get
solid dry metal-ovalbumin-curcumin complex.
Preparation of metal protein conjugate samples on slides
A very small quantity of aqueous solution of ovalbumin is placed on a glass
slide using a dropper , allowed to dry and viewed through microscope, the
micrographs are taken.
Slides are prepared with varied number of drops of saturated solution of albumin
and Zinc Sulphate solution. Samples are compared with respect to the amount
and quality of solid samples formed .
The relative quantities of albumin, and zinc salt solution are varied and optimized
by trial and error method.
A few slides are also prepared with a drop of surfactant solution, which would
facilitate appropriate orientation of molecules
The micrographs was taken with analyser in and analyser out in various stages.
Samples are compared under ordinary light and polarized light. Anisotropic
substances show specific behavior under polarized light.
Preparation of metal protein drug conjugate -samples on slides
A very small quantity of aqueous solution of ovalbumin is placed on a glass slide
using a dropper , a few drops Zinc Sulphate and solution of a drug are placed over
12
albumun drops and all three are thoroughly mixed. Slides are allowed to dry and
viewed through microscope, the micrographs are taken.
Two drugs are used here ,namely 5- fluoro uracil and curcumin. Curcumin is only
very sparingly soluble and so an alcoholic solution is used.
Just as in the case of metal albumin conjugate, variable amounts of albumin, Zinc
Sulphate and drug are used on different slides. Samples are compared under the
microscope and those slides with characteristic crystalline nature are chosen and
micrographs taken.
13
Result and Discussion
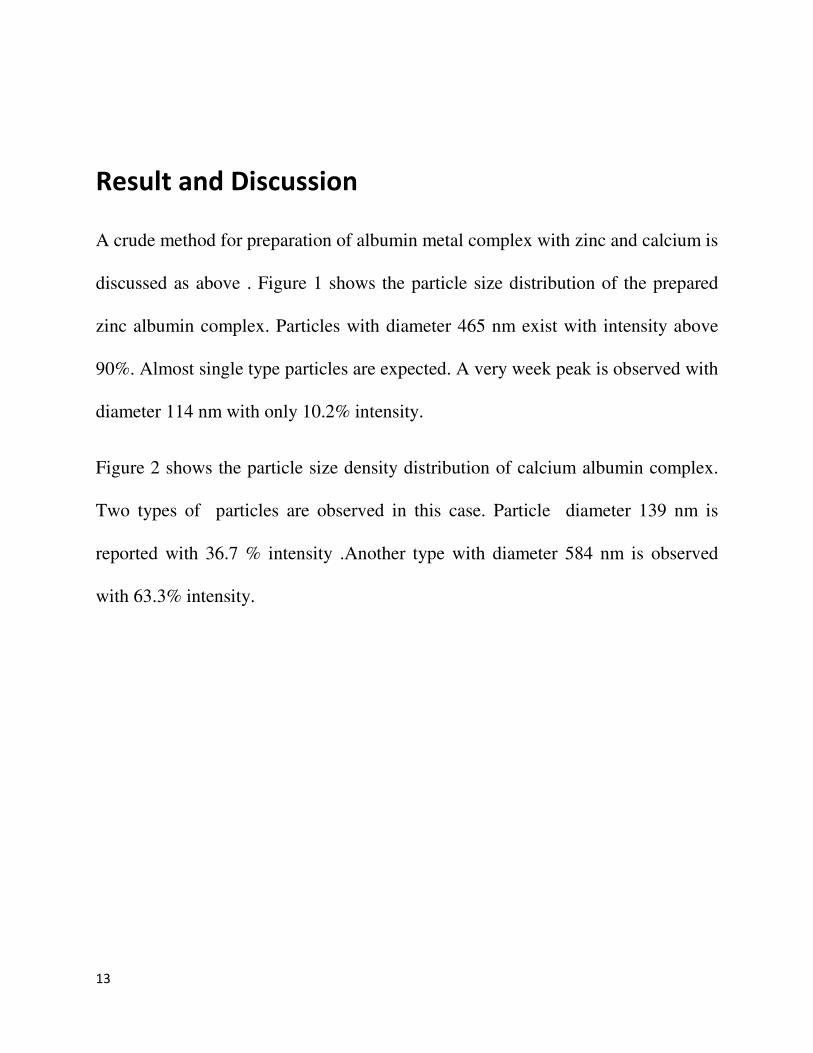
A crude method for preparation of albumin metal complex with zinc and calcium is
discussed as above . Figure 1 shows the particle size distribution of the prepared
zinc albumin complex. Particles with diameter 465 nm exist with intensity above
90%. Almost single type particles are expected. A very week peak is observed with
diameter 114 nm with only 10.2% intensity.
Figure 2 shows the particle size density distribution of calcium albumin complex.
Two types of particles are observed in this case. Particle diameter 139 nm is
reported with 36.7 % intensity .Another type with diameter 584 nm is observed
with 63.3% intensity.
14
(Figure 1 Particle size Distribution of Zinc Albumin Complex. Two types of particles suggested,with
diameter 114 nm and 465 nm.)

15
Figure 2 Particle size Distribution of Calcium Albumin complex. Two types of particles with
diameters 584 nm and 139 nm observed
16
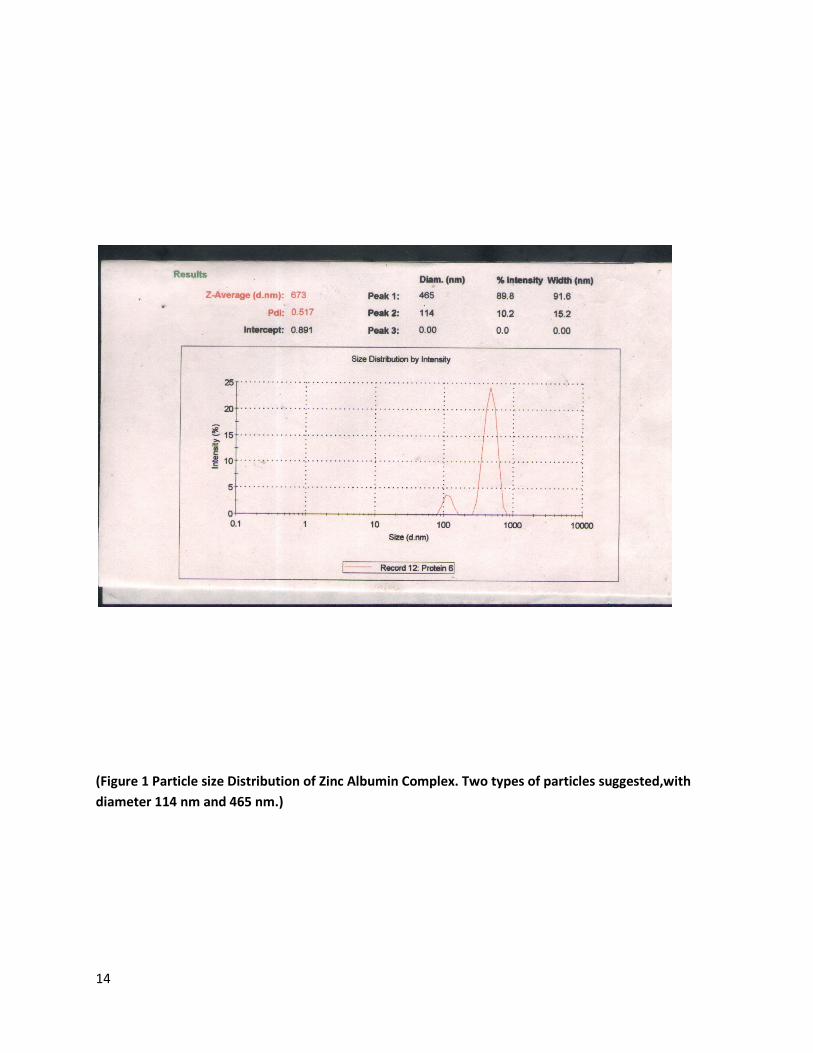
Figure3
It is one drop aqueous solution of albumin only .Even the clear saturated solution
shows uneven distribution of the solid on the glass plate.
Figure 3 shows dried sample from a few dropd of saturated albumin solution under magnification
10x10. It is not anisotropic.
17
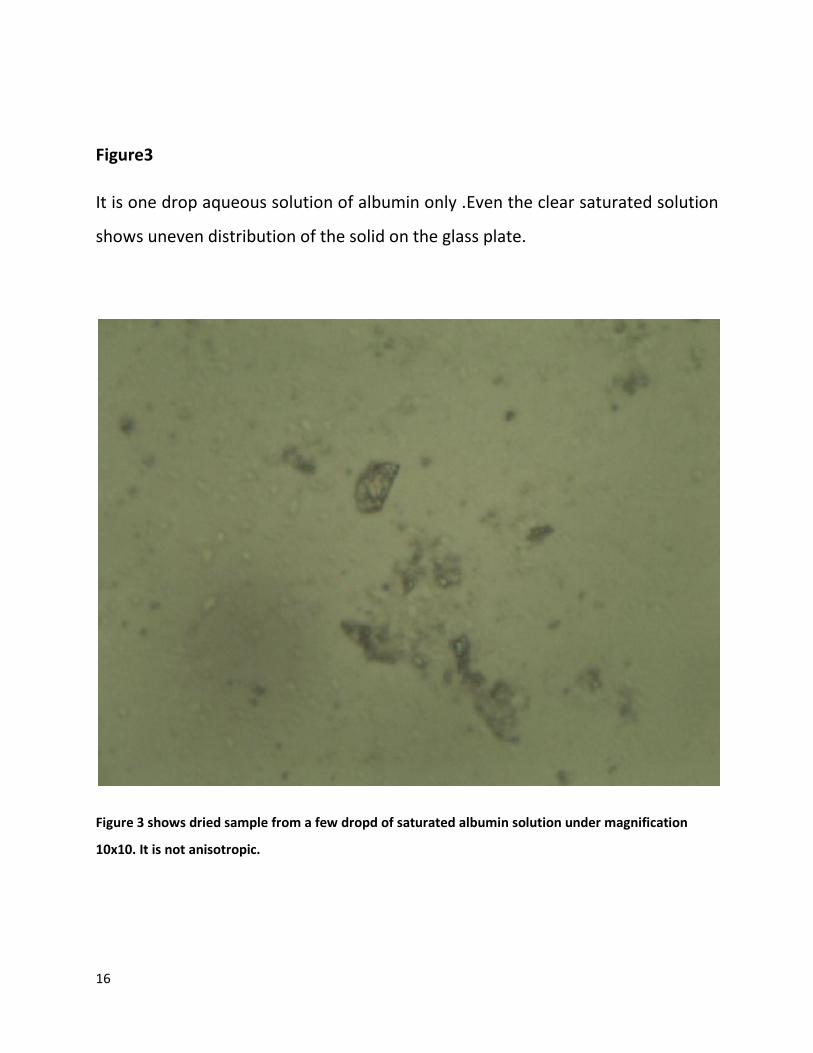
Figure 4
This shows Albumin with Surfactant. Here Albumin fragments are separated by
surfactant .In presence of the surfactant the albumin solid particles are broken in
to smaller units , better oriented for combining with other molecules.
Figure 4 show a drop of albumin solution mixed with a drop of surfactant. It is well distributed over
the whole slide. The presence of surfactant facilitates conjugate formation. Magnification 10x10

18
Figure 5
Careful observation reveals hexagonal shape. Visual image is clearer than the
image obtained in the digital camera, Motic. Some crystals are placed above
others. Many slides are obtained like this. A few are shown here.Hexagonal
crystals of zinc with albumin formed in presence of surfactant.
Figure 5 shows sample prepared with one drop albumin and two drops zinc sulphate
solution in presence of surfactant under magnification 10x10
Figure 5 and 6 are also taken from slides of albumin solution with surfactant and
zinc salt solution, under magnification 10X10 and 40X10
respectively. Formation of zinc albumin complex. We can see the hexagonal
crystals formed one above the other.
19
Figure 6
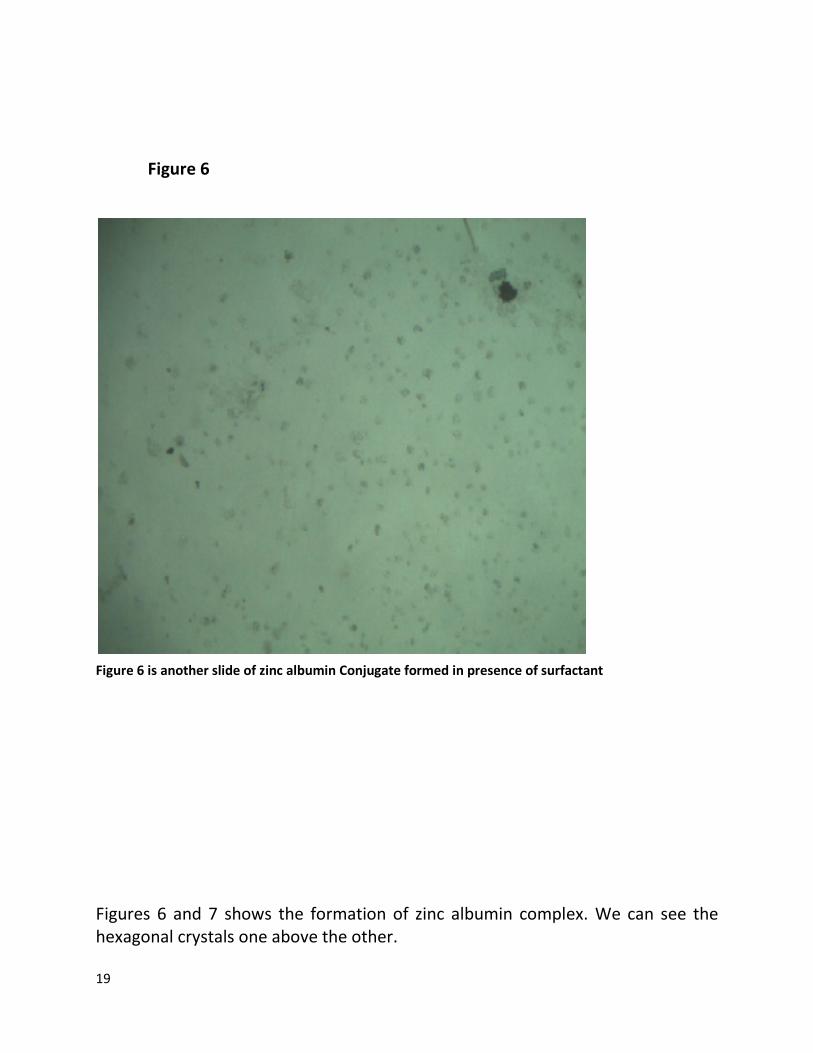
Figure 6 is another slide of zinc albumin Conjugate formed in presence of surfactant
Figures 6 and 7 shows the formation of zinc albumin complex. We can see the
hexagonal crystals one above the other.
20
Figure 7
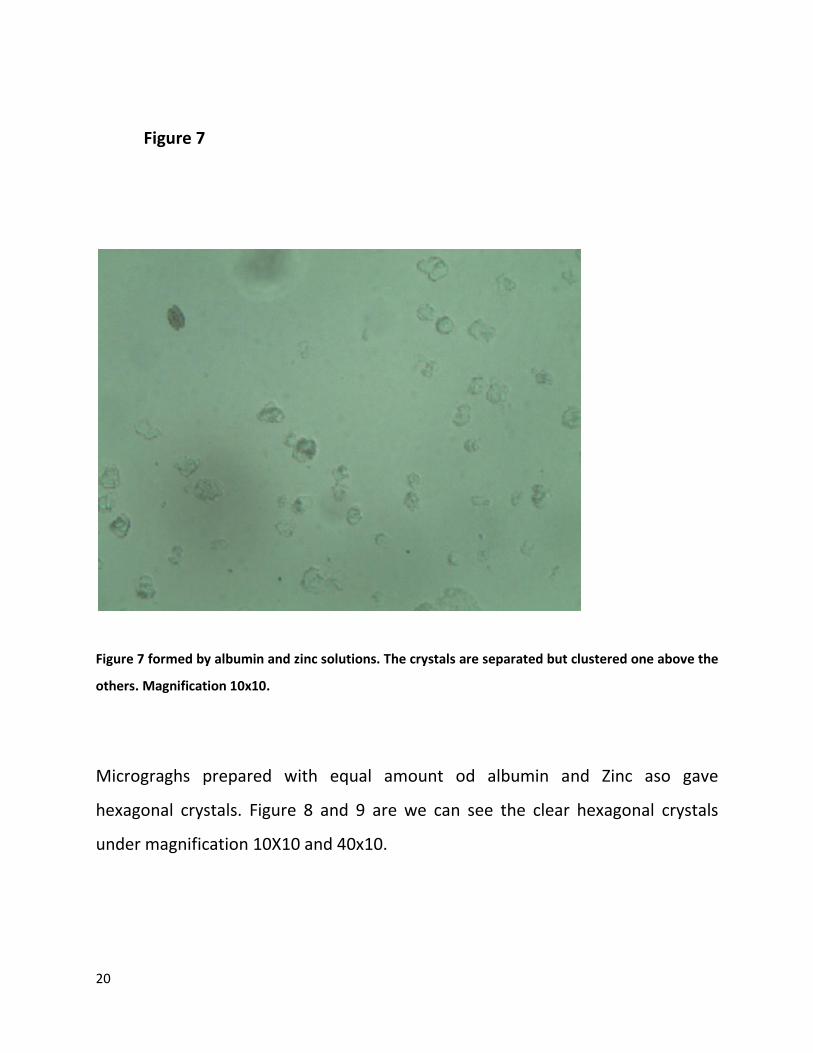
Figure 7 formed by albumin and zinc solutions. The crystals are separated but clustered one above the
others. Magnification 10x10.
Micrograghs prepared with equal amount od albumin and Zinc aso gave
hexagonal crystals. Figure 8 and 9 are we can see the clear hexagonal crystals
under magnification 10X10 and 40x10.
21
Figure 8
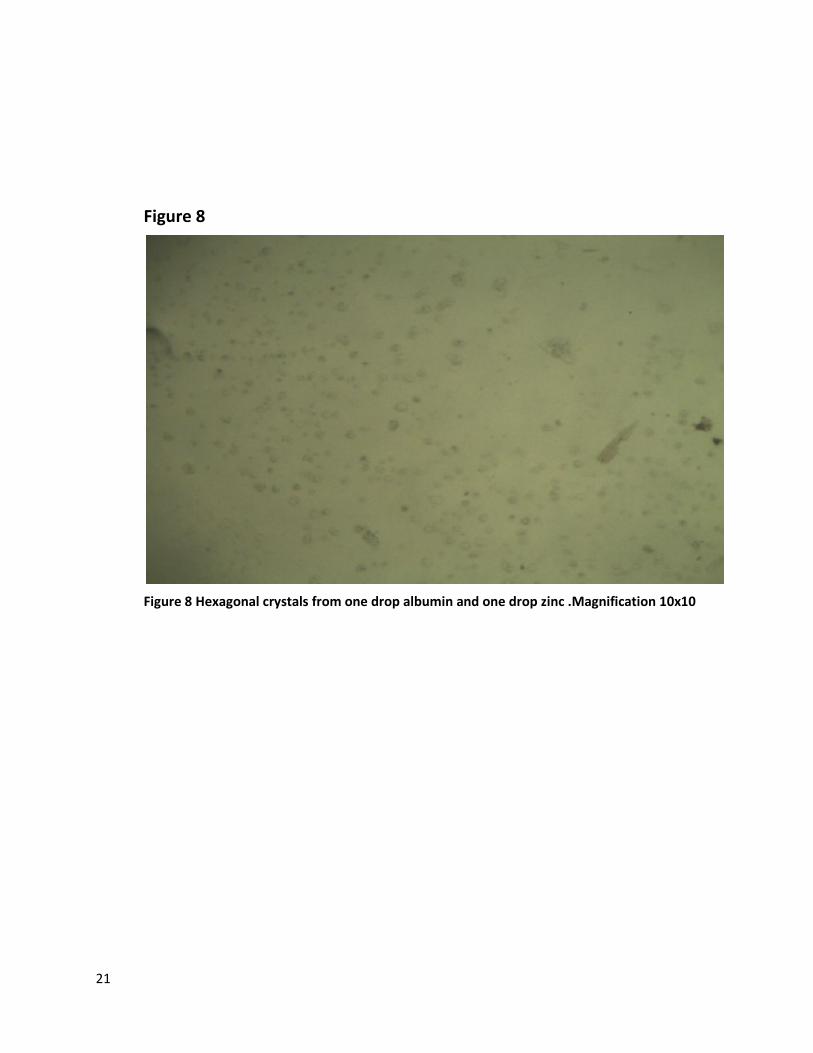
Figure 8 Hexagonal crystals from one drop albumin and one drop zinc .Magnification 10x10
22
.
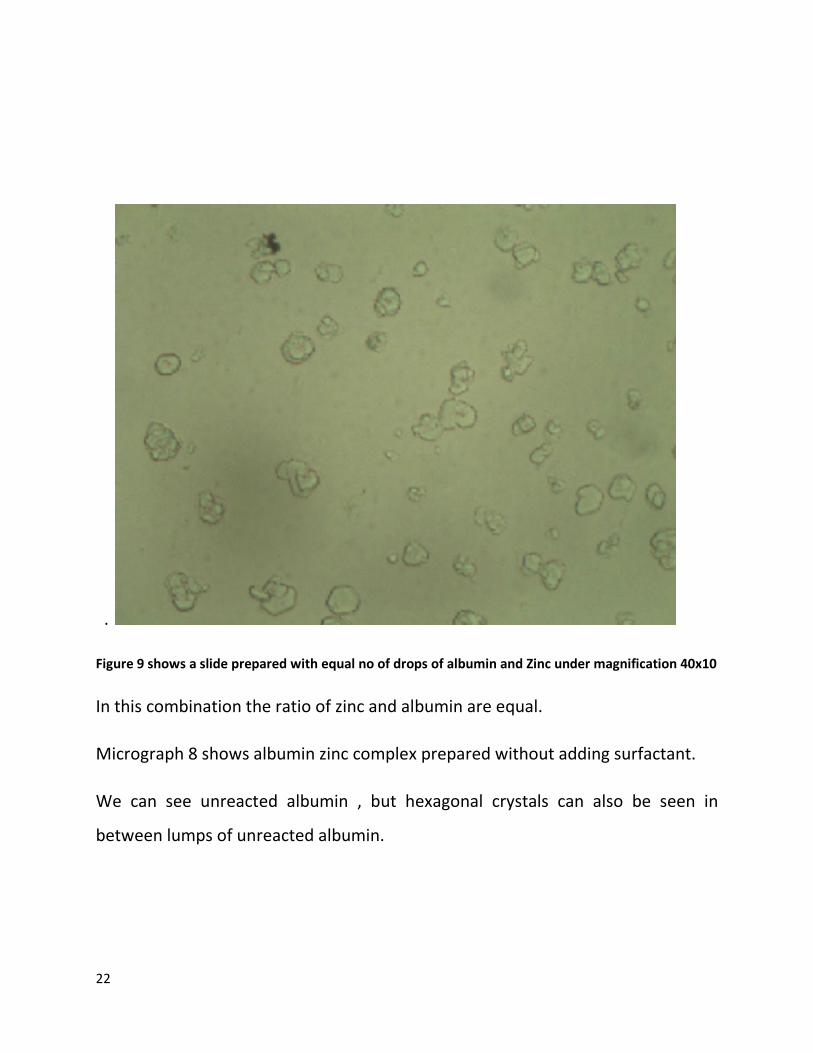
Figure 9 shows a slide prepared with equal no of drops of albumin and Zinc under magnification 40x10
In this combination the ratio of zinc and albumin are equal.
Micrograph 8 shows albumin zinc complex prepared without adding surfactant.
We can see unreacted albumin , but hexagonal crystals can also be seen in
between lumps of unreacted albumin.
23
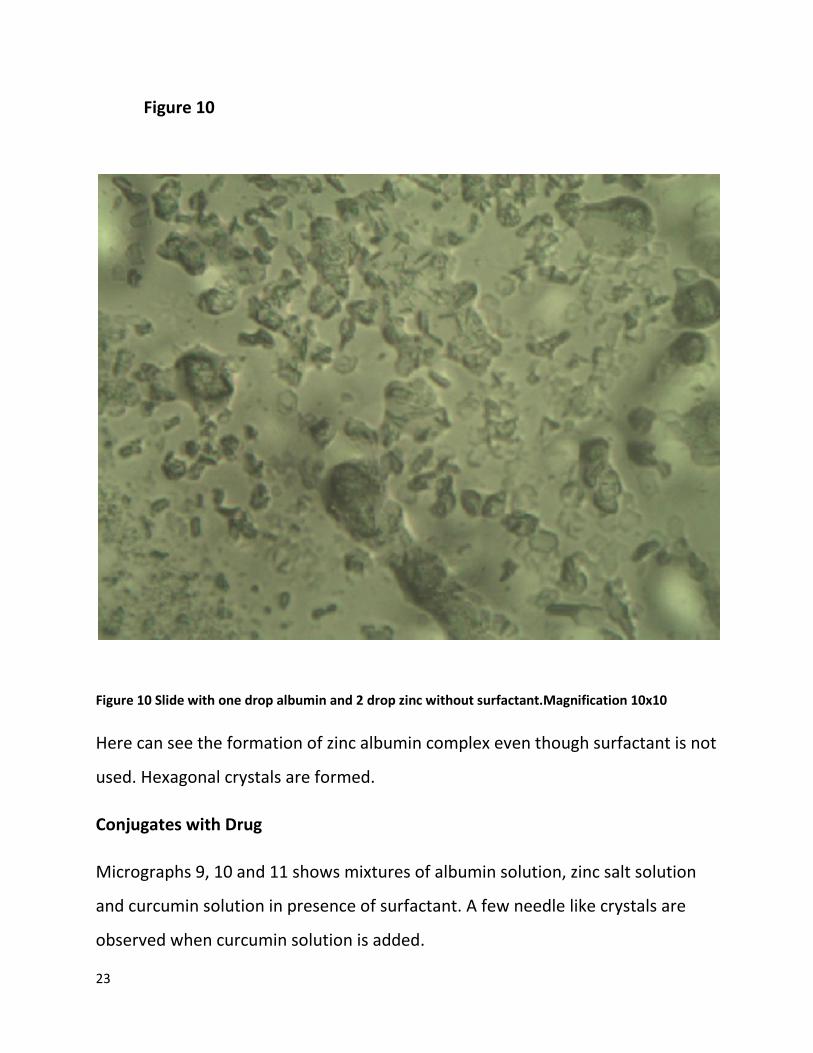
Figure 10
Figure 10 Slide with one drop albumin and 2 drop zinc without surfactant.Magnification 10x10
Here can see the formation of zinc albumin complex even though surfactant is not
used. Hexagonal crystals are formed.
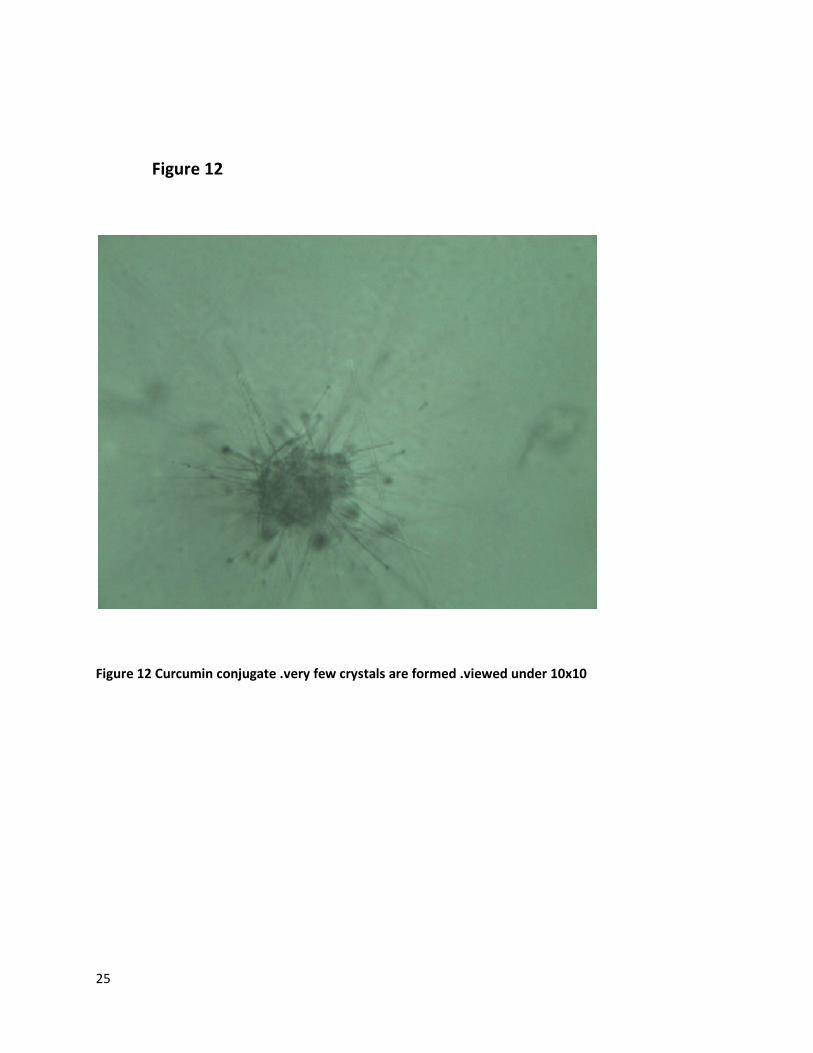
Conjugates with Drug
Micrographs 9, 10 and 11 shows mixtures of albumin solution, zinc salt solution
and curcumin solution in presence of surfactant. A few needle like crystals are
observed when curcumin solution is added.

24
Figure11
Figure 11 Curcumin conjugate .very few crystals are formed .viewed under 10x10
25
Figure 12
Figure 12 Curcumin conjugate .very few crystals are formed .viewed under 10x10
26
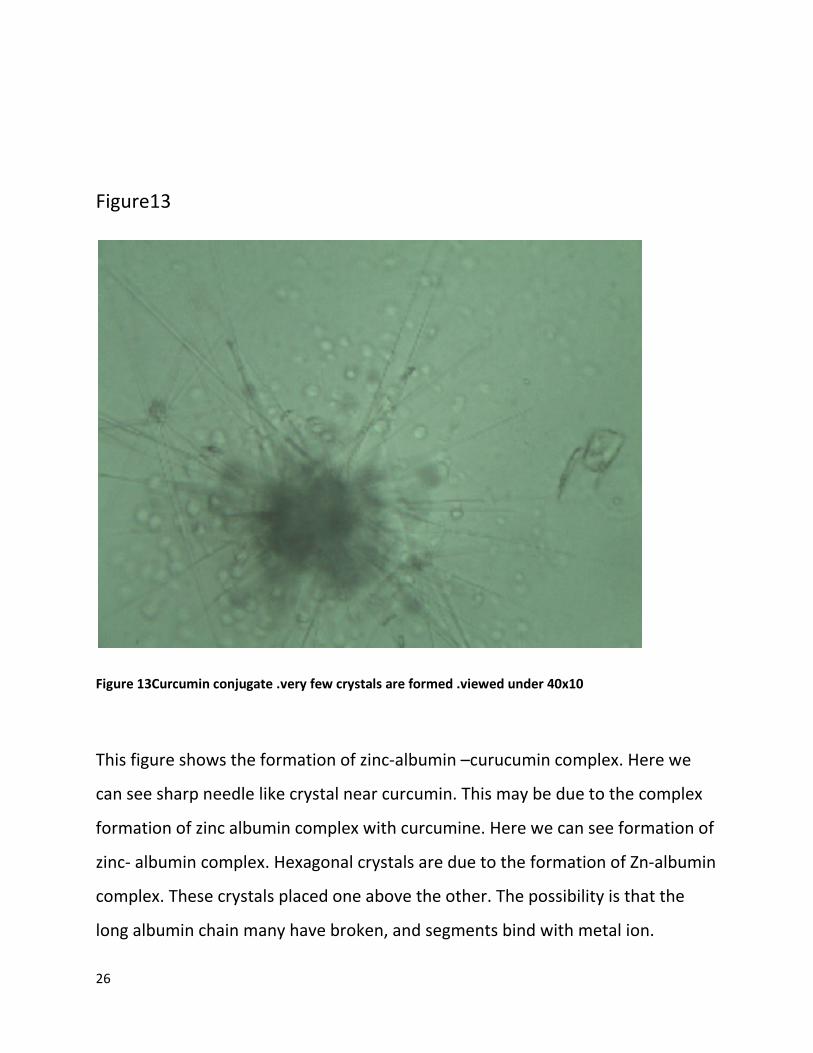
Figure13
Figure 13Curcumin conjugate .very few crystals are formed .viewed under 40x10
This figure shows the formation of zinc-albumin –curucumin complex. Here we
can see sharp needle like crystal near curcumin. This may be due to the complex
formation of zinc albumin complex with curcumine. Here we can see formation of
zinc- albumin complex. Hexagonal crystals are due to the formation of Zn-albumin
complex. These crystals placed one above the other. The possibility is that the
long albumin chain many have broken, and segments bind with metal ion.
27
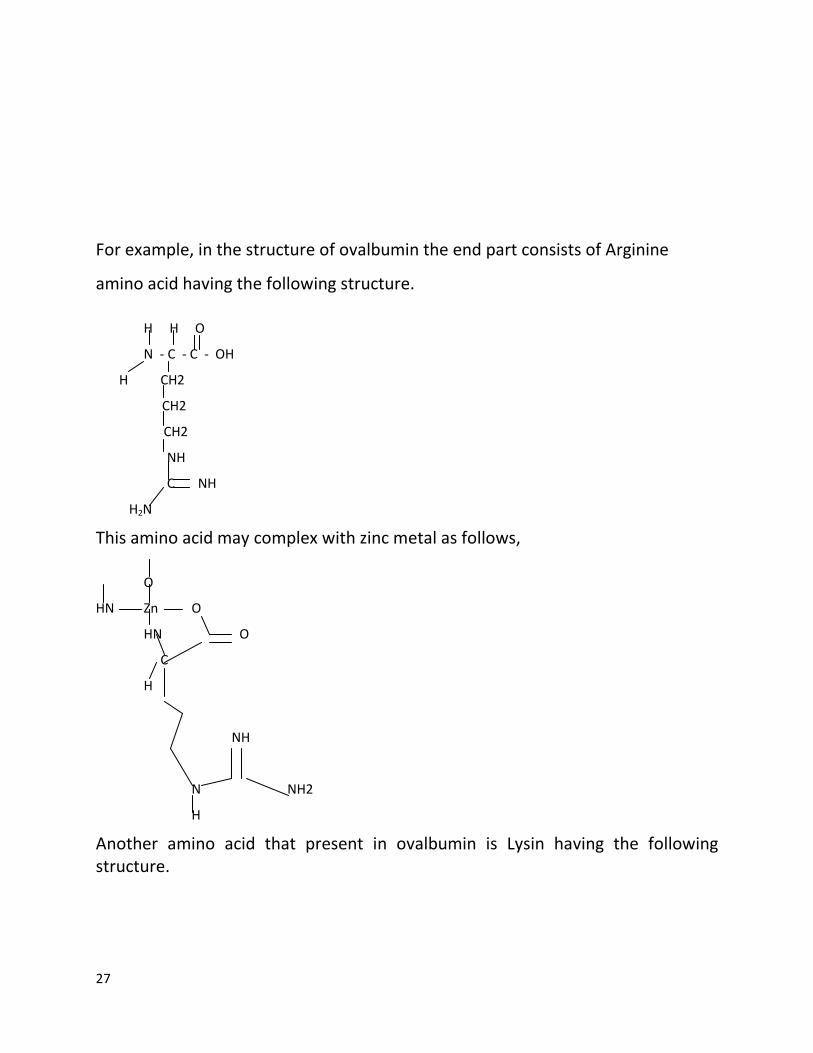
For example, in the structure of ovalbumin the end part consists of Arginine
amino acid having the following structure.
H H O
N - C - C - OH
H CH2
CH2
CH2
NH
C NH
H2N
This amino acid may complex with zinc metal as follows,
O
HN Zn O
HN O
C
H
NH
N NH2
H
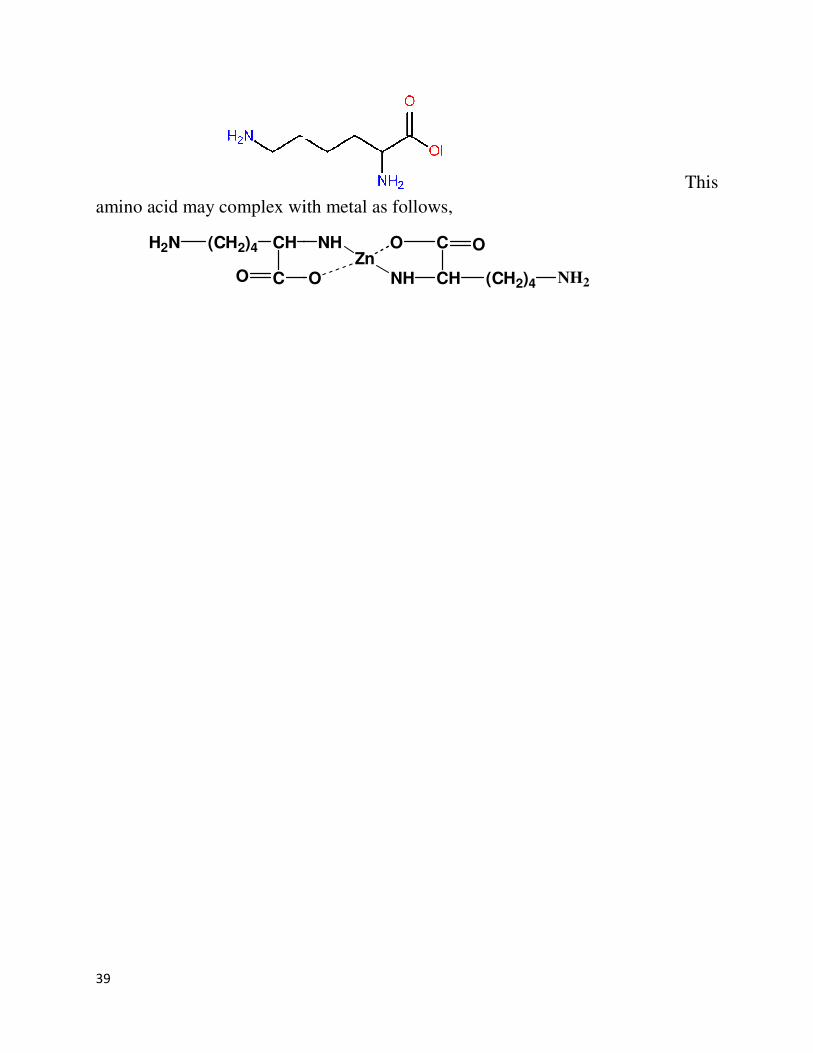
Another amino acid that present in ovalbumin is Lysin having the following
structure.
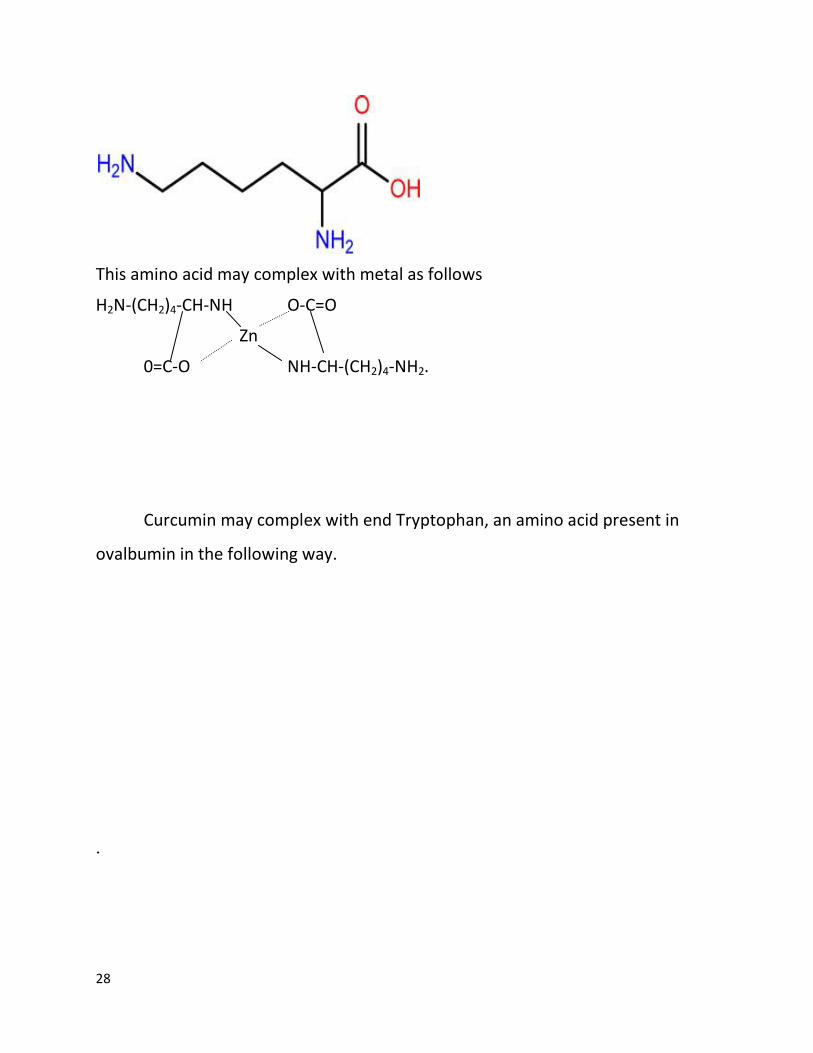
28
This amino acid may complex with metal as follows
H2N-(CH2)4-CH-NH O-C=O
Zn
0=C-O NH-CH-(CH2)4-NH2.
Curcumin may complex with end Tryptophan, an amino acid present in
ovalbumin in the following way.
.

29
SE M analysis
b) ANALYSIS USING SCANNING ELECTRON MICROSCOPE
Figure 14 SEM of Albumin .A few drops of Albumin solution placed on glass slide is dried and the
sample collected for SEM analysis.
30
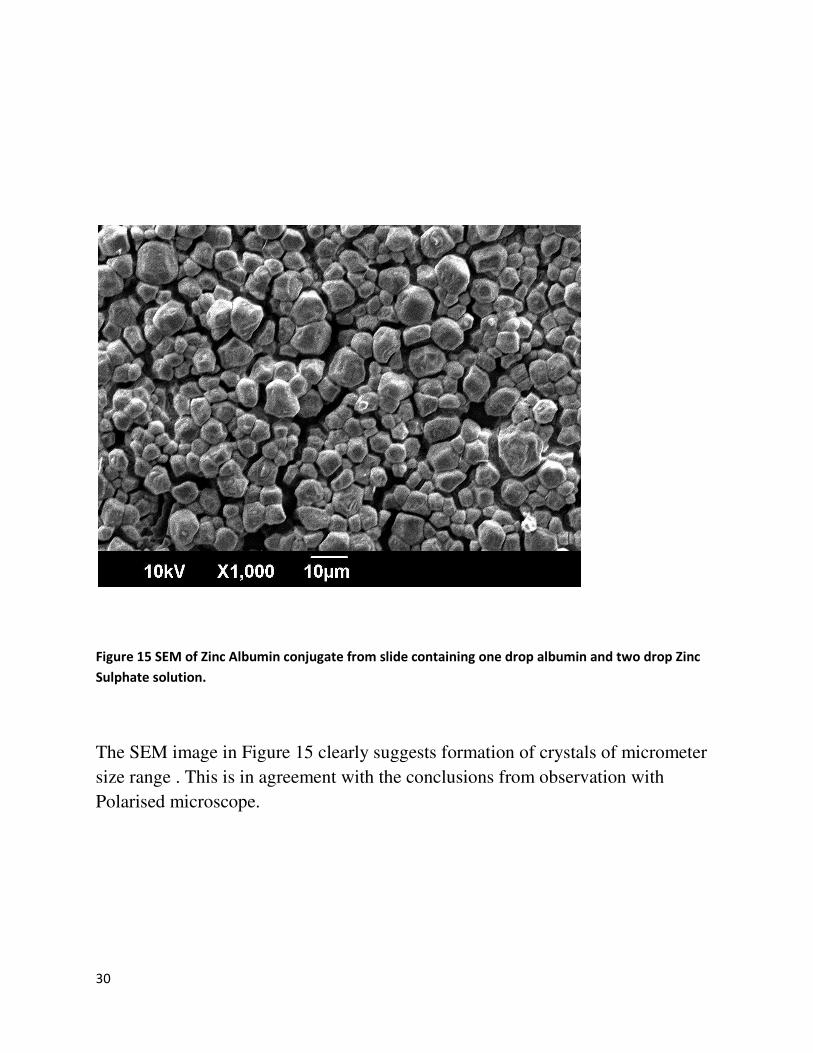
Figure 15 SEM of Zinc Albumin conjugate from slide containing one drop albumin and two drop Zinc
Sulphate solution.
The SEM image in Figure 15 clearly suggests formation of crystals of micrometer
size range . This is in agreement with the conclusions from observation with
Polarised microscope.
31
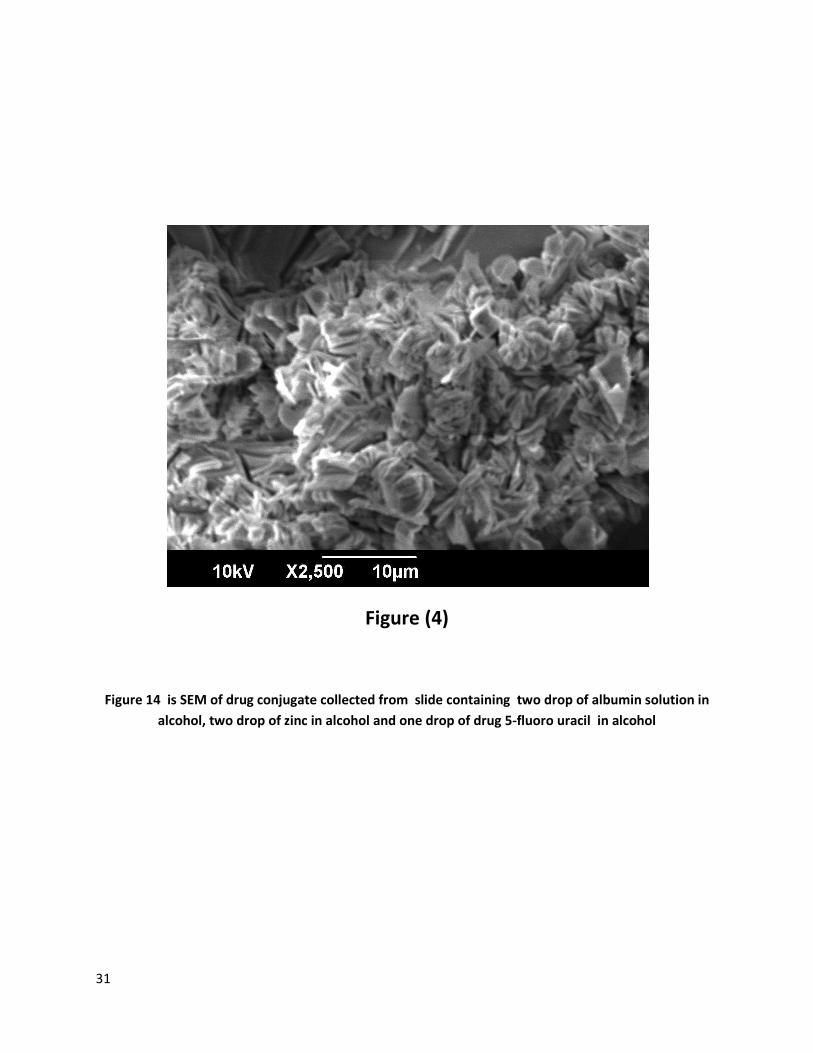
Figure (4)
Figure 14 is SEM of drug conjugate collected from slide containing two drop of albumin solution in
alcohol, two drop of zinc in alcohol and one drop of drug 5-fluoro uracil in alcohol
32
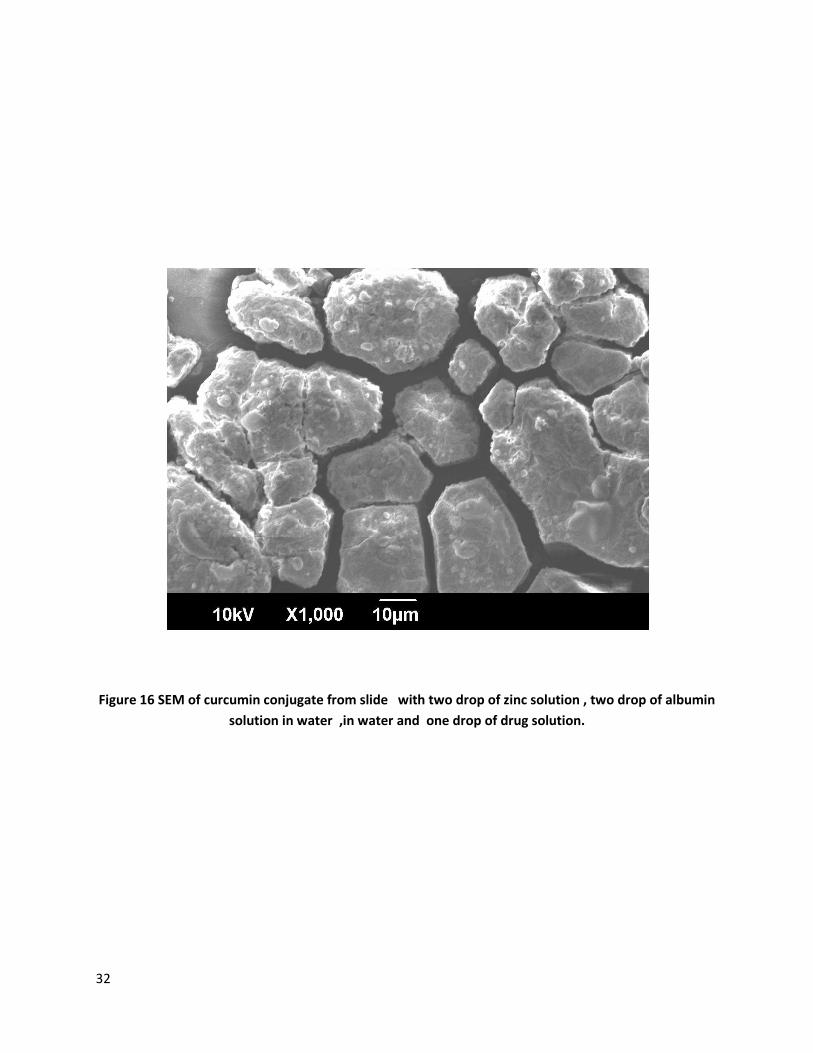
Figure 16 SEM of curcumin conjugate from slide with two drop of zinc solution , two drop of albumin
solution in water ,in water and one drop of drug solution.
33
Spectral analysis
Ovalbumin -IR Spectrum
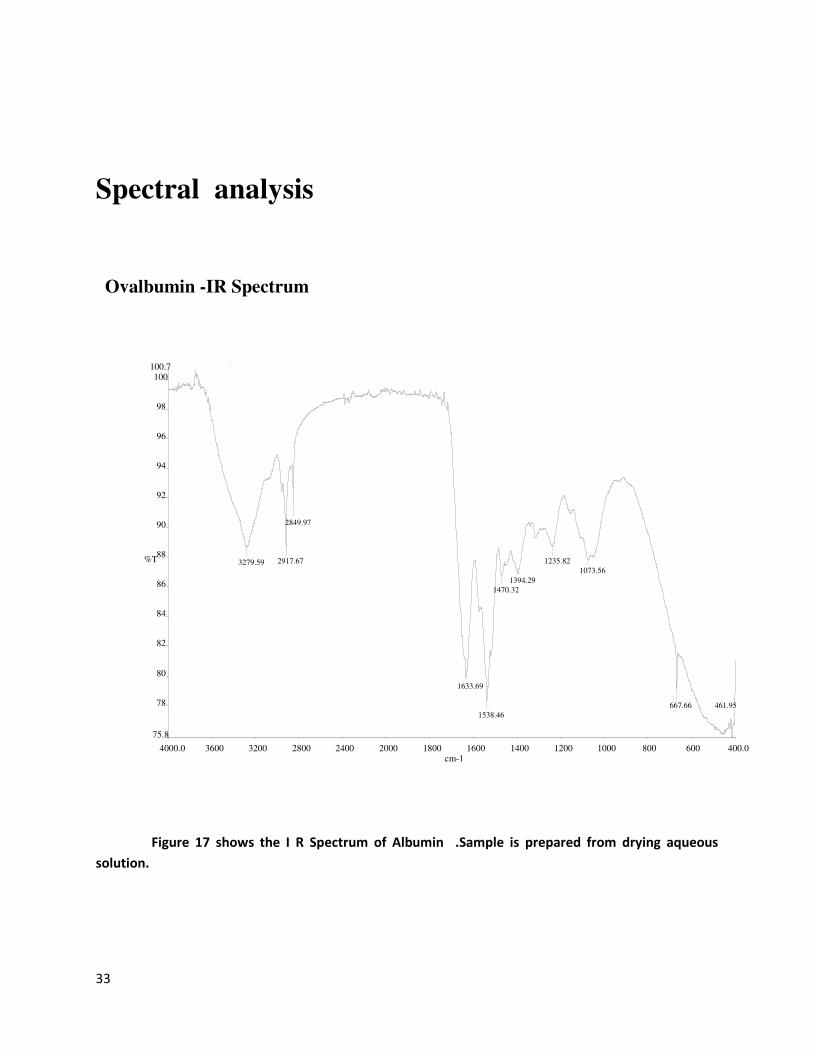
Figure 17 shows the I R Spectrum of Albumin .Sample is prepared from drying aqueous
solution.
4000.0 3600 3200 2800 2400 2000 1800 1600 1400 1200 1000 800 600 400.0 75.8
78
80
82
84
86
88
90
92
94
96
98
100100.7
cm-1
%T 3279.59 2917.67
2849.97
1633.69
1538.46
1470.32
1394.29
1235.82
1073.56
667.66 461.95

34
Zinc Ovalbumin complex-IR Spectrum
Figure 18 I R Spectrum of Zinc Albumin Conjugate
IR spectra of ovalbumin (Fig 17 ) and the Zn-Ovalbumin complex (Fig 18)
are compared.
4000.0 3600 3200 2800 2400 2000 1800 1600 1400 1200 1000 800 600 400.0
83.0
84
85
86
87
88
89
90
91
92
93
94
95
96
97
98
99
100
101
101.6
cm-1
%T
3194.29
1634.47
1066.42
982.70
596.04

35
Figure 17 Figure 18
Peaks in
cm-1
Reason Peaks in
cm-1
Reason
3279 Due to –NH stretching 3194 Due to –NH stretching
2917,2850 Due to –CH stretching
1633 Due to C=O stretching 1634 Due to C=O stretching
1538 Due to –NH bending
1074 Due to –C-O stretching 1066 Due to –C-O stretching
1317,1237 Due to –C-N stretching
Many of the specific representation in the Ovalbumin spectrum are
missing in the Zn-Ovalbumin complex. -NH stretching at 3279 cm-1
in Ovalbumin
broaded and shifted to 3194 cm-1
in the complex. –CH stretching at 2917cm-1
, -
NH bending at 1538cm-1
and –CN stretching at 1317cm-1
and 1237cm-1
are absent
in the IR spectrum of ovalbumin Zinc complex. C-O stretching at 1074 cm-1
shifted to 1066cm-1
in the complex. The IR spectrum of complex also consists of a
specific peak at 982 cm-1
. These changes are expected to be due to the binding of
Zinc with certain functional group such as –NH and C-O.
UV/V Spectral data analysis
36
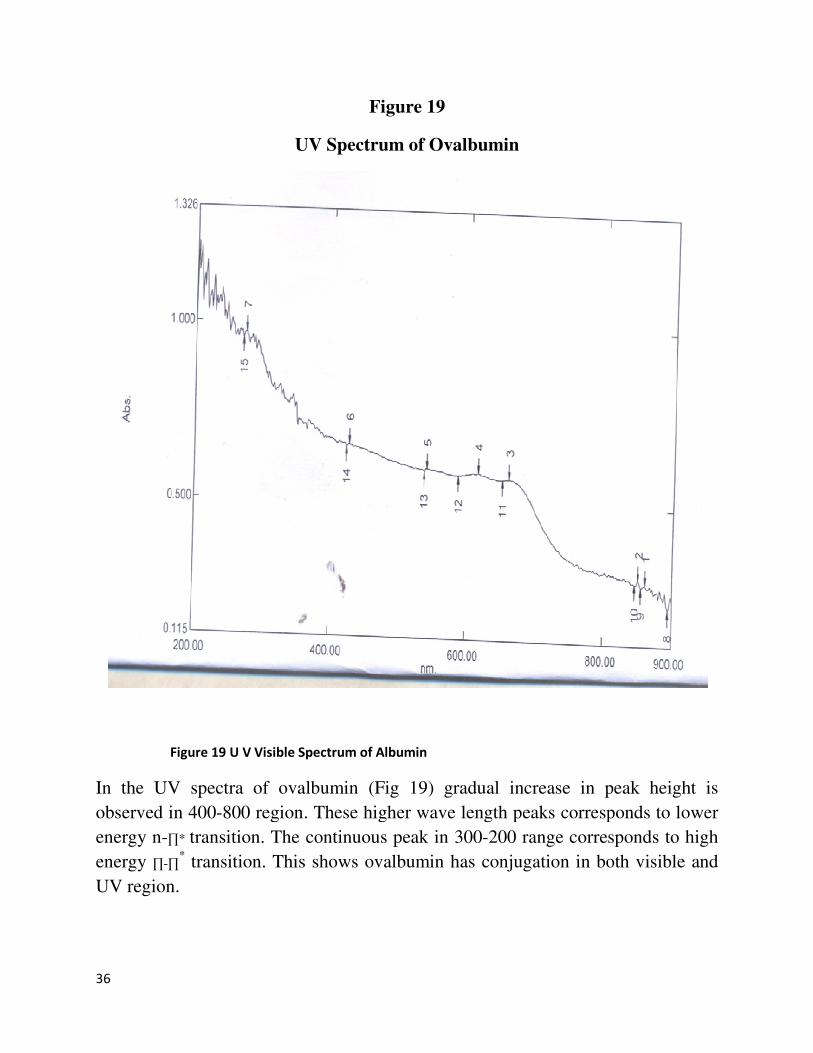
UV Spectrum of Ovalbumin
Figure 19 U V Visible Spectrum of Albumin
In the UV spectra of ovalbumin
observed in 400-800 region. These higher wave
energy n-∏* transition. The continuous peak in 300
energy ∏-∏* transition. This shows ovalbumin has conjugation in both visible and
UV region.
Figure 19
UV Spectrum of Ovalbumin
9 U V Visible Spectrum of Albumin
In the UV spectra of ovalbumin (Fig 19) gradual increase in peak height is
800 region. These higher wave length peaks corresponds to lower
ion. The continuous peak in 300-200 range corresponds to high
This shows ovalbumin has conjugation in both visible and
) gradual increase in peak height is
length peaks corresponds to lower
200 range corresponds to high
This shows ovalbumin has conjugation in both visible and
37
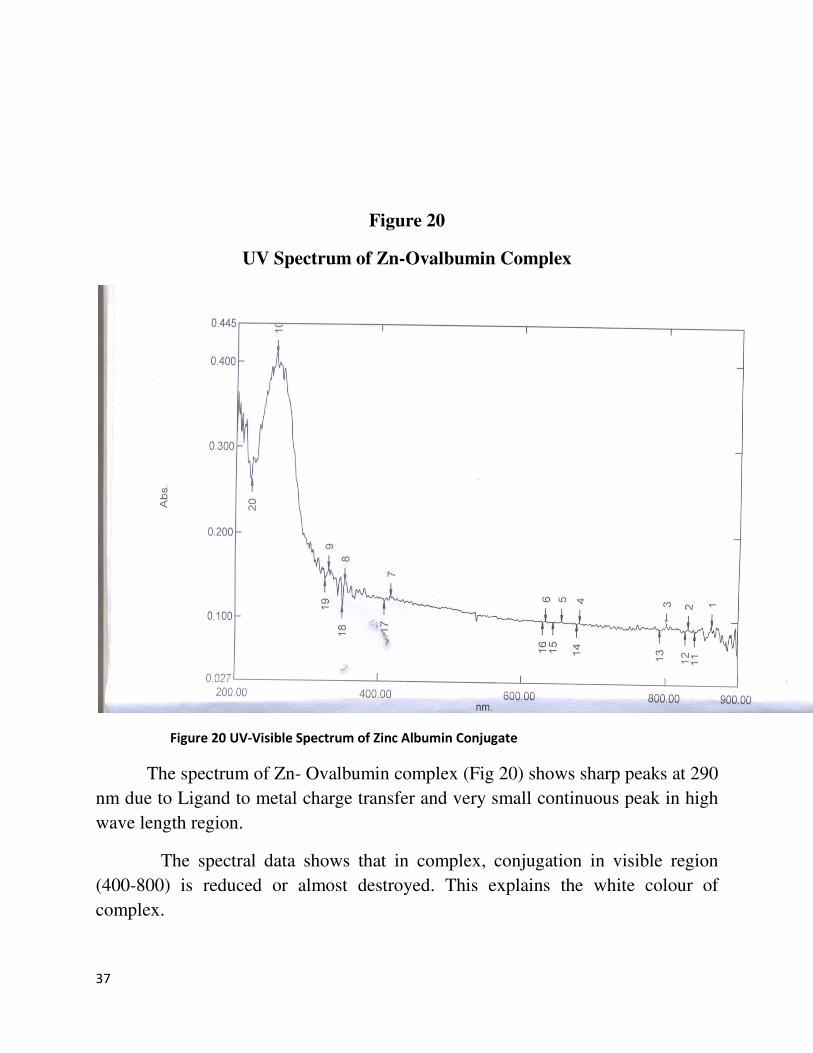
Figure 20
UV Spectrum of Zn-Ovalbumin Complex
Figure 20 UV-Visible Spectrum of Zinc Albumin Conjugate
The spectrum of Zn- Ovalbumin complex (Fig 20) shows sharp peaks at 290
nm due to Ligand to metal charge transfer and very small continuous peak in high
wave length region.
The spectral data shows that in complex, conjugation in visible region
(400-800) is reduced or almost destroyed. This explains the white colour of
complex.
38
Even though strong peak is formed in complex, the absorbance is decrease
from 1.25 to 0.35 and strong peak comes in 0.41 absorbance range. This shows that
only small energy is needed for excitation.
Thus a UV/V spectrum also shows the possibility of complex formation
between amino acid and metal ion.
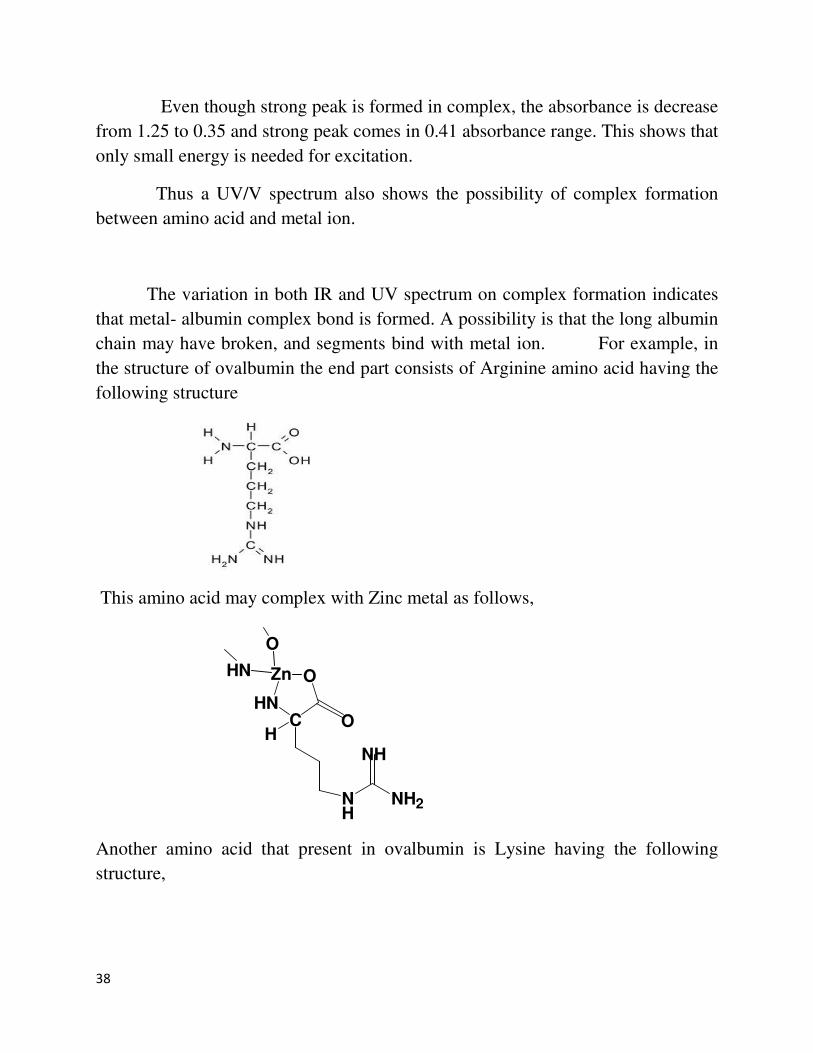
The variation in both IR and UV spectrum on complex formation indicates
that metal- albumin complex bond is formed. A possibility is that the long albumin
chain may have broken, and segments bind with metal ion. For example, in
the structure of ovalbumin the end part consists of Arginine amino acid having the
following structure
This amino acid may complex with Zinc metal as follows,
Zn
HNC
O
O
NH
NH2
NHH
O
HN
Another amino acid that present in ovalbumin is Lysine having the following
structure,
39
amino acid may complex with metal as
H2N (CH2)4 CH
CO
amino acid may complex with metal as follows,
O
NHZn
O
NH CH (CH2)4
C O
NH2
This
follows,
40
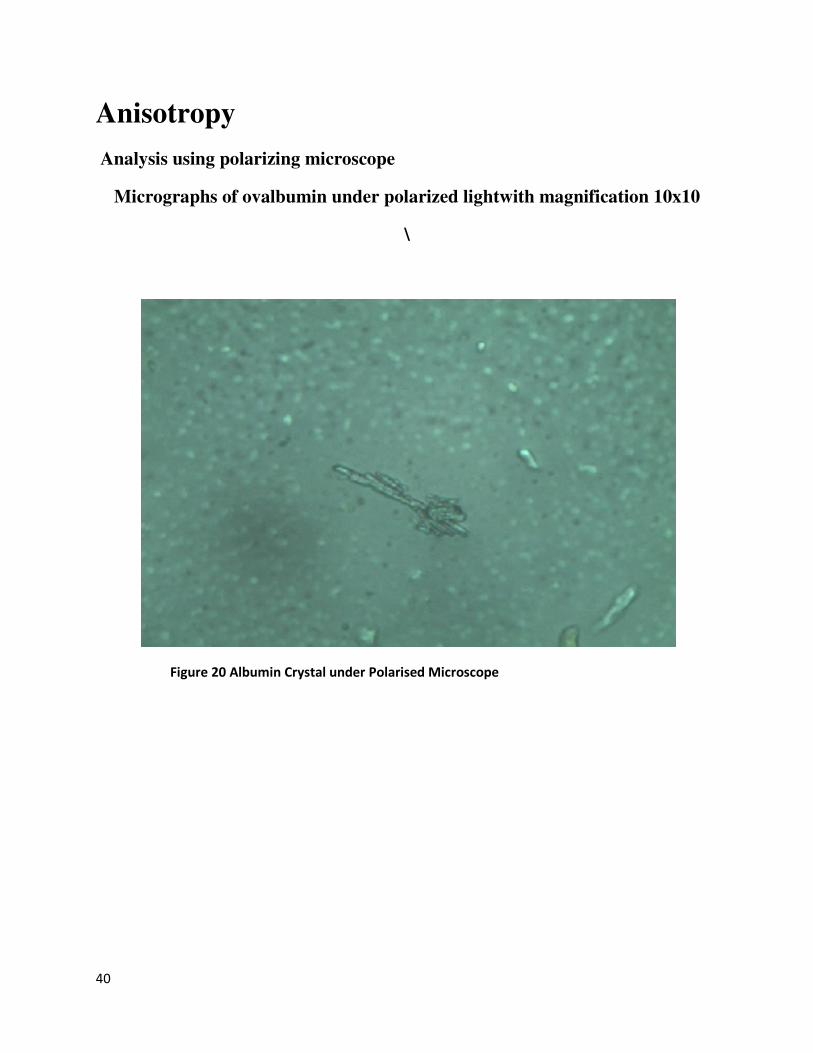
Anisotropy
Analysis using polarizing microscope
Micrographs of ovalbumin under polarized lightwith magnification 10x10
\
Figure 20 Albumin Crystal under Polarised Microscope

41
Figure 21 Micrographs of ovalbumin under polarized lightwith
magnification 40x10

42
The micrographic studies of Ovalbumin and its Zinc complex reveals that the
crystal structure of ovalbumin is needle like and Ovalbumin-Zinc complex shows a
hexagonal structure. This indicates the possibility of hexagonal structure of the Zn-
Ovalbumin complex.
Polarising microscope based on the phenomenon of birefringence mainly
helps to identify whether the substance is isotropic or anisotropic. In a single
crystal, the physical and mechanical properties often differ with orientation. It can
be seen from looking at our models of crystalline structure that atoms should be
able to slip over one another or distort in relation to one another easier in some
directions than others. When the properties of a material vary with different
crystallographic orientations, the material is said to be anisotropic.
Ovalbumin seems to be a transparent crystal. When rotated through 3600 it is
found to be isotropic (Uniform in all direction) that is with analyser-in, the object
was invisible, for all orientation of the microscope stage from 00
to 3600. Crystals
have similar properties in all directions.
When beam of polarised light passed through the crystals of Zinc-
Ovalbumin complex, at a specific orientation the crystal allows the passage of light
through it and seems to be bright (Fig 22). But when the stage is rotated, the bright
appearance change and after rotation through 450 it seems to be dark (Fig 25)
since it does not allow the passage of light. Again after 450
rotations it seems to be
bright (Fig 23). At every 450 rotation when polarized light passed through the
crystal it appears to be bright and dark alternatively. Since the crystals of Zinc-
Ovalbumin complex shows this phenomena it is said to be anisotropic.

43

44
45
Examination of micrographs of ovalbumin and the metal complex
indicates very definite change in property. Albumin crystals are found to be
isotropic. They are visible under ordinary light, but they are not visible under
polarised light. The Zn complex crystallised over microscope slide in form of
crystals of definite shape. Very beautiful hexagonal crystals are formed. These
crystals are clearly anisotropic, and seen under polarised light.
The definite change in optical property also suggests the
formation of Zn-Ovalbumin complex.
46
CONCLUSION
In this project work, a crude but simple method for preparing Zinc-
Albumin complex is obtained. The identity of the conjugate is suggested by its
properties like SEM image ,I R Spectrum and U V spectrum which are distinctly
different from corresponding observations on albumin crystallized from
ovalbumin solution.
We studied the optical properties of the complex by taking micrographs using
polarizing microscope and noted the peculiarities of complex in various stages.
Zinc albumin complex formed by mixing the respective solutions in slightly varying
proportions show formation of hexagonal crystals. Such crystals are obtained
both in presence and absence of surfactant. In presence of the surfactant, large
number of smaller crystals are formed.
We have prepared Zinc-Albumin complex with Curcumin loaded on it by simple
mixing of aqueous solutions in specific preparation on glass plate and drying .But
only very small amount of needle like crystal is obtained. The SEM image of
curcumin conjugate also shows only small change in the albumin surface.We
have not attempted any method for the purification of the prepared sample.
But the SEM image of conjugate with the drug 5-fluoro uracil shows thorough
morphology change over the surface of Albumin solid .
47
Further investigation of the properties of the complex material produced is
required to find out its applications. Generally such materials are used for drug
loading and controlled releasing. Characterisation of the curcumin loaded albumin
zinc complex can be investigated .Effective loading and releasing of curcumin on a
non toxic substrate can improve the bioavailability of curcumin and its use as a
drug.
Particle size anslysis is done for metal albumin conjugates. This is only a
preliminary level reporting of formation of particles of nano level diameter.
Further work has to be done to optimise the preparation technique and also to
obtain particles of definite size. Particles of this dimension can be put to several
applications like that for drug loading and releasing.
48
BIBLOGRAPHY
1. Hopkins, F. G., and Pinkus S. N. (1898) J. Physiol. (Land.) 23,
2. Means, A. R., Comstock, J. P., Rosenfeld, G. C., and O’Malley,
B. W. (1972) Proc. Natl. Acad. Sci. U. S. A. 69, 1146-1150
3. McReynolds, L., O’Malley, B. W., Nisbet, A. D., Fothergill, J. E.,
Givol, D., Fields, S., Robertson, M., and Brownlee, G. G. (1978)
4. Huntington JA, Stein PE (2001) Structure and properties of ovalbumin.
Journal of Chromatography B 756(1-2): 189-198.
5. Protein sequencing and characterization by M.S and Edman sequencing.
6. Nishel A.D, Saundry R.H, Moir, A.J.G, Fothergill L.A, Fothergill J.E(1981),
The Complete Amino Acid Sequence of hen ovalbumin. European Journal of
Bio-Chemistry ,115(2):335
7. Powrie, W. 1973. Chemistry of eggs and egg products. in Egg Science
and Technology, ed. W. Stadelman and O. Cotterill. Westport,
Connecticut: AVI Publishing Co. 61.-90.
8. Hardy, P. 1985. the protein amino acids. in Chemistry and
Biochemistry of the Amino Acids, ed. G. C. Barrett. London; Chapman
Hall Ltd. 6-24.
9. Lehninger, A. 1970. Biochemistry. New York, New York: Worth
Publishing.
10. MacDonnell, LR., B.E. Feeney, H.L. Hanson, A. Campbelll, T.F.
Sugihara. 1954. The functional properties of egg white proteins. Food
Technology 9: 49-53.Thakkar. H.
Copyright © 2022 FDOKUMEN