introducing computers into secondary school science teaching ...
395
THE UNIVERSITY OF HULL INTRODUCING COMPUTERS INTO SECONDARY SCHOOL SCIENCE TEACHING IN SAUDI ARABIA: TEACHERS' VIEWS, SOME PROBLEMS AND POSSIBLE SOLUTIONS being a Thesis submitted for the Degree of Doctor of Philosophy in the University of Hull by: Ibrahim Abdullah Al-Mohaissin BSc (1985), DipEd. (1987), MEd. (1989), King Abdulaziz University March 1993
-
Upload
khangminh22 -
Category
Documents
-
view
0 -
download
0
Transcript of introducing computers into secondary school science teaching ...

THE UNIVERSITY OF HULL
INTRODUCING COMPUTERS INTO SECONDARYSCHOOL SCIENCE TEACHING IN SAUDI ARABIA:
TEACHERS' VIEWS, SOME PROBLEMS ANDPOSSIBLE SOLUTIONS
being a Thesis submitted for the Degree of
Doctor of Philosophy
in the University of Hull
by:
Ibrahim Abdullah Al-MohaissinBSc (1985), DipEd. (1987), MEd. (1989), King Abdulaziz University
March 1993

Table of Contents
Table of Tables Table of Figures viiiTable of Appendices Frequent Abbreviations xiAbstract xiiAcknowledgements xiii
CHAPTER 1- 1-1INTRODUCTION TO THE STUDY 1-11.1 Introduction* 1-11.2 The Problem- 1-31.3 Objectives of the Study- 1-41.4 Overview of the Experimental Research- 1-51.5 Background to the Study: 1-61.6 Overview of The Thesis: 1-11
CHAPTER 2-OVERVIEW OF METHODS OF USING COMPUTERS FOR TEACHINGWITH SPECIAL REFERENCE TO SCIENCE 2-12.1 Introduction to the potential of the microcomputer- 2-12.2 Courses About Computer and Computing: 2-3
2.2.1 Computer Studies (CS): 2-42.2.2 Computer Literacy (CL): 2-5
2.3 Computer Assisted Learning* 2-72.4 Types of CAL and their Use for Science Teaching- 2-9
2.4.1 Programmed Learning: 2-92.4.2 Microtext: 2-122.4.3 Drill and Practice: 2-132.4.4 Tutorial: 2-152.4.5 Simulation* 2-172.4.6 Artificial Intelligence: 2-20
2.5 A Modern Position: 2-22
CHAPTER 3- 3-1REVIEW OF CAL STUDIES IN TEACHING WITH SPECIAL REFER-ENCE TO SCIENCE 3-13.1 Scope of the Review* 3-13.2 Types of Review' 3-1
3.2.1 Early Reviews- 3-23.2.2 Meta-analysis Reviews: 3-3
3.2.2.1 Reviews of the Michigan University Team (MUT): 3-43.2.2.2 Review of Florida University Team (FUT): 3-63.2.2.3 Science Subject Reviews: 3-8
3.3 Review of CAL Modern Studies in Science Teaching: 3-103.4 Problems of using CAL in science teaching* 3-193.5 The Role of Teachers in adopting CAL into Schools: 3-233.6 Summary- 3-25

CHAPTER 4- 4-1TEACHER LITERACY AND TEACHER TRAINING 4-14.1 The Significance of Teacher Training: 4-1.4.2 Content of Teacher Training Programmes: 4-4
4.2.1 Basic Training . 4-64.2.2 Familiarization and Personal Confidence Training: 4-74.2.3 Training in the Use of Computer Applications in theClassroom . 4-84.2.4 Subject Training; Practical Training for ScienceTeachers: 4-9
4.3 Influence of Teachers' Knowledge, Experience and Atti-tudes . 4-104.4 Teacher Training in Practice: 4-114.5 Information Technology Across the Curriculum: 4-154.6 The Role of Computer Studies (IT) Teacher: 4-174.7 The Needs for Pre-and In-service Training for SaudiArabian Secondary School Science Teachers: 4-17
CHAPTER 5 .• 5-1THE PRELIMINARY FIELD STUDY 5-1PART A: 5-15.1 Aim of the Study: 5-15.2 Content of the Interviews* 5-25.3 Methodology: 5-3
5.3.1 Method of Collecting Data* 5-35.3.2 The Sample* 5-35.3.3 Limitations: 5-4
5.4 Findings: 5-55.4.1 General Findings: 5-55.4.2 Special Findings . 5-6
5.4.2.1 Qualifications: 5-65.4.2.2 Characteristics' 5-65.4.2.3 Attitudes: 5-75.4.2.4 Factual Information . 5-9
5.5 Conclusion* 5-9PART B: 5-11IMPLICATIONS OF THE PRELIMINARY FIELDWORK FINDINGS 5-11.5.6 Insufficient Computer Background: •••• 55=11215.7 Shortage of Computer Education Specialists in Schools:5.8 Shortcomings of Computer Training: 5-135.9 Will Computer Studies Teachers Share with Their ScienceColleagues?: 5-155.10 Computer Machines: 5-165.11 Shortage of CAL Software: 5-16
CHAPTER 6:' 6-1GENERIC SOFTWARE AND ITS USE FOR SCIENCE TEACHING 6-16.1 Introduction: 6-1PART A: DATABASE 6-46.2 What is a Database''' . 6-46.3 Using Databases in Teaching . 6-5
11

6.4 Examples of Database use for Science . 6-106.4.1 QUEST: 6-116.4.2 The BP Energy File (BPEF): 6-18
PART B: SPREADSHEET 6-236.5 What is a Spreadsheet?: 6-236.6 Using Spreadsheets in Teaching: 6-256.7 Examples of Spreadsheet use for Science: 6-27
6.7.1 MULTIPLAN (MPLAN): 6-286.7.2 EXCEL: 6-31
PART C: OTHER APPLICATIONS 6-386.8 Wordprocessor: 6-386.9 Electronic Mail: 6-396.10 Data Logging: 6-416.11 Conclusion: 6-42
CHAPTER 7 . * 7-1CONSTRUCTION OF INSTRUMENTS FOR SAUDI ARABIAN STUDY 7-17.1 Introduction. 7-17.2 Source of the Items: 7-47.3 Setting up the Questionnaires: 7-57.4 Validity of the Questionnaires . 7-107.5 Translating the Questionnaires into Arabic: 7-127.6 Timing the Items . 7-137.7 Piloting the Questionnaires: 7-137.8 Analysis of the Pilot Study . 7-157.9 The Final Administration of the Questionnaires: 7-267.10 Setting up the Interviews: 7-30
CHAPTER 8.• 8-1RESEARCH DESIGN, ADMINISTRATION AND PRIMARY SCALEANALYSES 8-1PART: A 8-18.1 Choice and Description of the Sample: 8-18.2 Scoring the Responses: 8-128.3 Confirming the Scales: 8-138.4 Scale Reliability: 8-198.5 Factor Analysis Validity: 8-25PART B: 8-318.6 Description of Science Trainers' Sample and Scales: 8-318.7 An Official Interview: 8-378.8 Summary: 8-37
CHAPTER 9: • 9-1DATA ANALYSIS: WITHIN GROUP RELATIONSHIPS 9-1PART: A 9-19.1 Relationship Between Sample Characteristics and AttitudeScales and Items . 9-29.2 Relationship Between Sample Computer Knowledge andAttitude Scales and Items: 9-7
111

9.3 Relationship Between Science Teacher Activity and Atti-tude Scales and Items: 9-149.4 Science Teacher Factors Relations- 9-209.5 Summary: 9-23PART: B 9-279.5 Science Trainer Data Analysis: 9-27
CHAPTER 10:- 10-1COMPUTER STUDIES TEACHERS' SAMPLE AND DATA ANALYSIS 10-110.1 Selection and Description of the Sample: 10-110.2 Scoring the Responses- 10-510.3 Confirming the Scales: 10-610.4 Scale Reliability: 10-1110.5 Relationships between Variables- 10-16
10.5.1 Relationship Between Samples Characteristics andAttitude Scales- 10-1710.5.2 Relationship Between Sample Previous Training andAttitude Scales- 10-18
10.6 Discussion: 10-19
CHAPTER 11- • 11-1DISCUSSION AND SUMMARY 11-111.1 Funding Issue: 11-111.2 Hardware Issue: 11-211.3 Software Issue: 11-311.4 Samples' Computer Knowledge: 11-511.5 Samples Attitudes Toward the Introduction of Computersinto Science Teaching- 11-6
11.5.1 Science Teachers' and Advisors' Attitudes: 11-711.5.2 Science Teacher Trainers' Attitudes: 11-811.5.3 Computer Studies Teachers' Attitudes: 11-9
11.6 Variable Relationship Findings: 11-1011.6.1 Variable Relationships of Science Teachers andAdvisors: 11-1011.6.2 Variable Relationships of Science Trainers: 11-1211.6.3 Relationships of Computer Studies Teachers: 11-1311.6.4 Lack of Discrimination Between Groups in theFindings: 11-14
11.7 Lack of Computer Background and Experience: 11-1611.8 Teacher Training Issue: 11-17
CHAPTER 12:- 12-1AN APPROACH TO COMPUTER TRAINING FOR SCIENCETEACHERS IN SAUDI ARABIA 12-112.1 Introduction: 12-112.2 Selecting Training Objectives, Content and Components: 12-3
12.2.1 Objectives- 12-412.2.2 Content: 12-6
12.2.2.1 Basic Training: 12-6
iv

12.2.2.2 Familiarisation and Personal Confidence Training: 12-712.2.2.3 Training in the Use of Computer Applications inthe Science Classroom . 12-812.2.2.4 Training in the Evaluation of Teaching withComputer Software: 12-8
12.2.3 Hardware: 12-812.3 Initial Preparation of Science Teachers: 12-912.4 INSET Course Design for Science Teachers: 12-10
12.4.1 MWC Model: 12-1212.4.2 CESE Model: 12-1712.4.3 Course Structure for Science Teachers: 12-1912.4.4 Strategies to Locate the INSET . 12-26
12.5 Strategies for Pre-Service Training for Science Trainee: 12-28
REFERENCES R-1SOFTWARE REFERENCES R-13
APPENDICES A 1
1,

Table of Tables
Table No. Table Title Page
Table 1.1 Distribution of subjects through the four streams of 1-8SA secondary education
Table 3.1 Descriptive summary of CAL modern studies in science 3-12teaching
Table 3.2 Descriptive summary of modern studies on CAL in 3-13science teaching
Table 3.3 Descriptive summary of modern studies on the 3-16effectiveness of CAL in secondary level scienceteaching
Table 4.1 Sources of in-service teacher training 4-12
Table 5.1 Description of the sample by location 5-4
Table 5.2 Science teacher sample responses to possible computer 5-7uses in the classroom
Table 5.3 Science teacher sample responses to possible problems 5-8linked to the introduction of computers into scienceteaching
Table 7.1a Attitude scale name, description, number of items and 7-7typical item for each scale in the first item-pool usedin science teachers' questionnaire
Table 7.1b Personal section name, number of items and typical 7-7item for each section in the first item-pool used inscience teachers' questionnaire
Table 7.2a Attitude scale name, number of items and typical item 7-8for each scale in the first item-pool used in scienceteacher trainers' questionnaire
Table 7.2b Personal section name, number of items and typical 7-8item for each section in the first item-pool used inscience teacher trainers' questionnaire
Table 7.3a Attitude scale name, description, number of items, 7-9and typical item for each scale in the first item-poolused in Computer studies teachers' questionnaire
Table 7.3b Personal section name, number of items and typical 7-10item in the first item-pool used in computer studiesteachers' questionnaire
Table 7.4 Number of items removed and number of items replaced 7-12in each type of questionnaire

Table 7.5 Pilot study samples 7-14
Table 7.6 Descriptive statistics for pilot items of the VALUE 7-18scale in the science teachers' questionnaire
Table 7.7 Descriptive statistics for the pilot items of the BENEFIT 7-20scale in the science teachers' questionnaire
Table 7.8 Descriptive statistics for the pilot items of the 7-21TRAINING scale in the science teachers' questionnaire
Table 7.9 Descriptive statistics for the pilot items of the 7-22EFFECTIVE scale in the science teachers' questionnaire
Table 7.10 Descriptive statistics for the pilot items of the 7-24KNOWLEDGE section in the science teachers' ques-tionnaire
Table 7.11 Descriptive statistics of the pilot items of the ACTIVITY 7-25section in the science teachers' questionnaire
Table 7.12 Scales and sections rejected items; retained items and 7-26number of retained items in each scale and sectionafter pilot study analysis of the science teachers'questionnaire
Table 7.13 New items added in the final form of science teachers' 7-27questionnaire
Table 7.14 Distribution of positive and negative items in the 7-27science teachers' questionnaire four scales
Table 7.15 Number of items in each scale and section in the final 7-28form of the science teachers' questionnaire (STQ) afterpilot study analysis
Table 7.16 Number of items in each scale and section in the final 7-28form of the computer studies teachers' questionnaire(CSTQ) after pilot study analysis
Table 7.17 Number of items in each scale and section in the final 7-28form of the science teachers trainers' questionnaire(STTQ) after pilot study analysis
Table 8.1 Descriptive statistics of secondary schools and science 8-2teachers by city
Table 8.2 Descriptive statistics for sample sources 8-3
Table 8.3 Descriptive statistics of science teachers' sample by 8-4city
Table 8.4
Table 8.5
Table 8.6
Teaching subject of sample by group 8-5
Qualification of sample by group 8-6
Year of Experience of sample by group 8-7
iv A

Table 8.7 Sample Ownership of PC by group 8-7
Table 8.8 Number of sample by group who had Computer 8-7Experience
Table 8.9 Number of sample by group who had attended Computer 8-8Courses
Table 8.10 Number of sample by group who had attended courses 8-8in use of computer in teaching
Table 8.11 Descriptive statistics for "knowledge of computer" by 8-9group for the samples of STs and STAs
Table 8.12 Descriptive statistics for science teachers' sample 8-11activities
Table 8.13 Descriptive statistics of Means and Standard Deviation 8-15for the items of the VALUE scale by group
Table 8.14 Descriptive statistics of Means and Standard Deviation 8-16for the items of the BENEFIT scale by group
Table 8.15 Descriptive statistics of Means and Standard Deviation 8-17for the items of the TRAINING scale by group
Table 8.16 Descriptive statistics of Means and Standard Deviation 8-18for the items of the EFFECTIVE scale by group
Table 8.17 Possible and observed ranges and score means for 8-20the four scales of science teachers' questionnaire.Description of scales SUM also shown
Table 8.18 Scales reliability by using alpha and Spearman-Brown. 8-21The reliability of the whole of STQ (SUM) also shown
Table 8.19 Item and scale variances together with 8-22complementary-alpha values for the four science & 23teachers' questionnaire scales (30 items)
Table 8.20 Scale variances together with complementary-alpha 8-24values for the four science teachers' questionnairescales and SUM (30 items)
Table 8.21 Initial statistics for science teachers' questionnaire 8-2530 items including, factors, eigenvalue, percentage oftotal variance and total variance
Table 8.22 The science teachers' questionnaire four factors and 8-27items loaded for each factor
Table 8.23 Description of science teacher trainers sample by 8-31Universities
Table 8.24 Science trainers personal characteristics by group 8-33
1 v

Table 8.25 Descriptive statistics for knowledge of computer by 8-34group for science teacher trainers (STT) and scienceteachers (ST)
Table 8.26 Descriptive statistics of Means and Standard Deviation 8-35for the items of the science trainers questionnaire &36(STTQ) scales. Science teachers' (STQ) data alsopresented in the similar scales
Table 9.1 Relationship between sample-characteristics and the 9-3attitude scale VALUE
Table 9.2 Relationship between sample-characteristics and the 9-4attitude scale BENEFIT
Table 9.3 Relationship between sample-chara cteristics and the 9-5attitude scale EFFECTIVE
Table 9.4 Relationship between sample-computer knowledge and 9-9the attitude scale VALUE
Table 9.5 Relationship between sample-computer knowledge and 9-10the attitude scale BENEFIT
Table 9.6 Relationship between sample-computer knowledge and 9-11the attitude scale EFFECTIVE
Table 9.7 Relationship between significant TRAINING items and 9-13computer knowledge items by sample
Table 9.8 Relationship between Science Teacher-Activity and the 9-16attitude scale VALUE
Table 9.9 Relationship between Science Teacher-Activity and the 9-17attitude scale BENEFIT
Table 9.10 Relationship between science teachers' activity and 9-18the attitude scale EFFECTIVE
Table 9.11 Relationship between science teachers' activity and 9-19TRAINING attiude items
Table 9.12 Significant relationship between science tea- 9-20cher-characteristics and the factors IMPORTANT andPROBLEM
Table 9.13 Significant relationship between science teachers' 9-21computer knowledge and the factors IMPORTANT andPROBLEM
Table 9.14 Significant relationship between science teachers' 9-22activities and the factors IMPORTANT and PROBLEM
Table 9.15 Science teachers' results: summary of scales, factors 9-24and items
vi

Table 9.16 Median test exact probability between STTs' char- 9-28acteristics and attitude scales and items
Table 9.17 Median test exact probability between the STTs' 9-29computer knowledge and attitude scales and items
Table 10.1 Graphical locations of the sample of computer studies 10-2teachers.
Table 10.2 Subject specialisms of the sample. 10-3
Table 10.3 Qualifications of the sample. 10-4
Table 10.4 Years of experience for CSTs in the sample 10-4Table 10.5 Previous training of the sample 10-5Table 10.6 Descriptive statistics of frequencies, means and 10-7
standard deviations for the items of the VALUE scale
Table 10.7 Descriptive statistics of frequencies, means and 10-8standard deviations for the items of the ST.TRAINING &9scale
Table 10.8 Descriptive statistics of frequencies, means and 10-10standard deviations for the items of the TRAININGscale
Table 10.9 Possible and observed ranges and score means for 10-12the three scales of computer studies teachers'questionnaire. Description of scales SUM also. shown
Table 10.10 Scales reliability by using alpha and equal length 10-12Spearman-Brown. The reliability of the whole of CSTQ(SUM) also shown
Table 10.11 scale correlation coefficients for the CSTQ scales and 10-13SUM
Table 10.12 Item correlation for the scale VALUE. Item relation to 10-13the whole scale (Total) also shown
Table 10.13 The complementary-alpha values for the three scales 10-15of the computer studies teachers' questionnaire (25items)
Table 10.14 Result of t-tests for the scales VALUE, ST.TRAINING, 10-18TRAINING and groups formed accorded to personalcharacteristics
Table 10.15 Result of t-tests for the scales VALUE, ST.TRAINING, 10-19TRAINING and groups formed accorded to previoustraining
Table 12.1 CESE model 12-18
vii

Table of Figures
Figure No. Figure Title Page
Figure 1.1 Distribution of the weekly classes in the first year 1-9of the new secondary education system
Figure 3.1 The relationship between year of publication and 3-15number of CAL studies
Figure 6.1 QUEST main commands 6-12
Figure 6.2 VALUES screen after infiling the database PTABLE 6-13
Figure 6.3 Full information about the element number 1 6-14
Figure 6.4 The first eight elements with a valency of 3 6-15
Figure 6.5 Some 'ancient elements 6-17
Figure 6.6 The main menu of the BP database 6-19
Figure 6.7 BP options 6-19
Figure 6.8 Middle East oil used 1977-1988 6-20
Figure 6.9 Example of MPLAN tables 6-29
Figure 6.10 Example of MPLAN using calculation facility 6-30
Figure 6.11 Meter readings on the 1st August 1992 6730
Figure 6.12 Excel main menu. 6-32
Figure 6.13 Different options of Excel. 6-33
Figure 6.14 Spreadsheet input: Name, Mass, Length, Width, 6-35Height and output: Volume and Density of 10material blockes.
Figure 6.15 Excel chart shows Density by material 6-36
Figure 7.1 Distribution of positive and negative items for the 7-27four scales of the science teachers' questionnaire
Figure 8.1 Distribution of secondary schools by city 8-2
Figure 8.2 Distribution of science teachers by city 8-2
Figure 8.3 Distribution of original and selected schools 8-3
Figure 8.4 Distribution of original and selected science 8-3teachers
Figure 8.5 Distribution of subjects of science teachers' sample 8-6
Figure 8.6 Distribution of subjects of science advisors' sample 8-6
Figure 8.7 Area distribution for active and non-active groups 8-12in the science teachers' data
viii

Figure 8.8a Factor loading plots for the items using factors 8-291 and 2 as the coordinates
Figure 8.8b Factor loading plots for the items using factors 8-293 and 4 as the coordinates
Figure 10.1 Distribution of distributed and returned ques- 10-2tionnaires by city.
Figure 10.2 Subject distribution of the sample. 10-3
Figure 10.3 Qualification distribution of the sample. 10-4
Figure 11.1 Al-alamiah Arabic Windows 11-4Figure 12.1 MWC model 12-13
& 14Figure 12.2 Proposed INSET course design for science teachers 12-21
Figure 12.3 Proposed pre-service course design for science 12-30teacher trainees
ix

Table of Appendices
APPENDIX A: SYLLABUSES OF COMPUTER COURSES
APPENDIX B: THE 47 MODERN CAL STUDIES IN SCIENCE TEACHING
APPENDIX C: INTERVIEW SCHEDULES
APPENDIX D: APPROVAL LETTER
APPENDIX E: QUESTIONNAIRES
APPENDIX F: FACTOR ANALYSIS
APPENDIX G: INTERVIEW WITH DR\ SAEED AL-MALLAIS VICE ASSISTANT
MINISTER FOR EDUCATIONAL DEVELOPMENTON 10th FEB 1992
11.00-11.45 am
APPENDIX H: INTER-ITEM CORRELATIONS FOR CSTQ SCALES
x

Frequent Abbreviations
CAL Computer Assisted Learning
CBL Computer Based Learning
CESE Computer to Enhance Science Education Course
CSTQ Computer Studies Teachers Questionnaire
DSS Developmental Secondary School
INSET In Service Training
IT Information Technology
MCW Microworlds Course
NCET National Council for Educational Technology
NDPCAL National Development Programme for CAL
NEA National Education Association
NSB National Science Board
NSF National Science Foundation
SA Kingdom of Saudi Arabia
STQ Science Teachers Questionnaire
STTQ Science Teacher Trainers Questionnaire
NFER National Foundation for Educational Research in England and
Wales
xi

Abstract
The main aims of the study were to investigate the possibility ofintroducing computers for science teaching into Saudi Arabian secondaryeducation, to identify problems which might attend their introduction, andto suggest possible solutions.
A preliminary study was carried out in March and April 1991. Interviewschedules were used to interview 17 science teachers, 7 computer studiesteachers and 3 trainers. The findings of this study were used to confirmthe structure and scope of the main study.
The main study was carried out between January and April 1992. 266science teachers (ST), 15 science advisors (STA), 16 science teachertrainers (STT), and 38 computer studies teachers (CST) were included inthe study.
Each of the four samples showed strongly favourable attitudes towardthe introduction of computers into the science classroom. On the otherhand lack of awareness about using computers to aid science teachingwas detected among the three science samples.
The findings of STs showed that the ownership of a personal computer(PC) is the strongest related variable to attitudes toward the introductionof computers into science teaching. Other variables significantly relatedto most of the scales and factors, included iA19 14of experience, and computerknowledge. Few science teachers' activities show significant relationshipswith their attitudes generally.
The findings of STTs showed that the ownership of PC and knowledgeabout wordprocessors in teaching were significantly related to attitudes.Little relationship between computer knowledge and attitudes was found.
No significant relationships were found between any variable andattitudes for both STAs and CSTs samples.
The final two chapters conclude with some problems facing theintroduction of computers into Saudi Arabian secondary school scienceteaching, with suggestions for proposed course-design for science teachers,science teacher trainees and science trainers. Some other features relatedto teachers' computer training are also covered.
xii

Acknowledgements
First of all, I must thank Allah (the God), without his help and
assistance I would not have been able to do this study.
I would like to thank my supervisor, Dr Jeff Moore, for his professional
help, advice and friendly attitude throughout the study. He has been
unstinting in his time and support.
I wish to express my gratitude to Saudi and English teachers, advisors,
trainees and trainers who responded to one or more of the study
instruments, and to the Saudi Arabian Vice Assistant Minister For Edu-
cational Development, Dr Saeed Al-Mallais for the interview and for
providing the study with up to date information and details of policy.
Without their help, this study would not have been completed.
I am grateful to many people, too numerous to mention, who in one
way or another supported me during my study period. I am particularly
thank Mr Mohammed Afifi and Dr Abdullah Hafiz for their help in the pilot
study; and to Mrs Rosamund Sutherland for providing me with complete
references of the MWC project. Many friends and colleagues in Saudi
Arabia and the United Kingdom have generously given me time in the
course of my study, I thank them one and all.
I should not forget the kind support that I have received from my
parents, brothers and sisters throughout my education.
Finally, my special and deepest thanks to my wife Souad and children,
who, if they did not always understand what I was doing, gave me theencouragement and impetus to complete the study.

CHAPTER 1::INTRODUCTION TO THE S TUDY
1.1 Introduction:
This study describes an investigation into the possibility of intro-
ducing computers for science teaching into Saudi Arabian secondary
education, identifying problems which might attend their introduction,
and suggesting possible solutions.
The Kingdom of Saudi Arabia (SA) is a developing country which has
attached great importance to the use of computers in education. The
introduction of computers to assist teaching is however, a radical step
which needs careful policy-making with reference to the costs of intro-
duction, choice of appropriate hardware and software, teacher training,
etc. (Mindura, 1991)
The 1985 Developmental Secondary School (DSS) project was accom-
panied by the introduction of microcomputers and computer courses into
Saudi Arabian secondary education. At that time the Minister of Education,
Abdulaziz Alkhuwaiter, said, "Expanding the use of computers in our
schools is one of the most important tools for transferring technology to
our country. We should prepare our society to keep up with advanced
technology. I am sure that computers will help our people to achieve this
important target." (Alkhuwaiter, 1984)
1-1

The current Secondary Schools Project SSP (1992) which has replaced
the DSS, has retained and expanded the computer courses. The introduction
of twice-weekly computer classes at all secondary school levels reflects
the continued interest on the part of the Ministry of Education in enhancing
computer knowledge among pupils. More than 8000 computers have been
installed in secondary schools throughout the Kingdom during the session
1992-1993 (Al Riyadh, 1992a).
In 1990 the Fifth Development Plan (FDP) 1990-1995 for the Kingdom
of Saudi Arabia confirmed the importance of computers in education for
all educational levels. The plan stated that "to improve the quality of
educational instruction, computer education will be introduced as an
integral part of the curriculum at the intermediate level, and as an
awareness programme at the elementary level." (FDP, 1990-1995, p. 266)
The FDP also stressed the importance of changes in teaching methods
to utilize modern teaching aids for developing the pupils' skills. It stated
that, "Notwithstanding the changes introduced into the general education
curriculum by the Educational Development Centre, it is imperative to
adopt modern teaching methods which emphasize understanding, derivation
and problem solving ... Improvements will be introduced into the curriculum
and in teaching methods which encourage the development of pro-
blem-solving skills and creativity." (FDP, p260 &, p. 266)
1-2

Many studies' have shown the power of computers for developing
pupils' skills and achieving a variety of educational objectives such as:
developing problem-solving, thinking and information skills, and improving
pupils' attitudes toward science. For example, Cachapuz, et al. (1991)
pointed out that "The crisis in schools and teaching, ... is complicated
and widespread, but one step towards a solution may be the rapid
introduction of personal computers into schools. ... this will give the
students new skills, skills that are necessary in international competition
for markets and jobs. It will also make the teaching more interesting and
creative." (p. 417)
1.2 The Problem:
The SA government has given computer education a great deal of
support and priority. In recent years they have spent a large amount of
money on computer machines and equipment for secondary school education.
"Computers have been given continued and unlimited support by the
government," said Alzaid, the director of the Western Province General
Educational Authority, on opening a new computer department in a school
in Jeddah. (Alzaid, 1990). Moreover, the Ministry of Education has recently
established the National Society for Computers and their Use. The main
objective of this society is to promote better use of computers in secondary
education (Al Riyadh, 1992b).
1 ' A review of these studies is carried out in Chapters 2, 3 and 6.
1-3

However, despite this government interest in and support for computer
education, computer facilities are still used only for computer studies
purposes. The use of the computer to aid subject teaching has not yet
been fully recognized or approached. With this in mind, this study was
designed to investigate the possibility of obtaining greater benefit from
the computer facilities available in secondary schools by using them to
aid science teaching. The study focuses on problems and suggests possible
solutions.
As part of this work, the computer provision in SA secondary schools
was surveyed and the attitudes of science and computer studies teachers,
science advisors, and science trainers, toward the introduction and use
of computers for science teaching in SA secondary education were examined.
The data collected from SA were used to highlight the problems which
may arise when computers are introduced into SA secondary school science
teaching. The data have also been used to suggest solutions to some
problems and to propose an approach to computer training for science
teachers in secondary schools.
1.3 Objectives of the Study:
As mentioned above, the main aim of this study was to examine the
prospect of the introduction of computers into SA secondary school science
teaching, determining problems and suggesting possible solutions. It was
designed to focus on the people and provisions which may affect this
introduction. Thus, the following specific objectives were identified:
1-4

1) to carry out a review of the recent literature on the use of
computers for science teaching in an industrial society;
2) to conduct a field survey of computer provision and services in
SA secondary schools;
3) to assess attitudes to the introduction of computers into science
classrooms among those Saudi Arabian educators who are involved
in science teaching;
4) to identify problems facing the introduction of computers into SA
secondary school science teaching; and, following from 3) and 4)
5) to suggest possible solutions to any problems facing the introduction
of computers into SA science teaching, and to propose an approach
to facilitate science teacher training.
1.4 Overview of the Ex perimental Research:
The field work was limited to what could be achieved by one person
in a period of three months' field study.
The schools were selected from the three main cities of SA: Riyadh,
Jeddah, and Madinah. The samples of science and computer studies teachers
comprised all those teaching at secondary schools in these cities, who
were provided with computers. The science advisors' sample included
advisors from the LEAs based in the three cities, while all science teacher
trainers in all SA universities were also consulted.
The research involved three field studies in SA: the preliminary,
pilot, and main study. Seven instruments were used for the field work:
1-5

a) Three interview schedules were used in the preliminary field study
for consulting science teachers and advisors, computer teachers,
and science trainers.
b) Three types of questionnaire were used in the main field study
for collecting data from science teachers and advisors, computer
teachers, and science trainers.
c) In the main study, an interview schedule was used at a meeting
with a senior official in the Ministry of Education.
1.5 Background to the Study:
The Saudi Arabian Ministry of Education (MOE) is the official
organization supervising the education of male students throughout the
Kingdom. It was established in 1952 for the purpose of planning and
supervising a project aimed at the provision of general education'
everywhere in the Kingdom (Al-Zaid, 1982). Similarly, the Presidency of
Girls' Education supervises the general education of female students.
The most obvious characteristic of the educational system in SA, other
than the separation between boys and girls, is its very tight centralization,
with all aspects being subject to central control, with policy matters being
legislated by the Higher Council of Education. Curricula, syllabuses and
textbooks are uniform across the country. Educational administration is
the responsibility of nine different government agencies throughout the
Kingdom. (Al-Eissa, 1988)
1. General education includes the elementary, intermediate and secondary stages of edu-
cation.
1-6

The secondary stage consists of three years from grades 10 to 12.
It has special characteristics because of the age of pupils and the related
stresses of their education (Al-Zaid, 1982). Secondary education, like all
general education, is free for all Saudi and non-Saudi residents. The
intermediate school certificate is the only requirement in order to attend
secondary schools. At the end, pupils receive a general secondary cer-
tificate.
In the ordinary secondary school system, after the first year pupils
attending these schools may specialize in science or the arts, they receive
their certificate in that area.
The Developmental Secondary School (DSS) was a new type of secondary
school education, evolved as a result of the decision to adopt the Credit
Hour System, aiming to provide skills and knowledge adapted to students'
individual differences (Alzahrany, 1989). Some of the aims of DSS were:
a) to expand the scope of secondary education to include new curricula
and programmes more in keeping with the perceived demands of modern
Saudi society;
b) to prepare secondary school pupils for their careers and help
them to participate effectively in the developmental plans of Saudi society
by providing them with the appropriate training;
c) to prepare pupils for further and higher education in their chosen
fields of study (Ministry of Education, 1986).
1-7

There are four fields of study, Islamic and Arabic Studies, Management
and Social Science, Physics and Mathematics, and Chemistry and Biology
(Table 1.1). The same objectives and fields of study, and almost identical
curicula, have been retained for the 1992 Secondary Schools Project (SSP)
which has replaced the Credit Hour System with the Typical Year System.
Knowledge Subject
bodies Islamic & Manage. Physics Chemist. &Arabic Studies & Soc. St. & Math. Biology
Religion 46 18 18 18Arabic 40 14 14 14Soc. Science 26 30 8 8Science 9 9 53 61Mathematics 5 17 35 31English 8 8 8 8Computers 5 8 5 5Statistics 6 6 4 -Management - 35 - -Sport 3 3 3 3Draft 3 3 3 3
Total 151 151 151 151
Table 1.1 Distribution of subjects through the four streams of SAsecondary education
Computing, as a subject in its own right, was introduced as early
as 1985, and then for boys' secondary education only. The DSS included
three computer courses, accounting for 7.46 % of the whole curriculum.
These courses were: Introduction to Computers, Introduction to Pro-
gramming (BASIC language), and Computer Programming and Introduction
to Information Systems (the contents of the three courses are outlined
in Appendix A). These courses were distributed among the three years
of the new secondary school system (Almallais, 1991).
1-8

Science (18.2%)Arabic language (18.2%
Social studies (15.2%) N...,
'-Mathematics (15.2%)Sport (3.0%)
Computers (6.1%) .
The first compulsory year in the new system (SSP) involves two
weekly computer classes, accounting for 6.1 % of the whole first year
curriculum (Figure 1.1). The classes focuses on the introduction to
computers.
English (12.1%) Religion (12.1%)
Figure 1.1 Distribution of the weekly classes in the first year of thenew secondary education system (Source: Ministry of Education, 1992)
Table 1.1 and Figure 1.1 show that Science and Arabic have been
given the greatest priority in secondary education. Although secondary
education is concerned with only four science subjects, half of the choices
of subject field given to the pupils are science subjects. 35 % and 40 %
1-9

of the whole curriculum of the two science streams are science subjects.
The total science subjects account for about 20 % of the whole secondary
education curriculum.
The balance of science subjects in the secondary schools is reflected
in the large number of science teachers employed across the Kingdom.
There are 2013 science teachers in a total staff of 9327; in other words,
one teacher in five is a specialist in one or more science subjects (Centre
of Statistical Data 8E. Educational Documentation, 1992).
The nature of school science is also important. Computers have become
an essential part of science teaching in the industrial countries. A wide
range of educational software is available for various science subjects'.
Professor R. Lewis, (the director of the Lancaster Institute for Educational
Computing), claimed in 1984 that "the potential value of computers in
science education is great, and it may not be long before they are
considered as essential as the microscope and the oscilloscope are now."
(Kahn, 1985)
In addition, the SA Ministry of Education has always recognized
science and mathematics as the subjects most closely allied to computers,
this explains the greater priority that has been given to encouraging
science and mathematic teachers to teach computer courses.
1 • Computer uses for science teaching will described in the next chapter and Chapter 6.
1-10

For example, in 1992 Riyadh LEA invited only science and mathematics
teachers to attend computer courses which qualified them to become
computer studies teachers (AL Riyadh, 1991).
1.6 Overview of The Thesis:
The remainder of this study comprises eleven chapters, as follows:
Chapters 2, 3 and 4 present the theoretical background to the study.
Chapter 2 summarises the historical background to the introduction of
computers into schools and various uses of computers for science teaching.
A survey of the literature and problems relevant to the use of CAL in
science teaching is presented in Chapter 3. Chapter 4 describes how
teachers can be trained to use computers in their classrooms.
Chapter 5 discuses the preliminary study in Saudi Arabia. The first
part of the chapter presents the instruments and the results of the study,
while the second part gives some implications of the study.
The use of generic software, databases and spreadsheets in science
teaching is explained in Chapter 6. Wordprocessors, electronic mail and
datalogging are briefly presented in this chapter.
The main field work, the empirical study, is discussed in detail in
Chapters 7 to 10. Chapter 7 describes how the main instruments were
constructed. The Saudi Arabia pilot study and its results are also given
in this chapter. The research design and methodology are described fully
in Chapter 8, this includes data on the 266 science teachers, 15 science
advisors and 16 science trainers who constituted the samples. The reliability

and validity of the questionnaires are also discussed in this chapter.
Data analyses and relationships between variables of science teachers,
advisors, trainers and computer studies teachers are presented and
described in Chapters 9 and 10. Chapter 9 describes how the data of
science teachers, advisors and trainers were analysed to examine rela-
tionships between sample variables and attitudes toward the use and
introduction of computers into the science classroom. Statistical tables of
the relationships between the scales and sample characteristics and
background are also presented in this chapter. Chapter 10 summarises
and analyses the responses given by 38 computer studies teachers.
Chapter 11 contains a discussion of the findings of the empirical
study. Some problems facing the introduction of computers into Saudi
Arabian secondary school science teaching are indicated in this chapter.
The study concludes in Chapter 12 with suggestions for course-design
for science teachers, science teacher trainees and science trainers. Some
other features related to teachers' computer training are also brought
together in this chapter.
1-12

CHAPTER 2::CYV E Ftv- i EW c.-) E- m aim c, r) s (Dl? US T ksTGCOMPUTERS FOR TEACHING WITHSPECIAL REFERENCE TO SCIENCE
This chapter concerns the historical background of the literature
presented in the next chapter. The intention is to give an account of the
development of using computers for science teaching.
2.1 Introduction to the potential of the microcomputer:
"Only a hundred years ago, the very idea that a machine could be
built to execute calculations was treated with ridicule and scorn." (Megarry,
1983, p.15)
Professor Tom Kilburn ran the first stoek control programme on an
experimental computer built by Manchester University in June 1948. The
machine was big and weighed more than 60 000 pounds because it consisted
of a series of metal office storage cabinets full of glass valves.
Initially, programs were written to test specific hypotheses, just as
the early attempts at programming computers to play chess tried to specify
in advance what strategies were to be followed (Hofstadter, 1979).
The major technological innovation which has been heralded as the
`computer revolution', is the development of the microcomputer in which
all the processing functions are built into a single silicon chip. A
microcomputer is simply a computer system whose central processing unit
2-1

is a microprocessor. Computers, which had previously been expensive and
occupied a large amount of space, were suddenly available at relatively
low cost and become very much smaller in size. This marked the advent
of the 'personal computer' (pc) (Terry, 1984).
Consequently it became convenient to consider using computers in a
wide range of fields and applications. Medicine, the banks, the military,
the share market and supermarkets are all being significantly affected
by the computer. At the same time, businesses are changing to computer
control and we are experiencing changes in the way information is
generated, stored and transmitted. This revolution has taken place in a
very short time. Educationists, like everyone else, have had visions of
using these machines to make their jobs easier and to improve their
product: 'educated children'.
Since the appearance of microcomputers, their use has gradually
spread throughout the educational system (Ellington, 1989). In the earliest
stage of the computer in schools, educators tried to consider how best
to benefit from this new innovation, which cost more than any previous
teaching aid. From an early stage, it appeared that computers could
influence what is taught, how it is taught and who is taught. Therefore,
as early as 1962, educators tried to guess the educational implications of
computing for both teachers and students.
The ideas at the time were that society requires that every citizen
must make judgments about risk and need, and such ideas involved far
more abstract and scientifically sophisticated consideration than even a
2-2

decade previously. How is one to take a stand on the proper use of new
technology in education, medicine, genetic engineering, public services,
and so on? As a basis for decision making public education must provide
a foundation for all children that can allow them to cope with scientific
and technological development (Disessa, 1987). It has been said that:
"The present and future generations of pupils need educationgeared to what is likely to face them on leaving school...Education therefore has to take account of the new technologiesand use them appropriately. It has to prepare pupils for life.,... It also has to educate them about some of the implicationsof the facilities which are, or soon will be, available if notcommonplace. Just as computers have become an accepted partof life outside school, at work, in the home and for leisure,they have a part to play in the process of education itself."(Williams & Maclean, no date, p. 2-3)
It has been predicted that computers will bring about widespread
and fundamental changes in schools, will change the curriculum, and bring
about a new role for the teaching profession.
2.2 Courses About Computer and Computing:
The late 1960s and early 1970s saw the introduction of computers
into the school curriculum and an increasing variety of courses. The
introduction of computers in schools was intended to prepare pupils for:
a) living in the world of tomorrow,
b) working in the world of tomorrow.
The early idea was to study computers as part of the new technology,
but most teachers regarded it as a branch of mathematics, so the main
response to the call to teach programming was from those with mathematical
ability. It was easy for mathematics teachers to transfer their teaching
2-3

of binary arithmetic and logic to a computer context and to add on some
programming. The link was a misconception, since there is little relationship
between mathematics and the use of computers in education.
According to Ogborn (1986), the introduction of computers into schools
was aimed at three broad groups of uses:
a) the computer used "as a computer" running a language such as
BASIC, LOGO or PROLOG.
b) the computer running a program written with a specific educational
purpose such as Drill and Practice, Simulation, etc.
c) the computer running a general applications program such as a
database, spreadsheet, etc.
The current chapter discusses the first group briefly and the second
group extensively, while the general applications of computers and their
implication for science teaching will be addressed later in Chapter 6.
2.2.1 Computer Studies (CS):
Knowledge about computers in contrast with knowledge about the use
of computers, begins with instruction in the operation of a computer and
how it works. When computers first came into schools, it was suggested
that pupils must understand what are the components of a computer
system, how to turn the computer on and off, and how to load a program.
Some instruction in basic keyboarding was deemed necessary, and pupils
were expected to have a general understanding of how a computer program
2-4

works. The study of these issues in relation to the storage and processing
of data became known as Computer Studies. This was a minority subject
for older and generally more able pupils.
In the UK, during the 1980s, Computer Studies (CS) was offered as
a two-year specialist course dealing with the operation and application
of computers, leading to CSE (Certification of Secondary Education)
examination. Some schools had a policy of restricting the choice of CS to
the most able pupils. The CS syllabus consisted of: preparing a substantial
project, writing some BASIC programs, a study of computer hardware and
software, the commercial and industrial applications of computers and
social effects of computer use (Moore, 1989).
2.2.2 Computer Literacy (CL):
The term Computer Literacy (also known as Computer Awareness) is
easy to use but more difficult to define. It is not the same as programming
but does indicate understanding of the range of what computers can do
and of how they do it. This understanding comes preferably from practical
experience of the computer itself in various ways, including the applications
of programs and high-level languages, and probably a small amount of
programming. Computer Literacy also includes understanding the effects
of the use of technology on the way information is utilized and of the
role of the computer in a changing society (Allen, 1983). Computer Literacy
therefore, might be seen as comprising the elements: knowledge about
computers, knowledge of computer techniques, and knowledge about the
social consequences of using computers.
2-5

The aim of Computer Literacy was to expand the study of computers
to more pupils and to introduce more dimensions of computer applications
in order to extend awareness of computers to the whole of society.
"No book on computers in education would be complete withouta discussion of the question: what is computer literacy? Surely,it is a goal of every school program to prepare students tolive in a society where computers will affect nearly every areaof life, and where an estimated 75 percent of all jobs willinvolve computers in a some way." (Naisbitt, 1982, p. 36)
There were some interesting projects for computer literacy during
the seventies, for example, in the UK, Computer Awareness For All (1972),
published by the National Computer Centre Limited. Later projects included:
BBC Computer Literacy (1984), and Computer Literacy for Further Edu-
cational Colleges (1984). These projects aimed to enhance understanding
of the concept of computer literacy and to make it an essential part of
curriculum provision.
The main difference between CS and CL courses was that CS is an
examination course for relatively few pupils, whilst CL is a study for all
pupils and not examined.
The early introduction of computers into schools was aimed at preparing
pupils to live and work in a technological society. It was only learning
about computers and their use. Few teachers other than computer studies
specialists expressed interest in computers as a school resource. In many
schools this indifference enabled the computer studies departments to
establish themselves as the rightful place for computers. But, in the early
and mid 1980s, there was increasing consideration among the educators
2-6

that the computer is a resource applicable to aid subject teaching in
addition to learning specific computer courses; the move was towards
integrating computers into all school subjects rather than restricting them
to one.
Learning about computer use in special courses, such as CS and CL
is not the substance of the current thesis. This thesis is concerned with
the use of computers to aid science teaching; the contribution of computers
to science teaching and their demands on science teachers' attitudes and
training. The remainder of this chapter and Chapter 6 describe various
uses of computers to aid science teaching, while issues related to teacher
literacy and training are highlighted in Chapter 4.
2.3 Computer Assisted Learning:
Computer Assisted Learning (CAL) or Computer Based Learning (CBL),
in contrast with CS and CL, uses the power and facilities of the computer
as a tool to aid learning, just as industry uses computers as a tool for
its purposes. The aim of CAL is to use computer technology to help pupils
learn more effectively.
CAL is perhaps the most overused term current in the field of
educational computing. Almost every piece of software bears the CAL label,
while every approach featuring a computer is described as CAL. For some,
it is a term used to describe one category of program (usually simulation)
while for others it is collective acronym for all aspects of educational
computing. CAL probably includes all these things and more (Wild, 1988).
2-7

For the purpose of this study, CAL will be defined as: "the use of
specifically-written or special purpose computer software inside the
classroom to aid teaching". This definition includes older types of computer
use such as Programmed Learning, Drill and Practice, Tutorial; as well as
more modern types such as Simulation, Games, Artificial Intelligence. The
use of non-specific computer software such as generic computer appli-
cations is deliberately excluded from this definition.
Teachers spend a lot of time involved in administrative matters such
as pupils' records, tests, and lesson plans. Nowadays, computers can do
all these jobs for teachers easily and quickly. Using computers to carry
out these jobs gives the teacher extra time to deal with the pupils and
to advance the quality of their teaching work. This, of course, will improve
teaching in an indirect way. However, computer administration is not
specifically related to science teaching, therefore it will be excluded from
the study.
Hudson (1984) described CAL as a breaking down of the information
and skills into small pieces and claimed that it gives the opportunity for
pupils to work at the learning task in simple, achievable stages. He claimed
that CAL requires the application of two principal skills:
a) the ability to break down large bodies of information into smaller
and smaller quanta of conceptual steps;
b) an ability to reconstruct the items in interesting, imaginative and
relevant ways by means of well-written and well-presented frames.
2-8

There has been much confusion between the terms CAL and CAI
(Computer Assisted Instruction), because some literature has leaned heavily
upon the USA experience, where the term CAI tends to be used, whilst
the term CAL is used in the UK. Another reason for this confusion is that
the early work in educational computing often followed the 'programmed
learning' path of the sixties, which was instruction rather than learning.
CAL stemmed and developed from a different educational philosophy,
and has always followed changes in cognitive learning theories, since the
majority of CAL types in schools adopt psychologists' ideas. Thus, different
types of CAL stem from different educational theories.
In the classic form of CAL based on Skinner's ideas, the computer
presents the student with a piece of text which is followed by one or
more questions. These are usually of the multiple-choice type. The following
section gives further explanation of the old and modern types of CAL.
2.4 Types of CAL and their Use for Science Teaching:
2.4.1 Programmed Learning:
The question of the use of computers in education arose for the first
time in the United States as a result of psychologists' research and ideas
on programmed learning (PL). It was suggested that learning occurs when
a specific response from a learner has been elicited in response to a
particular stimulus in a given situation. In effect, this meant providing
children with a linear learning sequence and continual reinforcement.
These ideas derived from behavioural psychology led to the design of
individual PL systems.
2-9

According to the ideas of PL, teaching then becomes simply the
arrangement of contingencies of reinforcement. The important event is
considered to be positive reinforcement, which should follow only the
occurrence of desired behaviour. The main contribution of PL to education
was its emphasis on the importance of feedback and individuality. From
the beginning, followers of this school of psychology contended that
effective linear programming required mechanisation. Early behaviourists
were supposed to be able to compare the student's response with the
required answer, but given their reliance on push-buttons, this often
restricted the kinds of answer that could be required, or demanded that
the students should evaluate their responses for themselves (O'Shea 8E.
Self, 1988).
PL systems for science teaching were written by teams of science
teachers, programmers and educators. The systems involved pictures,
graphs and also laboratory work. It was claimed that student-computer
'dialogue' is better than a written instruction which the students just
follow without any responses or interaction. So a change could be made
to a linear program using the students' responses to control the material
they see next. For example, to build a lesson in Logo:
120 MAKVANSWER ASK [WHAT IS THE REAGENT
REQUIRED FOR THIS REACTION:
C6H6---C6H5BR]
2-10

121 IF EQUALQ :ANSWER [FE AND BR2] THEN
PRINT 'YES AND GO 130
122 IF EQUALQ :ANSWER [BR2] THEN
SAY [YOU ALSO NEED SOME FE] AND GO 120
123 SAY [THIS IS AN ELECTROPHILIC
PROMINATION]
124 GO 120
130
The 120 simply labels the frame. If the student responds correctly
(line 120), the program GOes to the next frame (label 130), as with linear
programs. If he responds wrongly (e.g. BR2), he receives an appropriate
explanation or suggestion and is retested on the current frame until the
desired responses is reached (O'Shea & Self, 1988).
In 1971 the National Science Foundation of America (NSF) decided to
invest $10 millions over five years in two demonstrations of use of
computers in education: the TICCIT and PLATO projects. These two projects
involved PL in high level command languages. The main aim of TICCIT
(Time-shared Instructive Computer Controlled Information Television) was
to demonstrate that CAL could provide better instruction at less cost than
traditional instruction. It was designed to be used as the main source
for the delivery and control of instruction. PLATO (Programmed Logic for
2-11

Automatic Teaching Operation) aimed to demonstrate the technical feasibility
of CAL and to develop curricula materials acceptable to instructors and
students.
2.4.2 Microtext:
Microtext (MT) was an extension of one aspect of PL. It is an author
language, allowing the writer, and perhaps the user to create on screen
a page of text and/or graphs of the sort seen on a Teletext TV, without
having to follow complicated programming procedures.
MT can be introduced to the classroom in two different ways: either
by allowing the pupils to create their own text or by introducing a
pre-prepared curriculum text to be followed and studied by pupils. The
author can incorporate different colours and designs in the text.
- The idea of MT was to involve an individual pupil in the process of
deciding progress from one frame to another and allowing him to develop
planned programs in a relatively easy language.
Examples of linear programming, PL and MT both emphasise the
importance of systematic presentation, and assume that the learner gives
precedence to the task over his own activity. Both tend to treat the
learner as a 'blank format'. They are concerned with the capability of
instruction' rather than the effectiveness of 'learning', seeing the process
of learning as a gain of 'knowledge' rather than 'experience and neglecting
the attitudinal and emotional aspects. Both tend to ask the learner to
follow instructions and to do what he is 'expected' to do rather than allow
2-12

him to offer his own interpretations.
2.4.3 Drill and Practice:
After some applications of PL, the problem was to find a more effective
approach than PL ideas. Ideas were adopted from arithmetic teaching,
using the computer to present a new kind of learning: 'learning' rather
than 'instruction', and 'training' rather than 'education'.
In Drill and Practice (D&P) lessons, the pupils are presented with a
structured succession of exercise questions designed to give them practice
in specific subjects. These questions can be written into a CAL package,
drawn at random from a collection of suitable questions called an item
bank, or generated within the CAL program. The program is able to provide
reasonable random values for the calculation and then determine the
correct result to check the pupils' answers. The sequence of examples
can be arranged so as to provide questions of prespecified difficulty, or
be graded in severity (Terry, 1984). The following example shows the
dialogue with a D&P program (Palmer and Oldehoeft, 1975).
FIND THE EQUATION OF A LINE WITH SLOPE 10 AND Y-INTERCEPT 2.
Y=10*X+2
GOOD. LET'S TRY ANOTHER PROBLEM.
FIND THE EQUATION OF A LINE WITH SLOPE 5 AND PASSING THROUGH
(10, -5).
Y=5 *X-45
THAT'S INCORRECT. LETS TRACE THROUGH THE SOLUTION OF THE
2-13

PROBLEM TOGETHER.
STEP 1:FIND THE Y-INTERCEPT BY
5= (-5- Y - INT ERCE PT)/10 4 -5 (.1 ° ) + (- 5) = Y - 1NT ERCEPT 4 V -INT ERCEPT -55
STEP 2:STOP
OKAY. LET'S TRY ANOTHER PROBLEM.
GOOD.
•••
.THAT'S VERY GOOD
•
After their illustration, Palmer and Oldehoeft (1975) claimed that no
further significant development seemed possible other than the use of
new modes of presentation, such as graphics. It was a limited approach,
they said.
One major question about using D&P was how it could be used to
teach some fields and topics; for example, the history of science, discovery
of penicillin and so on. If we could put different sorts of problems in a
logical order of difficulty, then we might be able to write a D&P; otherwise,
probably not...
2-14

2.4.4 Tutorial:
The demands on the learner made by a tutorial program may range
from simply following a sequence of actions which have been pre-specified
by the author, to executing complex decision procedures that attempt to
take into account a student model and course objectives. Since the authors
of tutorial programs are responsible not only for specifying the material
to be presented in each frame, but also for deciding which frame should
be presented next, it is also necessary to set up an equally laborious
tuning process (O'Shea & Self, 1988).
Many tutorial programs are content-centred, owing much to the work
of the cognitive psychologists Bruner and Ausubel (Hartley, 1981). The
original aim of tutorial programs was not only to test content and
understanding of certain key issues, but also to use the program as a
platform for discussion of wider issues that could not be predetermined
as a set of instructional objectives. The subject allowed the author to
provide a context for a more open-ended teaching strategy using the
author language PILOT (Beynon, 1985).
Tutorial involves more independent flexible tasks than D&P. It can
give the student more than one instructional path. For example, the
SCHOLAR tutorial generated a subtopic on an essentially random basis.
The science teacher, for instance, might specify the topic of 'Nuclear
Physics', and SCHOLAR would select a subtopic like 'Nuclear Interaction',
and then perhaps a sub-subtopic, e.g. 'Division of Electrons in Uranium
Orbits'.
2-15

Each of SCHOLAR's agenda can be perceived in Clancey's(1979)
description of a lesson plan' for GUIDON. The plan could be discussed,
created by the tutor for each case. In later versions of GUIDON, a lesson
plan is generated before each case session.
The National Development Programme for CAL in the UK (NDPCAL;
1973-1977) supported a wide variety of tutorial program types and subject
applications. The programme was supported by seven government
departments, and produced 35 studies and projects. Nine of these projects
concerned engineering, mathematics, and science.
The first aim of NDPCAL was "to develop and secure the assimilation
of CAL on a regular basis at reasonable cost". The second aim was "to
make recommendations for future developments in the field and this
obviously demands the collection and presentation of information" (Tawney,
1979).
CALCHEM (CAL in Chemistry) was an example of a science tutorial
project established in 1974 within NDPCAL to produce a number of CAL
packages in chemistry. It provided training and experience in designing,
writing and testing of CAL packages in chemistry.
During the late seventies and early eighties, there was a strong sense
of the need to introduce CAL into the secondary school science classroom
because the main thrust of NDPCAL had been at the tertiary level. Questions
were asked, such as: How can we train science teachers to help the
students use CAL? How can we develop the hardware to make it suitable
2-16

for CAL? Who should publish the software?. There were, at that time, no
doubts about the value of CAL for the science classroom and laboratory,
no questions about possible weaknesses or difficulties.
2.4.5 Simulation:
One of the best known forms of CAL in science was and perhaps still
is, simulation, which has the aim of placing pupils in a situation they
could not experience at first hand, to encourage them to anticipate, and
have in mind, more than one line of enquiry.
It was thought that applications of computer simulation in the area
of education were" ... perhaps the most exciting and potentially the most
rewarding ... of all the possible applications of computers in education."
(Dowsey, 1977, p. 59) Moreover, "Positive contributions occur in the
laboratory and in the regular classroom. Students can learn independently
and very rapidly...they can really get involved in the activity of learning."
(Hounshell & Hill, 1989 p. 544)
Many of the CAL materials of direct interest to science teachers
feature simulation, and publications such as Journal of Computer Assisted
Learning (Blackwell Scientific), Journal of Computers in Mathematics and
Science Teaching (Association for the Advancement of Computer in Edu-
cation), and Journal of Research in Science Teaching (National Association
for Research in Science Teaching), contain examples (up to the late eighties)
of the classroom application of simulations across the science curriculum.
2-17

Science is about developing models of the content and processes of
the real world. Constructing a model of reality is central to scientific
activity. Computers can provide working representation of a model; one
which students can investigate and explore. This was the idea behind
introducing simulation into science teaching. Simulation programs can allow
the student to supply information to the computer about variables affecting
a process, and the program responds by changing its stored information
in ways corresponding to how we suppose changes in real variables might
affect the real phenomenon. The computer allows the student to see the
results of these changes on the screen, by printing out numbers
representing new values for the state of the system, by plotting points
on a graph, or by changing graphic elements in an image representing
the phenomenon. In this way, the students build their own understanding
of the phenomenon they are investigating (Kahn, 1985).
For example, the EQUIL simulation allows the pupil to investigate the
reaction and the equilibrium between ethanoic acid, ethanol, ethyl ethanoate
and water. In one investigation, EQUIL invites the pupil to enter the
'initial concentration' for the compounds, whilst the computer displays
the 'final concentration' in a table or a graph. If the pupil changes the
values, then the screen will change, followed by new tables and graphs.
A computer simulation may be the only way to provide pupils a chance
to see and understand scientific phenomena in the 'real' situation; deep
in the sea or high in the moon, large as the earth or small as the cell.
All of these can be displayed in the science classroom by using simulation.
2-18

With the PLANETARY MOTION ORBIT 1 and 2 simulations, the pupils
are involved in some understanding of planetary astronomy. In one task,
the program incorporates understanding of the relationship between the
radius (R) and the period (T) for a family of four planets by inviting the
pupil to enter data for R (in millions of m) and T (in days). The program
displays the results in a table and/or a graph, then asks him or her: do
you think this is the law? The pupil then changes the data until he/she
gets the law of, for example, "Kepler".
Computer simulation is the only possible way to demonstrate some
models based on many experiments, done over many years, in different
situations. Take the case of the INSULIN simulation program: it brings
together the results and theories of more than forty years of research
and investigations in one program enabling students to study them in a
very short time, compared to the traditional laboratory.
Later simulations aimed to allow pupils to make decisions, formulate
strategies and develop social skills. For example SITING AN ALUMINIUM
PLANT simulation allows the pupil to consider some factors including:
a) the source and cost of the raw material;
b) the cost of purification of the bauxite;
c the cost of transportation of raw materials to the smelter;
d) the cost of building a power station and generating electricity
for the smelting process;
e) the location and size of the smelter;
f) the repayment of the capital cost of the plant;
2-19

g) operating costs, such as interest charge and repayment of capital;
h) environmental disruption to the area.
It was expected that through working with the SITING AN ALUMINIUM
PLANT simulation, students could develop skills such as problem-solving,
economic thinking, as well as positive attitudes to the environment.
There have been suggestions that computer simulation is the best
alternative to traditional science teaching (see for example, Zietsman &
Hewson, (1986), Woodward, et al. (1988), Hounshell & Hill, (1989)), but the
question was, how far can we give the students experiences? The arguments
for using CAL have moved from its effectiveness in aiding teachers, to
its effectiveness in providing experiences for the pupils.
2.4.6 Artificial Intelligence:
An early definition of artificial intelligence (A/,) is still widely accepted,
"Artificial intelligence is the science of making machines do things that,
if done by humans, would be regarded as intelligent" (Cumming, 1988, p
9).
The main difference between Al and simulation is that in Al, the
computer not only reacts to the student's responses, but also accounts
for or helps him or her overcome his or her mistakes, weaknesses and
difficulties.
The basic philosophy underlying Al is Piaget's ideas which are counter
to the behaviourist tradition in Psychology. Piaget tried to change our
understanding of children and what they know. He emphasised structure:
2-20

"The essential functions of intelligence consist in understanding and
inventing, in other words in building up structures by constructing
reality" (Piaget, 1970).
These structures are built by the child in interaction with the
environment. So, knowledge is always structured in some way at all age
levels. Piaget is not saying that the child's cognitive structures only
change in some pre-established or entirely predictable way; the child is
always considered to be the centre of activity, being constantly involved
in self-regulating processes. Thus, to describe a theory of change, we
need to be able to describe the process of change, exactly as Al's
computational metaphor for thinking tries to do (O'Shea & Self, 1988).
Despite the lack of practical examples in science teaching, Al is one
of the most active areas of research with respect to CAL. For instance
in the UK, there are now strong Al centres in the universities of London,
Lancaster, Sussex, Edinburgh, Exeter and also at the Open university.
One of the best examples of Al is MYCIN, which performs medical
diagnosis. O'Shea and Self (1988) discuss it from two perspectives. First
they use it as an example of some contemporary techniques used in the
construction of artificially intelligent programs. Second, they explore the
various educational uses to which this and similar programs might be put.
Good accounts of Al can be found in Howe (1978), O'Shea and Self (1988),
and Cumming (1988).
2-21

2.5 A Modern Position:
As CAL developed, doubts arose as to its success in the science
classroom. It became clear that the original forms of CAL, i.e D&P, tutorial,
and later simulation, were no longer internationally acceptable. There were
calls to change the ways of using CAL in science teaching, within a few
years from its introduction. Studies began to ask: are we sure that CAL
has achieved our educational aims? What are the problems of using CAL
in the science classroom? Are the students interested when they use it?
Do science teachers use CAL effectively in their teaching? Is CAL the
best way of using computers in science teaching? and so on. Alongside
doubt about the effectiveness of CAL, there is increased concern about
the cost and the time required to produce and test such programs. These
questions and issues are addressed in the next chapter through a critical
review of past and current studies in subject teaching generally and in
science particularly.
2-22
tisiversitylLibrarY
MN

CHAPTER 3::REVIEW OF CAL DTES TN
TEACHING WTTH SPECIAL REFER-ENCE TO SCIENCE
3.1 Scope of the Review:
The purpose of this review is to provide as clear a picture as possible
of trends in both reviews and individual studies concerning the effec-
tiveness of CAL and its contribution to school subject teaching generally
and science teaching in particular.
Several reviews of CAL studies carried out in the past few years
have presented information about the use of CAL in education. The reviews
mostly include the effectiveness of one or more type of 'CAL upon pupils'
achievement, cognitive skills, attitudes, etc.
Most of the studies concern subject teaching in general. While there
are relatively few science studies these normally show similar patterns
as in the other subjects. The following sections present reviews of CAL
studies in general as well as particular reviews of studies concerning
science subjects.
3.2 Types of Review:
Three kinds of review have evolved over the past 20 years for
summarizing research, and all are used in reviews of CAL cited. Although
meta-analysis procedures were developed in 1976 and are commonly used
3-1

by many reviewers, some reviewers still choose to use the box score
method, whilst others describe study findings in the form of 'journalistic
account' (Roblyer, et al. 1988).
3.2.1 Early Reviews:
One of the early published CAL reviews using the descriptive method
was done by Vinsonhaler and Bass (1972) on 10 Drill and Practice studies
in mathematics and language learning. They found that most of the studies
had reported no significant differences between experimental groups taught
by using D&P and control groups taught by traditional methods. However,
after they subtracted the average gain in the control group in each study
from that of the treatment group, in almost all studies, they found
advantages in favour of the computer group, and in most of the studies,
this advantage was statistically significant. They concluded by observing
that questions of cost-effectiveness and comparative effectiveness with
other media also had to be addressed.
The review of Thomas (1979) was focused on the use of CAL methods
in secondary schools, but he also included some studies from both ele-
mentary school levels and the military. Effects on achievement, attitude,
time reduction, retention and cost data were reviewed. He used the box
score method to summarize the results of 60 studies. Although he concluded
by saying that "the studies reviewed paint a positive picture from CAL"
(p. 111), 36 of the 49 studies reporting achievement claimed results equal
3-2

to those of the other method. The only variable which showed a clear-cut
advantage for CAL methods was time reduction. He went on to conclude
that cost factors continue to be an important factor in adoption of CAL.
3.2.2 Meta-analysis Reviews:
The meta-analysis technique was defined by Kulik et al. (1980) as
"statistical analysis of a large collection of results fromindividual studies for the purpose of integrating findings...ituses multivariate techniques to describe findings and relatecharacteristics of the studies to outcomes." (p. 527)
The rationale behind meta-analysis is to subtract the impact of the
control or traditional method from that of the experimental method or the
one under study and thus estimate the impact the new method would have
over and above the old one. This estimate called the "effect size" (ES),
is usually calculated by subtracting the mean score achieved by the
non-treatment group from that achieved by the group of the treatment
under study. The result is then divided by a measure of the spread of
scores achieved by the two groups: the pooled standard deviation. The
following formula is used for the process (Roblyer, et al. 1988):
5-k--- -E
SD,.
where, ES= effect size, X and C are the mean scores of the experimental
and control groups respectively and SDp= pooled standard deviation.
Cohen (1977) gives the following guide-lines for describing results
of studies:
ESES of 0.2 = small effectES of 0.5 = medium effectES of 0.8 = large effect
3-3

To give a continues range of values, Cohen's description can be
modified to be:
ES < 0.2 = no effect0.2 < Es < 0.5 = small effect
0.5 < ES < 0.8 = medium effectES > 0.8 = large effect
Meta-analysis was used extensively by Kulik and colleagues from the
University of Michigan in their reviews (1980, 1983, and 1985), and by
Roblyer and colleagues from Florida University (1988). The meta-analysis
technique was also used in three reviews of CAL studies concerning
science teaching.
3.2.2.1 Reviews of the Michigan University Team (MUT):
The first team-review was by Kulik, Kulik, and Cohen in 1980 which
performed several meta-analyses on CAL from college level teaching. They
integrated findings of 59 independent evaluations of CAL in college teaching.
The 59 studies were selected from a pool of 500 studies because they
satisfied three criteria. First, the studies had to take place in actual
college classrooms. Second, studies had to report on quantitatively
measured outcomes in both CAL and conventional classes. Third, studies
had to be free from crippling methodological flaws; for example treatment
and control groups had to be similar in aptitude and on other variables.
Kulik, et al. explained that the studies used in the meta-analysis
described four major types of application of computer to learning: tutoring,
computer-managed teaching, simulation, and programming the computer to
3-4

solve problems. They described the outcomes in studies in terms of
outcomes: student achievement, correlation between aptitude and
achievement, course completion, student attitudes, and instructional time.
The meta-analyses findings showed that CAL made small but significant
contributions to course achievement (ES= 0.25), and also produced positive,
but again small, effects on the attitudes of students toward learning and
toward the subject matter (ES= 0.18 to 0.24). CAL also reduced substantially
the amount of time needed for learning.
Although the effect of CAL in the typical study of Kulik, et al. was
small, effect sizes varied from study to study. Only one-quarter of the
studies reported a medium or large effect in favour of CAL, whilst nearly
three-quarter of the studies found small or trivial effects. Few studies
(less than five percent) reported moderate or large effects favouring
traditional learning.
But even the large effect size of some studies was not completely
related to the use CAL, because when Kulik, et al. looked back carefully
and examined whether the studies that reported large effect differed
systematically from those reporting small effect, they found the average
effect size was .13 for those studies in which a single teacher gave both
computer-based and traditional groups of a course. Effects were larger
(.51) when different teachers gave the two treatments. This could give
indication of the influence of group-teacher interaction rather than the
effectiveness of just the teaching method.
3-5

Later, the University of Michigan team performed two further
meta-analysis reviews, these times at secondary level (Kulik, et al.
1983/Bangert-Drowns, et al. 1985). Both reviews found approximately the
same effect size in achievement (0.32 and 0.26, respectively) and attitudes.
Again, both reviews found small effects on scores of students' achievement,
but in the 1983 review, they found very positive attitudes toward the
subject among students who were taught using computers. Both reviews
confirmed substantial reduction of time when students are using the
computer.
3.2.2.2 Review of Florida University Team (FUT):
A more recent and comprehensive meta-analysis review of CAL was
made by Roblyer, et al. (1988). They firstly made a comprehensive review
and analysis of the findings from past reviews.
ERIC and Dissertation databases were used to locate studies which
met their pre-set criteria. About 200 studies were gathered and read. Of
these, only 82 studies could be included in their analysis due to insufficient
data or lack of methodological information required by the authors; among
them 26 were reviews of CAL. Some of their findings are:
. attitudes: attitudes toward computers as learning media were not
significant, while significant different attitudes toward school
subject were found.
• protlem-solving skills: small effect by CAL in problem-solving skills.
Only one study (out of four) had a high effect size, and two of
the others had negative ones.
3-6

• content area: using CAL to teach cognitive skills (problem-solving,
critical thinking) in science yielded the same effects as for
mathematics and reading.
• grade level: effect sizes were higher at college and adult levels.
• reduction in learning time: eight reviews at various grade levels
concluded that using CAL resulted in substantially decreased
learning time.
• CAL type: drill works better with lower level skills found at lower
grade levels, while tutorial is required for higher level skills.
The success of the type of CAL depends on many variables,
including the type of skill being taught and instructional/learning
accompanying CAL.
• supplemental and replacement: CAL was more effective as a sup-
plement. CAL as a replacement for the teacher seemed neither a
practical nor an effective strategy, although early hopes had
been high that CAL could reduce the high costs of education by
eliminating the position of the teachers.
• ability level: six reviews at various grade levels found that slow
learners and under-achievers seemed to make greater gains with
CAL than more able students.
The main difference between the reviews of the MUT and those of
FUT is that the FUT reviewed all grade levels (primary through adult),
whilst a limited range of level was reviewed by each study of the MUT.
The MUT included college level studies in the first review (1980) and
3-7

secondary level studies in the reviews of 1983 and 1985. In addition, the
FUT drew up more specific information about the findings such as content
area, grade level, improving problem-soving skills, etc.
Although the FUT indicated positive effects on the achievement when
using computers, this was not the case of the MUT, who found little
contribution by CAL to the course achievement in all their three reviews.
This difference could be explained on the ground that the FUT team
included studies of more modern types of software and hardware. FUT
reviewed studies of PLATO and TICCIT Mainframe computers with types
of typical CAL such as D&P, tutorial, simulation and programming, and
they included in addition to typical types of CAL, 13 LOGO studies and
10 studies using wordprocessor and some other business software. The
high individual overall (ES) of each modern studies in the FUT review
could confirm this indication.
Both teams claimed to show a reduction of study time in favour of
CAL. The two teams also showed small or no significant effects of CAL on
the attitudes toward the computer as medium of learning and toward the
subject studied, although attitudes toward subject were more favourably
affected than attitudes toward computer as a medium of learning.
3.2.2.3 Science Subject Reviews:
Aiello and Wolfle (1980), Willett, Yamashita, and Anderson (1983), and
Okey (1985) have all reviewed studies of alternative methods of science
learning. The first of these reviewed 115 studies between 1961-1978 on
3-8

five kinds of individualized learning, including tutorial, CAL, personalized
system instruction (PSI), programmed learning (PL), and combinations of
these methods. The effect size for CAL was among the highest (0.42).
Willett, et al. carried out a meta-analysis to assess the effects of
different learning systems used in science teaching as part of a large
meta-analyses project initiated at the University of Colorado to examine
the major research areas in the field of science education. Only 14 studies
of the review were for computer treatments. CAL had an overall effect
size of 0.01, i.e negligible.
Although Willett, et al. provide important information about systems
being used in science teaching, it gave little information about particular
types of CAL.
A recent science review was made by Okey (1985). He examined the
studies on the effectiveness of CAL in the last 15 years. Some of his
results are:
. CAL is effective in prompting learning.
. most studies show CAL to be better than conventional learning.
• supplementing learning with computers may be more effective than
proving a total computer environment.
• young children are affected more powerfully than older learners
and those of low ability more strongly than those of high ability.
The last result may be not a contradiction with the findings of the
FUT who found greater success at older levels than at lower levels,
because Okey was comparing secondary with elementary levels, whilst,
3-9

the FUT were comparing adult and college levels with secondary and
elementary levels. Both the two reviews found greater gains by CAL for
slow learners than more able students.
The FUT commented on the effectiveness of CAL applications in science
in particular. Three out of four CAL science studies were found to show
a positive effect. The FUT concluded that students achieved significantly
more with computer methods with simulations only when they used them
to interpret results and make decisions about the simulated experiments.
When students were required only to follow directions and calculate results,
no differences were found between experimental and control groups.
3.3 Review of CAL Modern Studies in Science Teaching:
The current review aimed to summarise more recent studies of CAL
which have been carried out in the field of science teaching. The intention
was to give an overview of the nature of these studies according to types
of CAL, year of publication, content area, grade level concerned, design
and outcome concerned, as well as to examine the effectiveness of CAL in
secondary school science learning.
Studies were located by several methods, including dialoguing edu-
cational databases and scanning journals dealing with science teaching
and computers in education. Three educational databases and two
educational journals concerned with computers in science teaching were
found to be the most powerful sources of relevant studies. An initial pool
of 495 studies and dissertations was gathered according to general
3-10

keywords and key phrases such as "Computer", "Science Teaching or
Classroom", "Science Learning," as well as specific ones like "Simulation"
and "Computer Assisted Learning". The search was done through:
. Dialoguing searches of ERIC, a database on educational materials
from the Educational Resource Information Centre (1982 to date)
(97 studies),
. Dialoguing searches of HILITES, a database on computer in humanities
materials from HCI Information and literature Enquiry (1986 to
date) (187 studies),
• Dialoguing searches of Dissertation Abstracts, a database on academic
dissertations from IUM (1984 to date) (184 dissertation),
• Scanning Journal of Research in Science Teaching (1985 to date)
(15 studies),
• Scanning Journal of Computer Assisted Learning (1985 to date) (12
studies).
An of the 495 studies were read, although most of this number had
to be discarded according to pre-determined criteria: studies were required
to have experimental or quasi-experimental design. Only studies available
from 1985 were included, because this was the date when the last science
subject review (i.e Okey, 1985) took place. Some studies had to be omitted
because of insufficient data. Only studies concerned with science subjects
in general education, primary to college, were included; studies in uni-
versity and nursery levels were excluded.
3-11

Of the total number, 47 studies and dissertations were retained for
the review'. Tables 3.1 and 3.2 summarise these studies. The first table
classifies them by grade level and outcome. It shows that most of the
studies were based on the higher levels; the secondary and college levels
occupied more than two-thirds of the studies. Only a few studies were
based on the primary level. This may be because CAL primary studies
deal with all subjects, rather than science only, as many modern primary
schools adopt on integrated curriculum, with a "topic" or "project"
approach. Therefore, primary studies include, as well as science, other
subjects not relevant to this review.
Year Grade level Outcome Control group
Pri.* Mid. Sec. Co. Ach. Att. C-skills P-S Interact. S-C Cost Time T CAl. No
1985 3. 1 1 1 1 1 3
1986 4 1 2 2 1 31
1987 2 4 1 3 1 3 1 1 1 31 3
1988 2 2 3 1 1 3 1 1 3 1
1989 2 3 6 8 5 4 2 1 1 52 3
1990 2 3 7 4 4 3 4 5 1 83 2
1991 2 2 1 2 1 3 2 2 22
1992 1 1 1 1 2
Total 2 8 20 18 23 13 17 11 2 8 4 3 29 9 9
* Pri= Primary, Mid.= Middle, Sec.= Secondary, Co.= College, Ach.= Achievement, Att.=
Attitude, C-skills= Cognitive skills, P-S= Problem-solving skills, Interact.= Interaction,
S-C= Science concepts, and T= Traditional teaching method.
Note. Some studies included more than one grade level.
Table 3.1 Descriptive summary of CAL modern studies in science teach-ing
1 See a full list of these studies in Appendix B
3-12

Although most of the studies concerned students' achievement, there
has been an increase in studies emphasising cognitive and problem-solving
skills, whilst attitude is still one of the main considerations of computer
studies in education.
Table 3.2 shows that simulation is the CAL type most used. 19 out of
47 studies used simulation. This could reflect the common use of simulation
in the schools in the early and late eighties, arising from the expansion
in its use in science classrooms during the previous decade. Hartley (1988)
confirmed this point after he had looked back on previous CAL studies
in science teaching by saying: "Many of the CAL packages in science
feature simulation" (p. 59).
Year
D&P* Tut.
Type of CAL
Sim. IA CAL Lab. Total Pyb.
Content area
Chem. Bio. Science
1985 1 1 1 3 1 1 2
1986 4 1 4 2 3
1987 1 3 3 7 1 1 1 3
1988 1 1 2 4 1 2 1
1989 1 2 3 1 1 4 11 2 3 4 3
1990 1 3 5 1 2 5 12 3 7 2
1991 1 1 2 4 4
1992 1 1 2 1
Total 4 7 19 2 9 12 47(53) 10 5 19 14
* D&P= Drill and Practice, Tut. = Tutorial, Sim.= Simulation, IA= Artificial Intelligent,
CAL= no specific type, Lab.= Laboratory, Phy.= Physics, Che.= Chemistry, Bio.= Biology.
Note. Some studies has more than one type of CAL.
Table 3.2 Descriptive summary of modern studies on CAL in scienceteaching
3-13

Table 3.2 also shows the rapid increase of laboratory studies during
the late eighties, which would explain the large number of studies concerned
with Biology; almost all of CAL laboratory studies were carried out for
Biology topics.
Roblyer and his colleagues found the number of studies from 1980
to 1987 to be 85. Of these, most were reported during 1984-1987. In this
review, the number of studies changed dramatically during the second
half of the last decade and early this decade (Figure 3.1). In the beginning,
the number was increasing (as Roblyer, et al. found) and reached its
highest during 1989 and 1990, but so far it seems that there is a decline
in the first two years of the nineties.
The lack of CAL studies during 1991 and 1992 could be explained by
the rapid increase use of general software applications launched into
modern schools in the early nineties. Of course, the increased use of
these types would decrease the use of CAL (as defined in this thesis),
and therefore CAL studies.
3-14

12
10
8
6
4
2
0
CAw'5mii5'4-0ciz
1985 1986 1987 1988 1989 1990 1991 1992Publication Year
Figure 3.1 The relationship between year of publication and number ofCAL studies
One of the main aims of the current review was to investigate the
effectiveness of CAL in secondary school science teaching, to confirm and
support the scope of the thesis. For this reason, more conditions were
placed on the studies analysed in order to have a clear indication of the
effectiveness of CAL in secondary school science teaching. The new
conditions were that the studies took place in actual secondary (high)
school science classrooms; laboratory studies and those with handicapped
or special groups were excluded. Studies had to have a control group,
i.e, two-group design.
3-15

Out of the 47 studies included in tables 3.1, 3.2 and figure 3.1, 10
studies were able to be included in the more restricted secondary school
review. Table 3.3 summarises the findings from these studies.
Author Year Country Type of CAL Content area Description Finding *
Dalton 1985
Howard 1985
Wainwright 1985
Rudolph 1986
Zietsman & 1986
Hewson
Rivers & 1987
Vockell
Choi & 1987
Gennaro
Snir J, 1988
USA CAL Biology Effectiveness on achieve-
ment and attitudes
USA Simulation Biology Effectiveness on pro-
blem-solving
USA D&P Chemistry Effectiveness on concepts
USA IA Physics Effectiveness on perform-
ance
S.Africa Simulation Physics Effect on conceptual
change
USA Simulation Biology Effectiveness of scien-
tific pro-solving skills
USA Simulation Earth Effectiveness of simulated
experiences
UK Simulation Physics Effective on conceptual
et al. change and Problem-solving
skills
Wainwright 1989 USA
Commercial Chemistry Effectiveness on Achieve-
ment
El-Sanhurry 1990 USA Tutorial Physics Effectiveness on achieve-
ment and attitudes
* += positive findings in favour of CAL method, -= positive findings in favour of control
method, no sign= no significant difference between the two groups
Table 3.3 Descriptive summary of modern studies on the effectivenessof CAL in secondary level science teaching
3-16

While the 47 studies contained a majority of Biology studies, the 10
studies of Table 3.3 represented different science subjects (Physics,
Chemistry, Biology and Geology) in nearly equal numbers. These studies
also showed use of various types of CAL.
Half of the studies showed no significant effect for the CAL treatment
groups. Furthermore, Wainwright (1985) and (1989), found in favour of
the control groups (traditional learning), although he included immediate
feedback, response checking, and error avoidance in his software package.
He claimed ...
"In spite of numerous studies in which CAL treatments inchemistry have resulted in higher achievement, thisinvestigation has suggested that the traditional worksheetapproach is more effective than CAL, even when using asoftware package respected by educators for its instructionaldesign." (1989 p. 78)
This indication matches the conclusions of Roblyer, et al. described
above, because they found four analyses resulted in effect sizes which
were negative or not significantly different from zero.
To be included in Table 3.3 each study has been required to use the
control group design, which compares the results of an experimental (CAL)
group with a control (traditional method) group, with the same teacher
or one of similar standard.
The experimental and control groups design may be seen as an
"unequal comparison", because it is not just a comparison between two
teachers, but it is a comparison between one teacher in the control group,
against a team of programmers (authors), computer(s) and the experimental
3-17

group's teacher. Therefore, any significance in the result should not be
explained as a success for the CAL only, but for the whole team. Rosenshine
reminded us (in 1971) about this "source of invalidity" by pointing out
that specific teaching behaviours, rather than different types of teachers
compete to influence learning. Clark (1983) went further by saying:
"It seems reasonable to advise strongly against future mediacomparison research. There are no learning benefits to begained from employing different methods of instruction,regardless of their obviously attractive features oradvertised superiority. All existing surveys of this researchindicate that confounding has contributed to the studiesattributing learning benefits to one over another and thatthe great majority of these comparison studies clearlyindicate no significant differences." (p. 450)
Table 3.3 shows that some modern studies concern problem-solving
skills, which is seen as an important issue in science teaching. It was
thought that simulation could provide students in the science classroom
with enough practice in novel problem solving to help develop a generalized
skill in scientific problem-solving (Minsky and Solomon, 1985). In two
studies of computer simulation enhancement of problem-solving skills in
Biology and Physics, Rivers and Vockell (1987), and Snir, et al. (1988)
found that students using simulations met the unit objective no better
than control students and that simulation does not help students in
developing problem-solving skills. These typical studies raise serious
doubts as to the effectiveness of simulation in developing students'
problem-solving skills. Hartley (1988) has argued that a modelling system
is better than simulation for developing these skills. Modelling allows the
students not only to learn about the science topics-domain, but also to
3-18

develop investigatory and problem-solving skills.
3.4 Problems of using CAL in science teaching:
Studies of CAL in science teaching mostly follow the development of
the categories discussed previously and the era in which CAL was most
used. In the earliest stage of each category there was a surge of enthusiastic
studies, which claimed high benefits from the use of CAL. Later on and
after a period of application, other studies with little gain argued for
more caution in interpreting claims.
One problem limiting the use of CAL is its cost in both money and
time to develop materials. Several studies have suggested that CAL needs
specialists to spend many hours producing programs to teach a particular
topic, which may be taught by a simpler and cheaper method, with greater
cost effectiveness (Hartley, 1988).
Fielden (1979) has listed the main components of the cost of CAL as:
. the capital and recurrent cost of hardware;
. the use of computer time on existing installations;
. equipment maintenance;
. the time of specially recruited or funded staff;
. the time of existing staff;
• accommodation;
• share of overheads and services,
. travel, promotion and subsistence expenses.
3-19

Hooper (1977) in the final report on NDPCAL, claimed that the cost
was about £5,000,000 which was much more expensive than any other
innovative teaching method. The report showed that the cost of a student
hour of CAL was more than £4 and would be in the range of £5 to £10,
while the cost of conventional teaching at that time was in the range of
69p to £2.50 per student hour.
The report also indicated the cost taken to develop CAL packages,
which had the range of 200 to 400 hours of effort in their development.
Hooper pointed out:
"Thus, the point must be made that there should surely besome advances in teaching technique which are 'worthwhile'despite their extra cost. CAL and CML are however extremelyhigh cost technologies and are the most expensive tools yetintroduced into the teaching process." (Hooper, 1977, p. 78)
Although Fielden and other early evaluators argued about Mainframe
computers, the cost problem remains even with stand-alone machines. It
is a software-cost rather than just machine-cost. Even if microcomputer
time at present is effectively free, software production, testing, and time
problems remain. This indication is supported by many CAL studies and
reviews. Roblyer, et al. in (1988) stated that "since using computers in
this way means substantial increases in costs of instruction, it would
probably be cost-effective to use computers in this area only if they were
also being used for other purposes at the same time." (p, 32)
Another problem which is linked to the cost-problem is the quality
of the software. This problem has always dogged the development of CAL,
but it seems to have become a major problem in recent years. The National
3-20

Association for Research in Science Teaching (NARST) focused on this
problem in their annual meeting in 1985. Two of the four papers criticised
`less than optimal software' (Hale, 1986). Even when using a software
package respected by educators for its instructional design, the problem
still exists (Wainwright, 1989).
Kracjik, et al. (1986) confirmed this problem ... "The use of less than
optimal software in research studies was a problem that received little
attention ... It certainly deserves more attention in the future." (p. 467)
Attention should move from thinking about how CAL can be used in
the classroom toward examining the benefits of using it. Maddux (1988)
stressed this by saying: "Thus, if software houses elect to market software
that is not consistent with what is known about how people learn, the
burden of proof that the software is efficacious should lie with the
developer." (p. 4) He stressed that the software should help the students
not just to investigate scientific phenomena, but also to develop their
problem-solving skills.
In non-English speaking countries, the software problem is even more
complex. CAL software circulates internationally from its country of origin
which is most often an English-speaking country. Carnoy, et al. (1987)
stated three problems created by the use of imported CAL software:
1. the unsuitability of software for curriculum being used;
2. linguistic problems for countries where English is not spoken,
3. cultural problems in terms of the models inherent in the software.
Herbenstreit (1984) stressed this idea by saying:
3-21

"Willingly or not, the educational software designed in acountry carries with it, in many subtle ways, the social andmoral values of culture of that country and therefore themassive use of educational software designed in a foreigncountry will slowly but inevitably lead to a transformationand eventually to a decline of the originality and specificityof the national culture and traditions. This kind of difficultyis already well known regarding school books in generalbut it is much more difficult to analyze in the case ofinteractive educational software packages." (p. 16)
Finally, and perhaps most crucially, are the doubts about the reality
of the effectiveness of CAL. Some of the discussed reviews and studies
show little sign of the benefit of CAL in the classroom. Laurillard (1992)
pointed out that "many researchers and developer of CAL, have built
simulation and microworlds on the assumption that the enriching experience
they provide will help to develop students' understanding. But there is
little scientific evidence as yet that tells us what these experience are,
how they help the student, or how the computer's contribution is essentially
different from other teaching methods." (p. 156)
Although Roblyer, et al. and Kulik, et al. claimed that CAL can reduce
the learning time, nearly three quarters of studies in their reviews showed
trivial to small effects (ES= 0.10 to 0.30). The claim of reduced time for
learning was rejected by Clark (1983)- "A plausible rival hypothesis here
is the possible effect of the greater effort invested in newer media
programs than in conventional presentation of the same material." (p. 449)
The students in the treatment design are given additional help compared
the with traditional method, and this, of course, produces more effective
presentation requiring less time to complete.
3-22

Additional hypotheses against the effectiveness of CAL were also
raised by Clark. He has suggested that journal editors select for publication
research that finds stronger effect for newer media. Kulik, Bangert and
Williams (1983) reported effect sizes of .21 and .3 for unpublished and
dissertation studies respectively, while published studies showed an
average effect size of .47. Kulik, et al. (1980) found similar evidence in
an analysis of audiotutorial instruction studies. Published studies showed
a 3.8 percent final examination advantage for audiotutorial methods over
conventional instruction, but this reduced to a 0.6 percent advantage for
the same method in unpublished studies.
Wainwright (1989) summarised the argument by pointing out
"Although numerous studies have been published in whichCAL was the favoured instructional method, this studysuggests caution in adopting the general assumption thatCAL in more successful than traditional method. A carefulstudy of the literature reveals that in the vast majority ofcases in which CAL was favoured, subjects was volunteersrather than randomly assigned, and often used CAL asremedial or supplemental instruction, beyond that which thecontrol group received. These voluntary and enrichedapproaches may, in fact, be optimum applications for CAL,rather than required, controlled, whole-group instructionsuch as in this study." (p. 284)
3.5 The Role of Teachers in adopting CAL into Schools:
A further CAL-related difficulty facing educators today is that most
teachers do not use computers. Educators then start to argue seriously
that there is no need to introduce computer facilities, which cost a lot,
if teachers are not willing to use them.
3-23

Lehman (1985) found no use of computers by science faculty in 41
percent of 340 USA high schools he surveyed. Overall, of the 1,470 science
teachers in his study, Lehman found 77 percent did not use computers
in teaching. Similarly and in the same year, Kherlopian and Dickey (1985)
found that 60 percent of K-12 teachers were not using computers in the
classroom. Mitchell (1988) surveyed a random sample of 2000 secondary
science teachers. Few teachers were found to be users (17 %), with more
teachers (40 %) "anticipating use of computers within the next two years".
The National Science Foundation (NSF) study by Weiss (1977) showed
that only 9% of science classes grades 10-12 ever use computers, although
36% of high schools have them. Six years later, another survey this time
by the National Education Association (1983) indicated little improvement
in the use of computers. It showed that 82 percent of practising teachers
want and need training in using the computers.
The National Science Board of the United States (1983) stressed the
urgent need for training science teachers in using computers: "The most
critical need is to train teachers in the uses of technology in the education
of children", it says.
Inadequate teacher training contributes to the lack of computer use,
McCarthey (1988) stated that "Certainly, more and more comprehensive
teacher training would help drive the revolution forward." (p. 43) He
argued that we all made a serious mistake in giving the computers to the
kids first. We ignored the teachers, cut them out of the loop, and that
is precisely the way to kill a promising educational technology. What we
3-24

should have done is given adequate training to the teachers before asking
them to start using the computers. Once teachers have learned what a
computer can do, they can understand comfortably and intuitively, how
to make it fit into a lesson or a curriculum. Ray (1988) went on to say:
"After you find out about technology and its capabilities,then you must find out what the teachers think. Teachersare the bottom line, the keystone of this whole revolution.We must find out what teachers want and then determine ifthe computer can provide a solution. Throwing technologyat educators has not worked, obviously; though it hasinformed us that computers are not self-evidently peda-gogical devices." (p. 44)
3.6 Summary:
The previous chapter has shown that the introduction of CAL into
science teaching came through a series of stages starting with CS and
CL, then shifted to include science teaching in PL, D&P, simulation etc.
It has also shown that the introduction of computers depends on the
capabilities of schools and society.
Chapter One has shown that computers have recently been introduced
into Saudi Arabian secondary schools for CS purposes; there is some
speculation that it might be worthwhile using them in science teaching
also. The problem of introducing computers into the Saudi Arabian science
classroom may appear through the question: How best can we start to
introduce computers into Saudi Arabian science teaching? CAL is usually
used for science teaching in the science classrooms of industrialised
countries, and it has been associated with some problems, discussed
previously. These problems must also be addressed when thinking of using
3-25

computers in the SA science classroom.
Moreover, the problem of adequate software would be greater in Saudi
Arabia. Language is one of the main problems facing the Saudi Arabian
computer specialists. At present, there is no Arabic computer language,
which causes the secondary schools to teach BASIC computer language in
English in the computer studies subject.
Finally, whatever the potential benefit of computers, there is no actual
benefit from their introduction into science lessons if science teachers
are not willing and able to use them. Therefore, before planning to
introduce computers into Saudi Arabian science teaching, there is a need
to investigate whether Saudi Arabian science teachers are willing and
able to be trained to use computers in their teaching. This is the main
purpose of carrying out the two field studies in SA. The preliminary
study is explained in Chapter Five, while the main study is fully discussed
in Chapters Seven to Ten. Before that, Chapter Four will give further
explanation on the important methods, content, etc. of the teacher training
and literacy.
3-26

E Fit.
'TEACHER 1_, I 'T'Erit.A..CY ANAD EAL1T1EH.
r-r. NG-
As with any curricular innovation, healthy development arises from
a close liaison between training and classroom practice, i.e. the two stages
should be mutually dependent. Assisting teachers to become technically
literate and competent in using computers in the classroom is one of the
roles of teacher education (Gardner and Megarity, 1988) and it is on this
area of teacher education that this chapter will focus.
4.1 The Significance of Teacher Training:
The growth of information technology (IT) in schools has been rapid.
In one recent year, a fifty-six percent increase was reported in the use
of computers in the schools in the United States. Similar increases have
been reported in England, France, Australia, and many other countries
(Cachapuz, et al. 1991).
Unless the question of teacher education is addressed the potential
of computer use in schools will not be realised (Sutherland, et al. 1990).
At the heart of instructional computing are the teachers. It is teachers,
not computers, that teach. It is essential that teachers gain an under-
standing of the educational capabilities of this technology in order to be
able to identify when and when not to computerize their instruction.
4-1

Practising teachers require to gain this knowledge via specific in-service
training directly related to the ways in which they will need to use this
technology in their daily teaching (Langhorne, et al. 1989).
It has been shown in the previous chapter that many teachers do
not use computers, even when they are available in schools. It was
suggested that the main reason for this is that the teachers have little
or no training to give them confidence and familiarity with the machines.
In the early 1980s there was considerable pressure in the industrial
societies that computer literacy should be required of all teachers.
Recommended training content included writing a simple program, knowing
computer terminology, discussing the history of computers, and discussing
the moral and human impact issues related to computers (Martin and Heller,
1982). In the USA, for example, the major statewide INSET for secondary
science teachers in Pennsylvania has for several years been computer
training (Abdel-Gaid, et al. 1986).
To meet the need for teacher training many programmes were developed
such as the Microelectronic Education Programme (MEP) in the UK which
ran from 1981 to 1986 at a cost of £23 million and provided training for
100,000 teachers. It also generated around 2,000 computer programs to
help teachers introduce computers into their classrooms.
The incorporation of information technology (IT) within initial teacher
training (ITT) is currently a major concern of the British Government,
the Council for Accredition of Teacher Education (CATE) and of the teacher
training institutions. For example, the Initial Teacher Education and New
4-2

Technology Project (1990-1992) which was funded by CATE has stated
that all initial teacher training courses should contain compulsory and
clearly identifiable elements which enable students to make effective use
of information technology in the classroom (DES, 1989a). It has also
recommended that all newly qualified teachers should be able to use
information technology for their own purposes and in their teaching, and
be able to evaluate its impact on teaching and learning.
Despite the extended programmes, training teachers to use computers
in their classroom is still a common problem facing schools. The DES
(Department of Education 8z. Science) in the UK conducted a survey in
1988 which showed that only about a half of all teachers had undertaken
initial awareness training in computers (DES, 1989b). In 1992, Mellar and
Jackson made a survey of nearly 400 PGCE primary and secondary students.
Two thirds of these students were found to have little experience of using
computers either at home, school, college or work. Most trainee teachers
gave high training priority to learning how computers can be used in
teaching.
Even now, the recent survey of NCET (1993) shows that about half
of science teachers had no computer training. Challenging questions
confront educational leaders, such as: What should be taught to teachers?
Who can do the training? Should all teachers be expected to train? Should
the content be the same for all teachers? When should the training occur?
Who has the responsibility: the schools, the teachers, the LEAs, or the
Universities? (Langhorne, et al. 1989). Langhorne and his colleagues'
4-3

questions echoed earlier comments of Turkel and Chapline (1984) who
stated that "the important questions dealing with what will be needed in
the field are not readily answered." Others stressed that "if teachers
have well-designed and appropriate software, very little training would
be needed for the majority of teachers." (Rockman, et al. 1983) While
definitive answers to these questions may not yet have been found, some
of the issues can be addressed.
4.2 Content of Teacher Training Programmes:
There is emerging a much greater role for the use of computers and
the applications of IT across the spectrum of subject-teaching. To support
this, the training programme will need a structured approach to training.
There are many more computer training models for in-service training
programmes than there are for pre-service programmes. Lewis (1983) has
defined a model of IT in-service provision which focuses on the type of
participant attending the courses. His outline includes a number of levels:
a) familiarisation level;
b) specialist curricular level;
c) teacher-author level;
d) teacher-disseminator level, and
e) advisor-inspector level.
4-4

An empirical programme of inservice training was run by Sutherland,
et al. (1986-1988) 1. Their computer-based INSET programme which was
carried out for secondary mathematics teachers aimed to:
a) help the teachers become confident in using computers for
themselves;
b) structure computer environment within teacher classrooms, and
c) enable teachers to evaluate the role of computers in terms of
pupils' learning.
The DES (1989c), in their final submission (known as the Trotter
report), described the level of IT capability they would look for in initial
teacher training under three headings: practical IT skills; relating IT to
the curriculum; and managing and evaluating IT use.
It seems that teacher training programmes should first build-up
teachers' confidence, followed by training on use of some computer
applications. The last stage of specific computer training can then be
directed to applications in each individual subject (Hoyles, et al. 1990).
The following sections discuss the content of each of the three stages
of teacher training including a practical training directed to science
teachers.
1 • The programme will be discussed extensively in Chapter 12.
4-5

4.2.1 Basic Training:
Many teachers need to be given opportunities to develop some very
elementary computer skills, because in many cases subject teachers have
not yet taken the first steps towards using the computer as a teaching
and learning aid.
Basic teacher training aims to foster positive attitudes toward com-
puters where high levels of teacher anxiety are common. Summers (1990a)
investigated the feeling of 173 PGCE (Post Graduate Certificate in Education)
students. He found that 32% of the students started the PGCE course with
a 'nervous' feeling toward computers. Bliss, et al. (1986) reported very
similar findings. More than half of the teachers in their study had deeply
rooted worries or criticisms concerning computers. Among these were
'anxieties and feelings of inadequacy'.
Basic training should include computer awareness including on
introduction to the use of computers in schools, i.e the importance of
computers in society, the need for educational computing, ways of using
computers in schools (IT across the curriculum), and some basic training
such as: how to switch the machine on and off, how to load the programs
and save documents, and use of computer networks in school, etc.
Although some teachers may have taken some courses in computers,
they still need basic training in the schools, because many courses run
by Universities and Institutes are not exactly what teachers need in their
classrooms. Goler (1990) found in his survey that there were no significant
differences between older teachers and those recently qualified in their
4-6

use of computers, computer confidence or knowledge of programs. A recent
HMI survey of information technology in ITT revealed that one-fifth of
tutors had little or no knowledge of information technology; one-fifth were
aware of a broad range of IT applications but did not use IT in their
personal work or teaching; one-fifth had the ability to use specific IT
packages in their personal work but did not use IT in their teaching;
one-fifth had the ability to select the use of IT appropriately in their
teaching of students whilst only the remaining fifth thought that they
had the ability to help students use IT in their teaching in schools (DES,
1991). Thus, any particular student has only a one in five chance of being
supervised in the course of school experience by a tutor with IT
competencies that can support him or her.
4.2.2 Familiarization and Personal Confidence Training:
One step towards making teachers feel comfortable with computers
as a teaching tool is to train them in using computers as a personal tool.
Each school should provide a place where teachers can work with computers
to preview software, prepare materials, etc. (Langhorne, et al. 1989).
It is very important for the teachers to become familiar with the
computers they are likely to use in their classrooms, and to be convinced
that they it is worthwhile for some of their own work. Teachers can
become confident by practising and using a number of software packages
to confirm their basic training. This could include use of computers for
4-7

personal work such as preparing lesson plans, maintaining students'
records, reports, etc.. Successful personal use, should encourage them to
use computers in the classroom.
Hoyles, et al. (1990), after evaluating their programme, concluded that
an important requirement for using the computer in the classroom was
the development of personal confidence and competence in using the
software. They claimed:
"The tendency was for those who started the course with aninitial confidence in using computer applications to be moresuccessful at integrating the computer into their practice."(P. 18)
It is not the improvement of skills, but a building of confidence
brought about by such performance which can be of fundamentally
importance to the individual teacher. Summers (1990b) pointed out that
computer knowledge is important in one's social skills because they are
prevalent in society and even young children use them confidently, but
if someone feels they have passed him by, then perhaps a feeling of
inadequacy develops. A sensitivity to the possible existence of these kinds
of feeling is obviously important for the teachers and for teacher trainers.
4.2.3 Training in the Use of Computer Applications in the Classroom:
Research on teacher training indicates that only when teachers have
become confident with computers, is it possible to train them in some
computer applications in the classroom.
4-8

Teachers may then be trained to use some type of software packages
in schools and to identify which software packages should be used to
facilitate different types of classroom activity. They may also learn how
to use computer applications as problem-solving tools, as teaching aids
and for classroom management.
At this level, teachers should be encouraged to think of how to list
considerations in the evaluation of educational computer software used in
schools, and evaluate critically a specific piece of software.
4.2.4 Subject Training; Practical Training for Science Teachers:
While basic training is essential, there is also a need for special
training for individual subjects. The purpose of the special training is
to enable teachers to use computer applications in their own subjects in
order to apply their previous training to their daily teaching. Otherwise
they might not do so. In their follow-up study, one year after the training
course, D'Arcy and Gardener (1986) reported that: because the in-service
training was not translated directly into CAL practice in the classroom,
only 41% of the respondents (n=91 of original 194) reported that they had
used computers in their teaching.
Subject training for science teachers should illustrate some of the
software packages useful for science. This would include examples at
different levels and in different science subjects. Science teachers should
be able to:
a) use computers in the science classroom effectively;
4-9

b) prepare science materials using different software packages;
c) train pupils to use computer applications in the science classroom
and to produce their own work;
d) prepare pupils to simulate science experiments and data using
computers.
e) evaluate a specific piece of software.
They should also be trained to research, trial, and produce a
substantial science work using various computer software.
4.3 Influence of Teachers' Knowledge, Experience and Attitudes:
Research and other studies by Summers (1990) has shown that teachers'
reactions to training in the use of computers is influenced by a complex
series of interrelated factors, such as the teacher's knowledge, experience
and attitudes.
After examining the reasons for the negative feelings of some PGCE
students, Summers (1990a and b) found that lack of knowledge and
experience were the main reasons for negative feelings about learning to
use computers. Nearly all the students rated such knowledge as quite
important or very important. He stressed that:
"The evidence from this research is that negative feelings areassociated significantly with lack of experience of computers.This is obviously an encouraging finding for teacher educators,since it suggests that what we do might make a difference!"(p. 87)
4-10

Similarly, Underwood and Underwood (1989) found that negative
attitudes decrease teachers' use of computers, even when computer facilities
are available in their schools. They also found that many of the
Anti-computer teachers could develop more positive attitudes when they
were given first-hand experience of the machine. Other research has
demonstrated conclusively that practical training increases teachers'
positive attitudes in using computers (see Hoyles, et al. 1989).
Summers concluded in his two surveys (1990a and b) that teachers'
attitudes were significantly related to their use of computers in the
classroom. These views are supported by Rhodes and Cox (1990), earlier
work of Gardner and Megarity (1987), and a survey by DES (1989b).
Abdel-Gaid, et al. (1986) perceived teachers' attitudes toward com-
puters as the central issue in computer use. They claimed:
"Science educators can hardly ignore the trend toward theuse of microcomputers in the teaching of science. And centralto the success of this new initiative will probably be teacherattitude." (p. 824)
4.4 Teacher Training in Practice:
When providing INSET, many issues need to be recognized such as:
training sources, place and time period, and funding. Gardner and Megarity
(1987) listed and illustrated the sources of in-service courses in the UK,
(see table 4.1)
4-11

C
Type of courses*
nC FT PT LT STUniversities + + + +Polytechnics + + + +Colleges of Higher Education + + + +Colleges of Further Education + + +Teachers' Centres + + +Local Authority Support Centres + + +Schools + + +
* C= Certificated, nC= non-Certificated, FT= Full-time, PT= Part-time, LT= Long-term, ST=
Short-term.
Table 4.1 Sources of in-service teacher training.(Source: Gardner and Megarity, 1987)
Table 4.1 indicates that there are three main sources of teacher
training:
a) Universities, Polytechnics, etc.;
b) LEAs support, and
c) Schools.
Gander, et al. pointed out that at that time almost all pre-service
training was run at Universities and Polytechnics, while in-service training
was run at schools and Universities with the support of LEAs. More
recently, this has been changed, as schools often preferred the flexibility
of making their own arrangements. Therefore, Universities and LEAs have
lost most of their responsibility for INSET. A survey by NFER (National
Foundation for Educational Research in England and Wales) showed that
the move towards school-based INSET had led a growing number of the
higher education institutions to modify their provision, to become more
flexible and to accredit classroom-based study (DES, 1990).
4-12

It is likely that provision of in-service training could be organised
according to the levels described previously. The first two training levels
(i.e. basic, familiarization and personal confidence) could be run by the
schools for all teachers because they are more general, while the last
special training levels (i.e. computer applications in the classroom and
subject training) could be run as a support service of LEAs, for example
by an advisory unit or by training institutions at Universities or by both.
School-based INSET activities, with teachers working alongside col-
leagues and advisory teachers, have become increasingly widespread (DES,
1990). Most teachers prefer to receive their training in their schools
during the day. The teachers also prefer classroom-based training where
much of the training can be practised inside their classrooms. Goler (1990)
found that 63% of a sample of 50 primary school teachers preferred
school-based INSET, while only 9% wished to attend evening courses. This
indicates that teachers do not wish to give up their evening to attend
INSET courses. Therefore, to ensure the success of teacher training
programmes, these courses should be carried out in the schools and should
be pupil oriented. This move in the pattern of INSET was supported by
the report for the DES by Brown and Earley (1990):
"The trend, as earlier noted, was for traditional courseattendance models of INSET to be replaced by school-basedmodels." (p. 32)
The training programme would be more successful if given in shortr
periods. Boyles, et al. (1989) and (1990) ran 30-day INSET courses. Although
they spent half of the course in LOGO training and another half in all
4-13

other computer applications, they claimed significant improvement in
experience and use of computers, especially in computer applications. A
DES report (1990) stated that the staff training days (Non-contact days
usually at the start or end of school term) were "potentially, a very
successful means of providing INSET for all staff which created no
disruption to learning."
Teacher training has started to shift from training on computer
languages to computer applications according to the teachers' real needs
in the schools. Boyd-Barrett (1990) pointed out that we spend much time
and a lot of money in training for BASIC or LOGO or whatever language
and then complain of short training time and lack of use of computers
by teachers. The training of teachers in computer languages started with
the idea of using them in the subject teaching, but nowadays, there is
little or no use for them in the classroom. Subject teachers use computers
to aid their classroom teaching, therefore they should be trained to achieve
this target.
It is necessary to make teachers, officials and perhaps some educators
aware that we do not want teachers to be specialists in computers, but
we do want them to use computers to assist their teaching.
Another basic issue influencing training is funding. For example, in
the UK, the Task Group on Assessment and Training states that it would
require over £20 million to provide only one day's INSET for every teacher
4-14

(Boyd-Barrett, 1990). Because the cost of taking a teacher out of the
school is about £100 per a day, it would be much cheaper to train through
school-based INSET on non-contact days.
4.5 Information Technology Across the Curriculum:
Because of changes in the patterns of the use and provision of
computing facilities to microcomputers today over from Mainframe machines,
policies have developed in the UK, USA and some other countries, for
moving schools from Computer Studies Examinations for a minority of
pupils toward Information Technology (IT) across the curriculum for all
pupils. Computer studies might be a valuable subject for some pupils to
study but its detail and approach are not essential for all pupils, who
require an education in the broad concepts associated with IT (Allen,
1991).
The introduction of IT across the curriculum is built upon two
perspectives: first, to deliver IT to all pupils. (Many educators take the
view that IT is best delivered through other subjects (HMI, 1985).); second,
to teach the elements of learning subjects, that is, knowledge, concepts,
skills and attitudes to be developed (HMI, 1985).
National policies toward the role of IT in UK schools are seen as
crucial to its use in education:
"IT has a critical role in enhancing the learning process atall levels and across a broad range of activities includingbut going beyond the National Curriculum. Through the useof IT in the curriculum, schools will also be helping pupilsbecome knowledgeable about the nature of information,comfortable with the new technology and able to exploit itspotential." (DES 1989d, p. 2)
4-15

The IT approach in the UK has focused on using IT across the
curriculum rather than introducing it as a specific subject, The DES
(1989d) stated that all pupils should use a range of IT resources in core,
other foundation and, where relevant, non foundation subject and
cross-curricular themes.
The need for children to be given the opportunity to develop an IT
capability, with the publication of the subject orders for technology, has
now become a statutory requirement (DES, The Curriculum from 5 to 16).
The shift of emphasis towards the integration of IT into the curriculum
as a whole places demands on curriculum design, staff support and teacher
training strategy. Allen (1991) stressed that "Unless there is more emphasis
on teacher education in IT, then IT successfully delivered and used across
the curriculum of secondary schools will continue to remain only a vision."
(p. 23)
The new strategy of using IT across the whole school curriculum
requires all subject teachers to use computers to deliver some of their
daily lessons, every teacher, therefore should be able to use computers
in his/her classroom successfully. This leads to the requirement of
compulsory computer training for all school teachers. This must be the
reason behind the demand that has been made by CATE for inclusion
within ITT of compulsory teacher training in computer use for every
school teacher (see section 4.1).
4-16

4.6 The Role of Computer Studies (IT) Teacher:
The shift in the pattern of use of computers in schools requires a
new role for the Computer Studies teacher in schools.
Today, in many schools, the teacher of Computer Studies is the key
figure in teacher training and computer activity in schools. He is the
manager of computer resources including school network and software
support. He has also to train his colleagues for preliminary levels (1 and
2), and to continue supporting them in their classrooms wherever they
feel necessary. Additionally, he has to teach any IT course(s) that existed
and co-ordinate computer activities in the school.
It seems that the Computer Studies teacher is the right person to
run some of the training programmes, in order for teachers to be trained
in a short time, economically, practically, and inside the schools. Obviously,
no other person can do this.
4.7 The Needs for Pre-and In-service Training for Saudi Arabian Sec-
ondary School Science Teachers:
The previous sections have argued that successful pre-service training
and INSET are a necessary precondition to the better use of computers
by school teachers. It is also apparent that the quality and effectiveness
of training programmes depend on the knowledge, experience, and attitudes
of both teachers and trainers.
Science teachers can not be successfully trained to use computers
unless they have positive attitudes towards such training. Because the
4-17

best place for training is within the schools, it may not be possible to
provide the necessary training without the cooperation of the computer
studies teachers. But preservice training and INSET require the teacher
educators to have the necessary background, skills and attitudes to
engage in such training.
The introduction of computers into Saudi Arabian secondary school
science teaching requires basic measuring of science teachers' and
educators' background, knowledge and attitudes toward the use of the
computers in science teaching. Computer provisions and facilities provided
in the schools are also important. Initial measurements of attitudes as well
as a survey of provision possibilities are addressed in the next chapter
in the context of the preliminary field work.
INSET courses are important, that is they have to be taken into
account before introducing computers into science classrooms. However,
the last section has indicated the important role that can be played by
the Computer Studies teacher. Thus, another target for the preliminary
study was obtain preliminary data for later study of the possibility of
science teachers being trained by their computer studies colleagues.
4-18

CHAPTER 5::
THE PRELIMINARY FIELD STUDY
5.1 Aim of the Study:
The main purpose of the thesis is to consider some of the problems
that may arise when computers are introduced into Saudi Arabian secondary
schools and used to aid science teaching.
During March and April 1991, a preliminary study in Saudi Arabia
was carried out to confirm the structure and scope of the main field work
(to be discussed later in Chapters 7 to 10). The function of the preliminary
field study was to investigate the possible content of:
• a self-completed questionnaire for secondary school science teachers
(ST);
• a survey of computer facilities currently available in the secondary
schools.
• a structured interview schedule for use with science teacher trainers
(STT) and others responsible for the improvement of science
teaching;
• a structured interview schedule for use with the officials in the
Ministry of Education who are responsible for schools policy.
5-1

5.2 Content of the Interviews:
For the majority of the field work, three semi-structured interview
schedules were developed from the previous literature in the field and
were used with three types of samples throughout the period of the study.
The topics covered by the STs' and science teacher advisors' (STAs)
interviews were: teacher knowledge about computers; previous teacher
training and experience in computers; teacher attitudes to the use of
computers to aid science teaching and their introduction into the science
classroom; teacher attitudes toward computers in education and generally.
Main objective of gathering data from computer studies teachers
(CSTs) was to survey computer facilities which could be used to aid
science teaching.
STTs were interviewed under the headings of: knowledge about CAL;
attitude towards CAL and attitudes towards the introduction of computers
to aid science teaching in secondary school. They were also asked to give
their comments about the contents of the three interview schedules.
Before the interviews were carried out, draft interview schedules
were trialled with one ST, one STT and one CST. Results of these trials
suggested that some questions should be deleted, others combined, and
the order of some questions changed.
A copy of each interview schedule as used in the preliminary study
is attached in Appendix C.
5-2

5.3 Methodology:
5.3.1 Method of Collecting Data:
Data were collected in person, by letter and by telephone conversations.
All of the interviews followed a semi-structured format which was adapted
from time to time according to the responses of previous interviewees.
Also, during the interviews the discussion was directed towards specific
areas of the study relevant to the knowledge and experience of the
interviewee. For this reason, some interviews covered all topics, while
others did not.
There were telephone conversations with three teachers in Riyadh
city following the main procedure of the original schedule. Interview
sheets were also given to three teachers in Madinah city, who were
requested to write their responses.
The time spent on each personal interview was from 20 minutes to
two and a half hours, while the telephone conversations took 10 to 30
minutes. The interviewer recorded responses using a structured response
sheet and tape.
5.3.2 The Sample:
The samples were chosen by the interviewer as convenient to visit
and available for discussion. They were chosen from three main cities in
Saudi Arabia with different LEAs: Riyadh, Jeddah, and Madinah. Three
types of sample were included: science teachers, computer studies teachers,
and science trainers as follows (Table 5.1):
5-3

a) 17 STs: 1 from Riyadh and 16 from Madinah including 1 in a private
school , 2 vice-headmasters (VHs) who were STs.
b) 7 CSTs: 1 from Jeddah, 4 from Madinah including 1 in a private
school, and 2 from Riyadh including 1 computer studies advisor
involved in computer curriculum development at the Ministry of
Education.
c) 3 STTs from the college of Education in Madinah.
Group Occupation Total
Riyadh Jeddah Madinah
ST ST 1 - 13 17Private ST 1VH was ST 2
CST CST 1 1 3 7Private CST 1CST & CSTA 1
STT STT - - 3 3
Table 5.1 Description of the sample by location
5.3.3 Limitations:
The nature of this study did not require specific randomization of
the sample, so the sample was chosen from a wide range of persons likely
to have useful information and who were available for interview. For this
reason, the findings are merely indicative of the scope of school facilities
and respondents' qualifications.
5-4

5.4 Findings:
The data collected from 17 STs, 7 CSTs and 3 STTs were scanned
and analysed. Two types of findings were drawn up from the data: general
findings related to computer facilities existing in schools and general
understanding of the subject on the part of the sample, and special
findings related to the qualifications, characteristics, and attitudes of the
samples.
5.4.1 General Findings:
The excellent computer hardware available in the Saudi Arabian market
has not yet been installed in the schools. Currently, there is a shortage
of computer software in the schools. However, there are slight differences
in the availability of computer facilities among Saudi Arabian cities, in
favour of the larger cities.
The general understanding of computer uses in schools is confined
to learning about computers only. There is no knowledge or idea of
learning or teaching with computers. Moreover, the general understanding
of teaching about computers is that it is confined to learning about
computer programming.
The ST sample did not distinguish between using computers in schools
and using computers in the science classroom. Therefore, after six
interviews, it was decided to combine the two sections in the interview
schedule to be used as one section, and this was used with the remaining
subjects.
5-5

5.4.2 Special Findings:
5.4.2.1 Qualifications:
The majority of the ST sample (11 of 17) had BEd; the others had
BSc. In addition, some of them (six out of 17) had a higher qualification
such as a Diploma or a Masters degree.
The majority of the CST sample (6 out of 7) had no teaching
qualifications, though one had a teaching methods background. This teacher
had qualified at King Sauod University in Riyadh, where there is a new
computer department in the College of Education.
All three STTs selected had attended some computer courses, one had
i.vritten an article related to computers, none of them had done research
related to computers or their use in education.
5.4.2.2 Characteristics:
Although about half of ST sample (eight from 17) had a personal
computer, their computer experience was not extensive. They used these
PCs for typing and games only. Some of them (four out of 17) did not
know even how to turn a computer on and off, while only a few (three
from 17) had any awareness about using computers to aid teaching.
However, some of them could recognize some Microtext software which was
produced by Al-alamiah computer company. Table 5.2 shows the main
computer uses in science classrooms as perceived by the ST sample.
5-6

Table 5.2 indicates that the majority of the sample believe that the
objective of introducing computers to science classrooms is for tasks like
audio-visuals or writing examinations.
Computer uses in the classroom Number of responses
Audio-visual 9Writing examinations 7Saving lesson plans 4Alternative to the science laboratory 3Games 3Tutorial 3Solve mathematical exercises 2Programmed learning 2Graphs 2Saving curriculum text 2Nothing (no idea) 4
Table 5.2 Science teacher sample responses to possible computer usesin the classroom
The responses of STT sample indicated little knowledge and experience
of using computers to aid science teaching.
No training courses had been held for either STs or STTs. However,
some teachers and trainers had received some computer training concerning
general computer literacy and programming. Such courses are normally
run by private i.e non-LEA companies.
5.4.2.3 Attitudes:
Almost all of the ST sample claimed that they needed computers to
help them in the classroom, but they did not know exactly how it would
help. They indicated absolute conviction of its advantage in science
teaching. They also showed positive attitudes toward computers' roles in
society.
5-7

A few (two from 17) STs read computer articles. Meanwhile most of
the sample (12 from 17) claimed shortages of resources.
Sixteen STs agreed it would be useful to introduce computers into
science teaching, although they anticipated various problems, as shown
in Table 5.3.
Possible problems Total (from 17)
Software problems 7Difficulties with the pupils 6Economic problems 6Training problems 5Difficulties with the teachers 4Machine service problems 4It doesn't do the experiments 2Hardware problem 2
Table 5.3 Science teacher sample responses to possible problems linkedto the introduction of computers into science teaching
The STTs reported that they included some theoretical lectures about
computers in the science trainees' initial training programme. One of them
mentioned that he had written a theoretical article on the use of computers
for science teaching. The article was not based on classroom practices.
When the three STTs were questioned about their attitudes toward
the use of computers to aid science teaching, all showed positive attitudes
and agreed that it was necessary to introduce computers into secondary
school science classrooms. However, they stipulated some conditions for
the introduction such as: a comprehensive training programme for all
people involved in science teaching, adequate consideration of software,
providing clear objectives for the introduction and preparing the schools.
5-8

5.4.2.4 Factual Information:
In each secondary school there is: a computer room, a CST and 16
microcomputers, type MSX 350.
Every secondary school pupil should have three computer courses
in Management and Social Studies stream, or two computer courses in the
other three streams. The courses are: Introduction to Computers, Intro-
duction to Programming (BASIC language) and Computer Programming &
Introduction to Information Systems.
The interviews revealed meetings between CSTs and their science
teacher colleagues which aimed at improving teaching, although some CSTs
claimed that they had tried unsuccessfully to hold some courses for school
teachers.
Although no problems related to computer hardware were mentioned
by CSTs, they claimed that there were problems such as lack of computer
books, suitable room and teacher advisor.
5.5 Conclusion:
The study has showed that although the ST sample had no basic
knowledge about computers, they had favourable attitudes toward using
them in their teaching. Therefore, appropriate experience would be likely
to encourage them to use computers in their teaching.
5-9

The interviews indicated the absence of teacher training in the use
of computers. None of the ST sample had computer training and only one
of the CSTs had any training in teaching methods.
The survey has showed the shortage of CAL software in relation to
the expansion in computer hardware. Two difficulties would explain this
shortage: first, software language, because most of the commercial software
is written in English; second, shortage of specialists who can establish
a specific-use of educational software, the CAL. On the other hand, an
open market like Saudi Arabia with low taxes makes it worthwhile for
computer companies to import a wide range of high standard computer
hardware.
5-10

P AL R. 1-1 /3 ...:
IMF:P LAT civp ir cnv s o p '1" 11 E V' RELTMT-
NARY F IELDWORK FINDI NGS
The following points can be drawn from the preliminary field study
findings:
• strong positive attitudes among both teachers and educators, toward
the introduction of computers into science teaching;
• insufficient computer background among STs and other educators;
• shortcomings of computer training: nature, extent, and numbers;
• shortage of CAL software, in contrast to a wide range of computer
hardware and business software in the market;
• limited number of computer studies teachers in the school who have
both computer qualifications and teaching method qualifications.
The following sections highlight these issues.
5.6 Insufficient Computer Background:
The science sample lacked computer knowledge generally and specific
computer knowledge such as knowledge about the benefits that computers
bring to schools. Some teachers expressed regret that their students had
more computer experience than they did. "I have an uncontrollable feeling
when some of my students ask me things about computers which I do not
know" one science teacher said. Another teacher did not know the meaning
of "programming",athird did not know how to turn the computer on or
5-11

off. Some doubted whether there is a relationship between computers and
science teaching. (Summers (1990) examined computer knowledge of 57
teachers and found that 30% of the sample had negative feelings about
computers because of lack of knowledge and experience.)
The teachers had no chance to train inside their schools because
most computer courses were run outside schools.
There is general misunderstanding of CAL and the aims of introducing
computers to aid science teaching, as the majority of the sample interviewed
did not distinguish between learning about computers and learning with
computers. Therefore, the main study will take into account the sample's
limited background and misunderstanding and will avoid terms like CAL,
CBL, etc.
5.7 Shortage of Computer Education Specialists in Schools:
Each secondary school in Saudi Arabia has only one CST. A small
number of these are qualified teachers, the majority are engineers or
computer specialists. CSTs reported their need for more teachers to help
them in the computer room. The preliminary study showed shortages of
computer specialists in Saudi Arabia generally, and most of them prefer
to carry on in their subject or to work in the industrial sector rather
than to teach in schools.
The absence of computer teachers' training in teacher training colleges
and educational institutes made it necessary for the Ministry of Education
to look for computer engineers and specialists to teach computer studies
5-12

courses on a temporaray basis. The only institute which has recently
provided training on computers as well as teaching methods is the College
of Education at King Saud University.
5.8 Shortcomin gs of Computer Training:
Because of STs' lack of computer experience and their urgent need
for computer training, plans should be made for their training. However,
before that is done, the type of training needed should be considered.
Training should be aimed at giving STs appropriate experience to use
computers in their classrooms.
Teachers will not be required to know how computers work, or how
programs can be produced, but how computers can be used, in their
teaching, just as a person can drive a car without knowing how it works.
Mindura (no date) carried out a computing training project to be
used for Arab subject teachers. He suggested that computer colleges and
institutes could run the programme, and suggested the following content
for the programme:
a) Introduction to computer science and programming (1);
b) Introduction to computer science and programming (2);
c) Computers and learning;
d) Processing and microcomputers;
e) CAL;
f) Microcomputer applications.
5-13

The programme requires four full terms, but Mindura gave no indication
of the programmes financial cost, or how much the Ministry of Education
would need to spend to cover for teachers who will be away from their
schools for two years. This programme is comprehensive, and teachers
who attended the programme would learn to teach computer studies courses,
not just to use computers as a subject aid. However, the programme is
not practical, because the Ministry of Education which previously provided
only a few short INSET courses, would not accept a two-year course.
Another problem is that the teachers do not need training on programming,
because they are not going to teach computer programming, but they
need to use computers to assist their teaching.
A practical training programme might be held inside the schools, in
a simple and economic way. This would very likely be accepted by officials
and teachers as well. The training programme should take into account
teachers' personal benefit, as well as their real needs in the classroom.
Some CSTs have indicated their willingness to train their science
teacher colleagues. In this case, training courses could be held inside
schools for minimum cost. CSTs are already teaching school pupils the
computer studies courses 1, 2, 3; therefore, they could give extra courses
for their science teacher colleagues. More investigation of this possibility
is carried out in the main fieldwork.
The fieldwork findings (Chapter 10) will give further details about
the willingness of CSTs to take part in the training of their science
teacher colleagues.
5-14

5.9 Will Computer Studies Teachers Share with Their Science Col-
leagues?:
The preliminary study indicated a lack of training in teaching methods
among CSTs, and a lack of computer literacy among STs. This supports
the idea that it might be appropriate for CSTs to share computer provision
with their science colleagues in the schools. The sharing could achieve
the following objectives:
. The sharing would allow CSTs to train their science teaching
colleagues on computer use inside schools. This would be more
acceptable for science teachers.
. Science teachers could obtain benefits such as computer awareness
and confidence as well as being assisted in their science teaching.
. It would save money and time. Science teachers could use the same
machine and the same computer room as CSTs use.
. STs could train their computer studies colleagues in methods of
teaching. Therefore, there would be no need for INSET courses
outside schools in teaching methods for CSTs.
School-based sharing between CSTs and subject teachers exists and
has been successful in the secondary schools of some industrial countries
such as UK and USA (see section 4.6 in Chapters 4). Therefore it would
be worthwhile for Saudi Arabian secondary schools to start by sharing
between CSTs and STs. If this succeeded, the sharing could be extended
to other subject teachers.
5-15

5.10 Computer Machines:
The preliminary study showed that the number of computer machines
in each Saudi Arabia secondary school is about 16 computers, type MSX
350. This type is similar to the BBC machines in the UK, which are not
a standard type and therefore need a special type of software compatible
with these machines only. The schools lack common types of machines
which are normally low-cost and easy to use.
The compatibility of school computers with those readily available on
the market would make a wide range of both hardware and software
available. The cost of commercial types is more economic in the Saudi
Arabian market. For both reasons the use in schools of standard types
such as IBM and its compatibles, or Apple Macintosh, would be more
practical for both students and teachers. One objective of the main
fieldwork is to investigate the policy of the Ministry of Education regarding
computer provision.
5.11 Shortage of CAL Software:
The only CAL software available in the Saudi Arabian market is a
small range of Microtext programs produced by Al-alamiah computer
company for different subject curricula, such as science, mathematics,
geography etc. This type of CAL simply transfers text from books to the
screen (see Microtext in Chapter 2). The programs do not provide any
assistance or encouragement to the user. Some pictures which already
existed in the books are provided. At the end of each program, the user
5-16

is asked to answer some questions, usually similar to those in the text
books. If the student answers a question correctly, then the computer
asks him another question, but if he does not, the computer then gives
some extra explanations, until the pupil gets the correct answer.
Little benefit can be gained from Al-alamiah software, yet it costs
about 500 S.Riyals (£80), while the cost of some business software is
around 250 S.Riyals (£40). The high price of Al-alamiah software reflects
the lack of CAL software in the Saudi Arabian market.
Although a few parents have bought these programs for their children,
the majority of students have no opportunity to use or even see them.
There was also little knowledge about them among the ST sample, although
half of them had personal computers.
In any case no significant aid to science teaching is being provided
by this kind of software, as it is too inflexible. Each program is produced
for a specific topic only, which could be one reason for their high price,
they need sensitive work and materials to cover a small subject area.
Moreover, this type of CAL has minimal interaction between the computer
and the learner.
Could alternative software be used? The Saudi Arabian market has
a wide range of general computer applications which are used for business
purposes. These types of software can be used in different languages
including Arabic; they are available at economical prices, they are easy
to learn and use as is shown in the next chapter. But the question is,
can such software be used to aid Saudi Arabian science teaching?.
5-17

CHAPTER 6
GENERIC SC)FTWARE AND ITS USE
JP Co Ft SC I ENCE TE CH I NG-
6.1 Introduction:
Chapter 3 has indicated some problems of using CAL for science
teaching, such as high price, low quality and little benefit. The preliminary
study has suggested there are further problems with the use of CAL in
Saudi Arabian science teaching that are related to the language. Because
each CAL program is produced for a specific subject, it is impossible to
use it with another, especially in a different language, therefore, because
most CAL software is not in Arabic, little or no CAL could be found for
use in Saudi Arabia in the short term.
In addition, the preliminary study has shown the lack of computer
knowledge and experience of science teachers and educators. Therefore,
an extra difficulty in using CAL could arise here.
In recent years, educators concerned with computers in schools have
argued the great benefits of introducing the types of software which the
business and industrial sectors use. (See for example McLeod & Hunter,
1987; Troutner, 1988; Elliott, 1992; Beare, 1992; Turner, 1992.). Generic
(business) applications are the types of computer software which are
originally produced for non-specific content; these are free "tool-kits"
6-1

for whatever content can be put in. Consequently, they can be used as
a tool for several topics and subjects for various business and education
purposes.
Generic computer applications are rapidly being launched into schools
in countries such as UK and USA. Recent studies in the field of computers
in science teaching indicate successful integration of these types of
software into the science curriculum. Advantages such as low price, high
quality, relevance to the pupils' future needs, simplicity of use for both
teachers and students, ready availability, and so on, have given further
impetus to the use of these types of software in the science classroom.
Databases (DB), spreadsheets (SS), and wordprocessors (WP) are the
most popular generic software in the commercial market. All of them have
been used for subject teaching. Databases and spreadsheets are used
widely in science teaching today.
Using DB and SS for science teaching in SA would solve many, perhaps
most, of the software problems because a wide range of these types of
software already exists in the Saudi market, with Arabic language or
Arabic support. Digranes and Digranes (1989) stated that:
"Locating instructional materials specifically designed forvarious cultural groups is difficult because such materialsare typically limited or non-existent. The teacher's optionsare to create new instructional materials or to adapt otheravailable materials to the special cultural needs. Creatingnew instructional materials is a labor and time-intensiveprocess. Teachers will often choose to adapt existinginstructional materials. Computer software applications, suchas wordprocessing, databases, and graphics programs, arecommercially available instructional material that can beeasily adapted by teachers to meet special cultural needs."(p. 20)
6-2

Another advantage of using these applications is that little training
for the teachers will be required; the preliminary study shows some STs
already use them. "I use my PC for typing and organizing my personal
library; it is easy for me to do this", one ST mentioned during interview.
Therefore, a short training period should suffice, which would be pleasing
to both science teachers and the Ministry of Education.
In all types of generic software applications, computers can make an
important contribution to enabling students to become active learners
through open-ended investigations and problem-oriented questions. This
can encourage them to formulate actively and try out their own ideas,
rather than simply follow a list of instructions as to what to do (Beare,
1992). This method of teaching fits in with a constructivist view in which
students are seen as actively constructing meaning and understanding
for themselves, rather than receiving it passively from teachers and
textbooks.
This chapter reviews some literature concerning generic software in
teaching and presents examples and ideas about its use in science
classrooms. It examine databases and spreadsheets, each application being
followed by illustrative examples of its use for science teaching.
Because a wordprocessor is not specific to science, but it is also
suitable for other subjects as well, only a brief description of the use
of WP is presented later in this chapter.
6-3

At the end of the chapter, electronic mail and datalogging are briefly
discussed as examples of other generic software which are up to the
present less relevant and less commonly used in science classrooms.
17" A. Fla' A. : r) A. 'T' A.13 A S E
6.2 What is a Database?:
A database system is a way of storing data and keeping track of
related items which makes it easy to recall, investigate, add to, amend
and sort the stored data. If the system is based on a computer it usually
means that large quantities of information can be handled accurately,
relatively quickly and without fatigue. A Computer-store of information
can also be cleared and refilled very rapidly with completely new
information. A database is simply a medium for collecting together quantities
of data in a form where they can be retrieved, Searched and ordered
with ease.
A database is divided into records. For example, each card in the
personal phone directory is a record, and each record contains various
kinds of data (names), area codes, numbers, street addresses, etc. These
categories are called fields. When one writes a particular name (Sarah)
or area code (0482) in the record, he is putting an entry into the field.
Daines (1984) has suggested nine operations for manipulating data:
. data capture-obtaining the data,
. data input-entering it into the system,
. organisation-sorting data efficiently,
6-4

• storage-retaining the data,
• search-finding desired items,
• manipulation-adding totals, comparing, etc,
• retrieval-bringing the data out,
• presentation-making it meaningful,
• evaluation-applying standards.
A database is a shared collection of interrelated data designed to
meet the needs of multiple types of end users (Martin, 1981). Either textual
or numerical data can be used. A simple way to represent data is in
two-dimensional tabular form. The tabular form is a logical structure for
the user which is different from the way the data are actually stored.
Various commands are used to create the file, insert and delete, edit,
retrieve, search and arrange information, change the layout, and make a
report which can be printed or inserted into a wordprocessed article
(Brown, 1987).
Databases are normally designed to be expandable and to be as flexible
as possible, containing words and clues as well as words together with
a classification group; therefore they consist of two sections: the actual
information and the various classifications.
6.3 Using Databases in Teaching:
The ability of a database to organize and retrieve information quickly
according to many criteria, which its user can modify at will, is a powerful
tool with which students should become familiar -as part of their computer
literacy- as early as possible (McLeod & Hunter, 1987).
6-5

The computer can bring a new dimension to the teaching of a variety
of subjects by acting as a resource, offering almost instant access to
information. This raises questions about the ability of pupils to cope with
information and the need to learn about information handling on a personal
basis. It is quite possible to collect information for the sake of collecting
it, to refine the access procedures until they become an esoteric art form
and to concentrate on individual items to the exclusion of the whole. In
schools, students are usually dealing with relatively small amounts of
data, but the skills of handling these data could be given to the learner
naturally through learning some basic database procedures.
The increasing use of information-handling software, both inside and
outside schools, is creating a growing demand for more highly developed
information-handling skills than have been generally encouraged in the
past. For instance, "Use your periodic-table to find out ... and then
complete the following paragraph." These skills could be developed through
the use of computer databases if the children are encouraged to ask
themselves a set of questions, investigate, conduct some research or solve
a problem and consider the part that the computer might play (Straker,
1989).
As students become familiar with databases, they could add information
to the base from their own experience. They could determine what question
they want to ask, what data they need to answer it, and how they should
best organize that data (McLeod & Hunter, 1987).
6-6

Acquiring problem-solving skills continues to be an important part
of the general goals of education. Some educators have chosen to direct
some of their curriculum-development efforts toward teaching inquiry
skills as part of problem-solving skills within their subject domain. Berge
(1990) emphasized that using a computerized database is one possible
helpful approach in teaching these skills successfully. Unlike topic-specific
CAL, databases being content free can be used as a tool for a variety of
problem-solving activities rather than presenting specific material or
information. Newell (1980) argued that the problem solver first constructs
a plan in some abstract or simplified "problem space" and then uses that
plan to guide the solution to the problem.
The interactive nature of computer learning often allows students to
discover quickly whether or not their plans work. The computer need not
be viewed as a discipline (i.e. computer science and programming), but
as a tool for encouraging activities and skills already stressed in the
established subject area. (This concept of using the computer as a tool
to promote inquiry skills is already stressed in subject learning.)
Sartor (1985) argues the development of critical thinking skills in
creating and working with databases, while Little (1985) suggests that
students start with generalization and determine what information they
need to give an informed opinion. Then, students gather the data and
use them to see if the generalizations apply. When they are working with
a sample of the population, students should be encouraged to make
inferences from the data.
6-7

One of the most difficult tasks in planning a database is to understand
the data needed by the users and to be prepared for increased use of
the database as users realize its potential. There should be a high degree
of sharing of data so that they are used in multiple applications'. In
designing a database one collects the data requirements and creates a
logical model of the data, taking into consideration the requirements of
the "ready-to-use" software. Users should have to know as little as
possible to get started and to use the database. Users should not need
to know how a database works, but only how to use it (Brown, 1987).
Brown (1987) and McLeod & Hunter (1987) argue that when students
ask the computer to produce the data in various configurations, they are
like a research scientist organizing the results of experiments to test
hypotheses. They emphasize that using databases in the classroom places
students in the position of the research scientist with many assistants.
Scientists formulate hypotheses on the basis of prior knowledge. Then
they plan and conduct experiments to gather relevant data that can help
to confirm or reject their hypotheses. Sometimes they need to consider
their information many times in order to be sure they have the right
answer. And sometimes, they find an unacceptable answer, or none at all,
as a result of which they modify their assumptions. This is exactly what
happens to the students when they use a database in the classroom, and
of course, there is no doubt that these activities are important in modern
teaching.
1 ' Such as Electronic Mail presented later in this chapter.
6-8

Many studies have shown the success with which database can be
used in teaching various subjects. Freeman and Tagg (1985) summarized
the background to the development of the QUEST 'family' of programs
and demonstrated the way they can be used in teaching of History and
Geography. They also made comparisons with other database programs.
They concluded that the user (pupil or teacher) is in charge, not
the computer and that MicroQUERY and QUEST are powerful pieces of
software. They emphasized that a database is a 'powerful vehicle'.
Another review of the QUEST database was carried out by Smart
(1988) who has reported on five QUEST projects studied during 1985-86:
All About me; Our Weather; Our Food; Our Street and The World Cup.
The review indicated that the database acted as a catalyst, encouraging
and actively promoting a wide range of learning situations that might not
otherwise have occurred.
Knight and Timmins (1986) studied the use of several database programs
currently used in classroom teaching. The study included: FACTFILE;
QUEST; QUARRY BANK 1851 and B BASIC. They found them extremely useful
in teaching the process of historical enquiry such as the cognitive skills
associated with 'evidence handling' and social skills relating to small group
work. They reported also that a database can help children to hypothesize
about historical situations or events.
Low and his colleagues (1988) have shown the feasibility of a shared
database of instructional strategies and support materials. They stated
that there are two main advantages to using them in the classroom: first,
6-9

for teachers, databases can aid teaching effectiveness, and they can save
time; second, databases can easily bring many pieces of information relevant
to teaching particular topics into one place.
Three reasons for using databases in subject teaching were seen by
Langhorne and his colleagues (1989). First, they teach students'
data-manipulation skills which are vital in the "information age", because
today's students are entering into a technology-driven, information-rich
society, where skill at using technology to access information is essential.
Second, such a system provides a means for teaching higher-order thinking
skills like classifying, comparing, contrasting, drawing inferences,
hypothesizing, generalizing, and using Boolean logic. Third, databases can
serve as an instructional vehicle for imparting a specific content. In any
given curriculum area, in any particular content, the classroom teacher
is faced with selecting an appropriate method for putting the content
across to the students in the way which will most effectively and efficiently
bring the student to attainment of the lesson objectives, database can
assist.
6.4 Examples of Database use for Science:
Science teaching is well suited to the use of database software, since
it emphasizes solving and inductive reasoning within a subject domain.
Databases promote inquiry and thinking skills which receive a great deal
of attention and are emphasized as being at the heart of science education
(Berge, 1990).
6-10

Although databases have only recently been integrated into the science
curriculum, the flexibility of such software has given rise to a rapid
increase in educational packages concerning science subjects. The following
sections give some examples of database packages that are or have been
used for science teaching in the secondary school. QUEST and BP are an
early examples of generic software to aid science teaching. QUEST has
non-menu drive command. The BP Energy File shows the limited freedom
on the part of the user in an early database application for science
teaching.
6.4.1 QUEST:
QUEST is an information handling package. It enables the user to
manipulate quickly and easily a large amount of information. The user
can organise information, change it, add to it or ask questions, and display
the data in text and graphics on both screen and printer. The user can
choose what he wants without having to adhere to a pre-set structure
of responses required by the computer.
Three sample databases are included on the QUEST distribution disk:
. PTABLE: containing information about some of the properties of the
elements of the periodic table. There is a record for each element.
• HAMLET: containing one record for each line in the first act of
Shakespeare's famous play.
• TENNIS: an administrative database containing information about
some of the members of the fictitious Hatfield and District Tennis
club. There is a record for each club member.
6-11

QUEST has commands available to show on the screen. If the user
types:
COMMANDS, he will see (Figure 6.1):
COMMANDS
GO INFILE PRINT
QUERY RESET VALUES Figure 6.1 QUESTHELP EXPLAIN OUTFILE main commandsCOMMANDS FORMAT EDIT
ARCHIVE SORT EXACT
JUSTIFY SCREEN SPRINTER
CONTINUE CATALOGUE KEY
HEADING MEMORY DELETE
TRANSFER USE FINISH
PTABLE is an example of the use of QUEST in the science curriculum.
To start QUEST, the user types: QUEST
Before searching a database, it is essential to select which database
is to be used. The command INFILE is used to select a database, followed
by the name of the database required. Therefore, the user would next
type: INFILE PTABLE
The display changes to show a summary of the database called the
VALUES screen (Figure 6.2).
6-12

VALUES Fields [press <ESC> to swap]
Infile: PTABLE
Outfile: Con:
Records: 92 (Max: 192 )
Fields: 16 Exact: NO
Go: Max Search: 80
Space: 65536 Format: 2
Fields in memory:
Query:
Print:
NUMBER ELEMENT SYMBOL MASS
DATA DISCOVER ENERGY GROUP
MELT BOIL DENSITY SHELL
Figure 6.2VALUESscreen afterinfiling thedatabasePTABLE
In order to look at the complete content of each record, it is necessary
to type:
PRINT ALL
which tells QUEST to display all the information about the element(s). By
typing: GO 1, it is possible to display full information about element
number 1 (Figure 6.3):
The GO command starts the search while the number following GO
tells the computer how many records to display. In the previous case
only one record is requested, thus only one is shown. The user will then
see:
6-13

NUMBER 1ELEMENT HydrogenSYMBOL HMASS 1.00797VALENCY 1OTHERVPERIOD 1GROUP 1FORM 5MELT -259.19BOIL -252.7DENSITY 0.00008375
- _
Continue (Y/N)
Figure 6.3 Full information about the elementnumber 1
Continue ( yin)?, press Y to see another record, but if the user presses
N, the search will be interrupted. The screen display will indicate the
number of records reading, for example:
** Interrupted **
3 record searched
1 record matched
To return to the screen, the user should type:
VALUES
Type: QUERY VALENCY EQ 3, This means:
QUERY Ask QUEST to select all records for elements which ...VALENCY ... have a valency ...EQ ••• equal to •••3 ... the number 3.
To start the search, the user should type: GO
And QUEST responds with:Counting ...92 records searched18 records matched
6-14

ELEMENT: Boron
ELEMENT:Aluminum
ELEMENT: Scandium
ELEMENT: Chromium
ELEMENT: Iron
ELEMENT: Gallium
ELEMENT: Arsenic
ELEMENT :Yttrium
Continue(Y/N)?_
Figure 6.4 The first eight elementswith a valency of 3
This means that QUEST has searched through all 92 records and that
18 of them satisfied the condition specified by the QUERY. Nothing was
displayed because the PRINT command had not been used.
To select the names of the elements for display, type:
PRINT ELEMENT (ELEMENT is the name of field required; it is not ELEMENTS).
Next, he types: GO 8
The QUERY is still as it was last defined, so the user will see the
list of elements which have a valency of 3, eight at a time on the screen
(Figure 6.4)
A simple QUEST database has four parts: QUERY, <fieldname>,
<relationship>, and<value>. e.g. QUERY, VALENCY, EQ, 3.
Any field can be selected and a number of different <relationship>
codes are allowed. There are two types of codes: numeric and string. Here
are some of them:
6-15

• numeric relationships such as: EQ= Equals, GT= Greater than, LT=
less than.
• string relationships such as: IDENT= Identical to, SUB= contains the
sub-string (i.e. the sequence of characters).
To find elements with a valency equal to 3, or less than 3, or greater
than 3, the user should type:
QUERY VALENCY EQ 3, orQUERY VALENCY LT 3, orQUERY VALENCY GT 3.
The value following a numerical relationship will be a number (see
examples above), while the value following a string relationship can be
any group of characters, which must be enclosed in double quotation
marks.
To find the names of all elements known since ancient time, the user
then types:
QUERY DISCOVER IDENT "ANCIENT"PRINT NUMBER ELEMENT SYMBOLGO 13
The ancient elements are shown on the screen which finishes like
this: (Figure 6.5):
6-16

Figure 6.5 Some 'ancient elementsNUMBER :6
ELEMENT: Carbon
SYMBOL :C
NUMBER :16
ELEMENT: Sulphur
SYMBOL :S
NUMBER :80
ELEMENT:Murcury
SYMBOL: hg
NUMBER :82
ELEMENT: Lead
SYMBOL :Pb
92 records searched
10 record matched
The relationship SUB allows a search for a sub-string. For example,
to find the elements with the letter "s" in their SYMBOL field, the user
types:
QUERY SYMBOL SUB "S"GO 3
Although all this information about PTABLE exists in the database, it
is also possible to edit more in the print statements, or to edit an existing
QUEST database by using the command, EDIT. It is also possible to delete
unwanted files to make room for data to be saved, by using the command,
DELETE
On finishing working, one leaves QUEST by typing FINISH.
6-17

6.4.2 The BP Energy File (BPEF):
This pack is published by British Petroleum (BP) Educational Service.
It is a small database intended specifically for use in teaching. It uses
energy data from the BP Statistical Review of World Energy, and national
income and population data from the UN Statistical Yearbook. The pack
includeds: Tutor's Guide; Program Notes; some Worksheets (Forecasting,
student worksheets, maps) and a floppy disk.
The BPEF has 5 main curriculum areas of use:
1. Economics and Business studies;
2. Geography;
3. Computing: Use for useful, inter-disciplinary and confi-
dence-building student projects and analysing what a data-base
is and does.
4. Science: Use as a resource for Physics and Chemistry syllabuses
at both GCSE and A levels,
5. Environmental Science: Use as a resource for investigation patterns
of use of energy both by source (e.g. Nuclear and Hydro) and
by consumption per head and per unit of national income.
To start the program, the user types:
BP, then by pressing <space bar>. He will see:
6-18

B P Educational Serves
THE ENERGY FILE
by
Ken Randall and Alen Haweley
1 Check the data available
2 Table/graph data
3 Try to forecast
4 Explain these options
O Exit
Options:
Please type a number (0-4)
The BP Energy File
Data FILES are of two kinds: Comparisons
Time Series (1988 values)
(1964-1988)
1 Oil Used 10 Oil Prod 14 Oil Res
2 Gas Used 11 Gas Prod 15 Gas Res
3 Coal Use 12 Coal Prod 16 Coal Res
4 HydroUse 13 T En Prod 17 Oil Prod
5 Nucl Use 18 Gas Prod
6 T En Use 19 Coal Prod
7 Pop Use 20 Oil Used
8GDP 21 Oil Ex
9 RefinCap 22 Oil Im
23 Gasolin
Figure 6.7 BPoptions
Type : 1-23 for file datails
0 to return to the main menu_
Figure 6.6 The mainmenu of the BPdatabase
There are four different choices for the user, and he can exit from
the program any time, wherever he wants, by typing a
If he types /, then he will see:
If the user chooses one of the first kind (time series) the computer
will disply four options:
1. one file as a TABLE;
2. one file as a GRAPH;
3. two files as TABELS,
4. two files as GRAPHES.
6-19

It will then display 35 countries and regions for selection, and will
ask the user to choose one from the Data FILE. If he does so, he will see
something like Figure 6.8 (this case TABLE for Middle East Region):
Years Mid East
Oil Used Wronnes
1977 78.9
1978 81.51979 75.41980 82
1981 89.51982 1031983 115
1984 109
1985 108
1986 108
1987 n a
1988 n a
Please type: 1 to graph these items
2 to print this table
3 to see index&ratio
0 to return to the main menu
Figure 6.8 Middle Eastoil used 1977-1988
If, back on the main menu, the user choses 2, the tables and graph
facilities will be displayed very like the last display.
If he choses 3, then he could create his own data, and the computer
will table and graph it if he wishses. For example, the computer will give
the last table with just half a column (Years), then it will ask the user
to complete the rest.
Three types of Workskeet are included in the BPEF:
. forecasting: one double side page explaining the forecasting
with/without model;
6-20

some empty maps: required to answer some questions in the
• worksheets,
• student Worksheets: these give the student some instructions, then
ask questions relating to the screen situation. Here is an example
of a Worksheet:
Worksheet 4
World Energy
Requirements: The BP Energy File DiskReference SheetPencil and Paper
Instruction: Read the questions below, then study the programindex to decide which file you will need to look at to answereach one. Make notes of any figures or trends you requirebecause the program does not print results.Write your answers on a separate piece of paper, illustratingthem with any graphs or diagrams you think necessary.
Questions:1. What is the trend in total energy consumption over thelast ten years? Can you think of any reasons to explainthis?2. Is the consumption of any type of energy going againstthis trend? If so, why do you think it is?3. Which region has the greatest total energy reserves?4. If world gas consumption remains the same as last year,how long will the published-proved natural gas reserveslast?5. Calculate which of the major coal producers will use theirreserves first, assuming production remains at last year'slevel.
Because it is menu-drive, the BPEF requires less understanding on
part of the user of both databases and the process of database enquiry.
6-21

In contrast with QUEST, the BPEF database showed easier but more
specific type of generic software. Both databases were established some
years ago during the early period of using generic software in teaching.
QUEST has a weakness with its relatively difficult commands, while the
BPEF is not a typical generic software where the user is free to put his
own content.
More recent databases, however give the user freedom to put whatever
he wishes. For example, DataEase and Works for Windows both use Windows
environment, which has friendly menu-drive, more options and is totally
free for the user's data.
6-22

PART El: SPREADSHEET
Spreadsheets have a wide range of uses in the commercial sector.
Some spreadsheets are more powerful than a database and often have
more statistical options such as calculating, summating and analysing the
data. Recently, the commercial market has witnessed a rapid increase in
the availability of better and easy spreadsheet packages for Microsoft
Windows and Macintosh. For example, Personal Computer World (a commercial
magazine) devoted almost all the 500 pages of the March 1993 volume to
reviewing and advertising spreadsheets. At that time, John Barnes, the
Group Editor said: "One spin-off of this increase in the number of Windows
products has been the opening up of the spreadsheet market to non-expert
users." (PCW, p. 9)
6.5 What is a Spreadsheet?:
Originally, a spreadsheet was a large page of paper, divided into two
parts: horizontal rows and vertical columns, and used by accountants for
calculations. With the arrival of computers, the spreadsheet has became
somthing more elegant. Numerical data can be based in the computer's
memory and can be processed and modified in various ways. If the data
are interrelated, then the relationship issue can be seen immediately on
all relevant numbers. The computer can present data results in whatever
form the user wants: tables, graphs as well as a number of numerical and
alphabetical styles.
6-23

A microcomputer spreadsheet is a rectangular format of data set out
in rows and columns. In some sheets, columns are labelled using letters
of the alphabet and rows are labelled numerically. In the spreadsheet
system, an individual entry, or box, can be identified as for instance F5,
Z13 etc.
Each spreadsheet box in the grid is known as a cell, and the cells
may contain formulae that can define the contents of one cell in terms of
the contents of other cells on the spreadsheet. What arises in one cell
may be the result of adding together the contents of several other cells.
Osborn (1987) identified three purposes for each box:
1. to store and display text, such as an explanatory heading for the
contents of a column;
2. to store and display a number, i.e. an item of data;
3. to store a mathematical formula, and display the numerical result
of this expression, acting upon data already present in the
spreadsheet.
Once in the spreadsheet, data can be subjected to a wide range of
arithmetic transformations. These include addition, subtraction, multipli-
cation and division of single boxes, whole columns or rows by constants
or by other columns and rows on the spreadsheet. Trigonometrical functions,
logarithms, exponential and square roots may also be available. Averages
of values in columns or rows can also be taken (Chamberlain & Vincent,
1989).
6-24

A spreadsheet is a problem-solving tool allowing the user to represent
problems with a 'model' that can be use to explore what happens to some
numbers if he changes others on the spreadsheet. It can be an extremely
powerful tool that can take the drudgery out of recalculating sets of
symbols. It can give the user a completely free focus or the best solution
for his problem in a very simple way.
The flexibility of a spreadsheet is invaluable in all kinds of financial
planning, but this may be only the most obvious class of applications.
When solving a problem with a spreadsheet, one does not think of it
linearly; it is not necessary to break the problem down into step-by-step
sequences. Instead, the user specifies a series of relationships between
columns and rows in any order he pleases. It is also very easy to modify
a spreadsheet "program"; and adjust whichever relationship it is desired
to alter (Tinker, 1984).
6.6 Using Spreadsheets in Teaching:
A spreadsheet can be thought of as a program within a program.
Following simple guide-lines, teachers and pupils can draw up their own
templates by entering data and formulae into the spreadsheet package.
They know exactly what information is available from it and are secure
in the knowledge that it is entirely appropriate for their specific
requirements in the classroom.
One of the greatest advantages of a spreadsheet is that teachers can
generate simple templates without the need for complex formats. When
shown clearly how the formulae are structured, pupils find it easy to use
6-25

them, can readily understand them, and soon learn to generate new ones
for themselves. This instant accessibility, even to the youngest secondary
pupils, is perhaps the spreadsheet template's greatest appeal as a teaching
aid (Black, 1987).
Another advantage of spreadsheets, as compared with CAL packages,
is that large amounts of numerical data are accessible on the screen in
the spreadsheet window at the same time as the graphical displays. This
not only makes it easier to access any required data by simply 'scrolling'
the relevant window, but also helps the student by giving an overview
of the data available, its associations, and links to the charts which are
also displayed. New values for quantities entered in the spreadsheet are
immediately reflected in changes to calculated quantities and to graphical
displays. This contrasts with CAL simulation where new values of variables
for the pre-stored model have to be entered via a set sequence of
commands. The benefit is that students feel much more directly in control
of the data than when it is built into a sequential or semi-sequential type
of program (Beare, 1992).
Black (1987) suggested three methods for using spreadsheet in
teaching.
1. Co-operative method: This method usually involves the teachers
setting up a template spreadsheet. Pupils collect data for the
spreadsheet, then type the results into the appropriate place.
The co-operative method of using the computer is suitable for use
in the science laboratory when only one computer is available.
6-26

2. Sewing machine and tool box method: In contrast to the previous
method, when using this method, the computer should be readily
available for use by the pupils, with a variety of software
available.
The advantage of using this method is that pupils have an extra tool
for learning and reinforcement of ideas, as it gives more time
for discussion and hypothesis formation.
3. Battery method: This method requires at least one computer used
by two pupils, so each pupil gets the required amount of
skill-learning time. The teacher sets his pupils tasks, gradually
building up their computer skills. He carefully selects the tasks
to simulate life situations. The pupils should have a spreadsheet
guide to help them, and the teacher assists and advises them
as necessary.
The advantages of using the battery method are: all pupils get equal
time and opportunity to use the computer and spreadsheets; the
pupils are put into real life situations with some of the latest
technology; and the activities can be structured to provide a
suitable learning tool.
6.7 Examples of Spreadsheet use for Science:
In the last few years, several studies and articles have appeared
which illustrate the use of spreadsheets for various purposes in science
6-27

education, for example, Ogborn, 1987; Osborn, 1987; Elliott, 1988 and 1992;
Chamberlain & Vincent, 1989; Brosnan, 1989 and 1990; Finnemore, 1990;
Stephens, 1991, and Beare, 1992.
The following section presents two types of spreadsheet and examples
of their use in science teaching. In contrast with the previous database
examples, the spreadsheet examples have used more modern generic
software packages. The following two examples are totally free-content.
6.7.1 MULTIPLAN (MPLAN):
MULTIPLAN is a spreadsheet package available on a wide range of
business microcomputers. It allows the pupil to manipulate data quickly
and accurately. The pupils can examine a larger number of data sets than
with traditional methods. MPLAN allows hypothetical deductive thinking,
which in turn promotes a problem-solving approach to teaching. Pupils
can develop their own spreadsheets as tools for solving their own problems.
The worksheets included with the school package deliberately represent
a range of different styles so that the teachers can consider what suits
the individual needs of their pupils.
The MPLAN spreadsheet can be used by middle and secondary school
pupils. An example of the use of MPLAN in science is: a group of pupils,
collect details on the properties of different materials with the intention
of establishing which ones are metals. The pupils list these properties:
names, colour and shape, whether or not the various materials were good
conductors and whether they changed shape with hammering. They take
it in turns to enter their results on to the spreadsheet. The conducting
6-28

qualities and the change of shape indicates whether or not the materials
are metals. The spreadsheet is able to sort columns to give pupils the
information they require. Once all the results of the investigation have
been recorded, they are printed in table form similar in function to the
database, but with easier entry and more compact presentation (see Figure
6.9 below).
NAME COLOUR SHINY/ FORM HAMMER. CONDUCT MTL/NMT
DULL
CHARCOAL black dull lump no no NMETAL Figure 6.9CALCIUM grey dull lump no no METAL Example ofLEAD black dull lump yes yes METAL MPLAN tableIRON silver shiny lump yes yes METAL
IDDINE grey shiny powder no no NMETAL
SULPHUR yellow dull powder no no NMETAL
ALUMIN. silver shiny lump yes yes METAL
GRAPH. black dull lump no yes NMETAL
COPPER bronze shiny lump yes yes METAL
TIN silver shiny lump yes yes METAL
MAGNES. silver shiny lump yes yes METAL
The following example uses the sewing machine and tool box method
with MPLAN. It shows use of the instant calculation facility. The teacher
sets the class tasks: prepare, cook and serve a mid-day meal for 2 students
who require an adequate supply of protein, but only have 1.50 to spend.
Pupils can choose the best information to help them from the menu
of resources. This could include food tables, recipe books, price lists,
literature on meal planning, and the computer. If the pupils choose the
computer to help them, they could again select from the menu of software
available. In this case the teacher has prepared a spreadsheet with the
current prices of foods containing protein, and their actual protein content
6-29

Figure 6.11 Meterreadings on the1st August 1992
standing charge6.37pcharge per unit5.42p
(Figure 6.10).
PROTEIN
FOOD:COOK ORIGINAL ORIGIN COST/ PROT/ COST 10 VAL.FOR Figure 6.10UNIT COST 1000 1000 PROT MoNY Example of
MINCED BF 500.00 1.15 0.23 18.80 0.01 excell. MPLAN usingROAST CHIC 500.00 1.20 0.24 24.80 0.01 excell. calculationMILK 566.00 0.24 0.04 3.30 0.01 excell. facilityYOGHOURT 150.00 0.18 0.12 5.00 0.02 poor
FISH 500.00 1.20 0.24 13.50 0.02 excell.
It is possible to use the battery method. For example. The pupils
have the following data:
Address Name status initials het.now last
1Hull St. A Mr D 34315 34809
2Hull St. B Mr Z 07435 06732
3Hull St. C Miss J 14762 12391
4Hull St. D Miss P 64809 64580
The pupils are then asked to use the spreadsheet to calculate the
therms used, and their total cost, including the standing charge. The
pupils could also use the spreadsheet to help them forecast future costs
and developments.
A MPLAN package for schools includes some worksheets to help pupils
use the spreadsheet. One worksheet example is as follows:
Worksheet for elements.SCC
Use the TO START guide to help you load ELEMENTS.SCC.
6-30

On the screen you will see:Column 1 several elements listed in alphabetical order.Column 2 their atomic number.Column 3 the number of electrons in the outer shell.Column 4 metal or non-metal classification.Column 5 the melting point, in degrees C.Column 6 the boiling point, in degrees C.Column 7 the state, solid(s), liquid (1), gas(g) at room temperature.USE THE SORT COMMAND TO ANSWER THE QUESTIONSTO SORTSelect the SORT command TYPE SYou will see the sub command at the bottom of the screen.SORT by column :1 between rows:1 and:255 Order:(-)3/4When you have decided which column and rows you want to sort, TYPEthese numbers in the appropriate space. To move from one command toanother use the TAB key.Note:- this means in ascending order.3/4 this means in descending order.QUESTIONS1 Which element on the spreadsheet has the lowest atomic number?
2 Which element on the spreadsheet has the highest atomic number?
3 Which elements have 4 outer shell electrons?
4 Do these outer shell electron numbers relate to any other section ofthe Periodic Table?5 Explain your answer to question 4 by giving a further example fromthe information on the spreadsheet
6.7.2 EXCEL:
Excel is a spreadsheet widely used in the commercial sector as well
as in education. The suitability of this spreadsheet for subject teaching
led the majority of UK secondary schools to buy it in its early version,
that of 1990. In 1992, Microsoft produced a new Windows versions (4.0)
of Excel for both IBM compatibles and the Macintosh family. The new
versions provide further powerful facilities for both business and edu-
cational sectors (Figure, 6.12).
6-31

Reference area Formula bar Menu bar Toolbar
Column heading
121 011:1 171:III molai 1:113171112
. 1 r. I IT—
12 --------- —1---- -13 !
iI
—L--- I 1 I5 I 1 t
n
6 i I !
7 __ t 1_ti___ !
1 .9
10/
:
1112 .
1 13
15 I
16
17 7—18 .....
,
19 .LN,...
20
1:3 •
Reectv
El
Row haadino Active cell Scroll bars
Status bar
Figure 6.12 Excel main menu.
Figure 6.13 shows that there are nine "tools" in the tool-bar line of
the display as a default: Standard, Formatting, Utility, Chart, Drawing
and Excel 3.0, and three for macros. The most useful button on the
standard toolbar is the one that automatically determines which columns
of figures you wish to add up and sums them. The formatting toolbar
offers control over the font, font size, emphasis and styling of numbers.
One of the great features of Excel is its Utilities toolbar, which has the
ability to define outlines. Treating lines of numbers like lines of text in
a spreadsheet outliner allows the user to condense the area of expenditure
into a few lines to give an overview, or expand them to show detail. The
spreadsheet is also provided with a spelling-check, as well as various
6-32

FormattingUtilityChartDrawingMicroacrft Excel 3_0Macro
ToCustomize._
You can use these and other shortcut menus...
Copy Ctrl+C
Ovarbah, Saws by Diirston
f T Olii—i—CIN4 MAW ___1 _
Cral+30 i 143 260 l 647T4250 1$1.741.0113 ; .....1.___
147. i sauce, *41 0,5t1) itl,c_v_so+14.1:00 .1 .M700 I 173.1,50 tzzoso •
A921_1) 50.500 1 42n3D0 [. P1,3.8..i112.7 1E58 ISO LI1.2 ,114D0 :1 425 i6X0
I
Clear._ DelDelete...Insert...
Number.-Alignment._Font..Border...Patterns.
:all- I .XI
Sales Total by Division
09
13it121414
1617II14
South
North
West
Gallery...
Attach Text_floes—
Gridlines—
Edit Series_.
...by performing the followingmouse actions:
In Microsoft Excel for Windows,click the right mouse button.
In Microsoft Excel for theMacintosh, press OPTIONI•COMMAND
while clicking the mouse button.Patterna_.Foot..Main Chart_Overton_
3-D View...
nonn INonaa4 E3 CIEIES6
figure options, including chart and drawing tools. Excel has special
interactive help in the form of the Chart Wizard which asks the user
about the type of chart he wants to create, before creating it. A user
can choose between charts which look good but are hard to read, such
as stack and 3D bar graphs, and those which look plain but are easily
interpreted, such as line graphs and pie charts.
Figure 6.13 Different options of Excel.
Excel also provides advanced analysis functions, including finding
values through interaction. The function can either cycle a number of
6-33

times or until the value found stops changing within a certain tolerance.
It has many statistical analyses for many types of data. It also provides
an area of the screen into which the user can put his data and the results
are presented in another range of cells.
The spreadsheet allows the user to store, manipulate, calculate, and
analyse data such as numbers, text, and formulas. It is possible to add
a chart directly to the worksheet and add graphics elements such as
lines, text boxes, and buttons on the worksheet. Cell styles, drawing tools,
charts gallery and tables can be used to produce high quality presentations.
These can be displayed directly on the screen or printed. Additional to
its chart options, it is very easy to operate, via pull-down menus, windows
and a muse.
Today, Excel spreadsheet is perhaps the best known spreadsheet
among science teachers in the developed countries. Almost every UK
secondary school has a copy and it is used mostly for science teaching.
In additions to its IBM and MAC versions, Excel has recently launched
new versions in international languages including Arabic, and is available
now in the Saudi Arabian market.
Excel spreadsheet is a powerful tool for science teaching. An example
of a science topic which could be taught by Excel is "Density" 1. The
science teacher could give his students regular blocks of say 10 materials.
The teacher enters the substance names in the first column in the
1. Density occupies two lessons in the Saudi Arabian Physics curriculum in the second
year of secondary level (Ministry of Education, Physics curriculum, 1993).
6-34

spreadsheet, lets his students weigh each substance and enter mass values
in the second column. The students also measure each substance length,
width and height, and entering them in the next three columns. By using
the spreadsheet calculator facility, the students then calculate volume for
each substance and then the density for each material (Figure 6.14). The
students devise a formula for the sixth column (volume), as: Volume=
Length x Width x Height, and the seventh column (density) as: Density=
Mass/Volume, Excel can automatically then calculate the volume for each
substance and the density for each material, after they have entered the
valuses of each substance.
jile dftC16: [U11]
rtyla 5' ph Nint Oatablme Elool ptions lindow
n B 0 F F 61a...
Mal (n ial MaNs Length Width Heiciht Vi/ltwri Doir-iilyWilmaci3 . Wood .›." .;.n ..": 4!) 43 20 48C 3 Li.' IGII
4 All,roiniani 5C0.4 :3 C 6 20C 2.032567
Steel,GkIse.Leric!
468 2ca3
.)CI) !
,
4....n
1.9
22
4 R
r:10
4.1.1
E:343
.2 IR
•.' 8:122 :: DBH..38
Esc
14-'1
n Pe-spex 47 10C 7 2 -IOC 3.110 foGal5 1-'0:yt:Itwrenc- -1 : :?;? 8 If: :IE..' 9 a 01:::10 Site 113 2 7 10 -13 2.02:::•
xi Wre... 51 ..* 51 7 5 I12 Brass 1E0.3 5 2 7 - 23 B.::1 s13 luys14
levinl15
17
1920.
22
6 -1.W41 [1] READY
Figure 6.14 Spreadsheet display: Name, Mass, Length, Width, Height andoutput: Volume and Density of 10 material blocks.
6-35

dLea
JMAlumini
Glass
0 2 4 6 8 10 12
Pupils could display the material names and densities on bar or pie
charts as they wish. From charts such as Figure 6.15, pupils could build
up their understanding of low/high density for different materials, easily
comparing them. The spreadsheet can order the materials according to
their density from the highest to the lowest or vice versa. The pupils
could also translate the relationship between mass and volume in "line"
or "XY" charts.
BrassBrass
Wax
Slate
Polystyrene
Perspex ]Perspex
Lead
Glass
Steel
Aluminium
Wood
Wax
Wood
Slate
S teel
Polystyrene
Figure 6.15 Excel chart shows Density by material
6-36

Worksheets for Density:
* If you have lg of water in a cube of 1 cm length, 1 cm width and
1 cm high, and therefore 1 cm3 density. Enter these values within the
last example, and from a chart try to find out which one of the 10
substances (materials) will sink in the water or float on the water. Could
you tell why?
* You have three pieces of wood; a valuable piece of gold has been
hidden in one of them. Use Excel to find out which one is valuable.
6-37

0 gr 1-3 E Fit A,17) r" L. I C. _A. al I Co N. S
6.8 Wordprocessor:
A wordprocessor is a program that allows the user to use the computer
to write, edit, and print documents quickly, easily, and professionally. He
can compose short documents like lists, memos and letters, or he can
generate longer articles and reports. He also can save his documents, as
long as he wishes, and print them at any time.
In a wordprocessor, the screen is often divided into three sections.
The first is an area where the text being worked on is displayed. New
text is added to this area and this window' can be moved to display
other sections of the file being used. The second is a smaller area which
gives information to the user, such as the name of the current file, the
position within that file, the position of the cursor on the screen and
other relevant information such as the date and time and any information
about the state of the host system. Finally there is a menu area where
the user is shown or can enter commands such as edit, save, move and
print (Williams & Maclean, no date).
Wordprocessing is generally a student's first opportunity to experience
the value of a computer as a personal tool. Early wordprocessing software
was designed for adult users, but in the last few years, a number of
user-friendly, menu-driven packages designed specifically for younger
users have appeared on the market. As a result, an increasing number
6-38

of elementary school children and their teachers are realizing the
advantages of using a computer to aid the writing process (Langhorne,
et al. 1989).
Secondary school students should have available to some of the
software designed to facilitate effective revision skills through text
analysis. Spelling and grammar checking programs can be used with some
wordprocessing programs to highlight problem points in the text for the
student to consider and correct. They can assist self-editing of surface
writing problems, allowing the student to correct some errors before
submitting the document to the teacher (Langhorne, et al. 1989).
Although the purpose of introducing WP to the classroom was to
improve the teaching of language, including writing and reading skills,
it is also possible to get some benefits for other subjects. However, WP
is not specific to science, but equally appropriate to social science studies,
languages, etc.. For this reason, no further explanation is included.
6.9 Electronic Mail:
An Email service allows users to exchange messages with other users
through computer networks that include JANET, ARPANET, and CSENT,
etc. It is a modern method of communication which has grown rapidly in
the last few years. The advantage of using Email is that it is cheap,
convenient and very quick, especially for those who spend most of their
time using computers.
6-39

A student using Email needs to type in message-file by using
wordprocessor facilities. He also needs to know the receiver's
school-address (locally or abroad), then he can send a message or reply
to his friend or colleague.
Email could allow pupils in different schools, LEAs or even different
countries to exchange information, for instance, about their local weather.
Take this imaginary message between two science pupils, one living in
Hull, another living in St Andrews (Scotland):
To: [email protected]: Hull weatherText::Dear Y,:Our weather this afternoon is a few bright intervals, but a good deal of:cloud and a strong and gusty wind, the temperature is 14c. But I expect:it to remain cloudy with wind and rain during the night.:Bye, X.
The St Andrews pupil then will receive:
Subject: Hull weatherFrom: [email protected]: Thur, 7 Nov 92 01:24:17To: [email protected]
Dear Y,Our weather this afternoon is a few bright intervals, but a good deal ofcloud and a strong and gusty wind, the temperature is 14c. But I expectit remain cloudy with wind and rain during the night.Bye, X.
For such a message, pupils can still prepare their data for some
experiments or tasks, and then copy and exchange them with their
colleagues in other school(s) using a wordprocessor for typing the message
6-40

and database for exchanging information. This would give them Email, WP
and DB awarenesses (part of computer awareness) as well as confirming
their science concepts.
Email is not just another interesting computer development of which
pupils need to be aware. There could be applications within the curriculum
in different subjects. It is best utilised in the classroom where pupils
exchange data or information; that is, when used as an integral part of
a lesson (Northwood, 1991).
Although ideas about the use of Email in science teaching are fresh
and it is still not in widespread use, they could soon be practised in
schools. It is likely to be a rapidly-growing field.
6.10 Data Logging:
"Having a computer in every laboratory should be every science
department's first computer-related priority." (Kahn, 1985, p 50)
The idea behind datalogging is that by using a computer to streamline
the mundane, tedious tasks of data collection, the students are encouraged
to concentrate on designing the experiment, predicting, and analysing the
results. The computer becomes a piece of laboratory equipment (Langhorn,
et al. 1989).
Datalogging gives the pupils the opportunity to work in small groups
to collect, investigate, analyse and also graph the data relating to, for
eXample their own heart rate in a short time, and perhaps with equal or
even greater success than the traditional science laboratory in terms of
6-41

the pupils' attitudes and achievement. In this case, the pupils do not
need to spend a long time doing tables, calculating, and attempting to
produce complicated or even impossible graphs, because the computer can
do all of these in a very short time.
Datalogging is a powerful tool in the hands of the science teacher,
to save his and his pupils' time. Today, many experiments can be done
in one class, with just two or three machines, because pupils could be
divided into groups, variously investigating, collecting data or introducing
them into the computer. In this respect, conventional experiments would
be extended rather than replaced and the pupils would carry out practical
experiments as well as gaining experience in computer-datalogging.
Because the main uses of datalogging are in the science laboratory,
rather than the actual science classroom, no examples are presented here.
However, they can be found in a practical datalogging project which was
based at Leicester University School of Education and summarized by
Barton (1991). The summary shows pupils' involvement using datalogging
in some physics experiments such as temperature measurement, motion
and electrical measurements. Another project was described by Chamberlain
and Vincent (1989).
6.11 Conclusion:
This chapter has described five types of generic software applications.
Databases and spreadsheets were presented in depth because they have
a very wide range of potential use in science classrooms. Examples of the
use of these two types in the science classroom were also presented.
6-42

The chapter has shown the flexibility and applicability of generic
(tool-kit) computer software in subject teaching generally and science
particularly. These approaches can be successful for developing students'
skills, such as problem-solving, thinking skills, etc., as well as their
awareness of computer applications widely used in commercial and daily
life.
The ease of use for both teachers and students may be the main
reason behind the widespread introduction of the generic applications
into industrial countries' schools. The need for simple and cheap software,
however, is particularly urgent in the developing countries, where lack
of computer awareness and shortages of teacher training are common. The
introduction of generic applications into science teaching in Saudi Arabia
as a developing country needs careful investigation of teachers' attitudes,
views and ideas toward training and use of these applications in the
science classroom. These issues are the main reason for carrying out the
main field study explained fully in the following four chapters.
6-43

CHAPTER 7::
IC C:)N. 0 T RUC T I CloN CDF INST RUM ENT'S
FOR SAUDI ARABIAN STUDY
7.1 Introduction:
The main aim for the main field study in Saudi Arabia was to investigate
science teachers', advisors', trainers' and computer studies teachers' views
and attitudes toward the introduction and use of computers for science
teaching. It also examined official views toward facilitating the introduction
and use of computers into science classrooms.
The study was intended to make an assessment of the attitudes of
science teachers and educators. To generalize this assessment for SA as
a whole, required a large sample of both science teachers and computer
studies teachers and as many science trainers and advisors as conveniently
possible. It was decided therefore to measure these samples' attitudes by
using a questionnaire survey.
The most popular form of attitude measurement is by means of a
questionnaire consisting of attitude items, each item belonging to one
scale which providing a means of quantifying respondents' views. The
items often contain a choice from a range of numerical values for each
statement (item) about which people express their agreement, or dis-
agreement, along a continuum (Thomas, 1978).
7-1

Suitable instruments were sought because the preliminary field study
(Chapter 5) indicated lack of computer experience and background among
SA science teachers and educators. For example the study findings indicated
that some technical questions should be ignored and others expanded or
replaced according to the responses and suggestions of the interviewees.
Questions like "Could you tell me what is a hard disk and what is a floppy
disk? " and "Do you know what is BASIC language?" 1 were found difficult
for the teachers to understand, as a result, only a few teachers responded
to such questions.
Unfortunately, no instrument suitable for the SA samples was found.
Previous studies of attitude toward computers had been directed to
students, teachers, computer professionals and\or those with computer
knowledge. For instance, Mathews and Wolf (1979), Minnesota Educational
Computing Consortium (MECC) (1979), Wilson and Ternary (1981), Reece
and Gable (1982), Moore (1984), Banks and Havice (1989), Ransley (1991)
who developed or used instruments for measuring one or more aspect of
students' attitudes towards computers.
In contrast to the widespread attention to students' attitudes, the
studies which concerned subject teachers' attitudes were mostly directed
to teachers who had some knowledge or/and experience of computers.
Studies of Lichtman (1979), Clement (1981), Miller (1981), Jay (1981),
Bitter and Davis (1985), Lawton and Gerschner (1982), Smith (1984) were
Items 2 and 3 in knowledge part of science teachers interview schedule Appendix C.
7-2

all designed to be used with teachers who already had computer experience
as Moore (1984) confirmed in his review of previous studies of attitudes.
Early studies reviewed by Moore used the Ahl l questionnaire which was
designed originally for adults, who used or had experience with computers.
Later studies including those of Beare, et al. (1987), Moore (1989) and
Boyes and Thyagarajan (1992), have all been concerned with students'
attitudes, whilst, Abdel-Gaid, et al. (1986) and Marion (1988) compared
preservice and inservice teachers' attitudes; both of their questionnaires
require respondents to have some computer knowledge and awareness.
However some studies examined teachers' attitudes after they had attended
a computer course. For example, Bitter's study was a survey of 300
teachers who had participated in a computer literacy program. Underwood
and Underwood (1989) used 313 teachers and trainees who were to start
a compulsory computer literacy course.
The absence of studies related to teachers with little experience of
computers can be attributed to the fact that these surveys were conducted
in developed countries such as USA, UK, Germany, etc., where attention
has been paid to computer literacy in the whole of the society. However,
less attention has been paid in the developing countries, where the current
study is located. The study sought instruments that could be answered
by respondents with little computer knowledge and experience.
1 * Ahl, D. (1976). Survey of public attitudes towards computers in society. In (Moore,
1984).
7-3

Further, this study investigates science teachers' and science edu-
cators' attitudes toward the introducing and use of computers for science
teaching, while almost all studies mentioned previously mainly measured
teachers' attitudes to computers generally. They were not directed to
science teachers only but to all subject teachers.
In addition, some studies of teachers' attitudes such as Moore (1987)
were concerned with computer studies teachers' attitudes, those who are
specialists in computers. The instruments of these studies were not suitable
for SA computer studies teachers because an instrument was needed
there to measure the SA computer studies teachers' attitudes to using
computers to help in science teachers' training and not to measure their
attitude toward computers.
Moreover, it was thought that in a society like Saudi Arabia, teachers
and educator need an instrument appropriate to their culture, educational
system and facilities available in the SA schools. For these three reasons
(difference of sample, difference of focus and difference of culture), it
was necessary to construct new instruments (questionnaires) suitable for
use with SA science teachers, advisors, trainers and computer studies
teachers.
7.2 Source of the Items:
The preliminary field work (chapter 5) carried out interviews with
samples of science teachers, computer studies teachers and science trainers.
7-4

The findings of the study were used to develop three types of ques-
tionnaires for the main field work: science teachers questionnaire (STQ),
science teacher trainers questionnaire (STTQ) and computer studies
teachers questionnaire (CSTQ).
Items were drawn up from the findings of each type of interview.
Some interview questions that had contributed interesting responses were
expanded into two or more items. Other items came from statements by
respondents.
Only questions eliciting responses from a majority of interviewees
were translated into questionnaire items. Care was taken to avoid the use
of technical items or words unlikely to be understood by Saudi Arabian
subjects. Items were designed to be clear and unambiguous to teachers
and others who had limited knowledge of computer education.
7.3 Setting up the Questionnaires:
For setting up questionnaires with opinion or attitude items, it is
worthwhile to generate scales comprised of groups of related items.
Youngman (1979) claimed "A person's responses to the items can then be
combined to produce a score on that subscale, and similarly for the
remaining scales. The analysis of subscales scores then becomes no different
from that of any other continuous score." (p. 159) The use of scales
(groups of items) is found to be more reliable than the use of each item
individually.
7-5

The first draft of the science teachers' questionnaire (STQ) included
four attitude scales of Attitude toward: value of computers for science
teaching (VALUE); benefits and problems which they might see in use of
computers in their classrooms (BENEFIT); training to use computers in
their teaching (TRAINING); the effectiveness or otherwise of pupils' use
of computers (EFFECTIVENESS). It also included three sections of personal
information: science teachers' computer knowledge (KNOWLEDGE); science
teachers' classroom activities (ACTIVITIES); and personal characteristics
(CHARACTER).
The aims of including the KNOWLEDGE section were to measure the
science teachers' computer knowledge and to obtain data that would make
it possible to explore the relation between respondents' knowledge and
their attitudes. The aims of including the ACTIVITIES section was to allow
a test of whether there is a relation between a science teacher's activity
and his attitudes to the introduction and use of computers. Table 7.1a
shows the scales and number of items in each scale, whilst Table 7.1b
shows the personal information sections and number of items in each
section. A typical item is presented for each scale and section as
representative of the whole scale or section.
7-6

Attitude Scale description
No of
Typical item
scale Name
items
VALUE Value of computers for science
teaching
BENEFIT Benefits and problems in use
of computers in science
classrooms
15 Computers bring more disadvantages than
advantages to science teaching (-)*
10 Teaching science with the aid of com-
puters would make teaching easier (+)
TRAINING Training to use computers in 21 A computer training programme should be
science teaching compulsory for every science teacher (+)
EFFECTIVE The effectiveness or otherwise 20 Computers are as important to students
of pupils' use of computers as text books in the classroom (0
* + Positive item, - Negative item
Table 7.1a Attitude scale name, description, number of items and typi-cal item for each scale in the first item-pool used in science teachers'
questionnaire
Section Name Section description
No. of Typical item
items
KNOWLEDGE
ACTIVITIES
CHARACTER
Computer knowledge
13 To use a computer successfully, one needsto learn how to program (F)*
Classroom activities 11 I make personal visits to computer centres
Personal characteristics 8 Have you got a personal computer? If yes,
for what do you use it?
* F. False item
Table 7.1b Personal section name, number of items and typical itemfor each section in the first item-pool used in science teachers' ques-
tionnaire
Similar to the STQ, the first draft of the science teacher trainers'
questionnaire (STTQ) included four attitude scales of Attitudes toward:
value of computers for science teaching (VALUE); the training of science
teachers to use computers in their teaching (S.TRAINING); training to use
computers in their teaching (TRAINING); the effectiveness or otherwise of
pupils' use of computers (EFFECTIVE). In addition, it included two more
sections for computer knowledge (KNOWLEDGE) and personal characteristics
(CHARACTER).
7-7

The scales VALUE, and EFFECTIVE were both similar in both STQ and
STTQ because these scales are related to both science teachers and trainers
at the same level of importance. In other words it is as important to
measure science teachers' attitudes to the VALUE of computers and to
EFFECTIVE use of computers by pupils as its for science trainers. Thescale TRAINING had almost similar items, but items were changed to reflect
occupation, i.e science teachers and science teacher trainers as shown in
Table 7.2a.
Attitude
scale Name
Scale description No. of Typical item
items
VALUE Value of computers for
science teaching
15 Computers bring more disadvantages than
advantages to science teaching (-)*
S.TRAINING Science teacher's
training
11 Science teachers should have INSET in the use
of computers in their teaching (+)
TRAINING Computer training 17 A computer training programme should be
compulsory for every science teacher trainer
(+)
EFFECTIVE Effectiveness or
otherwise of pupils' use
of computers
17 Computers are as important to students as
text books in the classroom (+)
* + Positive item, - Negative item
Table 7.2a Attitude scale name, number of items and typical item foreach scale in the first item-pool used in science teacher trainers'
questionnaire
Section
Section description No. of
Typical item
name
items
KNOWLEDGE Computer knowledge
13 To use a computer successfully, one needs
to learn how to program (F)*
CHARACTER Personal
characteris- 10 Have you written any article or conducted
tics research about computers? If yes, was it
theoretical or practical?
* F= False item
Table 7.2b Personal section name, number of items and typical item foreach section in the first item-pool used in science teacher trainers'
questionnaire
7-8

Table 7.2b shows the two personal information sections used in the
first draft of STTQ. The knowledge section was similar to that in STQ,while two more questions related to previous involvement in computer
research were added to the STTQ.
Because computer studies teachers have no involvement in science
teaching, tha CSTQ scales and sections were different from those in the
STQ and STTQ. The scale, "Relationship with Science Teachers" wasexpanded in the CSTQ and renamed as "Attitudes toward training science
teachers to use computers in their teaching" because the preliminary
findings suggested an important role for computer studies teachers in
science teachers' training. Tables 7.3a shows the CSTQ attitude scales of
Attitudes toward: value of computers for science teaching (VALUE); training
science teachers to use computers in their teaching (ST.TRAINING); training
in teaching methods (TRAINING); and personal information. One typical
representative item is shown for each scale and section.
Attitude
scale Name
Scale description No.
items
of Typical item
VALUE Value of computers for
science teaching
16 I think it is enough for pupils to study
computer studies courses (-)
ST.TRAINING Training of science
teachers
27 I would be willing to train my science
colleague to use a computer in his teaching
(+)
TRAINING Training in teaching
methods
11 A computer studies teacher does not need
to be trained in teaching if he has enough
knowledge of his subject (-)
Table 7.3a Attitude scale name, description, number of items, andtypical item for each scale in the first item-pool used in Computer
studies teachers' questionnaire
Although the VALUE scale measured one aspect in all of the three
questionnaires, special items were required for CS teachers only. For
example, item 13 was "The increased use of computers in schools subjects
will cause less favourable student attitudes toward computers".
ST.TRAINING was also different in both STTQ and CSTQ because STTQ is
7-9

mainly concerned pre-service training, whereas CSTQ concerned INSET.
Moreover, CSTs CHARACTERs questions were designed to measure CSTsprevious technical training and experience, see example Table 7.3b.
Section Section description No. of
Typical item
Name items
CHARACTER Personal characteristics 10 Have you been trained in using computer
networks?
Table 7.3b Personal section name, number of items and typical item inthe first item-pool used in computer studies teachers' questionnaire
It was decided to remove the section asking for "Actual Information"
from the CSTQ because the preliminary study gave enough background
information about computer provision in the secondary schools.
7.4 Validity of the Questionnaires:
To confirm the relevance of the items to their scales and sections,
copies of the STQ were distributed to a trainer at an English University,
six science teachers at three English secondary schools and five students
undertaking a one year post graduate course in education (PGCE) in
secondary science teaching 1991\1992 at an English University. The CSTQ
was also distributed to a trainer at English University, three IT teachers
at the same three schools and five PGCE students undertaking computer
studies in 1991\1992. At the same time, copies of the trainers' questionnaire
were distributed to four science trainers at an English University.
All respondents received a copy of the questionnaire with a letter
indicating the nature and purpose of the study and questionnaire and
7-10

stressing that they are not asked to respond to the items ( whether they
agree or disagree), but to respond to whether the items belong to their
scales or not.
To obtain their views about the strength of the relationship between
each item and its scale or section, the respondents were asked to tick
one of four boxes: NR (not relevant), MR (minimally relevant), FR (fairly
relevant) or VR (very relevant). They were also invited to make any
suggestions about the items, scales (appropriateness of items) and
questions. They were also asked to indicate a more suitable scale for any
items which they thought did not belong to their current scale.
All questionnaires were collected personally. Almost all of the
respondents were interviewed after they completed the questionnaire and
invited to give their opinion about the questionnaire.
The responses were coded as NR=1, MR=2, FR=3 and VR=4. The data
were analysed by using the MEAN. All items below the mean (2.5) were
removed, or replaced if some respondents suggested that, whilst all items
above the mean were retained.
Table 7.4 shows that only 9 items from 75 items in the STQ were
removed, and even less than this number in the cases of STTQ and CSTQ,
they were just 4 or 5 items in these two questionnaires. That means that
the respondents agreed that 88% of STQ items belonged to their scales,
94.5% of STTQ items belonged to their scales and 91% of CSTQ items
belonged to their scales.
7-11

Ques. No. of items No of items No of retainedname removed replaced itemsSTQ 9 5 66STTQ 4 6 69CSTQ 5 3 52
Table 7.4 Number of items removed and number of items replaced ineach type of questionnaire
The replaced items were switched to a more appropriate scale or
section within the questionnaire according to the suggestions made by
the respondents in the questionnaires or in the interviews.
At this stage the treatment of the English of the questionnaires was
finished.
7.5 Translating the Questionnaires into Arabic:
In order to apply the questionnaires in Saudi Arabia, they were
translated into the SA mother language, Arabic. The translation was
designed to retain the items' English meaning and to be as simple as
possible for general understanding.
To ensure that all items retained their English meaning, English and
Arabic copies of each questionnaire were shown to a science teacher at
an English school, whose mother language is Arabic. He suggested slight
changes. For example, he suggested more explanation of the word
"spreadsheet" in the computer studies teachers questionnaire, because
spreadsheet is not a common noun in the Arab computer sector, but Lotus
1,2,3 are surely familiar. So it was decided to explain the spreadsheets
items by the example of Lotus 1,2,3. He also recommended renaming the
7-12

science trainer, "science supervisor", because this is the name normally
used in the Arab academic sector. His comments and suggestions were
implemented before further testing of the questionnaires.
7.6 Timing the Items:
"One effective way of detecting potentially difficult questions is to
pilot them by administering the questionnaire personally, timing each
response. Any questions which take substantially longer to answer than
others quite likely are too complicated. They should be reworded, or
broken down into separate parts." (Youngman, 1982, p. 12)
To make sure that all items were easily understandable by native
Arabic speakers, each questionnaire was distributed to postgraduate Arab
students at an English University. Copies of both STQ and STTQ were
distributed to three students undertaking PhD studies in science education,
whilst copies of CSTQ were distributed to three students undertaking PhD
studies in computer science or engineering. The time taken to answer
each item was recorded in each case. From these records the mean time
for each item was calculated and analysed. Any item which took more then
15 seconds was treated as a difficult item and reworded in a simpler way.
7.7 Piloting the Questionnaires:
Before carrying out the main study and distributing the questionnaires
to the samples, it was important to make sure that the instruments were
suitable for use with this particular sample. The aim of piloting the
questionnaire was to explore any possible problems within the questionnaire
7-13

and solve them. Youngman (1982) claimed that "Piloting is an integral part
of any research and a questionnaire survey is no exception. Indeed the
strong dependence upon the instrument rather than the researcher makes
pilot assessment even more necessary. They need to evaluate the
instruction, the questions and response system." (p. 26)
The pilot study concerned questionnaires rather than sample, so it
normally involved a small sample of the main study (Youngman, 1982). It
was required to choose a small representative number of the main sample
with if possible 100% responses in a short time. Selective samples were
therefore chosen as convenient and according to their willingness to
respond to the questionnaires immediately.
The questionnaires were sent and distributed in SA on November 1991
to samples of science teachers, computer studies teachers and science
trainers in Madinah city. 17 science teachers, 11 computer studies teachers
and 3 science trainers were involved in this study (Table 7.5).
Type of sample No.
Science teacher 17
Computer studies teacher 11
Science trainer 3
Table 7.5 Pilot study samples
Each questionnaire was accompanied by a letter explaining the purpose
of the study and instructions for completion of the questionnaire. The
attitudes and knowledge items in all of the questionnaires were listed in
one thematic category. For each attitude item respondents were asked to
7-14

tick one of the following choices: STRONGLY AGREE, AGREE, DISAGREE,
STRONGLY DISAGREE or UNDECIDED. At the end of each page, they were
asked to look back at the items and circle the difficult ones. (This was
required only in the pilot study.) In addition to that, science teachers
were asked to respond to 15 factual items about their classroom activity
by ticking one of six choices: 1\D (almost every day), 1\W (once a week),
1\M (once a month), 1\T (once a term or less often) N (never) or UNDECIDED.
The final page in each questionnaire included personal questions and
space for extra suggestions. In addition, the science teacher trainers were
asked to give opinions about any unsuitable item in all of the three
questionnaires.
7.8 Analysis of the Pilot Study:
All copies were returned. the STQ and CSTQ data were analysed by
the same statistical test, whilst STTQ data were used to justify items of
the STTQ and also to confirm the STQ and CSTQ data.
The purpose of analysing the pilot study data was to select the most
suitable items for use in the main study. If there is a great deal of
agreement/disagreement among the population, then the item is a "fact"
and it does not need further investigation, as it does not discriminate
between different parts of the subject. The item is therefore be removed
from the questionnaire.
A SPSS-PC non-parametric routine was used to analyse the STQ and
CSTQ data by using the "Binomial test". The Binomial test is used with
data that are binomially distributed, the hypothesis that probability p of
7-15

particular outcome is equal to some number is often of interest. If a
population consists of categories of classes, then each observation (X)
sampled from the population may take on one of two values. Depending
on the category sampled, it is most convenient to denote each outcome
as either 1 or 0. If the hypothesis is Ho: p = po, the probabilities can be
calculated for the various outcomes when it assume that Ho is true. The
Binomial test will tell whether it is acceptable to believe that the proportion
with the hypothesised values of po and 1-po. (See Norusis, 1990 and Siegel
and Castellan, 1988). The "null" hypothesis was that 50% of the pilot
population would agree with each item, while the other 50% would disagree.
To find out the probability of agreement and disagreement with N cases
observed, the following equation can be used:
P[ Y = k]-( k)pke-k)k=0,1,...,N
Where p the proportion of observations expected where X = 1
q = the proportion of observations expected where X 0
(Source Siegel and Castellan, 1988).
X= 0 was denoted as the 'disagree' categories (SDA and DA), whilst
X =1 denoted as the `agree' categories (SA and A). Choosing for example,
item 2 in Table 7.6. 17 respondents responded to the item (N=17) , 3
disagreed (k=3), while 14 agreed (N-k=14). Thus the probability for the
disagreement category ()C:-.0) is:
p[Y.3]. (17!) (1)3(1)14(3!14!)2)
0.013
7-16

The results indicates that this item has probability of greater than
0.01 of occurring by chance. Therefore, this item should be retained in
the questionnaire because the Binomial distribution has show s.% that the
two proportions (agree and disagree) have been drawn from a population
with the hypothesised values of agree and disagree. In other words, the
observed responses indicate no true difference between the response
categories (agree and disagree) of the 17 respondents.
In contrast, the probability of item 1 Table 7.6 (p= 0.000) indicates
very low probability of occurring by chance since there were 16 `agree'
and no 'disagree'), therefore this item should be regarded as a `fact' and
thus rejected.
All items with low probability were rejected and removed from the
questionnaires. Items with difficult wording were altered to make them
simpler according to the trainers' suggestions. For example, item 7 from
STQ, "There is no benefit from the use of computers in science teaching,
commensurate with their cost", was changed to "The benefit from the
use of computer is not commensurate with their cost".
Tables 7.6 to 7.11 show the pilot items for the scales and sections of
STQ. They also show the response distribution and the results of the
Binomial test for each item. According to the test results the decision was
made for accepting or rejecting the items. The equivalent test and analysis
for CSTQ were carried out, and its findings will be presented later in
this chapter.
7-17

No Item SDA# DA UD A SA Binomia Decision2 3 4 5 I 2-T p.
1 Computers are valuable tools that can be 0 0 1 11 5 0.000 R*used to improve the quality of scienceteaching (+)
2 I look forward to a time when computers are 1 2 0 7 7 0.013more widely used in science teaching (+)
3 I would like to see computers in every 1 1 0 9 5 0.004 Rschool subject (+)
4 The use of computers in science teaching 0 4 1 6 5 0.119 R**should be made compulsory immediately (+)
5 The computer can enhance the learning of 3 2 0 6 5 0.210pupils in every science subject.
6 If the computer is introduced into science 0 1 0 9 6 .0005 R
teaching, then problems would arise as aresult of that (-)
7 There is no benefit from theuseof computers 5 6 0 3 2 0.210in science teaching commensurate with theircost (-)
8 Using computers in science teaching will 0 2 0 9 5 0.004 R
improve the curriculum (-)
9 Computers bring more disadvantages than 4 1 0 3 8 0.210advantages to science teaching (-)
10 Computers could make teaching chaotic (-) 6 8 1 1 1 0.004 R
11 The use of computers in science teaching 1 2 0 8 6 0.012would require large changes in scienceteaching methods (-)
12 Science teaching is better without the use 3 9 0 1 4 0.144of computers (-)
13 I almost never think about using a computer 5 2 0 5 5 0.629in my teaching (-)
14 Computers will increase the amount of 1 10 0 3 3 0.332teacher-student interaction in the scienceclassroom (-)
15 We should rethink how our science curricula 0 0 1 9 7 0.000 Rare organized so they make maximum use ofcomputer technology (+)
Sig. At P<0.01# SDA= strongly disagree, DA= disagree, UD= undecided, A= agree and SA= strongly agree* R= rejected items** Item rejected for non-statistical reason
Table 7.6 Descriptive statistics for pilot items of the VALUE scale inthe science teachers' questionnaire
Table 7.6 shows the VALUE scale pilot items. Six items were rejected
because they did not achieve the probability level (p= 0.01) of the Binomial
test. At the same time 4 was rejected although it did achieve the probability
7-18

level because the word "immediately" confused the respondents, e.g., they
were not sure whether that referred before or after planning and training
for use. Finally, 8 items were retained to this scale.
The table indicates that almost all of the respondents were agreed
to the items 1, 6 and 15. This may show that they had strong positive
attitudes toward two aspects of the value of computers for science teaching;
i.e items 1 and 15, and at the same time they were worried about the
problems associated with the introduction of computers into science
teaching; i.e item 6.
Table 7.7 shows BENEFIT scale pilot items. Three items were rejected
because they did not achieve the probability level (p= 0.01), while item
9 was rejected although it did achieve the probability level because the
expression "object" is unusual term in the SA teachers' society. Almost
all of the sample agreed to items 7 and 8. As the result of these decisions,
only five items were retained to this scale.
7-19

No Item
1 Teaching science with computers wouldmake the teaching easier (+)
2 Introducing computers into scienceteachingwoulddecreasetheteacher'srole
(-)
3 Using computers in science classroomscould weaken the teacher's control uponthe students (-)
4 Introducing computers into scienceteaching will decrease the teacher'sworkload (+)
5 If the schools use more computers, theywill need fewer teachers (-)
6 Science teachers manage without corn-puters, so computers are not reallynecessary (-)
7 If I had a chance to use a computer Iwould use it (+)
8 Science teachers could introduce studentsto computers (+)
9 I object to all the attention being givento computers because it detracts from thereal problems now faced by teachers (-)
SDA# DA OD A SA Dimmia12-T p.
Decision
1 5 0 8 3 0.332
1 8 0 5 2 0.804
2 8 0 5 2 0.629
6 8 0 1 1 0.004 R*
3 8 2 2 2 0.119
2 3 0 8 4 0.144
1 0 0 9 6 0.001 R
0 1 2 10 3 0.002 R
1 9 1 3 3 0.455 R**
Sig. At p<0.01# SDA= strongly disagree, DA= disagree, UD= undecided, A= agree and SA= strongly agree* R= rejected items** item rejected for non-statistical reason
Table 7.7 Descriptive statistics for the pilot items of the BENEFITscale in the science teachers' questionnaire
Although the TRAINING scale had 20 pilot-items in the pilot study,
only six items were retained. The large number of rejected items can be
seen as confirming the need to produce special instruments for the SA
samples. Some items such as: 1, 2, 9, 11, 12, 16 and 19 were agreed by
almost all of the sample. These items were measuring the attitudes to some
aspects of training to use computers.
Item 15 was rejected because there is no overtime for teachers in
the SA educational system. Therefore no benefit could be achieved from
asking this item (Table 7.8).
7-20

No Item SDA# Dk UD A SA Binomia DecisionI 2-T p.
1 I would like to learn how to use computers inmy teaching (+)
1 0 0 4 12 0.000 R*
2 Science teachers should train to use computersin the classroom (+)
1 0 0 4 12 0.000 R
3 A computer training programme is necessaryfor every science teacher (+)
0 4 2 4 7 0.119
4 A computer training programme is necessaryfor computer studies teachers only (-)
6 9 0 1 1 0.002 R
5 It is possible for science teachers to betrained to use computers by their computerteachers colleagues (+)
1 1 0 11 4 0.002 R
6 I would like my computer teacher colleague totrain me to use computers in my teaching (+)
5 5 0 6 1 0.629
7 A teacher of computer studies is not the bestperson to train science teachers to usecomputers (-)
2 5 1 5 3 1.000
8 A science teacher has no time to train to usecomputers (-)
2 1 0 4 10 0.004
9 Science teachers will need a long time if theywant to learn to use computers (-)
2 0 0 9 6 0.000
10 Probably I could never learn to use computers 8 6 0 2 0 0.004
(-)
11 If there was a computer club in my school, Iwould help with it (+)
0 0 2 11 4 0.000
12 If there were computer courses for teachers,I would join them (+)
0 0 0 9 7 0.000
13 Science teachers should demand that they betaught how to use computers in their classroom
0 2 1 6 7 0.007 • R
(+)
14 I prefer to be trained in the use of computersinside my school (+)
0 2 0 7 7 0.004
15 Science teachers need overtime to be trainedto use computers (-)
2 2 0 7 5 0.077 R'4-
16 Even if a science teacher knows how to use acomputer in typing, he still requires to knowhow he can use it in the science classroom (-)
0 0 1 10 6 0.000
17 Science teachers must know a great deal abouthow computers work if they want to use them inscience teaching (-)
1 3 1 6 6 0.076
18 A computer studies teacher needs to know howto use computers in science teaching before hetrains science teachers (-)
1 5 0 6 5 0.332
19 The computer teacher needs to know how to usecomputers in teaching before he trains scienceteachers (-)
0 0 0 8 8 0.000 R
20 Only the computer studies teacher should use 5 8 0 2 2 0.05computers regularly in his teaching (-)
Sig. At 13(0.01# SDA= strongly disagree, DA= disagree, UD= undecided, A= agree and SA= strongly agree* R= rejected items** item rejected for non-statistical reason
Table 7.8 Descriptive statistics for the pilot items of the TRAININGscale in the science teachers' questionnaire
7-21

No Item SDA# DA UD A SA Binomial Decision2-T p.
1 Computers areas important to science pupilsas text books in the classroom (+)
0 5 1 5 5 0.301
2 Computers in science classrooms will requirestudents to become active learners (+)
0 1 1 10 5 0.001
3 If we do not use computers in scienceteaching, our students will grow up illit-erate and deprived of a basic science skill
1 8 2 2 3 0.424 R**
(+)
4 Using computers in science classrooms willnot improve pupils' positive attitudestoward sciences (-)
2 11 0 0 4 0.049
5 Students who use computers will have moredifficulty learning the basic science skills
5 9 0 1 1 0.004 R
( )
6 Computers will increase the amount ofanxiety pupils' experience in the scienceclassroom (-)
1 10 1 3 1 0.119
7 Computers will improve science pupils'thinking (+)
1 11 1 2 2 0.077
8 Computers will improve science pupils'problem-solving skills (+)
1 2 0 12 2 0.012
9 Computers will improve science pupils'abilities (+)
0 3 1 8 4 0.035
10 Using computers in science teaching willimprove students' computer skills (+)
0 0 1 8 8 0.000 R
11 Computers would improve student's attitudestoward the science classroom (+)
3 10 1 1 1 0.007 R
12 Computers should be used throughout thesubjects (-)
1 1 0 10 5 0.004 R
13 Computers will isolate students from oneanother (-)
6 9 0 1 1 0.004 R
14 Using computers in science teaching willimprove students' attitudes toward computers
0 1 1 12 3 0.001 R
(+)
15 Students do not like using the computersin the classroom (-)
3 11 1 0 2 0.004 R
16 Computers should not be a separate subject 0 1 1 8 6 0.000 R
(+)
Sig. At p<0.01# SDA= strongly disagree, DA= disagree, UD= undecided, A= agree and SA= strongly agree* R= rejected items** Item rejected for non-statistical reason
Table 7.9 Descriptive statistics for the pilot items of the EFFECTIVEscale in the science teachers' questionnaire
Table 7.9 shows the pilot items of the EFFECTIVE scale. Six items
were retained while ten items were rejected including item 3 which was
rejected because "basic science skills" is too general a term. It was
7-22

surprising that almost all the sample disagreed with item 11: "Computers
would improve student's attitudes toward the science classroom", i.e. they
saw no relation between the science classroom and computers. This could
perhaps confirm their lack of knowledge about the possible contribution
of computers to the science classroom. However, almost all of the sample
were agreed with the positive items 2, 10, 12, 14 and 16, whilst they
disagreed with the negative items 5, 13, and 15.
Because a major purpose of the preliminary study was aimed to
estimate the knowledge of computers in the sample, Table 7.10 shows that
eight items were selected for the KNOWLEDGE scale. Only two out of ten
items were rejected. Item 3 seems excessively simple, while item 9 contains
the words "you should" which perhaps led the respondents to disagree.
7-23

No Item SDA# DA OD A SA Binomial Decision2-T p.
1 Computers can be used as a private tutor 1 3 0 9 4 0.049(T)@
2 Computers are used to introduce a largeamount of information for pupils.
1 2 1 7 5 0.035
3 Computers can be used to store large amountsof information which can be used any time
0 0 0 7 10 0.000 R
(T)
4 Computers have little application inscience teaching (F)
1 8 1 5 2 0.804
5 To use computers successfully, one needsto learn how to program (F)
1 3 0 5 8 0.049
6 One of the computer weaknesses is that itis difficult to change the text when youtype by computer (F)
2 6 0 5 2 1.000
7 The use of PC is unrelated to the needs ofthe schools (F)
1 6 0 5 5 0.629
8 The Saudi Arabian market has variousexamples of English software, but almostnothing in Arabic language (F)
1 10 0 2 4 0.332
9 To use computers you should be specializedin computers (F)
5 10 0 2 0 0.004 R
10 Existing commercial software can be usedin science teaching (T)
0 5 2 4 6 0.302
Sig. At p(0.01# SDA= strongly disagree, DA= disagree, UD= undecided, A= agree and SA= strongly agree* R= rejected items• T= True item, F= False item
Table 7.10 Descriptive statistics for the pilot items of the KNOWLEDGEsection in the science teachers' questionnaire
On the evidence of their responses to the Activity items, science
teachers were divided into two groups, the active group were those who
responded 1\D; 1\W and 1\M whilst, the non-active group were those
responded 1\T and N. Table 7.11 show that 7 items were rejected according
to Binomial test criteria. That is to say, these items could not distinguish
between teachers. However, the data show that the rejected items were
these in which normal job determination was required officially such as:
allowing pupils to participate; give short class test; etc.. The accepted
items were those which related to computers and technology which relate
to actions that are not required officially from the science teachers.
7-24

No Item 1\D#Score 6
1 I allow my students to do 1experiments by themselves.
2 I use video in my teaching. 0
3 I use an overhead projector in my 3class.
4 I take my students on science 0trips.
5 I deal with my students individ- 9ually.
6
I allowmy students to participate 16during their lesson.
7
I include discussion of TV science 7programmes in my teaching.
8 I read educational computing 2articles to look for teachingideas.
9 I meet with computer teachers to 1discuss computer uses in teaching.
10 I make personal visits to computer 0centres.
11 I use the science laboratory in 8my teaching.
12 I ask the students to do experi- 2ments for their homework.
13 I ask my students to read extra 3books.
14 I advise my students to follow the 5developments in technology.
15 I give my students short class 2tests.
1\W 1\M 1\T N UD Binomia/ Decision5 4 3 2 1 2-T p.
7 3 1 5 0 0.332
5 7 3 2 0 0.144
5 4 2 3 0 0.144
1 1 6 8 1 0.004 R*
6 0 1 1 0 0.004
1 0 0 0 0 0.000
3 2 3 1 1 0.144
1 6 2 6 0 1.000
3 0 3 10 0 0.050
0 3 5 8 0 0.021
7 2 0 0 0 0.000
2 11 1 1 0 0.002
3 8 0 2 0 0.004
2 4 5 0 0 0.210
8 5 0 1 0 0.001
1\T= once a term; N= never and UD= undecided
Sig. At p<0.01* R= rejected item# 1\D= once a day; l\W= once a week;
Table 7.11 Descriptive statistics of the pilot items of the ACTIVITYsection in the science teachers' questionnaire
The ability of the retained items to distinguish between science
teachers was one of the aims of this section and therefore reinforces the
validity of the instruments.
The data of CHARACTER items revealed no difficulties in responding,
therefore, all questions were retained.
7-25

7,9 The Final Administration of the Questionnaires:
After analysis of the STQ pilot data by Binomial test, the rejected
items were removed from the final questionnaire, whilst the accepted items
were retained and included in the final questionnaire. Table 7.12 summarizes
the rejected and retained items in the STQ scales and sections explained
in the previous section.
Scale(section)
Rejected items forthe Binomial test
Items rejected fornon-statis. reasons
Retaineditems
No. of retaineditems
VALUE
BENEFIT
TRAINING
1,
4,
1,
3,
7,
2,
6, 8,
8
4, 5,
10,
8,
15
9, 10,
4
915
2,5, 7,9,12, 13, 14
1, 2, 3, 5,
3, 6, 7,
11,
6,
17,
8
5
6
EFFECTIVE
11,
2,
12, 13,
5, 10-16
14, 16, 19
3
18,
1,9
20
4, 6, 7, 8, 6
KNOWLEDGE
ACTIVITY
3,
4,
9
5, 6, 11, 12, 13, 15
-
-
1,7,
1,9,
2, 4, 5,8, 10
2, 3, 7,10, 14
6,
8,
8
8
Table 7.12 Scales and sections rejected items; retained items andnumber of retained items in each scale and section after pilot study
analysis of the science teachers' questionnaire
Five items were added to the retained items in the final form of the
science teachers' questionnaire. 3 items were added to the scale BENEFIT
because few items were left in the scale after the analysis. Also, the
additional items were intended to investigate whether science teachers
believe in the benefits of computers only partially (i.e in some science
subjects only, with specific pupils only). Two items were added to the
scale TRAINING to find out in which place science teachers would prefer
the training to take place and whether they would prefer a colleague to
do the training (Table 7.10).
7-26

Swim
Scale New item
BENEFIT
Teaching science with the aid of computers would only makedifficult topics easier (-)
BENEFIT
Teaching science with the aid of computers would maketeaching easier for the most able pupils only (-)
BENEFIT
Teaching science with the aid of computers would maketeaching easier for all pupils (+)
TRAINING
It is better to train science teachers in the schools ratherthan the Universities (-)
TRAINING
I would be willing for an expert from outside school totrain me to use computers (+)
Table 7.13 New items added in the final form of science teachers'questionnaire
All of the four scales include positive and negative items. The dis-
tribution of positive (favourable) and negative (unfavourable) items among
the scales is given in Table 7.14 and Figure 7.1. The number of negative
items is larger than the number of positive items within the questionnaire
as a whole. This is because of the nature of the BENEFIT (and problems)
scale where 6 negative items were located. The problems of using computers
are negative, so it was thought that negative items could be more easily
understood.
Scale Positive Negative TotalVALUE 3 5 8BENEFIT 2 6 8TRAINING 4 4 8EFFECTIVE 4 2 6TOTAL 13 17 30
IaEl Pwittn. IM New*.
1,2,3,4 The scales respectively
Table 7.14 Distribution of positive Figure 7.1 Distribution of posi-and negative items in the science tive and negative items for theteachers' questionnaire four scales four scales of the science
teachers' questionnaire
7-27

The positive items were: 1, 3, 4, 5, 7, 8, 14, 15, 22, 26, 28, 29 and 30.
While the negative items were: 2, 6, 9, 10, 11, 12, 13, 16, 17, 18, 19, 20.
21, 23, 24, 25 and 27.
The CSTQ had the same operations of analysis, while the STTQ was
analysed by using the three trainers' suggestions and comments. There
were no specific criteria for rejecting STTQ pilot items, because of the
very small sample size, but the sample suggestions were used as a guide
for the STTQ final form.
Tables 7.15 to 7.17 show number of items in each scale and section
used in the form of each type of questionnaire.
Scale VALUE BENEFIT TRAINING EFFECTIVE KNOWLEDGE ACTIVITY CHARACTER(Sec.)
No. of 8 8 8 6 8 8 8items
Table 7.15 Number of items in each scale and section in the final formof the science teachers' questionnaire (STQ) after pilot study analysis
Scale (Sec.) VALUE S.TRAINING H.TRAINING CHARACTER
NO. of items 7 13 5 8
Table 7.16 Number of items in each scale and section in the final formof the computer studies teachers' questionnaire (CSTQ) after pilot
study analysis
Scale (Sec.) VALUE S.TRAINING TRAINING EFFECTIVE KNOWLEDGE CHARACTER
No. of items 7 5 6 6 8 8
Table 7.17 Number of items in each scale and section in the final formof the science teachers trainers' questionnaire (STTQ) after pilot study
analysis
Four different thematic categories were used in the final question-
naires: SA (strongly agree), A (agree), DA (disagree) and SDA (strongly
disagree) for the ATTITUDE scales; T (true), F (false) and DN (do not
7-28

know) for KNOWLEDGE items; 1\D (once a day), 1\W (once a week), 1\M
(once a month), 1\T (once a term or less often) and N (never) for ACTIVITY
items; nominal boxes were used for CHARACTER items. The UNDECIDED
column was omitted in the final questionnaires because few responses
appeared under this column in the pilot results. For example in STQ the
maximum UD response was 2 for N= 17, that is only 12 %. Moreover, the
omitted "Not Sure" responses was found to be more reliable than responses
in the UNDECIDED column. (Bame and Dugger (1989) claimed that "When
analyzing the attitude scales, improved results were obtained if the
"neutral" response was removed and counted as no response.) This meant
that a four-point scale was used resulting in better statistical analysis"
(p. 315).)
The bottom half of the final page in each questionnaire was used to
invite respondents to give free format suggestions and recommendations
on the subject of the use of computers in science teaching in SA.
Before the questionnaires were implemented in SA, they were given
to a translation specialist at an SA University to compare the Arabic
translation to the original version for each questionnaire in English and
to ensure that each item retain its original meaning. He was also asked
to make sure that the question did not contain any ambiguous expressions.
This was confirmed (see Appendix D).
A copy of each questionnaire as used in the main fieldwork with its
original English is attached in Appendix E.
7-29

7.10 Setting up the Interviews:
Chapter one indicated that the SA educational system is centralised
by the Ministry of Education and all important decisions must come officially
from the Ministry. Therefore, it was necessary to explore the officials'
views on the introducing of computers into science teaching and to
investigate current studies of issues on provision of computers.
The interview method was considered as the best way to explore the
official views and attitudes toward the introduction of computers into
science teaching. The interview was aimed at examining the Ministry policy
for using computers in schools. To achieve these aims, only a very small
number of persons with indepth information was required. Borg and Gall
(1989) claimed that the interview is a popular and an effective method
which can be used to assess views when the target sample is small.
On the basis of the preliminary and pilot field studies, an interview
schedule was designed and refined for use with a senior officer in the
SA Ministry of Education. The interview consisted of three main parts:
the history of introducing computers in the secondary schools; the present
use and facilities of computers; and future use of computers in the
secondary schools.
For covering the three parts of the interview, a series of questions
was scheduled about the following issues:
• the aims of introducing computers into SA secondary schools;
• the difficulties the Government had faced during the introduction:
funds, training, hardware and software difficulties;
7-30

• computer benefit to the pupils and their attitudes from the official
point of view;
• Government policy in the future: expansion of machines, expansion
of uses, and funding budget;
• the officials' point of view on the use of computers in sub-
ject-teaching.
Although the interview was scheduled to cover the previous issues,
it was decided to give the interviewer freedom to go further than answering
the questions, to link any important issue raised during his speaking in
connection with any of the matters need an investigation.
To give a clear idea of the time taken by the interview and the
understandability of the questions, a trial interview with a professional
educator who had previous experience in official posts taking the role of
Government officer was made before the real interview took place.
7-31

cil/slApm]Ert al.:
RES.EARCI-1 DESIGN . A.DMINI STELA.—PION AND PRIMARY SCALE ANALY-
SE S
This chapter describes the science teacher sample and their responses
to the instruments. It also includes a description of the responses of the
science advisors, who answered the same questionnaire. At the end of the
chapter, an assessment of the responses of the science teachers' trainers
is presented because in the STTQ they responded to very similar items
to those used in the STQ.
PA.RP : A.
8.1 Choice and Description of the Sample:
The 1992 yearly report of the " Centre for Statistical Data & Educational
Documentation u (CSDED) indicates that Saudi Arabia has 40 LEAs,
responsible for 545 secondary schools and 9215 teachers. It also shows
that there are 2013 science teachers for the four science subjects: Physics,
Chemistry, Biology and Geology.
Moreover the report indicated that 122 secondary schools are based
in three main cities: Riyadh; Jeddah and Madinah. Within these schools
there are 607 science teachers (Table 8.1 and Figures 8.1 and 8.2).
8-1

VA
Total SA (11110ii)
$00
500
400
500
200
100
0 M PARAFarad% Joatlah blotch
Z4VJ
2000
:,./1500
V4' 4%,"..1000
//
500 —/ -
. - 097A1rj/A
r• A.
11/Tceb Ad00 Mollusk Told solxis
City No. of secondary No. of scienceschools (%) teachers (%)
Riyadh 43 (7.9) 242 (12)
Jeddah 37 (6.7) 253 (12.6)
Madinah 25 (4.6) 112 (5.6)
Total 105(19.3) 607 (30.2)
SA (whole) 545 2013
Table 8.1 Descriptive statistics of secondary schoolsand science teachers by city,
Source (CSDED)
Figure 8.1 Distribution of Figure 8.2 Distribution ofsecondary schools by city science teachers by city
The sample was chosen from the three main cities in SA: Riyadh;
Jeddah and Madinah, because they have large populations, and represent
different geographical regions (Riyadh is situated in the middle east, while
Jeddah is in the west and Madinah is in the north).
The sample was identified as all science teachers in all the secondary
schools in these cities which have computer equipment, including: 122
science teachers in Riyadh, 103 science teachers in Jeddah and 60 science
teachers in Madinah (Table 8.2 and Figures 8.3 and 8.4).
8-2

60
50
40
30
20
10
0
*Mal
Jaelth
blacIncii
lold
400
350
300
250
200
150
100
50
0
City No. ofschools
No. of scienceteachers
No. of schools withcomputers (%)
No. of scienceteachers (X)
Riyadh 26 161 19 (73) 122 (76)Jeddah 22 152 14 (64) 103 (68)Madinah 10 85 7 (70) 60 (71)Total 58 398 40 (69) 285 (72)
Table 8.2 Descriptive statistics for sample sourcesSource (CSDED)
Figure 8.3 Distribution of original Figure 8.4 Distribution of originaland selected schools and selected science teachers
The questionnaires were distributed and collected or received in the
period February and March 1992. The beginning of the second term was
thought to be the most suitable time in SA because at this time teachers
are free from examination pressures.
122 questionnaires were distributed in Riyadh starting on 8 February
1992. They were delivered to the five educational centres throughout the
city, the schools' mailing service then delivered them to schools and
8-3

returned them to the centres. Reminder calls were made as necessary to
schools whose envelopes had not been received on 16 February. By 19
Feb., 111 completed copies had been returned.
Because of the small number of schools in Madinah, 60 questionnaires
were delivered and collected to and from schools personally in the period
22-26 February 1992. 55 completed copies were collected.
In Jeddah 103 questionnaires were used in the period 29 Feb.-18
March 1992. They were distributed and collected by the official post
between Jeddah LEA and schools. Every school received the questionnaires
accompanied by an official letter and form on which the school head was
asked to inform the LEA about how many teachers completed the ques-
tionnaires, and to give reasons for any not completed. By 18 March, 100
copies had been returned.
Table 8.2 indicates that the highest rate of return of questionnaires
was in Jeddah city where the questionnaires were distributed and collected
via official channels, while the lowest was in Riyadh where they were
delivered and collected through educational centres and schools mailings.
93% overall return is seen as a very high percentage response.
City No. of Whole No. of returned No. of lostsample copies (%) copies (%)
Riyadh 122 111 (91) 11 (9)
Madinah 60 55 (92) 5 (8)
Jeddah 103 100 (97) 3 (3)
Total 285 266 (93) 19 (7)
Table 8.3 Descriptive statistics of science teachers' sample by city
8-4

Because of the important role played by science advisors, all of the
19 science advisors in the three LEAs were invited to give their responses
to the science teachers' questionnaire. 15 copies were completed and
returned.
Tables 8.4 to 8.10 summarise the personal data supplied by the 266
science teachers and 15 science teacher advisors.
Table 8.4 and Figures 8.5 and 8.6 show that Physics, Chemistry and
Biology were the main subjects taught by SA secondary school science
teachers. Only four teachers taught Geology. One-fifth of the teachers'
sample and one-third of the advisors' sample recorded (Others), which
means pairs of subjects such as Physics and Chemistry, Biology and
Geology, Chemistry and Biology and Chemistry or Geology.
ST STA
N=266 % N=15
Physics 74 27.8 2 13
Chemistry 71 26.7 4 27
Biology 69 25.9 3 20
Geology 4 1.5 1 6.7
Others 48 18.0 5 33.3
Table 8.4 Teaching subject of sample by group
8-5

Figure 8.5 Distribution of subjects of
Figure 8.6 Distribution ofscience teachers' sample subjects of science advisors'
sample
Table 8.4 indicates that few teachers had post-graduate degrees:
those with MEd or MSc, or even Diploma (within the Others choice) were
around one-fifth. The table also shows that a large number of teachers
had no degree in education- those who had MSc or BSc. That means that
two-fifth of the sample had no teaching methods background. Unlike
science teachers, one-fifths of the science advisors had MEd.
Ed. degree ST
N=266 %
STA
N=14 %
MEd + 4 1.5 3 20.0
MSc - 5 1.9 0 0
BEd + 137 51.5 7 46.7
BSc - 103 38.7 3 20.0
Others + 17 6.4 1 6.7
+ Education degree qualifications, - No Education degree qualifications
Table 8.5 Qualification of sample by group
8-6

The experience data in Table 8.6 show that two-thirds of the STs
had more than five years teaching experience, while all STAs had more
than five years teaching experience.
ST STA
N=261 % N=14
0-5 95 36 0 06+ 166 64 14 100
Table 8.6 Year of Experience of sample by group
Although use of computers is not officially required in science teaching,
one-third of the ST sample and nearly half of the STA sample had PCs
( Table 8.7).
ST STA
N=264 % N=14
Yes 86 33 6 43
No 178 67 8 57
Table 8.7 Sample Ownership of PC by group
Only one-fifth of STs had computer experience. Table 8.8 suggests
that less than this average was found in the case of STAs, but a Chi2
test shows no significant difference (p=. 0.334) between the levels of group
experience. (Table 8.8).
ST STAN=262 % N=13
Yes 58 22 2 15
No 204 78 11 85
Table 8.8 Number of sample by group who had Computer Experience
8-7

In line with the previous result, only about one-quarter of science
teachers had attended computer courses. A higher average was found in
the case of advisors. Among them, it was almost one-third of the sample
(Table 8.9). Again the difference is not statistically significant.
ST % STA
N=262 N=14
Yes 62 24 5 36
No 200 76 9 64
Table 8.9 Number of sample by groupwho had attended Computer Courses
Table 8.10 shows the lack of courses related to the use of computer
in teaching. Only 12 teachers and 3 advisors had attended such courses.
Not surprisingly, the advisors had a significantly better attendance rate.
ST STA •
N=256 % N=14
Yes 12 5 3 21
No 244 95 11 79
Table 8.10 Number of sample by group who had attendedcourses in use of computer in teaching
Table 8.11 summarizes the samples' knowledge of computers. The
teachers group showed their highest level of success (77.4%) on item 2,
and their lowest (22.6%) on item 6. As with the STs', STAs show their
highest correct response score with item 2, whilst they show the lowest
response with items 4 and 5 (26.7 %). This may suggest that item 2 is too
8-8

simple. In half of the items (1, 2, 4 and 5) STs show slightly higher
correct response scores than STAs, whilst STAs score slightly higher in
the other items.
No Item
1 Computers can be used as a private
tutor (T)
2 Computers are used to introduce
large amounts of information to
pupils (T)
3 Computers have little application
to science teaching (F)
4 To use a computer successfully,
one needs to learn how to program
(F)
5 One of the computer's weaknesses
is that it is difficult to change
the text when you type by computer
(F)
6 The use of the PC is unrelated to
the needs of the schools (F)
7 The Saudi Arabian market has
various examples of English soft-
ware, but almost nothing in the
Arabic language (F)
8 Existing commercial software can
be used in science teaching (T)
Group F(%) DN(%) T(%)
ST 113(42.50) 43(16.2) 108(40.6)
STA 7(46.7) 2(13.3) 6(40.0)
ST 43(16.2) 16(6) 206(77.4)
STA 3(20.0) 2(13.3) 10(66.7)
ST 116(43.6) 50(18.8) 99(37.2)
STA 9(60.0) 0(0) 6(40)
ST 73(27.4) 11(4.1) 182(68.4)
STA 4(26.7) 0(0) 11(73.3)
ST 82(30.8) 86(32.3) 93(35.0)
STA 4(26.7) 4(26.7) 7(46.7)
ST 60(22.6) 87(32.7) 112(42.1)
STA 5(33.3) 4(26.7) 6(40)
ST 67(25.2) 88(33.1) 108(40.6)
STA 8(53.3) 5(33.3) 2(13.3)
ST 96(36.1) 86(32.3) 83(31.2)
STA 4(26.7) 6(40) 5(33.3)
Table 8.11 Descriptive statistics for "knowledge of computer"by group for the samples of STs and STAs
The table indicates that more than half of each of the two samples
could not achieve the correct answer to most of the eight computer
8-9

knowledge items. Even with items testing basic knowledge of computer
use such as item 1 "Computers can be used as a private tutor", the
majority failed to give the correct response.
Because STAs have no involvement with classroom activities, they
were not given the activity items, thus only STs' data are presented in
Table 8.12. On the basis of their replies, respondents were divided into
two groups for each item. The active group were those who responded
1\D (once a day), 1\W (once a week) and 1\M (once a month), whilst, the
non-active group were those responding 1\T (once a term or less often)
and N (never).
Table 8.12 indicates that the number of teachers in the active group
is greater than that in the non-active group for four of the eight items:
1, 2, 5 and 8. It can be seen that the number in the non-active group
is always more than the number of the active group in the case of items
mentioning computers, i.e items 4, 6 and 7. That seems to confirm the
results of the preliminary study which indicated lack of computer literacy
among SA secondary school subject teachers.
8-10

No Items
1
I allow my students to do experiments
by themselves.
2 I use video in my teaching.
3
I use an overhead projector in my
class.
4
I make personal visits to computer
centres.
5
I include discussion of TV science
programmes in my teaching.
6
I read educational computing
articles to look for teaching ideas.
7
I meet with computer teachers to
discuss computer uses in teaching.
8
I advise my students to follow the
developments in technology.
N Active (%) Non-active (%)
263 190 (72) 73 (28)
259 144 (56) 115 (44)
261 122 (47) 139 (53)
265 65 (25) 200 (75)
261 169 (65) 92 (35)
256 85 (33) 171 (67)
254 105 (41) 149 (59)
262 215 (82) 47 (18)
Table 8.12. Descriptive statistics for scienceteachers' sample activities
It is obvious that the ACTIVITY items shown in Table 8.12 divide the
science teachers' sample into two approximately equal groups according
to their classroom activity. The percentage of each group was closest to
each other for five items, 2, 3, 5, 6 and 7. However, Figure 8.7 shows
that the data of all items could make almost similar areas for each group,
which means each group covered half of the whole area of expected
responses.
8-11

AA" Active WA Non-Active
300
250(I)
w 200
•_w 150
Z50
02 3 4 5
6
Items1 87
Figure 8.7 Area distribution for active and non-active groupsin the science teachers' data
8.2 Scoring the Responses:
To prepare the data for computer analysis it was convenient to score
each response in one system, scoring for each part of the questionnaire.
The Attitudes items were scored as: SA=4, A=3, DA=2 and SDA=1 for the
positive items and SA=1, A=2, DA=3 and SDA=4 for negative items. All
missing responses were scored as mid point (2.5).
The knowledge items were scored as: True=2 and False or Do Not
Know= 1, for the items, 1, 2 and 8, because they are true items; and
8-12

False=2 and True and Do Not Know= 1, for the items, 3, 4, 5, 6, and 7,
because they are false items. All missing responses were scored as mid
point (1).
The Activity items were scored as 2 for the active group and 1 for
the non-active group. All missing responses were scored as mid point
(1.5).
Generally, few missing values were found. In the majority of the
subjects there were no missing values at all. Maximum missing values were
10 cases (3.8%) per item.
8.3 Confirming the Scales:
The scales of the science teachers' questionnaire were developed from
the preliminary study and were used in the pilot study as well. 30 attitude
items in the STQ were used in the main study divided into the same four
previous scales. The scales are:
• Attitudes to the value of computers for science teaching (VALUE),
eight items: 4, 5, 10, 16, 20, 25, 27, 29;
• Attitudes to the benefits and problems which they might see in the
use of computer in their classrooms (BENEFIT), eight items: 2,
6, 9, 13, 17, 22, 23, 28;
8-13

• Attitudes toward training to use computer in their teaching
(TRAINING), eight items: 3, 7, 11, 14, 18, 21, 24,26, and
• Attitudes toward the effectiveness or otherwise of pupils' use of
computers (EFFECTIVE), six items: 1, 8, 12, 15, 19, and 30.
Tables 8.13 to 8.16 display summaries of statistical description for
each scale in the STQ using data supplied by 266 science teachers and
15 advisors. The tables include the mean and standard deviation for each
item and score mean and score standard deviation for both STs and STAs.
Table 8.13 indicates that both STs and STAs scored higher than the
item-mid point for 7 items of the scale VALUE. However the STAs show
greater but not significantly greater differences between means for five
items.
8-14

No Item
4 Computers will increase the amount of
teacher-student interaction in the science
classroom.
5 I look forward to a time when computers are
more widely used in science teaching
10 Computers bring more disadvantages than
advantages to science teaching.
16 There is nobenefit from the use of computers
in science teaching commensurate with their
cost.
20 The use of computers in science teaching
would require large changes in science
teaching methods.
25 Science teaching is better without the use
of computers.
27 I almost never think about using a computer
in my teaching.
29 Computers can enhance the learning of pupils
in every science subject.
ST
N=266
STA
N=15
M 3.07 2.93
SD 0.768 0.799
M* 3.34 3.00
SD 0.690 0.845
M 2.85 3.10
SD 0.800 0.930
M 2.57 2.73
SD 0.791 1.10
M 1.93 2.07
SD 0.745 0.884
M 2.74 2.87
SD 0.771 0.743
M 2.57 2.80
SD 0.786 0.676
M 2.98 2.73
SD 0.743 0.961
*M= Mean, SD= Standard Deviation
Scale mid-point= 20, item mid-point= 2.5
Score mean: ST= 22.08, STA= 22.24
Score SD : ST= 6.09, STA= 6.94
Table 8.13 Descriptive statistics of Means and Standard Deviation forthe items of the VALUE scale by group
8-15

Table 8.14 shows that above mid point scores were achieved on 7
items of the scale BENEFIT by both STs and STAs. For five items STs
achieved a higher item-mean, but the two groups had approximately equal
score means (Table 8.14).
No Item
2 Introducing computers into science teaching would
decrease the teacher's role.
6 Science teachers manage without computers, so computers
are not really necessary.
9 Teaching science with the aid of computers would only
make difficult topics easier.
13 Teaching science with the aid of computers would make
teaching easier for the most able pupils only.
17 If the schools use more computers, they will need fewer
teachers.
22 Teaching science with the aid of computers would make
teaching easier for all pupils.
23 Using computers in science classrooms could weaken the
teacher's control of the students.
28 Teaching science with the aid of computers would make
teaching easier.
ST
N=266
STA
N=15
M 2.82 2.53
SD 0.741 0.834
M 2.32 2.27
SD 0.746 0.884
M 2.50 2.87
SD 0.729 0.743
M 2.62 2.73
SD 0.829 0.594
M 2.77 3.07
SD 0.790 0.961
M 2.90 2.63
SD 0.732 0.896
M 2.70 2.87
SD 0.804 0.516
M* 3.02 2.77
SD 0.745 0.863
* M= Mean, SD= Standard Deviation
Scale mid-point= 20, item mid-point= 2.5
Score mean: ST= 21.68, STA=21.76
Score SD : ST= 6.12, STA=6.29
Table 8.14 Descriptive statistics of Means and Standard Deviation forthe items of the BENEFIT scale by group
8-16

Unlike the previous two scales, only about half of the scores in the
scale TRAINING achieved the item mid-point. On half of the items STAs
obtained a slightly greater mean than STs, while the STs obtained slightly
mean in the other half of the items (Table 8.15).
No Item
3
A computer training programme should be compulsory for
every science teacher.
14 I would like my computer studies colleague to train
me to use a computer in my teaching.
24 A teacher of computer studies is not the best person
to train science teachers to use computers.
7
It is better to train science teachers in the schools
rather than in Universities.
11 Science teachers must know a great deal about how
computers work if they want to use them in science
teaching.
18 A computer studies teacher needs to know how to use
computers in science teaching before he trains science
teachers.
21 Only the computer studies teacher should use computers
regularly in his teaching.
26 I would be willing for an expert from outside school
to train me to use computers.
ST
N=266
STA
N=15
M* 3.07 3.13
SD 0.835 0.634
M 3.01 3.07
SD 0.783 0.799
M 2.26 2.47
SD 0.741 0.640
M 2.75 2.33
SD 0.916 0.817
11 1.63 1.43
SD 0.742 0.563
M 1.55 1.47
SD 0.684 0.916
M 2.76 3.07
SD 0.918 1.03
M 3.35 3.53
SD 0.660 0.516
* M= Mean, SD= Standard Deviation
Scale mid-point= 20, item mid-point= 2.5
Score mean: ST= 20.04, STA=20.96
Score SD : ST= 6.28, STA=5.92
Table 8.15 Descriptive statistics of Means and Standard Deviation forthe items of the TRAINING scale by group
8-17

Table 8.16 shows that all item scores on the EFFECTIVE scale reached
the item mid-point for both of STs and STAs. The total score means were
very nearly equal for the two groups.
No 'tea ST
N=266
STA
N=15
1 Computers are as important to science pupils as text N 2.75 2.43
books in the classroom. SD 0.804 0.623
12 Using computers in the science classroom will not improve M 2.90 3.00
pupils' positive attitudes towards the sciences. SD 0.786 0.378
19 Computers will increase the amount of anxiety pupils N 2.84 3.27
experience in the science classroom. SD 0.707 0.458
30 Computers will improve science pupils' thinking. M 3.13 3.00
SD 0.708 0.756
8 Computers will improve science pupils' problem-solving M 3.07 3.03
skills. SD 0.629 0.896
15 Computers will improve science pupils' abilities. M 2.82 2.47
SD 0.709 0.516
* M= Mean, SD= Standard Deviation
Scale mid-point= 15, item mid-point= 2.5
Score Mean: ST= 17.52, STA=17.22
Score SD : ST= 4.34, STA=3.63
Table 8.16 Descriptive statistics of Means and Standard Deviation forthe items of the EFFECTIVE scale by group
Tables 8.13-8.16 indicates that the score-mean of all scales were over
their scale mid-points for both ST and STA samples. In the scales, VALUE,
BENEFIT AND EFFECTIVE scores on almost all items were over the item
mid-point. On the three scales, only two items among STs and three items
8-18

among STAs scored below the item mid-point. In contrast, Table 8.15 shows
that for the scale TRAINING about half of the items, (three among STs
and four among STAs) scored lower than the item mid-point. There will
be more discussion of this point in chapter 11.
8.4 Scale Reliability:
The data supplied by 266 science teachers were used to estimate the
sensitivity and the internal consistency reliability of the four scales of
STQ.
The sensitivity of an attitude test or questionnaire is its ability to
discriminate between levels of attitude. The sensitivity of the scales is
related to the range of scale scores obtained by the respondents; the
wider the range of scores, the higher is the sensitivity of the scale
(Moore, 1984).
Table 8.17 shows that the scales of the STQ gave a wide range of
scores, more than four-fifths of VALUE, BENEFIT and EFFECTIVE scales
were covered by the responses of 281 STs, whilst more than a half of
TRAINING scale were covered. However, the range covered by all scales
(SUM) was from 52 to 106, 60% of the possible range. This would be wider
as a percentage of the scale span without the TRAINING scale. The mean
of the scale SUM is 81.60, near to the scale mean of 75.
8-19

Scale
name
No. of
items
Possible range
of scales
Min. Mid-point Max.
Observed range
of scales
Min. Max.
Mean
score
Scale
variance
VALUE 8 8 20 32 11 31 22.08 1.43
BENEFIT 8 8 20 32 12 31 21.66 0.41
TRAINING 8 8 20 32 14 27 20.37 3.56
EFFECTIVE 6 6 15 24 10 24 17.50 0.14
SUM 30 30 75 120 52 106 81.60 17
Table 8.17 Possible and observed ranges and score means for the fourscales of science teachers' questionnaire. Description of scales SUM also
shown
The internal consistency Alpha and the equal length Spearman-Brown
probability (Rss) were calculated.
The Rss estimates the reliability of a questionnaire of items as long
as the one for which we know is a self-correlation. In that case estimates
of reliability arise from the relationships between items and overall
construct. The split-half method works on the basis that there is a high
degree of equivalence between questionnaire items, so much so that it is
possible to separate them into two halves which perform similarly. However,
one weakness of this method is that a questionnaire can be split into
halves in many ways, and each split half could yield a somewhat different
estimate of questionnaire reliability.
Because of the dissatisfaction with the split-half methods,
Kuder-Richardson (KR) and later Cronbach developed alternative ways of
8-20

estimating scale reliability. The Cronbach alpha reliability is used to
estimate the degree of consistency within a questionnaire. One weakness
of this method is it is an estimate and generally only offers a lower bound
for the true value. Youngman (1979) suggested lengthening a test tends
to increase the associated alpha which masks the effect of unsuitable
items. The effect of individual items can be assessed by comparing alpha
values with and without each item (complementary alpha). If the alpha
value increases by dropping an item then that item must be disturbing
the reliability.
The reliability of the questionnaire was estimated as 0.712, 0.646,
0.052, 0.644 and 0.798 by the internal consistency Alpha of the scales
VALUE, BENEFIT, TRAINING, EFFECTIVE and SUM. Spearman-Brown
reliability were close to the alpha values for all scales except TRAINING
scale. They were recorded as; 0.719, 0.621,
scales respectively. (Table 8.18).
0.162, 0.620 and 0.811 for the
Scale name No. of items cc RSB
VALUE 8 0.712 0.719
BENEFIT 8 0.646 0.621
TRAINING 8 0.052 0.162
EFFECT 6 0.644 0.620
SUN 30 0.828 0.811
Table 8.18 Scales reliability by using alpha and Spearman-Brown. Thereliability of the whole of STQ (SUM) also shown.
8-21

Each of the three scales (VALUE, BENEFIT AND EFFECTIVE) has an
acceptable reliability from 0.620 for the scale EFFECTIVE to 0.719 for the
scale VALUE with both of the two reliability tests. Alpha was recorded
as 0.828 for the whole questionnaire with TRAINING scale and even higher,
0.850, without this scale. The TRAINING scale is unreliable by both tests.
The complementary-alpha values given in Table 8.19 indicate that all
of the three scales have a satisfactory make-up of items. For only one
item in the scale VALUE and one item in the scale BENEFIT was the
complementary-alpha less than the full scale alpha value, but the difference
is small. In the TRAINING scale, the complementary-alpha show that little
improvement in scale reliability could be achieved by removing any items.
It was concluded that the items are not sufficiently homogeneous to form
a scale. Consequently, it was decided to deal with each item individually.
Item Item van- Variance of complementary alpha
ance com. scale
4 59 9.57 0.672 VALUE scale (8 items)
5 0.48 9.63 661 a-0.712
10 64 8.96 645 RSB= 0.719
16 63 10.12 702
20 56 12.06 771
25 59 8.93 637
27 62 9.53 673
29 55 9.89 683
Total 0.179 0.712
2 55 8.74 615
6
9
56
53
8.58
9.45
606
654
BENEFIT scale (8 items)
a-0.646
8-22

13 69 8.06 588 RSB= 0.621
17 62 8.70 623
22 54 8.81 617
23 65 8.41 606
28 0.56 8.84 0.622
Total 0.051 0.646
3 0.55 4.53 0.060
7 84 3.98 -052 TRAINING scale (8 items)
11 55 4.82 091 a-0.0S2
14 69 4.03 -102 RSB= 0.162
18 47 5.12 136
21 84 4.64 057
24 65 4.44 -001
26 44 5.11 127
Total 0.45 0.052
1 0.65 4.81 0.596
8
12
40
62
5.28
4.91
594
602
EFFECTIVE scale (6 items)
a-0.644
15 50 5.20 610 RSB= 0.620
19 50 5.40 634
30 50 4.85 564
Total 0.02 0.644
Table 8.19 Item and scale variances together with complementary-alphavalues for the four science teachers' questionnaire
scales (30 items)
The complementary-alphas for the three scales individually are less
than the whole questionnaire alpha, whilst removing the TRAINING scale
8-23

can give some improvement to the questionnaire reliability (from 0.828 to
0.850). Thus, additional support for the omission of the scale is obtained
here (Table 8.20).
Scale Scale variance Variance of con. Complementarralpha
scale
VALUE 0.179 41.090 0.665 Questionnaire
(Total)
BENEFIT 051 46.304 720 a-0.828
TRAINING 446 69.126 850 RSB= 0.620
EFFECTIVE 023 54.161 714
Total 4.251 4.251 0.828
Table 8.20 Scale variances together with complementary-alphavalues for the four science teachers' questionnaire
scales and Total (30 items)
It can be concluded that the scales VALUE, BENEFIT and EFFECTIVE
can be used to probe similar dimensions of science teachers' attitudes to
the use of computers. Reliability data show that the eight TRAINING items
do not constitute a scale and that moreover the scale, if adopted, does
not measure in the same region of teachers' attitudes. The reason for the
unreliability of the TRAINING items may be associated with the different
aspects this scale measured. For example, item 21 was, "Only the computer
studies teacher should use computers regularly in his teaching", but the
item 26 was "I would be willing for an expert from outside school to train
me to use computers".
8-24

8.5 Factor Analysis Validity:
The spss/pc+ Factor Analysis routine was used to reestimate the
validity of the STQ 30 attitude items. Factor analysis is a common validity
test used to identify a relatively small number of factors that can be
used to represent relationships among sets of many interrelated variables.
The initial' statistics shown in Table 8.21. suggested seven main factors
because only factors that account for variance greater than 1 should be
included (Norusis, 1990). More than one-fifth of the questionnaire variance
was loaded in the first factor.
Factor Eigenvalue Pct of Var Cum Pct
1 6.70932 22.4 22.4
2 2.73630 9.1 31.5
3 1.68908 5.6 37.1
4 1.42013 4.7 41.8
5 1.29397 4.3 46.2
6 1.12948 3.8 49.9
7 1.05815 3.5 53.5
8 .97765 3.3 56.7
9 .96472 3.2 59.9
10 .90634 3.0 63.0
Table 8.21 Initial statistics for science teachers' questionnaire 30 itemsincluding, factors, eigenvalue, percentage of total variance and total
variance
1. A complete factor analysis statistics is located in Appendix F.
8-25

Very few items were loaded in factors five, six and seven, suggesting
that the use of only four factors would be most suitable and give more
meaningful factors for the 30 items. The four factors accounted for 41.8%
of the total questionnaire variance (Table 8.21). All items except one were
loaded above or equal to 0.40 in one of the first four factors, and therefore
accepted. If an item was loaded in more than one factor, the highest
loading determined its inclusion (see Appendix F).
Factor 1 had loadings from 19 items, accounting for 22.4 % of the
total variance, with an eigenvalue of 6.71. The highest loading of 0.73 was
on item 25, "Science teaching is better without the use of computers",
whilst the lowest loading of 0.30 was on item 2, "Introducing computers
into science teaching would decrease the teacher's role". It is obvious
that almost all VALUE and EFFECTIVE items were loaded in this factor.
The factor, therefore, was labelled: Attitudes to the importance of computers
for science teaching and pupils (IMPORTANT).
4 items were loaded in factor 2, accounting for 9.1 % of the total
variance, with an eigenvalue of 2.74. The highest loading of 0.45 was on
item 9, "Teaching science with the aid of computers would only make
difficult topics easier", whilst the lowest loading of 0.41 was on item 20,
"The use of computers in science teaching would require large changes
in science teaching methods". Three items of this factor were found in
the scale BENEFIT (and problems), but all these items concerned problems
rather than benefit. This factor, therefore, was labelled: Attitudes to the
8-26

problems which teachers see in the use of computers in their classrooms
(PROBLEMS).
4 items were also loaded in factor 3, accounting for 5.6 % of the total
variance, with an eigenvalue of 1.69. The highest loading of 0.69 was on
item 14, "I would like my computer studies colleague to train me to use
a computer in my teaching", whilst the lowest loading of 0.40 was for item
26 "I would be willing for an expert from outside school to train me to
use computers".
Only 3 items were loaded in factor 4, accounting for 4.7 % of the
total variance, with an eigenvalue of 1.42. The highest loading of 0.56 was
on item 11, "Science teachers must know a great deal about how computers
work if they want to use them in science teaching" and the lowest loading
of 0.42 was on item 21 "Only the computer studies teacher should use
computers regularly in his teaching".
All items of the last two factors were found in the scale TRAINING.
They were therefore labelled the same as TRAINING : Attitudes toward
training to use computers in their teaching, but factor 3 was named as
TRAINING1 and factor 4 named TRAINING2. The following table shows each
factor and its items.
Factor IMPORTANT PROBLEM TRAINING]. TRAINING2
Items No. 1-6, 8, 10, 12, 13, 15, 16, 9, 17,20, 7, 14,24, 11, 18, 21
19, 22, 25, 27-30 23 26
Table 8.22 The science teachers' questionnaire four factors and itemsloaded for each factor
8-27

The four factors were plotted according to their loading in two factors
1 and 2 or 3 and 4. Figures 8.8 a and b show loading plots of the factor
using Factors 1 and 2 as the coordinates in Figure 8.8a and using Factors
3 and 4 as the coordinates in Figure 8.8b. The IMPORTANT Factor items
shown in Figure 8.8a indicate a clusters of items around the factor axis,
the items at the end of the axis seem to have high loading on only this
Factor (Norusis, 1990), e.g, items, 8, 29, 30, 22, 27, etc., whilst items near
to the origin of the plot have low loading on both factors, such as items
2, 7, 24, etc.. The axis also includes items 11 and 18 because each of the
two items has high loading in this factor (see Appendix F), but at the
same time, they have a higher loading in TRAINING2 factor, therefore they
appeared in again in the TRAINING2 axis with item 21 (Figure 8.8b). A
clear axis appeared for the factor TRAINING1 items (7, 14, 24, 26), which
could also include item 2 because it has a high loading in this factor
(Figure 8.8b).
8-28

Horizontal Factor 1 Vertical Factor 2 Horizontal Factor 3 Vertical Factor 4
112018 9
*
24*
*
*
17 23
1927
216 10
21 6
4 25
11
18
*
13 6
8*
1230 *27
1 7
14
************************************* ******************** ****************
*7
*
*14
*
*
.
2615
22
829
330
16
26
92220
*15
23
*
2117
2
24
Figure 8.8a Factor loading plots for Figure 8.8b Factor loading plotsthe items using factors 1 and 2 as for the items using factors 3 and
the coordinates 4 as the coordinates
The four factors were treated as scales and each item was treated
according to its factor. Appendix F shows the complementary alpha for
each item to its factor.
8-29

No significant improvement could be achieved by removing any of
items in the IMPORTANT factor, although removing item 2 could increase
the alpha value of the factor from 0.879 to 0.882. For this reason all items
were retained in the factor.
The alpha reliability of the factor PROBLEM recorded 0.391, which
can be increased to 0.416 if item 20 is removed. Because there are few
items in this factor, it was decided to retain the item in the factor.
Unlike the two previous factors, small alpha values were recorded
for the factors: TRAINING1 and TRAINING2. However, the items in each
factor were too few to remove any of them, therefore these items must
be analysed separately.
It can be concluded that factor analysis loaded the 30 items of STQ
into four factors: IMPORTANT (19), PROBLEM (4), TRAINING1 (4) and
TRAINING2 (3). There were close correspondence between VALUE, BENEFIT,
and EFFECTIVE scales.
TRAINING items do not belong to any scale. This would confirm the
previous findings regarding the scale and the decision was made to deal
with TRAINING items individually and with the three scales as groups.
8-30

1=PA R. 111 13 :r.
8.6 Description of Science Trainers' Sample and Scales:
The important role played by science teacher trainers (STT) in pre-
and in-service science teacher training and in the decisions which can
made by them for SA science teaching, made it very important to investigate
their knowledge and attitudes in preliminary, pilot and main studies toward
introducing computers and using them for science teaching.
All science teacher trainers in all SA Universities were involved in
this study: 7 trainers at King Saud University at Riyadh (KSU1), 6 trainers
at King Saud University branch at Abha (KSU2), 5 trainers at Om Al-Qura
University at Makkah (OQU1), 1 trainer at Om Al-Qura University branch
at Tayef (OQU2), 4 trainers at King Abdul Aziz University at Madinah
(ICAU) and 2 trainers at King Faisal University (KFU) at Ahsa (Table 8.23).
Name of No. of whole No. of returned No. of lostUni. sample copies (%) copies (%)
KSU1 7 3 (43) 3 (67)
KSU2 6 6 (100) 0 (0)
OQU1 5 2 (40) 3 (60)OQU2 1 0 (0) 1 (100)KAU 4 3 (75) 1 (25)
KFU 2 2 (100) 0 (0)
Total 25 16 (64) 9 (36)
Table 8.23 Description of science teacher trainers sample byUniversities
8-31

Table 8.23 show that 16 (64%) science trainers completed and returned
the questionnaire'. This represented a smaller returned average than that
of STs and STAs. This may be attributable to the way in which both types
were distributed and collected: STQ was sent and collected personally or
through school mail and official post, the STTQ was sent and received
through Saudi Mail.
Table 8.24 summarizes personal characteristics data supplied by 16
science trainers. Almost all the sample had a PhD, and three-quarters had
more than 5 years teaching experience.
The Table shows that about one-third had not read any article or
papers about use of database or spreadsheet in science teaching and did
not know about uses of wordprocessors in teaching.
Less than one-third of STTs had no PC, close to the STs results
shown in Table 8.7. Not surprisingly STTs had more computer experience
than STs, about one-third of STTs had computer experience, whilst, only
one-fifth of STs had. However, the proportion of respondents having
attended computer courses was found for both STs and STTs to be about
one-quarter in each case.
Table 8.24 also indicates that one-quarter of STT sample had written
article (s) related to computers, although the article titles 2 show that
these were either theoretical articles like "computer literacy" or unrelated
to use of computers in teaching.
1. See the STTQ in Appendix E.2 ' See question 9 in the final section of STTQ at appendix E
8-32

Variable Score Qua.# Exp. DB SS WP PC CEx. CC CArt.
0* 1 4 10 14 11 10 11 12 12
1 15 12 6 2 5 4 5 4 4
# Qua.= qualification, Exp.= experience, DB= database, SS= spreadsheet, VP= wordprocessore,
PC= personal computer, CEx.= computer experience, CC= computer courses and CArt.= computer
article
* 0= No PhD qualification, 5 years of experience or less and No for all other variables
1. PhD qualification, more than 5 years of experience and Yes for other variables
Table 8.24 Science trainers personal characteristics by group
Because STTs responded to the same knowledge items responded by
STs, Table 8.25 presents a summary for STTs and STs responses on the
eight items shown previously in Table 8.11. The summary shows that the
highest correct response for STT was to item 2, to which more than
four-fifths of the sample gave the correct response. The lowest correct
response was to item 4, answered correctly by only one-third of the
sample.
Like STs, STTs show their highest correct response score with item
2. In half of the items (1, 2, 4 and 5) STs show higher correct response
scores than STTs, whilst, STTs show higher in the other items.
8-33

Item No. Group F(X) DN(54) TM
1* STT 7 (43.8) 1 (6.2) 8 (50)
ST 113(42.50 43(16.2) 108(40.6)
2 STT 1 (6.2) 2 (12.5) 13 (81.3)
ST 43(16.2) 16(6) 206(77.4)
3 STT 11 (73.3) 2 (13.3) 2 (13.3)
ST 116(43.6) 50(18.8) 99(37.2)
4 STT 5 (33.3) 1 (6.7) 9 (60)
ST 73(27.4) 11(4.1) 182(68.4)
5 STT 6 (40) 7 (46.7) 2 (13.3)
ST 82(30.8) 86(32.3) 93(35.0)
6 STT 7 (46.7) 1 (6.7) 7 (46.7)
ST 60(22.6) 87(32.7) 112(42.1)
7 STT 6 (37.5) 5 (33.3) 5 (33.3)
ST 67(25.2) 88(33.1) 108(40.6)
8 STT 5 (33.3) 3 (20) 7 (46.7)
ST 96(36.1) 86(32.3) 83(31.2)
* Items shown in Table 8.11
Table 8.25 Descriptive statistics for knowledge of computer by groupfor science teacher trainers (STT) and science teachers (ST)
Not surprisingly STTs show higher correct responses than STs to all
items. This may be because their high qualifications, kind of experience
and the valuable facilities provided for trainers at Universities. Moreover,
STTs are usually involved with computers in many ways, such as educational
technology in science teaching, science teaching innovations, using
computers in data analysis in their research, etc., whilst there is little
8-34

computer use among science teachers.
The STTs questionnaire includes four attitude scales: attitudes toward:
value of computers for science teaching (VALUE) which includes 7 items,
identical to items in the VALUE scale of STQ (there is one extra item in
STQ scale); training of science teachers to use computers in their teaching
(S.TRAINING) which includes 5 items; their own training to use computers
in their teaching (TRAINING) which includes 6 items and the effectiveness
or otherwise of use of computers by science pupils (EFFECTIVE), which
was exactly the same as the equivalent scale in the ST questionnaire.
Table 8.26 shows that all scale means were greater than the scale
mid-point, as for the STs sample. This is not surprising because almost
all item means were greater than item mid-point (2.5), the possible item
mean. The only two items below the mid-point were items 9 and 24. However,
the data suggest that positive attitudes of science trainers are perhaps
higher than among science teachers, although the scale means for both
cases are very close.
STTQ
No.
STQ No. STT ST It
No.
STT
4 4 M 2.44 3.07 2 M 3.50
SD 0.727 0.768 SD 0.516
5 5 M* 3.13 3.34 9 m 1.56
SD 0.602 0.690 SD 0.629
8 10 M 3.16 2.8514 m 1.69
SD 0.569 0.800 SD 0.602
13 162.72 2.57
18 m 3.31
SD 0.547 0.791 SD 0.479
8-35

17 20 M 2.22 1.93
SD 0.836 0.745
20 25 H 2.91 2.74
SD 0.584 0.771
23 29 M 3.25 2.98
SD 0.683 0.743
21 M 3.28
SD 0.515
VALUE Scale
Score mean: STT= 20.02; ST= 22.08
Score SD : STT= 4.337; ST= 6.09
S.TRAINING scale
Score mean= 13.35
Score SD = 2.741
1 1 M 2.69 2.75 3 M 3.08
SD 0.793 0.804 SD 0.854
7 8 M 3.063 3.07 6 M 2.69
SD 0.929 0.629 SD 0.873
10 12 M 2.5 2.90 11 M 3.06
SD 0.730 0.786 SD 0.680
12 15 H 2.72 2.82 15 M 3.19
SD 0.865 0.709 SD 0.544
16 19 M 2.88 2.84 19 H 2.81
SD 0.500 0.707 SD 0.911
24 30 H 3.0 3.13 22 M 3.13
SD 0.632 0.708 SD 1.03
EFFECTIVE Scale TRAINING Scale
Score mean: STT= 16.86; ST= 17.52 Score mean: STT= 17.94
Score SD : STT= 4.449; ST= 4.34 Score SD : STT= 4.892
*Note M= Mean, SD= Standard Deviation
Table 8.26 Descriptive statistics of Means and Standard Deviation forthe items of the science trainers questionnaire (STTQ) scales. Science
teachers' (STQ) data also presented in the similar scales.
8-36

The reliability estimations for STQ shown previously in Table 8.19
indicate an alpha of 0.673 for the scale VALUE without item 27 which was
not used in the STTQ, acceptable for a scale of seven items. Again, the
EFFECTIVE scale has exactly the same items of STQ, so the same reliability
can be used for STT questionnaire.
The TRAINING and S.TRAINING scales differ from the STQ scales, so
new reliability was sought for both scales.
The alpha reliability for the TRAINING scale was 0.34 and -0.302 for
S.TRAINING scale. The complementary alpha shows that the TRAINING scale
value could be improved by removing item 6 from the scale, which would
make the reliability value run up to 0.612. For this reason, the item was
removed from the scale. In contrast, no improvement can be achieved by
removing any item from the S.TRAINING scale.
8.7 An Official Interview:
During the Riyadh field work period, a semi-structured interview was
carried out with the Vice Assisted Minister for Educational Development.
The 45-minute official interview gained useful information related to the
study which will be incorporated in Chapter 12. The full interview can
be read in Appendix G.
8.8 Summary:
This chapter has explained the initial analysis of responses given by
samples of 266 science teachers and 15 advisors. Three reliable scales
8-37

have been derived for the STQ. The items of the TRAINING scale have
been shown not to be homogeneous and will analysed individually in the
next chapter.
Factor analysis has been used to confirm the scale results. Two
factors could be treated as scales. Confirming the above result, the
unreliable items were these of the TRAINING scale.
Data supplied by 16 science trainers have also been analysed. Three
reliable scales and 5 items have been found not to be belong to any
scales. These items will analysed individually in the following chapter.
8-38

CHAPTER 9::DATA ANALYSIS: WITHIN GROaJP
RE LAT' i CIN ii r S
The data from the science teachers' questionnaire, supplied by 266
science teachers (ST), 15 science advisors (STA) and 16 science teacher
trainers (STT), who returned completed questionnaires, are presented in
this chapter. The results are subjected to data analysis including
identification of groups, further analysis of attitude scales, and rela-
tionships between variables.
The chapter is divided into two parts. The first part deals with the
data collected by STQ from science teachers and advisors, while the second
part presents the data collected by STTQ from science teachers' trainers.
PARal A.
The three main relationships presented in the this sections are the
relationships between STs' and STAs' attitude scales and items and their
characteristics, activities (STs only) and computer knowledge.
To examine whether the different groups had different attitudes,
t-tests were carried out to analyse relationships between science teachers'
variables and attitudes, whilst the nonparametric median test was carried
out on science advisors' relationships, because the number of STAs was
too small for parametric analysis.
9-1

9.1 Relationship Between Sam ple Characteristics and Attitude Scales and
Items:
This section describes some relationships between sample char-
acteristics of the opinion scales VALUE, BENEFIT, EFFECTIVE and the
TRAINING items. Tables 9.1 to 9.4 give a summary of science teachers' and
science teacher advisors' characteristic variables including qualifications,
years of experience, ownership of PC, computer experience, computer
courses and courses in uses of computers in teaching, in relation to their
attitudes in the scales and items.
Table 9.1 indicates that some STs' characteristics are related to their
attitudes to the scale VALUE. These were: 'ownership of PC' (at p< 0.01),
and 'years of experience' (at p< 0.05). Small probability is shown for
ownership of PC, indicating the indubitable influence of having a PC on
science teachers' attitudes toward the scale VALUE. In contrast, the
t-value indicates no significant attitude differences according to variations
in 'qualifications', but 'attendance on a computer course' and 'courses in
use of computer in teaching' could be significant if the probability is at
p< 0.1. In addition, F is always significant, which means the variances of
the two STs groups are equal in all of the characteristic variables.
The median test most closely resembles the t-test (Siegel and Castellan,
1988). Therefore it was used to analyse STAs data. The median tests of
STAs responses show no significant relationship between characteristics
and the scale VALUE, though `PC ownership' is still the most effective
variable among STAs personal characteristics.
9-2

Character ST STA
Variable N Mean SD F Sig. t-value sig. N Median Prob.
Qua.* Post-G. 9 23.17 3.52 Sig. 0.96 0.340 3 22.00 1.000Grad. 257 22.03 3.51 11
Exp. 0-5 95 21.44 3.66 Sig. 2.17 0.031 0 _ _6+ 166 22.42 3.41 14
PC Yes 86 23.52 3.15 Sig. 4.83 0.000 6 22.00 0.192No 178 21.37 3.49 8
CExp. Yes 58 22.66 3.42 Sig. 1.48 0.141 2 22.00 1.000No 204 21.90 3.51 11
CC Yes 62 22.78 3.17 Sig. 1.95 0.053 5 22.00 0.580No 200 21.79 3.59 9
CCT Yes 12 23.92 3.75 Sig. 1.92 0.056 3 22.00 0.539No 244 21.91 3.52 11
*Qua. = qualification, Exp.= years of experience, PC= ownership of personal computer, CExp.=
computer experience, CC= attended computer courses and CCT= attended courses in use of
computers in teaching.
Table 9.1 Relationship between sample-characteristics and the attitudescale VALUE
On the scale BENEFIT, STs' `ownership of PC' had once more the
highest t-value and smallest probability and is therefore the characteristic
most significant on that scale (Table 9.2). 'years of experience' and
'attending courses in use of computers in teaching' also had significant
values. In contrast, the largest probability appeared for qualification
variables, confirming the previous indication that this variable has little
bearing on the BENEFIT dimension of STs attitudes (Table 9.2).
The results of STAs' data shown in Table 9.2 indicate again no true
difference between the two STA groups' characteristics and the scale
BENEFIT. Uniform medians were obtained in all characteristics.
9-3

Character ST STA
Variable N Mean SD F sig. t-value Sig. N Median Prob.
Qua. Post-G. 9 22.11 3.72 Sig. 0.42 0.674 3 20.00 1.00Grad. 257 21.64 3.29 11
Exp. 0-5 95 21.44 3.66 Sig. 2.17 0.031 0 - -6+ 166 22.42 3.41 14
PC Yes 86 22.38 3.22 Sig. 2.46 0.015 6 20.00 1.00No 178 21.34 3.24 8
CExp. Yes 58 21.89 3.30 Sig. 0.64 0.524 2 20.00 0.192No 204 21.57 3.31 11
CC Yes 62 21.85 2.96 Sig. 0.55 0.585 5 20.00 0.580No 200 21.59 3.39 9
CCT Yes 12 23.71 3.95 Sig. 2.22 0.027 3 20.00 0.539No 244 21.55 3.26 11
*Qua.= qualification, Exp.= years of experience, PC= ownership of personal computer, CExp.=
computer experience, CC= attended computer courses and CCT= attended courses in use of
computers in teaching.
Table 9.2 Relationship between sample-characteristics and the attitudescale BENEFIT
In line with the previous STs' results, Table 9.3 shows that the
characteristic 'ownership of PC' had the highest t-value of all the
characteristic relationships t=4.83 with the scale EFFECTIVE; the significant
of p=0.00 indicates the definite relationship between having a PC and the
attitudes toward the scale EFFECTIVE. The characteristic 'years of
experience' failed to show a significant relationship with this scale, while
the characteristic 'qualification' once again had a small t-value. The other
character variables show no true relationships to the scale.
The STAs' median tests show no real significant effect in all of their
characteristics.
9-4

Character ST STAVariable N Mean SD F sig. t-value sig. N Median Prob.
Qua. Post-G. 9 17.33 2.65 Sig. -0.20 0.844 3 16.75 1.00Grad. 257 17.51 2.62 11
Exp. 0-5 95 17.50 2.81 Sig. -0.08 0.936 0 - -6+ 166 17.47 2.52 14
PC Yes 86 23.52 3.15 Sig. 4.83 0.000 6 16.75 0.592No 178 21.37 3.45 8
CExp. Yes 58 17.59 2.96 Sig. 0.26 0.798 2 16.50 0.192No 204 17.50 2.52 11
CC Yes 62 17.52 2.45 Sig. 0.18 0.857 5 16.75 0.266No 200 17.45 2.66 9
CCT Yes 12 18.63 3.19 Sig. 1.57 0.117 3 16.75 1.000No 244 17.40 2.60 11
*Qua.= qualification, Exp. = years of experience, PC= ownership of personal computer, CExp.=
computer experience, CC= attended computer courses and CCT= attended courses in use of
computers in teaching
# Negative sign indicates greater mean for the second group.
Table 9.3 Relationship between sample-characteristics and the attitudescale EFFECTIVE
Because the scale TRAINING (items: 3, 7, 11, 14, 18, 21, 24 and 26)
was found to be unreliable (see section 8.4), t-test and median test were
carried out for each item individually.
It was surprising that none of the 8 items had a significant relationship
with the variable, 'ownership of PC' at p< 0.01 or p< 0.05. On the other
hand, two items had a significant relationship with PC ownership at p<
0.1. These were item 3, "A computer training programme should be com-
pulsory for every science teacher", and item 11, "Science teachers must
know a great deal about how computers work if they want to use them
9-5

in science teaching". However, the least significant item was item 18, "A
computer studies teacher needs to know how to use computers in science
teaching before he trains science teachers".
The other characteristics of STs showed no significant relationship
with any of the items, at the p< 0.1 level.
The STAs characteristics also showed no significant relationship with
the 8 TRAINING items, at p< 0.1.
The lack of distinction between groups found according to personal
characteristics on scores of the 8 items of TRAINING for both STs and
STAs could be associated with the nature of these items.
It can be concluded from the previous tables that the `ownership of
PC' is the variable with strongest effect on the STs scales, and that
`years of experience' also had a significant effect on two scales. In addition,
`attending courses in use of computers in teaching' had significant effect
on one scale. No significant effect resulted from any other characteristic.
It was likely that `qualification' had the least effect on the attitudes of
the ST sample.
All science advisors' characteristics showed no significant relationship
to the attitude scales and items.
The failure to detect differences between the STAs groups may be
associated with the median test limitation as a measure of central tendency.
It is only appropriate for describing continuous variables. For example,
the data 1, 2, 3, 4, 5, 6, 7 and the data 1, 2, 3, 4, 200, 3126, 5421 have
the same median of 4. Thus, the median is not particularly sensitive to
9-6

the exact value of each data value in the distribution, and changing one
of the data values of the distribution may or may not have any effect on
the value of the median. With a large sample it is more likely that the
data are continuous, but this is not the case with small a sample, and
that is maybe what was happened to the STAs' data which was supplied
by only 15 subjects, i.e a small sample population.
9.2 Relationship Between Sample Computer Knowledge and Attitude
Scales and Items:
Eight knowledge items were included in the science teachers'
questionnaire: computer as a private teacher; computer to introduce
information; computer applications in science teaching; need to be a
programmer; change within computer typing; PC is different from school
computers; computer software in SA market; and the use of commercial
software in science teaching.
T-tests and the median tests were carried out on the Means of STs
and STAs groups respectively. Their data were divided into two groups
according to the correctness of item responses. If the item was in fact
true, the responses were scored as Correct for true responses and Wrong
for false and do not know responses, but if the item was in fact false,
then true and do not know responses scored as Wrong and false responses
scored as Correct. The reversal for false items does not affect the
significance of the t-test and median results.
9-7

Table 9.4 shows a significant relationship between STs' knowledge of
computers and the scale VALUE. The items 2, 3, 4 and 5 had very high
t-values, indicating a strong relationship with knowledge effecting
teachers' attitudes to the VALUE scale. The only two unrelated items were
item 6, "The use of PC is unrelated to the needs of the schools" and item
7, "The Saudi Arabian market has various examples of English software,
but almost nothing in the Arabic language". For almost all items, the
number in the Wrong group was greater than the number in the Correct
group. Therefore, further indication of the poor computer background of
SA science teachers is obtained here.
For the STAs, the number in the Wrong group was greater than that
in the Correct group in only five items, and was less in three items; this
result was expected because of the STAs' extra experience and qualifi-
cations. However, the median test did not show significant difference in
the attitude scores between the groups for any of the items.
9-8

No. Item description
1 Computeras private
teacher (T)*
2 Computer to intro-
duce information
(T)
3 Computer applica-
tions in science
(F)
4 Need to be a pro-
grammer (F)
5 Change within corn-
puter typing (F)
6 PC is different
from school corn-
puters (F)
7 Computer software
in SA market (F)
8 Commercial soft-
ware in science
teaching (T)
g_TA
gE9MR I MkAn gR EilLI=yAlmn gig: N Median
Wrong 158 21.64 3.47 Sig. 2.40 0.017 9 22.00 1.00
Correct 108 22.69 3.50 6
Wrong 60 20.28 3.93 sig. 4.64 0.000 5 22.00 0.282
Correct 206 22.59 3.21 10
Wrong 150 21.21 3.76 Sig. 4.67 0.000 6 22.00 0.608
Correct 116 23.17 3.82 9
Wrong 193 21.65 3.62 Sig. 3.19 0.002 11 22.00 0.569
Correct 73 23.16 2.96 4
Wrong 184 21.56 3.46 Sig. 3.58 0.000 11 22.00 1.00
Correct 82 23.20 3.38 4
Wrong 206 21.92 3.50 Sig. 1.26 0.210 10 22.00 1.00
Correct 60 22.57 3.53
Wrong 199 21.97 3.46 Sig. 0.79 0.432 7 22.00 1.00
Correct 67 22.36 3.66 8
Wrong 183 21.77 3.51 Sig. 2.05 0.042 10 22.00 0.608
Correct 83 22.72 3.46 5
* T= true item, F= false item.
Table 9.4 Relationship between sample-computer knowledge and theattitude scale VALUE
Half of the STs' knowledge variables showed significant relationship
with the scale BENEFIT. Table 9.5 shows that items 6 and 7 appeared
again as unrelated knowledge variables, while the results obtained from
items 2, 3, 4 and 5 confirm the previous indication of their strong
9-9

relationship with science teachers' attitudes. Moreover, the STAs' knowledge
variables continue to show insignificant relationships with their attitude
scores.
NO. Item description Group M Mean MR X filgxXnAjgg ig
_s_TA
Median P
1 Computer as pri-Wrong 158 21.53 3.15 Sig. 0.78 0.434 9 20.00 1.00
vate teacher (T) Correct 108 21.85 3.50 6
2 Computer toWrong 60 20.52 3.25 sig. 3.10 0.002 5 20.00 0.282
introduce infor-Correct
mation (T)
206 21.99 3.23 10
3 Computer appli-Wrong 150 21.07 3.28 Sig. 3.39 0.001 6 20.00 0.608
cations inCorrect
science (F)
116 22.42 3.16 9
4 Need to be aWrong 193 21.36 3.34 Sig. 2.39 0.018 11 20.00 0.569
programmer (F) Correct 73 22.43 3.04 4
5 Change withinWrong 184 21.15 3.25 Sig. 3.88 0.000 11 20.00 0.282
computer typing Correct 82 22.80 3.10 4
(F)
6 PC is differentWrong 206 21.60 3.29 Sig. 0.54 0.59 10 20.00 0.608
from school corn-Correct
puters (F)
60 21.86 3.30 5
7 Computer software Wrong 199 21.49 3.27 sig. 1.42 0.156 7 20.00 1.00
in SA market (F) Correct 67 22.15 3.33 8
8 Commercial soft-Wrong 183 21.45 3.25 Sig. 1.51 0.131 10 20.00 0.119
ware in scienceCorrect 83 22.11 3.25 5
teaching (T)
Table 9.5 Relationship between sample-computer knowledge and theattitude scale BENEFIT
9-10

No. Item description Croup
1 Computer as private Wrong
teacher (T) Correct
2 Computer to intro- Wrong
duce information Correct
(T)
3 Computer applica- Wrong
tions in science (F) Correct
4 Need to be a pro- Wrong
grammer (P) Correct
5 Change within corn- Wrong
puter typing (F) Correct
6 PC is different from Wrong
computers in Correct
schools (F)
7 Computer software Wrong
in SA market (F) Correct
8 Commercial software Wrong
in science teaching Correct
(T)
In contrast with the findings on the previous two scales, Table 9.6
shows that half of the STs' knowledge items were significantly related to
the scale EFFECTIVE. Items 2 and 3 again showed the highest t-value
among the items, whilst items 6 and 7 again showed the lowest t-value.
No significant relationship was found between any of the STAs items
and the scale EFFECTIVE.
N
ST
Mean SD F Sig. T-value N
STA
RMedian
158 17.22 2.59 Sig. 2.11 0.036 9 17.00 0.622
108 17.91 2.60 6
60 16.10 2.52 Sig. 4.93 0.000 5 17.00 0.580
206 17.91 2.50 10
150 16.91 2.64 Sig. 4.32 0.000 6 17.00 1.00
116 18.26 2.38 9
193 17.36 2.60 Sig. 1.47 0.143 9 17.00 0.604
73 17.89 2.62 4
184 17.25 2.57 Sig. 2.38 0.018 11 17.00 1.00
82 18.07 2.63 4
206 17.43 2.65 Sig. 0.18 0.420 10 17.00 1.00
60 17.74 2.48 5
199 17.39 2.47 Sig. 1.18 0.237 7 17.00 1.00
67 17.83 2.99 8
183 17.33 2.58 Sig. 1.57 0.118 10 17.00 0.329
83 17.87 2.66 5
Table 9.6 Relationship between sample-computer knowledge and theattitude scale EFFECTIVE
9-11

As explained earlier, each of the TRAINING items needed an individual
analysis with the personal variables, including knowledge items. Because
not all of the TRAINING items were significant, only significant items are
presented in Table 9.7.
T-test on STs data indicated that the TRAINING item 11, "Science
teachers must know a great deal about how computers work if they want
to use them in science teaching", was significantly related to half of the
computer knowledge items. These were items 1, 4, 6 and 8.
TRAINING items 3, 18 and 21 showed significant relationship with two
of the knowledge items. Items 3 and 21 both showed a strong relationship,
p=0.005 and 0.004, respectively, with knowledge item 2, "Computers are
used to introduce a large amount of information to pupils".
The computer knowledge item 7 showed no real relationship with any
of the TRAINING items, this item was, "The Saudi Arabian market has
various examples of English software, but almost nothing in the Arabic
language".
Table 9.7 also shows that F value is frequently significant except
between TRAINING item 11 and knowledge item 1, where F was not significant.
The reason for that is because the group variances were not equal,
therefore in this case the separate-variance t-test should be used (Norusis,
1990). However the t-value was not very different from the pooled variance
estimate.
9-12

014
No.
1
Item description Sin t items I Big±
NS*
Sig
7-value
2.12
2.48
lig,.
0.035
0.014
Zig its Median E
Computer as pri- 11
vate teacher (T) 21
None
2 Computer to 3 Sig. 2.84 0.005 21 3 0.044
introduce infor-
mation (T)
21 Sig. 2.88 0.004
3 Computer applica- 3 Sig. 2.07 0.040 None
tions in science 18 Sig. 2.06 0.040
(F)
4 Need to be a pro- 11 Sig. 3.35 0.001 None
grammer (F) 21 Sig. 2.46 0.014
5 Change within
computer typing
3 Sig. 2.02 0.045 None
(F)
6 PC is different 11 Sig. 2.09 0.038 11 1 0.002
from school corn-
puters (F)
18 Sig. 2.18 0.030
7 Computer software
in SA market (F)
None 11 1 0.007
8 Commercial soft- 11 Sig. 3.06 0.002 11 1 0.089
ware in science 24 2 0.089
teaching (T)
* If F not significant, the separate variance estimate was used
Table 9.7 Relationship between significant TRAINING items and com-puter knowledge items by sample
9-13

It is not surprising that half of the knowledge items had no significant
relationship with the STAs' TRAINING attitude items, because previous
results had show insignificant relationships on all three scales. Only three
relationships were significant below the used-level of 0.05.
The previous analysis of the relationship between samples' computer
knowledge and their attitudes indicates that, in the STs' case, knowledge
items 2, 3, 4, 5 had frequently significant relation with all of the scales
and even with some TRAINING items, while items 6 and 7 were often not
significant items.
Knowledge item 2 "Computer to introduce information" had the highest
t-value for both of TRAINING items 3 and 21, while item 11, "Science
teachers must know a great deal about how computers work if they want
to use them in science teaching", was most significantly related with the
computer knowledge variables among the items, being significantly related
to four computer knowledge items.
9.3 Relationship Between Science Teacher Activity and Attitude Scales
and Items:
Eight science teacher activities were included in the STQ:
• Allow students to do experiments by themselves (Experiment),
• Use of video in teaching (Video), use of overhead projector in class
(Overhead),
. Make personal visits to computer centres (Computer visit),
9-14

• Include discussion of TV science programmes in teaching (TV
programmes),
• Read educational computing articles (Computer articles),
• Meet with CT to discuss computer uses in teaching (CT meeting),
• Advise students to follow developments in technology (IT news).
The subjects were asked to state how many times they perform each
activity: daily (1\D), weekly (1\W), monthly (1\M), termly (1\T) or never
(N).
Only science teachers were involved in the activity part (see section
8.1). The sample was divided into two groups, the active group who
responded 1\D, 1\W or 1\M, and the non-active group, who responded
1\T or Never.
T-tests were carried out for data supplied by 266 science teachers
between the two groups according to their attitudes to the scales, VALUE,
BENEFIT, EFFECTIVE, and the TRAINING items.
Table 9.8 shows that the Means of the active group were almost always
greater than those of the non-active group, but the difference of the
Means and therefore the attitudes between the two groups are not always
significant (Table 9.8). However, sign of generally more positive attitudes
on the part of the active group toward the scale VALUE are shown here.
From the t-test results shown in Table 9.8 it can be seen that three
science teacher activities are significantly related (p< 0.05) to the scale
VALUE. These are, computer visits, computer articles, and computer teacher
meetings. Among them 'computer articles' had the highest t-value, while
9-15

the lowest t-value among the whole activities was the `video' activity,
which scored only 0.06. However, the activity 'IT news' had a significant
t value at the level of 0.1.
Teacher Activities Group N Mean SD F Sig. T-value Sig.Experiments Active 190 22.12 3.52 sig. 0.93 0.355
Non-Act. 73 21.68 3.35
Video Active 144 21.97 3.71 sig. -0.06# 0.951Non-Act. 115 22.00 3.17
Overhead Active 122 22.17 3.36 sig. 0.88 0.382Non-Act. 139 21.80 3.57
Computer visits Active 65 23.20 3.13 Sig. 3.06 0.002Non-Act. 200 21.69 3.57
TV Programmes Active 169 22.20 3.57 Sig. 0.98 0.327Non-Act. 92 21.76 3.45
Computer articles Active 85 23.09 3.30 Sig. 3.31 0.001Non-Act. 171 21.56 3.57
CT Meeting Active 105 22.56 3.31 Sig. 2.08 0.039Non-Act. 149 21.63 3.64
IT News Active 215 22.26 3.38 Sig. 1.84 0.066Non-Act. 47 21.22 4.03
# Negative sign shows non-active group have the higher mean score
Table 9.8 Relationship between Science Teacher-Activity and the atti-tude scale VALUE
Only one activity, 'computer articles', was related to the scale BENEFIT
at the level of 0.05, although three more activities were significant at the
level of 0.1; these were: 'video', 'computer visits' and 'IT news'. The
activity 'CT meeting' had the lowest t-value among all activities (Table
9.9).
9-16

Although only one activity group difference was found to have a
significant t-value, all of the active group Means are greater than those
of the non-active group for all of the activities.
Teacher Activity Group N Mean SD F T-value sig.Experiments Active 190 21.72 3.35 1.25 1.01 0.312
Non-Act. 73 21.27 3.99
Video Active 144 21.89 3.32 1.15 1.75 0.082N-Act. 115 21.19 3.11
Overhead Active 122 21.87 3.25 1.01 1.44 0.152Non-Act. 139 21.30 3.24
Computer visits Active 65 22.22 3.39 1.10 1.67 0.097Non-Act. 200 21.45 3.23
TV Programmes Active 169 21.89 3.29 1.03 1.49 0.138Non-Act. 92 21.27 3.23
Computer Active 85 22.34 3.24 1.02 2.31 0.021articles Non-Act. 171 21.35 3.22
CT Meeting Active 105 21.75 3.19 1.12 0.57 0.572Non-Act. 149 21.51 3.38
IT News Active 215 21.84 3.29 1.04 1.85 0.066Non-Act. 47 20.86 3.23
Table 9.9 Relationship between Science Teacher-Activity and theattitude scale BENEFIT
Table 9.10 indicates that three science teacher activities had significant
relationships with the scale EFFECTIVE. 'computer articles', 'CT meeting'
and 'IT news' showed t-test significance at p< 0.05 or better, while 'TV
programme' was significant at the level of 0.1. However, 'IT nnews' seems
to have the strongest relationship to the scales, whilst 'experiments' has
the lowest t-value among all activities.
9-17

The Table 9.10 also shows that the active group Means are greater
than those of the non-active Means for all of the significant activities,
that is to say, the active group had more positive attitudes to the scale
EFFECTIVE with these three activities.
Teacher Activity Group N Mean SD F T-value Sig.Experiments Active 190 17.44 2.65 1.16 -0.25 0.803
Non-Act. 73 17.53 2.47
Video Active 144 17.34 2.71 1.35 -0.92 0.356Non-Act. 115 17.63 2.33
Overhead Active 122 17.55 2.67 1.11 0.57 0.570Non-Act. 139 17.37 2.37
Computer visits Active 65 17.94 2.16 1.59 1.61 0.108Non-Act. 200 17.34 2.72
TV Programmes Active 169 17.70 2.54 1.12 1.82 0.070Non-Act. 92 17.09 2.69
Computer Active 85 18.05 2.41 1.25 2.48 0.014articles Non-Act. 171 17.20 2.70
CT Meeting Active 105 17.97 2.44 1.22 2.48 0.014Non-Act. 149 17.15 2.70
IT News Active 215 17.71 2.54 1.24 2.77 0.006Non-Act. 47 16.56 2.83
Table 9.10 Relationship between science teachers' activity and theattitude scale EFFECTIVE
Table 9.11 shows that TRAINING item 3, "A computer training programme
should be compulsory for every science teacher" has a significant rela-
tionship with four teachers' activities and the item 26 has significant
relations with three activities. However, item 7 is significantly related to
only one activity, while items 11, 14, 18, 21 and 24 have no real relationship
with any of the science teachers' activities.
9-18

The activity, 'computer articles' has the greater number of significantly
related items and the activity, 'visits' has two significant related items.
That would confirm the previous indication about their effect on science
teachers' attitudes. In contrast, the activities, 'experiments' and 'video'
have no significant relationship with any of the TRAINING items.
Teacher Activity Sig. Items F Sig. T-value Sig.Experiments None - - -
Video None - - -Overhead 26 Sig. 2.28 0.023
Computer visits 3 Sig 2.06 0.04126 Sig. 2.05 0.041
TV Programmes 7 Sig. 2.15 0.032Computer articles 3 Sig. 1.99 0.048
24 Sig. 1.98 0.04926 Sig. 2.66 0.008
CT Meeting 3 Sig. 2.78 0.006IT News 3 Sig. 2.01 0.046
Table 9.11 Relationship between science teachers' activity andTRAINING attiude items
It can be concluded that the activity 'computer articles' had the
strongest relationship with the science teachers' attitudes generally. In
this activity, the subjects were asked to tell how many times they read
educational computing articles to look for teaching ideas.
The activities, 'CT meeting', 'IT news', and 'visits' also had significant
relations, while the other activities seemed to have no significant rela-
tionships to science teachers' attitudes.
9-19

It is noticeable that all significant activities require use of teachers'
leisure times; teachers need to give up their own time for these activities.
These activities are not compulsory teaching jobs.
9.4 Science Teacher Factors Relations:
Chapter 8 derived two reliable factors: IMPORTANT and PROBLEM,
together they accounted for 31.2 % of the total item variance.
Tables 9.12 to 9.14 summarise the significant relationships between
the two factors and science teachers' personal characteristics, computer
knowledge and activities.
Two characteristics are significantly related to the IMPORTANT factor.
These are ownership of PC and attending courses in use of computers in
teaching. The characteristics PC and years of experience are also related
to the factor PROBLEM. The Table 9.12 shows that PC has the highest
t-value in the factor IMPORTANT.
IMPORTANT PROBLEM
Character F Sig. T-value Sig. F Sig. T-value Sig.
Qua. Sig. 0.46 0.644 - - -
Exp. Sig. - - Sig. 3.52 0.001
PC Sig. 4.23 0.000 Sig. 2.54 0.012
CoEx Sig. - - - - -
CC Sig. - - - - -
CoT Sig. 2.15 0.032 - - -
Table 9.12 Significant relationship between science teacher-characteris--tics and the factors IMPORTANT and PROBLEM
9-20

Table 9.13 shows that six knowledge items are related to the factor
IMPORTANT, but unlike this factor, the PROBLEM factor showed no sig-
nificant relationship with any of the computer knowledge items. Among
them, 'computer to introduce information' has the highest t-value. The
PC variable also indicates a strong relationship to the factor.
IMPORTANT PROBLEM
Item description F Sig. T-value Sig. F Sig. T-value Sig.
Computer as Sig. 2.42 0.016 - - -private teacher
Computer to Sig. 5.38 0.000 -introduceinformation
Computer appli- Sig. 4.74 0.000 -cations inscience
Need to be a Sig. 2.54 0.012 -programmer
Change within Sig. - - - -computer typing
PC is different Sig. 3.83 0.000 - - -from schoolcomputers
Computer soft- Sig. - - - -ware in SAmarket
Commercial Sig. 2.01 0.046 - _ _software inscience teaching
Table 9.13 Significant relationship between science teachers' computerknowledge and the factors IMPORTANT and PROBLEM
Four science teachers' activities were related to the factor IMPORTANT.
These were 'computer visits', 'computer articles', 'CT meeting' and 'IT
news'. Computer articles had the strongest relationship to the factor of
9-21

all activities. Computer visits also had a strong relationship. Meanwhile,
it seems that four activities had no real relationship to the factor
IMPORTANT. These were, Experiments, Video, Overhead and TV programmes
(Table 9.14).
The factor PROBLEM again showed weak relationship to the activities.
Only 'video' activity was related to the factor.
IMPORTANT PROBLEMActivity F Sig. T-value Sig. F Sig. T-value Sig.Experiments Sig. - - - - -Video Sig. - - Sig. 2.16 0.032Overhead Sig. - - - - -Computer Sig. 2.90 0.004 - - -visitsTV pro- - - - - - -grammesComputer Sig. 3.41 0.001 - - -articlesCT meeting Sig 2.57 0.011 - - -IT news Sig. 2.61 0.009 - - -
Table 9.14 Significant relationship between science teachers' activitiesand the factors IMPORTANT and PROBLEM
9-22

9.5 Summary:
Table 9.15 summarises the science teachers' questionnaire results
presented in this chapter. It also allows direct comparison between the
three opinion scales and the two factor scales.
The Table 9.15 also shows the similarity between the results of the
factor IMPORTANT and the three scales, though the closest similarity was
with the scale VALUE. This may be because the 19 items of the factor
IMPORTANT and the 4 items of the factor PROBLEM are almost similar to
these of the scales VALUE, BENEFIT and EFFECTIVE. Therefore similar
results were expected for the factors.
9-23

Attitudes VALUE BENEFIT EFFECTIVE IMPORTANT PROBLEM 3* 7 11 14 18 21 24 26
Character
Qua.
Exp + + +
PC + + + + +
CExp.
CC
CoT + +
Knowledge it
1 + + +
2 + + + + +
3 + + + + +
4 + + +
5 + + + +
6 +
7
8 + +
Activity
Experiments
Video +
Overhead
Computer visit + + +
TV programmes
Computer article + + + + +
CT meeting + + + +
IT news + + +
+ Indicates positive significant relation (p< 0.05)
* TRAINING items
Table 9.15 Science teachers' results: summary of scales, factors anditems
9-24

It seems that amongst the science teachers' characteristics ownership
of a PC had the greatest number of significant relationships. All of the
scales (and factors) show a significant relationship to this characteristic.
Years of experience was also significantly related to most of the scales
and factors. However, no significant relationship was found between any
of science teachers' characteristics and their score on the TRAINING items.
The Table 9.15 indicates that most of the computer knowledge items
were significantly related to most of the scales, factors and several
TRAINING items. Knowledge items 2, 'computer to introduce information',
3, 'computer applications in science' and 4, 'need to be a programmer',
are strongly related to science teachers' attitudes. The only knowledge
item which showed no relationship was item 7, 'computer software in the
SA market', although all other knowledge variables showed strong link to
teachers' attitudes.
In addition, few science teachers' activities show significant rela-
tionships with their attitudes generally. Among them, Computer articles
and CT meeting had the greatest number of significant relationships.
Examination of the results of science teachers' activities in Table 9.15
shows that the activities most related to the attitudes generally were
these which were referred to computers, these were, Computer visit,
Computer article and Computer studies teacher meeting.
The TRAINING item 11, "Science teachers must know a great deal
about how computers work if they want to use them in science teaching"
was the item most related to the science teachers' knowledge. It was
9-25

related to half of the computer knowledge items. The same number of
relations was shown for the item 3 "A computer training programme should
be compulsory for every science teacher", with the science teachers'
activities.
9-26

1=• R.'11
9.5 Science Trainer Data Analysis:
Chapter Eight identified three reliable scales and six individual items
for the STTQ. The scales were VALUE ( 7 items), EFFECTIVE (6 items),
and TRAINING ( 5 items).
Relationships between the data supplied by 16 science trainers are
presented in the following Tables, including relationships between STTs'
personal data and computer knowledge and their attitudes in the scales
and items. The Median test was used because of the small size of the
sample.
Table 9.16 does not include the characteristics 'qualification', because
almost all of the sample had the same qualification (see Table 8.24);
therefore this variable was removed from the analysis.
The results shown in Table 9.16 reveal the weak relationship between
the STTs' characteristics and their attitudes. It was not surprising that
PC had the strongest relationship with the scales and items because
previous findings from the STs suggested the same result. However, use
of wordprocessor also appears to be related to some of the STTs' attitudes,
while almost no true relationships exist between the other characteristics
and the attitude scales and items. Nevertheless, the scale TRAINING shows
the strongest relationships among all scales and items.
9-27

Attitudes VALUB RITICTIVR TRAINING 2 6 9 14 18 21
Character NedianProb.
Exp.* 0.077 0.569 0.019 0.569 1.000 0.569 1.000 0.547 0.547
DB 0.608 1.000 0.302 1.000 1.000 0.608 1.000 1.000 1.000
SS 0.467 1.000 0.175 0.467 1.000 0.467 1.000 0.083 1.000
WP 1.000 0.282 0.005 1.000 0.509 0.282 1.000 0.000 0.013
PC 0.000 0.559 0.070 0.000 0.506 0.070 ==^ 0.005 0.095
CRxp. 1.000 0.282 0.005 1.000 1.000 0.026 1.000 0.245 0.245
CC 1.000 0.569 1.000 0.569 1.000 1.000 1.000 1.000 0.245
CArt. 1.000 1.000 0.596 1.000 0.214 1.000 1.000 0.245 0.245
*Exp.= experience, DB= database, SS= spreadsheet, WP= wordprocessor, PC= personal computer,
CEx.= computer experience, CC= computer courses and CArt.= computer articles
- The values are all less than the Median
Table 9.16 Median test exact probability between STTs' characteristicsand attitude scales and items
The computer knowledge items answered by 16 STTs shown in Table
9.17 indicate slight relationships to the STTs attitudes scales and items
generally. Nevertheless, item 1 is the only item which shows a significant
relationship with the majority of the attitude scales and items. This item
is, "Computer. can be used as private tutor".
Among the scales and items, the scale TRAINING had the smallest
probability, p = 0.001, with knowledge item 1, indicating that the scale is
strongly related to the two groups of item 1. In addition, the scale
EFFECTIVE had also small probability, P = 0.01, with the item.
9-28

Attitudes VALUE EFFECTIVE TRAINING 2 6 9 14 18 21
Item Median Prob.
Knowl* 0.619 0.010 0.001 1.000 1.000 0.010 1.000 0.028 0.028
Know2 1.000 1.000 0.213 1.000 0.071 0.200 1.000 0.509 0.509
Know3 1.000 1.000 0.308 1.000 0.018 0.282 1.000 0.119 0.119
Know4 1.000 0.026 0.106 1.000 0.509 1.000 1.000 0.245 0.013
Know5 0.119 1.000 0.302 0.119 1.000 0.604 0.375 0.300 1.000
Know6 1.000 0.315 0.126 0.315 1.000 0.315 1.000 0.600 0.106
Know7 1.000 0.119 0.302 0.608 1.000 0.007 0.375 1.000 0.300
Know8 0.041 0.315 0.126 0.315 1.000 0.315 0.438 0.600 0.600
* Knowl Computer knowledge item 1
Table 9.17 Median test exact probability between the STTs' computerknowledge and attitude scales and items
In summary, two relationship studies have been carried out for the
STTs data: relationship between the STTs' characteristics and their
attitudes, and relationship between the STTs' computer knowledge and
their attitudes.
It seems that the characteristics 'ownership of PC' and 'know about
wordprocessor in teaching' were significantly related to the sample
attitudes, while the only computer knowledge item showing significant
relationship was item 1. However, the scale TRAINING was the most sig-
nificant variable among the scales and items in both the characteristics
and knowledge relationships of STTs.
9-29

C HAP '1" E 1:?. 1 0COMPUTER STUDIES TEACHERS'SAMPLE AND DATA ANALYSIS
The previous two chapters have focused on the science teachers',
advisors' and trainers' samples and the findings from the data supplied
by each sample. This chapter concerns the sample of computer studies
teachers (CST) and the results from data supplied by them.
10.1 Selection and Description of the Sample:
The 1992 yearly report of the "Centre of Statistical Data 81. Educational
Documentation" (CSDED) indicates that Saudi Arabian secondary education
involves 125 computer studies teachers working at 140 secondary schools1.
About one-third of those teachers are based in three cities: Riyadh, Jeddah
and Madinah.
The CSTs' sample was identified as all computer studies teachers at
the schools from which the science teachers' sample was selected. It
consisted of 43 computer studies teachers in 40 secondary schools in the
three cities of Riyadh, Jeddah and Madinah which have computer equipment.
Copies of the computer studies teachers' questionnaire (CSTQ) which
has been described in Chapter Seven were distributed and collected in
l ' Some schools share a computer teacher.
10-1

iMadinahR yadh
Jeddah
15 -
1 0 -
5 -
0
n•n•nnn
the same way and during the same period as those of the science teachers
in each of the three cities (see section 8.1). 38 teachers completed and
returned the questionnaire (Table 10.1 and Figure 10.1).
City No. of whole No. Of returned No. Of Lostsample copies (%) copies (%)
Riyadh 18 14 (78%) 4 (13%)Jeddah 14 14 (100%) 0 (0%)Madinah 11 10 (91) 1 (9)Total 43 38 (88) 5 (12)
Table 10.1 Graphical locations of the sample of computer studiesteachers.
45
40 -.an
'=--
.Maan
MIMI
35 -
30 -.1n11
.1nn•n
25 - ;.n
•n••YMMI.
.0.1
=20 -
Total
.—n,-.nNow.,
MIIIIn
...VIM
Figure 10.1 Distribution of distributed and returned questionnaires bycity.
10-2

Tables 10.2 to 10.5 summarise the personal data supplied by the 38
computer studies teachers.
Table 10.2 and Figure 10-2 show that the largest group of computer
studies teachers specialized in computer science, that is about two-fifths
of the sample, while about 16% of the sample were computer engineering
specialists. However, only about one-fifth of the sample indicated that
they specialized in computer and education. These had mainly qualified
at colleges of education or had an Educational Diploma. (See tables below.)
By referring to the questionnaires, those in the "Others" category
were mainly mathematics specialists indicating the involvement of a minority
of subject teachers in teaching computer studies.
N=36 %
Computer science 15 39.5
Computer engineering 6 15.8
Computer and education 8 21.1
Others 7 18.4
Table 10.2 Subject specialisms of Figure 10.2 Subject distribution ofthe sample. the sample.
In line with the previous result, Table 10.3 and Figure 10-3 show
that half of the CSTs had a qualification in science (computer science),
and about one-fifth of the sample had a degree in engineering (computer
10-3

engineering), while less than a quarter of the sample had a first degree
in education. Table 10.3 also shows the absence of post-graduate degrees
among the whole sample. Only 11% of the sample had in addition to these
qualifications, a Diploma in Education.
N=38 %
MEd 0 0
MSc 0 0
BEd 9 23.7
BSc 19 50
BEg 7 18.4
Others 3 7.9
Ed. 4 11
Diploma
Table 10.3 Qualifications of the Figure 10.3 Qualification distributionsample. of the sample.
It was not surprising that the majority of CSTs had less than five
years of experience. This is probably because computers and computer
studies were introduced to the schools only recently. (See Chapter One
and Table 10.4.)
Years of Experience N=37
0-5 30 81
6+ 7 19
Table 10.4 Years of experience for CSTs in the sample
10-4

Table 10.5 summarises the courses and experience responded by the
CST sample, including pre-service training and INSET.
The data in Table 10.5 indicate that a large percentage of the sample
had received training in databases, wordprocessors and spreadsheets,
almost all of them had trained on wordprocessors and databases, while
two thirds had trained on spreadsheets. One third of the sample had
trained in the use of computer networks, although these do not exist in
the schools. It was not surprising to find that the majority of CSTs had
a personal computer.
A few teachers, constituting only about one-third of the sample, had
attended a course in general teaching methods. A majority had attended
courses related specifically to the use of computers in teaching, often
the teaching of computer studies.
Variable DB* SS WP Net. PC TC CCTYes (%) 32 (91) 23 (68) 35 (95) 11 (31) 31 (84) 12 (33) 31 (86)
NO (%) 3 (9) 11 (32) 2 (5) 25 (69) 6 (16) 24 (67) 5 (14)
* DB= had training on database, SS= had training on spreadsheet, WP= had training on
wordprocessor, Net.= had training on computer networks, PC= have a personal computer, TC=
attended courses in teaching methods and CCT = attended courses related to use of computers
in teaching.
Table 10.5 Previous training of the sample
10.2 Scoring the Responses:
Responses to the attitude items in the CSTQ were scored as described
previously with STs' attitude data (see section 8.2).
10-5

10.3 Confirming the Scales:
As described in section 7.3 the three scales of the CSTQ were developed
from the preliminary study and were used in the pilot study also. The
25 attitude items used for the CSTQ in the main study belonged to the
three scales used for the other instruments in both the preliminary and
pilot studies. The scales were:
• Attitudes to the value of computers for science teaching (VALUE),
including seven items.
• Attitudes toward training science teachers to use computers in their
teaching (ST.TRAINING), comprising about half of the question-
naire (13 items) because of the importance of this scale to the
main target of the thesis.
. Attitudes toward training in teaching methods (TRAINING), made up.
of five items.
Tables 10.6 to 10.8 summarise the responses for each scale in the
CSTQ using data supplied by the 38 computer studies teachers. The tables
give the frequencies, means and the standard deviations for each item
and the score mean and score standard deviations for each scale.
Table 10.6 shows that almost all of item means in the scale VALUE
were greater than the item mid-point (=2.5), the exception being item 7,
"If computers were introduced into science teaching, then problems would
arise as a result". The highest mean was for item 1. The score-mean of
the scale was above its mid-point (20.30 > 17.5). This indicates positive
attitudes toward the scale generally.
10-6

NO Items
1 Teaching science with the aid of
computers will make science teaching
easier.
4 The use of computers in science
teaching should be made compulsory
immediately.
7 If computers were introduced into
science teaching, then problems would
arise as a result (N)41.
11 Science teaching is better without
the use of computers (N).
18 Computers will decrease the amount
of teacher-pupil interaction in the
classroom (N).
19 The only subject which should use
computers is computer studies (N).
22 I think it is enough for pupils to
study computer studies courses (N).
SA=4* A=3 DA=2 SDA=I M SD
19 12 6 0 3.33 0.756
10 10 16 1 2.78 0.875
3 4 23 7 2.09 0.787
12 21 3 2 3.13 0.777
10 16 8 4 2.84 0.945
14 18 2 3 3.15 0.861
10 18 8 1 2.99 0.775
* SA= strongly agree, A= agree, DA= disagree, SDA= strongly disagree, M= the mean and SD=
standard deviation. it N= negative item
Scale mid-point= 17.5, item mid-point= 2.5, score mean= 20.30, score SD= 5.776
Note 1: The category values have been reversed for negative items, e.g SA replaces SDA and
so on. M and SD were calculated after reverse.
Note 2: Missing values were calculated as equal 2.5
Table 10.6 Descriptive statistics of frequencies, means and standarddeviations for the items of the VALUE scale
10-7

Similarly to the scale VALUE, Table 10.7 shows that almost all of the
item-means in the scale ST.TRAINING were greater than the item mid-point
(=2.5), the only item which did not achieved the item mid-point being item
2, "There are not enough computer machines in the schools to be used
for science teachers' training". The highest item-mean in the questionnaire
as a whole was item 10, "It is possible for science teachers to be trained
to use computers by their computer studies colleagues". This would indicate
strong agreement by computer studies teachers to train their scien-
ce-teaching colleagues to use computers.
No Its SA=4 A=3 DA=2 SDA=1 M SD
2 There are not enough computers in the 5
schools to be used for science teachers'
training (N).
3 The only person who should control 9
school computers is the computer studies
teacher (N).
6 If I am to train my science colleagues 5
in my school, then I need at least a
year to do so (N).
8 It would be easy for me to train science 11
teachers to use databases.
10 It is possible for science teachers to 22
be trained to use computers by their
computer studies colleague.
13 Science teachers are not capable of 19
being trained to use computers (N).
7 6 20 1.92 1.12
18 7 4 2.84 0.916
15 12 5 2.54 0.888
17 6 1 3.04 0.766
14 2 0 3.53 0.603
13 5 1 3.32 0.809
Table continue...
10-8

No Items SA=4 A=3 DA=2 SDA=1 M SD
15 I don't think that science teachers 8
would like me to train them to use
computers (N).
16 The computer studies teacher is the 11
only person who should use the computers
in his teaching (N).
17 Even if science teachers are trained 6
to use computers, they will not be able
to introduce pupils to computer appli-
cations (N).
20 I would be willing to train my science 18
teacher colleague to use a computer in
his teaching.
21 Students do not like any person to train 8
them except the computer studies teacher
(N).
23 I would be willing to allow my science 18
teaching colleagues to use the com-
puters.
26 3 1 3.08 0.632
20 4 3 3.03 0.854
13 13 5 2.54 0.918
15 4 1 3.32 0.775
18 7 5 2.76 0.943
18 o 1 3.41 0.656
25 It would be easy for me to train science 10 21 4 2 3.04 0.774
teachers to use spreadsheets.
* SA= strongly agree, A= agree, DA= disagree, SDA= strongly disagree, M= the mean and SD=
standard deviation. # N= negative item
Scale mid-point= 32.5, item mid-point= 2.5, score mean= 38.36, score SD= 10.654
Note 1: The categories have been reversed for negative items
Note 2: The missing values were calculated as equal 2.5
Table 10.7 Descriptive statistics of frequencies, means and standarddeviations for the items of the ST.TRAINING scale
10-9

The score-mean of the scale ST.TRAINING shown in Table 10.7 was
also greater than its mid-point (38.5 > 32.5). This result shows positive
attitudes throughout the scale.
No Items SA=4 A=3 DA=2 SDA=1 H SD
5 The computer studies teacher should meet 21
with his science colleagues to discuss
teaching ideas.
9 I would like my science colleagues to 12
tell me about science teaching methods.
12 I think computer studies teachers are 3
teaching well, so there is no need to
train them how to teach (N).
14 A computer studies teacher does not need 5
to be trained in teaching if he has enough
knowledge of his subject (N).
24 There is no need to train a computer 5
studies teacher to teach because he can
get experience in the classroom (N).
13 2 0 3.45 0.686
24 2 0 3.26 0.554
10 14 7 2.29 0.851
12 13 8 2.87 0.970
13 12 7 2.43 0.946
* SA= strongly agree, A= agree, DA= disagree, SDA= strongly disagree, M= the mean and SD=
standard deviation. # N= negative item
Note 1: The categories have been reversed for negative items
Note 2: The missing values were calculated as equal 2.5
Scale mid-point= 17.5, item mid-point= 2.5, score mean= 20, score SD=4.00
Table 10.8 Descriptive statistics of frequencies, means and standarddeviations for the items of the TRAINING scale
Table 10.8 shows that all of the 5 item means of the scale TRAINING
were greater than the item mid-point. Item 5 shows the highest mean
score (M=3.45), the item being, "The computer studies teacher should meet
with his science colleagues to discuss teaching ideas". The scale mean of
10-10

20 was greater than the scale mid-point, and thus the score of 20 indicates
strong positive attitudes toward computer studies teachers being trained
in teaching methods.
It seems that almost all item-means and all of the scale score-means
were greater than they had been expected to be (the mid-points). This
indicates positive attitudes on the part of the sample generally toward
the targets of the questionnaire as a whole. However, item 10 showed the
most favourable response from computer studies teachers. This concerned
the possibility of science teachers being trained in the use of computers
by their computer studies colleagues. At the same time the scale concerning
science teachers' training (ST.TRAINING), shows a large difference between
its score-mean and its mid-point (38.36-32.5= 5.86). This would appear to
confirm the willingness of computer studies teachers to train their
science-teaching colleague to use computers. Further discussion about
this point will be given in the next chapter.
10.4 Scale Reliability:
The data supplied by 38 computer studies teachers were used to
estimate the sensitivity and the internal consistency of the CSTQ and its
scales.
Table 10.9 shows that the 25 items of CSTQ gave a wide range of
scores. More than 90% of the scale VALUE, 60% of the scale ST.TRAINING
and more than 73% of the scale TRAINING, were covered by the responses
of the sample. In addition, more than half the range of the questionnaire
as a whole was covered by their responses.
10-11

Scale No. Of Possible range Observed range Mean Scale
name items of scales of scales score variance
Min. Mid-point Max. Min. Max.
VALUE 7 7 17.5 28 9 28 20.30 18.51
ST.TRAINING 13 13 32.5 52 28 51 38.36 35.13TRAINING 5 5 12.5 20 9 20 13.80 6.02
SUM 25 25 62.5 100 55 94 72.46 86.10
Table 10.9 Possible and observed ranges and score means for thethree scales of computer studies teachers' questionnaire. Description of
scales SUM also shown
The internal consistency (alpha) and the equal length Spearman-Brown
(Rss) were used to estimate the reliability of the questionnaire scales.
Table 10.10 shows all scales had significant reliability. Two scales
had high reliabilities. The TRAINING scale had the lowest value; acceptable
for a scale of only 5 items.
Scale name No. Of items a RsB
VALUE 7 0.864 0.842
ST.TRAJNING 13 0.806 0.826
TRAINING 5 0.557 0.562
SUM 25 0.835 0.795
Table 10.10 Scales reliability by using alpha and equal lengthSpearman-Brown. The reliability of the whole of CSTQ (SUM) also
shown.
A total scale SUM of all 25 items showed higher reliability than two
of the separate scales. The fact that alphsum is not greater than alpha for
all the separate scales individually indicates the scales do not measure
closely similar constructs. This is confirmed by the inter-scale correlation
10-12

which shows two weak negative relationships (Table 10.11).
Correlations ST.TRAINING TRAINING
VALUE
0.5556*
0-.0320
ST.TRAIN
0-.0420
* Sig. at 0.05
Table 10.11 scale correlation coefficients for the CSTQ scales and SUM
Table 10.12 shows that 16 of the 21 inter-item correlations for the
items in the scale VALUE were significant at the 0.01 level or better. A
typical item was item 1, "Teaching science with the aid of computers will
make science teaching easier". This item was significantly related to all
items of the scale indicating strong associations to the other items in the
scale.
Correlations: 1 4 7 11 18 19 22
1 1.0000 .5023** .4247* .5915** .4719* .3815* .3996*
4 .5023** 1.0000 .2072 .5610** .3482 .3667 •4734*
7 .4247* .2072 1.0000 .3331 .6739** .2987 .3784*
11 .5915** .5610** .3331 1.0000 .5442** .7379** .5861*
18 .4719* .3482 .6739** .5442** 1.0000 .5600** .6609**
19 .3815* .3667 .2987 .7379** .5600** 1.0000 .5492**
22 .3996* •4734* .3784* .5861** .6609** .5492** 1.0000
1-tailed Signif: * - .01 ** - .001
Table 10.12 Item correlation for the scale VALUE.
10-13

Similar to the inter-item correlations of the scale VALUE, significant
inter-item correlations were found between most items in the scales
ST.TRAINING and TRAINING. The Tables are located in Appendix H.
The value of the complementary-alpha (i.e. the value of the alpha for
scale if the item were deleted) was used to determine for each item in
the three scales whether it should be removed from the scale.
The results of the complementary-alpha for all scales shown in Table
10.13 indicate that the complementary-alpha of each item in the scale
VALUE was less than the alpha of the whole scale. In the scale ST.TRAINING,
small improvement in alpha value could be obtained by removing item 2,
which was the only item with a greater complementary-alpha value than
the scale alpha value. The item was "There are not enough computer
machines in the schools to be used for science teachers' training". It was
also thought that the item is too important to the scale because many
teachers interviewed in the preliminary study were of this opinion. (See
Chapter Five.) For these two reasons, the item was retained in the scale.
10-14

Item complementary alpha Item complementary alpha
1 0.849 2 0.824
4 861 VALUE scale (7 items) 3 773 ST.TRAINING scale (13 items)
7 862 e-.0.864 6 793 a-0.806
11 829 8 780
18 831 10 793
19 844 13 799
22 838 15 804
Total 0.864 16 797
5 0.641 TRAINING scale (5 items) 17 782
9 587 a-0.557 20 803
12 270 21 784
14 507 23 797
24 352 25 775
Total 0.557 Total 0.806
Table 10.13 The complementary-alphavalues for the three scales of the computer studies teachers'
questionnaire (25 items)
Item 5 of the scale TRAINING decreased its alpha reliability from 0.641
to 0.557, while a further test showed removing both item 5 and item 9
would increase alpha value up to 0.732. However, these items were sig-
nificantly related to the scale TRAINING (see inter-item correlations for
the scale in Appendix H). This suggested that the two items may be not
sufficiently homogeneous to the scale. There was some reluctance to drop
10-15

these items for two reasons. First, they have good face validity for the
scale, and second, the notion of training is central to the interaction of
STTs and CSTs. Consequentaly, the scale was treated with and without
these item, i.e. the scale analysed as TRAINING (5) with these items, and
TRAINING (3) without these items.
It can be concluded that both of the previous tables suggest acceptable
reliability for each individual scale. The scales VALUE and ST.TRAINING
showed high reliability values, while removing two items from the scale
TRAINING give further improvement to its reliability.
The scales VALUE, ST.TRAINING, and two forms of the scale TRAINING
will be used in the next part of this chapter to look for relationships
between the variables included in the computer studies teachers' ques-
tionnaires.
10.5 Relationships between Variables:
Computer studies teachers' characteristics were divided into two
categories: the first was personal characteristics, including: subject,
qualification, Education Diploma, years of experience and ownership of
personal computer. The second covered previous training, including:
training on database, spreadsheets, wordprocessor, computer networks,
attending courses in teaching methods and attending courses related to
use of computers in teaching.
10-16

To investigate whether groups formed according to the characteristic
variables had different attitude scores, t-tests were carried out between
scores of the groups on the three attitude scales of VALUE, ST.TRAINING
and TRAINING.
Because similar results were found for the scale TRAINING with 5
items, 3 items and for the items 5 and 9 individually, the relationships
presented in the next sections were for the scale as a whole, i.e. with
combining all 5 items together.
10.5.1 Relationship Between Samples Characteristics and Attitude Scales:
Table 10.14 summarises the relationships between the CSTs personal
characteristics and their attitude scores on the three scales.
The t-test results shown in Table 10.14 indicate insignificant t-values,
which means that there are no true relationships between CSTs personal
characteristics and and scales VALUE, ST.TRAINING and TRAINING measuring
their attitudes to: the value of computers for science teaching; toward
training their science colleagues to use computers; and toward their own
training in teaching methods. Among the variables, 'Subject' showed the
highest t-value to the scale VALUE.
10-17

Scale VALUE ST.TRAINING TRAINING
Character Groups N Mean SD t-value Mean SD t-value Mean SD t-value
Subject Educational 8 22.69 3.56 1.63 39.38 6.11 0.54 14.19 1.89 0.54
Non-Edu. 30 19.96 4.31 38.05 6.13 13.64 2.66
Qualification Educational 9 21.61 4.30 1.05 39.11 5.73 0.43 13.89 1.88 0.12
Non-Edu. 29 19.90 4.30 38.12 6.07 13.78 2.63
Had Edu. Yes 4 22.13 4.80 0.88 40.38 3.82 0.70 13.87 1.32 0.11
Diploma No 33 20.09 4.33 38.12 6.22 13.73 2.58
Years of Exp. 0-5 30 20.35 4.49 -0.28 38.12 6.12 -0.63 13.93 2.62 0.556+ 7 20.86 3.42 39.71 5.71 13.36 1.86
Ownership of PC Yes 31 20.68 4.55 0.83 38.73 1.07 1.02 13.95 2.58 1.18
No 6 19.08 2.54 36.00 6.20 12.67 1.40
Table 10.14 Result of t-tests for the scales VALUE, ST.TRAINING,TRAINING and groups formed accorded to personal characteristics.
10.5.2 Relationship Between Sample Previous Training and Attitude
Scales:
Table 10.15 summarises the relationship between the previous training
of CSTs and the scales VALUE, ST.TRAINING and TRAINING respectively.
The only significant variable among all previous training variables
was training on computer networks 'Net'. A t-value of 2.39 was achieved,
more than 0.05 level of significance. Some variables, however had visible,
but insignificant t-values.
10-18

Scale VALUE ST.TRAINING TRAINING
Character Groups N Mean SD t-value Mean SD t-value Mean SD t-value
DB* Yes 32 20.88 4.32 1.32 38.67 6.11 0.00 13.58 2.56 -0.50
No 3 17.50 2.50 38.67 2.51 14.33 1.16
SS Yes 23 21.39 4.81 1.34 40.22 6.13 2.01 13.91 2.52 0.56
No 11 19.32 2.45 36.14 3.99 13.41 2.28
WP Yes 35 20.66 4.29 1.43 38.27 6.14 0.05 13.73 2.52 -0.15
NO 2 16.25 1.77 38.50 3.54 14.00 1.41
Net. Yes 11 22.86 4.77 2.39 40.68 7.52 1.55 14.23 2.96 0.78
NO 25 19.32 3.78 37.36 5.13 13.52 2.29
TCo Yes 12 20.88 4.38 0.67 20.88 4.38 0.67 13.08 3.03 -1.22
No 24 19.88 4.11 19.88 4.11 14.15 2.13
CTC Yes 31 21.90 1.75 0.98 38.52 5.69 1.38 38.52 5.69 1.38
NO 5 19.94 4.39 34.70 5.91 34.70 5.91
* DB= had training on database, SS= had training on spreadsheet, WP= had training on
wordprocessor, Net.= had training on computer networks, TC= attended courses in teaching
methods and CCT = attended courses related to use of computers in teaching.
Table 10.15 Result of t-tests for the scales VALU, ST.TRAINING, TRAIN-ING and groups formed accorded to previous training
10.6 Discussion:
This chapter showed that there were three reliable scales in the
CSTQ, namely: VALUE, ST.TRAINING and TRAINING. Very high reliability
was recorded for each individual scale. Alpha was recorded 0.86, 0.81 and
0.73(0.56) for scales and modified scale respectively.
The data supplied by 38 CSTs showed strong positive attitudes among
the sample toward: the value of computers for science teaching (VALUE),
training their science colleagues to use computers in their science
classrooms (ST.TRAINING) and their own training in teaching methods
10-19

(TRAINING). The item-means recorded by their responses indicated that
almost all items were scored higher than item mid-point, which was expected
as a mid response.
The results presented in the previous two sections showed that the
only related variable was previous training on Networks with the scale
VALUE. 32 of the 33 t-tests for the three scales were not significant,
indicating lack of significant relationships between computer studies
teachers' personal characteristics and their previous training, and their
attitude scores on the three scales. The finding of one value from 33
testes can be dismissed on the ground that this is no more than simple
statistical expectation.
Two reasons could explain the lack of significant findings for the
CSTs. First, 38 cases of the computer studies teachers is not a very large
sample. Difficulties were compounded by the uneven split across the
variables with, often, very few cases in one of the groups. A very small
sample for one group makes it too difficult for the t-test to detect the
difference if any, between the two groups. The importance of sample size
in statistical tests is well known. McNemar (1969) pointed out that the
greater the number of cases, the greater the likelihood of detecting a
difference. The results of CSTs showed two group sizes for each variable,
a small group and large one. In each test of the personal characteristics,
there were 9 cases or less in each of the smaller groups. In the previous
training section also, small groups were revealed for about half the
variables.
10-20

The results of the sample on 'previous training' indicated that t-value
was mostly increased as the number in the smaller group increased. For
example, it was 0.00, 0.05 and 1.38 when the smaller group was 3, 2, and
5 in the variables: DB, WP and CCT respectively. But it was 2.01, 1.55 and
0.67 when the smaller group was 11, 11 and 12 in the variables: SS, Net.
and TC respectively. Although these scales are not significant, they do
support indications of restrictions from group size.
Second, the means of both CSTs groups were very close to each
other. This indicates the similarity of attitude between the two groups.
All CSTs had the same favourable and sympathetic attitudes to the variables
measured by the three scales.
10-21

CH .1k1=6 "I' E FL 1 I
DISCUSSION AND SUMMARY
The main aim of this study was to consider possible problems which
may arise when computers are used for science teaching in Saudi Arabian
secondary education.
This chapter concerns some problems facing the introduction of
computers into secondary school science teaching. It summarises the
findings obtained from the 266 science teachers, 15 science advisors, 16
science trainers and 38 computer studies teachers. Computer background
of the STs, STAs and STTs, and the attitudes of all samples toward the
introduction of computers for science teaching are also described.
The following sections bring together the problems, issues and
findings detected by this study, from the literature review, experience
of some industrial countries, and from empirical fieldwork in Saudi Arabia.
11.1 Funding Issue:
Although funding is a major issue to be considered in educational
programmes, the enthusiasm shown for computers by the Saudi Arabian
government and its Ministry of Education, leaves little doubt that the
introduction of computers would not face any funding difficulty.
The problem which may arise here is the allocation of the funds
between different parts of the programme. At present, most funding goes

to support computer equipment and machines, whilst little if anything has
been spent on teachers' training programmes and software development.
The correctly balanced distribution of the fund will provide both machines
and other services to ensure they are used to full benefit for students.
11.2 Hardware Issue:
The preliminary study (Chapter 5) showed that 16 computer machines
are based or intended to be based in each secondary school. This number
is close to the number of machines per school in some industrial countries,
where computers are used in teaching of almost every subject. Moreover,
the Saudi Arabian government is continuing its programme of installing
machines in the schools (see Chapter 1).
One recognizable hardware problem which could face the introduction
of computers in secondary school science teaching may arise from the
type of machines installed in schools. The preliminary study showed that
schools have MSX 350 computers. These machines are supplied by Alalamia
computer company. The majority of these machines can work only with
specific types of software produced by the company, partly because they
are bought for programming purposes only.
Lewis (1989) and NCET (1993) have both stated that lack of versatility
of the BBC computer machines was a serious crisis in British schools in
the late eighties. Similar problems, therefore could be expected in Saudi
Arabia if the Ministry of Education continues to install MSX machines. It
has been opined that installing standard types of computer such as IBM-PC
and its compatible, Apple Macintosh, is the best way of avoiding problems
11-2

arising from incompatibility between hardware and software. Standard
types are usually easy to use, cheap to buy and a wide range of compatible
software can be found and used.
11.3 Software Issue:
This problem is shown through: shortages of programs related to
science subjects, high price of science software, etc..
There is a lack of Arabic computer software for science subject
teaching in Saudi Arabia, although some private companies have established
"Microtext" programs for some science subjects. The price of these
programmes is too high. The reason for shortages and the high price of
software related to science subjects is probably linked with the use of
non-standard MSX computers.
The difficulties of producing specific software to assist science
teaching has led some educators in the industrial countries to think about
using types of generic software such as: Wordprocessor, Database and
Spreadsheets (see Chapter 6). The recognition of the potential of these
types of software in science teaching can seen by the rapid increase in
their use throughout English and American schools.
The lack of Arabic educational software gives additional support to
call for the use of generic software in science teaching in Saudi Arabian
secondary schools. These types of software are widely available in the
Saudi Arabian market at economic prices.
11-3

..4114.1 E
egaoOda
Gann
r-i 4"-PI
In 1992, Microsoft and Alalamiah companies have both launched Arabic
versions of Micrsoft Windows release 3.0 and 3.1. This facility can easily
translate any Windows-applications into Arabic. In addition to command
translation, Alalamiah copy provides an "Arabic Interface", which gives
the user complete control over the applications (Figure 11.1). It states:
"This version provides all that you need through the Arabic Interface
for all Windows Latin applications. You could easily replace any Latin
Interface by an Arabic one". (Al-alamiah Manual, p. 1)
-Ma i
,INNImmenzzzamirmmur.zo"2" 411 pee4
Figure 11.1 Al-alamiah Arabic Windows
Recently, Microsoft has announced that it will provide an Arabic
version for every Microsoft application within 90 days after its Latin
release, "We are considering to establish a Microsoft manufacture in Saudi
Arabia because 80% of our sale in the Gulf is based in Saudi", said the
Microsoft Dealer in the middle east (Al Riyadh, 1993).
11-4

Arabic windows could provide schools with a wide range of generic
software applications in Arabic such as Lotus 1,2,3, DataEase, etc., although
some generic applications such as Excel and Word have already provided
Arabic versions.
Regardless whether schools choose an Arabic application or a translated
Arabic application, there is no doubt that science teachers will find them
much easier than establishing new software for every science topic.
11.4 Samples' Computer Knowledge:
Eight computer knowledge items were included in both the STQ and
STTQ. Each of the three samples (i.e STs, STAs and STTs) found item 2,
"Computers are used to introduce large amounts of information to pupils"
the easiest item, as it was very general. The majority in each sample gave
correct responses to this item.
Items 6 and 7 were found the most difficult. Item 7 was, "The Saudi
Arabian market has various examples of English software, but almost
nothing in the Arabic language". The item was intended to investigate
the samples' awareness of the Arabic commercial applications of the
computers. Only subjects who used or were aware of computers were
expected to give the correct response. Responding correctly to this item
could be linked to the ownership of a PC, because the preliminary study
showed most of the sample who had PCs were found to use them for Arabic
applications (see Chapter Five). The 30.8 %, 43 % and 40 % of STs, STAB
and STTs respectively who gave the correct response to the item
corresponded closely with the 33 %, 26.7 and 28.6 who had PCs.
11-5

Item 6 was, "The use of the PC is unrelated to the needs of the
schools". Since this item was intended to assess advanced computer
knowledge and the misunderstanding of the needs of the schools, only a
minority of subjects disagreed with the item. 22.6 % of STs, 33.3 % of
STAs and 46.7 % of STTs responded correctly to this item.
Although only basic knowledge was involved in many of the items
(see Table 7.10), the majority of both STs and STAs could not give the
correct answers to most of the items. This confirmed the preliminary study
findings of lack of knowledge and background of use of computers in
classrooms among the samples. The results from STTs also showed somewhat
limited computer knowledge.
This limitation of computer knowledge may perhaps be attributed to
the lack of computer literacy courses in the Saudi Arabian education
sector. For example, 78 % of STs, 85 % of STAs and 69 % of STTs had no
computer experience. Moreover, 76 % of STs, 64 % of STAs and 75 % of
STTs had not attended computer courses at all, while 95 % of STs and
79 % of STAs had not attended a computer course specifically related to
the use of computers in teaching.
11.5 Samples Attitudes Toward the Introduction of Computers into
Science Teaching:
Each of the four samples, i.e. STs, STAs, STTs and CSTs showed
strongly favourable attitudes toward the introduction of computers into
the science classroom.
11-6

11.5.1 Science Teachers' and Advisors' Attitudes:
In the STs results, the item-means were greater than the item mid-point
in all of the items making up the three reliable attitude scales, except
for items 6 and 20 (Tables 8.13 to 8.16). These items were, "Science teachers
manage without computers, so computers are not really necessary" and
"The use of computers in science teaching would require large changes
in science teaching methods". The agreement with these two items can be
explained on the ground of lack of computer knowledge among the sample,
especially for item 20. Some teachers might have thought that the
introduction of computers in science teaching really needs a great change
in teaching methods, because they had little knowledge of the nature of
computers and their use in science teaching, although they might still
have a favourable attitude. For example, 14 out of 17 science teachers
interviewed in the preliminary study had no idea about using computers
to aid science teaching.
Although STs' data showed that half the item means in the scale
TRAINING were less favourable than the item mid-point, these items were
generally stated less directly as positive (or negative) than those where
item-means were higher than item mid-point. For example, item 24 (item-mean
was lower than item mid-point), " A teacher of computer studies is not
the best person to train science teachers to use computers", and item 11
(item-mean was lower than item mid-point), " Science teachers must know
a great deal about computers if they want to use them in science teaching"
were not directly worded, whereas item 14 "I would like my computer
11-7

studies colleague to train me to use a computer in my teaching" reflected
more clear opinions. Some respondents therefore for some reason(s)
disagreed that the computer studies teacher was the best person to train
them, although they were willing to be trained by him, as they stated in
item 14. Some who answered to the best of their knowledge, that the
science teacher needs a great deal of knowledge about computers before
he uses them, were not reflecting their unwillingness to use computers,
but their lack of knowledge as to how easy or difficult computers are.
The highest item-mean among the TRAINING items was for item 3, "A
computer training programme should be compulsory for every science
teacher". The high score for this item (mean=3.07) indicates that science
teachers are extremely willing to be trained to use computers in their
teaching.
Although STAs findings showed rather less favourable attitudes than
those of STs, 22 of the 30 item-means were greater than item mid-point
(Tables 8.13 to 8.16). The similarly unfavourable attitudes to some items
of both STs and STAs could confirm the previous assumption that the
strength of attitudes implied by the wording of the statements accounted
for these responses.
11.5.2 Science Teacher Trainers' Attitudes:
Part B of Chapter 8 has discussed how 24 attitude items were used
to estimate science trainers' attitudes toward the introduction of computers
for science teaching. Strong positive attitudes were found among the
sample for all items. Only three item-means were less than the item
11-8

mid-point. The three items were 17, 9 and 14. Items 17 and 9 were identical
to items 20 and 11 respectively in the STQ; therefore additional support
for the explanation effected previously is obtained here. Item 14 stated,
"Even if a science teacher knows to use a computer for personal home
use, he will still require to be taught how to use it in the science
classroom". Not all of the sample were expected to recognize the statement,
because it was intended to measure the STTs' opinions on the science
teachers' training and how difficult or easy they perceive a training
programme.
11.5.3 Computer Studies Teachers' Attitudes:
The computer studies teachers' questionnaire involved 25 attitude
items. More than half of the items were directed to assessing the computer
studies teachers' attitudes toward training science teachers to use
computers in their science classrooms.
Tables (10.6 to 10.8) showed that 21 of the 25 item-means were greater
than item mid-point indicating strongly favourable attitudes among the
sample. 12 out of 13 items directed to investigating computer studies
teachers' attitudes toward training their science teacher colleagues to use
computers in their classrooms achieved greater than item mid-point,
showing the willingness of computer studies teachers to train science
teachers. The only item which had a mean lower than the item mid-point
was item 2, "There are not enough computers in the schools to be used
for science teachers' training". This result perhaps indicates that computer
studies teachers thought that training science teachers will require a
11-9
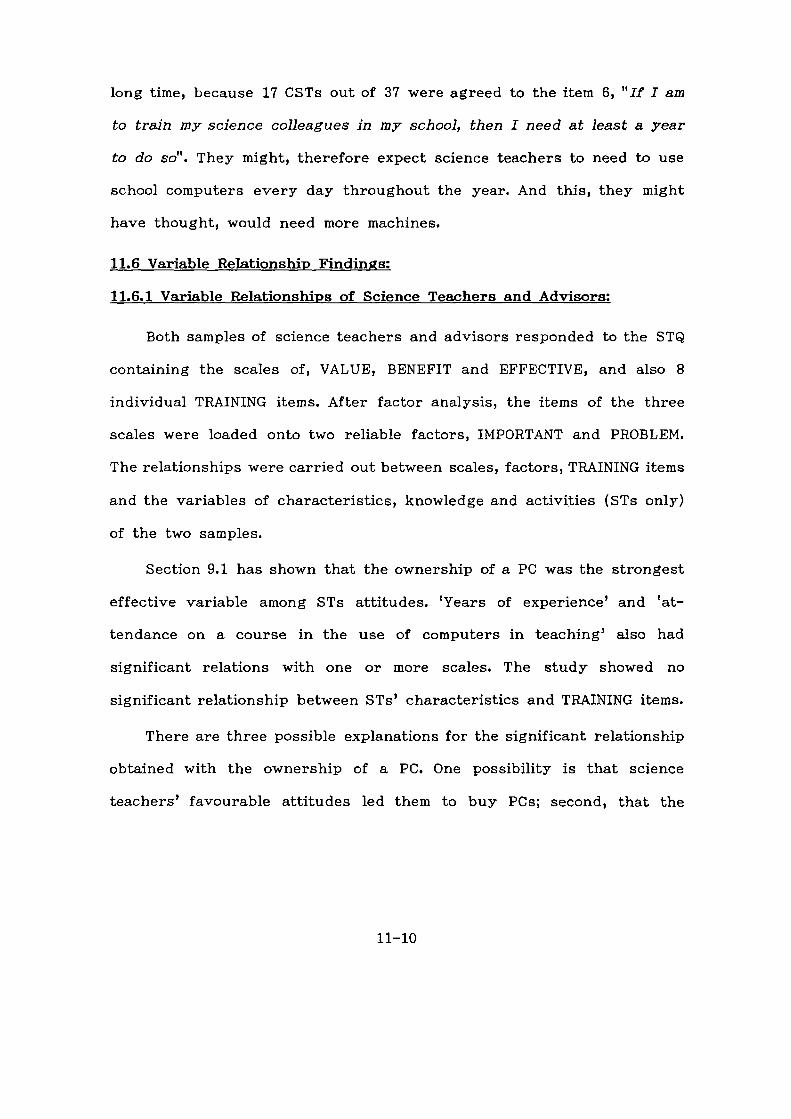
long time, because 17 CSTs out of 37 were agreed to the item 6, "If I am
to train my science colleagues in m7 school, then I need at least a year
to do so". They might, therefore expect science teachers to need to use
school computers every day throughout the year. And this, they might
have thought, would need more machines.
11.6 Variable Relationship Findings:
11.6.1 Variable Relationships of Science Teachers and Advisors:
Both samples of science teachers and advisors responded to the STQ
containing the scales of, VALUE, BENEFIT and EFFECTIVE, and also 8
individual TRAINING items. After factor analysis, the items of the three
scales were loaded onto two reliable factors, IMPORTANT and PROBLEM.
The relationships were carried out between scales, factors, TRAINING items
and the variables of characteristics, knowledge and activities (STs only)
of the two samples.
Section 9.1 has shown that the ownership of a PC was the strongest
effective variable among STs attitudes. `Years of experience' and `at-
tendance on a course in the use of computers in teaching' also had
significant relations with one or more scales. The study showed no
significant relationship between STs' characteristics and TRAINING items.
There are three possible explanations for the significant relationship
obtained with the ownership of a PC. One possibility is that science
teachers' favourable attitudes led them to buy PCs; second, that the
11-10

ownership of PCs made them more favourable toward the introduction of
computers; and third that both variables (attitudes and ownership of PC)
influence each other.
The significant relationships between some science teachers' char-
acteristics and the scales and factors could suggest that their attitudes
were affected by computer experience, because the ownership of a PC,
and attending a course in the use of computers in teaching would all
increase computer experience. Many studies however, have claimed the
influence of personal computer ownership, computer knowledge and
experience upon attitudes toward the use of computers. (See section 4.3.)
The importance of computer background, discussed earlier in this
chapter is confirmed by the findings of the knowledge relationships. Half
of the knowledge items were significantly related to STs' attitudes. The
strongest significant statements were items 2, 3, 4 and 5, concerning
"Computer to introduce information", "Computer applications in science",
"Need to be a programmer" and "Change within computer typing",
respectively. In all 24 knowledge relationships between knowledge items
and scales, the means of the Correct groups (the teachers who responded
to the knowledge items correctly) were greater than those of the Wrong
groups (the teachers who responded to the items incorrectly). This means
that the Correct groups had more favourable attitudes than the Wrong
groups. In other words, teachers with greater knowledge had more
favourable attitudes. Although correlation is not evidence of causation,
the balance of probability seems to favour an increase of teachers'

knowledge improving their attitudes.
The 8 science teachers' activities in the STQ were intended to assess
the influence of science teachers' classroom activities on their attitudes
toward the introduction of computers in their science teaching. The findings
showed that only activities related to computers were significantly related
to science teachers' attitudes. These activities concerning "Computer
articles", "CT meeting", "IT news" and "Visits". Teachers who claimed to
read educational computing articles to look for teaching ideas -Computer
articles- had the strongest favourable attitudes among the science teachers'
sample. That means, among the teachers who were interested in computing
(those who were active in the activities related to computers), there is
one group (those who were reading computer articles only to look for
teaching ideas) who had the most favourable attitudes.
Unlike science teachers, science advisors showed little, if any, sign
of significant relationships between their personal characteristics and
computer knowledge and their attitudes toward the introduction of
computers into science classroom. (Another discussion of the lack of group
discrimination will be presented later in this chapter).
11.6.2 Variable Relationships of Science Trainers:
Part B of Chapter 9 has explained how three reliable attitude scales
and six individual items were used to measure the science teacher trainers'
attitudes toward the introduction of computers for science teaching.
Relationships were investigated regarding the interrelations of the attitude
variables with 9 personal characteristics and 8 knowledge items (identical
11-12

to STQ items). Although weak relationships were found among the char-
acteristic variables, the ownership of a PC appeared as the only strong
relating characteristic variable. Reading articles about wordprocessors
(WP) also showed some significant relationships with some scales and items.
The knowledge item 1, "Computer can be used as private tutor" was the
only item which showed an obvious significant relationship to some attitude
scales and items.
The most obvious discrimination between characteristic and computer
knowledge groups appeared with the scale TRAINING. Half of the 8 personal
characteristics were significantly related to the scale at a significance
level of 0.1 or less. Trainers who answered "Yes" to the variables, "WP",
"PC", and "CExp.", and who had more years of "Experience", had more
positive attitudes toward their own training on use of computers in their
teaching. The scale was intended to assess STTs' willingness to use
computers in their teaching, in other words, their willingness to train
science trainees to use computers in the pre-service training programme.
The studies describes made to identify variables which might affect such
willingness. Three of the variables were those that could increase computer
experience. This findings gives additional support to the influence of
computer experience on the subjects' attitudes.
11.6.3 Relationships of Computer Studies Teachers:
Six personal characteristics and six previous training variables were
analysed in relation to computer studies teachers' attitudes. The findings
of the relationships between the various variables and the three reliable
11-13

attitude scales, VALUE, ST.TRAINING and TRAINING, showed an almost
complete absence of significant relationships between the variables and
the attitudes. The only related variable was between previous training
on Networks, and the scale VALUE. Two possible reasons for the lack of
significant relationships were given at the end of Chapter 10.
11.6.4 Lack of Discrimination Between Groups in the Findings:
It is obvious from the study findings that, although strongly favourable
attitudes toward the introduction of computers in science teaching were
found among the four samples, no discrimination between groups was
found in most of the relationships within individual samples. The lack of
discrimination between groups can be attributed to the following reasons:
First, some samples were very small, especially STAs, STTs. The
number of the CSTs was also not very large. The importance of sample
size in statistical tests was fully explained at the end of Chapter 10.
However, more evidence of the importance of sample size could be obtained
from the increase of discrimination by the test used for the STs sample,
where 266 cases were included.
Second, difference between groups in one or more aspect does not
always influence the results relating to other aspects of the subjects.
Youngman (1979) pointed out that many treatments often have little effect
on the final results and interpretation. This is even more likely when, as
in the present case, the subjects' attitudes are already highly positive.
11-14

Thus, it was impossible for a statistical test such as t-test to detect any
discrimination between the attitudes of science teacher who had attended
computer courses (for example) and others who had not.
Third, and perhaps most important, differences in the groups'
backgrounds are very important for the discrimination of the results. The
classification tests used in social science and education were developed
from the applied sciences where obvious group discrimination exists.
Differences between groups can only be detected if there are enough
grounds of classification, for example: acid and alkali, reptiles and birds,
male and female, young and adults. In a study of attitudes, relevant
distinguishing criteria include males and females, those who have computer
qualification and those who do not, those with a PC and those without,
those often using computers and seldom using computers, etc.
The preliminary study and the demographic data in the main study
indicated only slight background differences among the STs' sample. They
had almost similar computer knowledge background and experience. Science
teachers had had neither computer training programmes, nor real computer
courses (some of them had attended courses lasting a day or so), few of
them had attended a course in the use of computers in teaching, and
some of them were not active (according to the eight activities dis-
crimination) because of the lack of facilities available. Moreover, the main
field work shows strong favourable attitudes among all subjects. The
expectation, then, was of few variables that would detect differences
between the groups of the sample. For example, because ownership of the
11-15

PC is an obvious difference, the attitudes of science teachers who had
PCs and those who had not were distinguishing among the sample, but
the attitudes of experienced and new science teachers were found to be
similar, as neither had any computer training in their qualification pro-
grammes.
11.7 Lack of Computer Background and Experience:
The findings of this study indicated lack of computer knowledge and
experience among STs, STAs and STTs. The importance of computer
knowledge and experience for improving attitudes toward computers and
for using computers was confirmed by many studies. Underwood and
Underwood (1989) found that teachers' negative attitudes to use of
computers in school were related to low computer awareness. They found
it encouraging that those who rejected the computer based their opinions •
on limited computer knowledge. Turkel and Chapline (1984) found that
increasing teachers' knowledge about computers could foster positive
attitudes toward computers and their use in schools.
The lack of computer knowledge and experience among Saudi Arabian
science teachers could create a serious difficulty for the introduction of
computers into science teaching. Many subjects claimed to suffer from
this problem: "I could noc give any comments, because I do not have any
computer knowledge and I was not provided with any computer courses",
one subject stated. Many subjects said that they will not use computers
in their teaching unless they first have opportunities to obtain computer
experience.
11-16

Providing computer knowledge and awareness among the school staff
in Saudi Arabia could encourage science teachers to adopt more favourable
attitudes toward the use of computers in their own classrooms. It could
also encourage them to attend computer courses inside and outside their
schools. The solution to this problem could be linked with the solution of
more general problems of teacher training.
11.8 Teacher Training Issue:
Chapter Four has indicated that one of the most serious difficulties
facing the introduction of computers to schools in industrial societies is
teacher training.
The findings of this study indicated a real need for computer training
programmes in Saudi Arabian secondary schools. 21 of 73 respondents,
i.e. 33.3 % who gave comments on the science teachers' questionnaire,
called for "Training first". For example, subject 96 stated, "Before we
introduce computers into the science classroom, we should think carefully
about the teachers' training programme". Subject 193 also claimed that
"The most important key to the introduction of computers in science
teaching is teachers' training". A science trainer stressed that science
teachers will not use computers unless they are provided with adequate
training. One possible solution to this important problem will be suggested
in the following chapter.
11-17

CHAPTER 12::
AN P FL CD C al CD COMP 113 `1"
TRATNING FOR SCMENCE TEACHERS
InT S.A.Tjr) I ARAB TA
The aim of this chapter is to propose a model for an INSET programme
to be used with science teachers in the field, as well as a pre-service
programme for science teacher trainees. The locations of the responsibilities
for the programmes are also indicated.
12.1 Introduction:
Teacher training is the crucial issue to be addressed for the successful
introduction of computers in schools. It currently receives considerable
attention in the developed countries. Terry (1984) pointed out that:
"The training of teachers across all subject areas in thecurriculum to use the microcomputer effectively in theteaching of their subjects represents one of the largestproblem areas and is essential if microcomputers are toachieve their considerable potential in schools." (p. 7,8)
In October 1988, the UK secretary of State set up an IT in ITT Expert
Working Group whose terms of reference were:
"To identify current best practice in preparation of traineeteachers for the use of information technology in schoolsin all areas of the curriculum and to make recommendationsfor the development, within the time and other resourcesavailable, of initial teacher training to ensure that all traineeteachers acquire the appropriate knowledge and skills ininformation technology and competence in their professionalapplication in the classroom." (DES, 1991, p. 1)
12-1

The report of the Expert Working Group, the Trotter report, was
published in March 1989 and one of the recommendations was that "It
should be a condition for the approval by the Secretary of State of any
course of ITT that it includes training to provide students with at least
a specified minimum IT capability." (DES, 1989c, p. 19)
The first strategy for teacher training is to develop adequate
in-service and pre-service training programmes for teachers and teacher
trainees (Duguet, 1990).
Development of pre- and in-service courses that enable and encourage
teachers to use computers is no small task (Langhorne, et al. 1989). The
courses should be designed to give teachers the specific skills they need
to use computers in their classrooms successfully, in order to meet
appropriately the needs of their pupils. Any approach should take into
account the background of teachers and advisors as well as trainers.
The absence of computer-based subject awareness among Saudi Arabian
science teachers and educators requires an extensive approach for
in-service training. The need for pre-service training in the use of
computers is also important to avoid computer illiteracy among new science
teachers.
The Saudi Arabian Vice Assistant Minister for Educational Development
has stated that the computer curriculum will be replaced by a new one
similar to those found in the developed countries. "It will start where
the others left off," he added. He went on to say that the Ministry of
12-2

Education has not yet set up a training plan which would enable subject
teachers to use the computer facilities available in the schools, as subject
teachers in developed counties are doing'. (See the interview in Appendix
G). He emphasized however, that "We are still considering how and in
which subject we can start".
Therefore, it seems that the current period is the right time to
consider a training programme, whereby subject teachers will be able to
undertake in-service computer-based subject training in order to enable
all teachers to use information technology as part of their daily lessons.
Chapter 1 has shown that science subjects have been accorded one
of the highest priorities in Saudi Arabian secondary education. Science
teaching involves the largest number of secondary school teachers. If
science teachers are encouraged to undertake computer-oriented INSET
and the programme is successful, then the training framework used for
science teachers can be used afterward as a pattern for a comprehensive
approach to release all secondary school subject teachers throughout the
country to participate in an INSET programme. This would facilitate the
use of information technology across the whole secondary school curriculum.
12.2 Selecting Training Objectives, Content and Components:
Stetcher (1984) found a number of aspects of course design which
are important for in-service information technology courses. These are:
1. See some of the industrial strategies in Duguet, 1990.
12-3

• placing emphasis on "hands-on" computer time with a focus on
integrating the computer into the teaching process;
• developing clear goals and objectives and incorporating assignments
which prompt teachers to use the software in their classroom;
• including activities which encourage interaction and sharing of
information;
• making participation on the course voluntary;
• selecting course tutors who have experience of the software.
12.2.1 Objectives:
For any educational programme, clear objectives should be set before
implementation. As with other teaching programmes, the least effective
forms of INSET are likely to be those courses and activities where the
aims and objectives have not been clearly identified and matched to the
needs of individuals and their instructors. After their six-month study
of the strategies being used by LEAs and schools to enable teachers to
undertake INSET, the report of the National Foundation for Educational
Research (NFER) stressed that INSET was seen as most successful when
it resulted from a clear analysis of needs and was likely to be cus-
tom-designed rather than off-the-shelf. It was stated that teachers
themselves regarded INSET as being effective when there was a degree
of match between their level of experience and the content of the course
(DES, 1990). The objectives of the INSET for Saudi Arabian science teachers,
therefore, will use all findings and information obtained from science
teachers, advisors, trainers and computer studies teachers in order to
12-4

set up appropriate objectives suited to their knowledge, experience and
attitudes. The computer facilities existing in the secondary schools will
also be considered.
However, there are many issues which will influence and guide the
formulation of objectives for the current INSET programme, such as: the
findings of the preliminary and main field studies; the experience of some
industrial countries; and the current and future policies regarding use
of computers in Saudi Arabian secondary education.
The following objectives are considered appropriate for the INSET
approach for Saudi Arabian secondary school science teachers:
a) To improve science teachers' computer awareness: At this stage teachers
should have general information about computers; they should become
"computer literates".
b) To improve science teachers' personal confidence in using computers:
Teachers should feel confident to use computers for their own
purposes, e.g, record-keeping, preparing lesson plans, course pro-
cedures.
c) To make appropriate use of computers in science classrooms: Teachers
should be able to choose and make practical use of computer generic
software in science lessons.
d) To collect ideas from science teachers which could improve use of
computers in the science classroom: Teachers should be encouraged
to reflect on their own experiences in their lessons. These reflections
12-5

should be used to improve both the choice of software and methods
of using them. Teachers' ideas and experiences should be shared with
others for the benefit of the whole system.
e) To make effective evaluation of computer software related to science
subjects: At this stage teachers should be requested to deliver their
own evaluation of using some software in the classroom.
The following section gives further explanation and examples of these
objectives.
12.2.2 Content:
On the basis of the training programmes and strategies discussed in
Chapter 4, and in accordance with the level of computer knowledge and
experience found by this study among Saudi Arabian science teachers,
the training approach should cover the following aspects:
12.2.2.1 Basic Training:
Many studies have shown that improvement in teachers' computer
awareness is strongly related to their attitudes and participation in
computer training programmes (see section 4.3 in Chapter 4). Therefore,
the first step should be basic training linking to computer awareness.
This will include basic principle of using a computer, such as: how to
switch the machine on and off, distinguishing between the software options,
understanding computer facilities, using Windows/mouse, typing and
printing with one wordprocessor, creating and saving a file, using a
printer, etc.
12-6

At this stage teachers should be advised to use only one type of
wordprocessor in order to reduce the time and effort required to become
confident.
12.2.2.2 Familiarisation and Personal Confidence Training;
The next stage includes training teachers to use computers for their
own purposes. For example, they could use them for pupils' records,
lesson plans, writing and recording examinations, etc. Wordprocessors are
the most appropriate software for this type of training, being relatively
simple to master, yet at the same time doing these jobs effectively.
Teachers should be encouraged to use computers regularly. For
example, writing a plan for each daily lesson is compulsory for every
science teacher in Saudi Arabia. It would be useful if the teachers were
required to write their plans by using a wordprocessor. This would require
them to use computers almost every day. If this practice were adopted,
teachers' confidence would quickly be greatly increased, because the fact
that many users are performing the same activities would give a feeling
of mutual support.
One idea which is thought worthy of consideration is to provide one
or two computers and a printer in the staff room(s); this would encourage
teachers to use computers in their spare time. It would also be useful if
the teachers were required to keep their pupils' records in the staff
computer. The Ministry of Education could play an important role here
by deciding these requirements for all teachers throughout the country.
12-7

12.2.2.3 Training in the Use of Computer Applications in the Science
Classroom:
Various generic types of computer software are available in the Saudi
market today, such as database and spreadsheet. Science teachers should
be given confidence to apply these in their classrooms.
Chapter 6 has shown that databases and spreadsheets are powerful
tools for science subjects. Therefore, science teachers should be trained
how can they use them in their classrooms successfully as part of the
INSET programme. Teachers would be shown some examples of applications
of these tools to topics from the science curriculum.
12.2.2.4 Trainin g in the Evaluation of Teaching with Computer Software:
The training programme should include guide-lines, methods and
criteria for evaluating the application of software in science teaching. An
objective evaluation given according to an agreed common format could
be accompanied by comments and personal questions to the teachers about
the quality of the software and its validity for improving science teaching
and pupils' experience.
Teachers should be asked to offer their opinions and ideas and to
keep notes, etc., on how they have used the software in order to discuss
them in regular meetings throughout the programme.
12.2.3 Hardware:
Only half of the US secondary schools have fifteen or more computers
(Woerner, et al. 1991). A similar number is based in every UK secondary
12-8

school (Lewis, 1992). By 1992-1993, each Saudi Arabian secondary school
will have at least sixteen computers (see Appendix G). The recent installation
of computers has given the Ministry of Education the opportunity to
install better and more powerful machines, because of the rapid fall in
market price and rapid increase in computer power.
The installation of more machines in the schools will make the provision
of computer facilities in Saudi Arabia on a par with, or even better than
that in USA and UK. Therefore, similar uses of computers in Saudi Arabian
schools will not be held back or restricted by any hardware problem. The
availability of large numbers of newer, more powerful computers in Saudi
schools will not guarantee better use of computers, but provide the
potential for it. It is the time now for the Ministry of Education to think
carefully about how schools, teachers and students can get better use
from these valuable facilities.
12.3 Initial Preparation of Science Teachers:
The nature of Saudi Arabian science teachers requires careful planning
of course content and timing before the training programme is implemented.
Teachers need initial computer literacy to not disappoint the high positive
attitudes held toward training in the use of computers. The training
course should take into account the lack of computer literacy among
science teachers and in the whole Saudi Arabian society. Although Saudi
Arabia is moving now toward computer literacy for all, there is no plan
12-9

or deadline. The Ministry of Education, therefore, should consider its own
plan for computer conferences, gatherings, etc. inside schools to keep all
teachers in touch with computers and their development.
Perhaps one important issue in initial preparation is that it should
be "voluntary". Voluntary attendance has been found to be more successful
(Stetcher, 1984). The INSET course therefore should consider ways which
could increase the number of volunteers among the participants. Of course,
place, time and type of course are important in this issue.
12.4 INSET Course Design for Science Teachers:
Previous work on in-service teacher education courses has dealt
either with non-computer-based INSET (for example Pine, 1989; Ingvarson
& MacKenize, 1988; Sparks, 1983) or more specifically with INSET in the
area of Information Technology (for example, Stetcher, 1984; Lewis, 1983,
Gardner & Megarity, 1987). Neither of these perspectives is directly related
to the work of teacher education in subject-based computer applications
(Sutherland, et al. 1991a).
The work of Rosamund Sutherland and her colleagues, the Microworlds
Course (MWC 1986-1987) in the UK, and the Johns Hopkins University and
the Baltimore City Public School System, Computers to Enhance Science
Education (CESE 1986-1988) in the USA, provide appropriate models to be
used for Saudi Arabian science teacher training for the following reasons:
12-10

• Both courses were implemented and succeeded: 80% and 90% of trained
teachers in the MWC and CESE respectively reported using com-
puters after their training.
. The two courses are concerned with the use of generic computer
applications, which is what the current approach is looking for.
• At 30 and 12 days for MWC and CESE respectively, the training courses
are not too long. It is likely that the Saudi Arabian Ministry of
Education would accept a similar period.
• The courses developed confidence in the use of the computer as a
problem solving tool.
• The courses were developed to be used with secondary level teachers
(CESE was developed for high, middle and elementary school
teachers).
. Finally, and perhaps most importantly, the courses were directed to
teachers with little or no computer experience, which is very similar
to the situation of the majority of Saudi Arabia's science teachers.
However, the MWC was directed to mathematics teachers, while the
CESE included some programming. The projects therefore would not be
applied in their original forms, but used as guides for planning appropriate
training courses for Saudi Arabian science teachers. The nature of the
subjects suggest little would be lost in changing from mathematics in the
MWC to science in the current model.
12-11

12.4.1 MWC Model:
The main aim of the MWC 1 project was to develop, implement and
evaluate a programme of in-service teacher education concerned with the
use of generic computer applications within the secondary school
mathematics curriculum.
The organizers (the three authors) ran two courses. The number of
teachers attending the course was 13 in Year 1 (1986-1987), and 7 in Year
2 (1987-1988). Two of these (one in each year) were part of their local
education authority's advisory team and the majority (13) of the remaining
teachers were in positions of some responsibility within their mathematics
departments (7 were heads of department, 6 were deputy heads or
equivalent). In addition, 5 held the position of head of computing within
their school. 16 of the 20 course participants had at least five years'
teaching experience and the ages of the participants ranged from late
twenties to early fifties. Acceptance on the course was conditional on
access to at least one computer within the teacher's mathematics classroom.
The course did not provide institutionalised qualifications for the teachers
and in this respect they were all voluntarily motivated to attend the
course.
The course was structured to be 30 days' attendance at the university
over the period of one school year, with a mixture of blocks of time (up
to one week) and one-day sessions at fortnightly intervals (see figure
1. More information about the project can be found in the following sources: Sutherland,
et al. 1990 and 1991 Volumes 1,2 and 3.
12-12

am, "Nan* Ne Function kolaoppooto 15)
pm lima of foredo) TasksOfsoossJon on °WmWord In Oro Woman
Asalgonivo: Choesbosal TookWpm* as
TM Of Toot (Ammo* 2)
Day 4
am Fataback I4*M CireeroodiObormotion Tata
Foalback awn Chmobosni TaxaTarok) Our Mamba
(P P*, eels A)PAL llama on' Imo Rowan TW
Wpm.* 2.71
Aasigromoisflocumlon TOMLope Classroom 01:mowloo rase
Day
Foodback gons SproalskaotExiondad Logo Woad
'Han* NY LogoDarting (wended limana
Not fiesentePon i4 Cdossmen we alSpreadsheet*'Hama airSpnualthsea
Asearescsar: C 90 CartifOOTObsonwOon Toot
ftsperance Adierownekl (Appeede 7)
OW 5
am Toachom war IMO fhookUnnoosity : Lew Cbsenfa(iAnTeat
pm foodbo9 from Wont MNPealsMkroworld Pmpamank(Appendixn
Lai 'Non& on- Logo Wads 8. USIA
Pfesentalbn el LW ofSpexedsneets Orapt: POW,PackagesI a be CPUs, WO
pm 'Mode for eW•addie•M aGRPh Keens Pacinge
&falba& an Lego ammoObeervelsen Ted
Dew 8
• Fasdbeek from GleNtOONI Mack*fangnack 1mm Rogssion TataPorobilograns licamodO
pm TON& cre apronceMoolfoommar S)
Assrommanor Sposedshoot Took(apponan 59)
Enlandod Logo Pow) (Appal& kJ)
12.1). The blocks were to focus upon specific issues. In the sessions at
schools, teachers were asked to try activities in schools, which allowed
opportunities for the course organisers to work with the teachers in the
classroom with pupils.
Two Day Block
-41.17Wilt;t4W,t,*,r4f4Firfig!
-AsaNnnunk Riparian Or 34Doy Nock
CosoMraly iW ai ant DE01111i0.1 OR DaSIIIITSIbORk
Stmloges z
. ,.:-.ilianas or Logo .1
,1 Non TIE Ammansk.
-ri r(Zret pm Eno ol Tenn Pasty
"fnit,""i.,.`iN-.;,-,...»...qrw.44;,,,,-.4.,1,'" .
Al tasks minim in italics are concerned wig) elassicom issues.
Figure continue....
12-13

Dsy 17
am. 'Fiends ea' thireommostaIllpreamhoal ExionOwl Propc1(Appaeric 5.3)
p.m Asilalav et 111:VOILSIL/
Aulgnmitai: SpieselaheeiEekaded Pretty (4emo* 5.3)Diemen aisshemsres
am Meecataki Redraleap
pm lianas an' Logs Recursion
Day 15
Us. Lego Maas Preem Cam SUM,Prams/Melismils en- Teectssie'reveutteSettram
p.m 'Hen& on' no:krona Toshe
Day II
Sehaciassed case Su*(Zeeman Seasion.
p.m Logo Mogan EvaluationancLs ore SpreacistasisttitYrI.7.. .15.1f,N*-44t4f4,1.1
f;14
•
xf
ant illeamodes DevelapmeneEvansaisx1
S."neito:
Qv,
147.
fr.
g't .
am Presanlason by coursepans:spans on Eniansior/ LogoNolects/see as mange Appendix 6-2)
pm. PrehentalienErliaalorl Logo Proisois
'Rands on' Logo Maier'Pleven out • of NaumanProcedures
Assignment Cass Samba
::,* .'11.4 • relgeik.4 e /ow , - .,:4 + • ., ,,s „,fil.11?':)./. n 'f,'..: q... .17" F. 1,::"4,,,i1,,,,,I,;;JA: • J
,!Stit!, a". Mensweek t Developers',,:`• ^r5
Lunch will LEA MOM Aavisan —,..
p.ht DIsetesien en Daseenesssim ..;(Appendk el
ant. Teachers Present Case iged $
er,
LITL latemeork Ofteloement
pm PiossoratIon: Trevor Rothe(''Had* ter togaRecursion init.
Day 27
am. DiscussIcn at DiassfrAhMion
p ns. 'Rams on• Mull* TullioMloriscorsi
Day 25
am Estrioded Spreadsheel Pitied*:Prusraito by Came permiparts
pm 'Ham* an DeSstoomOrion Vara
Asalgrvronta dmerseastssa PIMCase &mem
Osy 29
am Case SaaarMelatelealtby cams paMepaers
11 Ist. 'MINX VC Logo
Day 25
am. &Iwo tamed Case $ad/00 OINV.M00 St1O0t1
p.m Ilhhdat • Databseeorspii Pbana Pa:xtee
am Dissemnahon of Iiramosedii
P.0% 'lianas cai LE1300Agsa
Final Evalusiloo el Came
Day 30
5t Walk Block
Figure 12.1 MWC model (source, Sutherland, et al. 1991a)
12-14

The course was divided into three parts. At the beginning of the
course, a three-day block provided the participants with the opportunity
to get to know each other and to become confident in using Logo': in the
middle term, the block was devoted to microworld 2 design and production
of curricular materials; in the final term, the block focused on questions
of dissemination and evaluation. The course was structured around the
following activities:
. hands-on activity: during the course sessions participants worked
on both open-ended exploratory projects and structured
well-defined projects chosen with specific learning aims in mind.
. extended projects: course participants were asked to produce an
extended computer-based project, reflecting their own learning
and drawing on mathematical ideas;
• classroom-based work: after the first three days, the participants
were asked to use computers within one of their classrooms;
• case studies: participants were required to complete case studies of
two pupils using Logo in their mathematics lessons throughout the
year;
. microworlds: to reflect teachers' experience of the ways in which
pupils commonly hold alternative conceptions of mathematical ideas,
the microworlds were evaluated by the teachers in their schools;
An educational programming language
2 ' Microworlds involved work with the participants in designing computer-based micro-
worlds for a specific area of the mathematics curriculum.
12-15

• dissemination: the course participants were expected to develop
dissemination procedures within their schools' mathematics
department and also within their own LEAs. Each teacher devised
a plan related to the needs and situation within his or her school.
Although the course was successful, there were some deficiencies in
the course in general, and the first run specifically, as follows:
a) Personal confidence and competence were the most frequently given
reasons for continuing to use the computer in the teachers' classrooms.
Therefore, in-depth training on a small range of software is more successful
than building up a wide range of various types of software. The findings
of the course showed that four teachers who were relatively unconfident
about their own personal use of Logo at the end of the course had all
been less motivated to engage in computer-based activities which aimed
at personal use and confidence-building in the early stages of the course.
b) The need for the course organizer to be familiar with applications
both from a personal and professional point of view is a critical factor
in influencing which computer activities continue to be used in the
classroom. During the first course, the course organizers had minimal
expertise in the use of spreadsheets for themselves and within the
mathematics classroom. This was no longer the case during the second
year and the course tutors' ability to build in more pupil-focused activities
in the spreadsheet work was reflected in an increase in the proportion
of teachers from the second course who continued to use spreadsheets
in the classroom.
12-16

In addition, most of the course was held at the university, while
recent studies have claimed more success with school-based training,
including classroom-based training (see for example, Goler, 1990; DES,
1989a and 1990).
12.4.2 CESE Model:
This course aimed 1 to help science teachers acquire the skills necessary
to integrate effectively computer technology into science teaching. This
purpose focused on instructional uses as much as on the personal and
managerial benefits of computer use.
From 1986 to 1988, five training workshops were implemented with
100 teachers (40 high school, 40 middle school, and 20 elementary) who
ranged in computer literacy from novice to experienced user. Each training
workshop consistd of 12 days held bimonthly during one semester of the
school year (Table 12.1). Each full-day session coupled instruction with
supervised practice and was followed up with homework assignments and
a brief review at the start of the next meeting day. Teachers were released'
from their regular classroom responsibilities, and money to hire substitutes
was provided. Two teachers were selected from the same school to provide
peer support during training and to act as first level of support in
subsequent integration of acquired skills into classroom teaching. Between
sessions, teachers wers asked to complete assignments, practice skills,
and begin to incorporate those skills into classroom learning. An Appleworks
More information about the course can be found in Roseman & Brearton (1989)1.
12-17

application package was distributed to the participants. The package
includes software for wordprocessor, database and spreadsheet. They also
were given two sets of laboratory probeware. Each teacher was required
to develop two detailed lesson plans that demonstrated effective computer
use in science teaching, one employing database or spreadsheet and the
other using an interface device. They presented these lessons first to
their peers and then to a statewide audience at a final conference.
Day Content
1 Computer awareness/delivery, assembly, setup2 Wordprocessor3 Database4 Spreadsheet5 Integration of applications6 Interface presentation/construction7 Interface use8 Programming9 Trouble shooting/software evaluation10 Design/presentation of projects11 Project presentation and discussion12 Conference
Table 12.1 CESE model (source, Roseman 8c. Brearton, 1989)
Over 200 lesson plans demonstrating computer use in science learning
were developed. Each lesson plan consisted of lesson objectives, moti-
vational activity, procedures, assessment and assignments. The project
staff used a specifically developed questionnaire and direct observation
to assess classroom use.
Although the project covered training issues related to personal
benefit, it did not cover all teachers' professional needs, i.e pedagogical
12-18

issues (see Table 12.1 above). This could explain why although 90% of
trained teachers continued to use computers for their personal benefit,
only 75% continued to use computers in their science classrooms.
12.4.3 Course Structure for Science Teachers:
The course designs described (i.e MWC and CESE) will be modified
to be suitable for use with Saudi Arabian science teachers.
The proposed course is based on the positive findings of the MWC
and CESE studies. Similar activities to those of MWC and CESE will be
used, but the whole course will be relocated in local schools. This will
decrease the cost of the course and would very likely increase the number
of voluntary participants. As with MWC and CESE a number of class-based
activities will be included in the course.
The teachers will be trained in the use of generic software. Pro-
gramming will not be presented because, as Chapters 2,3 and 6 have
shown, there is little relationship between programming and the use of
computers to aid science teaching. Instead, wordprocessor use seems most
appropriate in the earliest training stages, because it is easy to use and
useful for personal benefit. Perhaps easier than Logo which was used in
the MWC.
Sutherland, et al. spent 30 days running their course (i.e MWC). Half
of their time was spent on Logo, and the remainder on computer applications.
CESE took 12 days for each course, but it gave little training for professional
purposes. Therefore, it is likely that 18 days would be an appropriate
12-19

period for training in computer generic applications only, as planned for
the current course. This will replace the period spent on Logo (15 days)
in the case of MWC with 3 days of wordprocessor, and will add 6 extra
days to the case of CESE for pedagogical issues.
The course is designed to be held bimonthly, similar to the practises
of the MWC and CESE; therefore, 34-36 weeks are needed to complete the
course. This period is deliberately equal to a whole study year according
to the normal Saudi Arabian school system.
In addition to these 18 days, teachers will be asked to prepare
classroom assignments between the block-sessions throughout the course
(Figure 12.2). Both of MWC and CESE found improvement in personal and
professional confidence after the teachers had classroom-based work.
12-20

CST
Day 2
WP assignment,
LEA
Day 5..
SS & DB assignment
771 Day 8Three-DayDemonstration
Three-Day ConfidenceSS & DB
ClassroomBased
Activities
SIT
Day 11
reparation
LEA Day 16 Day 17., , ....
Project implementation, -
•
-\ eThree-Day Evaluation
Three-Day ConfidenceWP
Six-Day project
* CST= computer studies teachers, LEA= Local Education Authority, STT= science teacher
trainers, WP= wordprocessor, SS= spreadsheet, DB= database
Figure 12.2 Proposed INSET course design for science teachers
Day 18
The first three days will provide the participants with the opportunity
to get to know each other and become confident in using Windows and
one type of Arabic wordprocessor: for example WordPerfect (an Arabic
version) or Word for Windows (with Arabic support). The procedure could
be along the lines of:
• the teachers will be given a brief overview of the course;
12-21

• hands-on Windows: using mouse, loading Windows, moving around,
selecting applications, open and close Windows, moving from Latin
to Arabic options etc.;
• hands-on wordprocessor: loading the program, creating a file, saving
a file, loading a file, etc.;
• produce and print out a given document;
. produce and print out a personal document.
Teachers will be asked to produce an assignment using the word-
processor concerning their own classroom business. Lesson plans are
appropriate for this task. Participants should be encouraged to use
wordprocessor facilities such as bold, underline, justification, etc.
The next three days will develop the skills introduced in the WP part
of the course, but using a type of spreadsheet, an Arabic version of
Excel, or Lotus 1,2,3 for example, and a type of database, for example
Data Base System (an Arabic database). During these three days, the
participants will engage in the following activities:
. hands-on spreadsheet & database: loading the program, creating a
file, saving a file, loading a file, etc.;
• entering data, processing tables, adding data, making formulae, etc.;
. processing graphs, chosen graph types such as chart, pie, line, etc.;
. produce and print out given data;
• produce and print out personal data.
12-22

Homework assignment will include introducing personal data into the
spreadsheet and database. For example, teachers could be asked to record
their pupils' marks and chart them in order to produce the best and most
useful assessment.
Both of the two "confidence" parts of the course should be given
by computer studies teacher colleagues and their role should end at this
stage.
The next three days will be run by the Local Education Authority
and will be spent in demonstrating computer business applications. The
teachers will have access to various types of generic software and some
examples of their classroom use in science teaching.
In the following six day-block of the course, specialist science tutors
will go to the schools and continue the programme by addressing issues
relating to the use of computers in the science curriculum. During this
period, the participants will be involved in developing and implementing
a project in the area of the science curriculum. The teachers could continue
to seek advice from their CST colleagues. The idea is to develop competence
in the use of the computational environment, and enable participants to
feel for themselves the power that the computer can give them to express
scientific ideas independently. They will be encouraged to reflect on
pupils' conceptions, build pedagogic sequences and evaluate the potential
contribution of the computer in science subjects. They will also be
12-23

encouraged to give more control in terms of scientific problem solving to
the learner. Teachers should be encouraged to continue to extend the
ideas seen on the course and include personal interests and needs.
The first three days of this block will be spent in describing
pedagogical issues and illustrating some examples of developing and
implementing generic software in science classrooms. Tutors could film
themselves in one lesson and show it to the teachers. Some software
examples from previous or other courses could also be presented. After
this session, teachers will be asked to go to their schools and think about
and choose a project for themselves from one science subject; writing its
objectives, plan, content, science concept skills, problem skills, etc.
In the second three days, teachers will be expected to bring along
different forms of project proposals. Most of this period will be spent in
discussing these proposals and improving ways of implementing them in
order to allow every teacher to try his project in his own science classroom.
Tutors should visit every teacher and help him to implement the project
successfully. Tutors will give the teachers follow-up work in the classrooms
because the feedback from the course could give important evidence for
its effectiveness. Brophy and Good (1974) found that providing teachers
with feedback on their classroom practice is an important element
engendering change in teacher-pupil interaction. MWC stressed the value
of tutors visiting course-participants in their schools.
12-24

During the implementation of the project, teachers will be asked to
develop case studies of two of their pupils working with the computer
throughout the implementation of the project. This is to provide a focus
for a discussion of teaching and learning.
The final three days of the course will mainly be held by LEAs and
will be directed toward dissemination and evaluation of the course. The
participants will be encouraged to consider ways of disseminating the
course among their science teacher colleagues and other teachers in their
schools.
The main target of the evaluation is to find out whether the participants
are using computers in their daily lessons, and whether they use them
successfully.
After a period of a year or so, more investigation of the participants
should be made to assess the course. Three ways could be used for this
evaluation:
a) Visits to the participants in their classrooms: every participant
should be visit individually.
b) Questionnaire: a questionnaire survey will be distributed to the
participants. Modified forms of the MWC and CESE questionnaires
could be used. Because, the first questionnaire was made for English
mathematic teachers while the second one was made for American
science teachers, appropriate modification of the questionnaires will
be needed in order to make them useful for Saudi Arabian science
teachers.
12-25

c) Interviews with the participants: all of the participants should be
interviewed to address their difficulties, problems, views, etc.
12.4.4 Strategies to Locate the INSET:
The proposed INSET programme will be organized to be used inside
schools. This requires strategies to enable science teachers to achieve
the aims of the programme properly. Five main sources will need to
cooperate to run the proposed INSET programme. These are: the Ministry
of Education; the Educational Development Directorate at the Ministry of
Education; the LEAs; the schools; and the Universities.
The centralization of the Saudi Arabian educational system (see Chapter
1) necessitates that the Ministry of Education play an important role,
especially in funding, course-content and official matters. To enable schools
to engage in the training programme, permission from the Ministry would
be needed. Alessi and Shih (1989) have argued about the advantages of
the centralized state-funded educational system which enables the gov-
ernment to make nation-wide decisions and implement programmes for the
schools, resulting in similar facilities and greater equity across schools.
The Ministry of Education could have additional control over the course
materials, content, and way of implementation if, for example, it funds the
production of course materials.
The normal budget of the schools would also be insufficient. Because
the Ministry is often in charge of the schools' equipment and provisions,
it seems, therefore, that the main role of the Ministry of Education would
be to permit and fund the programme.
12-26

The Educational Development Directorate will mainly be responsible
for curriculum development. It should provide various computer tasks
within the science curriculum through the science experiment book which
is normally given to Saudi students, alongside a text book. The teacher's
book should include the appropriate procedure and evaluation for every
task.
The role of the Local Educational Authorities would as be intermediaries
between the Ministry of Education and the schools. In this respect, LEAs
could organize the allocation of resources (financial and other) to each
school as required. The advisory unit at LEAs could be responsible for
carrying out the second and final three day blocks of the programme and
for those issues related to demonstrating the software and evaluating the
course in post-course visits to the schools. Science advisors could par-
ticipate with science trainers in presenting pedagogical issues.
Because the course is school-based, a great part of the responsibility
for it will be located in schools, particularly among computer studies
teachers. The first six days of the programme will be run by computer
studies teachers. The programme requires computer studies teachers to
act as co-ordinators for the training programme as a whole in the schools.
It is important also to consider the need for the support of both
school heads and the rest of the staff throughout the training period
and in the dissemination afterwards.
12-27

The important source of organizing the proposed programme is the
universities. Planning, allocating and running the pedagogical training
days will be carried out by science trainers at the universities throughout
the country. The role of science trainers should be as advisors and
organizers to the proposed programme as a whole. They should build up
a model for learning upon which the INSET is based. The model would
aim to create an environment in which the individual teachers would take
responsibility for their own learning and would emphasise small-group
work with the group being carefully formed to foster an atmosphere of
collaboration, maximising the constructive spreading of ideas and minimising
potentially destructive relative dominance within the groups. Science
trainers would supply ideas from the course to the Educational Development
Directorate in order to include them in the science curriculum. They would
also develop course-materials related to science topics.
The trainers should show their role as facilitators who set up science
activities, encourage reflection and extension, build-in ideas related to
pedagogical practice, develop specific activities to highlight science ideas.
They need to develop their own prior specialism and work alongside
teachers to synthesise experiences.
12.5 Strategies for Pre-Service Training for Science Trainee:
The importance of integrating computers in the science curriculum
requires careful consideration of computer-based subject training within
12-28

the initial science training. The training institutions throughout the
country, then, have to determine the most appropriate ways to respond
to these pressures.
The proposed strategies for initial teacher training are aimed at
ensuring that all trainee science teachers acquire the appropriate
knowledge and skills in information technology and competence in their
professional application in the school. The same principle of the proposed
INSET can be used to guide the development of courses within ITT to
improve the preparation of trainee teachers with regard to the use of
information technology in schools throughout the science curriculum.
Similar content to that of the proposed INSET could be considered
for integration within initial teacher training. Appropriate integration of
training activities could be considered during the teaching method work
of the ITT programme for science trainees. The pre-service course will
use some ideas, materials, etc. from the INSET programme.
The Saudi Arabian Universities usually include two training courses
in the final year of science trainees' ITT, concerning science teaching
methods. They normally use the first course for theoretical background
of science teaching, while the second course is used for practical training
in the schools. The IT training course, therefore, could be integrated
within these two courses.
A modified version on the INSET model described earlier is proposed
for use in pre-service training (Figure 12.3). The course is split into two
parts. The first part, confidence-building part consisting of two three-day
12-29

Day 2 „
WP assignment -.11
Three—Day ConfidenceWP
CS
Day 3
Day 5 Day 6
SS 8c DB assignment
Three—Day ConfidenceSS & DB
University—BasedActivities
Project implementation
-„LittiDay 16 Day 17 ) ,
Classroom—Based
ctivities
Three—DayDemonstration
Six—Day project
Day 18
Three—Day Evaluation
Day 9y7
ay 10
roject preparation
ay 13
SIT
blocks, will be given by computer specialists at computer institutes of
the Universities during the first ITT science teaching method course. The
remaining parts of the course will be given by the science trainers during
the training practice periods in the schools.
*CS= computer specialists, STT= science teacher trainers, HP= wordprocessor, SS= spreadsheet,
DB= database.
Figure 12.3 Proposed pre—service course design for science teachertrainees
12-30

The role played by science trainers in the proposed in-service and
pre-service programmes requires urgent training of science trainers to
use computers both personally and professionally; otherwise, neither
programme will be valid.
The computer specialists at the Universities could train their science
trainer colleagues to have sufficient levels of confidence to use a computer
for personal purposes; similar to the first two three-day blocks in the
teachers' courses. Science trainers must realize the importance of computers
for themselves and for their students as well. They should use computers
in their daily business and seek for help from their computer science
colleagues as necessary.
As the trainers become familiar with the computer and its generic
applications, they could subsequently train themselves on pedagogical
issues. They need to select some tasks for themselves to experiment with.
Some research and articles in the field of computers in science classrooms
would be very helpful. Of course, there may be no Arabic examples, but
the majority of Saudi Arabian trainers can read and understand English,
where various examples are available.
Finally, the training of science teachers, trainees and trainers, should
not be considered as the final step, but as the open-door to the long
process of developing the best use of computers in the science curriculum.
There should be links between research and proposals about development,
training and appropriate curriculum, teachers and regular INSET pro-
grammes and the development of computer hardware and use of software
12-31

in science teaching. The potential benefit from computer teacher training
requires more attention from both Universities and the Educational
Development Directorate in the Ministry of Education in order to make
the best gains from computers in science education for both teachers and
pupils. Basic research activities could start with replication/extension of
USA and UK studies to establish validity of ideas in SA context. This
research would also provide teaching materials and very important
classroom confidence and classroom experience for tutors.
12-32

R.E FE R.EN- C E S
Abdel-Gaid, S., Trueblood, C. & Shrigley, R. (1986). A systemic procedurefor constructing a valid microcomputer attitude scale. Journal ofResearch in Science Teaching, 23(9). 823-839.
Al-Eissa, M. (1988). A plan for a functional educational resource systemto create a new learning environment in Saudi Arabia. UnpublishedPh.D thesis, University of Cardiff.
Alessi, S. & Shih, Y. (1989). The growth of computer-assisted instructionin Taiwan schools. Computers Education, 13(4), 337-341.
Aiello, N. & Wolfle, L. (1980). A meta-analysis of individual instruction inscience. Paper presented at the annual meeting of the AmericanEducational Research Association. Boston, MA. USA (ERIC DocumentReproduction Service No. ED 190 404).
Alkhuwaiter, A. (1984). Computer's role in the development of Saudi Arabia.Computer World, Jeddah, Tohamah. 2.
Allen, D. (1983). The BBC initiative in computer literacy for adults. In theWorld Yearbook of education 1982/83, Computers and Education,London, Kogan Page Ltd.
Allen, J. (1991). Information Technology Across the Curriculum. ComputerEducation. 68, 20-23.
Almallais, S. (1991). Al Riyadh newspaper, 6674, 6th Jan., p. 5.
Al Riyadh newspaper, (1991), 8432, 28th July, p. 24.
Al Riyadh newspaper, (1992a), 8721, 10th May ,p. 30.
Al Riyadh newspaper, (1992b), 8740, 29th May, p. 10.Al Riyadh newspaper, (1993), 8991, 4th Feb., p. 21.
Alzahrany, A. (1989). Self concept and locus of control and their relationshipto academic achievement of the development secondary schools inWestern Province in Saudi Arabia. Paper presented in the Develop-mental Secondary Education Conference, Riyadh, Saudi Arabia, 1989.
Al-Zaid, A. (1982). Education in Saudi Arabia: A model with difference.Jeddah, Tohamah.
Al-Zaid, A. (1990). Al Riyadh newspaper, 6574, 28th September, p. 3.
Baird, B. (1991). Perspectives on computers in preservice science teachereducation. Sigcue Outlook, 21, Part 1, 5-16.
Bame, E. & Dugger, W. (1989). Pupils' attitude towards technology. Paperpresented in the PATT-4 Conference, Eindhoven, the Netherlands,April, 1989.
R-1

Bangert-Drowns, R., Kulik, J. & Kulik, C. (1985). Effectiveness ofcomputer-based education in secondary schools. Journal ofcomputer-Based Instruction, 12, 59-68.
Banks, M. & Havice, M. (1989). Strategies for dealing with computer anxiety:Two case studies. Educational Technology, XXIX (1), 22-25.
Barnes, J. (1993). This month's PCW. Personal Computer World. 16, March.
Barton R. (1991). Practical science With computers. Computer Education,67, 6.
Beare, G., Richards, H. & Lancaster, P. (1987). Attitudes toward computers:Validation of a computer attitudes scale. Journal of EducationalComputing Research. 3(2), 207-219.
Beare, R. (1992). Software tools in science classrooms. Computer AssistedLearning. 8, 221-230.00t
Berge, Z. (1990). Effects of group size, gender, and ability grouping onlearning science process skills using microcomputers. Journal ofResearch in Science Teaching, 27(8), 747-759.
Beynon, L. (1985). An investigation into the use of CAL and the dialoguein a Tutorial context. Journal of Computer Assisted Learning, 1, 15-24.
Bitter, G. & Davis, S. (1985). Measuring the development of computerliteracy among teachers. AEDS Journal, 18(4), 243-253.
Bliss, J., Chander, P. & Cox, M. (1986). The introduction of computers intoa school. In Summers, (1990a).
Black, J.(1987), Spreadsheets across the curriculum. Hatfield Harts, Theadvisory unit.
Borg, W. & Gall, M. (1989). Educational research. 5th edn, London, Longman.
Boyd-Barrett, 0. (1990). Schools' computing policy as state-directedinnovation. Educational Studies. 16(2), 169-185.
Boyes, E. & Thyagarajan, J. (1992). The evaluation of an undergraduatecomputer course at the University of Liverpool. Computer Education.71, 9-12
Brophy, J. & Good, T. (1974). Teacher student relationships: Causes andconsequences. New York, Holt, Rinehart & Winston.
Brosnan, T. (1989). Teaching Chemistry using spreadsheets -1: Equilibriumthermodynamics. School Science Review, 70, 39-47.
Brosnan, T. (1990). Teaching Chemistry using spreadsheets -2: More ideasand some limitations. School Science Review, 71, 53-59.
Brown, M. (1987). The computer as a tool for information processing inGeography. History and Social Science Teacher. 22(4). 197-202.
R-2

Cachapuz, A., Malaquias, I., Marilia, F. & Vasconcelos, N. (1991). Need fornew information technology in the teaching of Physics and Chemistryin Portugal. In: Teacher Education in the Nineties towards a NewCoherence (ATEE). (Ed. by Coolahn, J.), Ireland, The Leinster Leader,Naas, Co. Kildare, 2 417-426.
Carnoy, M., Daley, H. & Loop, L. (1987). Education and Computers: Visionand Reality, Paris, Unesco.
Centre of Statistical Data & Educational Documentation (1992). Educationalstatistics for the Ministry of Education. Saudi Arabia, Ministry ofEducation.
Chamberlain, P. & Vincent, R. (1989). Using a spreadsheet to analyse thethermal performance of a model hous. School Science Review. 71(255),39-47.
Choi, B. & Gennaro, E. (1987). The effectiveness of using computer simulatedexperiments on Junior High students' understanding of the dis-placement concept. Journal of Research in Science Teaching, 56, 37-52.
Clancey, J. (1979). Transfer of rule-based expertise through a tutorialdialogue. Unpublished PhD thesis, Stanford Univ. In (O'Shea & Self,1988).
Clark, E. (1983). Reconsidering research on learning from media. Reviewof Education Research, 53(4), 445-459.
Clark, E. (1985). Evidence for confounding in computer-based instructionstudies: Analysing the meta-analyses. Education Communication andTechnology Journal, 33(4), 249-262.
Clement, F. (1981). Affective considerations in computer-based education.Educational Technology, 21(4), 28-32.
Cohen, J. (1977). Statistical Power Analysis for the Behavioural Science.New York, Academic Press.
Cumming, G. (1988). Artificial intelligence applications to learning andtraining. Occasional paper inTER/2/88. Lancaster, Lancaster Uni-versity.
Daines, D. (1984). Databases in the classroom. Kent, Castle House Publi-cations.
Dalton, B. (1985). The effects of different amounts of computer-assistedinstruction on the Biology achievement and attitudes of high schoolstudents. Unpublished EDD thesis, University of Georgia. In.(Dissertation Abstracts, No. AAC 8606036).
D' Arcy, M. & Gardner, R. (1986). Learning from teachers: teacher'sperspectives of relevant courseware and training provision. Presentedat EURIT 86, Twente University, Enschede, The Netherlands (May1986).
R-3
A

Davis, N (1990). A Strategy for information technology in teacher education.A discussion paper from the ITTE Association. Computer Education.65, 29-31.
DES, (1985). General certificate of secondary education. London. HMSO.
DES (1989a). Information Technology in Initial Teacher Training, the reportof the expert group chaired by Janet Trotter. DES, London. HMSO.
DES (1989b). Survey of information technology in schools". StatisticalBulletin 10/89. London. HMSO.
DES (1989c). Report of the IT in ITT Expert Working Group. London, DES.
DES (1989d). Information Technology from 5 to 16. DES, London. HMSO.DES (1990). Enabling Teachers to undertake in-service education and
training. A report by Brown S. and Earley P. HMSO
DES (1991). Survey of information technology in initial teacher training.Statistical Bulletin 12/91. London, DES.
Digranes, J. SE, Digranes, S. (1989). Adapting computer applications formulticultural teaching. Computer Teacher. 17(3), 20-23.
Disessa, A. (1987). The third revolution in computers and education. Journalof Research in Science Teaching, 24(4), 343-367.
Dowsey, M (1977). Computer simulation of laboratory experiments. Aspectsof simulation and gaming. London, Kogan Page.
Duguet, P. (1990). Computers in schools, national strategies and theirextension to the international level. Prospects, 20(2), 65-72.
Ellington, H (1989). Foreword for Langhorne, et al. (1989).
Elliott, C. (1988). Spreadsheets in science teaching. School Science Review,71, 94-98.
Elliott, C. (1992). Spreadsheets in science teaching. School Science Review,73, 120-123.
El-sanhurry, A. (1990). Effects of freedom to control a science learningsequence of computer-based instruction on achievement and attitudesof junior high school formal and nonformal reasoners. UnpublishedPhD thesis, University of Minnesota. In. (Dissertation Abstracts, No.AAC 9024268).
Fielden J. (1979) The cost of CAL. In Tawney, (1979).
Finnemore, D. (1990). More spreadsheets in science teaching. School ScienceReview. 71(257), 94-98.
Fifth Development Plan (FDP), 1990-1995. Ministry of Planning. Saudi Arabia.
Freeman, D. & Tagg, W. (1985), Databases in the classroom. Journal ofComputer Assisted Learning, 1, 2-11.
R-4

Gardner, J. & Megarity, M. (1987). Information technology and in-serviceteacher education. ESRC Occasional Paper ITE/21/87. Lancaster.University of Lancaster.
Goler, B. (1990). INSET in CAL for teachers in primary schools. BritishJournal of In-service Education, 16(2) 119-121.
Gwyn, R. (1982). Information technology and education: the approach topolicy in England, Wales and Northern Ireland. European Journal ofEducation, 17(4) 355-368.
Hale, M. (1986). Improving research on computers in science learning: Areaction. Journal of Research in Science Teaching. 23(5), 471-473.
Hartley, J. (1981). Learner initiative in computer assisted learning.Microcomputers in Secondary Education: Issues and Techniques,102-117.
Hartley, R. (1988). Learning from computer based learning in science.Studies in Science Education, 15, 55-76.
Hebenstreit, J. (1984). Computers in education in developing countries.Paris, Unesco.
HMI (1985). The Curriculum from 5 to 16. London, HMSO.
Boyles, C, Noss,R & Sutherland, R (1989). An INSET programme for secondarymathematics teachers. ESRC Research in Progress- research projects,January 1988, Lancaster, University of Lancaster.
Hoyles, C, Noss,R & Sutherland, R (1990). A computer-based INSET pro-gramme for secondary mathematics teachers. ESRC Research inProgress- update April 1990, University of Lancaster, Lancaster.
Hofstadter, R. (1979). Godel, escher, bach: an eternal golden penguin:Harmondsworth. In Megarry, (1983).
Hooper, R. (1977), National development programme in computer assistedlearning: Final report of the director. London, Council of EducationalTechnology.
Hounshell, P. & Hill, S. (1989). The microcomputer and achievement andattitudes in high school Biology. Journal of Research in ScienceTeaching, 26 (6), 543-549.
Howard, H. (1985). The effects of cognitive process training on high schoolstudents' problem-solving and transfer. Unpublished EDD thesis,University of Pittsburgh. In. (Dissertation Abstracts, No. AAC 8519471).
Howe, J. (1978), Artificial intelligence and computer-assisted learning: Tenyears on, London, Kogan Page.
Hudson, K. (1984), Introducing CAL: A practical guide to writing com-puter-assisted learning programs. London, Chapman and Hall Com-puting.
R-5

Ingvarson & Mackenzie (1988). Factors affecting the impact of inservicecourse for teachers: Implication for policy. Teaching & TeacherEducation, 4(2), 139-155. In Sutherland, et al., (1991a)
Jay, B. (1981). Comuterphobia: What to do about it. Educational Technology,January, 47-48.
Kahn, B. (1985), Computers in science. Cambridge, Cambridge University.
Kherlopina, R. & Dickey, E. (1985). Technology in teaching science andmathematics (grade 7-9). Paper presented at the tenth annual meetingof the National Council of States on in-service education, Denver,(1985).
Knight, P. & Timmins, G. (1986). Using databases in history teaching.Journal of Computer Assisted Learning, 2, 93-101.
kracjik, S., Simmons, E., & Luneta, N. (1986). Improving research oncomputers in science learning. Journal of Research in Science Teaching.23(5), 465-470.
Kulik, J., KUlik, C. & Cohen P. (1980). Effectiveness of computer-basedcollege teaching: A meta-analysis of findings. Review of educationalResearch, 50(4), 525-544.
Kulik, A., Bangert, L. & Williams, W. (1983). Effects of computer-basedteaching on secondary school students. Journal of Educational Psy-chology, 75(1), 19-26.
Langhorne, M. Donham, J. & Rehmke, D. (1989). Teaching with computers:A new menu for the '90s. Kogan Page, London.
Laurillard, D. (1992). Learning through collaborative computer simulations.British Journal of Educational Technology, 23(3), 164-171.
Lawton, J. & Gerschner, T. (1982). A survey of the literature on attitudestowards computers and computerised instruction. Journal of Researchand Development in education. 16(1), 50-55.
Lehman, J. (1985). Survey of microcomputer use in the science classroom.School Science and Mathematics. 85, 578-583.
Lewis, R. (1983). The Microcomputer and the teacher's need. In Gardner& Megarity, (1987).
Lewis, P. (1989). Battle of the PCs for the lucrative schools market. TheIndependent. Monday 22 May, p. 16.
Lewis, P. (The head of IT in schools division at the Department OfEducation). In a speech to the RESOURCE conference, November 1992.
Lichtman, D. (1979). Survey of educators' attitudes towards computers.Creative Computing. 5, 48-50.
Little, T. (1985). Using general purpose microcomputer software to enhancesocial studies instruction. Paper presented at the annual meeting ofthe National Council for the Social Studies. Chicago. November (1985).
R-6

Low, W., Carson, M. 8r. Zlotolow, S. (1988). A data base of instructionalstrategies. Journal of Computers in Mathematics and Science Teaching,7(3), 30-32.
Maddux, C. (1988). Preface to (Roblyer, et al., 1988).
Margolin, J. & Misch M. (1970), Computer in the classroom. London, MacmillanCo. Ltd.
Marion, H. (1988). Teacher attitudes toward computer use in the classroom.A paper presented at the annual meeting of the Pacific NorthwestResearch and Evaluation Conference of the Washington EducationalResearch Association. March, 1988.
Martin, D, & Heller, R. (1982). Computer literacy for teachers. EducationalLeadership 40, 46-47.
Martin, J. (1981). An end-users guide to data base. New Jersey,Prentice-Hall, Inc.
Mathews, W. & Wolf, A. (1979). The computer attitude continuum: Scotingthe critics and the appreciators. Proceeding of the Association forEducational Data Systems Annual Conference. AEDS, New York, 1979.
McCarthy, R. (1988). Making the future work: The road to curriculumintegration. Electronic Learning. September, 42-46.
McLeod, R. & Hunter B. (1987), The data base in the laboratory. Scienceand Children 24 (4), 28-30.
McNemar, Q. (1969). Psychological statistics, 4th edn. New York, John Wiley& Sons, Inc.
MECC (Minnesota Educational Computing Consortium) (1979). MinnesotaComputer Literacy and Awareness Assessment. Minnesota, MinnesotaEducational Computing Consortium.
Megarry, J. (1983). Thinking, learning and educating: the role of thecomputer. In the World Yearbook of education 1982/83, Computers andEducation, Kogan Page Ltd, London.
Mellar, H. & Jackson, A. (1992). IT in post-graduate teacher training.Journal of Computer Assisted learning. 8(4), 231-243.
Miller, I. (1981). The micros are coming. In Thomas, I. St James, L.Microcomputers in the schools. The Oryx Press.
Mindura, M. (1991). Computers and curriculum. Science and Technology.15, 14-21. Riyadh. King Abduluziz City for Science and Technology.
Mindura, M. (no date). A comprehensive survey about using computers ingeneral education with special review to the Gulf States. Riyadh, ArabOffice of Education for the Gulf States.
Ministry of Education, (1986). The developmental secondary school guide.Saudi Arabia, Ministry of Education.
R-7

Ministry of Education, (1992). Secondary School Project. Unpublishedreport, Saudi Arabia, Ministry of Education.
Ministry of Education, (1993). The curriculum, first year of secondaryschool, Introduction to the Computers, Saudi Arabia, Ministry ofEducation.
Ministry of Education, (1993). The curriculum, second year of secondaryschool, Introduction to the Programming (BASIC), Saudi Arabia,Ministry of Education.
Ministry of Education, (1993). The curriculum, third year of secondaryschool, Computer Programming and Introduction to InformationSystems, Saudi Arabia, Ministry of Education.
Ministry of Education, (1993). The Curriculum, First Year of SecondarySchool, Physics, Saudi Arabia, Ministry of Education.
Minsky, M. & Solomon, C. (1985). Logo works: Challenging in Logo. London.McGraw-Hill.
Mitchell, L. (1988). Computerization in Texas secondary science classrooms.Unpublished PhD thesis. University of Texas. USA.
Moore, J. (1984). The development and use of a questionnaire measuringsecondary school pupils' attitudes to computers and robots.Unpublished M.Phil thesis. University of Nottingham.
Moore, J. (1987). Teaching computer studies: teachers' attitudes and theireffects on pupils. Computer Education, 60, 18-19.
Moore, J. (1989). A questionnaire survey of the teaching of computerstudies, pupils attitudes toward computers and perceptions of thelearning environment Unpublished Ph.D thesis. University of Hull.
Naisbitt, J. (1982). Megatrends. New York: Warner book.
National Education Association (1983). A teacher survey: Computers in theclassroom. Washington, D.C.: National Education Association.
National Science Board (1983). Educational American for the 21st century.Washinton, D.C.: National Science Foundation.
NCET (1993). Evaluation of IT in science. Science Report, National Councilfor Educational Technology.
Newell, A. (1980). One final word. In Berge, (1990).
Northwood, J. (1991) Computing in the National Curriculum. PC Compatibles.UK, SIGMA press.
Norusis, M. (1990). SPSS/PC+ Statistics 4.0 for the IBM PC/XT/AT andPS/2. USA, SPSS Inc.
Ogborn, J. (1986) New Technologies and the Classroom. In the Internationalconference on trends in Physics education. The International Com-mission of Physics Education and KTK Scientific Publishers.
R-8

Ogborn, J. (1987). Computational modelling in science. In Trends in ComputerAssisted Education. 148-166. Oxford, Blackwell Scientific publication.
Ogborn, M. (1987). Spreadsheets in science teaching. School Science Review,69, 142-143.
Okey, R. (1985 April). The effectiveness of computer-based education: Areview. Paper presented at the annual meeting of the NationalAssociation for Research in Science Teaching, french Lick Springs,In (ERIC Document Reproduction Service No. ED 257 677).
Osborn, M. (1987). Spreadsheets in science teaching. School Science Review.69(246), 142.
O'Shea, T. & Self J. (1988), Learning and teaching with computers: Artificialintelligence in education. Sussex, Harvester Press.
Palmer, G. & Oldehoeft, A. (1975). The design of an instructional systembased on problem-generators. International Journal of MAN-MACH. 7,249-71.
Piaget, J. (1970), The Science of education and the psychology of thechild, New York, Orion Press.
Pine, S. (1989). Changing teacher styles: the development of a model foreffective in-service courses. The Eleventh Conference for the Psy-chology of Mathematics, Hungary. In. Sutherland, et al., (1991a).
Ransley, W. (1991). An instrument for measuring five aspects of children'sattitudes towards microcomputers. British Journal of EducationalTechnology. 22(3), 216-221.
Ray, D. (1988). An interview in McCarthy (1988).Reece, J. & Gable, K. (1982). The development and validation of a measure
of general attitudes towards computers. Educational and PsychologyMeasurement. 42, 913-916.
Reid, I. & Rushton, J. (1985), Teaching computers and the classroom.Manchester, Manchester University Press.
Rhodes, V. & Cox, M. (1990). Current practice and policies for usingcomputers in primary schools: Implication for training. ESRC OccasionalPaper InTER/15/90, Lancaster, University of Lancaster.
Rivers, R. & Vockell, E. (1987). Computer simulation to stimulate scientificproblem solving. Journal of Research in Science Teaching, 24(5),403-415.
Roblyer, M., Castine, W. & King, F. (1988). Assessing the impact ofcomputer-based learning. Computers in the Schools. 5 (3&4).
Rockman, S., White, D. & Rampy, L. (1983). Computers in the schools: Theneed for policy and action. Educational Technology, 23, 13-20.
R-9

Roseman, J. & Brearton, M. (1989). Computers to enhance science education:An inservice designed to faster classroom implementation. A paperpresented at the annual meeting of the national Association forResearch in Science Teaching at san Fransisco, California.
Rosenshine, B. (1971). Teacher behaviours and student achievement. London.National Foundation for Educational Research In England and Wales.
Rudolph, S. (1986). A study of the effectiveness of an audio-graphicteleconferencing system in a remotely delivered high school Physicsprogram. Unpublished PhD thesis, The University of Utah. In.(Dissertation Abstracts, No. AAC 8619541).
Sartor, R. (1985). Using tomorrow's database today to help solve globalchallenges, via a computer. Paper presented at the annual meetingof the National Council for the Social Studies. Chicago. November 1985.
Siegel, S. & Castellan, N. (1988). Nonparametric statistics for the behaviouralsciences, 2nd edn. USA, McGraw-Hill.
Skinner, B. (1938). The behaviour of organisms: An experimental analysis.New York, Appleton-Century-Crofts.
Smart, L. (1988). The database as a catalyst- a year with QUEST. Journalof Computer Assisted Learning. 4, 140-149.
Smith, L. (1984). Overcoming computer-induced anxiety. In Kelly, A.Microcomputers and the Curriculum. Harper Education Press.
Snir, J. and Others (1988). The truth, but not the whole truth: An essayon building a conceptually enhanced computer simulation for scienceteaching. draft article. Technical Report, 88-18. In (ERIC databasesservice No. ED 295832).
Sparks, C. (1983). Synthesis of research on staff development for effectiveteaching. Educational Leadership, 41(3), 65-72.
Stephens, H. (1991). Chemical equilibrium spreadsheet. School ScienceReview. 73(263), 83-84.
Stetcher, B. (1984). Improving computer in-service training programs forteachers. AEDS Journal, 4, 95-105.
Straker, A. (1989), Children using computers. Oxford, Basil Blackwell Ltd.
Summers, M (1990a). Starting teacher training-new PGCE students andcomputers British Educational Research Journal, 16(1), 79-87.
Summers, M (1990b). New student teachers and computers: an investigationof experiences and feelings. Educational Review, 42(3), 261-271.
Sutherland, R., Noss, R. & Hoyles, C. (1990). The microworlds course: Anapproach to computer-based in-service teacher education forMathematics. In: Teacher education in Logo-based environments (Ed.by Schuyten, G & Valcke, M. EDIF-State University Gent), 92-104.Belgium. Commission of European Communities.
R-10

Sutherland, R., Hoyles, C. & Noss, R. (1991a). The microworlds course:Description and evaluation. Final report of the microworlds project.Volume 1. London, University of London.
Sutherland, R., Hoyles, C. & Noss, R. (1991b). The microworlds course:Description and evaluation. Final report of the microworlds project.Volume 2. London, University of London.
Sutherland, R., Hoyles, C. & Noss, R. (1991c). The microworlds course:Description and evaluation. Final report of the microworlds projectVolume 3. London, University of London.
Tawney, D. (1979), Learning through computers: An introduction to computerassisted learning in engineering, mathematics and science at tertiarylevel. London, The Macmillan Press Ltd.
Terry, C. (1984). Using computers in schools. London, Nichols PublishingCompany.
Thomas, D. (1979). The effectiveness of computer-assisted instruction insecondary school, AEDS Journal, 103-116. In Roblyer et al., (1988).
Thomas, C. (1978). Attitude assessment, rediguide 7. TRCR, Nottingham,University of Nottingham.
Tinker, R. (1984). Spreadsheet math: An example of educational applicationsof general software tools. Hands-On. 7(1), 19-21.
Troutner, J. (1988). Using spreadsheets in the elementary and middleschool math class. Journal of Computers in Mathematics and ScienceTeaching. 7(4), 12-13.
Trowbridge, D. & Bork, A. (1984), Computer based learning modules forearly adolescence, in: Using Microcomputers in Sch000ls (Ed. by Terry,C.). London, Nichols Publishing Company.
Turkel S. & Chapline E. (1984). A computer literacy program for prospectiveelementry school teachers, Journal of Computer Management SystemTeaching. 4(1) 24-28.
Turner, R. (1992). Using a metals database. School Science Review. 73(265),99-100.
Underwood, J. & Underwood, G. (1989). Teacher attitudes to the use ofcomputers in school. A paper presented in the Sixth InternationalConference on Technology and Education (1989).
Vinsonhaler, F. & Bass, K. (1972). A summary of ten major studies on CIAdrill and practice. Educational Technology, July, 29-32.
Wainwright, C. (1985). The effectiveness of a computer-assisted instructionpackage in supplementing teaching of selected concepts in high schoolchemistry equations. Paper presented at the annual meeting of theNational Association for Research in Science Teaching. French LickSpring. In. (ERIC Databases Service No. ED 257 656).
R-11

Wainwright, C. (1989). The effectiveness of a computer-assisted instructionpackage in high school chemistry. Journal of Research in ScienceTeaching, 26 (4), 273-290.
Weiss, R. (1977). National survey of science, mathematics and social scienceeducation high-lights report. The status of pre-college science,mathematics, and social studies educational practices in U.S schools:an overveiw and summaries of 3 studies, Washington, DC: NationalScience Foundation, 1978, quoted in Willett et al. (1983).
Wild, M. (1988). Microcomputers in secondary education. ESRC OccasionalPaper ITE/28b-c/88. Lancaster. University of Lancaster.
Willett, B., Yamashita, M. & Anderson, D. (1983). A meta-analysis ofinstructional systems applied in science teaching. Journal of Researchin Science Teaching. 29(5), 405-417.
Williams, R. & Maclean, C. (no date), Computing in schools. Edinburgh,Holmes McDougall Lt.
Wilson, D. & Trenary, G. (1981). An investigation of computer literacy asa function of attitude. SIGCSE Bulletion. 13(3), 5-12.
Winn, K. (1990). New computer-interfaced experiment to investigate changingforces. School Science Review. 72 (258), 59-61.
Woerner, J., Rivers, R. & Vockell, E. (1991). The computer in the sciencecurriculum. New York, McGraw-Hill.
Woodward, J., Carnine, D. & Gersten, R. (1988). Teaching problem solvingthrough computer simulation. American Educational Research, 25(1),72-86.
Youngman, M. (1979). Analysing social and educational research data. UK,McGraw-Hill.
Youngman, M. (1982). Designing and analysing questionnaires, redigude12. TRCR, Nottingham, University of Nottingham.
Zietsman, A. & Hewson P. (1986). Effect of introduction using microcomputersimulation and conceptual change strategies on science learning.Journal of Research in science teaching. 23(1), 27-39.
R-12

SOFTWARE REFERENCES
Al-alamiah Windows (1992). Al-alamiah, Saudi Arabia.
Allwrite (1988). ILECC.
FIND. Humberside Microelectronics in Education Centre.
FlexiWRITE (1990). Flexible Software Ltd.
GRASSHOPPER (1988). Newman Software
EQUIL. Longman Micro Software, UK.
Excel Spreadsheet (1990 and 1992). Microsoft.
Lotus Manuscript (1988). Lotus development Ltd.
Microsoft windows 3.0 and 3.1. Microsoft
MULTIPLAN Package (1986). ITEM.
PC QUEST (1987). Hertfordshire. The advisory Unit.
PLANETARY MOTION. Longman Micro Software, UK.
SITING AN ALUMINIUM PLANT. Longman Micro Software, UK.
Spreadsheets Across the Curriculum (1987). Hertfordshire, Hertsmedia.
The BP Energy File (1989). BP Educational Service.
The Universal Word (1989). Wysiwyg Corporation.
R-13

A lE) 1," E N. I) I IC E S

Appendix A: SYLLABUSES OF COMPUTER COURSES
I Introduction to Computers:
* Introduction to computers and their uses;
* Computer contents;
* Computer unites;
* Microcomputers and their uses;
* Introduction to programming;
* Data processing.
II Introduction to Programming (BASIC):
* Program coding in BASIC;
* Computer instructions;
* BASIC commandos: structure and use;
* BASIC capability.
III Computer Programming and Introduction to Information Systems:
* Arrays;
* Strings;
* Sub-programs;
* Functions;
* Files;
* Introduction to microcomputers;
* Computer operating system;
* Introduction to information systems;
* Databases.
Appendix A-1

Appendix B: THE 47 MODERN CAL STUDIES IN SCIENCE TEACHING
1. Adams, D. & Shrum, J. (1990). The effects of microcomputer-basedlaboratory exercises on the acquisition of line graph constructionand interpretation skills by high school Biology students. Journal ofResearch in Science Teaching, 27, 8, 777-787.
2. Barlow, S. (1990). An investigation of the effects of microcomputextsupon problem-solving skills in college Biology students. DissertationAbstract International. No.: AAC9113566.
3. Bill, R. (1990). The role of advance organizers, learning control, andstudent's locus-of-control on acquisition of pharamacokinetic conceptsand attitudes towards computer-assisted instruction. DissertationAbstract International. No.: AAC9031195.
4. Brasell, H. (1987). Sex differences related to graphing skills inmicrocomputer-based labs. Paper presented at the annual meeting ofthe national Association for Research in Science Teaching. ERICDatabase Service. No.: ED 280734.
5. Carnes, E., Lindbeck, J. & Griffin, C. (1987). Effects of group size andadvance organizers on learning parameters when using microcomputertutorials in kinematics. Journal of Research in Science Teaching, 24,9, 781-789.
6. Carrison, D. (1991). The effective grouping and ability on achievementby subject using computer-based lesson with instructional options.Dissertation Abstract International. No.: AAC91228241.
7. Choi, B. and Gennaro, E. (1987). The Effectiveness of Using ComputerSimulated Experiments on Junior High Students' Understanding ofthe Displacement Concept. Journal of Research in Science Teaching,56, 37- 52.
8. Conlin, 0. (1989). The impact of computer assisted instruction uponstudent achievement in a magnet school. Dissertation AbstractInternational. No.: AAC9003381.
9. Crawford, R. (1990). A study of the relationships among student MBTIPsychological profiles, microcomputing time-on-task, achievement, andattitude in introductory college genetics. Dissertation AbstractInternational. No.: AAC9024586.
10. Dalton, L. (1985). The effects of different amounts of computer-assistedinstruction on the Biology achievement and attitudes of high schoolstudents. Dissertation Abstract International. No.: AAC8606036.
11. Dohery, M. (1989). the effect of drill question sequencing on learningand user satisfactory in computer-assisted instruction in moleculargeometry. Dissertation Abstract International. No.: AAC9008601.
Appendix B-1

12. Donn, J. (1990). The relationship between student learning approachand student understanding and use of ogwin's Vee in a college levelBiology course following computer tutorial instruction. DissertationAbstract International. No.: AAC9027040.
13. Driscoll, R. (1990). A comparison of the relative effectiveness ofmicrocomputer-assisted instruction and conventional instruction forthe teaching of reference skills to seventh-grade students. DissertationAbstract International. No.: AAC9100613.
14. Ebert-Zawasky, K. (1989). Integrating computer interfaced videodiscsystems into the teaching of introductory Biology at the college level.Dissertation Abstract International. No.: AAC9005504.
15. El-Sanhurry, N. (1990). Effects of freedom to control a science learningsequence of computer-based instruction on achievement and attitudesof junior high school formal and nonformal reasoners. DissertationAbstract International. No.: AAC9024268.
16. Faryniarz, J & Lockwood, L. (1992). Effective of microcomputersimulations in stimulating environment problem solving by communitycollege students. Journal of Research in Science Teaching, 29, 5,453-470.
17.Flick, L. (1990). Interaction of intuitive Physics with computer-simulationPhysics. Journal of Research in Science Teaching, Journal of Researchin Science Teaching, 27, 3, 219-231.
18. Freitag, P. (1991). Learning in the middle school earth science classroom:students conceptually integrate new knowledge using intelligentlaserdiscs. Dissertation Abstract International. No.: AAC9122904.
19. Friedler, R., Nachmias, R. &. Linn, M. (1990). Learning scientific skillsin microcomputer-based laboratories. Journal of Research in ScienceTeaching, 27, 2, 173-191.
20. Garren, W. (1990). An experimental evaluation of using computer-aideddesign simulations in teaching basic electronics at the college level.Dissertation Abstract International. No.: AAC9023380.
21. Gizara, J. (1989). A comparison of the student controlled CAI andcomputer control CAI in a remedial program for solving stoichiometryproblems in Chemistry. Dissertation Abstract International. No.:AAC9002465.
22. Holliday, W. & McGuire, B. (1992). How can comprehensive adjunctquestions focus students' attention and enhance concept learning ofa computer-animated science. Journal of Research in Science Teaching,29, 3, 3-15.
23. Hounshell and Hill (1989). The Microcomputer and Achievement andAttitudes in High School Biology. Journal of Research in ScienceTeaching, 26 (6), 543-549.
Appendix B-2

24. Howard, J. (1985). The effect of cognitive process training on highschool students' problem-solving and transfer. Dissertation AbstractInternational. No.: AAC8519471.
25. Juang, C. (1989). The effects of the temporal position of computer-basedpractice on solving quantitative in Physics science. DissertationAbstract International. No.: AAC9010904.
26. Jyoung, H. (1990). The use of integrated curriculum materials, hands-oninvestigations in cooperative group activities and computer-basedalternatives in science and basic skills instruction: a prototype forfurther study and for integrated curriculum development. DissertationAbstract International. No.: AAC9100293.
27. Klix, F., Streitz, N., Waern, Y. & Wandke, H. (1989). Mental representationof geometrical objects in human-computer interaction. The HILITESDatabase Service. No.: ACCN 56040.
28. Kruse, D. (1989). the effects of laboratory investigations usinginteractive videodisc or computer simulations on student control forvariables. Dissertation Abstract International. No.: AAC9016528.
29. Leonard W. (1989). A comparison of student reaction to Biologyinstruction by interactive videodisc or conventional laboratory.Journal of Research in Science Teaching, 26, 2, 95-104.
30. Lowery, B. (1988). A comparison of computer-assisted instruction andtraditional lecture/discussion and their relationship to studentcognitive style, faculty and student time involvement and cost.Dissertation Abstract International. No.: AAC8826953.
31. Mccurry, E, (1988). The effects of microcomputer drill and practice onachievement in general Physics classes a two year liberal art college.Dissertation Abstract International. No.: AAC8812085.
32. Miller, D. (1986). The integration of computer simulation into thecommunity college general Biology laboratory. Dissertation AbstractInternational. No.: AAC8619579.
33. Mokros, J. & Tinker, R. (1987). The impact of microcomputer-basedlabs on children's ability to interpret graphs. Journal of Researchin Science Teaching, 24, 4, 369-383.
34. Mousa, N. (1987). The effects of CAI tutorial instruction on collegestudents' achievement and skills performance in balancing equations.Dissertation Abstract International. No.: AAC8807324.
35. Nachmias, R. & Linn, M. (1987). Evaluation of science laboratory data:The role of computer-presented information, Journal of Research inScience Teaching, 24, 5, 491-506.
36.Rivers, R. & Vockell, E. (1987). Computer simulation to stimulate scientificproblem solving, Journal of Research in Science Teaching, 24, 5,403-415.
Appendix B-3

37. Rosner, E. (1989). An evaluation of a computer assisted instructionalunit in basic electrical awareness for sixth through ninth-groupscience students. Dissertation Abstract International. No.: AAC913130.
38. Rudolph, S. (1986). A study of the effectiveness of an audio-graphicteleconferencing system in a remotely delivered high school Physicsprogram. Dissertation Abstract International. No.: AAC8619541.
39.Sanchez, J. & Mallegas, A. (1990). A new approach to software developmentin Biology. The HILITES Database Service. No.: ACCN 76761.
40. Snir, J. (1988). The truth, but not the whole truth: An essay onbuilding a conceptually enhanced computer simulation for scienceteaching. ERIC Database Service. No.: ED 295832.
41. Spraggins, C. & Rowsey, R. (1986). The effective of simulation gamesand worksheets on learning of varying ability groups in a high schoolBiology classroom. Journal of Research in Science Teaching, 23, 3,219-229.
42. Stancil, J. (1991). Paper and cube interventions preceded by a threedimentional computer graphics in elementary education majors. ERICDatabase Service. No.: ED 334071.
43. Wagner, S. (1991). Robotics and children: Their relationship to scienceachievement, problem-solving, adha rating scale scores, and learningstyles. Dissertation Abstract International. No.: AAC9129255.
44. Wainwright, C. (1985, April). The effectiveness of a computer-assistedinstruction package in supplementing teaching of selected conceptsin high school chemistry equations. ERIC Databases Service No.: ED257 656.
45. Wainwright, C. (1989). The effectiveness of a computer-assistedinstruction package in high school chemistry, Journal of Research inScience Teaching, 26 (4), 273-290.
46. Woodward, J., Carnine, D. & Carsten, R. (1988), Teaching problemSolving Through Computer Simulation. ERIC Databases Service No.:ED 543 231.
47. Zietsman, I. A. & Hewson W. P. (1986). Effect of introduction usingmicrocomputer simulation and conceptual change strategies on sciencelearning. Journal of Research in Science Teaching, 23, 1, 27-39.
Appendix B-4

Appendix C: INTERVIEW SCHEDULES
Appendix C-1

k
Name(if you like) School City of the school ...Qualifications:
1) What is your teaching subject?(Eg Physics, Chemistry...)
2) What is your qualification? (Eg MEd, MSc, BSE, BSc..)
3) For how long have you been teaching?
4) For how long have you been a science teacher? 5) Have you got a personal computer? If, yes, for what do you use it?if, not, are you thinking of buying one?
6) Are there any computers in your school?If yes, how many? , Have you ever used these computers?
7) If you reply No to 5 and 6, have you had any computer experience"if yes, give more information?....
Characteristics:
Knowledge:
1- Do you know how the computer is turned on and off?
2- Could you tell me what is a hard disk and what is a floppy disk? 3- Do you know what is BASIC language?If yes, give brief description?
4- Can you give tell me what are the ways in which computers can beused in schools?
5- What is the best way to use them as far as you know?
6- Do you think science teaching is one of these ways? If yes, how? If no, why not?
7) Could you tell me how far the computer can aid the science teacherin his teaching?
a. audio-visual presentation,b. an alternative to the science laboratory,c. science games.
8) Could you tell me what is computer assisted learning?
Appendix C-2

Training: 1) Have you been on any courses in computers? If yes, give somedetails (When? Where? What was it about? How many days did it last?)....2- Has any institute, private company, etc. held any courses related touse computer in teaching?...If yes, who organised them? When were these courses held? What formdid they take? (Eg workshops, visiting speakers, formal discussion,demonstrations, ), did you attend this \these course\s?....If yes, what was your aim?....
Attitudes: Attitudes Toward Computer Assisted Learning: 1) Do you think it is enough to teach the pupils about computers?(Knowledge about computers, computers technique, social applications ofcomputers),If no, what other learning do they need?
2) Do you feel you need computers to help you in your teaching?
3) Do you expect any discipline problems to arise as a result of introducingcomputer in science teaching? If yes, give examples:Economic problems?Training problems?Software problems?Curriculum problems?4) What is your view of teaching science with the assistance of computers?
What advantages are there? What disadvantages?
5) What is your view on introducing CAL into secondary school scienceteaching?
- Do you think it would change the teachers' role?* increase lesson period, * make teachers' job more difficult
- Do you think it would change the teaching?* make it more difficult, * make it more interesting
- Do you think it would influence the curriculum?* make it more difficult, * make them more complicated
- Do you think science teachers will be trained in using CAL.
6) Do you agree that the use of CAL in science teaching can achieveresults which might otherwise be thought impossible?
Appendix C-3

7) Have you read educational computing articles to look for teaching ideas?
8) Have you followed the recent developments in using computers forteaching?
9) What are you thoughts about the future development of computer usesin science teaching?
10) Would you ever contemplate using a computer in your teaching?If yes, in what circumstances? if no, why not?
Attudes to Computers in Education: 10 Do you read any research, reports about computers in education?If so, how inany?(eg weekly, monthly.....) ; and how do you getthem?
2) What do you think about them? (Eg would you like to see more, easier,cheaper)
3) Do you think science teachers need to learn how to use computers?•-• ,Why?What kind of learning do you think they need?
4) Could you outline some advantages of computer use in education?
5) Are there any disadvantages?
6) What are your views on the use of computers in education generally?
7) Do you think we do not need to introduce computers to our secondaryschools because they cost too much money?
8) Do you think secondary school students should be taught some computercourses? Why?
9) Do you think the use of computers in schools increases pupils' interest?II•11
10) Have you encouraged your pupils to arrange a personal visit(s) to acomputer installation? (Institution, private company, )If yes, what were the aims of this(these) visit(s)?
11) Have you used film or video in your teaching to show applications ofcomputers?
Appendix C-4

12) Do you agree or disagree that computers can encourage the pupils':* flexibility* openness of mind* grasp of technological change* problem solving skill* help handicaps
13) Do you meet with computer teachers to discuss computers in education?If yes, what are your discussions usually about?* teaching ideas?* computer techniques?* the job in general?
Attitudes toward Computers in General:
1) Have you encountered computers? If yes,When? What was your first impression? Have your views changed? How do you feel about computers now?
2) Do you think it is the teacher's duty to introduce pupils to computers? Why?
3) What are your views on the role of computers in society in general?
4) Have you discussed media programmes and news about computers inthe classroom? If yes, why? 5) Have you talked about any computer application in your class?If yes, what was the subject?
6) Have you ever seen TV or video- programmes about computers? ....If, yes, what do you think about them?
7) Have you read computing or technical magazines? ...If yes, what is your opinion of them ?Are you interested in them?Do you want to see more?Are they too specialised?
8) Have you made any personal visit(s) to a computer installation? (Eginstitute, private company,....)If yes, what was the aim of this visit?
9) Do you keep in touch with any private computer company? ....If so, why? *********************************************************
Any comments or suggestions?
Appendix C-5

II INTERVIEW SCHERITLF, WITH COMPITTER STUDIES_ TEACHER
Name(if you like) School City of the school ...Qualifications:
1) For how long have you been teaching? 2) What is your qualification? (Eg MEd, MSc, BSE, BSc..) 3) What is your main teaching subject?
4) Do you have any experience of teaching computer studies out of school?If so, give some details (e.g When? Where? For how long?)
Training:
1) Have you had any inservice training?If yes, give a description (How long was the course? What was it about?
2) Have you been on any courses about using computers in education?If yes, give some details (When? Where? What was it about? How manydays did it last?)
3) Has any institute, private company, etc. held any courses related tothe use of computers in education?If yes, who organised them? When were these courses held? How manyteachers have attended these courses? What form did they take? (e.gworkshops, visiting speakers, formal discussion, demonstrations)
4) Do you think you need more training about computers in education?
Relationship With Science Teacher:
1) Do you meet with the science teachers to discuss computers in education?If yes, how often (daily, weekly...) ....What sort of questions do they ask you?
2) Have you tried to hold any courses on computers for the teachers inthe school?If so, what were your aims?
Factual Information:
1) Is there a computer room in your school?If so, what are its contents?
Appendix C-6

2) Are there any computers in your school?If yes, how many" ,What type of machines" What type ofsoftware do you have" If no, has there been any promise from the officials to supply them" 3) How many computer courses are taught in your school? ....Give some details of contents
4) How many computer teachers are there in your school?
5) Are there any computer books in the school library? ....Is there any lack of these?
6- Are any official reports sent to you?If yes, how many per year? What is your opinions about them? (e.g would you like to see more, easier,1 )
7) What percentage of your pupils have PCs? (Approximately)
8) Can you outline some advantages of computer use in secondary schools?
9) Are there any disadvantages?
10) Could you outline the problems you find during your work?* lack of machines,* lack of software,* difficulties with the officials.* difficulties with the headmaster.* difficulties with pupils' attitudes to computers.
11) Do you expect any discipline problems to arise as a result of introducingcomputers into science teaching? * control problems,* training problems,* software problems.*******************************************************Any mor comments or suggestions.
Appendix C-7
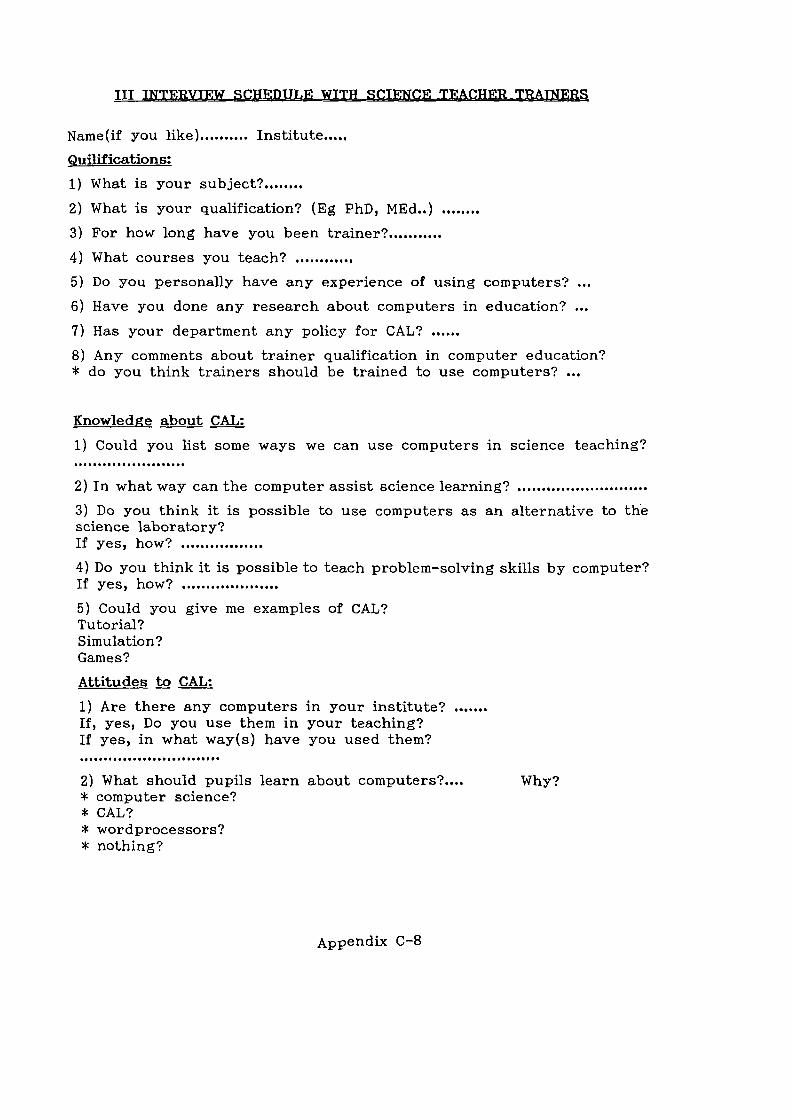
LII : k
Name(if you like) Institute
Quilifications: 1) What is your subject?
2) What is your qualification? (Eg PhD, MEd..) 3) For how long have you been trainer'
4) What courses you teach" 5) Do you personally have any experience of using computers? •••
6) Have you done any research about computers in education? •••
7) Has your department any policy for CAL?
8) Any comments about trainer qualification in computer education?* do you think trainers should be trained to use computers? ...
Knowledge about CAL:
1) Could you list some ways we can use computers in science teaching?
2) In what way can the computer assist science learning? 3) Do you think it is possible to use computers as an alternative to thescience laboratory?If yes, how'
4) Do you think it is possible to teach problem-solving skills by computer?If yes, how'
5) Could you give me examples of CAL?Tutorial?Simulation?Games?
Attitudes to CAL: 1) Are there any computers in your institute" If, yes, Do you use them in your teaching?If yes, in what way(s) have you used them?
2) What should pupils learn about computers?....* computer science?* CAL?* wordprocessors?* nothing?
Why?
Appendix C-8

3) Do you think it is the trainer's duty to train teachers how to usecomputers in their teaching? Why?
3) What are your views on the role of computers in science teaching?
4) Do you think science teachers need to learn how to use computers?,Why? ,What kind of training do you think they need?
5) What do you think is the role of computers in science treaching?....
6) Have you discussed researche, media programmes and news aboutcomputers in science teaching with your students? 7) Do you ask your students to read some CAL books or reports?
8) Have you trained your students in how they can use CAL in theirteaching? * have you given them some lectures?* have you given them some practical sessions?* have you given them some applications?
9) Have you read any researche, reports or articles about CAL in scienceteaching? 9 If yes* did you find them interesting?* useful?* difficult?
10) Have you followed the recent development of using CAL in scienceteaching?
11) Could you outline some advantages of CAL in science teaching?
12) Are there any disadvantages?
13) Do you agree or disagree that computers can encourage the pupils':* flexibility* openness of mind* grasp of technological change* problem solving skill* overcoming handicaps
14) What is your view on introducing CAL into secondary school scienceteaching?
15) Do you think that including training on CAL for science trainees couldchange the preservice programme?* make it more interesting,* make it more difficult?,* make it more modern?
Appendix C-9

16) Do you expect any discipline problems to arise as a result of introducingcomputer to science teaching? If yes, give examples:* software problems?* official problems?* training problems?******************************************************Any comments or suggestions
Appendix C-10

-„ $
31_:14.A.t4e.:1011-4±01.4.
gor SAUIJI AHAti IA
1RGHER EDUCATION
UNIVERSITY
of Education, MUNAWWARAH
Appendix D:
TO WHOM IT MAY CONCERN
I have checked and revised the Arabic translation of
three types of questionnaires done by Mr. Ibrahim Al-Mohaissin
as part of his research work. I have compared the Arabic
translation to the original version in English and found that
they are near to identical.
The ideas are put in simple straightforward language.
I am quite sure that the final versions that I have seen do
not contain ambiguous expressions, nor do they cause confusion
or misunderstanding of ideas to any native Arabic speaker.
( Dr. A. Alharbi )Assistant Professor,
Department of Foreign Languages.
Appendix D-1

Appendix E: QUESTIONNAIRES
Appendix E-1

I: SCIENCE TEACHERS' QUESTIONNAIRE
Dear Science Teacher,
This questionnaire is part of a study investigating the possibility of
introducing computers into science teaching in Saudi Arabia Secondary
Education.
In view of the important role that science teachers play, we need to
know about their ideas and views relating to this matter. The conclusion
of the survey recommend improvements and the use of computers in
science teaching in our schools.
All information you give will be held by me personally in confidence,
and it will not be shown to any other person. You are free to write your
name or not, as you wish.
For the purpose of this survey there are no wrong or right answers.
Your personal honest opinion is the only required response. Please put
down what you really feel and complete all of the questionnaire so you
can give it to me when I come to collect it from you on / /1992.
Thank you in advance..
The researcher
Ibrahim Al-Mohaissin,
College of education,
Department of Curriculum and Instruction
Madinah, POBox 344, 25040 (personal).
Appendix E-2

PART ONE:
Please tick the appropriate column to indicate your personal view of
the following items.
* Remember there is no wrong or right response.
No Items SA A DA SDA
1 Computers are as important to science pupils
as text books in the classroom.
2 Introducing computers into science teaching
would decrease the teacher's role.
3 A computer training programme should be
compulsory for every science teacher.
4 Computers will increase the amount of
teacher-student interaction in the science
classroom.
5 I look forward to a time when computers
are more widely used in science teaching.
6 Science teachers manage without computers,
so computers are not really necessary.
7 It is better to train science teachers in the
schools rather than Universities.
8 Computers will improve science pupils'
problem-solving skills.
9 Teaching science with the aid of computers
would only make difficult topics easier.
10 Computers bring more disadvantages than
advantages to science teaching._
Appendix E-3

No Items SA A DA SDA
11 Science teachers must know a great deal
about how computers work if they want to
use them in science teaching.
12 Using computers in the science classroom will
not improve pupils' positive attitudes towards
the sciences.
13 Teaching science with the aid of computers
would make teaching easier for the most able
pupils only.
14 I would like my computer studies colleague
to train me to use a computer in my teaching.
15 Computers will improve science pupils'
abilities.
16 There is • no benefit from the use of computers
in science teaching commensurate with their
cost.
17 If the schools use more computers, they will
need fewer teachers.
18 A computer studies teacher needs to know
how to use computers in science teaching
before he trains science teachers.
19 Computers will increase the amount of anxiety
pupils experience in the science classroom.
20 The use of computers in science teaching would
require large changes in science teaching
methods.
Appendix E-4

No Items SA A DA SDA
21 Only the computer studies teacher should use
computers regularly in his teaching.
22 Teaching science with the aid of computers
would make teaching easier for all of the pupils.
23 Using computers in science classrooms could
weaken the teacher's control of the students.
24 A teacher of computer studies is not the best
person to train science teachers to use
computers.
25 Science teaching is better without the use of
computers.
26 I would be willing for an expert from outside
school to train me to use computers.
27 I almost never think about using a computer
in my teaching.
28 Teaching science with the aid of computers
would make teaching easier.
29 Computers can enhance the learning of pupils
in every science subject.
30 Computers will improve science pupils'thinking.
Appendix E-5

PART TWO:
Please respond to the following items by ticking one of the two columns:
True, False or in column DN, if you do not know or you have no idea
about the correct answer.
No Item T F DN
1 Computers can be used as a private tutor.
2 Computers are used to introduce large amounts
of information to pupils.
3 Computers have little application to science
teaching.
4 To use a computer successfully, one needs to
learn how to program.
5 One of the computers' weaknesses is that it is
difficult to change the text when you type by
computer.
6 The use of the PC is unrelated to the needs of
the schools.
7 The Saudi Arabian market has various examples
of English software, but almost nothing in the
Arabic language.
8 Existing commercial software can be used in
science teaching.
Appendix E-6

PAET THREE:
Please tick the appropriate column to indicate the frequency of your
classroom activities in the following items.
* Note that 1/D= almost every day, 1/W, once a week, 1/M, once a
month, 1/T, once a term or more, and N nearly never.
No Items 1/D 11W 1/M 1/T N
1 I allow my students to do experiments by
themselves.
2 I use video in my teaching.
3 I use an overhead projector in my class.
4 I make personal visits to computer centres.
5 I include discussion of TV science programmesin my teaching.
6 I read educational computing articles to look
for teaching ideas.
7 I meet with computer teachers to discuss
computer uses in teaching.
8 I advise my students to follow developments
in technology.
PART FOUR:
Please respond to the following questions:
1- What is your educational job?[] Science teacher [] Science advisor
Appendix E-7

2- What is your teaching subject?
1] Physics [l Chemistry[] Biology [1 Geology[] Others (specify please) •••
3- What is your qualification?
r] MEd [] MSc [] BSE [] BSc[] Others (specify please) ...
4- For how long have you been teaching?... Year(s).
5- Have you got a personal computer? If yes,
for what do you use it? ...
6- Do you personally have any experience of using computers?
If so,
what kind of experience you have?...
7- Have you been on any courses in computers? If yes, give some
details
When? ... Where? ... Who ran it?... How many days was it? ... What was it
about? ...
8- Have you been on any courses related to the use of computers in
teaching? If yes, Who ran it? ... When were these courses held? ...
How many teachers attended them (approximately)? ...
Any comments or suggestions
* Would you kindly make sure that you have responded to all items
Thank you for your kind help
Yours
I Al-Mohaissin
Madinah, P.O.Box 25040
Name (optional) , School
Appendix E-8

re.-,-y.11 4).4...-).11 4-U1 14.446.1
r ji,J1 r.L.-. VI
.1....,.." 4 1.C.A., 4111 :i......, jj c..‹..„1.c (......J1
J 6:- 3 1 4:-,..1<-41 LS-LA c, IL:-,,...11 Ji l,:,' Z... 1) 3 6... Ay.- ZA.,:-.Y ..:LA
J1 Sd....JI L53 :t.!,:,1.!..1 I .i.6-.7.1J p.L.JI Ly-..!).3,1 (.5_9
• 3j.m.,,.J 1
Jili c...t..;,:.....:; L....9i., ‘t.-_,..1.11 11.,b eui, . t,.,,,,J1 Ile, Jp- r.(6)6
• LL....)1.1... L.53 .).:;,...1 rw,..,....1., c j1JI L,.....L).1.3 j.,,ILd c..1.7:3LC
Lit-,2 jj :y.i.....). t.:-..2_;..:1 14.! Ja-L.-- - La Lit-lan --I u_:_11 c.AW..:_11
Zi .-.:2- le .7.-4j u::-I 1 :y 6.-)l l9 c Z,,....,...0 ji 411, U- Z4,.-1 !R.I.& Q.-)
41_, ty.,..,. c_s_zil :y6.-)1 .6.1•9 ,:,:S. i 6.L.ii c5.. ‘ 6.1..il . ;..yi...JI ;*y 6.-)1 1 (.5_4)
. Li.a l;J 1
_r„i,-t ,....3,...., j .Z1.....:.....%/1 c.,14 L..,...,.- L5IA Z. 6.-)1 1 A l..,.-.).11
,:,...._, rs..1 1.7C L':, ../1 ‘ i 1 V/ / c.,?. L53 4111 tl..::, 01 Ls.1.:-. lf.±-,-
. LI,.
; ,J I ;..<.I,J 1,
0.......,,,...1 I &LH .1-: L•j. i,.._& U.,1
:1_.-1 I Z...-13 - /.;?..;.•...11 A.:.G Li.11...J I ;k....A l.,.- Lyi / ;J I :t_:,, ..1„....1 I
.(..:1) Yo• E . trEt ,.,..hLfe.
( , )

..0.La IL
C.)1 j iakil (.5-9 6.21) ri.Z51.4J I l.;.J I Ls.:0 ) ,2-11.;23
I:J I
al, Li- 01
'I I)1..' I I L3-i1, 1 L.-4—iiii1...... Lz,
.
; j LsJ I 1;9) I
L:K.I I Z.,...A 1.5 I I L.41...,.J I :t.r...ib 1L:..., p...,1 r....1..1. ;;K.I.)........:z••••••••• I. .y...).)...J I
ri..-...1 I j j z L:r. r„..6..11‘)...,_,...0 ,...,... .);).„..,....Q I 4.16*- .51 J11! _Li - Y
• • 6 • • • • • • • • • • I pi,J,
t.i.:J I 1 ..i...40-4.1-11 cy,...; Jo cr. ri..6J .; r........(1Ls:. j' j.
• . • • • .. . 4„..m,
t.,,i Jil.:,.Lsi, ,.-,,,<J1 4_,..., e ,A...:....., 4 ..UI 4:.•.,i.11 Lsi i til2:1 L5.4 -
• • • • • • .0 • • . , . p.L..II Lf...?..)..z vi
,...1p JJ:d 4 ..,5_,..„:„....ii I i.ii li r*L.A.t...).u.:,1 c".1.1 I u.....L. :t's, tit:, L! -
• • • • 44, I Z.,.. L.k............) 7t.,- 6,...1 I
Li, ) 1 ..t....I
I .
J-4- I 3 j.;,..,•:....‹.1 I c I Lrls. r„.1.,JIv...L. ,....,,,.; —. • ,....,64,...11 (.53 r+:.!..).0 L:e j....a.91
.,:51‹.1...J1 c.j., ulpe.j ..11J1Oi le L5.:„..........; uip ),........._<J1 Ap L....r., -
• • • pLJI ‘,....!) -0 ,i khl...t.;,::...) .us. it....51L.L11 L.4 •LJ
-13 J4---!. -6 .,5,-...-:-•--(11 "c' t---•-: piki I 0--:.) -0-
• . .. . ..... laii z.:,„„aj 1
. . .4-A.:_!6.,...21, L:rA ).-Si r".L.J1 cr.! J.X5 Lc:9 .,Iy.:—......‹J I c 1 1.;•:-..., I c..A.„....1, - 1 •
.)1)1 11 j.*;:.1.4.Q I j...:JUi cro jta<11 ‘. j.% .)1 pifti I rk,..• LsiA - 1 1
. . ri.LJI
,:..1bl,...51 ,:).4 ri1,11 Lr.,- Ls; )).r ..‹.11 cl.t.:-..1 „id! ,./1 n
.... r,LJ 1 .5....:, 2,...,.4J I 1,-.)k.-J I
...L,-., it.:J I 1 p.611;,..4.,- 1 r I a;..--.1 ,:j.. .t.:_11—t °J .1.1 -1 iavi . .;,„.�J...... 1213 6:„..:•;,:c....- J I
4
(f)

'• L.- 5_!
I rIA.A —
Lr Ls; 4ALL i5J I.LC) —10
•• • • ••• • ••• •• • • • •• • • • r I
• . 41...J1<5 ksil‹; p.LJI —11
• • • • • • • • • • • • • • • • • • • • • • • •
j iIçftt elj>11
•• •...... • • •.....p.1.11
cAL,-rh cy's
• • • • • ** • • • a • • 1....45k.-J1 (s_U
L,s29 Lsi ./5J1 Y
pIJ Lr-1)-3-;
v.; — Y1
• • • • • • • • • • • • • • • • • • • • • •
J5 )-.—. :4—Q 1
4.---J1 -kn.; r,io —rr
• • • • • • • • • • • • • • • 1...-45L-IJ
piAJI piou ‘7.).) .1! 042—;T—L% —r
• 0 • • • • . .
• —Y0
LiL.1 —
• • • • • • • • • • .
• ç,Is.JI Lys...! ja; Ls.1L — Yv
S. . I I I Jt ç,.L1J I J .A3 —
)1,A
• • • • • • • • pi,J I
Ls; —r.
• • • • • • • • • • • • • •• • • • • • *** • • • • • • • •
I• • • • • • • • • • • • •
(r)

: §n:.1
csi ( ) 4.45kA :L:rn:.-1
;L:6.-)/ 1 4,6 1..)1 61 *.L1;‘11 Ls.; ji
,
WIo j .r3)1
• • • • •• . .. . Lro)....2,7- L.,...).L.s* ,7,_„..„.s.11 (1.L.;,_-......1 cis...4,, -,
• • • • • • • 4._...1:11 c.,1.4.)1...JI c:r. j Xi .711 r...,...ial .-, j..r..4..(11 e_G,-......,! -Y
• • • • • • • 3., .t..... r,.1.._11 ‘,....).).12; L.629 :,.._.......‹...11 c..)ri*,1,-, -r
. ,-,-;-•_7:5 ‘..;01.-5 . L .J.7.3 Z)I E L:.,; 4c1...:..! j.;it.t....(11(6.G.,_:_...J- -i
.. . • c...12,..1,i. t....,_12..JI 0.2.:JI Ls3 ..„_..,....;,..-LII ;tip-, ..,.; ..,_.„?....‹.11 ,:..,,_...._a L.74 - 0
-.L:..4-_:, -1.71)........1 L....a
...... . • .. . . . Ly, JI.x.il
.;•,,....1..�J1 L_..1.).): t.5.. 7......:‹11 ;,..1.,,.....11 3l. ..A1 Lsi ..1-r Jo_ -v
• •• • • ... • • 11-..-:i-0 Ls.)-i- 1 61 -. 6.v:i%111'-'.-i J-1-L.,. 6-(-J
L5:9 ( Li 1„...1)/ L! ; 3,..7.,...J I ) L..) 1...,.,7J I .).5)__.....‹..1 Ic..A1..)..> f l ..L..;.:-.. I L:r..‹,..., - A
:
C.A.)-n 3 it. .43-1.11 1;ei I ) Z•51L0
*.L...) c.,1 j i.:,„11 (51
c.s-;1•:•!.;4,- =4N 31=
) 1 Lk;,.A =L:Th AL. js ; = tith
=k7)
LS/ L2.1I 7') L:-I1/
• . • • • • • • .1.4-jai. , tsi LJ I ç - Y
, J -4;11 cs. 3 j..11 u.SLJI -r
(I)

_
Y `-.9 1 LA/ I Um/ I (SPA '0')L,J1 ri )1
5-17.-J c:li tir! pil -tLi--, j a.1 Lri 6 .70 -00 I:L...41.A -.Lt..i1.y..).adl Lri ( j,k7,6 u.:J• c.1.7)1
. . ..... . .
) 1,..,*-1 Z
H ji. Liti 6.12-p -V
,-,-1 -A
. [ t r.„6 [ (.5.7,11 JA, -1
r4 1.1 ;yL;.-)11
c-LLC 1'4 . [ ] [ ] .L.53 .;)3 3 tjA -V
:1LJI k1 tr.,6
c-LIC Tt+.12:.
L•IA
(.)

I'Ly.,!).x:J1 Ls-9 .7", I 1.! ;.).33 - A
1".)0[]4r,..,[]3.3s. rs-
JiJU I..4.411.-ns**-,IssIssississit—Ississ1:41:****41:.*.31:4:31:4;*-31:31:41silsils**.*
-11;;I: 41; * 4IS =AS
.4 1 t:LIJ ii elk :Lai. 'r11 Le:i
01.4% p.1,1 I Lf.,?. j Ly's j_...„_‹J I I
j.).1A1
,L1Li
LS L 1 4111 .
I r.„..A 1.7;1 i
I I
Voit . r t
1-.)1]

II: COMPUTER STUDIES TEACHERS' QUESTIONNAIRE
Dear Computer Studies Teacher,
This questionnaire is part of a study investigating the possibility of
introducing computers into science teaching in Saudi Arabia Secondary
Education.
In view of the important role that computer studies teacher play, we
need to know about their ideas and views relating to this matter. The
conclusion of the survey recommends improvements and computerization
of science teaching in our schools.
All information you give will be held by me personally, in confidence,
and it will not be shown to any other person. You are free to write your
name or not as you wish.
For the purpose of this survey there are no wrong or right answers.
Your personal honest opinion is the only required response. Please put
down what you really feel and complete all of the questionnaire so you
can give it to me when I come to collect it from you on / /1992.
Thank you in advance..
The researcher
Ibrahim Al-Mohaissin,
College of Education,
Department of Curriculum and Instruction
Madinah, POBox 344, 25040 (personal).
Appendix E-9

PART ONE:
Please tick the appropriate colum to indicate your personal view of
the following items.
* Remember there is no right or wrong response.
No Items SA A DA SDA
1 Teaching science with the aid of computers
will make science teaching easier.
2 There are not enough computers in the
schools to be used for science teachers'
training.
3 The only person who should control school
computers is the computer studies teacher.
4 The use of computers in science teaching
should be made compulsory immediately.
5 The computer studies teacher should meet
with his science colleague(s) to discuss
teaching ideas.
6 If I am to train my science colleagues in
my school, then I need at least a year to do
so.
7 If computers were introduced into science
teaching, then problems would arise as a
result.
8 It will be easy for me to train science
teachers to use databases.
9 I would like my science colleagues to tell
me about science teaching methods.
Appendix E-10

No Items SA A DA SDA
10 It is possible for science teachers to be
trained to use computers by their computer
studies colleagues.
11 Science teaching is better without the use
of computers.
12 I think computer studies teachers are
teaching well, so there is no need to train
them how to teach.
13 Science teachers are not capable of being
trained to use computers.
14 A computer studies teacher does not need to
be trained in teaching if he has enough
knowledge of his subject.
15 I don't think that science teachers would
like me to train them to use computers.
-
16 The computer studies teacher is the only
person who should use computers in his
teaching.
17 Even if science teachers are trained to use
computers, they will not be able to introduce
pupils to computer applications.
18 Computers will decrease the amount of
teacher-pupil interaction in the classroom.
19 The only subject which should use computers
is computer studies.
20 I would be willing to train my science teacher
colleague to use a computer in his teaching.
Appendix E-11

No Items SA A DA SDA
21 Students do not like any person to train
them to use computers except the computer
studies teacher.
22 I think it is enough for pupils to study
computer studies courses.
23 I would be willing to allow my science teaching
colleagues to use the computers.
24 There is no need to train a computer studies
teacher to teach because he can get the
experience in the classroom.
25 It would be easy for me to train science
teachers to use spreadsheets.
PART TWO:
Please respond to the following 5 questions:
1- What subject did you
study?
H Computer engineering
H Computer science H Others (specify please) •••
II Computer and education
2- What is your qualification?
[] MEd
[] MSc H BSE H BE
I) BSc H Others (mention please) ...
3- Do you have an Education Diploma? H Yes H No
4- For how long have you been teaching?... Year(s).
Appendix E-12

5- Have you trained in the use of:
a) Databases [] Yes [] No b) Spreadsheets [] Yes [] Noc) Wordprocessors [] Yes [] No e) Computer networks [] Yes [] No
6- Do you have a personal computer? If yes,
for what do you use it? ...
7- Have you been to any courses in teaching? If yes, give somedetails
When? ... Where? ... Who ran them? ... For how many days did the courselast? ... What was it about? ...
8- Have you been to any courses related to the use of computers in
teaching?
If yes, who ran them? ... When were these courses held? ... How many
teachers attended them (approximately)? ...***********************************************************
Any comments or suggestions
* Would you kindly make sure that you have responded to all items
Thank you for your kind help
Yours
I Al-Mohaissin
Madinah, P.O.Box 25040
Name (optional) , School
Appendix E-13

zp4.0-).11 iLi
rixA
ji
")1 1(41 'Lk CJA Laj Ci" . 1.:7> 1.6 o JA
Z<L,11 Ls.9
Z.2 I
L:9 c!d:::n., • I 1113 J
. çbp.1,110_1).1.3
LILL!. tj-1 9 14-)az 4.7.11 u.,1 I
j..C; ç.i r.6 . (,ct
14-! L5.-J1 ji Zt66:- LILA
6.!. 1) ts:J. ;y1...1-)il L:r. diLIJ . LTA,
LyoUJI
r‹.11.).5 _eb1E1Y/ / cs.9 aill
; I ;L(L......1
.111
To. E. r Ljo
( 1 )

: AjggL wiu.
l:JI tsi ‘1,0.71 :6W1 Lci ( j)
. iL t1-I *
,Ic0 1,1
)1ji0
.ail, 1
C.9 iLL - WI
• •• .. .. • _;.;.,_,_,.S.J1 (.1.12,,:-...1 ...up j4,1 p.L.J1 L.,....!).0 -- 1
••• . • li„.. pi•JI rl.,. L7-2j a:-.1* ..L.-a: is" -...;4.,: t 1.,,,..),,J1 ts's .1_,.-.y. V - Y
• •• • c..,---.)-LJI .);_9-...-:---(11 Ls-i Li-i--e-..2. ,:31.):;,..:-:-.<-11 4-4 ..7:-;LI 3----2. v -r . („..,,..0 cs9 ..,:;,..,.....‹.11 cl.L.;,-..-.1 )7.D ,,,:-...1 - i
:ti.`...31.:_ 1 C..31 - 0c_,L....n .L.,...J.......6*:, , ..).s.,...„......<J1 .. ..),..!V
• • • • • • • • • • • • • •• • •• • •• • •• • • • • •• • .4.-..--!)-0 J1-(.91pi,J1 Lra*, ,r,„.) ,x; L.y. cf(...31 ,y.0. 1 L.c.t ..a4t.c a, ,11 L.-.,i .-1
• • • • ..,.-,,..‹.11 ç1 „La .z..).%.4.11 L5:9
. . c,i,11 u....„.6. uze .73..�.11 N.; -....,1 ISI J.CLf.....JI , j,:7_,...! Aia:; ai -v
_AA); rI.G.:-.1 Lsi.p pi,J1 u.....1..... ‘,....L,..o (....5.9 ;yi.A.s.a• .L.,.-1 L:7.1 -A
• • •• • O .... • ...... . • c...A...,.L.L.J1 .
Z12.45,.! .):;)_...‹JI r)...G,-....,1 0.IA cii..11 4,i. ,.,,,, J .13 (.7(4,11 cf. -1 .
• • • • • • • ........).,-.--...�-11 1/1" 444:)
• • • • • • • • 0 • )."_.....„...<J1 el.L ;,7,1 4:.)i -y p..L...11 ,./..!. j ...o Li..,,i'Ai l cr. - 11
(s) V a.0 4 .L.,...,.- j..(::....! ri.......e.,..0 ..1.)t..., j5.5,_:„....CJI li.,1.... cia.' ?.-1Y
•• • • •• • •• • Lr..f. j .t.:J. I Lcia i,.4.,!...).1:J. &-I..,-
• ••• . •. • ..).3 .."......„...�.11 cl..L.4,-,1 (51c. L...;;A:JJ c.1_! 1:9 ..,..: 21,11 rULA -1r
a..., (..)LC q:_n LsiA ,?) .x.-„, (DI .77,„SJI 4... c L..,_,. V — 1 t
• • • • • • ...... • 4.....,..A..;•.:; Lci :t.....29 Ls" c., 6_,L.•
• • •• • •.#3,_,,....Q1 (sip y) .11 ot (.5.9 L r k)..2 pi,Jy...,4 ()I 41:...1 V - ‘ 0
csi .;,- ..,-,...<J1 (I.G,..:„.....1 01,...• ,.) .9 . 0.1_,-3),-,._<J1 ri.,1 c,...,... -11
(y)

Y
L3-;13 i L0 13 1 L.--i131L., tz Z,..)1-:•*-n
- \ Vc1.G..--,1 uis- p..LJI ri.... ,.?).z . J ., C.s-:->
• • • • • • • • • • • • • I `:-' LL- -1-::-4 -1. I.1:".9-:.-:-4-1-1 L-11.7.:" L
4:r:....1. . j.c.LILl I t...r. p.I....11 ;La,-L.520 .):.;),........(JI(.1.1.;.:......I J.11..,' .. c....9,-.4 — 1 A
• • • •• • •• •• • . •• • • O • • " ' • • plx-fi it-L.-4i .4-4.-Li I
;A. L5.11 lf_.:9.;_,,-.......‹.11 cl.i ;,:......1 ‘,...›.-...). cs:J. I ;..L.....,-).II 'i,l.J1 -1'1
n • • • 1 j I. 7 .).'; : .4�
fl ..G.;_.... .1 Z.2.1...,_S Lrlp p.I.,11 rl...... 0.1.;_.:) ,....-2.j..e.J. I..L.:......,1 0.1 L.5..:,1 - Y i
• . • . . ...... 0 . . . ........
L51G. rir.„) ..LJ .,5_,..,,..�.1I 4,.. .._ 1.1,1 (.)J.A..2..).2. 1.-. .5k:J I - Y1
);_,.......?...‹J I
• . ...... ..),.........(JI L ..ra .)1).. ..L..._....-JIu.-?..)...o .61 '..t..i.:...c.. i - YY
Lr-LP.ujt-: rL...-.0 ...i-:.-;:c u-i-P ..;;.)-:—...-QI 4.-. L...e..)-0 C74 Z-'.- 6.- bl - t
c..iiJI jj}.. L_.. ;.7:..>J1 cak ,.,........:�...-,.. ,L:,
..:..,1..,..i....:2JI fl..G.:....... I Lrls. p.I.,JI ri,. ‘,....2.„..c., Lsi :u.j.,,,,, .a...-.4 L.J.1 - Y 0
• (r 4 Y 4 \ 0..Z .,.1 LP:Al C.L:..j.).:_<PNJI j j I ..1-,.J I) J,
Ut_..411
• • P-1-A
-
? Ls..1.1 Ls-it - Y
4.53 -E • P-6-11 • 7%- 7-11 Lsi I
-4' • p-6-11 .ZJI C. Lis-r I
( - j• ‘11 [ • rZ cs-.9 J-t° -1°
-
(r)

:r1,.G.L..,1 Lsip c..,..) ..0 3A -0
.%1[ ] 4r.4 ] ?c..)1.4,.1,...J1 as.1):9* -I
•1 ] 4 r4 ] i'zi j.b.,..il c...,6„a_.a.11 -,...)
• %/[ ] 4 r-4 ] ?.;,..,-:.-:-.�-11 cd t.-<-:-• --
, r-:, :1-'. 6.- 1 c-' ...-d-C IS! • q i 4 r":' [ ] C .LF.42- " :1 -;;.,17:'S ‘11.1 jj jib
:U. 6.-)11c".....:d.C. I) 4 Ni[ ] 4 i,4 ] L.,,,,...L:J1 .4.-.6 -0. ..)_9 3 -4...21 Jj..sb —v
,-...,UL.......J1u.A.J..12.c.14c,...:,
CfP ?145..x.., ,:.....AC 1.,S i'1.4.4.6.:) cy. i ' ,...r!. 1 i' Ls:A
i)c.....A.0 IA.
?0......, jx:J1 um; .).3.,.............‹.J1 (1.1..;.:.....L. Zi5tp 4.1 ;_).p Z:I I c,.7...;., Jib -A
1*.)1, . q ] ‘i,.4 ]
ja....11.,.........:;.9.1 (:)..2 1 ? 4.16 cra
* * 41;
3-"" cA.,- I.i.5 I 41 :t.! L-:�1 Z,..:::-..2J I 0i Z...ii-; J1 4r.1,..JI Li..,•-1
123."-•'..9 c pia., I Lrlt j X; Ls..9 ., Le, ) 1 .1-4J I .L.5:9 .73,-:...:..S., 1 f I .1,..., L.:
o :lib ;1...: US- ..t.:_p ..) :s.%1 1 L:r.,_p (.53 C..%) 6- Ly:SD a iltb
. u..1 66 klil xl.t, (DI :L>-.)1All
c...1".i.'s _.:,,.- 0..1c.,..,.-1,,..1*.j ce 1.,..?„,,.. c.J..1.1.3 ,tA *
.,t1-....3., L..,... 1 II& 0_,,.-,. ulp 1.7:_,:- ,JJI !.31;.,.- *
L•j_....._.,,11 r.._041.).,1 /L3_>-1
'o. t,
it‘L..-:.9-1 1n i,-.•11
..... iz....).L.,11
(i)

III: SCIENCE TEACHER TRAINERS' QUESTIONNAIRE
Dear Science Trainer,
This questionnaire is part of a study investigating the possibility of
introducing computers into science teaching in Saudi Arabia Secondary
Education.
In view of the important role that science trainers play, we need to
know about their ideas and views relating to this matter. The conclusion
of the survey recommends improvements and the use of computers in
science teaching in our schools.
All information you give will be held by me personally, in confidence,
and it will not be shown to any other person. You are free to write your
name or not, as you wish.
As you know, there are no wrong or right answers. Your personal
honest opinion is the only required response. Please put down what you
really feel and complete all of the questionnaire so you can give it to me
when I come to collect it from you on / /1992.
Thank you in advance..
The researcher
Ibrahim Al-Mohaissin,
College of Education,
Department of Curriculum and Instruction
Madinah, POBox 344, 25040 (personal).
Appendix E-14

PAET ONE:
Please tick the appropriate column to indicate your personal view of
the following items.
* Remember there is no right or wrong response.
No Items SA A DA SDA
1 Computers are as important to science
students as text books in the classroom.
2 If I had the facilities, I would train my
students to use computers.
3 A computer training programme should be
compulsory for every science teacher trainer.
4 Computers will decrease the amount ofteacher-pupil interaction in the science
classroom.
5 I look forward to a time when computers are
more widely used in science teaching.
6 A science teacher trainer has no time to be
trained to use computers.
7 Computers will improve science pupils'
problem-solving skills.
8 Computers bring more disadvantages than
advantages to science teaching.
9 Science teachers must know a great deal
about computers if they want to use them in
science teaching.
Appendix E-15

No Items SA A DA SDA
10 Using computers in the science classroom willnot improve students' positive attitudes
towards the sciences.
11 Science teacher trainers could be trained to
use a computer by the schools' computer
studies teacher.
12 Computers will improve science pupils' abi-
litie s.
13 There is no benefit from the use of computers
in science teaching commensurate with their
cost.
14 Even if a science teacher knows how to use
a computer for personal home use, he will still
require to . be taught how to use it in the
science classroom.
15 Science trainers should be aware of devel-
opments of using computers in science
teaching.
16 Computers will increase the amount of anxiety
students experience in the science classroom.
17 The use of computers would require large
changes in teaching methods in science.
18 Science teachers should have INSET in the
use of computers in their teaching.
19 I would like the school computer studies
teacher to train me to use a computer in my
teaching.
Appendix E-16

No Items SA A DA
SDA
20 Science teaching is better without the use of
computers.
21 Science teachers' training programmes should
include training in the use of computers in
science teaching.
22 I will benefit from training in the use of
computers in my own teaching.
23 Computers can enhance the learning of pupils
in every science subject.
24 Computers will improve science students'thinking.
PART TWO:
Please respond to the following items by ticking one of the two
columns: True, False or in the column DN, if you do not know or you
have no idea about the correct answer.
Appendix E-17

No Item T F DN
1 Computers can be used as a private tutor.
2 Computers are used to introduce large amounts
of information to pupils.
3 Computers have little applications to science
teaching.
4 To use a computer successfully, one needs to
learn how to program.
5 One of the computers' weaknesses is that it is
difficult to change the text when you type by
computer.
6 The use of the PC is unrelated to the needs of
the schools.
7 The Saudi Arabian market has various examples
of English software, but almost nothing in the
Arabic language.
8 Existing commercial software can be used in
science teaching.
PART THREE:
Please respond to the following questions:
Appendix E-18

1- Name (optional) , College
2- What is your subject? ...
3- What is your academic position?
4- For how long have you been a trainer?... Year(s).
5- Have read research or articles about:
a) use of databases in teaching? [] Yes [] No
b) use of spreadsheets in teaching? [] Yes [] No
c) use of wordprocessors in teaching? [] Yes [1 No
6- Have you got a personal computer? If yes,
For what do you use it? ...
7- Do you personally have any experience of using computers?
If so,what kind of experience do you have?...
8- Have you been to any courses related to the use of computers in
teaching?
If yes, who ran them? ... Where were these courses held? ... How many
trainers attended them (approximately)? ...
9- Have you written any article or conducted research about com-
puters? If yes, was it theoretical or experimental? What was the title?
Any comments or suggestions
Thank you for your kind help
Yours
I Al-Mohais sin
Madinah, P.O.Box 25040
Appendix E-19

cow.. Pwii 1 4.11 I c,..41
ç,JJI L4
$ThJ4-01 "L"-.).3
;Kt....)I (5:9 Z.L,LL4.1 (si
cis ty,..:29 (.."1,11
L L9',Lac?' I I i..03
l -Lb eb.71;:,
.LJ4 Lsi .7; p1...11 c1.7.:;LC
L-112e. L5-1 9 If: -La 1 .43-42-"6 ci-J 1 C.dULL-JI
LAI .,111.) ea.c 0.47.;,-1; Ler:I
3iL IJI 0.3,16
Wc..40 j ;ill, L.T 6:1 aLIT, 4,6
Lr:_11 Iti; L.6.-)!i Let 14,
r<1 iJ LL' -SO t YI / p L5:9 411 LA 44-L%-,a1
ta
;Kt.-IL!
4.1.J1 1.7;1
,LJ-Lil j.i
Yo. E . crit
(1)

:.kiggi
sz.,1 ) 1,..J1 (si 41) 2......:sYL.J1 :t.:, WI Lsi ( J)
::1_,J ld I
.i.C..1.; *,
,v.
3 1 (3-iI3 1t` (3-9 5 I L-..t.:,. i, j l:..J1 r-9.71 I
,
‘....)1;...‹J I t..0 I...r....k. p_.J. r
•••••••••• . ..
c...,L L1 ;)43..,,-) c.,1-.4 -Y(_,:,u, .I.J tyl .,..I
••••••• • • r4---:.)-0 .L.s-.9 .7.; ...,-1
L_.......J 1....,41)..11 j:;.,-,S,11 cla;-_--,1 LAG ,...:) -eil .3.,.0 (DI ui,.:,.. -r
• • • • P-6-'1 r" v-'9J-::-.,
..,..,...,., -i.L.,:. ..;,. ....9-,.....<J1 ri...,..;,.....,1
•••• •• . ... rt......_11, .k....„..i.d1
• • . ...... . • .. • pl„_11 L.,....,,..0 0_1
el..L.1 J..c. , :,..k.:_u c.:...;, pii.J I ri..... ,....)L5JJ Lr.....J. -1
...,k.(1 J.,-- u_l ;.) .C2J1 ;) te 0.........-,Z L.,J. _73,_,..,4KJI ..t.pl..,!. -V
• . . . . .p1,11 0....!..)..0 Lc; ,-41.1...;.:_...,1 .1..:_p .1......45k:_11 L5-1..1
• • 4.51......! 1,7_,A .• I.:Ct pi•JI u......L.,a5 (.5:9 j.:;,..1 rI.G.:-... ' I k...-..A.z.1... -A
t:it 1.) I 1 ..)1 .):;.,trt....<11 Li_:..,:; cjp 7:-....<11 L.9."). (DI P'- ri., ui• — '‘
• ••• •• ••• •• • • plA,J1 L.7-2J -1,5 c5.9. 4-4 -Li.,.-......-2
f1a.;,;:-.1 rIL.....f. --,.
• • • ••• ••• • • pl...11 ,.,r.:, ;L:-,.-)..J I 1,-.*J I c..., LA l.,...; I
(5-.9.7-=-4 ‘7..)-1:-.1 1."-°A. 0 1 0,..)1-L-11 (5-.9 .71.,-...--.-(li Ls-.1.---1 0.‹..-!. - t \
4..1,..G.:-.....1 .L..-.. 5k:J.1Lx.,:).)..1.; L59 ..x.:_p
• c ji,J I
. . 41.-1, Li; puil.<3 '11 (.31,11 Ly.,,..)..0 L53 j.3.,_-...1.11ci.A.;.:-•.,1 Zlii -11"
—
(y)

R
10
)I
COO
.1 I
(-11".
3..,i15i
U trnz;;:JLII 9.)1JL
Li.1. 4 .),-....,<J1 r1.1.;.::,..1 p_UJI i,J.... L1iz:-.1 iJ L5_-_, - 1 t
. . .p.1...11 0...,t) .0 (1.9 4A1..L.;c::_.1 LTLA ‘,.;:).1:J1 (3.11 E L...,_2. JI:)...! '1 4.:13
L.9.74,4 CA k7-_,:7•• — 1 .2ri.1,11 r..4„,_.LI%
. p.L.J1 Lr....t_pz .(424
- ‘13.1111 c..,l,- cy. f.y.6,11 Lt.,i.) .1.3 Lsi j . 3 j-:-....SJI (D I ..Gr.: -
• • 1.-. 45L1* i Ls-d
vi.,.- 1. .....;6 p.l,11 :i.42,- LF 's .).1.,.....(J1cl..G...-._..1 (.5L.X:...*.a. .1.9 -W
cl..G.:....-..1 Lsic. Li......J1Lel j Lyls. L:r.,..LII ri1JI Lc-a,. .,....?..)..o ,.......,I -1A
1 41: A Li 6,4.! Ii I k.::j XJ1 — 1 `‘./:),-..r1.4�..1 .;',.,...‹..i -Gr:.,,tvy. c (.5.1 Lj....91
• • • • O Ls,. j J...J I
• . ).3.,_..........�.J1 cl.G...-.....1 Cii .x.: riJ,J1 t).-.1) ..0 Li....:Al cy, -1' •
f I .1..; .....-...,1 LsJ. ,..„7_,..).:11 ril,..11 (.5.4.1.... .0apl c)......a2. (14 ,..,......e. -Y1
pLJ I.).-).,...,..4.) I
,...:).L.:JI (Dt -YYcla..;.:-....1 oda .t
- Yr
• • • • •• • • • r,Lx11
v.; 1 fl..G..--.1 .x.:_a J.,.;3t ..i.:A5k:JI
• • • • r."-LLII Ly--2.)-0
: .4nIgLit it .ogisti. L
'...,..r.r.:.:W;JI .1...,-1 c ji ( V) :+...k.A .......; ..,..., :1....,1J. I c...,1_,L,,J1
"ii.i 6.-)1 1 riz 'I ,..._..LC 1 ..) 1 - .4.pt NJ :ZUJI L45-.9 31 c_..r,r....0 _,..- c cl-,. r-.4=0
.J16.,....J1 cfp at..i.1.,. t!.1.2 .L1 u........1 it
(r)

ljF
P---`c...._.......0
3.......,,, -11 i,_"9) I
4
-1v.....0)....o_i- Lx ....0 .7"_:„...._<J1 (.1........,1 L:r‹,..!
• • . . . ..1.:-..J-11 cA.,1.,.....I1 cf• _,X9' .711 1...!x.L.J. .).:;)_.1......CJI r.u,-...e.
-Y
. ........ • . •. • • 0o..9.1,,... p.1,J1c".....L,..o Lsi ..7;_,....„:......Q I -,....,Lit....12:; -r
• •• • . c.A.7::; L.:41S. (3.,....5 CA cl-...,c; 4cL,.,:.. ! .7:;)_:.......<J1 ra.; .............:J - t
• • • 412....,Iy. L.,)-2.-....11 LI42.J) (.5.1 .7....:13c...1. I Zu...., ..):;)._?..‹JI ,..7.,..91...p cf. - o
c.1._ c..)i t7..-.7).Lo Liz u.......;.4J1 .;_,,—..,<J n Lii.:_;.! —1
• • • •
Ze..3,...,..J1 L '.9 9..,I .1-_,.:1 -vL5:4
• ••••• • •• :,.-..-&)-P (Sf-'11 "i-'.--9 ) .-L.. . L.)-(-1 4;t:).)-:.— I
Ls:9 (C,I.L.! eift.-.).0_11) .t.y.)6.,-di;1.."..,...S.11 E-41 j. el..1.:--a- ) (•;<.4:1 -A
• • •• • • • • .. • . pid I
-
:"4'.....J_CJ I
:11-1.11...ohal. C.
:JUJI a‘-.41 1 L-tr--,:- &c. L7---.- 1 clii -X4 C7°
:(L.5)1.....-1)r,411 -1
-Y
:Z.......L.11;i.-j.d1 -r
:;11 c..,1,:...,, o..tp -t
( ) ( ) i'pl..JI ti-7,..p.:; csi C.)1,4.'1044-11 -1A.,..9. fl-GW.41 -1
( ) ( ) jil-L>eil) Zij-L?t.a-11C.A -IL.2.11 c1.141 -L?
?P-6-/ I cr':!-)Z. L4-.3 (4:2)) -.7.:�n1
( ) ( ) i'Lre. _pi:J*1 (5:9 c-A-4-1-<-11 L3—...L• (.1..G.-... il -c
4.-LI j-A -1
4r•-$42-!:k.il,.-1c...*.:AC I:51
v4. jj Li..11 ;.,....;JI L.,:,6 c r.-L.., z..;L..-)ri c.....:,l5- Ill
(1)

?,..1-1) -1-:-11 ts.; ..).:;)...m......<-1 I f l .1._;.:-.4; Z.95LP L4) 'i jj z 74...). tc...,...,:,_.,- 1 _IA - A
: q c...A.0 Ill
i'c-,...:91 L.7:. 1 c,143.41:, cf•
.11..! LA j..,....:2,- 67,...1J1
1.. i't....,1 ri 1.,..„.6.:, (DT JA 4 rx.:-! 4..). 6.-4,11 1 c...*...LC N
0.-**-1r: -*-g: -;!: * it: -11,: V: *O. -*V* if:* ;IS CI *** SIV;I: **SI:* C. ;Ss *
:4s***-11;
c-, 1,-L I L..0 ;Ls. 1.-:3Z_! ;_.,..i.....J I 0 ..i_ft, ;L,i..! c.);.:-... I “....., J.:1...J I Ls_,:- t
t_15,.4 j 4 c,..L.JI L,..__, j .1.; (51 .73)...--. . ._<_1 I rl -1-.;...z., L. Lit.:::;
. (51 LZ all I A Lf:, .)1 :i.,- i j.IA I 0 .1,23 ;Li US' ..u. j l::p 'V I L:r:50. ,::A,- 1..7i'D
...;-:, lr::_.#71 I c-, 1-9-L--..... ...,..-
• 41.-.2ii ,..)-0 s.)...) I 114 ter-t... Ls-LP 1 j_..,.. .- 4.1J I !.11).,.- a
L.)...-:-.,-.J I r..... bl„..q k..1.,_,L1
Yoiti &tw it L:.).‘„,
(0)

Appendix F: FACTOR ANALYSIS
Corresponding
scale
Item FACTOR 1 FACTOR 2 FACTOR 3 FACTOR 4
EFFECTIVE 1 .54683 * -.21130 .24762 .16539BENEFIT 2 .29730 .28887 .26270 -.12736TRAINING 3 .53597 -.31344 -.08947 .08343VALUE 4 .55910 .03543 -.01851 .18477VALUE 5 .68782 -.13029 -.08603 .13007BENEFIT 6 .57798 .14178 .08756 .21782TRAINING 7 .11763 -.04896 .62287 .12534TRAINING 8 .57516 -.21186 -.05927 .16276BENEFIT 9 .06335 .44526 -.16472 -.04141VALUE 10 .67953 .22798 -.00335 -.07356TRAINING 11 -.22796 .41692 .04293 .55752TRAINING 12 .56939 .37046 -.20664 .01297BENEFIT 13 .49623 .40453 -.11442 .25034TRAINING 14 .13852 -.20351 .68638 .03607TRAINING 15 .40950 -.30009 .18037 -.16170VALUE 16 .40459 .30548 -.26848 -.09809BENEFIT 17 .28063 .44494 .16260 -.40031TRAINING 18 -.08045 .43464 -.19075 .48731TRAINING 19 .44074 .38908 .02454 -.27217VALUE 20 -.14517 .41013 .07152 -.02893TRAINING 21 .32039 .19917 .08532 -.42224BENEFIT 22 .59251 -.18872 -.09080 -.07421BENEFIT 23 .41374 .41390 .06198 -.21583TRAINING 24 -.10077 .28059 .46635 -.00522VALUE 25 .72885 .06977 .09472 .05761TRAINING 26 .31085 -.29250 -.39573 -.27551VALUE 27 .50300 .31276 .09714 .09727BENEFIT 28 .68767 -.33048 -.04021 .09535VALUE 29 .67450 -.23848 -.01303 .09020EFFECTIVE 30 .62225 -.29746 -.03413 .04554
Total Items 30 19 4 4 3
Factor pattern matrix for the 30 science teachers questionnaire items
loading in the four factors:
* Bolding shows the highest item-loading
Appendix F-1

Item Complementary alpha
Item Complementary alpha
1 .8736 15 .87832 .8817 16 .87843 .8747 19 .87694 .8729 22 .87255 .8692 25 .86686 .8718 27 .87498 .8733 28 .869010 .8684 29 .869512 .8725 30 .871513 .8745
alpha = 0.8791
Complementary alpha for 19 items of IMPORTANT factor of science teachers'
questionnaire.
Item Complementa Item Complementary
ry alpha alpha
9 .3241 7 .056417 .1590 14 -.171720 .4159 24 .166623 .2868 26 .4246
alpha = .3691 alpha = 0.2080
Item-total correlation for 4 items of Item-total correlation for 4 items ofPROBLEM factor, complementary TRAINING1 factor, complementaryalpha for each item also shown alpha for each item also shown
Item Complementary
alpha
11 -.3674 Item-total correlation for 3 items of TRAINING2 factor18 -.0770 of science teachers' questionnaire, complementary21 .4961 alpha for each item also shown
alpha = 0.0627
Appendix F-2

Appendix G: INTERVIEW WITH DR\ SAEED AL-MALLAIS
VICE ASSISTANT MINISTER FOR EDUCATIONAL DEVELOPMENT ON 10th
FEB 1992 11.00-11.45 am
Introduction, aims of the interview, etc.
Ql. The introduction of computers in SA secondary education was integrated
with Developmental Secondary Schools (DSS) in 1985. So, what were
your aims?.
Al. In my opinion, education is always changing according to changing
social variables. That means, schools should prepare pupils for what
ever they are facing in their daily life, and this machine became an
important tool in human life. So our duty was to train pupils on
computers, this was the idea. The Ministry felt that it was important
to introduce computer courses to develope computer literacy (both
theory and practice), but not as a teaching aid.
Q2. Why not as a teaching aid?.
A2. First of all, we need to know more about this machine. We could use
it later on to assist teaching, but we are still considering how and
in which subject we can start.
Q3. Are there any practical steps in that direction?.
A3. Yes, we have a committee from the Ministry and some academic specialists
in computers at Universities discusing this matter.
Q4. What about Educationalists?.
Appendix G-1

A4. We here, in the educational development directorate consult with the
educationalists in all activities, whether in the Ministry, in the schools,
or in the educational faculties at the Universities.
Q5. Have you faced any difficulties during the introduction of computers,
and if so, what were they?.
A5. There were some difficulties:
1- First, there was a funding problem, because we were establishing
a new subject. But today we have no fund problem. In fact we are
invited to spend plenty of money on this subject.
2- The most serious problem was lack of teachers. When we introduced
computers we had no computer teachers, so we invited teachers from
outside the country to teach this subject. Most of them had little or
no background in teaching methods.
3- Regarding text books, because we had no previous experience in
teaching this subject, we sought help from specialists at the Uni-
versities. This led to some mistakes. These mistakes will be solved
when we apply the new curriculum starting from next year.
Q6. Would you kindly give us some details about the new curriculum?.
A6. Next year we will stop teaching the current curriculum and replace
it with the new curriculum. It wiU similar to that found in the
developed countries. It will be start where the other stopped. It will
highlight the machine itself and how it can be used.
Q7. Ok. Back to the difficulties. Were there software problems?.
Appendix G-2

A7. We are teaching computer studies, so we have no software problems.
So far, if we use them to aid teaching, we might have problems; that
is, we are expecting some difficulties in that field.
Q8. What about training? I mean teachers' training, did you face difficulties?.
A8. The main problem was the availability of computer teachers. As I said,
we had no computer teachers at the time when we introduced computers
to the schools. We also could not find enthusiastic teachers. But now
this problem has been solved and we have no training problems. I
also do not expect any training problems in the future. We have more
than one source of training. Some educational colleges have already
opened computer departments. We have made some contracts with
computer institutes to include some teaching methods courses. These
will prepare trainees to teach computer studies courses.
Q9. What about those people who are already working with you in the
field, like engineers teaching computers?.
A9. Yes, we conducted some INST programmes in teaching methods. We
also have a training plan for all computer studies teachers.
Q10.Do you have a training policy for other subject teachers in secondary
schools?.
AlO.We have not made any final policy yet. To be exact, the schools are
ahead of us. Some of them are using computers in administration;
plenty of teachers have trained themselves without any help from
us. I do not think that we would have any problem if we wanted to
Appendix G-3

train all of them. We have experience in such a job. For example, we
trained more than 4000 primary school teachers in maths and science
when we introduced math and science into primary education.
Q11.0k. I would like to turn now to the pupils. Have you considered the
validity of the computer for the pupils and their attitudes towards
it?.
A11.Computers have become so important in social life. We are very pleased
that we introduced them to our schools. We have to do that any way.
Q12.That is fine. Can I ask about the future plans? I mean, you teach
computers today as literacy courses. Will you continue to do so or
will there be some change?.
Al2.We introduced computers as computer studies courses, but we might
use them one day to assist teaching. We might teach all subjects
through computers. As you know, some programs are available on the
market. Some pupils and teachers have bought them, and they are
doing well with them. However, we could not do that before a careful
study of its educational validity. We are considering some options,
but we have not come to a final decision. We are very careful, as
this will be a large project and we have first to look at other people's
experience, especially those in the developed countries. We will start
where the other left off.
Q13. What about the machines? You mentioned that you will install computers
sets in secondary schools throughout the Kingdom starting from next
year. Do you have enough machines for each school?.
Appendix G-4

A13.We have no financial difficulty now. We can spend enough money to
buy machines and to construct computer rooms. We can do that in a
couple of months.
Q14. What is the computer room?.
A14.Yes, by the next year we will have a special room designed for
computers in each secondary school.
Q15.A final question. Can I ask about who will choose these machines and
who will decide how they are to be used?.
A15.We have a committee here in the Ministry which also includes some
specialists from the SA Universities. Of course, they will select
machines that suit our purposes, as well as considering other factors,
like, for example, high quality, reasonable price, simplicity to operate
and maintain, etc.
Thank you very much indeed; and I am very pleased to invite you to
give your suggestions and your recommendations related to the
subject.
Yes, we are here in the educational development directorate are looking
for practical studies. There is no doubt that most studies are left
on the shelves. I think that is because they are not closely related
to our real educational problems or they have not provided practical
solutions to the problems. To be more clear, we are going to change
the computer curriculum next year according to one good study which
gives us all possible options.
Appendix G-5

Appendix H:
Correlations: 5
INTER-ITEM CORRELATIONS FOR CSTQ SCALES
9 12 14 24
5
91.0000 .1085 .0037 -.1325 .0883
12.1085 1.0000 .2638 -.1349 .1113
14.0037 .2638 1.0000 .5217** .5615**
24-.1325 -.1349 .5217** 1.0000 .3658.0883 .1113 .5615** .3658 1.0000
1-tailed Signif: * - .01 ** - .001
Item correlation for the scale TRAININGA of the CSTQ
Correlations: 2 3 6 8 10 132
31.0000
.1713.1713 .0032 .3334 .2621 .0579
6 .00321.0000 .3234 .2788 .3988* .1785
8.3234 1.0000 .3056 .1871 .1326
10.3334
.2621.2788 .3056 1.0000 .3925* .4593*
13 .0579.3988* .1871 .3925* 1.0000 .3147
15 .0851.1785 .1326 .4593* .3147 1.0000
16 -.0259.1155 .4760* .1051 .2426 .2673
17 .0555.2473 .1946 .2464 .0248 .3398
20.4735* .3792* .3437 .2542 .0373
21-.0637
.1604.4148* .2759 .1607 .3864* .3541
23.4876** .2697 .4815* .0825 :0653
25.2464 .3124 .0992 .3033 .2964 .3109.0502 .5995** .4200* .5557** .3881* .1953
Correlations: 15
2
16 17 20 21 23 25.0851
3 .1155-.0259 .0555 -.0637 .1604 .2464 .0502
6 .4760*.2473 .4735* .4148* .4876** .3124 .5995**
8 .105110 .2426
.1946
.2464.3792*
.3437.2759
.1607.2697
.4815*.0992
.3033.4200*
.5557**13 .2673
.0248 .2542 .3864* .0825 .2964 .3881*15 1.0000
.3398 .0373 .3541 .0653 .3109 .195316 .3468
.3468
1.0000.1110 .0029 -.0131 .1158 .1040
17 .1110.3262 .0688 .5117** .0286 .3662
20 .0029.3262 1.0000 .2100 .6670** .2305 .5964**
21 -.0131.0688 .2100 1.0000 .0682 .2183 .2039
23 .1158.5117** .6670** .0682 1.0000 .1604 .4945**
25 .1040.0286
.3662.2305 .2183 .1604 1.0000 .3531.5964** .2039 .4945** .3531 1.00001-tailed Signif: * - .01 ** - .001
Item correlation for the scale ST. TRAININGA of the CSTQ
Appendix H-1