Introducing Cheminformatics Academic Library Version
64
Introducing cheminformatics Page 1 of 64 © Copyright David Wild, 2012-2013 Academic Library Version
-
Upload
khangminh22 -
Category
Documents
-
view
5 -
download
0
Transcript of Introducing Cheminformatics Academic Library Version

Introducing cheminformatics Page 1 of 64 © Copyright David Wild, 2012-2013 Academic Library Version

Introducing cheminformatics Page 2 of 64 © Copyright David Wild, 2012-2013 Academic Library Version
Introducing cheminformatics An intensive electronic self-learning guide for new practitioners Edition 2.0 © Copyright David Wild, 2012-2013 This entire learning guide is copyright of the author, and must not be distributed or shared without prior written permission of the author. This is the academic library version of the guide. When purchased for an academic or non-profit institution, it may be used freely and indefinitely by members of the institution including students. It may be placed on intranets and IP-restricted websites. Corrections, comments and suggestions for improvement are welcome. Please address them to the author at davidjwild @ gmail.com

Introducing cheminformatics Page 3 of 64 © Copyright David Wild, 2012-2013 Academic Library Version
Contents Welcome to the introducing cheminformatics self-learning guide .................................................. 6 Lesson 1.The history and current practice of cheminformatics ....................................................... 7
Learning objectives ...................................................................................................................... 7 Defining cheminformatics ............................................................................................................ 7 The history of cheminformatics ................................................................................................... 8 Solved problems ........................................................................................................................... 8 Journals ........................................................................................................................................ 9 Magazines & Online Resources ................................................................................................... 9 Questions .................................................................................................................................... 10
Lesson 2. Representing 2D chemical structures on computer ....................................................... 11 Learning objectives .................................................................................................................... 11 Historical ways of representing chemicals ................................................................................. 11 SMILES line notation ................................................................................................................ 11 InChI line notation ..................................................................................................................... 13 Graph theory and internal representation ................................................................................... 14 File-based formats ...................................................................................................................... 15 Representation nuances .............................................................................................................. 16 Representing reactions and generic structures ........................................................................... 16 Questions .................................................................................................................................... 17
Lesson 3: Characterizing 2D structures with descriptors and fingerprints .................................... 19 Learning objectives .................................................................................................................... 19 Fragmental descriptors ............................................................................................................... 19 Physicochemical properties ........................................................................................................ 20 Topological indices .................................................................................................................... 20 Assembling descriptors into fingerprints ................................................................................... 20 Measuring similarity between fingerprints ................................................................................ 21 Questions .................................................................................................................................... 22
Lesson 4. Storing and searching 2D structures in databases .......................................................... 23 Learning objectives .................................................................................................................... 23 Moving beyond simple files of chemicals ................................................................................. 23 Database technologies ................................................................................................................ 23 Structure, substructure and similarity searching ........................................................................ 24 Representing substructure search queries in SMARTS ............................................................. 25 Client-side interfaces to databases ............................................................................................. 25 Searching example using PostgreSQL and CHORD ................................................................. 26 Freely available searchable chemical datasets ........................................................................... 28 Questions .................................................................................................................................... 29
Lesson 5. Handling chemical reactions on computer ..................................................................... 30 Learning objectives .................................................................................................................... 30 Chemical reactions ..................................................................................................................... 30 Reaction databases ..................................................................................................................... 31 Questions .................................................................................................................................... 32
Lesson 6. Representing 3D chemical structures on computer ....................................................... 33 Learning objectives .................................................................................................................... 33 Where do 3D structures come from? ......................................................................................... 33 Dealing with conformational flexibility ..................................................................................... 33 Representing 3D conformers on computer ................................................................................ 34 Generating and manipulating 3D structures with a computer .................................................... 35

Introducing cheminformatics Page 4 of 64 © Copyright David Wild, 2012-2013 Academic Library Version
3D pharmacophores ................................................................................................................... 36 3D descriptors and fingerprints .................................................................................................. 36 Databases of 3D structures ......................................................................................................... 36 Available 3D databases .............................................................................................................. 37 Questions .................................................................................................................................... 37
Lesson 7. Chemical structures on the web and in the scholarly literature ..................................... 38 Learning objectives .................................................................................................................... 38 Requirements for handling chemical information in documents ............................................... 38 Making structures in documents machine readable ................................................................... 38 Discoverability ........................................................................................................................... 39 Contextualization ....................................................................................................................... 40 Accessibility ............................................................................................................................... 41 Questions .................................................................................................................................... 41
Lesson 8. Cheminformatics in the chemistry library ..................................................................... 42 Learning objectives .................................................................................................................... 42 Commercial tools and datasets covering the chemistry literature .............................................. 42 Free cheminformatics resources, datasets and tools for the chemistry library .......................... 42 Emerging trends in the chemistry library ................................................................................... 43 Questions .................................................................................................................................... 44
Lesson 9. Analyzing chemical datasets using clustering and diversity ......................................... 45 Learning objectives .................................................................................................................... 45 Cluster analysis .......................................................................................................................... 45 Hierarchical clustering ............................................................................................................... 46 Nonhierarchical clustering ......................................................................................................... 47 Diversity analysis ....................................................................................................................... 48 Coverage and cell-based methods .............................................................................................. 49 Relative diversity ....................................................................................................................... 49 Comparing datasets .................................................................................................................... 49 Diverse subset selection ............................................................................................................. 49 Questions .................................................................................................................................... 50
Lesson 10. Predicting biological activities of chemical compounds ............................................. 51 Learning Objectives ................................................................................................................... 51 Quantitative Structure-Activity Relationships (QSAR) ............................................................. 51 Nonlinear approaches to QSAR ................................................................................................. 52 Virtual screening ........................................................................................................................ 53 Evaluating predictive models ..................................................................................................... 53 Questions .................................................................................................................................... 54
Lesson 11. Working with 3D chemical structures ......................................................................... 55 Learning objectives .................................................................................................................... 55 Visualization of 3D structures and proteins ............................................................................... 55 Molecular Superposition ............................................................................................................ 55 3D QSAR ................................................................................................................................... 56 Molecular Docking ..................................................................................................................... 56 Molecular Modeling Tools ......................................................................................................... 57 Questions .................................................................................................................................... 57
Lesson 12. Programmingtoolkits for cheminformatics .................................................................. 58 Learning objectives .................................................................................................................... 58 Programming toolkits for cheminformatics ............................................................................... 58 Workflow tools ........................................................................................................................... 59 Questions .................................................................................................................................... 59
Lesson 13. The next steps: MOOCs and other online study resources .......................................... 60

Introducing cheminformatics Page 5 of 64 © Copyright David Wild, 2012-2013 Academic Library Version
Learning objectives .................................................................................................................... 60 "Core" Cheminformatics ............................................................................................................ 60 Chemical information resources ................................................................................................ 60 MOOCs in related areas ............................................................................................................. 60
Appendix 1. Answers to questions ................................................................................................. 61

Introducing cheminformatics Page 6 of 64 © Copyright David Wild, 2012-2013 Academic Library Version
Welcome to the introducing cheminformatics self-‐learning guide Welcome! The purpose of this guide is to give you an intensive introduction to the emerging field of cheminformatics, including the history of the field, representing 2D and 3D chemical structures on computer, storing and using databases of chemical and related biological information, handling chemical information on the web and in the scholarly literature, and giving an overview of some advanced topics such as clustering and diversity, QSAR and predictive modeling, 3D alignment and docking, and writing cheminformatics software. Rather than being designed as a textbook, it is meant as a complete self-study guide. It is aimed at life scientists and computer scientists in both industry and academia who need a rapid, flexible introduction to this field. The guide is split into 12 lessons, each focusing on a particular area of cheminformatics, with the aim to introduce the reader to the most important aspects of the field for further study. The first six are focused mainly on the foundational aspects of the field, such as representing 2D structures, and the last five cover more advanced applications in the field. Each lesson details learning objectives and concludes with a set of questions that are designed to be thought provoking, with some responses and answers in a final chapter. The text is hyperlinked to current external resources on the web.
The guide is written by David Wild. David has over 20 years experience in the field of cheminformatics, and is currently an Assistant Professor in the Indiana University School of Informatics and Computing. There he directs one of the few educational programs dedicated to cheminformatics, and leads a research group focused on large-scale data mining and aggregation of chemical and biological information. He is Editor-in-Chief (along with Chris Steinbeck at the
EBI) of the Journal of Cheminformatics, and works as editorial advisor or reviewer to many journals. He is involved in several cheminformatics organizations including being a trustee of the Chemical Structure Association Trust and a member of the American Chemical Society. He has helped organize many conferences and symposia in this field. Comments, corrections, and suggestions for improvement of this guide are very welcome, and should be addressed to the author at [email protected]. It is expected that updates will be made to this guide periodically, and everyone who has purchased a copy of this guide will be eligible for free updates.

Introducing cheminformatics Page 7 of 64 © Copyright David Wild, 2012-2013 Academic Library Version
Lesson 1.The history and current practice of cheminformatics
Learning objectives
1. Be able to define cheminformatics 2. Know the history of research at the intersection of computing and chemistry 3. Know the problems that have already been solved, those that are still being actively
researched, and new challenges in the field. 4. Know the relevant journals and web resources for the field.
Defining cheminformatics
Although computers have been used in chemistry since their inception, the term “cheminformatics” has only been used since the early 1990’s, as the field emerged from a variety of prior work in the fields of computation, chemistry, information science, and drug discovery, amongst others. The diversity of these influences in the field resulted in some quite divergent definitions of cheminformatics, and indeed a variety of spellings including chemoinformatics (most predominant in Europe), chemical informatics and even chemi-informatics. A few of the more widely know definitions are: “The mixing of those information resources [information technology and information management] to transform data into information and information into knowledge for the intended purpose of making better decisions faster in the arena of drug lead identification and optimization” (Frank Brown, 19981) “The application of informatics techniques to solve chemistry problems” (Johann Gasteiger, Chemoinformatics: A Textbook, 20032) For the purposes of this course, we will use another definition: “The field of study of all aspects of the representation and use of chemical and related biological information on computers” Which definition is used is a matter of preference and focus: the author prefers this broad definition of the field. However it should be understood that definitions of cheminformatics are clearly related to other defined terms including computational chemistry, molecular modeling and computer-aided drug discovery: Computational Chemistry is the application of mathematical and computational methods to chemistry problems (note that in academia this refers specifically to theoretical chemistry; the term is used more broadly in industry) Molecular Modeling involves using 3D graphics and optimization techniques to help understand the nature and action of compounds and proteins (including applications in materials sciences) Computer-Aided Drug Discovery is the discipline of using computational techniques to assist in the discovery and design of drugs.
1 Brown, F.K. Chemoinformatics: what is it and how does it impact drug discovery.Ann. Rep. Med. Chem. 1998, 33, 375-384 2 Gasteiger, J., and Engel, T. (eds). Chemoinformatics: a textbook. Wiley-VCH, Weinheim, 2003.

Introducing cheminformatics Page 8 of 64 © Copyright David Wild, 2012-2013 Academic Library Version
We also have to position it with reference to Bioinformatics, Genomics, Biomedical Informatics, and so on.
The history of cheminformatics
Computers and computational methods applied to chemistry appeared very early: the 1950's for statistical models (now QSAR), and the 1960's for the first computer representations, mainly by curious chemists. The bulk of the foundational work in what we now call cheminformatics was done in the 70's and 80's, and was strongly supported by the pharmaceutical industry and the need for computational drug discovery research. The history and future directions of cheminformatics are nicely documented in three journal articles:
• Chemoinformatics: a history3 • Chemoinformatics: past, present and future4 • Grand challenges for cheminformatics5
There are also some good introductory guides to the field:
• Chemoinformatics - an introduction for computer scientists6 This is a short guide that was specifically written for readers with expertise in computer science, showing how computing techniques are applied in cheminformatics. However it is very readable for all audiences.
• An introduction to chemoinformatics7 This guide, originally written in 2003 and updated for the 2007 paperback edition, covers wide range of traditional topics in cheminformatics.
• Chemoinformatics: a textbook8 This is a shortened version of a 6-volume reference series produced by two early pioneers in the field of cheminformatics.
Cheminformatics has some traditional areas of application (pharmaceutical drug discovery, databases of available chemicals, journal article indexing, patent databases) and some newer ones (pathway databases, probe discovery, polypharmacology, toxicology, etc). In particular, there has recently been a big increase in the amount of chemical information in the public domain, and a deeper integration with other related areas such as bioinformatics and chemogenomics.
Solved problems
Whilst all areas of cheminformatics are still actively researched, there are many topics that have been intensely researched and good common practices have been developed. Many of these will be covered in this guide. In particular the following can be considered “successes” of the field of cheminformatics:
3 Willett, P. WIREs Comput Mol Sci 2011, 1: 46-56. 4 Chen W.L. Journal of Chemical Information and Modeling, 2006, 46, 2230-2255. 5 Wild, D.J. Journal of Cheminformatics, 2009, 1, 1. 6 Brown, N. ACM Computing Surveys, 2009, 41, 2. 7 Leach, A.R. and Gillet, V.J. Springer, 2007, Dordrecht 8 Gasteiger, J. and Engel, T. Wiley-VCH, 2003, Weinheim.

Introducing cheminformatics Page 9 of 64 © Copyright David Wild, 2012-2013 Academic Library Version
How do you represent 2D and 3D chemical structures on computer?–Chemical compounds are normally considered in terms of entities like atoms, bonds, functional groups, complex names and properties, none of which naturally lend themselves to text-based or other simple representations. Good representations have been developed including linear representations like SMILES and more recently InChI. However using chemical structures on the web and in large public databases has produced some challenges which is fueling new research in this area. How do you search databases of chemical structures? Fast algorithms have been developed to answer questions like “which chemical compounds in this set contain this particular substructure?” or “find me all the chemical compounds that are similar to this query compound”. How do you visualize chemical structures & proteins? Cheminformatics and computer graphics grew together, with well established ways of visualizing the complexities of chemical structures and proteins. Can computers predict how chemicals are going to behave … in the test tube? … in the body?Whilst still an active research area, good best practices have been developed for using chemical structure information and known activities for predicting the biological activities on chemical compounds against protein targets, and more recently with more systematic effects like toxicity. There are, of course, many new challenges and unsolved problems, some of which were referenced in the opening editorial of the Journal of Cheminformatics9, and many of which are referenced in this learning guide.
Journals
The following journals all contain articles of relevance to cheminformatics.
• Journal of Chemical Information and Modeling • Journal of Chemical Theory and Computation • Journal of Cheminformatics • Journal of Computer-Aided Molecular Design • Journal of Molecular Graphics & Modeling • Journal of Computational Chemistry • Journal of Medicinal Chemistry • Reviews in Computational Chemistry • Drug Discovery Today • BMC Bioinformatics • Nature Reviews Drug Discovery • Expert Opinion on Drug Discovery
Magazines & Online Resources
• Scientific Computing World – a magazine focused on laboratory informatics with many news updates relating to cheminformatics
• Bio-IT World – an industry-focused magazine for the use of IT in biology and pharmaceutical industries
9 Wild, D.J. Grand challenges for cheminformatics. Journal of Cheminformatics, 2009, 1, 1.
Introducing cheminformatics Page 10 of 64 © Copyright David Wild, 2012-2013 Academic Library Version
• Network Science – an online journal which is no longer updated but which has many useful articles
• CHMINF-L – mailing list with a chemistry library/information science focus • Chemical Information Sources Wiki – a large collection of resources put together by
Gary Wiggins • A variety of blogs including: Useful Chemistry blog, Chem-bla-ics blog, Noel O'Blog,
Murray Rust blog, and Rajarshi Guha’s blog.
Questions
Responses are given at the end of this guide. 1. How would you describe the difference between bioinformatics and cheminformatics, both in
terms of scope and of the history and culture? 2. Name the four grand challenges identified in the Journal of Cheminformatics opening
editorial. Do you agree? 3. Read the article entitled Systems Chemical Biology10. What new challenges does this make to
cheminformatics? 4. What applications of cheminformatics can you think of that are outside life sciences and drug
discovery? 5. If you could devise a Web search engine perfectly tailored for use in chemistry, what would it
look like? Now take a look at PubChem (http://pubchem.ncbi.nlm.nih.gov/). How close is it to what you had in mind?
10 Oprea, T. et al. Nature Chemical Biology, 2007, 3, 447-450

Introducing cheminformatics Page 11 of 64 © Copyright David Wild, 2012-2013 Academic Library Version
Lesson 2. Representing 2D chemical structures on computer
Learning objectives
1. Understand the historical ways of representing chemicals and why these pose challenges for computers
2. Know how to create SMILES and InChI linear notations for simple molecules 3. Understand how graph theory is used for internal representation, including atom lookup
tables and a connection tables 4. Understand some of the nuances of chemical structure representation
Historical ways of representing chemicals
As the field of chemistry developed over the centuries, a wide variety of ways emerged to identify chemical compounds. Some of these, such as the trivial name, simply give an identifier to the compound; others, such as the chemical formula or systematic name, actually describe how the compounds are made up of atoms and the bonds that connect them. Some of the most commonly used are:
• Trivial name, e.g. Baking Soda, Aspirin, Citric Acid, etc. The traditional form of identification, which assigns an arbitrary or semi-arbitrary namesome of the most commonly known compounds. Only a small fraction of the known chemical compounds have trivial names
• Chemical formula, e.g. C6H12O6, sometimes known as molecular formula. An algorithmic name which specifies the type and quantity of the atoms in the compound, but not its structure (i.e. how the atoms are connected by bonds)
• Systematic name, e.g. 1,2-dibromo-3-chloropropane. Identifies the atoms present and how they are connected by bonds, in a systematically defined way as laid out by IUPAC.
• 2D chemical structure diagram, a pictorial representation of the structure of atoms and bonds in a molecule
In modern years, the 2D chemical structure diagram has become the “lingua franca” of the chemist, and is a straightforward way to describe the structure of a compound in a way that is flexible and easily digestible by other scientists. However what is digestible by a human is not necessarily easily digestible by a computer, and computers find image recognition notoriously difficult. Therefore early pioneers in the field focused on ways of representing this same information in a way that computers could easily digest – a text string, easily convertible to strings of ‘1’s and ‘0’s. These forms of representation are known as line notations.
SMILES line notation
Early research considered two questions: how do we communicate structural information between humans and (text-only) computers? And how do we represent the atoms and bonds in a molecule once they are stored internally on a computer?. The answer to the former question was line notations: clever ways of representing 2D structures in a text string. The earliest example was Wiswesser Line Notation11 , followed by Beilstein's ROSDAL (which is still used in a limited fashion today). Early work was also done on ways of using linear notations for indexing structures, including the Lawson Number12.
11 See a good overview at http://www.dalkescientific.com/writings/diary/archive/2003/10/15/WLN.html 12 See the article at http://depth-first.com/articles/2010/09/28/a-brief-introduction-to-lawson-numbers/
Introducing cheminformatics Page 12 of 64 © Copyright David Wild, 2012-2013 Academic Library Version
Today, linear representations are extremely useful, not because computers can only work in text, but because text is still the most efficient way of storing and communicating information. A linear representation of a structure can easily be stored in a spreadsheet cell or in a text field of a database. The most popular current linear representations are SMILES (which stands for Simplified Molecular Input Line Entry System) and InChI. The essence of SMILES is as follows. Atoms are represented by alphabetic characters, with the six most common organic atoms (C, N, S, O, P, H) simply represented by their standard symbol. Other atoms must be surrounded by square brackets – for example [Ag] or [Cu]. Adjacent atom symbols in a text string are, by default, considered to be bonded by a single bond. We can therefore very easily represent simple alkanes by SMILES strings as follows:
C Methane CC Ethane CCC Propane CCCC Butane
Note that hydrogens can be implicitly derived from the bond order of the atom (along with the number of bonds specified to non-hydrogens) so they need not be explicitly expressed. Double and triple bonds are represented by the = and # symbols respectively, so we can now represent several more structures:
C=C Ethene C=CC Propene (an alternative would be CC=C) [C-]#N Cyanide Ion
Here we also add a charge to the Carbon for Cyanide – doing this means we have to add the square bracket notation to the atom to delimit it. Note that we have two valid representations for Propene: whilst SMILES specifically describes a chemical structure, it does not do so uniquely, and so SMILES cannot be used as an identifier for a molecule. This is partially addressed by canonicalization (see description of the Morgan Algorithm below). Branching is specified through the use of parentheses, and these branches can be nested. Here are some examples of SMILES using branching: CC(C)C Isobutane CNCCC(=O)OH 3-(methylamino)propanoic acid CC(CC(=O)OH)CCN 5-amino-3-methylpentanoic acid Finally, at least for simple SMILES, rings can be closed by using digits (1-9, or 10-99 in square brackets). So cyclohexane would be C1CCCCC1 (with the two “1”’s specifying the end points of the ring-closing bond). Ring aromaticity is handled in SMILES at the atomic level, not at the bond level (i.e. an atom is considered aromatic rather than a bond). To specify an atom as aromatic, simply use lower case letters. We can therefore simply differentiate aromatic and non-aromatic rings: C1CCCCC1 Cyclohexane c1ccccc1 Benzene

Introducing cheminformatics Page 13 of 64 © Copyright David Wild, 2012-2013 Academic Library Version
Note that the digit-ring-closure notation simply specifies an extraordinary bond between two atoms – it doesn’t have to specify a ring closure (although its main use is to do so). Together with another character – the full stop (“.”) which overrides the implicit single bond between adjacent atoms we can make some exotic variants on SMILES: C1C.CC1 Butane C1CC1.C2CC2 Cyclohexane The most common use of this is for computer programs that systematically “piece together” molecules into SMILES. To explore SMILES, further, take a look at the Daylight SMILES homepage13 which contains a theory manual, various tutorials, and depiction utilities so you can depict your own SMILES strings. There is also an open source effort called OpenSMILES 14 which is dedicated to community development of an open standard version of the SMILES language.
InChI line notation
InChI (International Chemical Identifier) was developed by IUPAC and NIST in the early 2000’s, with the purpose of providing not only a standard for identifying chemical structures on computer, but also a standardized canonical suite of software for producing InChIs, thus avoiding some of the problems of SMILES interpretation which mean that different implementations interpret SMILES differently. InChI also addresses some of the “nuances” not well addressed in SMILES notation like stereochemistry and tautomerism. InChI describes a chemical structure in several layers – each layer describing a different property of the compound. Only the main layer is required, and layers are separated by “/”. The most commonly used layers are:
• Main layer: chemical formula, bond connectivity (“c” prefix), hydrogens (“h” prefix) • Charge layer: positive charges (“p”), negative charges (“q”) • Sterochemical layer: double bonds (“b”), tetrahedral stereochemistry (“t”,”m”), type of
stereochemistry (“s”). All InChIs currently are prefixed with “INCHI=”. Following this, a designator of “1/” or “1S/” indicates whether the InChI is non-standard or standard (i.e. with fixed standardized options in the software).Some examples just containing a main layer are given below. InChI=1S/CH4/h1H4 Methane InChI=1S/C3H6/c1-3-2/h3H,1H2,2H3 Propene InChI=1S/C6H12/c1-2-4-6-5-3-1/h1-6H2 Cyclohexane InChI=1S/C6H6/c1-2-4-6-5-3-1/h1-6H Benzene InChI=1S/C4H9NO2/c1-5-3-2-4(6)7/h5H,2-3H2,1H3,(H,6,7) 3-(methylamino)propanoic acid The chemical formula is straightforward enough, but the connectivity and hydrogen sections require some explanation. The connectivity layer describes chains and branches – for example in the above Propene example, atom 1 is bonded to atom 3, which is bonded to atom 2. In the final example, we have branching, as represented by parentheses. In this way, the description of the
13 http://www.daylight.com/smiles/ 14 http://www.opensmiles.org/

Introducing cheminformatics Page 14 of 64 © Copyright David Wild, 2012-2013 Academic Library Version
bonding structure is similar to SMILES, but atom numbers are used instead of atom types. The atom numbering is, in this case, provided by the ordering in the chemical formula. Bond order is determined not by the connectivity section, but in the hydrogen section, which places hydrogen on atoms. For example, 2-4H2 means atoms 2-4 have two hydrogens; 1-3,6,7H means atoms 1-3, 6 and 7 have one hydrogen. “Mobile hydrogens” can be indicated with parentheses; these may migrate between different atoms. An InChI Key can also be generated for a compound. This is completely separate from the InChI linear notation, and is used to provide an identifier for a compound that is particularly suitable for use in Web search engines. It is an ASCII character string based on a hashing of the InChI linear notation, but is of fixed length and uses only characters not normally considered separators. Different sections of the InChI linear notation are represented by different hash sections separated by hyphens, so a web search for just the first section will return other related isomers and so on. Some examples are below (taken from PubChem): VDIPNVCWMXZNFY-UHFFFAOYSA-N 3-(methylamino)propanoic acid VNWKTOKETHGBQD-UHFFFAOYSA-N Methane QQONPFPTGQHPMA-UHFFFAOYSA-N Propene To explore InChI further, including more details of the layers and their content, check out the InChI official website15, which includes a full download package of documentation (of especial use is the InChI User Guide), executables, and code, and the InChI FAQ16, a comprehensive introductory guide to InChI. Development of InChI is being supported by the InChI Trust17.
Graph theory and internal representation
Graph Theory is a branch of mathematics that is used to model graphs. A graph is made up of objects (called nodes) with links between them (called edges). How does this apply to chemical structures? Well, if we consider atoms as nodes and bonds as edges, a chemical structure becomes a mathematical graph. This mapping opens up a wide variety of “off-the-shelf” computer science algorithms that have been developed for generic use with graphs. For example, comparing two chemical structures to see if they are the same becomes a graph isomorphism problem; determining if a chemical structure contains a given substructure becomes asubgraph isomorphism problem. Well established algorithms can then be used almost off the shelf for these problems – almost, because we have to take account of a variety of subtleties in chemical structure representation that are described later in this section. Internal representation for 2D structures uses standard methods for representing graphs, with a few minor tweaks. Each atom (or node) is assigned a unique number, and this is stored along with a variety of labels for the atom, minimally including the atomic type (C, N, S, etc; sometimes more advanced atom typing is used that allows differentiation of hybridization states) and often various other properties. This table of labels is sometimes referred to as the atom lookup table. The table that represents the bonds between atoms is commonly called the connection table in cheminformatics, although it is a form of the common mathematical adjacency matrix. The connection table contains a row and a column for each atom. At the intersection of a row and column, a zero indicates that the atoms are not connected, and a 1 or higher number indicates a bond between the two atoms. There is no absolute convention on what should be used at the 15 http://www.iupac.org/inchi/ 16 http://www.inchi-trust.org/fileadmin/user_upload/html/inchifaq/inchi-faq.html 17 http://www.inchi-trust.org/

Introducing cheminformatics Page 15 of 64 © Copyright David Wild, 2012-2013 Academic Library Version
intersection of an atom’s row with its own column. In variation from the common association matrix, which uses a “1” to indicate an edge between nodes, the connection table usually represents the bond order at the intersection (i.e. 1=single bond, 2=double bond, 3=triple bond). Sometimes, a 4 can be used for an "aromatic" bond. Since the connection table is redundant (i.e. it represents both that atom a is bonded to atom b and vice-versa), a non-redundant form of the connection table can be used that only stores this information once. Depicted here is an example atom lookup table and connection table for Acetaminophen (Tylenol, Paracetamol) with the non-redundant part of the table shown in bold. Note that if we need to ensure that the same molecule is numbered the same way each time, we
need an algorithm that consistently numbers atoms via rules. Fortunately, this can be done with the Morgan Algorithm 18 . In this algorithm, each atom is given a "connectivity value" reflecting how many atoms it is connected to. This value is iteratively replaced by the sum of the connectivity values of its neighbors, until the number of different values is maximized. Atoms are then numbered in decreasing order of connectivity value. In the case of a tie, other properties are used (e.g. atomic number, bond order, etc). Doing this is an important basis for producing canonical representations: indeed the Morgan Algorithm is used in canonicalization algorithms for line notations to ensure that the connection tables are numbered the same way each time a molecule is encountered, and since the linear notation generation algorithm will follow this numbering, the resultant line notation will be the same each time.
File-‐based formats
Line notations are not the only way of communicating structure: also popular are file-based formats such as MDL's MOL File 19 (and its variant, the SD File), and Chemical Markup Language20 (CML, a variant of XML). These file formats are essentially a “dump” of the atom lookup and connection tables, sometimes with other mandatory or optional fields. These have the advantage of flexibility – i.e. they can contain information other than the basic atoms and how they are connected – although they are much more verbose. 18 A short overview of the algorithm is at http://graphiteworks.wordpress.com/2011/08/31/chemoinformatics-curiosities-i-the-morgan-algorithm/ 19 A 2005 copy of MDL’s file formats specification is currently available at http://c4.cabrillo.edu/404/ctfile.pdf 20 http://www.xml-cml.org/

Introducing cheminformatics Page 16 of 64 © Copyright David Wild, 2012-2013 Academic Library Version
Representation nuances
We have introduced some simple ways of representing and communicating 2D chemical structures. However, there are some nuances of chemistry that complicate matters. In particular stereochemistry, aromaticity and tautomers. Normal SMILES does not inherently store stereochemical information, although it is stored optionally in InChI and Isomeric SMILES. Stereochemistry is normally depicted in 2D structure diagrams using wedges which indicate whether a bond is “coming out” of the page or “going into” the page (see diagram top). While it is perfectly possible to mandate indication of this stereochemistry in our representation, we have the problem of when we do and do not want to differentiate stereoisomers (i.e. whether we want them to be considered the same structure or not). For example, thalidomide can take two steroisomeric forms. In some instances, such as when we want to store an entry in a database for thalidomide independent of the isomeric form, we may not want to differentiate the isomers. But the isomers have very different biological properties, which we do not want to conflate. InChI addresses this problem by representing stereochemistry in a separate part of the notation, so removing the stereochemical information will still leave a “stub” that is a valid representation of a compound that does not indicate stereochemistry. Another issue is aromaticity – the tendency for electrons to delocalize smoothly around ring systems and thus blur distinction of “double” and “single” bonds. There are various approaches to categorizing ring systems as “aromatic” or “non-aromatic”, such as the 4n+2 rule. The ability to represent ring systems in a variety of ways (alternating single or double bonds, aromatic atoms, or aromatic bonds) can lead to confusion and mistakes in comparing molecules (for instance we need an algorithm to ensure the Kekule and non-Kekule forms of Benzene, shown in the image center, are considered equal). Note that aromaticity can be addressed at both the representation level (with aromatic labels for atoms, aromatic bond types, or allowing only alternating single and double bonds), or at the algorithm level (determining aromaticity through analysis of the structure). A related problem is tautomerism, the ability of some molecules and some functional groups to take on different forms. An example of this is given in the above image at the bottom, with three forms of the Nitro group. The first, pentavalent form, is not really chemically valid without charge, but is commonly used in depiction. The second employs aromatic bond types to indicate that the electrons will delocalize between the oxygens. The third explicitly specifies that one oxygen is double bonded, and one is single bonded. All forms are considered valid, but depending on the context, a representation may need to specify an exact form (e.g. in a particular pH, the third form may be the only valid one) or be vague about the form. Again, tautomerism is addressed in InChI through the permissibility of expression of multiple tautomeric forms in a single line notation.
Representing reactions and generic structures
Structural representations of reactions need to identify only the arrangement of products and reagents, and possibly which reagent atom maps to which product atom; other information such as stoichiometry and yield are generally stored separately. Reaction SMILES is a superset of SMILES with symbols for arrows and to separate components of the reaction.Specifically,

Introducing cheminformatics Page 17 of 64 © Copyright David Wild, 2012-2013 Academic Library Version
reactants, catalysts (agents) and products are separated from each other by a “>” sign, and individual reactants, catalysts and products are separated by a dot – “.”. For example, simple combustion of methane to carbon dioxide and water could be represented as
C.OO>>C(O)O.O Note that in this case there are no agents, and so both “>” signs are together. Also permitted is mapping of individual reactant atoms to product atoms, which is done using atom labels (example taken from a Daylight tutorial): [CH2:1]=[CH:2][CH:3]=[CH:4][CH2:5][H:6]>> [H:6][CH2:1][CH:2]=[CH:3][CH:4]=[CH2:5]
Another language called SMIRKS can be used for allowing ambiguity in reactions, which enables the representation of transformations – i.e. the description of a change in a substructure or functional group, without having to specify a full reaction. An example, taken from the Daylight tutorial, is given below:
[*:1][N:2](=[O:3])=[O:4]>>[*:1][N+:2](=[O:3])[O-:4] SMIRKS is technically a hybrid of SMILES and SMARTS (a query language described in the next section). It is particularly useful for describing kinds of reaction that can be generically applied to compounds. An excellent example of its use is in the DrugGuru tool21. To explore Reaction SMILES and SMIRKS further, check out the Daylight Reaction SMILES and SMIRKS tutorial22, and the SMIRKS chapter in the Daylight Theory Manual23. A related but different problem is the representation of generic structures. Genericized forms of chemical structures were probably first introduced by Eugene Markush in 1924 as part of a patent (prior to that, patents were for specific structures). Thus the term "Markush structures" came to be used for 2D representations that describe more than one actual structure (for example, by enumerating alternate groups on particular points of the molecule, or specifying ambiguity at an attachment point). Representing generic structures is difficult because a Markush structure can represent an unlimited number of compounds (e.g. "aryl group"). However this problem has been addressed with text-based languages for describing generic structures, such as GENSAL, and extended connection table representations for internal use. They are widely used in patent searching systems. For more on generic structures, see the paper The Sheffield Generic Structures Project – a Retropsective Review24.
Questions
Responses are given at the end of this guide. 1. Generate both a SMILES and an InChI for Ibuprofen 2. Do a Google search for WTDRDQBEARUVNC-LURJTMIESA-N. What drug is this the
InChI Key for? Now do a search for WTDRDQBEARUVNC-ZCFIWIBFSA-N. What is this the InChI Key for? Note the first section is the same. How do the compounds differ? Now do a search for just the first section WTDRDQBEARUVNC – do you find both?
21 Stewart, K.D. et. al., Bioinorganic & Medicinal Chemistry, 2006,14(20), 7011-7022 22http://www.daylight.com/meetings/summerschool01/course/basics/smirks.html 23http://www.daylight.com/dayhtml/doc/theory/theory.smirks.html 24 Lynch, M.F. and Holliday, J.D., Journal of Chemical Information and Modeling, 1996, 36(5), 930-936

Introducing cheminformatics Page 18 of 64 © Copyright David Wild, 2012-2013 Academic Library Version
3. Type the following SMILES into the Daylight Depict tool: C1=CC=C2C(=C1)NC=N2 . What is the compound? Note that both rings are shown in aromatized form, but the SMILES is entered in Kekule form. Why do you think the aromatic form was depicted?
4. Try the alternative forms: c1ccc2c(c1)NC=N2 and c1ccc2c(c1)nc=n2 . Why do you think the second one is rejected?

Introducing cheminformatics Page 19 of 64 © Copyright David Wild, 2012-2013 Academic Library Version
Lesson 3: Characterizing 2D structures with descriptors and fingerprints
Learning objectives
1. Know the kinds of descriptors available for chemical structures 2. Be able to distinguish fragmental descriptors, physicochemical descriptors, and toplogical
indices 3. Understand what a structural key and a fingerprint are 4. Know the common methods for calculating similarity between fingerprints The methods we have discussed so far are primarily for representing and identifying chemical structures. However, there is also utility in methods for describing the properties and features of the structures – i.e. descriptors. Here we shall describe how descriptors can be generated and how sets of descriptors can be used as “fingerprints” for characterizing the compounds. These are useful for a variety of purposes, especially for predictive modeling and calculation of similarity between structures. Some of the descriptors we can compute from the 2D structure include:
• Simple feature counts (such as number of rotatable bonds or molecular weight) • Fragmental descriptors which indicate the presence or absence (or count) of actual or
genericized substructures • Physicochemical properties • Topological indices, such as the Branching Index and the Chi Molecular Connectivity
Indices For a larger list, an excellent source is the Molconn-Z Methods Manual.25
Fragmental descriptors
Fragmental descriptors describe 2D structural features that are larger than one atom. These will often describe a specific substructure (such as a nitro group or carboxyllic acid) as well as simple substructures, or even more complex constructs. Fragmental descriptors may be rule based (generated from a dataset of compounds via rules) or dictionary based (arbitrary substructures specified in a dictionary). Some examples of rule-based fragmental descriptors include augmented atoms (atoms with their neighboring bond environment), atom sequences (all paths of a given range of number of bonded atoms), atom pairs and augmented couples (atoms or augmented atoms separated by a specified number of bonds), and ring composition (paths in a ring system). Depending on the rule type, various algorithms may be used to identify the presence of fragments in a molecule. Dictionary-based fragmental descriptors will specify a list, or dictionary, of substructures of interest, often
25http://www.edusoft-lc.com/molconn/manuals/400/methodex.html
Introducing cheminformatics Page 20 of 64 © Copyright David Wild, 2012-2013 Academic Library Version
specified in SMARTS. In either case, a particular subset of valid descriptors would be present for any given molecule, constituting the set of descriptors for that molecule.
Physicochemical properties
These are physical and chemical properties of a molecule which can be determined experimentally, or estimated algorithmically by examination of the 2D structure of a molecule. Either way, physicochemical properties are usually represented by a real number. Common physicochemical property descriptors are LogP (a measure of the oiliness of a compound which affects its transport in the body), Molecular Weight, counts of hydrogen bond donors or acceptors, and Polar Surface Area. Some interesting analyses have been carried out using these kinds of descriptors, of particular note the “Lipinski Rule of Five”26 which sets critera for certain descriptor values based on a statistical analysis of marketed drugs.
Topological indices
Topological indices are single-value descriptors that reflect something about the nature of the chemical structure graph (thus the term “topological”). One of the simplest (and earliest) was the Wiener Index , which is simply 0.5 x the sum of the number of bonds between all pairs of atoms. Later development of the Wiener Index, include Molecular Connectivity Indices, the Randic Branching Index and the Kier and Hall Chi Molecular Connectivity Indices. More details of these can be found in the Molconn-Z Methods Manual.
Assembling descriptors into fingerprints
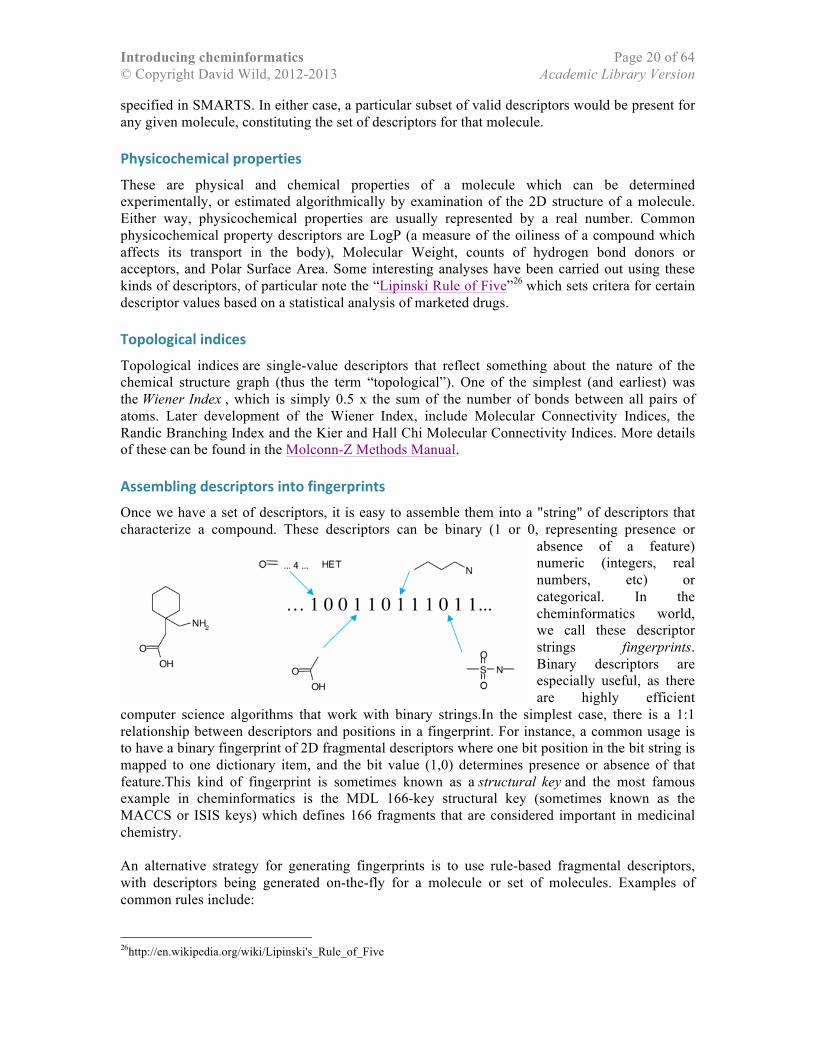
Once we have a set of descriptors, it is easy to assemble them into a "string" of descriptors that characterize a compound. These descriptors can be binary (1 or 0, representing presence or
absence of a feature) numeric (integers, real numbers, etc) or categorical. In the cheminformatics world, we call these descriptor strings fingerprints. Binary descriptors are especially useful, as there are highly efficient
computer science algorithms that work with binary strings.In the simplest case, there is a 1:1 relationship between descriptors and positions in a fingerprint. For instance, a common usage is to have a binary fingerprint of 2D fragmental descriptors where one bit position in the bit string is mapped to one dictionary item, and the bit value (1,0) determines presence or absence of that feature.This kind of fingerprint is sometimes known as a structural key and the most famous example in cheminformatics is the MDL 166-key structural key (sometimes known as the MACCS or ISIS keys) which defines 166 fragments that are considered important in medicinal chemistry. An alternative strategy for generating fingerprints is to use rule-based fragmental descriptors, with descriptors being generated on-the-fly for a molecule or set of molecules. Examples of common rules include: 26http://en.wikipedia.org/wiki/Lipinski's_Rule_of_Five

Introducing cheminformatics Page 21 of 64 © Copyright David Wild, 2012-2013 Academic Library Version
• All atom sequences from 2-7 atoms • All augmented atoms • Circular substructures
When there is no dictionary, there is no obvious way to map these descriptors consistently to fingerprint bits. Further, the number of fragments generated can be huge (100,000 just for the 2-7 atom sequences for C,N,S,O,P, not considering bond types or generalizations). If we created a bit position for every possible descriptor, the fingerprints would be impossibly big, and extremely sparse. Therefore, we generally use a hashing algorithm to map these descriptors onto a fixed number of bits (e.g. 1,024), and these are called hashed fingerprints. Binary fingerprints and structural keys are available from a variety of sources
• MDL (166-keys, available in a variety of forms) • Scitegic ECFPs (available in the Pipeline Pilot package) • Daylight hashed fingerprints • BCI fingerprints • CDK (Chemistry Development Kit) • Chemaxon
Non-binary fingerprints can also be created, either using a variant of fragmental descriptors (e.g. with a number indicating the number of times a fragment occurs in a molecule), or with categorical or non-binary descriptors.
Measuring similarity between fingerprints
The most common way of measuring similarity between two fingerprints is the Tanimoto Coefficient. In the case of a binary fingerprint, Tanimoto is identical to the better known Jaccard Index. Generally, this is the defined as the intersection of a set divided by the union of a set, and so has a value between 0 and 1. The binary variant is the most common, which is defined as C / (A+B-C) where C is the number of set bits in common, A is the number of set bits in fingerprint A, and B is the number of set bits in fingerprint B. For most fingerprints, a similarity greater than 0.7 or 0.8 indicates that the molecules are similar enough to be likely to share biological properties (the “similar property principle”). The measure loses any real meaning <0.3 or so. A related measure is the Cosine Coefficient which measures the angle between two vectors. For a non-binary case (i.e. using non-binary descriptors), Tanimoto is the dot product of the vectors (fingerprints) divided by the magnitude of fingeprint A + the magnitude of fingerprint B - the dot product. This collapses to Jaccard for binary fingerprints. The second most common measure is Euclidean Distance , which is technically a measure of distance, not similarity. The Euclidean distance is simply the Pythagorean distance between two points in a multi-dimensional space. This is especially useful when the measure has to obey the triangle inequality (i.e. it is a metric ) although the Soergel Distance (1-Tanimoto) has been recently proven to obey the triangle inequality for positive descriptors. Note that for binary fingerprints, the Euclidean distance is the square root of the Hamming Distance . An excellent overview of similarity measures is given by Willett27. 27 Willett, P., Barnard, J.M., Downs, G.M. Journal of Chemical Information and Modeling, 1998, 38(6), 983-996

Introducing cheminformatics Page 22 of 64 © Copyright David Wild, 2012-2013 Academic Library Version
Questions
1. What might be a problem with using dictionary-based fingerprints for calculating similarity between highly similar molecules of the same chemical series?
2. Under what circumstances might two very similar but different chemical structures have a Tanimoto similarity of 1.0?
3. Would it be possible to mix descriptor types (e.g. fragmental and physicochemical) in a single fingerprint? If so, how would you do this?
4. Go to the PubChem page for Atorvastatin.28 Click on the “similar compounds” link under “related compounds” on the right. Why do think you do not see many of the other drugs in the statin family29 in the top of the hitlist?
28http://pubchem.ncbi.nlm.nih.gov/summary/summary.cgi?cid=60823 29 See http://en.wikipedia.org/wiki/Statin

Introducing cheminformatics Page 23 of 64 © Copyright David Wild, 2012-2013 Academic Library Version
Lesson 4. Storing and searching 2D structures in databases Having covered representation of 2D chemical structures through line notations, file formats and internal representations, in this lesson we will look at how to store sets of chemical structures, and once we store the sets how they can be searched and utilized.
Learning objectives
1. Understand the limitations of storing chemical structure information in generic files, spreadsheets and databases
2. Know the available database technologies for handling chemical structures 3. Understand structure, substructure and similarity searching 4. Be able to work through an example of chemical searching using PostgreSQL and CHORD
Moving beyond simple files of chemicals
We can, of course, simply store sets of chemical structures in files – in fact this is very commonly done. Linear notations in particular allow integration of chemical structures in files very easily, as they contain regular text. For example, we might create a “SMILES file” of structures along with names and maybe a particular biological activity value as follows. The fields can be separated by spaces or tabs. c1ccccc1 Benzene 3.6 c1cc(Cl)ccc1 Chlorobenzene 5.8 c1cc(Br)ccc1 Bromobenzene 2.4 … Similar files can be created for InChIs. The SD, CML and other file formats also let us store this same information multiple times in a file to store a “set” of chemical compounds. We can go further and store this information in spreadsheets or even relational databases. In the above example, we could search for compounds by name, sort by name or activity, and so on. In a relational database, we could create quite complex queries of the non-structural data. However, we hit problematic limits when we want to do searching based on chemical structure. For example only the first of the following queries can be answered in this fashion, and that only if canoncalization was used for both the data set compounds and the query.
1. Does the set contain a particular structure expressed in SMILES? 2. Find all of the compounds that contain a thiazolinedione 3. Find all of the compounds that are similar to a given query
For these kinds of query, we have to invoke specialized forms of searching, and to do that, we have to employ specialized database teachnologies.
Database technologies
Until the turn of the century, the only available databases that enabled specialized chemistry searching were entirely specialized. One of the first was MDL MACCS (1979) that offered storage and searching of databases of 2D structures, but little else. It became more useful in 1985, when it was integrated into the ISIS packageallowing chemical structure information to be stored in one database, and non-structural information in a separate Oracle database, with a system for

Introducing cheminformatics Page 24 of 64 © Copyright David Wild, 2012-2013 Academic Library Version
integrated searching between the two called ISIS Host. Interfaces for computers were developed that allowed structure drawing and display, and querying of these databases. The general architecture of this was client/server, where we have a server receiving queries from and sending results to applications running on client computers. Note that this requires installation of specialized software on the client machines as well as on the server. Several other client/server database management systems emerged, including Daylight Merlin/Thor and Tripos Unity. Separately, client-only systems were developed for handling lists of structures locally on machines, such as Accord for Excel. A major shift started when Oracle released version 8i of its SQL-based database management system, which allowed "cartridges" to be written that extended the functionality of the database in a very flexible way. Quickly, it was realized that the kinds of specialized storage and searching required for 2D structure storage and retrieval could be implemented incartridges , thus enabling a generic Oracle SQL database to be used for chemical structure searching. A good example of how Daylight implemented such a cartridge is given in Jack Delaney's MUG2000 talk30. A similar system (called the Datablade) was developed for IBM's Informix database, but this has not been widely used in cheminformatics. However, a similar kind of "plug-in" for the free database PostgreSQL has been implemented in gNova 's CHORD. There are currently many Oracle or PostgreSQL cartridges available, including:
• Accelrys Direct • IDBS ActivityBase • Daylight DayCart • gNova CHORD • ChemAxon JChem • Open source OrChem and ChemiSQL
Note that cartridges don't offer any interfaces per se, so nowadays these products are often packaged with interface tools and client programs. Both Oracle and PostgreSQL are relational databases that use the SQL language for querying.An excellent overview of the use of relational databases in chemistry is given by O’Donnell31 A variety of interesting alternatives to relational databases are starting to have an impact on the scientific community as a whole, although none of these currently have capacity for cheminformatics capabilities. These alternatives include semantic triple-stores32, NoSQL33, and JSON34. In particular, semantic triple stores offer advantages of large-scale data integration, linking, and mapping, as demonstrated in the EU OpenPHACTS project35
Structure, substructure and similarity searching
There are three commonly used types of searching that need to be implemented in 2D chemical structure databases, which address the three problematic queries described above:
• Structure searching, i.e. answering the question "is this structure in the database?" • Substructure searching, i.e. "find me all of the structures that contain this substructure" • Similarity searching, i.e. "find me the structures which are similar to this one"
30 See http://www.daylight.com/meetings/mug00/Delany/cartridge.html 31 O’Donnell, T.J. Design and Use of Relational Databases in Chemistry. CRC Press, 2009, Boca Raton, FL. 32 http://en.wikipedia.org/wiki/Triplestore 33 http://en.wikipedia.org/wiki/NoSQL 34 http://en.wikipedia.org/wiki/JSON 35 http://www.openphacts.org/

Introducing cheminformatics Page 25 of 64 © Copyright David Wild, 2012-2013 Academic Library Version
Note that these might often be combined with regular text or numeric searches, e.g. "find me all of the compounds containing this substructure that are active in this assay and have a LogP < 5". If we are using canonical SMILES (and make sure the query is specified using the same canonicalization algorithm), then structure searching can be as simple as doing a text search for the SMILES in the database (although even with canonicalization minor variants would be missed). A more reliable substructure search can be carried out using a graph isomorphism algorithm. Substructure searching requires implementation of a subgraph isomorphism algorithm such as Ullman. Similarity searching is effected through the use of similarity or distance coefficients and descriptors as described previously. Additionally, one can speed up structure and similarity searching by pre-search screening using fragmental descriptors (indeed this is what they were originally designed for) to exclude compounds that don't include features in the query (substructure search) and those whose maximum similarity (based on features present) to a query would be greater than a specified cutoff (similarity searching)
Representing substructure search queries in SMARTS
One issue is how we go about representing queries for substructure searching. For many substructures, we can simply use SMILES as if the substructure were a full structure. However, we often want to add features to substructures that we wouldn't have in a regular structure, such as specifying attachment points, bonds to undefined atoms, and ambiguity about atom and bond types. For example, we might want to search for a ring system that attaches to the rest of a molecule only at particular specified points. Fortunately we have several ways to do this. For example, the MDL MOL/SD file is extendible to represent query features. Of particular note is SMARTS 36, a superset of SMILES which is designed for representing queries. A simple example of SMARTS would be *C(=O)O, a carboxyllic acid, in this case differing from the SMILES only by the presence of an asterisk indicating an attachment point. In fact, SMARTS includes a wide range of extra characters for representing queries. Useful resources on the Daylight website include a SMARTS tutorial,37 SMARTS examples,38 and SMARTS practice,39 using the DepictMatch tool.40
Client-‐side interfaces to databases
At the client side, some kind of interface is required for searching databases. This could be a machine interface (e.g. JDBC , ODBC , SOAP service, REST service) or a human interface (HTTP or client-side application). Increasingly database access through a single human interface is an outdated method; service-oriented architectures allow much greater flexibility to search within a variety of applications and mashups. Client side interfaces need a method of displaying and drawing 2D structures. This can be done with a variety of toolkits (e.g. CDK, OEChem) and applets and plug-ins (e.g. Chemdraw Plugin, JME). It can even be done with a REST service.
36http://www.daylight.com/dayhtml/doc/theory/theory.smarts.html 37http://www.daylight.com/dayhtml_tutorials/languages/smarts/index.html 38http://www.daylight.com/dayhtml_tutorials/languages/smarts/smarts_examples.html 39http://www.daylight.com/dayhtml_tutorials/languages/smarts/smarts_practice.html 40http://www.daylight.com/daycgi_tutorials/depictmatch.cgi

Introducing cheminformatics Page 26 of 64 © Copyright David Wild, 2012-2013 Academic Library Version
Searching example using PostgreSQL and CHORD
For this example, we are going to be working with a very small sample dataset of common drugs:
We will give examples that use the gNova CHORD cartridge along with PostgreSQL. To fully understand these examples, you will need a basic working knowledge of SQL. First, we will create a new database to store SMILES, Name, LogP (octanol/water partition coefficient) and Fingerprint for each chemical structure:
create table gnovatest (smiles VARCHAR(200), name VARCHAR(50), logp real, fkey BIT(166));
Next, we will add the field values for the 8 compoumds:
INSERT INTO gnovatest (smiles, name, logp) VALUES ( 'CC(=O)Nc1ccc(O)cc1', 'Acetaminophen', 0.27 ); INSERT INTO gnovatest (smiles, name, logp) VALUES ( 'CC(C)NCC(O)COc1ccccc1CC=C', 'Alprenolol', 2.81 ); INSERT INTO gnovatest (smiles, name, logp) VALUES ( 'CC(N)Cc1ccccc1', 'Amphetamine', 1.76 ); INSERT INTO gnovatest (smiles, name, logp) VALUES ( 'CC(CS)C(=O)N1CCCC1C(=O)O', 'Captopril', 0.84 ); INSERT INTO gnovatest (smiles, name, logp) VALUES ( 'CN(C)CCCN1c2ccccc2Sc3ccc(Cl)cc13', 'Chlorpromazine', 5.20 ); INSERT INTO gnovatest (smiles, name, logp) VALUES ( 'OC(=O)Cc1ccccc1Nc2c(Cl)cccc2Cl', 'Diclofenac', 4.02 ); INSERT INTO gnovatest (smiles, name, logp) VALUES ( 'NCC1(CC(=O)O)CCCCC1', 'Gabapentin', -1.37 ); INSERT INTO gnovatest (smiles, name, logp) VALUES ( 'COC(=O)c1ccccc1O', 'Salicylate', 2.60 );
We will now use the gNovapublic166keys function to create fingerprints from the SMILES field and put them in the fkey fingerprint field for each compound:
update gnovatest set fkey = public166keys(smiles);

Introducing cheminformatics Page 27 of 64 © Copyright David Wild, 2012-2013 Academic Library Version
Now we can use the SQL select command to show all of the records (responses are shown in green):
select smiles,name,logp from gnovatest; select * from gnovatest; smiles | name | logp | fkey ----------------------------------+----------------+-------+------------------------------------------------------------------------------------------------------------------------------------------------------------------------ CC(=O)Nc1ccc(O)cc1 | Acetaminophen | 0.27 | 0000000000000000000000000000000000000000000000000000000000000000000000000000000000000000000100000000000000000100100010000000000000101010001000100000001101011111111110 CC(C)NCC(O)COc1ccccc1CC=C | Alprenolol | 2.81 | 0000000000000000000000000000000001000000000000000000010000000000000000010100000001000000010000101011000100001000100100000000010100110000001000110000111110111111111110 CC(N)Cc1ccccc1 | Amphetamine | 1.76 | 0000000000000000000000000000000000000000000000000000000000000000000000000000000000010000000000000000000100000010001000000000000000000000000000000000000000110101111010 CC(CS)C(=O)N1CCCC1C(=O)O | Captopril | 0.84 | 0000000000000000000000000000000000000000000000000000000000000000000000000010000001101001011100110001000000010110001010001110000100100001111000000111010011111111100110 CN(C)CCCN1c2ccccc2Sc3ccc(Cl)cc13 | Chlorpromazine | 5.2 | 0000000000000000000000000000000000010000000000000000000000100000000000000110000110001011000010000101001010110010001100011100000000000110100001011011100010110101111010 OC(=O)Cc1ccccc1Nc2c(Cl)cccc2Cl | Diclofenac | 4.02 | 0000000000000000000000000000000000000000000000000000000000000000000000000000000000000010010000000000001100100000000000000010000000111110001000011000011001111110111110 NCC1(CC(=O)O)CCCCC1 | Gabapentin | -1.37 | 0000000000000000000000000000000000000000000000000000000000000000010000000000000001010000011000000001000100000001000000000010000110110000001000000010000011101110101110 COC(=O)c1ccccc1O | Salicylate | 2.6 | 0000000000000000000000000000000000000000000000000000000000000000000000000000000000000000100010000000000000000000100000000010010000000000001000110100010101001011011110
Now the data set is populated, we can begin to search it, not only with regular SQL searching (e.g. for a compound with a given name, or a LogP in a certain range), but using specialized cheminformatics functions. Here we will do a substructure search for structures containing a carboxylic acid (note the SMARTS representation of the carboxylic acid)
select smiles,name,logp from gnovatest where matches(smiles, '*C(=O)O'); smiles | name | logp --------------------------------+------------+------- CC(CS)C(=O)N1CCCC1C(=O)O | Captopril | 0.84 OC(=O)Cc1ccccc1Nc2c(Cl)cccc2Cl | Diclofenac | 4.02 NCC1(CC(=O)O)CCCCC1 | Gabapentin | -1.37 COC(=O)c1ccccc1O | Salicylate | 2.6 (4 rows)

Introducing cheminformatics Page 28 of 64 © Copyright David Wild, 2012-2013 Academic Library Version
We will now refine the search to only return the carboxylic acid containing compounds that have a LogP > 1:
select smiles,name,logp from gnovatest where (matches(smiles, '*C(=O)O') AND (logp>1.0)); smiles | name | logp --------------------------------+------------+------ OC(=O)Cc1ccccc1Nc2c(Cl)cccc2Cl | Diclofenac | 4.02 COC(=O)c1ccccc1O | Salicylate | 2.6 (2 rows)
Next, we will perform a similarity search with Aspirin as the query (represented in SMILES), returning only those compounds with a Tanimoto similarity of the fingerprints that is greater than 0.6. Note that only one compound is returned in this case – unsurprisingly Salicylate (a precursor to Aspirin):
select smiles,name,logp from gnovatest where tanimoto(fkey, public166keys('CC(=O)Oc1ccccc1C(=O)O')) > 0.6; smiles | name | logp ------------------+------------+------ COC(=O)c1ccccc1O | Salicylate | 2.6 (1 row)
Once we have finished with the database, we can delete it:
drop table gnovatest;
Freely available searchable chemical datasets
There are now many online public databases of chemical structures, of particular note are PubChem, ChemSpider and eMolecules. PubChem - http://pubchem.ncbi.nlm.nih.gov/ - is a dataset containing information on tens of millions of compounds including an increasing amount of bioactivity data. Simple searches can be carried out using keywords, or more advanced kinds of searching based on chemical structure (structure, substructure and similarity searching) and other factors. Advanced tools are available for clustering and bioactivity analysis of sets of compounds returned from a search. A variety of training materials are available including PubChem help pages41, slides from previous Principles of PubChem42 courses provided by the NCBI, and a variety of training videos43 available from the University of California Berkeley. Chemspider - http://www.chemspider.com/ - is a free chemical structure data set providing an alternaive to PubChem with some unique kinds of data including spectroscopy. A variety of training materials are available on the website.
41http://pubchem.ncbi.nlm.nih.gov/help.html 42http://www.ncbi.nlm.nih.gov/Class/PubChem/course.html 43http://www.lib.berkeley.edu/CHEM/instruction/pubchem/

Introducing cheminformatics Page 29 of 64 © Copyright David Wild, 2012-2013 Academic Library Version
ChEMBL - https://www.ebi.ac.uk/chembl/ - is a database of bioactive drug-like small molecules, containing 2D structures, calculated properties (e.g. logP, Molecular Weight, Lipinski parameters, etc.) and abstracted bioactivities (e.g. binding constants, pharmacology and ADMET data). eMolecules - http://www.emolecules.com/ - is a searchable set focused on commercially available compounds.
Questions
1. What is the only kind of specialized cheminformatics searching that is possible using a regular spreadsheet or file?
2. Describe in plain English what this SMARTS means, and what kind of fragment it represents: [#6][CX3](=O)[#6]
3. Find out how many distinct chemical structures are available in PubChem and ChemSpider.

Introducing cheminformatics Page 30 of 64 © Copyright David Wild, 2012-2013 Academic Library Version
Lesson 5. Handling chemical reactions on computer
Learning objectives
1. Understand the nature of chemical reactions and how these relate to chemical structure representations
2. Know the difference between reaction databases and synthesis planning systems 3. Know some of the advanced kinds of searching that are sometimes needed on reaction
databases
Chemical reactions
Chemical reactions are processes that convert one set of chemical compounds into another. There are many different classes of reaction - for example, displacement reactions and acid-base reactions. Of particular interest in drug discovery are organic reactions. There are many kinds of information that can be associated with a reaction, including:
• The reaction equation and stochiometry • A detailed reaction mechanism • Any catalysts involved in the reaction • Any solvents involved in the reaction • Reaction conditions (often a mix of numeric and textual information) • Reaction yield (numeric)
Note that the reaction might be generic (i.e. applicable to many compounds, rather than just one specific compound) or specific, and a reaction equation might just supply the simplified start and end points to a more detailed reaction mechanism. You can find information on many simple organic reactions on Wikipedia44 or in an organic chemistry textbook such as Morrison and Boyd45. Reaction equations are generally represented on paper like mathematical equations, with a set of reactants on the left and products on the right. By convention, the "+" sign is used to separate reactants from each other or products from each other, and an arrow separates the reactants from the products and indicates reaction direction. From a cheminformatics perspective, the most important concern is representing the individual chemical structures, and representing the relationship between reagents and products (or the reaction mechanism if stored). All other information requires trivial kinds of representation (e.g. text, numeric, etc). Note that the transformation represents a subset of the information in the reaction mechanism, and it is quite possible to define transformations that have no corresponding valid reaction mechanism. However, when representing information on computer we often represent a more detailed level of information about the transformation than we would see on paper (e.g. explicit structures, mapping of one structure to another). In a database, we might store the transformation, the reaction mechanism, or both. We of course already know how to represent the 2D structures, with SMILES, InChI, MDL MOL files and so on. However, we need a way to map reactants to products and thus represent the whole reaction. One way to do this is with Reaction SMILES and SMIRKS (already introduced in
44http://en.wikipedia.org/wiki/Category:Organic_reactions 45http://www.amazon.com/Organic-Chemistry-6th-Robert-Morrison/dp/0136436692

Introducing cheminformatics Page 31 of 64 © Copyright David Wild, 2012-2013 Academic Library Version
Lesson 2). Reaction SMILES extends SMILES to allow identification of products and reagents, and the mapping between them.SMIRKS goes further and allows the definition of transformations that do not contain complete structures, but rather fragments represented in a SMARTS-like way. Connection table formats can be modified to incorporate a variety of reaction information - for example an extension of the MDL MOL/SD File called an RXN file defines structures as reactants or products. In the same way that several MOL files can be contained in an SD file, several RXN files can be contained in an RD file. Note there is currently no equivalent of Reaction SMILES or SMIRKS for InChIs.
Reaction databases
Historically, books have been published that index and describe organic reactions. The most famous is the Beilstein Handbook of Organic Chemistry46. This slowly migrated into the Beilstein Database , now one of the largest repositories of reactions, distributed by Elsevier as part of their Reaxsys system. 47 Other databases include Chemical Abstract Service CASREACT48and SPRESI49 . There are now also some free databases such as The Chemical Thesaurus 50and WebReactions51 It is important to recognize two things about reaction databases: first, they can only exist with a source of reactions. Usually this source is the scholarly literature, from which reactions have to be manually extracted. Second, reaction databases are distinct from synthesis planning systems such as CAESA 52 and WODCA53that attempt to assist the chemist with reaction planning (through rules, etc) but don't necessarily sit on top of a comprehensive, detailed reaction database. As with simple structure databases, bespoke systems and interfaces developed, often incorporating searching of both compounds and reactions. e.g. DiscoveryGate and SciFinder Scholar . These systems are developed particularly for use by chemistry librarians and synthetic chemists and will be addressed in the lesson on cheminformatics for chemistry libraries. To implement a reaction database, just as we can store a SMILES in a database text field, so we can also store a Reaction SMILES or a SMIRKS in a text field. Most chemistry database cartridges can work with these. Here are the ones that do handle reactions:
• MDL Isentris • Tripos Auspyx • Daylight DayCart • Accelrys Accord • IDBS ActivityBase • ChemAxon JChem • gNova CHORD
As well as the straightforward structure, substructure and similarity searches, we also want to be
46 For a concise overview of the Beilstein handbook, see http://www.indiana.edu/~cheminfo/33-16.html 47https://www.reaxys.com/info/ 48http://www.cas.org/expertise/cascontent/casreact.html 49http://www.spresi.com/ 50http://www.chemthes.com/ 51http://webreactions.net/ 52http://www.simbiosys.ca/caesa/index.html 53http://www2.chemie.uni-erlangen.de/software/wodca/
Introducing cheminformatics Page 32 of 64 © Copyright David Wild, 2012-2013 Academic Library Version
able to carry out a few more specialized forms of searching on reaction databases. In particular, we often want to limit searching to just products or reagents - for example, find all the reactions that have an exact match to the query in the products. This quickly leads to more advanced kinds of searching, for example:
• Finding reactions that contain particular substructures in the reagents and products • Finding different synthesis routes for a named reaction (e.g. find all Dies-Alder reactions) • Finding reactions which are similar to a query reaction • Finding chains of reactions that can be used to create a particular structure from a set of
starting materials And, of course, these queries may be combined with text / numeric searching. So searching reaction databases can get quite complicated. The problem of finding chains of reactions is particularly interesting, as these chains are really paths through a graph.
Questions
1. Explain the difference between a reaction equation, a reaction mechanism and a transformation
2. Follow through the WebReactions tutuorial.54 When you specified the query, was it a reaction equation, mechanism or transformation that you specified?
3. Create a SMIRKS string for the query you specified in the WebReactions tutorial. 4. Why do you think there are few public, free databases of reactions?
54http://webreactions.net/tutorial.html

Introducing cheminformatics Page 33 of 64 © Copyright David Wild, 2012-2013 Academic Library Version
Lesson 6. Representing 3D chemical structures on computer
Learning objectives
1. Know the sources of 3D structural information 2. Understand the representational challenge of comformational flexibility and the two ways of
dealing with it 3. Understand coordinate tables and distance matrices 4. Know what a 3D pharmacophore is, and how it can be used in database searching
Where do 3D structures come from?
2D chemical structures can be derived from knowledge of the atoms that are present in a compound, and how they are bonded together. This is common knowledge for all substances, and thus we do not need to consider where they come from. However, there is no a priori information available to us that would reveal what the 3D structure of a compound would be. Indeed, as we shall see, all compounds are flexible to some degree, so the 3D structure will change over time. And we must bear in mind that, as with 2D structures, we are dealing with a model, not with reality itself (which is, to the best of our knowledge so far, a grand scale fuzzy quantum event!). There are three main sources of 3D structural information – two experimental techniques,X-ray crystallography and NMR spectroscopy, and one computational - computer-generated 3D structures. The experimental techniques will not be covered further here, except to say that both will produce a set of atomic coordinates for the compound in a particular form (for example, in crystalline form for X-ray structures). This is by no means necessarily the form that the compound will take for example when binding to a protein target, so we need to be able to find ways to handle the flexibility of the molecule.
Dealing with conformational flexibility
Most compounds have rotatable bonds, which means that the whole molecule can flex into many different conformers in 3D. Thus there is not just one 3D structure, but for any one compounds
there is an infinite number (or less than infinite if, say, we consider discreet rotation units) of possible conformers.However, not all conformers are equal. In particular, molecules prefer to be in low energy states instead of high energy states. Therefore we may decide to store just one low energy conformer and let algorithms flex the molecule as
needed, or produce several conformers (say a sampling of different lowe energy orientations). Thus we can deal with conformational flexibility either at the representation level, by storing multiple conformers, or at the algorithm level, by providing just one representation of the 3D structure and requiring that any program that requires conformational flexibility to be taken into accound handles the sampling of conformational space itself. Before addressing conformational flexibility, we have to decide how to determine whether a bond is rotatable. A good working definition is: any single bond which is not part of a ring, is not terminal (e.g. Methyl) and is not in a conjugated system (e.g. an Amide). However, this is not

Introducing cheminformatics Page 34 of 64 © Copyright David Wild, 2012-2013 Academic Library Version
perfect: we do know conjugated system bonds can rotate to a degree (based on the degree of conjugation), and we can have flexing of rings (say between chair and boat conformations for cyclohexane). When we are discussing the rotation of rotatable bonds, you will hear two terms used: the torsion angleand the dihedral angle. These two terms are synonymous, and refer to the relative position, or angle, between the A-B bonds and the C-D bonds when considering four atoms connected in the order A-B-C-D (see diagram above).
Representing 3D conformers on computer
In addition to the information stored in the 2D structure (the atoms and how they are connected by bonds), for 3D conformers we also need to be able to store the coordinates of atoms relative to some origin. There is no well established linear notation for storing this information, although Sybyl Line Notation (SLN) does allow atoms to be labelled with coordinates. More usual is a connection-table type file format, often either an MDL MOL or SD File or a Sybyl MOL2 file. Other formats can be used too, such as CML, PDB and for the coordinates simply anXYZ file. Internally, we can create a coordinate table which is simply an extension of the atom lookup table to store X, Y and Z coordinates for each of the atoms relative to a defined origin. It is normal for this coordinate system to be based on Ångström (i.e. one unit is one Ångström). Here is an example:
Once we have a coordinate table, we can derive from it a Distance Matrix that specifies the distance (in Ångström) between any two atoms in the conformer. For example:

Introducing cheminformatics Page 35 of 64 © Copyright David Wild, 2012-2013 Academic Library Version
Note that this constitutes a fully connected graph. In addition to storing coordinate tables and distance matrices for 3D conformers, we can also use various ways of specifying degrees of flexibility of a compound in 3D. For example we can specify two coordinate tables, one which stores a minimum X, Y, and Z value for an atom, and one which stores a maximum value. Or we can similarly specify minimum and maximum distance matrices.
Generating and manipulating 3D structures with a computer
There are a variety of programs that will "convert" 2D structures (say in SMILES format) to 3D structures. Often these will produce "valid" 3D structures, but not necessarily an energy minimized one (unless they are combined with an energy minimization tool as described below). These programs may output a single structure, or an ensemble of 3D structures. Most of these methods are fragment & rule based, that is they split the 2D structure into small fragments that are then matched to pre-defined dictionary of 3D fragments. By a series of rules and theory these are then combined together into a full 3D structure. Other methods use Distance Geometry methods to rapidly sample the "conformational space" of a molecule to look for valid conformations based on distance bounds. An example of this latter approach is SMI23D, a freely available program from Indiana University that will generate a 3D structure (in SD file format) from a SMILES string. You can try it out by pasting into your browser the URL http://cheminfov.informatics.indiana.edu/rest/thread/d3.py/SMILES/ followed by a SMILES string, for example:
http://cheminfov.informatics.indiana.edu/rest/thread/d3.py/SMILES/c1ccccc1
An SD File will be automatically downloaded. You can also access the code for SMI23D at http://cicc-grid.svn.sourceforge.net/viewvc/cicc-grid/cicc-grid/smi23d/ . Most 3D structure generation methods also perform energy minimization, which can also be applied to 3D structures from any source (e.g. Xray or NMR). An energy minimization algorithm will take a conformer as input, and will attempt to rotate and flex the molecule such that the potential energy is minimized. To do this, we can apply any one of many optimization algorithms.

Introducing cheminformatics Page 36 of 64 © Copyright David Wild, 2012-2013 Academic Library Version
Some of these will only find local minima (such as hill climbing), whilst others will attempt to find global minima.
3D pharmacophores
A pharmacophore is a set of molecular features that is required for binding to a particular protein target. It is almost always used to refer to structural features (or derivatives such as hydrogen bonding potential), and is usually used in reference to 3D structures. A pharmacophore may be defined as set of features and distance bounds of these features from each other in 3D, and can be generated from either a target, or from a set of ligands. For example, "An OH group between 2 and 5 Ångström away from a carboxyl oxygen, both of which are 7-8 Ångström from a benzene ring":
A pharmacophore can be used as a query to a database too. Note that a pharmacophore search is like a substructure search in that it is a subgraph query on a fully-connected distance matrix graph. A pharmacophore can be represented in a variety of ways: for instance, a distance matrix of pharmacophore points (with a dictionary for point types which may contain coordinates of 3D substructures or SMARTS of 2D features). Note that we often need to be able to represent distance ranges (rather than exact distances) and we also may need to represent ambiguity in pharmacophore points.
3D descriptors and fingerprints
Just as with 2D, we can generate 3D structural or property-based descriptors. The equivalent of 2D structural keys are 3D pharmacophore "fragments". Sometimes these are called triplets or quadruplets based on the number of atoms in each of the fragments. Note that these fragments can contain distance ranges and ambiguous points just like a full pharmacophore. For a set of molecules, there are a huge number of triplets or quadruplets that can be generated, so these are usually hashed down onto a fixed number of bits. A variety of other kind of descriptors can be created for 3D ranging from atom-based (e.g. partial charges generated from semi-empirical methods) to full molecule field-based (such as electrostatic, steric and hydrophobic fields). These can be used for a variety of applications (molecular alignment, docking, and similarity)
Databases of 3D structures
A good overview of how databases of 3D structures can be used in drug discovery is given on NetSci 55. Pharmacophore searching is the equivalent of substructure searching in 2D: we supply a pharmacore query and then return all of the molecules which could satisfy the query (either by flexing the molecule, or by storing multiple conformers).Similarity searching in 3D can
55http://www.netsci.org/Science/Cheminform/feature06.html

Introducing cheminformatics Page 37 of 64 © Copyright David Wild, 2012-2013 Academic Library Version
be simply a matter of calculating at Tanimoto coefficient or Euclidean distance between two fingerprints (as in 2D). However there are several other ways of calculating 3D similarity that are not based on 3D similarity - for example by comparing distance matrices and mapping atoms in one molecule onto another, or by aligning the molecules to maximize the overlap of fields, and then measuring the amount of overlap between fields.
Available 3D databases
The most comprehensive database of 3D chemical structures generated by x-ray crystallography is the Cambridge Structural Database56 . This database contained 469,611 structures as of January 2009. The database comes with a variety of tools for viewing and analyzing the structures, including several free services57 . In particular, there is a free 500 compound subset of the database available for teaching purposes. PubChem now also contains 3D structures of compounds and permits a variety of kinds of searching. Much more on this can be found in the Journal of Cheminformatics PubChem3D Thematic Series58.
Questions
1. What arguments do you think there may be in favor of each of the two ways of dealing with conformational flexibility?
2. Generate 3D structures for Chlorobenzene and Bromobenzene using the SMI23D tool. What are the MMFF94 energies of the two structures?
3. In what instance might a pharmacophore search be more useful that a 2D substructure search in a drug discovery project?
56http://www.ccdc.cam.ac.uk/products/csd/ 57http://www.ccdc.cam.ac.uk/free_services/ 58http://www.jcheminf.com/series/PubChem3D

Introducing cheminformatics Page 38 of 64 © Copyright David Wild, 2012-2013 Academic Library Version
Lesson 7. Chemical structures on the web and in the scholarly literature
Learning objectives
1. Know the four requirements for chemical information on the web and in documents to be useful
2. Understand the problems of making structures in documents machine readable 3. Understand how InChI can be used for discoverability 4. Understand the importance of contextualization
Requirements for handling chemical information in documents
The web is used increasingly for all kinds of searching, and an increasing amount of scientific knowledge is available in electronic documents and electronic forms of journal articles. However, searching these sources for chemical information can be a challenge. For chemical structure information on the web and in journal articles to be useful, it has to be:
• Machine readable – structures referenced in documents should be in a form that can be read and understood properly by a computer
• Discoverable –it should be possible to carry out searches using chemical compounds as queries (and ideally, structure, substructure and similarity searching) for documents that contain matching structures.
• Accessible – once a matchine document has been identified, it should be possible to access the whole content of the document by a computer for further processing and/or human consumption
• Contextualized – it should be possible to relate the chemical information in a documentto other relevant information, such as biological activities, chemical properties, reaction descriptions, and so on.
Each of these will be considered below.
Making structures in documents machine readable
Most documents are not designed with machine processing in mind: they are designed to be read by humans. Humans are very good at pattern recognition and language processing, and this is reflected in how compounds are represented. There is thus a very well established field of “text mining” and natural language processing, focused on extracting computer-understandable meaning from documents designed for humans. However, chemical compounds and structures as they are commonly referenced in documents prove to be particularly difficult to identify and process on a computer. For instance, think about some ways that the drug ibuprofen might be referenced in a document:
• Any one of the following synonyms: Ibuprofen, Motrin, Andran, Brufen, Liptan, Advil, Butylenin, Ibuprocen, Anflagen, Buburone, 2-[4-(2-Methylpropyl)Phenyl]Propanoic Acid
• (ibuprofen in Japanese) • The text “all over-the-counter NSAIDs” (ibuprofen is an over-the-counter non-steroidal
anti-inflammatory drug in most countries)

Introducing cheminformatics Page 39 of 64 © Copyright David Wild, 2012-2013 Academic Library Version
• 2D or 3D chemical structures (maybe even as part of a reaction equation):
By far the most preferable way to address this is for authors of documents to be mindful of the need to machine read structural information, and to supply machine readable chemical structures in one of the standard formats (SMILES, InChI, ChemDraw file, etc) along with an article - either with a link or reference to the representation within the document, or added as a supplemental material for a journal article. Few web or journal documents contain this information - this situation is changing quickly though with several journals now marking up structures in documents, often with links to databsases like PubChem and ChemSpider. Currently this includes Nature Chemistry59 and some RSC journals through their Project Prospect.60Note that most journal article formats are currently very unfriendly for computers: for example PDFs are very good aesthetically but "destroy" data (e.g. a table becomes an image or just text). An alternative has been dubbed the "datument"61. Since, most documents do not currently supply chemical structure information at source, we have to try to recreate machine-readable forms from human readable forms. Given the complexity, there is no perfect way to do this, but there are a few tools which can at least help:
• Name ontologies (really just synonym lookups) • Name to structure conversion programs (e.g. OSCAR362 and Lexichem63) • Image to structure conversion programs (e.g. ChemReader64 , CLiDE65)
Natural language processing can help to differentiate structural information from regular text based on syntactic context. These methods are far less than perfect, but do work quite well, in the main. However, there are many challenges: for example, how to handle references to groups of compounds or generic compounds (NSAIDs, COX-2 inhibitors, etc), and complex diagrams. In the example above, it is unclear whether a document containing the term “all over the counter NSAIDS” should be considered to refer to Ibuprofen or not; the reference is indirect rather than direct, and whether Ibuprofen is even “over the counter” might change over time or in different locations. Note that compounds in the abstracts of articles in the popular PubMed dataset have now been linked to compounds in the PubChem dataset through such a process.
Discoverability
Once chemical structure information has been identified in documents, it is easy to link it using stardardized techniques, to make it at least theoretically discoverable. For example, in an HTML document we might simply have a link to a structure file, e.g. 59http://www.nature.com/nchem 60http://www.rsc.org/Publishing/Journals/ProjectProspect/index.asp 61http://journals.tdl.org/jodi/article/view/130/128 62http://sourceforge.net/projects/oscar3-chem/ 63http://www.eyesopen.com/lexichem-tk 64http://journal.chemistrycentral.com/content/3/1/4 65http://www.simbiosys.ca/clide/
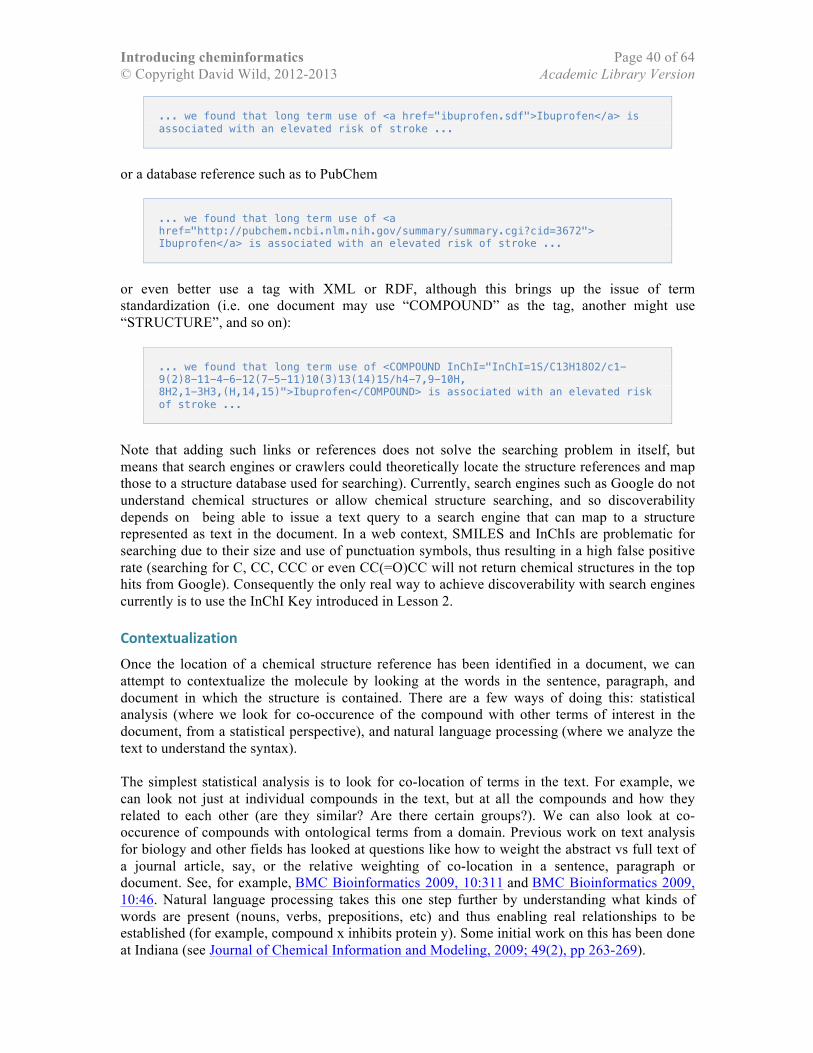
Introducing cheminformatics Page 40 of 64 © Copyright David Wild, 2012-2013 Academic Library Version
... we found that long term use of <a href="ibuprofen.sdf">Ibuprofen</a> is associated with an elevated risk of stroke ...
or a database reference such as to PubChem
... we found that long term use of <a href="http://pubchem.ncbi.nlm.nih.gov/summary/summary.cgi?cid=3672"> Ibuprofen</a> is associated with an elevated risk of stroke ...
or even better use a tag with XML or RDF, although this brings up the issue of term standardization (i.e. one document may use “COMPOUND” as the tag, another might use “STRUCTURE”, and so on):
... we found that long term use of <COMPOUND InChI="InChI=1S/C13H18O2/c1-9(2)8-11-4-6-12(7-5-11)10(3)13(14)15/h4-7,9-10H, 8H2,1-3H3,(H,14,15)">Ibuprofen</COMPOUND> is associated with an elevated risk of stroke ...
Note that adding such links or references does not solve the searching problem in itself, but means that search engines or crawlers could theoretically locate the structure references and map those to a structure database used for searching). Currently, search engines such as Google do not understand chemical structures or allow chemical structure searching, and so discoverability depends on being able to issue a text query to a search engine that can map to a structure represented as text in the document. In a web context, SMILES and InChIs are problematic for searching due to their size and use of punctuation symbols, thus resulting in a high false positive rate (searching for C, CC, CCC or even CC(=O)CC will not return chemical structures in the top hits from Google). Consequently the only real way to achieve discoverability with search engines currently is to use the InChI Key introduced in Lesson 2.
Contextualization
Once the location of a chemical structure reference has been identified in a document, we can attempt to contextualize the molecule by looking at the words in the sentence, paragraph, and document in which the structure is contained. There are a few ways of doing this: statistical analysis (where we look for co-occurence of the compound with other terms of interest in the document, from a statistical perspective), and natural language processing (where we analyze the text to understand the syntax). The simplest statistical analysis is to look for co-location of terms in the text. For example, we can look not just at individual compounds in the text, but at all the compounds and how they related to each other (are they similar? Are there certain groups?). We can also look at co-occurence of compounds with ontological terms from a domain. Previous work on text analysis for biology and other fields has looked at questions like how to weight the abstract vs full text of a journal article, say, or the relative weighting of co-location in a sentence, paragraph or document. See, for example, BMC Bioinformatics 2009, 10:311 and BMC Bioinformatics 2009, 10:46. Natural language processing takes this one step further by understanding what kinds of words are present (nouns, verbs, prepositions, etc) and thus enabling real relationships to be established (for example, compound x inhibits protein y). Some initial work on this has been done at Indiana (see Journal of Chemical Information and Modeling, 2009; 49(2), pp 263-269).
Introducing cheminformatics Page 41 of 64 © Copyright David Wild, 2012-2013 Academic Library Version
Accessibility
There are three relevant levels of accessibility: access to the chemical structure information; access to related information for contextualization and access to the full text of the article. Whilst web pages normally allow all three levels of access, we currently we have a "mixed bag" of accessibility for journal articles. No journals currently give direct access to chemical structure and ontology information in a truly open fashion (i.e. with the ability to download fully ontologically marked-up articles) except the limited senses described above. Open Access journals give free access to the full text of the article, but the number in chemistry is very limited (e.g. Chemistry Central Journal66) and access is generally limited to HTML and PDF formats. The mandate that all U.S. government funded research publications be made freely available after a year, and the resultant PubMed Central67 archive may also positively impact accessibility.
Questions
1. What is the boiling point of 2-ethyl-2-hydroxy-3-oxo-butanoic acid? Try to find it out on Google using the searches “2-ethyl-2-hydroxy-3-oxo-butanoic acid boiling point” and "VUQLHQFKACOHNZ-UHFFFAOYSA-N boiling point”. Compare the results you get.
2. On PubMed (http://www.ncbi.nlm.nih.gov/pubmed) do searches for the terms “paracetamol” and “acetaminophen”. Why do some of the results not contain the specified term? Why do you think there are nearly the same number of hits, but not quite?
3. What might be some difficulties in contextualizing IC50 biological activity data for a compound expressed in a paper?
66http://journal.chemistrycentral.com/ 67http://www.ncbi.nlm.nih.gov/pmc/

Introducing cheminformatics Page 42 of 64 © Copyright David Wild, 2012-2013 Academic Library Version
Lesson 8. Cheminformatics in the chemistry library
Learning objectives
1. Know the commercial tools and datasets available for searching of chemistry literature sources
2. Know the free cheminformatics resources, datasets and tools available that are relevant to the chemistry library
3. Understand some of the emerging trends in use of searching tools and cheminformatics in the chemistry library
Commercial tools and datasets covering the chemistry literature
Generally, commercial tools for chemistry libraries have evolved from partnerships between commercial software producers and vendors, abstracting/indexing services and in some cases journal publishers. Two of the most widely known are a partnership between Chemical Abstracts Service, FIZ Chemie, and the Japan Science and Technology Corporation, resulting in several hundred available databases under the STN branding.68 These databases were traditionally made accessible through expert searching tools, but can now be accessed through the popular user-friendly Scifinder Scholar tool from Chemical Abstracts Service69 which allows text, structure and similarity searching of curated datasets extracted from the literature and patent repositories. The searchable CAS datasets include the CAS Registry, a large set of chemical compounds,CAS React, a large dataset of reaction data extracted from the literature, and MARPAT, a set of generic structures and related information extracted from the patent literature.An alternative is provided by the Reaxys tool from Elsevier which gives access to the Beilstein dataset, derived from the Handbook of Organic Chemistry, and the Gmelin dataset, a large dataset of organometallic and inorganic compounds. Other smaller commercial datasets exist, including GVKBIO,70 a set of datasets on approved drugs, clinical candidates, and target inhibition information for compounds; WOMBAT,71 a dataset linking compounds with targets and sequence information for the targets; MDDR (MDL Drug Data Report), 72 containing information on drugs and potential drugs extracted from published documents, meeting reports and congress proceedings; and the DNP (Dictionary of Natural Products),73 which includes chemical and biological data on many compounds.
Free cheminformatics resources, datasets and tools for the chemistry library
There are now a wide variety of free resources, datasets and tools available on the web that are of use in the chemistry library, usually as a complement to the commercial tools. An excellent meta-resource is the Chemical Information Sources Wiki,74 developed by Gary Wiggins, which contains several chapters on searching strategies for different kinds of chemical information, plus SIRCh (Selected Internet Resources for Chemistry) containing links to web resources for
68http://info.cas.org/support/stngen/index.html 69http://www.cas.org/products/sfacad/index.html 70http://www.gvkbio.com/ 71http://www.sunsetmolecular.com/ 72http://accelrys.com/products/databases/bioactivity/mddr.html 73http://www.chemnetbase.com/ 74http://en.wikibooks.org/wiki/Chemical_Information_Sources
Introducing cheminformatics Page 43 of 64 © Copyright David Wild, 2012-2013 Academic Library Version
databases and tools to effect these searches. Other useful general resources are the Student’s Guide to Free Chemistry Software75 and Whilst there are no free datasets or tools available that search heavily manually curated data (although some are close, such as ChEMBL76), a lot of information can be gained by carrying out searches on the freely available chemistry datasets such as PubChem and ChemSpider (referenced previously). These datasets cover increasingly large numbers of compounds, although as described in a recent Journal of Cheminformatics paper,77 commercial sets continue to represent unique chemistry not found currently in the public sets. Chemical structure, substructure, similarity, or text-based searches of these sets can be used to identify synonyms, experimental and predicted chemical properties, spectral data, referencing journal articles, vendors, biological activities, assay results, and medical classifications, inter alia. Also of use is the NIST Chemistry WebBook,78 which links to fairly extensive physical property data for compounds. A variety of free tools exist for property prediction, which may be useful when experimental property data is not available, although all predictions obviously have to be taken “with a pinch of salt”. Commonly predicted properties include LogP, solubility, polar surface area and pKa., and free online tools including the Molinspiration79 property and bioactivity calculator, and the Virtual Computational Chemistry Laboratory.80 There are also some free standalone prediction programs, including MedChem Designer,81 and the Estimation Program Interface Suite82 from the EPA. Popular commercial offerings are available from ACD Labs,83and Simulations Plus,84 amongst others.
Emerging trends in the chemistry library
Previous studies including one co-authored by the author of this guide85 have shown that whilst the traditional searching tools are still working well for chemists and chemistry librarians, there is an emerging trend in using generic search engines and tools to find answers to chemical problems, especially among the younger generation of chemistry researchers. Whilst an increasing amount of information is available electronically (journal articles, web pages and increasingly books), a variety of“roadblocks”currently exist to the access of this information – subscription journal article content is not generally indexed by search engines, and as described in the previous chapter the requirements of machine readability, discoverability, contexualization and accessibility of chemical information are often poorly met (see previous lesson). A current danger of a web search only approach is that so much information is available electronically on the web that the ease of finding “something” often leads to much information being overlooked, particularly for researchers who are poorly equipped for and inexperienced in finding the information they need. The trends in the academic world are toward more and more
75https://sites.google.com/site/chemistryfreeware/ 76https://www.ebi.ac.uk/chembl/ 77Journal of Cheminformatics, 2009, 1:10 78http://webbook.nist.gov/chemistry/ 79http://www.molinspiration.com/cgi-bin/properties 80http://www.vcclab.org/ 81http://www.simulations-plus.com/Products.aspx?grpID=1&cID=20&pID=25 82http://www.epa.gov/oppt/exposure/pubs/episuite.htm 83http://www.acdlabs.com/home/ 84http://www.simulations-plus.com/ 85 Wild, D.J. and Beckman, R. In Banville, D. (ed). Chemical Information Mining: Facilitating Literature-Based Discovery. CRC Press 2008.

Introducing cheminformatics Page 44 of 64 © Copyright David Wild, 2012-2013 Academic Library Version
end-user searching, which is convenient and inexpensive, but bypasses the experience of librarians and the information depth and quality of specialized tools. Coping with the large and increasing amounts and kinds of information available in a meaningful way will necessarily involve a degree of automation of some traditionally human activities. Semantic technologies will likely form part of this. Several important roadbloacks that still remain to be overcome have been identified including: 1. Liberation of information in journal articles. As noted in the previous chapter, access to
machine readable information in journal articles is sporadic 2. The ability to assign and retrieve meta-information pertaining to quality, confidence, curation
level and source of information. 3. Strong security where necessary. Security is an issue in both academia and the
pharmaceutical industry, although it is of greatest concern in the industry, where a security lapse can in the worst case cause a highly expensive loss of competitive advantage. In academia, the consequences are less onerous, although most scientists are eager to protect their own intellectual property particularly in the fragile early stages of research.
4. An open lab culture where possible. Unlike the security issue, which is technical, this is more of a cultural hurdle. Large amounts of useful information are generated by (particularly academic) chemistry laboratories, but never published (or publication is delayed). This can be for a number of reasons: the information might pertain to negative information not considered useful to the research project; there might be intellectual property concerns; the information might be not considered yet publishable in journals. The problem of publication bias (the tendency to publish only positive results) is widely studied and any solution goes beyond the scope of chemical information. Intellectual property concerns would likely require information privacy.
Questions
1. You are working with a chemist searching for information on a particular kind of displacement reaction. What commercial tools would you use? How would you specify the query? Would you supplement this with use of free / web based tools, and if so, which ones?
2. Pick a compound, and look for its boiling point from several sources, preferably both commercial and free. How do the results compare? How would you decide which one is the “right” answer?
3. Given what you know about cheminformatics so far, how might you help someone who needs to know the LogP of a compound which is not available in any public or commercial sources?

Introducing cheminformatics Page 45 of 64 © Copyright David Wild, 2012-2013 Academic Library Version
Lesson 9. Analyzing chemical datasets using clustering and diversity
Learning objectives
1. Understand the three main applications of cluster analysis in cheminformatics 2. Understand how hierarchical clustering methods work 3. Understand how nonhierarchical clustering differs from hierarchical clustering 4. Know the difference between descriptor space, chemistry space, and drug space 5. Understand the difference between coverage methods and relative diversity Our similarity measures for 2D and 3D structures, along with a wide variety of descriptors, allow us to use a variety of techniques which order data points into groups by similarity (cluster analysis) or analyze datasets to see how similar or dissimilar the data points are to each other (diversity analysis).
Cluster analysis
Cluster analysis refers to a group of statistical methods that are used for identifying groups ("clusters") of similar items in multidimensional space. They require a measure of similarity between items to be defined. To illustrate this, let's imagine a simple 2D space (say, two property descriptors), so we can take a look at the points in this space visually. In the diagram below, the blue circles represent compounds plotted in this space, and the red circles one possible set of clusters. Note that there is not a definitive clustering: determining groups is subjective and dependent on the method used to identify them. One might onsider the two leftmost clusters to be actually one cluster, for instance. Data points that are not put into groups are called singletons.
Cluster analysis methods have been applied in many different areas, and are now widely used in fields like data mining, pattern recognition and machine learning. In cheminformatics, clustering methods are used for three main purposes: Grouping compounds into chemical series (or something approximating to this), as a way of organizing large datasets. For example, it is easier for a chemist to browse through 500 clusters (where the molecules in a cluster are similar) than 50,000 arbitrarily ordered compounds Identifying new bioactive molecules: if a compound with unknown activity is in a cluster that is

Introducing cheminformatics Page 46 of 64 © Copyright David Wild, 2012-2013 Academic Library Version
biased towards compounds with known activity, we can make a prediction of the probability of activity of the unknown compound (for example, if 75% of the compounds in the cluster are active, we might say the probability of activity is 75%). Picking representative subsets: if we cluster a set of compounds, we can then take one compound from each cluster as a "representative" of this cluster, and the total set of representative compounds as a representative subset of the whole dataset. This is sometimes more useful than random selection.
Hierarchical clustering
Clustering methods can be either hierarchical or non-hierarchical. Hierarchical clustering creates a "tree" of clusters, with, at the bottom level, every item in its own cluster, and at the top level all items in one cluster. Algorithmically, this can be done either by starting at the bottom and progressively merging clusters (agglomerative) or starting at the top and breaking up clusters (divisive). Mostly, the hierarchical agglomerative methods work in the same algorithmic fashion, but differ in the way that they decide which clusters to merge at each level. The Ward's method (described in detail below) has been used widely in cheminformatics, and is distinguished by merging clusters which, when merged, have the smallest increase in variance from the mean (i.e. create the "tightest" cluster when merged). Other methods include single linkage (the clusters are merged with the minimum distance between the nearest two points in each cluster); complete linkage (the clusters are merged with the minimum distance between the farthest points in each cluster); and group average (the minimum value of the mean distance between all pairs in the two clusters). Due to their computational complexity and memory requirements, hierarchical methods do not scale well to very large datasets, and thus they are giving way to faster, nonhierarchical methods. In order to create a partitioned grouping of a dataset (i.e. where every item is in one and only one cluster, or is a singleton), one must select a horizontal slice from this tree. The only divisive method that has been used widely is Divisive K-means. To see how these methods work, let's take a look at the sample data set that we used in the 2D databases lesson. Hierarchical methods work by initially putting every item in a cluster by itself, at the bottom level (with n clusters, where n = the number of points). It then identifies the two clusters to merge (depending on the methods as described above) and merges them to form a new cluster at the next level. The next level up will therefore consist of one cluster with two points, and all the rest of the points in clusters by themselves (i.e. there will be n-1 clusters). The process repeats until there is just one cluster at the top containing all the points, resulting in a cluster hierarchy. This is demonstrated for our sample set below:

Introducing cheminformatics Page 47 of 64 © Copyright David Wild, 2012-2013 Academic Library Version
In order to extract a partition from the hierarchy (i.e. a grouping of compounds where every compound is in one and only one cluster), we need to select a "level" from this hierarchy. There are many algorithms for selecting "good" levels (see for example those discussed in Wild & Blankley86).
Nonhierarchical clustering
Nonhierarchical methods can use a variety of algorithms, but they generally all produce a single partitioning of the dataset into clusters (versus a tree which can result in many partitions). Some of the more common nonhierarchical methods are Jarvis-Patrick, K-means and K-medioids. Jarvis-Patrick (JP) is a non-hierarchical method where, for each compound in a set, the j nearest neighbors (i.e. other compounds in the dataset that are the most similar) are identified. Compounds are then placed in the same cluster if they (i) are in each others' list of j nearest neighbors, and (ii) havek of their j nearest neighbors in common. This method doesn't require level selection, but does require j and k to be predefined. Tanimoto is usually used as the measure of similarity. JP is fast, but has had mixed results in cheminformatics in terms of quality. K-means is more widely used than JP. It requires that the number of desired clusters m be known in advance. An initial set of m cluster centroids is created, for example by randomly selecting compounds to use as centroids. Each of the n items is then placed into the nearest cluster, by calculating the similarity between the item and each of the cluster centroids. After one pass through all of the items, the centroids are recalculated (as the center of the newly formed clusters). Since this will change the assignments to clusters, then the process is repeated,
86Journal of Chemical Information and Computer Sciences, 2000, 40, 155-162

Introducing cheminformatics Page 48 of 64 © Copyright David Wild, 2012-2013 Academic Library Version
reassigning members to clusters, until no more items change cluster (i.e. the clusters are stable). Generally only a few (<100, often <10) iterations are required to settle. K-medioids is a derivative of K-means that is implemented as PAM (Partitioning Around Medioids) in the R statistical package (and thus is is commonly used in this environment). It differs from K-means in that it uses real exemplars, or "medioids", to represent cluster centers, rather than centroids. Many scholarly articles have been written pertaining to the use of clustering in cheminformatics. Some good ones to start with are:
• Willett, P. et al., Chemical Similarity Searching, J. Chem. Inf. Comput. Sci., 1998, 38, 983-996
• Barnard, J.M and Downs. G.M. Clustering of Chemical Structures on the Basis of Two-Dimensional Similarity Measures, J. Chem. Inf. Comput. Sci, 1992, 32, 644-649
• Downs, G.M. and Barnard, J.M. Clustering methods and their uses in Computational Chemistry, G.M.Downs and J. M. Barnard, Reviews in Computational Chemistry, 2002, 18, 1-40
Diversity analysis
Diversity Analysis gained popularity in the late 1990’s in response to the following needs in the pharmaceutical industry:
• There was much interest as to how well the corporate collections of compounds held by pharmaceutical companies “covered” possible chemistry / drug space
• Combinatorial Chemistry experiments were producing many new compounds, and people wanted to know if these compounds added anything new (in terms of chemical or biological functionality) to their corporate collections, i.e. if they made the datasets more diverse, or just replicated what was already in there
• Libraries of thousands of compounds became available for purchase – are they worth the money?
This provoked a discussion about "descriptor spaces", i.e. the multidimensional Euclidean spaces created by treating each descriptor of a compound as a dimension. Of particular interest was how these descriptor spaces might map to conceptual "chemistry space" (i.e. if you made all the compounds that could theoretically be made, the chemistry space represents the regions of a multi-dimensional descriptor space - as defined by a given descriptor set - that would be occupied), and "drug space" (the regions of chemistry space that would be inhabited by drug molecules). Conceptually, we could think of something like this for an imaginary two-dimensional space as shown in the diagram.

Introducing cheminformatics Page 49 of 64 © Copyright David Wild, 2012-2013 Academic Library Version
Coverage and cell-‐based methods
Once one has defined these spaces, one can consider identifying regions of chemistry or drug space that are or are not covered by a collection, and increasing the diversity of a collection by adding more compounds that would increase the coverage of chemistry or drug space. The most straightforward way of performing this kind of analysis is to choose two or three descriptors, and to plot compounds in the two or three dimensional space created by these descriptors, indicating whether the compounds are drugs or not (in the case of differentiating drug and chemical space). For an example of this, see Shemetulskis, et al.87. Cell-based methods have also been used, that discretize each dimension into a number of bins, and thus create "cells" in Euclidean space at the intersection of these bins. One can then determine how many of these cells are populated and the extent to which they are over or under represented relative to the space as a whole.
Relative diversity
Additionally, several methods were developed for measuring relative diversity, i.e. how internally dissimilar the compounds are in a set. The most straightforward way of measuring this latter property, is to calculate the mean inter-molecular similarity of all the pairs of compounds in a set using the Tanimoto coefficient, and then subtract this from 1 as a measure of diversity. It is important to recognize that this doesn't say anything about the how much the set covers a particular space, just how dissimilar the compounds in a set are to each other. One can also perform cluster analysis on a set, and identify which clusters are associated with higher or lower prevalence of compounds of interest (e.g. drug molecules) relative to the dataset as a whole.
Comparing datasets
Both coverage and relative methods can be used to compare sets as well as investigate single data sets. For example, we can answer the question: "how diverse is set A compared to set B?" by comparing the coverage of the sets (e.g. number of cells populated), or by comparing mean dissimilarities of the two sets. We can answer the question "how different are these two sets of compounds?" by looking at the overlap with coverage methods, or seeing how a mean dissimilarity of one set is changed by adding the second.
Diverse subset selection
It is also often desirable to extract a diverse subset, i.e. a subset of the compounds in a database that represents the chemical or biological diversity of a set as a whole. Note that this is different to taking a random subset, which merely attempts to sample the distribution in a set. There are several ways we can use to pick a diverse subset. With a cell-based coverage approach, we can take a single compound as representative of an entire cell, or of a set of cells if there are more populated cells than desired subset members. If we are taking a relative approach, we can adapt the mean inter-molecular similarity approach into a Dissimilarity-based compound selection (DBCS). For example, we can select an initial compound (e.g. randomly), then select the next compound as the one which is maximally dissimilar to the first, then the next which is maximally dissimilar to the first two, and so on.
87 Shemetulskis, N.E. et al., Journal of Computer Aided Molecular Design, 1995, 9, 407-416.

Introducing cheminformatics Page 50 of 64 © Copyright David Wild, 2012-2013 Academic Library Version
We can also apply cluster analysis to this problem, by clustering a set into n clusters (where n is the size of the desired subset), and then picking a representative from each cluster (e.g. the compound closest to the cluster centroid). There are many articles published on diversity. Here are a few examples:
• New perspectives in Lead Generation II: Evaluating Molecular Diversity, M.J. Ashton, M.C. Jaye, J.S. Mason., Drug Discovery Today, 1996, Vol 1, No. 2
• Molecular Diversity and Representativity in Chemical Datasets, D.M. Bayada, H. Hamersma, V. van Geerestein, J. Chem. Inf. Comput. Sci, 1999, 39, 1-10
• Rapid Quantification of Molecular Diversity for Selective Database Acquisition, D.B. Turmer, S.M. Tyrrell, P. Willett, J. Chem. Inf. Comput. Sci., 1997, 37, 18-22
• • Challenges and prospects for computational aids to molecular diversity, Y. Martin,
Perspectives in Drug Discovery and Design, 1997, 7/8, 159-172 • Descriptors for diversity analysis, R.Brown, Perspectives in Drug Discovery and Design,
1997, 7/8, 31-49 • Cluster-based selection, J.B. Dunbar, Perspectives in Drug Discovery and Design, 1997,
7/8, 51-63 • Enhancing the diversity of a corporate database using chemical database clustering and
analysis, N.E. Shemetulskis, J.B. Dunbar, B.W. Dunbar, D.W. Moreland, C. Humblet, Journal of Computer-Aided Molecular Design, 1995, 9, 407-416
Questions
1. Is using clustering (and extraction of compounds from clusters) to identify representative subsets of datasets a coverage or relative method?
2. How might you attempt to obtain a high quality hierarchical clustering for a dataset that is too large for Ward’s method?
3. Why is it difficult to evaluate clustering methods for how well they organize compounds into chemical series?
4. Which of the datasets in an imaginary 2D descriptor space shown below is the most diverse?

Introducing cheminformatics Page 51 of 64 © Copyright David Wild, 2012-2013 Academic Library Version
Lesson 10. Predicting biological activities of chemical compounds
Learning Objectives
1. Understand the basics of SAR and QSAR, including Hansch and Free-Wilson analyses 2. Understand the difference between linear and non-linear models We have previously discussed the use of 2D and 3D descriptors to characterize compounds, and how these can be used in similarity calculation, clustering, diversity, and so on. In this lesson we are concerned with ways of correlating these descriptors with outcomes, such as biological activities, properties, and toxicity, and the building of predictive models based on these descriptors and correlations. This is a very large topic that we can only cover briefly in this introductory guide.
Quantitative Structure-‐Activity Relationships (QSAR)
The establishment of structure-activity relationships (SAR) in medicinal chemistry predates the use of computers in chemistry, and relies on correlating structural features with experimental results for multiple compounds, usually in the same series. It is common in medicinal chemistry to use synthesis techniques to create several related compounds (e.g. methyl-, ethyl-, butyl- forms), and then to investigate the effect of these synthetic changes on a particular property or biological activity (so we might find, for instance, that extending the Methyl chain reduces a particular activity). The relationship between structure and activity may or may not be quantified. Quantitative Structure-Activity Relationships (QSARs) were originally designed as an attempt to add some mathematical basis to this process, particularly to define the activity as some function of descriptors (note that when the activity is a property or a toxicity, this is sometimes referred to as QSPR and QSTR respectively). If we develop a function that relates descriptors to a particular activity, we can then use the function predictively for compounds where the activity is unknown but the descriptors can be calculated. The earliest examples of QSAR were Hansch analysis and Free-Wilson Analysis, which are actually applications of linear regression . Hansch analysis pertained to property descriptors, and Free-Wilson, which we shall discuss here, to structural descriptors. Free-Wilson defined a function that equates activity (defined as log of 1 / the concentration) with weighted descriptors, the weightings, or coefficients, being determined by linear regression. That is, we have the equation:
Log (1/C) = a1x1 + a2x2 + a3x3 ... where C is the concentration required for activity, x1, x2, x3, etc are the descriptor values (usually 1 or 0 to represent absence or presence of features), and a1, a2, a3, etc are the coefficients derived from linear regression. Linear regression is a generalized technique that aims to optimize the coefficients applied to independent variables so that the dependent variable (in this case Log 1/C) most closely matches the observed value for a set of descriptors. Thus one an think of a regression equation being trained using data with known dependent values, and then being applied predictively to data with unknown dependent values. Linear regression works by minimizing the sum of the differences between the values predicted by the equation and the actual observation. This is nicely illustrated in an online java applet88 at the University of South Carolina. 88http://www.stat.sc.edu/~west/javahtml/Regression.html
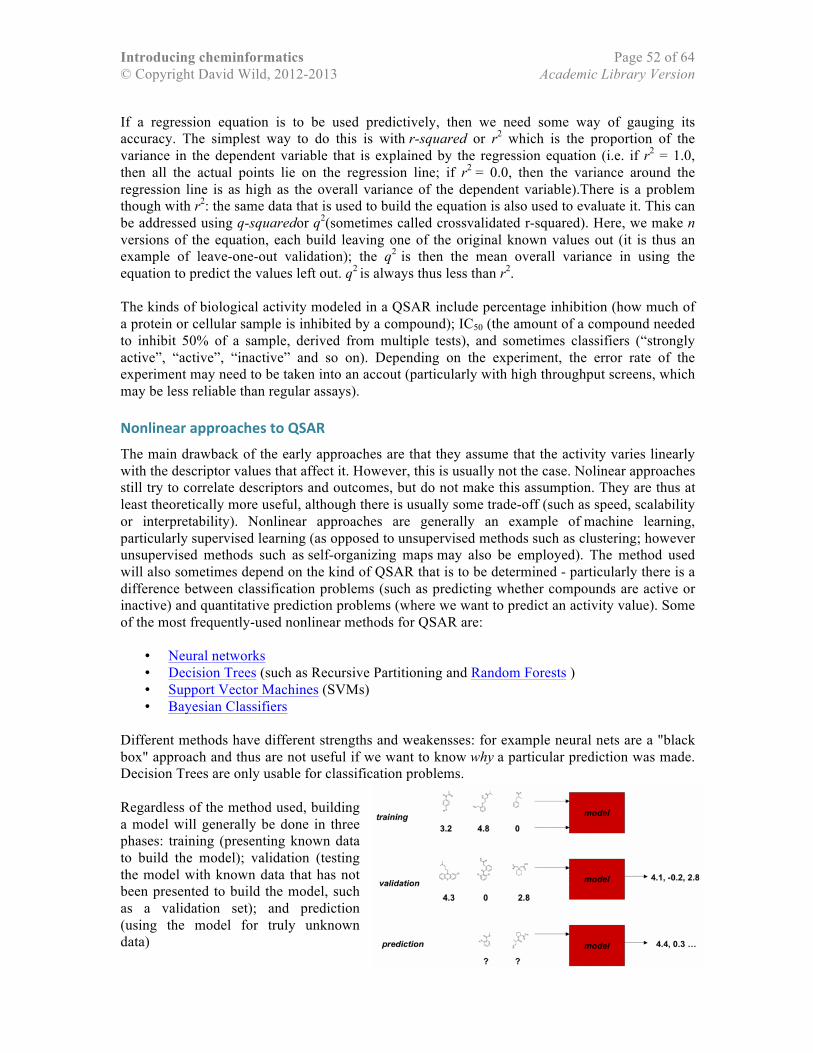
Introducing cheminformatics Page 52 of 64 © Copyright David Wild, 2012-2013 Academic Library Version
If a regression equation is to be used predictively, then we need some way of gauging its accuracy. The simplest way to do this is with r-squared or r2 which is the proportion of the variance in the dependent variable that is explained by the regression equation (i.e. if r2 = 1.0, then all the actual points lie on the regression line; if r2 = 0.0, then the variance around the regression line is as high as the overall variance of the dependent variable).There is a problem though with r2: the same data that is used to build the equation is also used to evaluate it. This can be addressed using q-squaredor q2(sometimes called crossvalidated r-squared). Here, we make n versions of the equation, each build leaving one of the original known values out (it is thus an example of leave-one-out validation); the q2 is then the mean overall variance in using the equation to predict the values left out. q2 is always thus less than r2. The kinds of biological activity modeled in a QSAR include percentage inhibition (how much of a protein or cellular sample is inhibited by a compound); IC50 (the amount of a compound needed to inhibit 50% of a sample, derived from multiple tests), and sometimes classifiers (“strongly active”, “active”, “inactive” and so on). Depending on the experiment, the error rate of the experiment may need to be taken into an accout (particularly with high throughput screens, which may be less reliable than regular assays).
Nonlinear approaches to QSAR
The main drawback of the early approaches are that they assume that the activity varies linearly with the descriptor values that affect it. However, this is usually not the case. Nolinear approaches still try to correlate descriptors and outcomes, but do not make this assumption. They are thus at least theoretically more useful, although there is usually some trade-off (such as speed, scalability or interpretability). Nonlinear approaches are generally an example of machine learning, particularly supervised learning (as opposed to unsupervised methods such as clustering; however unsupervised methods such as self-organizing maps may also be employed). The method used will also sometimes depend on the kind of QSAR that is to be determined - particularly there is a difference between classification problems (such as predicting whether compounds are active or inactive) and quantitative prediction problems (where we want to predict an activity value). Some of the most frequently-used nonlinear methods for QSAR are:
• Neural networks • Decision Trees (such as Recursive Partitioning and Random Forests ) • Support Vector Machines (SVMs) • Bayesian Classifiers
Different methods have different strengths and weakensses: for example neural nets are a "black box" approach and thus are not useful if we want to know why a particular prediction was made. Decision Trees are only usable for classification problems. Regardless of the method used, building a model will generally be done in three phases: training (presenting known data to build the model); validation (testing the model with known data that has not been presented to build the model, such as a validation set); and prediction (using the model for truly unknown data)

Introducing cheminformatics Page 53 of 64 © Copyright David Wild, 2012-2013 Academic Library Version
Given a source of chemical descriptors (fingerprints, property values and so on), and of dependent variables of the compounds represented by these descriptors (such as biological acitivity in assays) there are a variety of generic tools that can be applied to build models, including the free statistics and data mining packages R89 and WEKA,90. Beyesian models in Accelrys’ Pipeline Pilot91 and Konstanz Knime92are also widely used.
Virtual screening
One very common application of QSAR models, particularly nonlinear models is in virtual screening. This means using computer models to predict which of a large number of compounds will bind to a protein target or inhibit a cellular assay. It is thus a computational equivalent to high throughput biological assaying. As well as QSAR models, other methods can be used for virtual screening, including simple chemical similarity to known active compounds, and molecular docking when protein target structure information is available. Virtual screening methods are often classified as either ligand-based (Ligand-Based Virtual Screening, LBVS) – that is, like a QSAR model just looking at the chemical compounds and not the protein target – or protein structure-based (Structure-Based Virtual Screening, SBVS) – that is, looking at how a compound interacts with a protein target structure. When QSAR methods are used for virtual screening, it is common to use classification models (“active” or “inactive”) as well as quantitative prediction models (which attempt to predict a strength of binding).
Evaluating predictive models
Evaluating the effectiveness of a predictive model can be difficult for a variety of reasons: 1. Skewed datasets. Many datasets used for training and validation are skewed, that is they have
many more “inactives” than “actives” (the ratio of actives to inactives may be as high as 1:1000). Dealing with such sets can be statistically problematic (most simply, a model that predicted “inactive” every time could be correct 99.9% of the time). This can be addressed at the training phase by sampling inactives, and also at the validation phase by creating a full confusion matrix (see below).
2. Crossvalidation demonstrates how well a model predicts compounds from the same source as the ones used to train a model. It does not demonstrate how well the model acts prospectively on compounds that are truly unknown. Specifically, the compounds used to train and validate a set have a particular scope (or coverage of descriptor space) which may not be the same as those for which the model is to be used. It is thus important to have a way to determine whether a new compound to be tested with a model is in its “scope” (e.g. by calculating its similarity to the training and validaton set compounds)
3. The experiments used to generate activity values used for training a model may have unknown error rates
Good practices that have been developed for evaluating QSAR models include:
89http://www.r-project.org/ 90http://www.cs.waikato.ac.nz/ml/weka/ 91http://accelrys.com/products/pipeline-pilot/ 92http://www.knime.org/
Predicted Active
Predicted Inactive
Actually Active
True Positives
False Negatives
Actually Inactive
False Positives
True Negatives

Introducing cheminformatics Page 54 of 64 © Copyright David Wild, 2012-2013 Academic Library Version
1. Creation of a confusion matrix in the validation phase of a model. This is a table that shows how the actual data of active/inactive compares to the predicted data of active/inactive. Specifically, it records the number of compounds that were predicted active and were actually active (true positives, TP), the number predicted inactive but actually active (false negatives, FN), the number predicted active but actually negative (false negatives, FN) and predicted inactive and actually inactive (true negatives, TN). A confusion matrix is shown in the diagram. The aim is to maximize the TP and TN rate, and minimize the FP and FP rate. Note that in a skewed dataset (such as the 1:1000 ratio above) with a model that always predicted inactive, the matrix would show a zero TP rate and high FN rate, indicating the problem.
2. The confusion matrix can be used to derive a variety of useful statistical measures including precision (TP/TP+FP), the fraction of the compounds returned as active which are active; recall (TP/TP+FN), the fraction of actives which are actually identified, and f-score (the harmonic mean of precision and recall)
3. Particularly for virtual screening applications where a model returns a ranked list, it is useful to plot a Receiver Operating Curve (ROC curve) which plots true positive vs false positive rates as one goes down the list (it is thus a graphical version of precision and recall). This illustrates how well a model is returning actives near the top of the list, versus being “washed out” by false positives. A numeric measure may also be calculated as the “area under the curve” (AUC). A case has been made recently 93 for the use of ROC curves in cheminformatics.
4. Efforts should be made to understand the scope of models, and to “publish” the training and validation sets so that assessments of their applicability to specific query compounds can be made.
Questions
1. What factors might you use in determining which nonlinear method to use for a particular problem?
2. Is it valid to include both binary and non-binary descriptors when building a model? 3. How might you address the problem of scope of a model? 4. Look at the confusion matrix below for a validation set of 1000 compounds, 30 of which are
actually active. Do you think the model is good?
93 Jain, A.N. and Nicholls, A. Journal of Computer Aided Molecular Design. 2008, 22, 133-139.
Predicted Active
Predicted Inactive
Actually Active
14 16
Actually Inactive
2 968
Introducing cheminformatics Page 55 of 64 © Copyright David Wild, 2012-2013 Academic Library Version
Lesson 11. Working with 3D chemical structures
Learning objectives
1. Know the tools available for visualizing 3D structure 2. Understand the basics of molecular superposition and docking 3. Know some of the general molecular modeling tools that are available We earlier discussed ways of representing and characterizing 3D structures, including conformer generation, energy minimization and 3D pharmacophore and similarity searching. In this lesson, we will very briefly look molecular visualization, and then how 3D structures can be used in a variety of computational fashions either separately from or in conjunction with a protein target structure.
Visualization of 3D structures and proteins
The simplest and most common way to visualize a 3D structure is with the CPK ball and stick model. Interestingly, molecular visualization was introduced very early (1960's and 70's) and until high quality graphics became commoditized in the 1990's, was one of the main applications of high-end graphics workstations. Simply visualizing compounds, and in particular compounds bound into protein targets (for example from an X-ray crystallography experiment) can be extremely useful in its own right – for instance by revealing where a compound can be modified to bind more strongly to a target. There are now plenty of good programs available for visualizing and rotating and translating molecules in this fashion (and with a variety of other bells and whistles). Most of them are free. Some work in web browsers; some are standalone; some produce images. Most work with proteins as well as small molecules. A few notable ones are:
• JMOL • Rasmol • PyMOL • Cn3D • Mollycule
There are also of tutorials available, particularly using JMol. Here are some:
• UWEC tutorial on installing and basic use of JMol • Introduction to JMOL from Wiley • Introduction to JMOL scripting from California Lutheran
Molecular Superposition
Molecular superposition involves aligning two or more molecules in 3D (either to each other or to a single rigid reference molecule) so they optimally overlay in some fashion. Alignment is done by rotating and translating the molecules, and by flexing and rotating bonds to create different conformers. Superimposition can be a prerequisite to 3D similarity searching, pharmacophore detection, and 3D QSAR. Superposition is an example of optimization, and thus can use one of a variety of methods, from simple hill climbing to genetic algorithms, simulated annealing and monte-carlo. Other methods

Introducing cheminformatics Page 56 of 64 © Copyright David Wild, 2012-2013 Academic Library Version
have been used for alignment, for example shape-based overlay (see, for instance, OpenEye ROCS94 ).
3D QSAR
3D QSAR can be done simply by using 3D descriptors instead of 2D. However, there are a variety of other ways of doing QSAR in 3D. One well known one is CoMFA (Comparative Molecular Field Analysis). CoMFA uses fields to optimize overlay of multiple structures based on features related to binding (electrostatics, sterics, hydrophobics), finds commonality in the overlaid fields, then correlates these areas of commonality with activity. It requires that structures be already aligned, and can be used predictively or for visualization. For more information, see the CoMFA tutorial95 and the NetSci article96. A nice example of its use with Dopamine D2 agonists is presented in another NetSci article97.
Molecular Docking
Molecular docking involves attempting to predict how compounds (in this context known as ligands) might bind to the active sites of protein targets, usually to assess their potential for inhibiting the protein. Most docking programs take as input a file of 3D structures and a 3D structure of a protein target with active site identified, then rotate and translate the compounds in the active site, flexing rotatable bonds, until some function relating to binding is minimized. This scoring function often is made of some combination of hydrogen bonding, electrostatic interactions, shape, and hydrophobic interactions. The final value of the scoring function is generally taken as a measure of the success of the docking. Whilst docking algorithms have proven quite good at replicating binding orientations of compounds in active sites (tests using RMSD from bound ligands in crystal structures), the relationship of the final value of the scoring function to binding affinity is much less clear. Both free and commercial docking tools are available: Free tools
• UCSF Dock • Scripps Autodock • DockingServer (web system, free limited services)
Commercial tools
• Schroedinger Glide • Tripos Surflex • CCDC GOLD • BiosolveIT FlexX • OpenEye FRED
Molecular docking can be used in two fashions – either to predict alignment for a small number of compounds against a protein target (for example, for subsequent visualization), or on a large scale for virtual screening – ranking a large number of compounds against a protein target in lieu of an actual screening experiment.
94http://eyesopen.com/rocs 95http://www.cmbi.ru.nl/edu/bioinf4/comfa-Prac/comfa.shtml 96http://www.netsci.org/Science/Compchem/feature11.html 97http://www.netsci.org/Science/Compchem/feature20.html

Introducing cheminformatics Page 57 of 64 © Copyright David Wild, 2012-2013 Academic Library Version
Recent research has sought to compare these docking methods, both in terms of accuracy of docking poses relative to crystal structures (using RMS deviation) and how well ranking by scoring function correlates to binding affinity (as measured using ROC curves). For example a recent paper in the Journal of Chemical Information and Modeling98 indicates that on the datasets tested, Glide and Surflex outperform other methods on both counts.
Molecular Modeling Tools
There are a variety of molecular modeling tools available that can do superposition, 3D QSAR, docking, and/or quantum calculations. Here are a few:
• Accelrys Discovery Studio • Chimera • Ghemical • ArgusLab • CCP4 • PCModel
Questions
1. Use the RSCB Protein Data Bank JMOL viewer to visualize the crystal structure of an HIV protease inhibitor drug bound into the HIV Protease protein (start with this page99). Compare the default cartoon visualization with the “Ligands and Pocket” view (selected from the Display Options section). How might these visualizations be used for different purposes?
2. Run through the Introduction to JMOL from Wiley to familiarize yourself with the operation of JMOL
3. How might you evaluate different docking methods for a particular dataset and protein target?
98 Cross, J. et al. Journal of Chemical Information and Modeling. 2009, 49(6), 1455-1474 99http://www.rcsb.org/pdb/explore/jmol.do?structureId=1HVI&bionumber=1

Introducing cheminformatics Page 58 of 64 © Copyright David Wild, 2012-2013 Academic Library Version
Lesson 12. Programmingtoolkits for cheminformatics
Learning objectives
1. Be aware of the programming toolkits and workflow tools available for cheminformatics In this lesson, we will very briefly look at some of the toolkits and resources available for cheminformatics software development.
Programming toolkits for cheminformatics
There are fortunately several free and open source toolkits available that include libraries for many common cheminformatics functions, such as structure representation and searching. Thus it is possible to develop new cheminformatics software quickly without having to “reinvent the wheel”. The Chemistry Development Kit (CDK)100, is a widely-used open source Java toolkit for cheminformatics. According to the website, it has over 50 developers worldwide. It offers a wide range of functionality including 2D structure input, representation and depiction; file and linear representation conversion; 3D rendering; virtual screening based on simple descriptors and an interface to the R statistics package; simple 3D model building and alignment; substructure searching; NMR prediction; and structure generation. There is also an interface to the BioJava bioinformatics toolkit. The CDK is described in a 2003 Journal of Chemical Information and Computer Sciences paper101 and updates in a 2006 Current Pharmaceutical Design paper.102 OpenBabel103 is a “toolbox” of ready-made programs and a cheminformatics C/C++ toolkit (with wrappers for other languages), based on an earlier version of what is now the commercial (but available free for academics) OEChem104 toolkit. The ready-made programs include structure format conversion, conformer generation, energy calculation, minimization, and various other functions. The toolkit covers a variety of cheminformatics 2D and 3D functionality. OpenBabel is described in a 2011 Journal of Cheminformatics paper.105 The Chemistry Descriptors Library (CDL)106 is a C++ library that provides a wide variety of cheminformatics functionality, including structure representation and conversion, descriptor and fingerprint generation, pKa prediction and synthetic accessibility estimation. The library is described in a 2008 Journal of Chemical Information and Modeling paper. 107 A variety of other toolkits exist, including MolEngine,108 a .NET cheminformatics toolkit, RDKit,109 a toolkit for cheminformatics and machine learning, ChemKit,110 an open source C++
100http://cdk.sourceforge.net 101Steinbeck C. et al. J. Chem. Inf. Comput. Sci. 2003 Mar-Apr; 43(2):493-500 102 Steinbeck C. et al., Curr. Pharm. Des. 2006; 12(17):2111-2120 103http://openbabel.org/ 104http://www.eyesopen.com/oechem-tk 105 O’Boyle, N. et al., Journal of Cheminformatics, 2011, 3:33 106http://cdelib.sourceforge.net/doc/index.html 107 Sykora, V.J. and Leahy, D.E. Journal of Chemical Infomration and Modeling, 2008, 48 (10), pp 1931–1942 108http://www.scilligence.com/web/molengine.aspx 109http://rdkit.org/ 110http://wiki.chemkit.org/

Introducing cheminformatics Page 59 of 64 © Copyright David Wild, 2012-2013 Academic Library Version
library for molecular modeling, visualization and cheminformatics, Indigo, an open source C++ toolkit for cheminformatics, and Maya ChemTools111, a set of Perl scripts for cheminformatics.
Workflow tools
Workflow tools permit custom processes and “programs” to be created using a workflow, or pipelining approach based on existing building block programs, and thus allow custom tasks to be done by non-programmers. Such tools are widely used in scientific computing groups in drug discovery. The most popular commercial tool in drug discovery is SciTegic Pipeline Pilot112 which provides an integrated set of cheminformatics, bioinformatics and general data processing modules. Other cheminformatics-oriented workflow tools that are free and/or open source include Knime113 , CDK Taverna,114and AZorange,115 an extension of the Orange data mining and graphical programming environment. There are many more other kinds of tools available, such as the R statistical package (which can be linked with cheminformatics functionality uwing RCDK116)
Questions
1. What factors would you use in determining which programming toolkit to use? 2. What are some advantages and disadvantages of using workflow tools?
111http://www.mayachemtools.org/ 112http://accelrys.com/products/pipeline-pilot/ 113http://www.knime.org/ 114 Truszkowski, A. et al., Journal of Cheminformatics, 2011, 3;54 115 Stålring, J.C. et al., Journal of Cheminformatics, 2011, 3:28 116http://cran.r-project.org/web/packages/rcdk/index.html

Introducing cheminformatics Page 60 of 64 © Copyright David Wild, 2012-2013 Academic Library Version
Lesson 13. The next steps: MOOCs and other online study resources
Learning objectives
Know some of the resources available for widening your skills and training in cheminformatics This guide has focused on the “core” of cheminformatics, but to be an effective practitioner of cheminformatics you need to gain a wide range of skills from statistics and data visualization through to an knowledge of the drug discovery process. Below are some pointers to current, mostly online, resources for devoping these related skills. Included are some of the more recent Massive Open Online Courses (MOOCs) as well as more traditional learning resources. A list of these will be kept routinely updated on the ICEP wiki.117
"Core" Cheminformatics
Learning materials relating to core cheminformatics topics such as structure representation can be found on the Indiana Cheminformatics Education Portal (ICEP) previously mentioned, which contains a variety of wiki-based materials and videos, and the Henry Stewart Talks: Introduction to Cheminformatics118 page which contains recordings of talks given in a wide variety of cheminformatics areas including structure representation, visualization, algorithms, structure databases, machine learning, and molecular modeling. There is also now a Cheminformatics Education Google+ Community119 for sharing materials.
Chemical information resources
A variety of online resources are available in the broader field of chemical information handling, including the Chemical Information Sources Wiki 120 , and XCITR 121 (Explore Chemical Information Teaching Resources).
MOOCs in related areas
There are a growing number of massive online courses, or MOOCs, that provide overviews of areas related to cheminformatics, usually at little or no cost. For example some of the offerings from Coursera122 are: Computing for Data Analysis; Data Analysis; Network Analysis in Systems Biology; Drug Discovery; Intermediate Organic Chemistry; Introduction to Systems Biology; Web Intelligence and Big Data; Bioinformatics Algorithms Part I Other courses of note: Introduction to Biology - The Secret of Life (edX123); Semantic Web Techologies (OpenHPI124); UC Irvine Open Chemistry125 curriculum; and IU’s Information Visualization MOOC126. 117 See icep.wikispaces.com 118 http://hstalks.com/main/browse_talks.php?r=582&j=762&c=252 119 https://plus.google.com/u/0/communities/110969223735716759972 120 http://en.wikibooks.org/wiki/Chemical_Information_Sources 121 http://www.xcitr.org/ 122 https://www.coursera.org/ 123 https://www.edx.org/ 124 http://openhpi.org/ 125 http://learn.uci.edu/openedweek/opchem.html 126 http://ivmooc.cns.iu.edu/
Introducing cheminformatics Page 61 of 64 © Copyright David Wild, 2012-2013 Academic Library Version
Appendix 1. Answers to questions Many of the questions are open ended, and thus the responses here constitute one amongst many valid responses. Lesson 1 1. A “clean” distinction would be that bioinformatics covers proteins and larger entities, while
cheminformatics covers proteins and smaller entities. However, as the two fields develop this line becomes blurred. One specific difference is that bioinformatics usually considers chemical compounds or drugs as “end points” whereas cheminformatics considers them as gateways to a world of features, functional groups, atoms, bonds, properties and so on. Culturally, the two fields have developed quite differently, with bioinformatics having a large academic presence and most research being carried out in the public sphere, whilst cheminformatics has been mostly industry-driven, but in the last decade has seen a much bigger academic presence.
2. The four areas are: overcoming stalled drug discovery; green chemistry and global warming; understanding life from a chemical perspective; enabling the network of the world’s chemical and biological information to be accessible and interpretable
3. The real challenge is in integrating chemical and cheminformatics data with many other kinds of biological, bioinformatics, experimental and simulations data. Thus new research will be needed at the interfaces with these fields.
4. Cheminformatics has been applied in materials science, the energy industry, agrochemicals, and by chemical suppliers amongst others.
5. This one is for you to answer by yourself! Lesson 2 1. SMILES and InChI taken from PubChem are CC(C)CC1=CC=C(C=C1)C(C)C(=O)O and
InChI=1S/C13H18O2/c1-9(2)8-11-4-6-12(7-5-11)10(3)13(14)15/h4-7,9-10H,8H2,1-3H3,(H,14,15) respectively. Note that there are many possible SMILES for this compound.
2. The first compound is L-Dopa, a drug for Parkinson’s Disease. The second is a stereoisomer, D-Dopa. A Web search for the first section only should find both, but since L-Dopa is the most widely known and referenced, it will dominate the search results.
3. The compound is Benzimidazole. Daylight software automatically aromaticizes compounds using a 4n+2 rule (Hueckel’s Rule), independent of how they were entered. It thus considers both rings to be aromatic.
4. The first alternative SMILES simply gives an explicit aromatization of the first ring, but is resolved by the software to the same structure. The second alternative is not valid as it would make both nitrogens fully aromatized (no hydrogen on either nitrogen) and thus violate the 4n+2 rule. A correct notation would be c1ccc2c(c1)nc[nH]2. So the general rule is that if you use the aromatic form for input, all ring systems must comply with the 4n+2 rule (at least for Daylight software).
Lesson 3 1. If none of the fragments in the dictionary encode the features that differ between the
molecules in the series, then it will not be possible to distinguish them in the fingerprint 2. If the differences between them are not coded in the fragments used to create the fingerprint
(for example, stereoisomers)

Introducing cheminformatics Page 62 of 64 © Copyright David Wild, 2012-2013 Academic Library Version
3. Yes, although a few things have to be borne in mind. First, by defaut each descriptor in the fingerprint would be given an equal weighting, yet it is difficult to say, for instance, that a LogP should be weighted the same as the presence of a particular structural feature. Second, if the fingerprint is used for calculating similarity, each descriptor would need to be normalized into the same range. Further, in this case a non-binary similarity coefficient would need to be used.
4. If you check the Wikipedia page, you’ll see that although they are considered to belong to the same class, statins are actually quite structurally diverse. Further, they contain lots of paths with carbons in, so with hashed fingerprints similarity calculations can be overloaded with these features. Since there are many compounds in PubChem that are more similar to each of the statins than they are to each other, the statins do not come up crisply at the top of the hitlist.
Lesson 4 1. Structure searching, and only if the same canonicalization algorithm is used for the query and
the SMILES in the spreadsheet cells or file, in which case you can carry out a simple text search for the query SMILES.
2. Carbon (atomic number 6) bonded to a carbon with 3 total bonds (sp2 hybridized) with one of the bonds a double bond to an Oxygen, with this carbon bonded to another carbon (atomic number 6). It thus represents a ketone.
3. At the time of writing the results were PubChem Compound: 30,217,998 (you can find this out by searching for “all[filter]” on PubChem and seeing how many hits come back) and over 26 million for ChemSpider (see http://www.chemspider.com/About.aspx) and
Lesson 5 1. A reaction equation describes the conversion of products into reagents; i.e. the initial and
final stages of a reaction. A reaction mechanism describes in detail how this process occurs. A transformation describes the change of a functional group or other substructure that occurs in a reaction.
2. A transformation 3. One example would be CC(=O)C.O=CCC>>CC(=O)CC(O)CC . Note that this is both a valid
Reaction SMILES and SMIRKS. 4. Since reaction information is mostly in the published literature, it has to be extracted and
curated manually, and so reaction databases tend to be commercial. Lesson 6 1. Arguments in favor of storing multiple conformers: efficiency of algorithms (don’t have to
worry about flexing molecules); ability to limit considered conformers to lowest energy and/or most likely. Arguments in favor of handling flexibility in algorithns: efficiency of storage (don’t need to store multiple conformers); can allow comprehensive search of conformational space appropriate to each algorithm.
2. Bromobenzene = 15.837003, Chlorobenzene = 15.271241. 3. When one is looking for potential new compounds to bind to a protein active site without
limiting a search to a particular structural series, and when the structure of the active site is known.
Lesson 7

Introducing cheminformatics Page 63 of 64 © Copyright David Wild, 2012-2013 Academic Library Version
1. At the time of writing, the top hit for both searches is a ChemSpider entry, but a different one for each search (ID 9889970 for the systematic name search, and ID 10607847 for the InChI Key search). Both are valid hits. Note that there are lots more “false positives” in the name search than the InChI Key search.
2. Presumably, paracetamol and acetaminophen are in each others’ synonym lists. However, each may have an overlapping but different synonym list, resulting in the different number of hits.
3. The IC50 and structural information may not be co-located in the text – for example, the structure may be identified as “structure 1, shown in Figure 2” (with the structural information in 2D format in the image), and elsewhere “structure 1” may be associated with the IC50values.
Lesson 8 1. Obvious commercial tools to use would be those that give access to reaction databases –
Scifinder Scholar (CASREACT) and Reaxys (Beilstein). How to specify the query will depend on how it is expressed, but it may include searching for text terms, authors, substructures or by chemical similarity, or some combination of these. There are no large public reaction databases, but commercial searching might be supplemented by free tools for following up availability of reagents (ChemSpider, eMolecules) or probing the chemical properties of reagents or products (PubChem etc, predictive tools)
2. There is no good answer to this one, but it would likely involve probing deeper into where the values came from, and ultimately which source is the most trusted. Be careful to identify which values are actually experimental, and which are predicted
3. Predictive tools, such as the Molinspiration site, give access to LogP predictions that can be performed on compounds not in datasets. Experimental values for highly similar compounds might be identified also, for instance with a similarity search on PubChem.
Lesson 9 1. This would be a relative method, as it is derived from calculations of the similarity between
compounds in a dataset, not relative to anything external 2. One approach would be to do an initial clustering of the dataset into n clusters using a non-
hierarchical method, where n is chosen such that all sets are small enough to run Ward’s on individually. Another approach would be to use a hierarchical divisive method like Divisive K-Means
3. The problem is that it is hard to objectively define what is meat by a “chemical series”. Chemists may not agree as to how to organize compounds into series, and thus one cannot have a definitive “ideal” clustering
4. It depends whether one is considering coverage (in which case the one on the left is more diverse) or relative diversity (in which case the one on the right is more diverse).
Lesson 10 1. The methods readily available to you (e.g. Bayesian if you are using Pipeline pilot); the kind
of problem (classification vs continuous); interpretability (if you need to understand why a prediction is being made); efficiency (how long does it take to train and make a prediction); complexity of tuning methods (e.g. Neural Nets and SVMs have risk of over-fitting if not parameterized correctly)
2. Yes, but care needs to be taken to make sure values are normalized properly (just like with clustering)

Introducing cheminformatics Page 64 of 64 © Copyright David Wild, 2012-2013 Academic Library Version
3. The tension here is between general models which might have large scope but predict poorly, and specific models which might have a small scope but predict well. One approach is to build multiple specific models, and then choose which model is most applicable for a particular compound (e.g. by similarity with validation set).
4. The model correctly predicts almost all inactives, and correctly predicts slightly less than half of actives. Whether this is good depends on your perspective and application. Compared to random selection (which would identify actives 3% of the time), it looks quite good (47%)!
Lesson 11 1. The cartoon view is good for seeing the large scale of the protein structure and how the ligand
fits into it – for instance in this case you can identify the fact the protein is a dimer, the “flaps” that open to let the natural ligand in, and where the inhibitor binds. The Ligand and Pocket view enables a closer inspection of the binding site, including interactions between the ligand functional groups and amino acid functional groups.
2. No answer required 3. The two basic ways of testing are how well the program is orenting the ligands in the protein
target, and how well the ranking of docking scores correlates with activity. The former can be tested by taking known docking poses (e.g. from crystal structures), extracting the ligand, minimizing its structure, and having the docking program attempt to realign the compound in the active site (although this is slightly flawed as the active site will be flexible, and will already be perfectly oriented for the ligand). The latter can be tested like a predictive model using crossvalidation strategies.
Lesson 12 1. Factors could include cost, whether program execuatbles or source written with the kit can be
made freely available, which programming language you are using, and support base. 2. Advantages: deep programming skills are not required; functionality can be developed in a
building-block manner; tools give a visual flow to processes. Disadvantages: resultant programs are dependent on the workflow tool to run; flexibility is limited by the workflow model; may be less efficient than code written from scratch or with a toolkit.