Interviewer Support, Test-taker Performance and Test-taker Perception in an Oral Proficiency...
79
Interviewer Support, Test-taker Performance and Test-taker Perception in an Oral Proficiency Interview by Hendi Pratama The University of Queensland Supervisor: Dr. Michael Harrington A Thesis Submitted in Partial Fulfilment of the Requirement for the Degree of Masters of Arts (MA) in Applied Linguistics, The University of Queensland November, 2009
Transcript of Interviewer Support, Test-taker Performance and Test-taker Perception in an Oral Proficiency...

Interviewer Support, Test-taker Performance and
Test-taker Perception in an Oral Proficiency Interview
by Hendi Pratama
The University of Queensland
Supervisor: Dr. Michael Harrington
A Thesis Submitted in Partial Fulfilment of the Requirement for
the Degree of Masters of Arts (MA) in Applied Linguistics, The University of Queensland
November, 2009
i
STATEMENT OF ORIGINALITY
I declare that the materials in this thesis have not been submitted previously or
concurrently in the whole or as part of requirements for a degree to the University of
Queensland or any other educational institutions except as fully acknowledged within the
text.
I also certify that the work presented in the thesis is to the best of my knowledge and
belief, original except as acknowledged in the text. Any help that I have received during the
preparation and completion of this thesis has been acknowledged. In addition, I certify all
information sources and literature used are indicated in the thesis.
Date:
Signature:
Hendi Pratama
ii
ACKNOWLEDGEMENTS
To my lovely wife Indira, who has provided unlimited support throughout the years.
Without her, this paper would have been impossible. Brisbane becomes a far better place to
study with her assistance.
My sincere thanks go to Dr. Michael Harrington who has given me his best advice,
insights, arguments and patience. His ideas and professional suggestions have made this
paper a better piece of academic writing.
Thanks to my parents, Pram and Liz, who provided me with a home and wonderful
education for me. Without them, I would not be able to be what and where I am now.
My thanks also to my lecturers at UQ, Prof Roland Sussex, Dr. Noriko Iwashita and
Dr. Peter White, who have shared their knowledge during my study.
Thanks to the Government of Indonesia, the Rector of Semarang State University, and
my undergraduate lecturers at Semarang State University for their support so that now I can
study at UQ with a decent scholarship.
To my friends, Zulfa who has been my friend for seven years and Peter Barraclough
who has lent his hands to check my grammar and gave me a place to stay when I first came to
Brisbane.
iii
ABSTRACT
Language testing researchers have investigated the potential threat of rater variability to oral
proficiency test reliability. Rater variability can cover many aspects including the amount of
support or accommodation provided by the examiners. Several studies have been conducted
to investigate the effect of different types and amount of support provided by the interviewers
on the performance of participants. However, those studies have relied heavily on the scores
or rating given by the raters and/or the raters perception to the process of the interview. This
study compliments the earlier studies by examining the test-taker perceptions. This study
examines the relationship of the test-taker perception of the support provided by the
interviewers and their actual performance. In addition, it also attempts to shed light on the
effects of particular types of supporting behaviour related to the test-takers performance. The
independent variable is the degree of the supporting behaviour. There are two levels of
support: High Supporting Behaviour (HSB) and Low Supporting Behaviour (LSB). In the
HSB condition, in addition to the non-substantive features, the interviewers are obliged to
perform three different types of substantive supporting features: fronting, suppliance and
rephrase. In the LSB condition, interviewers are only allowed to give non-substantive
supporting features namely slowdown and back-channeling. Ten participants sat in two
interviews with two different interviewers applying LSB and HSB condition. The substantive
supporting features are strictly regulated by prescribed scripts and the non-substantive
features are provided depending on the participants‟ behaviour and/or the interviewers‟ own
choice. The non-substantive features, which are not regulated by the scripts, lead to two
different back-channeling styles: Low Back Channeling (LBC) and High Back Channeling
(HBC). At the end of the second interview, all participants completed a perception
questionnaire. Twenty interview scripts were analyzed to estimate the participants‟ actual
performance in three categories: (1) fluency, (2) lexical resources and (3) grammar
complexity. The results of the questionnaire showed relevantly higher values on the test-
takers perception in the HSB and HBC conditions than in their counterparts (LSB and LBC).
The same results can be seen on performance. Typically participants performed better in the
HSB and HBC conditions than in their counterparts. This study has implications for raters‟
training. Future research may involve a larger sample.
iv
TABLE OF CONTENTS
STATEMENT OF ORIGINALITY ....................................................................................... i
ACKNOWLEDGEMENTS ................................................................................................... ii
ABSTRACT ........................................................................................................................... iii
TABLE OF CONTENT ......................................................................................................... iv
CHAPTER I INTRODUCTION .......................................................................................... 1
1.1 Background of the Study ............................................................................................... 1
1.2 Purpose of the Study ...................................................................................................... 1
1.3 Research Questions ........................................................................................................ 2
1.4 Significance of the Study ............................................................................................... 2
1.5 Definition of Key Terms ................................................................................................ 3
1.6 Organization of the Thesis ............................................................................................. 3
CHAPTER II INTERVIEWER SUPPORT, TEST-TAKER PERFORMANCE AND
TEST-TAKER PERCEPTION IN AN ORAL PROFICIENCY INTERVIEW .................... 4
2.1 The Nature of the Oral Proficiency Interview (OPI) ..................................................... 4
2.2 The Discourse Paradox of an OPI .................................................................................. 5
2.3 Research on the Interviewer Behaviour Variability....................................................... 6
2.4 Important Issues on Interviewer Support ....................................................................... 7
2.5 Measurement of Test-Taker Language in an OPI .......................................................... 9
2.5.1 The Trend of Language Testing ............................................................................... 9
2.5.2 Measuring Language through Speaking Scale ......................................................... 10
2.5.3 Measuring Language for Specific Research Interest ............................................... 13
2.6 Investigating Perception................................................................................................. 13
2.7 Interviewer Support, Test-Taker Perception and Performance ...................................... 14
CHAPTER III RESEARCH METHOD .............................................................................. 17
3.1 The Test-takers............................................................................................................... 17
3.2 The Interviewers ............................................................................................................ 18
3.3 Data Collection Procedures............................................................................................ 18
3.3.1 The Interlocutor Frame ............................................................................................ 19
3.3.2 The Interview Process .............................................................................................. 20
3.3.3. Post-test Questionnaire ........................................................................................... 21
3.4. Transcribing Process ..................................................................................................... 22
3.5 Data Analysis .................................................................................................................. 23

v
3.5.1 Fluency ..................................................................................................................... 24
3.5.2 Lexical Resource ...................................................................................................... 24
3.5.3 Grammatical Complexity ......................................................................................... 25
3.6 Further Analysis ............................................................................................................. 26
CHAPTER IV RESULTS .................................................................................................... 27
4.1 Participants‟ Perception in HSB and LSB Conditions. ................................................... 27
4.2 Participants‟ Performance in HSB and LSB Conditions. ............................................... 28
4.3 Conditional Supporting Behaviour: Back-Channeling. ................................................. 31
4.4 Participants‟ Perception in HBC and LBC Conditions. ................................................. 32
4.5 Participants‟ Performance in HBC and LBC Conditions. .............................................. 33
4.6 Supporting Behaviours and Back Channeling in Contrast ............................................ 34
4.7 Contrasting Participant Fluency in HSB vs. LSB and HBC vs. LBC ............................. 35
4.8 Contrasting Participant Lexical Resource in HSB vs. LSB and HBC vs. LBC .............. 39
4.9 Contrasting Grammatical Complexity in HSB vs. LSB and HBC vs. LBC .................... 42
4.10 Crossover Analysis on Supporting Behaviour and Back-channeling .......................... 44
4.11 Word Production of Particular Supporting Behaviour................................................. 48
CHAPTER V DISCUSSION................................................................................................ 51
5.1 The Interviewer Support and the Test-taker Perception ................................................ 52
5.2 The Interviewer Support and the Test-taker Performance ............................................. 52
5.3 The Effect of the Test-taker Perception and Performance ............................................. 54
CHAPTER VI CONCLUSIONS AND IMPLICATIONS ................................................... 56
6.1 Conclusions ..................................................................................................................... 56
6.2 Implications.................................................................................................................... 56
6.3 Limitations ..................................................................................................................... 57
6.4 Suggestions for Further Research .................................................................................. 58
REFERENCES ...................................................................................................................... 59
APPENDIX A INTERVIEWER SCRIPT ............................................................................ 63
APPENDIX B POST TEST QUESTIONNAIRES .............................................................. 67
APPENDIX C SAMPLE OF TRANSCRIPTION ................................................................ 69
APPENDIX D VOCAB PROFILE OUTPUT ...................................................................... 72

1
CHAPTER I
INTRODUCTION
1.1 Background of the Study
In late 1980s, van Lier (1989) discussed a latent problem attached to the speaking test
in the form of interview. He argued that if the goal of the interview is to measure the ability
of the candidate in a conversation, the test itself should resemble a conversation. Discourse
analysis shows that a speaking test does not meet the criteria of daily conversations in at least
four aspects: (1) the control possessed by the interviewer, (2) the power inequality, (3) the
purpose of the talk and (4) topic nomination. These aspects pose a potential threat to the
validity of Oral Proficiency Interview (OPI).
When it comes to scoring, reliability of the test can be threatened. Indeed, a speaking
test is rated or marked by raters. Those raters might have different standards and different
experiences which may cause them to give different ratings to the same test-taker. The
objectivity of the test is at stake. That is not all. In conducting the interview, interviewers
often adopt their personal styles in the questions asked to the participants. It could be teacher-
like, lawyer-like, interrogator-like or comedian-like discourse practiced in the interview.
Brown (2003) reported that two different interviewers could completely build different types
of discourse when they are assigned to interview a single test-taker. How do these different
styles affect the test-taker perception and performance? This question becomes the point of
attention in this study.
Students around the world take such tests to seek entrance to universities. Job seekers
around the world, at the same time, rely on this type of test to gain employment. More
scientific studies conducted regarding the reliability of an OPI will make each penny they
spend to take such test more worth it. Indeed, an OPI is a high stake test and it is the
responsibility of the test maker and/or provider to pay more attention to its validity and
reliability.
1.2 Purpose of the Study
Lorenso-Dus and Meara (2005) state that interviewers tend to give more support to
the test-takers with low proficiency. However that study says nothing about the effect of the
support on the performance. Brown (2003) found that two interviewers can give different
ratings/scores to the participants. Discourse analysis showed that one interviewer is more
supportive than the other and gives better a score/rating. The study is based on only one test-
2
taker. O‟Sullivan and Lu (2006) observe a number of interviews, counting and analysing the
supports provided by the interviewers in real IELTS speaking tests. Sullivan and Lu assert
that different amount and types of support provided by the interviewers does not significantly
affect the participant performance. The results of those studies are mixed and hardly in
agreement. Moreover, those studies were based on the interviewer‟s rating and/or interviewer
perceptions but not on the test-taker perceptions.
A number of studies in the same area did not attempt to manipulate the amount and
the types of support or accommodation in their research design. They acquired their data
mostly from general proficiency tests administered for other purposes (e.g. IELTS and
CASE). It means that (1) the data can be more natural but (2) the desired conditions of the
support and accommodation cannot be maintained consistently throughout the available data.
In this study, a rich-accommodation condition is created and then it is being compared to a
poor-accommodation condition. Each participant experiences two different interviews and
their performance and perception on each interview is analysed. Hence, a clearer picture of
the effect of different amount and types of support or accommodation to the test-taker‟s
performance and perception can be examined to complement the earlier studies.
1.3 Research Questions
There are three questions addressed in this study:
(1) How does the interviewer support affect the test-taker perception?
(2) What are the effects of the interviewer support on the test-taker language linguistic
performance?
(3) What are the effects of the test-taker perception of interviewer support on their
linguistic performance?
1.4 Significance of the Study
This study is related to interviewer behaviour and its effects on the participant
performance and perception. The research has implications for the raters‟ training. It is
related to how far the interviewers are given the freedom to add additional information which
is not written in the test protocol or script. It also yields empirical data on how the discourse
constructed by the interviewers can be either favoured or disfavoured by the test-takers.
3
1.5 Definition of Key Terms
OPI (Oral Proficiency Test) refers to an interview administered to elicit the language of the
test taker. It involves a face-to-face interaction between an interviewer (usually acts as a rater
as well) and a candidate or a test taker.
Support or Accommodation refers to the particular interviewer behaviour in giving a certain
types of help in the forms of either additional linguistic and/or interpersonal exchange.
HSB (High Supporting Behaviour) refers to a condition simulated in the interview where the
interviewers give maximum support allowed in this study to the participants.
LSB (Low Supporting Behaviour) refers to a condition simulated in the interview where the
interviewers give minimum support allowed in this study to the participants.
Perception refers to the test-taker attitude towards each particular condition simulated in this
study.
Performance refers to the language elicited from the participants during the interview.
1.6 Organization of the Thesis
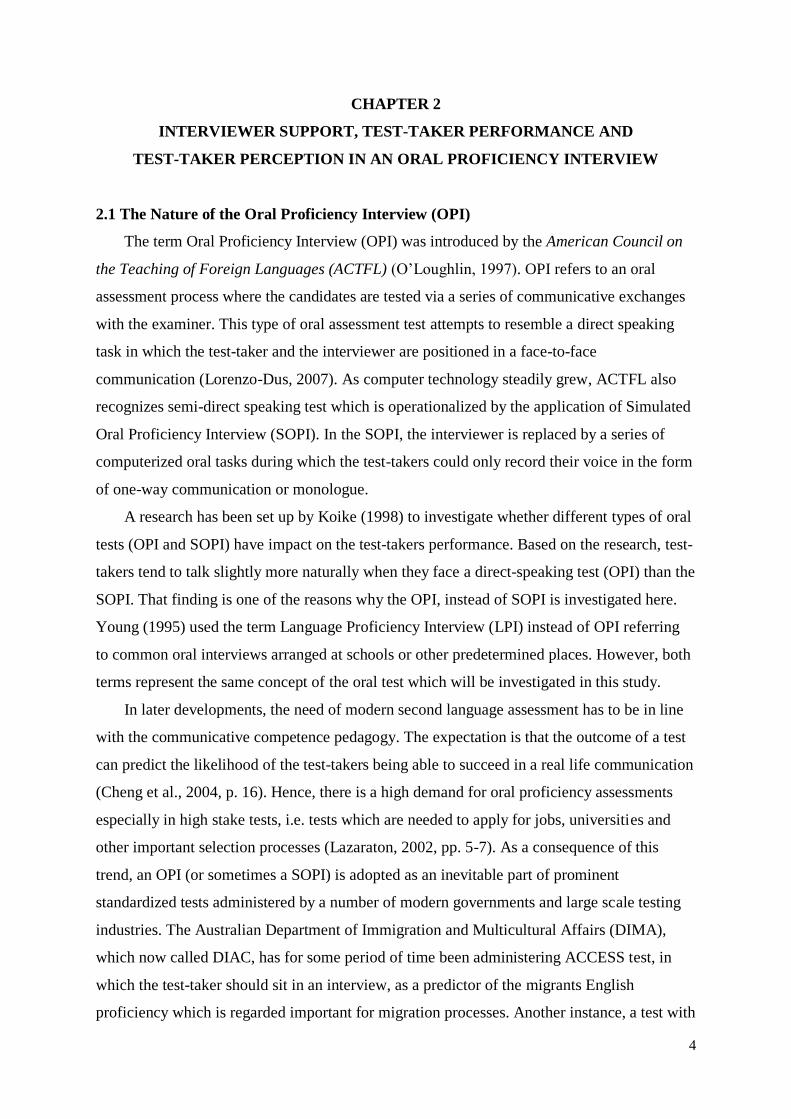
Chapter 1 of this study introduced the research questions and described the specific
problem addressed in the study as well as a brief explanation of the design components.
Chapter 2 presents a review of literature and relevant research associated with the problem
addressed in this study. Chapter 3 presents the methodology and procedures used for data
collection and analysis. Chapter 4 contains an analysis of the data and presentation of the
results. Chapter 5 offers a summary and discussion of the researcher's findings related to the
key issues. Chapter 6 concludes the research with the implications for practice, and
recommendations for future research.
4
CHAPTER 2
INTERVIEWER SUPPORT, TEST-TAKER PERFORMANCE AND
TEST-TAKER PERCEPTION IN AN ORAL PROFICIENCY INTERVIEW
2.1 The Nature of the Oral Proficiency Interview (OPI)
The term Oral Proficiency Interview (OPI) was introduced by the American Council on
the Teaching of Foreign Languages (ACTFL) (O‟Loughlin, 1997). OPI refers to an oral
assessment process where the candidates are tested via a series of communicative exchanges
with the examiner. This type of oral assessment test attempts to resemble a direct speaking
task in which the test-taker and the interviewer are positioned in a face-to-face
communication (Lorenzo-Dus, 2007). As computer technology steadily grew, ACTFL also
recognizes semi-direct speaking test which is operationalized by the application of Simulated
Oral Proficiency Interview (SOPI). In the SOPI, the interviewer is replaced by a series of
computerized oral tasks during which the test-takers could only record their voice in the form
of one-way communication or monologue.
A research has been set up by Koike (1998) to investigate whether different types of oral
tests (OPI and SOPI) have impact on the test-takers performance. Based on the research, test-
takers tend to talk slightly more naturally when they face a direct-speaking test (OPI) than the
SOPI. That finding is one of the reasons why the OPI, instead of SOPI is investigated here.
Young (1995) used the term Language Proficiency Interview (LPI) instead of OPI referring
to common oral interviews arranged at schools or other predetermined places. However, both
terms represent the same concept of the oral test which will be investigated in this study.
In later developments, the need of modern second language assessment has to be in line
with the communicative competence pedagogy. The expectation is that the outcome of a test
can predict the likelihood of the test-takers being able to succeed in a real life communication
(Cheng et al., 2004, p. 16). Hence, there is a high demand for oral proficiency assessments
especially in high stake tests, i.e. tests which are needed to apply for jobs, universities and
other important selection processes (Lazaraton, 2002, pp. 5-7). As a consequence of this
trend, an OPI (or sometimes a SOPI) is adopted as an inevitable part of prominent
standardized tests administered by a number of modern governments and large scale testing
industries. The Australian Department of Immigration and Multicultural Affairs (DIMA),
which now called DIAC, has for some period of time been administering ACCESS test, in
which the test-taker should sit in an interview, as a predictor of the migrants English
proficiency which is regarded important for migration processes. Another instance, a test with
5
larger scope of purposes, IELTS, is designed by University of Cambridge Local
Examinations Syndicate (UCLES) and jointly administered by the British Council and IDP
Australia (Lazaraton, 1996a). Individuals who are seeking entrance to universities in
Australia and the UK are required to do IELTS. Again, a test like the IELTS requires the
candidate of the test to sit in a face-to-face interview with a trained examiner (Mok et al.,
1998). TOEFL (Test of English as a Foreign Language), CULT (Combined Universities
Language Test), ECT (English Competency Test), ASLPR (Australian Second Language
Proficiency Ratings, CPE (Certificate of Proficiency in English). CASE (Cambridge
Assessment of Spoken English) and CAE (Certificate of Advanced English) and more tests
can be added to the list of the tests which include oral proficiency examination (McDowall
and Merryles, 1998).
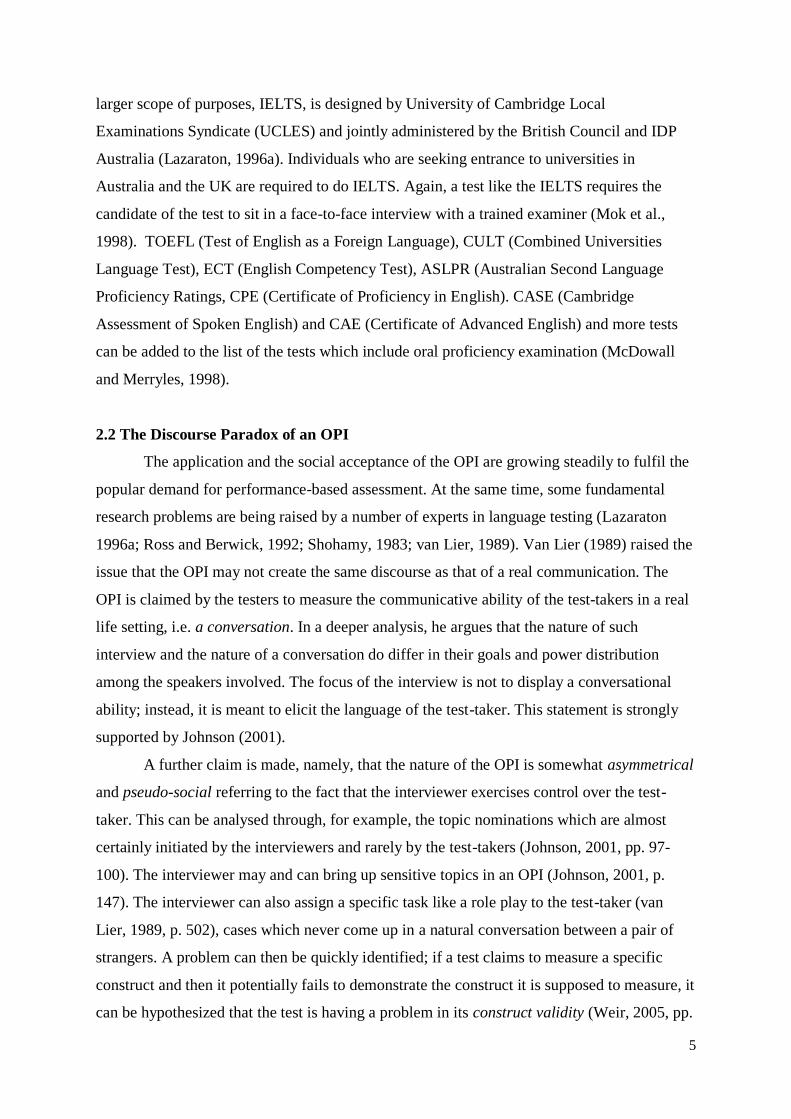
2.2 The Discourse Paradox of an OPI
The application and the social acceptance of the OPI are growing steadily to fulfil the
popular demand for performance-based assessment. At the same time, some fundamental
research problems are being raised by a number of experts in language testing (Lazaraton
1996a; Ross and Berwick, 1992; Shohamy, 1983; van Lier, 1989). Van Lier (1989) raised the
issue that the OPI may not create the same discourse as that of a real communication. The
OPI is claimed by the testers to measure the communicative ability of the test-takers in a real
life setting, i.e. a conversation. In a deeper analysis, he argues that the nature of such
interview and the nature of a conversation do differ in their goals and power distribution
among the speakers involved. The focus of the interview is not to display a conversational
ability; instead, it is meant to elicit the language of the test-taker. This statement is strongly
supported by Johnson (2001).
A further claim is made, namely, that the nature of the OPI is somewhat asymmetrical
and pseudo-social referring to the fact that the interviewer exercises control over the test-
taker. This can be analysed through, for example, the topic nominations which are almost
certainly initiated by the interviewers and rarely by the test-takers (Johnson, 2001, pp. 97-
100). The interviewer may and can bring up sensitive topics in an OPI (Johnson, 2001, p.
147). The interviewer can also assign a specific task like a role play to the test-taker (van
Lier, 1989, p. 502), cases which never come up in a natural conversation between a pair of
strangers. A problem can then be quickly identified; if a test claims to measure a specific
construct and then it potentially fails to demonstrate the construct it is supposed to measure, it
can be hypothesized that the test is having a problem in its construct validity (Weir, 2005, pp.
6
12-13). When the OPI is designed to display a conversational exchange while it cannot
demonstrate that a conversation has been facilitated in the process, the OPI also faces a threat
on its face validity (Messick, 1996, p. 14; Johnson, 2001, p. 25).
2.3 Research on the Interviewer Behaviour Variability
Interviewer behaviour during the process of interviewing may not only reflect a
possible threat to validity but also the test reliability (Bachman et al., 1995; Douglas, 1994;
Lumley & McNamara, 1997). The interviewer unique behaviour in an oral interview has been
attracting the researchers‟ attention since the early 1980‟s. Shohamy (1983) investigated an
interesting phenomenon that the same test taker can be awarded different scores by different
interviewers. This research was considered to be one of the pioneers of inter-rater reliability
studies in oral assessment (Brown, 2003, p.4). As in the case of most OPIs, the interviewers
also serve as the raters at the same time, meaning that while (or after) interviewing, the
interviewer gives rating to the test-taker. This area was revisited in 1990‟s by other language
testing researchers (Brown, 1995; Lazaraton, 1996b; Ross & Berwick, 1992).
Brown (1995) utilizes the FACETS program to investigate whether or not variability
of the raters should be taken into account in speaking tests. She found that different
interviewers from different backgrounds have different ways to perceive the assessment
criteria and the scoring scales. In addition, Brown (2003) states that massive studies have
been conducted to look into inter-rater variability in the following areas: (1) trained vs.
untrained raters (Shohamy et al., 1992), (2) native speaker vs. non-native speaker raters
(Fayer & Krasinski, 1987) and (3) ESL teachers vs. non-teachers (Hadden, 1991). Brown fills
the gap by investigating the possible variability of speaking tests in specific professions. She
goes over the variability of assessment conducted by non teacher raters but they are
considered as practitioners in a specific industry, in her case tourism. A solid body of
research which then grows mostly focuses on the relation between the interviewers‟
background and inter-raters‟ agreement; raters‟ background and their ratings; their ratings
and the test-takers‟ actual performance (Douglas, 1994); and the inter-raters agreement and
the reliability of the tests. Those studies reported that the reliability of a speaking test is
potentially threatened by the raters‟ variability. The inter-raters agreement in short is the
degree of similarity of the ratings given by different raters to the same participant. Related to
other type of rater variability, O‟Loughlin (2002) investigates the impact of the examiners‟
gender in IELTS test and found that the examiner‟s gender does not really affect either the
ratings given to or the performance of the test-takers. Most of the studies mentioned, except
7
one, suggest that different types of behaviour demonstrated by different types of examiners
may result in different ratings given to the test-takers.
2.4 Important Issues on Interviewer Support
The variability of the raters or interviewers is not only limited to their professional
and educational backgrounds; their testing experience and training; their gender; and their
nativeness or non-nativeness status. Beyond those factors, there is a type of variability related
to the different interactional behaviours or the discourse created by the examiners during the
oral performance test (Brown, 2003). Brown (2003) claims that the variation in different
interactional strategies utilized by different interviewers has a potential effect on test taker
performance. In other words, interviewer style may affect the test-taker language. The study
has successfully demonstrated through careful discourse analysis that single test-taker tend to
perform differently and be rated differently by two interviewers who possess different styles
in interviewing. However this study does not allow for generalization because it is based on
the performance of a single subject which may have been sensitive to the interview structure
(i.e. the interviewer structure is not counter-balanced). The study self-fulfils Brown‟s
prediction in her study with a colleague in the previous year. The study suggests that
„difficult‟ interviewers tend to elicit poor performance and „easy‟ interviewers tend to elicit
better performance (Brown & Hill, 1998).
To control the improvisation done by interviewers during the process of the interview,
the test makers make an effort to „limit‟ the variability of the interviewer style to make sure
that all test-takers get more equal treatment (Lazaraton, 2002, p. 21). As a direct response to
this demand, test makers set up what is typically called an interlocutor frame. In their study,
O‟Sullivan and Lu (2006) describe the interlocutor frame as a script of questions which has to
be followed by the interviewers. In addition, there is guidance from the test makers to avoid
certain features of behaviour. For instance, ACTFL OPI prohibits the interviewers from doing
the following: slowing down, echoing or correcting responses, furnishing vocabulary, rushing
response time, asking display questions, (Buck et al., 1989). ACTFL OPI is not the only test
adopting the limitation of behaviour, the CASE test also possesses almost similar interlocutor
frame and guidance (Lazaraton, 1996b).
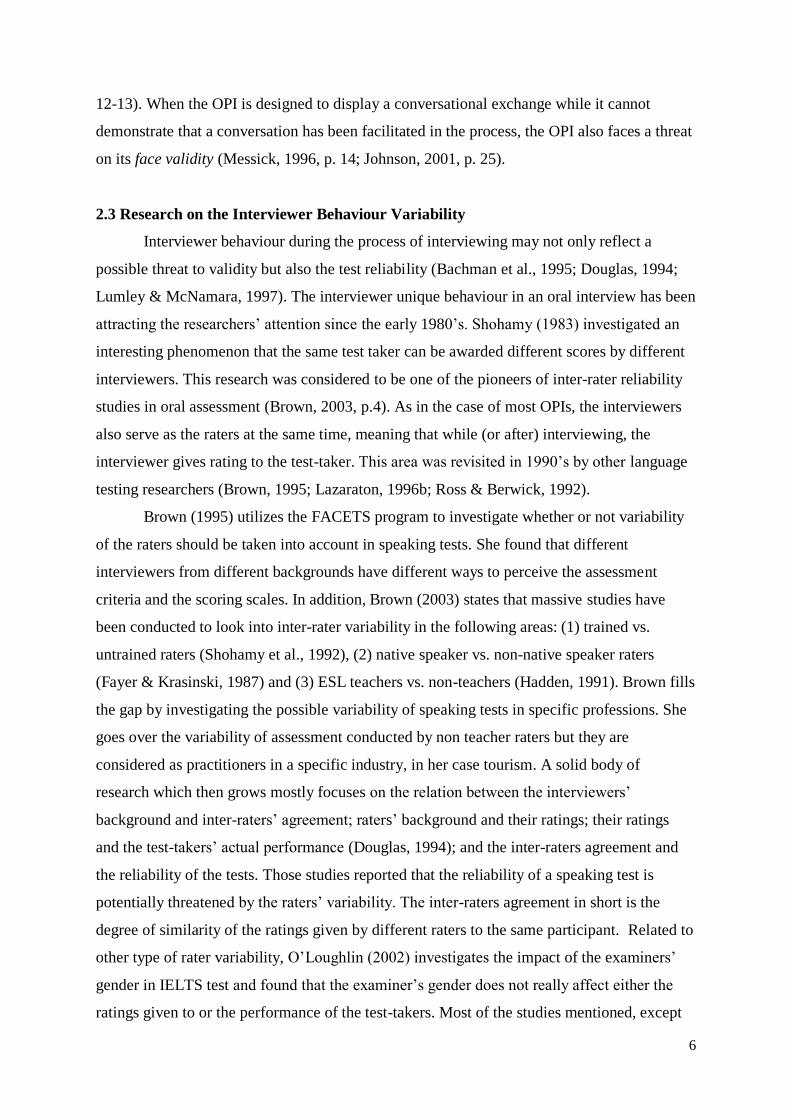
Lazaraton (1996a) observed that regardless how strict the interlocutor frame is, the
interviewers from time to time deviates from the prescribed scripts in predictable ways. She
picks out and identifies a list of behaviours from 200-page transcript generated from 58
8
audiotapes of CASE interviews. At least eight types of deviation can be identified (see Table
2.1).
Features of Behaviour Definition
1.Priming topics Cueing candidates on the next topic 2.Supplying vocabulary Completing the test-taker utterances 3.Giving evaluative responses Giving judgmental comment on performance 4.Echoing and correcting responses Repeating and then correcting part of utterances 5.Slowing Down & Over-articulation Exaggerating utterances 6.Rhetoric Question Questions which only need mere confirmation 7.Drawing conclusions Interpreting the test-taker utterance 8.Rephrasing questions Simplify complex question
Table 2.1 Summary of Lazaraton‟s (1996a) listing of interviewer behaviour
The list has strengthened the view that the interviewers by nature tend to support and
accommodate the candidates although such actions have been discouraged by the test maker.
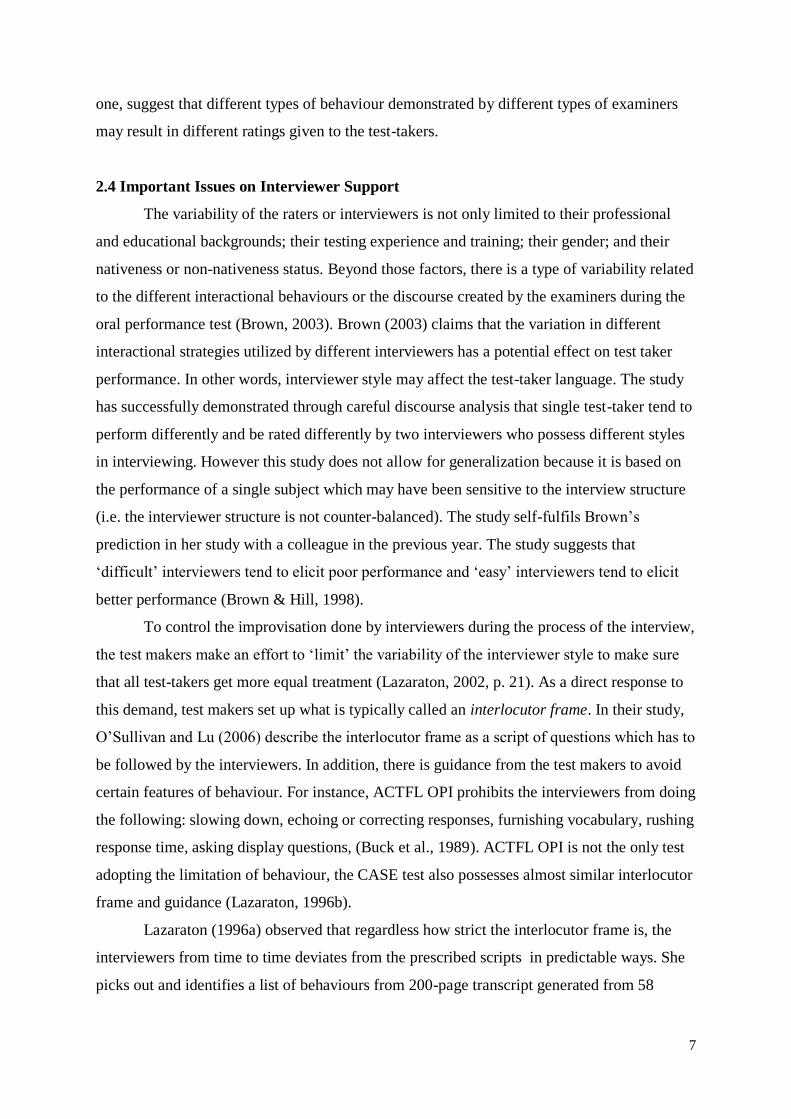
A more laborious study was then conducted in 2002. O‟Sullivan and Lu transcribe 70 audio-
taped interviews to take a deep look at the nature of these deviations. Another list containing
the types of support provided by the interviewers can be displayed in Table 2.2.
Types of Deviation Definition
1.Interupting Questions Question asked that stops the test-taker’s answer 2.Hesitated Questions Question asked hesitatingly 3.Paraphrased Questions Paraphrased questions without request from test-taker 4.Paraphrased and Explained Qs Repeating and then correcting part of utterances 5.Comments after Replies Comment made after test-taker’s reply 6.Improvised question Asking questions out of the script based on previous utterances 7.Informal Chatting Informal discussion 8.Loud Laughing Laughing because of test-taker’s reply 9.Offer of Clues Offer a hint to facilitate candidate reply
Table 2.2 Summary of O‟Sullivan and Lu Listing of Interviewer Deviation (2006, p. 8)
Further in their research, they shed light on how particular features of behaviour may
scaffold the test-takers utterances. In a two-way discussion, improvised questions are
provided to make the exchanges smoother and livelier. After a long turn taken by a test-taker,
the interviewer tends to make positive comments after the replies to show attention,
compliment and appreciation. The result of their study concludes that deviations
demonstrated by those interviewers are reflections of the interviewer support to accommodate
the test-takers.
9
2.5 Measurement of Test-Taker Language in an OPI
2.5.1 The Trend of Language Testing
Looking back at the development of language testing over the years, the practice of
assessment is often, if not always, affected by particular second language learning research
and/or specific linguistic theories (McNamara, 2000, p. 13-15). This statement can be
justified by the trend of language testing traced back in the period of 1913-1945 conducted by
the Cambridge University. At that time, phonology became one of the central fields discussed
in linguistic studies. Related to that notion, reading aloud and dictation become important
parts of spoken language testing (Weir, 2005, p. 6). It would not be a surprise if phonological
awareness and mastery were treated as the predictors of oral ability. When grammar
translation method was amazingly popular in the same era, translating passages from a
language to the other was a common practice to test individual‟s second language
proficiency. As early as 1980s, Krashen came up with the idea that second language
acquisition is mainly affected by the quality of input and not the output (Krashen, 1985). This
belief was adopted by some testing companies including the paper-based TOEFL, in which
listening test is included in the test battery but on the other hand, no speaking test is available.
This trend might be no longer applied in the 21st century‟s language testing.
Communicative Competence (CC) has been known as the standard pedagogical basis for
today‟s language teaching and testing (McNamara, 2000, p.17). Canale and Swain (1980)
break down the CC into four sub-sets of basic competence:
(1) Grammatical Competence: the knowledge of formal features of a language
including phonology, syntax and vocabulary.
(2) Sociolinguistic Competence: the ability to use the language within the range
different sets of social groups, settings, topics, and interlocutors.
(3) Strategic Competence: the ability to cope with communication backgrounds so
that on-going communication can be maintained.
(4) Discourse Competence: the ability to extend the language use into specific context
of communication.
Although communicative competence was introduced in the early 1980s, the
popularity of the model only started to be adopted massively in language classrooms around
the world from early 1990s, under the umbrella term „communicative language teaching‟ and
relevantly „communicative language testing‟ is adopted in the area of language testing
(McNamara, 2000, p.16).

10
2.5.2 Measuring Language through Speaking Scale
The challenge for language testing designers, especially in the field of spoken
language assessment, is how to operationalize the CC concept proposed by Canale and Swain
(1980) into a reliable language measurement instrument for an OPI. The most practical way
to actualize this concept is to design a speaking scale (Luoma, 2004, pp. 59-95). An example
of typical speaking scale can be taken from the Test of Spoken English (TSE) scoring system
designed by the Educational Testing Service (ETS). The score scales fall within the range of
20 to 60 with the incremental unit of 5.
60 = Communication almost always effective; task performed very competently
Functions performed clearly and effectively
Appropriate response to audience/situation
Coherent, with effective use of cohesive devices
Use of linguistic features almost always effective; communication not affected by minor errors.
50 = Communication generally effective; task performed competently
Functions generally performed clearly and effectively
Generally appropriate response to audience/situation
Coherent, with some effective use of cohesive devices
Use of linguistic features generally effective; communication generally not affected by errors.
40 = Communication somewhat effective; task performed somewhat competently
Functions performed somewhat clearly and effectively
Somewhat appropriate response to audience/situation
Somewhat coherent, with some use of cohesive devices
Use of linguistic features somewhat effective; communication sometimes affected by errors.
30 = Communication generally not effective; task performed poorly
Functions generally performed unclearly and ineffectively
Generally inappropriate response to audience/situation
Generally incoherent, with little use of cohesive devices
Use of linguistic features generally poor; communication often impeded by major errors.
20 = No effective communication; no evidence of ability to perform task
No evidence that functions were performed
No evidence of ability to respond appropriately to audience/situation
Incoherent, with no use of cohesive devices
Use of linguistic features poor; communication ineffective due to major errors.
Table 2.3 Interpretation of TSE scores designed by ETS (Luoma, 2004, p. 69)
Luoma (2004) mentions some other examples of speaking scales widely used in
renowned testing practices, namely ACTFL Proficiency Guidelines, Finnish National
Certificate and Common European Framework of Reference. However, speaking skill is a
very broad skill to measure. Some attempts were done to make more specific scales for
speaking sub-skills, producing fluency scale, accuracy scale, lexical mastery scale and so on,

11
(Weir, 1993, as cited in Luoma, 2004). This approach is also used by the UCLES to design
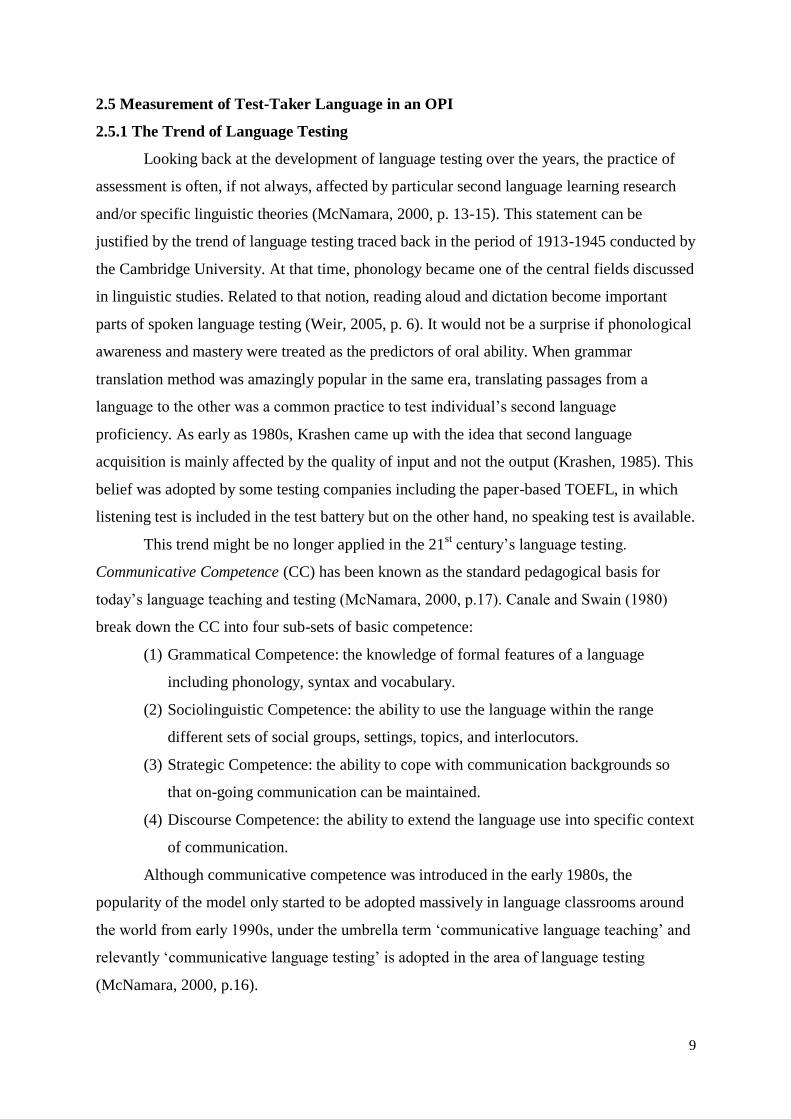
the IELTS Speaking band descriptors.
In the IELTS test, a band which falls in the range of 0 to 9 is assigned to the test-taker
as an overall proficiency measurement and half band scores are allowed. This overall band is
derived from the average scores of individual language skills, i.e. reading, writing, listening
and speaking. Each skill band is derived from the scores of smaller sub-skills. In the IELTS
speaking test for example, four sub-skills are rated by the examiner, i.e. fluency and
coherence; lexical resource; grammatical range and accuracy; and pronunciation (Brown,
2006).

12
Figure 2.1 IELTS speaking band descriptor (IELTS, 2001)

13
2.5.3 Measuring Language for Specific Research Interest
Measuring language skills for commercial testing and for language testing research
can be, but not always, different by nature due to the different interests. Speaking scales are
adequately objective to establish the sense of professionalism for the consumers of the
language tests, but might not be sufficient to build scientific confidence for specific language
testing researches (a test-taker who gets 8 out of 10 may not perform exactly twice better than
a candidate who gets 4) (Douglas, 1994; Brown, 2006). Some problems may arise from the
volatility of the speaking scales: (1) different raters might individually interpret the
descriptors based on their experiences, (2) different raters might give different scores to the
same participants and (3) intuition of the raters in giving rating is hard to justify (Brown &
Hill, 1998; Douglas, 1994). Hence the validity of speaking scales heavily depends on the
raters interpretation and experiences.
It does not mean that ratings given by the raters are useless; rather, the researchers do
need additional methods of language assessment to back-up certain investigations (Douglas,
1994). In order to create a more objective language assessment independent from and
additional to the raters interpretation, researchers are required to use certain method, software
or technique in their research (Read & Nation, 2006). Each sub-skill under the speaking test
needs different method to be assessed quantitatively. For example, to measure lexical density,
type token ratio (TTR) technique can be used (Lorenzo-Dus and Meara, 2005). To quantify
the grammar complexity of the test-taker language, number of words per utterance and/or
number of clauses per utterance can be analysed (Brown, 2006). Such quantitative analysis
can be done after the interviews are recorded and transcribed using certain convention.
Further explanation on the particular techniques used in this study will be elaborated in
chapter three, the research methods.
2.6 Investigating Perception
Eliciting participants‟ perception in research is a common practice to achieve a deeper
understanding of the investigated phenomenon from a more humanistic approach. Further
extension of this conduct is to inquire the relation between perception and the outcome of the
study. Brown (2003), for example, investigated the potential relation between the
interviewers‟ perception of the test-taker and the rating awarded to the test-taker. To achieve
this aim, she conducted a semi-structured interview. An excerpt from the first interviewer
says „She‟s expressing what she wants to say quite reasonably‟; while the second interviewer
puts forward a comment like, „She‟s not being helpful, you know... there‟s no sort of purpose

14
to what she‟s talking about‟. Indeed there is no definite convention to interpret this type of
comments. However, the researcher is then able to construct a logical inference that, the first
interviewer tends to have a positive perception on the test-taker and the second interviewer
perceives it to the opposite direction.
There are a number of studies on language testing and/or language studies related to
the participants‟ perception (Brown, 2003; Brown, 2006; Cheng et al., 2004). There are some
other strategies to elicit the participants‟ perception. A questionnaire using a Likert scale is
also a common practice in eliciting perception. The example of the application of the Likert
scale in a research is by instructing the participants to respond to a statement on a 5-point
format where “5 = Strongly Agree”, “4 = agree”, “3 = undecided”, “2 = disagree” and “1 =
strongly disagree” (Cheng et al., 2004, p.165).
In a questionnaire applying a Likert scale, the value of the numerical continuum
across the items or the questions must be uniform. If „4‟ means „agree‟ for item number one,
it is supposed to mean the same for item number twenty (DeCoster, 2005, p. 4). The purpose
of using this type of scale is to measure a construct using a number of questions or items.
Related to this issue, the responses of two or more items representing the same construct are
supposed to be equivalent. Each item should contain enough information to be responded
separately from the other items. If this condition is fulfilled, the items can be randomised
necessarily. Standing as an instrument, the speaking scale should be valid and reliable
(DeCoster, 2005, p. 7-13). To be valid, the items created should truly represent the construct
being measured. To be reliable, ideally the same items should get the same responses if the
same situations are applied (e.g. the same participant at two different points of time). The
numerical results obtained from the questionnaires are collected to measure the degree of the
response
2.7 Interviewer Support, Test-Taker Perception and Performance
There are a number of studies which investigate the relationship between the
interviewer support and the test-taker language performance. Lorenzo-Dus and Meara (2005)
demonstrated that an interviewer tends to give more features of support to the test-takers
whom he/she assumes to have low proficiency and less features of support to the higher level
test-takers. Hence, an abundant amount of support displayed in an interview is closely related
to mediocre test-takers and little support from the interviewer is related to higher level test
takers. However, the study itself does not provide any claim about the effect of interviewer
support on the test-taker language performance.

15
Brown and Hill (1998) examined the possibility of different styles of interviewers in
affecting the test-taker language. The result of the study strengthens the claim that there are
particular advantages and disadvantages faced by the test-takers related to different
interviewer styles. Brown (2003) confirms the finding by reassigning two of the interviewers
used in her previous study, to interview, this time, a single test-taker. In terms of the rating
given by both interviewers, a significant difference can be noted; the „easy‟ interviewer gives
a higher rating than the rating given by the „difficult‟ interviewer. Further discourse analysis
shows that, the „easy‟ interviewer gives more support by integrating the test-takers utterances
into the next questions and reformulating misunderstood or unintelligible questions. The
„difficult‟ interviewer, on the other hand, gives less support. Less support can include rare
integration of the test-takers utterances into the next exchange and the abandonment of
unintelligible questions. It was revealed in the study that the „difficult‟ interviewer thought
that the test-taker so often failed to anticipate communication breakdowns. Contrary to
Lorenzo-Dus and Meara‟s (2005) study, Brown (2003) argues that more features of support
are related to better rating and limited support given by the interviewer is related to poor
rating. Both the Lorenzo-Dus and Meara‟s (2005) study and Brown‟s (2003) study relate their
findings to the interviewer perception on how well the interview is going. In this study the
point of view is shifted to the perception of the test-taker.
The first research question (RQ) of this study will be:
(RQ1) How does the interviewer support affect the test-taker perception?
The second question of this research is:
(RQ2)What are the effects of the interviewer support on the test-taker linguistic
performance?
16
What the test-takers perceive might not be in line with the result of the interview. The
test-taker, who reckons that a lot of support has helped him/her in the interview, may perform
better in a less well supported interview and vice versa. At this point, the third research
question arises:
(RQ3) What are the effects of the test-taker perception on their linguistic
performance?
17
CHAPTER 3
RESEARCH METHOD
The research design consists of two main variables: (1) the interviewer support is the
independent variable and (2) the perception and the language performance of the test-taker
are the dependent variables. The interviewer support has two conditions: (1) high support
condition and (2) low support condition. The test-taker perception describes either positive or
negative attitude towards different conditions of the interview. Language performance
represents the linguistic quality of test-taker language production during the interviews. This
chapter presents the outline of the research method.
3.1 The Test-takers
The participants in this study are ten English as a Second Language (ESL) learners
who are currently studying at The University of Queensland Australia. The recruitment of the
participants was conducted via Indonesian Student Association mailing-list under the
supervision of the Chief of the association. Ethical clearance has been granted from the
university. All are postgraduate students. As part of their admission requirements to the
university, they all have an IELTS score equal or greater than 6.5. Differences in cultural
backgrounds are minimized because all of the participants are from Indonesia. The
participants have not lived in an English-speaking country for more than 6 months prior to
their stay in Australia. If this study is compared to those of Lorenzo-Duz and Meara (2005)
and O‟Sullivan and Lu (2006), the number of participants in this research is relatively small.
However, if this study is regarded as the extension of Brown‟s (2003) study which only deals
with a single test-taker, ten test-takers provide a more complete picture of the effects of the
supporting behaviour to the test-takers performance.
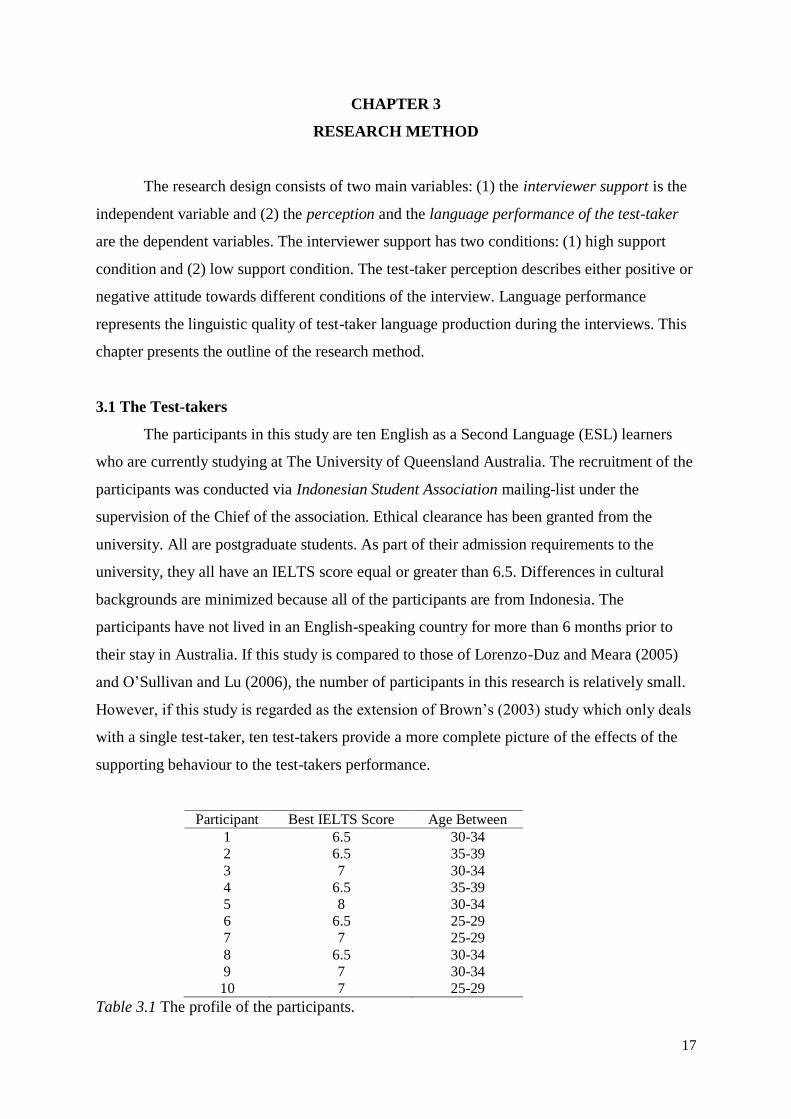
Participant Best IELTS Score Age Between
1 6.5 30-34
2 6.5 35-39
3 7 30-34
4 6.5 35-39
5 8 30-34
6 6.5 25-29
7 7 25-29
8 6.5 30-34
9 7 30-34
10 7 25-29
Table 3.1 The profile of the participants.
18
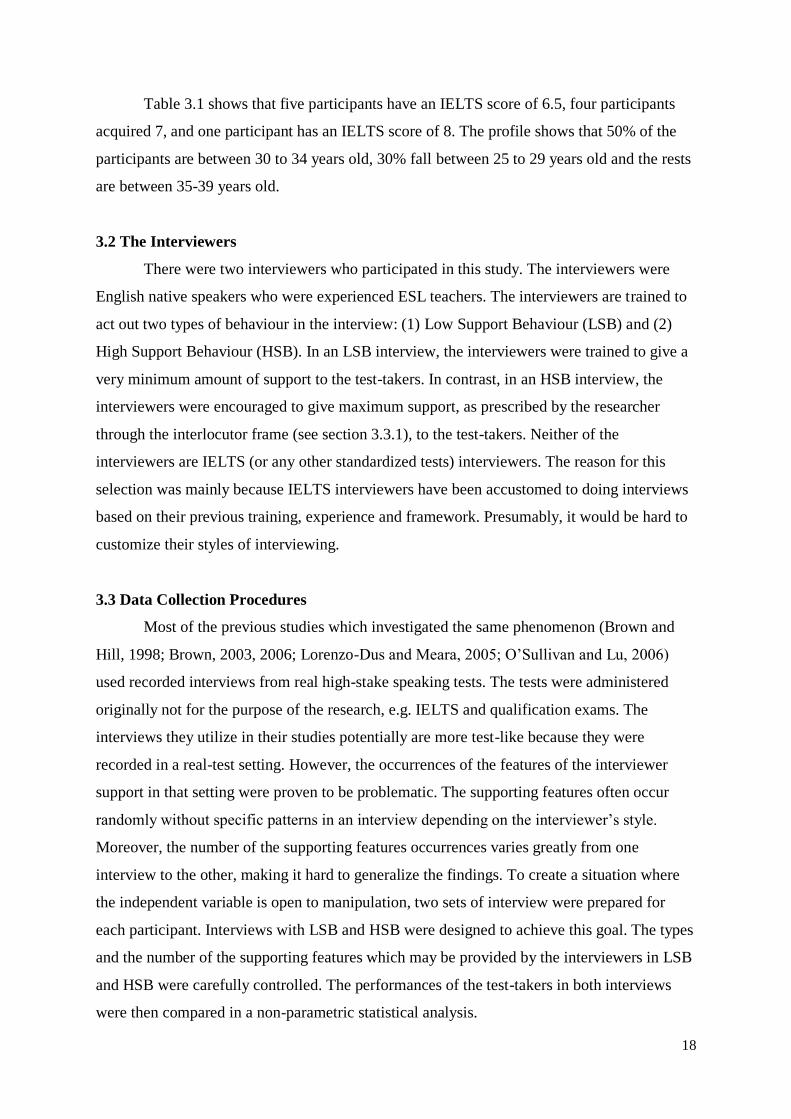
Table 3.1 shows that five participants have an IELTS score of 6.5, four participants
acquired 7, and one participant has an IELTS score of 8. The profile shows that 50% of the
participants are between 30 to 34 years old, 30% fall between 25 to 29 years old and the rests
are between 35-39 years old.
3.2 The Interviewers
There were two interviewers who participated in this study. The interviewers were
English native speakers who were experienced ESL teachers. The interviewers are trained to
act out two types of behaviour in the interview: (1) Low Support Behaviour (LSB) and (2)
High Support Behaviour (HSB). In an LSB interview, the interviewers were trained to give a
very minimum amount of support to the test-takers. In contrast, in an HSB interview, the
interviewers were encouraged to give maximum support, as prescribed by the researcher
through the interlocutor frame (see section 3.3.1), to the test-takers. Neither of the
interviewers are IELTS (or any other standardized tests) interviewers. The reason for this
selection was mainly because IELTS interviewers have been accustomed to doing interviews
based on their previous training, experience and framework. Presumably, it would be hard to
customize their styles of interviewing.
3.3 Data Collection Procedures
Most of the previous studies which investigated the same phenomenon (Brown and
Hill, 1998; Brown, 2003, 2006; Lorenzo-Dus and Meara, 2005; O‟Sullivan and Lu, 2006)
used recorded interviews from real high-stake speaking tests. The tests were administered
originally not for the purpose of the research, e.g. IELTS and qualification exams. The
interviews they utilize in their studies potentially are more test-like because they were
recorded in a real-test setting. However, the occurrences of the features of the interviewer
support in that setting were proven to be problematic. The supporting features often occur
randomly without specific patterns in an interview depending on the interviewer‟s style.
Moreover, the number of the supporting features occurrences varies greatly from one
interview to the other, making it hard to generalize the findings. To create a situation where
the independent variable is open to manipulation, two sets of interview were prepared for
each participant. Interviews with LSB and HSB were designed to achieve this goal. The types
and the number of the supporting features which may be provided by the interviewers in LSB
and HSB were carefully controlled. The performances of the test-takers in both interviews
were then compared in a non-parametric statistical analysis.
19
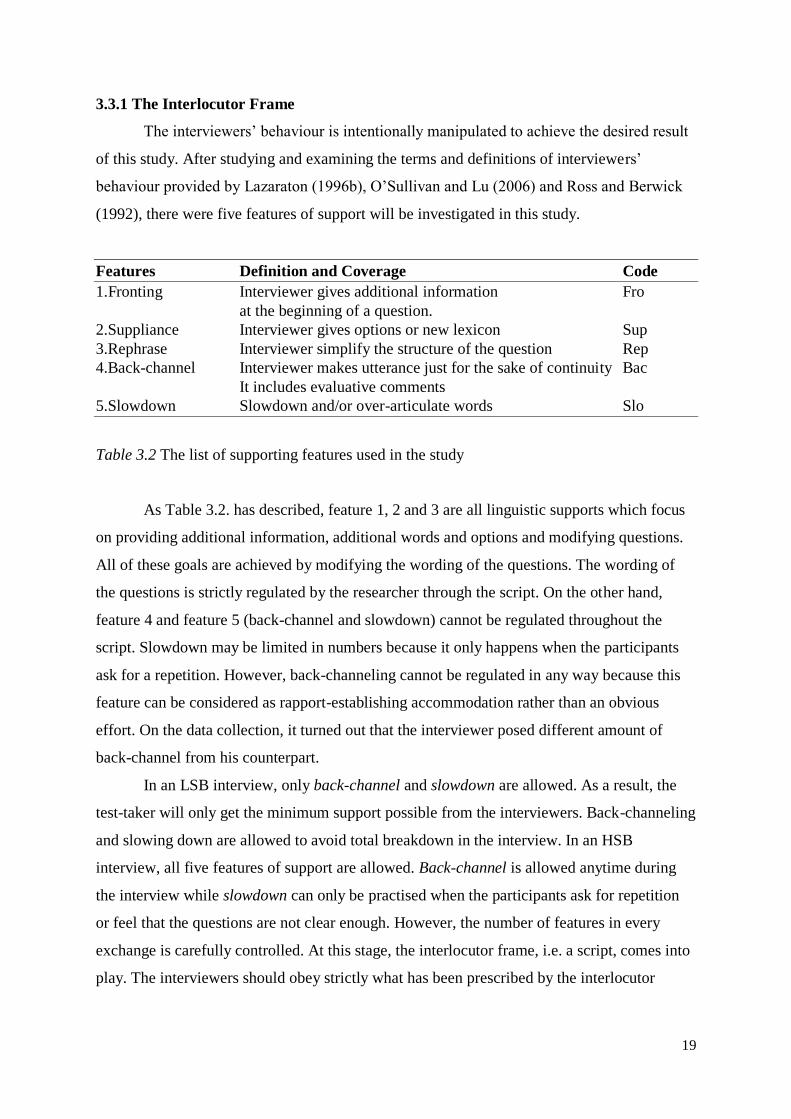
3.3.1 The Interlocutor Frame
The interviewers‟ behaviour is intentionally manipulated to achieve the desired result
of this study. After studying and examining the terms and definitions of interviewers‟
behaviour provided by Lazaraton (1996b), O‟Sullivan and Lu (2006) and Ross and Berwick
(1992), there were five features of support will be investigated in this study.
Features Definition and Coverage Code
1.Fronting Interviewer gives additional information Fro
at the beginning of a question.
2.Suppliance Interviewer gives options or new lexicon Sup
3.Rephrase Interviewer simplify the structure of the question Rep
4.Back-channel Interviewer makes utterance just for the sake of continuity Bac
It includes evaluative comments
5.Slowdown Slowdown and/or over-articulate words Slo
Table 3.2 The list of supporting features used in the study
As Table 3.2. has described, feature 1, 2 and 3 are all linguistic supports which focus
on providing additional information, additional words and options and modifying questions.
All of these goals are achieved by modifying the wording of the questions. The wording of
the questions is strictly regulated by the researcher through the script. On the other hand,
feature 4 and feature 5 (back-channel and slowdown) cannot be regulated throughout the
script. Slowdown may be limited in numbers because it only happens when the participants
ask for a repetition. However, back-channeling cannot be regulated in any way because this
feature can be considered as rapport-establishing accommodation rather than an obvious
effort. On the data collection, it turned out that the interviewer posed different amount of
back-channel from his counterpart.
In an LSB interview, only back-channel and slowdown are allowed. As a result, the
test-taker will only get the minimum support possible from the interviewers. Back-channeling
and slowing down are allowed to avoid total breakdown in the interview. In an HSB
interview, all five features of support are allowed. Back-channel is allowed anytime during
the interview while slowdown can only be practised when the participants ask for repetition
or feel that the questions are not clear enough. However, the number of features in every
exchange is carefully controlled. At this stage, the interlocutor frame, i.e. a script, comes into
play. The interviewers should obey strictly what has been prescribed by the interlocutor
20
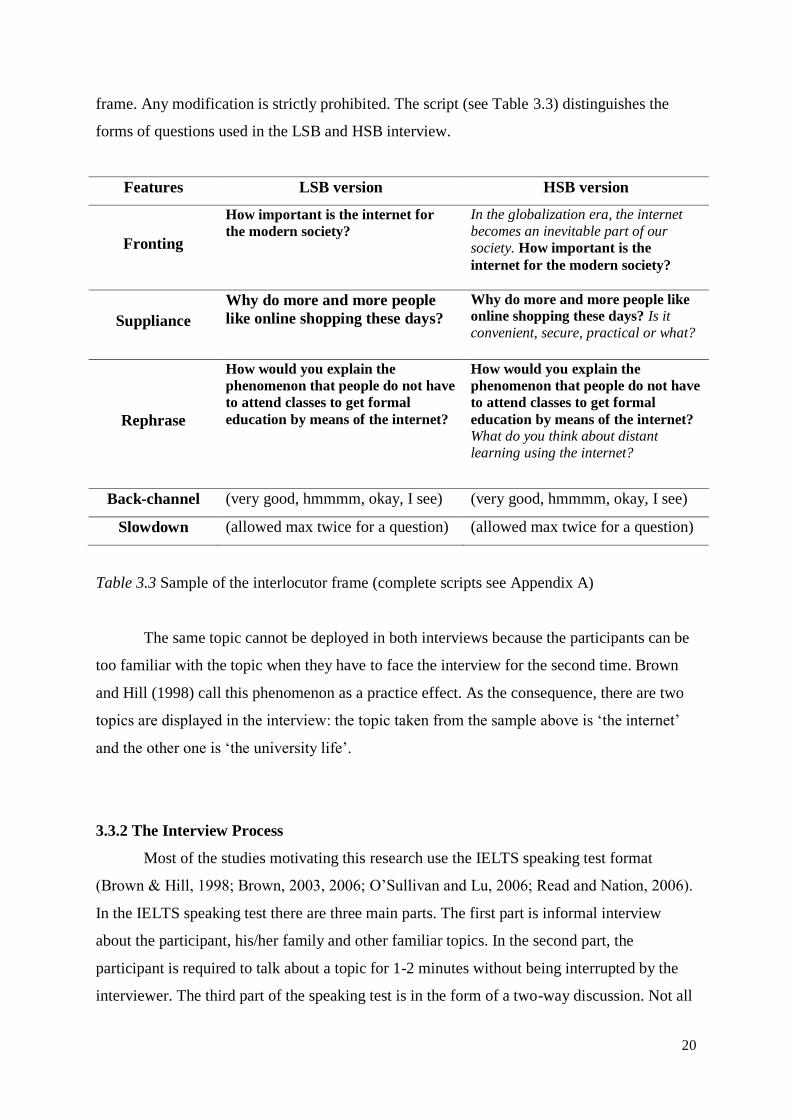
frame. Any modification is strictly prohibited. The script (see Table 3.3) distinguishes the
forms of questions used in the LSB and HSB interview.
Features LSB version HSB version
Fronting
How important is the internet for
the modern society?
In the globalization era, the internet
becomes an inevitable part of our
society. How important is the
internet for the modern society?
Suppliance
Why do more and more people
like online shopping these days?
Why do more and more people like
online shopping these days? Is it
convenient, secure, practical or what?
Rephrase
How would you explain the
phenomenon that people do not have
to attend classes to get formal
education by means of the internet?
How would you explain the
phenomenon that people do not have
to attend classes to get formal
education by means of the internet?
What do you think about distant
learning using the internet?
Back-channel (very good, hmmmm, okay, I see) (very good, hmmmm, okay, I see)
Slowdown (allowed max twice for a question) (allowed max twice for a question)
Table 3.3 Sample of the interlocutor frame (complete scripts see Appendix A)
The same topic cannot be deployed in both interviews because the participants can be
too familiar with the topic when they have to face the interview for the second time. Brown
and Hill (1998) call this phenomenon as a practice effect. As the consequence, there are two
topics are displayed in the interview: the topic taken from the sample above is „the internet‟
and the other one is „the university life‟.
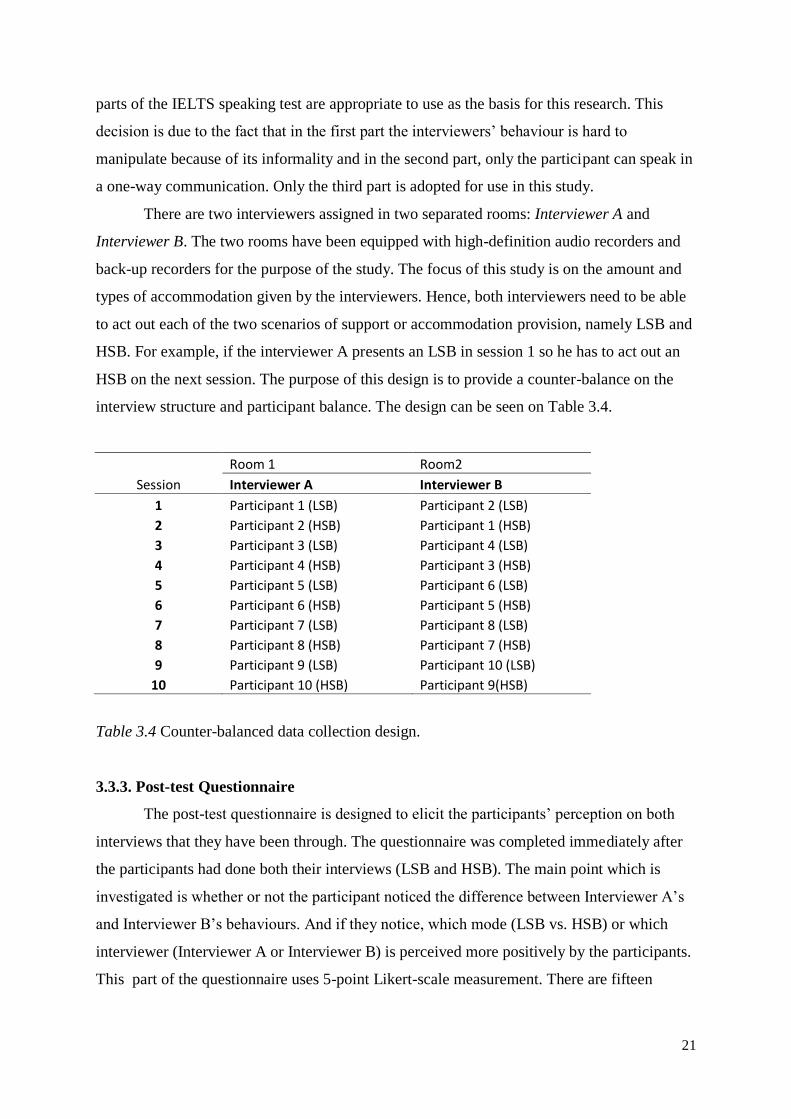
3.3.2 The Interview Process
Most of the studies motivating this research use the IELTS speaking test format
(Brown & Hill, 1998; Brown, 2003, 2006; O‟Sullivan and Lu, 2006; Read and Nation, 2006).
In the IELTS speaking test there are three main parts. The first part is informal interview
about the participant, his/her family and other familiar topics. In the second part, the
participant is required to talk about a topic for 1-2 minutes without being interrupted by the
interviewer. The third part of the speaking test is in the form of a two-way discussion. Not all
21
parts of the IELTS speaking test are appropriate to use as the basis for this research. This
decision is due to the fact that in the first part the interviewers‟ behaviour is hard to
manipulate because of its informality and in the second part, only the participant can speak in
a one-way communication. Only the third part is adopted for use in this study.
There are two interviewers assigned in two separated rooms: Interviewer A and
Interviewer B. The two rooms have been equipped with high-definition audio recorders and
back-up recorders for the purpose of the study. The focus of this study is on the amount and
types of accommodation given by the interviewers. Hence, both interviewers need to be able
to act out each of the two scenarios of support or accommodation provision, namely LSB and
HSB. For example, if the interviewer A presents an LSB in session 1 so he has to act out an
HSB on the next session. The purpose of this design is to provide a counter-balance on the
interview structure and participant balance. The design can be seen on Table 3.4.
Session
Room 1 Room2
Interviewer A Interviewer B
1 Participant 1 (LSB) Participant 2 (LSB)
2 Participant 2 (HSB) Participant 1 (HSB)
3 Participant 3 (LSB) Participant 4 (LSB)
4 Participant 4 (HSB) Participant 3 (HSB)
5 Participant 5 (LSB) Participant 6 (LSB)
6 Participant 6 (HSB) Participant 5 (HSB)
7 Participant 7 (LSB) Participant 8 (LSB)
8 Participant 8 (HSB) Participant 7 (HSB)
9 Participant 9 (LSB) Participant 10 (LSB)
10 Participant 10 (HSB) Participant 9(HSB)
Table 3.4 Counter-balanced data collection design.
3.3.3. Post-test Questionnaire
The post-test questionnaire is designed to elicit the participants‟ perception on both
interviews that they have been through. The questionnaire was completed immediately after
the participants had done both their interviews (LSB and HSB). The main point which is
investigated is whether or not the participant noticed the difference between Interviewer A‟s
and Interviewer B‟s behaviours. And if they notice, which mode (LSB vs. HSB) or which
interviewer (Interviewer A or Interviewer B) is perceived more positively by the participants.
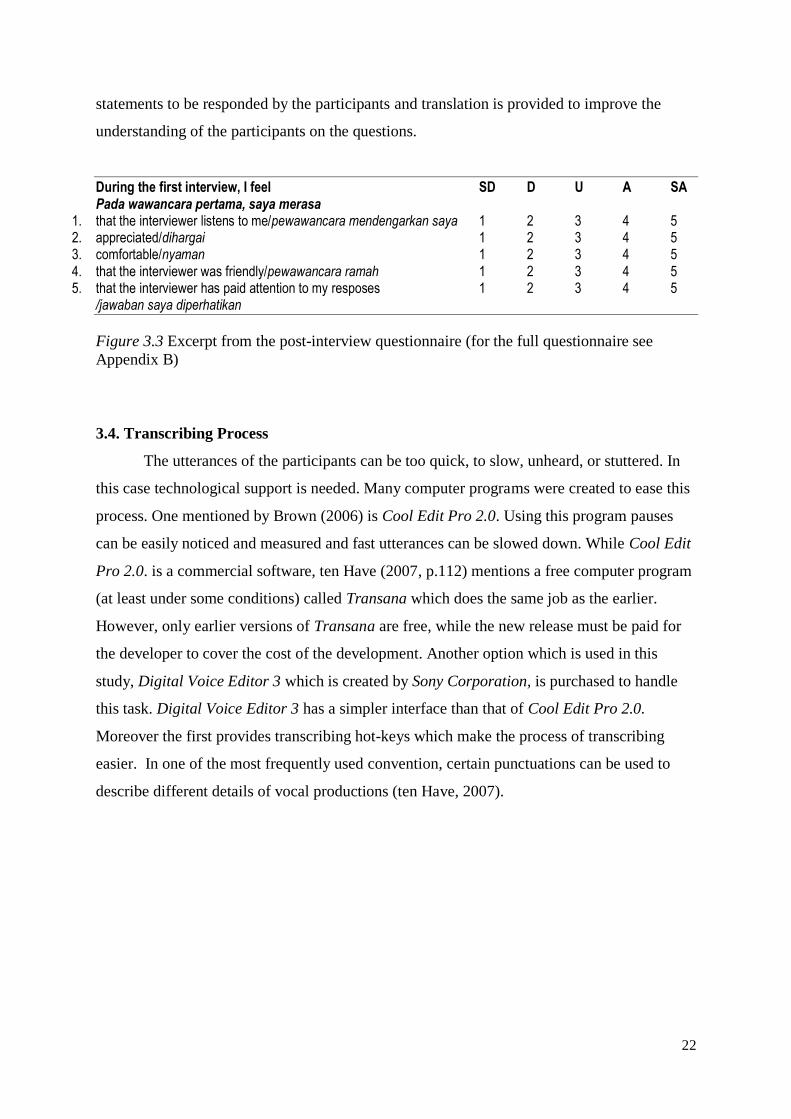
This part of the questionnaire uses 5-point Likert-scale measurement. There are fifteen
22
statements to be responded by the participants and translation is provided to improve the
understanding of the participants on the questions.
During the first interview, I feel SD D U A SA Pada wawancara pertama, saya merasa
1. that the interviewer listens to me/pewawancara mendengarkan saya 1 2 3 4 5 2. appreciated/dihargai 1 2 3 4 5 3. comfortable/nyaman 1 2 3 4 5 4. that the interviewer was friendly/pewawancara ramah 1 2 3 4 5 5. that the interviewer has paid attention to my resposes 1 2 3 4 5
/jawaban saya diperhatikan
Figure 3.3 Excerpt from the post-interview questionnaire (for the full questionnaire see
Appendix B)
3.4. Transcribing Process
The utterances of the participants can be too quick, to slow, unheard, or stuttered. In
this case technological support is needed. Many computer programs were created to ease this
process. One mentioned by Brown (2006) is Cool Edit Pro 2.0. Using this program pauses
can be easily noticed and measured and fast utterances can be slowed down. While Cool Edit
Pro 2.0. is a commercial software, ten Have (2007, p.112) mentions a free computer program
(at least under some conditions) called Transana which does the same job as the earlier.
However, only earlier versions of Transana are free, while the new release must be paid for
the developer to cover the cost of the development. Another option which is used in this
study, Digital Voice Editor 3 which is created by Sony Corporation, is purchased to handle
this task. Digital Voice Editor 3 has a simpler interface than that of Cool Edit Pro 2.0.
Moreover the first provides transcribing hot-keys which make the process of transcribing
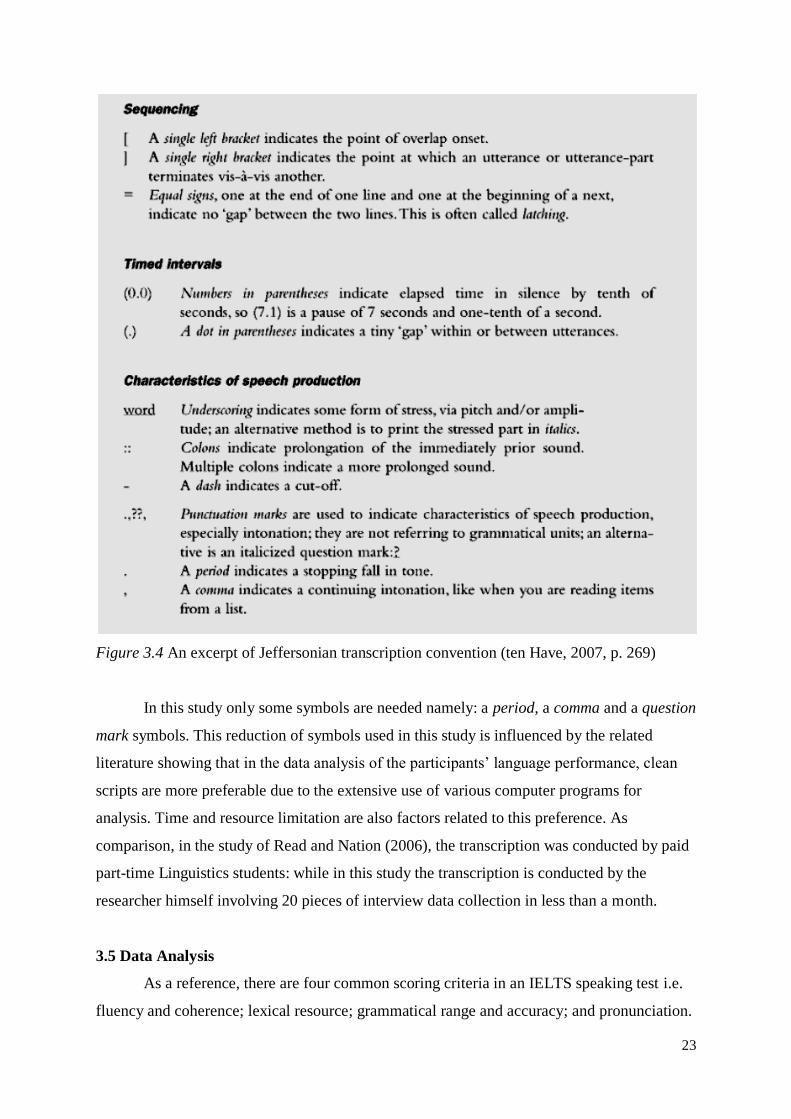
easier. In one of the most frequently used convention, certain punctuations can be used to
describe different details of vocal productions (ten Have, 2007).
23
Figure 3.4 An excerpt of Jeffersonian transcription convention (ten Have, 2007, p. 269)
In this study only some symbols are needed namely: a period, a comma and a question
mark symbols. This reduction of symbols used in this study is influenced by the related
literature showing that in the data analysis of the participants‟ language performance, clean
scripts are more preferable due to the extensive use of various computer programs for
analysis. Time and resource limitation are also factors related to this preference. As
comparison, in the study of Read and Nation (2006), the transcription was conducted by paid
part-time Linguistics students: while in this study the transcription is conducted by the
researcher himself involving 20 pieces of interview data collection in less than a month.
3.5 Data Analysis
As a reference, there are four common scoring criteria in an IELTS speaking test i.e.
fluency and coherence; lexical resource; grammatical range and accuracy; and pronunciation.

24
Brown (2006) has done a very good job in describing comprehensively the test-taker
language in an IELTS speaking test. Her foci of investigation include: fluency and coherence;
lexical resource; grammatical range and accuracy but not pronunciation. She argues that
pronunciation is too subtle to describe and might be beyond the scope of the research.
However, her methods were applied not to investigate the effects of interviewer behaviour on
the test taker performance but to examine the discriminating power of each band in an IELTS
speaking test, e.g. whether the performance of the test-taker from band 8 definitely differs
from the one from band 7. Considering the effectiveness of her techniques of performance
operationalization, some parts of her methodology are adopted in this study. As the test-taker
performance is the object of analysis in this study, the questions asked by the interviewer are
removed from the script provided for the sake of analysis.
As the final selection, there are three categories of performance measured in this
research: (1) fluency, (2) lexical resource and (3) grammatical complexity.
3.5.1 Fluency
The following methods are adapted to operationalize the sub-features of fluency. The
scripts of the interviews were trimmed, cleaned and pruned. The total words of each
interview was counted using word-processing software. The interview recording has been
splitted into 20 individual sessions. The total time per interview is displayed using Digital
Voice Editor . Total amount of speech is the total words produced by the test-taker in an
interview. Speech rate can be operationalized by counting the number of words produced per
60 seconds. Response length is measured by counting the total number of words per
utterance. In summary, there are three indicators of fluency and coherence: (1) total amount
of speech, (2) speech rate, and (3) response length.
3.5.2 Lexical Resource
There are two main dimensions of lexical resource. The first is called lexical density
and the second is lexical breadth (Daller et al., 2007). In the measurement of lexical density
(diversity), the ratio of type and token is calculated. The sentence „the cat sat on the mat’
comprises 6 tokens (number of all words in the sentence) and 5 types (number of different
words in the sentence). The Type-Token Ratio (TTR) is calculated here and giving 5:6 or
0.8333 as the result (Daller et al., 2007, p. 13). The second dimension of vocabulary output is
lexical breadth (sophistication). This reflects the number of low-frequency words used by the
participants. The concept of low-frequency vs. high-frequency words is constructed based on

25
the available English corpus taken from various sources. For instance, the word go is
considered a high-frequency word and the word elucidate is a low-frequency word based on
the corpus. More advanced language learners are expected to employ more low-frequency
words in their speech or writing. To measure the dimensions above, a computer program
called VocabProfile (Cobb, 2002) was utilized. VocabProfile is able to display lexical
breadth in a comprehensive analysis of: (1) the most frequent 500 words in English, (2) the
most frequent 1000 words in English, (3) the second most frequent 1000 words in English,
(4) words in Academic Word List (AWL), and (5) the words which are not included in the
first four categories. Lexical fillers like “okay” and “yeah” and proper names are cut out from
the script because they occur frequently and unnecessarily are regarded as off-list category by
the software. VocabProfile is also able to provide the information on the ratio of the content
words to the non-content words. This measurement provides the percentage of content words
(such as nouns, verbs, adjectives and adverbs) and non content words (such as pronouns,
conjunctions and prepositions). As the final selection, there are only three measurements of
lexical resource to analyse in this study: (1) TTR, (2) K2 words and (3) ratio of content non-
content words.
3.5.3 Grammatical Complexity
As for grammatical range and accuracy, there are two key features of interest:
grammatical accuracy and grammatical complexity. However, measuring accuracy and
complexity in spoken language can be problematic. Clear boundaries between units in a
written unit are commonly provided by punctuation and semantic markers. Spoken text is
lack of these features; loose fragments and ill-formed sentences often occur sporadically
along the discourse. Nonetheless, efforts have to be made to operationalize both key
dimensions. The T-unit is employed to achieve this goal. According Hunt (1970), „T-unit is
the shortest unit into which a piece of discourse can be cut without leaving any sentence
fragments as residue.‟ Grammatical complexity can be estimated by counting: (1) words per
T-unit (words per sentence) and (2) T-unit per response (sentences per response). For
grammatical accuracy, error-free T-units become the centre of attention. Basic errors can
occur in a T-unit including: tenses, noun-verb agreement, singular/plural, article, preposition,
pronoun choice and comparative formation. Other errors can also include relative clause
formation but may not include the right usage of word order. However, grammatical accuracy
is stripped out from this study because the limitation on resources.
26
3.6 Further Analysis
Three key categories of measurements have been identified: (1) fluency, (2) lexical
resource and (3) grammatical complexity. The operationalization of those three categories in
both LSB interview and HSB interview produced ordinal values which then will be compared
in a non-parametric statistical analysis. For example, an analysis of speech rate would
produce a sample value of 79.56 words per minute and an analysis of type token ratio would
produce a sample value of 0.285. From the analysis, the participants‟ performance in an LSB
interview and HSB interview can be analysed. If the gap is significant, it means that RQ2 is
supported by a positive finding. The questionnaires which have been filled in by the test-
takers are then scrutinized. The test-taker perception is then compared to their performance in
three aspects of measurements. Using this, the answers to RQ1 and RQ3 can be figured out.
The repeated measurement of only 10 participants cannot guarantee the normal
distribution of the sample. A t-test, like any other parametric tests, requires strict prerequisites
on the sample and data which may not be fulfilled by the sample provided in this study. Non-
parametric tests are used due to the small number of participants (Field, 2005). The Wilcoxon
signed ranks test is used because it can measure interval, ordinal and ratio scales. The
Wilcoxon signed ranks test is a substitute of a t-test for related samples and it is safely applied
if the assumptions of the t-test are violated.
27
CHAPTER 4
RESULTS
Interviewer support, participant’s perception and participant performance are all
abstract concepts, and these three are the variables which are the subject of this study.
Interviewer support is represented by the acts conducted by the interviewer during the
interview. Five acts are operationalized in this study. These are:
(1) fronting: giving additional information before a question,
(2) suppliance: giving options after a question,
(3) rephrase: modifying the question into a simpler one,
(4) back-channel: making utterance to show interest, and
(5) slowdown: exaggerating pronunciation and/or slowing the rate of speech (if
requested by the participant).
Participant perception is elicited using 15 statements using a Likert-scale style
questionnaire. Participant performance is the hardest one to operationalize. Participant
performance in this study consists of fluency, lexical resource and grammar complexity. All
interview sessions were recorded on the same day and were transcribed manually by the
researcher. This took a month to complete. Before further explanation of the data analysis,
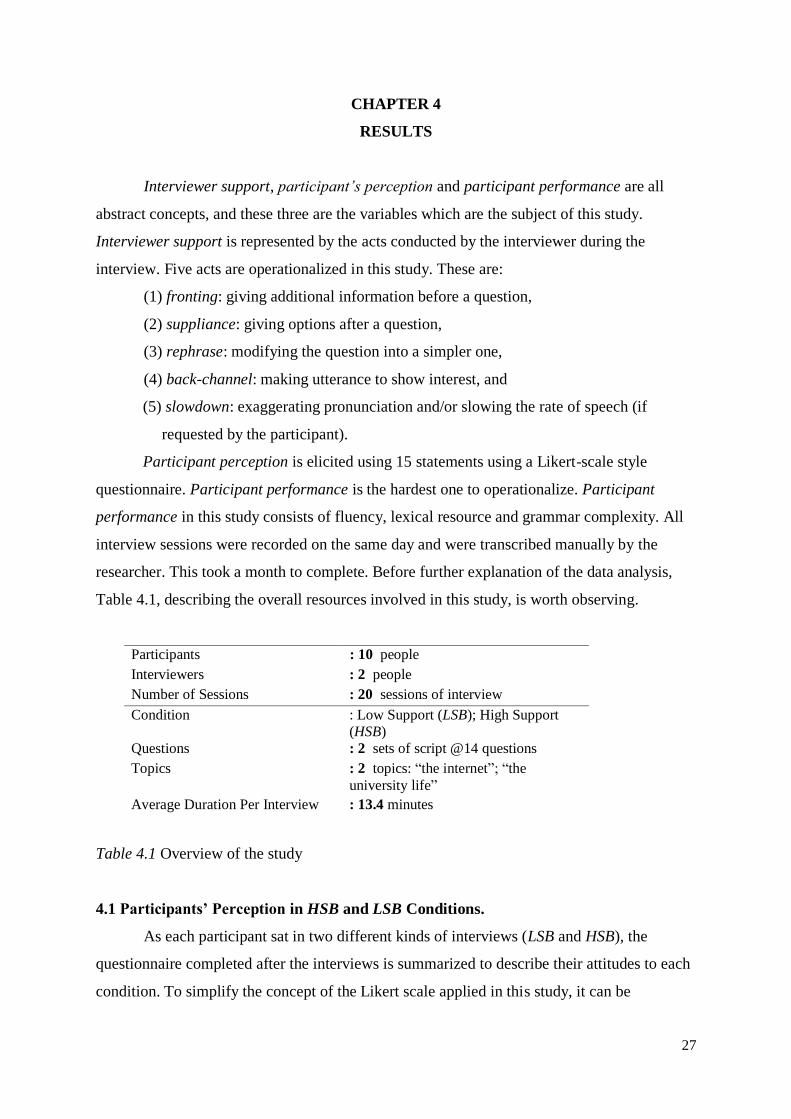
Table 4.1, describing the overall resources involved in this study, is worth observing.
Table 4.1 Overview of the study
4.1 Participants’ Perception in HSB and LSB Conditions.
As each participant sat in two different kinds of interviews (LSB and HSB), the
questionnaire completed after the interviews is summarized to describe their attitudes to each
condition. To simplify the concept of the Likert scale applied in this study, it can be
Participants : 10 people
Interviewers : 2 people
Number of Sessions : 20 sessions of interview
Condition : Low Support (LSB); High Support
(HSB)
Questions : 2 sets of script @14 questions
Topics : 2 topics: “the internet”; “the
university life”
Average Duration Per Interview : 13.4 minutes
28
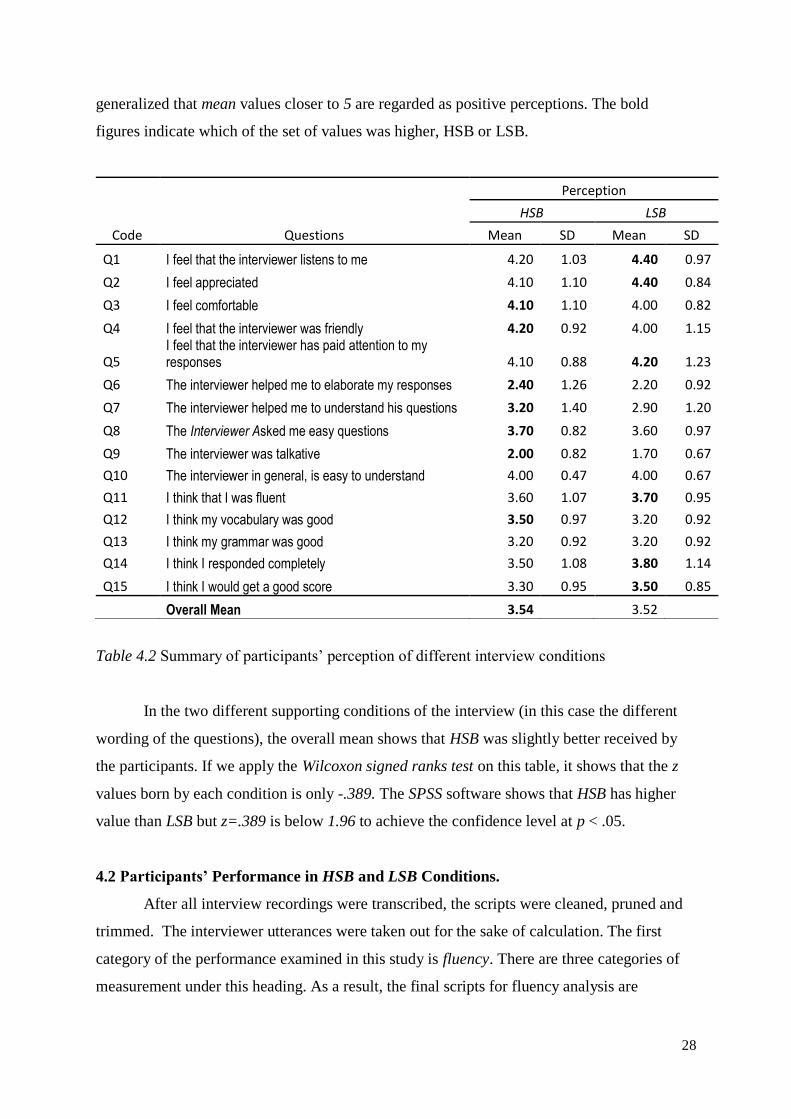
generalized that mean values closer to 5 are regarded as positive perceptions. The bold
figures indicate which of the set of values was higher, HSB or LSB.
Code Questions
Perception
HSB LSB
Mean SD Mean SD
Q1 I feel that the interviewer listens to me 4.20 1.03 4.40 0.97
Q2 I feel appreciated 4.10 1.10 4.40 0.84
Q3 I feel comfortable 4.10 1.10 4.00 0.82
Q4 I feel that the interviewer was friendly 4.20 0.92 4.00 1.15
Q5 I feel that the interviewer has paid attention to my responses 4.10 0.88 4.20 1.23
Q6 The interviewer helped me to elaborate my responses 2.40 1.26 2.20 0.92
Q7 The interviewer helped me to understand his questions 3.20 1.40 2.90 1.20
Q8 The Interviewer Asked me easy questions 3.70 0.82 3.60 0.97
Q9 The interviewer was talkative 2.00 0.82 1.70 0.67
Q10 The interviewer in general, is easy to understand 4.00 0.47 4.00 0.67
Q11 I think that I was fluent 3.60 1.07 3.70 0.95
Q12 I think my vocabulary was good 3.50 0.97 3.20 0.92
Q13 I think my grammar was good 3.20 0.92 3.20 0.92
Q14 I think I responded completely 3.50 1.08 3.80 1.14
Q15 I think I would get a good score 3.30 0.95 3.50 0.85
Overall Mean 3.54 3.52
Table 4.2 Summary of participants‟ perception of different interview conditions
In the two different supporting conditions of the interview (in this case the different
wording of the questions), the overall mean shows that HSB was slightly better received by
the participants. If we apply the Wilcoxon signed ranks test on this table, it shows that the z
values born by each condition is only -.389. The SPSS software shows that HSB has higher
value than LSB but z=.389 is below 1.96 to achieve the confidence level at p < .05.
4.2 Participants’ Performance in HSB and LSB Conditions.
After all interview recordings were transcribed, the scripts were cleaned, pruned and
trimmed. The interviewer utterances were taken out for the sake of calculation. The first
category of the performance examined in this study is fluency. There are three categories of
measurement under this heading. As a result, the final scripts for fluency analysis are

29
analysed based on: (1) speech rate, (2) total words per session and (3) words per utterance.
Speech rate is calculable by way of the total words in the session and divided by the duration
of the interview. The result value of this calculation would be in words per minute. The
second indicator of fluency is the total words produced by the participant in each session of
the interview. It follows that, the more fluent a participant, the more words he or she will
produce in an interview. The third indicator of fluency is the total words per utterance. What
is meant by this is the average of total words spoken by the participants in answering each
question. The result of this calculation may be contingent on the second indicator of fluency
(total words). The following table shows the mean analysis of the three indicators
representing the fluency analysis in this study. The values in the HSB condition are compared
with the values acquired in the LSB condition. The bold figures indicate higher values than
those of their counterparts.
HSB LSB
Mean SD Mean SD
Speech Rate 74.75 16.68 78.62 7.91
Total Words per Session 1046.3 293.94 983.2 328.12
Words per Utterance 74.74 20.99 70.23 23.44
Table 4.3 Fluency in supporting behaviour analysis
From the summary of the mean analysis of fluency mentioned above, there is a better
value in the total words produced per interview and total words per utterance in the HSB
condition than the LSB condition. However, the speech rate value in HSB is less than that of
LSB. This reflects the fact that participants tend to speak more slowly (less words per minute)
in the HSB condition.
The second category of performance investigated in this study is lexical resource.
There are three categories examined: (1) K2 words, (2) Type Token Ratio and (3) Content
Non-Content Word Ratio. Assuming that K1 words are the „unsophisticated‟ words and K2
Words are the „more sophisticated‟ words, it can be said that the higher K2 words percentage
shows that the vocabulary usage is deeper. Thus, the lexical choice is said to be more
sophisticated. For the lexical density, two measurements are used: Type Token Ratio and
Content Non-Content Word Ratio. Lexically dense speech can indicate that the speaker is
repeating words less often and tends to apply more unique words in his or her sentences.
Conversely if the speaker produces more content words (noun, verbs, adjective, etc) than

30
non-content words (grammatical markers, pronouns, etc.) it is also said to be Lexically dense.
The former is estimated by the use of Type Token Ratio (TTR) and the second is estimated by
Content Non-content Words Ratio. The three measurements of lexical resource ( K2 words,
Type Token Ratio and Content Non-Content Word Ratio) are summarized in Table 4.4.
HSB LSB
Mean SD Mean SD
K2 percentage 3.699 0.868529 3.501 0.630334
Type Token Ratio 0.285 0.042492 0.287 0.026268
Content Non-Content Word Ratio 0.425 0.03504 0.436 0.030984
Table 4.4 Lexical Resource in supporting behaviour analysis
In the analysis of the K2 words production, a majority of the participants perform
better in HSB condition (z=-.255, p>.05). In the HSB condition, the TTR mean value is
slightly lower than that of the LSB. In Content Non-content word ratio analysis, participants
actually perform better when they are interviewed in LSB condition (z=-1.727). Overall, this
analysis shows that participants display a more sophisticated vocabulary in the HSB condition
but use less dense vocabulary when they are interviewed in LSB condition. However,
differences in both results were marginal (z values are less than 1.96).
Grammatical accuracy is analysed in the third category of performance in this study,.
There are two indicators used to represent the category. The first is words per T-Unit (words
per sentence) while the second is T-Unit per response (sentences per response). T-Unit in a
spoken text being the substitution for a sentence in a written text. The assumption of the first
indicator is that the more capable the participants, the more words they use in a sentence.
Meanwhile, the assumption of the second is that the more capable the participants the more
sentences used every time they answer a question.
HSB LSB
Mean SD Mean SD
Words per T-Unit 13.79 1.137688 13.46 1.279931
T-Unit per Response 5.88 1.489071 5.43 1.866101
Table 4.5 Grammatical complexity in supporting behaviour analysis

31
The grammatical complexity analysis above shows similar results on both words per
T-Unit calculation and T-Unit per response calculation. Participants produced more words per
T-Unit in the HSB condition (z = -.255) and they also produced more T-Units per Response in
the HSB condition (z=-.866).
4.3 Conditional Supporting Behaviour: Back-Channeling.
In addition to HSB and LSB conditions, there is also a form of support that plays a role
in the interview which cannot be manipulated by the script, namely back-channeling. During
the data collection, Interviewer A performed more back-channeling (High Back Channeling)
in both HSB and LSB condition than that of his counterpart. The reason why back-channeling
was allowed for in each condition is that back-channeling could become problematic if
removed from any speech event. An information exchange without any reciprocal feedback
would be no different than any recorded spoken test using computers. Different amounts of
back-channeling were provided by both interviewers. A comparison of the back-channeling
behaviour can be observed in the following graph:
Figure 4.1 The occurrence of back-channeling by both interviewers.
The occurrence of back-channeling by both interviewers was tallied in each interview.
In each case Interviewer A introduced himself to the participant before the interview began.
This behaviour did not directly violate the research protocol because both interviewers
executed Low Support Behaviour (LSB) and High Support Behaviour (HSB) based strictly on
the script prescribed for them. However, based on the difference of the back-channeling
P1 P2 P3 P4 P5 P6 P7 P8 P9 P10 Mean
HBC 18 15 16 17 13 12 13 14 21 14 15.3
LBC 6 5 8 9 7 7 9 5 6 10 7.2
0
5
10
15
20
25
Occ
ure
nce
of
Bac
k-ch
ann
elin
g

32
strategy and the self-introduction practised by both interviewers, it can be added that
Interviewer A established a higher level of rapport with the participants via interpersonal
features of support. Hence, Interviewer A represents High Back Channeling (HBC) and
Interviewer B represents Low Back Channeling (LBC). This variation is examined in this
study.
4.4 Participants’ Perception in HBC and LBC Conditions.
In the previous section, the participant perception was analysed in HSB vs. LSB
conditions. In this section, the participant‟s perception in the HBC vs. LBC conditions will be
is examined.
Code Questions
Perception
HBC LBC
Mean SD Mean SD
Q1 I feel that the interviewer listens to me 4.7 0.48 3.9 1.2
Q2 I feel appreciated 4.7 0.48 3.8 1.14
Q3 I feel comfortable 4.5 0.71 3.6 0.97
Q4 I feel that the interviewer was friendly 4.7 0.48 3.5 1.08
Q5 I feel that the interviewer has paid attention to my responses 4.6 0.52 3.7 1.25
Q6 The interviewer helped me to elaborate my responses 2.6 1.26 2 0.82
Q7 The interviewer helped me to understand his questions 3.4 1.17 2.7 1.34
Q8 The Interviewer Asked me easy questions 3.6 0.97 3.7 0.82
Q9 The interviewer was talkative 1.9 0.74 1.8 0.79
Q10 The interviewer in general, is easy to understand 4.2 0.42 3.8 0.63
Q11 I think that I was fluent 3.8 0.92 3.5 1.08
Q12 I think my vocabulary was good 3.5 0.97 3.2 0.92
Q13 I think my grammar was good 3.2 0.92 3.2 0.92
Q14 I think I responded completely 3.9 0.99 3.4 1.17
Q15 I think I would get a good score 3.5 0.85 3.3 0.95
Overall Mean 3.79 3.27
Table 4.6 Summary of participants‟ perception on different back-channeling mode
There is a strong pattern in Table 4.6 showing that participants on average have a
positive perception of their interview process in the HBC condition. If we apply Wilcoxon
signed ranks test here, the z is -3.206, meaning that perception of HBC has a higher value
than the perception of LBC. The z is above 1.96 (the minus sign is ignored) and this can be

33
interpreted as a significant result at p <.05. To support this pattern, some open statements
written by the participants show that the HBC condition was better received.
Participant 5: the second interview (Interviewer B) is quite unnatural ... First
interviewer (Interviewer B) is more engaging ... No introduction in the second
interview (Interviewer B)...
Participant 9: ...the second interviewer (Interviewer B) seems more intimidating.
Participant 10: ...Interviewer I (Interviewer B) didn’t say something if he wanted to
move to another questions...
4.5 Participants’ Performance in HBC and LBC Conditions.
The participant performances in HBC and LBC conditions are compared here. The
first category of the performance displayed is fluency.
HBC LBC
Mean SD Mean SD
Speech Rate 70.31 13.35 83.06 8.98
Total Words per Session 1062.10 314.41 967.40 304.03
Words per Utterance 75.86 22.46 69.10 21.72
Table 4.7 Fluency in back-channeling analysis
Similar to the results of the HSB vs. LSB analysis, speech rate in HBC is lower than in
LBC. It shows that the participants speak slower in the high back channeling condition.
However the number of total words per session and total words per utterance in HBC is
higher than those of LBC. The statistical test results in z=-1.274 which is insignificant. The
pattern has shown that HBC can elicit more words from the participants. In effect,
participants generally spoke more slowly in the HBC condition but produced more words.
However they tended to speak more quickly in the LBC condition but produce less words.

34
The second category of performance analysed in this study is lexical resource.
HBC LBC
Mean SD Mean SD
K2 percentage 3.81 0.90 3.39 0.52
Type Token Ratio 0.290 0.040 0.282 0.029
Content Non-Content Word Ratio 0.439 0.031 0.422 0.033
Table 4.8 Lexical Resource in back-channeling analysis
In a HBC vs LBC analysis all sub-categories in lexical resource show similar patterns.
The participants displayed a more sophisticated words usage in the HBC condition (shown by
K2 percentage) and also produced a denser vocabulary in the HBC condition (shown by type
token ratio and content non-content word ratio).
The third category of performance is grammatical complexity.
HBC LBC
Mean SD Mean SD
Words per T-Unit 13.69 1.33 13.56 1.10
T-Unit per Response 6.12 1.71 5.19 1.55
Table 4.9 Grammar complexity in back-channeling analysis
This table shows that test-takers produced more words per T-Unit and more T-Units
per response in HBC mode than LBC mode.
4.6 Supporting Behaviours and Back Channeling in Contrast
In the previous sections, the analysis of HSB vs. LSB (see Table 4.2, 4.3, 4.4, and 4.5)
and HBC vs. LBC (see Table 4.6, 4.7, 4.8 and 4.9) were put in a separate analysis. The
following results compare both factors side by side in each category of analysis, both in
perception analysis and performance analysis. In addition, the mean values will be displayed
here as well as data from each test-taker. Starting with perception, the following records are
contrasting supporting behaviour and back channeling in the same graph.

35
Figure 4.2 Participant perception
By way of perception analysis, it can be seen that HSB vs. LSB shows a marginal
difference. On the other hand, the test-taker perception in HBC condition is far higher than
that in LBC condition. It corroborates the tendency that the variability of back channeling
(HBC/LBC) behaviour affects the participants‟ perceptions better than the variability of the
wording of the questions (HSB/LSB)
4.7 Contrasting Participant Fluency in HSB vs. LSB and HBC vs. LBC
There are three sub-categories in fluency: (1) speech rate, (2) total words per session
and (3) words per utterance. Speech rate is calculable by way of the total words in that
particular session divided by the duration of the interview. The resultant value of this
calculation would be in words per minute. Again, comparisons are made between the
participant performance in LSB vs. HSB and HBC vs. LBC (see Table 4.10).
3.00
3.10
3.20
3.30
3.40
3.50
3.60
3.70
3.80
3.90
High Low
Back Channeling
Support Behaviour
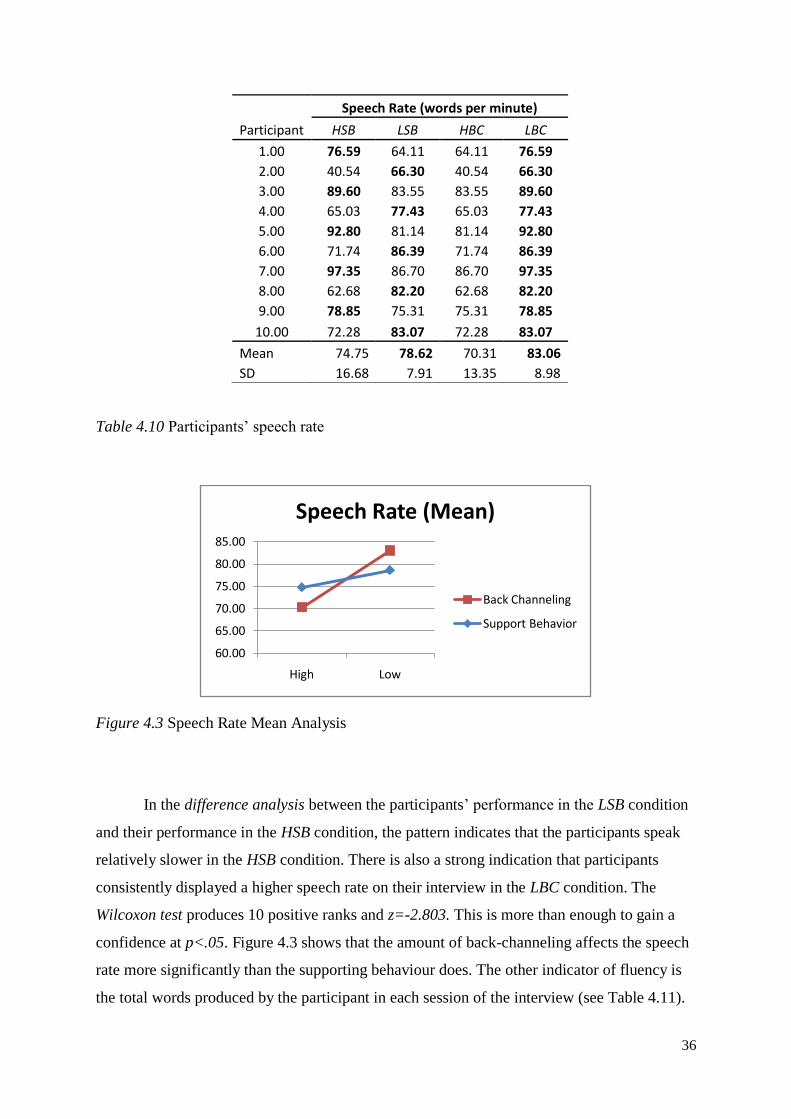
36
Participant
Speech Rate (words per minute)
HSB LSB HBC LBC
1.00 76.59 64.11 64.11 76.59
2.00 40.54 66.30 40.54 66.30
3.00 89.60 83.55 83.55 89.60
4.00 65.03 77.43 65.03 77.43
5.00 92.80 81.14 81.14 92.80
6.00 71.74 86.39 71.74 86.39
7.00 97.35 86.70 86.70 97.35
8.00 62.68 82.20 62.68 82.20
9.00 78.85 75.31 75.31 78.85
10.00 72.28 83.07 72.28 83.07
Mean 74.75 78.62 70.31 83.06
SD 16.68 7.91 13.35 8.98
Table 4.10 Participants‟ speech rate
Figure 4.3 Speech Rate Mean Analysis
In the difference analysis between the participants‟ performance in the LSB condition
and their performance in the HSB condition, the pattern indicates that the participants speak
relatively slower in the HSB condition. There is also a strong indication that participants
consistently displayed a higher speech rate on their interview in the LBC condition. The
Wilcoxon test produces 10 positive ranks and z=-2.803. This is more than enough to gain a
confidence at p<.05. Figure 4.3 shows that the amount of back-channeling affects the speech
rate more significantly than the supporting behaviour does. The other indicator of fluency is
the total words produced by the participant in each session of the interview (see Table 4.11).
60.00
65.00
70.00
75.00
80.00
85.00
High Low
Speech Rate (Mean)
Back Channeling
Support Behavior
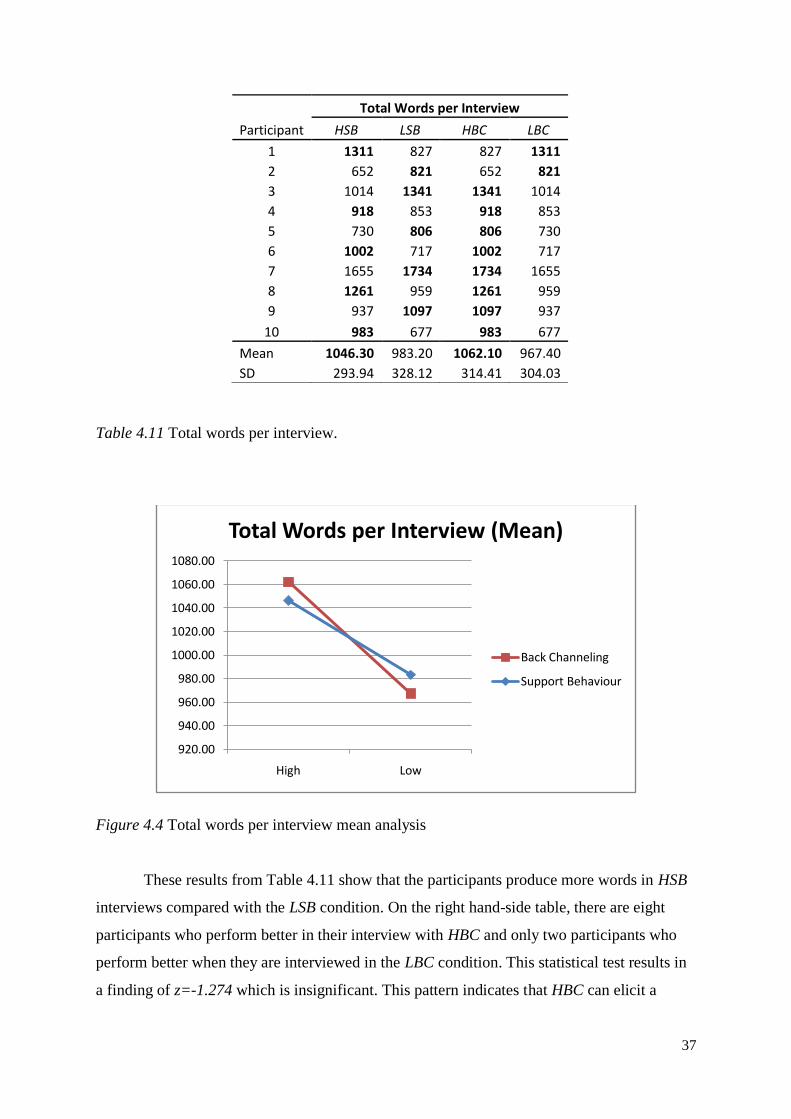
37
Participant
Total Words per Interview
HSB LSB HBC LBC
1 1311 827 827 1311
2 652 821 652 821
3 1014 1341 1341 1014
4 918 853 918 853
5 730 806 806 730
6 1002 717 1002 717
7 1655 1734 1734 1655
8 1261 959 1261 959
9 937 1097 1097 937
10 983 677 983 677
Mean 1046.30 983.20 1062.10 967.40
SD 293.94 328.12 314.41 304.03
Table 4.11 Total words per interview.
Figure 4.4 Total words per interview mean analysis
These results from Table 4.11 show that the participants produce more words in HSB
interviews compared with the LSB condition. On the right hand-side table, there are eight
participants who perform better in their interview with HBC and only two participants who
perform better when they are interviewed in the LBC condition. This statistical test results in
a finding of z=-1.274 which is insignificant. This pattern indicates that HBC can elicit a
920.00
940.00
960.00
980.00
1000.00
1020.00
1040.00
1060.00
1080.00
High Low
Total Words per Interview (Mean)
Back Channeling
Support Behaviour

38
greater number of words from the participants. Figure 4.4 shows that HSB/LSB and
HBC/LBC gave almost similar effects to the total word per interview.
The third indicator of the fluency is the words per utterance.
Participant
Words per Utterance
HSB LSB HBC LBC
1 93.64 59.07 59.07 93.64
2 46.57 58.64 46.57 58.64
3 72.43 95.79 95.79 72.43
4 65.57 60.93 65.57 60.93
5 52.14 57.57 57.57 52.14
6 71.57 51.21 71.57 51.21
7 118.21 123.86 123.86 118.21
8 90.07 68.5 90.07 68.5
9 66.93 78.36 78.36 66.93
10 70.21 48.36 70.21 48.36
Mean 74.73 70.23 75.86 69.10
SD 21.00 23.44 22.46 21.72
Table 4.12 Participants‟ words per utterance.
Figure 4.5 Words per utterance mean analysis
The results from Table 4.12 show that the participants produce more words per
utterance in HSB interviews compared with the LSB condition. On the right hand-side table,
there are eight participants who perform better in their interview with HBC and only two
64.00
66.0068.00
70.00
72.00
74.00
76.00
78.00
High Low
Words per Utterance (Mean)
Back Channeling
Support Behaviour
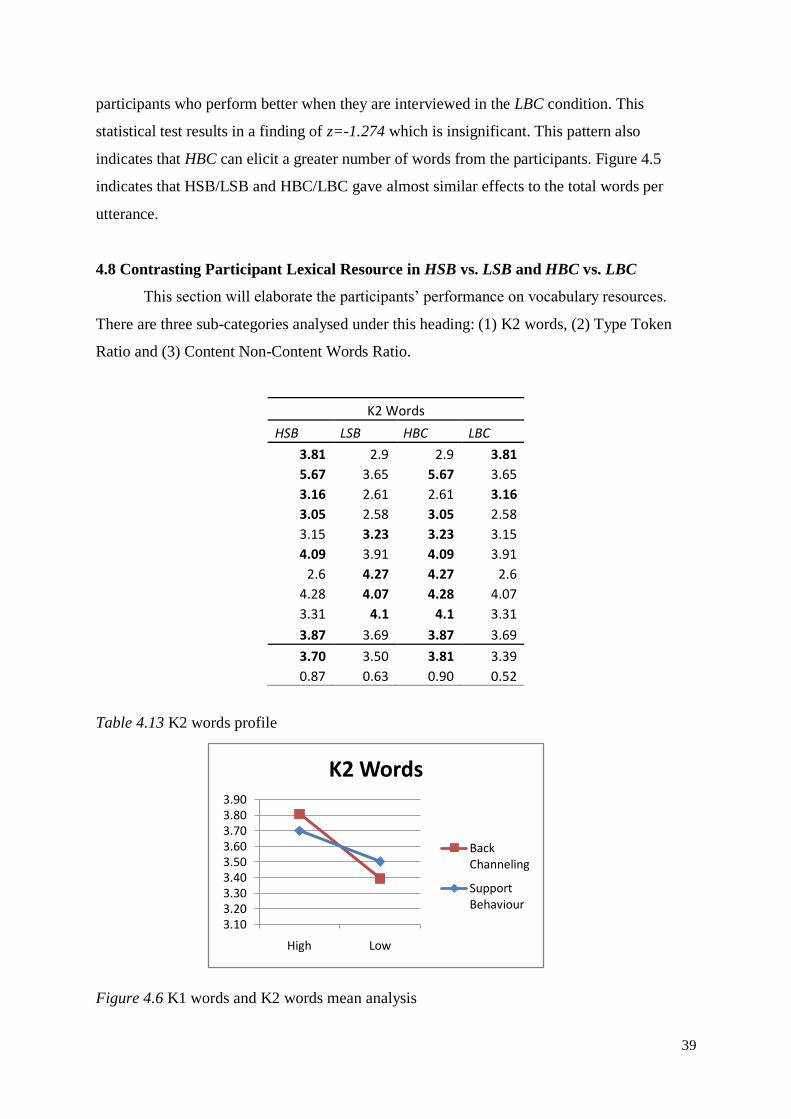
39
participants who perform better when they are interviewed in the LBC condition. This
statistical test results in a finding of z=-1.274 which is insignificant. This pattern also
indicates that HBC can elicit a greater number of words from the participants. Figure 4.5
indicates that HSB/LSB and HBC/LBC gave almost similar effects to the total words per
utterance.
4.8 Contrasting Participant Lexical Resource in HSB vs. LSB and HBC vs. LBC
This section will elaborate the participants‟ performance on vocabulary resources.
There are three sub-categories analysed under this heading: (1) K2 words, (2) Type Token
Ratio and (3) Content Non-Content Words Ratio.
K2 Words
HSB LSB HBC LBC
3.81 2.9 2.9 3.81
5.67 3.65 5.67 3.65
3.16 2.61 2.61 3.16
3.05 2.58 3.05 2.58
3.15 3.23 3.23 3.15
4.09 3.91 4.09 3.91
2.6 4.27 4.27 2.6
4.28 4.07 4.28 4.07
3.31 4.1 4.1 3.31
3.87 3.69 3.87 3.69
3.70 3.50 3.81 3.39
0.87 0.63 0.90 0.52
Table 4.13 K2 words profile
Figure 4.6 K1 words and K2 words mean analysis
3.103.203.303.403.503.603.703.803.90
High Low
K2 Words
Back Channeling
Support Behaviour
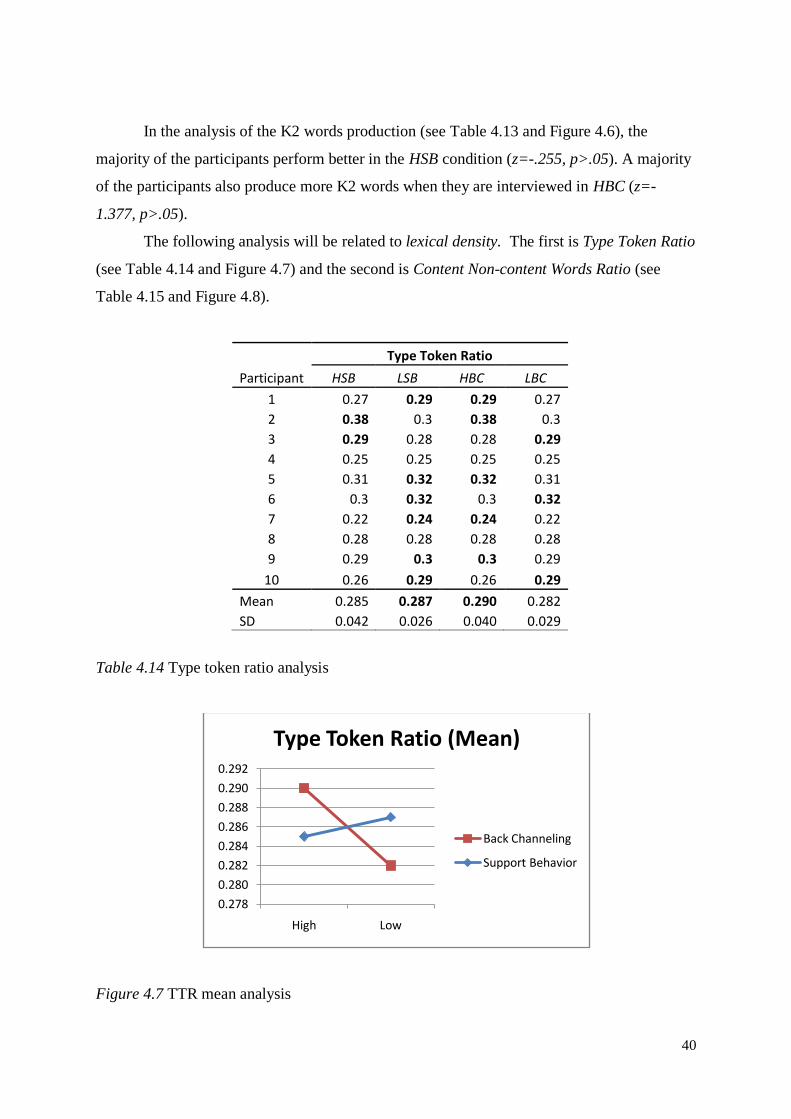
40
In the analysis of the K2 words production (see Table 4.13 and Figure 4.6), the
majority of the participants perform better in the HSB condition (z=-.255, p>.05). A majority
of the participants also produce more K2 words when they are interviewed in HBC (z=-
1.377, p>.05).
The following analysis will be related to lexical density. The first is Type Token Ratio
(see Table 4.14 and Figure 4.7) and the second is Content Non-content Words Ratio (see
Table 4.15 and Figure 4.8).
Participant
Type Token Ratio
HSB LSB HBC LBC
1 0.27 0.29 0.29 0.27
2 0.38 0.3 0.38 0.3
3 0.29 0.28 0.28 0.29
4 0.25 0.25 0.25 0.25
5 0.31 0.32 0.32 0.31
6 0.3 0.32 0.3 0.32
7 0.22 0.24 0.24 0.22
8 0.28 0.28 0.28 0.28
9 0.29 0.3 0.3 0.29
10 0.26 0.29 0.26 0.29
Mean 0.285 0.287 0.290 0.282
SD 0.042 0.026 0.040 0.029
Table 4.14 Type token ratio analysis
Figure 4.7 TTR mean analysis
0.278
0.280
0.282
0.284
0.286
0.288
0.290
0.292
High Low
Type Token Ratio (Mean)
Back Channeling
Support Behavior

41
In HSB condition, the TTR mean value is slightly lower than LSB. Meanwhile, TTR
value on HBC is higher than that of LBC. The Wilcoxon test on the LSB vs. HSB produces
z=-1.131 and the test on HBC vs. LBC produces z=-.566. Both values are smaller than 1.96
and they indicate that the differences are not significant.
Participant
Content Non-content Word Ratio
HSB LSB HBC LBC
1 0.41 0.43 0.43 0.41
2 0.5 0.47 0.5 0.47
3 0.45 0.45 0.45 0.45
4 0.38 0.37 0.38 0.37
5 0.41 0.42 0.42 0.41
6 0.43 0.45 0.43 0.45
7 0.4 0.47 0.47 0.4
8 0.44 0.46 0.44 0.46
9 0.39 0.43 0.43 0.39
10 0.44 0.41 0.44 0.41
Mean 0.425 0.436 0.439 0.422
SD 0.035 0.031 0.031 0.033
Table 4.15 Content non-content word ratio
Figure 4.8 Content non-content word ratio mean analysis
0.410
0.415
0.420
0.425
0.430
0.435
0.440
0.445
High Low
Content Non-content Word Ratio
Back Channeling
Support Behaviour
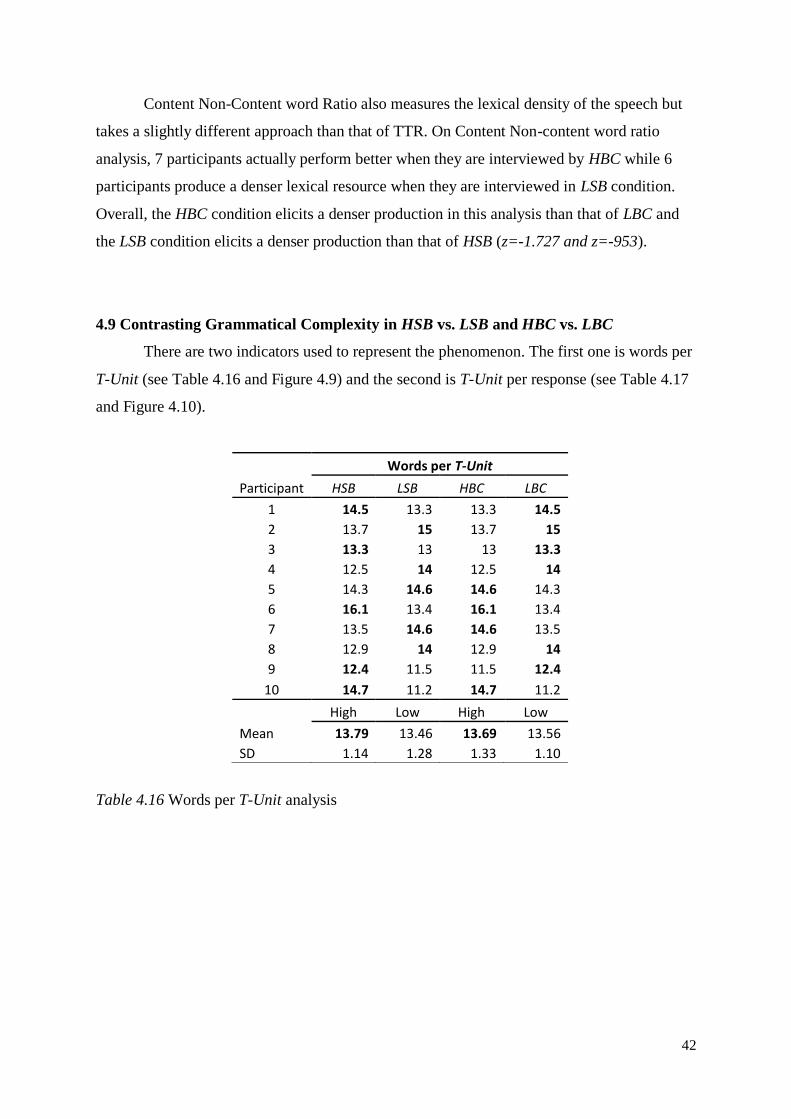
42
Content Non-Content word Ratio also measures the lexical density of the speech but
takes a slightly different approach than that of TTR. On Content Non-content word ratio
analysis, 7 participants actually perform better when they are interviewed by HBC while 6
participants produce a denser lexical resource when they are interviewed in LSB condition.
Overall, the HBC condition elicits a denser production in this analysis than that of LBC and
the LSB condition elicits a denser production than that of HSB (z=-1.727 and z=-953).
4.9 Contrasting Grammatical Complexity in HSB vs. LSB and HBC vs. LBC
There are two indicators used to represent the phenomenon. The first one is words per
T-Unit (see Table 4.16 and Figure 4.9) and the second is T-Unit per response (see Table 4.17
and Figure 4.10).
Participant
Words per T-Unit
HSB LSB HBC LBC
1 14.5 13.3 13.3 14.5
2 13.7 15 13.7 15
3 13.3 13 13 13.3
4 12.5 14 12.5 14
5 14.3 14.6 14.6 14.3
6 16.1 13.4 16.1 13.4
7 13.5 14.6 14.6 13.5
8 12.9 14 12.9 14
9 12.4 11.5 11.5 12.4
10 14.7 11.2 14.7 11.2
High Low High Low
Mean 13.79 13.46 13.69 13.56
SD 1.14 1.28 1.33 1.10
Table 4.16 Words per T-Unit analysis

43
Figure 4.9 Words per T-Unit mean analysis
A mean comparison shows that HSB elicits more words per T-Unit than that of LSB.
The same result can be seen in HBC vs. LBC. HBC elicits more words per T-Unit than that of
LBC. The z values calculated from both analyses are quite small (-.255 and -.204).
Participant
T-Unit per Response
HSB LSB HBC LBC
1 6.4 4.3 4.3 6.4
2 7.3 3.8 7.3 3.8
3 5.7 7.3 7.3 5.7
4 5.5 4.6 5.5 4.6
5 3.6 3.9 3.9 3.6
6 4.4 3.7 4.4 3.7
7 8.7 8.9 8.9 8.7
8 6.9 5.5 6.9 5.5
9 5.3 7.7 7.7 5.3
10 5 4.6 5 4.6
High Low High Low
Mean 5.88 5.43 6.12 5.19
SD 1.49 1.87 1.71 1.55
Table 4.17 T-Unit per response analysis
13.20
13.30
13.40
13.50
13.60
13.70
13.80
13.90
High Low
Words per T-Unit (Mean)
Back Channeling
Support Behaviour
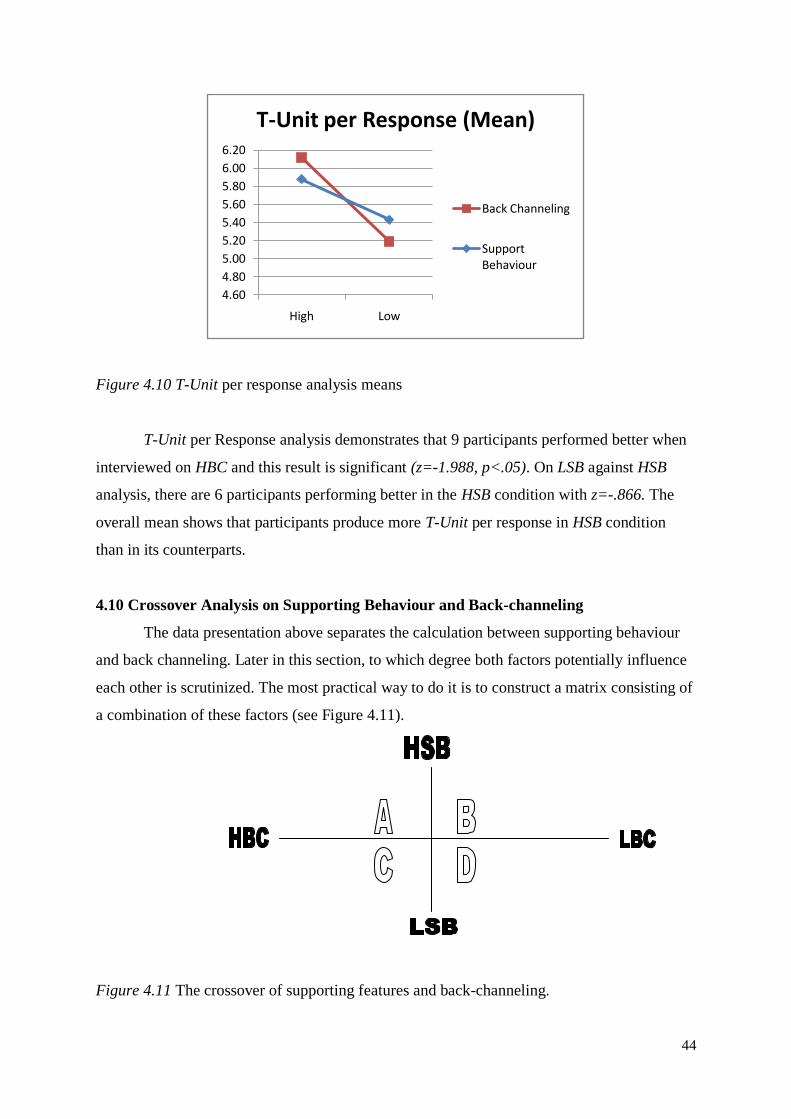
44
Figure 4.10 T-Unit per response analysis means
T-Unit per Response analysis demonstrates that 9 participants performed better when
interviewed on HBC and this result is significant (z=-1.988, p<.05). On LSB against HSB
analysis, there are 6 participants performing better in the HSB condition with z=-.866. The
overall mean shows that participants produce more T-Unit per response in HSB condition
than in its counterparts.
4.10 Crossover Analysis on Supporting Behaviour and Back-channeling
The data presentation above separates the calculation between supporting behaviour
and back channeling. Later in this section, to which degree both factors potentially influence
each other is scrutinized. The most practical way to do it is to construct a matrix consisting of
a combination of these factors (see Figure 4.11).
Figure 4.11 The crossover of supporting features and back-channeling.
4.60
4.80
5.00
5.20
5.40
5.60
5.80
6.00
6.20
High Low
T-Unit per Response (Mean)
Back Channeling
Support Behaviour

45
Quadrant A refers to the five interviews in which the participants received high
support treatment as well as high back channeling. Quadrant B refers to the five interviews in
which the participants received high support treatment but received a low back channeling.
Quadrant C refers to the five interviews where the participants received low support and high
back channeling. Quadrant D refers to both low support and low back channeling.
On the perception chart (Figure 4.12), it can be seen that HBC combined with HSB is
the most effective condition among of the four combinations and HSB combined with LBC is
the least desired condition. Although not as desirable as the HBC-HSB combination, the
HBC-LSB combination was also positively received by participants.
Figure 4.12 The effect of the crossover to the perception.
Some patterns of positive performance can be observed from this ideal combination
(HSB-HBC). The following patterns are the most frequent in the various performance charts.
3.83 3.75
3.25 3.29
HSB LSB
Perception
HBC LBC

46
Quadrant A >> Quadrant B
Quadrant D > Quadrant C
Figure 4.13 Crossover pattern type I
From this typical chart pattern (see Figure 4.13), it can be inferred that while the HBC
and HSB (Quadrant A) combination is the combination most favoured by participants, this
combination also tended to elicit a better performance from the participants. On the other
hand, the high supporting features provided without high-channeling (Quadrant B) would
typically elicit a worse performance than those in Quadrant A. However, the exposure to
back channeling without the application of supporting features (Quadrant C) can elicit
(slightly) worse performances than combinations involving low-support low-back-
channeling. These patterns do not always apply (for example the performance of the Speech
Rate chart on Figure 4.14).
0.29
0.29
0.28
0.29
HSB LSB
TTR
HBC LBC
4.19
3.423.213.58
HSB LSB
K2 Words
HBC LBC
13.98
13.40
13.6013.52
HSB LSB
Words per T-Unit
HBC LBC
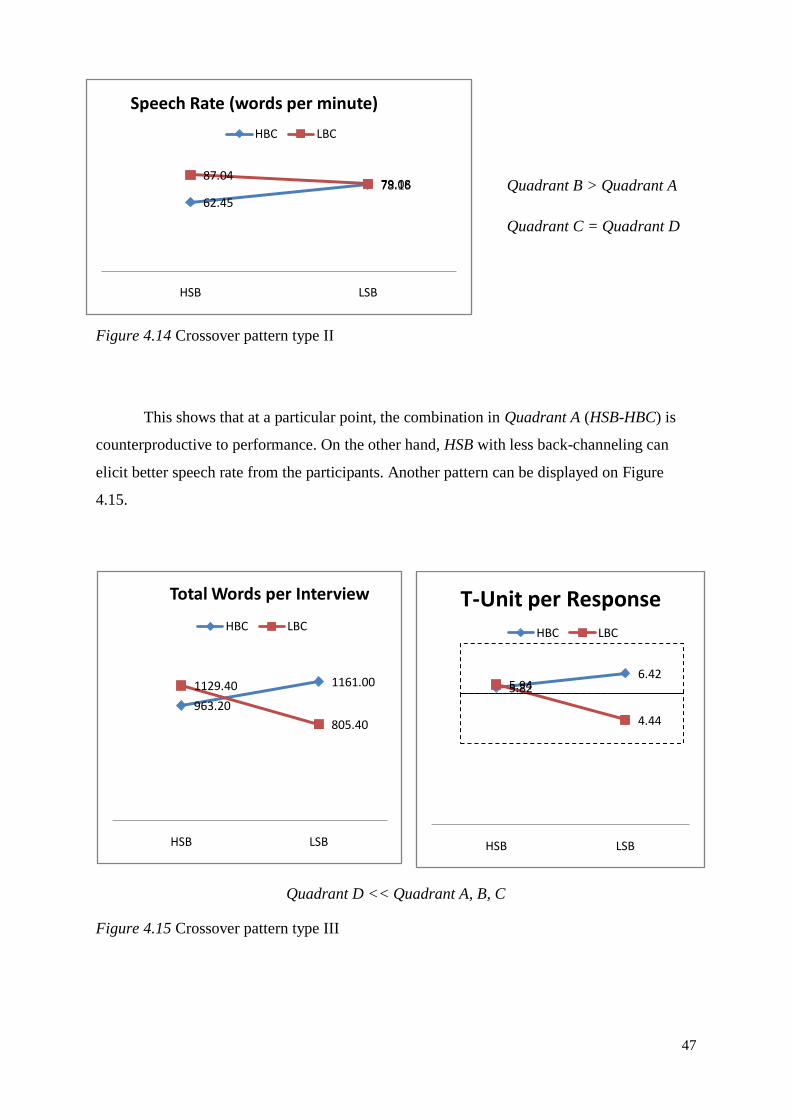
47
Quadrant B > Quadrant A
Quadrant C = Quadrant D
Figure 4.14 Crossover pattern type II
This shows that at a particular point, the combination in Quadrant A (HSB-HBC) is
counterproductive to performance. On the other hand, HSB with less back-channeling can
elicit better speech rate from the participants. Another pattern can be displayed on Figure
4.15.
Quadrant D << Quadrant A, B, C
Figure 4.15 Crossover pattern type III
5.826.42
5.94
4.44
HSB LSB
T-Unit per Response
HBC LBC
963.20
1161.001129.40
805.40
HSB LSB
Total Words per Interview
HBC LBC
62.45
78.1687.04
79.08
HSB LSB
Speech Rate (words per minute)
HBC LBC

48
In this pattern, the combination of LSB and LBC (Quadrant 4) elicits a worse
performance and the other three quadrants gather in the upper block of performance with the
combination of HBC and LSB (Quadrant C) becomes the best trigger of performance in this
case.
4.11 Word Production of Particular Supporting Behaviour.
The data analysis in the previous section relates to the overall form of support
provided by the interviewers. In fact, inside the HSB condition itself there are three specific
types of support being manipulated in the form of a prescribed script. Those types of support
are: (1) fronting, (2) suppliance and (3) rephrase. Up to this stage, the effect of each of these
has not been projected in any calculation or estimation. The following section focuses on the
potential effect of each type of support to the participant performance. The performance is
indicated by the total words elicited by each type of support. Table 4.18 is compiled to
demonstrate the number of words elicited with the presence of particular type of support
against the words elicited on the absence of the support.
Participant Fronting No Fronting Suppliance No Suppliance Rephrase No Rephrase
1 308 204 536 311 468 312
2 330 169 520 404 396 248
3 354 561 341 441 319 340
4 349 253 281 354 288 264
5 253 406 287 191 190 209
6 306 227 350 245 346 243
7 644 654 582 626 430 451
8 370 280 434 494 458 185
9 371 289 276 430 290 381
10 275 205 305 261 403 211
TOTAL 3560 3248 3912 3757 3588 2844
Table 4.18 Number of words elicited by certain types of support.

49
Figure 4.16 Word elicitation from different types of supporting features.
When fronting is provided, 7 participants produce more words compared with when
there is no fronting provided. The total words elicited when fronting is present is evidently
larger than when there is no fronting (fronting=3560 and no fronting=3248). Support in the
form of suppliance is problematic to interpret. There are 5 participants who perform better
when there is suppliance provided and 5 participants producing more words when there is no
suppliance. Nonetheless, the number of words elicited by suppliance is larger than no
suppliance. In the third type of support, rephrase, 6 participants perform better with this
particular support. The result of Wilcoxon test on rephrased questions shows that the z=-
1.683, not enough to gain the confidence required at p<.05. The number of words elicited
during overall rephrased questions (3588 words) is far superior to when there is no rephrase
available (2844 words). This contrast can be seen from Figure 4.16.
To give a different pespective of the potential effect of each support, the total words
elicited on each topic is calculated.
35603912
3588 3686.67
3248
3757
2844
3283
Fronting Suppliance Rephrase Overall Support
Word Elicitation of Different Types of Supporting Features
With Without
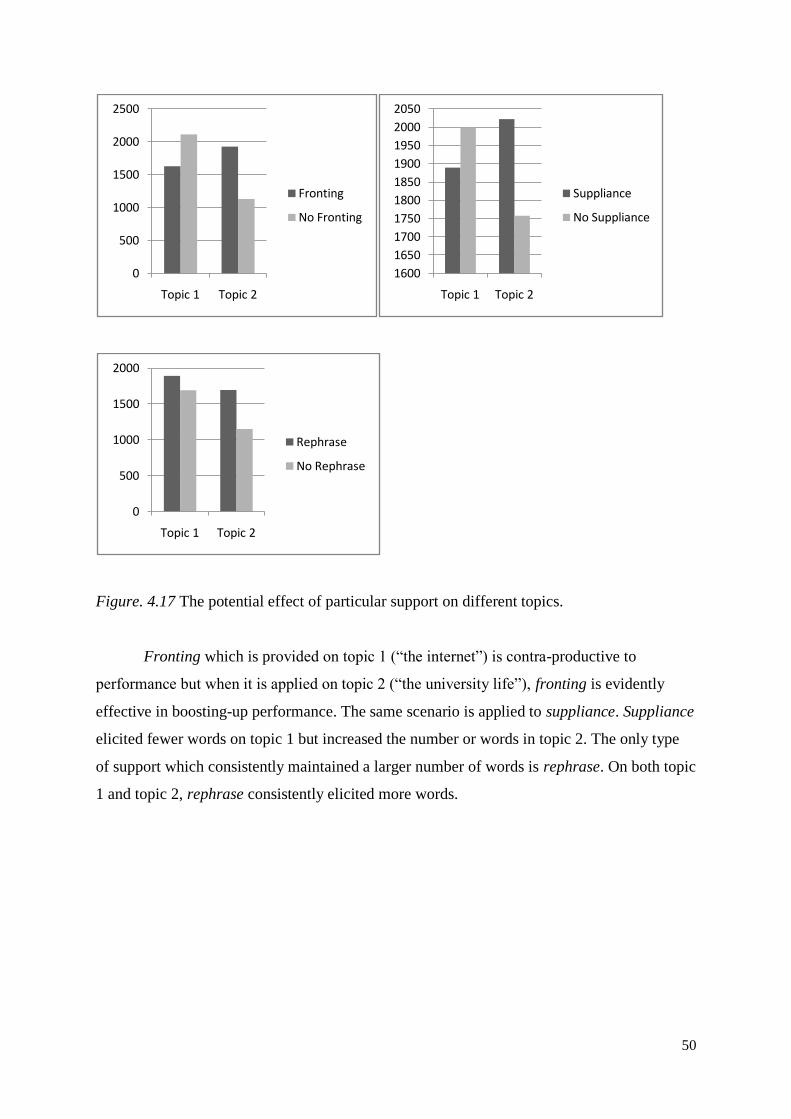
50
Figure. 4.17 The potential effect of particular support on different topics.
Fronting which is provided on topic 1 (“the internet”) is contra-productive to
performance but when it is applied on topic 2 (“the university life”), fronting is evidently
effective in boosting-up performance. The same scenario is applied to suppliance. Suppliance
elicited fewer words on topic 1 but increased the number or words in topic 2. The only type
of support which consistently maintained a larger number of words is rephrase. On both topic
1 and topic 2, rephrase consistently elicited more words.
0
500
1000
1500
2000
2500
Topic 1 Topic 2
Fronting
No Fronting
1600
1650
1700
1750
1800
1850
1900
1950
2000
2050
Topic 1 Topic 2
Suppliance
No Suppliance
0
500
1000
1500
2000
Topic 1 Topic 2
Rephrase
No Rephrase

51
CHAPTER 5
DISCUSSION
An Oral Proficiency Test is undeniably a unique interaction between (1) an examiner,
a rater or an interviewer and (2) a candidate, a participant or an interviewee. This interaction
is hardly a „casual‟ conversation (van Lier, 1989) and its main purpose is to elicit the
candidate‟s language (Johnson, 2001). As a test instrument, OPI is expected to be as reliable
as any other instruments. However, a number of studies show that there are number of factors
which made the variability of the raters has the potential to affect the test reliability especially
in ratings (Bachman et al., 1995; Douglas, 1994; Lumley and McNamara, 1997).
Accommodation or support provided by the interviewer is one of the possibilities of this type
of variability. Further studies claim that different accommodation or support given by
different interviewer is predicted to affect the performance of the participants of the test.
This study attempts to relate this issue by investigating the role of the participants‟
perception towards the interviewer‟s supporting behaviour in their language performance.
There are three main questions addressed at the beginning of this study:
(1) How does the interviewer support affect the test-taker perception?
(2) What are the effects of the interviewer support on the test-taker language linguistic
performance?
(3) What are the effects of the test-taker perception of interviewer support on their
linguistic performance?
To answer the aforementioned questions, a research outline is designed. Ten participants
are assigned to sit in two types of interview. Two interviewers are allotted to interview the
participants in a prescribed manner. Interviewers are obliged to follow the pre-designed
scripts which represent two modes of supporting behaviour (Low Supporting Behaviour
(LSB) and High Supporting Behaviour (LSB)). Apart from this the interviewers are free to
make any non-substantive feedback or back-channeling to keep the flow of the interaction.
During the process, one interviewer consistently provided more back-channeling features
than the other interviewer across the HSB and LSB conditions. This variable (Low Back
Channeling vs. High Back Channeling) is not taken for granted and it is taken into account in
the further analysis of this study. Perception is elicited from the post-questionnaires filled in
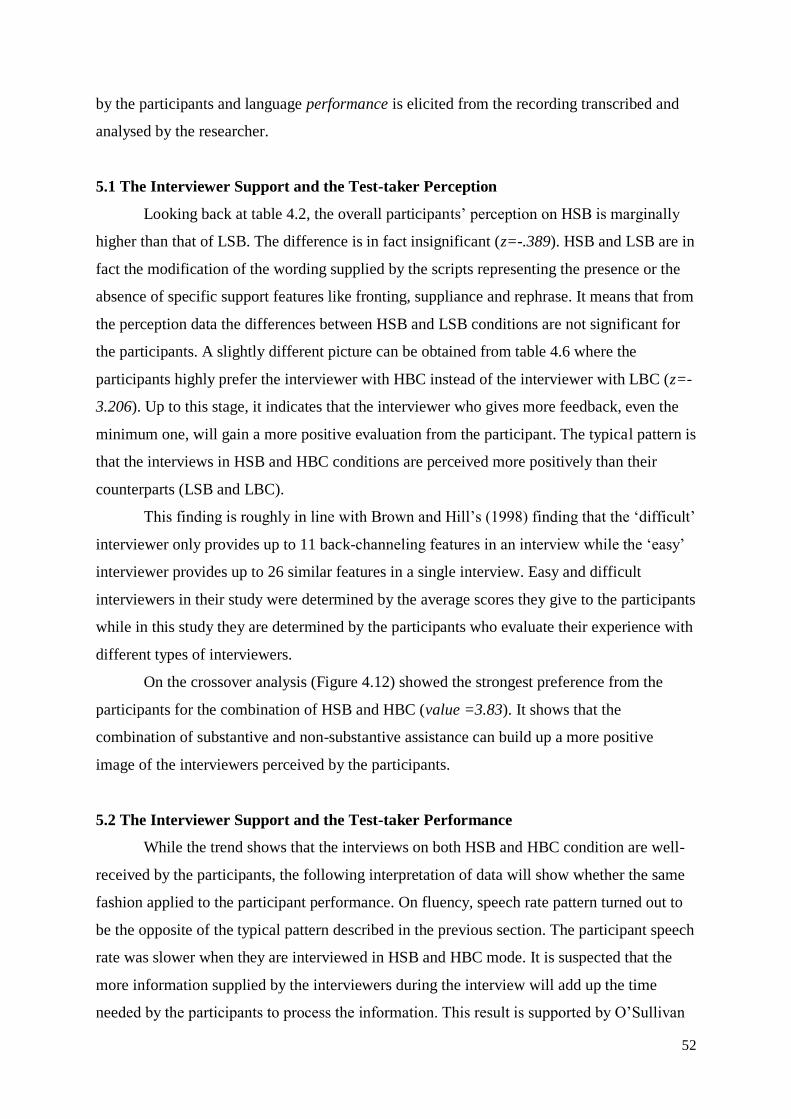
52
by the participants and language performance is elicited from the recording transcribed and
analysed by the researcher.
5.1 The Interviewer Support and the Test-taker Perception
Looking back at table 4.2, the overall participants‟ perception on HSB is marginally
higher than that of LSB. The difference is in fact insignificant (z=-.389). HSB and LSB are in
fact the modification of the wording supplied by the scripts representing the presence or the
absence of specific support features like fronting, suppliance and rephrase. It means that from
the perception data the differences between HSB and LSB conditions are not significant for
the participants. A slightly different picture can be obtained from table 4.6 where the
participants highly prefer the interviewer with HBC instead of the interviewer with LBC (z=-
3.206). Up to this stage, it indicates that the interviewer who gives more feedback, even the
minimum one, will gain a more positive evaluation from the participant. The typical pattern is
that the interviews in HSB and HBC conditions are perceived more positively than their
counterparts (LSB and LBC).
This finding is roughly in line with Brown and Hill‟s (1998) finding that the „difficult‟
interviewer only provides up to 11 back-channeling features in an interview while the „easy‟
interviewer provides up to 26 similar features in a single interview. Easy and difficult
interviewers in their study were determined by the average scores they give to the participants
while in this study they are determined by the participants who evaluate their experience with
different types of interviewers.
On the crossover analysis (Figure 4.12) showed the strongest preference from the
participants for the combination of HSB and HBC (value =3.83). It shows that the
combination of substantive and non-substantive assistance can build up a more positive
image of the interviewers perceived by the participants.
5.2 The Interviewer Support and the Test-taker Performance
While the trend shows that the interviews on both HSB and HBC condition are well-
received by the participants, the following interpretation of data will show whether the same
fashion applied to the participant performance. On fluency, speech rate pattern turned out to
be the opposite of the typical pattern described in the previous section. The participant speech
rate was slower when they are interviewed in HSB and HBC mode. It is suspected that the
more information supplied by the interviewers during the interview will add up the time
needed by the participants to process the information. This result is supported by O‟Sullivan
53
and Lu (2006) saying that “all other deviation types seem to be having a negative impact on
fluency.” On the total words per interview and total words per response, the pattern comes up
with similar pattern to the one described in the perception analysis. The participants produce
more words per interview when they are interviewed in the HSB condition than that of the
LSB condition. The same case is also applied to HBC vs. LBC.
On the lexical resource, the typical pattern also came out in the analysis of vocabulary
profile. The participants produce more sophisticated words (K2 words) in the HSB and/or
HBC interviews compared with when they are interviewed in the LSB and/or LBC
interviews. However, mixed patterns showed up in the lexical density analysis. High values
of TTR and Content Non-content Words Ratio were acquired in the HBC condition but not in
the HSB condition. This trend shows that additional information (substantive and non-
substantive materials) provided by the interviewers are recycled into more sophisticated
words but not always beneficial to the density of the utterances.
On the grammatical complexity, the typical pattern shows up in both words per T-
Unit analysis and T-Unit per response analysis. The participants on average produce more
complex utterances when they are interviewed in the HSB and HBC than their counterparts
(LSB and LBC).
The crossover analyses showed mixed results. The combination of HSB and HBC
elicit better performance in K2 words analysis, TTR analysis and words per T-Unit analysis.
The high amount of support provided by the interviewers has increased the quality of the
participant lexical dimension and grammatical accuracy partially. It might be caused by the
high amount of sample target language given to the participants or simply the participants
have more chances to develop their ideas based on the abundance of information given by the
interviewers. The same combination elicits the worst performance in the speech rate analysis.
The combination of LSB and LBC elicits the worst performances in the total words per
interview analysis and T-Unit per response analysis. The less information provided by the
interviewers apparently reduce the volume of the test-takers‟ utterances.
From the overall results, it shows that there is a tendency that different types of
supporting behaviour may lead to certain patterns of different performances elicited from the
participants. This finding strengthens Brown‟s (2003) proposition that the participants might
be benefited or disadvantaged from the amount and the types of supporting behaviour
provided by the interviewers. However, in her study she did look at in detail the participants
performance but she scrutinized the overall discourse created by the participant and different
types of interviewers.
54
Three particular features manipulated in this study can be scrutinized in the further
analysis. This analysis involves the number of words elicited from the participants using each
feature of support. The three types of supporting behaviour being discussed here are: (1)
fronting, (b) suppliance and (c) rephrase. Figure 4.16 displays the information that all three
supporting behaviours elicit more words from the participants when they are applied.
Rephrase gives the most significant improvement on words production. The average mean
analysis shows that 3686.67 words are elicited on the provision of three supporting modes
and only 3283 words on average are elicited in the absence of those supports.
On a different topic however, there are mixed results except that of rephrase. On the
provision of fronting, more words production can be reported on topic 2 “the university life”.
On topic 1 “the internet”, the absence of fronting elicited more words than that when the
support provided. On the suppliance, the opposite happened. Higher words production with
suppliance can only be seen on topic 1 but not on topic 2. Only rephrase shows consistent
effect on word production. On both topics, rephrase constantly improves the total words of
the participants. From three types of pre-scripted supporting behaviours rephrase has shown
consistent result across the interviewers and across the topics.
Apparently, O‟Sullivan and Lu (2006, p.18) found the same pattern regarding the
effect of rephrase (paraphrase). They mention “... suggesting that the paraphrasing was
successful-in that it always resulted in a long response (at least 30 seconds)”. Although some
parts of analysis supports O‟Sullivan and Lu‟s (2006) findings, this study rejects the general
statement made in their study. They claim that the impacts of the interviewers supporting
behaviour to the test-taker performance have been minimal. This difference is potentially
caused by different design where O‟Sullivan and Lu‟s data are examined from 30 seconds
before and after the interviewers‟ utterance while this study took the whole utterances
produced by the participants without being limited by the time set.
5.3 The Effect of the Test-taker Perception and Performance
Statistical correlation test like Pearson or ANOVA test cannot be done considering the
small number of samples acquired here. By examining the trends from the results presented
in the previous section, a deductive interpretation can be inferred. The participants perceived
high supporting behaviour was better than low supporting behaviour. The participants
typically also perform better in high supporting condition than in low supporting condition.
The participant perception of the high back channeling condition is higher than low back
channeling condition. The participants generally perform better in high back channeling
55
condition than in low back channeling condition. In summary, perception analysis has
reported higher values in high supporting condition and performance analysis also displayed
better production in high supporting condition. From these trends, there is a strong
probability that there is a potential relationship between the test taker perception and their
performance.

56
CHAPTER 6
CONCLUSIONS AND IMPLICATIONS
6.1 Conclusions
This study is intended to investigate the effects of the interviewer supporting
behaviour to the test-takers‟ perception and the test-takers performance. From the result
acquired during the analysis, in general the test-takers perceive rich accommodation
condition better than poor accommodation condition. In rich accommodation condition,
which is represented by high supporting behaviour and high back channeling, the atmosphere
provided by the interviewers make the participants feel more comfortable and assisted. This
result is based on the questionnaires completed by the participants at the end of the
interviews.
There are three main categories of performance examined here: fluency, lexical
resource and grammatical complexity. Under each category, there are some sub-categories
being analysed. On most of the sub-categories of performance analysed here, the participants
have shown better performance in the interviews with high supporting behaviour and high
back channeling. The most noticeable exception of this case was found in the speech rate
analysis with both high supporting behaviour and high back channeling consistently decrease
the participant speech rate. The total time of the interview was not fixed so that this result is
not contingent to the ratio of the examiner‟s and test-taker‟s talk. From three manipulated
supporting features, only rephrase has shown consistent results in improving the participant
performance while fronting and suppliance have shown partial improvement on the word
elicitation.
Perception analysis has reported higher values in high supporting condition and
performance analysis also displayed better production in high supporting condition. From the
patterns mentioned above, there is a strong probability that perception is correlated with
performance as long as other factors minimally affect this analysis.
6.2 Implications
The implications of these findings are twofold: (1) at theoretical level and (2) at
practical level. At the theoretical level, this research tends to be aligned with earlier studies.
The proposition asserted by Brown (2003) that the participants might benefit or be
disadvantaged by the interviewer support, is backed up by this study. Unfortunately, the
ratings given by the interviewers cannot be included in this study since the inter-rater
57
reliability was failed to achieve. The discourse analysis drawn from the Brown‟s study shows
that raters tend to give higher score when they provide more support. That finding is
supported by the test-taker perception analysis and the test-taker performance analysis in this
study. Having mentioned that, this study is not in line with the O‟Sullivan and Lu‟s (2006)
study because O‟Sullivan and Lu assert that the interviewer accommodation only causes a
very slight improvement in performance, if not none, on the test taker performance.
At the practical level, the findings from this study can be one of the references when
the test-makers or the test-providers design their protocol for the interviewers. As there is a
strong tendency shown in this study that the interviewer behaviour may affect the test-takers
performance, a set of guidelines should be set for the interviewers on how far they can
modify the interview scripts or frames. Whether the modification of the interview scripts are
incidental or affected by individual styles, the degree of freedom must be pre-determined by
the protocol. This precaution should be taken to assure that all participants can get, or can
manage to get, the same treatments across different interviewers. This action can be
reinforced with professional raters training.
6.3 Limitations
There are some limitations of this study. The first possible limitation is the fact that
some distorting factors might still remain intact in the data collection process. Two examples
of these factors are (1) topic effect and (2) practice effect. Topic effect refers to the
preference and the expertise of the participants to particular topics which may influence the
participant performance. Practice effect refers to a little time gap between the first interview
and the second interview which enables the test-taker to acclimatize in the first interview
which may make the second interview easier.
The second limitation is that the number of the participants is too small to represent a
larger scope of population. The mean analysis and non-parametric statistics applied in this
study must be interpreted with care and caution considering that normal distribution of these
repeated measures might not be ideal. However, some earlier studies also small samples but
still their findings were academically significant.
Due to the human and technological resources, some performance sub-categories
were not analysed (e.g. ratio of pauses and utterances, grammatical accuracy, etc). These sub-
categories which were dropped from this study might give different picture from the results
currently acquired from the analysis.
58
6.4 Suggestions for Further Research
Further research can assign larger number of test-takers and interviewers to improve
the scope of investigation and the level of confidence. Discourse analysis on the interaction
between the interviewers and the test-takers might also be included in the analysis to give a
better understanding of how different types of interaction can result in different performance.
The result of the performance analysis can be compared with the ratings given by the
interviewers to highlight the validity of the score. Test-taker perception analysis can be
compared side-by-side with the interviewer perception. By combining different types of data,
better triangulation can be acquired to ensure larger coverage of the study and better
credibility.

59
References
Bachman, L. F., Lynch, B. K., & Mason, M. (1995). Investigating variability in tasks and
rater judgements in a performance test of foreign language speaking. Language
Testing, 12(2), 238-257.
Brown, A. (1995). The effect of rater variables in the development of an occupation-specific
language performance test. Language Testing, 12(1), 1-15.
Brown, A. (2003). Interviewer variation and the co-construction of speaking proficiency.
Language Testing, 20(1), 1-25.
Brown, A. (2006). Candidate discourse in the revised IELTS Speaking Test. IELTS Research
Report, 6. The British Council/IELTS Australia.
Brown, A., & Hill, K. (1998). Interviewer style and candidate performance in the IELTS oral
interview. IELTS research reports, 1, 173-191.
Buck, K., Byrnes, H., & Thompson, I. (1989). The ACTFL Oral Proficiency Interview Tester
Training Manual. ACTFL
Canale, M., & Swain, M. (1980). Approaches to communicative competence. Singapore:
Seameo Regional Language Centre.
Cheng, L., Watanabe, Y., & Curtis, A. (2004). Washback in language testing: Research
contexts and methods. New York: Lawrence Erlbaum Associates.
Cobb, T. (2002). The Web Vocabulary Profiler. Retrieved September 2, 2009, from
http://www.lextutor.ca/vp/eng/
Daller, H., Milton, J., & Treffers-Daller, J. (2007). Modelling and assessing vocabulary
knowledge. Cambridge: Cambridge University Press.
DeCoster, J. (2005). Scale Construction Notes. Retrieved September 25, 2009, from
http://www.stat-help.com/notes.html
Douglas, D. (1994). Quantity and quality in speaking test performance. Language Testing,
11(2), 125-144.
Fayer, J., & Krasinski, E. (1987). Native and nonnative judgments of intelligibility and
irritation. Language Learning, 37(3), 313–326.
Field, A. (2009). Discovering statistics using SPSS. London: Sage.
60
Hunt, K. (1970). Syntactic maturity in schoolchildren and adults. Monographs of the society
for research in child development 53, 1
Hadden, B. (1991). Teacher and nonteacher perceptions of second-language communication.
Language Learning, 41(1), 1–24.
IELTS. (2001). IELTS Speaking Band Descriptor. Retrieved September 25, 2009, from
http://www.ielts.org/PDF/UOBDs_SpeakingFinal.pdf
Johnson, M. (2001). The Art of Non-conversation. New Haven: Yale University Press.
Koike, D. (1998). What happens when there's no one to talk to? Spanish foreign language
discourse in simulated oral proficiency interviews. In R. Young, & A. He (eds.).
Talking and testing: Discourse approaches to the assessment of oral proficiency (pp.
69-98). Philadelphia: John Benjamins.
Krashen, S. (1985). The input hypothesis: Issues and implications. London: Longman.
Lazaraton, A. (1996a). A qualitative approach to monitoring examiner conduct in the
Cambridge assessment of spoken English (CASE). In M. Milanovic and N. Saville
(eds.), Performance testing, cognition and assessment: Selected papers from the 15th
Language Testing Research Colloquium (pp. 18–33). Cambridge: Cambridge
University Press.
Lazaraton, A. (1996b). Interlocutor support in oral proficiency interviews: the case of CASE.
Language Testing, 13(2), 151.
Lazaraton, A. (2002). A qualitative approach to the validation of oral language tests.
Cambridge: Cambridge University Press.
Lorenzo-Dus, N., & Meara, P. (2005). Examiner support strategies and test-taker vocabulary.
International Review of Applied Linguistics in Language Teaching, 43(3), 239-258.
Lorenzo-Dus, N. (2007). The best of both worlds? Combined methodological approaches to
the assessment of vocabulary in oral proficiency interviews. In H. Daller, J. Milton, &
J. Treffers-Daller (eds.). Modelling and assessing vocabulary knowledge. Cambridge:
Cambridge University Press.
Lumley, T., & McNamara, T. F. (1995). Rater characteristics and rater bias: Implications for
training. Language Testing, 12(1), 54-71.
Luoma, S. (2004). Assessing speaking. Cambridge: Cambridge University Press.

61
McDowell, C., & Merrylees, B. (1998) Survey of receiving institutions‟ use and attitude to
IELTS. IELTS Research Reports, Vol. 1, 116-139.
McNamara, T. F. (2000). Language testing. Oxford: Oxford University Press.
Messick, S. (1996). Validity and washback in language testing. Language Testing, 13(3),
241.
Mok, M., Parr, N, Lee, T. & Wylie, E. (1998). A Comparative Study of IELTS and ACCESS
Test Results. In Wood, S. International English Language Testing System Research
Reports. Sydney: ELICOS Association.
O'Loughlin, K. (1997). The comparability of direct and semi-direct speaking tests: A case
study. Unpublished PhD Thesis, The University of Melbourne.
O'Loughlin, K. (2002). The impact of gender in oral proficiency testing. Language Testing,
19(2), 169-192.
O'Sullivan, B., & Lu, Y. (2006). The impact on candidate language of examiner deviation
from a set interlocutor frame in the IELTS Speaking Test. IELTS Research Report, 6.
The British Council/IELTS Australia.
Read, J., & Hayes, B. (2003). The impact of IELTS on preparation for academic study in
New Zealand. IELTS Research Reports, 4, 153–205.
Read, J., & Nation, P. (2006). An investigation of the lexical dimension of the IELTS
speaking test. IELTS Research Report, 6. The British Council/IELTS Australia.
Ross, S. (1992). Accommodative questions in oral proficiency interviews. Language Testing,
9(2), 173.
Ross, S., & Berwick, R. (1992). The discourse of accommodation in oral proficiency
interviews. Studies in Second Language Acquisition, 14(2), 159-176.
Shohamy, E. (1983). The stability of oral proficiency assessment on the oral interview testing
procedures. Language Learning, 33(4), 527-540.
Shohamy, E., Gordon, C., & Kraemer, R. (1992). The effect of raters' background and
training on the reliability of direct writing tests. The Modern Language Journal,
76(1), 27-33.
Ten Have, P. (2007). Doing conversation analysis. London: Sage.

62
Van Lier, L. (1989). Reeling, writhing, drawling, stretching, and fainting in coils: Oral
proficiency interviews as conversation. TESOl Quarterly 23(3), 489-508.
Weir, C. (1992). Understanding and developing language tests. New York: Prentice-Hall.
Weir, C. (2005). Language testing and validation: An evidence-based approach. New York:
Palgrave Macmillan.
Young, R. (1995). Conversational styles in language proficiency interviews. Language
Learning, 45(1), 3-42.

63
APPENDIX A: INTERVIEWER SCRIPTS
THE INTERNET (HSB)
1. In the globalisation era, the internet has become an unavoidable part of our society.
How important is the internet to modern society?
2. It seems that the internet is very important to everybody. How about yourself? How
do you use the internet as a part of modern society?
3. While you are studying in Australia, how does the internet help you in particular with
your studies?
4. Nowadays, children and teenagers have relatively easy access to the internet. In your
opinion, what are some of the negative effects of the internet on children and
teenagers?
5. Dealing with the disadvantages of the internet on children and teenagers, how would
you suggest these negative effects be overcome?
6. Can you tell me a bit about cyber crime? For example, hackers, carders,
impersonators and so on.
7. Why do more and more people like online shopping these days? Is it because it is
convenient, secure, practical or something else?
8. How do you or people in general expand personal networks and friendships over the
internet? By email, facebook, chatting...
9. What is your opinion about downloading illegal materials from the internet? Music,
video, software, pictures
10. What is an appropriate penalty for people who distribute illegal material?
Imprisonment, fines, the death penalty?!
11. Why do you think mobile phone companies are investing in providing internet access
in mobile phones? What do you think about the internet facility provided in mobile
phones?
12. What do you think about people who fail to socialize in real life because they spend
too much of their time in front of their computers? How do computers prevent some people from making friends?
13. How would you explain the phenomenon that people do not need to attend classes but
are able to receive a formal education over the internet? What do you think about
distance education/learning using the internet?

64
14. How do you see the internet in the future? Perhaps 10 years from now? Will the
internet play a different role in people's lives than it does now?
THE INTERNET (LSB)
1. How important is the internet to modern society?
2. How do you use the internet as a part of modern society?
3. How does the internet help you in particular with your studies?
4. What are some of the negative effects of the internet on children and teenagers?
5. How would you suggest these negative effects be overcome?
6. Can you tell me a bit about cyber crime?
7. Why do more and more people like online shopping these days?
8. How do you or people in general expand personal networks and friendships over the
internet?
9. What is your opinion about downloading illegal materials from the internet?
10. What is an appropriate penalty for people who distribute illegal material?
11. Why do you think mobile phone companies are investing in providing internet access
in mobile phones?
12. What do you think about people who fail to socialize in real life because they spend
too much of their time in front of their computers?
13. How would you explain the phenomenon that people do not need to attend classes but
are able to receive a formal education over the internet?
14. How do you see the internet in the future?
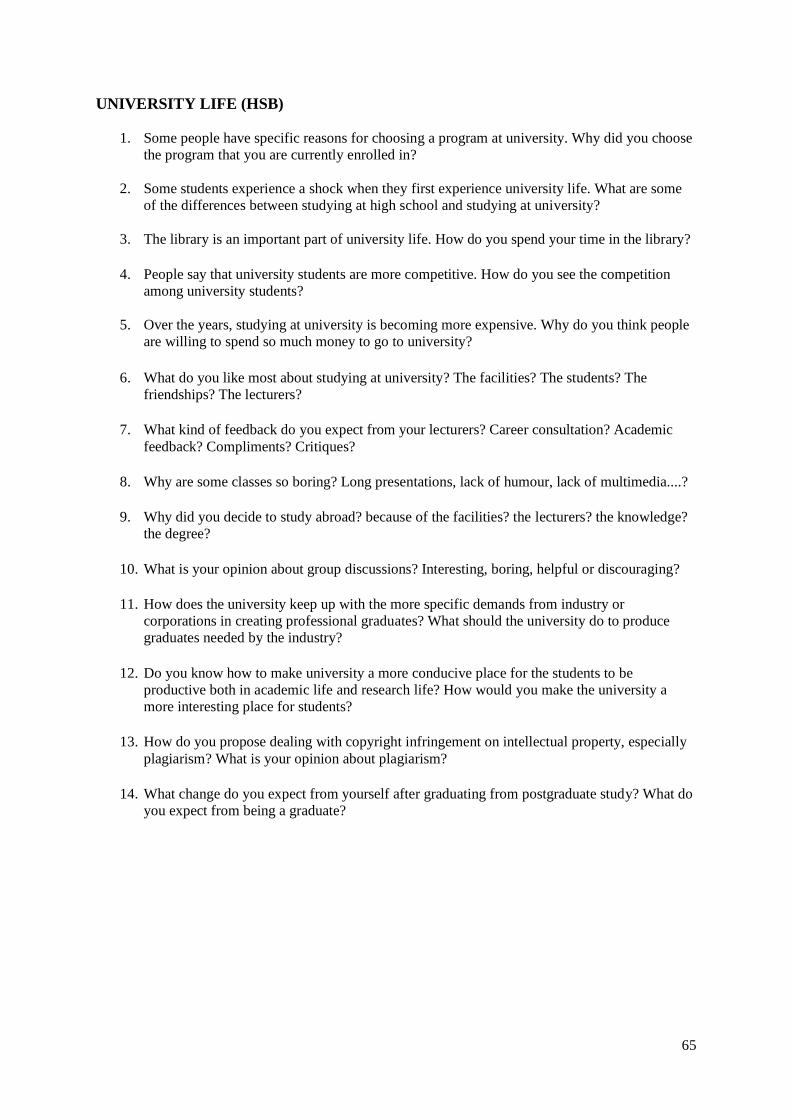
65
UNIVERSITY LIFE (HSB)
1. Some people have specific reasons for choosing a program at university. Why did you choose
the program that you are currently enrolled in?
2. Some students experience a shock when they first experience university life. What are some
of the differences between studying at high school and studying at university?
3. The library is an important part of university life. How do you spend your time in the library?
4. People say that university students are more competitive. How do you see the competition
among university students?
5. Over the years, studying at university is becoming more expensive. Why do you think people
are willing to spend so much money to go to university?
6. What do you like most about studying at university? The facilities? The students? The
friendships? The lecturers?
7. What kind of feedback do you expect from your lecturers? Career consultation? Academic
feedback? Compliments? Critiques?
8. Why are some classes so boring? Long presentations, lack of humour, lack of multimedia....?
9. Why did you decide to study abroad? because of the facilities? the lecturers? the knowledge?
the degree?
10. What is your opinion about group discussions? Interesting, boring, helpful or discouraging?
11. How does the university keep up with the more specific demands from industry or
corporations in creating professional graduates? What should the university do to produce
graduates needed by the industry?
12. Do you know how to make university a more conducive place for the students to be
productive both in academic life and research life? How would you make the university a
more interesting place for students?
13. How do you propose dealing with copyright infringement on intellectual property, especially
plagiarism? What is your opinion about plagiarism?
14. What change do you expect from yourself after graduating from postgraduate study? What do
you expect from being a graduate?
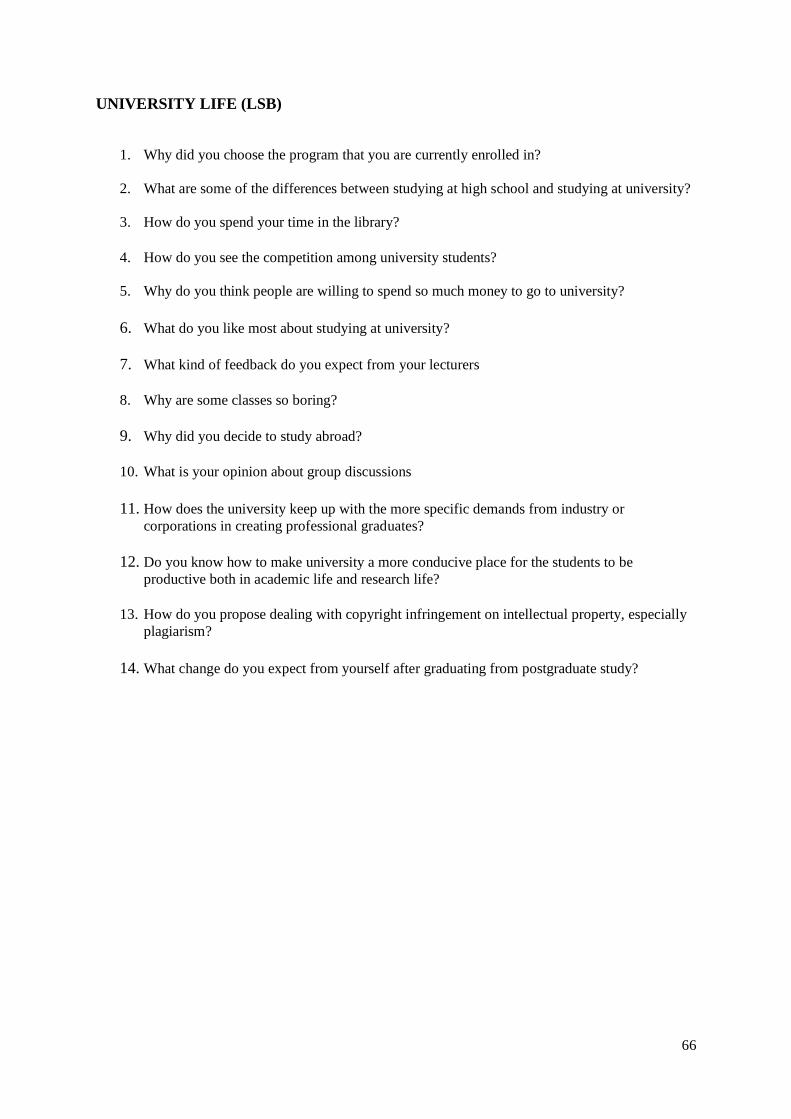
66
UNIVERSITY LIFE (LSB)
1. Why did you choose the program that you are currently enrolled in?
2. What are some of the differences between studying at high school and studying at university?
3. How do you spend your time in the library?
4. How do you see the competition among university students?
5. Why do you think people are willing to spend so much money to go to university?
6. What do you like most about studying at university?
7. What kind of feedback do you expect from your lecturers
8. Why are some classes so boring?
9. Why did you decide to study abroad?
10. What is your opinion about group discussions
11. How does the university keep up with the more specific demands from industry or
corporations in creating professional graduates?
12. Do you know how to make university a more conducive place for the students to be
productive both in academic life and research life?
13. How do you propose dealing with copyright infringement on intellectual property, especially
plagiarism?
14. What change do you expect from yourself after graduating from postgraduate study?
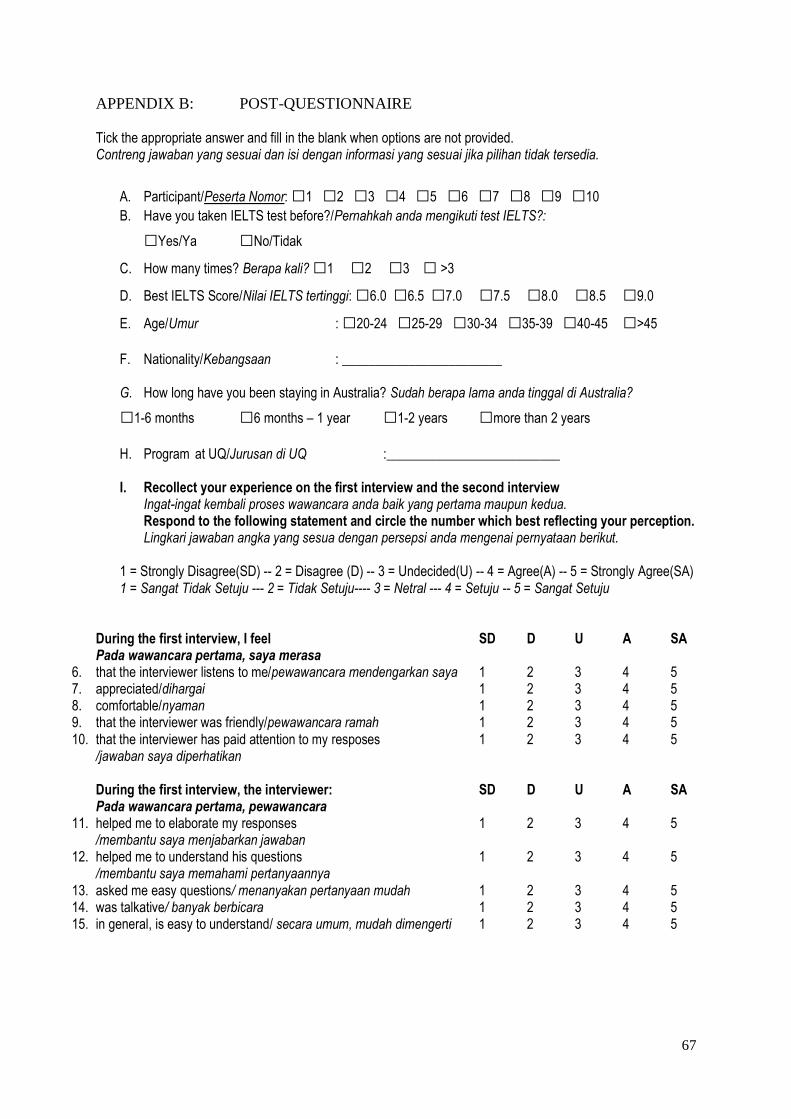
67
APPENDIX B: POST-QUESTIONNAIRE Tick the appropriate answer and fill in the blank when options are not provided. Contreng jawaban yang sesuai dan isi dengan informasi yang sesuai jika pilihan tidak tersedia.
A. Participant/Peserta Nomor: □1 □2 □3 □4 □5 □6 □7 □8 □9 □10
B. Have you taken IELTS test before?/Pernahkah anda mengikuti test IELTS?:
□Yes/Ya □No/Tidak
C. How many times? Berapa kali? □1 □2 □3 □ >3
D. Best IELTS Score/Nilai IELTS tertinggi: □6.0 □6.5 □7.0 □7.5 □8.0 □8.5 □9.0
E. Age/Umur : □20-24 □25-29 □30-34 □35-39 □40-45 □>45
F. Nationality/Kebangsaan : ________________________
G. How long have you been staying in Australia? Sudah berapa lama anda tinggal di Australia?
□1-6 months □6 months – 1 year □1-2 years □more than 2 years
H. Program at UQ/Jurusan di UQ :__________________________
I. Recollect your experience on the first interview and the second interview
Ingat-ingat kembali proses wawancara anda baik yang pertama maupun kedua. Respond to the following statement and circle the number which best reflecting your perception. Lingkari jawaban angka yang sesua dengan persepsi anda mengenai pernyataan berikut.
1 = Strongly Disagree(SD) -- 2 = Disagree (D) -- 3 = Undecided(U) -- 4 = Agree(A) -- 5 = Strongly Agree(SA) 1 = Sangat Tidak Setuju --- 2 = Tidak Setuju---- 3 = Netral --- 4 = Setuju -- 5 = Sangat Setuju
During the first interview, I feel SD D U A SA Pada wawancara pertama, saya merasa
6. that the interviewer listens to me/pewawancara mendengarkan saya 1 2 3 4 5 7. appreciated/dihargai 1 2 3 4 5 8. comfortable/nyaman 1 2 3 4 5 9. that the interviewer was friendly/pewawancara ramah 1 2 3 4 5 10. that the interviewer has paid attention to my resposes 1 2 3 4 5
/jawaban saya diperhatikan During the first interview, the interviewer: SD D U A SA Pada wawancara pertama, pewawancara
11. helped me to elaborate my responses 1 2 3 4 5 /membantu saya menjabarkan jawaban
12. helped me to understand his questions 1 2 3 4 5 /membantu saya memahami pertanyaannya
13. asked me easy questions/ menanyakan pertanyaan mudah 1 2 3 4 5 14. was talkative/ banyak berbicara 1 2 3 4 5 15. in general, is easy to understand/ secara umum, mudah dimengerti 1 2 3 4 5
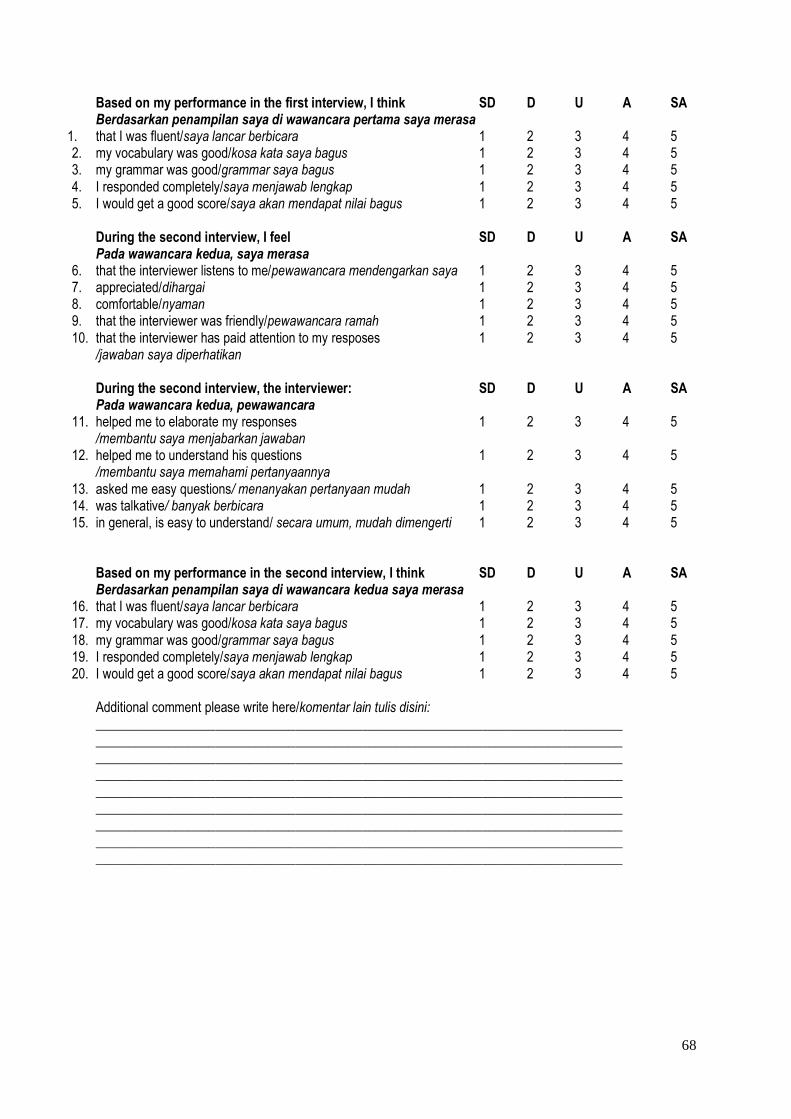
68
Based on my performance in the first interview, I think SD D U A SA Berdasarkan penampilan saya di wawancara pertama saya merasa
1. that I was fluent/saya lancar berbicara 1 2 3 4 5 2. my vocabulary was good/kosa kata saya bagus 1 2 3 4 5 3. my grammar was good/grammar saya bagus 1 2 3 4 5 4. I responded completely/saya menjawab lengkap 1 2 3 4 5 5. I would get a good score/saya akan mendapat nilai bagus 1 2 3 4 5
During the second interview, I feel SD D U A SA Pada wawancara kedua, saya merasa
6. that the interviewer listens to me/pewawancara mendengarkan saya 1 2 3 4 5 7. appreciated/dihargai 1 2 3 4 5 8. comfortable/nyaman 1 2 3 4 5 9. that the interviewer was friendly/pewawancara ramah 1 2 3 4 5 10. that the interviewer has paid attention to my resposes 1 2 3 4 5
/jawaban saya diperhatikan During the second interview, the interviewer: SD D U A SA Pada wawancara kedua, pewawancara
11. helped me to elaborate my responses 1 2 3 4 5 /membantu saya menjabarkan jawaban
12. helped me to understand his questions 1 2 3 4 5 /membantu saya memahami pertanyaannya
13. asked me easy questions/ menanyakan pertanyaan mudah 1 2 3 4 5 14. was talkative/ banyak berbicara 1 2 3 4 5 15. in general, is easy to understand/ secara umum, mudah dimengerti 1 2 3 4 5
Based on my performance in the second interview, I think SD D U A SA Berdasarkan penampilan saya di wawancara kedua saya merasa
16. that I was fluent/saya lancar berbicara 1 2 3 4 5 17. my vocabulary was good/kosa kata saya bagus 1 2 3 4 5 18. my grammar was good/grammar saya bagus 1 2 3 4 5 19. I responded completely/saya menjawab lengkap 1 2 3 4 5 20. I would get a good score/saya akan mendapat nilai bagus 1 2 3 4 5
Additional comment please write here/komentar lain tulis disini: _______________________________________________________________________________ _______________________________________________________________________________ _______________________________________________________________________________ _______________________________________________________________________________ _______________________________________________________________________________ _______________________________________________________________________________ _______________________________________________________________________________ _______________________________________________________________________________ _______________________________________________________________________________
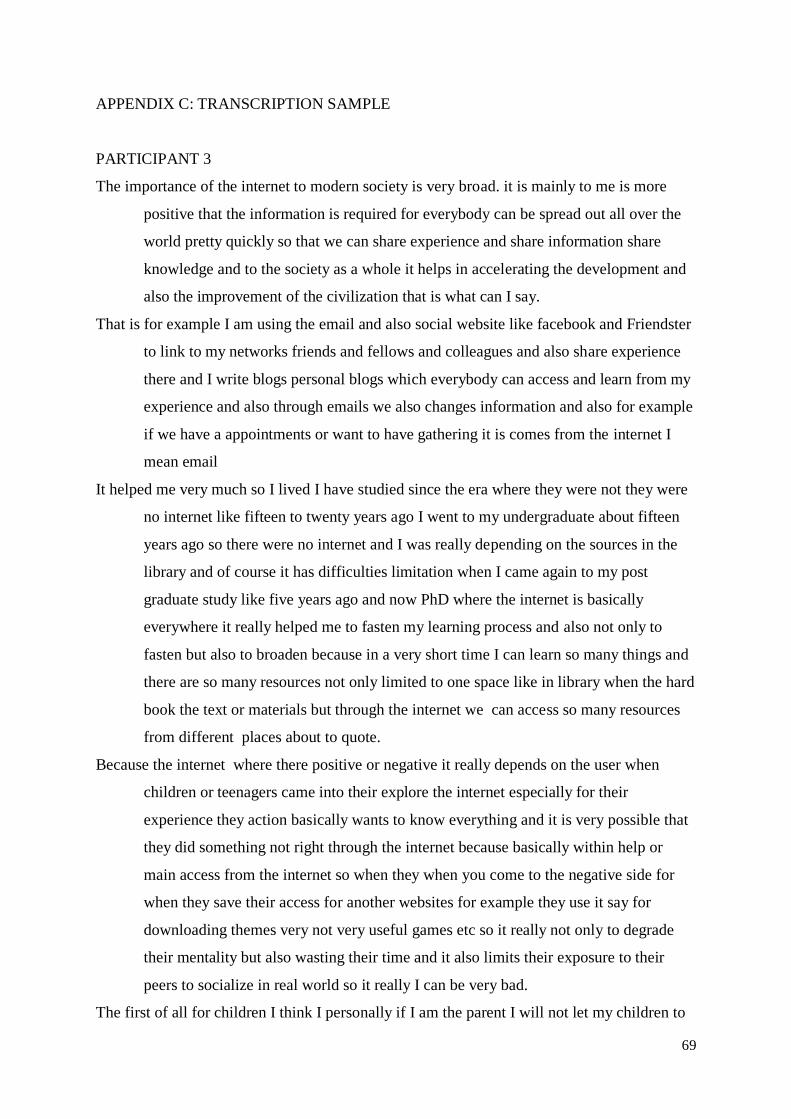
69
APPENDIX C: TRANSCRIPTION SAMPLE
PARTICIPANT 3
The importance of the internet to modern society is very broad. it is mainly to me is more
positive that the information is required for everybody can be spread out all over the
world pretty quickly so that we can share experience and share information share
knowledge and to the society as a whole it helps in accelerating the development and
also the improvement of the civilization that is what can I say.
That is for example I am using the email and also social website like facebook and Friendster
to link to my networks friends and fellows and colleagues and also share experience
there and I write blogs personal blogs which everybody can access and learn from my
experience and also through emails we also changes information and also for example
if we have a appointments or want to have gathering it is comes from the internet I
mean email
It helped me very much so I lived I have studied since the era where they were not they were
no internet like fifteen to twenty years ago I went to my undergraduate about fifteen
years ago so there were no internet and I was really depending on the sources in the
library and of course it has difficulties limitation when I came again to my post
graduate study like five years ago and now PhD where the internet is basically
everywhere it really helped me to fasten my learning process and also not only to
fasten but also to broaden because in a very short time I can learn so many things and
there are so many resources not only limited to one space like in library when the hard
book the text or materials but through the internet we can access so many resources
from different places about to quote.
Because the internet where there positive or negative it really depends on the user when
children or teenagers came into their explore the internet especially for their
experience they action basically wants to know everything and it is very possible that
they did something not right through the internet because basically within help or
main access from the internet so when they when you come to the negative side for
when they save their access for another websites for example they use it say for
downloading themes very not very useful games etc so it really not only to degrade
their mentality but also wasting their time and it also limits their exposure to their
peers to socialize in real world so it really I can be very bad.
The first of all for children I think I personally if I am the parent I will not let my children to
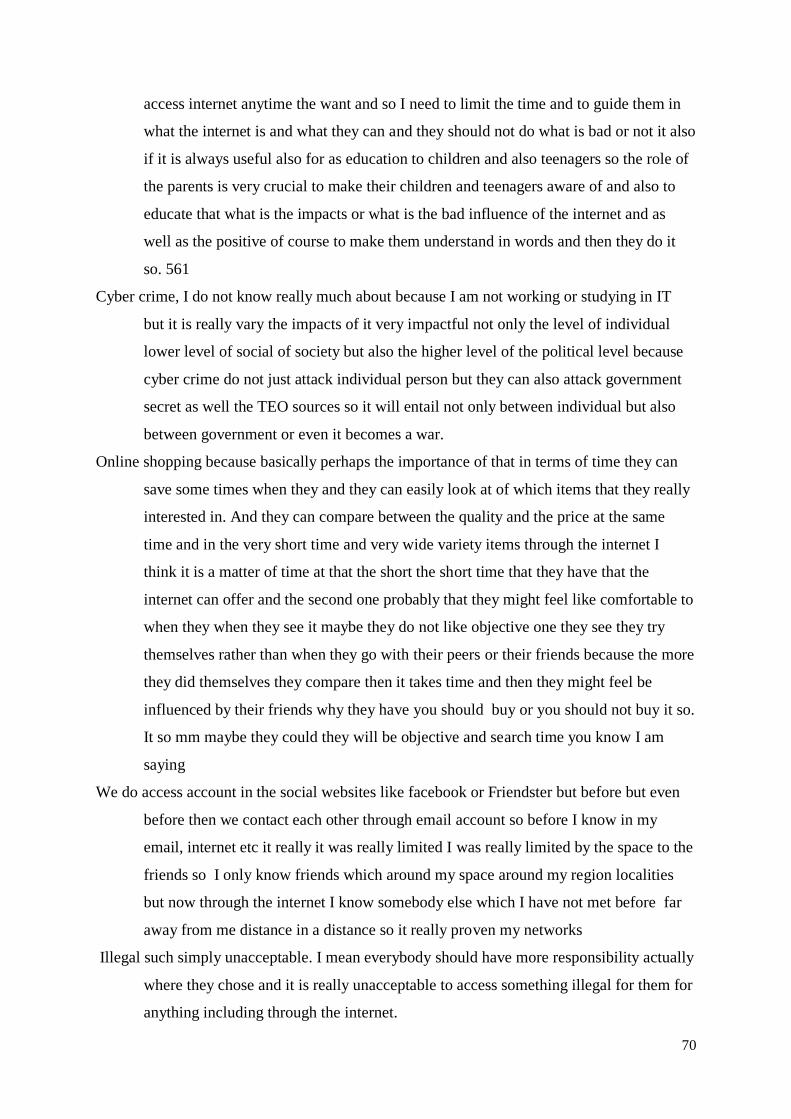
70
access internet anytime the want and so I need to limit the time and to guide them in
what the internet is and what they can and they should not do what is bad or not it also
if it is always useful also for as education to children and also teenagers so the role of
the parents is very crucial to make their children and teenagers aware of and also to
educate that what is the impacts or what is the bad influence of the internet and as
well as the positive of course to make them understand in words and then they do it
so. 561
Cyber crime, I do not know really much about because I am not working or studying in IT
but it is really vary the impacts of it very impactful not only the level of individual
lower level of social of society but also the higher level of the political level because
cyber crime do not just attack individual person but they can also attack government
secret as well the TEO sources so it will entail not only between individual but also
between government or even it becomes a war.
Online shopping because basically perhaps the importance of that in terms of time they can
save some times when they and they can easily look at of which items that they really
interested in. And they can compare between the quality and the price at the same
time and in the very short time and very wide variety items through the internet I
think it is a matter of time at that the short the short time that they have that the
internet can offer and the second one probably that they might feel like comfortable to
when they when they see it maybe they do not like objective one they see they try
themselves rather than when they go with their peers or their friends because the more
they did themselves they compare then it takes time and then they might feel be
influenced by their friends why they have you should buy or you should not buy it so.
It so mm maybe they could they will be objective and search time you know I am
saying
We do access account in the social websites like facebook or Friendster but before but even
before then we contact each other through email account so before I know in my
email, internet etc it really it was really limited I was really limited by the space to the
friends so I only know friends which around my space around my region localities
but now through the internet I know somebody else which I have not met before far
away from me distance in a distance so it really proven my networks
Illegal such simply unacceptable. I mean everybody should have more responsibility actually
where they chose and it is really unacceptable to access something illegal for them for
anything including through the internet.

71
Well . probably far penalty. I do not I am really sure what was appropriate here up to the very
severe one it could be a jail but fine will be okay for maybe in a in so I am not really
sure but it is very broad areas 441
May it clearly makes them easy to catch the market through the internet as I said that internet
can provide its very wide access to many people which means in the company its
market that is what they are looking for and knowing that many people can access the
internet especially in developed countries the company then well obviously use the
internet as a tool to catch their market so they provide different kinds of facilities
using the internet so it can make their customers comfortable and use their service.
I could not mention that I was part of them but it is really familiar it is really not good
because socialization to me real socialization is the real contact between persons so a
socialization through the internet is should be considered as a complimentary not as
substitution so I think this is not good would not be pro into more the internet
socialization like that than real life socialization.
to some extent it is really good especially for those who what was in the remote areas but
when they can access the internet because it will be good because they can still have a
gather education get some knowledge from far away. But, to the other extent it might
be bad because face to face learning process is required basically. So when people are
able to come to the class or to meet face to face with their teachers or supervisors it
should not be substituted through the internet because it is different in terms of the
learning process. Learning through the internet through words and text is different
from face to face. We know how they, the teachers or lecturers react or their gestures
and so it would impact differently to our internalization of our knowledge.
The internet in the future. But I am sure that the technology would be accelerating so I think
it would be more complicated it might be time more time saving. And it would be
more broadly accessed by people in the world. 340
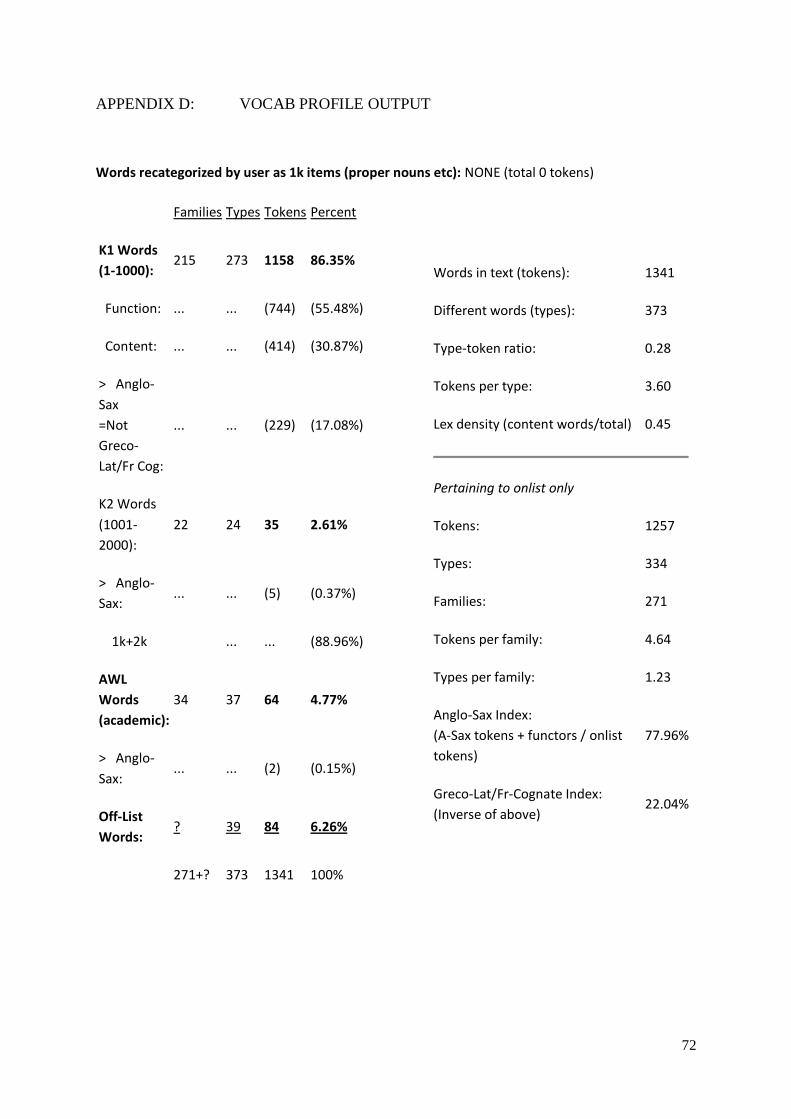
72
APPENDIX D: VOCAB PROFILE OUTPUT
Words recategorized by user as 1k items (proper nouns etc): NONE (total 0 tokens)
Families Types Tokens Percent
K1 Words
(1-1000): 215 273 1158 86.35%
Function: ... ... (744) (55.48%)
Content: ... ... (414) (30.87%)
> Anglo-
Sax
=Not
Greco-
Lat/Fr Cog:
... ... (229) (17.08%)
K2 Words
(1001-
2000):
22 24 35 2.61%
> Anglo-
Sax: ... ... (5) (0.37%)
1k+2k
... ... (88.96%)
AWL
Words
(academic):
34 37 64 4.77%
> Anglo-
Sax: ... ... (2) (0.15%)
Off-List
Words: ? 39 84 6.26%
271+? 373 1341 100%
Words in text (tokens): 1341
Different words (types): 373
Type-token ratio: 0.28
Tokens per type: 3.60
Lex density (content words/total) 0.45
Pertaining to onlist only
Tokens: 1257
Types: 334
Families: 271
Tokens per family: 4.64
Types per family: 1.23
Anglo-Sax Index:
(A-Sax tokens + functors / onlist
tokens)
77.96%
Greco-Lat/Fr-Cognate Index:
(Inverse of above) 22.04%

73