Characteristics and transferability of new apple EST-derived SSRs to other Rosaceae species

Interspeci!c variation in functional traits in relationto species climatic niche optima in Andean Polylepis(Rosaceae) tree species: evidence for climatic adaptations
Johanna M. ToivonenA,E, Viviana HornaB, Michael KesslerC, Kalle RuokolainenA
and Dietrich HertelD
ADepartment of Biology, 20014 University of Turku, Finland.BEcological Botanical Gardens, University of Bayreuth, Universitätsstr. 30, 95440 Bayreuth, Germany.CInstitute for Systematic Botany, University of Zurich, Zollikerstrasse 107, 8008 Zürich, Switzerland.DPlant Ecology and Ecosystems Research, Albrecht vonHaller Institute for Plant Sciences, Georg August Universityof Göttingen, Grisebachstr. 1, 37077 Göttingen, Germany.
ECorresponding author. Email: jomito@utu.!
Abstract. Plant functional traits canbegenetically determinedor phenotypically plastic.Weassessed the degree of geneticdeterminism in the functional traits of Andean Polylepis tree species among 14 important traits that enable the species towithstand cold and dry conditions. We conducted a common garden experiment and related the species-speci!c means ofthe functional traits to the variables of climatic niche optima of the species (mean annual temperature and annualprecipitation), deducing that if the interspeci!c variation in the functional trait is related to the species climatic nicheoptima according to the theoretically-expected pattern of climate-trait relationship, the variation of the trait must begenetically determined. In general, the traits were related either to species temperature or precipitation optima. For example,leaf size, maximum photosynthesis rate and root tip abundance were related to temperature, whereas light compensationand light saturation points were related to precipitation. Only leaf size showed a signi!cant phylogenetic signal, indicatingthat most of the manifested climate–trait relationships are not caused purely by phylogeny, but are mainly a result ofspecies specialisation along an environmental gradient. However, in many cases the relationships were rather weak. Thissuggests that important functional traits of Polylepis species involve both genetic and phenotypic components aiming tomaximise the overall !tness of the species at high elevations.
Additional keywords: climatic niche, ecophysiology, genetic determinism, phenotypic plasticity, phylogeny, treeline.
Received 21 February 2013, accepted 23 September 2013, published online 31 October 2013
IntroductionThe Andes are a relatively recently formed mountain chain withnumerous examples of radiations in which a lowland ancestorspecies has adapted to high altitude conditions and subsequentlydiversi!ed there. The underlying ecological adaptations havenot been effectively targeted to elevation as such, but tophysiologically meaningful environmental gradients that arecorrelated with elevation such as reductions in mean annual airand soil temperatures and in air CO2 concentration and increasesin clear sky radiation and in diurnal temperature variation (Körner2003). Precipitation shows a more complex relationship withelevation, being affected by orography and prevailing winddirections (e.g. Killeen et al. 2007). Generally, precipitationincreases with elevation up to the main cloud condensationlayer and then decreases again, so that the highest mountainhabitats may suffer from water stress (Leuschner 2000).However, there are strong regional variations in this pattern.As a response to these changes, high elevation plants show
different sets of genetically determined adaptations andphenotypically plastic acclimations in their functional traitsinvolving interactions and trade-offs driven by plant energyeconomy (Grime and Pierce 2012). Trees are especiallysusceptible to the multi-stress conditions of high elevationsowing to their high stature and open architecture, whichcouple them more directly to atmospheric climatic conditionsthan herbs and shrubs (Körner 2012).
The most commonly documented response of tree functionaltraits to climate is probably a reduction in tree abovegroundstructures with decreasing temperature and increasing drought,manifested for example in reduced leaf size and speci!c leaf area(e.g. Cordell et al. 1998; Moser et al. 2007; Hertel and Wesche2008; Macek et al. 2009). On the contrary, the size of treebelowground parts and their relative proportion in relation toaboveground structures has been reported to respond positivelyto decreasing temperature (Hertel and Wesche 2008; Hertel andSchöling 2011; Moser et al. 2011) and increasing drought (Gaul
CSIRO PUBLISHING
Functional Plant Biology, 2014, 41, 301–312http://dx.doi.org/10.1071/FP13210
Journal compilation ! CSIRO 2014 www.publish.csiro.au/journals/fpb

et al. 2008; Hertel et al. 2008). Maximum photosynthesis ratehas been shown to relate positively to temperature (e.g. Cabreraet al. 1998; Zhang et al. 2005; Azócar et al. 2007). However,increase in leaf thickness, and consequently N concentration perleaf area, with decreasing temperature may compensate theeffect of Rubisco inactivation at low temperatures (Wittichet al. 2012) (Table 1).
Genetically determined traits are typically unresponsive tothe environmental variation, whereas plastic traits respond tothe varying environmental conditions (e.g. Clausen et al. 1940;Bradshaw 1965; Schlichting 1986; Sultan 2000). Therefore, bygrowing individuals of different species in the same environment,
the eventually observed interspeci!c variation in a given traitmust be genetically determined. One can apply this logic inpractice by investigating experimentally if the geneticallydetermined interspeci!c variation in a given trait has evolvedas a response to a certain environmental factor. This examinationbecomes possible if one knows the preferred condition of eachspecies along the gradient of the environmental factor. Acorrelation between the interspeci!c variation in the trait andthe interspeci!c variation in the preferred environmentalcondition is in concordance with the proposition that theevolutionary adaptation of the species along the gradient of theenvironmental factor has included genetically determined
Table 1. Expected relationships between tree functional traits and temperature/precipitation and their functional explanationsNote: ‘+’ indicates positive relationshipwith temperature and precipitation, ‘!’ indicates negative relationship and ‘"’ no relationship; LA, single leaf area; SLA,speci!c leaf area; SRA, speci!c root area; SRL, speci!c root length; RT, root tip abundance; Amass, mass-based maximum photosynthesis; Aarea, area-basedmaximum photosynthesis; g, stomatal conductance; E, total leaf transpiration; Ci :Ca, ratio of intercellular to ambient CO2 concentration; a, quantum use
ef!ciency; Rd, dark respiration; LSP, light saturation point; LCP, light compensation point
Trait Expectedrelationship to:
Functional explanation of the relationship References
TemperatureLA + Reduced cell number in plant organs at low
temperatures due to energy economical reasonsCordell et al. (1998); Körner et al.
(1989); Hertel and Wesche (2008)SLA + Reduced leaf size due to reduced number of cells and
increased leaf thickness (especially epidermal cellwalls) at low temperatures
Rundel et al. (2003); Hertel andWesche (2008); Macek et al.(2009); van de Weg et al. (2009)
SRA, SRL, RT ! Response to decreased soil nutrient availability,constrained nutrient uptake or a compensation for alower mycorrhizal infections at low temperatures
Ostonen et al. (2007); Hertel andWesche 2008); Hertel et al. (2008)
Amass + Decreased activity of Rubisco enzyme andconsequently decreased rate of carboxylation at lowtemperatures.
Wittich et al. (2012)
Aarea, Ci :Ca ± Increase in leaf thickness and consequently higher Nand Rubisco concentration per leaf area at lowtemperaturesmay affect area-basedCO2 uptake andother area-based measures so that a positiverelationship with temperature is not detected
Benecke et al. (1981); Körner andDiemer (1987); Bresson et al.(2009);Wieser et al. (2010);Wittichet al. (2012)
g, E + De!ned via positive response to vapour pressurede!cit until a threshold limit in which stomata close
Benecke et al. (1981); Körner et al.(1986)
Rd + Depends mainly on the demand for metabolites formaintenance and growth. Exponential increasewithtemperature, but can acclimate over a long-term.
Larigauderie andKörner (1995);Reichet al. (1997); Wright et al. (2006)
LCP, LSP + Adaptation of light response to lower temperatures atlow light levels in colder environments.Consequently LSP has also a positive relationshipwith temperature.
Körner (2003)
a ! Due to apositive relationshipbetween temperature andLCP/LSP, light use ef!ciency decreases (slowerresponse of CO2 assimilation to increased lightintensity) with increasing temperature
PrecipitationLA, SLA + Decreased carbon gain due to higher stomatal
limitation in dry environments (resistance againstdesiccation), adaptation to longer leaf lifespan indryenvironments
Li et al. (2000); Colmenares-Arteagaet al. (2005)
SRA, SRL, RT ! Response to decreased water availability in soil toimprove water absorption
Bakker et al. (2006); Hertel et al.(2008)
Amass, Aarea, g, E,Ci :Ca,
+ De!ned via positive response to vapour pressurede!cit until a threshold limit in which stomata close
Benecke et al. (1981); Körner et al.(1986); Rada et al. (2009)
LSP, LCP, a, Rd ± No functional explanation which would be directlyrelated to precipitation
Wright et al. (2006)
302 Functional Plant Biology J. M. Toivonen et al.

modi!cations of the trait. However, it is possible that maternaleffects may in"uence the outcome of common gardenexperiments.
The Andean tree genus Polylepis (Rosaceae) offers anexcellent opportunity to study interspeci!c variation in traits inrelation to species climatic optima, because the genus contains~30 species (Schmidt-Lebuhn et al. 2006) adapted to differenttemperature and moisture conditions (Simpson 1986). Theseadaptations are relatively new in evolutionary terms, becausethe genus evolved and diversi!ed during the uplift of the Andesin the Plio-Pleistocene (Simpson 1986; Kerr 2003) in responseto the emergence of new high elevation habitats (Gregory-Wodzicki 2000). In this study, we speci!cally asked whetherthe variation in several functional traits potentially associatedwith temperature and/or precipitation among nine Polylepistree species can be attributed to genetically determinedadaptations, and whether the physiological traits aregenetically more strongly controlled than morphological traits.It has been suggested that physiological traits, photosynthesisin particular, would be more !xed (less plastic) thanmorphological traits due to the conservative inheritance ofphysiological traits caused by their complex genetic basis (e.g.Müller et al. 2012). Genetically determined variation in a traitmay also be induced by purely phylogenetic reasons. Therefore,we also asked whether the studied functional traits show aphylogenetic signal. To answer these research questions, wetested the following hypotheses:
(i) that species-speci!c average values in the functionaltraits are related to the climatic niche optima of thespecies (de!ned by mean annual temperature and annualprecipitation) according to the theoretical patterns listedin Table 1;
(ii) that physiological traits are more strongly related to theclimatic niche optima than morphological traits due to theconservative inheritance of physiological traits; and
(iii) that closely related species are functionally more similarthan distantly related species, i.e. functional traits show aphylogenetic signal.
Materials and methodsSpecies distribution and climate dataWe studied nine species of Polylepis originating from !vegeographical regions in central and southern Andes. Thesespecies grow under a wide range of climatic conditionsranging from humid montane forests to dry high-elevationhabitats. Four of the species form the natural alpine treelineswhereas the other !ve occur at lower elevations (Fig. 1). Plantswere obtained from the Polylepis collection at the greenhousesof the Experimental Botanical Garden of the University ofGöttingen. Provenances held in the botanical garden weregrown from seeds (in the case of Polylepis pauta Hieron. andPolylepis microphylla (Wedd.) Bitter.), or from seedling and/orroot suckers. Due to logistical reasons (e.g. very restricted
5000
4500
4000
sub tar
rac tom
3500mic
p npau neg3000
aus
2500
hie
2000
A B
Geographical region
C ED
Ele
vatio
n (m
)
Elevation (m)0–500
500–15001500–30003000–4500>4500
Fig. 1. Species geographical regions (A–E) and their elevation ranges: A, humid eastern Andes of southern Peru, includingP. pauta (pau); B, semi-dry eastern Andes of southern Peru, including the species P. microphylla (mic), P. racemosa (rac) andP. subsericans (sub); C, humid eastern Andes of central Bolivia, including P. hieronymi (hie), P. neglecta (neg) andP. tomentella (tom); D, dry western Andes of central Bolivia, including P. tarapacana (tar); and E, semi-dry easternAndes of Argentina, including P. australis (aus).
Functional traits and climatic niches of Polylepis Functional Plant Biology 303

accessibility of respective populations), individuals of eachspecies represent one population, which comes from ageographically limited area (Table 2).
Tode!ne theclimatic nicheoptimaof the species,weextractedthe climate data for the localities of species occurrence fromWorldClimglobalmodelled climate data (http://www.worldclim.org, accessed 1 February 2011) at the spatial resolution of ~1 km2
(Hijmans et al. 2005). The localities of species occurrence wereobtained during !eld trips reported in Kessler (1995) andToivonen et al. (2011). We obtained additional georeferencedoccurrence information from specimen location data in theGBIF (http://www.gbif.org/, accessed 1 November 2010) andTropicos (http://www.tropicos.org/, accessed 1 November 2010)databases and scienti!c publications reporting Polylepis specieslocations. Before using all this legacy data, we manually cleanedit. For the species with a large distribution range we includedonly climate records near the areas of the provenances used inthis study to ensure the correspondence between the climate dataand species ecophysiological data. For the species with a narrowdistribution range, all the climate records were used.
WorldClim climate data includes 19 climatic variables, ofwhich we used mean annual temperature and total annualprecipitation because they are readily interpretable andstatistically uncorrelated variables (r= –0.022, P = 0.955). Inour dataset, these two variables captured a large proportion ofthe variation in climatic niche optima between the species. Ina principal component analysis (PCA) made for all 19 bioclimvariables, total annual precipitation had the highest score inPCA component 1 (0.981) and mean annual temperature hadthe highest score in PCA component 2 (0.992), and PCAcomponents 1 and 2 together captured 88.6% of the totalvariation. We calculated species-speci!c means for meanannual temperature (Mmat) and for total annual precipitation(Mtap) from the species occurrence locations.We also calculatedmean minimum values of mean annual temperature and totalannual precipitation (Minmat andMintap) for each species basedon the lowest 10% of the mean values, and an interaction term ofclimatic stress, Climstress (–Mmat#Mtap) standardised tomean 0 and variance 1. High climatic stress is characterised bythe conditions of low temperature and precipitation, andtherefore the interaction term was multiplied by –1, so that the
climatic stress increases when the value of the variable increases.We were aware of the uncertainties in the modelled climate data(Killeen et al. 2007; Soria-Auza et al. 2010) and possible spatialerrors in species occurrence records. These could have caused acertain degree of inaccuracy in our estimates for species-speci!cmeans, but we do not have any reason to expect systematic biasesin the data (Table 2).
Common garden experimentWe raised 15–20 individuals per species, which were grown atconstant greenhouse conditions of 20$C of daytime and 8$C ofnight-time temperature with regular watering regime and a lightintensityof~700PAR(mmolphotonsm–2 s–1) for12 hperday, for18 months. These conditions were chosen because they wererelatively easy to maintain and we considered that all the specieswould perform reasonably well in them. Saplings were grownin the pots of the same size (1.5 L), which were placed in thegreenhouse in a randomised block design with all species beingpresent in each block with the same number of individuals beingso that possible differences in growth would have affected thedifferent species to the same extent. At the time of themeasurements the saplings were 1.5–8 years old and 10–50 cmtall.
As aboveground morphological traits we measured singleleaf area (LA, cm2) and speci!c leaf area (SLA, cm2 g–1). Werandomly extracted one intact and fully expanded leaf from theupper branches of 12 different individuals of each Polylepisspecies, scanned them with a digital "atbed scanner andmeasured the leaf area from the scanned images using aWinFolia software (Régent Instruments Inc., Québec, Canada).To determine SLA, we dried leaves to constant weight at 70$Cand related the single leaf area to the dry weight (DW) (Table S2in available as Supplementary Material to this paper).
As belowground traits we measured speci!c root area (SRA,cm2 g–1), speci!c root length (SRL, m g–1) and the abundance ofroot tips, (RT, nmg–1).Weextracted randomlyone representativeintact living rootlet from the soil of 12 or sixPolylepis individualsof each species and took digital images of the rootlets under waterwith a special transmitted light scanner to measure root surfacearea, root length and abundance of root tips from the scanned
Table 2. Species, the provenance of accession of seeds, seedlings and root suckers for the cultivation, and species environmental data including thenumber of species occurrence localities used to obtain climate data (n), species elevation ranges (adapted fromKessler (1995) andToivonen et al. (2011),
and species-speci!c mean values! s.e. for climate variables (obtained from modelled global climate data of WorldClim)Mmat, mean for mean annual temperature; Minmat, mean minimum for mean annual temperature; Mtap, mean for total annual precipitation; Mintap, mean
minimum for total annual precipitation. Mean minimum values, Minmat and Minmap, are calculated as a mean of the lowest 10% of the mean values
Species Provenance Species environmental datan Elevation (m) Mmat ($C) Minmat ($C) Mtap (mm) Mintap (mm)
Polylepis pauta Cuzco, Peru 16 2670–3600 10.98 ± 0.48 8.90 ± 0.13 737± 58 459 ± 0Polylepis microphylla Cuzco, Peru 10 3300–4000 9.17 ± 0.46 7.66 ± 0.25 730± 26 651 ± 12Polylepis racemosa Cuzco, Peru 24 3200–4200 9.08 ± 0.38 6.28 ± 0.06 704± 16 557 ± 58Polylepis subsericans Cuzco, Peru 36 4200–4800 5.52 ± 0.17 3.48 ± 0.39 773± 3 754 ± 0.3Polylepis hieronymi Tarija, Bolivia 31 1900–3300 16.10 ± 0.23 13.62 ± 0.66 625± 21 437 ± 42Polylepis neglecta Santa Cruz, Bolivia 17 2400–3500 14.40 ± 0.33 12.07 ± 0.11 690± 22 511 ± 14Polylepis tomentella Cochabamba, Bolivia 139 3200–4500 10.06 ± 0.21 5.75 ± 0.14 370± 14 143 ± 3Polylepis tarapacana Oruro, Bolivia 49 4000–4800 4.38 ± 0.22 1.95 ± 0.04 181± 22 58± 0.9Polylepis australis Córdoba, Argentina 22 1800–3800 12.85 ± 0.39 9.07 ± 0.08 356± 23 255 ± 6
304 Functional Plant Biology J. M. Toivonen et al.

images using the WinRhizo software (Régent Instruments Inc.).We dried the roots to constant weight at 70$C and calculated thespeci!c root area, speci!c root length and root tips abundancerelating themeasured surface area, length and root tip data to DWof the rootlets (Table S3).
The photosynthetic performance of the species was measuredas light response curveswith a portable gas-exchange system (LI-6400,Li-CorBioscieneces,Lincoln,NE,USA)withan integratedgas analyser and a standard leaf chamber equipped with a LEDred/blue light source (type 6400–02B). We measured 1–4 intactand fully expanded upper branch leaves per individual. Thenumber of individuals per species varied from one to eight,because at the moment of the measurement we did not havethe same number of individuals with suf!ciently healthy leavesnecessary for the measurements. Measurements were done inconstant CO2 partial pressure of 350mmolmol–1 and leaftemperature of 18$C. First, the plant leaf was exposed to themaximum light intensity of 1500 PAR for ~15–20min until CO2
level in the leaf chamber stabilised and leaves showed themaximum rate of photosynthesis (mmol of CO2 m
–2 s–1). Thenwe ran an automatic light response program, where the lightintensity was gradually lowered from 1500 to 1200, 1000, 800,600, 400, 200 and zero PAR, and CO2 assimilation rate wasmeasured in each light intensity level after the CO2 level hadstabilised within a minimum waiting time of 2min. The lastmeasurement at zero PAR was used to estimate dark respiration.We !tted the light response curve to the measured data usingnon-linear regression, which describes leaf photosynthesis, A1
as a rectangular hyperbolic function of photosynthetic photon"ux density, Q:
A1 % AmaxaQ=&Amax ' aQ( ! Rd; &1(
where Amax represents the asymptotic value of grossphotosynthesis with respect to Q, a is the quantum useef!ciency and Rd the apparent dark respiration rate (Meir et al.2007). We calculated the following parameters from the lightresponse data:
Aarea (mmol CO2 m–2 s–1), leaf area-based maximum netphotosynthesis rate;Amass (nmol CO2 g–1 s–1), leaf mass-based maximum netphotosynthesis rate calculated through speci!c leaf area;g (mol H2O m–2 s–1), stomatal conductance to water vapour inmaximum light conditions;Rd (mmol CO2 m
–2 s–1), dark respiration rate;E (mol H2O m–2 s–1), leaf transpiration rate;Ci :Ca (mol CO2 mol CO2
–1), ratio of intercellular to ambientCO2 concentration;a., quantum use ef!ciency, this is the coef!cient of the initialslope of light response curve indicating the ef!ciency of lightuse in CO2 assimilation;LSP (mmol photons m–2 s–1), light saturation point: this refersto the PAR value where 90% of maximum net photosynthesisis reached and carbon assimilation rate can no longer increasebecause of the limited carboxylation; andLCP (mmol photons m–2 s–1), light compensation point: thisis the PAR value where photosynthesis and respiration arebalanced, so that the rate of CO2 assimilation matches therate of CO2 released from respiration (Table S1).
Statistical analysesTo explore the relationships among the traits, we used Pearson’scorrelation analysis. To relate the traits with estimated climaticoptima of the species, we used ordinary linear regressions, wherespecies-speci!cmean for each trait was used in turn as a responsevariable and species-speci!c means for occurrence points alongclimatic variables (Mmat and Mtap) and their interaction term,climatic stress (Climstress), as explanatory variables.
To illustrate the relationships among the functional traits andbetween functional traits and climate,we conducted a redundancyanalysis (RDA),whereweused all 14 functional traits as responsevariables and Mmat, Mtap and their interaction Climstress asan explanatory variable. Due to a low sample size (n = 9 species),it is not meaningful to report type 1 error probabilities for RDAmodels that have more than one explanatory variable. The RDAwas carried outwith the statistical software Canoco 4.5 (ter Braakand Smilauer 1998).
We also made RDA separately for morphological andphysiological traits to study whether the selected physiologicaltraits are in general better explained by climatic niche variablesthan morphological traits. If so, that would prove higher degreesof genetic determinism in physiological traits compared withmorphological traits due to more complex genetic basis ofphysiological traits. As above, we report statistics with oneexplanatory variable in turn (Mmat, Mtap or Climstress).
To study the phylogenetic signal in functional traits, wecalculated phylogenetic distances between the species basedon the phylogenetic tree by Schmidt-Lebuhn et al. (2006) thatwas calculated by successive reweighting of morphologicalcharacters in combination with molecular AFLP (Ampli!edFragment Length Polymorphism) data. The tree is not time-calibrated and therefore time-scaled evolutionary distancescould not been calculated. Instead, we calculated thephylogenetic distances as number of bifurcations between thespecies. We then calculated dissimilarity matrices based onEuclidean distances separately for each functional trait. Thesematrices were then compared with the phylogenetic distancematrix with a Mantel test of matrix correspondence (Smouseet al. 1986). Distance matrices and Mantel tests were calculatedwith the statistical software PC-ORD 6 (Peck 2010).
ResultsSeveral functional traits were intercorrelated. For example, area-and mass-based maximum CO2 assimilation rates (Amass, Aarea),stomatal conductance (g) and leaf transpiration (E) were stronglypositively intercorrelated. Similarly, light compensation and lightsaturation points (LCP and LSP) and dark respiration (Rd) werestrongly positively intercorrelated. Also, LCP and LSP weremarginally negatively correlated with quantum use ef!ciency(a). Speci!c root area and root length (SRAandSRL) and root tipabundance (RT), were strongly positively intercorrelated.Additionally, RT and single leaf area (LA) were marginallynegatively intercorrelated. Speci!c leaf area (SLA) neithersingle leaf area (LA) correlated with CO2 assimilation rates(Amass, Aarea). Instead, SLA correlated negatively with LCP,LSP and Rd. (Table 3).
We noted some signi!cant and some marginally signi!cantrelationships between the interspeci!c variation in functional
Functional traits and climatic niches of Polylepis Functional Plant Biology 305

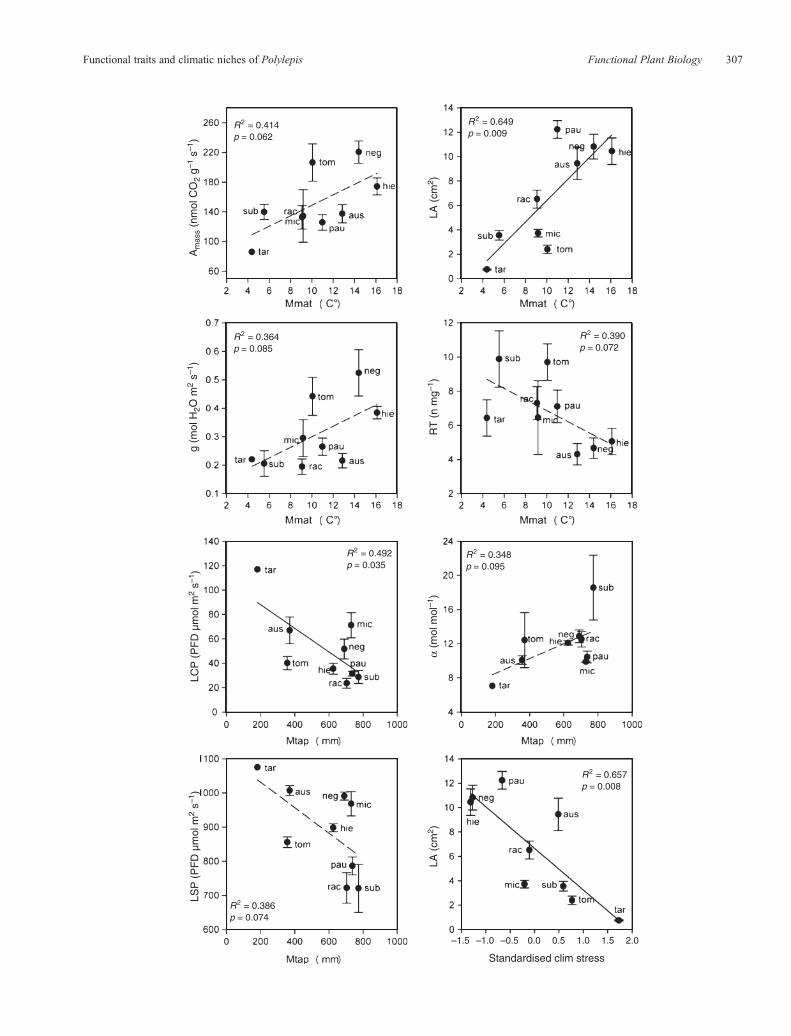
traits and climatic niche variables (Mmat,Mtap andClimstress),but in many cases the relationships were not signi!cant(Table 4). The strongest relationships were the increase inLA with increasing mean annual temperature, the reductionin LA with increasing climatic stress, and the decrease in lightcompensation point of photosynthesis (LCP) with increasing
precipitation. Mass-based photosynthesis rate Amass wasmarginally related to Mmat, but area-based photosynthesisrate (Aarea) not, as we expected. Also, speci!c leaf area(SLA) was not related to Mmat neither to Mtap even thoughit was positively correlated with LCP, which showed a strongrelationwithMtap. Similarly, even the rootmorphological traits
Table 4. Explained proportion of variance (R2) in inter-speci!c variation of functional traits in ordinary linear regressions and their statisticalsigni!cance (p) using climatic niche variables Mmat (mean for mean annual temperature), Mtap (mean for total annual precipitation) and their
interaction term Climstress as explanatory variables[+] and [!] symbols indicate the direction of the relationship. Statistically signi!cant R2-values are indicated: **,P< 0.01; *,P< 0.05; +,P< 0.1.Aarea, area-basedmaximum photosynthesis; Amass, mass-based maximum photosynthesis; Rd, dark respiration; g, stomatal conductance; E, total leaf transpiration; Ci:Ca, ratio ofintercellular to ambient CO2 concentration; a, quantum use ef!ciency; LSP, light saturation point; LCP, light compensation point; SRA, speci!c root area; SRL,
speci!c root length; RT, root tip abundance; SLA, speci!c leaf area; LA, single leaf area
Trait Mmat Mtap ClimstressSlope R2 P-value Slope R2 P-value Slope R2 P-value
Aarea [+] 0.259 0.162 [+] 0.003 0.893 [+] 0.164 0.279Amass [+] 0.414 0.062+ [+] 0.044 0.588 [+] 0.284 0.140Rd [!] 0.042 0.595 [!] 0.222 0.200 [!] 0.116 0.370g [+] 0.364 0.085+ [+] 0.004 0.879 [+] 0.263 0.158E [+] 0.325 0.109 [+] 0.016 0.747 [+] 0.272 0.150Ci :Ca [+] 0.248 0.172 [!] 0.064 0.512 [+] 0.101 0.404a [!] 0.001 0.951 [+] 0.348 0.095+ [+] 0.048 0.572LSP [+] 0.001 0.946 [!] 0.386 0.074+ [!] 0.046 0.579LCP [!] 0.198 0.230 [!] 0.492 0.035* [!] 0.345 0.096+
SRA [!] 0.020 0.718 [+] 0.171 0.268 [+] 0.000 0.974SRL [!] 0.035 0.627 [+] 0.071 0.488 [!] 0.007 0.832RT [!] 0.390 0.072+ [+] 0.015 0.750 [!] 0.191 0.239SLA [+] 0.097 0.415 [+] 0.212 0.212 [+] 0.112 0.378LA [+] 0.649 0.009** [+] 0.182 0.253 [+] 0.657 0.008**
Fig. 2. Signi!cant or marginally signi!cant relationships between species-speci!c mean values in functional traits ("s.e.) and climatic niche variables.Amass isthemass-basedmaximumphotosynthesis; g is stomatal conductance; LA is single leaf area; RT is root tip abundance; LCP is the light compensation point; LSP isthe light saturation point; a is quantum use ef!ciency; Mmat is the species-speci!c mean for mean annual temperature; and Mtap is the species-speci!c men fortotal annual precipitation. Standardised Climstress is calculated as an interaction between Mmat and Mtap, multiplied by –1 and standardised to mean 0 andvariance 1. Solid trend lines indicate statistically signi!cant relationships (P< 0.05) and dashed trend lines marginally signi!cant relationships (P< 0.1).
Table 3. Pearson’s correlation coef!cients among species-speci!c mean values for functional traitsCorrelations with Ci :Ca are Spearman’s correlation coef!cient. Signi!cant differences are indicated: ***, P< 0.001; **, P< 0.01; *, P< 0.05; +, P< 0.1). Aarea,area-based maximum photosynthesis; Amass, mass-based maximum photosynthesis; Rd, dark respiration; g, stomatal conductance; E, total leaf transpiration;Ci :Ca, ratio of intercellular to ambient CO2 concentration; a, quantum use ef!ciency; LSP, light saturation point; LCP, light compensation point; SLA, speci!c
leaf area; LA, single leaf area; SRA, speci!c root area; SRL, speci!c root length; RT, root tip abundance
Amass Rd g E Ci :Ca a LSP LCP SLA LA SRA SRL RT
Aarea 0.940*** 0.580 0.954*** 0.930*** 0.199 0.267 0.462 0.039 –0.325 0.104 –0.073 0.006 –0.051Amass 0.321 0.894** 0.898** 0.157 0.400 0.193 –0.267 0.014 0.305 0.116 0.202 –0.023Rd 0.554 0.523 0.221 –0.221 0.883** 0.795* –0.818** –0.587+ –0.345 –0.263 0.151g 0.986*** 0.451 0.074 0.531 0.082 –0.295 0.254 –0.170 –0.066 –0.171E 0.461 0.090 0.470 0.035 –0.210 0.262 –0.098 –0.015 –0.099Ci :Ca –0.758* 0.550 0.309 –0.101 0.356 –0.464 –0.380 –0.486a –0.591+ –0.635+ 0.295 0.030 0.674* 0.670* 0.525LSP 0.864** –0.809** –0.344 –0.644+ –0.580 –0.259LCP –0.851** –0.641+ –0.550 –0.535 –0.044SLA 0.594+ 0.498 0.508 0.039LA –0.030 –0.023 –0.584+
SRA 0.974*** 0.769*SRL 0.804**
306 Functional Plant Biology J. M. Toivonen et al.
R2 = 0.414p = 0.062
Am
ass
(nm
ol C
O2
g–1 s
–1)
LA (
cm2 )
LA (
cm2 )
Standardised clim stress
–1.5 –1.0 –0.5 0.0 0.5 1.0 1.5 2.0
RT
(n
mg–1
)!
(mol
mol
–1)
g (m
ol H
2O m
2 s–1
)LC
P (
PF
D µ
mol
m2
s–1)
LSP
(P
FD
µm
ol m
2 s–1
)
R2 = 0.649p = 0.009
R2 = 0.390p = 0.072
R2 = 0.364p = 0.085
R2 = 0.492p = 0.035
R2 = 0.348p = 0.095
R2 = 0.386p = 0.074
R2 = 0.657p = 0.008
Functional traits and climatic niches of Polylepis Functional Plant Biology 307

(SRA, SRL and RT) were strongly intercorrelated, only root tipabundance (RT) showed a signi!cant relationship (even thoughmarginal) to Mmat (Table 4; Figs 2, 3).
Physiological traits were not in general better explainedby climactic niche variables than morphological traits. Whenrelating allmorphological and all physiological traits respectivelyto climatic niche variables, no signi!cant relationships weredetected (Table 5).
Single leaf area (LA) was the only trait showing a signi!cantphylogenetic signal. Phylogenetic distances among the specieswere positively correlated with Euclidean distances based on LA(r= 0.33, P< 0.05) (Table 6).
DiscussionIn this study, our aimwas to assess (i)whether the functional traitsthat enablePolylepis species from tropical and subtropical Andesto cope with cold and dry conditions are genetically determined,(ii) whether the morphological traits are more plastic than thephysiological traits, and (iii) whether the functional traits showa phylogenetic signal. We found some signi!cant relationshipsbetween the interspeci!c variation in functional traits andtemperature and/or precipitation optima of the species,
indicating genetically determined climatic adaptations to coldand dry conditions respectively. However, several climate-traitrelationships that we expected to see, based on theories andprevious empirical evidence, were not observed. Our resultsdid not support the hypothesis about the conservativeinheritance of physiological traits, i.e. physiological traits werenot genetically more strongly controlled than morphologicaltraits among the traits and species that we studied. The roleof phylogenetic relationships determining the inter-speci!cvariation in the functional traits was limited and signi!cantonly for single leaf area.
Genetically determined adaptive traits
Adaptive traits are assumed to have a genetic basis and havebeen consistently linked to the environment during the speciesevolution, in the case of Polylepis species since Plio-Pleistocene(Simpson 1986; Kerr 2003). In our study, these associations canbe seen in strong relationships between the inter-speci!cvariationof a trait and climatic niche optima.
We found the expected increase in species-speci!c mean ofsingle leaf area (LA) and decrease in root tip abundance (RT)withincreasing mean annual temperature optima (Mmat). These!ndings are in concordance with the well known sizereduction in tree aboveground parts, and more recentlydetected increase in the size of tree belowground parts withdecreasing temperature, which also results in correspondingchanges in above- and belowground biomass allocationpatterns (e.g. Hertel et al. 2008; Hertel and Schöling 2011;Moser et al. 2011). Positive responses of root systems todecreased temperatures are explained by low nutrient supply atlow temperatures due to reduced water viscosity and liquiddiffusion and low microbial activity (e.g. Sveinbjörnsson et al.1992; Tanner et al. 1998; Hertel and Wesche 2008; Hertel andSchöling 2011). The direct mechanisms underlying the reductionin leaf area with decreasing temperature remain unclear, but arelikely to be linked to leaf energy economy and increasingleaf thickness. Körner (2003) highlighted the role of thedevelopmental control of cell wall structures, increased lipidconcentration in particular, as a reason for increased leafthickness at low temperatures. In thick leaves, more carbon isinvested per unit of photosynthesising leaf area than in thinleaves. Consequently, leaf size decreases with increasingthickness, because it would be energetically too expensive todevelop and maintain large and thick leaves.
Also, according to our expectations, mass-based maximumphotosynthetic rate was positively related to Mmat. The positiverelationship between CO2 assimilation and temperature iscommonly related to the activation of the Rubisco enzyme(Berry and Björkman 1980; Yamori et al. 2005). Generally, allnine species studied showed relatively high rates of maximumarea-based photosynthesis rates in comparison to other Polylepisspecies measured in situ (e.g. Rada et al. 1996; García-Núñezet al. 2004; Azócar et al. 2007). We believe this was partially aneffect of optimum laboratory conditions and elevated CO2 partialpressure, which was almost twice as high as the one Polylepisspecies are exposed to in their high mountain habitats.
Reduction in Amass with decreasing Mmat may be interpretedas an evidence that tree growth is limited by carbon acquisition at
1.0
1.0–1.0
–1.0
SLA
LA
SRASRL
RT
A_area
A_mass
Rd
QE
LCP
LSP
g
Ci : Ca
E
Mmat
Mtap
Clim stress
aus
hie
tom
neg
pau
rac
sub
tar
mic
Fig. 3. Redundancy analysis (RDA) triplot with three explanatory variables(Mmat is the mean for mean annual temperature; Mtap is the mean for totalannual precipitation; Climstress is climatic stress calculated as an interactionbetween Mmat and Mtap, multiplied by –1); and all 14 functional traits asresponse variables (Aarea is area-based maximum photosynthesis; Amass ismass-based maximum photosynthesis; Rd is dark respiration; g is stomatalconductance; E is total leaf transpiration; Ci :Ca is the ratio of intercellular toambient CO2 concentration; QE is quantum use ef!ciency (a); LSP is thelight saturation point; LCP is the light compensation point; SRA is speci!croot area; SRL is speci!c root length; RT is root tip abundance; SLA isspeci!c leaf area; and LA is single leaf area). Species (= samples) aremarked as black dots (pau =P. pauta, mic =P. microphylla,rac =P. racemosa, sub =P. subsericans, hie = hieronymi, neg =P. neglecta,tom=P. tomentella, tar =P. tarapacana, aus =P. australis).
308 Functional Plant Biology J. M. Toivonen et al.

high elevations, and not only by metabolic constraints relatedto the carbon investment into tree organs at low temperatures(Körner 1998; Hoch and Körner 2005). This !nding is inagreement to recent ecophysiological studies on trees underin situ conditions at high elevation treelines (Wieser et al.2010; Wittich et al. 2012).
Unexpectedly, we found that inter-speci!c variation in lightcompensation and light saturation points (LCP, LSP) was
negatively and quantum use ef!ciency (a) positively related tospecies-speci!c mean for total annual precipitation (Mtap). Thismay be interpreted as an indirect response of these photosynthetictraits to light conditions as a result of prevailing cloud coverand precipitation at the natural growth sites of the species. It ispossible that species from areas of frequent cloud cover and highprecipitation may better exploit available light and reach positivecarbon balance and maximum CO2 assimilation rate at lowerlight intensities than species from areas of clear sky conditions,and consequently lower precipitation. This assumption issupported by the observation that among Amazonian cloudforest trees maximum photosynthesis rate may be negativelyaffected by cloud cover due to low light intensity levels andleaf wetness (Letts and Mulligan 2005). However, it has beenshown that sun leaves have higher saturated photosynthesis rateand light compensation point than shade leaves of the sameplant (e.g. Boardman 1977), calling this interpretation intoquestion. It has also been shown among several tropical treespecies that photosynthetic features and functional leaf traitsdo not differ between the species of different shade tolerance(Coste et al. 2005), and that leaves may also be able to acclimateto changed light conditions (Mooney 1977). We did not !nd adecrease in species-speci!c maximum photosynthesis rate inrelation to increased mean annual precipitation optima, eventhough light compensation and light saturation points ofphotosynthesis (LCP, LSP) and quantum use ef!ciency (a)were affected.
Traits showing no relationships with climaticniche variables
We did not detect the commonly reported decrease in speci!cleaf area (SLA) with decreasing Mmat (e.g. Cordell et al. 1998;Moser et al. 2007; Hertel and Wesche 2008; Macek et al. 2009).Neither was the relationship with Mtap statistically signi!cant,even though the expected trend was visible. We expected thatarea-based photosynthetic rate (Aarea) would respond to changesin SLA so that an increase in SLA with decreasing temperaturewould compensate the temperature-related decrease in Aarea, viaincrease in N concentration per leaf area, eventually leading Aarea
to show no relationship with temperature optima of the species.We indeed observed this lack of relationship. However, theassumed compensation effect was not manifested in our studybecause SLA did not decrease with increasing temperatureoptimum. This suggests thatAarea is not controlled solely by SLA.
Also the root traits, SRA and SRL in particular, showed norelationship with climatic niche variables. We expected thesetraits to be negatively related to precipitation and temperaturedue to thenecessity to improvewater absorption in arid conditions(Bakker et al. 2006; Hertel et al. 2008) and to improve nutrientuptake at low temperatures (Sveinbjörnsson 2000; Ostonen et al.2007; Hertel and Wesche 2008). However, only root tipabundance (RT) showed the expected negative relationshipwith temperature. SRA and SRL were unresponsive to bothclimatic niche variables. This may partially be a consequenceof possible inaccuracies in species-speci!c mean values, due tothe intra-speci!c variation and limited number of measuredindividuals per species. In addition, we used individuals of onepopulation only, but as the used climate records also came from
Table 6. Coef!cients of correlation (r) and their level of signi!cance (P-value) between thematrices of functional dissimilarities andphylogeneticdistances among the nine species in the Mantel test of matrix
correspondenceSigni!cant differences are indicated: **,P< 0.01; *,P< 0.05; +,P< 0.1.Aarea,area-based maximum photosynthesis; Amass, mass-based maximumphotosynthesis; Rd, dark respiration; g, stomatal conductance; E, total leaftranspiration; Ci :Ca, ratio of intercellular to ambient CO2 concentration; a,quantum use ef!ciency; LSP, light saturation point; LCP, light compensationpoint; SRA, speci!c root area; SRL, speci!c root length; RT, root tip
abundance; SLA, speci!c leaf area; LA, single leaf area
Trait r P-value
Aarea –0.161 0.237Amass –0.073 0.402Rd 0.260 0.076+
g –0.266 0.068+
E –0.222 0.128Ci :Ca –0.263 0.177a –0.247 0.193LSP 0.066 0.323LCP 0.253 0.184SRA –0.101 0.277SRL –0.041 0.457RT –0.262 0.079+
SLA 0.181 0.210LA 0.327 0.031*
Table 5. Statistics of redundancy analysis made with one explanatoryvariable (Mmat, Mtap or Climstress), being either ‘all functional traitstogether as response variables’, ‘only morphological traits’, or ‘only
physiological traits as response variables’Mmat, species-speci!c mean for mean annual temperature; Mtap, species-speci!c men for total annual precipitation; Climstress, interaction between
Mmat and Mtap
R2 P-value
All functional traitsMmat 0.22 0.096+
Mtap 0.16 0.286Climstress 0.15 0.357
Morphological traitsMmat 0.24 0.136Mtap 0.12 0.936Climstress 0.18 0.246
Physiological traitsMmat 0.21 0.157Mtap 0.18 0.243Climstress 0.13 0.391
Functional traits and climatic niches of Polylepis Functional Plant Biology 309

the proximity of the studied provenances,we believe thematernaleffect has only a minor effect on the results.
Dark respiration (Rd) was expected to relate positively totemperature, but no relationship with precipitation was found(Wright et al. 2006). In contrast, interspeci!c variation in Rd
should relate positively to the variation in maximumphotosynthesis rate and associated leaf traits because highphotosynthesis rates have substantial maintenance costs (Reichet al. 1997). We found no relationship between interspeci!cvariation in dark respiration and Mmat in Polylepis speciesgrown in uniform experimental conditions. This may con!rmthe acclimation tendency of Rd to prevailing temperatureconditions (Larigauderie and Körner 1995; Körner 2003;Atkin et al. 2006). Instead, inter-speci!c variation in darkrespiration showed a slight negative trend in relation to Mtap,but owing to the weak statistical signi!cance of this relationship,it remains unclear whether or not Polylepis species of drierhabitats would respire more than species from humid habitats.However, our results showed a high respiration rate forP. tarapacana, the species with the most stressful climaticniche optima (the driest and the coldest) in relation to its meanmaximum photosynthesis rates. So, even though the variationin Rd among the nine species was not related to the variation inaverage climatic stress conditions that the species face, it seemsthat the respiration cost for this speci!c species is especiallyhigh because of the stressful climatic conditions where it comesfrom, and this trait was apparently maintained in the commongarden experiment.
The role of phylogeny and ecological specialisation
Genetically determined interspeci!c variation in traits may alsore"ect phylogenetic distances among species so that trait valuedifferences increase together with phylogenetic distances. In ourstudy, single leaf area was the only trait that showed a signi!cantpositive phylogenetic signal indicating that closely relatedspecies have similar single leaf area. Therefore, among ourstudy species the interspeci!c variations in traits that weresigni!cantly related to climatic niche optima of the speciesseem to be mainly a result of species-speci!c preferences todifferent environmental conditions. This can be interpreted asan evidence of ecological specialisation along environmentalgradient in the course of species evolution within the genusPolylepis. It has been shown earlier that the phylogeneticallybasal grade of species within the genus Polylepis grows in humidhabitats and that there is a successive adaptation of species toincreasingly arid environments (Simpson 1986; Schmidt-Lebuhnet al. 2006, 2010). Instead, cold climate species (treeline species)are dispersed fairly evenly in the phylogenetic tree, indicatingthat adaptations to cold climate within the genus would havehappened several times independently.
ConclusionsThe results of our study indicate that some of potentially relevantfunctional traits that enable high Andean Polylepis species towithstand cold and dry conditions show genetically determinedvariation among species. Therefore, these traits appear to havebeen important objects of selection during evolution of thespecies. Physiological traits were not more !xed than
morphological traits among the studied traits and species,leading to the rejection the hypothesis regarding theconservative inheritance of physiological traits. A phylogeneticsignal was signi!cant only for single leaf area, indicating that therelationships between species-speci!c means in the studied traitsand climatic niche optima result largely from environmentaladaptations.
The results of our study agree with earlier !ndings (Chapinet al. 1993; Westoby et al. 2002) that plant functional responsesto climate form a complex network of interactions and trade-offs, where plants aim to the optimal combination of traits tomaximise their overall !tness. Therefore, it is possible that notall of the individual traits studied are manifested optimallyin relation to the species-speci!c climatic niche variables.Consequently, predictions about species functional responsesto increasing temperatures due to climate change or changesin the high elevation treeline position should be made verycarefully.
AcknowledgementsWe thank the staff of the botanical garden of the department of Plant Ecologyand Ecosystems Research, Georg August University of Göttingen for takinggood care of thePolylepis seedlings and helpingwith themeasurements. Thisstudy was funded by DAAD (German Academic Exchange Service), Jennyand Antti Wihuri Foundation, Finnish Concordia Fund, Oskar Ö"undFoundation, University of Turku and Biological Interactions GraduateSchool.
ReferencesAtkin OK, Scheurwater I, Pons TL (2006) High thermal acclimation potential
of both photosynthesis and respiration in two lowland Plantago speciesin contrast to an alpine congeneric.Global Change Biology 12, 500–515.doi:10.1111/j.1365-2486.2006.01114.x
Azócar A, Rada F, García-Núñez C (2007) Functional characteristics of thearborescent genusPolylepis along a latitudinal gradient in the highAndes.Interciencia 32, 663–668.
Bakker MR, Augusto L, Achat DL (2006) Fine root distribution of trees andunderstory in mature stands of maritime pine (Pinus pinaster) on dryand humid sites. Plant and Soil 286, 37–51. doi:10.1007/s11104-006-9024-4
Benecke U, Schulze E-D,Matyssek R, HavranekWM (1981) Environmentalcontrol of CO2-assimilation and leaf conductance in Larix deciduaMill.Oecologia 50, 54–61. doi:10.1007/BF00378793
Berry JA, Björkman O (1980) Photosynthetic response and adaptation totemperature in higher plants. Annual Review of Plant Physiology 31,491–543. doi:10.1146/annurev.pp.31.060180.002423
Boardman NK (1977) Comparative photosynthesis of sun and shade plants.Annual Review of Plant Physiology 28, 355–377. doi:10.1146/annurev.pp.28.060177.002035
Bradshaw AD (1965) Evolutionary signi!cance of phenotypic plasticity inplants. Advances in Genetics 13, 115–155. doi:10.1016/S0065-2660(08)60048-6
BressonCC,KowalskiAS,KremerA,DelzonS (2009)Evidenceof altitudinalincrease in photosynthetic capacity: gas-exchange measurements atambient and constant CO2 partial pressure. Annals of Forest Science66, 505. doi:10.1051/forest/2009027
Cabrera HM, Rada F, Cavieres L (1998) Effects of temperature onphotosynthesis of two morphologically contrasting plant species alongan altitudinal gradient in the tropical high Andes. Oecologia 114,145–152. doi:10.1007/s004420050430
Chapin FS III, Autumn K, Pugnaire F (1993) Evolution of suits of traits inrelation to environmental stress. American Naturalist 139, 1293–1304.
310 Functional Plant Biology J. M. Toivonen et al.

Clausen J, Keck DD, HieseyWM (1940) ‘Experimental studies on the natureof species. 1. Effect of varied environments on western North Americanplants.’ (Carnegie InstitutionofWashingtonPublication520:WashingtonDC)
Colmenares-ArteagaM,RadaF,LuqueR (2005)Anatomía foliar dePolylepissericeaWedd. (Rosaceae) a dos altitudes en los Altos andes venezolanos.Plantula 3, 141–148.
Cordell S, Goldstein G, Mueller-Dombois D, Vitousek PM (1998)Physiological and morphological variation in Metrosiderospolymorphy, a dominant Hawaiian tree species, along an altitudinalgradient: the role of phenotypic plasticity. Oecologia 113, 188–196.doi:10.1007/s004420050367
Coste S, Roggy J-C, Imbert P, Born C, Bonal D, Dreyer E (2005) Leafphotosynthetic traits of 14 tropical rain forest species in relation to leafnitrogen concentration and shade tolerance. Tree Physiology 25,1127–1137. doi:10.1093/treephys/25.9.1127
García-Núñez C, Rada F, Boero C, González J, Gallardo M, Azócar A,Liberman-Cruz M, Hilal M, Prado F (2004) Leaf gas exchange andwater relations in Polylepis tarapacana at extreme altitudes in theBolivian Andes. Photosynthetica 42, 133–138. doi:10.1023/B:PHOT.0000040581.94641.ed
Gaul D, Hertel D, Borken W, Matzner E, Leuschner C (2008) Effects ofexperimental drought on the !ne root system of mature Norway spruce.Forest Ecology and Management 256, 1151–1159. doi:10.1016/j.foreco.2008.06.016
Gregory-Wodzicki KM (2000) Uplift history of the Central and NorthernAndes: a review.Geological Society of AmericaBulletin 112, 1091–1105.doi:10.1130/0016-7606(2000)112<1091:UHOTCA>2.0.CO;2
Grime JP, Pierce S (2012) ‘The evolutionary strategies that shapeecosystems.’ (Wiley-Blackwell: Oxford)
Hertel D, Schöling D (2011) Norway spruce shows contrasting changesin below- versus above-ground carbon partitioning towards the alpinetreeline: evidence from a Central European case study. Arctic, Antarctic,and Alpine Research 43, 46–55. doi:10.1657/1938-4246-43.1.46
Hertel D, Wesche K (2008) Tropical moist Polylepis stands at the treeline inEast Bolivia: the effect of elevation on stand microclimate, above- andbelow-ground structure, and regeneration. Trees 22, 303–315.doi:10.1007/s00468-007-0185-4
Hertel D, Therburg A, Villalba R (2008) Above- and belowground responseby Nothofagus pumilio to climatic conditions at the transition from thesteppe-forest boundary to the alpine treeline in southern Patagonia,Argentina. Plant Ecology & Diversity 1, 21–33. doi:10.1080/17550870802257026
Hijmans RJ, Cameron SE, Parra JL, Jones PG, Jarvis A (2005) Very highresolution interpolated climate surfaces for global land areas.International Journal of Climatology 25, 1965–1978. doi:10.1002/joc.1276
Hoch G, Körner C (2005) Growth, demography and carbon relations ofPolylepis trees at the world’s highest treeline. Functional Ecology 19,941–951. doi:10.1111/j.1365-2435.2005.01040.x
Kerr MS (2003) ‘A phylogenetic and biogeographic analysis ofSanguisorbeae (Rosaceae) with emphasis on the Pleistocene radiationof the high Andean genus Polylepis.’ (PhD Thesis, University ofMaryland: College Park, MD, USA)
Kessler M (1995) Present and potential distribution of Polylepis (Rosaceae)forests in Bolivia. In ‘Biodiversity and conservation of neotropicalmontane forests’. (Eds SP Churchill, H Balslev, E Forero, JL Luteyn)pp. 281–294. (New York Botanical Garden: New York)
Killeen TJ, DouglasM, Consiglio T, Jørgensen PM,Mejia J (2007) Dry spotsand wet spots in the Andean hotspot. Journal of Biogeography 34,1357–1373. doi:10.1111/j.1365-2699.2006.01682.x
Körner C (1998) A re-assessment of high elevation treeline positions andtheir explanation.Oecologia 115, 445–459. doi:10.1007/s004420050540
Körner C (2003) ‘Alpine plant life, functional plant ecology of highmountain ecosystems.’ (Springer: Berlin)
Körner C (2012) ‘Alpine treelines, functional ecology of the global highelevation tree limits.’ (Springer: Basel, Switzerland)
Körner C, Diemer M (1987) In situ photosynthetic responses to light,temperature and carbon dioxide in herbaceous plants from low andhigh altitude. Functional Ecology 1, 179–194. doi:10.2307/2389420
Körner C, Bannister M, Mark AF (1986) Altitudinal variation in stomatalconductance, nitrogen content and leaf anatomy in different plant lifeforms in New Zealand. Oecologia 69, 577–588. doi:10.1007/BF00410366
Körner C, Pelaez Menendez-Riedl S, John PCL (1989) Why are bonsaiplants small? A consideration of cell size. Australian Journal of PlantPhysiology 16, 443–448. doi:10.1071/PP9890443
Larigauderie A, Körner C (1995) Acclimation of leaf dark respirationto temperature in alpine and lowland plant species. Annals of Botany76, 245–252. doi:10.1006/anbo.1995.1093
Letts MG, Mulligan M (2005) The impact of light quality and leaf wetnesson photosynthesis in north-west Andean tropical montane cloud forest.Journal of Tropical Ecology 21, 549–557. doi:10.1017/S0266467405002488
Leuschner C (2000) Are high elevations in tropical mountains aridenvironments for plants? Ecology 81, 1425–1436. doi:10.1007/978-3-642-55819-1_16
Li CY, Berninger F, Koskela J, Sonninen E (2000) Drought responsesof Eucalyptus microtheca provenances depend on seasonality ofrainfall in their place of origin. Australian Journal of Plant Physiology27, 231–238.
Macek P,Macková J, DeBello F (2009)Morphological and ecophysiologicaltraits shaping altitudinal distribution of three species in the dry tropicalAndes. Acta Oecologica 35, 778–785. doi:10.1016/j.actao.2009.08.013
Meir P, Levy PE, Grace J, Jarvis PG (2007) Photosynthetic parameters fromtwo contrasting woody vegetation types in West Africa. Plant Ecology192, 277–287. doi:10.1007/s11258-007-9320-y
Mooney HA (1977) Photosynthesis. In ‘Plant ecology’. (Ed. MJ Crawley)pp. 345–373. (Blackwell Scienti!c Publications: Oxford)
Moser G, Hertel D, Leuschner C (2007) Altitudinal change in LAI and standleaf biomass in tropical montane forests: a transect study in Ecuador anda pan-tropical meta-analysis. Ecosystems 10, 924–935. doi:10.1007/s10021-007-9063-6
Moser G, Leuschner C, Hertel D, Graefe S, Soethe N, Iost S (2011) Elevationeffects on the carbon budget of tropical mountain forests (S Ecuador): therole of the belowground compartment. Global Change Biology 17,2211–2226. doi:10.1111/j.1365-2486.2010.02367.x
Müller A, Leuschner C, Horna V, Zhang C (2012) Photosyntheticcharacteristics and growth performance of closely related aspen taxa:on the systematic relatedness of the Eurasian Populus tremula and theNorth American P. tremuloides. Flora 207, 87–95. doi:10.1016/j."ora.2011.11.001
Ostonen I, Püttsepp Ü, Biel C, Alberton O, BakkerMR, Lõhmus K,Majdi H,Metcalfe D, Olsthoorn A, Pronk A, Vanguelova E, Weih M, Brunner I(2007) Speci!c root length as an indicator of environmental change.PlantBiosystems 141, 426–442. doi:10.1080/11263500701626069
Peck JE (2010) ‘Multivariate analysis for community ecologists: step-by-stepusing PC-ORD’. (MjM Software Design: Gleneden Beach, OR)
Rada F, Azócar A, Briceno B, Gonzalez J, García-Núñez C (1996) Carbonand water balance in Polylepis sericea, a tropical treeline species. Trees:Structure and Function 10, 218–222.
Rada F, García-Núñez C, Ataroff M (2009) Leaf gas exchange in canopyspecies of a Venezuelan cloud forest. Biotropica 41, 659–664.doi:10.1111/j.1744-7429.2009.00537.x
Reich PB, Walters MB, Ellsworth DS, Vose JM, Volin JC, Gresham C,BowmanWD (1997) From tropics to tundra: global convergence in plant
Functional traits and climatic niches of Polylepis Functional Plant Biology 311

functioning. Proceedings of the National Academy of Sciences of theUnited States of America 94, 13 730–13 734.
Rundel PW, Gibson AC, Midgley GS, Wand SJE, Palma B, Kleier C,Lambrinos J (2003) Ecological and ecophysiological patterns in a pre-altiplano shrubland of the Andean Cordillera in northern Chile. PlantEcology 169, 179–193. doi:10.1023/A:1026075721045
Schlichting CD (1986) The evolution of phenotypic plasticity in plants.Annual Review of Ecology Evolution and Systematics 17, 667–693.doi:10.1146/annurev.es.17.110186.003315
Schmidt-Lebuhn A, Kessler M, Kumar M (2006) Promiscuity in the Andes:species relationships in Polylepis (Rosaceae, Sanguisorbeae) based onAFLP and morphology. Systematic Botany 31, 547–559. doi:10.1600/036364406778388629
Schmidt-Lebuhn AN, Fuchs J, Hertel D, Hirsch H, Toivonen J, Kessler M(2010) An Andean radiation: polyploidy in the tree genus Polylepis(Rosaceae, Sanguisorbeae). Plant Biology 12, 917–926. doi:10.1111/j.1438-8677.2009.00297.x
SimpsonBB(1986)SpeciationandspecializationofPolylepis in theAndes. In‘High altitude tropical biogeography’. (Eds F Vuillemier, MMonasterio)pp. 304–316. (Oxford University Press: New York)
Smouse PE, Long JC, Sokal RR (1986) Multiple regression and correlationextensions of the Mantel test of matrix correspondence. SystematicZoology 35, 627–632. doi:10.2307/2413122
Soria-Auza RW, Kessler M, Bach K, Barajas-Barbosa PM, Lehnert M,Herzog SK, Böhner J (2010) Impact of the quality of climate modelsfor modelling species occurrences in countries with poor climaticdocumentation: a case study from Bolivia. Ecological Modelling 221,1221–1229. doi:10.1016/j.ecolmodel.2010.01.004
Sultan SE (2000) Phenotypic plasticity for plant development, function andlife history.Trends inPlant Science5, 537–542. doi:10.1016/S1360-1385(00)01797-0
Sveinbjörnsson B (2000) North American and European treelines:external forces and internal processes controlling position. Ambio 29,388–395.
Sveinbjörnsson B, Nordell O, Kauhanen H (1992) Nutrient relations ofmountain birch growth at and below the elevational tree-line inSwedish Lapland.Functional Ecology 6, 213–220. doi:10.2307/2389757
Tanner EVJ, Vitousek PM, Cuevas E (1998) Experimental investigationof nutrient limitation of forest growth onwet tropical mountains.Ecology79, 10–22. doi:10.1890/0012-9658(1998)079[0010:EIONLO]2.0.CO;2
ter Braak CJF, Smilauer P (1998) ‘CANOCO release 4 reference manual anduser’s guide to Canoco forWindows – software for canonical communityordination.’ (Microcomputer Power: Ithaca, NY, USA)
Toivonen JM, Kessler M, Ruokolainen K, Hertel D (2011) Accessibilitypredicts structural variation of Andean Polylepis forest. Biodiversity andConservation 20, 1789–1802. doi:10.1007/s10531-011-0061-9
van de Weg MJ, Meir P, Grace J, Ramos GD (2009) Altitudinal variationin leaf mass per unit area, leaf tissue density and foliar nitrogen andphosphorus content along an Amazon–Andes gradient in Peru. PlantEcology & Diversity 2, 243–254. doi:10.1080/17550870903518045
Westoby M, Falster DS, Moles AT, Vesk PA, Wright IJ (2002) Plantecological strategies: some leading dimensions of variation betweenspecies. Annual Review of Ecology and Systematics 33, 125–159.doi:10.1146/annurev.ecolsys.33.010802.150452
Wieser G, Oberhuber W, Walder L, Spieler D, Gruber A (2010)Photosynthetic temperature adaptation of Pinus cembra within thetimberline ecotone of the Central Austrian Alps. Annals of ForestScience 67, 201. doi:10.1051/forest/2009094
Wittich B, Horna V, Homeier J, Leuschner C (2012) Altitudinal changein the photosynthetic capacity of tropical trees: a case study fromEcuador and a Pantropical literature analysis. Ecosystems 15, 958–973.doi:10.1007/s10021-012-9556-9
Wright IJ, Reich PB, Atkin OK, Lusk CH, Tjoelker MG, Westoby M (2006)Irradiance, temperature and rainfall in"uence leaf dark respirationin woody plants: evidence from comparisons across 20 sites. NewPhytologist 169, 309–319. doi:10.1111/j.1469-8137.2005.01590.x
Yamori W, Noguchi K, Terashima I (2005) Temperature acclimationof photosynthesis in spinach leaves: analyses of photosyntheticcomponents and temperature dependencies of photosynthetic partialreactions. Plant, Cell & Environment 28, 536–547. doi:10.1111/j.1365-3040.2004.01299.x
Zhang SB, Zhou ZK, Hu H, Xu K, Yan N, Li SY (2005) Photosyntheticperformances of Quercus pannosa vary with altitude in the HengduanMountains, southwest China. Forest Ecology and Management 212,291–301. doi:10.1016/j.foreco.2005.03.031
312 Functional Plant Biology J. M. Toivonen et al.
www.publish.csiro.au/journals/fpb
Copyright © 2022 FDOKUMEN