Internship Report On “UNDERSTANDING A LABOUR ...
91
Internship Report On “UNDERSTANDING A LABOUR COMPLIANCE OF COMPENSATION”AT APARAJITHA CORPORATE SERVICES Submitted to VISVESVARAYA TECHNOLOGICAL UNIVERSITY, BELGAUM In partial fulfillment of the requirements for the award of the degree of MASTER OF BUSINESS ADMINISTRATION BY MEENAKSHI.RM 1NZ13MBA22 Under the guidance of INTERNAL GUIDE EXTERNAL GUIDE DR.ARADHANA YADAV MR.HARINATHBHASKARA PROFESSOR HR MANAGER Department of Management Studies NEW HORIZON COLLEGE OF ENGINEERING OUTER RING ROAD, MARATHALLI, BANGALORE 2013-15
-
Upload
khangminh22 -
Category
Documents
-
view
2 -
download
0
Transcript of Internship Report On “UNDERSTANDING A LABOUR ...
Internship Report On
“UNDERSTANDING A LABOUR COMPLIANCE OF COMPENSATION”AT
APARAJITHA CORPORATE SERVICES
Submitted to
VISVESVARAYA TECHNOLOGICAL UNIVERSITY, BELGAUM
In partial fulfillment of the requirements for the award of the degree of
MASTER OF BUSINESS ADMINISTRATION
BY
MEENAKSHI.RM
1NZ13MBA22
Under the guidance of
INTERNAL GUIDE EXTERNAL GUIDE
DR.ARADHANA YADAV MR.HARINATHBHASKARA
PROFESSOR HR MANAGER
Department of Management Studies
NEW HORIZON COLLEGE OF ENGINEERING
OUTER RING ROAD, MARATHALLI, BANGALORE
2013-15


ACKNOWLEDGEMENT
I wish to place on record my deep sense of appreciation to all those who made this project
come into existence and guide me from the start to finish. I express my sincere gratitude to
the institution of New Horizon College of Engineering, Bangalore.
I would like to thank Dr. Manjunatha, principal of New Horizon College of Engineering,
Bangalore for giving me the opportunity to prove my caliber by submitting this project
report1.
I am grateful to Dr. Sheelan Misra, Head of Department of Management Studies, New
Horizon College of Engineering, Bangalore for her support in the formatting and
completion of this project.
I am indebted to my guide Dr.Aradhana Yadav for his support from the beginning till
completion of this study.
I extend my sincere gratitude to Mr. Harinath Bhaskara, HR Manager of Aparajitha
corporate services private(ltd), Koramangala, Bangalore for giving me the time and
information needed for making this assignment success.
MEENAKSHI RM

TABLE OF CONTENT
S.NO. PARTICULARS PAGE
NO.
EXECUTIVE SUMMARY
1 INTRODUCTION OF LABOUR COMPLIANCE
OBJECTIVE OF LABOUR COMPLIANCE
SCOPES OF LABOUR COMPLIANCE
NEED FOR STUDY
LIMITATIONS
REVIEW OF LITERATURE
RESEARCH METHODOLOGY
1
2 PROFILE OF APARAJITHA
ABOUT APARAJITHA
CLIENTS OF APARAJITHA
10
3 CONCEPTUAL FRAMEWORK ON LABOUR COMPLIANCE 18
4 DATA COLLECTION, ANALYSIS & INTERPRETATION 29
5 FINDING, SUGGESTIONS, CONCLUSION 75
6 BIBLIOGRAPHY 77
ANNEXURE

LIST OF TABLES
TABLE
NO.
PARTICULARS PAGE
NO.
4.1 Frequency Distribution of GENDER Of Respondent(S)
29
4.2 FREQUENCY DISTRIBUTION OF DESIGNATION 30
4.3 FREQUENCY DISTRIBUTION OF QUALIFICATION 31
4.4. FREQUENCY DISTRIBUTION OF INCOME CATEGORY 32
4.5. Frequency distribution of Family Level 33
4.6 Frequency Distribution of EMPLOYEE EPF
33
4.7 Frequency distribution contribution of emp ESI 34
4.8 Frequency distribution of Health awareness 34
4.9 Frequency distribution of Rate for facilities 35
4.10 Frequency distribution of Rate for maternity leave 36
4.11 Frequency distribution of Rate for allowances 37
4.12 Frequency distribution of Rate for loans 38
4.13 Frequency distribution of Rate for house keeping facilties 39
4.14 Frequency distribution of Rate for working conditions 40
4.15 Frequency distribution of Allowances benefits 41
4.16 Frequency distribution of Bonus Benefits 42
4.17 Frequency distribution of Medical insurance Benefits 43
4.18 Frequency distribution of Disability Benefits 44
4.19 Frequency distribution of Unsatisfactory Performance 45
4.20 RATE PREFORMANCE OVERALL SATISFACTION 46
4.21 Frequency distribution of LABOUR COMPLIANCE 47
5.1 Table showing cross table for income category and family level 48
5.1.2 Designation Of Employee Working 49
5.2 Rate quality of Offline Training * Training improves 49
5.3 Rate quality of Inplant training * Training improves 50
5.4 Rate quality of Workshop * Training improves 51
5.5 Rate quality of health awareness * Training improves 52
5.6 FAMILY LEVEL*^WORK ENVIRONMENT 53
5.7 support from empl to top mgmt * WORK ENVIRONMENT 56
5.8 Work environment* support from employers 57
5.9 support from emp to co-worker * WORK ENVIRONMENT 58
5.10 support from emp to low level employees * WORK
ENVIRONMENT
59
5.11 LABOUR COMPLIANCE * Rate for facilities
60
5.12 LABOUR COMPLIANCE * Rate for maternity leave
61
5.13 LABOUR COMPLIANCE * Rate for ALLOWANCES
62

5.14 LABOUR COMPLIANCE * Rate for loans 63
5.15 LABOUR COMPLIANCE * Rate for housing facilties
64
5.16 LABOUR COMPLIANCE * Rate for working conditions 65
5.17 OVERALL * support from empl to top mgmt 66
5.18 OVERALL * Support from emp to supervisor 67
5.19 OVERALL * support from emp to co-worker 68
5.20 OVERALL * support from emp to low level employees 69
5.21 Rate quality of Offline Training * Rate Performance 70
5.22 Rate quality of Inplant training * RATE PERFORMANCE 71
5.23 Rate quality of Workshop * RATE PERFORMANCE 72
5.24 Rate quality of health awareness * RATE PERFORMANCE 73
EXECUTIVE SUMMARY
The major objectives of the study is to properly understand the employee training at big
bazaar ,Bangalore.this training and development information Is collected by survey
method for analytical studystructural questionnaire was used to collect the data.
A basic limitation of the project is that they did not provide all the information related to
the organization.cooperation and coordination was different from each othershence few
information are uncertainities.due to certain above assumptions are taken to the study .the
time limit is considered as big constraint.
The data is collected from the primary source and the secondary source. The tools and
techniques of spss software is used in the project.stastistical tools such as chai
square,charts ,tables,anova table are used in the project.
HR compliance should be treated as a process of defining both individual and group
behaviors to ensure the organization’s applicable laws and policies are followed. The HR
function must hire and retain individuals that are knowledgeable about HR specific laws
and can create policies and procedures in relation to these laws. Just writing policies and
procedures and placing them in a repository is not enough. Once established, they must be
effectively communicated throughout the organization.

01
CHAPTER NO. 1
1.1 INTRODUCTION OF LABOUR COMPLIANCE
An Introduction: Globalisation in new economy has paved way for open business and
everything is measured and looked from the angle of global standard and best of best in the
form of world class. This has led to lot of quality systems in technology, supply chain,
banking, and finance and also in Human resource management. Talent can move anywhere
and people are also mobile. To have continuous flow of business in smooth way many
approvals, certifications and compliance have become need of the hour and these are
subject to various and continuous audits by internal and external agencies.
In few cases customer’s requirements have to be fulfilled in legal aspects particularly in
connection with employee related matters which are governed by various laws comprising
both central and state legislations. Keeping this in view management of labour law plays a
very important role.
1.2: What is compliance? When business is governed by certain regulations that too when
it is global in nature, ILO conventions are followed. With the conventions, various laws
like factories act, Minimum wage etc have to be followed into addition to all the applicable
laws depending on the nature of industry. Adherence to these laws and implementation is
becoming need of the business without which further progress will be blocked. Hence such
kind of law has to made known to all concerned and have to be followed. These are under
scrutiny. As such compliance (adhering and following) is gaining vast importance.
1.3: Why compliance: It has to be understood in multiple ways. First being compliant
with the laws of the land, regulatory affairs for approvals, social security and fair work,
fair treatment and right of association and expression. Further there should not be any

02
discrimination based on caste, creed, ethnic and sex. For everything parameters will be the
applicable laws. Without this business is not recognized nor accepted. In the absence of
compliance, there are chances of losing the business and in some case black listing the non
compliant establishments. Therefore compliance is becoming a priority.
1.4: Coverage: For compliance wider coverage like regulatory laws, payment laws, social
security laws, employment laws, Industrial relations laws, Compliance laws, law of
association - matters. Depending on the nature of the industries all these have to be
followed in action and spirit.
1.5: Applicability: Every employer or an occupier has to be aware of the applicability of
various laws for every establishment. Whether certain laws are applicable or not? If
applicable the minimum requirement of workers and to what extent. Under the
applicability what are to be followed and maintained to be known. In India most labour
laws are based on the number of employees in the establishment. Hence the applicability is
important.
1.6: Implementation: Once the coverage and applicability is known implementation
becomes very easy and mandatory. When the number reaches to certain levels, it will go
without saying. On an average in India normally for any establishment there are about 14
to 16 labour laws are applicable. They are;
Factories Act, Shops and Commercial establishment Act, Contract labour, Building and
construction workers act, plantation labour act, Interstate migrant workmen act, Mines act
etc.
Payment of wages, Minimum wages, Payment of Bonus, Payment of Gratuity, Provident
Fund, ESI, Maternity Benefit act, Employees Compensation Act, Labour Compliance
Fund act, Industrial Employment Standing orders Act, Industrial Disputes Act, Trade
Union Act, Equal Remuneration Act, Apprentice Act, National and Festival Holidays Act,
Sexual harassment prevention committee provisions etc.
Above list is not exhaustive. Employer has to look into many of these acts depending on
the nature and implement which is his prime responsibility.
1.7: Audit and Check: Once these are covered and applied and having implemented,
sustenance of these compliances is to be monitored. There are no holidays for these laws.

03
HR being a dynamic function in nature number and nature of compliance fluctuates.
Depending on these factors, implementation also matters. Hence it is the onus of the
employer to ensure that the implementation of law is in place as per the framework of laws
throughout the year. They are subject to inspections and scrutiny. Some authorities inspect
critically and some superficially. But it is the responsibility of the employer to be
compliant. Hence audit and checking play an important role from compliance point of
view.
Few governments have allowed for self certification by the employer. OHS, SHE audits
are inbuilt in complying laws like working hours, safety, health, Compliance, social
security etc. Regular self audit, internal audit should help the employer to upgrade the
compliance level from time to time thereby reaching to the competitive edge. For
hazardous industries audit by External agencies are mandatory to make it more objective
and effective.
1.8: Know the subject: From this perspective knowledge and awareness about the subject,
provisions of various applicable laws are important. Further superficial knowledge will not
be adequate. What we call substantial law is the need of the hour. It is like human body
where outside view will not determine the good health but internal system should be in
order to stay healthy. In the same manner labour laws also have to be understood. Bare
knowledge is not sufficient. All provisions and methods are to be adhered.
1.9: Reports: Based on this an employer has to generate various reports by way of MIS,
compliance reports etc to know the status and also understand the gaps and lapse if any.
Looking at reports he will understand the status for further needful. Some times reports by
experts in the field, regulatory authorities are important and help for improvements.
1.10: Inspections: Under all laws and particularly labour laws, we see chapters/sections
on Inspectors where their powers and duties are prescribed. Under the statutes they are
empowered to exercise certain powers and also by duties. It is the duty of the employer to
co operates and supports the inspector while inspecting. Employer has to provide all
necessary documents, information, particulars, records, registers etc to the authorities. ILO
convention also prescribes this.
Inspection to be taken seriously and many a time they are eye openers. These will put a
break for establishments also from bad/unfair practices. Hence inspections have to be

04
taken seriously and complied religiously and meticulously. It is always advisable to attend
correct and comply at the initial stages of the inspections to prevent any further damage
and serious observations. Inspecting authorities to be seen as well wishers rather than as
pain and nuisance. If they are convinced they extend their helping hands for employer.
However for them advise and inspection cannot go together.
1.11: Consequence: Non compliance may end up in legal actions like penalty, suspension
of license, imprisonment etc and other by way of bad corporate governance. Corporate to
be on the line, good governance to be ensured. Negative side may affect the reputation of
the company thereby it may not attract the required talent and human resource and subject
to question by many others concerned. Non compliance may lead to series of problems like
prosecutions, unionism, suspicions, etc. In the long run business may get affected.
Establishment has to spend their time and energy in litigations and wasting their valuable
productive time.
1.12: Benefits: Timely compliance ensures an employer to be upright, conscious, law
abiding, compliant and to carry on his business without any fear or favour and all the time
he will be on right track and achieve success and industrial peace. Timely compliance
ensures that employees do not have any reason to crib on non compliance issues and may
help to nurture good relations leading to good production and productivity. For
government and statutory authorities it becomes easy it will nurture peace contentment and
prosperity everywhere.
1.13: Competitive advantage: Thus by following applicable laws an establishment can
run business without much hurdles and stand up all the time. By this it will have a
competitive edge in future to gain good reputation and revenue by the certified authorities.
By being compliant an employer can gain benefits when it comes without wasting time as
fire fighting. Without proper governance and compliance at each and every level
establishment has to face problems and obstacles. Thus one can see more advantage in
compliance since they are integrated with all the stake holders of the industry.
1.14: Conclusion: To conclude non compliance will only put positions like occupier,
director into problems and they have to face the music of judiciary, cases, prosecutions,
imprisonment, fine, personal accountability etc and have to waste time and energy in
facing these issues. In the process relationship may also get affected with the authorities
and may be with employees and union.

05
Thus every prudent employer should always look at the positive side of compliance
thereby making all the stake holders happy and achieve the goals of the organization and
can concentrate on strategic issues as priority.
Establishment should also ensure the respective dues to the employees are paid on time
and the Compliance is taken care of in reasonable good manner. Added to this what an
amount of mental peace and respect from all the concerned!
1.15.OBJECTIVE OF LABOUR COMPLIANCE
1. To provide healthy, hygienic & safe working conditions.
2. To provide better life and health to the workers.
3. To make the workers happy and satisfied.
4. To keep the labours worry free.
5. To keep the workers comfortable.
6. To relieve workers from industrial fatigue and to improve intellectual, cultural and
material conditions of living of the workers.
7. To induce labours to give higher Productivity.
1.16.THE SCOPES OF LABOUR COMPLIANCE
To enrich better quality of wok life.
To improve the efficiency of work
To enhance the productivity.
To enrich industrial relation and industrial peace
To raise the physical standards of the workforce.
To enhance the purchasing and serving capacity of the employees.
To make employee work contribute systematically to the nation’s economy.
To reduce absenteeism.
Employee Compliance is having a wider scope and may have indifferent countries
depending upon the socio-economic conditions, political outlook and social philosophy.
1.17.NEED FOR STUDY
Management is the art of getting the work done by the people; therefore it is necessary to
seek the co-operation of the employee for a in order to increase the production and to

06
higher profits. The co-operation of employees is possible only when they are satisfied with
employees and the workers on the job.
Good Compliance and Welfare facilities measures enables the employees and his family to
a good Compliance facilities like housing medical and children education, recreation etc.,
helps to improve the conditions of the employees. Employee’s Compliance measures leads
to high morals and high productivity and help to raise the standards of the industry in the
county. I have selected this topic because it very challengeable topic to go through various
employees felling on depth about difficulties of employees and various activities in the
Compliance department.
1.18:LIMITATIONS:
Due to time constraints and busy schedules of the employees it was difficult to
interact with the company.
Some people were not interested to give answer of the question.
The response may be influenced by personnel bias.
Difficult to getting the data because of the confidentiality.
1.19:REVIEW OF LITERATURE:
A full review of employment law is not provided—for an excellent review, see
Jolls (2007). My more modest goal is to provide some relevant insights into what
law is and how it works. This sort of targeted inquiry is desirable because the
standard assumption in economics is that the law enforces contracts as written. In
practice, private law imposes no restrictions on behavior. It is mainly an
adjudication system that can, aftera careful review of the evidence, exact monetary
penalties upon parties who have breached a duty.
The modern theory of contract, building on the work of Grossman and Hart
(1986), recognizes that an important function of economic institutions and
contracts is the efficient allocation of authority and decision rights within a
relationship. Most economists agree that unions and employment law affect the
relative bargaining power of individuals. These institutions are usually interpreted
as mere re-distribution of rents, and so any allocation of bargaining power that
results in prices diverging from competitive levels is inherently inefficient.
The modern empirical literature is concerned with identifying a causal link
between various labor-market interventions and performance. Unfortunately,much
of the economic theory of contract is not amenable to this approach. These models
typically describe how matches with certain observable features (X variables)
07
result in an employment-compensation package (Y variables). As Holland (1986)
makes clear, these are not causal relationships, but merely associations.For
example, the predicted relation between the sex of a worker and the form of his/her
employment contract is not causal, since the sex of a worker is not a treatment
variable.
A contract is an instrument that explicitly allocates certain decision rights between
the contract parties. This can also be achieved with unions. This section discusses
how the appropriate allocation of power and decision rights can enhance
productive efficiency. Thus, these theories provide conditions under which union
power may enhance productive efficiency, as suggested by Freeman and Medoff
(1984).
Ostrom (2000), for example, has shown that many societies have developed
efficient systems of rules and adjudication for regulating the use of common-pool
resources, thereby avoiding the tragedy of the commons . Ostrom observes that all
successful commons-governance regimes consist of a set of rules that have the
following features:
1. The rules are commonly known;
2. There are penalties for breaking rules that increase in intensity with the
severity and frequency of
violation;
3. There is an organization or an individual who is responsible for imposing
penalties when informed;
and
4. There is a process of adjudication when there are disagreements regarding
whether an offense has occurred and what penalty should be imposed.
Jensen and Meckling (1976), for example, famously proposed that one
should conceptualize a firm as a “nexus of contracts.” If all contracts are
enforceable at negligible cost, a reward system that promotes an employee
for good performance and an agreement with an outside supplier to pay a
bonus for sufficient quality are assumed to be equally enforceable. If
employment contracts are enforceable at no cost, subject only to information
constraints, then explaining contract form requires only that one carefully
specify the environment and then use principal-agent theory to work out the
optimal contract.
In a widely cited work, Wood (1877) argued for replacing this law with the
rule of at-will employment, where both parties can sever the relationship
whenever they wish and face no liability beyond the requirement that the
employer pay her employee the agreed-upon wage for work already
completed. Wood’s argument was a pragmatic one, based on the bad
experiences of many employers and employees with the inflexibility of
master-servant law.
Minimum wages are controversial, in some ways reflecting Freeman‘s
(1993) ―institutionalist-distortionist‖ divide. The institutionalist perspective
08
provides the rationale for minimum wage policies—to counter exploitation
by providing all workers with a ―fair‖ wage and, more generally, as an anti-
poverty policy. This view sees minimum wages both in a rights-based
framework (the right to a decent wage) and as a social policy.12 The
distortionist perspective—widely accepted by economists—raises concerns
about the unintended consequences of minimum wages.
Research done up to the 1980s was primarily based on U.S. times-series data
and typically found negative employment impacts. In a comprehensive
review of the analysis up to that time, Brown, Gilroy, and Kohen (1983)
estimated that the elasticity of teenage employment with respect to the
minimum wage was in the -0.1 to -0.3 range (i.e., a 10% increase in the
minimum wage reduced teenage employment by 1-3%).
1.20RESEARCH METHODOLOGY
INTRODUCTION & MEANING OF RESEARCH
1.20.1.MEANING OF RESEARCH:
Research in common parlance refers to a search for knowledge. Once can also define
research as a scientific systematic search for pertinent information on a specific topic. In
fact, research is an art of scientific investigation. The Advanced Learner’s Dictionary of
Current English lays down the meaning of research as “a careful investigation or inquiry
especially through search for new facts in any branch of knowledge.” Some people
consider research as a movement, a movement from the known to the unknown. It is
actually a voyage of discovery. We all possess the vital instinct of inquisitiveness for when
the unknown confronts us, we wonder and our inquisitiveness makes us probe and attain
full and fuller understanding of the unknown. This inquisitiveness is the mother of all
knowledge and the method, which man employs for obtaining the knowledge of whatever
the unknown, can be termed as research.
1.20..2.TITLE OF THE PROJECT:-
“UNDERSTANDING A LABOUR COMPLIANCE OF COMPENSATION”
1.20.3.OBJECTIVE OF THE PROJECT :-
Some of the main objectives are as follows-
1. To study the employees perception towards the welfare facilities provided by the
company.

09
2. To study the welfare facilities provided by the organization.
3. To study the welfare facilities recommended by the government.
4. To give some suggestions to the company about welfare facilities of company.
5. To boost up employees moral.
1.20.4.DATA COLLECTION:-
To achieve the objective of the data for the present study was collected as under.
a) Primary Data :-
The primary data collection was done with the help of survey. A questionnaire regarding
labour welfare amenities was designed and administrated. All the information was
collected with help of face to face interview with workers.
b) Secondary Data :-
The secondary data collection was possible with the help of official records, the past
project report and the general information collected with the help of Company website
and other online sites.
1.20.5.SAMPLING PLAN :
SAMPLE SIZE SELECTION:
Sample size is determined on the population of company As well as it is also dependent on
nature of population, Nature of classes proposed, Nature of study, and type of sampling.
The sample size of the project is about 100 workers.
1.20.6.METHOD OF SAMPLING:
Probability sampling method is used for the study, as it is also known as” simple random
sampling” under this sampling design, every item of the universe has an equal channel of
inclusion in the sample. Random sampling from a finite population refers to that method of
sample selection which gives each possible sample combination an equal probability of
being picked up and each item in the entire population to have an equal chance of being
included in the sample.

010
CHAPTER NO. 2
PROFILE OF APARAJITHA
2.1.ABOUT APARAJITHA: Aparajitha is a leading HR Compliance Services company
focusing on Labour Compliance Audit, Establishment Compliance, Factory Compliance,
Mines Compliance, Contract Labour Compliance, Flexi Staffing, Payroll Processing,
Payroll Compliance as well as providing Consultation & Legal Opinion. We have a
presence in all the states and union territories of India and are recognized as the experts in
labour and compliance laws and their complexities. Our large list of clientele ranges from
start-ups to reputed large companies across all industries and segments.
Aparajitha started out in the year 2000 with a humble beginning of just 11 people. We
began by providing flexi staffing services for clients in Tamil Nadu. Within a matter of 12
years, we have grown and transformed into a renowned HR compliance services provider
with more than 1000 + core employees, and serving over 400+ clients all over India.
Our operations and services are guided by professionalism and principles that stem from
our core values and business ethics: integrity, trust, continuous learning and partnering
progress. Our goal is to build enduring long term relationships with our clients by
partnering with them for mutual growth and benefit.
Mr. Bharath Krishna Sankar is the Chairman of Aparajitha Corporate Services Ltd,
headquartered at Madurai: which is into HR and Compliances related KPO services. Mr.
Bharath is an exceptional coach and mentor, with passion for developing and nourishing
the entrepreneurial spirit in youngsters. Started about fourteen years back, Aparajitha
group has grown from just 10 people and a turnover of about 20 lakhs to a group of 1000
people with a turnover of over 270 crores for year ending March 2014. Aparajitha is the
only organised company in India to take up ‘personnel related compliances management
services’ and ‘contract labour regulation services’. The operations are spread all over India
with operations covering about 1200 locations, resident representatives in all the 30 States
and 24 branch offices across India.
Aparajitha Foundations, a trust promoted by the group, has started ‘Thalir thiran thittam’
with a vision of creating a transformational change through awareness at the school level
by giving school students an exposure to skills which are extremely important in life, but

011
not covered by the regular curriculum. The Tamil Nadu Government has issued an order
for this project to be taken to 4239 schools across the state. The Gujarat government has
entered into an MoU to reach it to 6231 schools.
Bharath’s areas of specialization include human resource development, financial
management and facilitation of change management through organizational development
interventions.
He is the Past Chairman of the Madurai Zone of CII and the Vice Chairman of
MaaMadurai Potruvom Committee. He was a finalist of the Emerging Entrepreneur Award
of CII, Tamil Nadu in 2010. He pens a column ‘Smilingly yours’ in The Hindu –
Metroplus.
Mr. Nagaraj Krishnan is the Managing Director of Aparajitha Corporate Services
Limited. He is a born leader, versatile with a blend of logical thinking, process orientation
and people focus and intrinsically driven to achieve and that instinct is what has made this
phenomenal growth of Aparajitha possible. He took lead of the business operations and
product development of Aparajitha Corporate Services right from its inception. His
expertise in Labour Laws in addition to his personality is the reason for Aparajitha’s
reputation as the Leading HR Compliances Knowledge Processing Outsourcing Company.
Aparajitha Corporate Services offers HR Compliances and Industrial Licensing Services
and its service includes Establishment Compliances, Factory Compliances, Mines
Compliances, Contractactor Compliances, Payroll Compliances, Flexi Staffing and Payroll
Services. Aparajitha has grown from 14 to 1000 plus core employees, one room office to
37 offices across the country, turnover of a few lakhs to over 250 Crores in 14 years.
Aparajitha has national presence in all the States and Union Territories of India, with over
400 plus distinguished clients, many of them from the Fortune List in India. To have
started, led and grown the company from a tier two city to become an Industry Leader with
national presence is Mr. Nagaraj’s pride and phenomenal achievement.
Dinesh Ramachandran is the Joint Managing Director of T V Sundram Iyengar &
Sons Limited and Managing Director of TVS Logistics Services Limited. He is also
the Director for various joint ventures / subsidiaries of these companies. A commerce
graduate and an Associate member of both Institute of Chartered Accountants of India and
Institute of Cost and Works Accountants of India, Dinesh has had a wide experience

012
within the Group and as is the tradition in the family, worked his way up in the
organization ladder.
Currently, the companies under his management have a turnover of USD 1.40 billion (INR
6,100 crores) and employs around 10,000 people. Dinesh has been instrumental for the
companies expanding their operations globally and he has set up subsidiaries in Sri Lanka,
United Kingdom, Spain, Germany, Thailand, Bangladesh and United States of America.
T V Sundram Iyengar & Sons Limited is the parent company of TVS Group. The total
turnover of the Group is USD 6.0 Billion and the group employs around 40,000 people.
The group operates in diverse fields ranging from two-wheeler and automotive component
manufacturing to automotive dealerships, finance & electronics and is the leading
automobile distributor in India.

013
2.2.CLIENTELE

014

015
016

017

018
CHAPTER NO 3
CONCEPTUAL FRAMEWORK ON LABOUR COMPLIANCE
3.1.MEANING AND DEFINITIONS OF LABOUR WELFARE
Labour Welfare has been defined in varies ways. Though unfortunately no single
definition has been found universal acceptance .The oxford dictionary defined labour
welfare as “Efforts to make life worth living for workers”.
Prof. Richardson defined labour welfare as arrangement of working conditions ,
organization of social and sport clubs and establishment of funds which contributes to the
workers health and safety components and efficiency , economic ,security ,education and
recreation.
Prof. S .D . Pinker has been defined as “Labor Welfare is also understood mean such
services facilities and amenities which may be established in industries to enable person
employed there in to perform their work in healthy and congenial surrounding and to
promote them with amenities to conduct good health and good moral.”
A significant definition describes labour Welfare works as “the voluntary efforts of the
employer to improve living and working condition of these employees. The underlying
assumptions of course, being that the first essential to the welfare of the employees, on
steady work a fair wage ,responsible house of labour.
Labor welfare has been defined in several ways and therefore understood various ways in
various countries.
Then welfare work can be defined on work for improving the health safety generator well
being and the industrial efficiency of the workers beyond the minimum standards laid
down by the factory act and the another legislations. The whole fields of welfare is one
which must can be done to combat the sense of frustration of the industrial workers to
relieve of personal and family worries to improve his health to make him offered means of
self expression to after him. Same spears in which can be excel all other help him winder
connection of life.

019
Today in competitive market , everyone aims to profit human beings are the most
important factors of production in order to facilitated the satisfaction of human being these
welfare measures are very important.
3.2.IMPORTANCE OF WELFARE WORK IN INDIA
Labour welfare work got importance because of the following reasons.
1) The welfare activities influence the sentiments of the workers .when worker feels
that the employers and the state are interested in their happiness ,his tendency to
grouse and grumble will steadily disappear. The development of such feeling paves
the way for industrial peace.
2) The provision of various welfare measures makes the worker realize that they also
some stake in the undertaking in which they are engaged and so think thrice before
taking any reckless action which might prejudice the interest of undertaking
3) The welfare measures like cheap food in canteens, free medical and educational
facilities etc. Indirectly increase industrial dispute the real income of the workers.
Hence they try to avoid industrial dispute, as far as possible and do not go on strikes
on flimsy grounds.
4) Welfare activities will go a long way to better the mental and moral health of
workers by reducing the incidence of vices of industrialization.
5) Welfare activities will reduce labour turnover and absenteeism and create permanent
settled labour force by making service attractive to the labour.
6) Welfare measures will improve the physique , intelligence morality and standard of
living of the workers which in turn will improve their efficiency and productive
3.3.CLASSIFICATION OF LABOUR ACTIVITIES:

020
The labour Welfare activities may be classified as under:
1) statutory:
Every welfare promotes the welfare the labour by securing and protecting a social order in
which justice, social, economical, political, confirms with all the institutions of the natural
life. For this some legislation are passed and it is essential for all the employers to follow
the provisions of the Acts and Rules. These legislative measures generally regulate
working conditions, minimum wages, safety and sanitation. Such statutory provisions are
gradually increasing with the industrial development in the countries.
2) voluntary:
Under voluntary welfare, all those activities are including which are undertaken by the
employees for their workers at their own. These activities are not statutory but the
employees undertake these activities because they increase the efficiency of the workers
and maintain the industrial peace.
3) Mutual :
Mutual welfare activities are those activities which are initiated by the workers for their
betterment .Welfare activities undertaken by the trade unions are included under this head.
Labour welfare activities may be further classified under two heads:
1) Intra Mural Activities :
Intra mural activities are those amenities and services which have been provided by the
employers inside the factories e.g. sanitary conditions ,medical facilities ,shelter ,canteens
etc. These activities are the part of working conditions.
2) Extra Mural Activities :
Extra mural activities are those amenities and services which are available in the workers
outside the factory e.g. housing, medical facilities, education, recreation etc.
3.4.EMPLOYEE WELFARE:
The company is striving to employee welfare and it provides the following to its
employees.
021
Two pairs of uniform, one pair of safety shoes and safety caps are providing to all
the employees.
Dinner for the employees with their facilities and a cultural programmed on every
31st December.
Dinner for the employees with their families and a cultural programmed on every
1st January.
Celebrates Independence Day and republic day.
Provides family planning camp within the plant premises, every year.
Provided AIDS awareness classes to the employees by the District Medical &
Health Department.
Provided the Art of Living classes to the employees within the plant premises.
Provided the SSY classes to the employees within the plant premises
All the statutory obligations of the employees like P.F., L.I.C.etc. Within the work
schedule.
Provides different loans to the employees to meet their financial requirements.
The company maintained temples of Sri Venkateswara Swami, Anjaneya Swami
and Vinayak Temples located at Township.
3.5.THESE LAWS ARE:
The factories Act 1948: the mines Act 1952: the plantation employee Act 1951: the central
employees (regulation & abolition) Act 1970: these Act provides for facilities such as
canteen crèches shelters rest rooms , lunch rooms , washing facilities etc.
They also regulate the age of employment, hours of work and more provisions for the
appointment of employees welfare officers sickness, Maternity and medical benefits are
provided under the employee state Insurance Act 1948 and also the government has
chalked out comprehensive Programmers for housing facilities, social security schemes
provident funds and such other facilities & seize able has been allotted in each five years
for employee welfare activities.
3.6.ACCORDING TO THE FACTORIES ACT 1948:
The welfare facilities provided under this act are as follows:
1. Adequately suitable and clean washing facilities separately for male and female
workers.
022
2. Facilities for storing and drying clothes.
3. Setting facilities for occasional rest for workers who are obliged to work in a
standing
4. position.
5. First aid boxes one for every 150 workers and ambulance facilities if there are
more than 500 workers.
6. Canteens if more than 250 workers are employees.
7. Shelters rest rooms and lunch rooms if there are more than 150 workers.
8. Creche if more than 30 women are employees.
9. Welfare officer wherever more than 500 workers are employees.
The oxford dictionary refers employee welfare as “efforts to man life worth living for
women”. The committee on employee welfare (1969) has defined employee welfare as
“such services facilities and amenities as adequate canteen rest recreation facilities and
sanitary and medical facilities arrangements for travel to and from work for the
accommodation of workers employed at a distance from their homes and such other
services amenities and facilities including social security measures as contribute to
improve the conditions under which workers are employee.
33..77..LLAABBOOUURR AACCTT IINN IINNDDAA
CONTRACT LABOUR/REGULATION & ABOLITION ACT 1970
MINIMUM WAGES ACT,1948
PROVISION OF CONTRACT LABOUR (REGULATION & ABOLITION)
ACT, 1970)
EMPLOYEE PROVIDENT FUNDS AND MISC. PROVISIONS ACT, 1952
EQUAL REMUNERATION ACT,1976
INDUSTRIAL DISPUTE ACT, 1947
PAYMENT OF BONUS ACT, 1965
PAYMENT OF GRATUITY ACT, 1972
EMPLOYEE’S STATE INSURANCE ACT & THE SCHEME, 1948
MATERNITY BENEFIT ACT, 1961
WORKMEN’S COMPENSATION ACT,1923
CHILD LABOUR(PROHIBITION AND REGULATION) ACT, 1986

023
THE APPRENTICES ACT, 1961
33..88..RREEQQUUIIRREEMMEENNTTSS UUNNDDEERR DDIIFFFFEERREENNTT LLAABBOOUURR LLAAWWSS
3.8.1.Contract Labour / Regulation & Abolition Act 1970:
Each establishment employing twenty or more workmen as contract labour is required to
be registered under the contract Labour / Regulation & Abolition Act 1970 by making
an application in triplicate in form I (appended to the Rules) alongwith Registration fee
through Draft and obtain a certificate of Registration and shall maintain a register of
contractors in form XII appended to rules. If there is any change in the particulars given
in the certificate of Registration, the Principal Employer, within 30 days of such change,
intimate to the Registration officer particulars of such change.
Principal Employer of the registered establishment is required to display at a prominent
place in the establishment , notices showing the rates of wages , hours of work , wage
periods , date of payment of wages , names and addresses of Inspectors and date of
payment of unpaid wages in English and in Hindi and in the local language understood by
majority of workers. Every Principal Employer, within fifteen days of the commencement
/ completion of each contract work under each contractor, shall submit a return to the
inspector in form VI-B ( appended to the rules ).
(B) Obligations on contractors:
A person undertaking to produce a given result for the establishment through contract
labour or who supplies contract labour for any work of the establishment numbering
twenty or more is required to comply with following requirements under the Act as
contractor.
No contractor shall undertake or execute any work through contract labour except under
and in accordance with a license issued by licensing Officer for the area. Application for
license shall be in triplicate in form IV appended to rules accompanied by form V issued
by Principal Employer and security as also license fee through separate demand drafts.
The contractor is required to provide sufficient supply of drinking water, a sufficient
number of latrines and urinals, washing facilities & first aid facilities to contract labour at
work place.
The contractor shall maintain following registers in the prescribed formats under the Act:

024
Register of persons employed.
Muster Roll.
Register of wages.
Register of deductions for damages or loss.
Register of fines.
Register of Advances and
Register of overtime.
Where wage period is week or more contractor shall issue wages slips in prescribed
proforma.
Every contractor shall issue employment card in prescribed proforma to each worker
within three days of employment and on termination of employment issue a service
certificate in the prescribed format.
3.8.2.Minimum Wages Act 1948/ Minimum Wages (Central)Rules 1950.
The Act provides for fixation of minimum rates of Wages in certain employment and make
rules for implementation of the provisions of the Act.
Wages may be fixed by hour, day or month. A normal working day is defined as 9 hours
for an adult and 4 ½ hours for a child and spread over including rest intervals shall not be
more than 12 hours on any day. Worker working for more than 9 hours a day or 48 hours a
week shall be entitled for overtime wages at the rate of double the ordinary rate of wages
in respect of overtime working.
Employer shall display at the main entrance to the establishment and its office notices in
prescribes form (formIX-A under the Act) containing minimum rates of wages, working
hours, weekly rest, wages period, date of payment and name and address of Inspector in
English or and in language understood by majority of workers. An extract of Act/Rules
shall also be displayed.
Every Employer shall maintain the following registers/records in prescribed proforma at
work spot:
1. Register of wages (form X under the Rules)
2. Muster Roll (Form V)
3. Overtime Register (Form IX)

025
4. Register the fines (Form I)
5. Register of deductions for damage or loss (Form II)
Every employer shall issue wage slip (in Form XI) to every worker at least a day prior to
the disbursement of wages.
The above registers/records are required to be preserved for 3 years from the date of last
entry therein.
Every employer is required to sent annually a return (form III ) to reach the Inspector not
later than 1st February following the end of the year to which it relates.
3.9.ESI.Act 1948
Act applies to establishment where 20 or more persons are employed or were employed
on any day preceding twelve months.
Each establishment to be registered with ESIC
All employees of shops & establishments in receipt of wages up to 15000/- pm are
to be insured.
Principal Employer to pay contributions in respect of each employee whether
employed directly or through a contractor, employees contributions in the first
instance and recovers the amount of contribution from employee or immediate
employer.
3.10.Employees Provident Fund and ( Misc. Provisions ) Act 1952
The Act applies to establishments employing 20 or more persons.
Every employee employed in or in connection with the work of an establishment
shall be a subscriber to the fund.
The employer shall in the first instance, pay every month both the contributions
payable by him and also on behalf of employees employed by him directly or by or
through contractor.
3.11.Equal Remuneration Act 1976
The Act has been made applicable to different establishments including
communication, construction, storage and warehouses and is applicable to all
Groups of Aparajitha Industries.

026
Act provides that there would not be any discrimation in remuneration in any
employment on the basis of sex, for performing the same work or work of similar
nature.
No employer shall discriminate between male and female in making recruitment
for same work except where employment of women is restricted or prohibited by
law.
Each employer shall maintain register and other documents in relation to workers
employed (Form ‘D’ under the rules)
3.12.Payment of Bonus Act 1965
1. This Act applies to every establishment in which twenty or more persons are
employed on any day during the accounting year.
2. All employees drawing wages or salary not exceeding Ten thousand and five
hundred are covered under the Act.
3. Employer is required to pay statutory minimum of
a. 8.33% of the wages earned or rupees one hundred & fifty whichever is
higher whether or not the employer has any allocable surplus in the
Accounting Year.
b. Maximum rate of bonus payable to an employee in respect of any
accounting year, if allocable surplus exceeds the amount of minimum
bonus can be 20% of salary or wages earned during that accounting year.
4. Every employer is required to maintain following registers:
Register showing computation of allocable surplus (Form ‘A’ under the
rules )
Register showing set on and set off of the allocable surplus ( Form ‘B’ )
Register showing details of the amount of bonus due to each employee ( Form
‘C’ )
Annual Return in prescribed form (Form ‘D’) is required to be submitted within
30 days after statutory time limit of six months from close of accounting year.
3.13.Payment of Gratuity Act 1972
Each shop or establishment in which ten or more employees are employed or were
employed on any day of preceding 12 months are required to pay Gratuity to

027
employees on the termination of his employment after he has rendered continuous
service for not less than five years
on his superannuation, or
on his retirement or resignation; or
on his death or disablement due to accident or disease.
3.14.CHECKPOINTS FOR LABOUR COMPLIANCES
INDEMNITY BOND- This is not the legal binding. Just for the benefit of the company,
it is taken from each contractor against each contract.
INSURANCE POLICY- Company asks contractor to take insurance policy under
Workmen’s Compensation Act, 1923.
LABOUR LICENCE- Contractor, who engages 20 or more workers, is required to
obtain labour license from office of Asst. Labour Commissioner.
AFFIDAVIT- Any contractor is required to give an affidavit if he engages less than 20
workers for a works assigned to him.
PF CODE NO.- It is the policy of the company o assign the work to those contractors
who have their own PF Code No.
PF CHALLAN- It is a monthly return, where employer contributes 12%+1.61% & 12%
is also contributed by the employee.8.33% of employer contribution is submitted in
Family Pension Scheme and rest is submitted in Provident Fund Scheme.
PF Returns,FORM 5- It is the detail of all the employees who become members of
Employee Provident Fund and Employee Pension Scheme.
PF Returns,FORM 10- It contains the detail of all the employees who have left the
services during the month.
PF Returns,FORM 12A- It is the reconciliation statement of PF dues deposited for the
month.
SUMMARY OF THE WAGES PAID & PF – Any contractor or employer , who
employs contract labour in more than one establishment ,has to maintain the details of
the wages paid and their provident funds deposited at each site and is to be submitted in
summary.
028
ATTENDANCE SHEET- Attendance of all the contract labours is recorded in it.
WAGES SHEET- In this document, detail of the wages paid to the contract labour,
according to his attendance, is recorded.
LATEST INSPECTION REPORT- This is the inspection report conducted by
inspectorate, may be PF inspector, ESI inspector, etc.
PF ANNUAL RETURN, FORM 3A 6A & 12A- In this document, the amount of PF
submitted with the details of wages paid and PF deducted in the whole year is recorded.
PF SLIP COVERING LETTER- It is given to contract labour or employee concern as
and when year is completed, details of PF deducted and interest earned are mentioned
there and copy is given to each worker.

029
CHAPTER IV
DATA ANALYSIS
4.1.Frequency Distribution of GENDER Of Respondent(S)
Gender Frequenc
y
Percent Cumulative
Percent
Male 84 53.8 53.8
Female 72 46.2 100.0
Total 156 100.0
Table of Age Distribution explores the combination of employees participated in
the study. In general the group of employees would be in certain ratios. As the nature of
the job requires lot of time to be spent with the clients, participation of Male is more
required. Hence the ratio from Male group is more while compared with Female.
The study supports the equal participation of Male And Female Employees with
slight difference(s). The same is displayed by chart as follows.
84
72
66
68
70
72
74
76
78
80
82
84
86
Male Female
No
Od
Resp
on
den
ts(S
)
Graph 4.1 - Gender Classification Of Respondents
Gender

030
4.2.FREQUENCY DISTRIBUTION OF DESIGNATION
Frequenc
y
Percent Cumulative
Percent
Valid
Operation
Manager 33 21.2 21.2
HR Personnal 41 26.3 47.4
Executive 50 32.1 79.5
Project Leader 32 20.5 100.0
Total 156 100.0
Table of Designation Distribution explores the combination of employees
participated in the study. In general the group of employees would be in certain ratios. As
the nature of the job requires lot of time to be spent with the clients, participation of
Executive is more required. Hence the ratio from Executive group is more while compared
to others designation.
The study supports the equal designation with slight difference(s). The same is
displayed by chart as follows.
FREQUENCY DISTRIBUTION OF DESIGNATION
Valid Operation Manager
Valid HR Personnal
Valid Executive
Valid Project Leader

031
4.3.FREQUENCY DISTRIBUTION OF QUALIFICATION
Frequenc
y
Percent Valid
Percent
Cumulative
Percent
Valid
M S W 32 20.5 20.5 20.5
LLB 35 22.4 22.4 42.9
MBA 28 17.9 17.9 60.9
PGDB
A 28 17.9 17.9 78.8
B Com 33 21.2 21.2 100.0
Total 156 100.0 100.0
Table of Qualification Distribution explores the combination of employees
participated in the study. In general the group of employees would be in certain ratios. As
the nature of the job requires lot of time to be spent with the clients, participation of LLB
is more required. Hence the ratio from LLB Qualification is more while compared to
others qualification. The same is displayed by chart as follows.
0
20
40
60
80
100
120
M S W LLB MBA PGDBA B Com
Valid
FREQUENCY DISTRIBUTION OF QUALIFICATION Frequency
FREQUENCY DISTRIBUTION OF QUALIFICATION Percent
FREQUENCY DISTRIBUTION OF QUALIFICATION Valid Percent

032
4.4.FREQUENCY DISTRIBUTION OF INCOME CATEGORY
Frequenc
y
Percent Valid
Percent
Cumulative
Percent
Valid
5000-10000 30 19.2 19.2 19.2
10000-20000 28 17.9 17.9 37.2
20000-30000 23 14.7 14.7 51.9
30000-40000 30 19.2 19.2 71.2
40000-50000 27 17.3 17.3 88.5
>50000 18 11.5 11.5 100.0
Total 156 100.0 100.0
Table of Income category Distribution explores the combination of employees
participated in the study. In general the group of employees would be in certain ratios.
30000 to 40000 is a majority. Hence the ratio from 30000 to 40000 is more while
compared to others income. The same is displayed by chart as follows.
FREQUENCY DISTRIBUTION OF INCOME CATEGORY
Valid 5000-10000
Valid 10000-20000
Valid 20000-30000
Valid 30000-40000
Valid 40000-50000
Valid >50000

033
4.5. Frequency distribution of Family Level
Frequenc
y
Percent Valid
Percent
Cumulative
Percent
Valid
Poor 28 17.9 17.9 17.9
Low income category 27 17.3 17.3 35.3
Middle income
category 29 18.6 18.6 53.8
High income category 28 17.9 17.9 71.8
Rich 44 28.2 28.2 100.0
Total 156 100.0 100.0
4.6.Frequency Distribution of EMPLOYEE EPF
Frequenc
y
Percent Valid
Percent
Cumulative
Percent
Valid
Yes 79 50.6 50.6 50.6
No 77 49.4 49.4 100.0
Total 156 100.0 100.0

034
4.7.Frequency distribution contribution of emp ESI
Frequenc
y
Percent Valid
Percent
Cumulative
Percent
Valid
Yes 72 46.2 46.2 46.2
No 84 53.8 53.8 100.0
Total 156 100.0 100.0
4.8.Frequency distribution of Health awareness
Frequenc
y
Percent Valid
Percent
Cumulative
Percent
Valid
1 26 16.7 16.7 16.7
2 30 19.2 19.2 35.9
3 28 17.9 17.9 53.8
4 28 17.9 17.9 71.8
5 21 13.5 13.5 85.3
6 23 14.7 14.7 100.0
Total 156 100.0 100.0
035
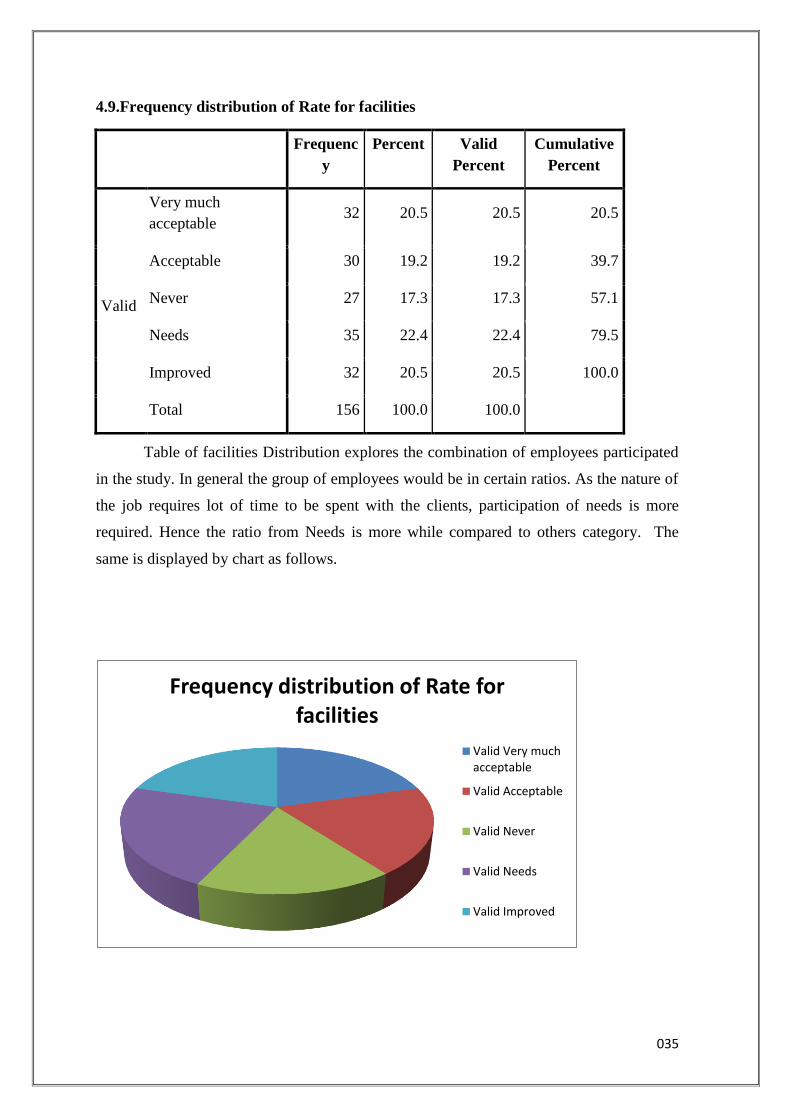
4.9.Frequency distribution of Rate for facilities
Frequenc
y
Percent Valid
Percent
Cumulative
Percent
Valid
Very much
acceptable 32 20.5 20.5 20.5
Acceptable 30 19.2 19.2 39.7
Never 27 17.3 17.3 57.1
Needs 35 22.4 22.4 79.5
Improved 32 20.5 20.5 100.0
Total 156 100.0 100.0
Table of facilities Distribution explores the combination of employees participated
in the study. In general the group of employees would be in certain ratios. As the nature of
the job requires lot of time to be spent with the clients, participation of needs is more
required. Hence the ratio from Needs is more while compared to others category. The
same is displayed by chart as follows.
Frequency distribution of Rate for facilities
Valid Very much acceptable
Valid Acceptable
Valid Never
Valid Needs
Valid Improved

036
4.10. Frequency distribution of Rate for maternity leave
Frequenc
y
Percent Valid
Percent
Cumulative
Percent
Valid
Very much
acceptable 33 21.2 21.2 21.2
Acceptable 29 18.6 18.6 39.7
Never 28 17.9 17.9 57.7
Needs 33 21.2 21.2 78.8
Improved 33 21.2 21.2 100.0
Total 156 100.0 100.0
Table of Maternity leave Distribution explores the combination of employees
participated in the study. As the nature of the job requires lot of time to be spent with the
clients, participation of acceptable is less. Hence the ratio from acceptable is less while
compared to others category. The same is displayed by chart as follows.
0
10
20
30
40
50
60
70
80
90
100
Ver
y m
uch
acc
epta
ble
Acc
epta
ble
Nev
er
Nee
ds
Imp
rove
d
Valid
Frequency distribution of Rate for maternity leave Frequency
Frequency distribution of Rate for maternity leave Percent
Frequency distribution of Rate for maternity leave Valid Percent
Frequency distribution of Rate for maternity leave Cumulative Percent

037
4.11.Frequency distribution of Rate for allowances
\ Frequenc
y
Percent Valid
Percent
Cumulative
Percent
Valid
Very much
acceptable 32 20.5 20.5 20.5
Acceptable 36 23.1 23.1 43.6
Never 35 22.4 22.4 66.0
Needs 28 17.9 17.9 84.0
Improved 25 16.0 16.0 100.0
Total 156 100.0 100.0
Table of allowances Distribution explores the combination of employees
participated in the study. In general the group of employees would be in certain ratios. As
the nature of the job requires lot of time to be spent with the clients, participation of
acceptable is more. Hence the ratio from acceptable is more while compared to others
category. The same is displayed by chart as follows.
Frequency distribution of Rate for allowances Frequency
Valid Very much acceptable
Valid Acceptable
Valid Never
Valid Needs
Valid Improved

038
4.12.Frequency distribution of Rate for loans
Frequenc
y
Percent Valid
Percent
Cumulative
Percent
Valid
Very much
acceptable 21 13.5 13.5 13.5
Acceptable 33 21.2 21.2 34.6
Never 39 25.0 25.0 59.6
Needs 34 21.8 21.8 81.4
Improved 29 18.6 18.6 100.0
Total 156 100.0 100.0
Table of loans Distribution explores the combination of employees participated in
the study. In general the group of employees would be in certain ratios. As the nature of
the job requires lot of time to be spent with the clients, participation of never is more.
Hence the ratio from never is more while compared to others category. The same is
displayed by chart as follows.
Frequency distribution of Rate for loans
Valid Very much acceptable
Valid Acceptable
Valid Never
Valid Needs
Valid Improved

039
4.13.Frequency distribution of Rate for house keeping facilties
Frequen
cy
Percen
t
Valid
Percent
Cumulativ
e Percent
Vali
d
Very much
acceptable 37 23.7 23.7 23.7
Acceptable 26 16.7 16.7 40.4
Never 31 19.9 19.9 60.3
Needs 45 28.8 28.8 89.1
Improved 17 10.9 10.9 100.0
Total 156 100.0 100.0
Table of House keeping facilities Distribution explores the combination of
employees participated in the study. In general the group of employees would be in certain
ratios. As the nature of the job requires lot of time to be spent with the clients, participation
of needs is more. Hence the ratio from needs is more while compared to others category.
The same is displayed by chart as follows.
0
10
20
30
40
50
60
70
80
90
100
Ver
y m
uch
acc
epta
ble
Acc
epta
ble
Nev
er
Nee
ds
Imp
rove
d
Valid
Frequency distribution of Rate for housing facilties Frequency
Frequency distribution of Rate for housing facilties Percent
Frequency distribution of Rate for housing facilties Valid Percent
Frequency distribution of Rate for housing facilties Cumulative Percent

040
4.14.Frequency distribution of Rate for working conditions
Frequenc
y
Percent Valid
Percent
Cumulative
Percent
Valid
Very much
acceptable 32 20.5 20.5 20.5
Acceptable 24 15.4 15.4 35.9
Never 29 18.6 18.6 54.5
Needs 32 20.5 20.5 75.0
Improved 39 25.0 25.0 100.0
Total 156 100.0 100.0
Table of Working conditions rate Distribution explores the combination of
employees participated in the study. In general the group of employees would be in certain
ratios. As the nature of the job requires lot of time to be spent with the clients, participation
of improved is more. Hence the ratio from improved is more while compared to others
category. The same is displayed by chart as follows.
Frequency distribution of Rate for working conditions
Valid Very much acceptable
Valid Acceptable
Valid Never
Valid Needs
Valid Improved

041
4.15.Frequency distribution of Allowances benefits
Frequenc
y
Percent Valid
Percent
Cumulative
Percent
Valid
Yes 68 43.6 43.6 43.6
No 88 56.4 56.4 100.0
Total 156 100.0 100.0
Table of Allowances benefits receives so far rate Distribution explores the combination of
employees participated in the study. In general the group of employees would be in certain
ratios. As the nature of the job requires lot of time to be spent with the clients, participation
of allowances got low from respondents. Hence the ratio from allowances low is more
while compared to other category. The same is displayed by chart as follows.
0
20
40
60
80
100
120
Frequency Percent Valid Percent Cumulative Percent
Valid Yes
Valid No

042
4.16. Frequency distribution of Bonus Benefits
Frequenc
y
Percent Valid
Percent
Cumulative
Percent
Valid
Yes 75 48.1 48.1 48.1
No 81 51.9 51.9 100.0
Total 156 100.0 100.0
Table of Bonus benefits receives so far rate Distribution explores the combination of
employees participated in the study. In general the group of employees would be in certain
ratios. As the nature of the job requires lot of time to be spent with the clients, participation
of bonus is low from respondents. Hence the ratio from bonus low is more while compared
to other category. The same is displayed by chart as follows.
0
20
40
60
80
100
120
Frequency Percent Valid Percent Cumulative Percent
Valid Yes
Valid No

043
4.17.Frequency distribution of Medical insurance Benefits
Frequenc
y
Percent Valid
Percent
Cumulative
Percent
Valid
Yes 80 51.3 51.3 51.3
No 76 48.7 48.7 100.0
Total 156 100.0 100.0
Table of Medical insurance benefits receives so far rate Distribution explores the
combination of employees participated in the study. In general the group of employees
would be in certain ratios. As the nature of the job requires lot of time to be spent with the
clients, participation of medical 80% from respondents. Hence the ratio from yes is more
while compared to no category. The same is displayed by chart as follows.
0
20
40
60
80
100
120
Frequency Percent Valid Percent Cumulative Percent
Valid Yes
Valid No

044
4.18.Frequency distribution of Disability Benefits
Frequenc
y
Percent Valid
Percent
Cumulative
Percent
Valid
yes 66 42.3 42.3 42.3
No 90 57.7 57.7 100.0
Total 156 100.0 100.0
Table of disability benefits receives so far rate Distribution explores the combination of
employees participated in the study. In general the group of employees would be in certain
ratios. As the nature of the job requires lot of time to be spent with the clients, participation
of disability benefits is too low. Hence the ratio from no is more while compared to yes
category. The same is displayed by chart as follows.
0
20
40
60
80
100
120
Frequency Percent Valid Percent Cumulative Percent
Valid yes
Valid No

045
4.19.Frequency distribution of Unsatisfactory Performance
Frequenc
y
Percent Valid
Percent
Cumulative
Percent
Valid
Salary deduction 39 25.0 25.0 25.0
Designation revision 38 24.4 24.4 49.4
Immediate termination 46 29.5 29.5 78.8
Termination with notice
period 33 21.2 21.2 100.0
Total 156 100.0 100.0
Table of unsatisfactory performance Distribution explores the combination of employees
participated in the study. In general the immediate termination group of employees would
be in certain ratios. As the nature of the job requires lot of time to be spent with the clients,
participation of immediate termination is more required. Hence the ratio from termination
is more while compared to others category. The same is displayed by chart as follows.
0 10 20 30 40 50 60 70 80 90
100
Valid Salary deduction
Valid Designation revision
Valid Immediate termination
Valid Termination with notice period

046
4.20.RATE PREFORMANCE OVERALL SATISFACTION
RATE Frequ
ency
Percent Valid
Percent
Cumulative
Percent
V.GOOD 32 20.5 20.5 20.5
GOOD 39 25.0 25.0 45.5
SATISFIE
D 33 21.2 21.2 66.7
POOR 21 13.5 13.5 80.1
NOT AT
ALL 31 19.9 19.9 100.0
Total 156 100.0 100.0
Table of performance of overall satisfaction Distribution explores the combination of
employees participated in the study. In general the immediate termination group of
employees would be in certain ratios. As the nature of the job requires lot of time to be
spent with the clients, participation of good is more required. Hence the ratio from good is
more while compared to others category. The same is displayed by chart as follows.
0
20
40
60
80
100
120
140
160
180
RATE PREFORMANCE OVERALL SATISFACTION Frequency
RATE PREFORMANCE OVERALL SATISFACTION Percent
RATE PREFORMANCE OVERALL SATISFACTION Valid Percent
RATE PREFORMANCE OVERALL SATISFACTION Cumulative Percent

047
4.21.Frequency distribution of LABOUR COMPLIANCE
RATE Frequen
cy
Percent Valid Percent Cumulative
Percent
V,GOOD 27 17.3 17.3 17.3
GOOD 38 24.4 24.4 41.7
SATISFIE
D 25 16.0 16.0 57.7
POOR 29 18.6 18.6 76.3
NOT AT
ALL 37 23.7 23.7 100.0
Total 156 100.0 100.0
Table of performance of overall satisfaction Distribution explores the combination of
employees participated in the study. In general the immediate termination group of
employees would be in certain ratios. As the nature of the job requires lot of time to be
spent with the clients, participation of good is more required. Hence the ratio from good is
more while compared to others category. The same is displayed by chart as follows.
0
10
20
30
40
50
60
70
80
90
100
Frequency distribution of LABOUR COMPLIANCE Frequency
Frequency distribution of LABOUR COMPLIANCE Percent
Frequency distribution of LABOUR COMPLIANCE Valid Percent
Frequency distribution of LABOUR COMPLIANCE Cumulative Percent

048
5.1.Table showing cross table for income category and family level
Crosstab
Income
category
Family Level Total
poor Low
income
category
Middle
income
category
High
income
category
Rich
5000-
10000 4 6 6 4 10 30
10000-
20000 2 6 5 6 9 28
20000-
30000 5 4 6 4 4 23
30000-
40000 8 5 5 5 7 30
40000-
50000 7 3 6 4 7 27
>50000 2 3 1 5 7 18
Total 28 27 29 28 44 156
ANALYSIS: Cross tabulation between the income category with family level
of the employees. Out of 100 respondents 80% of the employees have been
selected the middle level and only 5% of the employees are under level and 69%
employees have chosen satisfied toward family income in the organization and
only 3% of the employees have chosen dissatisfied towards income in the
organization.
5.1.1.Chi-Square Tests
Value df Asymp. Sig. (2-sided)
Pearson Chi-Square 12.812a 20 .885
Likelihood Ratio 13.740 20 .843
Linear-by-Linear
Association .079 1 .779
N of Valid Cases 156

049
INTERPRETATION:As the significant(.885)value of chi square test is greater than 0.05
hypothesis is accepted. This leads to the conclusion that family level are provided based on
income category.
5.1.2ANOVA
Designation Of Employee Working
Sum of
Squares
Df Mean
Square
F Sig.
Between
Groups 14.555 5 2.911 2.828 .018
Within Groups 154.387 150 1.029
Total 168.942 155
INTERPRETATION:As the significant (.018) value of anova test is greater than 0.05,
hypothesis is accepted. This leads to the conclusion that income category are provided
based on family level.
Crosstabs
5.2.Rate quality of Offline Training * Training improves
Rate quality of
Offline
Training
Training improves Total
Always Sometimes Seldom Not at
all
Efficient of
work
V.Good 5 5 5 8 9 32
Good 7 6 9 3 8 33
Satisfied 7 1 6 9 10 33
Poor 5 8 8 5 6 32
Worst 4 5 7 5 5 26
Total 28 25 35 30 38 156
ANALYSIS: Cross tabulation between rate quality of offline training with training
improves provided by the organization reveals nearby 38% of employees are comfortable
with their training improves and only 25% of employees are satisfied to some extent with
their training improves.From the view point of the rate quality of offline training and only
26% are dissatisfied with rate quality of offline training provided in the organization.

050
5.2.1.Chi-Square Tests
Value df Asymp. Sig.
(2-sided)
Pearson Chi-Square 12.633a 16 .699
Likelihood Ratio 14.486 16 .563
Linear-by-Linear
Association .421 1 .516
N of Valid Cases 156
INTERPRETATION: As the significant (.699) value of chi square test is greater than
0.05 hpothesis is accepted. This leads to the conclusion that offline training are provided
based on training improves.
5.3.Rate quality of Inplant training * Training improves
Crosstab
Count
Rate quality of
Inplant training
Training improves Total
Always Sometimes Seldom Not at all Efficient
of work
V.Good 3 8 7 7 7 31
Good 3 5 4 6 10 25
Satisfied 8 5 9 6 6 35
Poor 5 10 6 5 9 27
Worst 9 4 9 6 6 38
Total 28 32 35 30 38 156
ANALYSIS: Cross tabulation between rate quality of inplant training with training
improves provided by the organization reveals nearly 38% of employees are comfortable
with their training improves and only 28% of employees are satisfied to some extent with
their training improves. From the view point of the inplant training 38% of employees are

051
satisfied with quality of inplant training and only 25% are dissatisfied with the inplant
training provided in the organization.
5.3.1Chi-Square Tests
Value Df Asymp. Sig.
(2-sided)
Pearson Chi-Square 13.351a 16 .647
Likelihood Ratio 13.728 16 .619
Linear-by-Linear
Association 2.605 1 .107
N of Valid Cases 156
INTERPRETATION: As the significant (.647) value of chi square test is greater than
0.05, hypothesis is accepted. This leads to the conclusion that inplant training are provided
based on
training improves.
5.4.Rate quality of Workshop * Training improves
Crosstab
Rate quality
of Workshop
Training improves Total
Always Sometimes Seldom Not at all Efficient of
work
V.Good 8 4 5 7 8 32
Good 4 5 5 7 3 24
Satisfied 8 3 13 6 11 41
Poor 4 3 8 3 9 27
Worst 4 10 4 7 7 32
Total 28 25 35 30 38 156
ANALYSIS:Cross tabulation between rate quality of workshop and training improves
provided by the organization reveals nearly 38% of employees are comfortable with their

052
quality of workshop and only 25% of employees are satisfied to some extent with their
training improves. From the view point of the quality of workshop 41% of employees are
satisfied with quality of workshop provided in the organization.
5.4.1.Chi-Square Tests
Value df Asymp. Sig.
(2-sided)
Pearson Chi-Square 18.810a 16 .279
Likelihood Ratio 18.658 16 .287
Linear-by-Linear
Association .145 1 .703
N of Valid Cases 156
INTERPRETATION: As the significant (.279) value of chi square test is greater than
0.05 hypothesis is accepted. This leads to the conclusion that quality of workshop are
provided based on training improves.
5.5.Rate quality of health awareness * Training improves
Crosstab
Count
Rate quality of
health
awareness
Training improves Total
Always Sometimes Seldom Not at all Efficient of
work
V.Good 3 5 1 7 7 23
Good 4 9 9 2 7 31
Satisfied 6 0 5 10 9 30
Poor 5 6 9 7 8 35
Worst 10 5 11 4 7 37
Total 28 25 35 30 38 156
ANALYSIS:Cross tabulation between quality of health awareness with training improves
prvided by the organization reveals nearly 38% of employees are comfortable with their
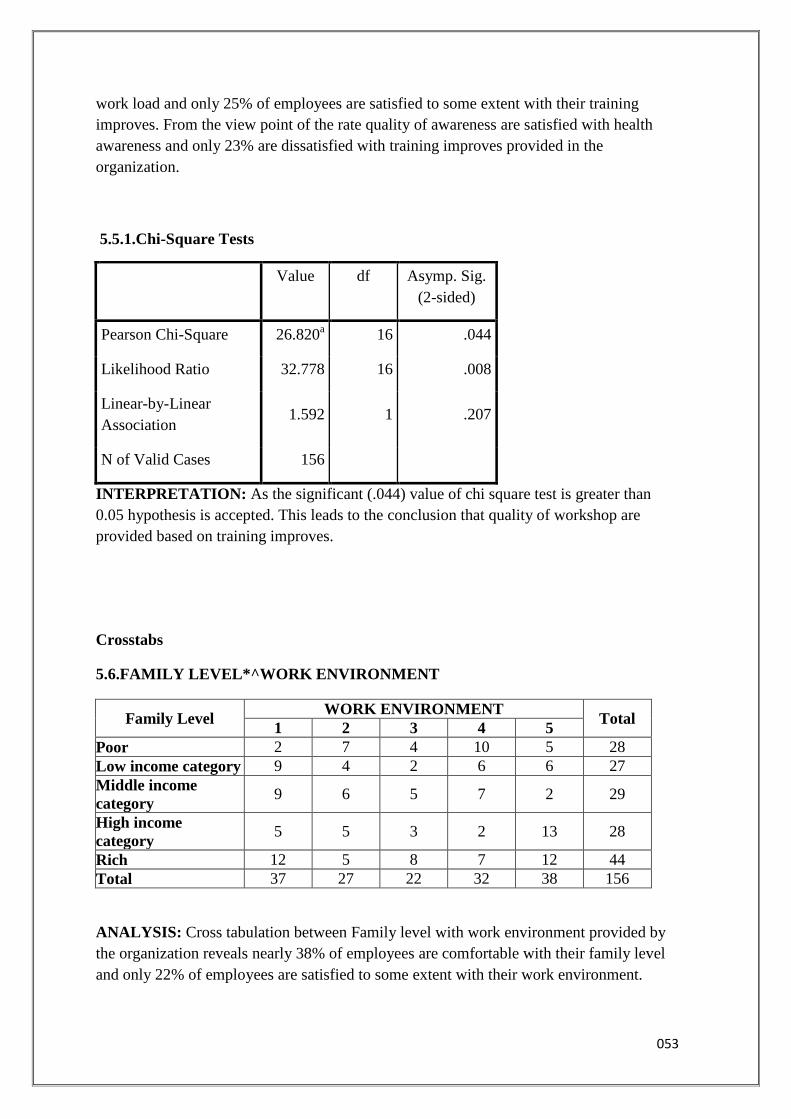
053
work load and only 25% of employees are satisfied to some extent with their training
improves. From the view point of the rate quality of awareness are satisfied with health
awareness and only 23% are dissatisfied with training improves provided in the
organization.
5.5.1.Chi-Square Tests
Value df Asymp. Sig.
(2-sided)
Pearson Chi-Square 26.820a 16 .044
Likelihood Ratio 32.778 16 .008
Linear-by-Linear
Association 1.592 1 .207
N of Valid Cases 156
INTERPRETATION: As the significant (.044) value of chi square test is greater than
0.05 hypothesis is accepted. This leads to the conclusion that quality of workshop are
provided based on training improves.
Crosstabs
5.6.FAMILY LEVEL*^WORK ENVIRONMENT
Family Level WORK ENVIRONMENT
Total 1 2 3 4 5
Poor 2 7 4 10 5 28
Low income category 9 4 2 6 6 27
Middle income
category 9 6 5 7 2 29
High income
category 5 5 3 2 13 28
Rich 12 5 8 7 12 44
Total 37 27 22 32 38 156
ANALYSIS: Cross tabulation between Family level with work environment provided by
the organization reveals nearly 38% of employees are comfortable with their family level
and only 22% of employees are satisfied to some extent with their work environment.

054
From the view point of the family level are satisfied with health awareness and only 27%
are dissatisfied with training improves provided in the organization.
5.6.1.Chi-Square Tests
Value Df Asymp. Sig.
(2-sided)
Pearson Chi-Square 25.740a 16 .058
N of Valid Cases 156
INTERPRETATION:As the significant (.058) value of chi square test is greater than
0.05 hypothesis is accepted. This lead to the conclusion the family level are provided
based on work environment.
5.6.2.Count
Income category WORK ENVIRONMENT Total
1 2 3 4 5
5000-10000 8 4 3 6 9 30
10000-20000 9 3 5 4 7 28
20000-30000 6 7 3 2 5 23
30000-40000 8 7 3 6 6 30
40000-50000 4 3 5 8 7 27
>50000 2 3 3 6 4 18
Total 37 27 22 32 38 156
ANALYSIS: Cross tabulation between Income category with work environment provided
by the organization reveals nearly 38% of employees are comfortable with their family

055
level and only 22% of employees are satisfied to some extent with their work environment.
From the view point of the family level are satisfied with health awareness and only 18%
are dissatisfied with training improves provided in the organization.
5.6.3.Chi-Square Tests
Value Df Asymp. Sig.
(2-sided)
Pearson Chi-Square 14.588a 20 .800
Likelihood Ratio 14.815 20 .787
Linear-by-Linear
Association .946 1 .331
N of Valid Cases 156
INTERPRETATION:As the significant (.800) value of chi square test is greater than
0.05 hypothesis is accepted. This leads to the conclusion that income category are provided
on work environment.
5.6.4.Symmetric Measures
Value Approx.
Sig.
Nominal by
Nominal
Contingency
Coefficient .292 .800
N of Valid Cases 156
INTERPRETATION:As the significant (.800) value of symmetric measures test is
greater than 0.05 hypothesis is accepted. This leads to the conclusion that income category
are provided on work environment

056
5.7.support from empl to top mgmt * WORK ENVIRONMENT
Crosstab
Count
support from empl
to top mgmt
WORK ENVIRONMENT Total
1 2 3 4 5
VERY MUCH
SUPPORT 7 6 5 7 5 30
Support 11 4 0 5 12 32
Neither support nor
support 6 5 6 4 8 29
Not support 9 6 3 8 4 30
Very not support 4 6 8 8 9 35
Total 37 27 22 32 38 156
ANALYSIS: Cross tabulation between support from employer to top management with
work environment provided by the organization reveals nearly 38% of employees are
comfortable with their work environment and only 29% of employees are satisfied to some
extent with their work environment. From the view point of the work environment are
satisfied with support from employment to top management and only 22% are dissatisfied
with work environment provided in the organization.
5.7.1.Chi-Square Tests
Value Df Asymp. Sig.
(2-sided)
Pearson Chi-Square 19.278a 16 .254
Likelihood Ratio 23.872 16 .092
Linear-by-Linear
Association .467 1 .494
N of Valid Cases 156
INTERPRETATION:As the significant (.254) value of chi square test is greater than
0.05 hypothesis is accepted. This leads to the conclusion that income category are provided
on work environment

057
5.8.Work environment* support from employers
Crosstab
Count
Support from emp
to supervisor
WORK ENVIRONMENT Total
1 2 3 4 5
Very much support 7 5 4 9 9 34
Support 8 8 8 5 4 29
Neither support nor
support 5 6 4 6 5 26
Notsupport 7 5 3 8 9 37
Very not support 10 3 3 4 11 30
Total 37 27 22 32 38 156
ANALYSIS: Cross tabulation between support from employer to supervisor with work
environment provided by the organization reveals nearly 38% of employees are
comfortable with their work environment and only 26% of employees are satisfied to some
extent with their work environment. From the view point of the work environment are
satisfied with support from employer to supervisor and only 22% are dissatisfied with
work environment provided in the organization.
5.8.1.Chi-Square Tests
Value Df Asymp. Sig.
(2-sided)
Pearson Chi-Square 13.670a 16 .623
Likelihood Ratio 13.621 16 .627
Linear-by-Linear
Association .086 1 .769
N of Valid Cases 156
INTERPRETATION:As the significant (.623) value of chi square test is greater than
0.05 hypothesis is accepted. This leads to the conclusion that income category are provided
on work environment.

058
5.9.support from emp to co-worker * WORK ENVIRONMENT
support from
emp to co-
worker
WORK ENVIRONMENT Total
1 2 3 4 5
Very much
support 8 8 3 11 8 38
Support 8 3 3 9 6 29
Neither support
nor support 7 3 8 5 9 32
not support 8 6 4 6 4 28
Very not support 6 7 4 1 11 29
Total 37 27 22 32 38 156
ANALYSIS: Cross tabulation between support from employer to co- worker with work
environment provided by the organization reveals nearly 38% of employees are
comfortable with their work environment and only 28% of employees are satisfied to some
extent with their work environment. From the view point of the work environment are
satisfied with support from employer to co-worker and only 22% are dissatisfied with
work environment provided in the organization.
5.9.1.Chi-Square Tests
Value df Asymp. Sig.
(2-sided)
Pearson Chi-Square 19.359a 16 .250
Likelihood Ratio 21.085 16 .175
Linear-by-Linear
Association .068 1 .794
N of Valid Cases 156
INTERPRETATION:As the significant (.250) value of chi square test is greater than
0.05 hypothesis is accepted. This leads to the conclusion that income category are provided
on work environment.

059
5.9.2.Symmetric Measures
Value Approx.
Sig.
Nominal by
Nominal
Contingency
Coefficient .332 .250
N of Valid Cases 156
INTERPRETATION:As the significant (.250) value of symmetric measures test is
greater than 0.05 hypothesis is accepted. This leads to the conclusion that income category
are provided on work environment.
5.10.support from emp to low level employees * WORK ENVIRONMENT
Count
support from emp
to low level
employees
WORK ENVIRONMENT Total
1 2 3 4 5
Very much
support 7 6 9 8 7 37
Support 7 6 1 2 7 23
Neither support
nor support 10 5 3 7 8 33
Not support 6 5 4 6 10 31
Very not support 7 5 5 9 6 32
Total 37 27 22 32 38 156
ANALYSIS: Cross tabulation between support from employer to low level employees
with work environment provided by the organization reveals nearly 38% of employees are
comfortable with their work environment and only 31% of employees are satisfied to some
extent with their work environment. From the view point of the work environment are
satisfied with support from employer to low level employees and only 22% are dissatisfied
with work environment provided in the organization

060
5.10.1.Chi-Square Tests
Value df Asymp. Sig.
(2-sided)
Pearson Chi-Square 12.401a 16 .716
Likelihood Ratio 12.718 16 .693
Linear-by-Linear
Association .224 1 .636
N of Valid Cases 156
INTERPRETATION:As the significant (.716) value of chi square test is greater than
0.05 hypothesis is accepted. This leads to the conclusion that income category are provided
on work environment.
5.11.LABOUR COMPLIANCE * Rate for facilities
Crosstab
Count
Labour compliance Rate for facilities Total
Very much
acceptable
Acceptabl
e
Never Needs Improve
d
1 5 4 8 5 5 27
2 8 8 8 9 5 38
3 7 3 2 5 8 25
4 2 7 7 8 5 29
5 10 8 2 8 9 37
Total 32 30 27 35 32 156
ANALYSIS: Cross tabulation between labour compliance with rate for facilities provided
by the organization reveals nearly 35% of employees are comfortable with their rate for
facilities and only 25% of employees are satisfied to some extent with their rate for
facilities. From the view point of the rate for facilities are satisfied with labour compliance
and only 27% are dissatisfied with work environment provided in the organization

061
5.11.1.Chi-Square Tests
Value df Asymp. Sig.
(2-sided)
Pearson Chi-Square 17.065a 16 .381
Likelihood Ratio 18.747 16 .282
Linear-by-Linear
Association .048 1 .827
N of Valid Cases 156
INTERPRETATION:As the significant (.381) value of chi square test is greater than
0.05 hypothesis is accepted. This leads to the conclusion that income category are provided
on rate for facilities.
5.12.LABOUR COMPLIANCE * Rate for maternity leave
Count
LABOUR
COMPLIANCE and
maternity leave
Rate for maternity leave Total
Very much
acceptable
Acceptabl
e
Never Needs Improve
d
1 6 5 6 5 5 27
2 10 6 7 4 11 38
3 4 8 5 6 2 25
4 8 3 4 9 5 29
5 5 7 6 9 10 37
Total 33 29 28 33 33 156
ANALYSIS: Cross tabulation between labour compliance with rate for maternity leave
provided by the organization reveals nearly 33% of employees are comfortable with their
rate for maternity leave and only 28% of employees are satisfied to some extent with their
rate for maternity leave. From the view point of the rate for facilities are satisfied with
labour compliance and only 25% are dissatisfied with rate for maternity leave provided in
the organization

062
5.12.1.Chi-Square Tests
Value Df Asymp. Sig.
(2-sided)
Pearson Chi-Square 14.481a 16 .563
Likelihood Ratio 15.145 16 .514
Linear-by-Linear
Association 1.134 1 .287
N of Valid Cases 156
INTERPRETATION:As the significant (.563) value of chi square test is greater than 0.05
hypothesis is accepted. This leads to the conclusion that income category are provided on rate
for maternity leave.
5.13. LABOUR COMPLIANCE * Rate for ALLOWANCES
Crosstab
Labour compliance
and rate for
allowances
Rate for allowances Total
Very much
acceptable
Acceptabl
e
Never Needs Improve
d
1 8 7 5 4 3 27
2 10 8 7 6 7 38
3 3 5 7 6 4 25
4 6 7 8 4 4 29
5 5 9 8 8 7 37
Total 32 36 35 28 25 156
ANALYSIS: Cross tabulation between labour compliance with rate for allowances
provided by the organization reveals nearly 36% of employees are comfortable with their
rate for allowances leave and only 25% of employees are satisfied to some extent with
their rate for allowances. From the view point of the rate for allowances are satisfied with

063
labour compliance and only 25% are dissatisfied with rate for allowances provided in the
organization
5.13.1.Chi-Square Tests
Value df Asymp. Sig.
(2-sided)
Pearson Chi-Square 7.086a 16 .972
Likelihood Ratio 7.171 16 .970
Linear-by-Linear
Association 1.988 1 .159
N of Valid Cases 156
INTERPRETATION:As the significant (.972) value of chi square test is greater than
0.05 hypothesis is accepted. This leads to the conclusion that labour compliance are
provided on rate for allowances.
5.14.LABOUR COMPLIANCE * Rate for loans
Count
LABOUR
COMPLIANCE
AND LOANS
Rate for loans Total
Very much
acceptable
Acceptable Never Needs Improve
d
1 6 4 7 7 3 27
2 4 10 10 6 8 38
3 4 9 8 2 2 25
4 4 3 6 7 9 29
5 3 7 8 12 7 37
Total 21 33 39 34 29 156
ANALYSIS: Cross tabulation between labour compliance with rate for loans provided by
the organization reveals nearly 39% of employees are comfortable with their rate for loans
and only 21% of employees are satisfied to some extent with their rate for allowances.

064
From the view point of the rate for loans are satisfied with labour compliance and only
25% are dissatisfied with rate for loans provided in the organization.
5.14.1.Chi-Square Tests
Value df Asymp. Sig.
(2-sided)
Pearson Chi-Square 18.768a 16 .281
Likelihood Ratio 19.229 16 .257
Linear-by-Linear
Association 3.020 1 .082
N of Valid Cases 156
INTERPRETATION:As the significant (.281) value of chi square test is greater than
0.05 hypothesis is accepted. This leads to the conclusion that labour compliance are
provided on rate for loans.
5.15.LABOUR COMPLIANCE * Rate for housing facilties
Cross tabs
LABOUR
COMPLIANCE
AND HOUSING
FACILITIES
Rate for housing facilties Total
Very much
acceptable
Acceptabl
e
Never Needs Improve
d
1 8 6 3 8 2 27
2 7 7 6 14 4 38
3 9 4 2 6 4 25
4 5 4 8 8 4 29
5 8 5 12 9 3 37
Total 37 26 31 45 17 156
ANALYSIS: Cross tabulation between labour compliance with rate for housing facilities
provided by the organization reveals nearly 37% of employees are comfortable with their
rate for housing facilities and only 17% of employees are satisfied to some extent with
their rate for housing facilities. From the view point of the rate for housing facilities are

065
satisfied with labour compliance and only 25% are dissatisfied with rate for housing
facilities provided in the organization.
5.15.1.Chi-Square Tests
Value df Asymp. Sig.
(2-sided)
Pearson Chi-Square 13.622a 16 .627
Likelihood Ratio 13.548 16 .632
Linear-by-Linear
Association .186 1 .666
N of Valid Cases 156
INTERPRETATION:As the significant (.627) value of chi square test is greater than
0.05 hypothesis is accepted. This leads to the conclusion that labour compliance are
provided on rate for housing facilities.
5.16.LABOUR COMPLIANCE * Rate for working conditions
CROSS TABS
LABOUR
COMPLIANCE
Rate for working conditions Total
Very much
acceptable
Acceptabl
e
Never Needs Improve
d
1 4 8 5 1 9 27
2 8 7 6 11 6 38
3 5 2 5 7 6 25
4 8 4 6 5 6 29
5 7 3 7 8 12 37
Total 32 24 29 32 39 156
ANALYSIS: Cross tabulation between labour compliance with rate for working
conditions provided by the organization reveals nearly 39% of employees are comfortable
with their rate for working conditions and only 24% of employees are satisfied to some
extent with their rate for working conditions. From the view point of the rate for working
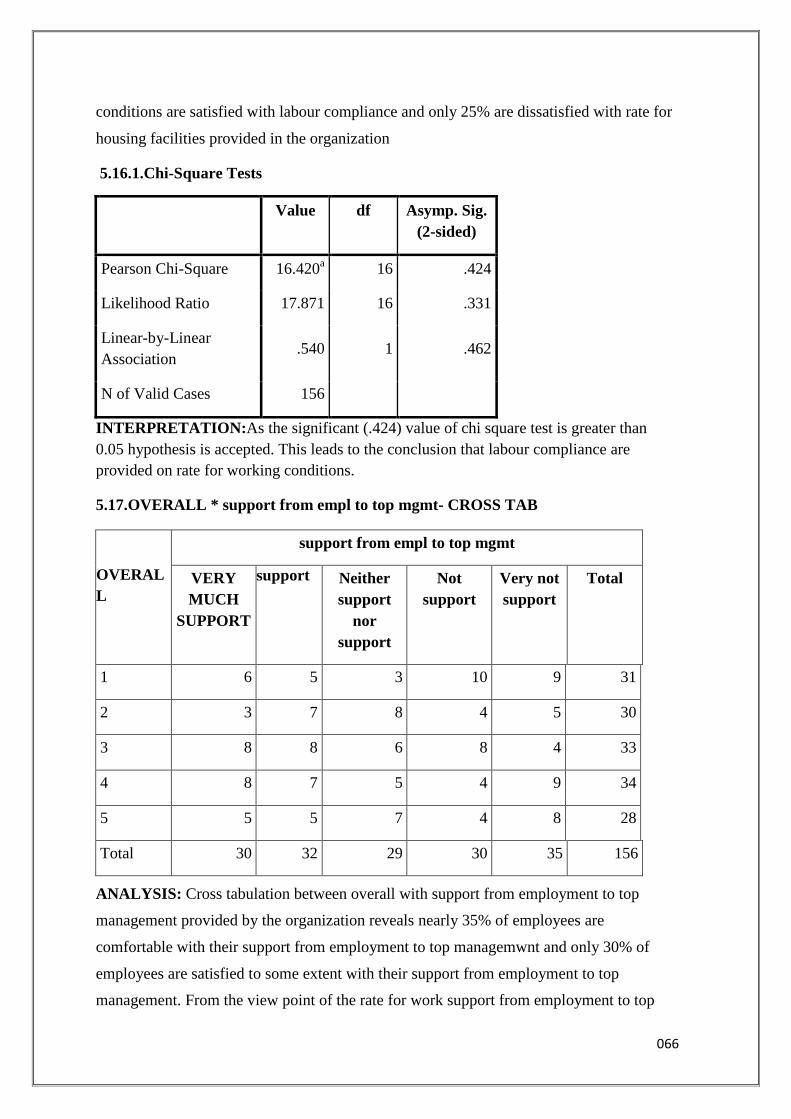
066
conditions are satisfied with labour compliance and only 25% are dissatisfied with rate for
housing facilities provided in the organization
5.16.1.Chi-Square Tests
Value df Asymp. Sig.
(2-sided)
Pearson Chi-Square 16.420a 16 .424
Likelihood Ratio 17.871 16 .331
Linear-by-Linear
Association .540 1 .462
N of Valid Cases 156
INTERPRETATION:As the significant (.424) value of chi square test is greater than
0.05 hypothesis is accepted. This leads to the conclusion that labour compliance are
provided on rate for working conditions.
5.17.OVERALL * support from empl to top mgmt- CROSS TAB
OVERAL
L
support from empl to top mgmt
VERY
MUCH
SUPPORT
support Neither
support
nor
support
Not
support
Very not
support
Total
1 6 5 3 10 9 31
2 3 7 8 4 5 30
3 8 8 6 8 4 33
4 8 7 5 4 9 34
5 5 5 7 4 8 28
Total 30 32 29 30 35 156
ANALYSIS: Cross tabulation between overall with support from employment to top
management provided by the organization reveals nearly 35% of employees are
comfortable with their support from employment to top managemwnt and only 30% of
employees are satisfied to some extent with their support from employment to top
management. From the view point of the rate for work support from employment to top

067
managemet are satisfied with labour compliance and only 28% are dissatisfied with
support to top management provided in the organization
5.17.1.Chi-Square Tests
Value df Asymp. Sig.
(2-sided)
Pearson Chi-Square 18.634a 16 .288
Likelihood Ratio 19.110 16 .263
Linear-by-Linear
Association .310 1 .577
N of Valid Cases 156
INTERPRETATION:As the significant (.288) value of chi square test is greater than
0.05 hypothesis is accepted. This leads to the conclusion that labour compliance are
provided on support to top manager
5.18.OVERALL * Support from emp to supervisor –
CROSS TABS
OVERAL
L
Support from emp to supervisor Total
Very much
support
Support Neither
support nor
support
Notsupport Very not
support
1 7 6 2 7 9 31
2 7 4 7 5 7 30
3 6 5 4 13 5 33
4 10 6 8 5 5 34
5 4 8 5 7 4 28
Total 34 29 26 37 30 156

068
ANALYSIS: Cross tabulation between overall with support from employment of
supervisor provided by the organization reveals nearly 37% of employees are
comfortable with their support from employment to supervisor and only 30% of
employees are satisfied to some extent with their support from employment to
supervisor. From the view point of the rate for work support from employment to
supervisor are satisfied with labour compliance and only 28% are dissatisfied with
support to top management provided in the organization
5.18.1Chi-Square Tests
Value df Asymp. Sig. (2-sided)
Pearson Chi-Square 16.249a 16 .436
Likelihood Ratio 16.107 16 .446
Linear-by-Linear
Association .924 1 .336
N of Valid Cases 156
INTERPRETATION:As the significant (.436) value of chi square test is greater than
0.05 hypothesis is accepted. This leads to the conclusion that labour compliance are
provided on support to supervisor.
5.19.OVERALL * support from emp to co-worker
OVERAL
L
support from emp to co-worker Total
Very much
support
Support Neither
support
nor
support
not
support
Very not
support
1 9 1 8 8 5 31
2 10 6 3 6 5 30
3 4 11 6 6 6 33
4 5 6 8 5 10 34
5 10 5 7 3 3 28
Total 38 29 32 28 29 156

069
ANALYSIS: Cross tabulation between overall with support from employment of co-
worker provided by the organization reveals nearly 38% of employees are comfortable
with their support from employment to co-worker and only 30% of employees are satisfied
to some extent with their support from employment to co-worker. From the view point of
the rate for work support from employment to co-worker are satisfied with labour
compliance and only 28% are dissatisfied with support to co-worker provided in the
organization
5.19.1.Chi-Square Tests
Value df Asymp. Sig.
(2-sided)
Pearson Chi-Square 21.879a 16 .147
Likelihood Ratio 23.796 16 .094
Linear-by-Linear
Association .202 1 .653
N of Valid Cases 156
INTERPRETATION:As the significant (.147) value of chi square test is greater than
0.05 hypothesis is accepted. This leads to the conclusion that labour compliance are
provided on support to co worker.
5.20.OVERALL * support from emp to low level employees
OVERAL
L
support from emp to low level employees Total
Very
much
support
Support Neither
support
nor
support
Not
support
Very not
support
1 9 9 7 2 7 31
2 7 7 6 7 6 30
3 10 2 2 13 4 33
4 6 4 14 5 6 34
5 5 6 4 4 9 28
Total 37 28 33 31 32 156

070
ANALYSIS: Cross tabulation between overall with support from employment to low level
employees provided by the organization reveals nearly 37% of employees are comfortable
with their support from employment to co-worker and only 28% of employees are satisfied
to some extent with their support from employment to low level employees. From the view
point of the rate for work support from employment to low level employees are satisfied
with labour compliance and only 28% are dissatisfied with support to low level employees
provided in the organization
5.20.1.Chi-Square Tests
Value Df Asymp. Sig.
(2-sided)
Pearson Chi-Square 28.277a 16 .029
Likelihood Ratio 27.975 16 .032
Linear-by-Linear
Association 1.315 1 .252
N of Valid Cases 156
INTERPRETATION:As the significant (.029) value of chi square test is greater than
0.05 hypothesis is accepted. This leads to the conclusion that labour compliance are
provided on support to low level employees.
5.21.Rate quality of Offline Training * Rate Performance
Cross tabs
Count Total
Rate quality
of Offline
Training
1 33 3 4 5
V.Good 33 33 9 3 7 32
Good 33 32 7 2 5 33
Satisfied 32 26 4 8 9 33
Poor 26 156 4 6 5 32
Worst 156 5 9 2 5 26

071
Total 32 39 33 21 31 156
ANALYSIS: Cross tabulation between overall with quality of offline training employees
provided by the organization reveals nearly 39% of employees are comfortable with their
support from employment to co-worker and only 21% of employees are satisfied to some
extent with their support from employment to low level employees. From the view point of
the rate for work support from employment to low level employees are satisfied with
labour compliance and only 26% are dissatisfied with rate of offline training provided in
the organization
INTERPRETATION:As the significant (.215) value of chi square test is greater than
0.05 hypothesis is accepted. This leads to the conclusion that raet pof quality of offline
training are provided on overall.
5.22.Rate quality of Inplant training * RATE PERFORMANCE
Crosstab
Count
Rate quality of
Inplant
training
RATE PERFORMANCE Total
1 2 3 4 5
V.Good 9 4 7 1 10 31
Good 3 7 5 4 6 25
Satisfied 6 9 7 8 5 35
Poor 7 4 9 4 3 27
5.21.1.Chi-Square Tests
Value Df Asymp. Sig.
(2-sided)
Pearson Chi-Square 20.107a 16 .215
Likelihood Ratio 19.457 16 .246
Linear-by-Linear
Association .005 1 .945
N of Valid Cases 156

072
Worst 7 15 5 4 7 38
Total 32 39 33 21 31 156
ANALYSIS: Cross tabulation between rate quality of inplant training with rate of
performance provided by the organization reveals nearly 39% of employees are
comfortable with their rate performance and only 21% of employees are satisfied to some
extent with their rate performance. From the view point of the rate performance from
employees are satisfied with labour compliance and only 26% are dissatisfied with rate of
inplant training provided in the organization.
5.22.1.Chi-Square Tests
Value Df Asymp. Sig.
(2-sided)
Pearson Chi-Square 21.314a 16 .167
Likelihood Ratio 21.878 16 .147
Linear-by-Linear
Association 1.286 1 .257
N of Valid Cases 156
INTERPRETATION:As the significant (.167) value of chi square test is greater than
0.05 hypothesis is accepted. This leads to the conclusion that rate quality of inplant
training are provided on overall.
5.23.Rate quality of Workshop * RATE PERFORMANCE-CROSS TAB
Rate quality of Workshop RATE PERFORMANCE Total
1 2 3 4 5
V.Good 8 4 7 6 7 32
Good 5 6 6 3 4 24
Satisfied 7 12 9 6 7 41
Poor 5 9 4 3 6 27

073
Worst 7 8 7 3 7 32
Total 32 39 33 21 31 156
ANALYSIS: Cross tabulation between rate quality of workshop with rate of performance
provided by the organization reveals nearly 39% of employees are comfortable with their
rate performance and only 21% of employees are satisfied to some extent with their rate
performance. From the view point of the rate performance from employees are satisfied
with rate quality of workshop and only 26% are dissatisfied with rate of quality of
workshop provided in the organization
5.23.1.Chi-Square Tests
Value Df Asymp. Sig.
(2-sided)
Pearson Chi-Square 6.112a 16 .987
Likelihood Ratio 6.514 16 .982
Linear-by-Linear
Association .121 1 .728
N of Valid Cases 156
INTERPRETATION:As the significant (.987) value of chi square test is greater than
0.05 hypothesis is accepted. This leads to the conclusion that rate performance are
provided on rate quality of workshop
5.24.Rate quality of health awareness * RATE PERFORMANCE
Crosstab
Rate quality
of health
awareness
RATE PERFORMANCE
1 2 3 4 5 Total
V.Good 2 6 7 6 2 23
Good 6 5 10 3 7 31
Satisfied 4 8 8 3 7 30
Poor 11 11 5 4 4 35
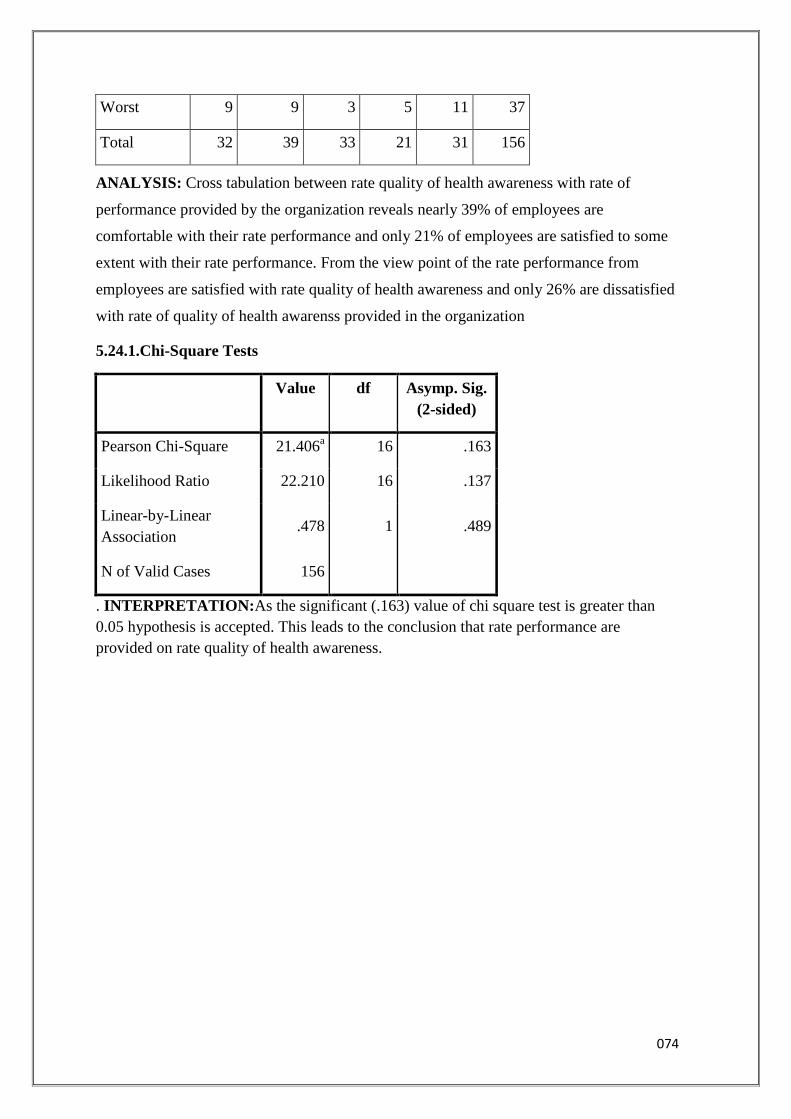
074
Worst 9 9 3 5 11 37
Total 32 39 33 21 31 156
ANALYSIS: Cross tabulation between rate quality of health awareness with rate of
performance provided by the organization reveals nearly 39% of employees are
comfortable with their rate performance and only 21% of employees are satisfied to some
extent with their rate performance. From the view point of the rate performance from
employees are satisfied with rate quality of health awareness and only 26% are dissatisfied
with rate of quality of health awarenss provided in the organization
5.24.1.Chi-Square Tests
Value df Asymp. Sig.
(2-sided)
Pearson Chi-Square 21.406a 16 .163
Likelihood Ratio 22.210 16 .137
Linear-by-Linear
Association .478 1 .489
N of Valid Cases 156
. INTERPRETATION:As the significant (.163) value of chi square test is greater than
0.05 hypothesis is accepted. This leads to the conclusion that rate performance are
provided on rate quality of health awareness.

075
CHAPTER NO: 5
FINDINGS,SUGGESTIONS AND CONCLUSIONS
5.1.FINDINGS:
1. All Statutory Labour Welfare Schemes are provided & some non- Statutory Labour
Welfare Schemes are provided.
2. More focus is given to non- Statutory Labour Welfare Schemes.
3. Employees are moderately satisfied with some non- Statutory Labour Welfare
Schemes.
4. All employees are satisfied with the medical facility provided by the company
because the doctor visited two times in a week in organization.
5. During the personal interaction with the workers there is dissatisfaction towards
the quality of the food and cleanliness.
6. Because of lack of communication from management about recreational activity
the maximum no of employees are not participated in recreational activity.
7. The educational facilities are provided
8. Maximum no of employees are involving in the problem solving.
9. The company provides safety measures to the employees there for maximum no of
employees are felt safe while working in the company.
5.2.SUGGESTIONS:
1. Irrespective of several attempts made by the employer in the field of introducing
non- statutory schemes, the labourers are moderately satisfied. Steps should be
taken to ensure one on one is conducted with the labourers to know the area of
dissatisfaction.
2. Non statutory schemes should be increased.
3. Company should provide proper information or knowledge
4. Company should provide the theoretical knowledge apart from practical
knowledge.

076
5. The organization should have communications skills training to handle the clients
or to convince the clinets.
6. The corporate should provide both on the job as well as off the training to the
employees.
7. The cmployees should be trained in communication skills to interact with clients.
5.3.CONCLUSION
The conclusion is based on the data analysis and Interpretation.
Welfare facilities are statutory provisions under facility act 1928. Every organization
provides these facilities to the workers.
Welfare facilities are very important aspect in every organization. The welfare facilities
help to organization for increasing the productivity and efficiency of the workers.
In Aparajitha Maximum numbers of employee are dissatisfied with welfare facilities very
few employees are satisfied because company does not provide welfare facility properly.
Some welfare facilities are not well maintained in the company. Welfare facilities plays
motivational role in organization.

077
CHAPTER-6
BIBLIOGRAPHY
6.1:BIBLIOGRAPHY:
References:
Freeman, Richard B. 1993. ―Labor Market Institutions and Policies: Help or Hindrance to
Economic Development?‖ Proceedings of the World Bank Annual Conference on
Development Economics 1992. Washington, DC: The World Bank.
Brown, Charles, Curtis Gilroy, and Andrew Kohen. 1983. ―The Effect of the Minimum
Wage on Employment and Unemployment.‖ Journal of Human Resources. 18 (1): 3-31.
FREEMAN, R. D. AND J. L. MEDOFF (1984): What do unions do?, New York, NY:
Basic Books.
GROSSMAN, S. J. AND O. D. HART (1986): “The Costs and Benefits of Ownership: A
Theory of Vertical and Lateral Integration,”
Journal of Political Economy, 94, 691–719.
HOLLAND, P. W. (1986): “Statistics and Causal Inference,” Journal of the American
Statistical Association,
81, 945–960.
JENSEN, M. AND W. MECKLING (1976): “Theory of the Firm: Managerial Behavior,
Agency Costs and Ownership Structure,” Journal of Financial Economics, 3, 305–60.
JOLLS,C. (2007): “Employment Law,” in Handbook of Law and Economics, ed. by A. M.
Polinsky and S. Shavell, Elsevier, Amsterdam, The Netherlands, vol. 2, chap. 17.
OSTROM, E. (2000): “Collective Action and the Evolution of Social Norms,” Journal of
Economic Perspectives,14, 137–158.
WOOD, H. G. (1877): A treatise on the law of master and servant, Albany, N.Y.: J.D.
Parsons.72
Websites:
http://www.aparajitha.com
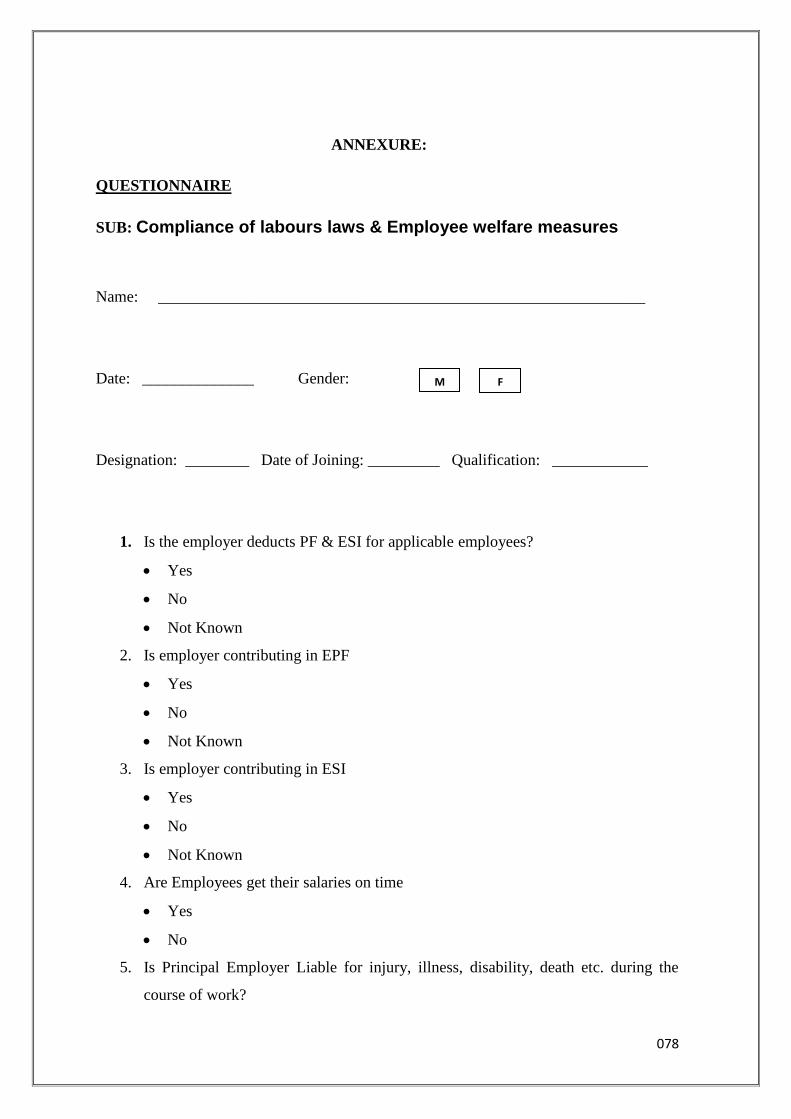
078
ANNEXURE:
QUESTIONNAIRE
SUB: Compliance of labours laws & Employee welfare measures
Name: _____________________________________________________________
Date: ______________ Gender: Age
Designation: ________ Date of Joining: _________ Qualification: ____________
1. Is the employer deducts PF & ESI for applicable employees?
Yes
No
Not Known
2. Is employer contributing in EPF
Yes
No
Not Known
3. Is employer contributing in ESI
Yes
No
Not Known
4. Are Employees get their salaries on time
Yes
No
5. Is Principal Employer Liable for injury, illness, disability, death etc. during the
course of work?
F
M

079
Yes
No
6. Who has to take disciplinary action against employees?
Labour Inspector
Management of the Company
None
7. Whether the Minimum Wages are paid to the applicable employees?
Yes
No
8. Employees get terminated due to unsatisfactory performance of the Job?
Yes
No
Not Known
9. What is the period of Probation to the employees in the company?
6 Months
1 Year
2 Year
10. Does the employer provide holiday for sickness?
Yes
No
11. Whether the employer deducting Profession tax as per slab?
Yes
No
12. Is Maternity benefit given by employer?
Yes
No
Not known
13. Do you think that all the policies laid down by the employer is employee friendly?
Yes
No
14.Did you receive your allowance benefits?(i.e.,Local conveyances,etc.,)

080
Yes
No
15.. How do you categorize the following Welfare measures?
High Moderate Low
Allowances
Insurance
Loans
16. Did you receive your bonus?
Yes
No
Not Applicable
17. Did you receive your bonus on time as per the act?
Yes
No
Not Applicable
18. Does your organization follow Payment of Wages Act and Payment of Minimum
Wages Act?
Yes
No
19. How is the House Keeping Facilities inside the company?
o Best
o Good
o Poor
o Better
o Average
20. How are the working conditions inside the company?
o Excellent
o Very good
o Good

081
o Satisfactory
o Poor
21.Are you covered under medical insurance policy?
Yes
No
22. Does your organization follow all the procedures laid down in Shops and
Establishment Act?
Yes
No
23. Does your organization pay equal remuneration to both male and female employees
?
Yes
No
24.Any suggestions?
______________________________________________________________________
______________________________________________________________________
____

082