INTERNSHIP REPORT ON A STUDY ON WORKING CAPITAL ...
76
INTERNSHIP REPORT ON A STUDY ON WORKING CAPITAL MANAGEMENT AT LARSEN AND TOUBRO By: Mr. MANISH KUMAR SHARMA USN: 1NH14MBA68 Submitted to VISVESVARAYA TECHNOLOGICAL UNIVERSITY, BELGAUM In the partial fulfilment of the requirements for the award of the degree of MASTER OF BUSINESS ADMINISTRATION Under The Guidance of, Internal Guide External Guide Mr. SHASHI KUMAR Mr. DEEPAK Professor, Dept of Management Studies Regional Manager NEW HORIZON COLLEGE OF ENGINEERING ORR, MARATHALLI, BANGALORE -560103 BATCH-2014-16
-
Upload
khangminh22 -
Category
Documents
-
view
0 -
download
0
Transcript of INTERNSHIP REPORT ON A STUDY ON WORKING CAPITAL ...

INTERNSHIP REPORT ON
A STUDY ON WORKING CAPITAL MANAGEMENT AT
LARSEN AND TOUBRO
By:
Mr. MANISH KUMAR SHARMA
USN: 1NH14MBA68
Submitted to
VISVESVARAYA TECHNOLOGICAL UNIVERSITY, BELGAUM
In the partial fulfilment of the requirements for the award of the degree of
MASTER OF BUSINESS ADMINISTRATION
Under The Guidance of,
Internal Guide External Guide
Mr. SHASHI KUMAR Mr. DEEPAK
Professor, Dept of Management Studies Regional Manager
NEW HORIZON COLLEGE OF ENGINEERING
ORR, MARATHALLI, BANGALORE -560103
BATCH-2014-16


ACKNOWLEDGEMENT
Words are indeed inadequate to convey my profound gratitude and heartiest
thanks to all those who have helped me in making this project report. I will take
this opportunity to thank Dr.Manjunatha, Principal of NEW HORIZON
COLLEGE OF ENGINEERING, Bangalore.
I will take this opportunity to thank Prof. Sheelan Mishra, Head of Management,
for the constant support and encouragement and guidance. I would like to thank
internal guide Prof. SHASHI KUMAR for the valuable inputs provided to this
project, which were immensely helpful in applying various frame works to a
practical situation.
I would also like to thank my external guide Mr. Deepak at KANSBAHAL,
ODISHAwho assisted me and helped me in shaping and execution of the project.
This project has been a great learning experience for me and it would have not
been possible without the support of the guidance of above mentioned people.
Mr. Manish kumar Sharma
USN: 1NH14MBA68
TABLE OF CONTENTS
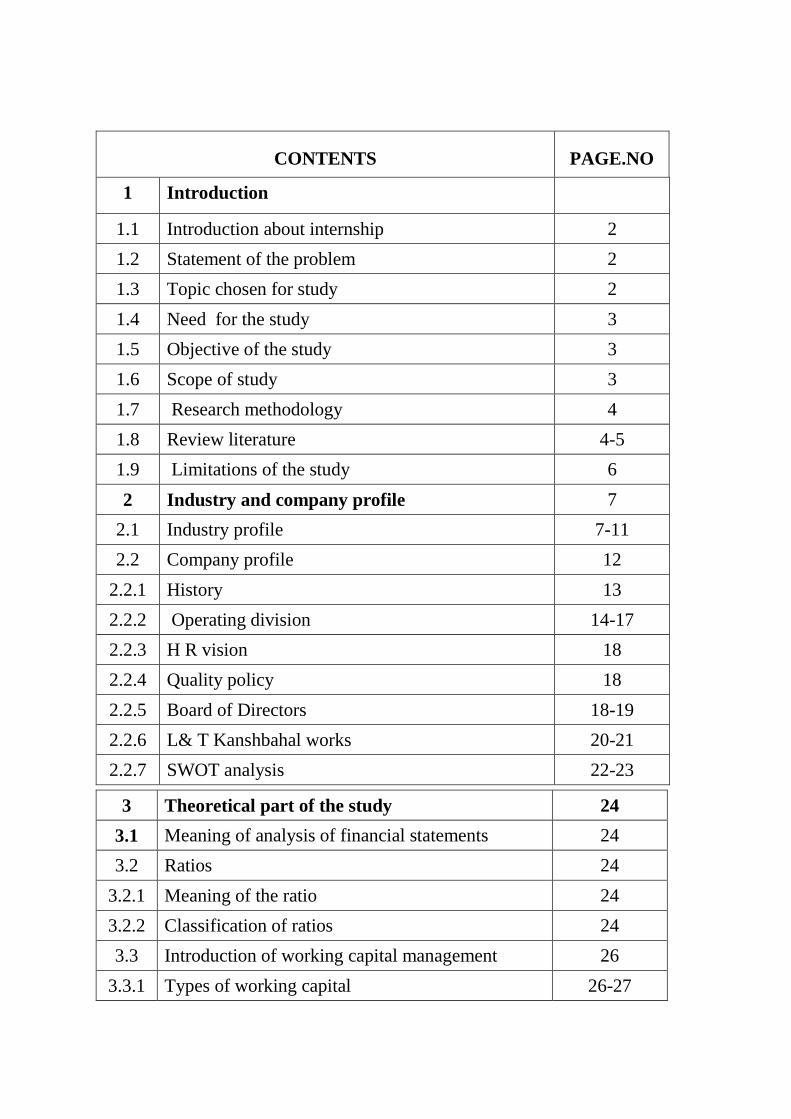
CONTENTS PAGE.NO
1 Introduction
1.1 Introduction about internship 2
1.2 Statement of the problem 2
1.3 Topic chosen for study 2
1.4 Need for the study 3
1.5 Objective of the study 3
1.6 Scope of study 3
1.7 Research methodology 4
1.8 Review literature 4-5
1.9 Limitations of the study 6
2 Industry and company profile 7
2.1 Industry profile 7-11
2.2 Company profile 12
2.2.1 History 13
2.2.2 Operating division 14-17
2.2.3 H R vision 18
2.2.4 Quality policy 18
2.2.5 Board of Directors 18-19
2.2.6 L& T Kanshbahal works 20-21
2.2.7 SWOT analysis 22-23
3 Theoretical part of the study 24
3.1 Meaning of analysis of financial statements 24
3.2 Ratios 24
3.2.1 Meaning of the ratio 24
3.2.2 Classification of ratios 24
3.3 Introduction of working capital management 26
3.3.1 Types of working capital 26-27

3.3.2 Operating cycle 28
4 Data Analysis And Interpretation 31
4.1 Gross working capital 31
4.2 Net working capital 31-32
4.3 Ratio analysis 32
4.3.1 Current ratio 32-34
4.3.2 Quick ratio 34-35
4.3.3 Activity ratio 35
4.3.4 Stock turnover ratio 36-37
4.3.5 Raw material holding period 38-39
4.3.6 WIP conversion period 39-40
4.3.7 Finished good conversion period 40-41
4.3.8 Inventory to current assets 41-43
4.3.9 Inventory to working capital ratio 43-45
4.3.10 Debtors turnover ratio 45-46
4.3.11 Average turnover ratio 46-47
4.3.12 Working capital turnover ratio 48-49
4.3.13 Asset turnover ratio 49-50
4.3.14 Profitability ratios
A . Net profit ratio
B. Operating ratio
C. Operating profit ratio
D. Expense ratio
50-55
5 FINDIGS, SUGGESTIONS AND CONCLUSION
Findings 56-57
Conclusion 58
Suggestion 59
ANNEXURE 60-64

LIST OF TABLES
Chart No Particulars Page No

4.1 Table on Gross working capital of the company 31
4.2 Table on Net working capital of the company 31-32
4.3 Table on Current Ratio of the company 32-34
4.4 Table on Quick Ratio of the company 32-33
4.5 Table on stock turnover Ratio of the company 36-37
4.6 Table on Raw materials holding period of the
company
38
4.7 Table on Work in progress conversion period
of the company
39
4.8 Table on Finished goods conversion period of
the company
40
4.9 Table on Inventory to current asset of the
company
42-43
4.10 Table on Inventory to working capital of the
company
44
4.11 Table on Debtor turnover ratio of the company 45-46
4.12 Table on Average collection period of the
company
46-47
4.13 Table on Working capital turnover ratio of the
company
48
4.14 Table on Asset turnover ratio of the company 49-50
4.15 Table on net profit ratio of the company 50-52
4.16 Table on Operating ratio of the company
52-53
4.17 Table on Operating profit ratio of the company
53-54
4.18 Table on Expense ratio of the company 54-55


EXECUTIVE SUMMARY
Working cycle is a measure of the working effectiveness and working capital administration
of an organization. A short working cycle is great as it tells that the organization's money is
tied up for a shorter period. Another helpful measure used to survey the working proficiency
of an organization is the money cycle (additionally called the money transformation cycle).
The construction industry is the second largest industry in India after agriculture. It accounts
for about 11% of India as GDP. It makes significant contribution to the national economy and
provides employment to large number of people.
Larsen and Toubro, contracted as L&T is an Indian Multinational Conglomerate whose
headquarters are in Mumbai. It was built up by two Danish engineers in 1938 by Henning
Holck Larsen&Soren Kristen Toubro. L&T is an advancement which has building,
improvement and amassing association. It is one of the greatest and most respected
associations in the Indian private zone.

1
CHAPTER 1
INTRODUCTION
1.1 Introduction about Internship
Internship provides the MBA student a life time opportunity to have an experience of the
corporate world and its atmosphere. The candidates can be able to see how different theories
which they have learnt in their educational period have been executed in the real practical
world of the business organization. The internship candidates fromdifferent specialization
selects the different topic and they can gain more knowledge relating to that topic through the
internship process within the organization. There is need of proper guidance and support from
the organization to the candidates for the successful internship process. The candidates have
the wonderful opportunity to explore the knowledge and contribute something new to the
organization. Internship is an crucial period in the life of a MBA student to learn something
relating to the operating process of the particular organization in which they have completed
their internship. The internship program sometime may end up with a permanent job in future
in most of the cases.
There is no doubt that an internship program is very much important in the carrier of a MBA
graduates as it provide the corporate knowledge, interaction with the corporate culture, proper
knowledge relating to the topic which selected by the candidates and how the theoretical
knowledge been implied, executed and followed in the real business world.
1.2 STATEMENT OF PROBLEM:
The important of working capital management stems from two reasons. The first is the
substantial portion of the investment is invested in current assets and the level of current
assets will change quickly with the variation in sales. Hence in this study, an attempt has been
made to analyze size and composition of working capital and whether such an investment has
increased or declined over a period after determining the requirement of current asset, one of
the important task of the financial is to select a group of appropriate source of finance for
current assets
1.3 Topic chosen for study
I have selected the topic named as “STUDY ON WORKING CAPITAL” in LARSEN and
TOUBRO. As we know every organization is required to have a sufficient level of working
capital in order to meet the current liability, expenses, and contingency in future. The topic I

2
chosen is simple but very much important as it is required to be managed properly in order to
be successful in long run of the business.
1.4 Need for study
Every organization requires a sufficient amount of working capital for the long run and
success of the business. It is important to have a surplus amount of cash or current asset in
order to meet the current obligation and expenses relating to the operation of the business and
maintaining the adequate amount of the inventories and the raw materials for the future time
period of the business.
1.5OBJECTIVES OF THE STUDY
To concentrate on the liquidity position of the association by investigating the
parts of the working capital.
To concentrate on the general working of the organization with connection to
the choice in regards to overseeing working capital.
To recommend the progression to be taken to build the effectiveness in
administration of working capital.
Correlation of different Working Capital Ratios for as long as four years 2010
to 2014. To concentrate on the different segments of working capital.
To dissect the working capital pattern.
To assess the usage of current resource and current liabilities and discover
inadequacies if any.
1.6 SCOPE OF THE STUDY
The focus of the training is on working capital activities at finance department and other
different departments related to this project at L&T ,Kansbahal Works.

3
1.7.RESEARCHMETHODOLOGY
SOURCES OF DATA
Primary sources:
Primary data refers to the data which has been collected for the first time and it has
not been used previously by anyone.
Collection of data from the people of finance department by discussion
Secondary sources:
The information gathered is through the optional source. The optional information are
which collected by another person and which have experienced by measurable
procedure. gathering of data from the yearly records and yearly reports from 2011 to
2015 gathering of information from magazines,journals of L&T ,Kansbahal Gathering
of information through web access .
1.8 LITERATURE REVIEW:
The following are the literature review which given by different authors and research
scholars.
Pass C.L., Pike R.H1(1984):this studied happened before 40 years ago that for the reason to
development in areas of longer-term investment and effective financial decision making.
many of this are new concept which is not used before and effectively implemented on
industrial practice .by contrast less attention given to the short term investment specially to
the working capital management. Such ignorance might be acceptable were give working
capital less importance but effective working capital has a very important and crucial role in
organization profitability and longer growth.

4
Beneda, Nancy; Zhang, Yilei7 (2008): this study about working capital management
describe the overall impact to the firm operating performance and also see the impact
because of growth new public companies.This study also give some light to the relationship
of working capital to debt level, firm risk and industry. Further this study describe that using
the sample of initial public offering (IPO) find significant bond between account receivable
and firm operating performance.
Thomas M. Krueger12 (2005)-:different level working capital studied describes the
performance of different industries which stable over time. This study helps of much industry
to improve their performance and increase their overall turnover. They had faced many
troubles ahead but this show that it takes firm to the continuously improvement stage they
able to achieve their goal which they had decided .this also helps to given top ranked to the
firm belong to the industry and motivate to them their continuously improvement.
Hard castle J5(2009)-:this study define that working capital not always consider gross
working capital but it consider sometimes ,and it simply refer to the company total current
assets, cash, marketable securities ,account receivable and inventory. But the longer term
financial analysis always consider strategic planning for future growth and working capital
management which is to deals with day to day operations, by consider that production do not
stop because of lack of materials and making sure that customer paying enough to pay the due
of the firm . Without working capital no firm can be efficient and profitable.
ThachappillyG6(2009) -: Working capital in cash conversion cycle maintain the cash or
maintain the flow of fund which firm require to carried out needed operation for the firm. i.e.
From the days to paying for raw materials to collecting cash from the customer. A firm buy
raw materials and operating supplies for continue the production process. Wages , salary and
other expenses are paid by the firm to converting the raw materials into the finished goods.
Firm allowed credit to customer for the specific time that is standard in the business which
have to maintain by every firm for future growth .

5
1.9LIMITATIONS
This study led and done is systematic and subject to taking after constraints:-
The study is for the most part completed in light of optional information gave
in the money related explanations.
This study depends on authentic information and data gave in the yearly
reports , in this manner it may not be a future marker .
There might be some partial contrasts in the figured proportions.
We can't do correlations with different organizations unless and until we have
the information of different organizations on the same subject .
A portion of the information's which were required for further examination
were secret and not accessible to the learners .
As the study was for limited ability to focus 06 weeks and because of absence
of time, different zones couldn't be engaged.

6
CHAPTER 2
2.1INDUSTRY PROFILE
The Industrial Revolution has given he birth to the machine and technology. Companies this
relating to this field grew out of iron foundries, shipyards, forges and repair shops.
Sometimes these companies are the combination of machine factory and shipyard. In the
20th century some of themotorcycle and automobile manufacturers started their own machine
manufacturing factories.
Before the industrial revolution a different variety of machines were available such as clocks,
weapons and running gear for mills (watermill, windmill, horse mill etc.) Production of these
machines was very less scale in artisan workshops mostly for the local or regional market.
With the introduction of the industrial revolution manufacturing began of composite tools
with more complex construction, such as steam engines and steam generators for the evolving
industry and transport. In addition, the emerging machine factories started making machines
for production machines as textile machinery, compressors, agricultural machinery, and
engines for ships.
18th century
The first industrial revolution start in England from 1750 before that labor usually was not
yet mechanized factories. In that 18th century there were many type of machines was invented
by the investor themselves also this was the first time that first steam engine was invented.
In the 1770s James watt did some improvement in that engine design which is easily
employable and produce large amount of energy .in England some certain cities concentrated
to manufacture or produce specific products such as textiles and pottery and after this
invention these type of industry also consider the mechanization. In 18th century some
countries are such like England, Britain and Belgium become the first machinery industry.
19th century
In the early of 19th century industrial revolution got boost with the upcoming railways this
because of innovation by the England of mining industry. Here they need for machinery

7
because working in coal mining was very hard and dangerous so they need tools which makes
they work easy and safe. In 1804, Richard made first steam engine and place it to rails, and
in 1825 they start to transport coals from mining to the port. For the apparatus business this
carried a wide range of new work with new hardware for metallurgy, machine instrument for
metalworking, creation of steam motors for trains with every one of its necessities and so on.
In time the business sector for the machine business got to be more extensive, specific items
were made for a more noteworthy national and regularly global business sector. For example,
in the half of the 19th century Americans gave order to England to produce machine or
machinery tools for them which is useful for the to steelmaking because their the techniques
were more advanced and effective compare to others .
20th century -now
The expression "machinery industry" appeared later in the nineteenth century. One of the
primary times this branch of industry was perceived in that capacity, and was researched, was
in a generation insights of 1907 made by the British Ministry of Trade and Industry.
That industry got divided into forty different categories, including for example, agricultural
machinery, machinery for the textile industry and equipment, and parts for train and tram.
The developments of new drive strategies taking into account electric engines, inner ignition
motors and gas turbines brought another era of machines in the twentieth century from autos
to family appliances. Not just the item scope of the machinery business expanded
impressively, particularly smaller machines could conveyed items in much more prominent
numbers created in large scale manufacturing . With the rise of large scale manufacturing in
different parts of the business, there was likewise an appeal for assembling and creation
frameworks, to build or increase the entire production.
Scarcity of availability of labor for agriculture industry in second half of 20th century which
increase the need or requirement for further mechanization of production or specific machine
which is helps in agriculture.
Shortage of labor in agriculture and industry at the beginning of the second half of the 20th
century, raised the need for further mechanization of production, which required for more
specific machines. The rise of the computer made further automation of creation conceivable,
which thusly set new demands on the machinery industry.

8
Product of the machine industry A machinery industry makes very diverse range of the products. A selection:
Engine
Steam turbine
Gas turbine
Pump

9
Compressor
Gear
Bearing of gas turbine
Climate control(of a hospital)
Tractor

10
Machine industry in different countries
Germany
In 2011 around 120,0000 people employed In Germany in which 900,000 people are in
Germany and 300,000are expected from abroad.the combined turnover of that industry in
Germany around €130 billion of which 60% came from exports.at that time there were 6,600
companies are active in that 95% companies strength are less than 500 people.each employee
belong to that industry average generated around 148,000 Euro . the biggest organizations in
Germany are DMG Mori Seiki AG, GEA Group, Siemens AG, and ThyssenKrupp.
France
In the France the machinery industry had generated around 98 billion Euros in 2011.there
were around 650,000 people are employed at that time. The annually turnover had fallen
between 20-15 percent because of the crisis. because of the consumer spending and
continuing demand from the energy sector and transport sector the damage happened with the
crisis is still limited.
Netherlands
In 1996 in the Netherlands approximately 2,500 companies were present and the strength of
people employed over there at that time is around 93,000, in which around 1000 of these
companies having strength of employed people is less then 20 or more employees.according
to the chamber of commerce in 2011 around 15,000 companies were active which belong to
machinery industry some of largest companies in Netherlands like Lely (company) ,Philips
and stork B.V
United states

11
The United States is the world's biggest business sector for machinery, and in addition the
third-biggest supplier.in 2011 U.S machinery industry had total sales of $413.7 billion this is
consider both domestic as well as foreign . American producers held a 58.5 percent offer of
the U.S. household marke

12
2.2COMPANYPROFILE
OVERVIEW
Larsen and Toubro, contracted as L&T is an Indian Multinational Conglomerate whose
headquarters are in Mumbai. It was built up by two Danish engineers in 1938 by Henning
HolckLarsen&Soren Kristen Toubro. L&T is an advancement which has building,
improvement and amassing association. It is one of the greatest and most respected
associations in the Indian private zone. Client centered methodology alongside nonstop
mission for world class quality has made it feasible for the organization to exceed
expectations, accomplish and support initiative in the greater part of its real lines of business.
It has a universal vicinity and it has workplaces and assembling offices in numerous nations.
Because of the International business, the abroad profit have become fundamentally.
L&T has an OK advancing and scattering arrange, and have developed a reputation for strong
customer backing. L&T similarly places stock in down to earth improvement. Progress must
be proficient in congruity with nature. A guarantee to gathering welfare and normal security
are an imperative bit of corporate vision.

13
2.2.1 HISTORY
L&T was established in present day Mumbai (prior knows as Bombay) in 1938 by two
Danish engineers, named H.H Larsen and S.K Toubro. Two were unequivocally dedicated to
building up India's designing capacities to meet the requests of the business.
H.H Larsen
Starting with the import of apparatus from Europe, L&T quickly tackled designing and
development assignments of expanding advancement. Today, the organization sets
worldwide building benchmarks regarding scale and multifaceted nature.
S.K Toubro

14
OPERATING DIVISIONS
L&T organizations have been extensively gathered into six business divisions viz:
Engineering and Construction Projects (E&C)
Heavy Engineering Division (HED)
Electrical and Electronics Business Group (EBG)
Information Technology (IT)
Machinery and Industrial Products Division (MIPD)
L&T Solar
L&T Power
1) ENGINEERING & CONSTRUCTION PROJECTS (E&C):
Largest business portion
Serves to process innovation, essential and definite building, overwhelming
designing and measured creation, acquirement, logistics, development, erection,
appointing and extend administration. It executes ventures on turnkey premise.
L&T has effectively conveyed EPIC administrations for some tasks in the
upstream hydrocarbon division in the course of the most recent two decades in
India, Africa, South-East Asia and Australia.
The organization has effectively finished super undertakings managing underway
of stages, procedure offices, subsea pipelines, seaward and coastal pre-collected
modules,
The organization has additionally effectively finished significant undertakings for
GAIL and OIL India Limited. Worldwide customers of mid and downstream

15
division incorporate Petroleum Development Oman, Dolphin Energy and Saudi
Aramco. L&T has more than 38000 representatives in India.
II) HEAVY ENGINEERING DIVISION (HED):
L&T is asserted to be among the main five manufacture organizations on the planet.
The Heavy building division produces and supplies specially crafted and designed basic
hardware and frameworks to the requirements of center area commercial ventures and the
resistance part. Exercises are sorted out under independent Strategic Business Units (SBUs).
Its pioneer in the field of innovation advancement, hardware, fabricates and site/plant
administrations. It has accomplished the prestigious INS Industrial Excellence
Award' for extraordinary commitment in the atomic segment.
L&T additionally has had a long and close relationship with the Indian Space
Research Association. It built up the Naval Multi-Barrel Rocket Launcher.
III) ELECTRICAL & ELECTRONICS BUSINESS GROUP (EBG):
L&T is a worldwide maker of an extensive variety of electrical and gadgets items and
frameworks.
It's occupied with the matter of low voltage Switchgear items, Electrical Systems,
Energy meters, Medical supplies, Petroleum apportioning pumps, Automation
arrangements and Enterprise organizing.
Largest producer of low voltage switchgear and control gear in India. It fabricates for
modern areas such as force, refineries, petrochemicals and concrete in the electronic
fragment.
EBG items take into account the requirements of different clients including
agriculturists, urban family units and business structures.

16
Its items are required in social insurance types of gear as cutting edge assurance,
control and robotization in various businesses.
IV) INFORMATION TECHNOLOGY:
L&T InfoTech Limited gives far reaching, end-to-end programming answers for
customers in the field of managing an account and budgetary administrations,
protection, vitality and petrochemicals and in addition fabricating everywhere
throughout the world.
It concentrates on: Manufacturing, Banking, Securities and Insurance, Utilities and
Interchanges, Embedded frameworks.
administrations, Strategy Consulting, Value Added administrations.
Larsen and Toubro InfoTech Limited, a 100 for every penny reinforcement of the
L&T, offers programming and organizations with a consideration on Manufacturing,
BFSI and Communications and Embedded Systems. It in like manner gives
organizations in the introduced understanding and e Engineering space.
V)MACHINERY & INDUSTRIAL PRODUCTS DIVISION (MIPD):
Caters to the necessities of the mechanical apparatus, development supplies and
modern items business fragments.
It appreciates market driving capacities in item plan, process innovation, obtainment,
venture administration, promoting and benefits support including charging.
It offers items and administrations for all the business verticals, keeping up stringent
conveyance plans.

17
L&T fabricates advertises and gives administration backing to basic development and
mining hardware surface mineworkers, water driven excavators, total crushers, and
vibratory compactors.
It supplies an extensive variety of elastic handling hardware and fabricates and
advertises mechanical valves and associated items and an extensive variety of use
designed welding combinations.
VI) L&T POWER:
L&T are set up to focused on the opportunities basically from the coal ,gas and
nuclear based power projects.
In 2008-09 firm focus to set up and progress in manufacturing facilities for critical
boilers and turbines at HAZIRA on India’s west coast.
L&T offers turnkey solutions for large i.e. up to 1000 MW for coal based and gas
based power plants.
L&T also signed technical collaboration with CLYDE BERGEMANN.
VII) L&T SOLAR:
This company also takes some solar projects on turn-key on EPC basis.
In April 2012 L&T become a largest photo voltaic based power plant (40
MWp) and the owner for this project is reliance power at jaisalmer Rajasthan.
In 2011 L&T entered with partnership for turn-key EPC in megawatt solar
project and there were planning to construct 100MW in next 12 months in
most of metros and the partnership held between L&T and sharp.
L&T is embraced sun based warm plants and in addition rooftop top
frameworks notwithstanding generally archived sunlight based voltaic taking
into account sun based vitality frameworks.

18
2.2.3HR Vision:
Our HR vision is to develop competent self-motivated team of job owners striving for
excellence in a congenial environment with customer orientation.
2.2.4 Quality Policy:
Adhere strictly to quality parameters at all stages to provide products/services
conforming to customers requirement and satisfaction.
Most requirements of quality management system and strive to continually improve
its effectiveness.
Develop competent human resource through planned training to the employees.
Establish quality objectives and review periodically to achieve continual improvement
2.2.5 BOARD OF DIRECTORS
MR. A. M. NAIK - Group Executive Chairman
MR. K. VENKATARAMANAN - Chief Executive Officer and Managing Director
MR. M. V. KOTWAL - Whole-time Director and President (Heavy Engineering)
MR. S. N. SUBRAHMANYAN - Whole-time Director and Senior Executive Vice
President (Construction and Infrastructure)
MR. R. SHANKAR RAMAN - Whole-time Director and Chief Financial Officer
MR. SHAILENDRA ROY - Whole-time Director and Senior Executive Vice
President (Corporate Affairs and Power)
MR. S. RAJGOPAL - Independent Director
MR. S. N. TALWAR - Independent Director

19
MR. M. M. CHITALE - Independent Director
MR. N. MOHAN RAJ - Nominee of LIC
MR. SUBODH BHARGAVA - Independent Director
MR. A. K. JAIN - Nominee of SUUTI
MR. M. DAMODARAN - Independent Director
MR. VIKRAM SINGH MEHTA - Independent Director
MR. SUSHOBHAN SARKER - Nominee of LIC
Organization Information
Company Secretary - Mr. N. Hariharan
Registered Office - L&T House, Ballard Estate, Mumbai - 400 001
Auditors - M/s. Sharp &Tannan
Solicitors - M/s. ManilalKher Ambalal and Co.
Registrar and Share Transfer Agents - Sharepro Services (India) Private Limited
20
2.2.6L&T-KANSBAHAL WORKS
Kansbahal works is situated close Rourkela (Odisha), is state's biggest substantial building
unit. Kansbahal Works, a unit under the Machinery and Industrial Products Division of L&T,
is a world class Integrated Machine Building Center with Facilities for throwing, Fabrication,
Machining and Assembly, complimented by great configuration, designing, quality control
and logistics support. Set up in 1962 as an Indo-German Venture under the name of Utkal
Machinery Limited (UTMAL) to serve the steel and paper industries to substitute imports.
On inception it had four partners‘ viz.GHH, VOITH, KOOPERS and L&T.
In the year 1982; it finally came under the umbrella of L&T group after full acquisition of
shares. It however remained a cost centre for L&T serving several business divisions of the
company and in October 1999, it was structured as a Strategic Business Unit (SBU).
L&T, Kansbahal works is situated in sylvan surroundings of Kansbahal, Odisha. It is 25 km
away from Rourkela and 15 km from Rajganpur in the district of Sundergarh, Odisha. It is
well connected by roads and railways. Kansbahal works is one of the oldest factories in the
arsenal of L&T‘s manufacturing bases. It has licensed annual capacity 12000tones.It is an
ISO 9001 certified works. The business portfolio incorporates Crushing and screening
frameworks, Pulp and Paper hardware, Windmill parts, Cast items and different other
mechanical items. It has advanced into a world class coordinated assembling focus with
offices for Fabrication, Machining, Assembly and Casting. This is supplemented by
magnificent outline, building, quality control and logistic ability. Kansbahal works fabricates
and supplies Heavy hardware, Crushing types of gear, Paper apparatus and Foundry types of
gear for Power plants and Windmill. The responsibilities to quality and consumer loyalty are
the driving powers for every one of its exercises. The sympathy toward environment is an
essential part of the company vision.
It produces a scope of steel, Iron and Alloy Iron including spheroidised graphite iron giving a
role as well as paper going barrels in vertical pits away to 2000-mm width and 7500 mm
length. Affirmed by Lloyd's register of hipping, London, for production of different
evaluations of ferrous castings, the foundry can make a solitary piece throwing of most
extreme 14 tons in steel, 22 tons in cast iron and 18 tons in spheroidised graphite iron. The
creation shop has a developed region of 9525 sq.m and can deal with a solitary unit of
greatest 100 tons.

21
The L&T Kansbahal Works has four main shops and they are:
1. Foundry shop
2. Machine Shop
3. Fabrication Shop
4. Assembly Shop
5. Wheel loader
Products:
1. Paper and pulp machineries
2. Crushing equipment’s for mining ,limestone and minerals
3. Various Foundry Castings
4. Steel plant equipment
5. Surface Minor
6. Hub Casting and Fabrication items for Windmill power sector
22
2.2.7 SWOT Analysis L&T Kansbahal
STRENGTH
(Capacities)
Solid industry base
Managed development underway and trades Easy accessibility of generation assets
Surplus generation for nearby and fare advertises Good neighborhood and global
notoriety
SHORTCOMINGS
(Failures)
Association with their suppliers in remote region.
Scope of business sector in not attractive Reduce the expense of merchandise sold.
Absence of Innovation and Technology Development.
Lack of fund to finance a new project

23
OPPORTUNITIES
Future Growth Potential Rising Demand
Developing Export Markets
Adding to a Long Term Vision and Strategy Research to Develop New Products
Concentrate on Cost Optimization Availability of Finance
THREATS
Workforce Challenges (Trade Union) Reduction In deals
Absence of Professional Expertise inside of Industry
Reliance on Cartelization for satisfactory Revenue Lack of Research and
Development.

24
CHAPTER 3
3 THEORTICAL BACKGROUND
3.1MEANING OF ANALYSIS OF FINANCIAL STATEMENTS
The analysis helps the firm to evaluate or interpret financial conditions of the company in
every year so this will helps the company to know the actual positions or performance of the
company. This evaluation can be done according to company profits.
3.2 RATIOS
3.2.1Meaning of the ratio
A ratio is a tools which is used to know the financial performance of the 2 or more years
according to the data given in the balance sheet and profit and loss account. It should be
expressed in the various forms such as quotient, a rate, and a percentage.
3.2.2 CLASSIFICATION OF RATIOS
ON THE BASIS OF TRADITIONAL CLASSIFICATION
A. Balance sheet ratios:
Current ratio
Quick ratio
Proprietary ratio
B. Income statement ratios are:
Gross profit ratio
Operating profit ratio
Net profit ratio
Expenses ratio
C. Composite or Mixed Ratios:
Return on proprietor’s fund ratio
Return on capital employed ratio
Debtors turnover ratio
Creditors turnover ratio
Inventory turnover ratio

25
ON THE BASIS OF FUNCTIONAL CLASSIFICATIONS
Liquidity ratio
Leverage ratio
Activity ratio
Profitability ratio
ON THE BASIS OF SIGINIFANCE OR IMPORTANCE
Liquidity ratios:
Solvency ratios:
Activity ratios:
Profitability ratios:
ACCORDING TO THE CLASSIFICATION OF NATURE IN
FINANCIAL ANALYSIS
Primary ratio
Secondary ratio
ACCORDING TO THE CLASSIFICSTION OF TIME
Structural ratio
Trend ratio
3.3 WORKING CAPITAL MANAGEMENT
Working capital plays an important role for the organization and it is necessary that a proper
plan must be available to manage the firm working capital. It includes both current assets and
the current liability for the calculation of working capital. As per the net working capital
concept the difference between the current assets and current liability is the firms net working
capital. And on the other hand as per the gross working capital concepts the sum total of the
total current asset represents the working capital. A Working capital management plays the
important role by ensuring that an organization has sufficient exchange resource out
solicitation to meet its passing liabilities, responsibilities and working expenses. Having a
sufficient level of working capital management system is a remarkable way for a few
organization to improve their payment capacity. The two essential parts of working capital
management are current asset and current liability.
A couple key execution extents of a working capital management system are the working
capital extent, stock turnover and the social occasion extent. Extent examination will lead
organization to perceive domains of concentrate, for instance, inventory management, cash
management, records of receipts and payment of the organization.

26
If the total of current assets are less than the total amount of current liabilities, it results to the
working capital deficiency, in simple manner it is called as shortage of working capital.
An organization will be having assets and its advantage however short of liquidity if its focal
points can't instantly be converted into cash. Positive working capital is very important to
ensure that a firm is able to continue with its operations and that it has sufficient resources or
the assets to meet the current liability andable to meet the other operating expenses. The
working capital management is useful for directing inventories, cash due and payable.
The key estimation of the working capital is done on the reason of the gross current assets of
the firm.
Gross working capital = Total Current assets
Net working capital = Current assets – Current liabilities.
Net working capital provides the positive or negative results. If the total of current asset is
more than the total of current liability then it means that the firm has the sufficient amount of
working capital to meet its current liability. On the other hand if the current assets is less than
the total current liability then it shows the negative working capital which means that the firm
has not the sufficient amount of current asses to meets its current liability.
Kinds of working capital

27
1) Permanent working capital: it is likewise called settled working capital. It intends
to bear on the everyday costs the firm is required to keep up the base measure of working
capital. For instance the firm is required to keep up the base level of crude material,
completed merchandise or money parity and so forth.
a) Regular working capital-it implies the base sum which the firm needs to keep with
itself to bear on the everyday operation.
b) Reserve working capital-it implies the overabundance sum over the normal working
capital for questionable circumstances such as strike, lock out, misery and so on.
2) Temporary working capital: it is also known variable working capital which is used
to meet occasional requirement and also for additional purpose.
a) Seasonal Working Capital-it is required to meet the regular requirement of the
venture.
b) Special Working Capital- it is required for some uncommon purposes of the
venture. For instance publicizing the result of the firm requires extraordinary working capital.
Brief working capital is for brief period and changes while perpetual working capital is
steady and altered.

28
OPERATING CYCLE
Operating cycle represents the total amount of days an organization requires to convert its
inventories in genuine cash. It levels with the time taken in maintaining inventories not with
standing the time required in recovering cash from trade receivables. This is called as operating
cycle because this is a method of purchasing inventories, offering products in credit, and at the end
recovering cash from customers in exchange of the credit sales, and after that using those cash to
purchase inventories, raw materials etc and it is always keeping going ahead as like circle thus it is
called as the operating cycle.
Operating cycle is helpful for measuring the working effectiveness and efficiency of working
capital management of an organization. A shorter operating cycle is good as it results that the cash
from the credit sale is been received earlier and cash is available to meet other expenses, and
investing in the raw material and inventories.
The accompanying are all elements that impact the term of the operating cycle:
The installment terms reached out to the organization by its suppliers. Longer installment
terms abbreviate the operating cycle, following the organization can defer paying out
money.
The request satisfaction arrangement, since a higher accepted starting satisfaction rate
expands the
measure of stock close by, which expands the operating cycle.
The credit arrangement and related installment terms, subsequent to looser credit compares
to a more drawn out interim before clients pay, which amplifies the operating cycle.
Consequently, a few administration choices (or arranged issues with business accomplices) can
affect the operating cycle of a business.
Analyzing the operating cycle of a potential get can be especially helpful, since doing as such can
uncover courses in which the acquirer can adjust the operating cycle to decrease money
prerequisites, which might balance a few or the greater part of the money expense expected to
purchase the secure.

29
Determination of the length of working and money cycle:
The length of operating cycle of an assembling firm is the whole of
Operating cycle = Inventory change period+ receivable transformation period
= RMCP+WIPCP+FGCP+ Debtors CP- Creditors CP
RMCP(Raw materials conversion period) = Average stock of raw materials
Material consumption/365

30
Average stock of raw materials = (opening stock of RM+ Closing
Stock of RM)/2
Material Consumed during the year= Opening stock of RM + Purchases – closing
stock.
WIPCP (Work in progress conversion period) = Avg. stock of raw material
Total cost of production per day
FGCP (Finished goods conversion period)=Avg. stock of finished goods
Total cost of goods sold per day
RCP (Receivable conversion period) :
It is ordinary time taken to change over obligated people into cash. RCP addresses the
ordinary collection period. It is the time required to assemble the noteworthy aggregate
from the customers.
Hence RCP= Receivable conversion period
= Avg. accounts receivable
Net credit sales per day
PCP(Payables Conversion Period)
It means that credit value according to suppliers and loan bosses ,since it demonstrates to
what extent they are willing to sit tight for installment .

31
CHAPTER 4
DATA ANALYSIS AND INTERPRETATION
4.1 GROSS WORKING CAPITAL
Gross working capital of L&T Kansbahal works for the last four years:
All figures are in Rupees
Current As on As on As on As on Assets 31-3-2012 31-3-2013 31-3-2014 31-3-2015
Inventories 732,891,622 1,292,272,077 1,191,653,112 1,109,372,449
Trade 746,161,152 952,803,991 988,310,861 1,204,042,947 Receivables
Cash and bank 53,316 165,323 92,600 19,386,237 Balances
Short term loans 102,670,535 100,886,250 91,549,829 145,667,051 and advances
Total Current
Assets 1,581,776,625 2,346,127,641 2,271,606,402 2,478,468,684
Sources: Balance sheet Table 1
We know that gross working capital is equal to current asset, hence the respective Gross
Working Capital for the respective years are in the table as shown. From the total working
capital we can see that it is steady over the years. However to study the real short term
financial liquidity, its advised to look at the trends of net working capital. L&T ,Kansbahal
Works always insists on net working capital.
4.2 NET WORKING CAPITAL
The equation for net working capital (NWC), now and again alluded to as essentially working
capital, is utilized to decide the accessibility of an organization's fluid resources by
subtracting its present liabilities. Current Assets are the benefits that are accessible inside of
12 months. Current Liabilities are the liabilities that are expected inside of 12 months.
Net working capital= Current assets- current liabilities
To figure the Net working capital we require the Current resources and current liabilities data
for individual years. Now, from the balancesheet , we see the figures to be

32
All figures are in Rupees
Current As on As on As on As on
Assets 31-3-2012 31-3-2013 31-3-2014 31-3-2015
Inventories 732,891,622 1,292,272,077 1,191,653,112 1,109,372,449
Trade 746,161,152 952,803,991 988,310,861 1,204,042,947 Receivables
Cash and 53,316 165,323 92,600 19,386,237 bank balances
Short term loans 102,670,535 100,886,250 91,549,829 145,667,051 and advances
Total current
Assets 1,581,776,625 2,346,127,641 2,271,606,402 2,478,468,684
(TCA)
Current As on As on As on As on
Liabilities 31-3-2012 31-3-2013 31-3-2014 31-3-2015
Short term (66,755,322) (10,208,686) 1,395,862 307,682 Borrowings
Current 682,260,091 824,015,044 822,123,070 1,107,015,021 maturities of long
term borrowings
Other current 285,125,024 293,472,765 198,080,860 173,821,741 Liabilities
Short term 5,250,000 5,040,000 4,695,600 4,460,400 Provisions
Total current 905,879,793 1,112,319,123 1,026,295,392 1,285,604,844 liabilities(TCL)
Net working 675,896,832 1,233,808,518 1,245,311,010 1,192,863,840
capital (CA-CL)
Sources: Balance sheet Table 2
4.3Ratio Analysis
LIQUIDITY RATIO
4.3 .1 CURRENT RATIO = Current Assets / Current
Liabilities
All figures are in Rupees
Year Current assets Current liabilities CA/CL Ratio
2011-12 1,581,776,626 905,879,793 1.74

33
12-13 2,346,127,640 1,112,319,123 2.10
2013-14 2,271,606,402 1,026,295,392 2.21
2014-15 2,478,468,684 1,285,604,844 1.92
3,000,000,000.00
2,500,000,000.00
2,000,000,000.00
1,500,000,000.00
Current Assets
1,000,000,000.00
Year
500,000,000.00
0.00
1 2 3 4
1,400,000,000.00
1,200,000,000.00
1,000,000,000.00
800,000,000.00
600,000,000.00
400,000,000.00
200,000,000.00
Current Liabilities
0.00
1 2 3 4
ANALYSIS: In below diagram showing current ratio from 2011 t0 2015. In which it
shows the standard ratio is 2.109 which they are getting in 2012 -13 and highest they getting
2013-14 which is 2.213

34
current ratio
2.5
2 2.109 2.213
1.927
1.746
1.5
1 current ratio
0.5
0
2011-2012 2012-2013 2013-2014 2014-2015
INTERPRETATION
Current proportion is a measure of liquidity of an association at a particular date. Current
proportion must be inspected over a time allotment. Increase in current proportion over a time
span may propose improved liquidity of the association or a more preservationist approach to
manage working capital organization. A reducing design in the present proportion may suggest
a disintegrating liquidity position of the business or a leaner working capital push of the
association through the allocation of more viable organization practices. Standard proportion is
2:1. In the year 2011-12 the proportion was 1.74:1 which increments to 2.09:1 in the year
2012-13. Step by step the proportion increments to 2.13:1 in the year 2013-14 lastly reductions
to 1.92:1 in the year 2014-15. It is close to standard proportion which is great and can be
received.
4.3.2 QUICK RATIO = (Current Assets - Inventories) / Current Liabilities
All figures are in Rupees
Year Liquid assets Current liabilities LA/CL Ratio
2011-12 848,885,004 905,879,793 0.93
2012-13 1,053,855,563 1,112,319,123 0.94
2013-14 107,995,3290 1,026,295,392 1.05
2013-15 2,368,096,235 1,285,604,844 1.84

35
ANALYSIS: In 2014-15, the quick ratio is high when contrasted with ideal 1:1. In
different years it was near 1 which was great. In 2011-12 to 2012-13 company
maintain stable quick ratio which is 0.93 to 0.94. 2013-14 company start growing.
QUICK RATIO
2 1.84
1.5
1.05
0.93
0.94
1
QUICK RATIO
0
2011-2012 2012-2013 2013-2014 2014-2015
INTERPRETATION: -quick proportion is a marker of dissolvability of an
element and must be examined over a timeframe furthermore in the connection of the
business the organization works in.In any case, associations must fulfill the right
agreement between liquidity risk rising up out of a low smart proportion and the threat
of mishap coming to fruition on account of a high rapid proportion. In 2014-15 , the
brisk proportion is high when contrasted with ideal 1:1 . In different years it was near 1
which was great .
So it gave adequate influence In 2014-15 it is too high on the grounds that the
organization is seeing to keep up it's position even in extremely capricious business
circumstances . Snappy proportion is in this manner a more dependable measure of
liquidity for assembling organizations and development firms that have moderately
abnormal amounts of stock, work in advancement and receivables than the present
proportion .
4.3.3Activity ratio
Resources are placed assets into various assets in business to make arrangements and
increase advantages. The profitability with which assets are managed particularly impacts
the volume of offer. Movement ratio measure the capability in addition, suitability with
which a firm manages its advantages or assets. These ratio are similarly called turnover
ratio.

36
4.3.4 Stock turnover ratio: Every firm maintain specific level of stock which is
required to finish the products to meet the necessities of the business. Yet the level of stock
of the firm should not be nor too high nor too low.
All figures are in Rupees
Year Net Sales Average inventory Ratio(times)
2012-13 2,782,924,202 1,012,581,850 2.74
2013-14 2,473,640,447 1,241,962,595 1.99
2014-15 2,731,011,684 1,150,512,780 2.37
ANALYSIS: In the below graph we can see that in 2012-13 the proportion was 2.74 &1.99
in the year 2013-2014 and then it increases to 2.37in the year 2014-15, the company holds a
good position without blocking of its money in inventories.
Ratio(times)
2.74
3
1.99
2.37
2.5
2
1.5
Ratio(times)
1
0.5
0
2012-13 2013-14 2014-15
INTERPRETATION: there is no reliable rule or standard stock turnover proportions.
commonly a high stock turnover demonstrates capable organization of stock since more a
great part of the time the stocks are sold, the lesser measure of money is required to back the
stock. A low stock proportion demonstrates an inefficient organization of stock. A low stock
turnover proportion suggests over interest in stocks, poor asset administration. Too high
turnover proportion is likewise not satisfactory as it diminishes benefit by expanding cost.

37
Days of stock holding
=days in a year/stock turnover ratio
All figures are in Rupees
Days of stock Holdings
F.Y No. of days stock Turnover Days of inventory
proportion holdings
2012-13 365 2.74 133.21
2013-14 365 1.99 183.41
2014-15 365 2.37 154.01
ANALYSIS: the below graph show that number of days to holding inventory. In 2013-14 number of
holding inventory was high compared to the other different years. in 2013-14 firm holding stock till
183.41 which was very high.
Days of inventory holdings
200 183.41
180
154.01
160
133.21
140
120
100
Days of inventory holdings
80
60
40
20
0
2012-13 2013-14 2014-15
INTERPRETATION:
The above chart demonstrates that in the year 2013-14 have a high number of days in stock. This
show there is a blockage of Inventory to some extent due to delay in lifting of materials by
customer. But in the year 2012-13 was having a low inventory which indicates the company is
maintain at optimum level of stock on hand to meet demands.

38
4.3.5 RAW MATERIALS HOLDING PERIOD:
Raw materials holding period= 365
Raw materials inventory turnover
All figures are in Rupees
RM Inventory
Year Days Turnover RM holding period
2012-2013 365 1.88 194.14
2013-2014 365 2.52 144.84
2014-2015 365 2.31 158.00
Source: balance sheet
ANALYSIS: The below graph shows that 2012-13 company holding raw material was 194.14
which was very high compared to other different years. In 2013-14 holding period was 144.84
which was increased in 2014-15.
Raw materials holding period
194.14 200
158.01 144.84
150
Raw materials holding
100
Period
50
0
2012-2013 2013-2014 2014-2015
INTERPRETATION:
Raw materials include number of items some of them require to procure longer period
of time and some of them require shorter period of time.
In 2012-13 the raw materials holding period was 194 which is very high.

39
In 2013-14 raw materials holding period was less which shows there is no blockage in
the working capital.
In 2014-15 again the holding period increased to 158 days.
4.3.6 WORK IN PROGRESS CONVERSION PERIOD:
Work in progress conversion period =Average work in progress inventory
Cost of production per day
e.cost of f.WIP a.opening D.Cost of production per conversion
Year WIP b. closing WIP c.Avg(a+b)/2 production day(d/365) period(c/e)
2012-
13 732,891,622 1,292,272,077 1,012,581,850 2,526,210,030 6,921,123 146
2013-
14 1,292,272,077 1,191,653,112 1,241,962,595 2,487,150,476 6,814,110 182 2014-
15 1,191,653,112 1,109,372,449 1,150,512,781 2,385,304,515 6,535,081 176
ANALYSIS: below graph reveals that period of semi-finished work that was 146 in 2012-13
and it increase in 2013-14 and again decreased to 176 in 2014-15.
WIP conversion period
200 182
176
146 150
100
WIP conversion period
50
0
2012-13 2013-14 2014-15
Cost of production amount taken from total expenditure excluding finance cost.

40
INTERPRETATION:
Work in advancement transformation period is the normal regular time taking the work
which is in progress or semi completed.to finish the semi completed work in advancement.
Work in progress conversion period in the year 2012-13 was 146 days .In the year 2013-14 it
is expanded to 182 days and declined in the year 2014-15 i.e. 176 days.
This is thought to be a decent sign as the products are worked upon proficiently and no
addition in the time taken to process merchandise. It is a sign of faster conversion of WIP
into finished goods, resulting in faster sales & better working capital.
4.3.7 FINISHED GOODS CONVERSION PERIOD
Finished Goods Conversion Period = Average finished goods inventory
Cost of goods sold per day
All figures are in Rupees
FG COGS
Year Opening stock Closing stock Avg. FG Inventory
2012-13 81,715,911 55,875,509 68,795,710 1,490,307,168 17
2013-14 55,875,509 41,669,376 48,772,442 1,565,411,024 11
2014-15 22,357,496 19,870,496 21,113,996 1,887,685,903 4
ANALYSIS: Below graph reveals that finished good conversion period , in 2012-13 the finished
goods conversion period was very high it was 17. But in 2014-15 company decreased the finish
goods period to 4 which was good sign for the company.
FG Conversion period
17 18
16
14
11
12
10
FG Conversion period
8
4
6
4
2
0
2012-13 2013-14 2014-15

41
INTERPRETATION:
The completed merchandise transformation period is the normal time taken to
offer completed items. In 2012-13 the average time taken to sell finished
products was 17 days.
In 2013-14 it has decline to 11 days.
However, in 2014-15 the time taken to sell the finished products further decreased to
4 days. So, as we see that time taken to sell the finished goods is decreasing which is
considered to be a good indicator.
The reason for decrease:-
Better advertisement
Improve the facilities e.g transportation and decreasing the time of delivery of good
from manufacture to unit of buyer
In L&T, kansbahal production process is such that maximum of goods are stored as work in
process processed as per customer needs.
4.3.8 INVENTORY TO CURRENT ASSETS
The proportion demonstrates the measure of enthusiasm for stock per rupee of current
assets venture. Generally an extending degree of stock is definite of inefficient stock
organization. The extent may in like manner demonstrate the state of liquidity position of
concern. The lower the stock to current assets cuts down the liquidity when stood out from
other current assets, viz., receivables, cash and attractive securities.

42
Inventory to Current Asset= Total inventory/
Total Current Assets
All figures are in Rupees
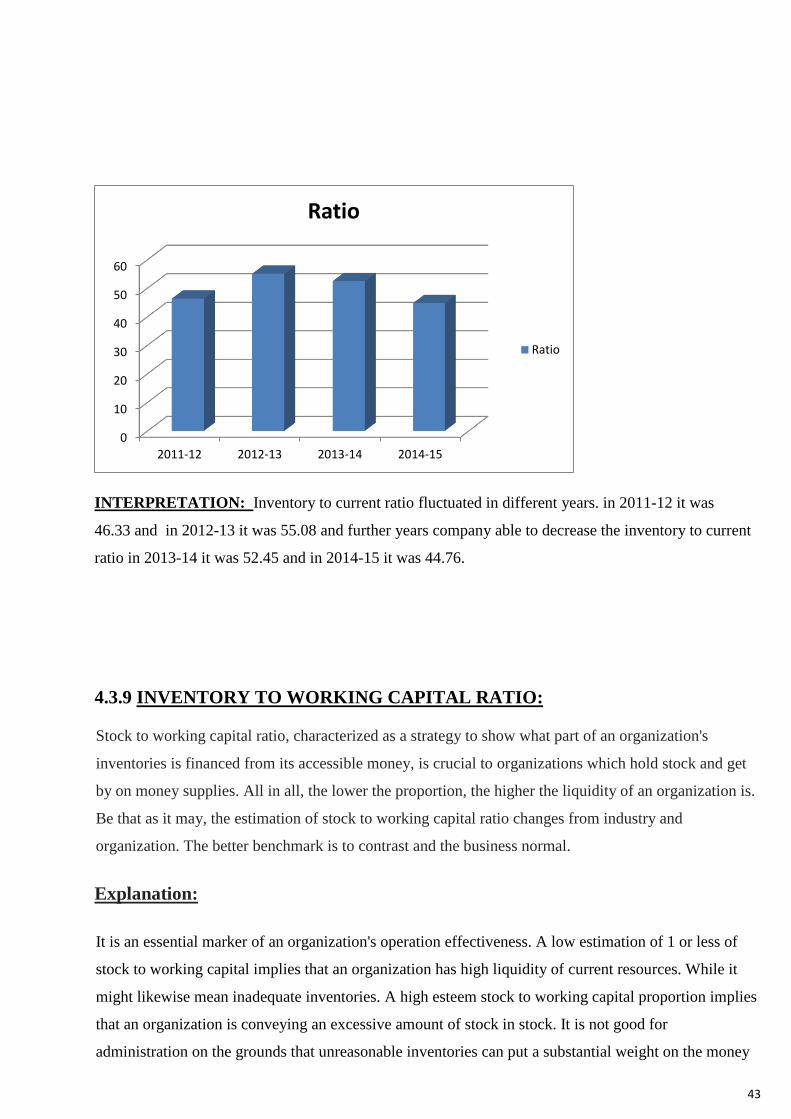
Year Inventory Current assets Ratio
2011-12 732,891,622 1,581,776,626 46.33
2012-13 1,292,272,077 2,346,127,640 55.08
2013-14 1,191,653,112 2,271,606,402 52.45
2014-15 1,109,372,449 2,478,468,684 44.76
Source: balance sheet
ANALYSIS: The below graph reveals that the inventory to current asset ratio in 2011-12
was 46.33 and in 2012-13 it was 55.08 and in 2013-14 it 52.45 and in 2014-15 it was 44.76
respectively.
43
INTERPRETATION: Inventory to current ratio fluctuated in different years. in 2011-12 it was
46.33 and in 2012-13 it was 55.08 and further years company able to decrease the inventory to current
ratio in 2013-14 it was 52.45 and in 2014-15 it was 44.76.
4.3.9 INVENTORY TO WORKING CAPITAL RATIO:
Stock to working capital ratio, characterized as a strategy to show what part of an organization's
inventories is financed from its accessible money, is crucial to organizations which hold stock and get
by on money supplies. All in all, the lower the proportion, the higher the liquidity of an organization is.
Be that as it may, the estimation of stock to working capital ratio changes from industry and
organization. The better benchmark is to contrast and the business normal.
Explanation:
It is an essential marker of an organization's operation effectiveness. A low estimation of 1 or less of
stock to working capital implies that an organization has high liquidity of current resources. While it
might likewise mean inadequate inventories. A high esteem stock to working capital proportion implies
that an organization is conveying an excessive amount of stock in stock. It is not good for
administration on the grounds that unreasonable inventories can put a substantial weight on the money
0
10
20
30
40
50
60
2011-12 2012-13 2013-14 2014-15
Ratio
Ratio

44
assets of an organization. A key issue for an organization to enhance its operation proficiency is to
distinguish the ideal stock levels and in this manner minimize the cost tied up in inventories.
ANALYSIS: Inventory to working capital ratio graph shows that ratio continuously decrease from
2011 to 2015. In 2011-12 company had 1.08 and in 2014-15 company was having 0.93 that means firm
was having enough amount to meet there daily expenses.
All figures are in Rupees
F.Y
C.A C.L
Working capital
prop
ortio
n
Stock
2011-12 1,581,776,626 905,879,793 675,896,833 732,891,622 1.08
2012-13 2,346,127,640 1,112,319,123 1,233,808,517 1,292,272,077 1.04
2013-14 2,271,606,402 1,026,295,392 1,245,311,010 1,191,653,112 0.95
2014-15 2,478,468,684 1,285,604,844 1,192,863,840 1,109,372,449 0.93
Source: balance sheet
Ratio
2014-15
0.93
2013-14
0.95
2012-13
1.04
Ratio
2011-12
1.08
0.85 0.9 0.95 1 1.05 1.1

45
INTERPRETATION–:Working capital is basically difference betwen the current assets
and current liabilities .the lower the stock to working capital company should be in better
position.As the ratio decreases from 2011 to 2015(shown in the above graph) it shows that the
money blocked in inventory reduces and the firm has more amount of cash in hand to meet its
daily expenses.
4.3.10 Debtors turnover ratio: Account holders turnover ratio shows the speed of
obligation gathering of the company. In straightforward words it demonstrates the quantity of
times normal borrowers (receivables) are turned amid a year.
Indebted individuals turnover =net credit yearly deals/normal exchange account holders.
Exchange debtors=sundry debtors + bills receivables and accounts receivables.
On the off chance that appropriate data is not gave then
Indebted individuals turnover can likewise be figured =gross deals/borrowers.
All figures are in Rupees
Year gross sales Debtors DTR
2011-2012 2,915,245,340 746,161,152 3.90
2012-2013 2,970,143,706 952,803,991 3.11
2013-2014 1,727,436,378 988,310,861 1.74
2014-2015 2,778,372,714 1,204,042,947 2.30
Source: balance sheet
ANALYSIS: Debtor’s turnover ratio showed in the below graph in that 2011-12 DTR was
3.90 but it continuously decreases to 2014-15 and in 2014-15 it was 2.30.

46
Ratio
4.5
4 3.9
3.5
3 3.11
2.5 2.3
2
1.74
ratio
1.5
1
0.5
0
2011-2012 2012-2013 2013-2014 2014-2015
INTERPRETATION:DTR shows the amount of times the obligated people are turned over
in the midst of a year. Generally, the higher the estimation of record holders the more successful
is the organization of obliged people/arrangements or more liquid are the borrowers.
Here the DTR decreases from 3.90(2011-12) to 2.30(2014-15)
4.3.11Average collection period=days in year/DTR
All figures are in Rupees
Year Days DTR ratio
2011-12 365 3.90 93
2012-13 365 3.11 117
2013-14 365 1.74 209
2014-15 365 2.30 158
Source: balance sheet
ANANLYSIS: The graph of average collection period showed ratios of the L&T from 2011-
2015. In 2011-12 the average collection period ratio was 93 and it increase next two years but in
2014-15 this was decreased from 209 to 158.

47
ratio
250
209
200
158
150
117
93
ratio
100
50
0
2011-12 2012-13 2013-14 2014-15
INTERPRETATION:
The ordinary aggregation period ratio identifies with the typical number of days for
which a firm needs to hold up before its receivables are changed over to cash.
The shorter it is the better is the way of record holders as a short assembling period
proposes energetic portion by obliged people.
In 2011-12 the average collection period was 93 which increased to 117 in 2012-13 which
further increases to 209 in 2013-14 and finally reduces to 158 in 14-15 It increases in L & T
because to survive in this though competitive world the firmadapts the policy of leniency to
debtors. If the firm will not do so it may loose its customers.

48
4.3.12Working capital turnover ratio:
Working capital of a firm is specifically identified with deals, current resources like account
holders, charges receivables, money stock and so on, working capital=current resources current
liabilities.
Working capital turnover ratio=sales/net working capital.
All figures are in Rupees
Year Current Current
Working capital WCTR Assets Liabilities Net sales
2011- 1,581,776,626 905,879,793
12 2,677,618,516 675,896,833 3.96
2012- 2,346,127,640 1,112,319,123
13 2,782,924,202 1,233,808,517 2.25
2013- 2,271,606,402 1,026,295,392
14 2,473,640,447 1,245,311,010 1.98
2014- 2,478,468,684 1,285,604,844
15 2,731,011,684 1,192,863,840 2.28
Source :balance sheet
ANALYSIS: The graph below it shows L&T working capital turnover ratio. Which increased in
2011-12 to 3.96 and continuously decreased further two years in 2012-2013 it was decreased to
2.25 and in 2013 -14 it was 1.98.but in 2014-15 it increased to 2.28.
WCTR
3.96
4
3.5
3
2.25
2.28
2.5
1.98
2
WCTR
1.5
1
0.5
0
2011-12 2012-13 2013-14 2014-15

49
INTERPRETATION: Thisproportion shows the amount of times the working capital is
turned over in course of one year. This proportions measures the profitability with which the
working capital is being used by the firm .The proportion is 3.96 in the year 2011-12 which
decreases to 2.25 in 2012-13 which again decays to 1.98 in 2013-14 and after that a beam of
trust is seen. That implies the proportion increments to 2.28 in the year 2014-15. This
proportions can, most ideal situation be used by making of close and inclination examination
for different firms in same industry and for different periods.
4.3.13 Assets turnover ratios:
Fixed assets turnover ratio= Net sales
Net fixed assets
The benefit turnover proportion has a tendency to be higher for organizations in a segment like
customer staples, which has a generally little resource base yet high deals volume. Alternately,
firms in segments like utilities and information transfers, which have substantial resource bases,
will have bring down resource turnover.
FATR of L&T Kansbahal works for four years:
All figures in rupees
Year Net sales Net fixed assets FATR
2011-12 2,677,618,516 635,192,333 4.21
2012-13 2,782,924,202 609,296,549 4.57
2013-14 2,473,640,447 612,946,269 4.03
2014-15 2,731,011,684 496,664,908 5.49
Source :balance sheet
ANALYSIS: Fixed assets turnover ratio showing below by graph in that graph shows L&T in
2011-2012 was 4.21 and it increased to 4.57 in 2012-13 that shows here L&T in good position by
the last year. But in next year it was decline to 4.03 that show was in not good position compare to
the last year and it again increased to 5.49 in 2014-2015 that means L&T are in good position
compare to all different years.

50
FATR
6
5.49
5
4.21
4.57
4 4.03
3
FATR
2
1
0
0 1 2 3 4 5
INTERPRETATION The higher the proportion the better high proportion demonstrates the business has less
cash tied up in altered resources for every unit of money of offers income.
Over the four years the ratio is increasing which means that the unit have not over-invested in
plant , machinery and other equipment’s.
4.3.14 Profitability ratio
A Net profit ratio
This proportion measures the relationship of gross benefit to net deals and is normally
spoken to a rate. In this way, it is computed by separating the gross benefit by deals.
Gross profit ratio=(net income/sales)*100
51
All figures are in Rupees
F.Y Net income Net sales
Net
profit ratio
2011-12 250,066,358 2,677,618,516 9.33
2012-13 443,737,101 2,782,924,202 15.94
2013-14 280,154,534 2,473,640,447 11.34
2014-15 402,461,367 2,731,011,684 14.73
Source: balance sheet
ANALYSIS: Net profit ratio showing in graph below was indicating that higher the
gross profit company get better outcome. In 2011-2012 company had 9.33 but in 2012-13
it increased to 15.94 that were great. In 2013-14 it declined to 11.34 and in 2014-15 it
again increased to 14.73 but it was lower to 2012-13.
14.73
11.34
INTERPRETATION: The net benefit proportion demonstrates the degree to which
offering costs of merchandise per unit might decrease without bringing about misfortunes on
operations of a firm. It mirrors the effectiveness with which a firm delivers items. As the
gross benefit is found by deducting expense of products sold from net deals, higher the gross
benefit better is the outcome. In the above diagram it is plainly seen that the gross benefit is
0
2
4
6
8
10
12
14
16
18
2011-12 2012-13 2013-14 2014-15
Net profit ratio
Net profit ratio
52
most astounding in the year 2012-13.the gross benefit has declined in the year 2013-14 yet
again it is expanding in the year 2014-15 which is a positive sign.
In the event that we deduct net benefit proportion from 100,we acquire the proportion of
expense of products sold to deals. In this manner: proportion of expense of products
sold=100-n.p proportion
Year N.P ratio C.O.G.S ratio
2011-12 9.33 90.67
2012-13 15.94 84.06
2013-14 11.34 88.66
2014-15 14.73 85.27
B.OPERATING RATIO
It is build the relationship between expense of merchandise sold and other working costs on
one hand and the deals on the other.
Operating ratio=(operating cost/net sales)*100
All figures are in Rupees
Year operating cost Net sales operating ratio
2011-12 1,774,260,401 2,677,618,516 66.26
2012-13 1,831,354,258 2,782,924,202 65.8
2013-14 1,789,164,460 2,473,640,447 72.32
2014-15 1,609,267,766 2,731,011,684 58.92
ANALYSIS: the operating ratio showing in the graph below reveals that L&T in 2011-12
was having 66 percentage of operating expenses which slightly reduce in 2012-13 to 65
percent but in 2013-14 these expense was increased to 72 percent and further year in 2014-15
they somehow manage the expense to the 58 percent.

53
operating ratio 80
72.32
70 66.26 65.8
58.92
60
50
40
operating ratio
30
20
10
0
2011-12 2012-13 2013-14 2014-15
INTERPRETATION:This proportion demonstrates the rate of net deals that is devoured
by working expense. Clearly, higher the working proportion, the less ideal it is, on the
grounds that it would have a little edge to cover interest, salarycharge, profit and saves. There
is no general guideline however 75-85% might be viewed as great as far as assembling
endeavors. In L&T Kansbahal works the ratio is quiet less than 75-85%. The ratio is 66% in
the year 2011-12 which declines to 65% in the year 2012-13. The % is highest in the year
2013-14 i.e 72% which again declines to 58% in the year 2014-15. It is lowest in the previous
year which shows that the firm is able to reduce its operating cost.
C. Operating profit ratio All figures are in Rupees
Year Net sales operating cost operating profit o.p ratio
2011-12 2,677,618,516 1,774,260,401 903,358,115 33.73
2012-13 2,782,924,202 1,831,354,258 951,569,944 34.19
2013-14 2,473,640,447 1,789,164,460 684,475,987 27.67
2014-15 2,731,011,684 1,609,267,766 1,121,743,918 41.07
ANALYSIS: operating profit ratio showing in graph that L&T generated profit in 2011 to
2015. In 2011-12 the company profit was 33.73 percent which was decline in 34.19 in 2012-
13 further it was reduced to 27.67 percentage in 2013-14 but in 2014-15 L&T increased their
operating profit to 41.07 percent.

54
o.p ratio
45
34.19
40
33.73
41.07
35
27.67
30
25
o.p ratio
20
15
10
5
0
2011-12 2012-13 2013-14
2014-15
D. Expenses ratio
It demonstrates the relationship of different costs to net deals.
i) Sales, Administrative & other expenses ratio =(sales, administrative & other
expenses)/sales *100
All figures are in Rupees
Year sales & admin
Other Net sales Expense ratio
2011-12 109,751,669 2,677,618,516 4.09
2012-13 115,173,331 2,782,924,202 4.13
2013-14 128,050,270 2,473,640,447 5.17
2014-15 241,437,011 2,731,011,684 8.84
55
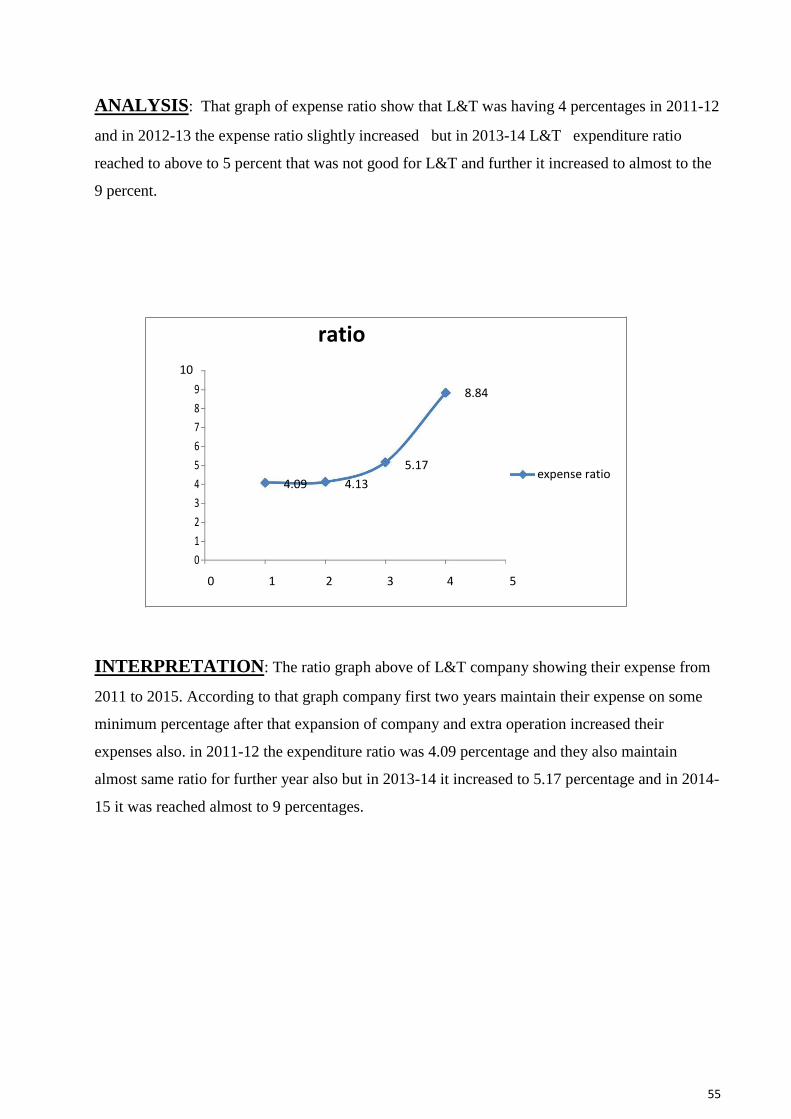
ANALYSIS: That graph of expense ratio show that L&T was having 4 percentages in 2011-12
and in 2012-13 the expense ratio slightly increased but in 2013-14 L&T expenditure ratio
reached to above to 5 percent that was not good for L&T and further it increased to almost to the
9 percent.
ratio
10 9 8.84
8
7
6
5 5.17 expense ratio
4 4.09
4.13
3
2
1
0
0 1 2 3 4 5
INTERPRETATION: The ratio graph above of L&T company showing their expense from
2011 to 2015. According to that graph company first two years maintain their expense on some
minimum percentage after that expansion of company and extra operation increased their
expenses also. in 2011-12 the expenditure ratio was 4.09 percentage and they also maintain
almost same ratio for further year also but in 2013-14 it increased to 5.17 percentage and in 2014-
15 it was reached almost to 9 percentages.

56
CHAPTER 5
FINDINGS, SUGGESTIONS AND CONCLUSION
FINDINGS
In the year 2011-12 the current ratio was 1.74:1 which increases to 2.09:1 in the year
2012-13. Gradually the ratio increases to 2.13:1 in the year 2013-14 and finally
decreases to 1.92:1 in the year 2014-15.
In 2014-15 , the quick ratio is very high as compared to optimal 1:1 . In other years it
was close to 1.
It is seen that in the year 2012-13 the inventory ratio was 2.74 &1.99 in the year 2013-
2014 and then it increases to 2.37in the year 2014-15.the company holds a good
position and does not block its money in inventory.
In 2012-13 the raw materials holding period was 194 which is very high. In 2013-14
raw materials holding period was less which shows there is no blockage in the
working capital. In 2014-15 again the holding period increased to 158 days.
Work in progress conversion period in the year 2012-13 was 146 days. In the year
2013-14 it is increased to 182 days and declined in the year 2014-15 i.e. 176 days.
In 2012-13 the average time taken to sell finished products was 17 days. In 2013-14 it
has reduce to 11 days. However, in 2014-15 the time taken to sell the finished
products further decreased to 4 days
Inventory to working capital ratio decreases from 1.08 in the year 2011-12 to 0.93 in
the year 2014-15
DTR declines from 3.90(2011-12) to 2.30(2014-15)
In 2011-12 the average collection period was 93 which increased to 117 in 2012-13
which further increases to 209 in 2013-14 and finally reduces to 158 in 14-15.
The working capital turnover ratio is 3.96 in the year 2011-12 which reduces to 2.25
in 2012-13 which again declines to 1.98 in 2013-14 and then increases to 2.28 in the
year 2014-15.

57
operating ratio 66% in the year 2011-12 which declines to 65% in the year 2012-13.
The % is highest in the year 2012-13 i.e 72% which again declines to 58% in the year
2014-15.
The operating profit ratio increases from 33.4 in 2011-12 to 41.07 in the year 2014-
15.
The sales and administration ratio increases from 4.09 in the year 2011-12 to 8.84 in
the year 2014-15.

58
CONCLUSION
This undertaking work in the fund part is going to help me a ton in future. I got learn many
financial aspects of the organization. It was great opportunity for me to do my Summer
Project at L&T Kansbahal. Since it is both labour and capital Intensive industry, the Working
Capital requirement is quite essential and hence my job was to investigate the pattern of
working capital over the previous years.
I have put up the best in me and left no stone unturned to reveal the facts and figures that
carry equal importance for accurate analysis. I have spent a considerable time and effort in
analyzing, conceptualizing and designing this project.
This project contains several features which are visibly apparent with some subtle findings
and explorations. For instance, I have described theoretical concepts and specialized analysis
techniques in simple and lucid terms, without any technical jargons. This project report
contains data and calculations in readable and comprehensible framework.
I have streamlined the chapters to move thoughtfully and ponderingly to important points and
thereby making the entire project quite concise and precise. I have also introduced industry
and economic data throughout the report, often in table form.

59
SUGGESTION
For change of affiliation's profit, complement is to be given to upgrade and administer
diminishing in order to work capital the present liabilities through decreasing of off
the cuff overhead expenses and better exchange on assessing. In such process, current
assets position will be upgraded through social occasion of pay.
Further, the organization should focus on changing in order to abbreviate its ordinary
aggregation period its credit terms and conditions.
There is an excessive amount of vacillation in the above proportion. The organization
ought to attempt to keep up the proportion inside of resilience.
60
ANNEXURE
BIBLIOGRAPHY
1. Pint, Ellen M., and Laura H. Baldwin, Strategic Sourcing: Theory and Evidence from
Economics and Business Management, Santa Monica, CA: RAND, MR-865-AF, 1997.
2. Pandey I M. Financial Management, published by Vikash Publication, 2010
3. ―Production and Inventory Management‖ by A.C. Hax and D. CandeaISBNNumber:
0137248806, 9780137248803, 978-0137248803
4. Buchar, Joseph and Koenisbgerg, Ernest, Scientific, Inventory Management, New
Delhi: Prentice Hall of India, 1966
5. L & T Annual Report -2012-2015
Pass C.L., Pike R.H: “An overview of working capital management and corporate financing”
(1984).
1Herzfeld B; “How to Understand Working Capital Management” (1990).
1ThachappillyG. Working Capital Management Manages Flow of Funds”,(2009)
1Beneda, Nancy; Zhang, Yilei, “Working Capital Management, Growth and Performance of
New Public
Thomas M. Krueger, “An Analysis of Working Capital Management Results Across
Industries” American Journal of Business, (2005)
1 Garcia-Teruel and Martinez-Solano; ”working capital management of SMEs” year 1996.
Website
1. www.intecc.com
2. www.google.com
3. www.barcodesinc.com
4. www.msu.edu
5. www.larsentoubro.com

61
Annexure
Balance Sheet
Items 2012-2013 2013-2014 2014-2015
EQUITY AND
LIABILITIES
Shareholders‘ funds 447,424,733 191,766,579 403,089,799 Reserves and Surplus
Non Current liabilities 1,250,306 1,060,306 2,217,568
Other Long term
Liabilities
Long term provisions
(10,208,686) 1,395,862 307,682
Current liabilities
a. Short term
Borrowings
b. Current
Maturities of 824,015,044 822,123,070 1,107,015,021
long term 293,472,765
Borrowings 198,080,860 173,821,741
c. Trade payables
d. Other current 5,040,000 4,695,600 4,460,400
Liabilities
e. Short term
Provisions 1,394,430,029 1,665,430,393 1,362,272,166
Inter Operating
Divisions Balances ICO
Total 2,955,424,190 2,884,552,670 3,053,184,377
ASSETS
Non –Current assets
Fixed Assets
a) Tangible assets 527,539,939 556,950,400 493,378,980 b) Intangible assets 8,024,802 7,227,121
c) Capital Work in 34,439,989 5,886,827 3,285,928
Progress 39,291,819 42,881,920 78,050,785
d) Long –term
loans and
Advances
Current Assets
a) Inventories 1,292,272,077 1,191,653,112 1,109,372,449
b) Trade 952,803,991 988,310,861 1,204,042,947
Receivables

62
c) Cash and Bank 165,323 92,600 19,386,237
Balances
d) Short term loans 91,549,829 145,667,051
and advance
100,886,250
Total 2,955,424,190 2,884,552,670 3,050,184,377

63
Statement of Profit & Loss
Items 2012-2013 2013-2014 2014-2015
Revenue
Revenue from 2,987,401,814 2,721,786,700 2,992,248,630
Operations 204,477,612 248,146,252 261,236,946
Less: Excise Duty 2,782,924,202 2,473,640,447 2,731,011,684
Revenue from 187,219,504 204,006,573 57,361,030
Operations
Other income
Total Revenue 2,970,143,706 2,677,647,020 2,788,372,714
EXPENSES
Manufacturing,
Construction and
operating income
a) Cost of raw 1,318,621,561 1,214,989,764 1,318,955,370
materials and
Components
Consumed 178,018,591
b) Purchase of 341,791,626 210,980,039
stock-in-trade
c) Stores, spares 169,770,080 118,519,097 204,087,879
and tool
Consumed 423,829,338 322,543,269 211,839,558
d) Sub contracting
Charges (339,876,099) 20,922,124 186,624,063
e) Change in
inventories of
finished goods
f) Other 179,011,266 164,103,967 169,897,877
manufacturing
,construction
and operating (261,793,512) (262,893,800) (660,155,572)
Expenses
g) Stock transfer
Total 1,831,354,258 1,789,164,460 1,609,267,766
Employee Benefit 505,528,094 500,757,775 455,052,058
Expenses 115,173,331 128,050,270 241,437,011
Sales, administration 196,576 602,013 606,832
Finance Cost 77,041,947 72,784,714 80,917,882
Depreciation, 2,108,028 1,815,584 1,243,616
Amortization
Less: Transfer from
Revaluation Reserve 779,572 1,791,158 126,586
Less: Overheads
charged to Fixed
Assets

64
Total Expenses 2,487,752,489 2,526,406,606 2,385,911,347
Profit before 189,894,531 443,737,101 402,461,367 exceptional and
extraordinary items 189,894,531 443,737,101 402,461,367
Profit before
extraordinary items and 189,894,531 443,737,101 402,461,367
Taxes
Profit before tax
Tax Expense
Profit after tax 189,894,531 443,737,101 402,461,367
Balance carried to 189,894,531 443,737,101 402,461,367
balance sheet

65