International Round-Robin Tests on Solar Cell Degradation Due to Electrostatic Discharge
9
International Round-Robin Tests on Solar Cell Degradation Due to Electrostatic Discharge Teppei Okumura ∗ Japan Aerospace Exploration Agency, Tsukuba 305-8505, Japan Mengu Cho † Kyushu Institute of Technology, Kitakyushu 804-8550, Japan Virginie Inguimbert ‡ ONERA, 31055 Toulouse, France Denis Payan § Centre National d’Etudes Spatiales, 31401 Toulouse, France Boris Vayner ¶ Ohio Aerospace Institute, Cleveland, Ohio 44142 and Dale C. Ferguson ∗∗ U.S. Air Force Research Laboratory, Albuquerque, New Mexico DOI: 10.2514/1.47929 Primary discharge occurs on solar arrays due to their interaction with the space plasma. A solar cell may suffer degradation of electrical performance if the primary discharge occurs at the cell edge. To estimate the power generated at the end of life, it is necessary to study the details of solar cell degradation. However, throughout the world, primary discharge has not been recognized as a cause of solar cell degradation. There is now an international collaboration among institutions in Japan, France, and the United States toward a common international standardization of solar array electrostatic discharge test methods. Round-robin tests were carried out as part of this collaborative research. Laboratory experiments were performed at the same time in three institutions using the same test method and identical solar cells. Solar cell degradation was confirmed at all three institutions. It was found that a multijunction solar cell is more susceptible to damage from primary discharge than a crystalline silicon solar cell. Throughout the round-robin tests, discharge has been shown to be a significant cause of solar cell degradation. Nomenclature C ext = external capacitance, F C p = current probe C sat = capacitance of the satellite, F dP max = variation of P max per primary discharge, W dI leak = variation of I leak per primary discharge, A I 0 = inverted saturation current, A I leak = leak current of solar cell, A I peak = peak of primary discharge, A I sc = short circuit current, A N arc = number of primary discharge P max = maximum power, W Q arc = primary discharge charge, Q R s = series resistance of solar cell, R sh = parallel resistance of solar cell, T arc = primary discharge duration, s T i1 , T i2 = start and end times of primary discharge current, s T p1 , T p2 = start and end times of primary discharge power, s V b = voltage power supply, V V oc = open circuit voltage, V V p = voltage probe W arc = primary discharge energy, J I. Introduction T HE primary discharge (trigger arc, primary arc) on the solar array has been studied for years. When primary discharge occurs on a solar cell, the material of the solar cell melts as the current concentrates at the cathode spot of a primary discharge. Therefore, the solar cell can potentially suffer degradation due to the primary discharge. Toyoda et al. first found solar cell degradation due to a primary discharge in ground discharge experiments [1,2]. Okumura et al. [3] presented an extensive study of the solar cell degradation. Figure 1 shows a discharge track leading to solar cell degradation. In this case, the cathode spot is generated at the edge of the solar cell, and then the primary discharge reaches the surface electrode. When the discharge track shown in Fig. 1 shorts the surface electrode and the back surface electrode (or the P layer) of the solar cell, the electrical performance of the solar cell decreases. Based on a microscopic picture of the back surface shown in Fig. 1, the size of the discharge track is 100 30 m 2 ; hence, the size of the cathode spot could be smaller. Therefore, heat injected to an area of 3 10 9 m 2 led to the observed solar cell degradation. In contrast, a primary discharge that occurs at the bus bar or on the interconnector does not cause solar cell degradation [4]. The reason is that the primary discharge does not directly inject heat into the solar cell material. A primary discharge at the bus bar or the interconnector may cause degradation of the bypass diode of the solar cell, because the primary discharge current generates a voltage surge on the solar cell [5]. Because degradation due to the voltage surge is not the same Received 6 November 2009; revision received 19 February 2010; accepted for publication 21 February 2010. Copyright © 2010 by the American Institute of Aeronautics and Astronautics, Inc. All rights reserved. Copies of this paper may be made for personal or internal use, on condition that the copier pay the $10.00 per-copy fee to the Copyright Clearance Center, Inc., 222 Rosewood Drive, Danvers, MA 01923; include the code 0022-4650/10 and $10.00 in correspondence with the CCC. ∗ Postdoctoral Fellow, Institute of Aerospace Technology; okumura. [email protected]. † Professor, Department of Electrical Engineering; [email protected]. ‡ Research Scientist, Space Environment Department; virginie. [email protected]. § Electrostatic Discharge Expert, Spacecraft Technologies, Design and Integration Department; [email protected]. ¶ Senior Scientist; [email protected]. Member AIAA. ∗∗ Principal Physicist; [email protected]. Member AIAA. JOURNAL OF SPACECRAFT AND ROCKETS Vol. 47, No. 3, May–June 2010 533
-
Upload
rostovstatemedicaluniversity -
Category
Documents
-
view
0 -
download
0
Transcript of International Round-Robin Tests on Solar Cell Degradation Due to Electrostatic Discharge
International Round-Robin Tests on Solar Cell DegradationDue to Electrostatic Discharge
Teppei Okumura∗
Japan Aerospace Exploration Agency, Tsukuba 305-8505, Japan
Mengu Cho†
Kyushu Institute of Technology, Kitakyushu 804-8550, Japan
Virginie Inguimbert‡
ONERA, 31055 Toulouse, France
Denis Payan§
Centre National d’Etudes Spatiales, 31401 Toulouse, France
Boris Vayner¶
Ohio Aerospace Institute, Cleveland, Ohio 44142
and
Dale C. Ferguson∗∗
U.S. Air Force Research Laboratory, Albuquerque, New Mexico
DOI: 10.2514/1.47929
Primary discharge occurs on solar arrays due to their interaction with the space plasma. A solar cell may suffer
degradation of electrical performance if the primary discharge occurs at the cell edge. To estimate the power
generated at the end of life, it is necessary to study the details of solar cell degradation. However, throughout the
world, primary discharge has not been recognized as a cause of solar cell degradation. There is now an international
collaboration among institutions in Japan, France, and the United States toward a common international
standardization of solar array electrostatic discharge testmethods. Round-robin tests were carried out as part of this
collaborative research. Laboratory experimentswere performed at the same time in three institutions using the same
testmethod and identical solar cells. Solar cell degradationwas confirmed at all three institutions. It was found that a
multijunction solar cell is more susceptible to damage from primary discharge than a crystalline silicon solar cell.
Throughout the round-robin tests, discharge has been shown to be a significant cause of solar cell degradation.
Nomenclature
Cext = external capacitance, FCp = current probeCsat = capacitance of the satellite, FdPmax = variation of Pmax per primary discharge, WdIleak = variation of Ileak per primary discharge, AI0 = inverted saturation current, AIleak = leak current of solar cell, AIpeak = peak of primary discharge, AIsc = short circuit current, ANarc = number of primary dischargePmax = maximum power, WQarc = primary discharge charge, QRs = series resistance of solar cell, �Rsh = parallel resistance of solar cell, �Tarc = primary discharge duration, sTi1, Ti2 = start and end times of primary discharge current, s
Tp1, Tp2 = start and end times of primary discharge power, sVb = voltage power supply, VVoc = open circuit voltage, VVp = voltage probeWarc = primary discharge energy, J
I. Introduction
T HE primary discharge (trigger arc, primary arc) on the solararray has been studied for years. When primary discharge
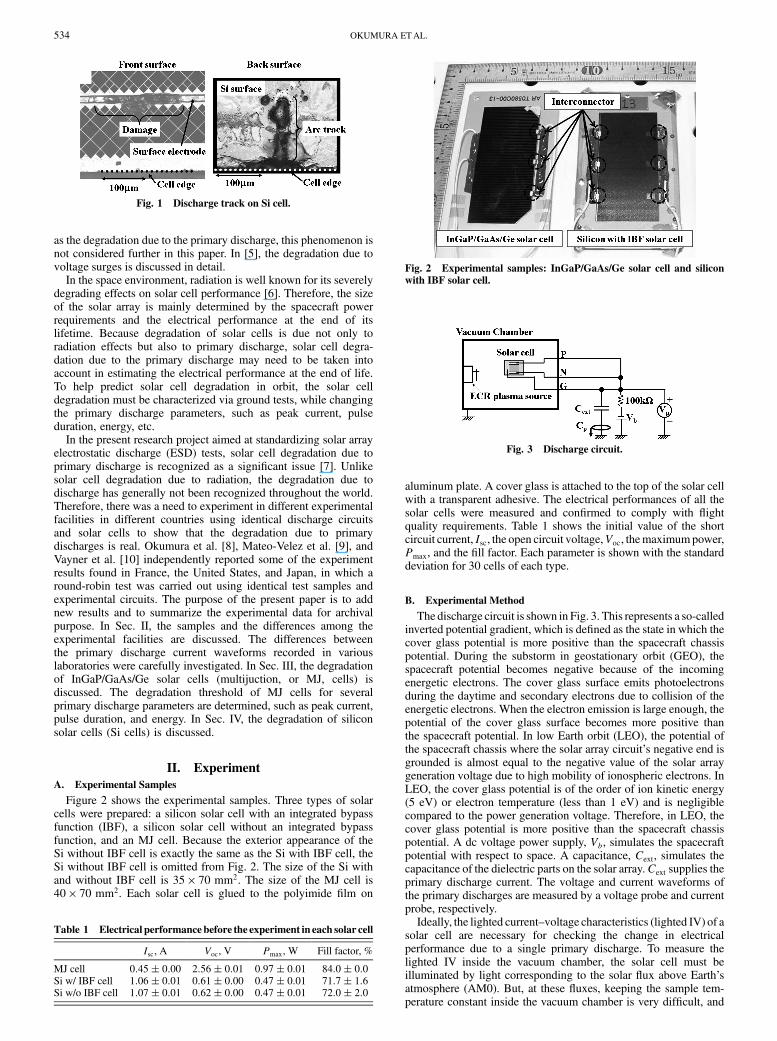
occurs on a solar cell, thematerial of the solar cell melts as the currentconcentrates at the cathode spot of a primary discharge. Therefore,the solar cell can potentially suffer degradation due to the primarydischarge. Toyoda et al. first found solar cell degradation due to aprimary discharge in ground discharge experiments [1,2]. Okumuraet al. [3] presented an extensive study of the solar cell degradation.Figure 1 shows a discharge track leading to solar cell degradation.In this case, the cathode spot is generated at the edge of the solarcell, and then the primary discharge reaches the surface electrode.When the discharge track shown in Fig. 1 shorts the surface electrodeand the back surface electrode (or the P layer) of the solar cell,the electrical performance of the solar cell decreases. Based on amicroscopic picture of the back surface shown in Fig. 1, the size ofthe discharge track is 100 � 30 �m2; hence, the size of the cathodespot could be smaller. Therefore, heat injected to an area of3 � 10�9 m2 led to the observed solar cell degradation. In contrast, aprimary discharge that occurs at the bus bar or on the interconnectordoes not cause solar cell degradation [4]. The reason is that theprimary discharge does not directly inject heat into the solar cellmaterial. A primary discharge at the bus bar or the interconnectormay cause degradation of the bypass diode of the solar cell, becausethe primary discharge current generates a voltage surge on the solarcell [5]. Because degradation due to the voltage surge is not the same
Received 6November 2009; revision received 19 February 2010; acceptedfor publication 21 February 2010. Copyright © 2010 by the AmericanInstitute of Aeronautics and Astronautics, Inc. All rights reserved. Copies ofthis paper may be made for personal or internal use, on condition that thecopier pay the $10.00 per-copy fee to the Copyright Clearance Center, Inc.,222 Rosewood Drive, Danvers, MA 01923; include the code 0022-4650/10and $10.00 in correspondence with the CCC.
∗Postdoctoral Fellow, Institute of Aerospace Technology; [email protected].
†Professor, Department of Electrical Engineering; [email protected].‡Research Scientist, Space Environment Department; virginie.
[email protected].§Electrostatic Discharge Expert, Spacecraft Technologies, Design and
Integration Department; [email protected].¶Senior Scientist; [email protected]. Member AIAA.∗∗Principal Physicist; [email protected]. Member AIAA.
JOURNAL OF SPACECRAFT AND ROCKETS
Vol. 47, No. 3, May–June 2010
533
as the degradation due to the primary discharge, this phenomenon isnot considered further in this paper. In [5], the degradation due tovoltage surges is discussed in detail.
In the space environment, radiation is well known for its severelydegrading effects on solar cell performance [6]. Therefore, the sizeof the solar array is mainly determined by the spacecraft powerrequirements and the electrical performance at the end of itslifetime. Because degradation of solar cells is due not only toradiation effects but also to primary discharge, solar cell degra-dation due to the primary discharge may need to be taken intoaccount in estimating the electrical performance at the end of life.To help predict solar cell degradation in orbit, the solar celldegradation must be characterized via ground tests, while changingthe primary discharge parameters, such as peak current, pulseduration, energy, etc.
In the present research project aimed at standardizing solar arrayelectrostatic discharge (ESD) tests, solar cell degradation due toprimary discharge is recognized as a significant issue [7]. Unlikesolar cell degradation due to radiation, the degradation due todischarge has generally not been recognized throughout the world.Therefore, there was a need to experiment in different experimentalfacilities in different countries using identical discharge circuitsand solar cells to show that the degradation due to primarydischarges is real. Okumura et al. [8], Mateo-Velez et al. [9], andVayner et al. [10] independently reported some of the experimentresults found in France, the United States, and Japan, in which around-robin test was carried out using identical test samples andexperimental circuits. The purpose of the present paper is to addnew results and to summarize the experimental data for archivalpurpose. In Sec. II, the samples and the differences among theexperimental facilities are discussed. The differences betweenthe primary discharge current waveforms recorded in variouslaboratories were carefully investigated. In Sec. III, the degradationof InGaP/GaAs/Ge solar cells (multijuction, or MJ, cells) isdiscussed. The degradation threshold of MJ cells for severalprimary discharge parameters are determined, such as peak current,pulse duration, and energy. In Sec. IV, the degradation of siliconsolar cells (Si cells) is discussed.
II. Experiment
A. Experimental Samples
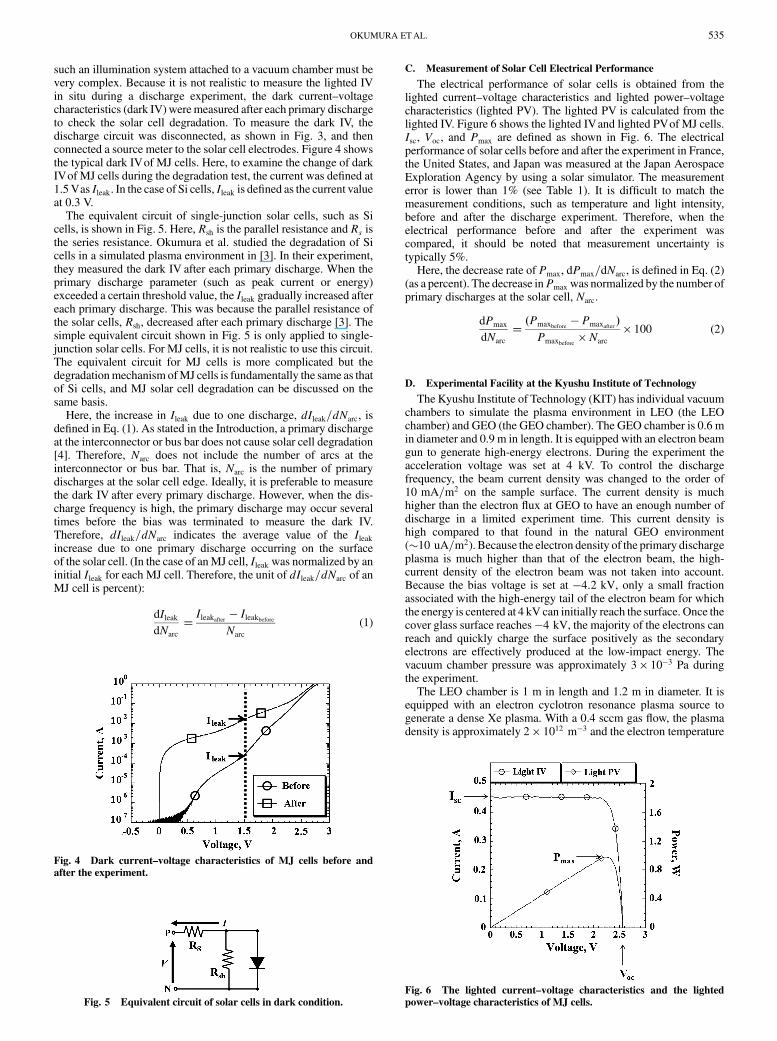
Figure 2 shows the experimental samples. Three types of solarcells were prepared: a silicon solar cell with an integrated bypassfunction (IBF), a silicon solar cell without an integrated bypassfunction, and an MJ cell. Because the exterior appearance of theSi without IBF cell is exactly the same as the Si with IBF cell, theSi without IBF cell is omitted from Fig. 2. The size of the Si withand without IBF cell is 35 � 70 mm2. The size of the MJ cell is40 � 70 mm2. Each solar cell is glued to the polyimide film on
aluminum plate. A cover glass is attached to the top of the solar cellwith a transparent adhesive. The electrical performances of all thesolar cells were measured and confirmed to comply with flightquality requirements. Table 1 shows the initial value of the shortcircuit current, Isc, the open circuit voltage,Voc, themaximumpower,Pmax, and the fill factor. Each parameter is shown with the standarddeviation for 30 cells of each type.
B. Experimental Method
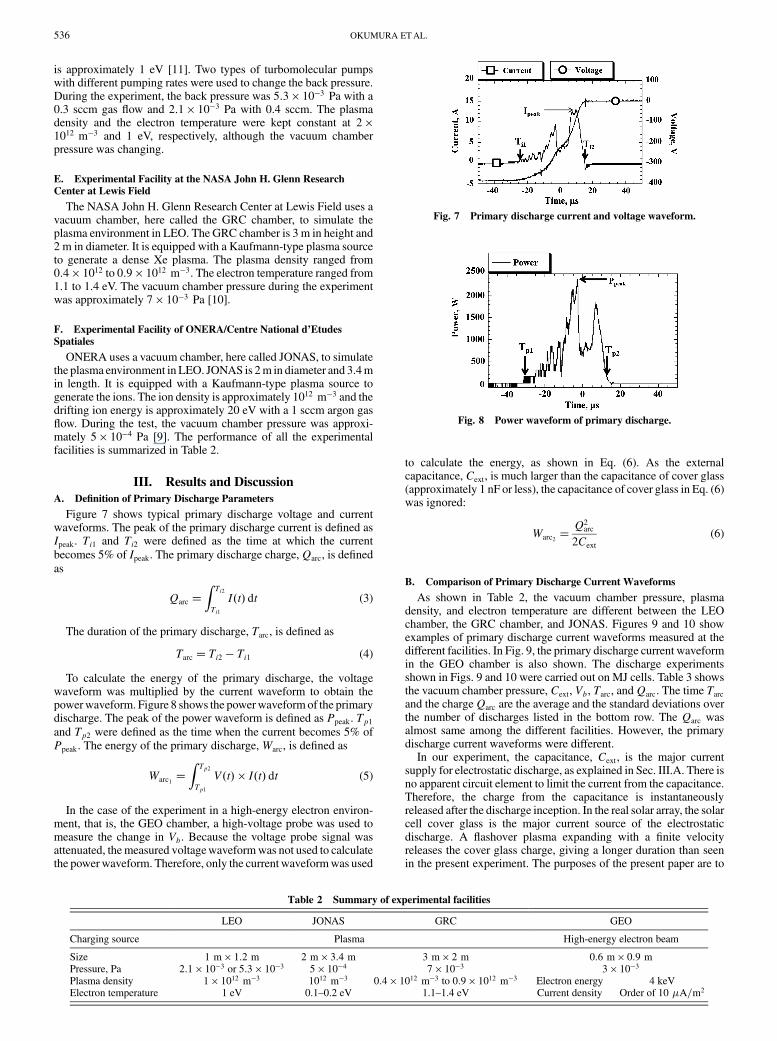
The discharge circuit is shown in Fig. 3. This represents a so-calledinverted potential gradient, which is defined as the state in which thecover glass potential is more positive than the spacecraft chassispotential. During the substorm in geostationary orbit (GEO), thespacecraft potential becomes negative because of the incomingenergetic electrons. The cover glass surface emits photoelectronsduring the daytime and secondary electrons due to collision of theenergetic electrons. When the electron emission is large enough, thepotential of the cover glass surface becomes more positive thanthe spacecraft potential. In low Earth orbit (LEO), the potential ofthe spacecraft chassis where the solar array circuit’s negative end isgrounded is almost equal to the negative value of the solar arraygeneration voltage due to high mobility of ionospheric electrons. InLEO, the cover glass potential is of the order of ion kinetic energy(5 eV) or electron temperature (less than 1 eV) and is negligiblecompared to the power generation voltage. Therefore, in LEO, thecover glass potential is more positive than the spacecraft chassispotential. A dc voltage power supply, Vb, simulates the spacecraftpotential with respect to space. A capacitance, Cext, simulates thecapacitance of the dielectric parts on the solar array.Cext supplies theprimary discharge current. The voltage and current waveforms ofthe primary discharges are measured by a voltage probe and currentprobe, respectively.
Ideally, the lighted current–voltage characteristics (lighted IV) of asolar cell are necessary for checking the change in electricalperformance due to a single primary discharge. To measure thelighted IV inside the vacuum chamber, the solar cell must beilluminated by light corresponding to the solar flux above Earth’satmosphere (AM0). But, at these fluxes, keeping the sample tem-perature constant inside the vacuum chamber is very difficult, and
Fig. 1 Discharge track on Si cell.
Fig. 2 Experimental samples: InGaP/GaAs/Ge solar cell and silicon
with IBF solar cell.
Table 1 Electrical performance before the experiment in each solar cell
Isc, A Voc, V Pmax, W Fill factor, %
MJ cell 0:45� 0:00 2:56� 0:01 0:97� 0:01 84:0� 0:0Si w/ IBF cell 1:06� 0:01 0:61� 0:00 0:47� 0:01 71:7� 1:6Si w/o IBF cell 1:07� 0:01 0:62� 0:00 0:47� 0:01 72:0� 2:0
Fig. 3 Discharge circuit.
534 OKUMURA ETAL.
such an illumination system attached to a vacuum chamber must bevery complex. Because it is not realistic to measure the lighted IVin situ during a discharge experiment, the dark current–voltagecharacteristics (dark IV) weremeasured after each primary dischargeto check the solar cell degradation. To measure the dark IV, thedischarge circuit was disconnected, as shown in Fig. 3, and thenconnected a source meter to the solar cell electrodes. Figure 4 showsthe typical dark IVof MJ cells. Here, to examine the change of darkIVof MJ cells during the degradation test, the current was defined at1.5Vas Ileak. In the case of Si cells, Ileak is defined as the current valueat 0.3 V.
The equivalent circuit of single-junction solar cells, such as Sicells, is shown in Fig. 5. Here, Rsh is the parallel resistance and Rs isthe series resistance. Okumura et al. studied the degradation of Sicells in a simulated plasma environment in [3]. In their experiment,they measured the dark IV after each primary discharge. When theprimary discharge parameter (such as peak current or energy)exceeded a certain threshold value, the Ileak gradually increased aftereach primary discharge. This was because the parallel resistance ofthe solar cells, Rsh, decreased after each primary discharge [3]. Thesimple equivalent circuit shown in Fig. 5 is only applied to single-junction solar cells. For MJ cells, it is not realistic to use this circuit.The equivalent circuit for MJ cells is more complicated but thedegradationmechanism ofMJ cells is fundamentally the same as thatof Si cells, and MJ solar cell degradation can be discussed on thesame basis.
Here, the increase in Ileak due to one discharge, dIleak=dNarc, isdefined in Eq. (1). As stated in the Introduction, a primary dischargeat the interconnector or bus bar does not cause solar cell degradation[4]. Therefore, Narc does not include the number of arcs at theinterconnector or bus bar. That is, Narc is the number of primarydischarges at the solar cell edge. Ideally, it is preferable to measurethe dark IV after every primary discharge. However, when the dis-charge frequency is high, the primary discharge may occur severaltimes before the bias was terminated to measure the dark IV.Therefore, dIleak=dNarc indicates the average value of the Ileakincrease due to one primary discharge occurring on the surfaceof the solar cell. (In the case of anMJ cell, Ileak was normalized by aninitial Ileak for each MJ cell. Therefore, the unit of dIleak=dNarc of anMJ cell is percent):
dIleakdNarc
�Ileakafter � Ileakbefore
Narc
(1)
C. Measurement of Solar Cell Electrical Performance
The electrical performance of solar cells is obtained from thelighted current–voltage characteristics and lighted power–voltagecharacteristics (lighted PV). The lighted PV is calculated from thelighted IV. Figure 6 shows the lighted IVand lighted PVof MJ cells.Isc, Voc, and Pmax are defined as shown in Fig. 6. The electricalperformance of solar cells before and after the experiment in France,the United States, and Japan was measured at the Japan AerospaceExploration Agency by using a solar simulator. The measurementerror is lower than 1% (see Table 1). It is difficult to match themeasurement conditions, such as temperature and light intensity,before and after the discharge experiment. Therefore, when theelectrical performance before and after the experiment wascompared, it should be noted that measurement uncertainty istypically 5%.
Here, the decrease rate of Pmax, dPmax=dNarc, is defined in Eq. (2)(as a percent). The decrease inPmax was normalized by the number ofprimary discharges at the solar cell, Narc.
dPmax
dNarc
��Pmaxbefore
� Pmaxafter�
Pmaxbefore� Narc
� 100 (2)
D. Experimental Facility at the Kyushu Institute of Technology
The Kyushu Institute of Technology (KIT) has individual vacuumchambers to simulate the plasma environment in LEO (the LEOchamber) and GEO (the GEO chamber). The GEO chamber is 0.6 min diameter and 0.9 m in length. It is equipped with an electron beamgun to generate high-energy electrons. During the experiment theacceleration voltage was set at 4 kV. To control the dischargefrequency, the beam current density was changed to the order of10 mA=m2 on the sample surface. The current density is muchhigher than the electron flux at GEO to have an enough number ofdischarge in a limited experiment time. This current density ishigh compared to that found in the natural GEO environment(�10 uA=m2). Because the electron density of the primary dischargeplasma is much higher than that of the electron beam, the high-current density of the electron beam was not taken into account.Because the bias voltage is set at �4:2 kV, only a small fractionassociated with the high-energy tail of the electron beam for whichthe energy is centered at 4 kV can initially reach the surface. Once thecover glass surface reaches �4 kV, the majority of the electrons canreach and quickly charge the surface positively as the secondaryelectrons are effectively produced at the low-impact energy. Thevacuum chamber pressure was approximately 3 � 10�3 Pa duringthe experiment.
The LEO chamber is 1 m in length and 1.2 m in diameter. It isequipped with an electron cyclotron resonance plasma source togenerate a dense Xe plasma. With a 0.4 sccm gas flow, the plasmadensity is approximately 2 � 1012 m�3 and the electron temperature
Fig. 4 Dark current–voltage characteristics of MJ cells before and
after the experiment.
Fig. 5 Equivalent circuit of solar cells in dark condition.
Fig. 6 The lighted current–voltage characteristics and the lighted
power–voltage characteristics of MJ cells.
OKUMURA ETAL. 535
is approximately 1 eV [11]. Two types of turbomolecular pumpswith different pumping rates were used to change the back pressure.During the experiment, the back pressure was 5:3 � 10�3 Pa with a0.3 sccm gas flow and 2:1 � 10�3 Pa with 0.4 sccm. The plasmadensity and the electron temperature were kept constant at 2 �1012 m�3 and 1 eV, respectively, although the vacuum chamberpressure was changing.
E. Experimental Facility at the NASA John H. Glenn Research
Center at Lewis Field
The NASA John H. Glenn Research Center at Lewis Field uses avacuum chamber, here called the GRC chamber, to simulate theplasma environment in LEO. The GRC chamber is 3 m in height and2 m in diameter. It is equipped with a Kaufmann-type plasma sourceto generate a dense Xe plasma. The plasma density ranged from0:4 � 1012 to 0:9 � 1012 m�3. The electron temperature ranged from1.1 to 1.4 eV. The vacuum chamber pressure during the experimentwas approximately 7 � 10�3 Pa [10].
F. Experimental Facility of ONERA/Centre National d’Etudes
Spatiales
ONERA uses a vacuum chamber, here called JONAS, to simulatethe plasma environment in LEO. JONAS is 2m in diameter and 3.4min length. It is equipped with a Kaufmann-type plasma source togenerate the ions. The ion density is approximately 1012 m�3 and thedrifting ion energy is approximately 20 eV with a 1 sccm argon gasflow. During the test, the vacuum chamber pressure was approxi-mately 5 � 10�4 Pa [9]. The performance of all the experimentalfacilities is summarized in Table 2.
III. Results and Discussion
A. Definition of Primary Discharge Parameters
Figure 7 shows typical primary discharge voltage and currentwaveforms. The peak of the primary discharge current is defined asIpeak. Ti1 and Ti2 were defined as the time at which the currentbecomes 5% of Ipeak. The primary discharge charge,Qarc, is definedas
Qarc �ZTi2
Ti1
I�t� dt (3)
The duration of the primary discharge, Tarc, is defined as
Tarc � Ti2 � Ti1 (4)
To calculate the energy of the primary discharge, the voltagewaveform was multiplied by the current waveform to obtain thepowerwaveform. Figure 8 shows the powerwaveform of the primarydischarge. The peak of the power waveform is defined as Ppeak. Tp1and Tp2 were defined as the time when the current becomes 5% ofPpeak. The energy of the primary discharge,Warc, is defined as
Warc1�ZTp2
Tp1
V�t� � I�t� dt (5)
In the case of the experiment in a high-energy electron environ-ment, that is, the GEO chamber, a high-voltage probe was used tomeasure the change in Vb. Because the voltage probe signal wasattenuated, themeasured voltagewaveformwas not used to calculatethe powerwaveform. Therefore, only the current waveformwas used
to calculate the energy, as shown in Eq. (6). As the externalcapacitance, Cext, is much larger than the capacitance of cover glass(approximately 1 nF or less), the capacitance of cover glass in Eq. (6)was ignored:
Warc2� Q2
arc
2Cext
(6)
B. Comparison of Primary Discharge Current Waveforms
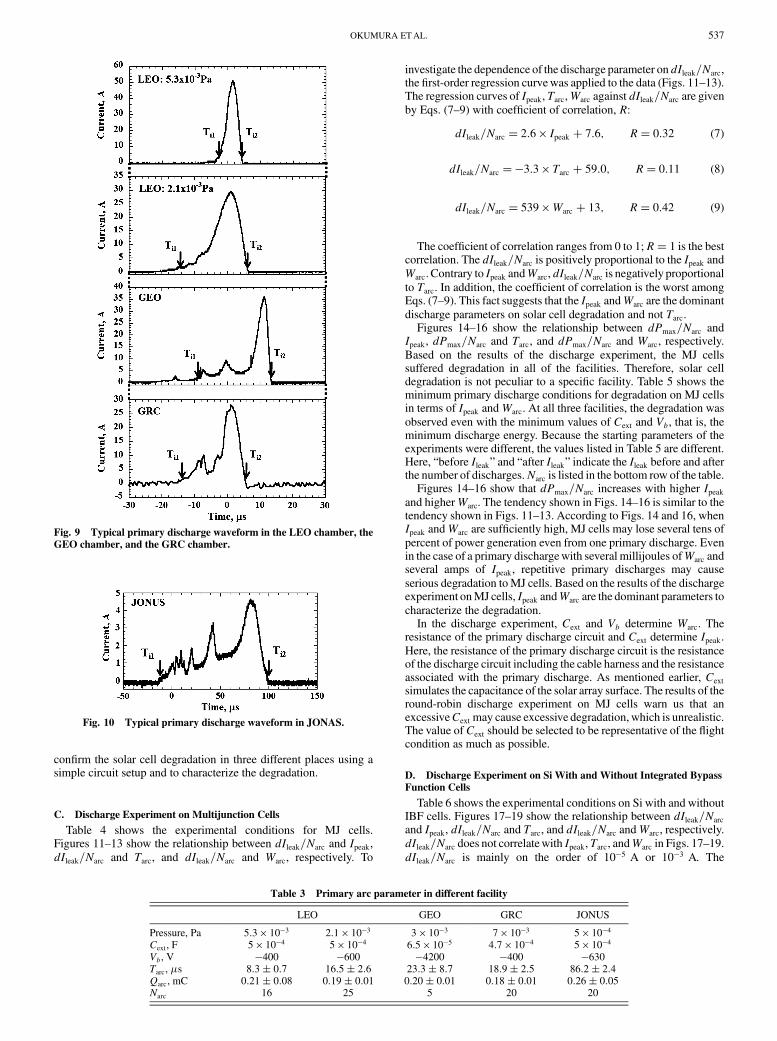
As shown in Table 2, the vacuum chamber pressure, plasmadensity, and electron temperature are different between the LEOchamber, the GRC chamber, and JONAS. Figures 9 and 10 showexamples of primary discharge current waveforms measured at thedifferent facilities. In Fig. 9, the primary discharge current waveformin the GEO chamber is also shown. The discharge experimentsshown in Figs. 9 and 10 were carried out on MJ cells. Table 3 showsthe vacuum chamber pressure, Cext, Vb, Tarc, andQarc. The time Tarcand the chargeQarc are the average and the standard deviations overthe number of discharges listed in the bottom row. The Qarc wasalmost same among the different facilities. However, the primarydischarge current waveforms were different.
In our experiment, the capacitance, Cext, is the major currentsupply for electrostatic discharge, as explained in Sec. III.A. There isno apparent circuit element to limit the current from the capacitance.Therefore, the charge from the capacitance is instantaneouslyreleased after the discharge inception. In the real solar array, the solarcell cover glass is the major current source of the electrostaticdischarge. A flashover plasma expanding with a finite velocityreleases the cover glass charge, giving a longer duration than seenin the present experiment. The purposes of the present paper are to
Table 2 Summary of experimental facilities
LEO JONAS GRC GEO
Charging source Plasma High-energy electron beam
Size 1 m � 1:2 m 2 m � 3:4 m 3 m � 2 m 0:6 m � 0:9 mPressure, Pa 2:1 � 10�3 or 5:3 � 10�3 5 � 10�4 7 � 10�3 3 � 10�3
Plasma density 1 � 1012 m�3 1012 m�3 0:4 � 1012 m�3 to 0:9 � 1012 m�3 Electron energy 4 keVElectron temperature 1 eV 0.1–0.2 eV 1.1–1.4 eV Current density Order of 10 �A=m2
Fig. 7 Primary discharge current and voltage waveform.
Fig. 8 Power waveform of primary discharge.
536 OKUMURA ETAL.
confirm the solar cell degradation in three different places using asimple circuit setup and to characterize the degradation.
C. Discharge Experiment on Multijunction Cells
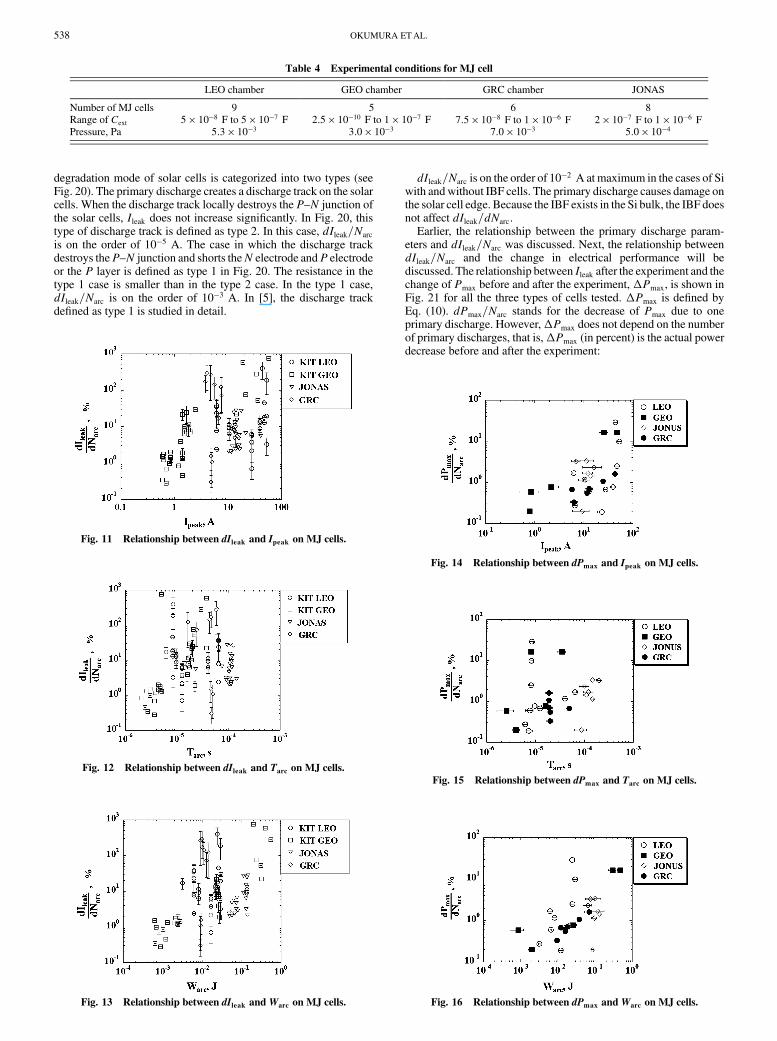
Table 4 shows the experimental conditions for MJ cells.Figures 11–13 show the relationship between dIleak=Narc and Ipeak,dIleak=Narc and Tarc, and dIleak=Narc and Warc, respectively. To
investigate the dependence of the discharge parameter ondIleak=Narc,the first-order regression curvewas applied to the data (Figs. 11–13).The regression curves of Ipeak, Tarc,Warc against dIleak=Narc are givenby Eqs. (7–9) with coefficient of correlation, R:
dIleak=Narc � 2:6 � Ipeak � 7:6; R� 0:32 (7)
dIleak=Narc ��3:3 � Tarc � 59:0; R� 0:11 (8)
dIleak=Narc � 539 �Warc � 13; R� 0:42 (9)
The coefficient of correlation ranges from 0 to 1; R� 1 is the bestcorrelation. The dIleak=Narc is positively proportional to the Ipeak andWarc. Contrary to Ipeak andWarc,dIleak=Narc is negatively proportionalto Tarc. In addition, the coefficient of correlation is the worst amongEqs. (7–9). This fact suggests that the Ipeak andWarc are the dominantdischarge parameters on solar cell degradation and not Tarc.
Figures 14–16 show the relationship between dPmax=Narc andIpeak, dPmax=Narc and Tarc, and dPmax=Narc and Warc, respectively.Based on the results of the discharge experiment, the MJ cellssuffered degradation in all of the facilities. Therefore, solar celldegradation is not peculiar to a specific facility. Table 5 shows theminimum primary discharge conditions for degradation on MJ cellsin terms of Ipeak andWarc. At all three facilities, the degradation wasobserved even with the minimum values of Cext and Vb, that is, theminimum discharge energy. Because the starting parameters of theexperiments were different, the values listed in Table 5 are different.Here, “before Ileak” and “after Ileak” indicate the Ileak before and afterthe number of discharges.Narc is listed in the bottom row of the table.
Figures 14–16 show that dPmax=Narc increases with higher Ipeakand higherWarc. The tendency shown in Figs. 14–16 is similar to thetendency shown in Figs. 11–13. According to Figs. 14 and 16, whenIpeak andWarc are sufficiently high, MJ cells may lose several tens ofpercent of power generation even from one primary discharge. Evenin the case of a primary dischargewith several millijoules ofWarc andseveral amps of Ipeak, repetitive primary discharges may causeserious degradation toMJ cells. Based on the results of the dischargeexperiment onMJ cells, Ipeak andWarc are the dominant parameters tocharacterize the degradation.
In the discharge experiment, Cext and Vb determine Warc. Theresistance of the primary discharge circuit and Cext determine Ipeak.Here, the resistance of the primary discharge circuit is the resistanceof the discharge circuit including the cable harness and the resistanceassociated with the primary discharge. As mentioned earlier, Cext
simulates the capacitance of the solar array surface. The results of theround-robin discharge experiment on MJ cells warn us that anexcessiveCext may cause excessive degradation, which is unrealistic.The value of Cext should be selected to be representative of the flightcondition as much as possible.
D. Discharge Experiment on Si With and Without Integrated Bypass
Function Cells
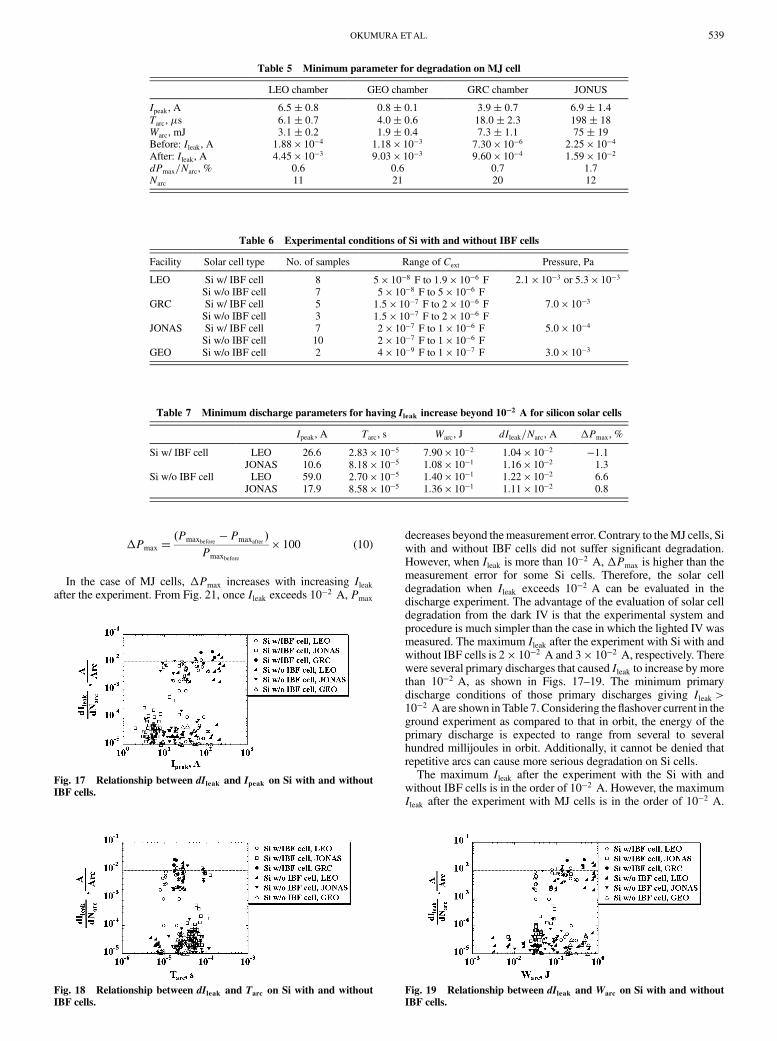
Table 6 shows the experimental conditions on Si with and withoutIBF cells. Figures 17–19 show the relationship between dIleak=Narc
and Ipeak, dIleak=Narc and Tarc, and dIleak=Narc andWarc, respectively.dIleak=Narc does not correlatewith Ipeak,Tarc, andWarc in Figs. 17–19.dIleak=Narc is mainly on the order of 10�5 A or 10�3 A. The
Fig. 9 Typical primary discharge waveform in the LEO chamber, the
GEO chamber, and the GRC chamber.
Fig. 10 Typical primary discharge waveform in JONAS.
Table 3 Primary arc parameter in different facility
LEO GEO GRC JONUS
Pressure, Pa 5:3 � 10�3 2:1 � 10�3 3 � 10�3 7 � 10�3 5 � 10�4
Cext, F 5 � 10�4 5 � 10�4 6:5 � 10�5 4:7 � 10�4 5 � 10�4
Vb, V �400 �600 �4200 �400 �630Tarc, �s 8:3� 0:7 16:5� 2:6 23:3� 8:7 18:9� 2:5 86:2� 2:4Qarc, mC 0:21� 0:08 0:19� 0:01 0:20� 0:01 0:18� 0:01 0:26� 0:05Narc 16 25 5 20 20
OKUMURA ETAL. 537
degradation mode of solar cells is categorized into two types (seeFig. 20). The primary discharge creates a discharge track on the solarcells. When the discharge track locally destroys the P–N junction ofthe solar cells, Ileak does not increase significantly. In Fig. 20, thistype of discharge track is defined as type 2. In this case, dIleak=Narc
is on the order of 10�5 A. The case in which the discharge trackdestroys theP–N junction and shorts theN electrode andP electrodeor the P layer is defined as type 1 in Fig. 20. The resistance in thetype 1 case is smaller than in the type 2 case. In the type 1 case,dIleak=Narc is on the order of 10�3 A. In [5], the discharge trackdefined as type 1 is studied in detail.
dIleak=Narc is on the order of 10�2 A at maximum in the cases of Si
with andwithout IBF cells. The primary discharge causes damage onthe solar cell edge. Because the IBF exists in the Si bulk, the IBF doesnot affect dIleak=dNarc.
Earlier, the relationship between the primary discharge param-eters and dIleak=Narc was discussed. Next, the relationship betweendIleak=Narc and the change in electrical performance will bediscussed. The relationship between Ileak after the experiment and thechange of Pmax before and after the experiment,�Pmax, is shown inFig. 21 for all the three types of cells tested. �Pmax is defined byEq. (10). dPmax=Narc stands for the decrease of Pmax due to oneprimary discharge. However,�Pmax does not depend on the numberof primary discharges, that is,�Pmax (in percent) is the actual powerdecrease before and after the experiment:
Table 4 Experimental conditions for MJ cell
LEO chamber GEO chamber GRC chamber JONAS
Number of MJ cells 9 5 6 8Range of Cext 5 � 10�8 F to 5 � 10�7 F 2:5 � 10�10 F to 1 � 10�7 F 7:5 � 10�8 F to 1 � 10�6 F 2 � 10�7 F to 1 � 10�6 FPressure, Pa 5:3 � 10�3 3:0 � 10�3 7:0 � 10�3 5:0 � 10�4
Fig. 11 Relationship between dIleak and Ipeak on MJ cells.
Fig. 12 Relationship between dIleak and Tarc on MJ cells.
Fig. 13 Relationship between dIleak and Warc on MJ cells.
Fig. 14 Relationship between dPmax and Ipeak on MJ cells.
Fig. 15 Relationship between dPmax and Tarc on MJ cells.
Fig. 16 Relationship between dPmax andWarc on MJ cells.
538 OKUMURA ETAL.
�Pmax ��Pmaxbefore
� Pmaxafter�
Pmaxbefore
� 100 (10)
In the case of MJ cells, �Pmax increases with increasing Ileakafter the experiment. From Fig. 21, once Ileak exceeds 10
�2 A, Pmax
decreases beyond themeasurement error. Contrary to theMJ cells, Siwith and without IBF cells did not suffer significant degradation.However, when Ileak is more than 10�2 A, �Pmax is higher than themeasurement error for some Si cells. Therefore, the solar celldegradation when Ileak exceeds 10�2 A can be evaluated in thedischarge experiment. The advantage of the evaluation of solar celldegradation from the dark IV is that the experimental system andprocedure is much simpler than the case in which the lighted IV wasmeasured. The maximum Ileak after the experiment with Si with andwithout IBF cells is 2 � 10�2 A and 3 � 10�2 A, respectively. Therewere several primary discharges that caused Ileak to increase by morethan 10�2 A, as shown in Figs. 17–19. The minimum primarydischarge conditions of those primary discharges giving Ileak >10�2 A are shown in Table 7. Considering the flashover current in theground experiment as compared to that in orbit, the energy of theprimary discharge is expected to range from several to severalhundred millijoules in orbit. Additionally, it cannot be denied thatrepetitive arcs can cause more serious degradation on Si cells.
The maximum Ileak after the experiment with the Si with andwithout IBF cells is in the order of 10�2 A. However, the maximumIleak after the experiment with MJ cells is in the order of 10�2 A.
Table 5 Minimum parameter for degradation on MJ cell
LEO chamber GEO chamber GRC chamber JONUS
Ipeak, A 6:5� 0:8 0:8� 0:1 3:9� 0:7 6:9� 1:4Tarc, �s 6:1� 0:7 4:0� 0:6 18:0� 2:3 198� 18Warc, mJ 3:1� 0:2 1:9� 0:4 7:3� 1:1 75� 19Before: Ileak, A 1:88 � 10�4 1:18 � 10�3 7:30 � 10�6 2:25 � 10�4
After: Ileak, A 4:45 � 10�3 9:03 � 10�3 9:60 � 10�4 1:59 � 10�2
dPmax=Narc, % 0.6 0.6 0.7 1.7Narc 11 21 20 12
Table 6 Experimental conditions of Si with and without IBF cells
Facility Solar cell type No. of samples Range of Cext Pressure, Pa
LEO Si w/ IBF cell 8 5 � 10�8 F to 1:9 � 10�6 F 2:1 � 10�3 or 5:3 � 10�3
Si w/o IBF cell 7 5 � 10�8 F to 5 � 10�6 FGRC Si w/ IBF cell 5 1:5 � 10�7 F to 2 � 10�6 F 7:0 � 10�3
Si w/o IBF cell 3 1:5 � 10�7 F to 2 � 10�6 FJONAS Si w/ IBF cell 7 2 � 10�7 F to 1 � 10�6 F 5:0 � 10�4
Si w/o IBF cell 10 2 � 10�7 F to 1 � 10�6 FGEO Si w/o IBF cell 2 4 � 10�9 F to 1 � 10�7 F 3:0 � 10�3
Fig. 17 Relationship between dIleak and Ipeak on Si with and without
IBF cells.
Fig. 18 Relationship between dIleak and Tarc on Si with and without
IBF cells.
Fig. 19 Relationship between dIleak and Warc on Si with and without
IBF cells.
Table 7 Minimum discharge parameters for having Ileak increase beyond 10�2 A for silicon solar cells
Ipeak , A Tarc, s Warc, J dIleak=Narc, A �Pmax, %
Si w/ IBF cell LEO 26.6 2:83 � 10�5 7:90 � 10�2 1:04 � 10�2 �1:1JONAS 10.6 8:18 � 10�5 1:08 � 10�1 1:16 � 10�2 1.3
Si w/o IBF cell LEO 59.0 2:70 � 10�5 1:40 � 10�1 1:22 � 10�2 6.6JONAS 17.9 8:58 � 10�5 1:36 � 10�1 1:11 � 10�2 0.8
OKUMURA ETAL. 539
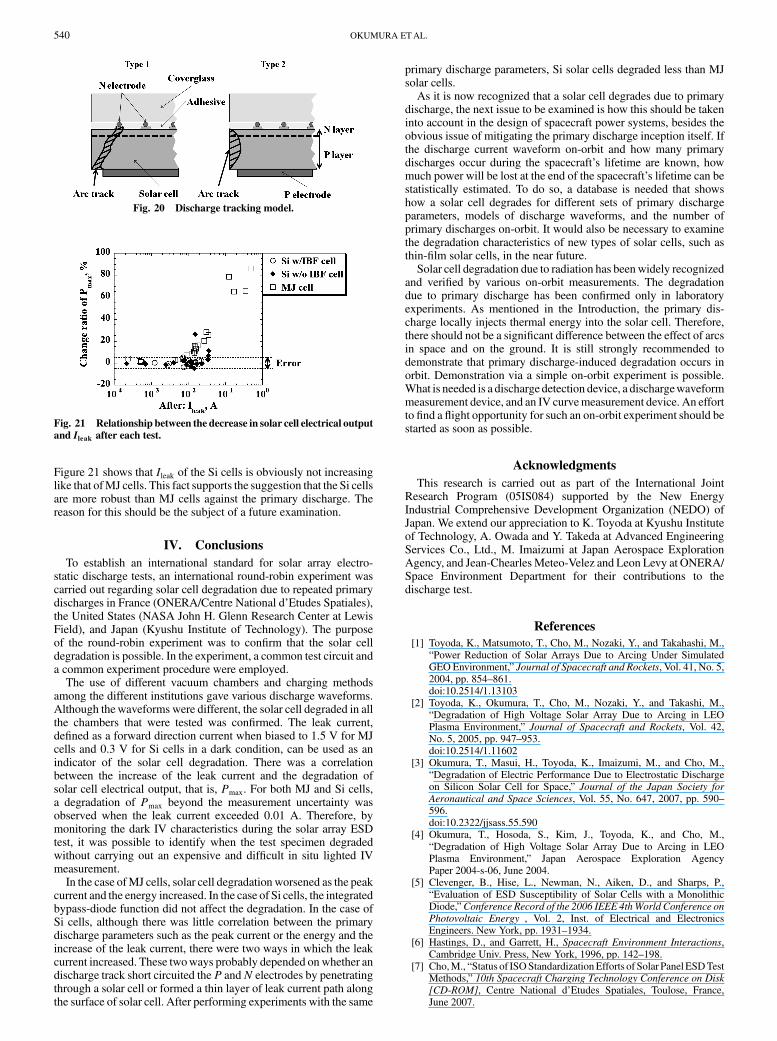
Figure 21 shows that Ileak of the Si cells is obviously not increasinglike that ofMJ cells. This fact supports the suggestion that the Si cellsare more robust than MJ cells against the primary discharge. Thereason for this should be the subject of a future examination.
IV. Conclusions
To establish an international standard for solar array electro-static discharge tests, an international round-robin experiment wascarried out regarding solar cell degradation due to repeated primarydischarges in France (ONERA/Centre National d’Etudes Spatiales),the United States (NASA John H. Glenn Research Center at LewisField), and Japan (Kyushu Institute of Technology). The purposeof the round-robin experiment was to confirm that the solar celldegradation is possible. In the experiment, a common test circuit anda common experiment procedure were employed.
The use of different vacuum chambers and charging methodsamong the different institutions gave various discharge waveforms.Although thewaveforms were different, the solar cell degraded in allthe chambers that were tested was confirmed. The leak current,defined as a forward direction current when biased to 1.5 V for MJcells and 0.3 V for Si cells in a dark condition, can be used as anindicator of the solar cell degradation. There was a correlationbetween the increase of the leak current and the degradation ofsolar cell electrical output, that is, Pmax. For both MJ and Si cells,a degradation of Pmax beyond the measurement uncertainty wasobserved when the leak current exceeded 0.01 A. Therefore, bymonitoring the dark IV characteristics during the solar array ESDtest, it was possible to identify when the test specimen degradedwithout carrying out an expensive and difficult in situ lighted IVmeasurement.
In the case ofMJ cells, solar cell degradationworsened as the peakcurrent and the energy increased. In the case of Si cells, the integratedbypass-diode function did not affect the degradation. In the case ofSi cells, although there was little correlation between the primarydischarge parameters such as the peak current or the energy and theincrease of the leak current, there were two ways in which the leakcurrent increased. These twoways probably depended onwhether andischarge track short circuited the P andN electrodes by penetratingthrough a solar cell or formed a thin layer of leak current path alongthe surface of solar cell. After performing experiments with the same
primary discharge parameters, Si solar cells degraded less than MJsolar cells.
As it is now recognized that a solar cell degrades due to primarydischarge, the next issue to be examined is how this should be takeninto account in the design of spacecraft power systems, besides theobvious issue of mitigating the primary discharge inception itself. Ifthe discharge current waveform on-orbit and how many primarydischarges occur during the spacecraft’s lifetime are known, howmuch power will be lost at the end of the spacecraft’s lifetime can bestatistically estimated. To do so, a database is needed that showshow a solar cell degrades for different sets of primary dischargeparameters, models of discharge waveforms, and the number ofprimary discharges on-orbit. It would also be necessary to examinethe degradation characteristics of new types of solar cells, such asthin-film solar cells, in the near future.
Solar cell degradation due to radiation has beenwidely recognizedand verified by various on-orbit measurements. The degradationdue to primary discharge has been confirmed only in laboratoryexperiments. As mentioned in the Introduction, the primary dis-charge locally injects thermal energy into the solar cell. Therefore,there should not be a significant difference between the effect of arcsin space and on the ground. It is still strongly recommended todemonstrate that primary discharge-induced degradation occurs inorbit. Demonstration via a simple on-orbit experiment is possible.What is needed is a discharge detection device, a dischargewaveformmeasurement device, and an IV curvemeasurement device. An effortto find a flight opportunity for such an on-orbit experiment should bestarted as soon as possible.
Acknowledgments
This research is carried out as part of the International JointResearch Program (05IS084) supported by the New EnergyIndustrial Comprehensive Development Organization (NEDO) ofJapan. We extend our appreciation to K. Toyoda at Kyushu Instituteof Technology, A. Owada and Y. Takeda at Advanced EngineeringServices Co., Ltd., M. Imaizumi at Japan Aerospace ExplorationAgency, and Jean-Chearles Meteo-Velez and Leon Levy at ONERA/Space Environment Department for their contributions to thedischarge test.
References
[1] Toyoda, K., Matsumoto, T., Cho, M., Nozaki, Y., and Takahashi, M.,“Power Reduction of Solar Arrays Due to Arcing Under SimulatedGEO Environment,” Journal of Spacecraft and Rockets, Vol. 41, No. 5,2004, pp. 854–861.doi:10.2514/1.13103
[2] Toyoda, K., Okumura, T., Cho, M., Nozaki, Y., and Takashi, M.,“Degradation of High Voltage Solar Array Due to Arcing in LEOPlasma Environment,” Journal of Spacecraft and Rockets, Vol. 42,No. 5, 2005, pp. 947–953.doi:10.2514/1.11602
[3] Okumura, T., Masui, H., Toyoda, K., Imaizumi, M., and Cho, M.,“Degradation of Electric Performance Due to Electrostatic Dischargeon Silicon Solar Cell for Space,” Journal of the Japan Society for
Aeronautical and Space Sciences, Vol. 55, No. 647, 2007, pp. 590–596.doi:10.2322/jjsass.55.590
[4] Okumura, T., Hosoda, S., Kim, J., Toyoda, K., and Cho, M.,“Degradation of High Voltage Solar Array Due to Arcing in LEOPlasma Environment,” Japan Aerospace Exploration AgencyPaper 2004-s-06, June 2004.
[5] Clevenger, B., Hise, L., Newman, N., Aiken, D., and Sharps, P.,“Evaluation of ESD Susceptibility of Solar Cells with a MonolithicDiode,”Conference Record of the 2006 IEEE 4thWorld Conference on
Photovoltaic Energy , Vol. 2, Inst. of Electrical and ElectronicsEngineers. New York, pp. 1931–1934.
[6] Hastings, D., and Garrett, H., Spacecraft Environment Interactions,Cambridge Univ. Press, New York, 1996, pp. 142–198.
[7] Cho,M., “Status of ISOStandardizationEfforts of Solar PanelESDTestMethods,” 10th Spacecraft Charging Technology Conference on Disk
[CD-ROM], Centre National d’Etudes Spatiales, Toulose, France,June 2007.
Fig. 20 Discharge tracking model.
Fig. 21 Relationship between the decrease in solar cell electrical output
and Ileak after each test.
540 OKUMURA ETAL.

[8] Okumura, T., Ninomiya, S., Masui, H., Toyoda, K., Imaizumi, M., andCho, M., “Solar Cell Degradation Due to ESD for InternationalStandardization of Solar Array ESD Test,” 10th Spacecraft Charging
Technology Conference, Centre National d’Etudes Spatiales, Toulose,France, June 2007.
[9] Mateo-Velez, J., Inguimbert, V., Roussel, J., Sarrail, D., Levy, L.,Boulay, F., Laffont, E., and Payan, D., “ESDs on Solar Cells –
Degradation, Modeling, and Importance of the Test Setup,” IEEE
Transactions on Plasma Science, Vol. 36, No. 5, Oct. 2008, pp. 2395–2403.doi:10.1109/TPS.2008.2001835
[10] Vayner, B., Ferguson, D., and Galofaro, J., “Detrimental Effect ofArcing on Solar Array Surfaces,” 10th Spacecraft Charging
Technology Conference on Disk [CD-ROM], Centre National d’EtudesSpatiales, Toulose, France, June 2007.
[11] Hayashi, H., Saionji, A., Toyoda, K., Cho, M., and Kuninaka, H.,“Development of Plasma Interaction Acceleration Test Facility forStudy on Space Material Deterioration,” Japan Aerospace ExplorationAgency Paper 2002-b-28, 2002.
A. KetsdeverAssociate Editor
OKUMURA ETAL. 541