©International Logistics and Supply Chain Congress DEA-BASED BENCHMARKING MODELS IN SUPPLY CHAIN...
38
©International Logistics and Supply Chain Congress’ 2012 November 08-09, 2012, Istanbul, TURKIYE Ertek, G., Akyurt, N., Tillem, G., 2012, “Dea-based benchmarking models in supply chain management: an application-oriented literature review”, X. International Logistics and Supply Chain Congress 2012, November 8-9, Istanbul, Turkey. Note: This is the final draft version of this paper. Please cite this paper (or this final draft) as above. You can download this final draft from http://research.sabanciuniv.edu. DEA-BASED BENCHMARKING MODELS IN SUPPLY CHAIN MANAGEMENT: AN APPLICATION-ORIENTED LITERATURE REVIEW Gürdal Ertek 1 , Nazlı Akyurt 2 , Gamze Tillem 3 Abstract ⎯ Data Envelopment Analysis (DEA) is a mathematical methodology for benchmarking a group of entities in a group. The inputs of a DEA model are the resources that the entity consumes, and the outputs of the outputs are the desired outcomes generated by the entity, by using the inputs. DEA returns important benchmarking metrics, including efficiency score, reference set, and projections. While DEA has been extensively applied in supply chain management (SCM) as well as a diverse range of other fields, it is not clear what has been done in the literature in the past, especially given the domain, the model details, and the country of application. Also, it is not clear what would be an acceptable number of DMUs in comparison to existing research. This paper follows a recipe-based approach, listing the main characteristics of the DEA models for supply chain management. This way, practitioners in the field can build their own models without having to perform 1 Gürdal Ertek, Assistant Professor, Sabanci University, Faculty of Engineering and Natural Sciences, Tuzla, İstanbul, Turkey, 2 Nazlı Akyurt, Sabanci University, Faculty of Engineering and Natural Sciences, Tuzla, İstanbul, Turkey, 3 Gamze Tillem, Sabanci University, Faculty of Engineering and Natural Sciences, Tuzla, İstanbul, Turkey,
-
Upload
independent -
Category
Documents
-
view
4 -
download
0
Transcript of ©International Logistics and Supply Chain Congress DEA-BASED BENCHMARKING MODELS IN SUPPLY CHAIN...
©International Logistics and Supply Chain Congress’ 2012 November 08-09, 2012, Istanbul, TURKIYE
Ertek, G., Akyurt, N., Tillem, G., 2012, “Dea-based benchmarking models in supply chain
management: an application-oriented literature review”, X. International Logistics and Supply
Chain Congress 2012, November 8-9, Istanbul, Turkey.
Note: This is the final draft version of this paper. Please cite this paper (or this final draft) as
above. You can download this final draft from http://research.sabanciuniv.edu.
DEA-BASED BENCHMARKING MODELS IN SUPPLY CHAIN
MANAGEMENT: AN APPLICATION-ORIENTED LITERATURE REVIEW
Gürdal Ertek1, Nazlı Akyurt2, Gamze Tillem3
Abstract ⎯ Data Envelopment Analysis (DEA) is a mathematical methodology for
benchmarking a group of entities in a group. The inputs of a DEA model are the resources
that the entity consumes, and the outputs of the outputs are the desired outcomes generated
by the entity, by using the inputs. DEA returns important benchmarking metrics, including
efficiency score, reference set, and projections. While DEA has been extensively applied in
supply chain management (SCM) as well as a diverse range of other fields, it is not clear
what has been done in the literature in the past, especially given the domain, the model
details, and the country of application. Also, it is not clear what would be an acceptable
number of DMUs in comparison to existing research. This paper follows a recipe-based
approach, listing the main characteristics of the DEA models for supply chain management.
This way, practitioners in the field can build their own models without having to perform
1 Gürdal Ertek, Assistant Professor, Sabanci University, Faculty of Engineering and Natural Sciences, Tuzla, İstanbul, Turkey, 2 Nazlı Akyurt, Sabanci University, Faculty of Engineering and Natural Sciences, Tuzla, İstanbul, Turkey, 3 Gamze Tillem, Sabanci University, Faculty of Engineering and Natural Sciences, Tuzla, İstanbul, Turkey,
©International Logistics and Supply Chain Congress’ 2012 November 08-09, 2012, Istanbul, TURKIYE
detailed literature search. Further guidelines are also provided in the paper for
practitioners, regarding the application of DEA in SCM benchmarking.
Keywords ⎯ Data envelopment analysis (DEA), supply chain management (SCM), survey
paper
INTRODUCTION
Supply Chain Management
Mentzer et al. (2001) define supply chain as “a set of three or more entities (organizations or
individuals) directly involved in the upstream and downstream flows of products, services,
finances, and/or information from a source to a customer” and identify three degrees of supply
chain complexity: A direct supply chain consists of a company, its upstream neighbors (suppliers),
and its downstream neighbors (customers, being consumers or intermediary vendors). An
extended supply chain includes the complete chain, from the ultimate suppliers to the ultimate
customers. An ultimate supply chain is one where all the organizations (even the financial
providers and the market research firms) involved in all the upstream and downstream flows of
products, services, finances, and information within the supply chain. Mentzer et al. (2001) define
supply chain management (SCM) as “the systemic, strategic coordination of … the supply chain,
for the purposes of improving the long-term performance of the individual companies and the
supply chain as a whole.”
SCM is important because effective supply chain strategies be the most influential driving force
in the growth and success of companies. One classical example is the global retail giant Walmart,
which has become the largest public corporation on earth with respect to revenue (Forbes), with
more than 8,500 stores in 15 countries (Daniel, 2010). At the core of Walmart’s success lies
crossdocking, a supply chain strategy that eliminates most of the product storage and transforms
warehouses into transfer locations with minimal materials storage and material handling (Ertek,
2011).
The global logistics market grew by 7.3% in 2007 to reach a value of $805 billion. In 2012, the
global logistics market was forecasted to have a value of $1,040 billion, an increase of 29.3% in
only five years since 2007 (Datamonitor, 2010). Every physical product on the face of earth is
©International Logistics and Supply Chain Congress’ 2012 November 08-09, 2012, Istanbul, TURKIYE
produced and delivered to its ultimate customer through a supply chain, and as the global world
population and the demand for physical products increases, the importance of SCM can only
increase. This is an important motivation and justification for increasing academic research on
SCM.
Benchmarking and DEA
The improvement of any system involves measurement of its performance in the dimensions of
interest. Many performance measurement systems are designed to present reports on a set of
selected performance metrics, also referred to as performance measures, performance indicators
or key performance indicators (KPI). Besides internal performance measurement, it is also
essential to compare the performance of the system with other systems of its kind. This
comparison of a set of systems or entities with respect to each other is referred to as
benchmarking.
Benchmarking can be carried out using qualitative and/or quantitative approaches. Ho et al.
(2010) present a comprehensive review of quantitative methods for multi-dimensional
benchmarking suppliers in a supply chain. The methods described in Ho et al. (2010) are
applicable not only for supplier benchmarking, but also benchmarking other types of entities in a
supply chain, such as supply chains, 3PL companies and warehouses.
Among the quantitative approaches, Data Envelopment Analysis (DEA) is particularly
interesting and useful, due to its capability of multi-dimensional benchmarking and the usefulness
of the results in generates. The popularity of DEA (Emrouznejad, 2008) makes it a viable
alternative as a quantitative technique. DEA takes as model input a set of input and a set of output
values for a set of entities. These entities to be benchmarked are referred to as decision making
units (DMU). The primary output of a DEA model is the efficiency score for each DMU, which
takes a value between 0 and 1. Other results generated include the reference set and the
projections for each DMU. An extensive discussion of the DEA concepts, models and modeling
issues can be found in Cooper et al. (2006).
Gattoufi et al. (2004b) present a classification scheme for the DEA literature, based on the
following criteria: (1) Data source, (2) Type of the implemented envelopment, (3) Analysis, and (4)
Nature of the paper. Gattoufi et al. (2004a) is a comprehensive reference on the content analysis of
DEA literature and its comparison with operations research and management science fields.
©International Logistics and Supply Chain Congress’ 2012 November 08-09, 2012, Istanbul, TURKIYE
Research Motivation and Scope
The reviews of both Gattoufi et al. (2004a) and Emrouznejad (2008) cite applications of DEA
within the domain of SCM. Some of these application papers, as well as others, contain review of
similar papers that apply DEA for benchmarking in SCM. However, there is a significant modeling
challenge for SCM practitioners who would consider using DEA: What should s/he benchmark,
and what inputs and outputs should s/he select?
This practical challenge can be paused as a research question, which calls for a literature survey
study:
“What has been done so far in journal papers for benchmarking in SCM using DEA?”
The goal of this paper is to list the main characteristics of the DEA models in the academic
journals. This way, practitioners in the field can build their own models without having to perform
detailed literature search.
The basic supply chain considered in the review will be the and the direct supply chain, as
described by Mentzer et al. (2001), involving only three successive stages: The company in the
middle, with its neighboring suppliers and customers. Throughout the paper, this will be the
terminology used. Any dyadic supply chain, involving only the supplier and buyer, is considered as
a subset of the direct supply chain.
The questions whose answers are investigated in this survey paper are as follows:
1) Which papers in the literature have used DEA for SCM?
2) What is the industry where the benchmarking is carried out?
3) What is the benchmarked DMU?
4) Which years does the data cover?
5) How many DMUs were included in the DEA model?
6) What is the country of application?
7) What are the inputs and the outputs in the DEA model?
8) How many inputs and outputs are used in the DEA models?
9) What is the nature of the inputs and outputs?
©International Logistics and Supply Chain Congress’ 2012 November 08-09, 2012, Istanbul, TURKIYE
We believe that having the answers to the above questions will greatly facilitate the work of SCM
practitioners at all managerial levels on the enterprise. The answers to the questions are provided
in the tables and figures of this paper. Furthermore, the complete database constructed for the
paper is made available online as a supplement spreadsheet (Ertek et al. 2012).
In this section, the study has been motivated and introduced, and concise literature review has
been presented. In the Methodology section, the methodology applied while conducting the
literature survey is described. In the Results section, the results of the literature survey are
presented. Finally, in the Conclusions section, the study is concluded with a summary and
remarks.
METHODOLOGY
The initial motivation for this paper was to construction of a very comprehensive list of all the
DEA models applied in SCM. The process started with the definition of the table structure for the
database to be constructed. However, throughout the literature search process, the database
structure has been modified several times. The final version of the database, held in a spreadsheet,
is v29 (Ertek et al., 2012).
We decided early on that there are far too many papers related with our topic, and that we
should focus only on journal papers, discarding other publication types (conference papers, thesis,
etc.). While some conference papers go through a very rigorous review process before being
published, we subjectively decided that on the overall, it is harder to get a journal paper published
than any other publication types. We also decided that we should focus only on the recent papers,
and determined the year 2000 as the lower threshold for the year of publication. The two papers
before the year 2000 have been included solely because they contain the original data for the
models in post-2000 papers.
The literature search advanced as three sub-processes, with many interactions in between. 1)
The studies cited in the papers which were readily known by us were searched; 2) Internet search
was carried out using Google Scholar online service, as well as Emerald and Ebscohost databases.
The search terms were “supply chain and dea”, “logistics dea”, “supply logistics dea”; 3) Newer
studies that cite selected papers were searched using Google Scholar and ISI Web of Science.
Among more than 1000 search results sifted through, more than 2000 were skimmed, and 86
were analyzed thoroughly. Eventually, 41 papers were included in the list of cited papers in our
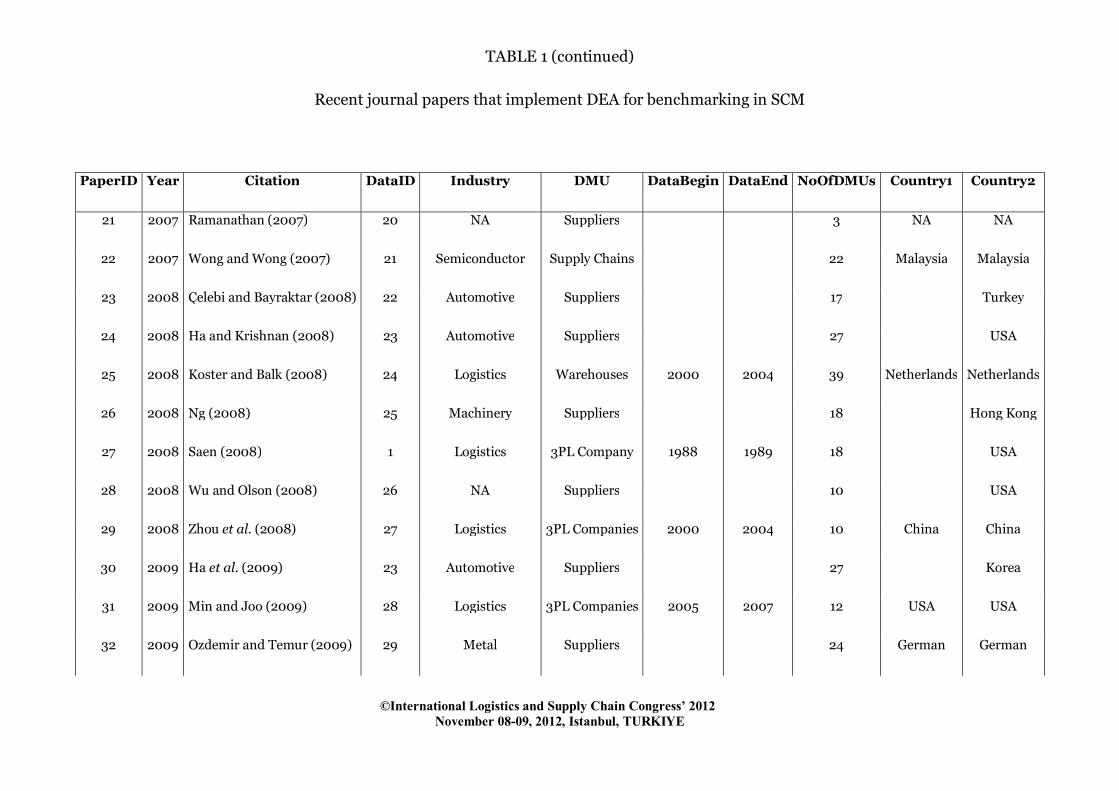
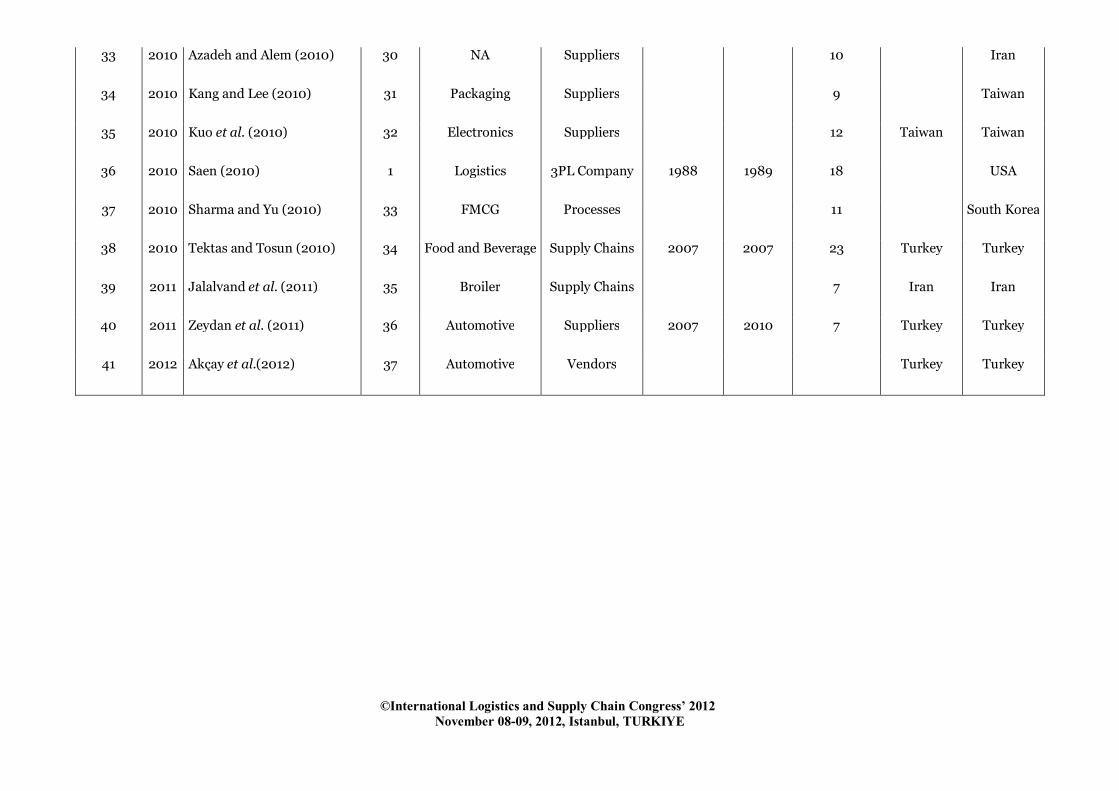
survey. Some of these papers used the same data set (Kleinsorge et al. (1992), Talluri and Sarkis
©International Logistics and Supply Chain Congress’ 2012 November 08-09, 2012, Istanbul, TURKIYE
(2010), Saen (2008), Saen (2010)). These four papers (PaperID=1, 10, 27, 36) have the same
DataID of 1, as shown in Table 1 under the DataID column. The inputs and outputs of the DEA
models in these four papers are given in Table 5. Furthermore, two papers used not only the same
data but also used the same inputs and outputs (these two papers are shown in Table1 with
PaperID=24&30, and DataID=23). The inputs and outputs of these two papers are given in Table
6.
In any data-involving study, data cleaning is a very important inevitable step. After the
database was populated with the collected data, a careful and rigorous data cleaning was carried
out, based on the taxonomy of the dirty data by Kim et al. (2003).
One particular challenge in the construction of the summary table was the non-standard usage
of terminology. In some of the papers (Wu and Chien, 2008; Weber, 2000; Talluri et al, 2006; Liu
et al., 2000; Çelebi and Bayraktar, 2008) the term “vendor” was used to refer to the suppliers that
the company purchases parts/assemblies from. Therefore, the usage of the term “vendor” in these
papers had to be reflected in our tables as “suppliers”, since the term “vendor” in our paper refers
to downstream supply chain neighbors who purchase from the company, to sell to their customers.
In our database, there exists only a single paper that considers vendors as DMUs (Akçay et al.,
2012).
Another challenge was the inclusion of the contents of papers with more than one DEA model
within. This was the case for Liang et al. (2006) and Akçay et al. (2012) (PaperID=14 and 41,
respectively). For these two papers, only the first of the mentioned models was considered and
populated into the database.
Finally, while populating the database, when the inputs or outputs were not clearly stated in
the paper we assumed that there was only a single input of output.
RESULTS
The completed database consists of two main tables, which are PAPERS (Table 1) and
INPUTS_OUTPUTS (Table 2). In both tables, missing data was shown with blank cells or cells
with a “- ” sign. The entry “NA” refers to “Not Applicable”.
Papers and DMUs in the Models
©International Logistics and Supply Chain Congress’ 2012 November 08-09, 2012, Istanbul, TURKIYE
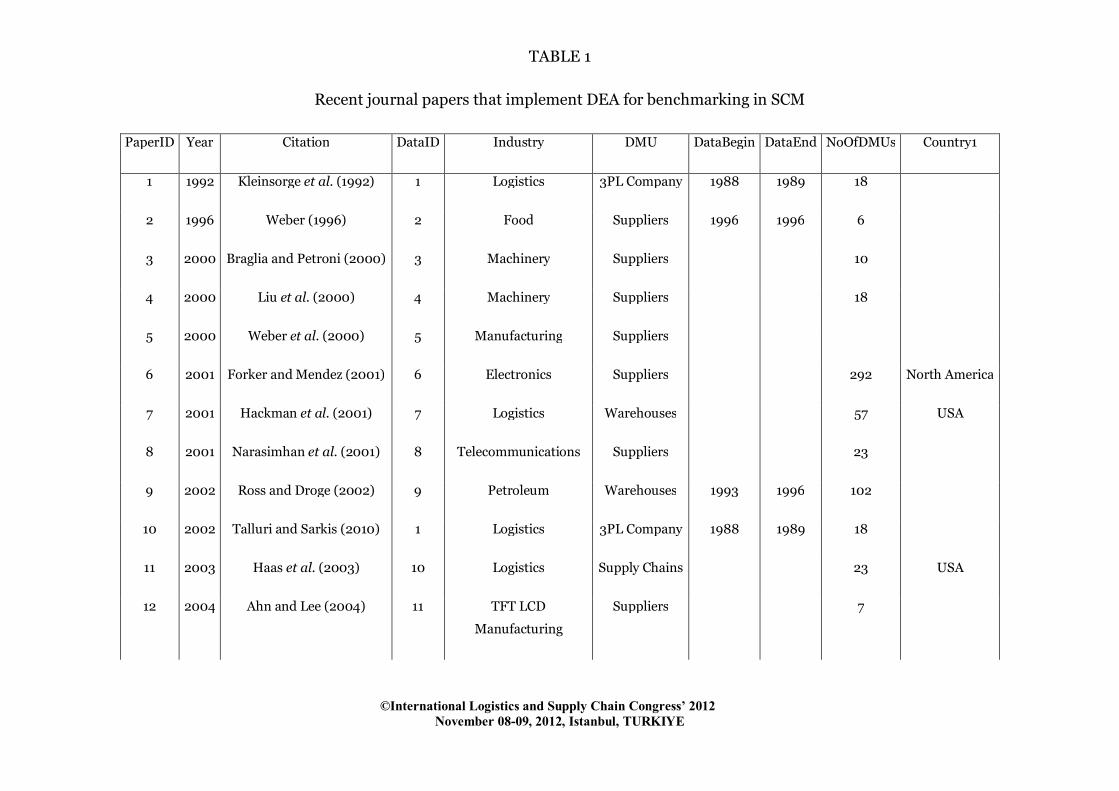
The PAPERS table contains the fields PaperID, Year (publication year of the paper), Citation,
DataID (the unique ID for the data used in the paper), IsDataReal (whether the data is from the
real world or not), IsDataOpSurvey (whether the data is completely based on an opinion survey or
not), Industry (the industry where the application is made), DMU, DataBegin (the beginning year
for the data), DataEnd (the ending year for the data), NoOfDMUs (number of DMUs included in
the model), Country1 (the country where the model was applied) and Country2 (the guessed
countries as well as the known ones). PaperID is the key attribute for the table. The table, except
the fields IsDataReal, IsDataOpSurvey, and Country2, is given in Table 1.
Among the papers listed in PAPERS (Table 1), those with PaperID=12, 14, 20, 33 use syntetic
data, generated by the authors. For these four papers (rows in the table), the attribute IsDataReal
takes the value of Syntetic. For all other papers, IsDataReal takes the value of RealWorld, meaning
that the data is understood to come from the real world.
Among the papers listed in PAPERS, those with PaperID=11, 22, 35 use opinion surveys as the
source of data for the inputs and outputs. For these three papers (rows in the table), the attribute
IsDataOpSurvey takes the value of OpinionSurvey. For all other papers, IsDataOpSurvey takes the
value of DirectData, meaning that the data is not (at least completely) based on opinions expressed
in a survey.
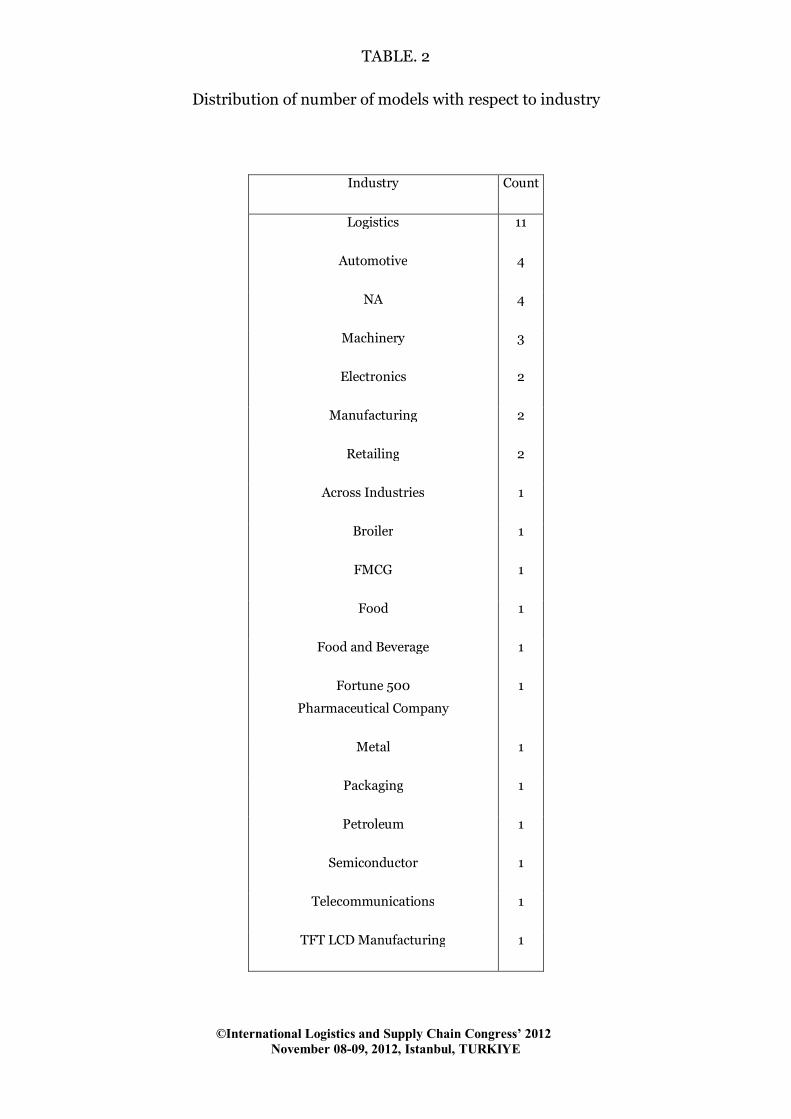
Table 2 shows the distribution of number of models with respect to industry. Logistics is the
primary industry for which DEA models are constructed. Automotive and machinery industries are
also primary application areas.
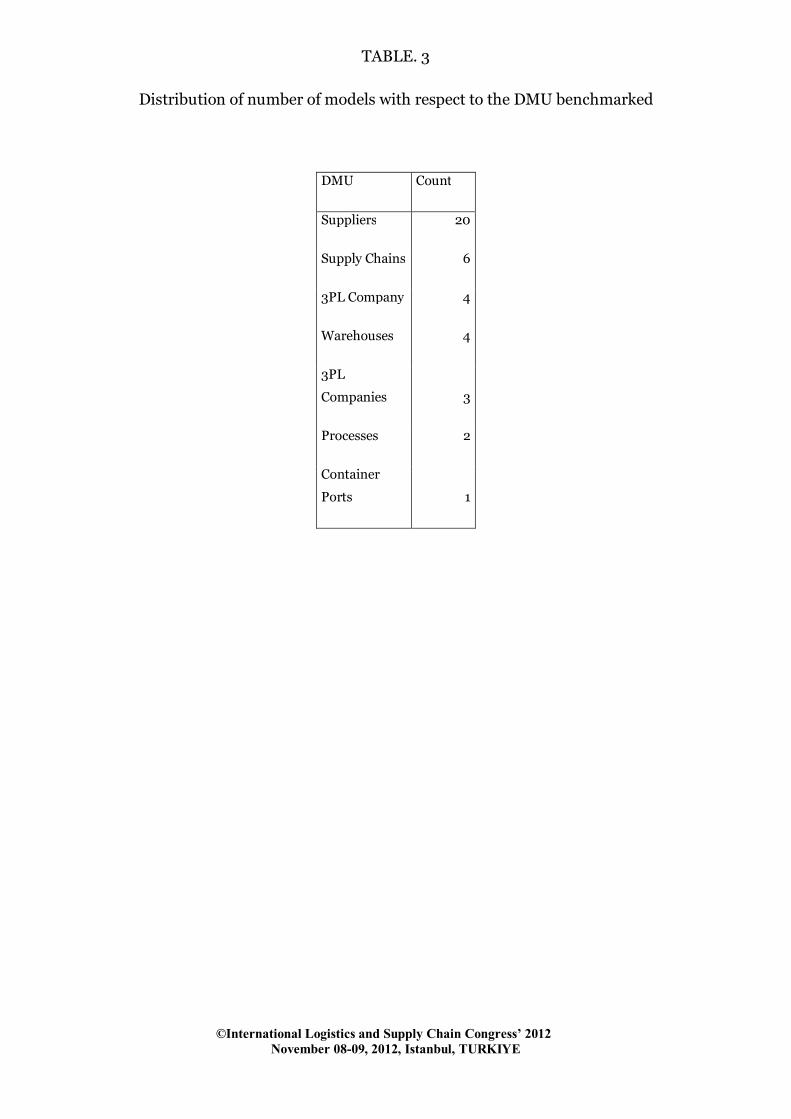
Table 3 shows the distribution of number of models with respect to the DMU benchmarked.
Most of the DEA models for SCM consider the suppliers as the DMUs. Benchmarking of complete
supply chains ranks second with respect to popularity. Four papers, based on Kleinsorge et al.
(1992), consider the monthly data from a single 3PL company (rather than 3PL companies) as
DMUs. There are also four papers where warehouses are benchmarked.
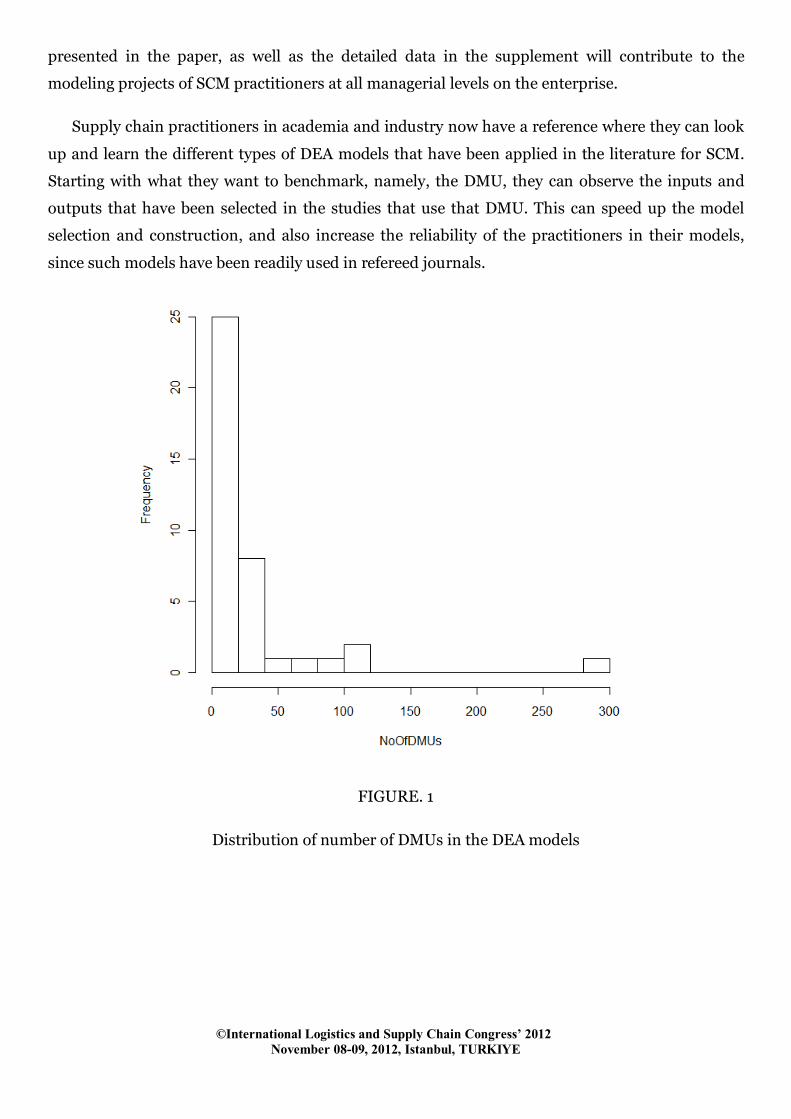
Figure 1 shows the distribution of number of DMUs in the DEA models as a histogram. An
overwhelming majority of the models benchmark up to 20 DMUs. Only six of the 41 models
benchmark more than 40 DMUs. Therefore, if a DEA model for SCM includes more than 40
DMUs, it is within the top 30% of the models with respect to size.
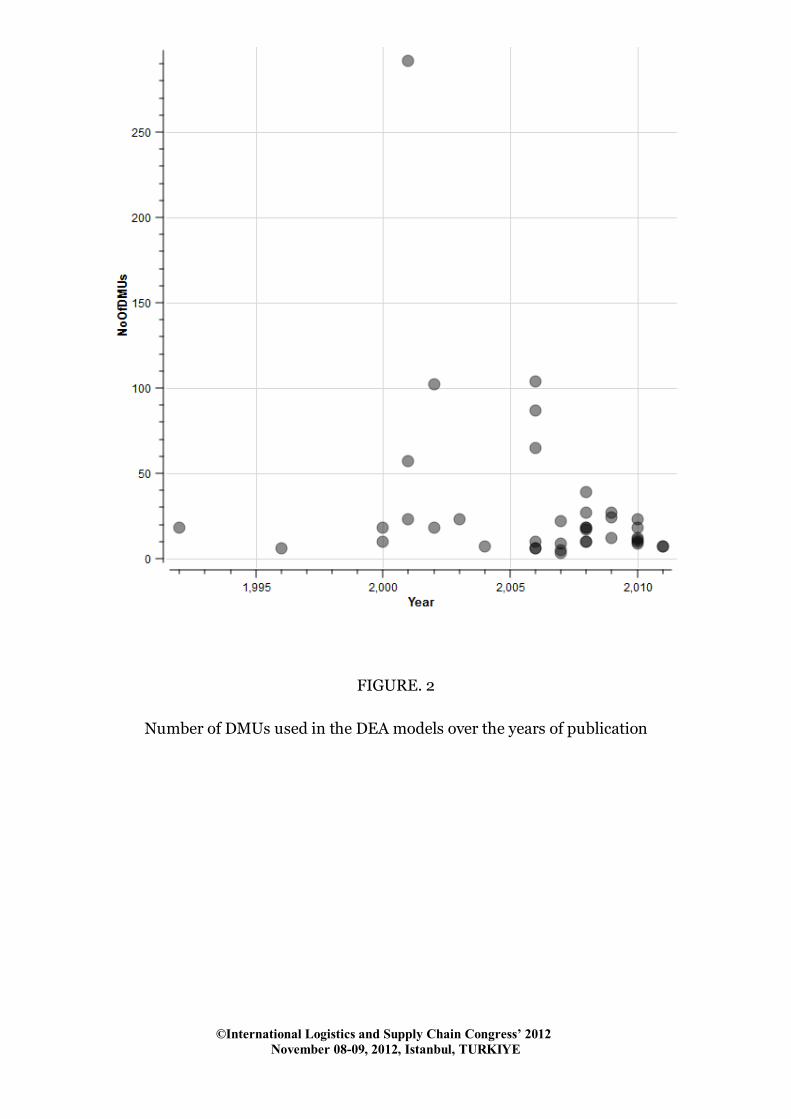
The analysis of number of DMUs with respect to years has also been conducted, both as a
scatter plot (Figure 2) and a statistical hypothesis test, namely the Spearman correlation test. As
©International Logistics and Supply Chain Congress’ 2012 November 08-09, 2012, Istanbul, TURKIYE
indicated by a p-value of 0.2643, there does not exist a statistically significant change through the
years in the number of DMUs considered in the models.
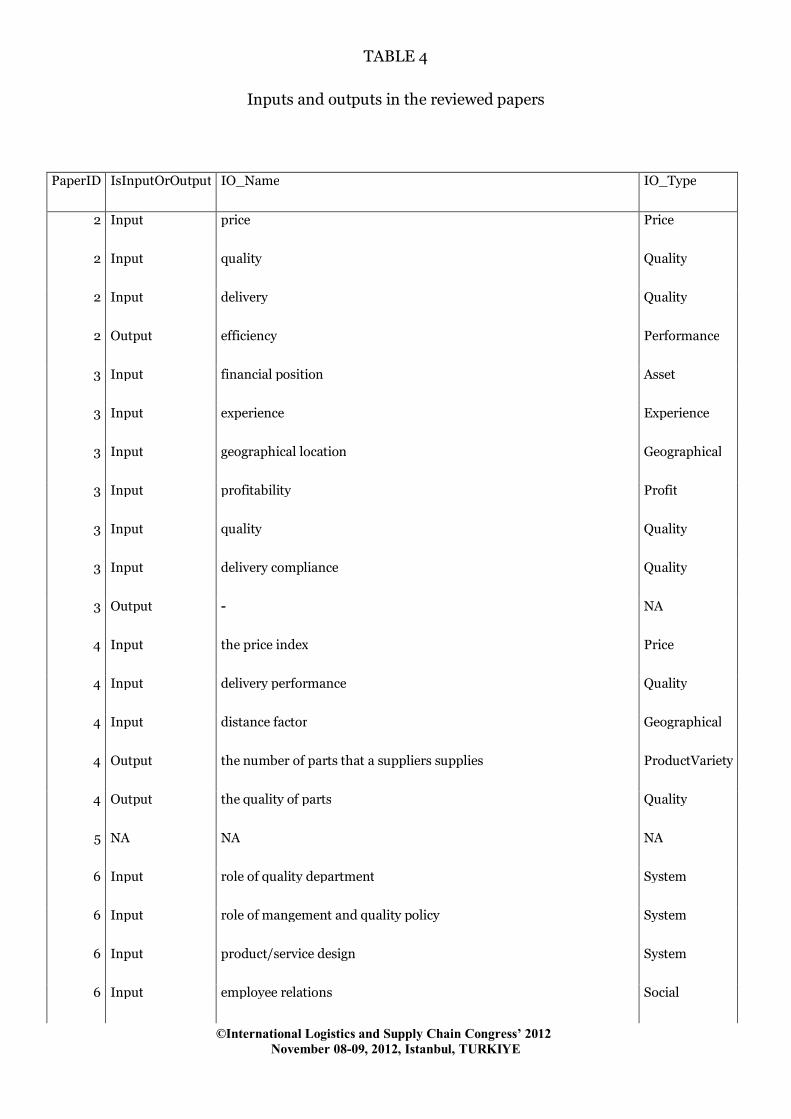
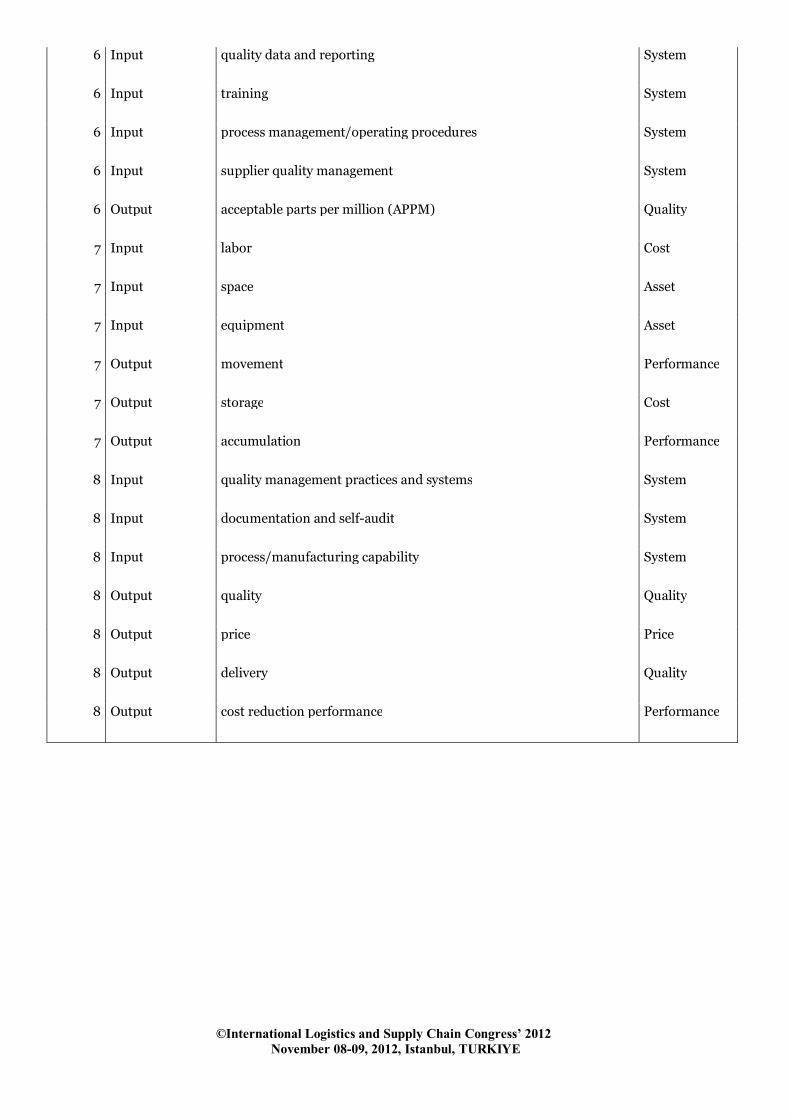
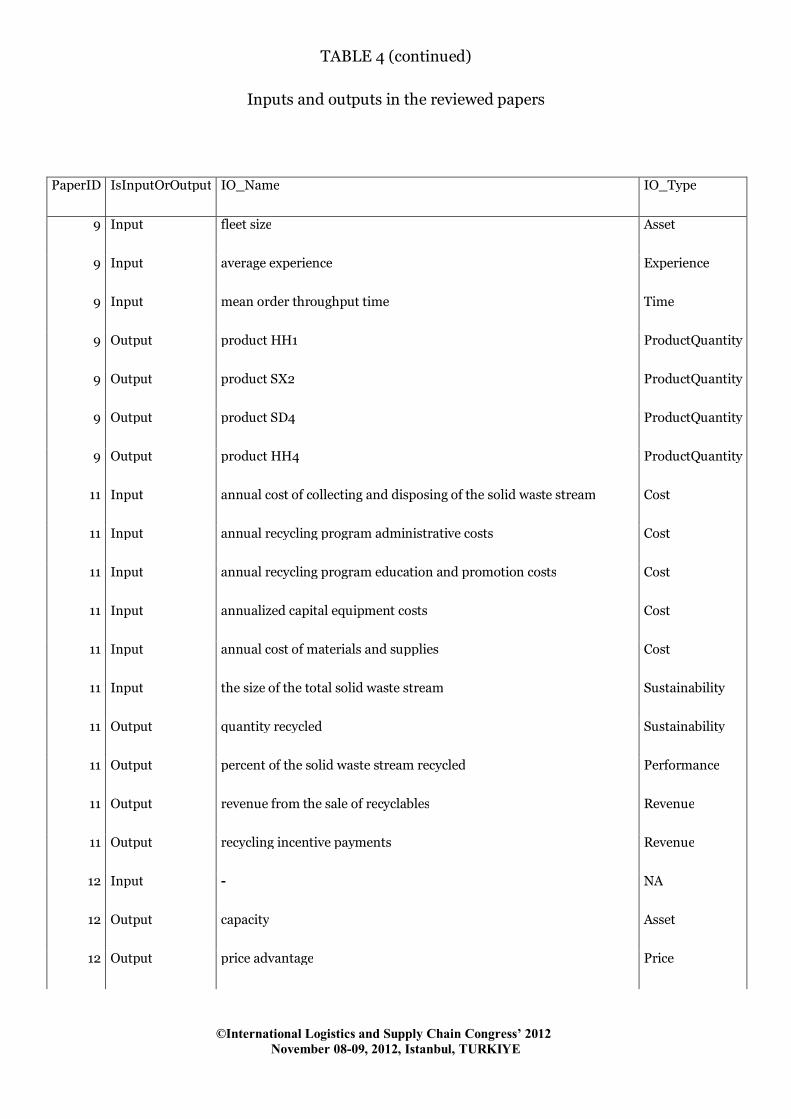
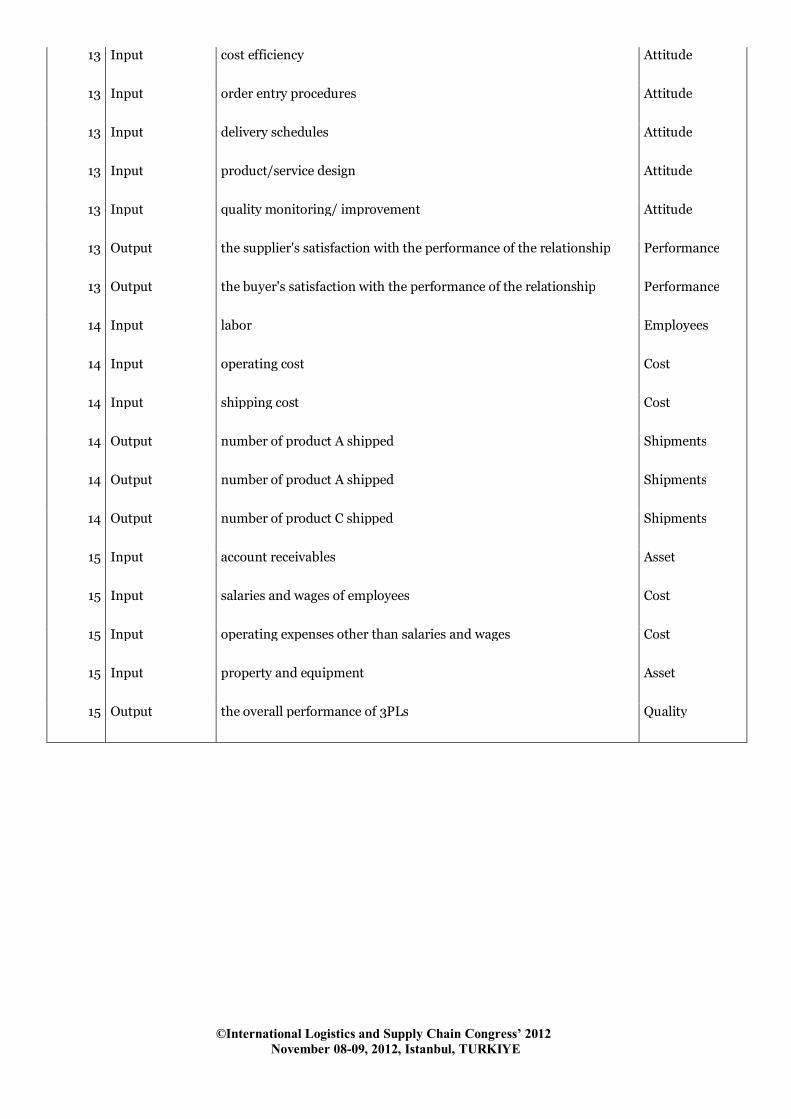
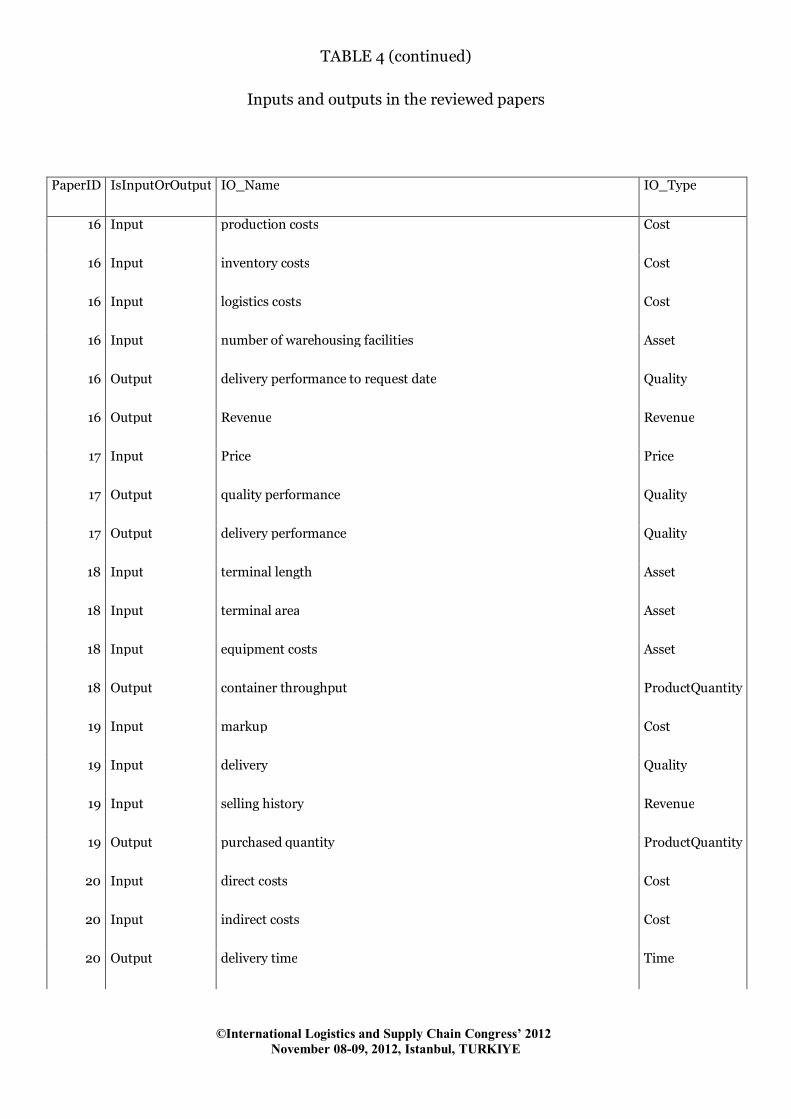
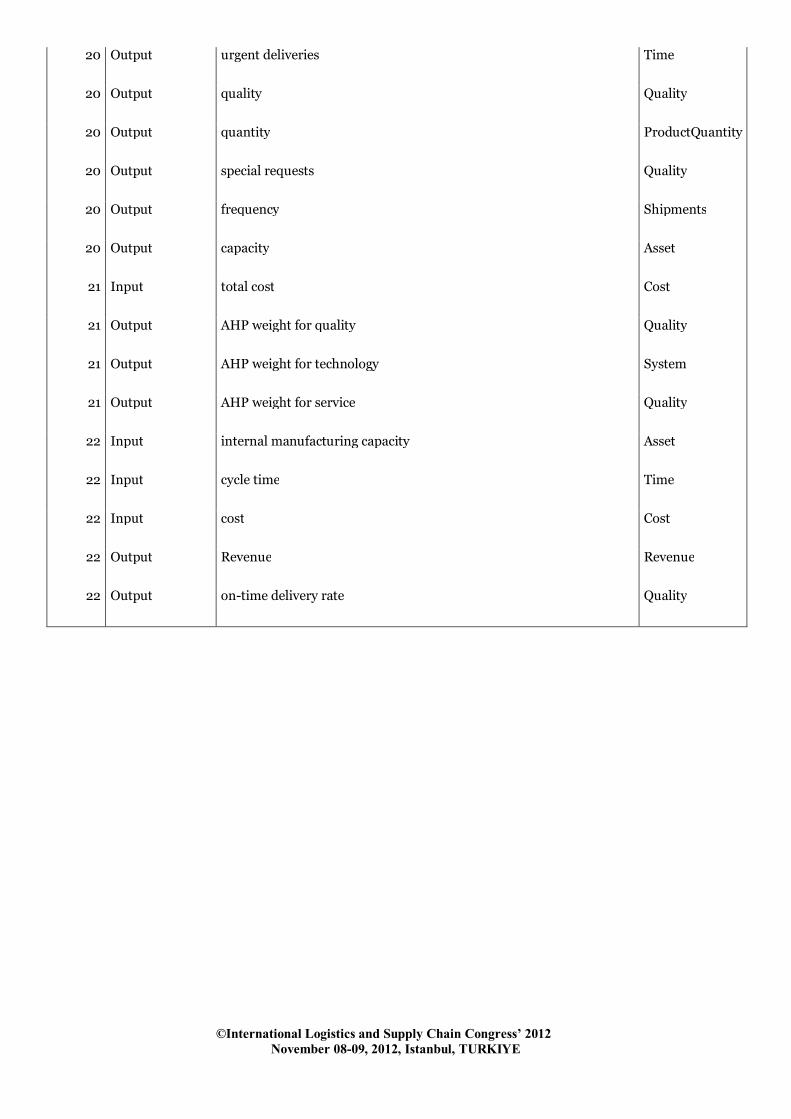
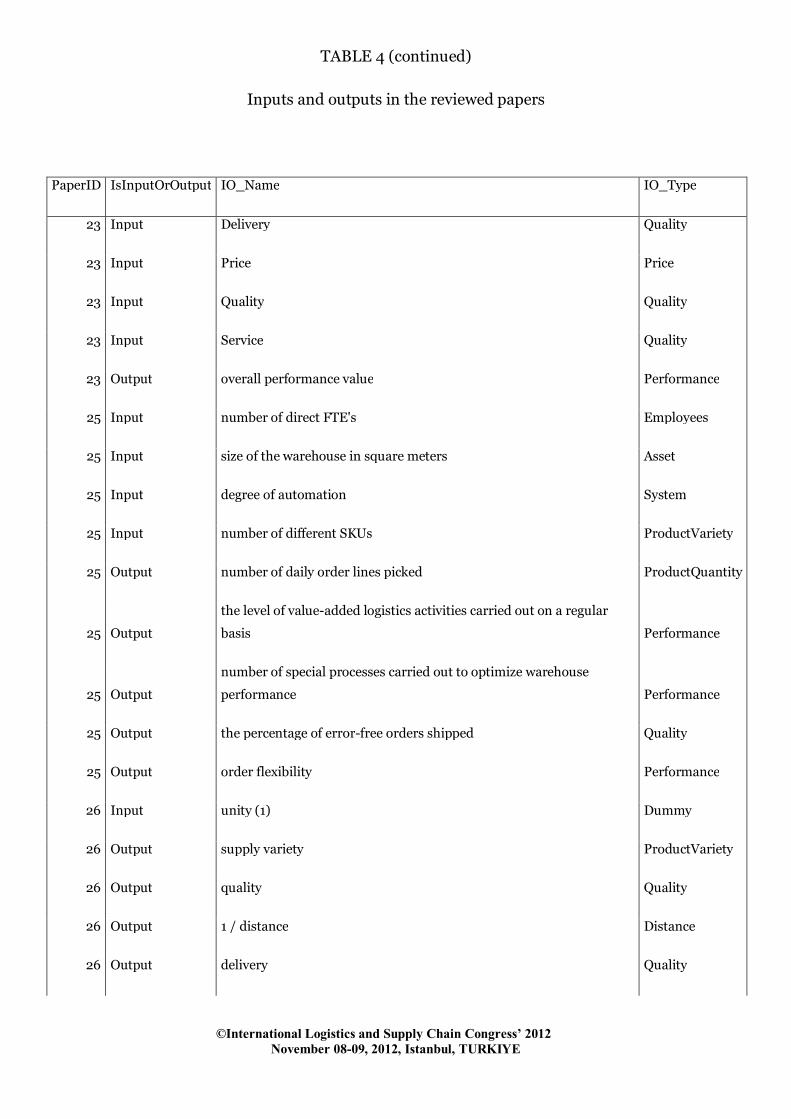
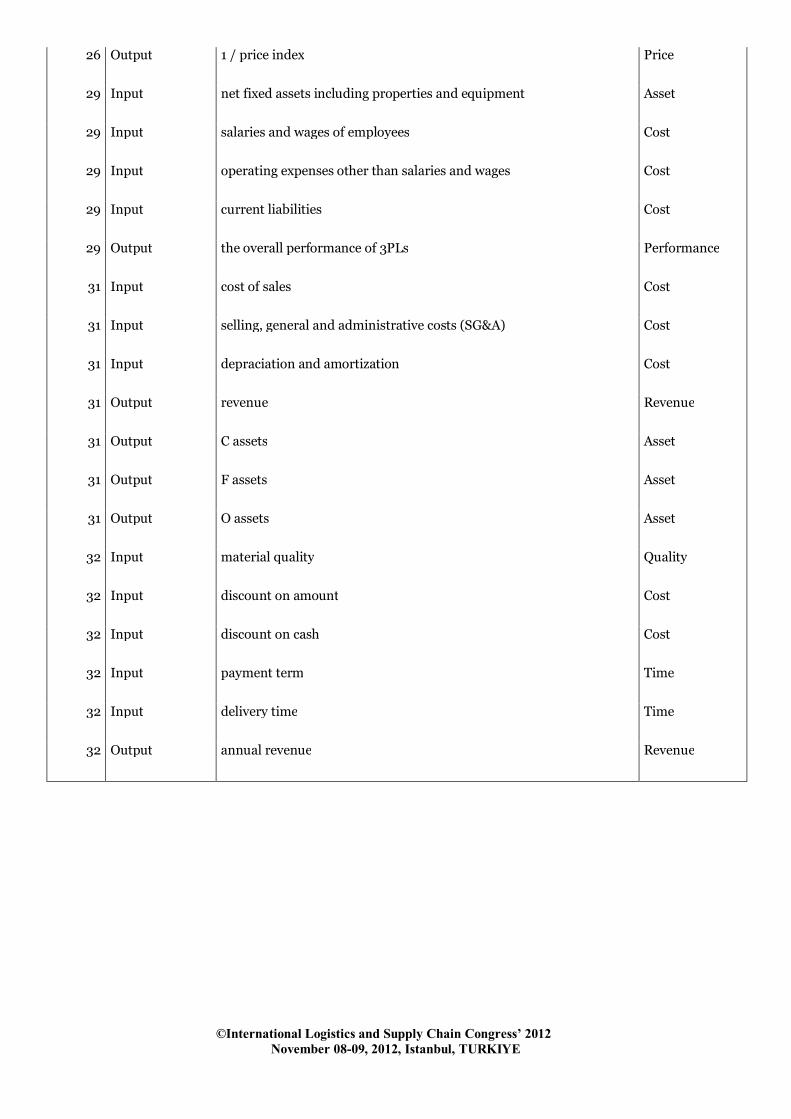
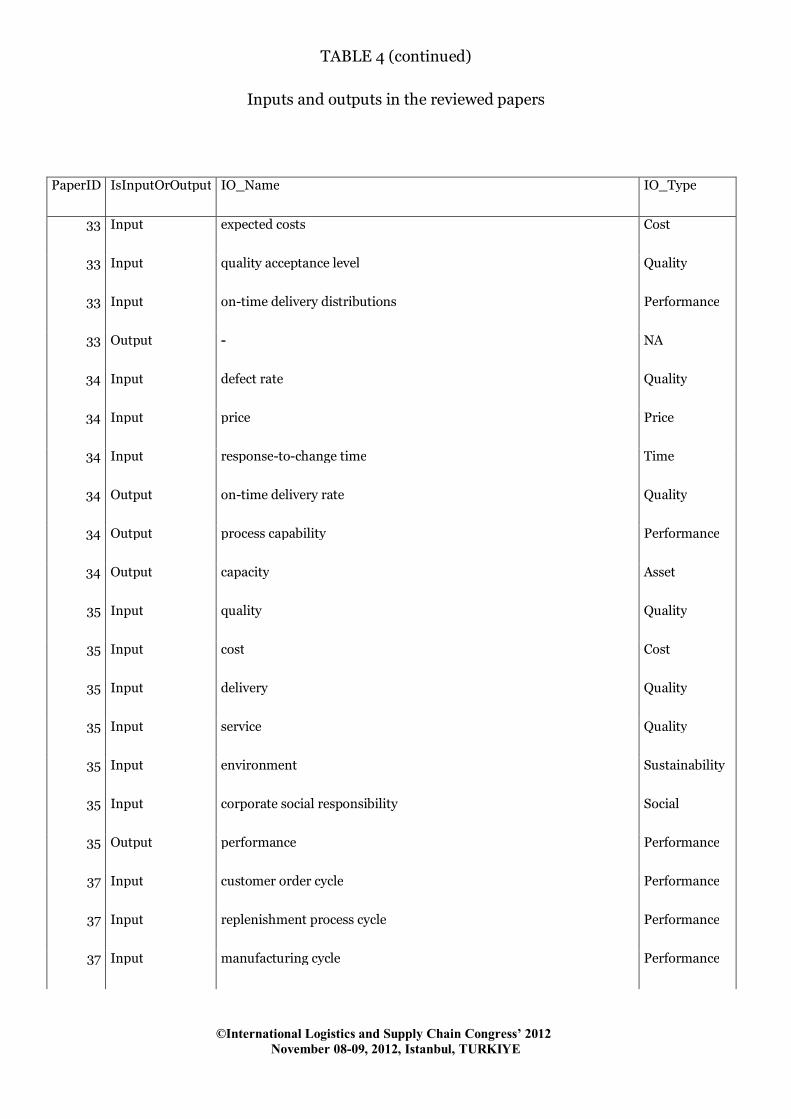
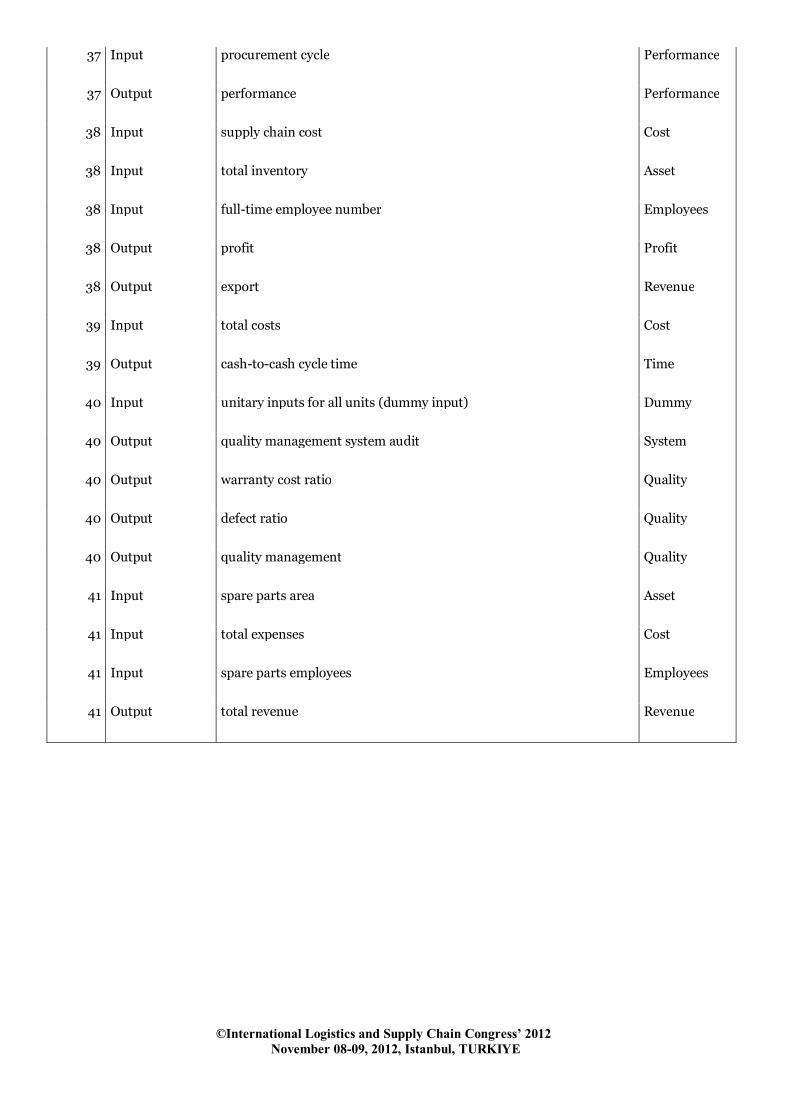
Inputs and Outputs in the Models
The INPUTS_OUTPUTS table contains the fields PaperID, IsInputOrOutput (is the ,
IO_Name, IO_Type. The three fields form the key in this table. Each row refers to the information
about a particular input or output in one of the models (each model is referred to with the PaperID
of the paper it is in). The table is given in Table 4.
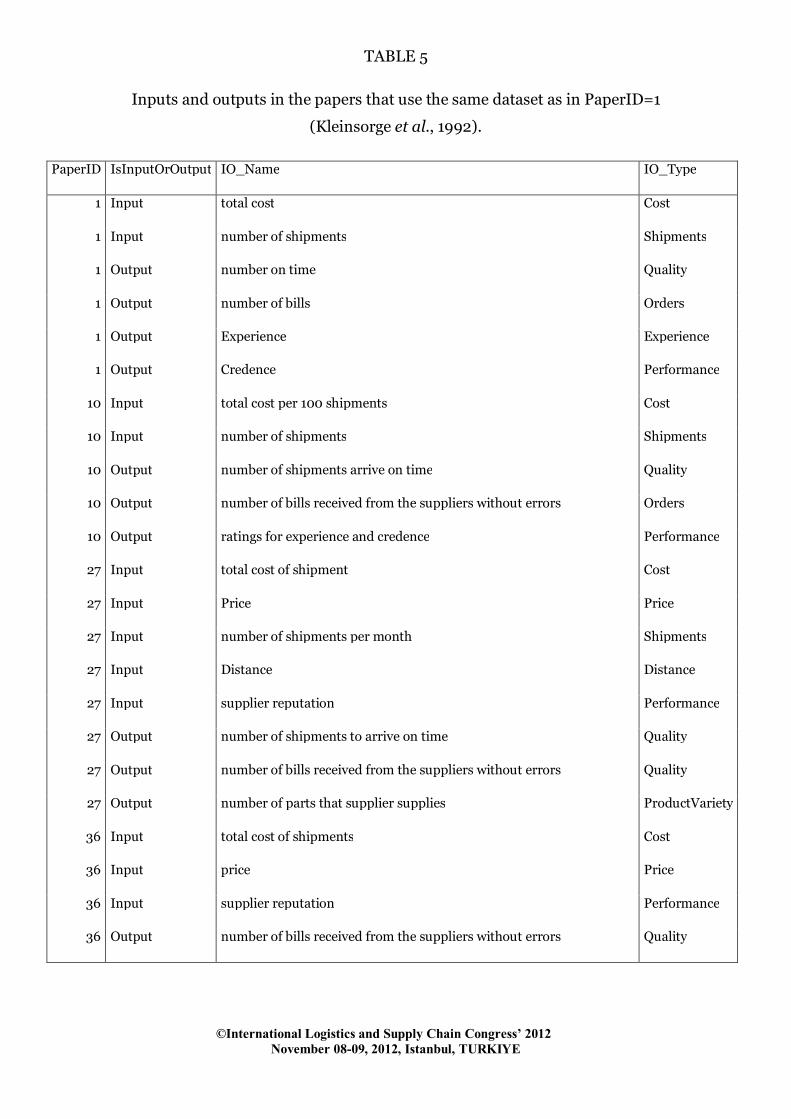
As mentioned earlier, four of these papers used the same data set, coming from Kleinsorge et
al. (1992). The inputs and outputs for these four papers (PaperID=1, 10, 27, 36; DataID=1) are
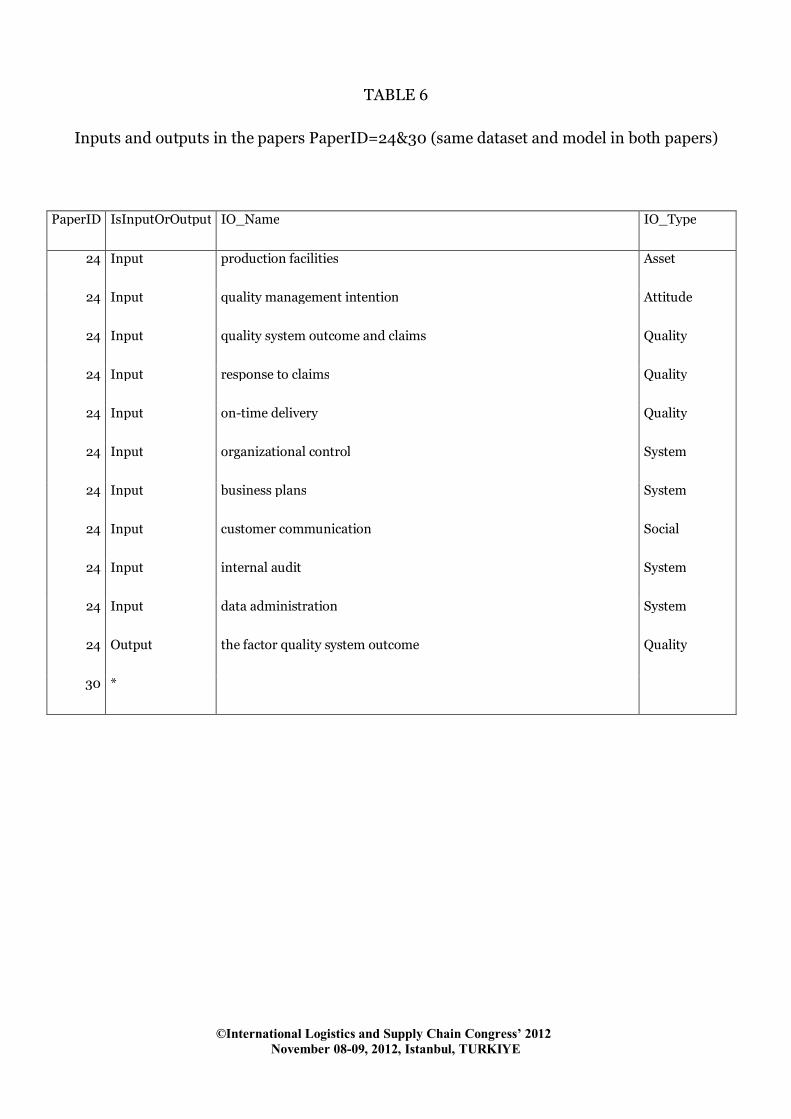
given in Table 5. Furthermore, two papers used not only the same data but also used the same
inputs and outputs (PaperID=24&30; DataID=23). The inputs and outputs of these two papers are
given in Table 6.
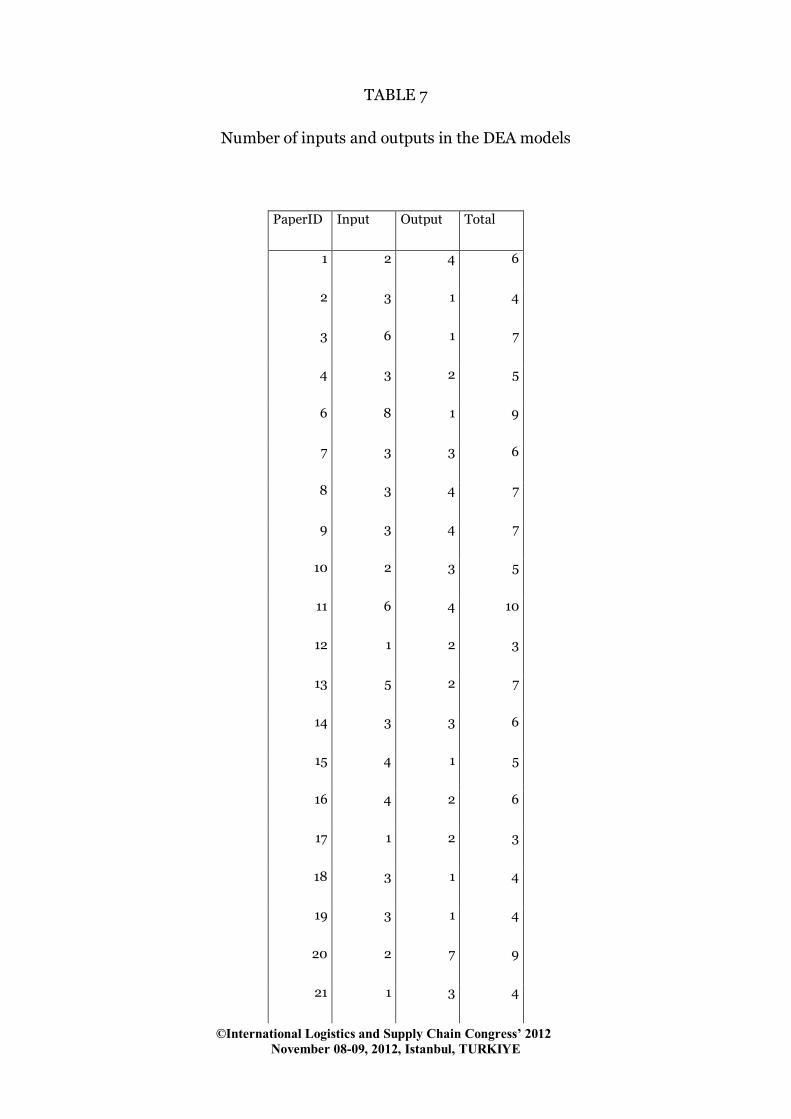
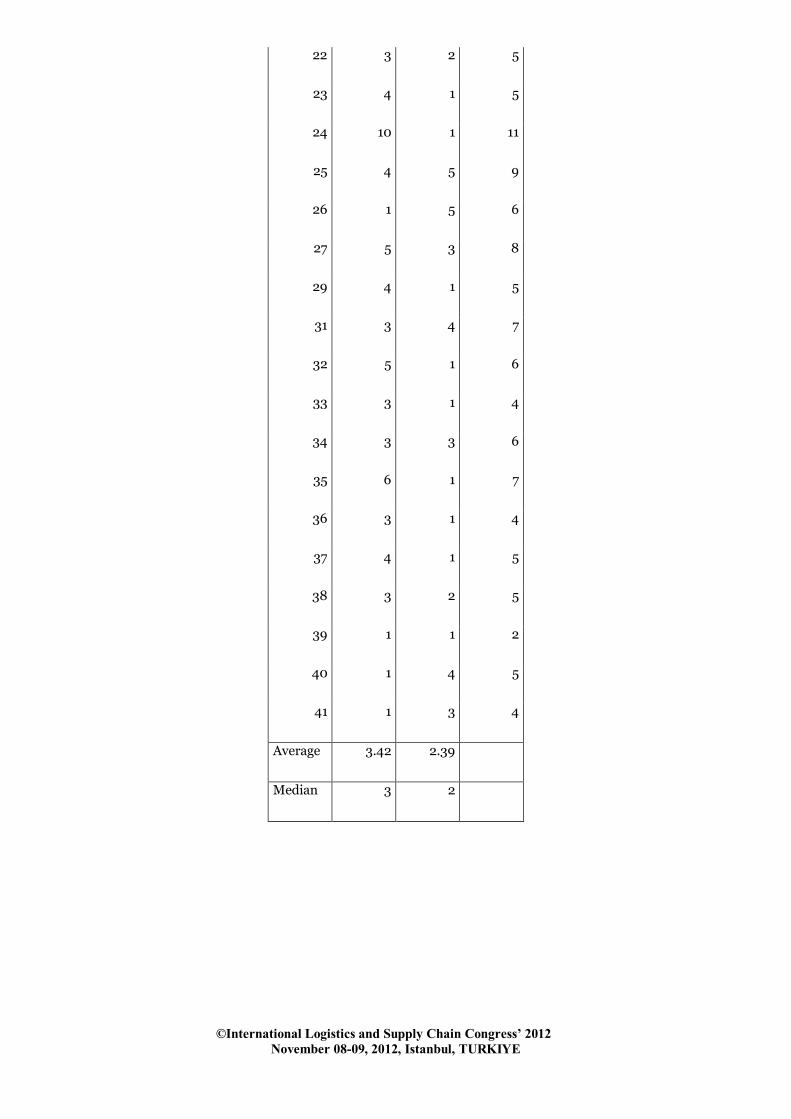
Table 7 shows the number of inputs and outputs in each of the DEA models. Table 7 provides
two very important numbers, namely, the average number of inputs and outputs in the 41 models.
The average number of inputs is 3.42 and the average number of outputs is 2.39. Furthermore, the
median number of inputs is 3, and the median number of outputs is 2. This, we believe, is a very
important guideline for practitioners. A very important shortcoming of DEA is that it rewards
extreme behavior. In other words, if a DMU has a very low value for even one of its inputs, or a
very high value for even one of its outputs, one can expect it to have a high efficiency score.
However, the DMU may be doing very poor with respect to its other inputs or outputs. When the
number of inputs or outputs is too many, the percentage of “efficient” DMUs with efficiency scores
of 1 increases. The average values of 3.42 and 2.39 and the median values of 3 and 2 for the
number of inputs and outputs give us a good idea of when to stop adding new inputs or outputs: A
“typical” model should not have more than 3 inputs and 2 outputs. The number of inputs and
outputs used in literature is a major guideline for practitioners. Due to our work, practitioners can
know clearly how many inputs and outputs are typically used and can judge better if they are using
too many or too few inputs and/or outputs. If there are more inputs than outputs, a practitioner
can start with a DEA model with three inputs and one output. If there are less inputs than outputs,
a practitioner can start with a DEA model with one input and three outputs.
©International Logistics and Supply Chain Congress’ 2012 November 08-09, 2012, Istanbul, TURKIYE
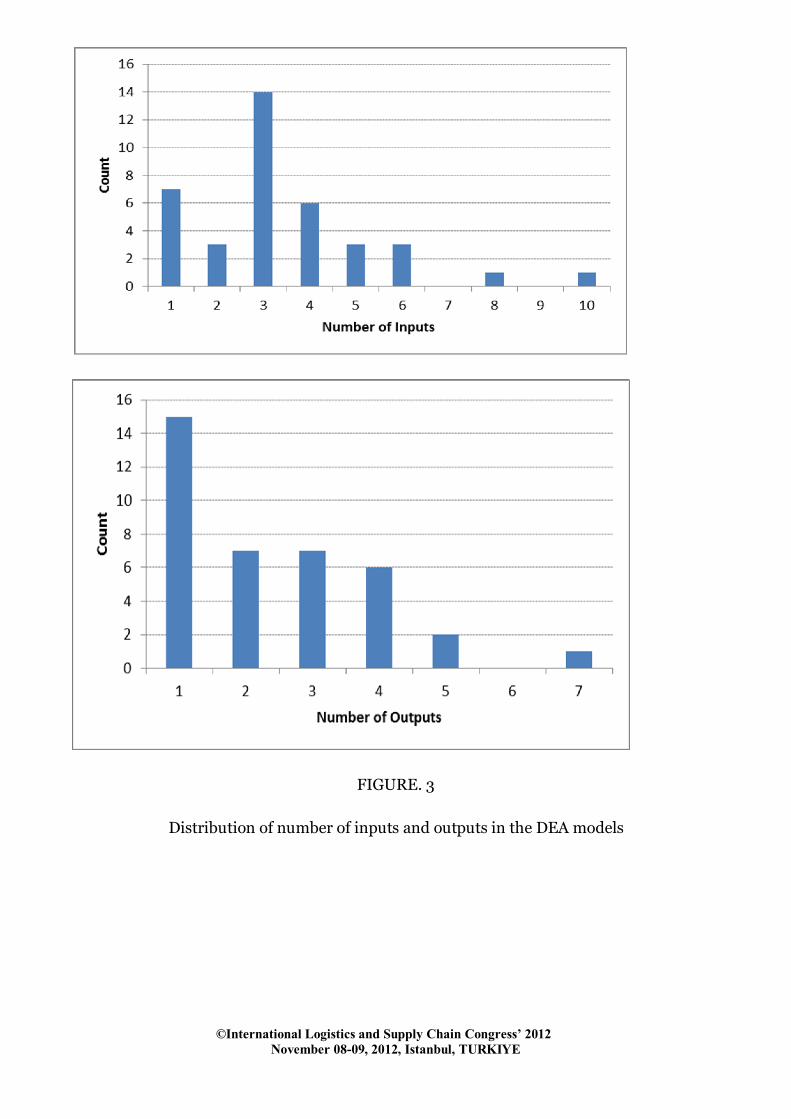
Figure 3 brings even more insights into the number of inputs and outputs to select: Figure 3
shows the distribution of number of inputs and outputs in the DEA models. The most frequent
selection for the number of inputs is 3. The most frequent selection for the number of outputs is 1.
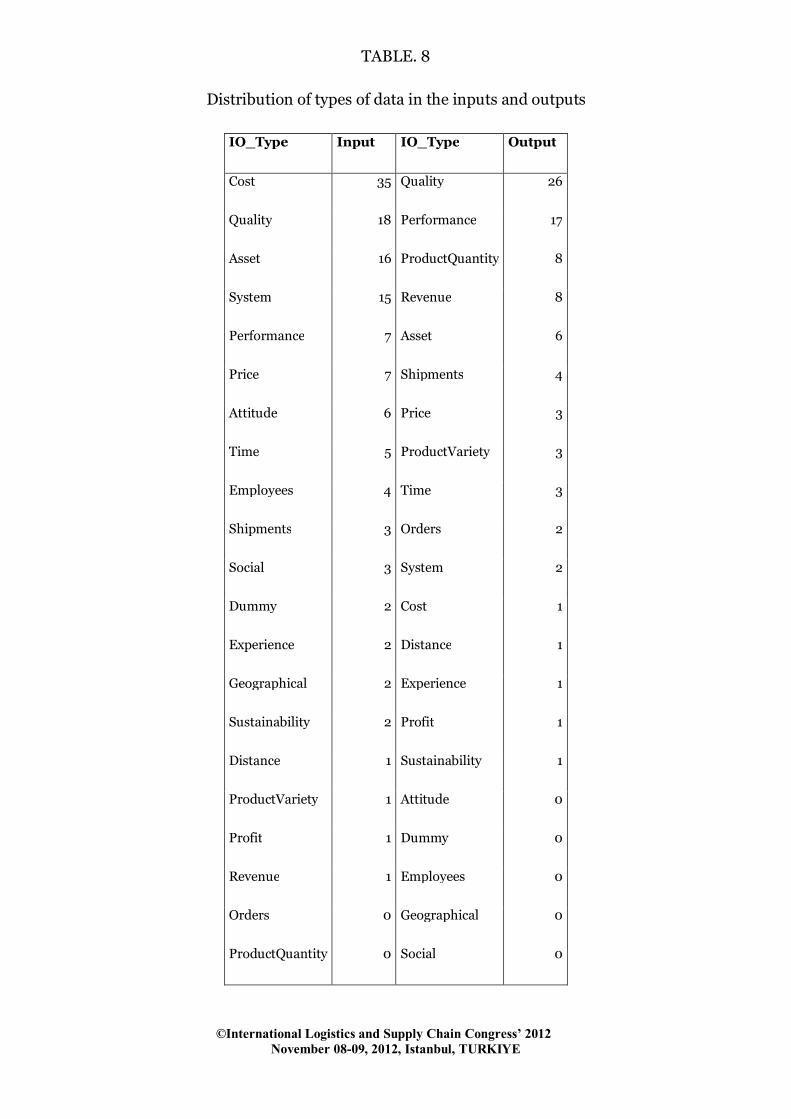
The final analysis performed was the analysis of the input and output types. Table 8 shows the
distribution of types of data in the inputs and outputs. Here, the inputs and outputs were
categorized into one of 21 categories. Table 8 suggests that cost-related inputs are the most
popular. Quality-related inputs and inputs that consider the infrastructure of the DMUs in terms
of assets and/or underlying physical/managerial systems are also popular. With respect to the
outputs, quality-related outputs (which were defined to include inputs related with delivery
performance and service performance) are the most popular. Performance related outputs are also
very popular. Other popular types of outputs are those that summarize the product quantity
flowing through the DMUs and the revenue generated by the DMUs.
Selecting the papers only after 2000 has the side benefit of telling us what the important issues
in SCM are: Benchmarking suppliers and the complete supply chains is an important focus in the
post-2000 SCM literature. Cost is the most important focus as input. Quality is the most important
focus as output, but is also popularly considered as an input. Thus, while quality is considered as
the most popular output in the post-2000 academic studies (a performance goal to be reached), it
is also considered as the second most input (as a given factor that affects the company
performance).
CONCLUSIONS
This paper presented a detailed review of the DEA models applied in journal papers in the
domain of SCM. The survey includes 41 papers published between 1992 and 2012, all but two
published after 2000. Firstly, for each analyzed paper, basic information regarding the DEA model
in the paper has been presented as a database table. Next, in a second and more detailed database
table, information on the inputs and outputs of each model have been presented. The data has also
been analyzed to obtain some critical insights on DEA modeling for the domain of SCM.
Our study provides, for the first time in literature, answers to several important questions that
practitioners face as uncertainties and challenges. The answers to the questions are provided in the
tables and figures of this paper. Furthermore, the complete database constructed for the paper is
made available online as a supplement spreadsheet (Ertek et al. 2012). We believe that the results
©International Logistics and Supply Chain Congress’ 2012 November 08-09, 2012, Istanbul, TURKIYE
presented in the paper, as well as the detailed data in the supplement will contribute to the
modeling projects of SCM practitioners at all managerial levels on the enterprise.
Supply chain practitioners in academia and industry now have a reference where they can look
up and learn the different types of DEA models that have been applied in the literature for SCM.
Starting with what they want to benchmark, namely, the DMU, they can observe the inputs and
outputs that have been selected in the studies that use that DMU. This can speed up the model
selection and construction, and also increase the reliability of the practitioners in their models,
since such models have been readily used in refereed journals.
FIGURE. 1
Distribution of number of DMUs in the DEA models
©International Logistics and Supply Chain Congress’ 2012 November 08-09, 2012, Istanbul, TURKIYE
FIGURE. 2
Number of DMUs used in the DEA models over the years of publication
©International Logistics and Supply Chain Congress’ 2012 November 08-09, 2012, Istanbul, TURKIYE
FIGURE. 3
Distribution of number of inputs and outputs in the DEA models
©International Logistics and Supply Chain Congress’ 2012 November 08-09, 2012, Istanbul, TURKIYE
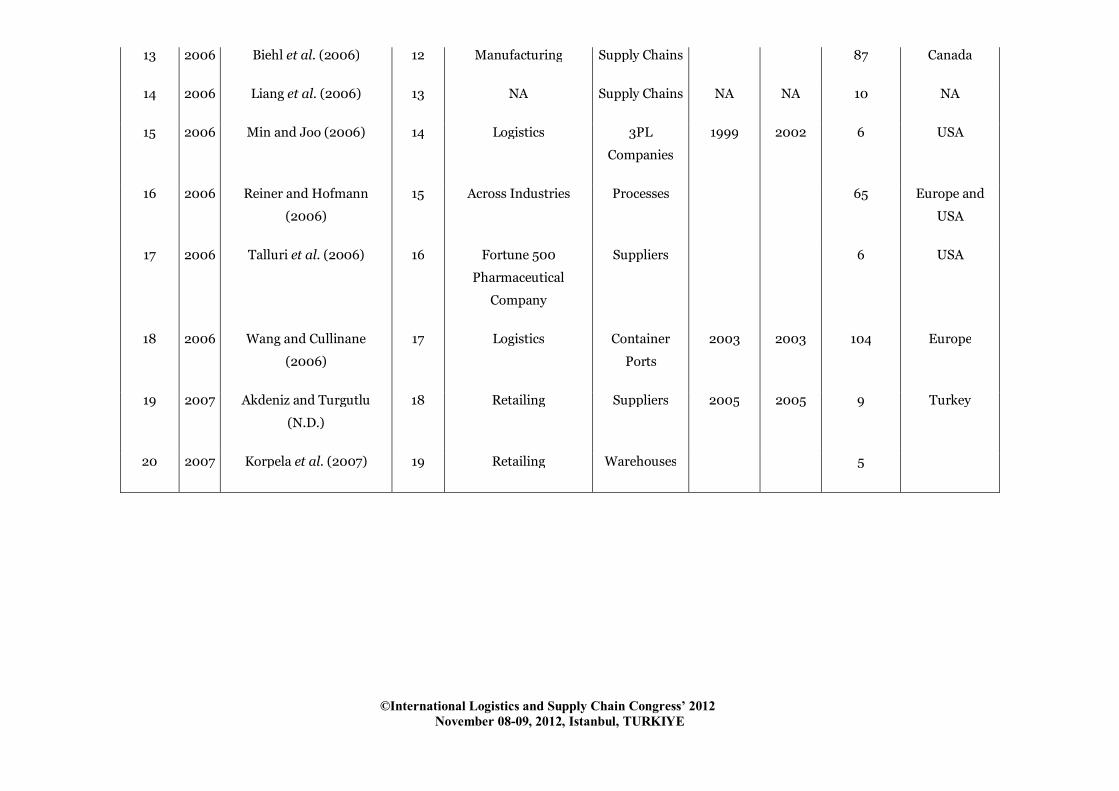
TABLE 1
Recent journal papers that implement DEA for benchmarking in SCM
PaperID Year Citation DataID Industry DMU DataBegin DataEnd NoOfDMUs Country1
1 1992 Kleinsorge et al. (1992) 1 Logistics 3PL Company 1988 1989 18
2 1996 Weber (1996) 2 Food Suppliers 1996 1996 6
3 2000 Braglia and Petroni (2000) 3 Machinery Suppliers 10
4 2000 Liu et al. (2000) 4 Machinery Suppliers 18
5 2000 Weber et al. (2000) 5 Manufacturing Suppliers
6 2001 Forker and Mendez (2001) 6 Electronics Suppliers 292 North America
7 2001 Hackman et al. (2001) 7 Logistics Warehouses 57 USA
8 2001 Narasimhan et al. (2001) 8 Telecommunications Suppliers 23
9 2002 Ross and Droge (2002) 9 Petroleum Warehouses 1993 1996 102
10 2002 Talluri and Sarkis (2010) 1 Logistics 3PL Company 1988 1989 18
11 2003 Haas et al. (2003) 10 Logistics Supply Chains 23 USA
12 2004 Ahn and Lee (2004) 11 TFT LCD
Manufacturing
Suppliers 7
©International Logistics and Supply Chain Congress’ 2012 November 08-09, 2012, Istanbul, TURKIYE
13 2006 Biehl et al. (2006) 12 Manufacturing Supply Chains 87 Canada
14 2006 Liang et al. (2006) 13 NA Supply Chains NA NA 10 NA
15 2006 Min and Joo (2006) 14 Logistics 3PL
Companies
1999 2002 6 USA
16 2006 Reiner and Hofmann
(2006)
15 Across Industries Processes 65 Europe and
USA
17 2006 Talluri et al. (2006) 16 Fortune 500
Pharmaceutical
Company
Suppliers 6 USA
18 2006 Wang and Cullinane
(2006)
17 Logistics Container
Ports
2003 2003 104 Europe
19 2007 Akdeniz and Turgutlu
(N.D.)
18 Retailing Suppliers 2005 2005 9 Turkey
20 2007 Korpela et al. (2007) 19 Retailing Warehouses 5
©International Logistics and Supply Chain Congress’ 2012 November 08-09, 2012, Istanbul, TURKIYE
TABLE 1 (continued)
Recent journal papers that implement DEA for benchmarking in SCM
PaperID Year Citation DataID Industry DMU DataBegin DataEnd NoOfDMUs Country1 Country2
21 2007 Ramanathan (2007) 20 NA Suppliers 3 NA NA
22 2007 Wong and Wong (2007) 21 Semiconductor Supply Chains 22 Malaysia Malaysia
23 2008 Çelebi and Bayraktar (2008) 22 Automotive Suppliers 17 Turkey
24 2008 Ha and Krishnan (2008) 23 Automotive Suppliers 27 USA
25 2008 Koster and Balk (2008) 24 Logistics Warehouses 2000 2004 39 Netherlands Netherlands
26 2008 Ng (2008) 25 Machinery Suppliers 18 Hong Kong
27 2008 Saen (2008) 1 Logistics 3PL Company 1988 1989 18 USA
28 2008 Wu and Olson (2008) 26 NA Suppliers 10 USA
29 2008 Zhou et al. (2008) 27 Logistics 3PL Companies 2000 2004 10 China China
30 2009 Ha et al. (2009) 23 Automotive Suppliers 27 Korea
31 2009 Min and Joo (2009) 28 Logistics 3PL Companies 2005 2007 12 USA USA
32 2009 Ozdemir and Temur (2009) 29 Metal Suppliers 24 German German
©International Logistics and Supply Chain Congress’ 2012 November 08-09, 2012, Istanbul, TURKIYE
33 2010 Azadeh and Alem (2010) 30 NA Suppliers 10 Iran
34 2010 Kang and Lee (2010) 31 Packaging Suppliers 9 Taiwan
35 2010 Kuo et al. (2010) 32 Electronics Suppliers 12 Taiwan Taiwan
36 2010 Saen (2010) 1 Logistics 3PL Company 1988 1989 18 USA
37 2010 Sharma and Yu (2010) 33 FMCG Processes 11 South Korea
38 2010 Tektas and Tosun (2010) 34 Food and Beverage Supply Chains 2007 2007 23 Turkey Turkey
39 2011 Jalalvand et al. (2011) 35 Broiler Supply Chains 7 Iran Iran
40 2011 Zeydan et al. (2011) 36 Automotive Suppliers 2007 2010 7 Turkey Turkey
41 2012 Akçay et al.(2012) 37 Automotive Vendors Turkey Turkey
©International Logistics and Supply Chain Congress’ 2012 November 08-09, 2012, Istanbul, TURKIYE
TABLE. 2
Distribution of number of models with respect to industry
Industry Count
Logistics 11
Automotive 4
NA 4
Machinery 3
Electronics 2
Manufacturing 2
Retailing 2
Across Industries 1
Broiler 1
FMCG 1
Food 1
Food and Beverage 1
Fortune 500
Pharmaceutical Company
1
Metal 1
Packaging 1
Petroleum 1
Semiconductor 1
Telecommunications 1
TFT LCD Manufacturing 1
©International Logistics and Supply Chain Congress’ 2012 November 08-09, 2012, Istanbul, TURKIYE
TABLE. 3
Distribution of number of models with respect to the DMU benchmarked
DMU Count
Suppliers 20
Supply Chains 6
3PL Company 4
Warehouses 4
3PL
Companies 3
Processes 2
Container
Ports 1
©International Logistics and Supply Chain Congress’ 2012 November 08-09, 2012, Istanbul, TURKIYE
TABLE 4
Inputs and outputs in the reviewed papers
PaperID IsInputOrOutput IO_Name IO_Type
2 Input price Price
2 Input quality Quality
2 Input delivery Quality
2 Output efficiency Performance
3 Input financial position Asset
3 Input experience Experience
3 Input geographical location Geographical
3 Input profitability Profit
3 Input quality Quality
3 Input delivery compliance Quality
3 Output - NA
4 Input the price index Price
4 Input delivery performance Quality
4 Input distance factor Geographical
4 Output the number of parts that a suppliers supplies ProductVariety
4 Output the quality of parts Quality
5 NA NA NA
6 Input role of quality department System
6 Input role of mangement and quality policy System
6 Input product/service design System
6 Input employee relations Social
©International Logistics and Supply Chain Congress’ 2012 November 08-09, 2012, Istanbul, TURKIYE
6 Input quality data and reporting System
6 Input training System
6 Input process management/operating procedures System
6 Input supplier quality management System
6 Output acceptable parts per million (APPM) Quality
7 Input labor Cost
7 Input space Asset
7 Input equipment Asset
7 Output movement Performance
7 Output storage Cost
7 Output accumulation Performance
8 Input quality management practices and systems System
8 Input documentation and self-audit System
8 Input process/manufacturing capability System
8 Output quality Quality
8 Output price Price
8 Output delivery Quality
8 Output cost reduction performance Performance
©International Logistics and Supply Chain Congress’ 2012 November 08-09, 2012, Istanbul, TURKIYE
TABLE 4 (continued)
Inputs and outputs in the reviewed papers
PaperID IsInputOrOutput IO_Name IO_Type
9 Input fleet size Asset
9 Input average experience Experience
9 Input mean order throughput time Time
9 Output product HH1 ProductQuantity
9 Output product SX2 ProductQuantity
9 Output product SD4 ProductQuantity
9 Output product HH4 ProductQuantity
11 Input annual cost of collecting and disposing of the solid waste stream Cost
11 Input annual recycling program administrative costs Cost
11 Input annual recycling program education and promotion costs Cost
11 Input annualized capital equipment costs Cost
11 Input annual cost of materials and supplies Cost
11 Input the size of the total solid waste stream Sustainability
11 Output quantity recycled Sustainability
11 Output percent of the solid waste stream recycled Performance
11 Output revenue from the sale of recyclables Revenue
11 Output recycling incentive payments Revenue
12 Input - NA
12 Output capacity Asset
12 Output price advantage Price
©International Logistics and Supply Chain Congress’ 2012 November 08-09, 2012, Istanbul, TURKIYE
13 Input cost efficiency Attitude
13 Input order entry procedures Attitude
13 Input delivery schedules Attitude
13 Input product/service design Attitude
13 Input quality monitoring/ improvement Attitude
13 Output the supplier's satisfaction with the performance of the relationship Performance
13 Output the buyer's satisfaction with the performance of the relationship Performance
14 Input labor Employees
14 Input operating cost Cost
14 Input shipping cost Cost
14 Output number of product A shipped Shipments
14 Output number of product A shipped Shipments
14 Output number of product C shipped Shipments
15 Input account receivables Asset
15 Input salaries and wages of employees Cost
15 Input operating expenses other than salaries and wages Cost
15 Input property and equipment Asset
15 Output the overall performance of 3PLs Quality
©International Logistics and Supply Chain Congress’ 2012 November 08-09, 2012, Istanbul, TURKIYE
TABLE 4 (continued)
Inputs and outputs in the reviewed papers
PaperID IsInputOrOutput IO_Name IO_Type
16 Input production costs Cost
16 Input inventory costs Cost
16 Input logistics costs Cost
16 Input number of warehousing facilities Asset
16 Output delivery performance to request date Quality
16 Output Revenue Revenue
17 Input Price Price
17 Output quality performance Quality
17 Output delivery performance Quality
18 Input terminal length Asset
18 Input terminal area Asset
18 Input equipment costs Asset
18 Output container throughput ProductQuantity
19 Input markup Cost
19 Input delivery Quality
19 Input selling history Revenue
19 Output purchased quantity ProductQuantity
20 Input direct costs Cost
20 Input indirect costs Cost
20 Output delivery time Time
©International Logistics and Supply Chain Congress’ 2012 November 08-09, 2012, Istanbul, TURKIYE
20 Output urgent deliveries Time
20 Output quality Quality
20 Output quantity ProductQuantity
20 Output special requests Quality
20 Output frequency Shipments
20 Output capacity Asset
21 Input total cost Cost
21 Output AHP weight for quality Quality
21 Output AHP weight for technology System
21 Output AHP weight for service Quality
22 Input internal manufacturing capacity Asset
22 Input cycle time Time
22 Input cost Cost
22 Output Revenue Revenue
22 Output on-time delivery rate Quality
©International Logistics and Supply Chain Congress’ 2012 November 08-09, 2012, Istanbul, TURKIYE
TABLE 4 (continued)
Inputs and outputs in the reviewed papers
PaperID IsInputOrOutput IO_Name IO_Type
23 Input Delivery Quality
23 Input Price Price
23 Input Quality Quality
23 Input Service Quality
23 Output overall performance value Performance
25 Input number of direct FTE's Employees
25 Input size of the warehouse in square meters Asset
25 Input degree of automation System
25 Input number of different SKUs ProductVariety
25 Output number of daily order lines picked ProductQuantity
25 Output
the level of value-added logistics activities carried out on a regular
basis Performance
25 Output
number of special processes carried out to optimize warehouse
performance Performance
25 Output the percentage of error-free orders shipped Quality
25 Output order flexibility Performance
26 Input unity (1) Dummy
26 Output supply variety ProductVariety
26 Output quality Quality
26 Output 1 / distance Distance
26 Output delivery Quality
©International Logistics and Supply Chain Congress’ 2012 November 08-09, 2012, Istanbul, TURKIYE
26 Output 1 / price index Price
29 Input net fixed assets including properties and equipment Asset
29 Input salaries and wages of employees Cost
29 Input operating expenses other than salaries and wages Cost
29 Input current liabilities Cost
29 Output the overall performance of 3PLs Performance
31 Input cost of sales Cost
31 Input selling, general and administrative costs (SG&A) Cost
31 Input depraciation and amortization Cost
31 Output revenue Revenue
31 Output C assets Asset
31 Output F assets Asset
31 Output O assets Asset
32 Input material quality Quality
32 Input discount on amount Cost
32 Input discount on cash Cost
32 Input payment term Time
32 Input delivery time Time
32 Output annual revenue Revenue
©International Logistics and Supply Chain Congress’ 2012 November 08-09, 2012, Istanbul, TURKIYE
TABLE 4 (continued)
Inputs and outputs in the reviewed papers
PaperID IsInputOrOutput IO_Name IO_Type
33 Input expected costs Cost
33 Input quality acceptance level Quality
33 Input on-time delivery distributions Performance
33 Output - NA
34 Input defect rate Quality
34 Input price Price
34 Input response-to-change time Time
34 Output on-time delivery rate Quality
34 Output process capability Performance
34 Output capacity Asset
35 Input quality Quality
35 Input cost Cost
35 Input delivery Quality
35 Input service Quality
35 Input environment Sustainability
35 Input corporate social responsibility Social
35 Output performance Performance
37 Input customer order cycle Performance
37 Input replenishment process cycle Performance
37 Input manufacturing cycle Performance
©International Logistics and Supply Chain Congress’ 2012 November 08-09, 2012, Istanbul, TURKIYE
37 Input procurement cycle Performance
37 Output performance Performance
38 Input supply chain cost Cost
38 Input total inventory Asset
38 Input full-time employee number Employees
38 Output profit Profit
38 Output export Revenue
39 Input total costs Cost
39 Output cash-to-cash cycle time Time
40 Input unitary inputs for all units (dummy input) Dummy
40 Output quality management system audit System
40 Output warranty cost ratio Quality
40 Output defect ratio Quality
40 Output quality management Quality
41 Input spare parts area Asset
41 Input total expenses Cost
41 Input spare parts employees Employees
41 Output total revenue Revenue
©International Logistics and Supply Chain Congress’ 2012 November 08-09, 2012, Istanbul, TURKIYE
TABLE 5
Inputs and outputs in the papers that use the same dataset as in PaperID=1
(Kleinsorge et al., 1992).
PaperID IsInputOrOutput IO_Name IO_Type
1 Input total cost Cost
1 Input number of shipments Shipments
1 Output number on time Quality
1 Output number of bills Orders
1 Output Experience Experience
1 Output Credence Performance
10 Input total cost per 100 shipments Cost
10 Input number of shipments Shipments
10 Output number of shipments arrive on time Quality
10 Output number of bills received from the suppliers without errors Orders
10 Output ratings for experience and credence Performance
27 Input total cost of shipment Cost
27 Input Price Price
27 Input number of shipments per month Shipments
27 Input Distance Distance
27 Input supplier reputation Performance
27 Output number of shipments to arrive on time Quality
27 Output number of bills received from the suppliers without errors Quality
27 Output number of parts that supplier supplies ProductVariety
36 Input total cost of shipments Cost
36 Input price Price
36 Input supplier reputation Performance
36 Output number of bills received from the suppliers without errors Quality
©International Logistics and Supply Chain Congress’ 2012 November 08-09, 2012, Istanbul, TURKIYE
TABLE 6
Inputs and outputs in the papers PaperID=24&30 (same dataset and model in both papers)
PaperID IsInputOrOutput IO_Name IO_Type
24 Input production facilities Asset
24 Input quality management intention Attitude
24 Input quality system outcome and claims Quality
24 Input response to claims Quality
24 Input on-time delivery Quality
24 Input organizational control System
24 Input business plans System
24 Input customer communication Social
24 Input internal audit System
24 Input data administration System
24 Output the factor quality system outcome Quality
30 *
©International Logistics and Supply Chain Congress’ 2012 November 08-09, 2012, Istanbul, TURKIYE
TABLE 7
Number of inputs and outputs in the DEA models
PaperID Input Output Total
1 2 4 6
2 3 1 4
3 6 1 7
4 3 2 5
6 8 1 9
7 3 3 6
8 3 4 7
9 3 4 7
10 2 3 5
11 6 4 10
12 1 2 3
13 5 2 7
14 3 3 6
15 4 1 5
16 4 2 6
17 1 2 3
18 3 1 4
19 3 1 4
20 2 7 9
21 1 3 4
©International Logistics and Supply Chain Congress’ 2012 November 08-09, 2012, Istanbul, TURKIYE
22 3 2 5
23 4 1 5
24 10 1 11
25 4 5 9
26 1 5 6
27 5 3 8
29 4 1 5
31 3 4 7
32 5 1 6
33 3 1 4
34 3 3 6
35 6 1 7
36 3 1 4
37 4 1 5
38 3 2 5
39 1 1 2
40 1 4 5
41 1 3 4
Average 3.42 2.39
Median 3 2
©International Logistics and Supply Chain Congress’ 2012 November 08-09, 2012, Istanbul, TURKIYE
TABLE. 8
Distribution of types of data in the inputs and outputs
IO_Type Input IO_Type Output
Cost 35 Quality 26
Quality 18 Performance 17
Asset 16 ProductQuantity 8
System 15 Revenue 8
Performance 7 Asset 6
Price 7 Shipments 4
Attitude 6 Price 3
Time 5 ProductVariety 3
Employees 4 Time 3
Shipments 3 Orders 2
Social 3 System 2
Dummy 2 Cost 1
Experience 2 Distance 1
Geographical 2 Experience 1
Sustainability 2 Profit 1
Distance 1 Sustainability 1
ProductVariety 1 Attitude 0
Profit 1 Dummy 0
Revenue 1 Employees 0
Orders 0 Geographical 0
ProductQuantity 0 Social 0
©International Logistics and Supply Chain Congress’ 2012 November 08-09, 2012, Istanbul, TURKIYE
ACKNOWLEDGMENT
The authors thank Gulcin Buyukozkan at Galatasaray University and Alp Eren Akçay at Carnegie
Mellon University for their literature review on the topic, which was published in earlier paper
(Akçay et al., 2012) with the first author, which provided us with some of the references in the
study.
REFERENCES
[1] Ahn, H.J., Lee, H., 2004, "An agent-based dynamic information network for supply chain management",
BT Technology Journal, vol.22, no.2, p.18-27.
[2] Akçay, A.E., Ertek, G., Büyüközkan, G., 2012, "Analyzing the solutions of DEA through information
visualization and data mining techniques: SmartDEA framework", Expert Systems with Applications,
vol.39, p.7763–7775.
[3] Akdeniz, A. H., Turgutlu, T.N.D., 2007, "Supplier Selection on Retail: Analysis with Two Multi-Criteria
Evaluation Methodologies" Review of Social, Economic & Business Studies, Vol.9/10, p.11-28
[4] Azadeh, A., Alem, S. M., 2010, "A flexible deterministic, stochastic and fuzzy Data Envelopment Analysis
approach for supply chain risk and vendor selection problem: Simulation analysis", Expert Systems with
Applications, vol.37, no.12, p.7438-7448.
[5] Biehl, M., Cook, W., Johnston, D.A., 2006, The efficiency of joint decision making in buyer-supplier
relationships. Annals of Operations Research, vol.145, no.1, p.15-34.
[6] Braglia, M., Petroni, A., 2000, "A quality assurance-oriented methodology for handling trade-offs in
supplier selection", International Journal of Physical Distribution & Logistics Management, vol.30, no.2,
p.96-112.
[7] Çelebi, D., Bayraktar, D., 2008, "An integrated neural network and data envelopment analysis for
supplier evaluation under incomplete information", Expert Systems with Applications, vol.35, no.4, p.1698-
1710.
[8] Cooper, W. W., Seiford, L. M., Tone, K., 2006, “Introduction to data envelopment analysis and its uses:
With DEA solver software and references”, Springer.
[9] Daniel, F., 2010, "Head of Walmart tells WFU audience of plans for growth over next 20 years".
Winston-Salem Journal.Available under http://www2.journalnow.com/news/2010/sep/29/head-of-wal-
©International Logistics and Supply Chain Congress’ 2012 November 08-09, 2012, Istanbul, TURKIYE
mart-tells-wfu-audience-of-plans-for-g-ar-425152/. Short link: http://tinyurl.com/6aldxvd. Last accessed
on July 28, 2012.
[10] Datamonitor, 2011, “Global: Logistics Industry Guide”, Datamonitor, March 2011.
http://tinyurl.com/5wcosyo
[11] Emrouznejad, A., Parker, B., Tavares, G., 2008, “Evaluation of research in efficiency and productivity:
A survey and analysis of the first 30 years of scholarly literature in DEA”, Journal of Socio-Economic
Planning Sciences, vol.42, no.3, p.151–157.
[12] Ertek, G., 2011, “Crossdocking insights from a 3rd party logistics firm in Turkey.” In: Haksöz, Çağrı and
Seshadri, Sridhar and Iyer, Ananth, (eds.) Managing Supply Chains on the Silk Road: Strategy,
Performance and Risk. Taylor & Francis LLC, United Kingdom.
[13] Ertek, G., 2012, “Supplement Document for: ‘DEA-based benchmarking models in supply chain
management: an application-oriented literature review’”. Available under
http://people.sabanciuniv.edu/ertekg/papers/supp/10.xls. Short link: http://bit.ly/OmWMCO. Also
available under http://research.sabanciuniv.edu.
[14] Forbes, 2011, “The Global 2000”, Available under http://www.forbes.com/lists/2010/18/global-2000-
10_The-Global-2000_Sales.html. Short link: http://tinyurl.com/2b4wlxj. Last accessed on July 28, 2012.
[15] Forker, L.B., Mendez, D., 2001, "An analytical method for benchmarking best peer suppliers"
International Journal of Operations & Production Management, vol.21, no.1/2, p.195-209.
[16] Gattoufi, S., Oral, M., Kumar, A., Reisman, A., 2004a, “Content analysis of data envelopment analysis
literature and its comparison with that of other OR/MS fields”, Journal of the Operational Research
Society, vol. 55, p. 911-935.
[17] Gattoufi, S., Oral, M., Reisman, A., 2004b, “A taxonomy for data envelopment analysis”, Socio
Economic Planning Sciences, vol.34, no.2, p.141-158.
[18] Ha, S.H., Krishnan, R., 2008, "A hybrid approach to supplier selection for the maintenance of a
competitive supply chain", Expert Systems with Applications, vol.34, no.2, p.1303-1311.
[19] Ha, S.H., Kwon, E.K., Jin, J.S., Park, H.S., 2009, "Single and Multiple Sourcing in the Auto-
Manufacturing Industry", World Academy of Science, Engineering and Technology,Vol.56, p55-60.
[20] Haas, D., Murphy F., Lancioni R., 2003, "Managing Reverse Logistics Channels with Data
Envelopment Analysis", Transportation Journal, vol. 42, no. 3, p. 59-69.
[21] Hackman, S., Frazelle E., Griffin P., Griffin S.,Vlasta D., 2001, "Benchmarking Warehousing and
Distribution Operations: An Input-Output Approach", Journal of Productivity Analysis, vol.16, p.79-100.
©International Logistics and Supply Chain Congress’ 2012 November 08-09, 2012, Istanbul, TURKIYE
[22] Ho, W., Xu, X., Dey, P.K., 2010, “Multi-criteria decision making approaches for supplier evaluation
and selection: A literature review”, European Journal of Operational Research, vol.202, p.16–24.
[23] Jalalvand, F., Teimoury, E., Makui, A., Aryanezhad, M.B., Jolai, F., 2011, "A method to compare supply
chains of an industry", Supply Chain Management: An International Journal, Vol. 16 2), p.82 - 97.
[24] Kang, H., Lee, A. H. I., 2010, "A new supplier performance evaluation model. Kybernetes", vol. 39.,
no.1, p.37-54.
[25] Kim, W., Choi, B.J., Hong, E.K., Kim, S.K., Lee, D., 2003, “A taxonomy of dirty data”, Data Mining and
Knowledge Discovery”, vol.7, no.1, p.81–99.
[26] Kleinsorge, I. K., Schary, P. B., Tanner, R. D, 1992, "Data Envelopment Analysis for Monitoring
Customer-Supplier Relationships", Journal of Accounting and Public Policy, vol.11, p.357-372.
[27] Korpela, J., Lehmusvaara, A., Nisonen, J., 2007, "Warehouse operator selection by combining AHP
and DEA methodologies", Production Economics, vol.108, pp.135-142.
[28] Koster, M. B. M., Balk, B. M., 2008, "Benchmarking and Monitoring International Warehouse
Operations in Europe. Production and Operations Management Society", vol.17, no.2,p.175-183.
[29] Kuo, R. J., Wang, Y. C., Tien, F. C., 2010, "Integration of artificial neural network and MADA methods
for green supplier selection", Journal of Cleaner Production, vol.18, no.12, p.1161-1170.
[30] Liang, L., Yang, F., Cook, W.D., Zhu, J., 2006, "DEA models for supply chain efficiency evaluation",
Annals of Operations Research, vol.145, no.1, p.35-49.
[31] Liu, J., Ding, F.Y., Lall, V., 2000, "Using data envelopment analysis to compare suppliers for supplier
selection and performance improvement", Supply Chain Management: An International Journal, vol.5,
no.3, pp.143-150.
[32] Mentzer, J.T., DeWitt, W., Keebler, J.S., Min, S., Nix, N.W., Smith, C.D., 2001, “Defining supply chain
management”, Journal Of Business Logistics, Vol.22, No. 2, p.1-25.
[33] Min, H. Joo, S.J., 2006, "Benchmarking the operational efficiency of third party logistics providers
using data envelopment analysis",Supply Chain Management: An International Journal, vol.11, no.3, p.259-
265.
[34] Min, H., Joo, S., 2009, "Benchmarking third-party logistics providers using data envelopment analysis:
an update", Benchmarking: An International Journal, vol.16, no.5, p.572-587
[35] Narasimhan, R., Talluri, S., Mendez, D., 2001, "Supplier evaluation and rationalization via data
envelopment analysis: an empirical examination", Journal of Supply Chain Management, vol.37, no.3, p.28-
37.
©International Logistics and Supply Chain Congress’ 2012 November 08-09, 2012, Istanbul, TURKIYE
[36] Ng, W.L., 2008, "An efficient and simple model for multiple criteria supplier selection problem",
European Journal of Operational Research, vol.186, no.3, p.1059-1067.
[37] Ozdemir, D., Temur, G.T., 2009, "DEA ANN approach in supplier evaluation system", World Academy
of Science, Engineering and Technology, vol.54,p343-348.
[38] Reiner, G., Hofmann, P., 2006, "Efficiency analysis of supply chain processes", International journal of
production research, vol.44, no.23, p.5065-5088.
[39] Ross, A., Droge, C., 2002, "An integrated benchmarking approach to distribution center performance
using DEA modeling", Journal of Operations Management, vol.20, no.1, p.19-32.
[40] Saen, R.F., 2008, "Supplier selection by the new AR-IDEA model", The International Journal of
Advanced Manufacturing Technology, vol.39, no.11, p.1061-1070.
[41] Saen, F., 2010, "The Use of AR-IDEA Approach for Supplier Selection Problems", Australian Journal of
Basic and Applied Sciences, vol.4, p.3053-3067
[42] Sharma, M.J., Yu, S.J., 2010, "Measuring Supply Chain Efficiency and Congestion", Engineering
Letters, vol.18, pp.384-390
[43] Talluri, S., Narasimhan, R., Nair, A., 2006, "Vendor performance with supply risk: a chance-
constrained DEA approach", International Journal of Production Economics, vol.100, no.2, p.212-222.
[44] Talluri, S., Sarkis J., 2002, "A model for performance monitoring of suppliers. International Journal
of Production Research", vol.40:16, p. 4257-4269.
[45] Tektas, A., Tosun E.O., 2010, "Performance Benchmarking in Turkish Food and Beverage Industry",
International Business Information Management Association, vol.2010.
[46] Wang, T.F., Cullinane, K., 2006, "The efficiency of European container terminals and implications for
supply chain management", Maritime Economics & Logistics, vol.8, no.1, p.82-99.
[47] Weber, C.A., 1996, "A data envelopment analysis approach to measuring vendor performance", Supply
Chain Management: An International Journal, vol.1, no.1, p.28-39.
[48] Weber, C.A., Current, J.,Desai, A., 2000, "An optimization approach to determining the number of
vendors to employ", Supply Chain Management: An International Journal, vol.5, no.2, p.90-98.
[49] Wong, W.P., Wong, K.Y., 2007, "Supply chain performance measurement system using DEA
modeling", Industrial Management and Data Systems, vol.107, no.3, p.361-381.
[50] Wu, D., Olson, D.L., 2008, "Supply chain risk, simulation, and vendor selection", International journal
of production economics, vol.114, no.2, p.646-655.
©International Logistics and Supply Chain Congress’ 2012 November 08-09, 2012, Istanbul, TURKIYE
[51] Wu, J.Z., Chien, C.F., 2008, "Modeling strategic semiconductor assembly outsourcing decisions based
on empirical settings", OR Spectrum, vol.30, no.3, p.401-430.
[52] Zeydan, M., Çolpan, C., Çobanoglu, C., 2011, "A combined methodology for supplier selection and
performance evaluation", Expert Systems with Applications, vol. 38, pp.2741-2751.
[53] Zhou, G., Min, H., Xu, C., Cao, Z., 2008, "Evaluating the comparative efficiency of Chinese third-party
logistics providers using data envelopment analysis", International Journal of physical distribution &
logistics management, vol.38, no.4, p.262-279.