
International Journal of Water Resources and Environmental Engineering Application of System...
10
Vol. 6(6), pp. 183-192, June, 2014 DOI: 10.5897/IJWREE2013.0479 Article Number: FA9E01545477 ISSN 2141-6613 Copyright © 2014 Author(s) retain the copyright of this article http://www.academicjournals.org/IJWREE International Journal of Water Resources and Environmental Engineering Full Length Research Paper Application of System Dynamics model in the determination of the unit cost of production of drinking water Adelere Ezekiel Adeniran Department of Civil and Environmental Engineering and Director of Works and Physical Planning, University of Lagos, Nigeria. Received 30 December, 2013; Accepted 9 June, 2014 Establishment of tariff structures and economic pricing regimes are contemporary issues in the water supply sector. The need to determine the economic price for water production has taken the centre stage in the face of dwindling world water resources. This paper reports the development of a System Dynamics (SD) model for the determination of the unit cost of domestic water production schemes in a developing economy. The dynamics and interconnectivities of the production factors of water production are considered. The model was applied to the University of Ibadan, Nigeria domestic water supply scheme for which extensive and historical data are available. The capability of SD Vensim software was used to examine some critical scenarios. The unit cost of production obtained using field data compares well with unit costs already established for some countries. The results of the scenarios investigation, confirm the model developed, can handle the various dynamics of water supply production and thus assist water utilities to determine appropriate tariffs to be charged on their consumers. Also, the unit rate of N107/m 3 compare very well with the Lagos state water tariff of N100/m 3 . Key words: domestic water supply, production factors, unit cost, scenario investigations. INTRODUCTION Until recently, municipal water supply was maintained with few difficulties for the consumers and at relatively low cost. That happy state is changing rapidly. The industry’s management for efficient service delivery, its relationship with the environment and its costs are coming under increasing pressure. At an International Symposium held between 8-10 June, 1999 at Kobe, Japan on “Effective Water Use in Urban Areas”, all practitioners in the water industry the world over were called upon to “find urgent solutions to the multi-faceted problems of water planning and management” (UNEP- IETC, 1999). This declaration underscores the need for research works to contribute to finding solutions to the problem of water management and planning. Why should the ‘water model’ not be ‘the brain’ or the ‘oracle’ of the water supply system; a template against which the real system could be constantly monitored for effective control of operations and for strategic planning? These requirements Email: [email protected], [email protected]. Author(s) agree that this article remain permanently open access under the terms of the Creative Commons Attribution License 4.0 International License .
-
Upload
babcockuni -
Category
Documents
-
view
1 -
download
0
Transcript of International Journal of Water Resources and Environmental Engineering Application of System...

Vol. 6(6), pp. 183-192, June, 2014
DOI: 10.5897/IJWREE2013.0479
Article Number: FA9E01545477
ISSN 2141-6613
Copyright © 2014
Author(s) retain the copyright of this article
http://www.academicjournals.org/IJWREE
International Journal of Water Resources and Environmental Engineering
Full Length Research Paper
Application of System Dynamics model in the determination of the unit cost of production of drinking
water
Adelere Ezekiel Adeniran
Department of Civil and Environmental Engineering and Director of Works and Physical Planning, University of Lagos, Nigeria.
Received 30 December, 2013; Accepted 9 June, 2014
Establishment of tariff structures and economic pricing regimes are contemporary issues in the water supply sector. The need to determine the economic price for water production has taken the centre stage in the face of dwindling world water resources. This paper reports the development of a System Dynamics (SD) model for the determination of the unit cost of domestic water production schemes in a developing economy. The dynamics and interconnectivities of the production factors of water production are considered. The model was applied to the University of Ibadan, Nigeria domestic water supply scheme for which extensive and historical data are available. The capability of SD Vensim software was used to examine some critical scenarios. The unit cost of production obtained using field data compares well with unit costs already established for some countries. The results of the scenarios investigation, confirm the model developed, can handle the various dynamics of water supply production and thus assist water utilities to determine appropriate tariffs to be charged on their consumers. Also, the unit rate of N107/m
3 compare very well with the Lagos state
water tariff of N100/m3.
Key words: domestic water supply, production factors, unit cost, scenario investigations.
INTRODUCTION Until recently, municipal water supply was maintained with few difficulties for the consumers and at relatively low cost. That happy state is changing rapidly. The industry’s management for efficient service delivery, its relationship with the environment and its costs are coming under increasing pressure. At an International Symposium held between 8-10 June, 1999 at Kobe, Japan on “Effective Water Use in Urban Areas”, all practitioners in the water industry the world over were
called upon to “find urgent solutions to the multi-faceted problems of water planning and management” (UNEP-IETC, 1999). This declaration underscores the need for research works to contribute to finding solutions to the problem of water management and planning. Why should the ‘water model’ not be ‘the brain’ or the ‘oracle’ of the water supply system; a template against which the real system could be constantly monitored for effective control of operations and for strategic planning? These requirements
Email: [email protected], [email protected].
Author(s) agree that this article remain permanently open access under the terms of the Creative Commons
Attribution License 4.0 International License.

184 Int. J. Water Res. Environ. Eng. have made the application of mathematical modelling techniques, in general, and System Dynamics modelling, in particular, very vital to the water industry (Adeniran, 2007).
There is no doubt that water is the most important resource in the world. Until recently, water supply management has been taken for granted. In most countries, water is regarded as social good rather than economic good. As water becomes scarcer and its quality continues to deteriorate, policy makers have been compelled to explore new approaches to improve the management of water resources. Water pricing reforms are among various measures designed to encourage the efficient use of water resources (Danar, 2000).
In 1990, the World Bank reported that the depletion of freshwater resources for domestic, industrial and agricultural purposes is likely to become the single most important environmental issues facing the Mediterranean countries and, in particular, their coastal areas. Even countries not yet facing water crises are likely to experience large increases in the cost of providing water to meet growing demand. Improving the planning, management and conservation of water will be critical for economic development. Failure to protect freshwater resources will render existing water-based patterns of development unsustainable in a number of countries by significantly increasing the cost of water over time (World Bank/EIB, 1990).
Winpenny (1994) argued that, in the water supply industry, there have been institutional, policy and market failures on a universal scale. He highlighted three underlying causes of the problem: (1) the fact that water is underpriced compared to its real cost of provision, (2) the fact that water is often a public good which makes it difficult to extract an economic price from users, and (3) the existence of environmental ‘externalities’ in the use of water which are not reflected in its price.
In 2004, the Norwegian Agency for Development Co-operation published the Water Supply Authority Tariff Determination Guidelines Edition 6. In the guidelines, the unit cost determination was based on operating costs, depreciation cost, profit and interest. From the foregoing, there is the need for evolving a tool that can capture the complexity of water production and variables in order to facilitate appropriate pricing and the establishment of reasonable tariff structures. The principles of SD are well suited for handling the dynamics of water resources and environmental problems. Yang et al. (2008) applied the principles of System Dynamics (SD) to carry out the impact analysis of (1) the severity of the water shortage and (2) total financial cost in central Taiwan. Adeniran (2007), Adeniran and Bamiro (2010) reported the development of a SD model for the strategic planning of a water supply system. In order to sustain the continuous availability of drinking water to a community, the need to
price water appropriately and recover some, if not all, of the
cost of production an investments for future develop-ments has become urgent.
The objective of this paper is to develop a model to determine the unit cost of water production using the System Dynamics method. The capabilities of Vensim Software were explored in achieving the objective. The developed model takes input from Excel Data sheet and it is therefore easy for the model inputs to be varied as economic and environmental factors may demand.
MATERIALS AND METHOD
Study Area
Ibadan is located in southwestern Nigeria in the southeastern part of Oyo State. The city's total area is 1,190 sq mi (3,080 km
2). The
mean total rainfall for Ibadan is 1420.06 mm, falling in approximately 109 days. There are two peaks for rainfall, June and September. The mean maximum temperature is 26.46 °C, minimum 21.42 °C and the relative humidity is 74.55%. The University of
Ibadan is the oldest and one of the most prestigious Nigerian universities and is located 5 miles (8 km) from the centre of the major city of Ibadan, Figure 1.
The Water Supply System and the University of Ibadan Water Scheme
“In order to undertake the modelling of any system, all the
processes that work together to constitute the system must be well understood” Forrester (2000). The processes involved in the production and supply of water in order to (1) make it suitable for human consumption and (2) make it available at the various end users; include a complex of physical, chemical, biological and mechanical methods (Twort et al., 1994). Water processing involves not only purification and removal of various unwanted and harmful impurities, but also transportation with the aid of prime movers through conduits as well as storage in specially designed pressure
vessels and tanks. The methods adopted in processing water include:
(a) Those aimed at improving organoleptic properties of water (clarification, decoloration, and deodorization), (b) Those which ensure epidemiological safety (chlorination, ozonization, Ultraviolet, and irradiation) and (c) Those by which the mineral composition of water is conditioned (fluorination and defluorination, deionization, demagnetization, softening, and
desalination). A particular method of water processing is chosen upon
preliminary examination of the composition and properties of the water source to be used and comparison of these data with the standard specification expected of the final processed water. A Section through the University of Ibadan water production and supply system is as shown in Figure 2.
System Dynamics Modeling
System dynamics models are causal mathematical models (Barlas, 1996). In system dynamics modelling (SDM) the underlying premise is that the structure of a system gives rise to its observable and thus predictable behaviour (Forrester, 1968; 1987). The first step in any system dynamics modelling project is to determine the system structure consisting of positive and negative relationships between variables, feedback loops, system archetypes, and delays
(Sterman, 2000; Wolstenholme, 2004). This understanding of system structure requires a focus on the system as a whole. Holistic

Adeniran 185
58
56
55
5962 63
AWBA DAM
12
14
16
538
10
87
3
13
11
34
6
8
10
12
15 17
8 6 4 2
2468
578 8 8 8
23
3
1
1
8
4
46
8
5
7
C
8
GC VC
36
3454
39
40
53 42
2
3
LISABI CRESCENT
3
5
5 7
9
11
2
8
4 6
2
CB
2A
37
33
2635
34
32
31
25
10
24
70
70
27
28
80
8
16
20
21
76
19
BS
BS
BS
18
22
26
9
815
300
5
8
3
6
7
2
10
12
11
13
1429
28
27
43
44
4546
47
4950
5745
49
2
1
75 3
11
3
20 18 16 14
16
20 20
15 13
1A
9 8
1
31V
6
KW
AR
A S
TR
EE
T
1
TO
TH
E P
OL
YT
EC
HN
IC
IBA
DA
N
12 10 8 6
1412
10
13
86 F4
5 4 3 89 7 5
1820
1715
2213
21
132224
2830
23
1211
4 2
8
22
9
6
10
1
2
6
4
3
4
2
22CD
7
A B
A D
I N A
WA
DIE
MA
RT
IN R
OA
D
IMO
ST
RE
ET
PROPOSED STADIUM
60 6164
6561
6667
69
73
74
23
24
71
72
2224
26
20
10
AB
F7
10
13
14
4
6
55
24
6
31
8
2728
297
20
18
1619
21
23
17
22
3
2
6
8
9
72
4
58
12
15
46
8
79
5 3
2
3 3
65
4
3
7
98
6
6
2 1
IBADAN UNIVERSITY PRESS
NORTH ENT
AGRICULTURE
PHYSIOLOGY ANATOMYPRI-CLINICAL
PLANTATION
BIOCHEMISTRY PHARMACOLOGY
Growther Line
Awolowo
Hall
Idia Hall
International Sch
Existin
g
R
oad
Independence
Hall
PhysicsDepartment
Site
Azikwe Hall
Earth Road
Hall Flats F4
F8 F2
F3
F1
Faculty
of
Technology
Plateau
P
late
au
Lin
e
Math &
Statistics Archaeology
Corton
Road
P
eppl
e
Roa
d
Eyo R
oad
Ijoma RoadIjoma Place
Afr
ica
Lod
ge
Athletics
EdldgMates
Computer
Centre
Chem
istry
Physic
s
Child Health
Benue Road
Saunders Road
B
atut
a R
d
K
urun
mi
Roa
d
A
bdul
lahi
Clo
seEllot Close
Gbelede
Stream
Parry Road
F1
F13
Tractor Road
Farm
Sewage Plant
Farm R
oad Abadina College
Forestry
Nursing
Cem
etry
Protestant
Chapel
Mosque
Chapel R
oad
ConfernceCentre
Guest
Flats
Shop
Senior Staff
Club
Library
Midwifery
Abadina
Atiba Road
Oluyole Road
Senior Staff
School
Am
ina Way
F1
F2
F5
F4
F8
CB
F6 Post
Office
MAIN ENTRANCE
PostGraduate Hall Obo
ng
Roa
d
Arts TedderHall
IBADANTO
LAGOS
AGODI UCH
Queen Elizabelth
Hall
Danfodio Road
VertinaryParamology
Scie
nce
Farm
Cross Poultry
Botanical Garden
MAP OF UNIVERSITY OF IBADAN SHOWING WATER FACILITIES
MAJOR ROAD
PIPE 75mm
PIPE 100mm
PIPE 150mm
PIPE 200mm
AWBA DAM
WATER STATION
LEGEND
Scale 1:1000
KURUMI
DISTRIBUTION STATION
AWBA RAW WATER
PUMPING STATION
U.I WATER
TREATMENT PLANT
LANDER
PUMPING STATION
U.I
WA
TE
RT
RE
AT
ME
NT
PL
AN
T
Figure 1. Map showing water supply facilities of the university of ibadan.
PRODUCTION
SUB-SYSTEM
RAW-WATER
SUB-SYSTEMDISTRIBUTION
SUB-SYSTEM
Neutralizer
Disinfectant
Coagulant
Raw-WaterSources
Raw-WaterPump
Dislodge Water
Chemical Solutions
Clarifier/SedimentationRapid Filters
ClarifiedWaterPump
Final Water
Tank
AluminiumPump
Chlorine and
Lime Pumps
Water
Distribution
High
Lift Pumps
Figure 2. Section through the University of Ibadan Water Supply System.
system understanding is a necessary condition for effective learning and management of complex systems as well as consensus building. These are important goals in their own right. Additionally, systems modelling and simulation supports policy analysis and evaluation (Morecroft, 1992). System dynamics allows simple ideas
to be combined into models of complex systems and processes; it makes the integration of modeling and experimentation a simple matter (Adeniran, 2013). In particular, SDM involves: (1) Defining problems dynamically, in terms of graphs over time;
186 Int. J. Water Res. Environ. Eng.
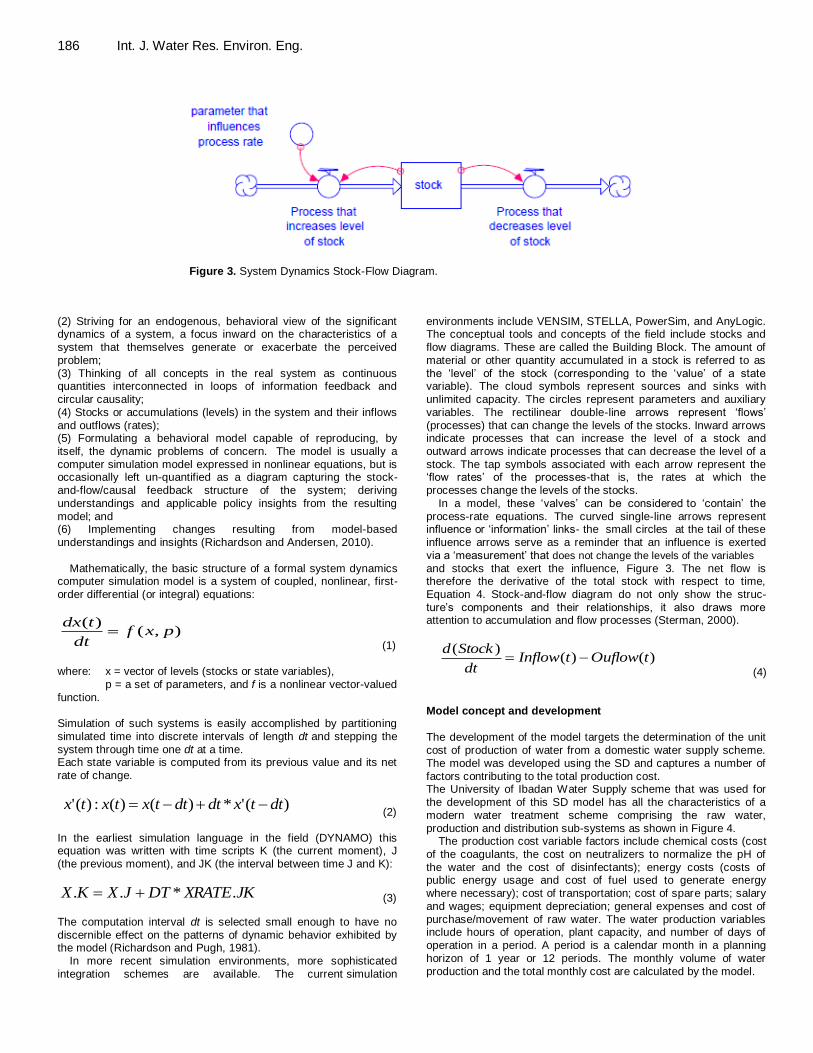
Figure 3. System Dynamics Stock-Flow Diagram.
(2) Striving for an endogenous, behavioral view of the significant dynamics of a system, a focus inward on the characteristics of a system that themselves generate or exacerbate the perceived problem; (3) Thinking of all concepts in the real system as continuous quantities interconnected in loops of information feedback and circular causality; (4) Stocks or accumulations (levels) in the system and their inflows and outflows (rates); (5) Formulating a behavioral model capable of reproducing, by itself, the dynamic problems of concern. The model is usually a computer simulation model expressed in nonlinear equations, but is occasionally left un-quantified as a diagram capturing the stock-and-flow/causal feedback structure of the system; deriving
understandings and applicable policy insights from the resulting model; and (6) Implementing changes resulting from model-based understandings and insights (Richardson and Andersen, 2010).
Mathematically, the basic structure of a formal system dynamics
computer simulation model is a system of coupled, nonlinear, first-order differential (or integral) equations:
),(
)(pxf
dt
tdx
(1) where: x = vector of levels (stocks or state variables), p = a set of parameters, and f is a nonlinear vector-valued function. Simulation of such systems is easily accomplished by partitioning simulated time into discrete intervals of length dt and stepping the system through time one dt at a time. Each state variable is computed from its previous value and its net rate of change.
)('*)()(:)(' dttxdtdttxtxtx
(2)
In the earliest simulation language in the field (DYNAMO) this equation was written with time scripts K (the current moment), J (the previous moment), and JK (the interval between time J and K):
JKXRATEDTJXKX .*.. (3)
The computation interval dt is selected small enough to have no discernible effect on the patterns of dynamic behavior exhibited by the model (Richardson and Pugh, 1981).
In more recent simulation environments, more sophisticated integration schemes are available. The current simulation
environments include VENSIM, STELLA, PowerSim, and AnyLogic. The conceptual tools and concepts of the field include stocks and flow diagrams. These are called the Building Block. The amount of material or other quantity accumulated in a stock is referred to as the ‘level’ of the stock (corresponding to the ‘value’ of a state variable). The cloud symbols represent sources and sinks with unlimited capacity. The circles represent parameters and auxiliary variables. The rectilinear double-line arrows represent ‘flows’ (processes) that can change the levels of the stocks. Inward arrows indicate processes that can increase the level of a stock and outward arrows indicate processes that can decrease the level of a stock. The tap symbols associated with each arrow represent the ‘flow rates’ of the processes-that is, the rates at which the processes change the levels of the stocks.
In a model, these ‘valves’ can be considered to ‘contain’ the process-rate equations. The curved single-line arrows represent influence or ‘information’ links- the small circles at the tail of these influence arrows serve as a reminder that an influence is exerted via a ‘measurement’ that does not change the levels of the variables and stocks that exert the influence, Figure 3. The net flow is therefore the derivative of the total stock with respect to time, Equation 4. Stock-and-flow diagram do not only show the struc-ture’s components and their relationships, it also draws more attention to accumulation and flow processes (Sterman, 2000).
)()(
)(tOuflowtInflow
dt
Stockd
(4) Model concept and development
The development of the model targets the determination of the unit cost of production of water from a domestic water supply scheme. The model was developed using the SD and captures a number of factors contributing to the total production cost. The University of Ibadan Water Supply scheme that was used for the development of this SD model has all the characteristics of a modern water treatment scheme comprising the raw water, production and distribution sub-systems as shown in Figure 4.
The production cost variable factors include chemical costs (cost of the coagulants, the cost on neutralizers to normalize the pH of the water and the cost of disinfectants); energy costs (costs of public energy usage and cost of fuel used to generate energy where necessary); cost of transportation; cost of spare parts; salary and wages; equipment depreciation; general expenses and cost of purchase/movement of raw water. The water production variables include hours of operation, plant capacity, and number of days of
operation in a period. A period is a calendar month in a planning horizon of 1 year or 12 periods. The monthly volume of water production and the total monthly cost are calculated by the model.

Adeniran 187
SUPPLY/ DISTRIBUTION
SUB-SYSTEM
CLEARWATERTANK
HIGH LIFTPUMP
ELEVATEDWATER
DISTRIBUTIONTANKS
HIGH LIFTPUMP
HIGH LIFTPUMP
HIGH LIFTPUMP
PRESSUREFILTERTANKS
TRANSFER PUMPS
PRODUCTION/TREATMENT
SUB-SYSTEM
RAW WATER
SUB-SYSTEMLOW LIFT PUMPS
ELEYELE RAW WATER STATION
RAW WATER PUMP
RAW WATERSTORAGE TANK
AWBA DAM RAW WATER STATION
HTH ALUM LIME
CLERIFIERTANK
CLERIFIERTANK
CLERIFIERTANK
RAW WATER PUMP
Figure 4. Schematic diagram of University of Ibadan water scheme.
The periodic volume, as well as the periodic cost is accumulated by SD level equations. The cumulated volume is divided by the cumulated total cost to determine the unit cost. The concept of the model is as shown in Figure 5.
The Vensim DSSTM
System Dynamic Modeling platform was the adopted model system while the input variables were entered from an Excel worksheet. The Vensim Stock and Flow diagram describing the model is presented in Figure 6. RESULTS AND DISCUSSION
Model Application
The model was applied to the University of Ibadan Water supply scheme for which extensive operation and main-tenance data, spanning over 15 years, are available. The input data, which are averages of actual field data, are stored in an Excel file “unitcost.xls”. The Vensim Model, using the “GET XLS DATA” command obtains the data for the simulation run from the Excel file “unitcost.xls”. The field data used for the initial simulation run is shown
in Table 1. Simulating with actual field data returns a unit cost of
production ranging from N160.63 ($1.07) to N169.70 ($1.13) per m
3. This result is shown in Figure 7. This
result obtained is reasonable and is comparable to field results and other tariff structures obtainable in other parts of the world. The result obtained compares favourably well with data for unit cost of water from other countries as shown in Figure 8 below.
Scenario Investigations
System dynamics is a method for understanding the dynamic behavior of complex systems. In particular, System Dynamics models have the capability of scenario investigation to consider the effect of changes in any or all of the input variables of the model. In this case, two scenarios are considered:
(1) The effect of the change in the source of raw water on the unit cost

188 Int. J. Water Res. Environ. Eng.
Figure 5. The concept of the unit cost of production model.
Figure 6. SD model for unit cost of water production system.
(2) The effect of improved power supply on the unit cost. Change of the source of raw water from surface water to deep boreholes The raw water used in the mode is imported surface
water that requires a coagulant in order to achieve WHO standard, payment is also made to the Water Supply Agency that owns the dam from where the raw water is abstracted. This scenario investigates a situation where the water scheme is located in a place where the source of raw water is boreholes. In the investigation of this scenario, the University of Lagos water scheme that uses

Adeniran 189 Table 1. Field data used for unit cost of water model
Time 1 2 3 4 5 6 7 8 9 10 11 12
Days 31 28 31 30 31 30 31 31 30 31 30 31
Hours 18 20 20 20 20 20 12 12 20 20 20 18
Plant Capacity (cu.m/hr) 250 250 250 250 250 250 250 250 250 250 250 250
Raw Water Rate (N/cu.m) 10 10 10 10 10 10 10 10 10 10 10 10
Alum Unit Price (N/kg) 450 450 450 450 450 450 450 450 450 450 450 450
Alum Dosage (ppm) 80 90 90 90 110 120 120 90 120 120 80 80
Lime Unit Price (N/kg) 150 150 150 150 150 150 150 150 150 150 150 150
Lime Dosage (ppm) 35 35 35 35 35 35 35 35 35 35 35 35
Chlorine Unit Price (N/kg) 750 750 750 750 750 750 750 750 750 750 750 750
Chlorine Dosage (ppm) 20 20 20 20 20 20 20 20 20 20 20 20
Plant Power Usage (Kw/hr) 600 600 600 600 600 600 450 450 600 600 600 600
Office/Equip Power Usage (Kw/hr) 35 35 35 35 35 35 35 35 35 35 35 35
Unit Cost of AGO (N/l) 65 65 65 65 65 65 65 65 65 65 65 65
Quantity of AGO used 2000 2000 2000 2000 2000 2000 1500 1500 2000 2000 2000 2000
Current Energy Rate (N/Kwh) 7.5 7.5 7.5 7.5 7.5 7.5 7.5 7.5 7.5 7.5 7.5 7.5
Junior Staff Number 32 32 32 32 32 32 32 32 32 32 32 32
Junior Sraff Ave Wage (N/month) 25000 25000 25000 25000 25000 25000 25000 25000 25000 25000 25000 25000
Middle Level Staff Number 12 12 12 12 12 12 12 12 12 12 12 12
Mid Level Saff Ave Wage(N/month) 90000 90000 90000 90000 90000 90000 90000 90000 90000 90000 90000 90000
Snr Staff Number 5 5 5 5 5 5 5 5 5 5 5 5
Snr Staff Ave Wage (N/month) 250000 250000 250000 250000 250000 250000 250000 250000 250000 250000 250000 250000
Equipment Depreciation (N/month) 1200000 1200000 1200000 1200000 1200000 1200000 1200000 1200000 1200000 1200000 1200000 1200000
Maintenance Cost (N/month) 750000 600000 600000 600000 750000 750000 750000 600000 600000 750000 750000 750000
Transport Cost (N/month) 450000 450000 450000 450000 450000 450000 450000 450000 450000 450000 450000 450000
boreholes as source of raw water was adopted. In that case, the cost of the coagulants can be set at zero but disinfectants and neutralizers would still be required. The result obtained is shown in Figure 9. It is observed that the price reduced to between N107.00 ($0.71) to N112.00 ($0.75).
Improved Power Supply This scenario investigates the same water supply scheme with surface raw water source but here with improvement from the public power supply. Improved public power supply would lead to
elimination of running of standby power gene-rators and accordingly for the reductions on the diesel fuel consumption and its maintenance cost. The result of this scenario is presented in Figure 10. The unit cost of production for this scenario now ranges from N154.00 ($1.023) to N163.00

190 Int. J. Water Res. Environ. Eng.
Figure 7. Unit cost of production using field data.
Figure 8. International comparison of unit cost of water production.
*Source : www.lenntech.com/specific-questions-water-quantities.htm
($1.09). It is noted that the unit cost of production will reduce, even with importation of surface raw water, if there is steady public power supply. The results for the three scenarios are presented together in Figure 11. The results obtained show that the unit cost of water from borehole is cheaper than the surface water raw water. This is expected because of the saving in the cost of coagulation which is, usually, not necessary for borehole
raw water. Conclusions A System Dynamics model using Vensim platform to capture the operation, maintenance and production variables with the objectives of determining the unit cost

Figure 9. Unit Cost of Production with Borehole Raw Water Source.
Figure 10. Unit cost of production with regular power Supply.
of domestic water supply production has been developed and reported here. The data input was from an Excel file to facilitate and enhance easy changes to be made to the variables using real life data. The model was applied the University of Ibadan Water Supply Scheme for which extensive field data spanning over fifteen (15) years are available. The model was then used to carry out scenario experimentations for strategic planning. The results obtained for the unit cost of production with the field data are reasonable and compare well with unit cost of production from other countries which were obtained through other techniques. It is concluded that the SD model can be successfully deployed for the establish-ment of reasonable and realistic water tariffs, which is currently on the front burners of industry, organizations and academic debates. Conflict of Interest The author(s) have not declared any conflict of interests.
Adeniran 191
Figure 11. Comparison of unit costs of production under three
scenarios.
REFERENCES
Adeniran AE (2013). System Dynamics as a Viable Tool for Engineering Education. Proceedings of African Regional Conference on Engineering Education (ARCEE 2013), Univ. Lagos, Nig. 9-12
September, 2013. Adeniran AE, Bamiro OA (2010). A System Dynamics Strategic
Planning Model for a Municipal Water Supply Scheme. International
Conference of the System Dynamics Society, Soul Korea, 2010. Adeniran AE (2007). Development of a System Dynamics Strategic
Planning Model for a Municipal Water Supply System. Unpublished
Ph. D. Thesis, University of Ibadan, Ibadan Nigeria. Barlas Y (1996). Formal aspects of model validity and validation in
system dynamics. Syst. Dynamics Rev. 12(3):183-210.
Danar A (2000). The Political Economy of Water Pricing Reform. Oxford University Press.
Forrester JW (2000). Insights from Forty Years in System Dynamics.
Proceedings of the System Thinking and Dynamic Modeling Conference, Portland, Oregon, June 26, 2000.
Forrester JW (1968). Principles of Systems. Productivity Press,
Portland, Oregon, USA, 1968. Forrester JW (1987). Lessons from system dynamics modelling. Syst.
Dynamics Rev. 3(2):136-149.
Morecroft JDW (1992). Executive knowledge, models and learning. Eur. J. Operational Res. 59:9-27.
Norway Water Supply Authority (2004).Tariff Determination Guidelines
2005 - 2007 Tariff Review. Edition 6, Nov. 2004. Richardson GP, Pugh AL (1981). Introduction to System Dynamics
Modelling. Productivity Press, Cambridge, Massachussets, USA, 1981.
Richardson GP, Andersen DF (2010). Systems Thinking, Mapping, and Modeling for Group Decision and Negotiation. Handbook for Group Decision and Negotiation, Eden C, Kilgour DN, eds. Dordrecht:
Springer, 2010, pp. 313-324. Sterman JD (2000). Business Dynamics: Systems Thinking and
Modelling for a Complex World. McGraw-Hill, Boston, MA.
Twort AC, Law FM, Crowley FW, Ratnayama DD (1994). Water Supply (4
th edn), Edward Arnold, Hodder Headline Group, London, UK.
UNEP-IETC (1999). Innovative Ways of Finding Water, Proceedings of
the International Synposium on Efficient Water Use in Urban Areas, Kobe Japan 1999.
Winpenny J (1994). Managing Water as an Economic Resource,
Routledge, London. Wolstenholme EF (2004). Using generic system archetypes to support
thinking and modelling. Syst. Dynamics Rev. 20(4):341-356.
World Bank/EIB (1990). The Environmental Programme for the Mediterranean. World Bank, Washington, D.C. and the European Investment Bank, Luxembourg.

192 Int. J. Water Res. Environ. Eng.
www.lenntech.com/specific-questions-water-quantities.htm Yang CC, Chang LC, Chang, Ho CC (2008). Application of System
Dynamics with Impact Analysis to Solve the Problem of Water
Shortages in Taiwan, Water Resource Manager, Springer 22:1561-1577.