Conceptualizing a Wetland Research Agenda for Developing Countries
Upload
khangminh22Category
view
0download
0
Founder EditorsLate M. M. S. AhujaHemraj B. Chandalia, Department of Endocrinology, Diabetes, Metabolism, Jaslok Hospital and Research Center, Mumbai
Editor-in-ChiefS.V. Madhu, Department of Endocrinology, University College of Medical Sciences-GTB Hospital, Delhi
Executive EditorRajeev Chawla, North Delhi Diabetes Centre, Delhi
Associate EditorsAmitesh Aggarwal, Department of Medicine, University College of Medical Sciences & GTB Hospital, Delhi, IndiaSudhir Bhandari, Department of Medicine, SMS Medical College and Hospital, Jaipur, IndiaSimmi Dube, Department of Medicine, Gandhi Medical College & Hamidia Hospital Bhopal, MP, IndiaSujoy Ghosh, Department of Endocrinology, Institute of Post Graduate Medical Education and Research, Kolkata, IndiaArvind Gupta, Department of Internal Medicine and Diabetes, Jaipur Diabetes Research Centre, Jaipur, IndiaSunil Gupta, Sunil’s Diabetes Care n' Research Centre Pvt. Ltd., Nagpur, IndiaViswanathan Mohan, Madras Diabetes Research Foundation, Chennai, IndiaKrishna G. Seshadri, Sri Balaji Vidyapeeth, Chennai, IndiaSaurabh Srivastava, Department of Medicine, Government Institute of Medical Sciences, Greater Noida, IndiaVijay Viswanathan, MV Hospital for Diabetes and Prof M Viswanthan Diabetes Research Centre Chennai, India
Statistical EditorsAmir Maroof Khan, Community Medicine, University College of Medical Sciences and GTB Hospital, DelhiDhananjay Raje, CSTAT Royal Statistical Society, London, Head Data Analysis Group, mds Data Analytics, Nagpur
Editorial AssistantRashi Kushwaha
Immediate Past Editor in ChiefGR Sridhar, Endocrine and Diabetes Center, Visakhapatnam
NATIONAL ADVISORY BOARDSanjay Agarwal, Aegle Clinic-Diabetes Care, PuneJamal Ahmad, Diabetes and Endocrinology Super Speciality Centre, AligarhS.R. Aravind, Diacon Hospital, BangaloreSarita Bajaj, Department of Medicine, MLN Medical College, AllahabadSamar Banerjee, Department of Medicine, Vivekananda institute of Medical Sciences, KolkataAnil Bhansali, Department of Endocrinology, PGIMER, ChandigarhSubhankar Chowdhury, Department of Endocrinology, IPGME&R and SSKM Hospital, KolkataA.K. Das, Department of Endocrinology, Pondicherry Institute of Medical Sciences, PondicherrySidhartha Das, Dean, SCB Medical College and Hospital, CuttackO.P. Gupta, Emeritus Professor, BJ Medical College, AhmedabadJayaprakashsai Jana, Apollo Hospitals, HyderabadRV Jayakumar, Indian Institute of Diabetes, TrivandrumShashank R Joshi, Joshi Hospital, MumbaiCh. Vasanth Kumar, Apollo Hospitals, HyderabadVinod Kumar, Department of Medicine, St. Stephens’ Hospital, DelhiAnuj Maheshwari, Department of Internal Medicine, BBD University, LucknowB.M. Makkar, Dr. Makkar’s Diabetes & Obesity Centre, DelhiC.R. Anand Moses, The Tamil Nadu Dr. MGR Medical University, ChennaiC. Munichoodappa, The Bangalore Diabetes Hospital, BengaluruJayant Panda, Department of Medicine, SCB Medical College, CuttackVijay Panikar, Department of Endocrinology and Diabetes, Lilavati Hospital & Research Centre, MumbaiP.V. Rao, Department of Endocrinology & Metabolism, Malla Reddy Institute of Medical Sciences, HyderabadB.K. Sahay, Sahay’s Diabetes Center, HyderabadRakesh Sahay, Department of Endocrinology, Osmania Medical College and General Hospital, HyderabadBanshi Saboo, DIA CARE - Diabetes Care & Hormone Clinic, AhmedabadV. Seshiah, Distinguished Professor, The Tamil Nadu Dr. MGR Medical University, ChennaiK.R. Narasimha Setty, Karnataka Institute of Diabetology, BengaluruNihal Thomas, Department of Endocrinology, Diabetes and Metabolism, Christian Medical College, Vellore
International Journal of Diabetes in Developing CountriesIncorporating Diabetes Bulletin
KK Tripathi, Institute of Medical Sciences, Banaras Hindu University, VaranasiVijay Viswanathan, MV Hospital for Diabetes, Chennai
INTERNATIONAL ADVISORY BOARDSilver Bahendeka, Senior Consultant, Diabetes and Endocrinology, Kampala, UgandaParesh Dandona, State University of New York, Buffalo, USAMd Fariduddin, Department of Endocrinology, BangabandhuSheikh Mujib Medical University, BangladeshSatish K Garg, University of Colorado, Denver, USAVed V Gossain, Michigan State University, Michigan, USAR G Naik, University of Pennsylvania, Philadelphia, USAK M Venkat Narayan, Department of Medicine and Epidemiology, Emory University, Atlanta, USADina Shresta, Norvic International Hospital and Medical College, Kathmandu, NepalNoel Somasundaram, National Hospital of Sri Lanka, Colombo, Sri LankaDevjit Tripathi, University Hospital in San Antonio, Texas, USA
Aims and ScopeInternational Journal of Diabetes in Developing Countries targets a readership consisting of clinicians, research workers, paramedical personnel, nutritionists and health care personnel working in the field of diabetes. Original research work and reviews of interest to the above group of readers is considered for publication in the journal.The journal has a goal of serving as an important resource material in diabetes for its readers, mainly in the developing world.
Copyright InformationFor AuthorsAs soon as an article is accepted for publication, authors will be requested to assign copyright of the article (or to grant exclusive publication and disseminationrights) to the publisher (respective the owner if other than Springer Nature). This will ensure the widest possible protection and dissemination of information undercopyright laws.
More information about copyright regulations for this journal is available at www.springer.com/13410For ReadersWhile the advice and information in this journal is believed to be true and accurate at the date of its publication, neither the authors, the editors, nor the publisher can accept any legal responsibility for any errors or omissions that may have been made. The publisher makes no warranty, express or implied, with respect to the material contained herein.
All articles published in this journal are protected by copyright, which covers the exclusive rights to reproduce and distribute the article (e.g., as offprints), as well as all translation rights. No material published in this journal may be reproduced photographically or stored on microfilm, in electronic data bases, on video disks, etc., without first obtaining written permission fromthe publisher (respective the copyright owner if other than Springer Nature). The use of general descriptive names, trade names, trademarks, etc., in this publication, even if not specifically identified, does not imply that these names are not protected by the relevant laws and regulations.
Springer Nature has partnered with Copyright Clearance Center’s RightsLink service to offer a variety of options for reusing Springer Nature content. For permission to reuse our content please locate the material that you wish to use on link.springer.com or on springerimages.com and click on the permissions link or go to copyright.com and enter the title of the publication that youwish to use. For assistance in placing a permission request, Copyright Clearance Center can be contacted directly via phone: +1-855-239-3415, fax: +1-978-646-8600, or e-mail: [email protected].
© 2021 Research Society for Study of Diabetes in India
Subscription InformationInternational Journal of Diabetes in Developing Countries is published 4 times a year. Volume 41 (4 issues) of will be published in 2021.
ISSN 0973-3930 print versionISSN 1998-3832 electronic version
For information on subscription rates please contact Springer Nature Customer Service Center: [email protected] Americas (North, South, Central America and the Caribbean)Springer Journal Fulfillment, 233 Spring Street, New York, NY, 10013-1578, USATel. 800-SPRINGER (777-4643); 212-460-1500 (outside North America)
Outside the Americas Springer Nature Customer Service Center GmbHTiergartenstr. 15, 69121 Heidelberg, GermanyTel.: +49-6221-345-4303
AdvertisementsE-mail contact: [email protected] or [email protected] (Germany)
DisclaimerSpringer Nature publishes advertisements in this journal in reliance upon the responsibility of the advertiser to comply with all legal requirements relating to the marketing and sale of products or services advertised. Springer Nature and the editors are not responsible for claims made in the advertisements published in the journal. Theappearance of advertisements in Springer Nature publications does not constitute endorsement, implied or intended, of the product advertised or the claims made for it by the advertiser.

Journal Websitewww.springer.com/13410Electronic edition: link.springer.com/journal/13410
For the actual version of record please always check the online version of the publication.
Office of PublicationSpringer Science+Business Media B.V., Van Godewijckstraat 30, 3311 GX Dordrecht, The Netherlands
Volume 41 · Number 2 · April–June 2021
EDITORIAL
Post-liver transplantation diabetes mellitus — a clinical challenge for diabetologists? S.K. Bhadada · R. Pal 177
REVIEW ARTICLES
Genetic association of vascular endothelial growth factor ( VEGF ) gene variants with the risk for diabetic retinopathy: a meta-analysis S. Kafeel · K.M. Nangrejo · R. Gonzalez-Salinas 180
Association between maternal alcohol use during pregnancy and gestational diabetes mellitus: a meta-analysis S.-L. Hu · B.-T. He · R.-J. Zhang 189
The association between gallstone disease and metabolic syndrome related abnormalities: a systematic review and meta-analysis P. Jiang · Z. Ni · S. Huang · X. Li · Y. Li · H. Huang 196
ORIGINAL ARTICLES
New-onset diabetes mellitus after liver transplantation in the patients with acute liver failure Ö. Topaloğlu · M. Cengiz · A. Cengiz · B. Evren · S. Yoloğlu · S. Yılmaz · İ. Şahin 205
Prevalence, risk factors and perinatal outcomes of gestational diabetes in Mexican adolescents when applying diagnostic criteria from three different international guidelines E.N. Nava Guerrero · A. Salcedo González · C.E. Hernández Escobar · F.C. Rivera · E.J. Mondragón Ortiz · I.M. De Alba · G. Cantú 212
Prevalence of diabetes mellitus and hypertension during pregnancy in eastern China after the implementation of universal two-child policy Z.F. Ma · H. Zhou · J. Ma · Y. Lu · B. Pan 221
Prevalence and risk factors in metabolic syndrome among Temiar in Kelantan A.F. Jusoh · N.S. Harun · R. Yahaya · N.A.S. Nik Him · R. Ismail · M.A.K. Rohin · N.H. Ridzwan · M.N. Jumli · M.N. Zahary 228
13
International Journal of Diabetes in Developing Countries
Human gut microbiota and its possible relationship with obesity and diabetes N. Mohammadzadeh · S. Razavi · Z. Hadi · M. Kermansaravi · S. Boloori · A. Kabir · M.E. Khamseh 235
Prevalence of IA-2 antibody in patients suffering from diabetes and their first-degree relatives V. Bolandi · S.K. Azghadi · M. Shahami · M. Fereidouni 244
The impact of high-fat and high-protein meal of adolescents with type 1 diabetes mellitus receiving intensive insulin therapy on postprandial blood glucose level: a randomized, crossover, breakfast study A.B. Gümüş · A. Keser · Z. Şiklar · M. Berberoğlu 249
Real-world outcomes of insulin pump compared to multiple daily injection therapy in adult type 1 diabetes mellitus patients in a Mediterranean scenario J. Moreno-Ferández · J.A. García-Seco · M. Herrera-Moraleda ·A.M. Seco · J.R. Muñoz-Rodríguez 259
The efficacy of once-daily liraglutide as an add-on to oral antidiabetic agents on weight reduction and glycemic control in obese patients with inadequately controlled type 2 diabetes: a retrospective analysis in relation to liraglutide dose escalation within a 7-month treatment period A.M. Rahmah · J.K.T. Al-Isawi · O.A. Mahdi 266
Glycemic control rate of type 2 diabetes mellitus in Chinese adults: a multi-centered, retrospective, cross-sectional study L. Yan · Y. Liu · J. Li · H. Zhou · H. Ma 273
Healthcare seeking behavior and glycemic control in patients with type 2 diabetes attending a tertiary hospital S.M.S. Islam · R. Uddin · S.B. Zaman · T. Biswas · T. Tansi · Z. Chegini · M.A. Moni · L. Niessen · A. Naheed · for the MPID Trial Investigators 280
Could the appropriate anti-diabetic therapy be mixed insulin in dialysis patients? V. Demircan · Y. Yıldırım · E. Aydın · A.V. Kara · F.Y. Aydın · Z. Yılmaz · A.K. Kadiroğlu · A.K. Tuzcu · Z. Pekkolay 288
Prevalence of peripheral neuropathy among type 2 diabetes mellitus patients in a rural health centre in South India A. Jasmine · Akila G.V. · V. Durai · Anitha Rani M. · V. Shriraam · Samya V. · Gayathri T. · S. Mahadevan 293
Correction to: Prevalence of peripheral neuropathy among type 2 diabetes mellitus patients in a rural health centre in South India A. Jasmine · Akila G.V. · V. Durai · Anitha Rani M. · V. Shriraam · Samya V. · Gayathri T. · S. Mahadevan 301
Relationship of HbA1c with plasma atherogenic index and non-HDL cholesterol in patients with type 2 diabetes mellitus E. Bozkur · A. Esen · O. Polat · Y. Okuturlar · Y.S. Akdeniz · H. Piskinpasa · S. Dogansen · I. Cakir · M. Mert 302
Investigating the relationship between myocardial infarction and the ratio of glycated albumin to glycated hemoglobin in patients admitted to cardiac ward H. Sadeghi · E. Monazah · A. Tavan · G. Yousefzadeh · M. Naderi · A. Sadeghi · N. Sedri 307
Predictive factors for reduced functional mobility in elderly diabetics and non-diabetics F.T.F. de Paiva · M.M. Stival · L.R. de Lima · A. de Oliveira Silva · Y.G. de Sousa Barbalho · M.V.G. da Costa · I.C.R. da Silva · S.S. Funghetto 314
Effects of telemedicine intervention on the management of diabetic complications in type 2 diabetes Y. Hu · X. Wen · L. Ni · F. Wang · S. Hu · F. Fang 322
Lipohypertrophy in insulin injecting patients with diabetes mellitus: an under-recognized barrier for glycemic control R. Kumar · R.D. Gupta · S. Shetty · C.S. Prabhu · K. Sathyakumar · M.D. Mruthyunjaya · F.K. Jebasingh · M. Inbakumari · F. Christina · H.S. Asha · T.V. Paul · N. Thomas 329
Knowledge, attitude, and practice towards self-management among diabetic patients at Debre Tabor General Hospital chronic diseases follow-up clinic, Northwest Ethiopia E.G. Mekonen 337
Function of family of origin and current quality of life: exploring the mediator role of resilience in Chinese patients with type 2 diabetes G. Jia · X. Li · Y. Chu · H. Dai 346
13
Further articles can be found at www.springerlink.com
Abstracted/Indexed in CAB Abstracts, CNKI, Chemical Abstracts Service (CAS), Dimensions, EBSCO Academic Search, EBSCO CINAHL, EBSCO Discovery Service, EBSCO STM Source, EMBASE, EMCare, Google Scholar, Institute of Scientific and Technical Information of China, Japanese Science and Technology Agency (JST), Journal Citation Reports/Science Edition, Naver, OCLC WorldCat Discovery Service, ProQuest Biological Science Database, ProQuest Central, ProQuest Health & Medical Collection, ProQuest Health Research Premium Collection, ProQuest Immunology Abstracts, ProQuest India Database, ProQuest Natural Science Collection, ProQuest Nursing & Allied Health Database, ProQuest Pharma Collection, ProQuest Research Library, ProQuest SciTech Premium Collection, ProQuest-ExLibris Primo, ProQuest-ExLibris Summon, SCImago, SCOPUS, Science Citation Index Expanded (SciSearch), Semantic Scholar, TD Net Discovery Service, UGC-CARE List (India)
Instructions for Authors for Int J Diabetes Dev Ctries are available atwww.springer.com/13410.
Compliance with Ethical Requirements
International journal of Diabetes in Developing Countries requeststhat all authors comply with Springer’s ethical policies. To viewour ethics statements please visit the following:
· Conflict of Interest and Ethical Standards: http://www.springer.com/authors?SGWID=0-111-6-791531-0
· Informed Consent: http://www.springer.com/authors?SGWID=0-111-6-608209-0
Statement of Human and Animal Rights: http://www.springer.com/authors?SGWID=0-111-6-608309-0
CASE REPORTS
De novo mutation in HNF-1b gene as a cause for Maturity-onset Diabetes of the Young type 5 with sustained hypomagnesemia B. Ren · Y. Chen · Q. Zhang · S. Chen · S. Zhang · J. Wang · Y. Zhang 354
Extremely low HDL and residual cardiovascular risk—a case report J. Sanyal · M. Lodh · A.K. Parida · A. Ganguly 358
LETTER TO THE EDITOR
A global view on prevalence of diabetes and the Human Development Index A. Mao · T. Huang · H. Zhang · W. Chen · Z. Zeng 361
EDITORIAL
Post-liver transplantation diabetes mellitus — a clinicalchallenge for diabetologists?
Sanjay K. Bhadada1 & Rimesh Pal1
# Research Society for Study of Diabetes in India 2021
Liver transplantation has become an effective therapy for pa-tients with acute or chronic end-stage liver disease. With im-provement in operative techniques and immunosuppressiveregimens, long-term survival after liver transplantation hasmarkedly increased. However, with increased longevity, theattention has shifted towards long-term complications, whichare primarily related to the immunosuppressive treatment.One such complication is new-onset diabetes after transplan-tation (NODAT), often referred to as posttransplantation dia-betes mellitus (PTDM).
New-onset diabetes after transplantation refers to individ-uals who develop new-onset diabetes following solid organ,bone marrow, and hematopoietic stem cell transplant. It char-acteristically excludes patients with pretransplant diabetesthat remained undiagnosed and posttransplant hyperglyce-mia that resolves by the time of discharge [1]. On the otherhand, PTDM theoretically describes the presence of diabetesin the posttransplant setting irrespective of the time of onset ofdiabetes [1, 2]. Nevertheless, in routine clinical practice, thetwo terms are often used interchangeably.
Hyperglycemia is not uncommon during the earlyposttransplant period; nearly 90% of liver transplant recipientsexhibit hyperglycemia in the immediate posttransplant period[3]. In the majority of the cases, such stress- or steroid-inducedhyperglycemia resolves by the time of discharge. Whereasposttransplantation hyperglycemia is an important risk factorfor subsequent PTDM, a formal diagnosis of PTDM shouldideally be made once the patient is stable on maintenanceimmunosuppression and in the absence of acute infection [4].
The diagnosis of PTDM, which in the context of livertransplantation is referred to as post-liver transplantation dia-betes mellitus (PLTDM), has long been a matter of debate [5].
Earlier, the most commonly used clinical definition was therequirement of insulin for a minimum period (usually 30 days)posttransplantation. This definition had resulted inunderestimating the prevalence of diabetes after transplanta-tion because it excludes patients treated with oral antidiabeticdrugs and those with untreated hyperglycemia, impairedfasting glucose (IFG), or impaired glucose tolerance (IGT).Furthermore, it does not distinguish between patients withnew-onset disease from those with preexisting disease [6].
The International Consensus Guidelines on new-onset di-abetes after transplantation 2003 recommended that the diag-nosis should be based on the American Diabetes Association(ADA) criteria for type 2 diabetes mellitus [6], which are asfollows:
& Fasting plasma glucose (FPG) ≥ 7.0 mmol/l (126 mg/dl)with no calorie intake for at least 8 h, or
& Two-hour plasma glucose during an OGTT (2-h PG post-OGTT) ≥ 11.1 mmol/l (200 mg/dl), or
& Casual plasma glucose ≥ 11.1 mmol/l (200 mg/dl) withclassic symptoms of diabetes, all being documented on 2different occasions.
Thus, the diagnostic criteria for PLTDM are the same asthose for diabetes in the general population [5]. Since post-prandial hyperglycemia is much more prevalent than fastinghyperglycemia among liver transplant patients [7], the idealscreening test for PLTDM is the oral glucose tolerance test(OGTT) [8]. However, performing an OGTT under supervi-sion might not always be feasible, thereby clinicians mighthave to rely solely on FPG.
Even in the posttransplant setting, a fasting plasma glucoselevel of < 5.5 mmol/l (100 mg/dl) is considered to be normal,and 5.5–6.9 mmol/l (100–125 mg/dl) is considered to be IFG.A 2-h post-OGTT plasma glucose level of < 7.7 mmol/l (140mg/dl) is considered to be normal, and 7.7–11.1 mmol/l (140–199 mg/dl) is considered to be IGT. The importance of diag-nosing the pre-diabetic states (IFG and IGT) in the post-liver
* Sanjay K. [email protected]
1 Department of Endocrinology, Post Graduate Institute of MedicalEducation and Research, Chandigarh, Chandigarh 160012, India
https://doi.org/10.1007/s13410-021-00955-3
Published online: 26 May 2021
International Journal of Diabetes in Developing Countries (2021) 41:177–179
transplant context lies in their relevance as predictors of futurerisk of PLTDM [5]. Apart from the aforementioned diagnosticcriteria, post-liver transplant patients whose blood glucoselevels are normal but are using insulin or oral antidiabeticdrugs are also diagnosed as having PLTDM [9].
Glycated hemoglobin (HbA1c) has a limited role in thediagnosis of PTDM (or PLTDM). Due to blood loss associat-ed with the transplant procedure, preexisting anemia (and sub-sequent shortened red blood cell survival), and especially lackof robust evidence regarding its use in the early posttransplantperiod, HbA1c is not recommended as a first-line diagnostictest for PLTDM, especially in the first 3 months posttransplant[10]. Beyond 3 months, the new hemoglobin would be syn-thesized and glycated for an appropriate period of time; insuch setting, HbA1c ≥ 6.5% can be utilized to diagnosePTDM. On the contrary, many studies do not recommendthe use of HbA1c alone as a screening tool for diagnosingPTDM in the first year after transplant [11].
Although the diagnostic criteria for defining PLTDM havebeen standardized, the timing of the tests remains controver-sial and unresolved. Most believe that the first month afterliver transplantation still falls within the period of surgicalstress; hence, plasma glucose levels beyond 1 month afterliver transplantation should be used as the determining crite-rion [9, 12]. On the contrary, others opine that if rejection orsurgical complications do not occur in the postoperative peri-od, stress-related hyperglycemia would be resolved in mostpatients until the end of the first month [13].
In this issue of the International Journal of Diabetes inDeveloping Countries, Topaloğlu et al. report on the preva-lence of NODAT after liver transplantation in patients withacute liver failure. The diagnosis of NODATwas based solelyon fasting blood glucose (FBG) measured at frequent timeintervals. Accordingly, the prevalence of NODAT was26.98%, 14.54%, and 8.3% based on FBG measured at 1month, 3 months, and 12 months post-liver transplant, respec-tively [14]. Although a significant fraction of patients whowere alive at 1st month had subsequently succumbed at the3rd month and 12th month, it remains unclear whetherNODAT diagnosed in the 1st month could have been one ofthe predisposing factors contributing to the later demise of thepatients. Similarly, it remains unanswered whether the markeddecline in the prevalence of NODAT at the 3rd and 12th monthcould have resulted from the selective demise of patients di-agnosed with NODAT in the 1st month, or a spontaneousreversal of stress-related hyperglycemia with time.
Thus, it does not seem to be prudent to label a liver trans-plant recipient as having NODAT on the basis of blood glu-cose values measured as early as 1 month posttransplant. Thediagnosis of NODAT (or PLTDM) should ideally be based on2-h PG post-OGTT (or FPG) or need for insulin/antidiabeticdrugs beyond 1 month after liver transplant. Nevertheless,putting aside semantics, appropriate management of any
degree of hyperglycemia in the posttransplant period is imper-ative as those with early perioperative hyperglycemia andPTDM have higher rates of graft rejection, infection, and re-hospitalization [4, 15, 16].
Data derived from randomized controlled trials on theshort- and long-term use of anti-hyperglycemic agents in thesetting of PTDM is limited. Insulin remains the agent ofchoice for the management of hyperglycemia, PTDM,preexisting diabetes and diabetes in the hospital setting.After discharge, PTDM patients with poor glucose controlshould continue insulin with frequent home self-monitoringof blood glucose to help titrate insulin doses accordingly [4].
Hitherto, there is insubstantial data on the use of noninsulinagents in the context of PTDM. The choice of an appropriateagent is usually made after taking into consideration the sideeffect profile of the drug and possible interactions with thepatient’s ongoing immunosuppression regimen. Frequentdrug dose adjustments may be needed because of a declinein the glomerular filtration rate, a common complication intransplant patients. A short-term pilot study reported the useof metformin in renal transplant recipients, but the same hasnot been replicated in other types of organ transplant [17].Thiazolidinediones have been successfully used in patientswith liver and renal transplants; however, frequent side effectsthat include fluid retention, heart failure, and osteopenia limitits use in the posttransplant setting [18, 19]. Dipeptidylpeptidase-4 inhibitors (DPP4i) have demonstrated safety insome recent clinical trials [20, 21]. Besides, DPP4i do notinteract with most immunosuppressant drugs and hence canbe safely used in most PTDM patients. Nevertheless, in viewof limited clinical data, it would not be prudent to advise oneantidiabetic drug (noninsulin) over the other. Well-designedrandomized controlled trials examining the efficacy and safetyof these and other antidiabetic agents in patients with PTDMare needed.
Declarations
Ethical approval Not required
Informed consent Not applicable
Conflict of interest The authors declare no competing interests.
References
1. Sharif A, Hecking M, de Vries APJ, Porrini E, HornumM, Rasoul-Rockenschaub S, et al. Proceedings from an international consensusmeeting on posttransplantation diabetes mellitus: recommendationsand future directions. Am J Transplant Off J Am Soc TransplantAm Soc Transpl Surg. 2014;14:1992–2000.
2. Hecking M, Werzowa J, Haidinger M, Hörl WH, Pascual J,Budde K, et al. Novel views on new-onset diabetes after trans-plantation: development, prevention and treatment. Nephrol
178 Int J Diabetes Dev Ctries (2021) 41:177–179
Dial Transplant Off Publ Eur Dial Transpl Assoc - Eur RenAssoc. 2013;28:550–66.
3. Werner KT,Mackey PA, Castro JC, Carey EJ, Chakkera HA, CookCB. Hyperglycemia during the immediate period following livertransplantation. Future Sci OA. 2016;2:FSO97.
4. American Diabetes Association. 2. Classification and diagnosis ofdiabetes: Standards of Medical Care in Diabetes—2021. DiabetesCare. 2021;44:S15–33.
5. Peláez-Jaramillo MJ, Cárdenas-Mojica AA, Gaete PV, MendivilCO. Post-liver transplantation diabetes mellitus: a review of rele-vance and approach to treatment. Diabetes Ther. 2018;9:521–43.
6. Davidson J, Wilkinson A, Dantal J, Dotta F, Haller H,Hernandez D, et al. New-onset diabetes after transplantation:2003 International Consensus Guidelines. Transplantation.2003;75:SS3–24.
7. Ducloux D. Polycystic kidney disease as a risk factor for post-transplant diabetes mellitus. Nephrol Dial Transplant. 1999;14:1244–6.
8. Shivaswamy V, Boerner B, Larsen J. Post-transplant diabetesmellitus: causes, treatment, and impact on outcomes. Endocr Rev.2016;37:37–61.
9. Ling Q, Xie H, Lu D, Wei X, Gao F, Zhou L, et al. Associationbetween donor and recipient TCF7L2 gene polymorphisms and therisk of new-onset diabetes mellitus after liver transplantation in aHan Chinese population. J Hepatol. 2013;58:271–7.
10. John PR, Thuluvath PJ. Outcome of patients with new-onset dia-betes mellitus after liver transplantation compared with those with-out diabetes mellitus. Liver Transplant Off Publ Am Assoc StudyLiver Dis Int Liver Transplant Soc. 2002;8:708–13.
11. Solhjoo M, Kumar SC. New onset diabetes after transplant.StatPearls. Treasure Island (FL): StatPearls Publishing; 2021. [cited2021 Apr 21]. Available from: http://www.ncbi.nlm.nih.gov/books/NBK544220/
12. Chaoyang LV, Zhang Y, Chen X, Huang X, Xue M, Sun Q, et al.New-onset diabetes after liver transplantation and its impact oncomplications and patient survival. J Diabetes. 2015;7:881–90.
13. Lane JT, Dagogo-Jack S. Approach to the patient with new-onsetdiabetes after transplant (NODAT). J Clin Endocrinol Metab.2011;96:3289–97.
14. Topaloğlu Ö, Cengiz M, Cengiz A, Evren B, Yoloğlu S, Yılmaz S,et al. New-onset diabetes mellitus after liver transplantation in thepatients with acute liver failure. Int J Diabetes Dev Ctries. 2021[cited 2021 Apr 18]; Available from: http://link.springer.com/10.1007/s13410-021-00922-y.
15. ThomasMC,Moran J,Mathew TH, RussGR, RaoMM. Early peri-operative hyperglycaemia and renal allograft rejection in patientswithout diabetes. BMC Nephrol. 2000;1:1.
16. Wallia A, Illuri V, Molitch ME. Diabetes care after transplant. MedClin North Am. 2016;100:535–50.
17. Kurian B, Joshi R, Helmuth A. Effectiveness and long-term safetyof thiazolidinediones and metformin in renal transplant recipients.Endocr Pract. 2008;14:979–84.
18. Budde K, Neumayer H-H, Fritsche L, Sulowicz W, Stompôr T,Eckland D. The pharmacokinetics of pioglitazone in patients withimpaired renal function. Br J Clin Pharmacol. 2003;55:368–74.
19. Luther P, Baldwin D. Pioglitazone in the management of diabetesmellitus after transplantation. Am J Transplant Off J Am SocTransplant Am Soc Transpl Surg. 2004;4:2135–8.
20. Lane JT, Odegaard DE, Haire CE, Collier DS, Wrenshall LE,Stevens RB. Sitagliptin therapy in kidney transplant recipientswith new-onset diabetes after transplantation. Transplantation.2011;92:e56–7.
21. Strøm Halden TA, Åsberg A, Vik K, Hartmann A, Jenssen T.Short-term efficacy and safety of sitagliptin treatment in long-term stable renal recipients with new-onset diabetes after transplan-tation. Nephrol Dial Transplant. 2014;29:926–33.
Publisher’s note Springer Nature remains neutral with regard to jurisdic-tional claims in published maps and institutional affiliations.
179Int J Diabetes Dev Ctries (2021) 41:177–179
REVIEW ARTICLE
Genetic association of vascular endothelial growth factor (VEGF)gene variants with the risk for diabetic retinopathy: a meta-analysis
Sanober Kafeel1 & Khan Muhammad Nangrejo2& Roberto Gonzalez-Salinas3
Received: 29 July 2020 /Accepted: 15 September 2020# Research Society for Study of Diabetes in India 2020
AbstractIntroduction The vascular endothelial growth factor (VEGF) significantly contributes to the manifestation of neovascularizationin the retina which progressively develops retinopathy in diabetic patients. The aim of this study was to assess the role of VEGFpolymorphisms in the pathogenesis of diabetic retinopathy (DR).Methods This meta-analysis comprised a total of six case-control and cohort studies published in the last 6 years. The selection ofstudies was done by sorting in reliable database searches: NCBI, Ensemble, GenBank, Embase, UCSC Genome Browser. Afterthe extraction of data, the Q test of heterogeneity was performed. The Stata Software version 13.1 was used as the statisticalpackage. Fixed and random effect models were applied for forest plot depiction while funnel plot and Egger’s test were carriedout for the evaluation of publication bias.Results A significant relationship was found between the risk allele of VEGF polymorphism rs3025039 with predisposi-tion of DR (OR = 1.45, 95%CI = 1.04–1.86) in the absence of heterogeneity by three studies. Furthermore, significantassociation was also observed for four polymorphisms of VEGF (rs833061, s13207351, rs1570360, and rs2010963) withhigher susceptibility of DR among the population of Pakistan (OR = 1.46, 95%CI = 1.21–1.71).Conclusion The meta-analysis suggested the substantial role of VEGF polymorphism rs3025039 as a possible biomarker for theassessment of DR risk. However, genome-wide association study (GWAS) is required in future to elucidate the multi-SNP effectof these polymorphisms in VEGF gene.
Keywords Diabetic retinopathy .Meta-analysis .VEGF polymorphism . Heterogeneity
Introduction
Diabetic retinopathy (DR) is a condition that develops in re-sponse of disturbances in the regulation of glycemia, which inturn causes an essential loss of vision among the diabeticpopulation. According to the Atlas of the InternationalDiabetes Federation (IDF), the current prevalence of DR indiabetes mellitus (DM) patients is 27% [1]. However, approx-imately 150 million cases are reported worldwide, which isestimated to increase up to a double-figure by end of the year2025 [2]. The formation of DR is predominantly characterizedby increased vascular permeability, angiogenesis, and ische-mia followed by neovascularization of the retina, iris, opticdisc, and angle which could eventually lead to formingneovascular glaucoma (NVG), defined as severe glaucomaassociated with the presence of new iris or angle vasculariza-tion [3–5].
The VEGF considerably contributes in the exertion of stim-ulus for neovascularization, increased vascular permeability in
Electronic supplementary material The online version of this article(https://doi.org/10.1007/s13410-020-00874-9) contains supplementarymaterial, which is available to authorized users.
* Sanober [email protected]
Khan Muhammad [email protected]
Roberto [email protected]
1 Dr. A. Q. Khan Institute of Biotechnology and Genetic Engineering,University of Karachi, Karachi 75270, Pakistan
2 Department of PMC Hospital, Peoples University of Medical &Health Sciences for Women, Nawabshah, Shaheed Benazirabad,Sindh 67480, Pakistan
3 Asociacion para Evitar la Ceguera en México (APEC), VicenteGarcía Torres 46, San Lucas, 04030 Coyoacán, Ciudad de Mexico,Mexico
https://doi.org/10.1007/s13410-020-00874-9
/ Published online: 10 October 2020
International Journal of Diabetes in Developing Countries (2021) 41:180–188
the retina, and the deterioration of the blood-retinal barrier(BRB) [6]. Furthermore, the antagonists of the VEGF receptorare known to be implicated in causing a decline in vascularpermeability and neovascularization of retina, hence develop-ing resistance in the progression of DR [7]. VEGF is primarilyreleased from the pericytes, epithelial cells of retina, Mullercells, astrocytes, glial and endothelial cells. The ischemiccues, generated on the retina, lead to massive production ofVEGF, a multifunctional cytokine that promotes angiogenesisand a potent mediator of microvascular permeability [8]. Itperforms the role of signaling proteins that modulate eitherthe development of new vessels from older branches or denovo vessel growth from the circulatory system of embryonicorigin [9]. This cytokine is estimated to be induced by hypox-ia, which is a landmark for DR patients [10]. During hypoxia,VEGF gene expression increases via several different mecha-nisms. These mechanisms include increased transcription,mRNA stability, and protein translation using an internal ri-bosomal entry site, as well as increased expression of oxygenregulated protein 150, a chaperone required for intracellulartransport of proteins from the endoplasmic reticulum to theGolgi apparatus prior to secretion [11]. Moreover, the over-production infers detrimental impacts on BRB and causes theendocytosis of tight junction proteins and enhancement inpermeability [12, 13].
The gene encoded for VEGF is situated on chromosomeno. 6 at position p21.3 contains eight exons and seven introns.It is suggested to be highly polymorphic, as many geneticvariants were reported in the promoter region, 5′ untranslatedregion (UTR), and 3′ UTR region which depicts a certainrelationship with the expression of VEGF protein [14]. Sincethe outcomes of prior genetic studies indicated heterogeneitydue to the assessment of a wide range of ethnicities and geo-graphical populations, therefore, the available data is discreteand displays diversification [15–17]. Hence, this meta-analysis is conducted with an aim to quantitatively evaluatethe outcomes of the recent 6 years of literature regarding theassociations of VEGF genetic variants with the pathogenicityof DR. The hypothesis of this meta-analysis is the VEGFgenetic variants play a robust role in developing the implica-tions on the induction and progression of DR.
Methods
Retrieval of eligible studies
An extensive literature survey in search bars of NCBI,PubMed, Ensemble, GenBank, Embase, UCSC GenomeBrowser, GWASCatalog, and Google Scholar was conductedto identify those studies which explored the associations ofVEGF genetic variants in the patients of DR. All the studieswere restricted to English language. The following keywords
were typed: VEGF and Diabetic Retinopathy, VEGF geneticvariants or polymorphisms or SNPs, in integration withNPDR or PDR to carry out searching and sorting relevantpublications among discrepancy of ethnicities. The deadlinefor data retrieval was limited to April 1, 2020. The protocol forthis meta-analysis conforms to the preferred reporting itemsfor meta-analysis followed by PRISMA guidelines [18].
Assessment criteria
The studies categorized as case reports, editorial letters, shortcommunications, and reviews were exempted. The selectionof potentially eligible studies was made based on the follow-ing criteria: (1) contains a related association of VEGF geneticvariant with DR group; (2) sufficient statistical analysis for theestimation of odds ratio; (3) reports of proper genotypic andallelic distribution of polymorphisms in comparison to controlgroup; (4) the population of control shows consistency withHardy-Weinberg equilibrium (HWE); (5) case-control studydesign; (6) standard diagnostic measures were taken for theconfirmation of DR patients according to the guidelines of theAmerican Diabetes Association; (6) adequate sample sizewith a confidence interval (CI) of 95%; (7) recent publicationsof the last 6 years which were published from 2014 wereincluded in this meta-analysis.
Data extraction and quality assurance
Independent extraction of data was undertaken by two re-searchers: Kafeel and Nangrejo. The extraction of essentialdata from each article was done using the following variables:year of publication, name of the first author, country of origin,sample size, genotype frequency, odds ratio, level of signifi-cance, and method of genotyping.
Statistical analysis
The meta-analysis was carried out using an expert statisticalsoftware STATA version 13.0 RRID:SCR_012763 (64-bit;Stata Corporation, College Station, TX, USA) after importingthe data from a Microsoft Excel sheet. A p value of < 0.05depicted a statistical significance. The strength of genetic as-sociation ofVEGF in the pathogenicity of DRwas assessed bycalculating the odds ratio (ORs) and 95% confidence interval.The heterogeneity was estimated by inconsistency index I2
which was based on Q statistics. In the absence of heteroge-neity (I2 < 50%), the fixed effect of the pooling model (peto)was applied, whereas the presence of heterogeneity (I2 < 50%)employed the random effect model (D-L) instead. The risk forpublication bias was evaluated by funnel plot and Egger’sstatistics.
181Int J Diabetes Dev Ctries (2021) 41:180–188
Results
Characteristics of included studies
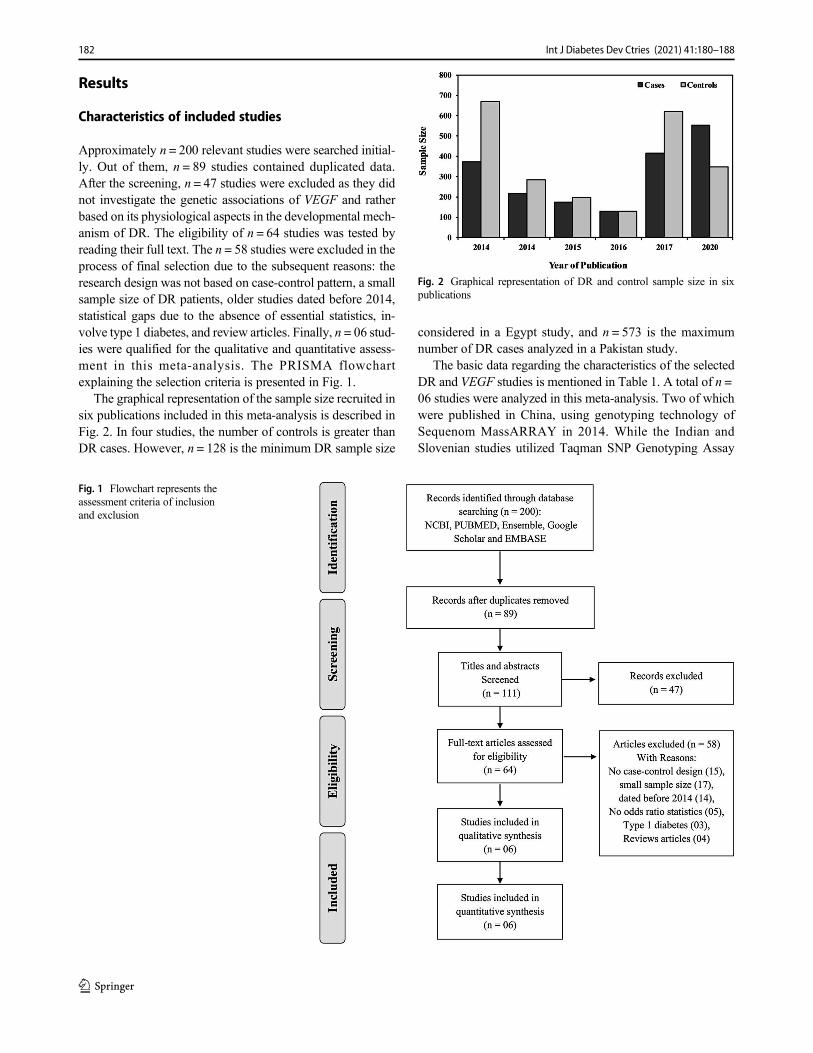
Approximately n = 200 relevant studies were searched initial-ly. Out of them, n = 89 studies contained duplicated data.After the screening, n = 47 studies were excluded as they didnot investigate the genetic associations of VEGF and ratherbased on its physiological aspects in the developmental mech-anism of DR. The eligibility of n = 64 studies was tested byreading their full text. The n = 58 studies were excluded in theprocess of final selection due to the subsequent reasons: theresearch design was not based on case-control pattern, a smallsample size of DR patients, older studies dated before 2014,statistical gaps due to the absence of essential statistics, in-volve type 1 diabetes, and review articles. Finally, n = 06 stud-ies were qualified for the qualitative and quantitative assess-ment in this meta-analysis. The PRISMA flowchartexplaining the selection criteria is presented in Fig. 1.
The graphical representation of the sample size recruited insix publications included in this meta-analysis is described inFig. 2. In four studies, the number of controls is greater thanDR cases. However, n = 128 is the minimum DR sample size
considered in a Egypt study, and n = 573 is the maximumnumber of DR cases analyzed in a Pakistan study.
The basic data regarding the characteristics of the selectedDR and VEGF studies is mentioned in Table 1. A total of n =06 studies were analyzed in this meta-analysis. Two of whichwere published in China, using genotyping technology ofSequenom MassARRAY in 2014. While the Indian andSlovenian studies utilized Taqman SNP Genotyping Assay
Fig. 1 Flowchart represents theassessment criteria of inclusionand exclusion
Fig. 2 Graphical representation of DR and control sample size in sixpublications
182 Int J Diabetes Dev Ctries (2021) 41:180–188
published in 2015 and 2017 respectively, an Egyptian studyemployed Reverse Transcriptase PCR method in 2016 andPakistani study used Sanger Sequencing method in 2020 forthe genotyping of VEGF polymorphisms.
The genotypic data of studied polymorphisms of VEGFgene analyzed in each of the six studies are summarized inTable 2 (Supplementary material). The frequency of genotyp-ic distributions and the significance of risk allele were dem-onstrated for each of the polymorphism. It was observed thatVEGF rs2010963-C and rs3025039-T were considered themost studied polymorphisms among the studies published inthe last 6 years.
Pooled effect for the VEGF polymorphism and DR riskamong various populations
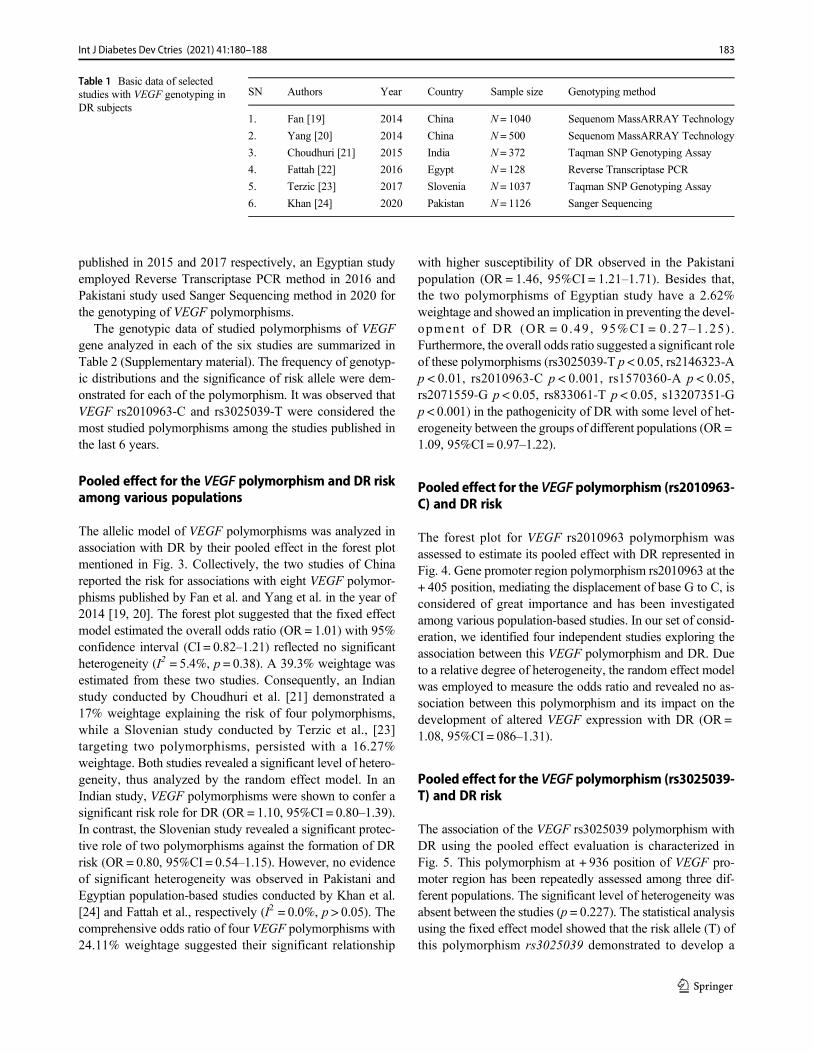
The allelic model of VEGF polymorphisms was analyzed inassociation with DR by their pooled effect in the forest plotmentioned in Fig. 3. Collectively, the two studies of Chinareported the risk for associations with eight VEGF polymor-phisms published by Fan et al. and Yang et al. in the year of2014 [19, 20]. The forest plot suggested that the fixed effectmodel estimated the overall odds ratio (OR = 1.01) with 95%confidence interval (CI = 0.82–1.21) reflected no significantheterogeneity (I2 = 5.4%, p = 0.38). A 39.3% weightage wasestimated from these two studies. Consequently, an Indianstudy conducted by Choudhuri et al. [21] demonstrated a17% weightage explaining the risk of four polymorphisms,while a Slovenian study conducted by Terzic et al., [23]targeting two polymorphisms, persisted with a 16.27%weightage. Both studies revealed a significant level of hetero-geneity, thus analyzed by the random effect model. In anIndian study, VEGF polymorphisms were shown to confer asignificant risk role for DR (OR = 1.10, 95%CI = 0.80–1.39).In contrast, the Slovenian study revealed a significant protec-tive role of two polymorphisms against the formation of DRrisk (OR = 0.80, 95%CI = 0.54–1.15). However, no evidenceof significant heterogeneity was observed in Pakistani andEgyptian population-based studies conducted by Khan et al.[24] and Fattah et al., respectively (I2 = 0.0%, p > 0.05). Thecomprehensive odds ratio of four VEGF polymorphisms with24.11% weightage suggested their significant relationship
with higher susceptibility of DR observed in the Pakistanipopulation (OR = 1.46, 95%CI = 1.21–1.71). Besides that,the two polymorphisms of Egyptian study have a 2.62%weightage and showed an implication in preventing the devel-opment of DR (OR = 0.49, 95%CI = 0.27–1.25) .Furthermore, the overall odds ratio suggested a significant roleof these polymorphisms (rs3025039-T p < 0.05, rs2146323-Ap < 0.01, rs2010963-C p < 0.001, rs1570360-A p < 0.05,rs2071559-G p < 0.05, rs833061-T p < 0.05, s13207351-Gp < 0.001) in the pathogenicity of DR with some level of het-erogeneity between the groups of different populations (OR =1.09, 95%CI = 0.97–1.22).
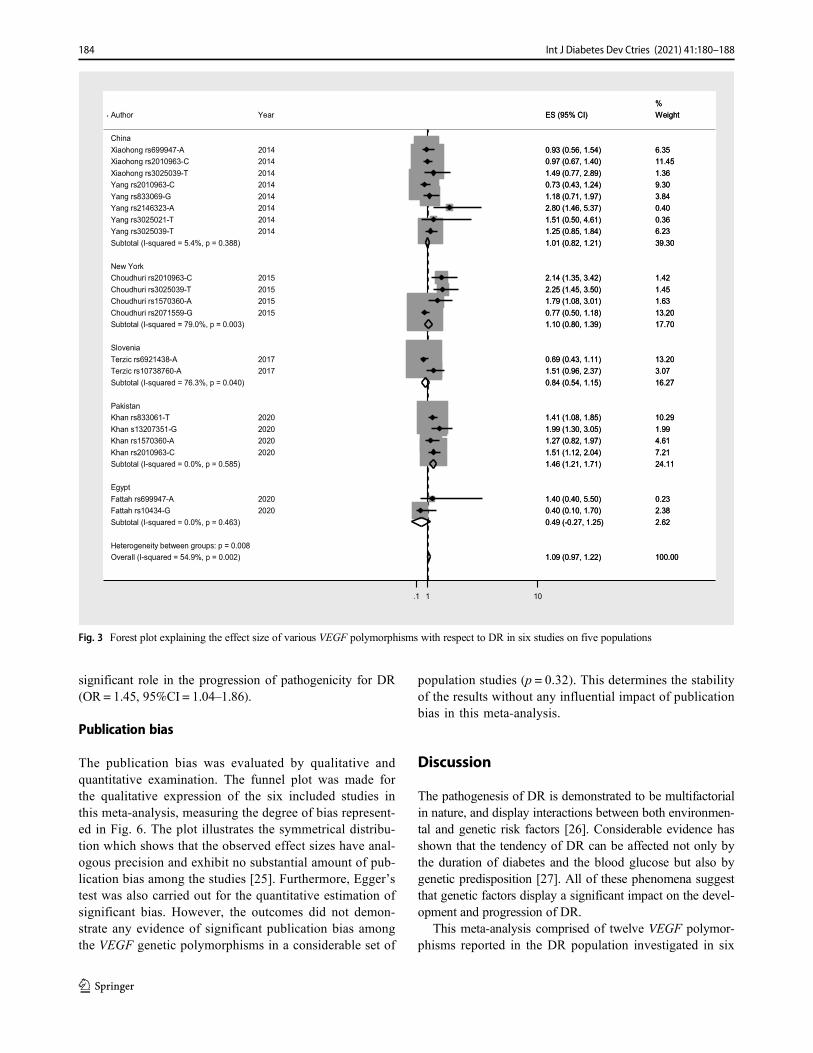
Pooled effect for the VEGF polymorphism (rs2010963-C) and DR risk
The forest plot for VEGF rs2010963 polymorphism wasassessed to estimate its pooled effect with DR represented inFig. 4. Gene promoter region polymorphism rs2010963 at the+ 405 position, mediating the displacement of base G to C, isconsidered of great importance and has been investigatedamong various population-based studies. In our set of consid-eration, we identified four independent studies exploring theassociation between this VEGF polymorphism and DR. Dueto a relative degree of heterogeneity, the random effect modelwas employed to measure the odds ratio and revealed no as-sociation between this polymorphism and its impact on thedevelopment of altered VEGF expression with DR (OR =1.08, 95%CI = 086–1.31).
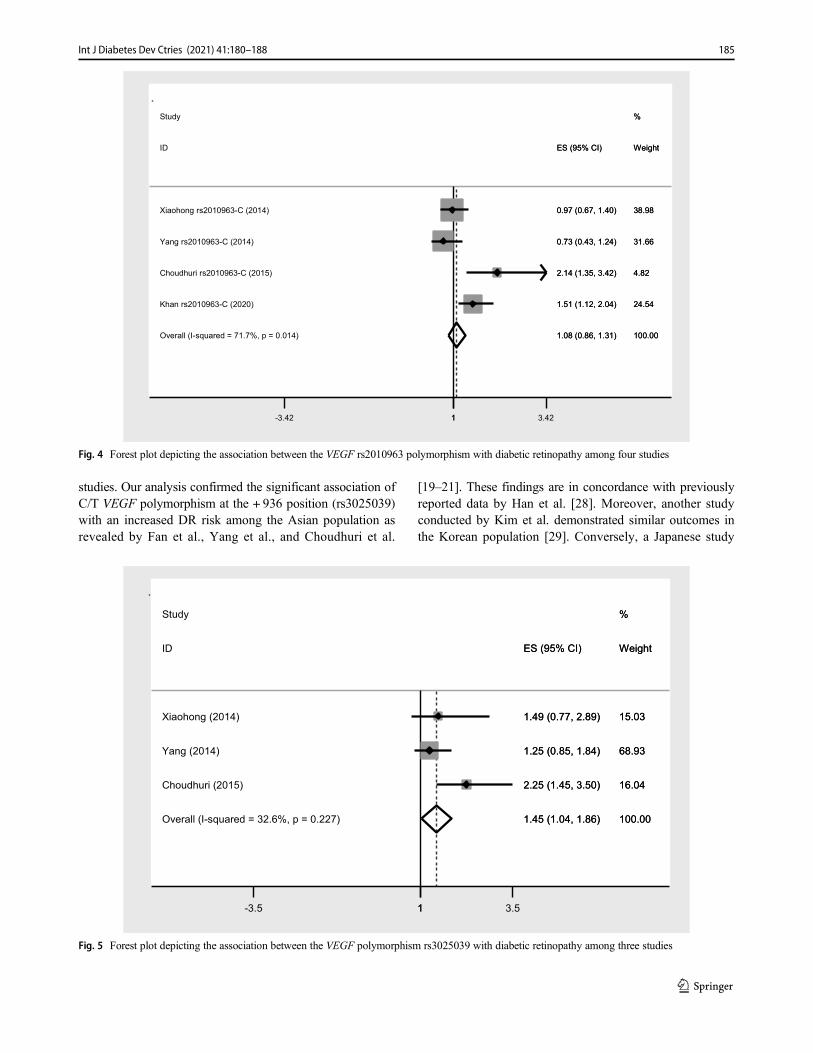
Pooled effect for the VEGF polymorphism (rs3025039-T) and DR risk
The association of the VEGF rs3025039 polymorphism withDR using the pooled effect evaluation is characterized inFig. 5. This polymorphism at + 936 position of VEGF pro-moter region has been repeatedly assessed among three dif-ferent populations. The significant level of heterogeneity wasabsent between the studies (p = 0.227). The statistical analysisusing the fixed effect model showed that the risk allele (T) ofthis polymorphism rs3025039 demonstrated to develop a
Table 1 Basic data of selectedstudies with VEGF genotyping inDR subjects
SN Authors Year Country Sample size Genotyping method
1. Fan [19] 2014 China N = 1040 Sequenom MassARRAY Technology
2. Yang [20] 2014 China N = 500 Sequenom MassARRAY Technology
3. Choudhuri [21] 2015 India N = 372 Taqman SNP Genotyping Assay
4. Fattah [22] 2016 Egypt N = 128 Reverse Transcriptase PCR
5. Terzic [23] 2017 Slovenia N = 1037 Taqman SNP Genotyping Assay
6. Khan [24] 2020 Pakistan N = 1126 Sanger Sequencing
183Int J Diabetes Dev Ctries (2021) 41:180–188
significant role in the progression of pathogenicity for DR(OR = 1.45, 95%CI = 1.04–1.86).
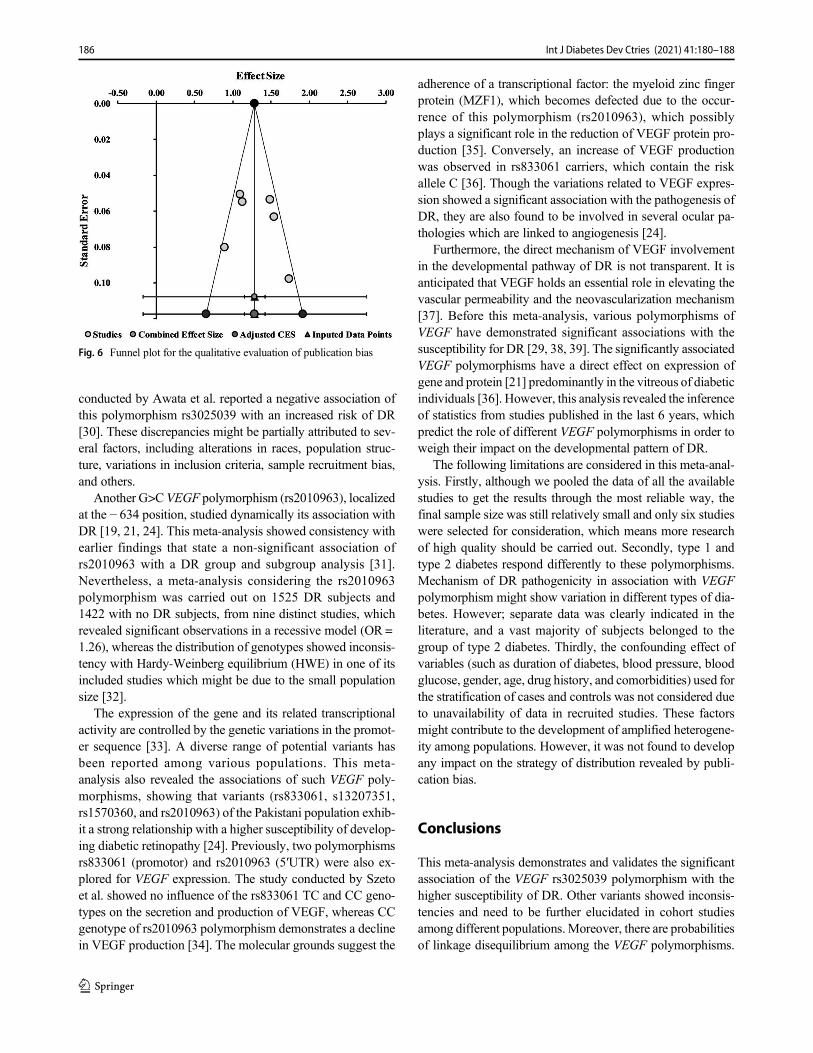
Publication bias
The publication bias was evaluated by qualitative andquantitative examination. The funnel plot was made forthe qualitative expression of the six included studies inthis meta-analysis, measuring the degree of bias represent-ed in Fig. 6. The plot illustrates the symmetrical distribu-tion which shows that the observed effect sizes have anal-ogous precision and exhibit no substantial amount of pub-lication bias among the studies [25]. Furthermore, Egger’stest was also carried out for the quantitative estimation ofsignificant bias. However, the outcomes did not demon-strate any evidence of significant publication bias amongthe VEGF genetic polymorphisms in a considerable set of
population studies (p = 0.32). This determines the stabilityof the results without any influential impact of publicationbias in this meta-analysis.
Discussion
The pathogenesis of DR is demonstrated to be multifactorialin nature, and display interactions between both environmen-tal and genetic risk factors [26]. Considerable evidence hasshown that the tendency of DR can be affected not only bythe duration of diabetes and the blood glucose but also bygenetic predisposition [27]. All of these phenomena suggestthat genetic factors display a significant impact on the devel-opment and progression of DR.
This meta-analysis comprised of twelve VEGF polymor-phisms reported in the DR population investigated in six
Heterogeneity between groups: p = 0.008Overall (I-squared = 54.9%, p = 0.002)
Choudhuri rs1570360-A
Author
Egypt
Yang rs833069-G
Choudhuri rs2010963-C
Fattah rs699947-A
Pakistan
Xiaohong rs699947-A
Subtotal (I-squared = 0.0%, p = 0.585)Khan rs2010963-C
Khan rs833061-T
Xiaohong rs2010963-C
Choudhuri rs2071559-G
Subtotal (I-squared = 76.3%, p = 0.040)
Terzic rs6921438-A
Xiaohong rs3025039-T
Yang rs3025021-T
Khan rs1570360-A
Subtotal (I-squared = 79.0%, p = 0.003)
Yang rs2010963-C
Choudhuri rs3025039-T
Yang rs3025039-T
Khan s13207351-G
Subtotal (I-squared = 5.4%, p = 0.388)
Slovenia
Yang rs2146323-A
Fattah rs10434-G
Terzic rs10738760-A
New York
Subtotal (I-squared = 0.0%, p = 0.463)
China
2015
Year
2014
2015
2020
2014
2020
2020
2014
2015
2017
2014
2014
2020
2014
2015
2014
2020
2014
2020
2017
1.09 (0.97, 1.22)
1.79 (1.08, 3.01)
ES (95% CI)
1.18 (0.71, 1.97)
2.14 (1.35, 3.42)
1.40 (0.40, 5.50)
0.93 (0.56, 1.54)
1.46 (1.21, 1.71)1.51 (1.12, 2.04)
1.41 (1.08, 1.85)
0.97 (0.67, 1.40)
0.77 (0.50, 1.18)
0.84 (0.54, 1.15)
0.69 (0.43, 1.11)
1.49 (0.77, 2.89)
1.51 (0.50, 4.61)
1.27 (0.82, 1.97)
1.10 (0.80, 1.39)
0.73 (0.43, 1.24)
2.25 (1.45, 3.50)
1.25 (0.85, 1.84)
1.99 (1.30, 3.05)
1.01 (0.82, 1.21)
2.80 (1.46, 5.37)
0.40 (0.10, 1.70)
1.51 (0.96, 2.37)
0.49 (-0.27, 1.25)
100.00
1.63
Weight
3.84
1.42
0.23
6.35
24.117.21
10.29
11.45
13.20
16.27
13.20
1.36
0.36
4.61
17.70
9.30
1.45
6.23
1.99
39.30
0.40
2.38
3.07
2.62
%
1.1 10
Fig. 3 Forest plot explaining the effect size of various VEGF polymorphisms with respect to DR in six studies on five populations
184 Int J Diabetes Dev Ctries (2021) 41:180–188
studies. Our analysis confirmed the significant association ofC/T VEGF polymorphism at the + 936 position (rs3025039)with an increased DR risk among the Asian population asrevealed by Fan et al., Yang et al., and Choudhuri et al.
[19–21]. These findings are in concordance with previouslyreported data by Han et al. [28]. Moreover, another studyconducted by Kim et al. demonstrated similar outcomes inthe Korean population [29]. Conversely, a Japanese study
Overall (I-squared = 71.7%, p = 0.014)
Choudhuri rs2010963-C (2015)
Xiaohong rs2010963-C (2014)
Study
Yang rs2010963-C (2014)
Khan rs2010963-C (2020)
ID
1.08 (0.86, 1.31)
2.14 (1.35, 3.42)
0.97 (0.67, 1.40)
0.73 (0.43, 1.24)
1.51 (1.12, 2.04)
ES (95% CI)
100.00
4.82
38.98
%
31.66
24.54
Weight
1.08 (0.86, 1.31)
2.14 (1.35, 3.42)
0.97 (0.67, 1.40)
0.73 (0.43, 1.24)
1.51 (1.12, 2.04)
ES (95% CI)
100.00
4.82
38.98
%
31.66
24.54
Weight
1-3.42 1 3.42
Fig. 4 Forest plot depicting the association between the VEGF rs2010963 polymorphism with diabetic retinopathy among four studies
Overall (I-squared = 32.6%, p = 0.227)
Yang (2014)
ID
Choudhuri (2015)
Xiaohong (2014)
Study
1.45 (1.04, 1.86)
1.25 (0.85, 1.84)
ES (95% CI)
2.25 (1.45, 3.50)
1.49 (0.77, 2.89)
100.00
68.93
Weight
16.04
15.03
%
1.45 (1.04, 1.86)
1.25 (0.85, 1.84)
ES (95% CI)
2.25 (1.45, 3.50)
1.49 (0.77, 2.89)
100.00
68.93
Weight
16.04
15.03
%
1-3.5 1 3.5
Fig. 5 Forest plot depicting the association between the VEGF polymorphism rs3025039 with diabetic retinopathy among three studies
185Int J Diabetes Dev Ctries (2021) 41:180–188
conducted by Awata et al. reported a negative association ofthis polymorphism rs3025039 with an increased risk of DR[30]. These discrepancies might be partially attributed to sev-eral factors, including alterations in races, population struc-ture, variations in inclusion criteria, sample recruitment bias,and others.
Another G>C VEGF polymorphism (rs2010963), localizedat the − 634 position, studied dynamically its association withDR [19, 21, 24]. This meta-analysis showed consistency withearlier findings that state a non-significant association ofrs2010963 with a DR group and subgroup analysis [31].Nevertheless, a meta-analysis considering the rs2010963polymorphism was carried out on 1525 DR subjects and1422 with no DR subjects, from nine distinct studies, whichrevealed significant observations in a recessive model (OR =1.26), whereas the distribution of genotypes showed inconsis-tency with Hardy-Weinberg equilibrium (HWE) in one of itsincluded studies which might be due to the small populationsize [32].
The expression of the gene and its related transcriptionalactivity are controlled by the genetic variations in the promot-er sequence [33]. A diverse range of potential variants hasbeen reported among various populations. This meta-analysis also revealed the associations of such VEGF poly-morphisms, showing that variants (rs833061, s13207351,rs1570360, and rs2010963) of the Pakistani population exhib-it a strong relationship with a higher susceptibility of develop-ing diabetic retinopathy [24]. Previously, two polymorphismsrs833061 (promotor) and rs2010963 (5′UTR) were also ex-plored for VEGF expression. The study conducted by Szetoet al. showed no influence of the rs833061 TC and CC geno-types on the secretion and production of VEGF, whereas CCgenotype of rs2010963 polymorphism demonstrates a declinein VEGF production [34]. The molecular grounds suggest the
adherence of a transcriptional factor: the myeloid zinc fingerprotein (MZF1), which becomes defected due to the occur-rence of this polymorphism (rs2010963), which possiblyplays a significant role in the reduction of VEGF protein pro-duction [35]. Conversely, an increase of VEGF productionwas observed in rs833061 carriers, which contain the riskallele C [36]. Though the variations related to VEGF expres-sion showed a significant association with the pathogenesis ofDR, they are also found to be involved in several ocular pa-thologies which are linked to angiogenesis [24].
Furthermore, the direct mechanism of VEGF involvementin the developmental pathway of DR is not transparent. It isanticipated that VEGF holds an essential role in elevating thevascular permeability and the neovascularization mechanism[37]. Before this meta-analysis, various polymorphisms ofVEGF have demonstrated significant associations with thesusceptibility for DR [29, 38, 39]. The significantly associatedVEGF polymorphisms have a direct effect on expression ofgene and protein [21] predominantly in the vitreous of diabeticindividuals [36]. However, this analysis revealed the inferenceof statistics from studies published in the last 6 years, whichpredict the role of different VEGF polymorphisms in order toweigh their impact on the developmental pattern of DR.
The following limitations are considered in this meta-anal-ysis. Firstly, although we pooled the data of all the availablestudies to get the results through the most reliable way, thefinal sample size was still relatively small and only six studieswere selected for consideration, which means more researchof high quality should be carried out. Secondly, type 1 andtype 2 diabetes respond differently to these polymorphisms.Mechanism of DR pathogenicity in association with VEGFpolymorphism might show variation in different types of dia-betes. However; separate data was clearly indicated in theliterature, and a vast majority of subjects belonged to thegroup of type 2 diabetes. Thirdly, the confounding effect ofvariables (such as duration of diabetes, blood pressure, bloodglucose, gender, age, drug history, and comorbidities) used forthe stratification of cases and controls was not considered dueto unavailability of data in recruited studies. These factorsmight contribute to the development of amplified heterogene-ity among populations. However, it was not found to developany impact on the strategy of distribution revealed by publi-cation bias.
Conclusions
This meta-analysis demonstrates and validates the significantassociation of the VEGF rs3025039 polymorphism with thehigher susceptibility of DR. Other variants showed inconsis-tencies and need to be further elucidated in cohort studiesamong different populations.Moreover, there are probabilitiesof linkage disequilibrium among the VEGF polymorphisms.
Fig. 6 Funnel plot for the qualitative evaluation of publication bias
186 Int J Diabetes Dev Ctries (2021) 41:180–188
Therefore, it should also be analyzed in association with near-by polymorphisms to reveal its potential implications.Correspondingly, a genome-wide association study (GWAS)should be established in future for the assessment of VEGFrole in the pathogenesis of DR in coordination with clinicalprofile to develop significant biomarkers.
Acknowledgment Dr. Muhammad Afzal is acknowledged for his guid-ance in statistical analysis.
Data and/or code availability Not applicable.
Compliance with ethical standards
Human and animal rights This article does not contain any studies withhuman or animal subjects performed by any of the authors.
Informed consent Not applicable
Ethical approval Not applicable
Conflict of interest The authors declare that they have no conflict ofinterest.
Consent to publish Not applicable
Consent to participate Not applicable
References
1. Thomas RL, Halim S, Gurudas S, Sivaprasad S, Owens DR. IDFDiabetes Atlas: a review of studies utilising retinal photography onthe global prevalence of diabetes related retinopathy between 2015and 2018. Diabetes Res Clin Pract. 2019;157:107840. https://doi.org/10.1016/j.diabres.2019.107840.
2. Gupta N, Mansoor S, Sharma A, Sapkal A, Sheth J, FalatoonzadehP, et al. Diabetic retinopathy and VEGF. Open Ophthalmol.2013;7:4–10. https://doi.org/10.2174/1874364101307010004.
3. Oshima Y, Sakaguchi H, Gomi F, Tano Y. Regression of iris neo-vascularization after intravitreal injection of bevacizumab in pa-tients with proliferative diabetic retinopathy. Am J Ophthalmol.2006;142:155–7. https://doi.org/10.1016/j.ajo.2006.02.015.
4. Lazcano-Gomez G, Soohoo JR, Lynch A, Bonell LN, Martinez K,Turati M, et al. Neovascular glaucoma: a retrospective review froma tertiary eye care center in Mexico. J Curr Glaucoma Pract.2017;11:48–51. https://doi.org/10.5005/jp-journals-10028-1222.
5. Simha A, Aziz K, Braganza A, Abraham L, Samuel P, LindsleyKB. Anti-vascular endothelial growth factor for neovascular glau-coma. Cochrane Database Syst Rev. 2020;8:CD007920. https://doi.org/10.1002/14651858.CD007920.pub2.
6. Díaz-Coránguez M, Lin CM, Liebner S, Antonetti DA. Norrin re-stores blood-retinal barrier properties after vascular endothelialgrowth factor–induced permeability. J Biol Chem. 2020;295:4647–60. https://doi.org/10.1074/jbc.RA119.011273.
7. Konopatskaya O, Churchill AJ, Harper SJ, Bates DO, Gardiner TA.VEGF165b, an endogenous C-terminal splice variant of VEGF,inhibits retinal neovascularization in mice. Mol Vis. 2006;12:626–32.
8. Gonzalez-Salinas R, Garcia-Gutierrez MC, Garcia-Aguirre G,Morales-Canton V, Velez-Montoya R, Soberon-Ventura VR,
et al. Evaluation of VEGF gene polymorphisms and proliferativediabetic retinopathy in Mexican population. Int J Ophthalmol.2017;10:135–9. https://doi.org/10.18240/ijo.2017.01.22.
9. Penn JS, Madan A, Caldwell RB, Bartoli M, Caldwell RW,Hartnett ME. Vascular endothelial growth factor in eye disease.Prog Retin Eye Res. 2008;27:331–71. https://doi.org/10.1016/j.preteyeres.2008.05.001.
10. Bolinger MT, Antonetti DA. Moving past anti-VEGF: novel ther-apies for treating diabetic retinopathy. Int J Mol Sci. 2016;17:1498.https://doi.org/10.3390/ijms17091498.
11. Ahuja S, Saxena S, Akduman L, Meyer CH, Kruzliak P, KhannaVK. Serum vascular endothelial growth factor is a biomolecularbiomarker of severity of diabetic retinopathy. Int J RetinaVitreous. 2019;5:1–6. https://doi.org/10.1186/s40942-019-0179-6.
12. Murakami T, Felinski EA, Antonetti DA. Occludin phosphoryla-tion and ubiquitination regulate tight junction trafficking and vas-cular endothelial growth factor-induced permeability. J Biol Chem.2009;284:21036–46. https://doi.org/10.1074/jbc.M109.016766.
13. Argaw AT, Gurfein BT, Zhang Y, Zameer A, John GR. VEGF-mediated disruption of endothelial CLN-5 promotes blood-brainbarrier breakdown. Proc Natl Acad Sci U S A. 2009;106:1977–82. https://doi.org/10.1073/pnas.0808698106.
14. Renner W, Kotschan S, Hoffmann C, Obermayer-Pietsch B, PilgerE. A common 936 C/Tmutation in the gene for vascular endothelialgrowth factor is associated with vascular endothelial growth factorplasma levels. J Vasc Res. 2000;37:443–8. https://doi.org/10.1159/000054076.
15. Szaflik JP, Wysocki T, Kowalski M, Majsterek I, Borucka AI,Blasiak J, et al. An association between vascular endothelial growthfactor gene promoter polymorphisms and diabetic retinopathy.Graefes Arch Clin Exp Ophthalmol. 2008;246:39–43. https://doi.org/10.1007/s00417-007-0674-6.
16. Buraczynska M, Ksiazek P, Baranowicz-Gaszczyk I, Jozwiak L.Association of the VEGF gene polymorphismwith diabetic retinop-athy in type 2 diabetes patients. Nephrol Dial Transplant. 2007;22:827–32. https://doi.org/10.1093/ndt/gfl641.
17. Kamal A, Eleinen KA, Siam I. Association of vascular endothelialgrowth factor-634G/C and receptor for advanced glycation endproducts G82S gene polymorphisms with diabetic retinopathy. IntJ Ophthalmol. 2016;9:1106–11. https://doi.org/10.18240/ijo.2016.08.04.
18. Moher D, Liberati A, Tetzlaff J, Altman DG, Group P. Preferredreporting items for systematic reviews and meta-analyses: thePRISMA statement. J Clin Epidemiol. 2009;62:1006–12. https://doi.org/10.1016/j.jclinepi.2009.06.005.
19. Fan X, Wu Q, Li Y, Hao Y, Ning N, Kang Z, et al. Association ofpolymorphisms in the vascular endothelial growth factor gene andits serum levels with diabetic retinopathy in Chinese patients withtype 2 diabetes: a cross-sectional study. Chin Med J. 2014;127:651–7. https://doi.org/10.3760/cma.j.issn.0366-6999.20132656.
20. Yang X, Deng Y, Gu H, Ren X, Li N, Lim A, et al. Candidate geneassociation study for diabetic retinopathy in Chinese patients withtype 2 diabetes. Mol Vis. 2014;20:200–14.
21. Choudhuri S, Chowdhury IH, Das S, Dutta D, Saha A, Sarkar R,et al. Role of NF-κB activation and VEGF gene polymorphisms inVEGF up regulation in non-proliferative and proliferative diabeticretinopathy. Mol Cell Biochem. 2015;405:265–79. https://doi.org/10.1007/s11010-015-2417-z.
22. Fattah RA, Eltanamly RM, Nabih MH, Kamal MM. Vascular en-dothelial growth factor gene polymorphism is not associated withdiabetic retinopathy in Egyptian patients. Middle East Afr JOphthalmol. 2016;23:75–8. https://doi.org/10.4103/0974-9233.171760.
23. Terzić R, Cilenšek I, Pleskovič RZ, Mankoč S, Milutinović A.Vascular endothelial growth factor (VEGF)-related single nucleo-tide polymorphisms rs10738760 and rs6921438 are not associated
187Int J Diabetes Dev Ctries (2021) 41:180–188
with diabetic retinopathy (DR) in Slovenian patients with type 2diabetes mellitus (T2DM). Bosn J Basic Med Sci. 2017;17:328–32.https://doi.org/10.17305/bjbms.2017.2068.
24. Khan N, Paterson AD, Roshandel D, Raza A, Ajmal M, WaheedNK, et al. Association of IGF1 and VEGFA polymorphisms withdiabetic retinopathy in Pakistani population. Acta Diabetol.2020;57:237–45. https://doi.org/10.1007/s00592-019-01407-5.
25. Suurmond R, van Rhee H, Hak T. Introduction, comparison, andvalidation of Meta-Essentials: a free and simple tool for meta-anal-ysis. Res Synth Methods. 2017;8:537–53. https://doi.org/10.1002/jrsm.1260.
26. Cao M, Tian Z, Zhang L, Liu R, Guan Q, Jiang J. Genetic associ-ation of AKR1B1 gene polymorphism rs759853 with diabetic ret-inopathy risk: a meta-analysis. Gene. 2018;676:73–8. https://doi.org/10.1016/j.gene.2018.07.014.
27. Tang ZH, Wang L, Zeng F, Zhang K. Human genetics of diabeticretinopathy. J Endocrinol Investig. 2014;37:1165–74. https://doi.org/10.1007/s40618-014-0172-8.
28. Han L, Zhang L, Xing W, Zhuo R, Lin X, Hao Y, et al. Theassociations between VEGF gene polymorphisms and diabetic ret-inopathy susceptibility: a meta-analysis of 11 case-control studies. JDiabetes Res. 2014;1:805801. https://doi.org/10.1155/2014/805801.
29. Kim HW, Ko GJ, Kang YS, Lee MH, Song HK, Kim HK, et al.Role of the VEGF 936 C/T polymorphism in diabetic microvascu-lar complications in type 2 diabetic patients. Nephrology. 2009;14:681–8. https://doi.org/10.1111/j.1440-1797.2009.01085.x.
30. Awata T, Inoue K, Kurihara S, Ohkubo T, Watanabe M, Inukai K,et al. A common polymorphism in the 5′-untranslated region of theVEGF gene is associated with diabetic retinopathy in type 2 diabe-tes. Diabetes. 2002;51:1635–9. https://doi.org/10.2337/diabetes.51.5.1635.
31. Zhao T, Zhao J. Association between the-634 C/G polymorphismsof the vascular endothelial growth factor and retinopathy in type 2diabetes: a meta-analysis. Diabetes Res Clin Pract. 2010;90:45–53.https://doi.org/10.1016/j.diabres.2010.05.029.
32. Qiu M, Xiong W, Liao H, Li F. VEGF− 634G> C polymorphismand diabetic retinopathy risk: a meta-analysis. Gene. 2013;518:310–5. https://doi.org/10.1016/j.gene.2013.01.018.
33. Watson CJ, Webb NJ, Bottomley MJ, Brenchley PE. Identificationof polymorphisms within the vascular endothelial growth factor(VEGF) gene: correlation with variation in VEGF protein produc-tion. Cytokine. 2000;12:1232–5. https://doi.org/10.1006/cyto.2000.0692.
34. Szeto CC, Chow KM, Poon P, Szeto CY, Wong TY, Li PK.Genetic polymorphism of VEGF: impact on longitudinal changeof peritoneal transport and survival of peritoneal dialysis patients.Kidney Int. 2004;65:1947–55. https://doi.org/10.1111/j.1523-1755.2004.00605.x.
35. Petrovič MG, Korošec P, Košnik M, Osredkar J, Hawlina M,Peterlin B, et al. Local and genetic determinants of vascular endo-thelial growth factor expression in advanced proliferative diabeticretinopathy. Mol Vis. 2008;14:1382–7.
36. Nakamura S, Iwasaki N, Funatsu H, Kitano S, Iwamoto Y. Impactof variants in the VEGF gene on progression of proliferative dia-betic retinopathy. Graefes Arch Clin Exp Ophthalmol. 2009;247:21–6. https://doi.org/10.1007/s00417-008-0915-3.
37. Ferrara N, Davis-Smyth T. The biology of vascular endothelialgrowth factor. Endocr Rev. 1997;18:4–25. https://doi.org/10.1210/edrv.18.1.0287.
38. Feghhi M, Nikzamir A, Esteghamati A, Mahmoudi T, YekaninejadMS. Relationship of vascular endothelial growth factor (VEGF)+405 G/C polymorphism and proliferative retinopathy in patientswith type 2 diabetes. Transl Res. 2011;158:85–91. https://doi.org/10.1016/j.trsl.2011.03.002.
39. Errera FI, Canani LH, Silva ME, Yeh E, Takahashi W, Santos KG,et al. Functional vascular endothelial growth factor− 634G> C SNPis associated with proliferative diabetic retinopathy: a case-controlstudy in a Brazilian population of European ancestry. DiabetesCare. 2007;30:275–9. https://doi.org/10.2337/dc06-1399.
Publisher’s note Springer Nature remains neutral with regard to jurisdic-tional claims in published maps and institutional affiliations.
188 Int J Diabetes Dev Ctries (2021) 41:180–188
REVIEW ARTICLE
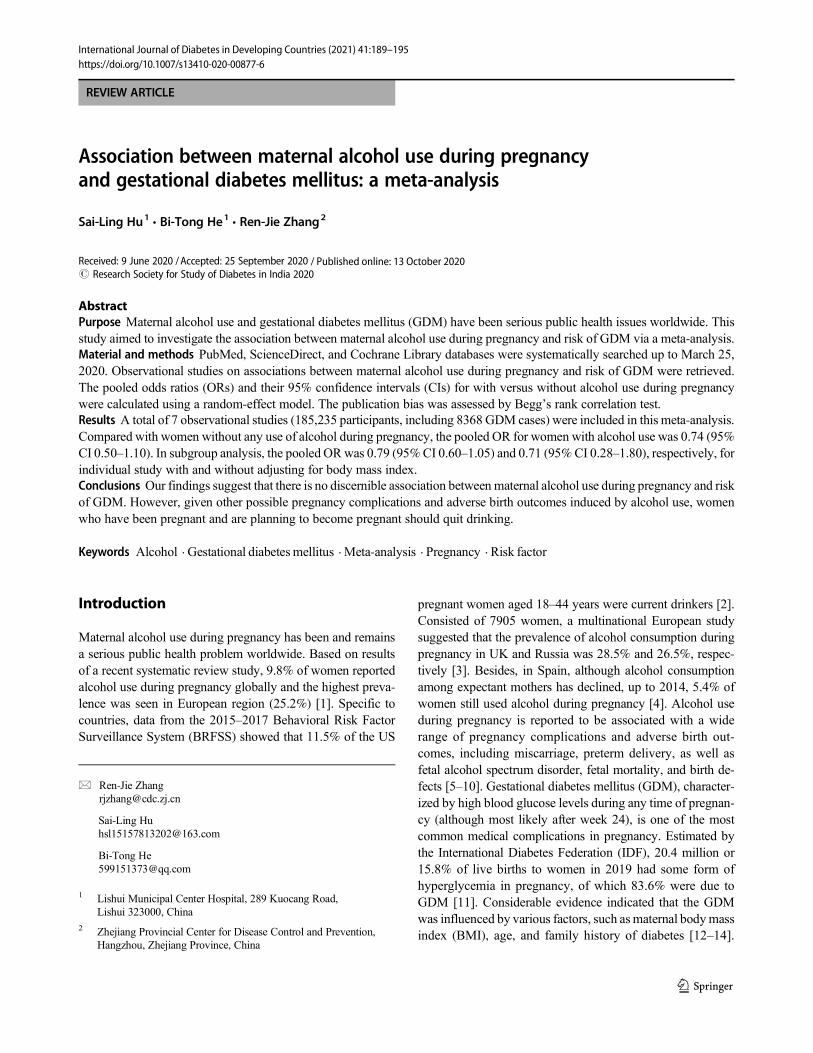
Association between maternal alcohol use during pregnancyand gestational diabetes mellitus: a meta-analysis
Sai-Ling Hu1& Bi-Tong He1 & Ren-Jie Zhang2
Received: 9 June 2020 /Accepted: 25 September 2020# Research Society for Study of Diabetes in India 2020
AbstractPurpose Maternal alcohol use and gestational diabetes mellitus (GDM) have been serious public health issues worldwide. Thisstudy aimed to investigate the association between maternal alcohol use during pregnancy and risk of GDM via a meta-analysis.Material and methods PubMed, ScienceDirect, and Cochrane Library databases were systematically searched up to March 25,2020. Observational studies on associations between maternal alcohol use during pregnancy and risk of GDM were retrieved.The pooled odds ratios (ORs) and their 95% confidence intervals (CIs) for with versus without alcohol use during pregnancywere calculated using a random-effect model. The publication bias was assessed by Begg’s rank correlation test.Results A total of 7 observational studies (185,235 participants, including 8368 GDM cases) were included in this meta-analysis.Compared with women without any use of alcohol during pregnancy, the pooled OR for women with alcohol use was 0.74 (95%CI 0.50–1.10). In subgroup analysis, the pooled ORwas 0.79 (95%CI 0.60–1.05) and 0.71 (95%CI 0.28–1.80), respectively, forindividual study with and without adjusting for body mass index.Conclusions Our findings suggest that there is no discernible association between maternal alcohol use during pregnancy and riskof GDM. However, given other possible pregnancy complications and adverse birth outcomes induced by alcohol use, womenwho have been pregnant and are planning to become pregnant should quit drinking.
Keywords Alcohol . Gestational diabetesmellitus . Meta-analysis . Pregnancy . Risk factor
Introduction
Maternal alcohol use during pregnancy has been and remainsa serious public health problem worldwide. Based on resultsof a recent systematic review study, 9.8% of women reportedalcohol use during pregnancy globally and the highest preva-lence was seen in European region (25.2%) [1]. Specific tocountries, data from the 2015–2017 Behavioral Risk FactorSurveillance System (BRFSS) showed that 11.5% of the US
pregnant women aged 18–44 years were current drinkers [2].Consisted of 7905 women, a multinational European studysuggested that the prevalence of alcohol consumption duringpregnancy in UK and Russia was 28.5% and 26.5%, respec-tively [3]. Besides, in Spain, although alcohol consumptionamong expectant mothers has declined, up to 2014, 5.4% ofwomen still used alcohol during pregnancy [4]. Alcohol useduring pregnancy is reported to be associated with a widerange of pregnancy complications and adverse birth out-comes, including miscarriage, preterm delivery, as well asfetal alcohol spectrum disorder, fetal mortality, and birth de-fects [5–10]. Gestational diabetes mellitus (GDM), character-ized by high blood glucose levels during any time of pregnan-cy (although most likely after week 24), is one of the mostcommon medical complications in pregnancy. Estimated bythe International Diabetes Federation (IDF), 20.4 million or15.8% of live births to women in 2019 had some form ofhyperglycemia in pregnancy, of which 83.6% were due toGDM [11]. Considerable evidence indicated that the GDMwas influenced by various factors, such asmaternal bodymassindex (BMI), age, and family history of diabetes [12–14].
* Ren-Jie [email protected]
Sai-Ling [email protected]
Bi-Tong [email protected]
1 Lishui Municipal Center Hospital, 289 Kuocang Road,Lishui 323000, China
2 Zhejiang Provincial Center for Disease Control and Prevention,Hangzhou, Zhejiang Province, China
https://doi.org/10.1007/s13410-020-00877-6
/ Published online: 13 October 2020
International Journal of Diabetes in Developing Countries (2021) 41:189–195
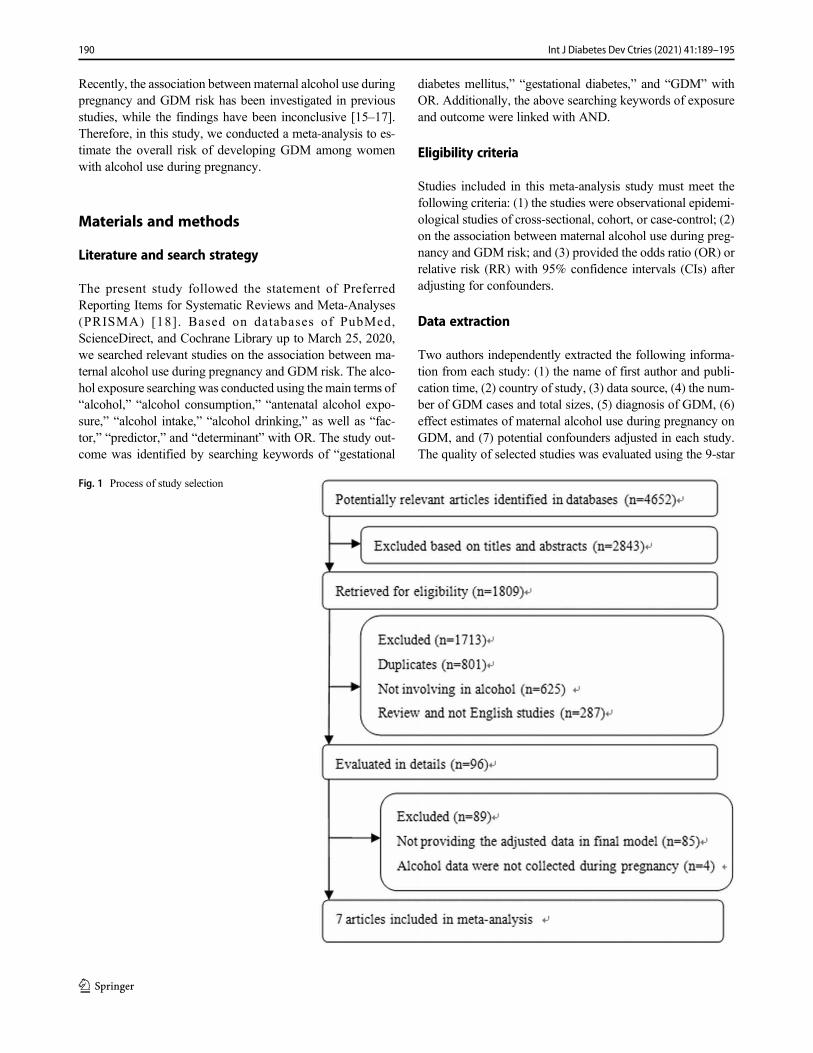
Recently, the association between maternal alcohol use duringpregnancy and GDM risk has been investigated in previousstudies, while the findings have been inconclusive [15–17].Therefore, in this study, we conducted a meta-analysis to es-timate the overall risk of developing GDM among womenwith alcohol use during pregnancy.
Materials and methods
Literature and search strategy
The present study followed the statement of PreferredReporting Items for Systematic Reviews and Meta-Analyses(PRISMA) [18]. Based on databases of PubMed,ScienceDirect, and Cochrane Library up to March 25, 2020,we searched relevant studies on the association between ma-ternal alcohol use during pregnancy and GDM risk. The alco-hol exposure searching was conducted using the main terms of“alcohol,” “alcohol consumption,” “antenatal alcohol expo-sure,” “alcohol intake,” “alcohol drinking,” as well as “fac-tor,” “predictor,” and “determinant” with OR. The study out-come was identified by searching keywords of “gestational
diabetes mellitus,” “gestational diabetes,” and “GDM” withOR. Additionally, the above searching keywords of exposureand outcome were linked with AND.
Eligibility criteria
Studies included in this meta-analysis study must meet thefollowing criteria: (1) the studies were observational epidemi-ological studies of cross-sectional, cohort, or case-control; (2)on the association between maternal alcohol use during preg-nancy and GDM risk; and (3) provided the odds ratio (OR) orrelative risk (RR) with 95% confidence intervals (CIs) afteradjusting for confounders.
Data extraction
Two authors independently extracted the following informa-tion from each study: (1) the name of first author and publi-cation time, (2) country of study, (3) data source, (4) the num-ber of GDM cases and total sizes, (5) diagnosis of GDM, (6)effect estimates of maternal alcohol use during pregnancy onGDM, and (7) potential confounders adjusted in each study.The quality of selected studies was evaluated using the 9-star
Fig. 1 Process of study selection
190 Int J Diabetes Dev Ctries (2021) 41:189–195
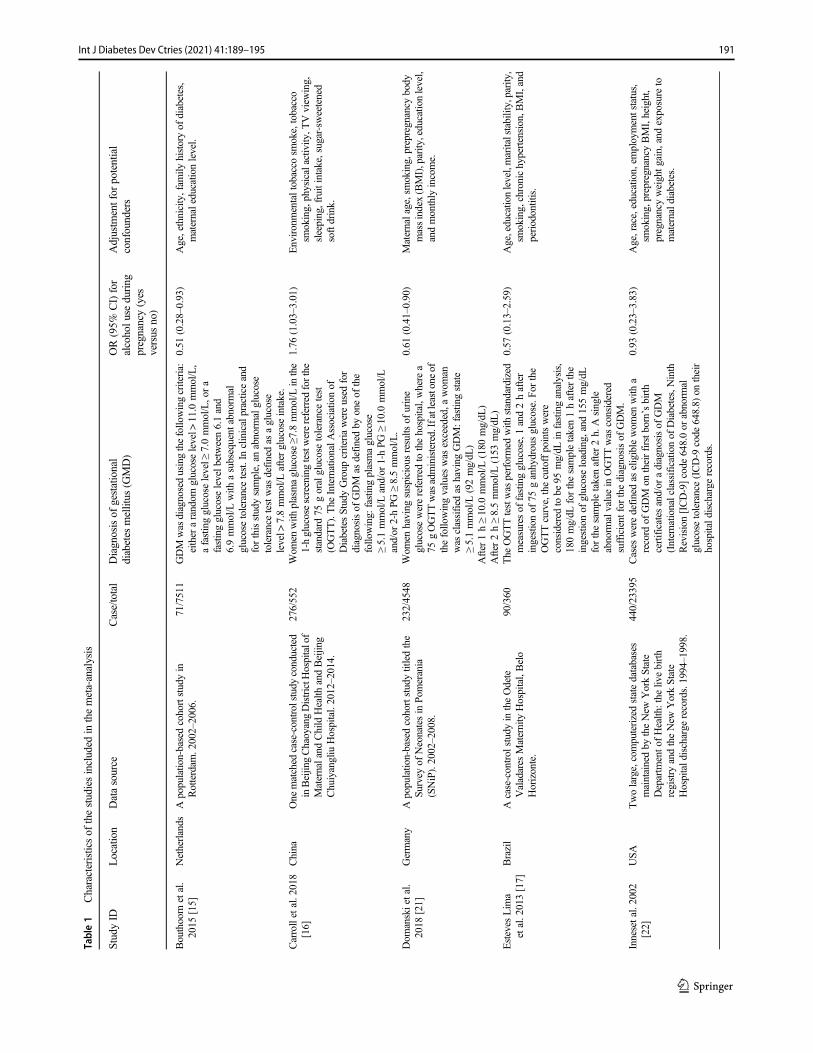
Table1
Characteristicsof
thestudiesincluded
inthemeta-analysis
StudyID
Location
Datasource
Case/total
Diagnosisof
gestational
diabetes
mellitus
(GMD)
OR(95%
CI)for
alcoholu
seduring
pregnancy(yes
versus
no)
Adjustm
entfor
potential
confounders
Bouthoorn
etal.
2015
[15]
Netherlands
Apopulation-basedcohortstudyin
Rotterdam
.2002–2006.
71/7511
GDM
was
diagnosedusingthefollo
wingcriteria:
either
arandom
glucoselevel>
11.0
mmol/L,
afastingglucoselevel≥
7.0mmol/L,ora
fastingglucoselevelb
etween6.1and
6.9mmol/L
with
asubsequent
abnorm
alglucosetolerancetest.Inclinicalpracticeand
forthisstudysample,an
abnorm
alglucose
tolerancetestwas
definedas
aglucose
level>
7.8mmol/L
afterglucoseintake.
0.51
(0.28–0.93)
Age,ethnicity,fam
ilyhistoryof
diabetes,
maternaleducatio
nlevel.
Carrolletal.2018
[16]
China
One
matched
case-controlstudyconducted
inBeijingChaoyangDistrictH
ospitalof
Maternaland
Child
Health
andBeijin
gChuiyangliu
Hospital.2012–2014.
276/552
Wom
enwith
plasmaglucose≥7
.8mmol/L
inthe
1-hglucosescreeningtestwerereferred
forthe
standard
75goralglucosetolerancetest
(OGTT).The
InternationalA
ssociatio
nof
DiabetesStudyGroup
criteriawereused
for
diagnosisof
GDM
asdefinedby
oneof
the
following:
fastingplasmaglucose
≥5.1mmol/L
and/or
1-hPG
≥10.0
mmol/L
and/or
2-hPG
≥8.5mmol/L.
1.76
(1.03–3.01)
Environmentaltobacco
smoke,tobacco
smoking,physicalactiv
ity,T
Vview
ing,
sleeping,fruitintake,sugar-sweetened
softdrink.
Dom
anskietal.
2018
[21]
Germany
Apopulation-basedcohortstudytitledthe
Survey
ofNeonatesin
Pomerania
(SNiP).2002–2008.
232/4548
Wom
enhaving
suspicious
results
ofurine
glucosewerereferred
tothehospital,where
a75
gOGTTwasadministered.Ifatleastone
ofthefollowingvalues
was
exceeded,a
wom
anwas
classified
ashaving
GDM:fastin
gstate
≥5.1mmol/L
(92mg/dL
)After
1h≥10.0
mmol/L
(180
mg/dL
)After
2h≥8.5mmol/L
(153
mg/dL
)
0.61
(0.41–0.90)
Maternalage,smoking,prepregnancy
body
massindex(BMI),parity
,educatio
nlevel,
andmonthly
income.
Esteves
Lim
aetal.2013[17]
Brazil
Acase-control
studyin
theOdete
Valadares
Maternity
Hospital,Belo
Horizonte.
90/360
The
OGTTtestwas
performed
with
standardized
measuresof
fastingglucose,1and2hafter
ingestionof
75ganhydrousglucose.Fo
rthe
OGTTcurve,thecutoffpointswere
considered
tobe
95mg/dL
infastinganalysis,
180mg/dL
forthesampletaken1hafterthe
ingestionof
glucoseloading,and155mg/dL
forthesampletakenafter2h.Asingle
abnorm
alvaluein
OGTTwas
considered
sufficient
forthediagnosisof
GDM.
0.57
(0.13–2.59)
Age,educationlevel,maritalstability,parity,
smoking,chronichypertension,B
MI,and
periodontitis.
Innesetal.2002
[22]
USA
Twolarge,computerizedstatedatabases
maintainedby
theNew
YorkState
Departm
ento
fHealth
:the
livebirth
registry
andtheNew
YorkState
Hospitald
ischarge
records.1994–1998.
440/23395
Cases
weredefinedas
eligiblewom
enwith
arecord
ofGDM
ontheirfirstb
orn’sbirth
certificates
and/or
adiagnosisof
GDM
(Internationalclassificationof
Diabetes,Ninth
Revision[ICD-9]code
648.0or
abnorm
alglucosetolerance(ICD-9
code
648.8)
ontheir
hospitald
ischarge
records.
0.93
(0.23–3.83)
Age,race,education,em
ploymentstatus,
smoking,prepregnancy
BMI,height,
pregnancyweightg
ain,andexposure
tomaternald
iabetes.
191Int J Diabetes Dev Ctries (2021) 41:189–195
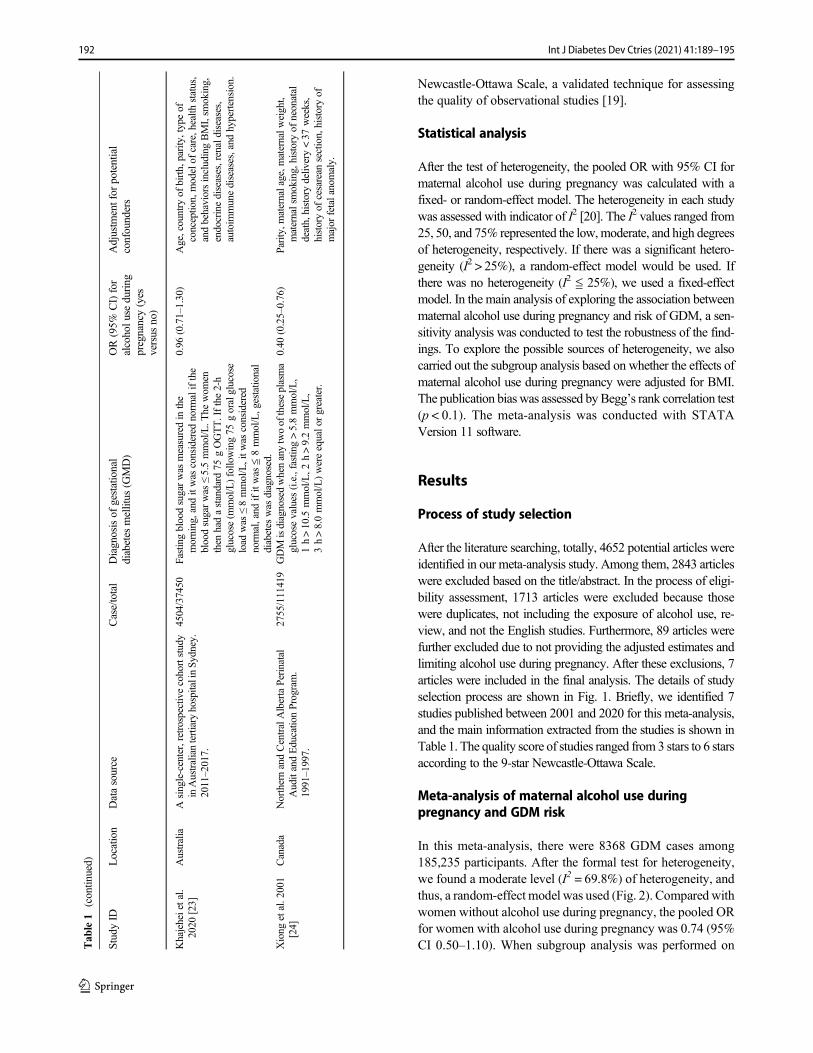
Newcastle-Ottawa Scale, a validated technique for assessingthe quality of observational studies [19].
Statistical analysis
After the test of heterogeneity, the pooled OR with 95% CI formaternal alcohol use during pregnancy was calculated with afixed- or random-effect model. The heterogeneity in each studywas assessed with indicator of I2 [20]. The I2 values ranged from25, 50, and 75% represented the low,moderate, and high degreesof heterogeneity, respectively. If there was a significant hetero-geneity (I2 > 25%), a random-effect model would be used. Ifthere was no heterogeneity (I2 ≦ 25%), we used a fixed-effectmodel. In the main analysis of exploring the association betweenmaternal alcohol use during pregnancy and risk of GDM, a sen-sitivity analysis was conducted to test the robustness of the find-ings. To explore the possible sources of heterogeneity, we alsocarried out the subgroup analysis based on whether the effects ofmaternal alcohol use during pregnancy were adjusted for BMI.The publication bias was assessed byBegg’s rank correlation test(p < 0.1). The meta-analysis was conducted with STATAVersion 11 software.
Results
Process of study selection
After the literature searching, totally, 4652 potential articles wereidentified in our meta-analysis study. Among them, 2843 articleswere excluded based on the title/abstract. In the process of eligi-bility assessment, 1713 articles were excluded because thosewere duplicates, not including the exposure of alcohol use, re-view, and not the English studies. Furthermore, 89 articles werefurther excluded due to not providing the adjusted estimates andlimiting alcohol use during pregnancy. After these exclusions, 7articles were included in the final analysis. The details of studyselection process are shown in Fig. 1. Briefly, we identified 7studies published between 2001 and 2020 for this meta-analysis,and the main information extracted from the studies is shown inTable 1. The quality score of studies ranged from 3 stars to 6 starsaccording to the 9-star Newcastle-Ottawa Scale.
Meta-analysis of maternal alcohol use duringpregnancy and GDM risk
In this meta-analysis, there were 8368 GDM cases among185,235 participants. After the formal test for heterogeneity,we found a moderate level (I2 = 69.8%) of heterogeneity, andthus, a random-effect model was used (Fig. 2). Compared withwomen without alcohol use during pregnancy, the pooled ORfor women with alcohol use during pregnancy was 0.74 (95%CI 0.50–1.10). When subgroup analysis was performed onT
able1
(contin
ued)
StudyID
Location
Datasource
Case/total
Diagnosisof
gestational
diabetes
mellitus
(GMD)
OR(95%
CI)for
alcoholu
seduring
pregnancy(yes
versus
no)
Adjustm
entfor
potential
confounders
Khajeheietal.
2020
[23]
Australia
Asingle-center,retrospectivecohortstudy
inAustraliantertiary
hospitalinSy
dney.
2011–2017.
4504/37450
Fastingbloodsugarwas
measuredin
the
morning,and
itwas
considered
norm
alifthe
bloodsugarwas
≤5.5mmol/L.T
hewom
enthen
hadastandard
75gOGTT.Ifthe2-h
glucose(m
mol/L)follo
wing75
goralglucose
load
was
≤8mmol/L,itw
asconsidered
norm
al,and
ifitwas
≦8mmol/L,gestatio
nal
diabetes
was
diagnosed.
0.96
(0.71–1.30)
Age,country
ofbirth,parity,typeof
conceptio
n,modelof
care,health
status,
andbehaviorsincludingBMI,sm
oking,
endocrinediseases,renaldiseases,
autoim
munediseases,and
hypertension.
Xiong
etal.2001
[24]
Canada
NorthernandCentralAlbertaPerinatal
AuditandEducationProgram.
1991–1997.
2755/111419
GDM
isdiagnosedwhenanytwoof
theseplasma
glucosevalues
(i.e.,fasting>5.8mmol/L,
1h>10.5
mmol/L,2
h>9.2mmol/L,
3h>8.0mmol/L)wereequalo
rgreater.
0.40
(0.25–0.76)
Parity,m
aternalage,m
aternalw
eight,
maternalsmoking,historyof
neonatal
death,historydelivery<37
weeks,
historyof
cesarean
section,historyof
major
fetalanomaly.
192 Int J Diabetes Dev Ctries (2021) 41:189–195
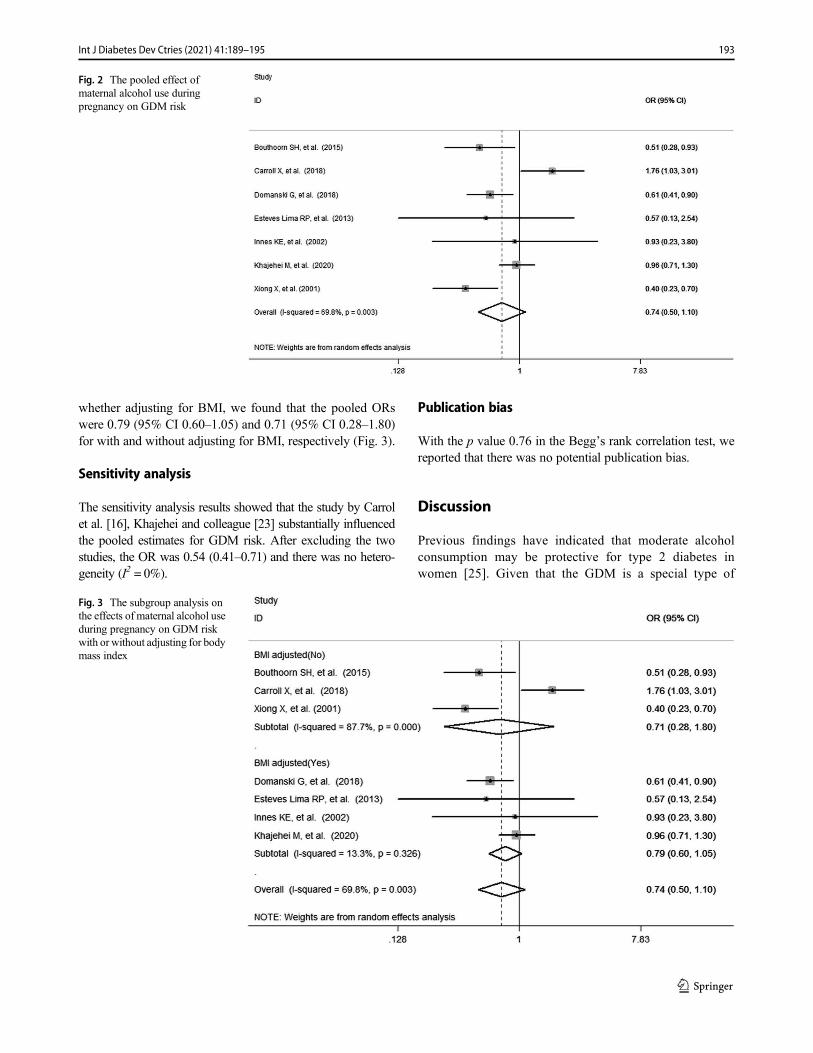
whether adjusting for BMI, we found that the pooled ORswere 0.79 (95% CI 0.60–1.05) and 0.71 (95% CI 0.28–1.80)for with and without adjusting for BMI, respectively (Fig. 3).
Sensitivity analysis
The sensitivity analysis results showed that the study by Carrolet al. [16], Khajehei and colleague [23] substantially influencedthe pooled estimates for GDM risk. After excluding the twostudies, the OR was 0.54 (0.41–0.71) and there was no hetero-geneity (I2 = 0%).
Publication bias
With the p value 0.76 in the Begg’s rank correlation test, wereported that there was no potential publication bias.
Discussion
Previous findings have indicated that moderate alcoholconsumption may be protective for type 2 diabetes inwomen [25]. Given that the GDM is a special type of
Fig. 3 The subgroup analysis onthe effects of maternal alcohol useduring pregnancy on GDM riskwith or without adjusting for bodymass index
Fig. 2 The pooled effect ofmaternal alcohol use duringpregnancy on GDM risk
193Int J Diabetes Dev Ctries (2021) 41:189–195
diabetes for women during pregnancy, it is essential toextend the knowledge to the association of maternalalcohol use during pregnancy with the GDM risk.With a meta-analysis method, this current studyattempted to pool estimates from observational studiesto explore the possible effects of maternal alcohol useduring pregnancy on the risk of developing GDM.Overall, our result showed that maternal alcohol useduring pregnancy was not significantly associated withthe risk of GDM (OR 0.74, 95% CI 0.50–1.10), evenafter adjusting for the potential confounders. This find-ing was in line with the pooled estimate in a meta-analysis exploring the risk factors of GDM, whichshowed a decreased but non-significant effect of drink-ing alcohol on GDM risk (OR 0.79, 95% CI 0.54–1.14)with no heterogeneity among Asian women [26].However, it is worth noting that the timing of maternalalcohol drinking in this study was not specifically clas-sified into before or during the pregnancy, which woulddecrease the reliability of findings. Considering the dif-ference in study design, sample, size, and GDM diag-nosis, we also conducted a sensitivity analysis. Afterexcluding the two studies included, a lower and signif-icant pooled estimate for GDM was seen in the meta-analysis (OR 0.54, 95% CI 0.41–0.71) without any het-erogeneity. However, due to the small number of stud-ies (only five), the updated result in the sensitivity anal-ysis could not support the protective effect of maternalalcohol use during pregnancy on GDM risk. BMI hasbeen reported to be the strongest risk factor for GDM inprevious study [12]. To explore the possible mediatingeffects of BMI on the association between maternal al-cohol use during pregnancy and GDM risk, we per-formed the subgroup analysis. Based on the results,we found a much higher effect estimate in subgroupof adjusting for BMI with low heterogeneity, whichindicated that the study association of maternal alcoholuse during pregnancy with GDM might be mediated byBMI and the mediating effects of other GDM-relatedfactors should be considered in future studies.
Our meta-analysis study had some limitations. First, there wasmoderate-to-high heterogeneity between studies in themain anal-ysis and subgroup analysis by adjusting for BMI, suggesting thatother confounding factors for variation still existed. Second, asthe included studies only provided estimated effects on GDMwith yes versus no alcohol use, the condition of former drinkerswith possible sick-quitter effect [27] was not considered in thismeta-analysis. Third, with limited number of studies included inour analysis, the observed association between maternal alcoholuse during pregnancy and GDM risk in the present study shouldbe interpreted with cautions.
In conclusion, findings from this study indicated that ma-ternal alcohol use during pregnancy was not significantly
associated with GDM risk. However, given other possiblepregnancy complications and adverse birth outcomes inducedby alcohol use, we call for those women who have been preg-nant and are planning to become pregnant should quitdrinking.
Author contributions All authors contributed to the study conception anddesign. Material preparation, data collection, and analysis were per-formed by Sai-Ling Hu, Bi-Tong He, and Ren-Jie Zhang. The first draftof themanuscript was written by Sai-Ling Hu, and all authors commentedon previous versions of the manuscript. All authors read and approved thefinal manuscript.
Funding The study was supported by grant (2019315797) fromMedicine and Health Care in Zhejiang Province Science andTechnology Project and grant (2019KY055) from Zhejiang medical andhealth technology project.
Data availability The data used for the analysis are available upon therequest for corresponding author.
Compliance with ethical standards
Conflict of interest The authors declare that they have no conflict ofinterest.
Ethics approval Not available.
Consent to participate Not available.
Consent for publication Not available.
Code availability Analysis was conducted using STATA Version 11software, and the code is available upon the request for correspondingauthor.
References
1. Popova S, Lange S, Probst C, Gmel G, Rehm J. Estimation ofnational, regional, and global prevalence of alcohol use duringpregnancy and fetal alcohol syndrome: a systematic review andmeta-analysis. Lancet Glob Health. 2017;5:e290–9. https://doi.org/10.1016/S2214-109X(17)30021-9.
2. Denny CH, Acero CS, Naimi TS, et al. Consumption of alcoholbeverages and binge drinking among pregnant women aged 18–44years—United States, 2015–2017. MMWR Morb Mortal WklyRep. 2019;68:365–8. https://doi.org/10.15585/mmwr.mm6816a1.
3. Mårdby AC, Lupattelli A, Hensing G, Nordeng H. Consumption ofalcohol during pregnancy—a multinational European study.Women Birth. 2017;30:e207–13. https://doi.org/10.1016/j.wombi.2017.01.003.
4. Romero-Rodríguez E, Cuevas L, Simón L, ECEMC PeripheralGroup, Bermejo-Sánchez E, Galán I. Changes in alcohol intakeduring pregnancy in Spain, 1980 to 2014. Alcohol Clin Exp Res.2019;43:2367–73. https://doi.org/10.1111/acer.14193.
5. Ikehara S, Kimura T, Kakigano A, Sato T, Iso H, the JapanEnvironment Children’s Study Group, et al. Association betweenmaternal alcohol consumption during pregnancy and risk of pre-term delivery: the Japan Environment and Children’s Study. BJOG.2019;126:1448–54. https://doi.org/10.1111/1471-0528.15899.
194 Int J Diabetes Dev Ctries (2021) 41:189–195
6. Lange S, Probst C, Gmel G, Rehm J, Burd L, Popova S. Globalprevalence of fetal alcohol spectrum disorder among children andyouth: a systematic review and meta-analysis. JAMA Pediatr.2017;171:948–56. https://doi.org/10.1001/jamapediatrics.2017.1919.
7. Sundermann AC, Zhao S, Young CL, Lam LA, Jones SH, VelezEdwards DR, et al. Alcohol use in pregnancy and miscarriage: asystematic review and meta-analysis. Alcohol Clin Exp Res.2019;43:1606–16. https://doi.org/10.1111/acer.14124.
8. Nykjaer C, Alwan NA, Greenwood DC, Simpson NAB, HayAWM, White KLM, et al. Maternal alcohol intake prior to andduring pregnancy and risk of adverse birth outcomes: evidencefrom a British cohort. J Epidemiol Commun Health. 2014;68:542–9. https://doi.org/10.1136/jech-2013-202934.
9. Andersen AM, Andersen PK, Olsen J, et al. Moderate alcohol in-take during pregnancy and risk of fetal death. Int J Epidemiol.2012;41:405–13. https://doi.org/10.1093/ije/dyr189.
10. Damm P, Houshmand-Oeregaard A, Kelstrup L, Lauenborg J,Mathiesen ER, Clausen TD. Gestational diabetes mellitus andlong-term consequences for mother and offspring: a view fromDenmark. Diabetologia. 2016;59:1396–9. https://doi.org/10.1007/s00125-016-3985-5.
11. International Diabetes Federation. IDF Diabetes atlas-9th edition2019. Available at https://diabetesatlas.org/en/sections/worldwide-toll-of-diabetes.html (Accessed April 1, 2020).
12. Giannakou K, Evangelou E, Yiallouros P, Christophi CA,Middleton N, Papatheodorou E, et al. Risk factors for gestationaldiabetes: an umbrella review of meta-analyses of observationalstudies. PLoS One. 2019;14:e0215372. https://doi.org/10.1371/journal.pone.0215372.
13. Moosazadeh M, Asemi Z, Lankarani KB, et al. Family history ofdiabetes and the risk of gestational diabetes mellitus in Iran: a sys-tematic review and meta-analysis. Diabetes Metab Syndr. 2017;Suppl 1: S99-S104. DOI: https://doi.org/10.1016/j.dsx.2016.12.016.
14. Anna V, van der Ploeg HP, Cheung NW, Huxley RR, Bauman AE.Sociodemographic correlates of the increasing trend in prevalenceof gestational diabetes mellitus in a large population of womenbetween 1995 and 2005. Diabetes Care. 2008;31:2288–93. https://doi.org/10.2337/dc08-1038.
15. Bouthoorn SH, Silva LM, Murray SE, Steegers EAP, JaddoeVWV, Moll H, et al. Low-educated women have an increased riskof gestational diabetes mellitus: the Generation R Study. ActaDiabetol. 2015;52:445–52. https://doi.org/10.1007/s00592-014-0668-x.
16. Carroll X, Liang X, Zhang W, Zhang W, Liu G, Turner N, et al.Socioeconomic, environmental and lifestyle factors associated withgestational diabetes mellitus: a matched case-control study inBeijing, China. Sci Rep. 2018;8:8103. https://doi.org/10.1038/s41598-018-26412-6.
17. Esteves Lima RP, Miranda Cota LO, Costa FO. Association be-tween periodontitis and gestational diabetes mellitus: a case-control study. J Periodontol. 2013;84:1257–65. https://doi.org/10.1902/jop.2012.120350.
18. Moher D, Liberati A, Tetzlaff J, Altman DG, The PRISMA Group.Preferred reporting items for systematic reviews and meta-analyses:the PRISMA statement. PLoS Med. 2009;6:e1000097. https://doi.org/10.1371/journal.pmed.1000097.
19. Wells GA, Shea B, O’Connell D, et al. The Newcastle-OttawaScale (NOS) for assessing the quality of nonrandomised studies inmeta-analyses. Available from: http:// www.ohri.ca/programs/clinical_epidemiology/oxford.htm. (accessed April 1, 2020). 3rdSymposium on Systematic Reviews: Beyond the Basics, Oxford,United Kingdom, 3–5 July, 2000.
20. Higgins JPT, Thompson SG, Deeks JJ. Measuring inconsistency inmeta-analyses. BMJ. 2003;327:557–60. https://doi.org/10.1136/bmj.327.7414.557.
21. Domanski G, Lange AE, Ittermann T, Allenberg H, Spoo RA,Zygmunt M, et al. Evaluation of neonatal and maternal morbidityin mothers with gestational diabetes: a population-based study.BMC Pregnancy Childbirth. 2018;18:367. https://doi.org/10.1186/s12884-018-2005-9.
22. Innes KE, Byers TE, Marshall JA, et al. Association of a woman’sown birth weight with subsequent risk for gestational diabetes.JAMA. 2002;287:2534–41. https://doi.org/10.1001/jama.287.19.2534.
23. Khajehei M, Assareh H. Temporal trend of diabetes in pregnantwomen and its association with birth outcomes, 2011 to 2017. JDiabetes Complicat. 2020;34:107550. https://doi.org/10.1016/j.jdiacomp.2020.107550.
24. Xiong X, Saunders LD, Wang FL, Demianczuk NN. Gestationaldiabetes mellitus: prevalence, risk factors, maternal and infant out-comes. Int J Gynaecol Obstet. 2001;75:221–8. https://doi.org/10.1016/s0020-7292(01)00496-9.
25. Baliunas DO, Taylor BJ, Irving H, RoereckeM, Patra J, MohapatraS, et al. Alcohol as a risk factor for type 2 diabetes: a systematicreview andmeta-analysis. Diabetes Care. 2009;32:2123–32. https://doi.org/10.2337/dc09-0227.
26. Lee KW, Ching SM, Ramachandran V, Yee A, Hoo FK, Chia YC,et al. Prevalence and risk factors of gestational diabetes mellitus inAsia: a systematic review and meta-analysis. BMC PregnancyChildbirth. 2018;18:494. https://doi.org/10.1186/s12884-018-2131-4.
27. Shaper AG, Wannamethee G, Walker M. Alcohol and mortality inBritish men: explaining the U-shaped curve. Lancet. 1988;2:1267–73. https://doi.org/10.1016/s0140-6736(88)92890-5.
Publisher’s note Springer Nature remains neutral with regard to jurisdic-tional claims in published maps and institutional affiliations.
195Int J Diabetes Dev Ctries (2021) 41:189–195
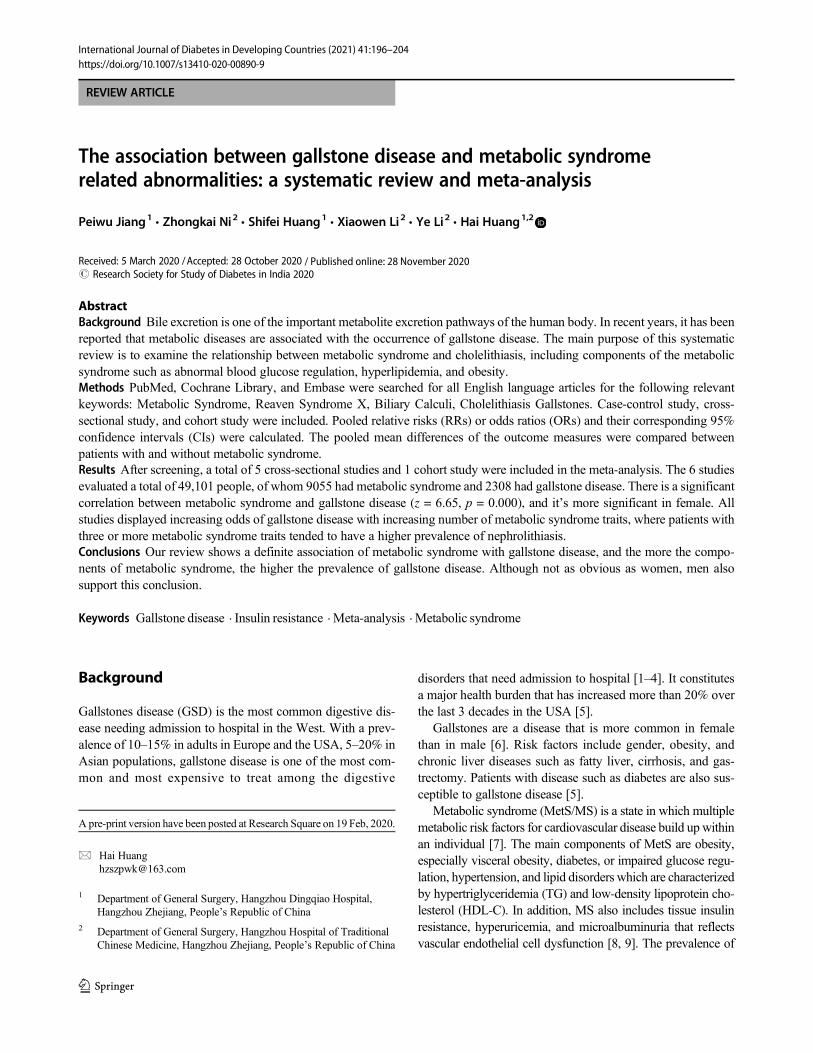
REVIEW ARTICLE
The association between gallstone disease and metabolic syndromerelated abnormalities: a systematic review and meta-analysis
Peiwu Jiang1& Zhongkai Ni2 & Shifei Huang1
& Xiaowen Li2 & Ye Li2 & Hai Huang1,2
Received: 5 March 2020 /Accepted: 28 October 2020# Research Society for Study of Diabetes in India 2020
AbstractBackground Bile excretion is one of the important metabolite excretion pathways of the human body. In recent years, it has beenreported that metabolic diseases are associated with the occurrence of gallstone disease. The main purpose of this systematicreview is to examine the relationship between metabolic syndrome and cholelithiasis, including components of the metabolicsyndrome such as abnormal blood glucose regulation, hyperlipidemia, and obesity.Methods PubMed, Cochrane Library, and Embase were searched for all English language articles for the following relevantkeywords: Metabolic Syndrome, Reaven Syndrome X, Biliary Calculi, Cholelithiasis Gallstones. Case-control study, cross-sectional study, and cohort study were included. Pooled relative risks (RRs) or odds ratios (ORs) and their corresponding 95%confidence intervals (CIs) were calculated. The pooled mean differences of the outcome measures were compared betweenpatients with and without metabolic syndrome.Results After screening, a total of 5 cross-sectional studies and 1 cohort study were included in the meta-analysis. The 6 studiesevaluated a total of 49,101 people, of whom 9055 had metabolic syndrome and 2308 had gallstone disease. There is a significantcorrelation between metabolic syndrome and gallstone disease (z = 6.65, p = 0.000), and it’s more significant in female. Allstudies displayed increasing odds of gallstone disease with increasing number of metabolic syndrome traits, where patients withthree or more metabolic syndrome traits tended to have a higher prevalence of nephrolithiasis.Conclusions Our review shows a definite association of metabolic syndrome with gallstone disease, and the more the compo-nents of metabolic syndrome, the higher the prevalence of gallstone disease. Although not as obvious as women, men alsosupport this conclusion.
Keywords Gallstone disease . Insulin resistance .Meta-analysis . Metabolic syndrome
Background
Gallstones disease (GSD) is the most common digestive dis-ease needing admission to hospital in the West. With a prev-alence of 10–15% in adults in Europe and the USA, 5–20% inAsian populations, gallstone disease is one of the most com-mon and most expensive to treat among the digestive
disorders that need admission to hospital [1–4]. It constitutesa major health burden that has increased more than 20% overthe last 3 decades in the USA [5].
Gallstones are a disease that is more common in femalethan in male [6]. Risk factors include gender, obesity, andchronic liver diseases such as fatty liver, cirrhosis, and gas-trectomy. Patients with disease such as diabetes are also sus-ceptible to gallstone disease [5].
Metabolic syndrome (MetS/MS) is a state in which multiplemetabolic risk factors for cardiovascular disease build up withinan individual [7]. The main components of MetS are obesity,especially visceral obesity, diabetes, or impaired glucose regu-lation, hypertension, and lipid disorders which are characterizedby hypertriglyceridemia (TG) and low-density lipoprotein cho-lesterol (HDL-C). In addition, MS also includes tissue insulinresistance, hyperuricemia, and microalbuminuria that reflectsvascular endothelial cell dysfunction [8, 9]. The prevalence of
A pre-print version have been posted at Research Square on 19 Feb, 2020.
* Hai [email protected]
1 Department of General Surgery, Hangzhou Dingqiao Hospital,Hangzhou Zhejiang, People’s Republic of China
2 Department of General Surgery, Hangzhou Hospital of TraditionalChinese Medicine, Hangzhou Zhejiang, People’s Republic of China
https://doi.org/10.1007/s13410-020-00890-9
/ Published online: 28 November 2020
International Journal of Diabetes in Developing Countries (2021) 41:196–204
metabolic syndrome has increased dramatically worldwide [7,10, 11]. Studies about the association between gallstone diseaseand MetS suggested that MetS is a risk factor for gallstonedisease [12]. Most of the key components for the diagnosis ofMetS are also key risk factors of GSD [8]. As a whole, meta-bolic syndrome is also associated with cholelithiasis; the pur-pose of this meta-analysis was to examine the association ofMS and gallstones integrated and independent by component.
Methods
Search strategy and selection criteria
This systematic review and meta-analysis was performed in ac-cordance with MOOSE guidelines [13]. The major medical da-tabases in the English language, among which were Cochrane,Embase, and PubMed, were searched independently by two au-thors (ZN and XL) up to September 15, 2019, using the follow-ing keywords in combination with both medical subject headingterms and text words: “Metabolic Syndrome X,” “Metabolicsyndrome,” “Insulin Resistance Syndrome X,” “ReavenSyndrome X,” “Cholecystolithiasis,” “Cholelithiasis,”“Choledocholithiasis,” “Biliary Calculi,” and “Gallstones”.
Gray trials were excluded in this study. But this may in-crease the publication bias, because the included studies werenot complete and comprehensive and published trials had anoverall greater intervention effect than gray trials. On the otherhand, unpublished studies may be of lower methodologicalquality than published studies [14].
Study selection and data extraction
Two reviewers (ZN and XL) independently screened all thetitles and abstracts in an effort to minimize selection bias, anda third reviewer was consulted for resolution of disagreement.The following information was extracted from all the litera-tures: research design type, region, number of patients includ-ed, diagnostic methods of cholelithiasis, diagnostic criteria ofmetabolic syndrome, BMI (Body Mass Index), age, and prev-alence of metabolic syndrome and its components such aswaist circumference, blood pressure (systolic pressure, dia-stolic pressure), fasting blood glucose, LDL-C, TG (triglycer-ide), and other blood biochemical indicators in cholelithiasisgroup and control group. For continuous data (such as age,blood pressure, fasting blood glucose), mean ± SD andthe number of people in the group were extracted re-spectively. For count data (such as hypertension anddiabetes mellitus), the corresponding number of peoplein the two groups and the total number of people in thegroup were extracted respectively.
Studies were included if the following criteria were met: (1)retrospective or prospective cohort study, cross-sectional
study, case-control study. (2) The experimental group metthe diagnostic criteria for MetS. (3) The diagnosis of choleli-thiasis was confirmed by imaging evidence or surgical evi-dence. (4) The control group was included in the study andodds ratios (ORs) in case-control studies or relative risks (RR)in cohort studies were reported with the 95% confidence in-tervals (CIs) (or, if 95% CIs were not reported, the reporteddata were sufficient to calculate them). Studies were excludedif (1) literature was not the above research type, or the unpub-lished. (2) The study did not set up a control, or the number ofcases less than 10; patients with long-term use of drugs provedto be conducive to stone formation or stone discharge. (3) Thepatients in the study had organic lesions, liver dysfunction orviral hepatitis in the hepatobiliary system. (4) Only the latestresearch involving more cases included in the similar study ofthe same authors.
Quality assessment
The Newcastle-Ottawa scale was used to assess the quality ofthe included studies [15]. Briefly, the instrument contains 8items categorized into 3 dimensions: the selection of the studygroups; the comparability of the groups; and the ascertainmentof either the exposure or outcome of interest for case-controlor cohort studies respectively. An 8-point scoring system isused for a semiquantitative assessment of study quality; scoreof 5–8 were classified as qualified studies [16]. Cross-sectional studies use the quality evaluation criteria recom-mended by AHRQ (Agency for Healthcare Research andQuality) which includes eleven items. Article quality wasassessed as follows: low quality = 0–3; moderate quality =4–7; high quality = 8–11 [17].
Outcome measures and data analysis
The primary outcome was the interrelation between theperiod/point prevalence of cholelithiasis with metabolic syn-drome patients and that in non-metabolic syndrome patients,and the prevalence of cholelithiasis in different sexes, the re-lationship between the components of metabolic syndromeand the prevalence of cholelithiasis, and the relationship ofnumber of components of metabolic syndrome and cholelithi-asis. The effect measures of interest were odds ratios for case-control studies and cross-sectional studies, relative risks forcohort studies, and the corresponding 95% confidence inter-vals are given.
The heterogeneity of the study was evaluated by I2 statis-tics. The I2 > 50% was taken to indicate high levels of hetero-geneity and the random effect analysis model is used.Otherwise, the fixed effect model will be used. Subgroupanalysis was performed to explore potential heterogeneity. Ap value < 0.05 was considered statistically significant, and95% confidence intervals (CIs) are given. Publication bias
197Int J Diabetes Dev Ctries (2021) 41:196–204
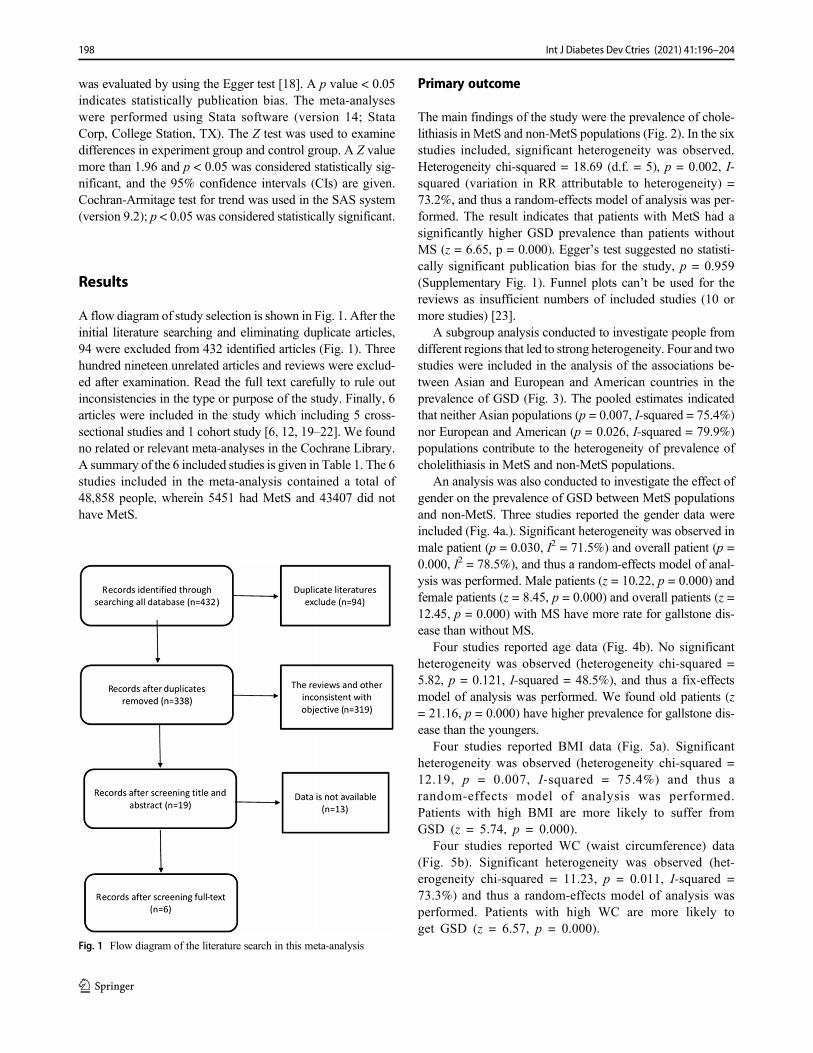
was evaluated by using the Egger test [18]. A p value < 0.05indicates statistically publication bias. The meta-analyseswere performed using Stata software (version 14; StataCorp, College Station, TX). The Z test was used to examinedifferences in experiment group and control group. A Z valuemore than 1.96 and p < 0.05 was considered statistically sig-nificant, and the 95% confidence intervals (CIs) are given.Cochran-Armitage test for trend was used in the SAS system(version 9.2); p < 0.05 was considered statistically significant.
Results
A flow diagram of study selection is shown in Fig. 1. After theinitial literature searching and eliminating duplicate articles,94 were excluded from 432 identified articles (Fig. 1). Threehundred nineteen unrelated articles and reviews were exclud-ed after examination. Read the full text carefully to rule outinconsistencies in the type or purpose of the study. Finally, 6articles were included in the study which including 5 cross-sectional studies and 1 cohort study [6, 12, 19–22]. We foundno related or relevant meta-analyses in the Cochrane Library.A summary of the 6 included studies is given in Table 1. The 6studies included in the meta-analysis contained a total of48,858 people, wherein 5451 had MetS and 43407 did nothave MetS.
Primary outcome
The main findings of the study were the prevalence of chole-lithiasis in MetS and non-MetS populations (Fig. 2). In the sixstudies included, significant heterogeneity was observed.Heterogeneity chi-squared = 18.69 (d.f. = 5), p = 0.002, I-squared (variation in RR attributable to heterogeneity) =73.2%, and thus a random-effects model of analysis was per-formed. The result indicates that patients with MetS had asignificantly higher GSD prevalence than patients withoutMS (z = 6.65, p = 0.000). Egger’s test suggested no statisti-cally significant publication bias for the study, p = 0.959(Supplementary Fig. 1). Funnel plots can’t be used for thereviews as insufficient numbers of included studies (10 ormore studies) [23].
A subgroup analysis conducted to investigate people fromdifferent regions that led to strong heterogeneity. Four and twostudies were included in the analysis of the associations be-tween Asian and European and American countries in theprevalence of GSD (Fig. 3). The pooled estimates indicatedthat neither Asian populations (p = 0.007, I-squared = 75.4%)nor European and American (p = 0.026, I-squared = 79.9%)populations contribute to the heterogeneity of prevalence ofcholelithiasis in MetS and non-MetS populations.
An analysis was also conducted to investigate the effect ofgender on the prevalence of GSD between MetS populationsand non-MetS. Three studies reported the gender data wereincluded (Fig. 4a.). Significant heterogeneity was observed inmale patient (p = 0.030, I2 = 71.5%) and overall patient (p =0.000, I2 = 78.5%), and thus a random-effects model of anal-ysis was performed. Male patients (z = 10.22, p = 0.000) andfemale patients (z = 8.45, p = 0.000) and overall patients (z =12.45, p = 0.000) with MS have more rate for gallstone dis-ease than without MS.
Four studies reported age data (Fig. 4b). No significantheterogeneity was observed (heterogeneity chi-squared =5.82, p = 0.121, I-squared = 48.5%), and thus a fix-effectsmodel of analysis was performed. We found old patients (z= 21.16, p = 0.000) have higher prevalence for gallstone dis-ease than the youngers.
Four studies reported BMI data (Fig. 5a). Significantheterogeneity was observed (heterogeneity chi-squared =12.19, p = 0.007, I-squared = 75.4%) and thus arandom-effects model of analysis was performed.Patients with high BMI are more likely to suffer fromGSD (z = 5.74, p = 0.000).
Four studies reported WC (waist circumference) data(Fig. 5b). Significant heterogeneity was observed (het-erogeneity chi-squared = 11.23, p = 0.011, I-squared =73.3%) and thus a random-effects model of analysis wasperformed. Patients with high WC are more likely toget GSD (z = 6.57, p = 0.000).
Fig. 1 Flow diagram of the literature search in this meta-analysis
198 Int J Diabetes Dev Ctries (2021) 41:196–204
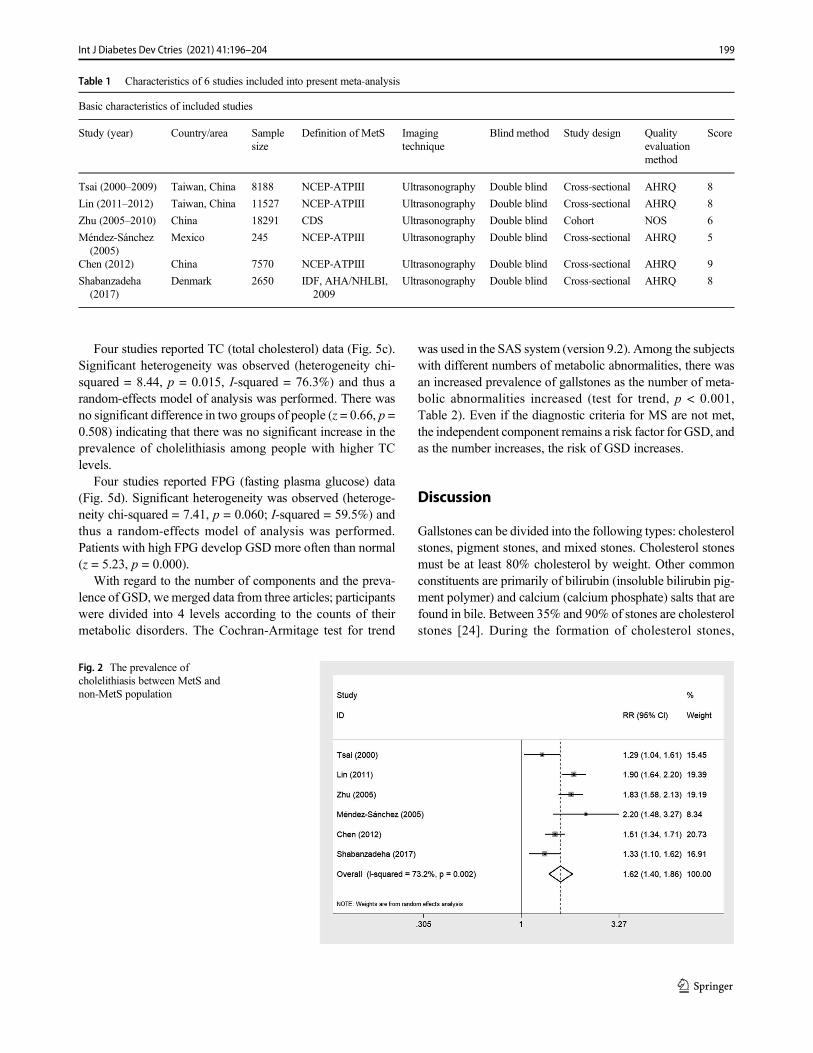
Four studies reported TC (total cholesterol) data (Fig. 5c).Significant heterogeneity was observed (heterogeneity chi-squared = 8.44, p = 0.015, I-squared = 76.3%) and thus arandom-effects model of analysis was performed. There wasno significant difference in two groups of people (z = 0.66, p =0.508) indicating that there was no significant increase in theprevalence of cholelithiasis among people with higher TClevels.
Four studies reported FPG (fasting plasma glucose) data(Fig. 5d). Significant heterogeneity was observed (heteroge-neity chi-squared = 7.41, p = 0.060; I-squared = 59.5%) andthus a random-effects model of analysis was performed.Patients with high FPG develop GSD more often than normal(z = 5.23, p = 0.000).
With regard to the number of components and the preva-lence of GSD, we merged data from three articles; participantswere divided into 4 levels according to the counts of theirmetabolic disorders. The Cochran-Armitage test for trend
was used in the SAS system (version 9.2). Among the subjectswith different numbers of metabolic abnormalities, there wasan increased prevalence of gallstones as the number of meta-bolic abnormalities increased (test for trend, p < 0.001,Table 2). Even if the diagnostic criteria for MS are not met,the independent component remains a risk factor for GSD, andas the number increases, the risk of GSD increases.
Discussion
Gallstones can be divided into the following types: cholesterolstones, pigment stones, and mixed stones. Cholesterol stonesmust be at least 80% cholesterol by weight. Other commonconstituents are primarily of bilirubin (insoluble bilirubin pig-ment polymer) and calcium (calcium phosphate) salts that arefound in bile. Between 35% and 90% of stones are cholesterolstones [24]. During the formation of cholesterol stones,
Fig. 2 The prevalence ofcholelithiasis between MetS andnon-MetS population
Table 1 Characteristics of 6 studies included into present meta-analysis
Basic characteristics of included studies
Study (year) Country/area Samplesize
Definition of MetS Imagingtechnique
Blind method Study design Qualityevaluationmethod
Score
Tsai (2000–2009) Taiwan, China 8188 NCEP-ATPIII Ultrasonography Double blind Cross-sectional AHRQ 8
Lin (2011–2012) Taiwan, China 11527 NCEP-ATPIII Ultrasonography Double blind Cross-sectional AHRQ 8
Zhu (2005–2010) China 18291 CDS Ultrasonography Double blind Cohort NOS 6
Méndez-Sánchez(2005)
Mexico 245 NCEP-ATPIII Ultrasonography Double blind Cross-sectional AHRQ 5
Chen (2012) China 7570 NCEP-ATPIII Ultrasonography Double blind Cross-sectional AHRQ 9
Shabanzadeha(2017)
Denmark 2650 IDF, AHA/NHLBI,2009
Ultrasonography Double blind Cross-sectional AHRQ 8
199Int J Diabetes Dev Ctries (2021) 41:196–204
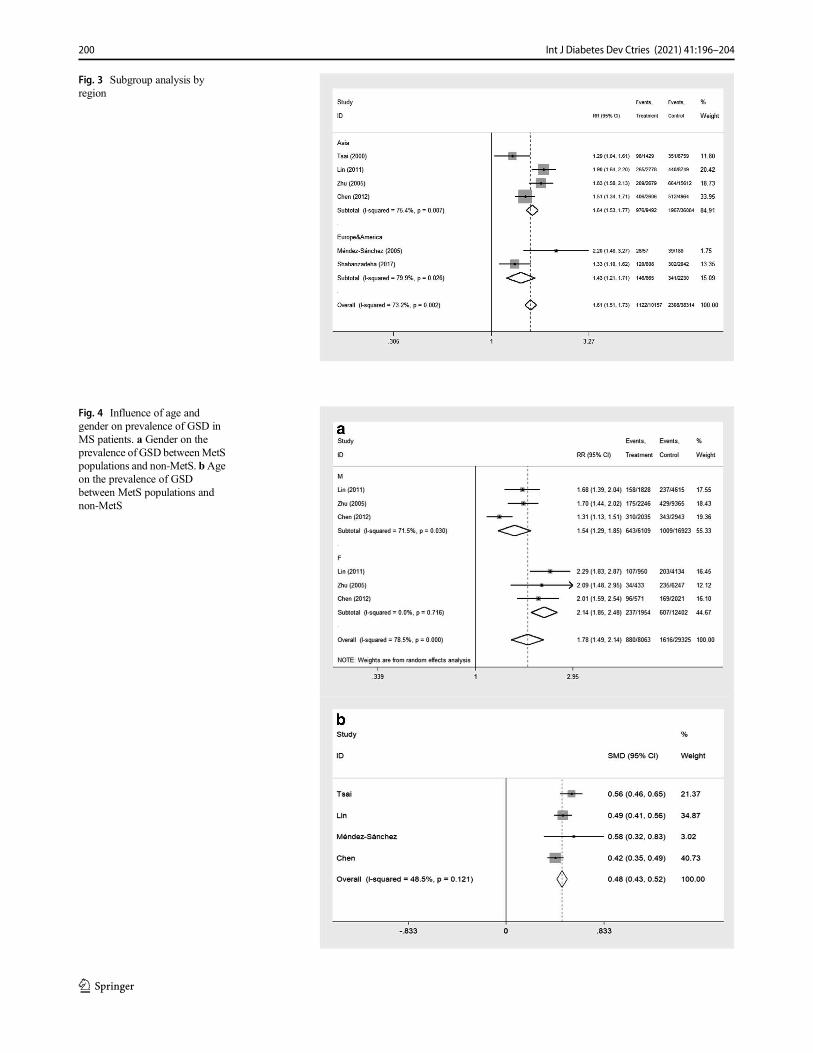
Fig. 4 Influence of age andgender on prevalence of GSD inMS patients. a Gender on theprevalence of GSD betweenMetSpopulations and non-MetS. bAgeon the prevalence of GSDbetween MetS populations andnon-MetS
Fig. 3 Subgroup analysis byregion
200 Int J Diabetes Dev Ctries (2021) 41:196–204
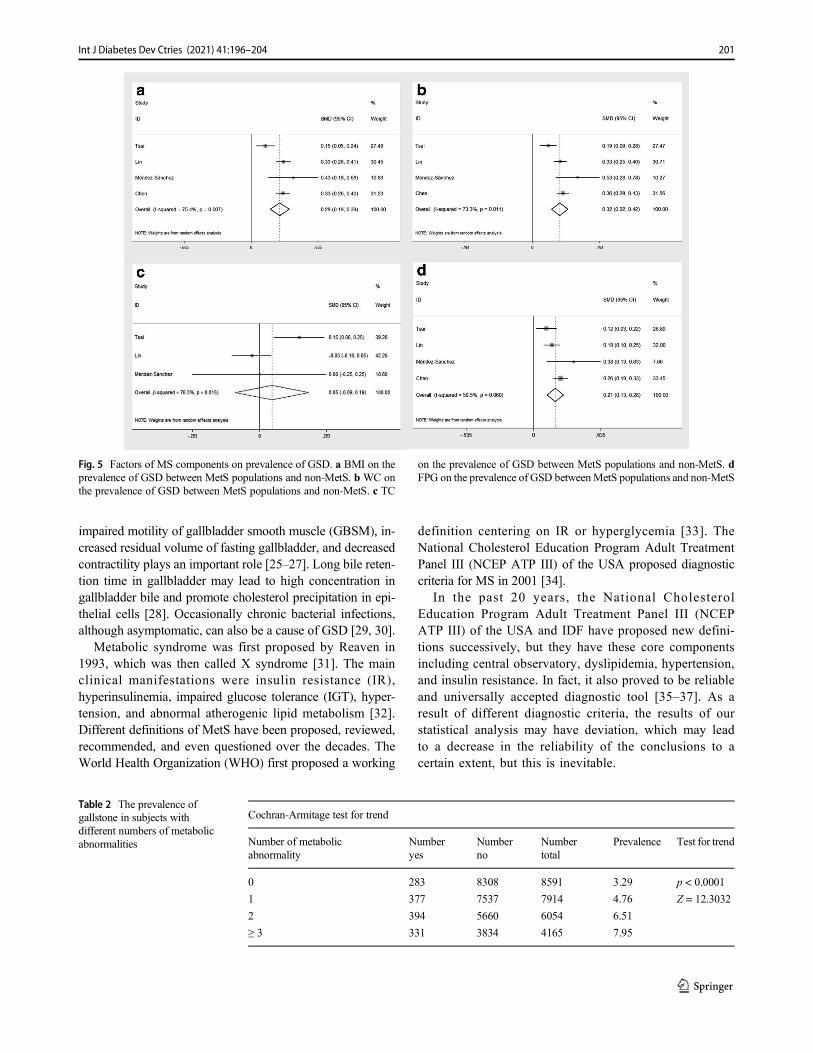
impaired motility of gallbladder smooth muscle (GBSM), in-creased residual volume of fasting gallbladder, and decreasedcontractility plays an important role [25–27]. Long bile reten-tion time in gallbladder may lead to high concentration ingallbladder bile and promote cholesterol precipitation in epi-thelial cells [28]. Occasionally chronic bacterial infections,although asymptomatic, can also be a cause of GSD [29, 30].
Metabolic syndrome was first proposed by Reaven in1993, which was then called X syndrome [31]. The mainclinical manifestations were insulin resistance (IR),hyperinsulinemia, impaired glucose tolerance (IGT), hyper-tension, and abnormal atherogenic lipid metabolism [32].Different definitions of MetS have been proposed, reviewed,recommended, and even questioned over the decades. TheWorld Health Organization (WHO) first proposed a working
definition centering on IR or hyperglycemia [33]. TheNational Cholesterol Education Program Adult TreatmentPanel III (NCEP ATP III) of the USA proposed diagnosticcriteria for MS in 2001 [34].
In the past 20 years, the National CholesterolEducation Program Adult Treatment Panel III (NCEPATP III) of the USA and IDF have proposed new defini-tions successively, but they have these core componentsincluding central observatory, dyslipidemia, hypertension,and insulin resistance. In fact, it also proved to be reliableand universally accepted diagnostic tool [35–37]. As aresult of different diagnostic criteria, the results of ourstatistical analysis may have deviation, which may leadto a decrease in the reliability of the conclusions to acertain extent, but this is inevitable.
Fig. 5 Factors of MS components on prevalence of GSD. a BMI on theprevalence of GSD between MetS populations and non-MetS. b WC onthe prevalence of GSD between MetS populations and non-MetS. c TC
on the prevalence of GSD between MetS populations and non-MetS. dFPG on the prevalence of GSD betweenMetS populations and non-MetS
Table 2 The prevalence ofgallstone in subjects withdifferent numbers of metabolicabnormalities
Cochran-Armitage test for trend
Number of metabolicabnormality
Numberyes
Numberno
Numbertotal
Prevalence Test for trend
0 283 8308 8591 3.29 p < 0.0001
1 377 7537 7914 4.76 Z = 12.3032
2 394 5660 6054 6.51
≥ 3 331 3834 4165 7.95
201Int J Diabetes Dev Ctries (2021) 41:196–204
This study aimed to evaluate the association of MS withcharacteristics of gallstone. There are great differences in bodyshape orWC among different ethnic groups, men, and womenwhere studied as one group, a fact that it could have intro-duced a bias in the final analysis, even if appropriate adjust-ments of data were performed in the final statistics. We in-cluded 5 cross-sectional studies in the literature, which meansthat these studied under normal living conditions in only onepoint in time; thus, the relationships found in the analysis havelimitations. And the exclusion of gray literature from themeta-analysis will exaggerate the positive results of themeta-analysis and lead to decision errors.
In spite of the limitations described above, conclusions canalso be drawn from these studies that the prevalence of gall-stones in MetS patients is increased compared with patientswithout MetS. A subgroup analysis by sex analysis showedthat both men and women had an increased prevalence.Analysis of various factors including MS components, theprevalence of cholelithiasis increased in older patients.Obesity-related factors like high blood lipids TC, WC, BMI,fasting blood glucose were positively correlated with the prev-alence of cholelithiasis. Diabetes and hypertension are alsopositively correlated with the prevalence of cholelithiasis. Inmale subjects, metabolic syndrome was associated with pres-ence of gallstones, and the size of gallstones [38].
In recent years, insulin resistance is another hot topic amongmetabolic abnormalities associated with GSD. Not only inobese people but insulin resistance can also occur in peoplewith normal weight. A study in a Hispanic population foundthat GS was associated with insulin resistance, fatty liver, andmetabolic syndrome. Insulin resistance is a risk factor for GS[39]. Insulin resistance may play an important role in the path-ogenesis of GS favoring the production of cholesterol supersat-urated bile and altering gallbladder function [39]. Nakeeb et al.[40] demonstrated that insulin resistance alone may be respon-sible for gallbladder dysmotility, which may result inacalculous cholecystitis or gallstone formation.
Even evidence supports the contention that insulin resis-tance not only directly induces gallbladder inflammation in-crease mucus production and alter gallbladder function butcould also favor the secretion by the liver of cholesterol su-persaturated bile [41]. The latter seems more accepted patho-genic link. GS increases cholesterol saturation in gallbladderbile, a phenomenon related to increases of body cholesterolsynthesis and hypersecretion of biliary cholesterol as observedin obesity [30]. Adiponectin acted as a critical element in thedevelopment of insulin resistance; the lower the rate of obesi-ty, weight, and BMI, the higher the concentration ofadiponectin and that this information would be helpful forthe treatment of diabetes [42].
The definition presented by the IDF that emphasizes ab-dominal obesity as a sine qua non diagnostic factor [43]. Infact, it has been confirmed that some indicators such as larger
waist circumference, higher BMI, and hyperlipidemia areobese manifestations. Recent data from animal and humanstudies have shown that the gallbladder of obese people isenlarged and their response to neurotransmitters is usuallyreduced. A high-fat diet can lead to abnormal emptying ofthe gallbladder. In addition, obese and high carbohydrate diethad increased gallbladder tissue levels of tumor necrosis fac-tor-alpha, interleukin-6, and interleukin-1 beta. These changeslead to decreased smooth muscle function and diminishedgallbladder absorption [44].
The function of bile components secretory also increased inGS patients. In a study from Chile, increased bile synthesiswas found in GS patients [45]. Hepatic bile acid and bodycholesterol were significantly increased by 50% in patientswith cholelithiasis, hepatic hypersecretion of cholesterol, andsupersaturated bile which give life to precipitating cholesterolcrystals that accumulate and grow in a sluggish gallbladder.
Although there is no parallel relationship with blood lipidslevel, increased lipid components excretion through bile di-rectly promote the formation of cholesterol stones. Total cho-lesterol, direct bilirubin, and especially lean body weightmight provide simple stratification tools for obese women,outlining a high-risk profile for developing gallstones [46].
In the next step of the study, the number of included liter-ature should be increased as much as possible, especially thegray literature, to reduce publication bias, and subgroup anal-ysis of each component, thereby reducing heterogeneity, and,more importantly, investigating the priority or order of Metsand GSD in cross-sectional studies.
Conclusions
Despite there may be some heterogeneity due to different di-agnostic criteria of metabolic syndrome or some other errors,the result trend shows that metabolic syndrome is closely re-lated to cholelithiasis. Even some researchers propose that GDis another member of the metabolic syndrome [43]. Theseresults also suggest that the metabolic syndrome can even beregarded as another indication for prophylactic surgery in pa-tients with GSD.
Supplementary Information The online version contains supplementarymaterial available at https://doi.org/10.1007/s13410-020-00890-9.
Authors’ contributions PJ and HH conceived and designed the study. ZNand XL performed the experiments. PJ and SH wrote the paper. PJ, ZN,XL, YL, and HH reviewed and edited the manuscript. All authors readand approved the manuscript.
Funding This study was funded by the Zhejiang Medical and HealthScience and Technology (grant number 2021KY927) and ZhejiangTraditional Chinese Medicine Administration (CN) (grant number2021ZB208).
202 Int J Diabetes Dev Ctries (2021) 41:196–204
Data availability Not applicable
Compliance with ethical standards
Conflict of interest The authors declare that they have no conflict ofinterest.
Code availability Not applicable
References
1. Portincasa P, Moschetta A, Palasciano G. Cholesterol gallstonedisease. Lancet. 2006;368(9531):230.
2. Everhart JE, Khare M, Hill M, Maurer KR. Prevalence and ethnicdifferences in gallbladder disease in the United States.Gastroenterology. 1999;117(3):632–9.
3. Sandler RS, Everhart JE, Donowitz M, Adams E, Cronin K,Goodman C, et al. The burden of selected digestive diseases inthe United States☆☆☆. Gastroenterology. 2002;122(5):1500–11.
4. Shaffer EA. Epidemiology of gallbladder stone disease. Best PractRes Clin Gastroenterol. 2006;20(6):981–96.
5. Stinton LM, Shaffer EA. Epidemiology of gallbladder disease: cho-lelithiasis and cancer. Gut Liver. 2012;6(2):172–87.
6. Lin IC, Yang YW, Wu MF, Yeh YH, Liou JC, Lin YL, et al. Theassociation of metabolic syndrome and its factors with gallstonedisease. BMC Fam Pract. 2014;15(1):138.
7. Aguilar M, Bhuket T, Torres S, Liu B, Wong RJ. Prevalence of themetabolic syndrome in the United States, 2003-2012. Jama.2015;313(19):1973–4. https://doi.org/10.1001/jama.2015.4260.
8. Alberti KG, Eckel RH, Grundy SM, Zimmet PZ, Cleeman JI,Donato KA, et al. Harmonizing the metabolic syndrome: a jointinterim statement of the International Diabetes Federation TaskForce on Epidemiology and Prevention; National Heart, Lung,and Blood Institute; American Heart Association; World HeartFederation; International Atherosclerosis Society; andInternational Association for the Study of Obesity. Circulation.2009;120(16):1640–5. https://doi.org/10.1161/circulationaha.109.192644.
9. Grundy SM, Cleeman JI, Daniels SR, Donato KA, Eckel RH,Franklin BA, et al. Diagnosis and management of the metabolicsyndrome: an American Heart Association/National Heart, Lung,and Blood Institute scientific statement: Executive Summary. CritPathw Cardiol. 2005;4(4):198–203. https://doi.org/10.1097/00132577-200512000-00018.
10. Kim HJ, Kim Y, Cho Y, Jun B, Kyung Won O. Trends in theprevalence of major cardiovascular disease risk factors amongKorean adults: results from the Korea National Health andNutrition Examination Survey, 1998-2012. Int J Cardiol.2014;174(1):64–72. https://doi.org/10.1016/j.ijcard.2014.03.163.
11. Li Y, Zhao L, Yu D, Wang Z, Ding G. Metabolic syndrome prev-alence and its risk factors among adults in China: a nationally rep-resentative cross-sectional study. PLoS One. 2018;13(6):e0199293.
12. Méndez-sánchez N, Chaveztapia NC, Motolakuba D, SanchezlaraK, Poncianorodríguez G, Baptista H, et al. Metabolic syndrome as arisk factor for gallstone disease. World J Gastroenterol.2005;11(11):1653–7.
13. Stroup DF, Berlin JA, Morton SC, Olkin I, Williamson GD, RennieD, et al. Meta-analysis of observational studies in epidemiology: aproposal for reporting. Meta-analysis Of Observational Studies inEpidemiology (MOOSE) group. Jama. 2000;283(15):2008–12.
14. Tarsilla M. Cochrane handbook for systematic reviews of interven-tions. J Multidiscip Eval. 2008;6:142–8.
15. Wells G, Shea B, O'Connell J (2014) The Newcastle-Ottawa Scale(NOS) for assessing the quality of nonrandomised studies in meta-analyses. Ottawa Health Research Institute. http://www.ohri.ca/programs/clinical_epidemiology/oxford.asp.
16. Zeng X, Zhang Y, Kwong JS, Zhang C, Li S, Sun F, et al. Themethodological quality assessment tools for preclinical and clinicalstudies, systematic review and meta-analysis, and clinical practiceguideline: a systematic review. J Evid Based Med. 2015;8(1):2–10.https://doi.org/10.1111/jebm.12141.
17. Sanderson S, Tatt ID, Higgins JP. Tools for assessing quality andsusceptibility to bias in observational studies in epidemiology: asystematic review and annotated bibliography. Int J Epidemiol.2007;36(3):666.
18. Sterne JA, Egger M. Funnel plots for detecting bias in meta-analy-sis: guidelines on choice of axis. J Clin Epidemiol. 2001;54(10):1046–55. https://doi.org/10.1016/s0895-4356(01)00377-8.
19. Shabanzadeh DM, Skaaby T, Sørensen LT, Eugen-Olsen J,Jørgensen T. Metabolic biomarkers and gallstone disease – apopulation-based study. Scand J Gastroenterol. 2017:52(11):1270–7. https://doi.org/10.1080/00365521.2017.1365166.
20. Li-Ying C, Qiao-Hua Q, Shan-Chun Z, Yu-Hao C, Chao G-Q.Metabolic syndrome and gallstone disease. World J Gastroenterol:WJG. 2012;18(31):4215.
21. Zhu Q, Sun X, Ji X, Zhu L, Xu J, Wang C, et al. The associationbetween gallstones and metabolic syndrome in urban Han Chinese:a longitudinal cohort study. Sci Rep. 2016;6:29937.
22. Chung-Hung T,Wu J-S, Chang Y-F, Lu F-H, Yang Y-C, Chang C-J. The number of metabolic abnormalities associated with the riskof gallstones in a non-diabetic population. PLoS One. 2014;9(3):e90310.
23. Chaimani A, Higgins JPT, Mavridis D, Spyridonos P, Salanti G.Graphical tools for network meta-analysis in STATA. PLoS One.2013;8(10):e76654. https://doi.org/10.1371/journal.pone.0076654.
24. In Sook K, Myung S-J, Lee S-S, Lee S-K, KimM-H. Classificationand nomenclature of gallstones revisited. Yonsei Med J.2003;44(4):561.
25. Fridhandler TM, Davison JS, Shaffer EA. Defective gallbladdercontractility in the ground squirrel and prairie dog during the earlystages of cholesterol gallstone formation. Gastroenterology.1983;85(4):830–6.
26. Portincasa P, Di Ciaula A, Vanberge-Henegouwen GP. Smoothmuscle function and dysfunction in gallbladder disease. CurrGastroenterol Rep. 2004;6(2):151–62.
27. Kishk SM, Darweesh RM, Dodds WJ, Lawson TL, Stewart ET,Kern MK, et al. Sonographic evaluation of resting gallbladder vol-ume and postprandial emptying in patients with gallstones. AJRAm J Roentgenol. 1987;148(5):875.
28. Yongsheng C, Jing K, Shuodong W. Cholesterol gallstone disease:focusing on the role of gallbladder. Lab Investig. 2015;95(2):124–31.
29. Yoosoo C, Sung E, Ryu S, Park Y-W, Jang YM, Park M. Insulinresistance is associated with gallstones even in non-obese, non-diabetic Korean men. J Korean Med Sci. 2008;23(4):644–50.
30. Shaffer EA. Epidemiology and risk factors for gallstone disease:has the paradigm changed in the 21st century? Curr GastroenterolRep. 2005;7(2):132–40.
31. Reaven GM. Role of insulin resistance in human disease (syndromeX): an expanded definition. Annu Rev Med. 1993;44(1):121.
32. Samson SL, Garber AJ. Metabolic syndrome. Endocrinol MetabClin N Am. 2014;43(1):1–23. https://doi.org/10.1016/j.ecl.2013.09.009.
33. Balkau B, Charles MA. Comment on the provisional report fromthe WHO consultation. European Group for the Study of InsulinResistance (EGIR). Diabet Med. 1999;16(5):442–3. https://doi.org/10.1046/j.1464-5491.1999.00059.x.
203Int J Diabetes Dev Ctries (2021) 41:196–204
34. Executive Summary of the third report of The National CholesterolEducation Program (NCEP) expert panel on detection, evaluation,and treatment of high blood cholesterol in adults (Adult TreatmentPanel III). Jama. 2001;285(19):2486–97. https://doi.org/10.1001/jama.285.19.2486.
35. Sirdah MM, Abu Ghali AS, Al Laham NA. The reliability of theNational Cholesterol Education Program’s Adult Treatment PanelIII (NCEP/ATP III) and the International Diabetes Federation (IDF)definitions in diagnosing metabolic syndrome (MetS) among GazaStrip Palestinians. Diabetes Metab Syndr Clin Res Rev. 2012;6(1):4–8.
36. Zimmet P, DMatsuzawa Y, Magliano GA, Shaw J. The metabolicsyndrome: a global public health problem and a new definition. JAtheroscler Thromb. 2005;12(6):295–300.
37. Alberti KG, Zimmet P, Shaw J. The metabolic syndrome–a newworldwide definition. Lancet. 2005;366(9491):1059–62. https://doi.org/10.1016/s0140-6736(05)67402-8.
38. Sang JH, Ki NK, Cho JH, Ahn JO, Sunwoo JG. Correlations be-tweenmetabolic syndrome, serologic factors, and gallstones. J PhysTher Sci. 2016;28(8):2337–41.
39. Nervi F, Miquel JF, Alvarez M, Ferreccio C, García-Zattera MJ,González R, et al. Gallbladder disease is associated with insulinresistance in a high risk Hispanic population. J Hepatol.2006;45(2):299–305.
40. Nakeeb A, Comuzzie AG, Al-Azzawi H, Sonnenberg GE,Kissebah AH, Pitt HA. Insulin resistance causes human gallbladderdysmotility. J Gastrointest Surg. 2006;10(7):940–9.
41. Twisk J, Hoekman MF, Lehmann EM, Meijer P, Mager WH,Princen HM. Insulin suppresses bile acid synthesis in cultured rat
hepatocytes by down-regulation of cholesterol 7 alpha-hydroxylaseand sterol 27-hydroxylase gene transcription. Hepatology.1995;21(2):501–10.
42. HollandWL, Xia JY, Johnson JA, Sun K, PearsonMJ, SharmaAX,et al. Inducible overexpression of adiponectin receptors highlightthe roles of adiponectin-induced ceramidase signaling in lipid andglucose homeostasis. Mol Metab. 2017;6(3):267–75. https://doi.org/10.1016/j.molmet.2017.01.002.
43. Grundy SM. Cholesterol gallstones: a fellow traveler with metabol-ic syndrome? Am J Clin Nutr. 2004;80(1):1–2.
44. Pitt HA. Hepato-pancreato-biliary fat: the good, the bad and theugly. HPB. 2007;9(2):92–7.
45. Cecilia G, Francisco MJ, Maria PR, Curt E, Lars S, Guillermo M,et al. Bile acid synthesis is increased in Chilean Hispanics withgallstones and in gallstone high-risk Mapuche Indians.Gastroenterology. 2004;126(3):741–8.
46. Cojocaru D-C, Mitu F, Dascălu CG, Manole A, Dima-Cozma C.The predictors of cholelithiasis in female patients with metabolicsyndrome. Cent Eur J Med. 2014;2014(9):108–14. https://doi.org/10.2478/s11536-013-0255-5.
A pre-print version have been posted at Research Square on 19 Feb, 2020.(https://www.researchsquare.com/article/rs-14528/v1) https://doi.org/10.21203/rs.2.23967/v1
Publisher’s note Springer Nature remains neutral with regard to jurisdic-tional claims in published maps and institutional affiliations.
204 Int J Diabetes Dev Ctries (2021) 41:196–204
ORIGINAL ARTICLE
New-onset diabetes mellitus after liver transplantationin the patients with acute liver failure
Ömercan Topaloğlu1& Muhammet Cengiz2 & Ayşe Cengiz2 & Bahri Evren3
& Saim Yoloğlu4&
Sezai Yılmaz5 & İbrahim Şahin3
Received: 16 September 2020 /Accepted: 8 January 2021# Research Society for Study of Diabetes in India 2021
AbstractBackground To detect the frequency and possible risk factors of new-onset diabetes after liver transplantation in the patients withacute liver failure. The frequency of new-onset diabetes after transplant (NODAT) is 5–30% in liver transplant recipients. Weaimed to analyze the frequency and predictors of NODAT in the patients undergoing liver transplantation due to acute liver failure.Methods Adult patients undergoing liver transplantation due to acute liver failure were analyzed retrospectively. The patientswith chronic liver failure or diabetes were excluded.Wemeasured pretransplant random blood glucose and posttransplant fastingblood glucose. NODAT was diagnosed according to principally 1st month fasting blood glucose (group 1 < 100, group 2 100–125, group 3 > 125 mg/dL). The participants were subgrouped according to age, gender, body mass index, etiology, antiviralmedication, thyroid function, pretransplant random blood glucose, donor type, immunosuppressive drug, common infection, andsurgical complication.Results Mean age of total 91 patients was 33.48 (± 13.35), and 52.7% (n = 48) of them was female. The ratio of NODAT was26.98% on the 1st month. NODAT group had a higher pretransplant random blood glucose than the others. Pretransplanthyperglycemia increased the risk of NODAT by 4.065 times (p = 0.018).Conclusion We showed that pretransplant hyperglycemia increased NODAT risk by 4 times, but hypoglycemia did not affect.So, pretransplant hyperglycemia should be controlled also in the patients with acute liver failure as in the patients with chronicliver failure.
Keywords NODAT . Acute liver failure . Liver transplant . Posttransplant diabetes . New onset diabetes . Diabetesmellitus
Introduction
New-onset diabetes after transplant (NODAT) may develop inthe patients after transplantation of solid organs such as the
liver, kidney, bone marrow, lung or heart [1–4]. It may bediagnosed with the same criteria as the nontransplant popula-tion at any time after transplantation [5]. However, oral glu-cose tolerance test may be sensitive but not a practical method
* Ömercan Topaloğ[email protected]
Muhammet [email protected]
Ayşe [email protected]
Bahri [email protected]
Saim Yoloğ[email protected]
Sezai Yı[email protected]
İbrahim Ş[email protected]
1 Kocaeli Derince Training and Research Hospital, EndocrinologyClinics, University of Health Sciences, Derince, Kocaeli, Turkey
2 Department of Internal Medicine, Inonu University Medical Faculty,Malatya, Turkey
3 Department of Endocrinology, Inonu University Medical Faculty,Malatya, Turkey
4 Department of Biostatistics, Inonu University Medical Faculty,Malatya, Turkey
5 Department of General Surgery, Inonu University Medical Faculty,Malatya, Turkey
https://doi.org/10.1007/s13410-021-00922-y
/ Published online: 22 January 2021
International Journal of Diabetes in Developing Countries (2021) 41:205–211
for transplant patients, and HbA1c may be used for the diag-nosis after 3rd month of transplantation [6]. The prevalence ofNODAT was found as 5–30% in liver transplant recipients [7,8]. Several pretransplant (prediabetes, obesity, hypertension,dyslipidemia, or HCV infection) and posttransplant (immuno-suppressive drugs, weight gain, CMV infection, acute rejec-tion) factors had been defined to increase the risk for new-onset diabetes after liver transplantation (LTx) [1, 3].
NODAT was shown to be associated with higher rate ofrejection, cardiovascular morbidity, fatal infections, neurolog-ical complications, poor graft survival, and mortality in livertransplant recipients [3, 9]. Therefore, it should be detectedand managed properly. Diabetes mellitus should be managedwith lifestyle changes as well as pharmacological treatment,and they may be considered also for NODAT [5, 7, 10, 11].
LTxmay be indicated in the patients with acute liver failure(ALF), cirrhosis, hepatic neoplasm, or metabolic liver disease[7]. Hence, the patients with ALF is one of the potential pop-ulations for the development of new-onset diabetes after LTx.Cause and effect relationship between diabetes mellitus andALF has not been clarified in previous studies [12, 13]. Due toa defect in glycogenolysis and gluconeogenesis, hypoglyce-mia may be observed in ALF at a rate of about 45% [14]. InALF, pretransplant glycemic status may be different from thatin chronic liver failure. Hence, the frequency of NODAT maybe expected to be different in the patients with ALF from thosewith chronic liver failure.
However, the frequency of NODAT has not been studiedyet comparatively in acute or chronic liver failure [7, 8]. Nostudy has focused on new-onset diabetes mellitus after livertransplantation in the patients with acute liver failure. There isno report analyzing the risk factors of NODAT in this patientpopulation. We aimed to analyze the frequency of and theclinical and laboratory features associated with new-onset di-abetes mellitus after liver transplantation in the patients withacute liver failure.
Materials and methods
Adult patients who were admitted to our clinics (of InonuUniversity Medical Faculty) with a diagnosis of ALF andunderwent LTx between 2010 and 2018 were included inour study. Our study was designed as retrospective, observa-tional, cross-sectional study, and approved by the EthicsCommittee of Inonu University (Malatya ClinicalResearches Ethics Committee). We performed our study inaccordance with the ethical standards laid down in the 1964Declaration of Helsinki and its later amendments.
ALF may be defined as coexistence of severe acute liverinjury, hepatic encephalopathy, and dysfunction of hepaticsynthesis of proteins and coagulation factors (internationalnormalized ratio ≥ 1.5) in the patients without preexisting liver
disease [15, 16]. We diagnosed the patients as ALF based onthe clinical and laboratory features, and duration cutoff todiscriminate ALF from chronic liver disease was defined as26 weeks. The causes of ALF were defined as Budd-Chiarisyndrome (BCS), acute viral hepatitis, drugs and toxins, andthe other/unknown etiological factors in our study. The pa-tients younger than 18-year-old, those with chronic liver fail-ure, known type 1 or 2 diabetes mellitus, who had been takingany antidiabetic regimen, or lacking data were excluded fromthe study.
Basic demographic (age) and clinical (height, weight, bodymass index) features were recorded preoperatively and ana-lyzed. Body weight (kg) and height (m) were measured withpatient barefoot and having light clothes. Body mass index(BMI) was calculated as weight/square of height (kg/m2).
We measured random venous blood glucose (RBG) beforeLTx on admission and fasting blood glucose (FBG) on the 1stand 7th day, on the 1st, 3rd, and 12th month of LTx after anovernight fasting for at least 8 h. Based on the diagnosticcriteria of diabetes mellitus, we evaluated the patients accord-ing to FBG levels: < 100mg/dL as normal FBG, 100–125mg/dL as prediabetes, ≥126 mg/dL as NODAT [5]. We mainlygrouped the patients by FBG level on 1st month (group 1 <100 mg/dL normal FBG, group 2 100–125 mg/dL prediabe-tes, group 3 ≥ 126 mg/dL NODAT). We analyzed the patientsprincipally according to the 1st month FBG. We could notmeasure FBG before LTx due to inappropriate clinical condi-tion of the patients. We could not analyze HbA1c levels. Wealso analyzed donor FBG. Blood glucose was designated asmg/dL, TSH mIU/L, free T4 (fT4) ng/dL, and free T3 (fT3)pg/mL. Blood glucose was measured from venous blood sam-ple by glucose oxidase method with the Olympus AU-2700analyzer. TSH, fT4, and fT3 were measured with chemilumi-nescence method by using the Beckman Coulter marked andDxI 800 model device (Beckman Coulter, Inc. 4300 N.Harbor Blvd., Fullerton, CA 92835, USA). The referencerange of our laboratory was used to determine the upper andlower limit of normal for all laboratory parameters.
The participants were grouped according to age (< 40 vs ≥40), gender (female vs male), BMI (< 30 vs ≥ 30 kg/m2), eti-ology (other vs acute viral hepatitis), antiviral medication (ab-sence vs presence), thyroid function (euthyroid vs subclinicalthyrotoxicosis), pretransplant RBG (hypoglycemia < 54/≥ 54or < 70/≥70 mg/dL, or hyperglycemia < 200/≥ 200 mg/dL),donor type (cadaver vs living donor), immunosuppressivedrug (other vs tacrolimus), common infection (absence vspresence), and surgical complication (absence vs presence).Subclinical thyrotoxicosis was defined as TSH lower thannormal limits, with fT4 and fT3 levels in the reference range.We defined pretransplant hypoglycemia according to alertvalue (70 mg/dL) or clinically important hypoglycemiathreshold (54 mg/dL) based on the report of InternationalHypoglycemia Study Group [17]. We defined common
206 Int J Diabetes Dev Ctries (2021) 41:205–211
infection as upper respiratory or urinary tract infection andsurgical complication as common biliary or vascular compli-cations which might be observed in the postoperative period.
Statistical analysis
SPSS 22.0 (IBM Corporation, Armonk, NY, USA) programwas used in the analysis of data. We used Shapiro-Wilk test toassess whether the data showed normal distribution or not.Homogeneity of variance was evaluated by Levene test. Weused Mann-Whitney U test when comparing independent twogroups according to quantitative data, Kruskal-Wallis forcomparison of more than 2 groups. In comparison of categor-ical variables, each other, Pearson Chi-Square test was used.To analyze the correlations of variables with each other,Spearman’s correlation (r) analysis was used. To determinethe risk groups for parameters affecting the development ofNODAT according to posttransplant 1st month FBG, we usedunivariate logistic regression analysis. Multivariate test wasnot applicable. Odds ratio (OR) was used with 95% confi-dence intervals (CI) to show that risk groups had how higherrisk than the other subjects. Quantitative variables were de-fined as mean (X) ± standard deviation (SD) in the tables.Categorical variables were demonstrated as number (n) andpercent (%), and p value of < 0.05 was accepted as statisticallysignificant.
Results
Of total 91 patients, 52.7% (n = 48) was female and mean agewas 33.48 (± 13.35). The etiology of ALF was BCS in3(3.29%) patients, acute viral hepatitis in 38(41.75%), drugor toxin-related in 21(23.07%), and other/unknown causes in29(31.86%) patients.
Of total 91 patients, transplantation was performed fromliving donors in 59 patients. All living donors in our studywere related to the recipient (living related donor), and degreeof relation was as follows: 18 living related donors (LRD)were 1st degree relative, 22 LRD 2nd degree relative, 4LRD 3rd degree relative, 3 LRD 4th degree relative (cousin),3 LRD relative-in-law, and 9 LRD husband-wife.
A total of 11(12.08%) patients died in the 1st week,28(30.76%) in the 1st month, 36 (39.56%) in 3 months,and 43(47.25%) in 12 months of LTx. The mortalityrate was higher in 1st month in the patients withpretransplant hypoglycemia than in the remainder(42.85 vs 29.76%).
The ratio of prediabetes and NODAT in survivors of LTxwas 23.07% and 67.03% on the 1st day, 28.75% and 58.75%on the 1st week, 36.5% and 26.98% on the 1st month, 32.72%and 14.54% on 3rd month, and 20.83% and 8.3% on 12thmonth.
Pretransplant RBGwas significantly higher in group 3 thanin group 2 (p = 0.041) or in group 1 (p = 0.022); 3rd monthFBG was significantly higher in group 3 than in group 1 (p =0.018); 12th month FBG was significantly higher in group 2(p = 0.037) or group 3 (p = 0.006) than in group 1. Age, gen-der, body weight, BMI, thyroid function tests, and donor FBGwere similar in all groups (Table 1).
Among survivors on 12th month of LTx, NODATpersisted in 3, changed to prediabetes in 1, and then turnedto normal FBG in 5 patients. Prediabetes persisted in 7,changed to normal FBG in 10, to NODAT in 1 patient.Normal FBG persisted in 19 patients and changed to predia-betes in 2 patients.
There were no significant predictors for NODAT in 1st day(not demonstrated on the table). Pretransplant hyperglycemiawas found as a positive predictor for NODAT (OR 4.065,95% CI, p = 0.018) (Table 2).
Pretransplant RBG was positively correlated with 1stmonth (p = 0.014) and 3rd month FBG (p = 0.043) (Table 3).
Discussion
We found that the frequency of NODAT was about 70% on1st day and decreased progressively until the 12th month.Those without diabetes on the 1st month had almost stablenormoglycemia on the 12th month. We showed thatpretransplant hyperglycemia increased the risk of NODATby 4 times, but pretransplant hypoglycemia was not a predic-tor for NODAT.
Several pretransplant (age, family history of diabetes, obe-sity, hypertension, dyslipidemia) and posttransplant (immuno-suppressive drugs, CMV infection, acute rejection) risk fac-tors were shown to be important in the occurrence of NODAT[18, 19]. Studies analyzing NODAT usually included a mixedstudy sample consisting of patients with acute or chronic liverfailure [3, 9, 19, 20]. There is no report that focuses NODATin the patients with ALF.
In ALF, hypoglycemia may be observed due to depletedglycogen stores, a defect in glycogenolysis and gluconeogen-esis, and as high as 45% [14]. Increased level of serum insulinmay also contribute to the development of hypoglycemia inALF [21, 22]. We proposed that catabolic state contributinghypoglycemia in the patients with ALF might continue afterLTx, and it might blunt the development of hyperglycemia.However, we showed that preoperative hypoglycemia did nothave any negative impact on NODAT. Due to that a highermortality rate was observed in the patients with pretransplanthypoglycemia than the rest, the effect of pretransplant hypo-glycemia on NODAT might be underestimated.
Perioperative hyperglycemia was known as a risk factor forNODAT [23]. In one study, transplant candidates with im-paired glucose tolerance which was detected by glucose load
207Int J Diabetes Dev Ctries (2021) 41:205–211
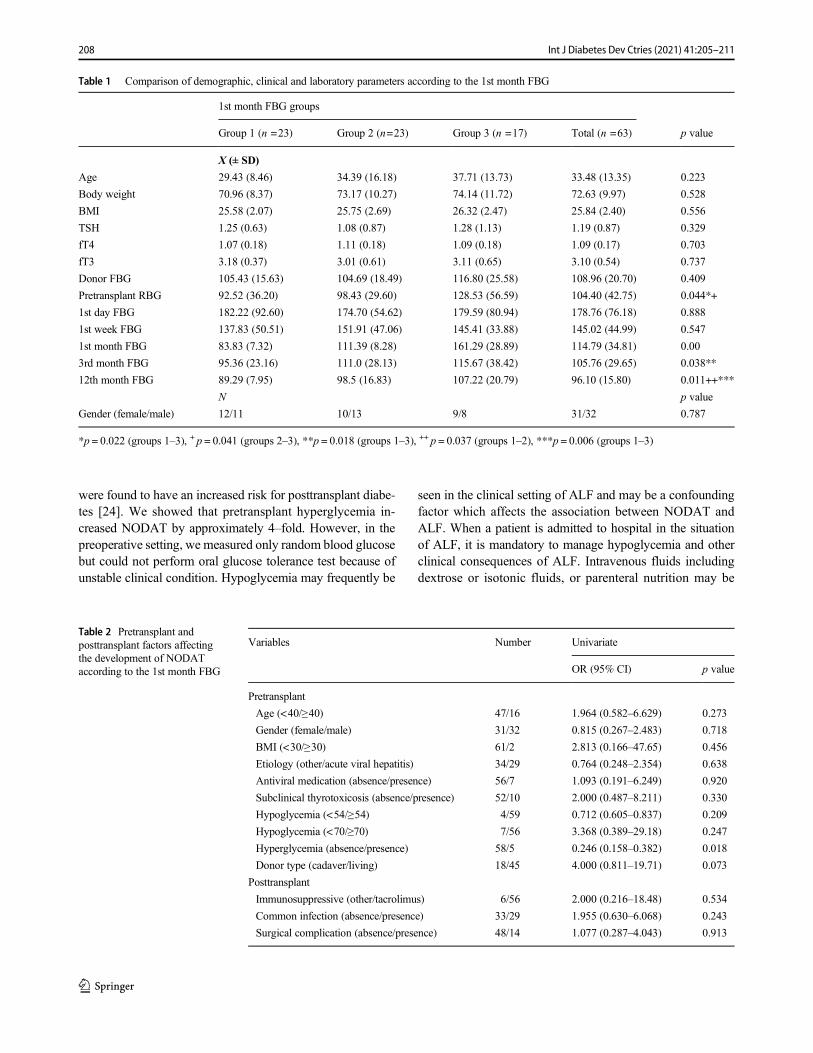
were found to have an increased risk for posttransplant diabe-tes [24]. We showed that pretransplant hyperglycemia in-creased NODAT by approximately 4–fold. However, in thepreoperative setting, we measured only random blood glucosebut could not perform oral glucose tolerance test because ofunstable clinical condition. Hypoglycemia may frequently be
seen in the clinical setting of ALF and may be a confoundingfactor which affects the association between NODAT andALF. When a patient is admitted to hospital in the situationof ALF, it is mandatory to manage hypoglycemia and otherclinical consequences of ALF. Intravenous fluids includingdextrose or isotonic fluids, or parenteral nutrition may be
Table 1 Comparison of demographic, clinical and laboratory parameters according to the 1st month FBG
1st month FBG groups
Group 1 (n =23) Group 2 (n=23) Group 3 (n =17) Total (n =63) p value
X (± SD)
Age 29.43 (8.46) 34.39 (16.18) 37.71 (13.73) 33.48 (13.35) 0.223
Body weight 70.96 (8.37) 73.17 (10.27) 74.14 (11.72) 72.63 (9.97) 0.528
BMI 25.58 (2.07) 25.75 (2.69) 26.32 (2.47) 25.84 (2.40) 0.556
TSH 1.25 (0.63) 1.08 (0.87) 1.28 (1.13) 1.19 (0.87) 0.329
fT4 1.07 (0.18) 1.11 (0.18) 1.09 (0.18) 1.09 (0.17) 0.703
fT3 3.18 (0.37) 3.01 (0.61) 3.11 (0.65) 3.10 (0.54) 0.737
Donor FBG 105.43 (15.63) 104.69 (18.49) 116.80 (25.58) 108.96 (20.70) 0.409
Pretransplant RBG 92.52 (36.20) 98.43 (29.60) 128.53 (56.59) 104.40 (42.75) 0.044*+
1st day FBG 182.22 (92.60) 174.70 (54.62) 179.59 (80.94) 178.76 (76.18) 0.888
1st week FBG 137.83 (50.51) 151.91 (47.06) 145.41 (33.88) 145.02 (44.99) 0.547
1st month FBG 83.83 (7.32) 111.39 (8.28) 161.29 (28.89) 114.79 (34.81) 0.00
3rd month FBG 95.36 (23.16) 111.0 (28.13) 115.67 (38.42) 105.76 (29.65) 0.038**
12th month FBG 89.29 (7.95) 98.5 (16.83) 107.22 (20.79) 96.10 (15.80) 0.011++***
N p value
Gender (female/male) 12/11 10/13 9/8 31/32 0.787
*p = 0.022 (groups 1–3), + p = 0.041 (groups 2–3), **p = 0.018 (groups 1–3), ++ p = 0.037 (groups 1–2), ***p = 0.006 (groups 1–3)
Table 2 Pretransplant andposttransplant factors affectingthe development of NODATaccording to the 1st month FBG
Variables Number Univariate
OR (95% CI) p value
Pretransplant
Age (<40/≥40) 47/16 1.964 (0.582–6.629) 0.273
Gender (female/male) 31/32 0.815 (0.267–2.483) 0.718
BMI (<30/≥30) 61/2 2.813 (0.166–47.65) 0.456
Etiology (other/acute viral hepatitis) 34/29 0.764 (0.248–2.354) 0.638
Antiviral medication (absence/presence) 56/7 1.093 (0.191–6.249) 0.920
Subclinical thyrotoxicosis (absence/presence) 52/10 2.000 (0.487–8.211) 0.330
Hypoglycemia (<54/≥54) 4/59 0.712 (0.605–0.837) 0.209
Hypoglycemia (<70/≥70) 7/56 3.368 (0.389–29.18) 0.247
Hyperglycemia (absence/presence) 58/5 0.246 (0.158–0.382) 0.018
Donor type (cadaver/living) 18/45 4.000 (0.811–19.71) 0.073
Posttransplant
Immunosuppressive (other/tacrolimus) 6/56 2.000 (0.216–18.48) 0.534
Common infection (absence/presence) 33/29 1.955 (0.630–6.068) 0.243
Surgical complication (absence/presence) 48/14 1.077 (0.287–4.043) 0.913
208 Int J Diabetes Dev Ctries (2021) 41:205–211
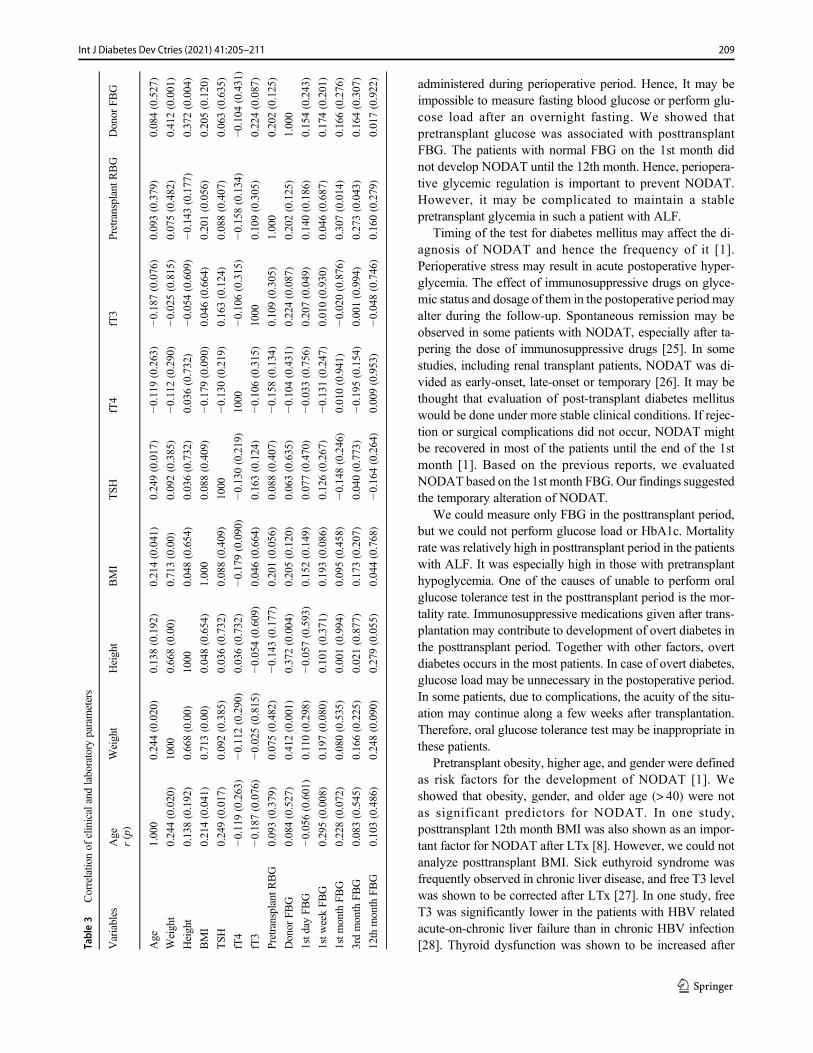
administered during perioperative period. Hence, It may beimpossible to measure fasting blood glucose or perform glu-cose load after an overnight fasting. We showed thatpretransplant glucose was associated with posttransplantFBG. The patients with normal FBG on the 1st month didnot develop NODAT until the 12th month. Hence, periopera-tive glycemic regulation is important to prevent NODAT.However, it may be complicated to maintain a stablepretransplant glycemia in such a patient with ALF.
Timing of the test for diabetes mellitus may affect the di-agnosis of NODAT and hence the frequency of it [1].Perioperative stress may result in acute postoperative hyper-glycemia. The effect of immunosuppressive drugs on glyce-mic status and dosage of them in the postoperative period mayalter during the follow-up. Spontaneous remission may beobserved in some patients with NODAT, especially after ta-pering the dose of immunosuppressive drugs [25]. In somestudies, including renal transplant patients, NODAT was di-vided as early-onset, late-onset or temporary [26]. It may bethought that evaluation of post-transplant diabetes mellituswould be done under more stable clinical conditions. If rejec-tion or surgical complications did not occur, NODAT mightbe recovered in most of the patients until the end of the 1stmonth [1]. Based on the previous reports, we evaluatedNODAT based on the 1st month FBG. Our findings suggestedthe temporary alteration of NODAT.
We could measure only FBG in the posttransplant period,but we could not perform glucose load or HbA1c. Mortalityrate was relatively high in posttransplant period in the patientswith ALF. It was especially high in those with pretransplanthypoglycemia. One of the causes of unable to perform oralglucose tolerance test in the posttransplant period is the mor-tality rate. Immunosuppressive medications given after trans-plantation may contribute to development of overt diabetes inthe posttransplant period. Together with other factors, overtdiabetes occurs in the most patients. In case of overt diabetes,glucose load may be unnecessary in the postoperative period.In some patients, due to complications, the acuity of the situ-ation may continue along a few weeks after transplantation.Therefore, oral glucose tolerance test may be inappropriate inthese patients.
Pretransplant obesity, higher age, and gender were definedas risk factors for the development of NODAT [1]. Weshowed that obesity, gender, and older age (> 40) were notas significant predictors for NODAT. In one study,posttransplant 12th month BMI was also shown as an impor-tant factor for NODAT after LTx [8]. However, we could notanalyze posttransplant BMI. Sick euthyroid syndrome wasfrequently observed in chronic liver disease, and free T3 levelwas shown to be corrected after LTx [27]. In one study, freeT3 was significantly lower in the patients with HBV relatedacute-on-chronic liver failure than in chronic HBV infection[28]. Thyroid dysfunction was shown to be increased afterTa
ble3
Correlatio
nof
clinicalandlaboratory
parameters
Variables
Age
Weight
Height
BMI
TSH
fT4
fT3
Pretransplant
RBG
Donor
FBG
r(p)
Age
1.000
0.244(0.020)
0.138(0.192)
0.214(0.041)
0.249(0.017)
−0.119
(0.263)
−0.187
(0.076)
0.093(0.379)
0.084(0.527)
Weight
0.244(0.020)
1000
0.668(0.00)
0.713(0.00)
0.092(0.385)
−0.112
(0.290)
−0.025
(0.815)
0.075(0.482)
0.412(0.001)
Height
0.138(0.192)
0.668(0.00)
1000
0.048(0.654)
0.036(0.732)
0.036(0.732)
−0.054
(0.609)
−0.143
(0.177)
0.372(0.004)
BMI
0.214(0.041)
0.713(0.00)
0.048(0.654)
1.000
0.088(0.409)
−0.179
(0.090)
0.046(0.664)
0.201(0.056)
0.205(0.120)
TSH
0.249(0.017)
0.092(0.385)
0.036(0.732)
0.088(0.409)
1000
−0.130
(0.219)
0.163(0.124)
0.088(0.407)
0.063(0.635)
fT4
−0.119
(0.263)
−0.112(0.290)
0.036(0.732)
−0.179
(0.090)
−0.130
(0.219)
1000
−0.106
(0.315)
−0.158
(0.134)
−0.104
(0.431)
fT3
−0.187
(0.076)
−0.025(0.815)
−0.054
(0.609)
0.046(0.664)
0.163(0.124)
−0.106
(0.315)
1000
0.109(0.305)
0.224(0.087)
PretransplantR
BG
0.093(0.379)
0.075(0.482)
−0.143
(0.177)
0.201(0.056)
0.088(0.407)
−0.158
(0.134)
0.109(0.305)
1.000
0.202(0.125)
Donor
FBG
0.084(0.527)
0.412(0.001)
0.372(0.004)
0.205(0.120)
0.063(0.635)
−0.104
(0.431)
0.224(0.087)
0.202(0.125)
1.000
1std
ayFB
G−0
.056
(0.601)
0.110(0.298)
−0.057
(0.593)
0.152(0.149)
0.077(0.470)
−0.033
(0.756)
0.207(0.049)
0.140(0.186)
0.154(0.243)
1stw
eekFB
G0.295(0.008)
0.197(0.080)
0.101(0.371)
0.193(0.086)
0.126(0.267)
−0.131
(0.247)
0.010(0.930)
0.046(0.687)
0.174(0.201)
1stm
onth
FBG
0.228(0.072)
0.080(0.535)
0.001(0.994)
0.095(0.458)
−0.148
(0.246)
0.010(0.941)
−0.020
(0.876)
0.307(0.014)
0.166(0.276)
3rdmonth
FBG
0.083(0.545)
0.166(0.225)
0.021(0.877)
0.173(0.207)
0.040(0.773)
−0.195
(0.154)
0.001(0.994)
0.273(0.043)
0.164(0.307)
12th
month
FBG
0.103(0.486)
0.248(0.090)
0.279(0.055)
0.044(0.768)
−0.164
(0.264)
0.009(0.953)
−0.048
(0.746)
0.160(0.279)
0.017(0.922)
209Int J Diabetes Dev Ctries (2021) 41:205–211
liver transplantation [29]. Systematic analysis of thyroid func-tion tests in ALF is limited in the literature. Anastasiou et al.showed that the patients who recovered from ALF had higherTSH, total T4, and T3 levels than the patients undergoing LTxor died from ALF [30]. We showed that subclinical thyrotox-icosis was found in 15.38% of the patients; it was not a pre-dictor for NODAT.
Strength and limitations
There is no previous report that focuses on the devel-opment of NODAT in the patients with ALF. To ourknowledge, our study is the first to evaluate NODAT ina specific large group of the patients with ALF. Wemeasured only random blood glucose but could not per-form oral glucose load or HbA1c due to unstable clin-ical condition of the patients in the pretransplant setting.We could not analyze HbA1c or oral glucose load afterLTx. Our study was designed as a retrospective manner,because prospective study design might be difficult insuch a clinical condition of ALF.
Conclusion
Our findings suggested that NODAT was observed in morethan 60% of the patients on 1st day, and the ratio was de-creased progressively during follow-up. The patient withoutNODAT on the 1st month had almost stable normoglycemiaon 12th month. Pretransplant hyperglycemia increased therisk of NODAT by 4 times, but pretransplant hypoglycemiadid not have any protective role against NODAT. We recom-mend that perioperative glycemic regulation should be insti-tuted to prevent the development of NODAT or at least toalleviate posttransplant hyperglycemia. It should be kept inmind that constitution of stable pretransplant glucose level insuch a patient with ALF might be complicated. Prospectivestudies including patients with ALF will give a more detailedinformation about NODAT in this population.
Acknowledgements All authors contributed to the study conception anddesign. Study design, material preparation, data collection, and analysiswere performed by Ömercan Topaloğlu, Muhammet Cengiz, AyşeCengiz, Bahri Evren, Saim Yoloğlu, Sezai Yılmaz, and İbrahim Şahin.The first draft of the manuscript was written by Ömercan Topaloğlu, andall authors commented on previous versions of the manuscript. All au-thors read and approved the final manuscript.
Data availability The datasets generated during and/or analyzed duringthe current study are available from the corresponding author on reason-able request.
We had accepted that “the previous form” of our article could belocated on a website of “https://www.researchsquare.com/article/rs-14864/v1” as a preprint, before we have submitted the article to yourjournal. We changed some parts of the article and title, before we havesubmitted our article to your journal. The authors assure that this paper
has not been published before nor has been submitted for publication toanother scientific journal.
The abstract of previous form of our article was accepted as an “AudioElectronic Poster” (AEP-306) with a heading of “New-Onset DiabetesMellitus After Liver Transplantation In The Patients With Acute LiverFailure: Is There Any Effect Of Pretransplant Hypoglycemia?” in 2020online congress of European Society of Endocrinology (e-ECE 2020).
Compliance with ethical standards
Conflict of interest The authors declare that they have no conflict ofinterest.
Ethics approval and consent to participate Our study was designed asretrospective manner, and we performed our study in accordance with theethical standards laid down in the 1964 Declaration of Helsinki and itslater amendments.
Our study was approved by the Ethics Committee of Inonu University(Malatya Clinical Researches Ethic Committee, approval date:04 January2017, approval number:2017/11).
Human rights Due to the retrospective design of the study and the use ofalready available data, written informed consent was unavailable.
References
1. Lane JT, Dagogo-Jack S. Approach to the patient with new-onsetdiabetes after transplant (NODAT). J Clin Endocrinol Metab.2011;96:3289–97.
2. Guad RM, Taylor-Robinson AW, Wu YS, Gan SH, Zaharan NL,Basu RC, et al. Clinical and genetic risk factors for new-onsetdiabetes mellitus after transplantation (NODAT) inmajor transplantcentres in Malaysia. BMC Nephrol. 2020;21:388.
3. Man Kim J, Hwang S, Lee KW, Lee JG, Ryu JH, Kim BW, ChoiDL, You YK, Kim DS, Nah YW, Kang KJ, Cho JY, Hong G, ChoiIS, Yu HC, Choi D, Kim MS; Korean Organ TransplantationRegistry Study Group. New-onset diabetes after adult liver trans-plantation in the Korean Organ Transplantation Registry (KOTRY)study. Hepatobiliary Surg Nutr 2020;9:425–439.
4. Zielińska K, Kukulski L, Wróbel M, Przybyłowski P, ZakliczyńskiM, Strojek K. Prevalence and risk factors of new-onset diabetesafter transplantation (NODAT). Ann Transplant. 2020;25:e926556.
5. Classification and diagnosis of diabetes: standards of medical carein diabetes—2019 American Diabetes Association. Diabetes Care2019;42:S13-S28.
6. Sharif A, Hecking M, de Vries AP, Porrini E, Hornum M, Rasoul-Rockenschaub S, et al. Proceedings from an international consensusmeeting on posttransplantation diabetes mellitus: recommendationsand future directions. Am J Transplant. 2014;14:1992–2000.
7. Gaglio PJ, Cotler SJ. Liver transplantation in adults: long-termmanagement of transplant recipients. In: UpToDate [online].Available at: www.UpToDateInc.com. (Accessed January 7,2020).
8. Saab S, Shpaner A, Zhao Y, Brito I, Durazo F, Han S, et al.Prevalence and risk factors for diabetes mellitus in moderate termsurvivors of liver transplantation. Am J Transplant. 2006;6:1890–5.
9. Ling Q, Xu X, Xie H, Wang K, Xiang P, Zhuang R, et al. New-onset diabetes after liver transplantation: a national report fromChina Liver Transplant Registry. Liver Int. 2016;36:705–12.
10. Sook LW, Sablihan NI, Ismail S, Devaraj NK, Mooi CS. Factorsassociated with the level of physical activities among non-academicstaffs in the Faculty of Medicine and Health Sciences of a Public
210 Int J Diabetes Dev Ctries (2021) 41:205–211
University in Selangor. Malaysia Mal J Med Health Sci. 2019;15:47–55.
11. Devaraj NK, Mohazmi M, Norita H. Prevalence, factors influenc-ing and knowledge about adherence to lipid-lowering therapyamong hyperlipidemia patients. Medical J Malaysia. 2017;72:157–64.
12. Davern TJ, Schilsky ML, Hynan LS, Lee WM. Prevalence of dia-betes mellitus is not increased in acute liver failure. Hepatology.2004;40:499A.
13. Rutherford A, Davern T, Hay JE, Murray NG, Hassanein T, LeeWM, et al. Acute Liver Failure Study Group. Influence of highbody mass index on outcome in acute liver failure. ClinGastroenterol Hepatol. 2006;4:1544–9.
14. Gill RQ, Sterling RK. Acute liver failure. J Clin Gastroenterol.2001;33:191–8.
15. Lee WM, Stravitz RT, Larson AM. Introduction to the revisedAmerican Association for the Study of Liver Diseases PositionPaper on acute liver failure 2011. Hepatology. 2012;55:965–967.
16. European Association for the Study of the Liver. Electronic ad-dress: [email protected]; Clinical practice guidelines panel,Wendon, J; Panel members, Cordoba J, Dhawan A, Larsen FS,Manns M, Samuel D, Simpson KJ, Yaron I; EASL GoverningBoard representative, Bernardi M. EASL clinical practical guide-lines on the management of acute (fulminant) liver failure. JHepatol. 2017;66:1047–81.
17. International Hypoglycaemia Study Group. Glucose concentrationsof less than 3.0 mmol/L (54 mg/dL) should be reported in clinicaltrials: a joint position statement of the American DiabetesAssociation and the European Association for the Study ofDiabetes. Diabetes Care. 2017;40:155–7.
18. Sharif A, Baboolal K. Risk factors for new-onset diabetes afterkidney transplantation. Nat Rev Nephrol. 2010;6:415–23.
19. Oommen T, Arun CS, Kumar H, Nair V, Jayakumar RV,Sudhindran S, et al. Incidence of new-onset diabetes andposttransplant metabolic syndrome after liver transplantation - aprospective study from South India. Indian J Endocrinol Metab.2020;24:165–9.
20. Pham PT, Pham PC, Lipshutz GS, Wilkinson AH. New onset dia-betes mellitus after solid organ transplantation. Endocrinol MetabClin North Am. 2007;36:873–90;vii.
21. Kerwin AJ, Nussbaum MS. Adjuvant nutrition management of pa-tients with liver failure, including transplant. Surg Clin North Am.2011;91:565–78.
22. Schilsky ML, Honiden S, Arnott L, Emre S. ICU management ofacute liver failure. Clin Chest Med. 2009;30:71–87 viii.
23. Chakkera HA, Knowler WC, Devarapalli Y, Weil EJ, Heilman RL,Dueck A, et al. Relationship between inpatient hyperglycemia andinsulin treatment after kidney transplantation and future new onsetdiabetes mellitus. Clin J Am Soc Nephrol. 2010;5:1669–75.
24. Caillard S, Eprinchard L, Perrin P, Braun L, Heibel F, Moreau F,et al. Incidence and risk factors of glucose metabolism disorders inkidney transplant recipients: role of systematic screening by oralglucose tolerance test. Transplantation. 2011;91:757–64.
25. Zahir N, Mousa D, Al Taweel A, Ashraf A, Fahim A, Taqi K, et al.Prospective nonrandomized study with early steroid withdrawal(day 5) postrenal transplant in low immunological risk patients: asinglecenter experience at prince sultan military medical cityRiyadh. Saudi J Kidney Dis Transpl. 2019;30:1398–406.
26. Hur KY, KimMS, KimYS, Kang ES, Nam JH, Kim SH, et al. Riskfactors associated with the onset and progression of posttransplan-tation diabetes in renal allograft recipients. Diabetes Care. 2007;30:609–15.
27. Roth D, Milgrom M, Esquenazi V, Fuller L, Burke G, Miller J.Posttransplant hyperglycemia. Increased incidence incyclosporine-treated renal allograft recipients. Transplantation.1989;47:278–81.
28. Wu Y, You S, Zang H, Liu H, Mao Y, Mao P, et al. Usefulness ofserum thyroid-stimulation hormone (TSH) as a prognostic indicatorfor acute-on-chronic liver failure. Ann Hepatol. 2015;14:218–24.
29. Moura Neto A, Bovi TG, Righetto CM, Fiore AR, Lot LT, PeralesSR, et al. Frequency of thyroid dysfunction in patients with diabetesmellitus before and after liver transplantation. Transplant Proc.2018;50:788–91.
30. Anastasiou O, Sydor S, Sowa JP, Manka P, Katsounas A, SynWK,et al. Higher thyroid-stimulating hormone, triiodothyronine andthyroxine values are associated with better outcome in acute liverfailure. PLoS One. 2015;10:e0132189.
Publisher’s note Springer Nature remains neutral with regard to jurisdic-tional claims in published maps and institutional affiliations.
211Int J Diabetes Dev Ctries (2021) 41:205–211
ORIGINAL ARTICLE
Prevalence, risk factors and perinatal outcomes of gestationaldiabetes in Mexican adolescents when applying diagnostic criteriafrom three different international guidelines
Eduardo N. Nava Guerrero1& Alejandra Salcedo González2 & Claudia E. Hernández Escobar3 & Fidel Cisneros Rivera4 &
Elena J. Mondragón Ortiz2 & Ivette M. De Alba3 & Graciela Cantú5
Received: 8 April 2020 /Accepted: 25 September 2020# Research Society for Study of Diabetes in India 2020
AbstractObjective To compare the prevalence, risk factors and perinatal outcomes of gestational diabetes mellitus (GDM) for Mexicanadolescent population when applying different diagnostic criteria based on the 2-h 75-g oral glucose tolerance test, as establishedby three international guidelines.Materials and methods Comparative, observational, and retrospective study, which included pregnant women under 19 years,who underwent screening for GDM in our center. Data were obtained from the hospital’s electronic records and were analyzedusing descriptive statistics. The X2 test was used to compare group proportions. Statistical significance was set at p ≤ 0.05.Results A total of 999 adolescents were screened for GDM. The observed prevalence was 3%, 14.4%, and 29.3%when using theFifth International Workshop-Conference on Gestational Diabetes Mellitus (FIWC), National Institute for Health and CareExcellence (NICE-2015), and International Association of Diabetes and Pregnancy Study Groups (IADPSG) criteria, respec-tively. Of our sample, 42.5% presented at least one risk factor. An association was observed regarding the need for cesareansection in patients with GDM diagnosed through IADPSG criteria (OR = 1.35, p = 0.04). On the other hand, the use of the FIWCand NICE standards showed an association between GDM and obstetric hemorrhage (OR = 17.8, p = 0.000, and OR = 4.8, p =0.01, respectively) and preeclampsia with severity criteria (OR = 5.1, p = 0.001, and OR = 2.4, P = 0.025, respectively).Conclusions The prevalence of GDM in adolescents is high, and we can conclude that the prevalence varies based on whichinternational diagnostic guideline is applied.While there is an association with adverse pregnancy outcomes such as hypertensivedisorders of pregnancy, obstetric hemorrhage, and the need for cesarean section, this requires further evaluation.
Keywords Pregnancy . Diabetes gestational . Adolescent pregnancy . Pregnancy outcomes . Glucose tolerance test
* Eduardo N. Nava [email protected]
Alejandra Salcedo Gonzá[email protected]
Claudia E. Hernández [email protected]
Fidel Cisneros [email protected]
Elena J. Mondragón [email protected]
Ivette M. De [email protected]
Graciela Cantú[email protected]
1 Maternal-Fetal Medicine Department, Tecnologico de Monterrey,Escuela de Medicina y Ciencias de la Salud, Ave. Morones Prieto3000, 64710 Monterrey, NL, Mexico
2 Obstetrics and Gynecology Fellow, Tecnologico de Monterrey,Escuela de Medicina y Ciencias de la Salud, Ave. Morones Prieto3000, 64710 Monterrey, NL, Mexico
3 Obstetrics and Gynecology Department, Tecnologico de Monterrey,Escuela de Medicina y Ciencias de la Salud, Ave. Morones Prieto3000, 64710 Monterrey, NL, México
4 Maternal-Fetal Medicine Department, Hospital Regional MaternoInfantil, Aldama 460, 67140 Guadalupe, Nuevo León, México
5 Central Laboratory, Hospital Regional Materno Infantil, Aldama460, 67140 Guadalupe, Nuevo León, Mexico
https://doi.org/10.1007/s13410-020-00876-7
/ Published online: 27 October 2020
International Journal of Diabetes in Developing Countries (2021) 41:212–220
Introduction
Gestational diabetes mellitus (GDM) prevalence varies ac-cording to age, ethnic group, or location of the populationunder study, and the criteria used to define the diagnosis [1].
In 2013, the International Diabetes Federation (IDF) esti-mated that GDM affects 16.9% of women between 20 and49 years old worldwide. Prevalence rates of GDM have beenreported to be higher in Hispanic, African American, andAsian women [2]. A lower prevalence has been reported foradolescent women, between 0.85 and 1.2% [3, 4].
International diabetes mellitus guidelines do not spec-ify the ideal age to start screening for gestational dia-betes or the diagnostic criteria to use in young pregnantwomen [5].
In Mexico, teenage pregnancy rates have increased in thepast decade, representing now one third of the total births inthe country [6]. Commonly, these patients are not beingscreened for GDM because of their young age. Knowing thata high percentage of them might have an increased risk ofdeveloping gestational diabetes, it is of utmost importance tounderstand how the prevalence of this disease behaves whenusing different diagnostic criteria. It is also essential to deter-mine how or if it relates to adverse perinatal results and whichrisk factors are present in our adolescent population, to be ableto plan effective interventions.
Material and methods
The study included adolescent women whose prenatalcare was performed in the same facility from May toDecember 2017. The data analyzed were obtained fromthe Fetal-Maternal Medicine Department files, as well asfrom the hospital’s electronic medical records (EMR).The patients were included in our sample as they ar-rived at screening and obstetric control.
During the first prenatal care appointment, we registeredfamily, medical, obstetric, and socioeconomic history, as wellas body weight and height. Gestational age was calculatedusing the last menstrual period. If unknown or unreliable,gestational age was estimated by crown-rump length mea-sured before the 14 weeks of gestation or cephalic circumfer-ence in the second trimester. As per hospital policy, due to ahigh prevalence of type II diabetes in the general populationand the particular ethnic group that we are studying, and aspart of the inclusion criteria for this study, a 2-h, 75-g OGTTwas applied to every pregnant woman at her first prenatal visit,irrespective of gestational age, patient’s age, or preexistingrisk factors. The test was performed at the center’s laboratory,with 8–12-h fasting and a regular diet for 3 days before thesample retrieval. GDM diagnosis was determined accordingto the Fifth International Workshop Conference on
Gestational Diabetes Mellitus criterion (two or more alteredvalues regarding serum glucose; fasting, ≥ 95 mg/dl, 1 h ≥180 mg/dl, and 2 h ≥ 155 mg/dl), and treatment was onlyadministered to these patients groups. Treatment consistedof a low glycemic index diet provided by the clinical nutritiondepartment, with monitoring every 2–4 weeks, alongside ob-stetric and fetal medical checkups. Two different methodsevaluated plasma glucose levels: (1) fasting and 2 h afterbreakfast glucose levels from venous blood were obtained attheir perinatal checkup; (2) glucose self-monitoring with aglucometer 2 to 6 times a day (after overnight fast, 2 h afterbreakfast, 2 h after lunch, and 2-h after dinner). Patients whoreported fasting glucose levels ≥ 95 mg/dl and/or 2-h post-prandial ≥ 140 mg/dl or a self-monitoring reporting 30%higher glucose levels than the first reported were prescribedmetformin (1000–2550 mg per day). In case of non-compliance or failure to achieve the goal glucose levels, hu-man regular and NPH insulin was prescribed subcutaneously.
The primary objective of this study was to assess andcompare gestational diabetes mellitus prevalence in aMexican teenager population when applying three dif-ferent international criteria based on their 75-g OGTTresults. Women were retrospectively assigned to the fol-lowing study groups:
1) International Association of Diabetes and PregnancyStudy Groups (IADPSG): One or more altered values,regarding serum glucose; fasting, ≥ 92 mg/dl, 1 h ≥180 mg/dl, and 2 h ≥ 153 mg/dl [7]
2) National Institute for Health and Care Excellence (NICE-2015): One altered value regarding serum glucose;fasting, ≥ 100 mg/dl and/or 2 h ≥ 140 mg/dl [8]
3) Fifth International Workshop-Conference on GestationalDiabetes Mellitus (FIWC GDM): Two or more alteredvalues regarding serum glucose; fasting, ≥ 95 mg/dl, 1 h≥ 180 mg/dl, and 2 h ≥ 155 mg/dl [9]
The presence of risk factors for developing gestation-al diabetes mellitus, such as the family history of type 2diabetes mellitus, prior history of gestational diabetes ormacrosomic newborn, and body mass index > 25, wasalso documented.
Our secondary objective was to analyze the relation-ship between positive screening with each diagnosticcriterion and the following adverse perinatal results:
(1) Pregnancy-associated hypertensive disorder (pre-eclampsia with or without severity criteria or gestational hy-pertension) according to American College of Obstetrics andGynecology criteria [10]; (2) obstetric hemorrhage, blood loss≥ 500 ml during vaginal birth and ≥ 1000 ml during cesareansection, as defined by American College of Obstetrics andGynecology [11]; (3) large for gestational age newborn, con-sidering birth weight greater than 90th percentile based on the
213Int J Diabetes Dev Ctries (2021) 41:212–220
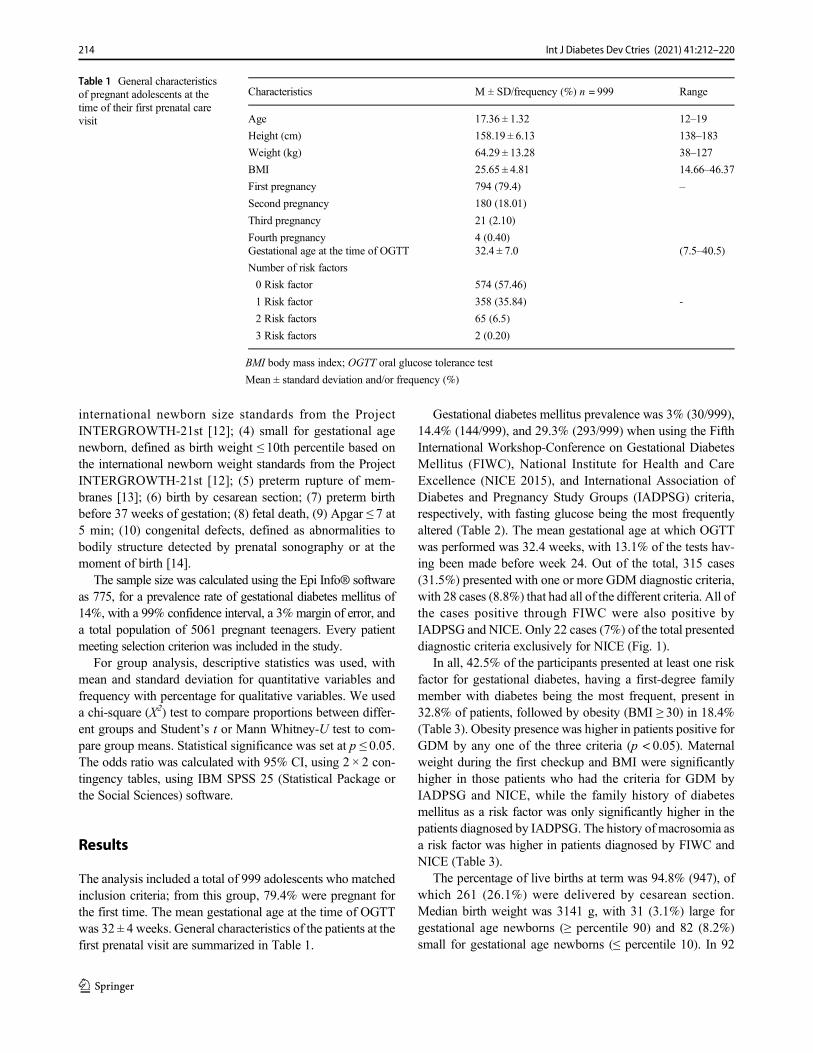
international newborn size standards from the ProjectINTERGROWTH-21st [12]; (4) small for gestational agenewborn, defined as birth weight ≤ 10th percentile based onthe international newborn weight standards from the ProjectINTERGROWTH-21st [12]; (5) preterm rupture of mem-branes [13]; (6) birth by cesarean section; (7) preterm birthbefore 37 weeks of gestation; (8) fetal death, (9) Apgar ≤ 7 at5 min; (10) congenital defects, defined as abnormalities tobodily structure detected by prenatal sonography or at themoment of birth [14].
The sample size was calculated using the Epi Info® softwareas 775, for a prevalence rate of gestational diabetes mellitus of14%, with a 99% confidence interval, a 3% margin of error, anda total population of 5061 pregnant teenagers. Every patientmeeting selection criterion was included in the study.
For group analysis, descriptive statistics was used, withmean and standard deviation for quantitative variables andfrequency with percentage for qualitative variables. We useda chi-square (X2) test to compare proportions between differ-ent groups and Student’s t or Mann Whitney-U test to com-pare group means. Statistical significance was set at p ≤ 0.05.The odds ratio was calculated with 95% CI, using 2 × 2 con-tingency tables, using IBM SPSS 25 (Statistical Package orthe Social Sciences) software.
Results
The analysis included a total of 999 adolescents who matchedinclusion criteria; from this group, 79.4% were pregnant forthe first time. The mean gestational age at the time of OGTTwas 32 ± 4 weeks. General characteristics of the patients at thefirst prenatal visit are summarized in Table 1.
Gestational diabetes mellitus prevalence was 3% (30/999),14.4% (144/999), and 29.3% (293/999) when using the FifthInternational Workshop-Conference on Gestational DiabetesMellitus (FIWC), National Institute for Health and CareExcellence (NICE 2015), and International Association ofDiabetes and Pregnancy Study Groups (IADPSG) criteria,respectively, with fasting glucose being the most frequentlyaltered (Table 2). The mean gestational age at which OGTTwas performed was 32.4 weeks, with 13.1% of the tests hav-ing been made before week 24. Out of the total, 315 cases(31.5%) presented with one or more GDM diagnostic criteria,with 28 cases (8.8%) that had all of the different criteria. All ofthe cases positive through FIWC were also positive byIADPSG and NICE. Only 22 cases (7%) of the total presenteddiagnostic criteria exclusively for NICE (Fig. 1).
In all, 42.5% of the participants presented at least one riskfactor for gestational diabetes, having a first-degree familymember with diabetes being the most frequent, present in32.8% of patients, followed by obesity (BMI ≥ 30) in 18.4%(Table 3). Obesity presence was higher in patients positive forGDM by any one of the three criteria (p < 0.05). Maternalweight during the first checkup and BMI were significantlyhigher in those patients who had the criteria for GDM byIADPSG and NICE, while the family history of diabetesmellitus as a risk factor was only significantly higher in thepatients diagnosed by IADPSG. The history of macrosomia asa risk factor was higher in patients diagnosed by FIWC andNICE (Table 3).
The percentage of live births at term was 94.8% (947), ofwhich 261 (26.1%) were delivered by cesarean section.Median birth weight was 3141 g, with 31 (3.1%) large forgestational age newborns (≥ percentile 90) and 82 (8.2%)small for gestational age newborns (≤ percentile 10). In 92
Table 1 General characteristicsof pregnant adolescents at thetime of their first prenatal carevisit
Characteristics M ± SD/frequency (%) n = 999 Range
Age 17.36 ± 1.32 12–19
Height (cm) 158.19 ± 6.13 138–183
Weight (kg) 64.29 ± 13.28 38–127
BMI 25.65 ± 4.81 14.66–46.37
First pregnancy
Second pregnancy
Third pregnancy
Fourth pregnancy
794 (79.4)
180 (18.01)
21 (2.10)
4 (0.40)
–
Gestational age at the time of OGTT 32.4 ± 7.0 (7.5–40.5)
Number of risk factors
0 Risk factor
1 Risk factor
2 Risk factors
3 Risk factors
574 (57.46)
358 (35.84)
65 (6.5)
2 (0.20)
-
BMI body mass index; OGTT oral glucose tolerance test
Mean ± standard deviation and/or frequency (%)
214 Int J Diabetes Dev Ctries (2021) 41:212–220
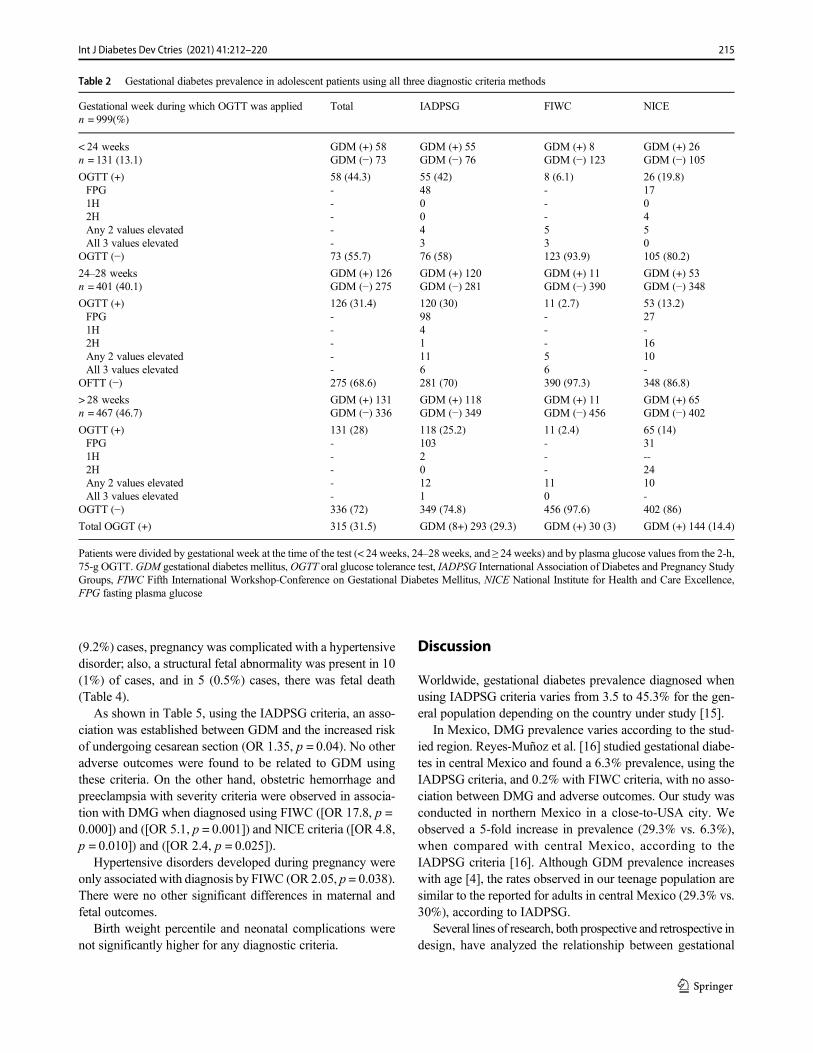
(9.2%) cases, pregnancy was complicated with a hypertensivedisorder; also, a structural fetal abnormality was present in 10(1%) of cases, and in 5 (0.5%) cases, there was fetal death(Table 4).
As shown in Table 5, using the IADPSG criteria, an asso-ciation was established between GDM and the increased riskof undergoing cesarean section (OR 1.35, p = 0.04). No otheradverse outcomes were found to be related to GDM usingthese criteria. On the other hand, obstetric hemorrhage andpreeclampsia with severity criteria were observed in associa-tion with DMG when diagnosed using FIWC ([OR 17.8, p =0.000]) and ([OR 5.1, p = 0.001]) and NICE criteria ([OR 4.8,p = 0.010]) and ([OR 2.4, p = 0.025]).
Hypertensive disorders developed during pregnancy wereonly associatedwith diagnosis by FIWC (OR 2.05, p = 0.038).There were no other significant differences in maternal andfetal outcomes.
Birth weight percentile and neonatal complications werenot significantly higher for any diagnostic criteria.
Discussion
Worldwide, gestational diabetes prevalence diagnosed whenusing IADPSG criteria varies from 3.5 to 45.3% for the gen-eral population depending on the country under study [15].
In Mexico, DMG prevalence varies according to the stud-ied region. Reyes-Muñoz et al. [16] studied gestational diabe-tes in central Mexico and found a 6.3% prevalence, using theIADPSG criteria, and 0.2% with FIWC criteria, with no asso-ciation between DMG and adverse outcomes. Our study wasconducted in northern Mexico in a close-to-USA city. Weobserved a 5-fold increase in prevalence (29.3% vs. 6.3%),when compared with central Mexico, according to theIADPSG criteria [16]. Although GDM prevalence increaseswith age [4], the rates observed in our teenage population aresimilar to the reported for adults in central Mexico (29.3% vs.30%), according to IADPSG.
Several lines of research, both prospective and retrospective indesign, have analyzed the relationship between gestational
Table 2 Gestational diabetes prevalence in adolescent patients using all three diagnostic criteria methods
Gestational week during which OGTT was appliedn = 999(%)
Total IADPSG FIWC NICE
< 24 weeksn = 131 (13.1)
GDM (+) 58GDM (−) 73
GDM (+) 55GDM (−) 76
GDM (+) 8GDM (−) 123
GDM (+) 26GDM (−) 105
OGTT (+)FPG1H2HAny 2 values elevatedAll 3 values elevated
OGTT (−)
58 (44.3)-----73 (55.7)
55 (42)48004376 (58)
8 (6.1)---53123 (93.9)
26 (19.8)170450105 (80.2)
24–28 weeksn = 401 (40.1)
GDM (+) 126GDM (−) 275
GDM (+) 120GDM (−) 281
GDM (+) 11GDM (−) 390
GDM (+) 53GDM (−) 348
OGTT (+)FPG1H2HAny 2 values elevatedAll 3 values elevated
OFTT (−)
126 (31.4)-----275 (68.6)
120 (30)9841116281 (70)
11 (2.7)---56390 (97.3)
53 (13.2)27-1610-348 (86.8)
> 28 weeksn = 467 (46.7)
GDM (+) 131GDM (−) 336
GDM (+) 118GDM (−) 349
GDM (+) 11GDM (−) 456
GDM (+) 65GDM (−) 402
OGTT (+)FPG1H2HAny 2 values elevatedAll 3 values elevated
OGTT (−)
131 (28)-----336 (72)
118 (25.2)10320121349 (74.8)
11 (2.4)---110456 (97.6)
65 (14)31--2410-402 (86)
Total OGGT (+) 315 (31.5) GDM (8+) 293 (29.3) GDM (+) 30 (3) GDM (+) 144 (14.4)
Patients were divided by gestational week at the time of the test (< 24 weeks, 24–28 weeks, and ≥ 24 weeks) and by plasma glucose values from the 2-h,75-g OGTT.GDM gestational diabetes mellitus,OGTT oral glucose tolerance test, IADPSG International Association of Diabetes and Pregnancy StudyGroups, FIWC Fifth International Workshop-Conference on Gestational Diabetes Mellitus, NICE National Institute for Health and Care Excellence,FPG fasting plasma glucose
215Int J Diabetes Dev Ctries (2021) 41:212–220
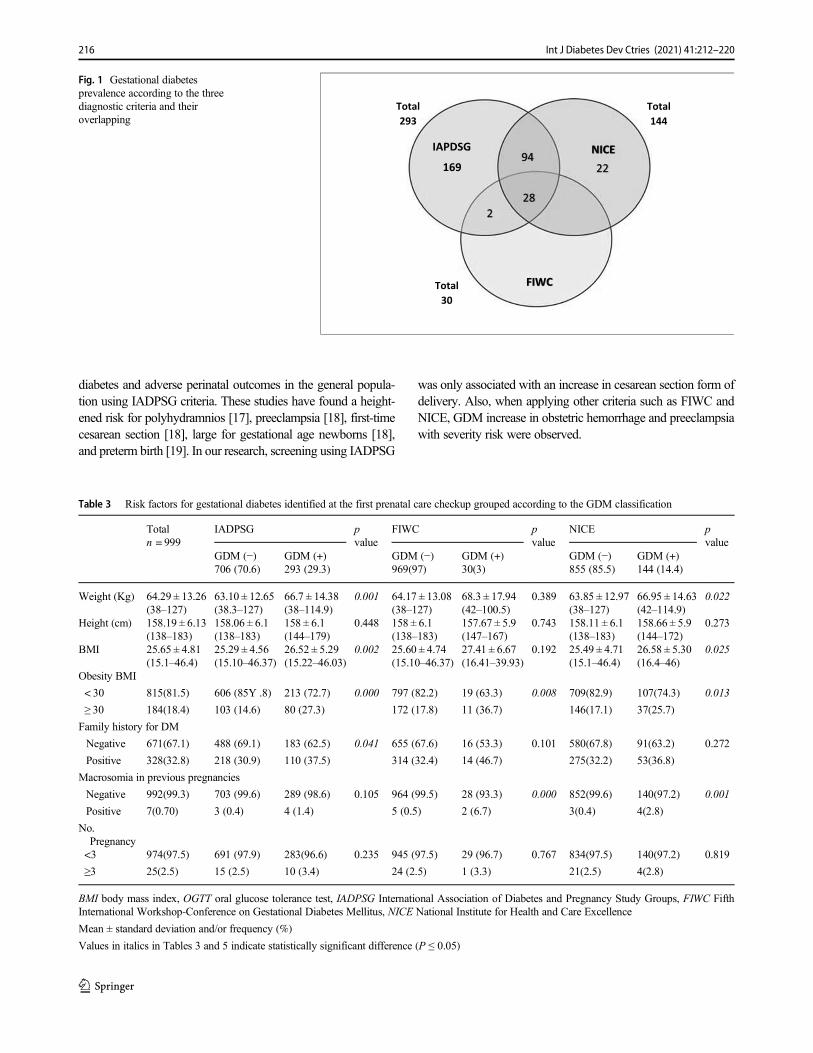
diabetes and adverse perinatal outcomes in the general popula-tion using IADPSG criteria. These studies have found a height-ened risk for polyhydramnios [17], preeclampsia [18], first-timecesarean section [18], large for gestational age newborns [18],and preterm birth [19]. In our research, screening using IADPSG
was only associated with an increase in cesarean section form ofdelivery. Also, when applying other criteria such as FIWC andNICE, GDM increase in obstetric hemorrhage and preeclampsiawith severity risk were observed.
Table 3 Risk factors for gestational diabetes identified at the first prenatal care checkup grouped according to the GDM classification
Totaln = 999
IADPSG pvalue
FIWC pvalue
NICE pvalue
GDM (−)706 (70.6)
GDM (+)293 (29.3)
GDM (−)969(97)
GDM (+)30(3)
GDM (−)855 (85.5)
GDM (+)144 (14.4)
Weight (Kg) 64.29 ± 13.26(38–127)
63.10 ± 12.65(38.3–127)
66.7 ± 14.38(38–114.9)
0.001 64.17 ± 13.08(38–127)
68.3 ± 17.94(42–100.5)
0.389 63.85 ± 12.97(38–127)
66.95 ± 14.63(42–114.9)
0.022
Height (cm) 158.19 ± 6.13(138–183)
158.06 ± 6.1(138–183)
158 ± 6.1(144–179)
0.448 158 ± 6.1(138–183)
157.67 ± 5.9(147–167)
0.743 158.11 ± 6.1(138–183)
158.66 ± 5.9(144–172)
0.273
BMI 25.65 ± 4.81(15.1–46.4)
25.29 ± 4.56(15.10–46.37)
26.52 ± 5.29(15.22–46.03)
0.002 25.60 ± 4.74(15.10–46.37)
27.41 ± 6.67(16.41–39.93)
0.192 25.49 ± 4.71(15.1–46.4)
26.58 ± 5.30(16.4–46)
0.025
Obesity BMI
< 30 815(81.5) 606 (85Y .8) 213 (72.7) 0.000 797 (82.2) 19 (63.3) 0.008 709(82.9) 107(74.3) 0.013
≥ 30 184(18.4) 103 (14.6) 80 (27.3) 172 (17.8) 11 (36.7) 146(17.1) 37(25.7)
Family history for DM
Negative 671(67.1) 488 (69.1) 183 (62.5) 0.041 655 (67.6) 16 (53.3) 0.101 580(67.8) 91(63.2) 0.272
Positive 328(32.8) 218 (30.9) 110 (37.5) 314 (32.4) 14 (46.7) 275(32.2) 53(36.8)
Macrosomia in previous pregnancies
Negative 992(99.3) 703 (99.6) 289 (98.6) 0.105 964 (99.5) 28 (93.3) 0.000 852(99.6) 140(97.2) 0.001
Positive 7(0.70) 3 (0.4) 4 (1.4) 5 (0.5) 2 (6.7) 3(0.4) 4(2.8)
No.Pregnancy<3 974(97.5) 691 (97.9) 283(96.6) 0.235 945 (97.5) 29 (96.7) 0.767 834(97.5) 140(97.2) 0.819
≥3 25(2.5) 15 (2.5) 10 (3.4) 24 (2.5) 1 (3.3) 21(2.5) 4(2.8)
BMI body mass index, OGTT oral glucose tolerance test, IADPSG International Association of Diabetes and Pregnancy Study Groups, FIWC FifthInternational Workshop-Conference on Gestational Diabetes Mellitus, NICE National Institute for Health and Care Excellence
Mean ± standard deviation and/or frequency (%)
Values in italics in Tables 3 and 5 indicate statistically significant difference (P ≤ 0.05)
IAPDSG
169
228
9422
FIWC
NICE
Total293
Total144
Total30
Fig. 1 Gestational diabetesprevalence according to the threediagnostic criteria and theiroverlapping
216 Int J Diabetes Dev Ctries (2021) 41:212–220
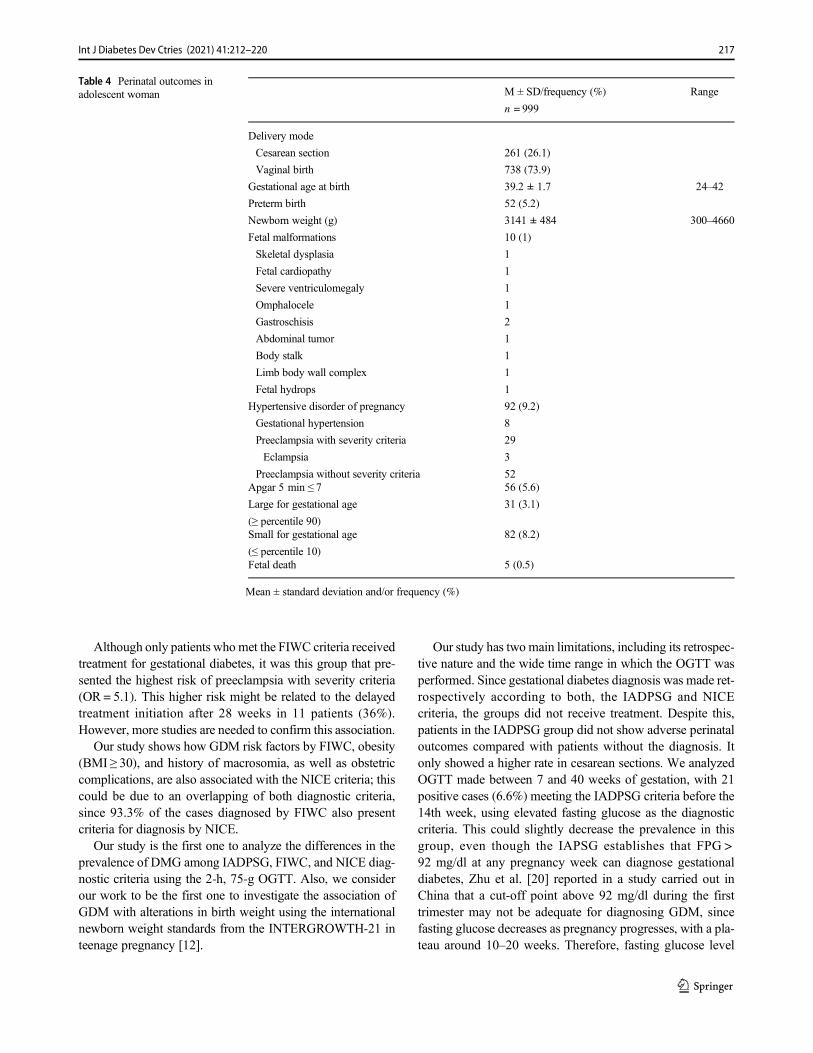
Although only patients who met the FIWC criteria receivedtreatment for gestational diabetes, it was this group that pre-sented the highest risk of preeclampsia with severity criteria(OR = 5.1). This higher risk might be related to the delayedtreatment initiation after 28 weeks in 11 patients (36%).However, more studies are needed to confirm this association.
Our study shows how GDM risk factors by FIWC, obesity(BMI ≥ 30), and history of macrosomia, as well as obstetriccomplications, are also associated with the NICE criteria; thiscould be due to an overlapping of both diagnostic criteria,since 93.3% of the cases diagnosed by FIWC also presentcriteria for diagnosis by NICE.
Our study is the first one to analyze the differences in theprevalence of DMG among IADPSG, FIWC, and NICE diag-nostic criteria using the 2-h, 75-g OGTT. Also, we considerour work to be the first one to investigate the association ofGDM with alterations in birth weight using the internationalnewborn weight standards from the INTERGROWTH-21 inteenage pregnancy [12].
Our study has two main limitations, including its retrospec-tive nature and the wide time range in which the OGTT wasperformed. Since gestational diabetes diagnosis was made ret-rospectively according to both, the IADPSG and NICEcriteria, the groups did not receive treatment. Despite this,patients in the IADPSG group did not show adverse perinataloutcomes compared with patients without the diagnosis. Itonly showed a higher rate in cesarean sections. We analyzedOGTT made between 7 and 40 weeks of gestation, with 21positive cases (6.6%) meeting the IADPSG criteria before the14th week, using elevated fasting glucose as the diagnosticcriteria. This could slightly decrease the prevalence in thisgroup, even though the IAPSG establishes that FPG >92 mg/dl at any pregnancy week can diagnose gestationaldiabetes, Zhu et al. [20] reported in a study carried out inChina that a cut-off point above 92 mg/dl during the firsttrimester may not be adequate for diagnosing GDM, sincefasting glucose decreases as pregnancy progresses, with a pla-teau around 10–20 weeks. Therefore, fasting glucose level
Table 4 Perinatal outcomes inadolescent woman M ± SD/frequency (%)
n = 999
Range
Delivery mode
Cesarean section 261 (26.1)
Vaginal birth 738 (73.9)
Gestational age at birth 39.2 ± 1.7 24–42
Preterm birth 52 (5.2)
Newborn weight (g) 3141 ± 484 300–4660
Fetal malformations 10 (1)
Skeletal dysplasia 1
Fetal cardiopathy 1
Severe ventriculomegaly 1
Omphalocele 1
Gastroschisis 2
Abdominal tumor 1
Body stalk 1
Limb body wall complex 1
Fetal hydrops 1
Hypertensive disorder of pregnancy 92 (9.2)
Gestational hypertension 8
Preeclampsia with severity criteria 29
Eclampsia
Preeclampsia without severity criteria
3
52Apgar 5 min ≤ 7 56 (5.6)
Large for gestational age
(≥ percentile 90)
31 (3.1)
Small for gestational age
(≤ percentile 10)
82 (8.2)
Fetal death 5 (0.5)
Mean ± standard deviation and/or frequency (%)
217Int J Diabetes Dev Ctries (2021) 41:212–220
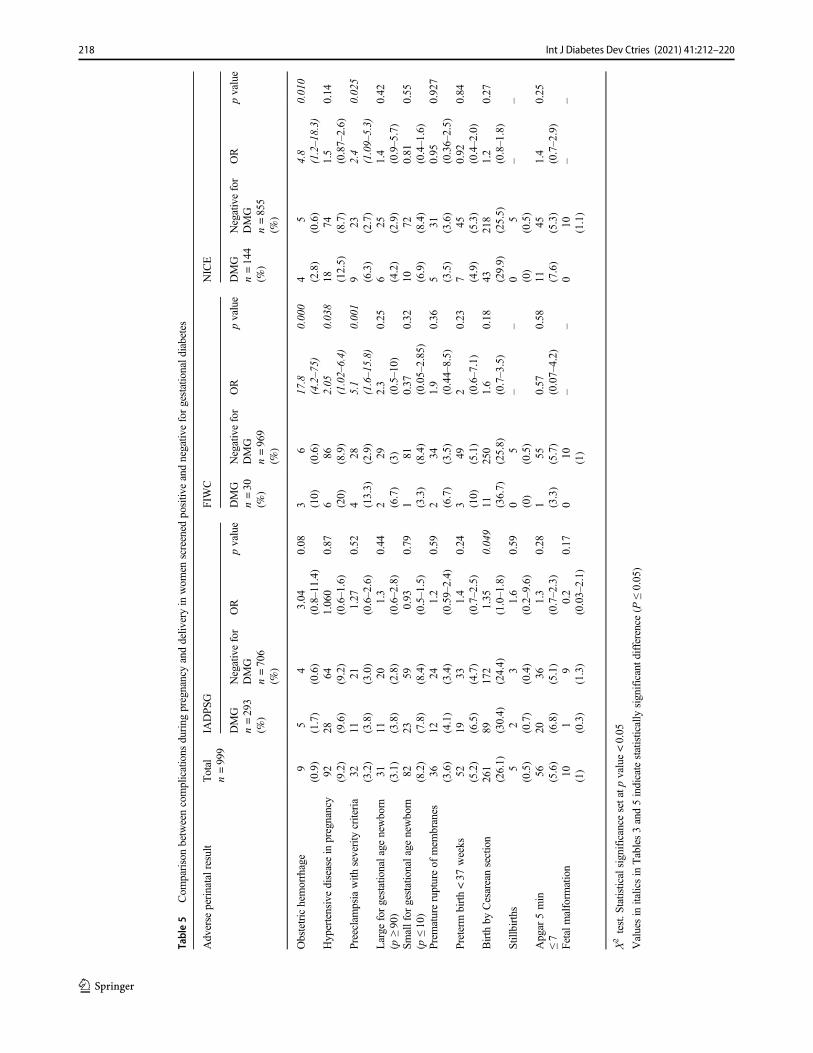
Table5
Com
parisonbetweencomplications
during
pregnancyanddeliv
eryin
wom
enscreened
positiv
eandnegativ
eforgestationald
iabetes
Adverse
perinatalresult
Total
n=999
IADPS
GFIWC
NICE
DMG
n=293
(%)
Negativefor
DMG
n=706
(%)
OR
pvalue
DMG
n=30
(%)
Negativefor
DMG
n=969
(%)
OR
pvalue
DMG
n=144
(%)
Negativefor
DMG
n=855
(%)
OR
pvalue
Obstetrichemorrhage
9(0.9)
5 (1.7)
4(0.6)
3.04
(0.8–11.4)
0.08
3 (10)
6(0.6)
17.8
(4.2–75)
0.000
4 (2.8)
5(0.6)
4.8
(1.2–18.3)
0.010
Hypertensivediseasein
pregnancy
92 (9.2)
28 (9.6)
64 (9.2)
1.060
(0.6–1.6)
0.87
6 (20)
86 (8.9)
2.05
(1.02–6.4)
0.038
18 (12.5)
74 (8.7)
1.5
(0.87–2.6)
0.14
Preeclampsiawith
severity
criteria
32 (3.2)
11 (3.8)
21 (3. 0)
1.27
(0. 6–2.6)
0.52
4 (13.3)
28 (2.9)
5.1
(1.6–15.8)
0.001
9 (6.3)
23 (2.7)
2.4
(1.09–5.3)
0.025
Large
forgestationalage
newborn
(p≥90)
31 (3.1)
11 (3.8)
20 (2.8)
1.3
(0.6–2.8)
0.44
2 (6.7)
29 (3)
2.3
(0.5–10)
0.25
6 (4.2)
25 (2.9)
1.4
(0.9–5.7)
0.42
Smallfor
gestationalage
newborn
(p≤10)
82 (8.2)
23 (7.8)
59 (8.4)
0.93
(0.5–1.5)
0.79
1 (3.3)
81 (8.4)
0.37
(0.05–2.85)
0.32
10 (6.9)
72 (8.4)
0.81
(0.4–1.6)
0.55
Prem
atureruptureof
mem
branes
36 (3.6)
12 (4.1)
24 (3.4)
1.2
(0.59–2.4)
0.59
2 (6.7)
34 (3.5)
1.9
(0.44–8.5)
0.36
5 (3.5)
31 (3.6)
0.95
(0.36–2.5)
0.927
Preterm
birth<37
weeks
52 (5.2)
19 (6.5)
33 (4.7)
1.4
(0.7–2.5)
0.24
3 (10)
49 (5.1)
2 (0.6–7.1)
0.23
7 (4.9)
45 (5.3)
0.92
(0.4–2.0)
0.84
Birth
byCesareansection
261
(26.1)
89 (30.4)
172
(24.4)
1.35
(1.0–1.8)
0.049
11 (36.7)
250
(25.8)
1.6
(0.7–3.5)
0.18
43 (29.9)
218
(25.5)
1.2
(0.8–1.8)
0.27
Stillbirths
5(0.5)
2 (0.7)
3(0.4)
1.6
(0.2–9.6)
0.59
0 (0)
5(0.5)
––
0 (0)
5(0.5)
––
Apgar
5min
≤7
56 (5.6)
20 (6.8)
36 (5.1)
1.3
(0.7–2.3)
0.28
1 (3.3)
55 (5.7)
0.57
(0.07–4.2)
0.58
11 (7.6)
45 (5.3)
1.4
(0.7–2.9)
0.25
Fetalmalform
ation
10 (1)
1 (0.3)
9(1.3)
0.2
(0.03–2.1)
0.17
010 (1)
––
010 (1.1)
––
X2test.S
tatisticalsignificance
setatp
value<0.05
Valuesin
italicsin
Tables3and5indicatestatistically
significantd
ifference(P
≤0.05)
218 Int J Diabetes Dev Ctries (2021) 41:212–220
during the first trimester is not consistent with fasting glucosebetween 24 and 28 weeks.
Our study shows a high percentage of Mexican pregnantteenagers present with several risk factors for developing ges-tational diabetes. This is concerning because teenagers who dodevelop the disease will have a heightened risk of developingchronic conditions, such as type 2 diabetes mellitus [21], car-diovascular disease, or chronic arterial hypertension [22, 23]later in life. Even when of reproductive age, in the future,these patients will have accumulated not only their preexistentrisk factors, such as obesity, family history, and ethnicity butalso the risk implied by having a previous history of gestation-al diabetes mellitus. Likewise, these long-term adverse healthoutcomes can also affect their children’s future, as they maydevelop childhood obesity, glucose intolerance, and vasculardisorders after birth [24]. The stakes for the public healthsystem to change these probabilities are high, which calls forthe instauration of efficient and integral strategies, starting atthe first level of care and focusing on prevention, timely in-tervention, and identification of patients at risk.
Although the number of macrosomic newborns during thestudy was small, this is a risk factor for gestational diabetes.Therefore, it could be used as an indicator for early screeningin future pregnancies.
Pregnant Mexican adolescents in northern Mexico werefound, according to our data, to be at a heightened risk ofdeveloping gestational diabetes mellitus. They present with ahigh percentage of risk factors and a high prevalence of thedisease, which is why we emphasize the need to performOGTT in the adolescent Mexican population. When compar-ing different diagnostic criteria, gestational diabetes was asso-ciated with various adverse perinatal outcomes. We, therefore,recommend that every different region in Mexico should an-alyze their communities to screen for and analyze using 2-h,75-g OGTT according to their resources.
Compliance with ethical standards
Conflict of interest The authors declare that they have no conflict ofinterest.
Ethical approval Approval was obtained from the ethics committee ofthe Hospital Regional Materno Infantil, Secretaria de Salud de NuevoLeón, México. The procedures used in this study adhere to the tenets ofthe Declaration of Helsinki.
Informed consent This research study employs retrospective and obser-vational research techniques and methodology and does not carry out anyintervention or intentional modification to physiological, psychological,or social variables to the participants. For this study, only an electronicfile review was used for data collection, creating a database in which thenames of the patients were not included. Informed consent is not requiredas long as the information is anonymized, and the submission does notinclude images that may identify the person.
References
1. Getahun D, Nath C, Ananth CV, et al. Gestational diabetes in theUnited States: temporal trends 1989 through 2004. Am J ObstetGynecol. 2008;198:525. e1.
2. Guarigata L, et al. Global estimates of the prevalence of hypergly-cemia in pregnancy. Diabetes Res Clin Pract. 2014;103:176–85.
3. Chu SY, Callaghan WM, Kim SY, et al. Maternal obesity and riskof gestational diabetes mellitus. Diabetes Care. 2007;30:2070–6.
4. Karcaaltincaba D, Kandemir O, Yalvac S, Güvendag-Guven S,Haberal A. Prevalence of gestational diabetes mellitus and gesta-tional impaired glucose tolerance in pregnant women evaluated byNational Diabetes Data Group and Carpenter and Coustan criteria.Int J Gynaecol Obstet. 2009;106(3):246–9.
5. Ogden CL, Flegal KM, Carroll MD, et al. Prevalence and trends inoverweight among US children and adolescents, 1999-2000.JAMA. 2002;288:1728.
6. Instituto Nacional de Estadística y Geografía (INEGI). Natalidad yFecundidad. Porcentaje de nacimientos registrados de madresadolescentes (menores de 20 años). https://www.inegi.org.mx/temas/natalidad/. Accesed 14 January 2020.
7. International Association of Diabetes and Pregnancy Study GroupsConsensus Panel. International Association of Diabetes andPregnancy Study Groups recommendations on the diagnosis andclassification of hyperglycemia in pregnancy. Diabetes Care.2010;33:676–82.
8. National Institute for Health and Clinical Excellence. Diabetes inpregnancy: management from preconception to the postnatal peri-od. Great Britain. The Royal College of Obstetricians andGynaecologists 2015. https://www.nice.org.uk/guidance/ng3/resources /d iabetes- in -pregnancy-management - f rom-preconception-to-the-postnatal-period-51038446021. Accesed 11November 2019.
9. Metzger BE, Buchanan TA, Coustan DR, De Leiva A, Dunger DB,Hadden DR, et al. Summary and recommendations of the FifthInternational Workshop- Conference on Gestational DiabetesMellitus. Diabetes Care. 2007;30:251–60.
10. American College of Obstetricians and Gynecologists; Task forceon hypertension in pregnancy: hypertension in pregnancy. Reportof the American College of Obstetricians and Gynecologists’ TaskForce on Hypertension in Pregnancy. Obstet Gynecol. 2013;122:1122–31.
11. American College of Obstetricians and Gynecologists. ACOGPractice Bulletin No. 76 Postpartum hemorrhage. Int J GynecolObstet. 2006;108:1039–47.
12. Villar J, Cheikh Ismail L, Victora CG, Ohuma EO, et al.International standards for newborn weight, length, and head cir-cumference by gestational age and sex: the newborn cross-sectionals tudy of the INTERGROWTH-21st Project . Lancet .2014;384(9946):857–68.
13. American College of Obstetricians and Gynecologists. ACOGPractice Bulletin No. 160: Premature Rupture of Membranes.Obstet Gynecol. 2016;127(1):e39–51. https://doi.org/10.1097/AOG.0000000000001266.
14. FeldkampML, Carey JC, JLB B, Krikov S, Botto LD. Etiology andclinical presentation of birth defects: a population-based study.BMJ. 2017;357:j2249.
15. Brown FM, Wyckoff J. Application of one-step IADPSG versustwo-step diagnostic criteria for gestational diabetes in the realworld: impact on health services, clinical care, and outcomes.Curr Diab Rep. 2017;17(10):85.
16. Reyes-Muñoz E, Reyes-Mayoral C, Sandoval-Osuna NL, et al.Prevalencia y resultados perinatales adversos en adolescentes condiabetes mellitus gestacional según tres criterios diagnósticosinternacionales. Ginecol Obstet Mex. 2017;85(5):298–305 http://
219Int J Diabetes Dev Ctries (2021) 41:212–220
www.scielo.org.mx/scielo.php?script=sci_arttext&pid=S0300-90412017000500298&lng=es. Accesed 2 March 2020.
17. Sevket O, Ates S, Uysal O. To evaluate the prevalence and clinicaloutcomes using a one-step method versus a two-step method toscreen gestational diabetes mellitus. J Matern Fetal Neonatal Med.2014;27(1):36–41.
18. Waters TP, Dyer AR, Scholtens DM, Dooley SL, Herer E, LoweLP, et al. Maternal and neonatal morbidity for women who wouldbe added to the diagnosis of GDM using IADPSG criteria: a sec-ondary analysis of the hyperglycemia and adverse pregnancy out-come study. Diabetes Care. 2016;39(12):2204–10.
19. Hirst JE, Tran TS, Do MA, Morris JM, Jeffery HE. Consequencesof gestational diabetes in an urban hospital in Viet Nam: a prospec-tive cohort study. PLoS Med. 2012;9(7):e1001272.
20. Zhu WW, Yang HX, Wei YM, et al. Evaluation of the value offasting plasma glucose in the first prenatal visit to diagnose gesta-tional diabetes mellitus in China. Diabetes Care. 2013;36(3):586–90. https://doi.org/10.2337/dc12-1157.
21. Benhalima K, Lens K, Bosteels J, Chantal M. The risk for glucoseintolerance after gestational diabetes mellitus since the introductionof the IADPSG criteria: a systematic review and meta-analysis. JClin Med. 2019;8(9):1431. https://doi.org/10.3390/jcm8091431.
22. Kramer CK, Campbell S, Retnakaran R. Gestational diabetes andthe risk of cardiovascular disease in woman: a systematic reviewand meta-analysis. Diabetologia. 2019;62(6):905–14.
23. Shah BR, Retnakaran R, Booth GL. Increased risk of cardiovascu-lar disease in young women following gestational diabetes mellitus.Diabetes Care. 2008;31(8):1668–9.
24. Zhu Y, Zhang C. Prevalence of gestational diabetes and risk ofprogression to type 2 diabetes: a global perspective. Curr DiabRep. 2016;16(1):7. https://doi.org/10.1007/s11892-015-0699-x.
Publisher’s note Springer Nature remains neutral with regard to jurisdic-tional claims in published maps and institutional affiliations.
220 Int J Diabetes Dev Ctries (2021) 41:212–220
ORIGINAL ARTICLE
Prevalence of diabetes mellitus and hypertension during pregnancyin eastern China after the implementation of universaltwo-child policy
Zheng Feei Ma1 & Hang Zhou2,3& Jingjie Ma4 & Yiming Lu2,5
& Binyu Pan6
Received: 23 January 2020 /Accepted: 15 September 2020# Research Society for Study of Diabetes in India 2020
AbstractAims Few studies have assessed the prevalence of diabetes and hypertension among pregnant women in China after theimplementation of universal two-child policy. Therefore, the aim of the study was to determine the prevalence of diabetes andhypertension from 2016 to 2018 among pregnant women in Jiangsu, China, after the policy implementation.Methods We analysed data from pregnant women who delivered their neonates between 2016 and 2018 in theNorthern Jiangsu People’s Hospital. All pregnant women irrespective of their gestation weeks underwent oral glu-cose intolerance tests in a fasting state.Results A total of 3262 pregnant women were included. The overall prevalence of diabetes and hypertension in pregnant womenwas 21.8% and 2.4%, respectively. In addition, the prevalence of low birth weight (LBW) and macrosomia for participants withdiabetes was significantly higher than those without diabetes (LBW: 4.4. vs. 2.6%, p = 0.017; macrosomia: 10.1 vs. 5.8%,p < 0.001). There was a significant increasing trend in the prevalence of diabetes, which was from 18.9% in 2016 to 25.4% in2018 (p < 0.001). Similarly, there was also a significant increasing trend in the prevalence of diabetes across the increasing agegroup (from 16.4% in 18–24 years to 47.6% in 40–45 years) (p < 0.001).Conclusion Our study reported a high prevalence of diabetes among this sample of Chinese pregnant women. In addition,advanced maternal age was found to be a risk factor of diabetes in pregnant women. Therefore, in view of high prevalence ofdiabetes, screening for diabetes in pregnant women is strongly recommended, regardless of their age, BMI, and gestation weeks.
Keywords Diabetes . Hypertension . Pregnancy . Advancedmaternal age . China
Introduction
The prevalence of diabetes mellitus and hypertension is in-creasing globally and these numbers include pregnant women[1]. Pregnant women with pre-existing diabetes or gestationaldiabetes are at increased risk of pre-term delivery, congenitaldefects, and macrosomia [2, 3]. In addition, diabetes duringpregnancy is also associated with a higher risk of developingdiabetes and obesity in children later in life [2]. Similarly,pregnant women with pre-existing hypertension or gestationalhypertension have a higher risk of developing cardiovasculardisease (CVD), chronic renal disease, and heart failure [4].Therefore, diabetes and hypertension during pregnancy arethe commonly seen pregnancy complications that can ad-versely influence the maternal and fetal outcomes [2].
In 2015, China introduced the universal two-child policy inorder to address the aging issue in the Chinese population [5].Following this, there is an increase in the number of births and
* Hang [email protected]
1 Department of Health and Environmental Sciences, Xi’anJiaotong-Liverpool University, Suzhou 215123,Jiangsu Province, China
2 Clinical Medical College, Yangzhou University,Yangzhou 225009, Jiangsu Province, China
3 Department of Clinical Nutrition, Northern Jiangsu People’sHospital, Yangzhou 225001, Jiangsu Province, China
4 Baoji Maternity and Child Health Care Hospital, No. 2 EasternSection of Xinjian Road, Weibin District, Baoji 712000,Shaanxi, China
5 Department of Orthopedics, Northern Jiangsu People’s Hospital,Yangzhou, Jiangsu Province 225001, China
6 Department of Clinical Nutrition, Suzhou Ninth People’s Hospital,Suzhou 215200, Jiangsu Province, China
https://doi.org/10.1007/s13410-020-00872-x
/ Published online: 9 October 2020
International Journal of Diabetes in Developing Countries (2021) 41:221–227
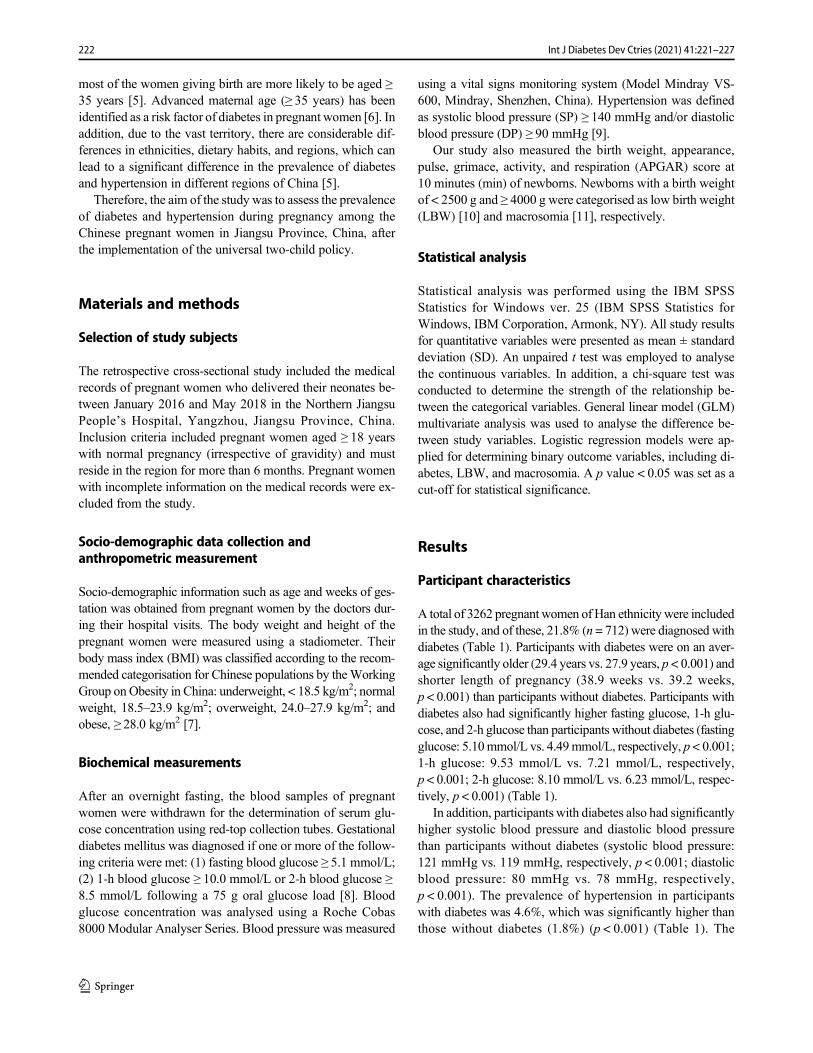
most of the women giving birth are more likely to be aged ≥35 years [5]. Advanced maternal age (≥ 35 years) has beenidentified as a risk factor of diabetes in pregnant women [6]. Inaddition, due to the vast territory, there are considerable dif-ferences in ethnicities, dietary habits, and regions, which canlead to a significant difference in the prevalence of diabetesand hypertension in different regions of China [5].
Therefore, the aim of the study was to assess the prevalenceof diabetes and hypertension during pregnancy among theChinese pregnant women in Jiangsu Province, China, afterthe implementation of the universal two-child policy.
Materials and methods
Selection of study subjects
The retrospective cross-sectional study included the medicalrecords of pregnant women who delivered their neonates be-tween January 2016 and May 2018 in the Northern JiangsuPeople’s Hospital, Yangzhou, Jiangsu Province, China.Inclusion criteria included pregnant women aged ≥ 18 yearswith normal pregnancy (irrespective of gravidity) and mustreside in the region for more than 6 months. Pregnant womenwith incomplete information on the medical records were ex-cluded from the study.
Socio-demographic data collection andanthropometric measurement
Socio-demographic information such as age and weeks of ges-tation was obtained from pregnant women by the doctors dur-ing their hospital visits. The body weight and height of thepregnant women were measured using a stadiometer. Theirbody mass index (BMI) was classified according to the recom-mended categorisation for Chinese populations by theWorkingGroup on Obesity in China: underweight, < 18.5 kg/m2; normalweight, 18.5–23.9 kg/m2; overweight, 24.0–27.9 kg/m2; andobese, ≥ 28.0 kg/m2 [7].
Biochemical measurements
After an overnight fasting, the blood samples of pregnantwomen were withdrawn for the determination of serum glu-cose concentration using red-top collection tubes. Gestationaldiabetes mellitus was diagnosed if one or more of the follow-ing criteria were met: (1) fasting blood glucose ≥ 5.1 mmol/L;(2) 1-h blood glucose ≥ 10.0 mmol/L or 2-h blood glucose ≥8.5 mmol/L following a 75 g oral glucose load [8]. Bloodglucose concentration was analysed using a Roche Cobas8000 Modular Analyser Series. Blood pressure was measured
using a vital signs monitoring system (Model Mindray VS-600, Mindray, Shenzhen, China). Hypertension was definedas systolic blood pressure (SP) ≥ 140 mmHg and/or diastolicblood pressure (DP) ≥ 90 mmHg [9].
Our study also measured the birth weight, appearance,pulse, grimace, activity, and respiration (APGAR) score at10 minutes (min) of newborns. Newborns with a birth weightof < 2500 g and ≥ 4000 g were categorised as low birth weight(LBW) [10] and macrosomia [11], respectively.
Statistical analysis
Statistical analysis was performed using the IBM SPSSStatistics for Windows ver. 25 (IBM SPSS Statistics forWindows, IBM Corporation, Armonk, NY). All study resultsfor quantitative variables were presented as mean ± standarddeviation (SD). An unpaired t test was employed to analysethe continuous variables. In addition, a chi-square test wasconducted to determine the strength of the relationship be-tween the categorical variables. General linear model (GLM)multivariate analysis was used to analyse the difference be-tween study variables. Logistic regression models were ap-plied for determining binary outcome variables, including di-abetes, LBW, and macrosomia. A p value < 0.05 was set as acut-off for statistical significance.
Results
Participant characteristics
A total of 3262 pregnant women ofHan ethnicity were includedin the study, and of these, 21.8% (n = 712) were diagnosed withdiabetes (Table 1). Participants with diabetes were on an aver-age significantly older (29.4 years vs. 27.9 years, p < 0.001) andshorter length of pregnancy (38.9 weeks vs. 39.2 weeks,p < 0.001) than participants without diabetes. Participants withdiabetes also had significantly higher fasting glucose, 1-h glu-cose, and 2-h glucose than participants without diabetes (fastingglucose: 5.10mmol/L vs. 4.49mmol/L, respectively, p < 0.001;1-h glucose: 9.53 mmol/L vs. 7.21 mmol/L, respectively,p < 0.001; 2-h glucose: 8.10 mmol/L vs. 6.23 mmol/L, respec-tively, p < 0.001) (Table 1).
In addition, participants with diabetes also had significantlyhigher systolic blood pressure and diastolic blood pressurethan participants without diabetes (systolic blood pressure:121 mmHg vs. 119 mmHg, respectively, p < 0.001; diastolicblood pressure: 80 mmHg vs. 78 mmHg, respectively,p < 0.001). The prevalence of hypertension in participantswith diabetes was 4.6%, which was significantly higher thanthose without diabetes (1.8%) (p < 0.001) (Table 1). The
222 Int J Diabetes Dev Ctries (2021) 41:221–227
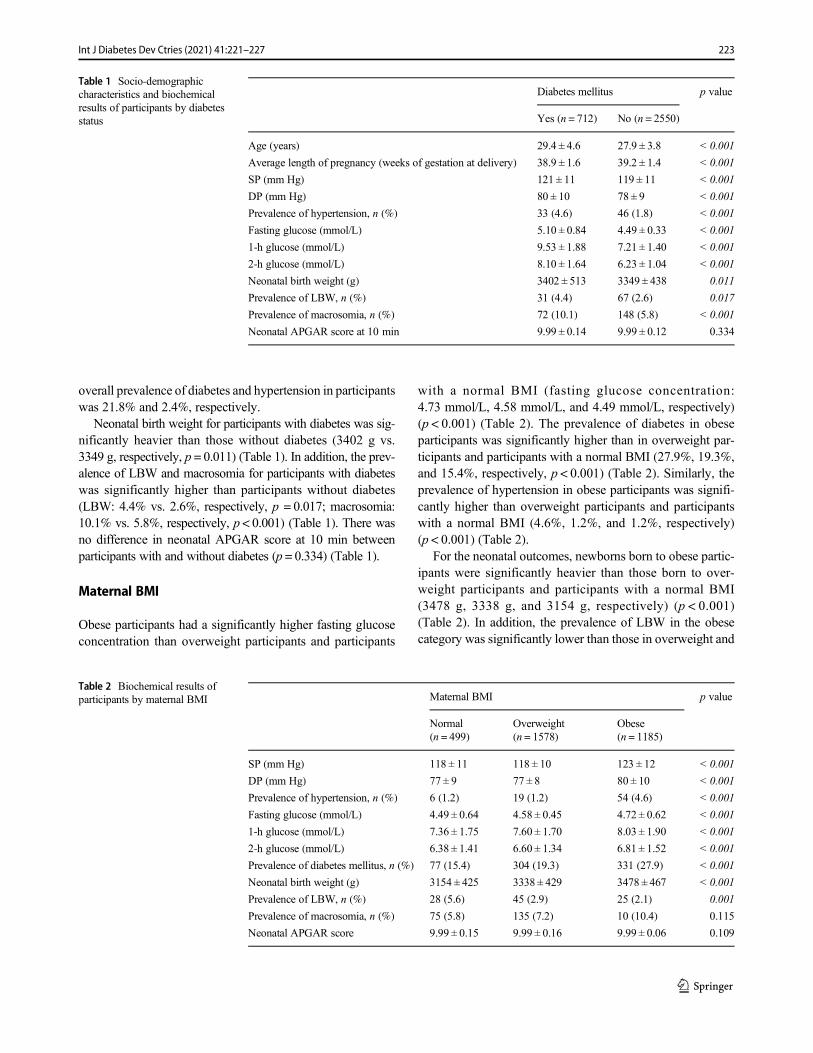
overall prevalence of diabetes and hypertension in participantswas 21.8% and 2.4%, respectively.
Neonatal birth weight for participants with diabetes was sig-nificantly heavier than those without diabetes (3402 g vs.3349 g, respectively, p = 0.011) (Table 1). In addition, the prev-alence of LBW and macrosomia for participants with diabeteswas significantly higher than participants without diabetes(LBW: 4.4% vs. 2.6%, respectively, p = 0.017; macrosomia:10.1% vs. 5.8%, respectively, p < 0.001) (Table 1). There wasno difference in neonatal APGAR score at 10 min betweenparticipants with and without diabetes (p = 0.334) (Table 1).
Maternal BMI
Obese participants had a significantly higher fasting glucoseconcentration than overweight participants and participants
with a normal BMI (fasting glucose concentration:4.73 mmol/L, 4.58 mmol/L, and 4.49 mmol/L, respectively)(p < 0.001) (Table 2). The prevalence of diabetes in obeseparticipants was significantly higher than in overweight par-ticipants and participants with a normal BMI (27.9%, 19.3%,and 15.4%, respectively, p < 0.001) (Table 2). Similarly, theprevalence of hypertension in obese participants was signifi-cantly higher than overweight participants and participantswith a normal BMI (4.6%, 1.2%, and 1.2%, respectively)(p < 0.001) (Table 2).
For the neonatal outcomes, newborns born to obese partic-ipants were significantly heavier than those born to over-weight participants and participants with a normal BMI(3478 g, 3338 g, and 3154 g, respectively) (p < 0.001)(Table 2). In addition, the prevalence of LBW in the obesecategory was significantly lower than those in overweight and
Table 1 Socio-demographiccharacteristics and biochemicalresults of participants by diabetesstatus
Diabetes mellitus p value
Yes (n = 712) No (n = 2550)
Age (years) 29.4 ± 4.6 27.9 ± 3.8 < 0.001
Average length of pregnancy (weeks of gestation at delivery) 38.9 ± 1.6 39.2 ± 1.4 < 0.001
SP (mm Hg) 121 ± 11 119 ± 11 < 0.001
DP (mm Hg) 80 ± 10 78 ± 9 < 0.001
Prevalence of hypertension, n (%) 33 (4.6) 46 (1.8) < 0.001
Fasting glucose (mmol/L) 5.10 ± 0.84 4.49 ± 0.33 < 0.001
1-h glucose (mmol/L) 9.53 ± 1.88 7.21 ± 1.40 < 0.001
2-h glucose (mmol/L) 8.10 ± 1.64 6.23 ± 1.04 < 0.001
Neonatal birth weight (g) 3402 ± 513 3349 ± 438 0.011
Prevalence of LBW, n (%) 31 (4.4) 67 (2.6) 0.017
Prevalence of macrosomia, n (%) 72 (10.1) 148 (5.8) < 0.001
Neonatal APGAR score at 10 min 9.99 ± 0.14 9.99 ± 0.12 0.334
Table 2 Biochemical results ofparticipants by maternal BMI Maternal BMI p value
Normal(n = 499)
Overweight(n = 1578)
Obese(n = 1185)
SP (mm Hg) 118 ± 11 118 ± 10 123 ± 12 < 0.001
DP (mm Hg) 77 ± 9 77 ± 8 80 ± 10 < 0.001
Prevalence of hypertension, n (%) 6 (1.2) 19 (1.2) 54 (4.6) < 0.001
Fasting glucose (mmol/L) 4.49 ± 0.64 4.58 ± 0.45 4.72 ± 0.62 < 0.001
1-h glucose (mmol/L) 7.36 ± 1.75 7.60 ± 1.70 8.03 ± 1.90 < 0.001
2-h glucose (mmol/L) 6.38 ± 1.41 6.60 ± 1.34 6.81 ± 1.52 < 0.001
Prevalence of diabetes mellitus, n (%) 77 (15.4) 304 (19.3) 331 (27.9) < 0.001
Neonatal birth weight (g) 3154 ± 425 3338 ± 429 3478 ± 467 < 0.001
Prevalence of LBW, n (%) 28 (5.6) 45 (2.9) 25 (2.1) 0.001
Prevalence of macrosomia, n (%) 75 (5.8) 135 (7.2) 10 (10.4) 0.115
Neonatal APGAR score 9.99 ± 0.15 9.99 ± 0.16 9.99 ± 0.06 0.109
223Int J Diabetes Dev Ctries (2021) 41:221–227
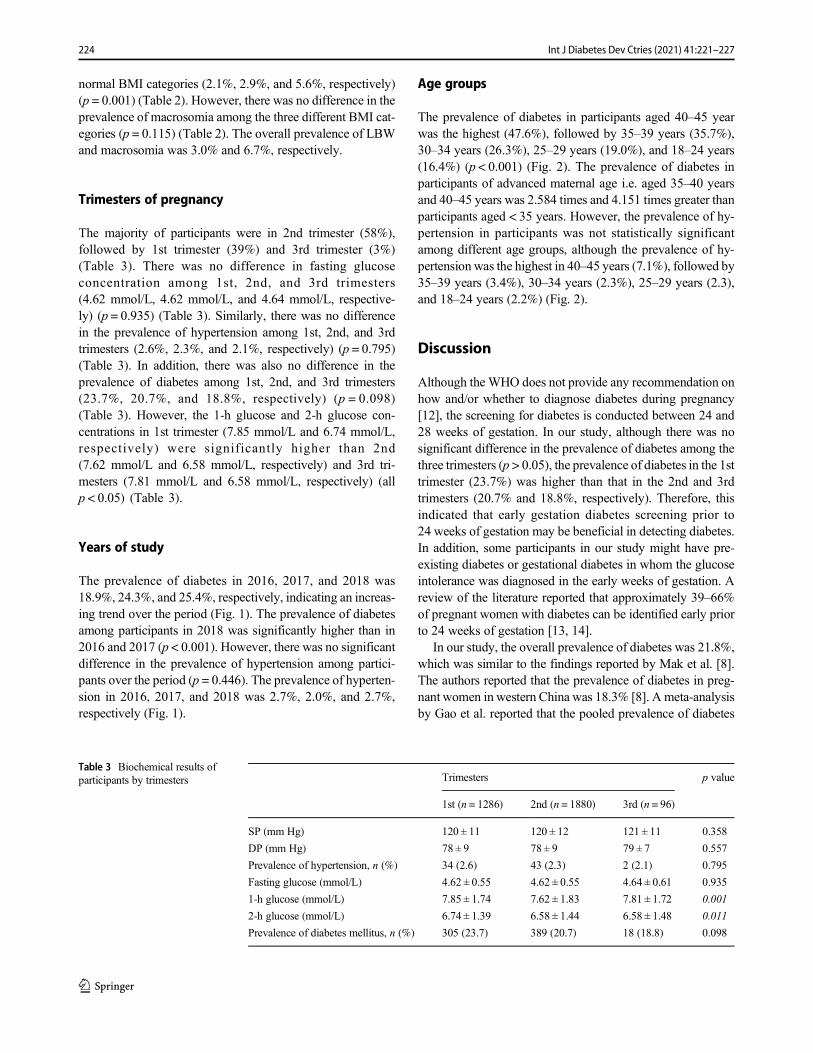
normal BMI categories (2.1%, 2.9%, and 5.6%, respectively)(p = 0.001) (Table 2). However, there was no difference in theprevalence of macrosomia among the three different BMI cat-egories (p = 0.115) (Table 2). The overall prevalence of LBWand macrosomia was 3.0% and 6.7%, respectively.
Trimesters of pregnancy
The majority of participants were in 2nd trimester (58%),followed by 1st trimester (39%) and 3rd trimester (3%)(Table 3). There was no difference in fasting glucoseconcentration among 1st, 2nd, and 3rd trimesters(4.62 mmol/L, 4.62 mmol/L, and 4.64 mmol/L, respective-ly) (p = 0.935) (Table 3). Similarly, there was no differencein the prevalence of hypertension among 1st, 2nd, and 3rdtrimesters (2.6%, 2.3%, and 2.1%, respectively) (p = 0.795)(Table 3). In addition, there was also no difference in theprevalence of diabetes among 1st, 2nd, and 3rd trimesters(23.7%, 20.7%, and 18.8%, respectively) (p = 0.098)(Table 3). However, the 1-h glucose and 2-h glucose con-centrations in 1st trimester (7.85 mmol/L and 6.74 mmol/L,respectively) were significantly higher than 2nd(7.62 mmol/L and 6.58 mmol/L, respectively) and 3rd tri-mesters (7.81 mmol/L and 6.58 mmol/L, respectively) (allp < 0.05) (Table 3).
Years of study
The prevalence of diabetes in 2016, 2017, and 2018 was18.9%, 24.3%, and 25.4%, respectively, indicating an increas-ing trend over the period (Fig. 1). The prevalence of diabetesamong participants in 2018 was significantly higher than in2016 and 2017 (p < 0.001). However, there was no significantdifference in the prevalence of hypertension among partici-pants over the period (p = 0.446). The prevalence of hyperten-sion in 2016, 2017, and 2018 was 2.7%, 2.0%, and 2.7%,respectively (Fig. 1).
Age groups
The prevalence of diabetes in participants aged 40–45 yearwas the highest (47.6%), followed by 35–39 years (35.7%),30–34 years (26.3%), 25–29 years (19.0%), and 18–24 years(16.4%) (p < 0.001) (Fig. 2). The prevalence of diabetes inparticipants of advanced maternal age i.e. aged 35–40 yearsand 40–45 years was 2.584 times and 4.151 times greater thanparticipants aged < 35 years. However, the prevalence of hy-pertension in participants was not statistically significantamong different age groups, although the prevalence of hy-pertension was the highest in 40–45 years (7.1%), followed by35–39 years (3.4%), 30–34 years (2.3%), 25–29 years (2.3),and 18–24 years (2.2%) (Fig. 2).
Discussion
Although the WHO does not provide any recommendation onhow and/or whether to diagnose diabetes during pregnancy[12], the screening for diabetes is conducted between 24 and28 weeks of gestation. In our study, although there was nosignificant difference in the prevalence of diabetes among thethree trimesters (p > 0.05), the prevalence of diabetes in the 1sttrimester (23.7%) was higher than that in the 2nd and 3rdtrimesters (20.7% and 18.8%, respectively). Therefore, thisindicated that early gestation diabetes screening prior to24 weeks of gestation may be beneficial in detecting diabetes.In addition, some participants in our study might have pre-existing diabetes or gestational diabetes in whom the glucoseintolerance was diagnosed in the early weeks of gestation. Areview of the literature reported that approximately 39–66%of pregnant women with diabetes can be identified early priorto 24 weeks of gestation [13, 14].
In our study, the overall prevalence of diabetes was 21.8%,which was similar to the findings reported by Mak et al. [8].The authors reported that the prevalence of diabetes in preg-nant women in western China was 18.3% [8]. A meta-analysisby Gao et al. reported that the pooled prevalence of diabetes
Table 3 Biochemical results ofparticipants by trimesters Trimesters p value
1st (n = 1286) 2nd (n = 1880) 3rd (n = 96)
SP (mm Hg) 120 ± 11 120 ± 12 121 ± 11 0.358
DP (mm Hg) 78 ± 9 78 ± 9 79 ± 7 0.557
Prevalence of hypertension, n (%) 34 (2.6) 43 (2.3) 2 (2.1) 0.795
Fasting glucose (mmol/L) 4.62 ± 0.55 4.62 ± 0.55 4.64 ± 0.61 0.935
1-h glucose (mmol/L) 7.85 ± 1.74 7.62 ± 1.83 7.81 ± 1.72 0.001
2-h glucose (mmol/L) 6.74 ± 1.39 6.58 ± 1.44 6.58 ± 1.48 0.011
Prevalence of diabetes mellitus, n (%) 305 (23.7) 389 (20.7) 18 (18.8) 0.098
224 Int J Diabetes Dev Ctries (2021) 41:221–227
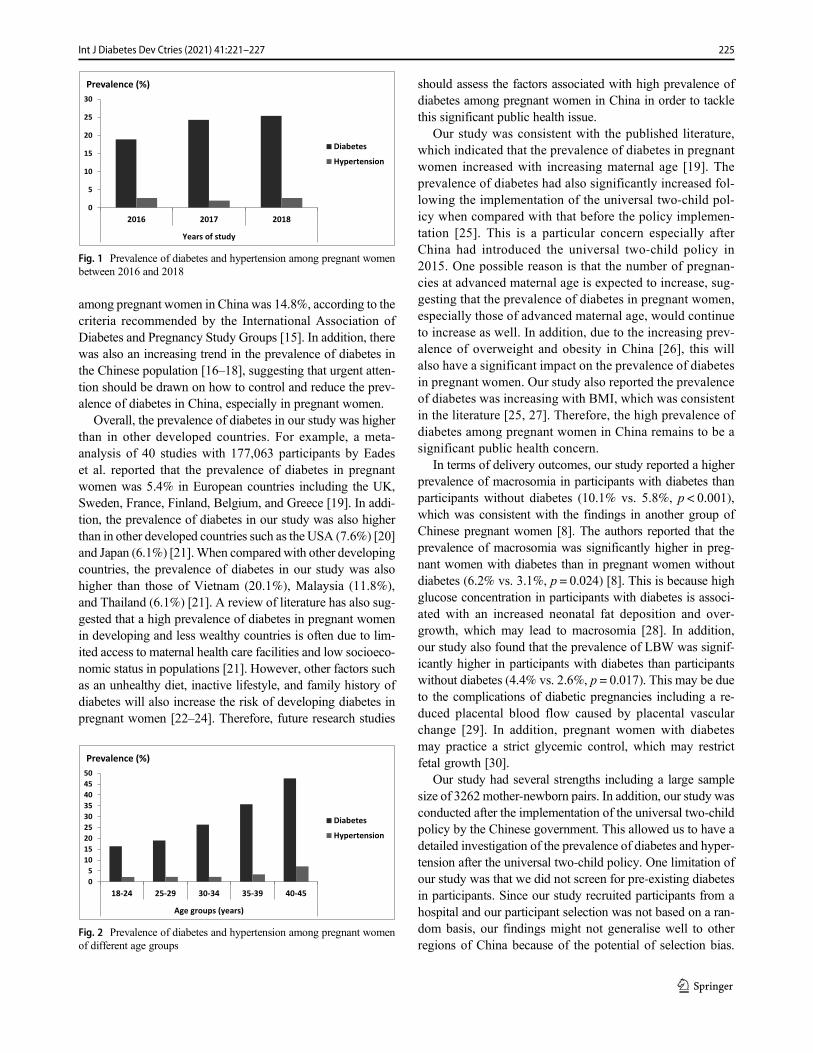
among pregnant women in China was 14.8%, according to thecriteria recommended by the International Association ofDiabetes and Pregnancy Study Groups [15]. In addition, therewas also an increasing trend in the prevalence of diabetes inthe Chinese population [16–18], suggesting that urgent atten-tion should be drawn on how to control and reduce the prev-alence of diabetes in China, especially in pregnant women.
Overall, the prevalence of diabetes in our study was higherthan in other developed countries. For example, a meta-analysis of 40 studies with 177,063 participants by Eadeset al. reported that the prevalence of diabetes in pregnantwomen was 5.4% in European countries including the UK,Sweden, France, Finland, Belgium, and Greece [19]. In addi-tion, the prevalence of diabetes in our study was also higherthan in other developed countries such as the USA (7.6%) [20]and Japan (6.1%) [21].When compared with other developingcountries, the prevalence of diabetes in our study was alsohigher than those of Vietnam (20.1%), Malaysia (11.8%),and Thailand (6.1%) [21]. A review of literature has also sug-gested that a high prevalence of diabetes in pregnant womenin developing and less wealthy countries is often due to lim-ited access to maternal health care facilities and low socioeco-nomic status in populations [21]. However, other factors suchas an unhealthy diet, inactive lifestyle, and family history ofdiabetes will also increase the risk of developing diabetes inpregnant women [22–24]. Therefore, future research studies
should assess the factors associated with high prevalence ofdiabetes among pregnant women in China in order to tacklethis significant public health issue.
Our study was consistent with the published literature,which indicated that the prevalence of diabetes in pregnantwomen increased with increasing maternal age [19]. Theprevalence of diabetes had also significantly increased fol-lowing the implementation of the universal two-child pol-icy when compared with that before the policy implemen-tation [25]. This is a particular concern especially afterChina had introduced the universal two-child policy in2015. One possible reason is that the number of pregnan-cies at advanced maternal age is expected to increase, sug-gesting that the prevalence of diabetes in pregnant women,especially those of advanced maternal age, would continueto increase as well. In addition, due to the increasing prev-alence of overweight and obesity in China [26], this willalso have a significant impact on the prevalence of diabetesin pregnant women. Our study also reported the prevalenceof diabetes was increasing with BMI, which was consistentin the literature [25, 27]. Therefore, the high prevalence ofdiabetes among pregnant women in China remains to be asignificant public health concern.
In terms of delivery outcomes, our study reported a higherprevalence of macrosomia in participants with diabetes thanparticipants without diabetes (10.1% vs. 5.8%, p < 0.001),which was consistent with the findings in another group ofChinese pregnant women [8]. The authors reported that theprevalence of macrosomia was significantly higher in preg-nant women with diabetes than in pregnant women withoutdiabetes (6.2% vs. 3.1%, p = 0.024) [8]. This is because highglucose concentration in participants with diabetes is associ-ated with an increased neonatal fat deposition and over-growth, which may lead to macrosomia [28]. In addition,our study also found that the prevalence of LBW was signif-icantly higher in participants with diabetes than participantswithout diabetes (4.4% vs. 2.6%, p = 0.017). This may be dueto the complications of diabetic pregnancies including a re-duced placental blood flow caused by placental vascularchange [29]. In addition, pregnant women with diabetesmay practice a strict glycemic control, which may restrictfetal growth [30].
Our study had several strengths including a large samplesize of 3262mother-newborn pairs. In addition, our study wasconducted after the implementation of the universal two-childpolicy by the Chinese government. This allowed us to have adetailed investigation of the prevalence of diabetes and hyper-tension after the universal two-child policy. One limitation ofour study was that we did not screen for pre-existing diabetesin participants. Since our study recruited participants from ahospital and our participant selection was not based on a ran-dom basis, our findings might not generalise well to otherregions of China because of the potential of selection bias.
0
5
10
15
20
25
30
2016 2017 2018
Years of study
Prevalence (%)
DiabetesHypertension
Fig. 1 Prevalence of diabetes and hypertension among pregnant womenbetween 2016 and 2018
05
101520253035404550
18-24 25-29 30-34 35-39 40-45
Age groups (years)
Prevalence (%)
DiabetesHypertension
Fig. 2 Prevalence of diabetes and hypertension among pregnant womenof different age groups
225Int J Diabetes Dev Ctries (2021) 41:221–227
This is because to find out the prevalence or screening rate, theideal methodology is to do random sampling. Therefore, ourfindings should be interpreted cautiously. Future studiesshould consider including a larger group of pregnant womenand performing a random sampling in order to calculate theprevalence of diabetes and hypertension in pregnant women.
Conclusions
Our study reported a high prevalence of diabetes in this sam-ple of pregnant women. Therefore, in view of the high prev-alence of diabetes, screening for diabetes in pregnant womenis strongly recommended, regardless of their age, BMI, andgestation weeks. In addition, management and preventivemeasures of diabetes should also be undertaken in order toreduce the increased risk of developing adverse maternal anddelivery outcomes in diabetic pregnant women.
Compliance with ethical standards
The study was approved by the Ethics Committee of the Northern JiangsuPeople’s Hospital (reference no. 2018063).
Conflict of interest The authors declare that they have no conflict ofinterest.
Ethical approval All procedures performed in studies involving humanparticipants were in accordance with the ethical standards of the institu-tional and/or national research committee and with the 1964 Helsinkideclaration and its later amendments or comparable ethical standards.
Informed consent Informed consent was obtained from all individualparticipants included in the study. No animals were used in this study.
References
1. Zheng Y, Ley SH, Hu FB. Global aetiology and epidemiology oftype 2 diabetes mellitus and its complications. Nat Rev Endocrinol.2018;14:88–98. https://doi.org/10.1038/nrendo.2017.151.
2. American Diabetes Association. Management of diabetes in preg-nancy: standards of medical care in diabetes—2019. Diabetes Care.2019;42:S165–S72. https://doi.org/10.2337/dc19-S014.
3. Ji J, He Z, Yang Z, Mi Y, Guo N, Zhao H, et al. Comparing theefficacy and safety of insulin detemir versus neutral protamineHagedorn insulin in treatment of diabetes during pregnancy: a ran-domized, controlled study. BMJ Open Diabetes Res Care. 2020;8:e001155. https://doi.org/10.1136/bmjdrc-2019-001155.
4. Tranquilli AL. Hypertension during pregnancy is associated withincreased risk of later cardiovascular disease, kidney disease anddiabetes. Evid Based Nurs. 2014;17:36–7. https://doi.org/10.1136/eb-2013-101322.
5. Li H-t, Xue M, Hellerstein S, Cai Y, Gao Y, Zhang Y, et al.Association of China’s universal two child policy with changes inbirths and birth related health factors: national, descriptive compar-ative study. BMJ. 2019;366:l4680. https://doi.org/10.1136/bmj.l4680.
6. Makgoba M, Savvidou MD, Steer PJ. An analysis of the interrela-tionship between maternal age, bodymass index and racial origin inthe development of gestational diabetes mellitus. BJOG. 2012;119:276–82. https://doi.org/10.1111/j.1471-0528.2011.03156.x.
7. Zhou H, Lu Y, Pan B, Zhao Q, Ma ZF. Iodine deficiency asassessed by neonatal TSH in a sample of mother-and-newborn pairsin Jiangsu Province, China. Biol Trace Elem Res. 2020. https://doi.org/10.1007/s12011-020-02135-6.
8. Mak JKL, Lee AH, Pham NM, Pan XF, Tang L, Binns CW, et al.Gestational diabetes incidence and delivery outcomes in WesternChina: a prospective cohort study. Birth. 2019;46:166–72. https://doi.org/10.1111/birt.12397.
9. Moser M, Brown CM, Rose CH, Garovic VD. Hypertension inpregnancy: is it time for a new approach to treatment? JHypertens. 2012;30:1092–100. https://doi.org/10.1097/HJH.0b013e3283536319.
10. WHO. International statistical classification of diseases and relatedhealth problems. Geneva: WHO; 2004.
11. Ye J, Torloni MR, Ota E, Jayaratne K, Pileggi-Castro C, Ortiz-Panozo E, et al. Searching for the definition of macrosomia throughan outcome-based approach in low- andmiddle-income countries: asecondary analysis of the WHO Global Survey in Africa, Asia andLatin America. BMC Pregnancy Childbirth. 2015;15:324. https://doi.org/10.1186/s12884-015-0765-z.
12. WHO Reproductive Health Library. WHO recommendation on thediagnosis of gestational diabetes in pregnancy. Geneva: WHO;2016.
13. Meyer WJ, Carbone J, Gauthier DW, Gottmann DA. Early gesta-tional glucose screening and gestational diabetes. J Reprod Med.1996;41:675–9.
14. Seshiah V, Balaji V, Balaji MS, Paneerselvam A, Arthi T,Thamizharasi M, et al. Gestational diabetes mellitus manifests inall trimesters of pregnancy. Diabetes Res Clin Pract. 2007;77:482–4. https://doi.org/10.1016/j.diabres.2007.01.001.
15. Gao C, Sun X, Lu L, Liu F, Yuan J. Prevalence of gestationaldiabetes mellitus in mainland China: a systematic review and me-ta-analysis. J Diabetes Investig. 2019;10:154–62. https://doi.org/10.1111/jdi.12854.
16. Gao WG, Dong YH, Pang ZC, Nan HR, Zhang L, Wang SJ, et al.Increasing trend in the prevalence of type 2 diabetes and pre-diabetes in the Chinese rural and urban population in Qingdao,China. Diabet Med. 2009;26:1220–7. https://doi.org/10.1111/j.1464-5491.2009.02832.x.
17. Zhang F, Dong L, Zhang C, Li B, Wen J, Gao W, et al. Increasingprevalence of gestational diabetes mellitus in Chinese women from1999 to 2008. Diabet Med. 2011;28:652–7.
18. Hu C, Jia W. Diabetes in China: epidemiology and genetic riskfactors and their clinical utility in personalized medication.Diabetes. 2018;67:3–11. https://doi.org/10.2337/dbi17-0013.
19. Eades CE, Cameron DM, Evans JMM. Prevalence of gestationaldiabetes mellitus in Europe: a meta-analysis. Diabetes Res ClinPract. 2017;129:173–81. https://doi.org/10.1016/j.diabres.2017.03.030.
20. Casagrande SS, Linder B, Cowie CC. Prevalence of gestationaldiabetes and subsequent type 2 diabetes among U.S. women.Diabetes Res Clin Pract. 2018;141:200–8. https://doi.org/10.1016/j.diabres.2018.05.010.
21. Nguyen CL, Pham NM, Binns CW, Duong DV, Lee AH.Prevalence of gestational diabetes mellitus in eastern and southeast-ern Asia: a systematic review and meta-analysis. J Diabetes Res.2018;2018:1–10.
22. Sami W, Ansari T, Butt NS, Hamid MRA. Effect of diet on type 2diabetes mellitus: a review. Int J Health Sci. 2017;11:65–71.
23. Kampmann U, Madsen LR, Skajaa GO, Iversen DS, Moeller N,Ovesen P. Gestational diabetes: a clinical update. World J Diabetes.2015;6:1065–72. https://doi.org/10.4239/wjd.v6.i8.1065.
226 Int J Diabetes Dev Ctries (2021) 41:221–227
24. Bao W, Tobias DK, Bowers K, Chavarro J, Vaag A, Grunnet LG,et al. Physical activity and sedentary behaviors associated with riskof progression from gestational diabetes mellitus to type 2 diabetesmellitus: a prospective cohort study. JAMA Intern Med. 2014;174:1047–55. https://doi.org/10.1001/jamainternmed.2014.1795.
25. Miao M, Dai M, Zhang Y, Sun F, Guo X, Sun G. Influence ofmaternal overweight, obesity and gestational weight gain on theperinatal outcomes in women with gestational diabetes mellitus.Sci Rep. 2017;7:305. https://doi.org/10.1038/s41598-017-00441-z.
26. Chen Y, Peng Q, Yang Y, Zheng S, Wang Y, Lu W. The preva-lence and increasing trends of overweight, general obesity, andabdominal obesity among Chinese adults: a repeated cross-sectional study. BMC Public Health. 2019;19:1293. https://doi.org/10.1186/s12889-019-7633-0.
27. Solomon CG, Willett WC, Carey VJ, Rich-Edwards J, Hunter DJ,Colditz GA, et al. A prospective study of pregravid determinants ofgestational diabetes mellitus. JAMA. 1997;278:1078–83.
28. Metzger BE, Gabbe SG, Persson B, Buchanan TA, Catalano PA,Damm P, et al. International association of diabetes and pregnancystudy groups recommendations on the diagnosis and classificationof hyperglycemia in pregnancy. Diabetes Care. 2010;33:676–82.https://doi.org/10.2337/dc09-1848.
29. Ornoy A. Prenatal origin of obesity and their complications: gesta-tional diabetes, maternal overweight and the paradoxical effects offetal growth restriction and macrosomia. Reprod Toxicol. 2011;32:205–12. https://doi.org/10.1016/j.reprotox.2011.05.002.
30. Parikh RM, Joshi SR, Menon PS, Shah NS. Intensive glycemiccontrol in diabetic pregnancy with intrauterine growth restrictionis detrimental to fetus. Med Hypotheses. 2007;69:203–5. https://doi.org/10.1016/j.mehy.2006.10.020.
Publisher’s note Springer Nature remains neutral with regard to jurisdic-tional claims in published maps and institutional affiliations.
227Int J Diabetes Dev Ctries (2021) 41:221–227
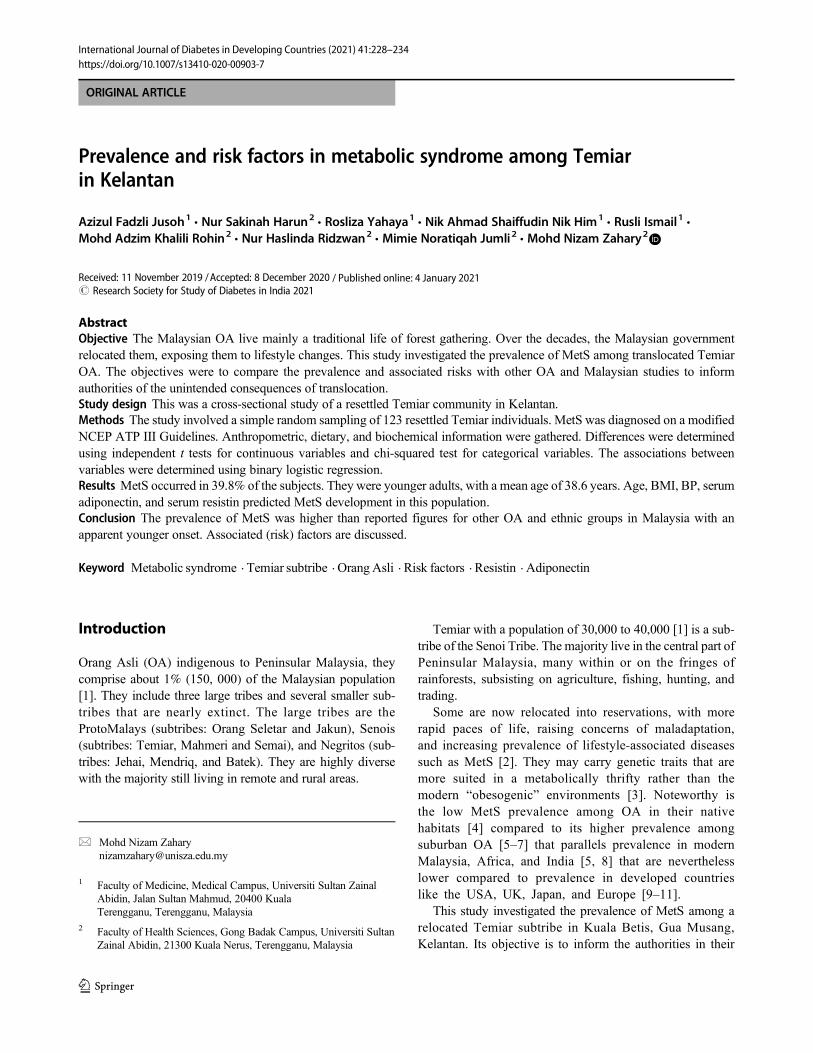
ORIGINAL ARTICLE
Prevalence and risk factors in metabolic syndrome among Temiarin Kelantan
Azizul Fadzli Jusoh1& Nur Sakinah Harun2
& Rosliza Yahaya1 & Nik Ahmad Shaiffudin Nik Him1& Rusli Ismail1 &
Mohd Adzim Khalili Rohin2& Nur Haslinda Ridzwan2
& Mimie Noratiqah Jumli2 & Mohd Nizam Zahary2
Received: 11 November 2019 /Accepted: 8 December 2020# Research Society for Study of Diabetes in India 2021
AbstractObjective The Malaysian OA live mainly a traditional life of forest gathering. Over the decades, the Malaysian governmentrelocated them, exposing them to lifestyle changes. This study investigated the prevalence of MetS among translocated TemiarOA. The objectives were to compare the prevalence and associated risks with other OA and Malaysian studies to informauthorities of the unintended consequences of translocation.Study design This was a cross-sectional study of a resettled Temiar community in Kelantan.Methods The study involved a simple random sampling of 123 resettled Temiar individuals. MetS was diagnosed on a modifiedNCEP ATP III Guidelines. Anthropometric, dietary, and biochemical information were gathered. Differences were determinedusing independent t tests for continuous variables and chi-squared test for categorical variables. The associations betweenvariables were determined using binary logistic regression.Results MetS occurred in 39.8% of the subjects. They were younger adults, with a mean age of 38.6 years. Age, BMI, BP, serumadiponectin, and serum resistin predicted MetS development in this population.Conclusion The prevalence of MetS was higher than reported figures for other OA and ethnic groups in Malaysia with anapparent younger onset. Associated (risk) factors are discussed.
Keyword Metabolic syndrome . Temiar subtribe . OrangAsli . Risk factors . Resistin . Adiponectin
Introduction
Orang Asli (OA) indigenous to Peninsular Malaysia, theycomprise about 1% (150, 000) of the Malaysian population[1]. They include three large tribes and several smaller sub-tribes that are nearly extinct. The large tribes are theProtoMalays (subtribes: Orang Seletar and Jakun), Senois(subtribes: Temiar, Mahmeri and Semai), and Negritos (sub-tribes: Jehai, Mendriq, and Batek). They are highly diversewith the majority still living in remote and rural areas.
Temiar with a population of 30,000 to 40,000 [1] is a sub-tribe of the Senoi Tribe. The majority live in the central part ofPeninsular Malaysia, many within or on the fringes ofrainforests, subsisting on agriculture, fishing, hunting, andtrading.
Some are now relocated into reservations, with morerapid paces of life, raising concerns of maladaptation,and increasing prevalence of lifestyle-associated diseasessuch as MetS [2]. They may carry genetic traits that aremore suited in a metabolically thrifty rather than themodern “obesogenic” environments [3]. Noteworthy isthe low MetS prevalence among OA in their nativehabitats [4] compared to its higher prevalence amongsuburban OA [5–7] that parallels prevalence in modernMalaysia, Africa, and India [5, 8] that are neverthelesslower compared to prevalence in developed countrieslike the USA, UK, Japan, and Europe [9–11].
This study investigated the prevalence of MetS among arelocated Temiar subtribe in Kuala Betis, Gua Musang,Kelantan. Its objective is to inform the authorities in their
* Mohd Nizam [email protected]
1 Faculty of Medicine, Medical Campus, Universiti Sultan ZainalAbidin, Jalan Sultan Mahmud, 20400 KualaTerengganu, Terengganu, Malaysia
2 Faculty of Health Sciences, Gong Badak Campus, Universiti SultanZainal Abidin, 21300 Kuala Nerus, Terengganu, Malaysia
https://doi.org/10.1007/s13410-020-00903-7
/ Published online: 4 January 2021
International Journal of Diabetes in Developing Countries (2021) 41:228–234
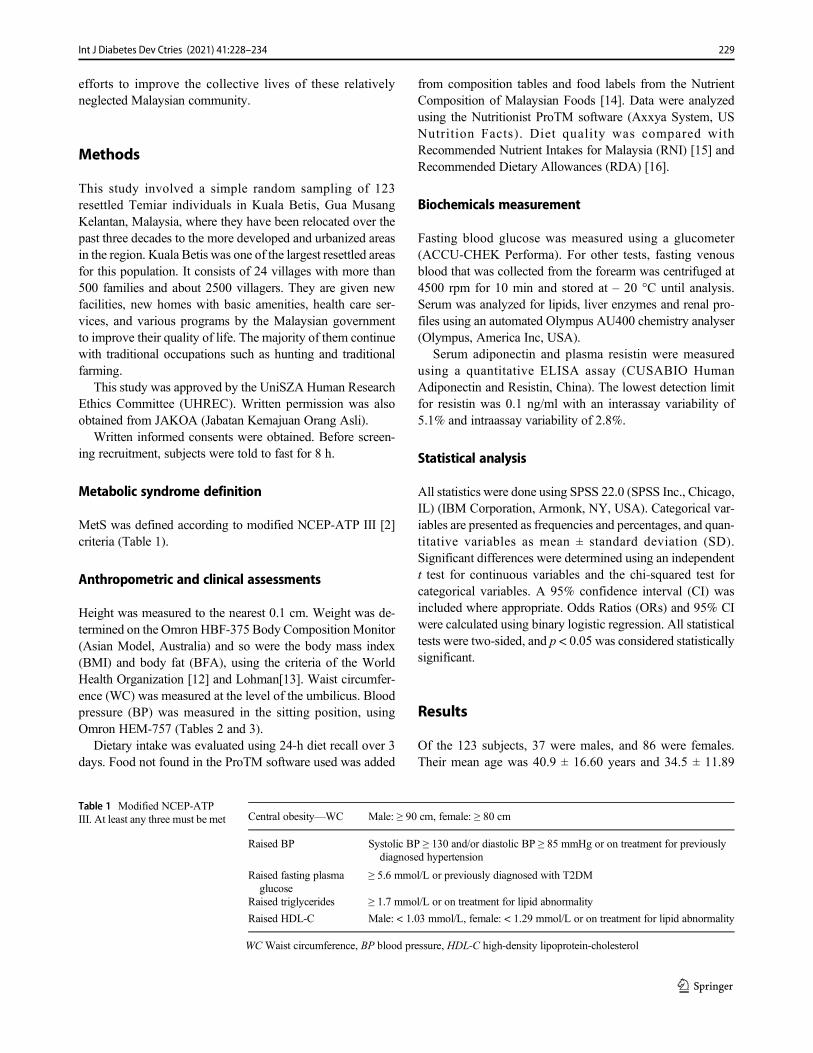
efforts to improve the collective lives of these relativelyneglected Malaysian community.
Methods
This study involved a simple random sampling of 123resettled Temiar individuals in Kuala Betis, Gua MusangKelantan, Malaysia, where they have been relocated over thepast three decades to the more developed and urbanized areasin the region. Kuala Betis was one of the largest resettled areasfor this population. It consists of 24 villages with more than500 families and about 2500 villagers. They are given newfacilities, new homes with basic amenities, health care ser-vices, and various programs by the Malaysian governmentto improve their quality of life. The majority of them continuewith traditional occupations such as hunting and traditionalfarming.
This study was approved by the UniSZA Human ResearchEthics Committee (UHREC). Written permission was alsoobtained from JAKOA (Jabatan Kemajuan Orang Asli).
Written informed consents were obtained. Before screen-ing recruitment, subjects were told to fast for 8 h.
Metabolic syndrome definition
MetS was defined according to modified NCEP-ATP III [2]criteria (Table 1).
Anthropometric and clinical assessments
Height was measured to the nearest 0.1 cm. Weight was de-termined on the Omron HBF-375 Body CompositionMonitor(Asian Model, Australia) and so were the body mass index(BMI) and body fat (BFA), using the criteria of the WorldHealth Organization [12] and Lohman[13]. Waist circumfer-ence (WC) was measured at the level of the umbilicus. Bloodpressure (BP) was measured in the sitting position, usingOmron HEM-757 (Tables 2 and 3).
Dietary intake was evaluated using 24-h diet recall over 3days. Food not found in the ProTM software used was added
from composition tables and food labels from the NutrientComposition of Malaysian Foods [14]. Data were analyzedusing the Nutritionist ProTM software (Axxya System, USNutrition Facts). Diet quality was compared withRecommended Nutrient Intakes for Malaysia (RNI) [15] andRecommended Dietary Allowances (RDA) [16].
Biochemicals measurement
Fasting blood glucose was measured using a glucometer(ACCU-CHEK Performa). For other tests, fasting venousblood that was collected from the forearm was centrifuged at4500 rpm for 10 min and stored at – 20 °C until analysis.Serum was analyzed for lipids, liver enzymes and renal pro-files using an automated Olympus AU400 chemistry analyser(Olympus, America Inc, USA).
Serum adiponectin and plasma resistin were measuredusing a quantitative ELISA assay (CUSABIO HumanAdiponectin and Resistin, China). The lowest detection limitfor resistin was 0.1 ng/ml with an interassay variability of5.1% and intraassay variability of 2.8%.
Statistical analysis
All statistics were done using SPSS 22.0 (SPSS Inc., Chicago,IL) (IBM Corporation, Armonk, NY, USA). Categorical var-iables are presented as frequencies and percentages, and quan-titative variables as mean ± standard deviation (SD).Significant differences were determined using an independentt test for continuous variables and the chi-squared test forcategorical variables. A 95% confidence interval (CI) wasincluded where appropriate. Odds Ratios (ORs) and 95% CIwere calculated using binary logistic regression. All statisticaltests were two-sided, and p < 0.05 was considered statisticallysignificant.
Results
Of the 123 subjects, 37 were males, and 86 were females.Their mean age was 40.9 ± 16.60 years and 34.5 ± 11.89
Table 1 Modified NCEP-ATPIII. At least any three must be met Central obesity—WC Male: ≥ 90 cm, female: ≥ 80 cm
Raised BP Systolic BP ≥ 130 and/or diastolic BP ≥ 85 mmHg or on treatment for previouslydiagnosed hypertension
Raised fasting plasmaglucose
≥ 5.6 mmol/L or previously diagnosed with T2DM
Raised triglycerides ≥ 1.7 mmol/L or on treatment for lipid abnormality
Raised HDL-C Male: < 1.03 mmol/L, female: < 1.29 mmol/L or on treatment for lipid abnormality
WC Waist circumference, BP blood pressure, HDL-C high-density lipoprotein-cholesterol
229Int J Diabetes Dev Ctries (2021) 41:228–234
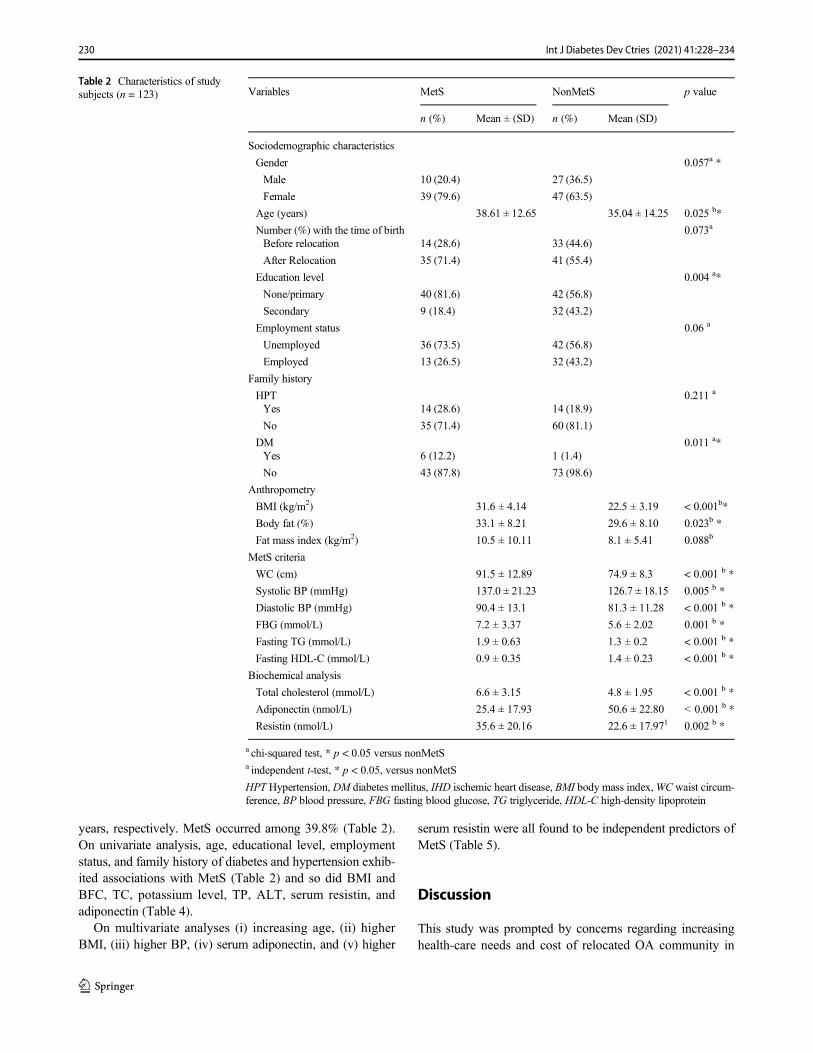
years, respectively. MetS occurred among 39.8% (Table 2).On univariate analysis, age, educational level, employmentstatus, and family history of diabetes and hypertension exhib-ited associations with MetS (Table 2) and so did BMI andBFC, TC, potassium level, TP, ALT, serum resistin, andadiponectin (Table 4).
On multivariate analyses (i) increasing age, (ii) higherBMI, (iii) higher BP, (iv) serum adiponectin, and (v) higher
serum resistin were all found to be independent predictors ofMetS (Table 5).
Discussion
This study was prompted by concerns regarding increasinghealth-care needs and cost of relocated OA community in
Table 2 Characteristics of studysubjects (n = 123) Variables MetS NonMetS p value
n (%) Mean ± (SD) n (%) Mean (SD)
Sociodemographic characteristics
Gender 0.057a *
Male 10 (20.4) 27 (36.5)
Female 39 (79.6) 47 (63.5)
Age (years) 38.61 ± 12.65 35.04 ± 14.25 0.025 b*
Number (%) with the time of birth 0.073a
Before relocation 14 (28.6) 33 (44.6)
After Relocation 35 (71.4) 41 (55.4)
Education level 0.004 a*
None/primary 40 (81.6) 42 (56.8)
Secondary 9 (18.4) 32 (43.2)
Employment status 0.06 a
Unemployed 36 (73.5) 42 (56.8)
Employed 13 (26.5) 32 (43.2)
Family history
HPT 0.211 a
Yes 14 (28.6) 14 (18.9)
No 35 (71.4) 60 (81.1)
DM 0.011 a*Yes 6 (12.2) 1 (1.4)
No 43 (87.8) 73 (98.6)
Anthropometry
BMI (kg/m2) 31.6 ± 4.14 22.5 ± 3.19 < 0.001b*
Body fat (%) 33.1 ± 8.21 29.6 ± 8.10 0.023b *
Fat mass index (kg/m2) 10.5 ± 10.11 8.1 ± 5.41 0.088b
MetS criteria
WC (cm) 91.5 ± 12.89 74.9 ± 8.3 < 0.001 b *
Systolic BP (mmHg) 137.0 ± 21.23 126.7 ± 18.15 0.005 b *
Diastolic BP (mmHg) 90.4 ± 13.1 81.3 ± 11.28 < 0.001 b *
FBG (mmol/L) 7.2 ± 3.37 5.6 ± 2.02 0.001 b *
Fasting TG (mmol/L) 1.9 ± 0.63 1.3 ± 0.2 < 0.001 b *
Fasting HDL-C (mmol/L) 0.9 ± 0.35 1.4 ± 0.23 < 0.001 b *
Biochemical analysis
Total cholesterol (mmol/L) 6.6 ± 3.15 4.8 ± 1.95 < 0.001 b *
Adiponectin (nmol/L) 25.4 ± 17.93 50.6 ± 22.80 < 0.001 b *
Resistin (nmol/L) 35.6 ± 20.16 22.6 ± 17.971 0.002 b *
a chi-squared test, * p < 0.05 versus nonMetSa independent t-test, * p < 0.05, versus nonMetS
HPT Hypertension, DM diabetes mellitus, IHD ischemic heart disease, BMI body mass index,WC waist circum-ference, BP blood pressure, FBG fasting blood glucose, TG triglyceride, HDL-C high-density lipoprotein
230 Int J Diabetes Dev Ctries (2021) 41:228–234
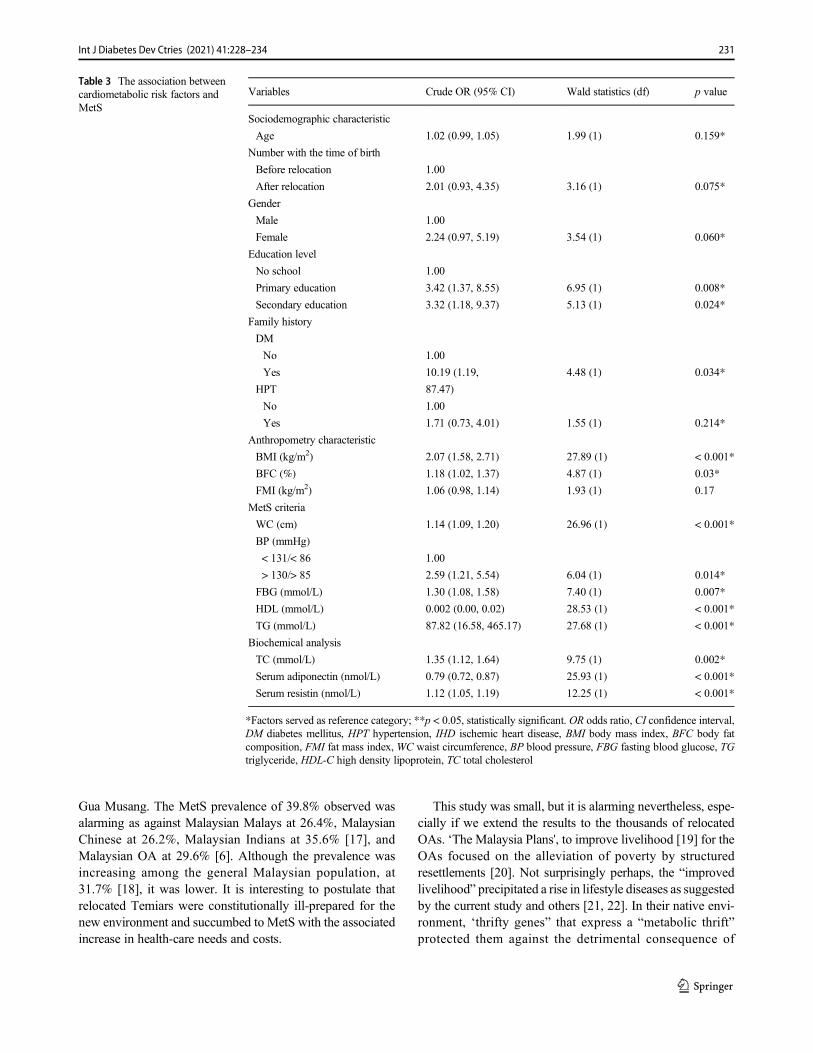
Gua Musang. The MetS prevalence of 39.8% observed wasalarming as against Malaysian Malays at 26.4%, MalaysianChinese at 26.2%, Malaysian Indians at 35.6% [17], andMalaysian OA at 29.6% [6]. Although the prevalence wasincreasing among the general Malaysian population, at31.7% [18], it was lower. It is interesting to postulate thatrelocated Temiars were constitutionally ill-prepared for thenew environment and succumbed to MetS with the associatedincrease in health-care needs and costs.
This study was small, but it is alarming nevertheless, espe-cially if we extend the results to the thousands of relocatedOAs. ‘The Malaysia Plans', to improve livelihood [19] for theOAs focused on the alleviation of poverty by structuredresettlements [20]. Not surprisingly perhaps, the “improvedlivelihood” precipitated a rise in lifestyle diseases as suggestedby the current study and others [21, 22]. In their native envi-ronment, ‘thrifty genes” that express a “metabolic thrift”protected them against the detrimental consequence of
Table 3 The association betweencardiometabolic risk factors andMetS
Variables Crude OR (95% CI) Wald statistics (df) p value
Sociodemographic characteristic
Age 1.02 (0.99, 1.05) 1.99 (1) 0.159*
Number with the time of birth
Before relocation 1.00
After relocation 2.01 (0.93, 4.35) 3.16 (1) 0.075*
Gender
Male 1.00
Female 2.24 (0.97, 5.19) 3.54 (1) 0.060*
Education level
No school 1.00
Primary education 3.42 (1.37, 8.55) 6.95 (1) 0.008*
Secondary education 3.32 (1.18, 9.37) 5.13 (1) 0.024*
Family history
DM
No 1.00
Yes 10.19 (1.19, 4.48 (1) 0.034*
HPT 87.47)
No 1.00
Yes 1.71 (0.73, 4.01) 1.55 (1) 0.214*
Anthropometry characteristic
BMI (kg/m2) 2.07 (1.58, 2.71) 27.89 (1) < 0.001*
BFC (%) 1.18 (1.02, 1.37) 4.87 (1) 0.03*
FMI (kg/m2) 1.06 (0.98, 1.14) 1.93 (1) 0.17
MetS criteria
WC (cm) 1.14 (1.09, 1.20) 26.96 (1) < 0.001*
BP (mmHg)
< 131/< 86 1.00
> 130/> 85 2.59 (1.21, 5.54) 6.04 (1) 0.014*
FBG (mmol/L) 1.30 (1.08, 1.58) 7.40 (1) 0.007*
HDL (mmol/L) 0.002 (0.00, 0.02) 28.53 (1) < 0.001*
TG (mmol/L) 87.82 (16.58, 465.17) 27.68 (1) < 0.001*
Biochemical analysis
TC (mmol/L) 1.35 (1.12, 1.64) 9.75 (1) 0.002*
Serum adiponectin (nmol/L) 0.79 (0.72, 0.87) 25.93 (1) < 0.001*
Serum resistin (nmol/L) 1.12 (1.05, 1.19) 12.25 (1) < 0.001*
*Factors served as reference category; **p < 0.05, statistically significant. OR odds ratio, CI confidence interval,DM diabetes mellitus, HPT hypertension, IHD ischemic heart disease, BMI body mass index, BFC body fatcomposition, FMI fat mass index, WC waist circumference, BP blood pressure, FBG fasting blood glucose, TGtriglyceride, HDL-C high density lipoprotein, TC total cholesterol
231Int J Diabetes Dev Ctries (2021) 41:228–234
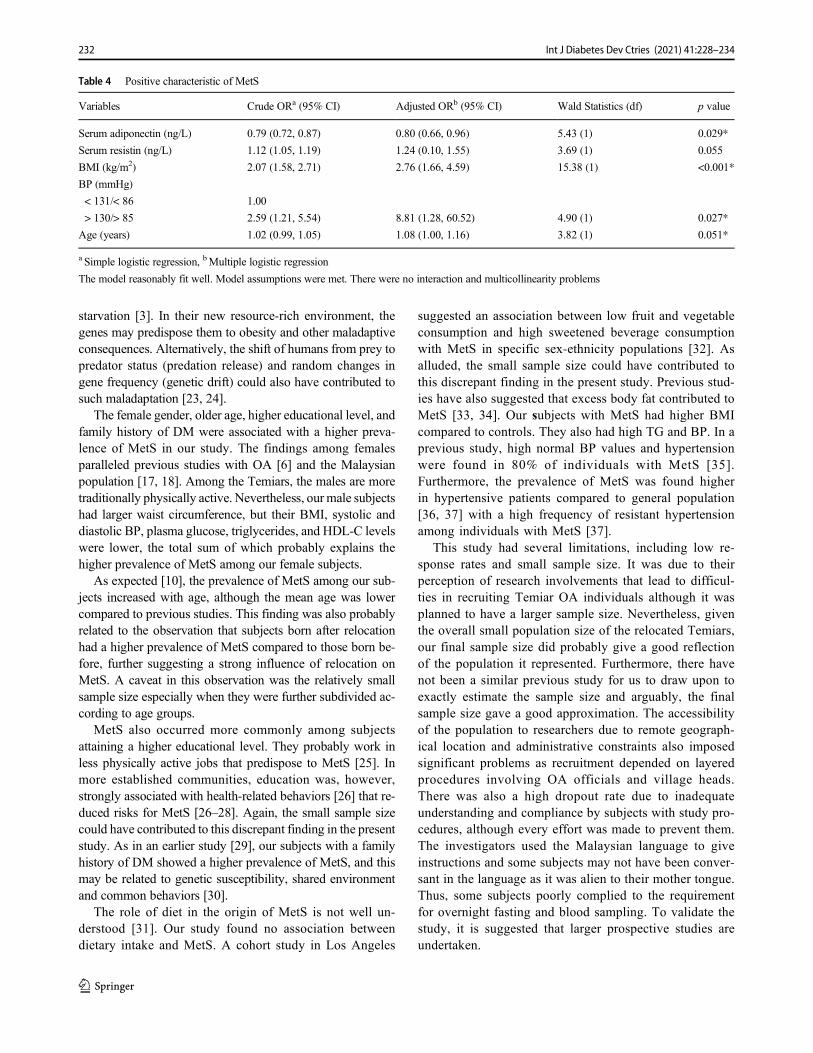
starvation [3]. In their new resource-rich environment, thegenes may predispose them to obesity and other maladaptiveconsequences. Alternatively, the shift of humans from prey topredator status (predation release) and random changes ingene frequency (genetic drift) could also have contributed tosuch maladaptation [23, 24].
The female gender, older age, higher educational level, andfamily history of DM were associated with a higher preva-lence of MetS in our study. The findings among femalesparalleled previous studies with OA [6] and the Malaysianpopulation [17, 18]. Among the Temiars, the males are moretraditionally physically active. Nevertheless, our male subjectshad larger waist circumference, but their BMI, systolic anddiastolic BP, plasma glucose, triglycerides, and HDL-C levelswere lower, the total sum of which probably explains thehigher prevalence of MetS among our female subjects.
As expected [10], the prevalence of MetS among our sub-jects increased with age, although the mean age was lowercompared to previous studies. This finding was also probablyrelated to the observation that subjects born after relocationhad a higher prevalence of MetS compared to those born be-fore, further suggesting a strong influence of relocation onMetS. A caveat in this observation was the relatively smallsample size especially when they were further subdivided ac-cording to age groups.
MetS also occurred more commonly among subjectsattaining a higher educational level. They probably work inless physically active jobs that predispose to MetS [25]. Inmore established communities, education was, however,strongly associated with health-related behaviors [26] that re-duced risks for MetS [26–28]. Again, the small sample sizecould have contributed to this discrepant finding in the presentstudy. As in an earlier study [29], our subjects with a familyhistory of DM showed a higher prevalence of MetS, and thismay be related to genetic susceptibility, shared environmentand common behaviors [30].
The role of diet in the origin of MetS is not well un-derstood [31]. Our study found no association betweendietary intake and MetS. A cohort study in Los Angeles
suggested an association between low fruit and vegetableconsumption and high sweetened beverage consumptionwith MetS in specific sex-ethnicity populations [32]. Asalluded, the small sample size could have contributed tothis discrepant finding in the present study. Previous stud-ies have also suggested that excess body fat contributed toMetS [33, 34]. Our subjects with MetS had higher BMIcompared to controls. They also had high TG and BP. In aprevious study, high normal BP values and hypertensionwere found in 80% of individuals with MetS [35].Furthermore, the prevalence of MetS was found higherin hypertensive patients compared to general population[36, 37] with a high frequency of resistant hypertensionamong individuals with MetS [37].
This study had several limitations, including low re-sponse rates and small sample size. It was due to theirperception of research involvements that lead to difficul-ties in recruiting Temiar OA individuals although it wasplanned to have a larger sample size. Nevertheless, giventhe overall small population size of the relocated Temiars,our final sample size did probably give a good reflectionof the population it represented. Furthermore, there havenot been a similar previous study for us to draw upon toexactly estimate the sample size and arguably, the finalsample size gave a good approximation. The accessibilityof the population to researchers due to remote geograph-ical location and administrative constraints also imposedsignificant problems as recruitment depended on layeredprocedures involving OA officials and village heads.There was also a high dropout rate due to inadequateunderstanding and compliance by subjects with study pro-cedures, although every effort was made to prevent them.The investigators used the Malaysian language to giveinstructions and some subjects may not have been conver-sant in the language as it was alien to their mother tongue.Thus, some subjects poorly complied to the requirementfor overnight fasting and blood sampling. To validate thestudy, it is suggested that larger prospective studies areundertaken.
Table 4 Positive characteristic of MetS
Variables Crude ORa (95% CI) Adjusted ORb (95% CI) Wald Statistics (df) p value
Serum adiponectin (ng/L) 0.79 (0.72, 0.87) 0.80 (0.66, 0.96) 5.43 (1) 0.029*
Serum resistin (ng/L) 1.12 (1.05, 1.19) 1.24 (0.10, 1.55) 3.69 (1) 0.055
BMI (kg/m2) 2.07 (1.58, 2.71) 2.76 (1.66, 4.59) 15.38 (1) <0.001*
BP (mmHg)
< 131/< 86 1.00
> 130/> 85 2.59 (1.21, 5.54) 8.81 (1.28, 60.52) 4.90 (1) 0.027*
Age (years) 1.02 (0.99, 1.05) 1.08 (1.00, 1.16) 3.82 (1) 0.051*
a Simple logistic regression, bMultiple logistic regression
The model reasonably fit well. Model assumptions were met. There were no interaction and multicollinearity problems
232 Int J Diabetes Dev Ctries (2021) 41:228–234
Conclusion
The relocation of the Temiar community increased their prev-alence of MetS that also affected younger individuals.Preventive strategies are needed and should target their youngto prevent the negative health consequences of relocation forthis unique community.
Acknowledgment The authors would like to thank the Ministry of HighEducation for financial aid (KPT/2015/RAGS/RR170), BMLGlobal Ent,and the UniSZA Faculty of Medicine for providing facilities. The authorswould also like to thank the JAKOA, tribe’s leader and Temiar OAcommunity from Kuala Betis, Gua Musang, Kelantan, for their warmwelcome and willingness to participate in this study.
Authors’ contribution All authors participated sufficiently in work andagreed to take public responsibility for appropriate portions of thecontents.
Funding The authors would like to thank the Ministry of High Educationfor financial aid (KPT/2015/RAGS/RR170), Universiti Sultan ZainalAbidin (UniSZA) for ethics approval (UHREC/2016/3/012), and BMLGlobal Ent and Faculty of Medicine for providing facilities.
Data availability All data were primary and could be provided ifrequired.
Compliance with ethical standards
Conflict of interest The authors declare that they have no conflict ofinterest.
Informed consent Personal, demographic details, and relevant data ofthe participants were collected and recorded after getting informedconsent.
Ethical approval Research conducted at the Faculty of Medicine,UniSZA in the present study was approved (UHREC/2016/3/012) bythe UniSZA Human Ethics Research Committee (UHREC), UniversitiSultan Zainal Abidin (UniSZA; Kuala Terengganu, Malaysia). The studyprotocol conforms to the ethical guidelines of the 1975 Declaration ofHelsinki as reflected in a prior approval by the UHREC.
References
1. Jinam TA, Hong LC, Phipps ME, Stoneking M, Ameen M, Edo J,et al. Evolutionary history of continental southeast Asians: "earlytrain" hypothesis based on genetic analysis of mitochondrial andautosomal DNA data. Mol Biol Evol. 2012;29(11):3513–27.
2. Alberti KG, Eckel RH, Grundy SM, Zimmet PZ, Cleeman JI,Donato KA, et al. Harmonizing the metabolic syndrome: a jointinterim statement of the International Diabetes Federation TaskForce on Epidemiology and Prevention; National Heart, Lung,and Blood Institute; American Heart Association; World HeartFederation; International Atherosclerosis Society; andInternational Association for the Study of Obesity. Circulation.2009;120(16):1640–5.
3. Neel JV. Diabetes mellitus: a "thrifty" genotype rendered detrimen-tal by "progress"? Am J Hum Genet. 1962;14:353–62.
4. Ashari LS, Mitra AK, Rahman TA, Mitra A, Teh LK, Salleh MZ,et al. Prevalence and risk factors of metabolic syndrome among anendangered tribal population in Malaysia using harmonized IDFcriteria. Int J Diabetes Dev Countries. 2016;36(3):352–8.
5. Lim KG, Cheah WK. A review of metabolic syndrome research inMalaysia. Med J Malaysia. 2016;71(Suppl 1):20–8.
6. Aghakhanian F, et al.Metabolic syndrome and cardiometabolic riskfactors among indigenous Malaysians. Public Health. 2018.
7. LimH, Chee H. Nutritional status and reproductive health of OrangAsli women in two villages in Kuantan, Pahang. Malays J Nutr.1998;4(1):31–54.
8. Okafor CI. The metabolic syndrome in Africa: current trends.Indian J Endocrinol Metab. 2012;16(1):56–66.
9. Ford ES, Li C, Zhao G. Prevalence and correlates of metabolicsyndrome based on a harmonious definition among adults in theUS. J Diabetes. 2010;2(3):180–93.
10. Ford ES, Giles WH, Dietz WH. Prevalence of the metabolic syn-drome among US adults: findings from the third National Healthand Nutrition Examination Survey. Jama. 2002;287(3):356–9.
11. Yamagishi K, Iso H. The criteria for metabolic syndrome and thenational health screening and education system in Japan. EpidemiolHealth. 2017;39(0):e2017003-0.
12. Physical status: the use and interpretation of anthropometry. Reportof a WHO Expert Committee. World Health Organ Tech Rep Ser.1995;854:1–452.
13. Lohman TG. Applicability of body composition techniques andconstants for children and youths. Exerc Sport Sci Rev. 1986;14:325–57.
14. Tee ES. Nutrient composition of Malaysian foods: a preliminarytable 1998., I.f.M.R. Division of Human Nutrition, Kuala Lumpur,Editor. 1998. p. 73.
15. National Coordinating Committee on Food and Nutrition,M.o.H.M., Recommended nutrient intakes for Malaysia (RNI),2005. A report of the technical working group on nutritional guide-lines. 2005: Putrajaya.
16. Food and Nutrition Board, I.o.M., National Academies.,Recommended Dietary Allowances (RDA), 1997. DietaryReference Intakes (DRIs): recommended dietary allowances andadequate intakes, elements.
17. Rampal S, Mahadeva S, Guallar E, Bulgiba A, Mohamed R,Rahmat R, et al. Ethnic differences in the prevalence of metabolicsyndrome: results from a multi-ethnic population-based survey inMalaysia. PLoS One. 2012;7(9):e46365.
18. MohamudWN, et al. Prevalence of metabolic syndrome and its riskfactors in adultMalaysians: results of a nationwide survey. DiabetesRes Clin Pract. 2012;96(1):91–7.
19. Henderson JW, Vreeland, Nena, Dana, Glenn B, Hurwitz, et al. In:Studies FA, editor. Area handbook for Malaysia. Washington DC:American University; 1977. p. 147.
20. Hussain TPRS, Hassan AAG. Resettlementof the Orang Asli anddevelopment plan for Orang Asli community in Malaysia. JTechnol Soc. 2017:9.
21. Phipps ME, Chan KKL, Naidu R, Mohamad NW, Hoh BP, QuekKF, et al. Cardio-metabolic health risks in indigenous populationsof Southeast Asia and the influence of urbanization. BMC PublicHealth. 2015;15:47.
22. Nicholas C. Putting the people into EIAs; assessing the environ-mental impacts on indigenous peoples. Malayan Nat. 1997;15:34–8.
23. Speakman JR. Thrifty genes for obesity, an attractive but flawedidea, and an alternative perspective: the 'drifty gene' hypothesis. IntJ Obes. 2008;32(11):1611–7.
24. Speakman JR. A nonadaptive scenario explaining the genetic pre-disposition to obesity: the "predation release" hypothesis. CellMetab. 2007;6(1):5–12.
233Int J Diabetes Dev Ctries (2021) 41:228–234
25. Lakka TA, Laaksonen DE. Physical activity in prevention and treat-ment of the metabolic syndrome. Appl Physiol Nutr Metab.2007;32(1):76–88.
26. Cohen AK, Syme SL. Education: a missed opportunity for publichealth intervention. Am J Public Health. 2013;103(6):997–1001.
27. Fujiwara T, Kawachi I. Is education causally related to betterhealth? A twin fixed-effect study in the USA. Int J Epidemiol.2009;38(5):1310–22.
28. Groth MV, Sørensen MR, Matthiessen J, Fagt S, Landvad N,Knudsen VK. Disparities in dietary habits and physical activity inDenmark and trends from 1995 to 2008. Scand J Public Health.2014;42(7):611–20.
29. Das M, Pal S, Ghosh A. Family history of type 2 diabetes andprevalence of metabolic syndrome in adult Asian Indians. JCardiovasc Dis Res. 2012;3(2):104–8.
30. Yoon PW, Scheuner MT, Peterson-Oehlke KL, Gwinn M, FaucettA, Khoury MJ. Can family history be used as a tool for publichealth and preventive medicine? Genet Med. 2002;4(4):304–10.
31. Parillo M, Riccardi G. Diet composition and the risk of type 2diabetes: epidemiological and clinical evidence. Br J Nutr.2004;92(1):7–19.
32. Yoo S, Nicklas T, Baranowski T, Zakeri IF, Yang SJ, SrinivasanSR, et al. Comparison of dietary intakes associated with metabolic
syndrome risk factors in young adults: the Bogalusa Heart Study.Am J Clin Nutr. 2004;80(4):841–8.
33. Gonzalez M, et al. Inflammatory markers and metabolic syndromeamong adolescents. Eur J Clin Nutr. 2012;66(10):1141–5.
34. Melka MG, Abrahamowicz M, Leonard GT, Perron M, Richer L,Veillette S, et al. Clustering of the metabolic syndrome componentsin adolescence: role of visceral fat. PLoS One. 2013;8(12):e82368.
35. Mancia G, Bombelli M, Corrao G, Facchetti R, Madotto F,Giannattasio C, et al. Metabolic syndrome in the PressioniArteriose Monitorate E Loro Associazioni (PAMELA) study: dailylife blood pressure, cardiac damage, and prognosis. Hypertension.2007;49(1):40–7.
36. Mule G, et al. Metabolic syndrome in subjects with essential hyper-tension: relationships with subclinical cardiovascular and renaldamage. Minerva Cardioangiol. 2006;54(2):173–94.
37. Chaudhary K, Buddineni JP, Nistala R, Whaley-Connell A.Resistant hypertension in the high-risk metabolic patient. CurrDiabetes Rep. 2011;11(1):41–6.
Publisher’s note Springer Nature remains neutral with regard to jurisdic-tional claims in published maps and institutional affiliations.
234 Int J Diabetes Dev Ctries (2021) 41:228–234
ORIGINAL ARTICLE
Human gut microbiota and its possible relationshipwith obesity and diabetes
Nima Mohammadzadeh1,2& Shabnam Razavi2,3 & Zahra Hadi4 & Mohammadreza Kermansaravi5,6 & Shahin Boloori7 &
Ali Kabir8 & Mohammad E. Khamseh9
Received: 24 August 2019 /Accepted: 10 October 2020# Research Society for Study of Diabetes in India 2020
AbstractBackground Obesity and diabetes are public health problems that are leading causes of death in the world. Recent surveyssuggest that there is a relationship between diabetes and bacterial residents of the gastrointestinal tract.Objective This case-control study was designed to evaluate the composition of the gut microbiota in patients with type 2 diabetes(T2DM) and obesity compared to the healthy people.Methods A total of 91 adult subjects (25 patients diagnosed with T2DM, 48 obese patients, and 18 healthy individuals) wereincluded in the study. The gut microbiota composition was investigated by quantitative real-time polymerase chain reaction(qPCR) method using bacterial 16S rRNA gene.Results The frequency of all bacterial species in the obese group compared to the control group have significantly changed(p < 0.05) except Bacteroides fragilis, whereas the level of bacterial composition was not changed significantly (p > 0.05) in thediabetic patients versus the control ones, except for Bacteroides phylum and Lactobacillus spp. Moreover, the mean body massindex (BMI) in control, T2DM, and obese groups were 24.28 ± 3.00, 26.83 ± 3.29, and 44.65 ± 3.73, respectively. Our analysisshowed a positive correlation between diabetic patients plus obese ones and the number of bacteria (p < 0.05).Conclusions To sum up, these findings show that specific changes in microbial community composition are associated withT2DM and obesity. More extensive, our survey suggests that modulation of the microbiome warrants further investigation as apotential therapeutic strategy for metabolic diseases.
Keywords Gutmicrobiota . Obesity . Type 2 diabetesmellitus . Real-time PCR
Introduction
Over 10–100 trillion microbes colonize in each part of humanbody, including the skin, vagina, oronasopharyngeal cavity,and of course gastrointestinal tract [1, 2]. The gastrointestinalmicrobiota generally refers to the microbial composition in the
gut, which contains various types of microorganisms such asbacteria, viruses, archaea, fungi, as well as phages [3]. Amongall different bacterial species, which colonized in human guts,five phyla are most abundant, including Firmicutes,Bacteroidetes, Verrucomicrobia, Actinobacteria, andProteobacteria [3]. These microorganisms perform variety
* Shabnam [email protected]
1 Faculty of Science, Department of Microbiology, Shahid BeheshtiUniversity, Tehran, Iran
2 Faculty ofMedicine, Department ofMicrobiology, Iran University ofMedical Sciences, Tehran, Iran
3 Microbial Biotechnology Research Center, Iran University ofMedical Sciences, Tehran, Iran
4 Department of Microbiology, School of Basic Sciences, IslamicAzad University, Karaj Branch, Karaj, Iran
5 Minimally Invasive Surgery Research Center, Iran University ofMedical Sciences, Tehran, Iran
6 Center of Excellence of International Federation for Surgery ofObesity, Hazrat-e Rasool Hospital, Tehran, Iran
7 Faculty of Medicine, Department of Microbiology, Shahid BeheshtiUniversity of Medical Sciences, Tehran, Iran
8 Educational Development Center, Iran University of MedicalSciences, Tehran, Iran
9 Endocrine Research Center, Institute of Endocrinology andMetabolism, Iran University of Medical Sciences, Tehran, Iran
https://doi.org/10.1007/s13410-020-00881-w
/ Published online: 16 November 2020
International Journal of Diabetes in Developing Countries (2021) 41:235–243
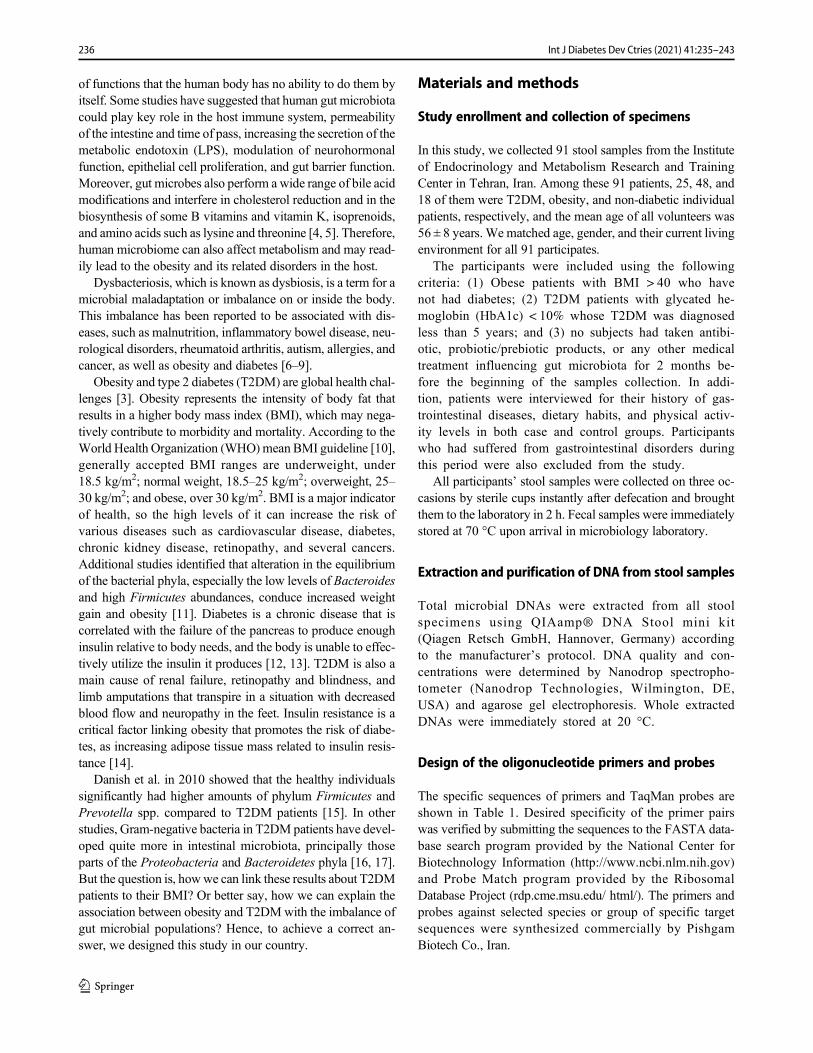
of functions that the human body has no ability to do them byitself. Some studies have suggested that human gut microbiotacould play key role in the host immune system, permeabilityof the intestine and time of pass, increasing the secretion of themetabolic endotoxin (LPS), modulation of neurohormonalfunction, epithelial cell proliferation, and gut barrier function.Moreover, gut microbes also perform a wide range of bile acidmodifications and interfere in cholesterol reduction and in thebiosynthesis of some B vitamins and vitamin K, isoprenoids,and amino acids such as lysine and threonine [4, 5]. Therefore,human microbiome can also affect metabolism and may read-ily lead to the obesity and its related disorders in the host.
Dysbacteriosis, which is known as dysbiosis, is a term for amicrobial maladaptation or imbalance on or inside the body.This imbalance has been reported to be associated with dis-eases, such as malnutrition, inflammatory bowel disease, neu-rological disorders, rheumatoid arthritis, autism, allergies, andcancer, as well as obesity and diabetes [6–9].
Obesity and type 2 diabetes (T2DM) are global health chal-lenges [3]. Obesity represents the intensity of body fat thatresults in a higher body mass index (BMI), which may nega-tively contribute to morbidity and mortality. According to theWorld Health Organization (WHO)mean BMI guideline [10],generally accepted BMI ranges are underweight, under18.5 kg/m2; normal weight, 18.5–25 kg/m2; overweight, 25–30 kg/m2; and obese, over 30 kg/m2. BMI is a major indicatorof health, so the high levels of it can increase the risk ofvarious diseases such as cardiovascular disease, diabetes,chronic kidney disease, retinopathy, and several cancers.Additional studies identified that alteration in the equilibriumof the bacterial phyla, especially the low levels of Bacteroidesand high Firmicutes abundances, conduce increased weightgain and obesity [11]. Diabetes is a chronic disease that iscorrelated with the failure of the pancreas to produce enoughinsulin relative to body needs, and the body is unable to effec-tively utilize the insulin it produces [12, 13]. T2DM is also amain cause of renal failure, retinopathy and blindness, andlimb amputations that transpire in a situation with decreasedblood flow and neuropathy in the feet. Insulin resistance is acritical factor linking obesity that promotes the risk of diabe-tes, as increasing adipose tissue mass related to insulin resis-tance [14].
Danish et al. in 2010 showed that the healthy individualssignificantly had higher amounts of phylum Firmicutes andPrevotella spp. compared to T2DM patients [15]. In otherstudies, Gram-negative bacteria in T2DM patients have devel-oped quite more in intestinal microbiota, principally thoseparts of the Proteobacteria and Bacteroidetes phyla [16, 17].But the question is, howwe can link these results about T2DMpatients to their BMI? Or better say, how we can explain theassociation between obesity and T2DMwith the imbalance ofgut microbial populations? Hence, to achieve a correct an-swer, we designed this study in our country.
Materials and methods
Study enrollment and collection of specimens
In this study, we collected 91 stool samples from the Instituteof Endocrinology and Metabolism Research and TrainingCenter in Tehran, Iran. Among these 91 patients, 25, 48, and18 of them were T2DM, obesity, and non-diabetic individualpatients, respectively, and the mean age of all volunteers was56 ± 8 years. We matched age, gender, and their current livingenvironment for all 91 participates.
The participants were included using the followingcriteria: (1) Obese patients with BMI > 40 who havenot had diabetes; (2) T2DM patients with glycated he-moglobin (HbA1c) < 10% whose T2DM was diagnosedless than 5 years; and (3) no subjects had taken antibi-otic, probiotic/prebiotic products, or any other medicaltreatment influencing gut microbiota for 2 months be-fore the beginning of the samples collection. In addi-tion, patients were interviewed for their history of gas-trointestinal diseases, dietary habits, and physical activ-ity levels in both case and control groups. Participantswho had suffered from gastrointestinal disorders duringthis period were also excluded from the study.
All participants’ stool samples were collected on three oc-casions by sterile cups instantly after defecation and broughtthem to the laboratory in 2 h. Fecal samples were immediatelystored at 70 °C upon arrival in microbiology laboratory.
Extraction and purification of DNA from stool samples
Total microbial DNAs were extracted from all stoolspecimens using QIAamp® DNA Stool mini kit(Qiagen Retsch GmbH, Hannover, Germany) accordingto the manufacturer’s protocol. DNA quality and con-centrations were determined by Nanodrop spectropho-tometer (Nanodrop Technologies, Wilmington, DE,USA) and agarose gel electrophoresis. Whole extractedDNAs were immediately stored at 20 °C.
Design of the oligonucleotide primers and probes
The specific sequences of primers and TaqMan probes areshown in Table 1. Desired specificity of the primer pairswas verified by submitting the sequences to the FASTA data-base search program provided by the National Center forBiotechnology Information (http://www.ncbi.nlm.nih.gov)and Probe Match program provided by the RibosomalDatabase Project (rdp.cme.msu.edu/ html/). The primers andprobes against selected species or group of specific targetsequences were synthesized commercially by PishgamBiotech Co., Iran.
236 Int J Diabetes Dev Ctries (2021) 41:235–243
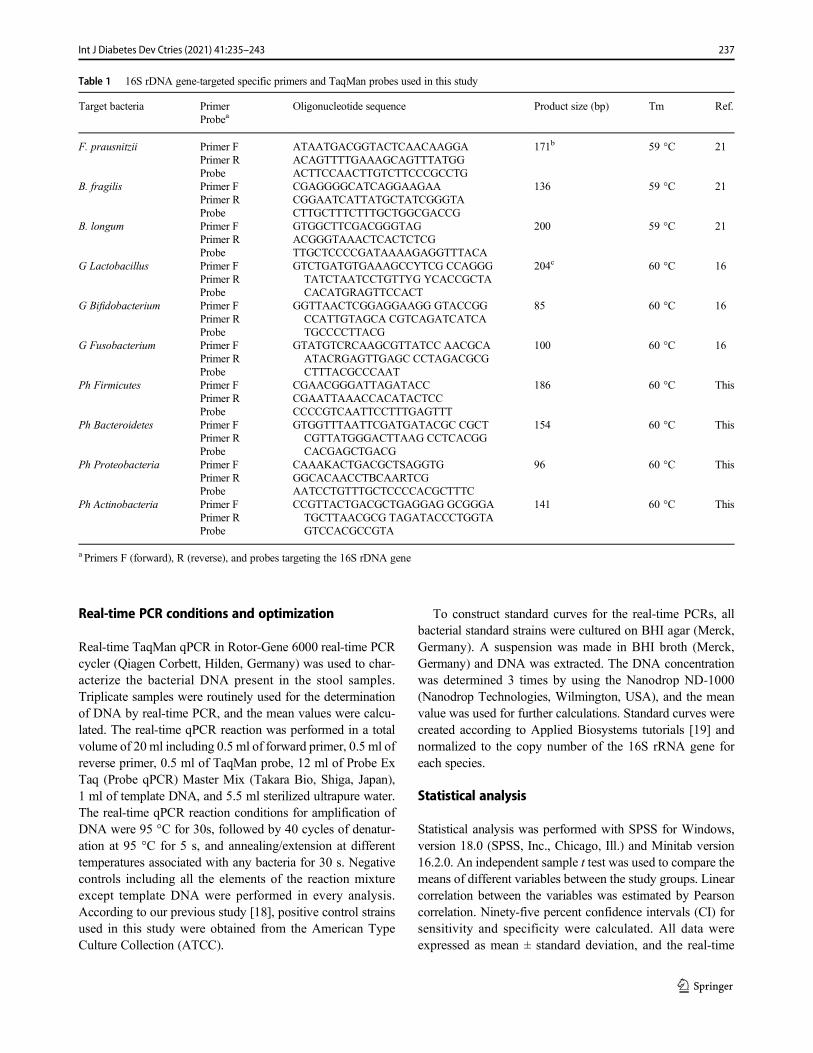
Real-time PCR conditions and optimization
Real-time TaqMan qPCR in Rotor-Gene 6000 real-time PCRcycler (Qiagen Corbett, Hilden, Germany) was used to char-acterize the bacterial DNA present in the stool samples.Triplicate samples were routinely used for the determinationof DNA by real-time PCR, and the mean values were calcu-lated. The real-time qPCR reaction was performed in a totalvolume of 20 ml including 0.5 ml of forward primer, 0.5 ml ofreverse primer, 0.5 ml of TaqMan probe, 12 ml of Probe ExTaq (Probe qPCR) Master Mix (Takara Bio, Shiga, Japan),1 ml of template DNA, and 5.5 ml sterilized ultrapure water.The real-time qPCR reaction conditions for amplification ofDNA were 95 °C for 30s, followed by 40 cycles of denatur-ation at 95 °C for 5 s, and annealing/extension at differenttemperatures associated with any bacteria for 30 s. Negativecontrols including all the elements of the reaction mixtureexcept template DNA were performed in every analysis.According to our previous study [18], positive control strainsused in this study were obtained from the American TypeCulture Collection (ATCC).
To construct standard curves for the real-time PCRs, allbacterial standard strains were cultured on BHI agar (Merck,Germany). A suspension was made in BHI broth (Merck,Germany) and DNA was extracted. The DNA concentrationwas determined 3 times by using the Nanodrop ND-1000(Nanodrop Technologies, Wilmington, USA), and the meanvalue was used for further calculations. Standard curves werecreated according to Applied Biosystems tutorials [19] andnormalized to the copy number of the 16S rRNA gene foreach species.
Statistical analysis
Statistical analysis was performed with SPSS for Windows,version 18.0 (SPSS, Inc., Chicago, Ill.) and Minitab version16.2.0. An independent sample t test was used to compare themeans of different variables between the study groups. Linearcorrelation between the variables was estimated by Pearsoncorrelation. Ninety-five percent confidence intervals (CI) forsensitivity and specificity were calculated. All data wereexpressed as mean ± standard deviation, and the real-time
Table 1 16S rDNA gene-targeted specific primers and TaqMan probes used in this study
Target bacteria PrimerProbea
Oligonucleotide sequence Product size (bp) Tm Ref.
F. prausnitzii Primer FPrimer RProbe
ATAATGACGGTACTCAACAAGGAACAGTTTTGAAAGCAGTTTATGGACTTCCAACTTGTCTTCCCGCCTG
171b 59 °C 21
B. fragilis Primer FPrimer RProbe
CGAGGGGCATCAGGAAGAACGGAATCATTATGCTATCGGGTACTTGCTTTCTTTGCTGGCGACCG
136 59 °C 21
B. longum Primer FPrimer RProbe
GTGGCTTCGACGGGTAGACGGGTAAACTCACTCTCGTTGCTCCCCGATAAAAGAGGTTTACA
200 59 °C 21
G Lactobacillus Primer FPrimer RProbe
GTCTGATGTGAAAGCCYTCG CCAGGGTATCTAATCCTGTTYG YCACCGCTACACATGRAGTTCCACT
204c 60 °C 16
G Bifidobacterium Primer FPrimer RProbe
GGTTAACTCGGAGGAAGG GTACCGGCCATTGTAGCA CGTCAGATCATCATGCCCCTTACG
85 60 °C 16
G Fusobacterium Primer FPrimer RProbe
GTATGTCRCAAGCGTTATCC AACGCAATACRGAGTTGAGC CCTAGACGCGCTTTACGCCCAAT
100 60 °C 16
Ph Firmicutes Primer FPrimer RProbe
CGAACGGGATTAGATACCCGAATTAAACCACATACTCCCCCCGTCAATTCCTTTGAGTTT
186 60 °C This
Ph Bacteroidetes Primer FPrimer RProbe
GTGGTTTAATTCGATGATACGC CGCTCGTTATGGGACTTAAG CCTCACGGCACGAGCTGACG
154 60 °C This
Ph Proteobacteria Primer FPrimer RProbe
CAAAKACTGACGCTSAGGTGGGCACAACCTBCAARTCGAATCCTGTTTGCTCCCCACGCTTTC
96 60 °C This
Ph Actinobacteria Primer FPrimer RProbe
CCGTTACTGACGCTGAGGAG GCGGGATGCTTAACGCG TAGATACCCTGGTAGTCCACGCCGTA
141 60 °C This
a Primers F (forward), R (reverse), and probes targeting the 16S rDNA gene
237Int J Diabetes Dev Ctries (2021) 41:235–243
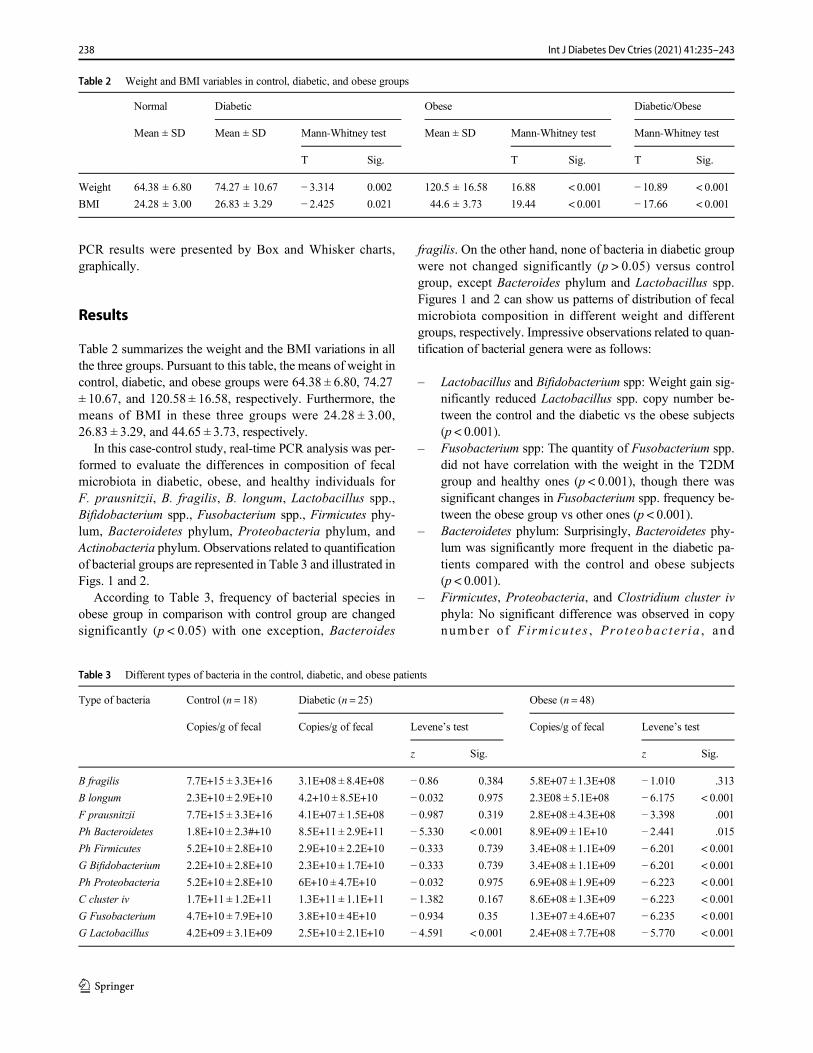
PCR results were presented by Box and Whisker charts,graphically.
Results
Table 2 summarizes the weight and the BMI variations in allthe three groups. Pursuant to this table, the means of weight incontrol, diabetic, and obese groups were 64.38 ± 6.80, 74.27± 10.67, and 120.58 ± 16.58, respectively. Furthermore, themeans of BMI in these three groups were 24.28 ± 3.00,26.83 ± 3.29, and 44.65 ± 3.73, respectively.
In this case-control study, real-time PCR analysis was per-formed to evaluate the differences in composition of fecalmicrobiota in diabetic, obese, and healthy individuals forF. prausnitzii, B. fragilis, B. longum, Lactobacillus spp.,Bifidobacterium spp., Fusobacterium spp., Firmicutes phy-lum, Bacteroidetes phylum, Proteobacteria phylum, andActinobacteria phylum. Observations related to quantificationof bacterial groups are represented in Table 3 and illustrated inFigs. 1 and 2.
According to Table 3, frequency of bacterial species inobese group in comparison with control group are changedsignificantly (p < 0.05) with one exception, Bacteroides
fragilis. On the other hand, none of bacteria in diabetic groupwere not changed significantly (p > 0.05) versus controlgroup, except Bacteroides phylum and Lactobacillus spp.Figures 1 and 2 can show us patterns of distribution of fecalmicrobiota composition in different weight and differentgroups, respectively. Impressive observations related to quan-tification of bacterial genera were as follows:
– Lactobacillus and Bifidobacterium spp: Weight gain sig-nificantly reduced Lactobacillus spp. copy number be-tween the control and the diabetic vs the obese subjects(p < 0.001).
– Fusobacterium spp: The quantity of Fusobacterium spp.did not have correlation with the weight in the T2DMgroup and healthy ones (p < 0.001), though there wassignificant changes in Fusobacterium spp. frequency be-tween the obese group vs other ones (p < 0.001).
– Bacteroidetes phylum: Surprisingly, Bacteroidetes phy-lum was significantly more frequent in the diabetic pa-tients compared with the control and obese subjects(p < 0.001).
– Firmicutes, Proteobacteria, and Clostridium cluster ivphyla: No significant difference was observed in copynumber of Firmicu tes , Proteobac ter ia , and
Table 2 Weight and BMI variables in control, diabetic, and obese groups
Normal Diabetic Obese Diabetic/Obese
Mean ± SD Mean ± SD Mann-Whitney test Mean ± SD Mann-Whitney test Mann-Whitney test
T Sig. T Sig. T Sig.
Weight 64.38 ± 6.80 74.27 ± 10.67 − 3.314 0.002 120.5 ± 16.58 16.88 < 0.001 − 10.89 < 0.001
BMI 24.28 ± 3.00 26.83 ± 3.29 − 2.425 0.021 44.6 ± 3.73 19.44 < 0.001 − 17.66 < 0.001
Table 3 Different types of bacteria in the control, diabetic, and obese patients
Type of bacteria Control (n = 18) Diabetic (n = 25) Obese (n = 48)
Copies/g of fecal Copies/g of fecal Levene’s test Copies/g of fecal Levene’s test
z Sig. z Sig.
B fragilis 7.7E+15 ± 3.3E+16 3.1E+08 ± 8.4E+08 − 0.86 0.384 5.8E+07 ± 1.3E+08 − 1.010 .313
B longum 2.3E+10 ± 2.9E+10 4.2+10 ± 8.5E+10 − 0.032 0.975 2.3E08 ± 5.1E+08 − 6.175 < 0.001
F prausnitzii 7.7E+15 ± 3.3E+16 4.1E+07 ± 1.5E+08 − 0.987 0.319 2.8E+08 ± 4.3E+08 − 3.398 .001
Ph Bacteroidetes 1.8E+10 ± 2.3#+10 8.5E+11 ± 2.9E+11 − 5.330 < 0.001 8.9E+09 ± 1E+10 − 2.441 .015
Ph Firmicutes 5.2E+10 ± 2.8E+10 2.9E+10 ± 2.2E+10 − 0.333 0.739 3.4E+08 ± 1.1E+09 − 6.201 < 0.001
G Bifidobacterium 2.2E+10 ± 2.8E+10 2.3E+10 ± 1.7E+10 − 0.333 0.739 3.4E+08 ± 1.1E+09 − 6.201 < 0.001
Ph Proteobacteria 5.2E+10 ± 2.8E+10 6E+10 ± 4.7E+10 − 0.032 0.975 6.9E+08 ± 1.9E+09 − 6.223 < 0.001
C cluster iv 1.7E+11 ± 1.2E+11 1.3E+11 ± 1.1E+11 − 1.382 0.167 8.6E+08 ± 1.3E+09 − 6.223 < 0.001
G Fusobacterium 4.7E+10 ± 7.9E+10 3.8E+10 ± 4E+10 − 0.934 0.35 1.3E+07 ± 4.6E+07 − 6.235 < 0.001
G Lactobacillus 4.2E+09 ± 3.1E+09 2.5E+10 ± 2.1E+10 − 4.591 < 0.001 2.4E+08 ± 7.7E+08 − 5.770 < 0.001
238 Int J Diabetes Dev Ctries (2021) 41:235–243
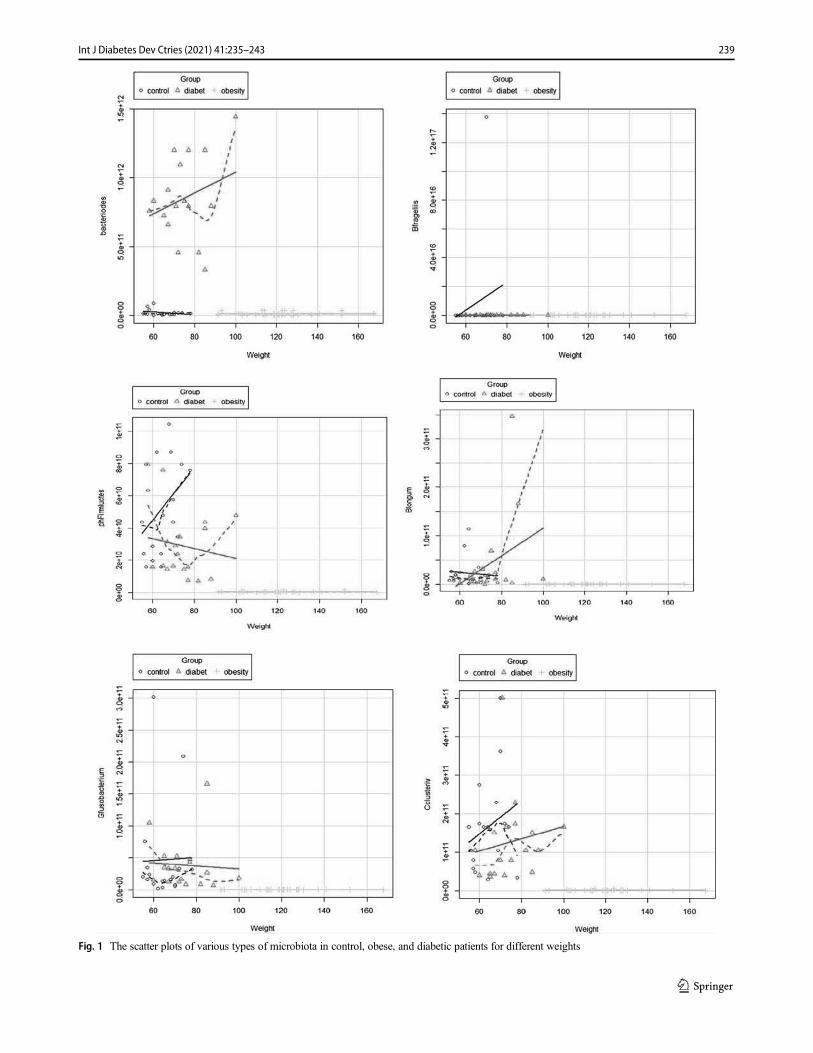
Fig. 1 The scatter plots of various types of microbiota in control, obese, and diabetic patients for different weights
239Int J Diabetes Dev Ctries (2021) 41:235–243
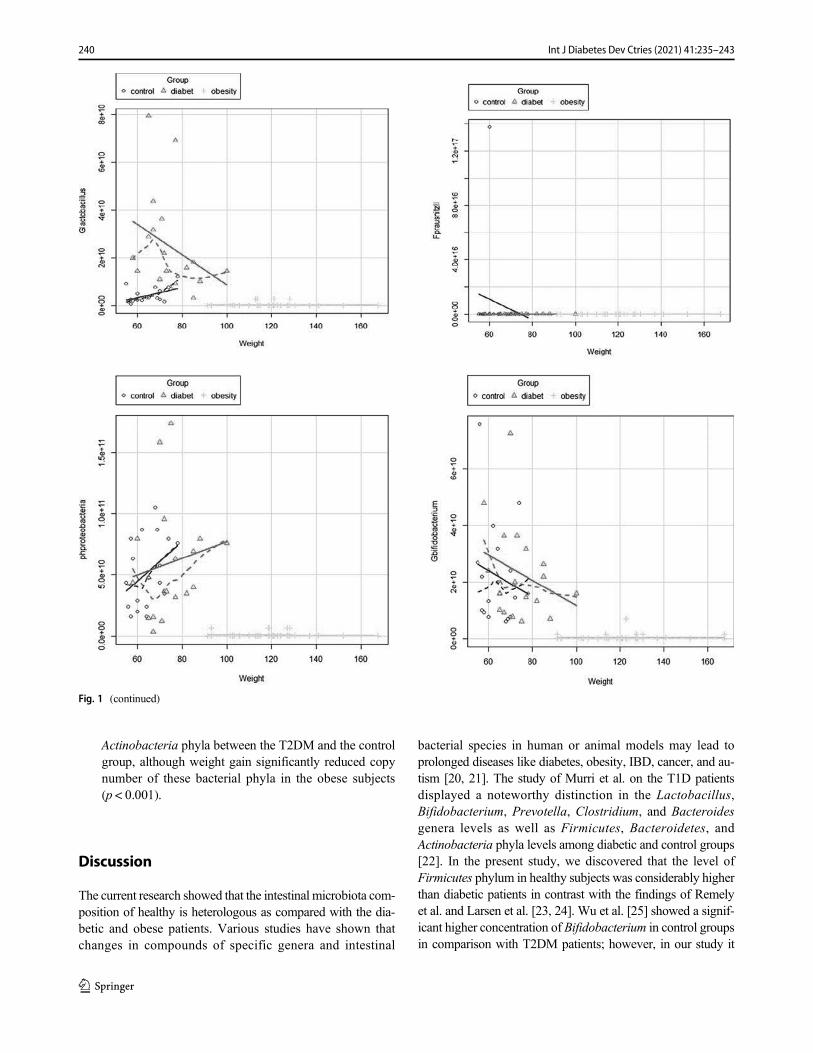
Actinobacteria phyla between the T2DM and the controlgroup, although weight gain significantly reduced copynumber of these bacterial phyla in the obese subjects(p < 0.001).
Discussion
The current research showed that the intestinal microbiota com-position of healthy is heterologous as compared with the dia-betic and obese patients. Various studies have shown thatchanges in compounds of specific genera and intestinal
bacterial species in human or animal models may lead toprolonged diseases like diabetes, obesity, IBD, cancer, and au-tism [20, 21]. The study of Murri et al. on the T1D patientsdisplayed a noteworthy distinction in the Lactobacillus,Bifidobacterium, Prevotella, Clostridium, and Bacteroidesgenera levels as well as Firmicutes, Bacteroidetes, andActinobacteria phyla levels among diabetic and control groups[22]. In the present study, we discovered that the level ofFirmicutes phylum in healthy subjects was considerably higherthan diabetic patients in contrast with the findings of Remelyet al. and Larsen et al. [23, 24]. Wu et al. [25] showed a signif-icant higher concentration of Bifidobacterium in control groupsin comparison with T2DM patients; however, in our study it
Fig. 1 (continued)
240 Int J Diabetes Dev Ctries (2021) 41:235–243
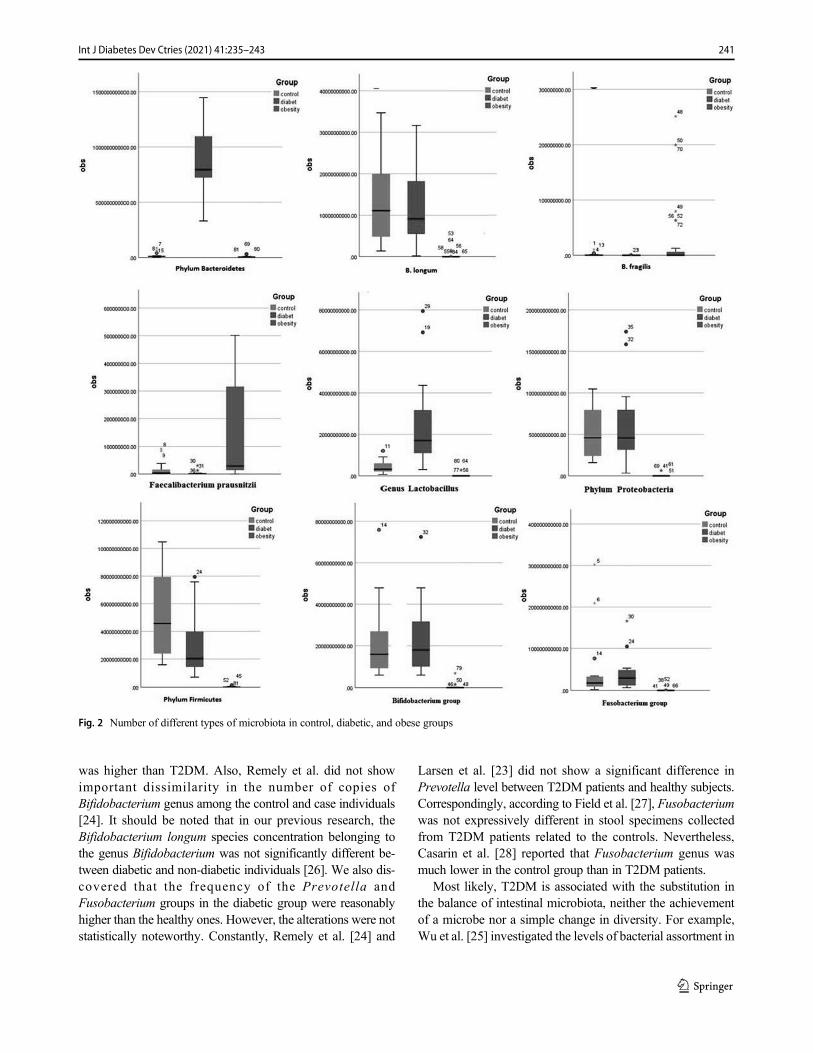
was higher than T2DM. Also, Remely et al. did not showimportant dissimilarity in the number of copies ofBifidobacterium genus among the control and case individuals[24]. It should be noted that in our previous research, theBifidobacterium longum species concentration belonging tothe genus Bifidobacterium was not significantly different be-tween diabetic and non-diabetic individuals [26]. We also dis-covered that the frequency of the Prevotella andFusobacterium groups in the diabetic group were reasonablyhigher than the healthy ones. However, the alterations were notstatistically noteworthy. Constantly, Remely et al. [24] and
Larsen et al. [23] did not show a significant difference inPrevotella level between T2DM patients and healthy subjects.Correspondingly, according to Field et al. [27], Fusobacteriumwas not expressively different in stool specimens collectedfrom T2DM patients related to the controls. Nevertheless,Casarin et al. [28] reported that Fusobacterium genus wasmuch lower in the control group than in T2DM patients.
Most likely, T2DM is associated with the substitution inthe balance of intestinal microbiota, neither the achievementof a microbe nor a simple change in diversity. For example,Wu et al. [25] investigated the levels of bacterial assortment in
Fig. 2 Number of different types of microbiota in control, diabetic, and obese groups
241Int J Diabetes Dev Ctries (2021) 41:235–243
T2DM and non-diabetic patients and showed that there wasnot any substantial difference between bacterial species in thetwo groups. Though, they pointed to a meaningful change inthe number of bacterial phyla, genera, and species [25]. Theybelieved that the combination of dominant bacteria in the in-testinal microbiota of T2DM individuals was not similar tohealthy subjects. Regarding previous studies that indicatedan association between T2DM and overweight/obesity, wealso showed significant correlation between BMI and all themicrobial groups, Bacteroides fragilis.
Remely et al. [24] and Larsen et al [26] and our results areconsistent in overweight individuals, but it contrasts withsome studies on the relationship between BMI and this groupof bacteria [29, 30]. On the other hand, Million et al. [30],Ignacio et al. [29] showed a positive and noteworthy connec-tion between Lactobacillus concentration and BMI in obesesubjects, and Saber et al. [31] exhibited a meaningful negativecorrelation between Lactobacilli count and BMI. As with ourfindings, Million et al. [30], Collado et al. [32] and Remelyet al. did not correlate results between Bifidobacterium andBMI. In contrast, Ignacio et al. [29] found a negative correla-tion between BMI and Bifidobacterium. Andoh et al. [33]showed a significant positive correlation betweenFusobacterium and BMI; nevertheless, in the present study,there was no association between this bacterial frequency andBMI in the studied groups. Si et al [34] reported thatPrevotella spp. have a significant correlation with BMI, butit is not in line with our results. These controversial resultsabout alterations in the composition of intestinal bacteria inT2DM patients and also ambiguous findings in relation be-tween different groups of bacteria and BMI can be explicatedby heterogeneity in assorted factors like genetic background,ethnicity, geographical location, environment and occupation,disclosures, medical history, potential underlying diseases/disorders, lifestyle habits, and dietary routines of individualsduring studies.
In the present study, we tried to limit the maximumperplexing variables where the members in the T2DM andcontrol group were coordinated by age, sex, race, living envi-ronment, and non-interventional medications and food thatmight affect the outcome (such as various antibiotics,probiotics, and prebiotics). It should be kept in mind that thedesign of a technical study (i.e., a specific bacterial primer andprobe design for a real-time qPCR) is of significant impor-tance in the final output of the study. Thus, some of theseheterogeneities may return to the study design. In general, inthe present study, we exhibited that T2DM and obese areassociated with changes in the gut microbes. Conversely,due to the scheme of this study, we remained restricted tocreating a causative connection concerning the changes inthe intestinal microbial composition and the disease.Moreover, it is uncertain whether T2DM and obese are creat-ed by microbial changes or that it is just a replication of the
condition of the disease. This matter should be taken intoconsideration in longitudinal research.
Conclusion
The outcomes of this study enhance basic knowledge aboutthe gut microbiome in T2DM and obese patients. This surveyshows the abundance of different types of bacteria in the gut,which in turn can affect health. In addition, eating habits andprobiotics supplements may induce change in the gut micro-biota and stabilize microbial communities, which help to pre-vent or delay T2DM and obese. Nowadays, there is a clearneed to continue to explore the roles of the microbiome inobesity and T2DM to facilitate the development of effectivetherapeutic strategies.
Compliance with ethical standards
Conflict of interest The authors declare that they have no conflict ofinterest.
Ethical statement This project was done based on the ethical guidelinesas previously approved by the Iran University of Medical Science,Tehran, Iran (project no: IR.IUMS.REC.1397.1072).
References
1. BarlowGM, Lin EA,Mathur R. An overview of the roles of the gutmicrobiome in obesity and diabetes. InNutritional and TherapeuticInterventions for Diabetes and Metabolic Syndrome.Cambridge:Academic Press; 2018. p. 65–91.
2. Bakhshi A, Delouyi ZS, Taheri S, Alivandi A,MohammadzadehN,Dabiri H. Comparative study of Lactobacilli and bifidobacteria invaginal tract of individual with bacterial vaginosis and healthy con-trol by quantitative PCR. Rev Med Microbiol. 2019;30(3):148–54.
3. Chen X, Devaraj S. Gut microbiome in obesity, metabolic syn-drome, and diabetes. Curr Diab Rep. 2018;18(12):129.
4. Cani PD, Delzenne NM. Gut microflora as a target for energy andmetabolic homeostasis. Curr Opin Clin Nutr Metab Care.2007;10(6):729–34.
5. Creely SJ,McTernan PG, Kusminski CM, Fisher FM, Da Silva NF,Khanolkar M, Evans M, Harte AL, Kumar S. Lipopolysaccharideactivates an innate immune system response in human adipose tis-sue in obesity and type 2 diabetes. American Journal of Physiology-Endocrinology and Metabolism. 2007 Mar;292(3):E740–7.
6. Dicksved J, Flöistrup H, BergströmA, Rosenquist M, Pershagen G,Scheynius A, et al. Molecular fingerprinting of the fecal microbiotaof children raised according to different lifestyles. Appl EnvironMicrobiol. 2007;73(7):2284–9.
7. Ley RE, Bäckhed F, Turnbaugh P, Lozupone CA, Knight RD,Gordon JI. Obesity alters gut microbial ecology. Proc Natl AcadSci. 2005;102(31):11070–5.
8. Zhang H, DiBaise JK, Zuccolo A, Kudrna D, Braidotti M, Yu Y,et al. Human gut microbiota in obesity and after gastric bypass. ProcNatl Acad Sci. 2009;106(7):2365–70.
9. Mohammadzadeh N, Kalani BS, Bolori S, Azadegan A, GholamiA, Mohammadzadeh R, Masjedian Jazi F. Identification of an in-testinal microbiota signature associated with hospitalized patients
242 Int J Diabetes Dev Ctries (2021) 41:235–243
with diarrhea. Acta Microbiologica et Immunologica Hungarica.2019;66(2):189–202.
10. Nuttall FQ. Body mass index: obesity, BMI, and health: a criticalreview. Nutr Today. 2015;50(3):117–28.
11. Rajpal DK, Klein J-L, Mayhew D, Boucheron J, Spivak AT,Kumar V, et al. Selective spectrum antibiotic modulation of thegut microbiome in obesity and diabetes rodent models. PLoSOne. 2015;10(12):e0145499.
12. Bagheri S, Dormanesh B, Afarid M, Sagheb MM. Proteinuria andrenal dysfunction after intravitreal injection of bevacizumab in pa-tients with diabetic nephropathy: a prospective observational study.Galen Med J. 2018;7:1299.
13. Vu BG, Stach CS, Kulhankova K, Salgado-Pabón W, KlingelhutzAJ, Schlievert PM. Chronic superantigen exposure induces system-ic inflammation, elevated bloodstream endotoxin, and abnormalglucose tolerance in rabbits: possible role in diabetes. MBio.2015;6(2):e02554–14.
14. Hartstra AV, Bouter KE, Bäckhed F, Nieuwdorp M. Insights intothe role of the microbiome in obesity and type 2 diabetes. DiabetesCare. 2015;38(1):159–65.
15. Neyrinck AM, Possemiers S, Druart C, Van deWiele T, De BackerF, Cani PD, et al. Prebiotic effects of wheat arabinoxylan related tothe increase in bifidobacteria, Roseburia and Bacteroides/Prevotella in diet-induced obese mice. PLoS One. 2011;6(6):e20944.
16. Conlon M, Bird A. The impact of diet and lifestyle on gut micro-biota and human health. Nutrients. 2015;7(1):17–44.
17. Moreno-Indias I, Cardona F, Tinahones FJ, Queipo-Ortuño MI.Impact of the gut microbiota on the development of obesity andtype 2 diabetes mellitus. Front Microbiol. 2014;5:190.
18. Sedighi M, Razavi S, Navab-Moghadam F, Khamseh ME, Alaei-Shahmiri F, Mehrtash A, et al. Comparison of gut microbiota inadult patients with type 2 diabetes and healthy individuals. MicrobPathog. 2017;111:362–9.
19. Biosystems A. Creating standard curves with genomic DNA orplasmid DNA templates for use in quantitative PCR. Basel: FHoffmann-La Roche Ltd. 2013.
20. Cho I, Blaser MJ. The human microbiome: at the interface of healthand disease. Nat Rev Genet. 2012;13(4):260–70.
21. Tlaskalová-Hogenová H, Štěpánková R, Kozáková H, Hudcovic T,Vannucci L, Tučková L, et al. The role of gut microbiota (commen-sal bacteria) and the mucosal barrier in the pathogenesis of inflam-matory and autoimmune diseases and cancer: contribution of germ-free and gnotobiotic animal models of human diseases. Cell MolImmunol. 2011;8(2):110–20.
22. Murri M, Leiva I, Gomez-Zumaquero JM, Tinahones FJ, CardonaF, Soriguer F, et al. Gut microbiota in children with type 1 diabetes
differs from that in healthy children: a case-control study. BMCMed. 2013;11(1):46.
23. Navab-Moghadam F, Sedighi M, Khamseh ME, Alaei-Shahmiri F,Talebi M, Razavi S, et al. The association of type II diabetes withgut microbiota composition. Microb Pathog. 2017;110:630–6.
24. Remely M, Dworzak S, Hippe B, Zwielehner J, Aumüller E, BrathH, et al. Abundance and diversity of microbiota in type 2 diabetesand obesity. J Diabetes Metab. 2013;4(253):2.
25. Wu X, Ma C, Han L, Nawaz M, Gao F, Zhang X, et al. Molecularcharacterisation of the faecal microbiota in patients with type IIdiabetes. Curr Microbiol. 2010;61(1):69–78.
26. Larsen N, Vogensen FK, Van Den Berg FW, Nielsen DS,Andreasen AS, Pedersen BK, et al. Gut microbiota in human adultswith type 2 diabetes differs from non-diabetic adults. PLoS One.2010;5(2):e9085.
27. Field CA, Gidley M, Preshaw P, Jakubovics N. Investigation andquantification of key periodontal pathogens in patients with type 2diabetes. J Periodontal Res. 2012;47(4):470–8.
28. Casarin R, Barbagallo A, Meulman T, Santos V, Sallum E, NocitiF, et al. Subgingival biodiversity in subjects with uncontrolled type-2 diabetes and chronic periodontitis. J Periodontal Res. 2013;48(1):30–6.
29. Ignacio A, Fernandes M, Rodrigues V, Groppo F, Cardoso A,Avila-Campos M, et al. Correlation between body mass indexand faecal microbiota from children. Clin Microbiol Infect.2016;22(3):258 e1-. e8.
30. MillionM, Angelakis E, MaraninchiM, HenryM, Giorgi R, ValeroR, et al. Correlation between body mass index and gut concentra-tions of Lactobacillus reuteri, Bifidobacterium animalis,Methanobrevibacter smithii and Escherichia coli. Int J Obes.2013;37(11):1460–6.
31. Saber SM, Othman HB, ElMasry S, Magdy A, Zidan HF.Correlation between body mass index and gut microbiota in adults.Int J Curr Microbiol App Sci. 2017;6(2):778–87.
32. Collado MC, Isolauri E, Laitinen K, Salminen S. Distinct compo-sition of gut microbiota during pregnancy in overweight andnormal-weight women. Am J Clin Nutr. 2008;88(4):894–9.
33. AndohA, NishidaA, Takahashi K, Inatomi O, ImaedaH, Bamba S,et al. Comparison of the gut microbial community between obeseand lean peoples using 16S gene sequencing in a Japanese popula-tion. J Clin Biochem Nutr. 2016;59(1):65–70.
34. Si J, You HJ, Yu J, Sung J, Ko G. Prevotella as a hub for vaginalmicrobiota under the influence of host genetics and their associationwith obesity. Cell Host Microbe. 2017;21(1):97–105.
Publisher’s note Springer Nature remains neutral with regard to jurisdic-tional claims in published maps and institutional affiliations.
243Int J Diabetes Dev Ctries (2021) 41:235–243
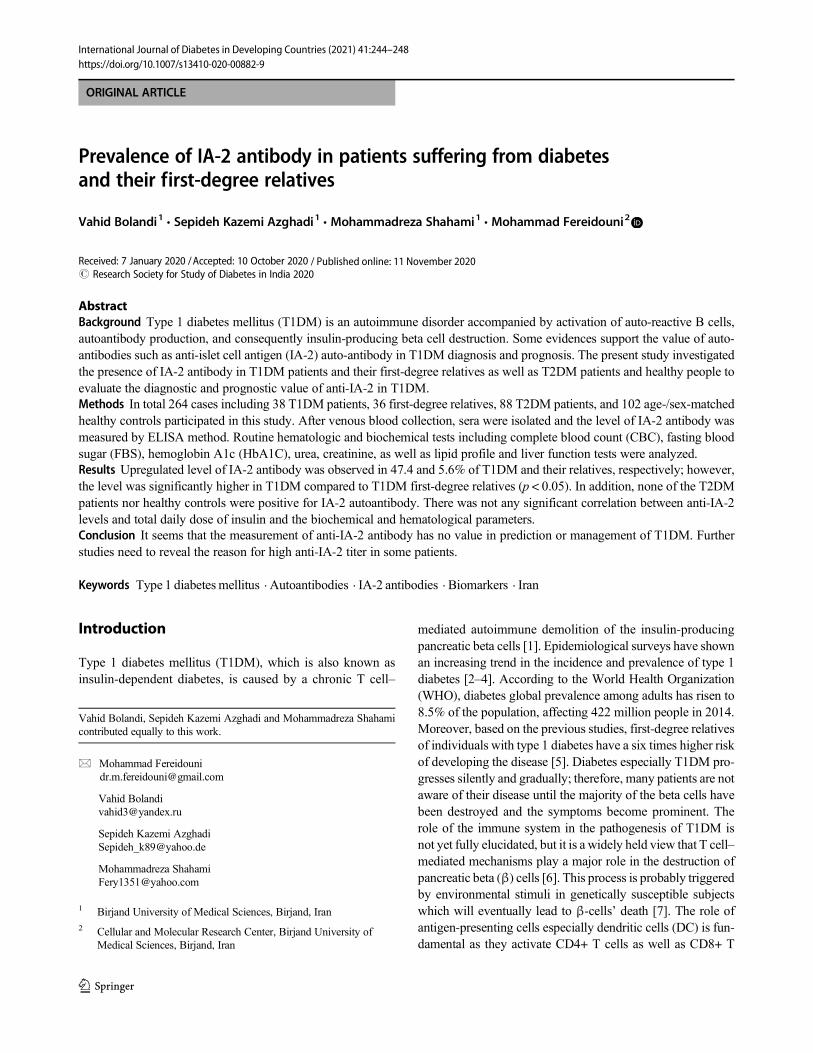
ORIGINAL ARTICLE
Prevalence of IA-2 antibody in patients suffering from diabetesand their first-degree relatives
Vahid Bolandi1 & Sepideh Kazemi Azghadi1 & Mohammadreza Shahami1 & Mohammad Fereidouni2
Received: 7 January 2020 /Accepted: 10 October 2020# Research Society for Study of Diabetes in India 2020
AbstractBackground Type 1 diabetes mellitus (T1DM) is an autoimmune disorder accompanied by activation of auto-reactive B cells,autoantibody production, and consequently insulin-producing beta cell destruction. Some evidences support the value of auto-antibodies such as anti-islet cell antigen (IA-2) auto-antibody in T1DM diagnosis and prognosis. The present study investigatedthe presence of IA-2 antibody in T1DM patients and their first-degree relatives as well as T2DM patients and healthy people toevaluate the diagnostic and prognostic value of anti-IA-2 in T1DM.Methods In total 264 cases including 38 T1DM patients, 36 first-degree relatives, 88 T2DM patients, and 102 age-/sex-matchedhealthy controls participated in this study. After venous blood collection, sera were isolated and the level of IA-2 antibody wasmeasured by ELISA method. Routine hematologic and biochemical tests including complete blood count (CBC), fasting bloodsugar (FBS), hemoglobin A1c (HbA1C), urea, creatinine, as well as lipid profile and liver function tests were analyzed.Results Upregulated level of IA-2 antibody was observed in 47.4 and 5.6% of T1DM and their relatives, respectively; however,the level was significantly higher in T1DM compared to T1DM first-degree relatives (p < 0.05). In addition, none of the T2DMpatients nor healthy controls were positive for IA-2 autoantibody. There was not any significant correlation between anti-IA-2levels and total daily dose of insulin and the biochemical and hematological parameters.Conclusion It seems that the measurement of anti-IA-2 antibody has no value in prediction or management of T1DM. Furtherstudies need to reveal the reason for high anti-IA-2 titer in some patients.
Keywords Type 1 diabetesmellitus . Autoantibodies . IA-2 antibodies . Biomarkers . Iran
Introduction
Type 1 diabetes mellitus (T1DM), which is also known asinsulin-dependent diabetes, is caused by a chronic T cell–
mediated autoimmune demolition of the insulin-producingpancreatic beta cells [1]. Epidemiological surveys have shownan increasing trend in the incidence and prevalence of type 1diabetes [2–4]. According to the World Health Organization(WHO), diabetes global prevalence among adults has risen to8.5% of the population, affecting 422 million people in 2014.Moreover, based on the previous studies, first-degree relativesof individuals with type 1 diabetes have a six times higher riskof developing the disease [5]. Diabetes especially T1DM pro-gresses silently and gradually; therefore, many patients are notaware of their disease until the majority of the beta cells havebeen destroyed and the symptoms become prominent. Therole of the immune system in the pathogenesis of T1DM isnot yet fully elucidated, but it is a widely held view that T cell–mediated mechanisms play a major role in the destruction ofpancreatic beta (β) cells [6]. This process is probably triggeredby environmental stimuli in genetically susceptible subjectswhich will eventually lead to β-cells’ death [7]. The role ofantigen-presenting cells especially dendritic cells (DC) is fun-damental as they activate CD4+ T cells as well as CD8+ T
Vahid Bolandi, Sepideh Kazemi Azghadi and Mohammadreza Shahamicontributed equally to this work.
* Mohammad [email protected]
Vahid [email protected]
Sepideh Kazemi [email protected]
Mohammadreza [email protected]
1 Birjand University of Medical Sciences, Birjand, Iran2 Cellular and Molecular Research Center, Birjand University of
Medical Sciences, Birjand, Iran
https://doi.org/10.1007/s13410-020-00882-9
/ Published online: 11 November 2020
International Journal of Diabetes in Developing Countries (2021) 41:244–248
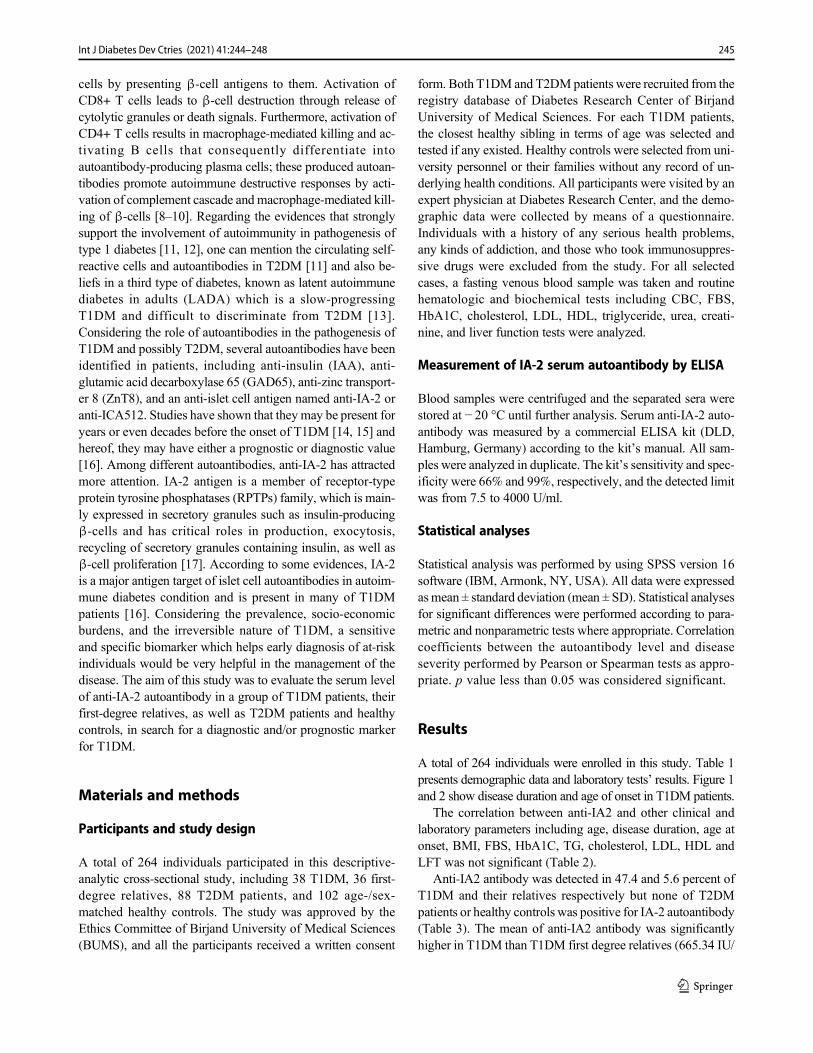
cells by presenting β-cell antigens to them. Activation ofCD8+ T cells leads to β-cell destruction through release ofcytolytic granules or death signals. Furthermore, activation ofCD4+ T cells results in macrophage-mediated killing and ac-tivating B cells that consequently differentiate intoautoantibody-producing plasma cells; these produced autoan-tibodies promote autoimmune destructive responses by acti-vation of complement cascade and macrophage-mediated kill-ing of β-cells [8–10]. Regarding the evidences that stronglysupport the involvement of autoimmunity in pathogenesis oftype 1 diabetes [11, 12], one can mention the circulating self-reactive cells and autoantibodies in T2DM [11] and also be-liefs in a third type of diabetes, known as latent autoimmunediabetes in adults (LADA) which is a slow-progressingT1DM and difficult to discriminate from T2DM [13].Considering the role of autoantibodies in the pathogenesis ofT1DM and possibly T2DM, several autoantibodies have beenidentified in patients, including anti-insulin (IAA), anti-glutamic acid decarboxylase 65 (GAD65), anti-zinc transport-er 8 (ZnT8), and an anti-islet cell antigen named anti-IA-2 oranti-ICA512. Studies have shown that they may be present foryears or even decades before the onset of T1DM [14, 15] andhereof, they may have either a prognostic or diagnostic value[16]. Among different autoantibodies, anti-IA-2 has attractedmore attention. IA-2 antigen is a member of receptor-typeprotein tyrosine phosphatases (RPTPs) family, which is main-ly expressed in secretory granules such as insulin-producingβ-cells and has critical roles in production, exocytosis,recycling of secretory granules containing insulin, as well asβ-cell proliferation [17]. According to some evidences, IA-2is a major antigen target of islet cell autoantibodies in autoim-mune diabetes condition and is present in many of T1DMpatients [16]. Considering the prevalence, socio-economicburdens, and the irreversible nature of T1DM, a sensitiveand specific biomarker which helps early diagnosis of at-riskindividuals would be very helpful in the management of thedisease. The aim of this study was to evaluate the serum levelof anti-IA-2 autoantibody in a group of T1DM patients, theirfirst-degree relatives, as well as T2DM patients and healthycontrols, in search for a diagnostic and/or prognostic markerfor T1DM.
Materials and methods
Participants and study design
A total of 264 individuals participated in this descriptive-analytic cross-sectional study, including 38 T1DM, 36 first-degree relatives, 88 T2DM patients, and 102 age-/sex-matched healthy controls. The study was approved by theEthics Committee of Birjand University of Medical Sciences(BUMS), and all the participants received a written consent
form. Both T1DM and T2DMpatients were recruited from theregistry database of Diabetes Research Center of BirjandUniversity of Medical Sciences. For each T1DM patients,the closest healthy sibling in terms of age was selected andtested if any existed. Healthy controls were selected from uni-versity personnel or their families without any record of un-derlying health conditions. All participants were visited by anexpert physician at Diabetes Research Center, and the demo-graphic data were collected by means of a questionnaire.Individuals with a history of any serious health problems,any kinds of addiction, and those who took immunosuppres-sive drugs were excluded from the study. For all selectedcases, a fasting venous blood sample was taken and routinehematologic and biochemical tests including CBC, FBS,HbA1C, cholesterol, LDL, HDL, triglyceride, urea, creati-nine, and liver function tests were analyzed.
Measurement of IA-2 serum autoantibody by ELISA
Blood samples were centrifuged and the separated sera werestored at − 20 °C until further analysis. Serum anti-IA-2 auto-antibody was measured by a commercial ELISA kit (DLD,Hamburg, Germany) according to the kit’s manual. All sam-ples were analyzed in duplicate. The kit’s sensitivity and spec-ificity were 66% and 99%, respectively, and the detected limitwas from 7.5 to 4000 U/ml.
Statistical analyses
Statistical analysis was performed by using SPSS version 16software (IBM, Armonk, NY, USA). All data were expressedasmean ± standard deviation (mean ± SD). Statistical analysesfor significant differences were performed according to para-metric and nonparametric tests where appropriate. Correlationcoefficients between the autoantibody level and diseaseseverity performed by Pearson or Spearman tests as appro-priate. p value less than 0.05 was considered significant.
Results
A total of 264 individuals were enrolled in this study. Table 1presents demographic data and laboratory tests’ results. Figure 1and 2 show disease duration and age of onset in T1DM patients.
The correlation between anti-IA2 and other clinical andlaboratory parameters including age, disease duration, age atonset, BMI, FBS, HbA1C, TG, cholesterol, LDL, HDL andLFT was not significant (Table 2).
Anti-IA2 antibody was detected in 47.4 and 5.6 percent ofT1DM and their relatives respectively but none of T2DMpatients or healthy controls was positive for IA-2 autoantibody(Table 3). The mean of anti-IA2 antibody was significantlyhigher in T1DM than T1DM first degree relatives (665.34 IU/
245Int J Diabetes Dev Ctries (2021) 41:244–248
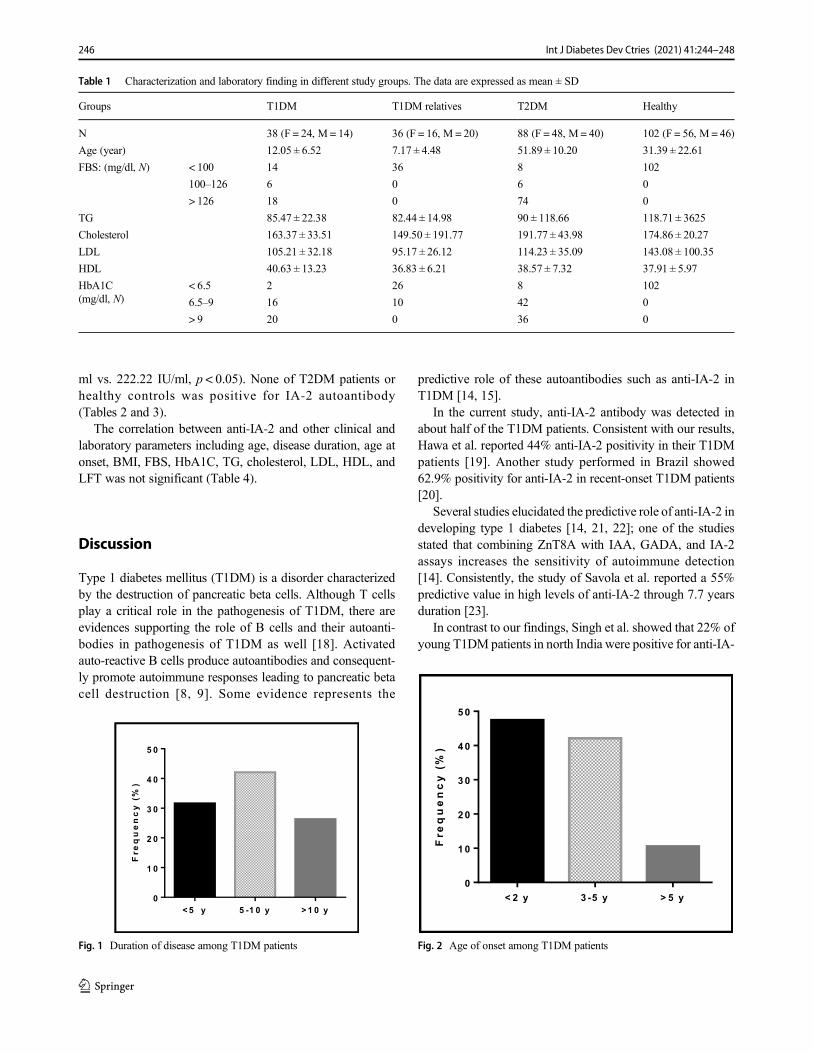
ml vs. 222.22 IU/ml, p < 0.05). None of T2DM patients orhealthy controls was positive for IA-2 autoantibody(Tables 2 and 3).
The correlation between anti-IA-2 and other clinical andlaboratory parameters including age, disease duration, age atonset, BMI, FBS, HbA1C, TG, cholesterol, LDL, HDL, andLFT was not significant (Table 4).
Discussion
Type 1 diabetes mellitus (T1DM) is a disorder characterizedby the destruction of pancreatic beta cells. Although T cellsplay a critical role in the pathogenesis of T1DM, there areevidences supporting the role of B cells and their autoanti-bodies in pathogenesis of T1DM as well [18]. Activatedauto-reactive B cells produce autoantibodies and consequent-ly promote autoimmune responses leading to pancreatic betacell destruction [8, 9]. Some evidence represents the
predictive role of these autoantibodies such as anti-IA-2 inT1DM [14, 15].
In the current study, anti-IA-2 antibody was detected inabout half of the T1DM patients. Consistent with our results,Hawa et al. reported 44% anti-IA-2 positivity in their T1DMpatients [19]. Another study performed in Brazil showed62.9% positivity for anti-IA-2 in recent-onset T1DM patients[20].
Several studies elucidated the predictive role of anti-IA-2 indeveloping type 1 diabetes [14, 21, 22]; one of the studiesstated that combining ZnT8A with IAA, GADA, and IA-2assays increases the sensitivity of autoimmune detection[14]. Consistently, the study of Savola et al. reported a 55%predictive value in high levels of anti-IA-2 through 7.7 yearsduration [23].
In contrast to our findings, Singh et al. showed that 22% ofyoung T1DMpatients in north India were positive for anti-IA-
Table 1 Characterization and laboratory finding in different study groups. The data are expressed as mean ± SD
Groups T1DM T1DM relatives T2DM Healthy
N 38 (F = 24, M = 14) 36 (F = 16, M = 20) 88 (F = 48, M = 40) 102 (F = 56, M = 46)
Age (year) 12.05 ± 6.52 7.17 ± 4.48 51.89 ± 10.20 31.39 ± 22.61
FBS: (mg/dl, N) < 100 14 36 8 102
100–126 6 0 6 0
> 126 18 0 74 0
TG 85.47 ± 22.38 82.44 ± 14.98 90 ± 118.66 118.71 ± 3625
Cholesterol 163.37 ± 33.51 149.50 ± 191.77 191.77 ± 43.98 174.86 ± 20.27
LDL 105.21 ± 32.18 95.17 ± 26.12 114.23 ± 35.09 143.08 ± 100.35
HDL 40.63 ± 13.23 36.83 ± 6.21 38.57 ± 7.32 37.91 ± 5.97
HbA1C(mg/dl, N)
< 6.5 2 26 8 102
6.5–9 16 10 42 0
> 9 20 0 36 0
< 2 y 3 -5 y > 5 y0
10
20
30
40
50
Fre
quency
(%)
Fig. 2 Age of onset among T1DM patients
<5 y 5 -1 0 y >1 0 y0
1 0
2 0
3 0
4 0
5 0
Fre
quency
(%)
Fig. 1 Duration of disease among T1DM patients
246 Int J Diabetes Dev Ctries (2021) 41:244–248
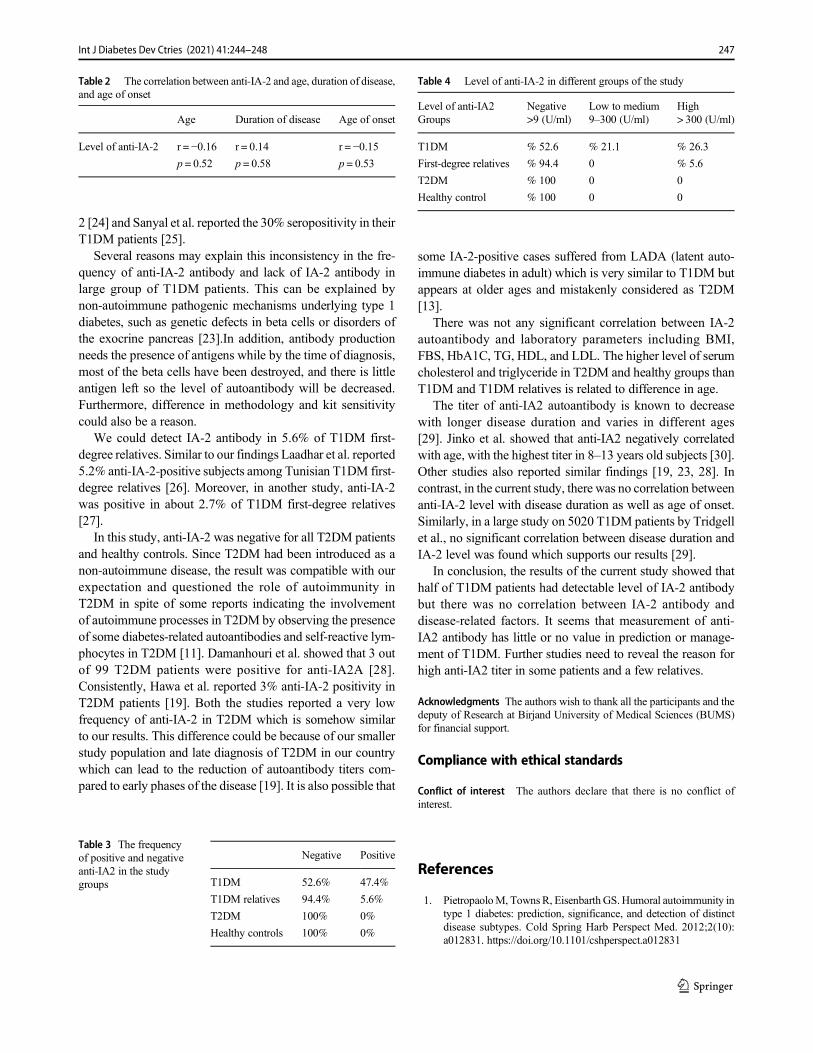
2 [24] and Sanyal et al. reported the 30% seropositivity in theirT1DM patients [25].
Several reasons may explain this inconsistency in the fre-quency of anti-IA-2 antibody and lack of IA-2 antibody inlarge group of T1DM patients. This can be explained bynon-autoimmune pathogenic mechanisms underlying type 1diabetes, such as genetic defects in beta cells or disorders ofthe exocrine pancreas [23].In addition, antibody productionneeds the presence of antigens while by the time of diagnosis,most of the beta cells have been destroyed, and there is littleantigen left so the level of autoantibody will be decreased.Furthermore, difference in methodology and kit sensitivitycould also be a reason.
We could detect IA-2 antibody in 5.6% of T1DM first-degree relatives. Similar to our findings Laadhar et al. reported5.2% anti-IA-2-positive subjects among Tunisian T1DM first-degree relatives [26]. Moreover, in another study, anti-IA-2was positive in about 2.7% of T1DM first-degree relatives[27].
In this study, anti-IA-2 was negative for all T2DM patientsand healthy controls. Since T2DM had been introduced as anon-autoimmune disease, the result was compatible with ourexpectation and questioned the role of autoimmunity inT2DM in spite of some reports indicating the involvementof autoimmune processes in T2DM by observing the presenceof some diabetes-related autoantibodies and self-reactive lym-phocytes in T2DM [11]. Damanhouri et al. showed that 3 outof 99 T2DM patients were positive for anti-IA2A [28].Consistently, Hawa et al. reported 3% anti-IA-2 positivity inT2DM patients [19]. Both the studies reported a very lowfrequency of anti-IA-2 in T2DM which is somehow similarto our results. This difference could be because of our smallerstudy population and late diagnosis of T2DM in our countrywhich can lead to the reduction of autoantibody titers com-pared to early phases of the disease [19]. It is also possible that
some IA-2-positive cases suffered from LADA (latent auto-immune diabetes in adult) which is very similar to T1DM butappears at older ages and mistakenly considered as T2DM[13].
There was not any significant correlation between IA-2autoantibody and laboratory parameters including BMI,FBS, HbA1C, TG, HDL, and LDL. The higher level of serumcholesterol and triglyceride in T2DM and healthy groups thanT1DM and T1DM relatives is related to difference in age.
The titer of anti-IA2 autoantibody is known to decreasewith longer disease duration and varies in different ages[29]. Jinko et al. showed that anti-IA2 negatively correlatedwith age, with the highest titer in 8–13 years old subjects [30].Other studies also reported similar findings [19, 23, 28]. Incontrast, in the current study, there was no correlation betweenanti-IA-2 level with disease duration as well as age of onset.Similarly, in a large study on 5020 T1DM patients by Tridgellet al., no significant correlation between disease duration andIA-2 level was found which supports our results [29].
In conclusion, the results of the current study showed thathalf of T1DM patients had detectable level of IA-2 antibodybut there was no correlation between IA-2 antibody anddisease-related factors. It seems that measurement of anti-IA2 antibody has little or no value in prediction or manage-ment of T1DM. Further studies need to reveal the reason forhigh anti-IA2 titer in some patients and a few relatives.
Acknowledgments The authors wish to thank all the participants and thedeputy of Research at Birjand University of Medical Sciences (BUMS)for financial support.
Compliance with ethical standards
Conflict of interest The authors declare that there is no conflict ofinterest.
References
1. PietropaoloM, TownsR, Eisenbarth GS. Humoral autoimmunity intype 1 diabetes: prediction, significance, and detection of distinctdisease subtypes. Cold Spring Harb Perspect Med. 2012;2(10):a012831. https://doi.org/10.1101/cshperspect.a012831
Table 4 Level of anti-IA-2 in different groups of the study
Level of anti-IA2 Negative>9 (U/ml)
Low to medium9–300 (U/ml)
High> 300 (U/ml)Groups
T1DM % 52.6 % 21.1 % 26.3
First-degree relatives % 94.4 0 % 5.6
T2DM % 100 0 0
Healthy control % 100 0 0
Table 3 The frequencyof positive and negativeanti-IA2 in the studygroups
Negative Positive
T1DM 52.6% 47.4%
T1DM relatives 94.4% 5.6%
T2DM 100% 0%
Healthy controls 100% 0%
Table 2 The correlation between anti-IA-2 and age, duration of disease,and age of onset
Age Duration of disease Age of onset
Level of anti-IA-2 r = −0.16 r = 0.14 r = −0.15p = 0.52 p = 0.58 p = 0.53
247Int J Diabetes Dev Ctries (2021) 41:244–248
2. Patterson CC, Dahlquist GG, Gyurus E, Green A, Soltesz G.Incidence trends for childhood type 1 diabetes in Europe during1989–2003 and predicted new cases 2005–20: a multicentre pro-spective registration study. Lancet. 2009;373(9680):2027–33.
3. Lantion-Ang LC. Epidemiology of diabetes mellitus in Westernpacific region: focus on Philippines. Diabetes Res Clin Pract.2000;50(Suppl 2):S29–34.
4. Mathers CD, Loncar D. Projections of global mortality and burdenof disease from 2002 to 2030. PLoS Med. 2006;3(11):e442.
5. Dorman JS, Bunker CH. HLA-DQ locus of the human leukocyteantigen complex and type 1 diabetes mellitus: a HuGE review.Epidemiol Rev. 2000;22(2):218–27.
6. Katsarou A, Gudbjörnsdottir S, Rawshani A, Dabelea D, BonifacioE, Anderson BJ, et al. Type 1 diabetes mellitus. Nat Rev DisPrimers. 2017;3:17016.
7. Litherland SA. Immunopathogenic interaction of environmentaltriggers and genetic susceptibility in diabetes: is epigenetics themissing link? Diabetes. 2008;57(12):3184–6.
8. Wallberg M, Cooke A. Immune mechanisms in type 1 diabetes.Trends Immunol. 2013;34(12):583–91.
9. van Belle TL, Coppieters KT, von Herrath MG. Type 1 diabetes:etiology, immunology, and therapeutic strategies. Physiol Rev.2011;91(1):79–118.
10. Ziegler AG, Nepom GT. Prediction and pathogenesis in type 1diabetes. Immunity. 2010;32(4):468–78.
11. Itariu BK, Stulnig TM. Autoimmune aspects of type 2 diabetesmellitus - a mini-review. Gerontology. 2014;60(3):189–96.
12. Arslanian S. Type 2 diabetes in children: clinical aspects and riskfactors. Horm Res. 2002;57(Suppl 1):19–28.
13. Bottazzo GF, Bosi E, Cull CA, Bonifacio E, LocatelliM, Zimmet P,et al. IA-2 antibody prevalence and risk assessment of early insulinrequirement in subjects presenting with type 2 diabetes (UKPDS71). Diabetologia. 2005;48(4):703–8.
14. Wenzlau JM, Hutton JC. Novel diabetes autoantibodies and predic-tion of type 1 diabetes. Curr Diab Rep. 2013;13(5):608–15.
15. Bonifacio E. Predicting type 1 diabetes using biomarkers. DiabetesCare. 2015;38(6):989–96.
16. Raz I, Eldor R, Naparstek Y. Immune modulation for prevention oftype 1 diabetes mellitus. Trends Biotechnol. 2005;23(3):128–34.
17. Sosa L, Torkko JM, Primo ME, Llovera RE, Toledo PL, Rios AS,et al. Biochemical, biophysical, and functional properties ofICA512/IA-2 RESP18 homology domain. Biochim BiophysActa. 2016;1864(5):511–22.
18. Smith MJ, Simmons KM, Cambier JC. B cells in type 1 diabetesmellitus and diabetic kidney disease. Nat Rev Nephrol.2017;13(11):712–20.
19. Hawa MI, Fava D, Medici F, Deng YJ, Notkins AL, De Mattia G,et al. Antibodies to IA-2 and GAD65 in type 1 and type 2 diabetes:isotype restriction and polyclonality. Diabetes Care. 2000;23(2):228–33.
20. Pardini VC, Mourão DM, Nascimento PD, Vívolo MA, FerreiraSRG, Pardini H. Frequency of islet cell autoantibodies (IA-2 andGAD) in young Brazilian type 1 diabetes patients. Braz J Med BiolRes. 1999;32:1195–8.
21. Wasserfall CH, Atkinson MA. Autoantibody markers for the diag-nosis and prediction of type 1 diabetes. Autoimmun Rev.2006;5(6):424–8.
22. Taplin CE, Barker JM. Autoantibodies in type 1 diabetes.Autoimmunity. 2008;41(1):11–8.
23. Savola K. Role of IA-2 antibodies in clinical and preclinical type Idiabetes: Oulun yliopisto; 2000.
24. Singh AK, Bhatia E, Dabadghao P, Bhatia V, Gellert SA, ColmanPG. Role of islet autoimmunity in the aetiology of different clinicalsubtypes of diabetes mellitus in young north Indians. Diabet Med.2000;17(4):275–80.
25. Sanyal D, Majumder A, Chaudhuri SR, Chatterjee S. Thyroid pro-file and autoantibodies in type 1 diabetes subjects: a perspectivefrom eastern India. Indian J Endocrinol Metab. 2017;21(1):45–50.
26. Laadhar L, Gassara A, Mahfoudh N. Ben Hadj hmida Y, KamounT, ben Ayed M, et al. [susceptibility markers in Tunisian first-degree relatives of patients with type 1 diabetes]. Ann Endocrinol.2007;68(2–3):181–5.
27. Incani M, Serafini C, Satta C, et al. High prevalence of diabetes-specific autoimmunity in first-degree relatives of Sardinian patientswith type 1 diabetes. Diabetes Metab Res Rev. 2017;33(3):e2864.
28. Damanhouri LH, Dromey JA, Christie MR, Nasrat HA, ArdawiMS, Robins RA, et al. Autoantibodies to GAD and IA-2 in SaudiArabian diabetic patients. Diabet Med. 2005;22(4):448–52.
29. Tridgell DM, Spiekerman C,Wang RS, Greenbaum CJ. Interactionof onset and duration of diabetes on the percent of GAD and IA-2antibody-positive subjects in the type 1 diabetes genetics consor-tium database. Diabetes Care. 2011;34(4):988–93.
30. Graham J, Hagopian WA, Kockum I, Li LS, Sanjeevi CB, LoweRM, et al. Genetic effects on age-dependent onset and islet cellautoantibody markers in type 1 diabetes. Diabetes. 2002;51(5):1346–55.
Publisher’s note Springer Nature remains neutral with regard to jurisdic-tional claims in published maps and institutional affiliations.
248 Int J Diabetes Dev Ctries (2021) 41:244–248
ORIGINAL ARTICLE
The impact of high-fat and high-protein meal of adolescentswith type 1 diabetes mellitus receiving intensive insulin therapyon postprandial blood glucose level: a randomized, crossover,breakfast study
Aylin Bayindir Gümüş1 & Alev Keser1 & Zeynep Şiklar2 & Merih Berberoğlu2
Received: 31 October 2019 /Accepted: 27 May 2020# Research Society for Study of Diabetes in India 2021
AbstractBackground In addition to carbohydrate count, this study aims to investigate the impact of the determination of bolus insulindoses by fat and protein counts on postprandial blood glucose level for adolescents having type 1 diabetes mellitus.Methods The study was crossover and randomized; and all of participants were given standard breakfast (insulin dose accordingto carbohydrate/insulin ratio) for 1 day, and high-fat and high-protein breakfast for 2 days. The insulin dose for one of test mealwas determined based on carbohydrate/insulin ratio. In the second application, in addition to carbohydrate/insulin ratios of theadolescents, 1 unit of insulin per what was added for each 200 kcal of energy provided from fat and protein of the meal.Postprandial blood glucose was recorded for 4 h using a continuous glucose monitoring system at intervals of 30 min.Results The mean blood glucose level between 0 and 240 min following consumption of different meals increased significantlyin second application after 150th minute comparing with first application (p < 0.05).In addition to this, between 30 and 240 minglycemic response of second application seemed to be higher than those responses in first and third application. The differenceamong them was not significant (p > 0.05).However, the glycemic excursion of 30–0 min in third application was higher than theexcursion in first and second applications while the glycemic excursion in first application between 150 and 120 min was higherthan in third application (p < 0.05).Conclusions These evidences demonstrated that high-fat and high-protein meal increases the requirement of insulin. Eventually,this study shows that there could be alternative algorithms to carbohydrate-based approach for the determination of the bolusinsulin dose.
Keywords Type 1 diabetesmellitus . Postprandial glucose level . High-fat meal . High-proteinmeal
Highlights • High-fat and high-protein meal raised postprandial bloodglucose after 150 min and this meal increased the requirement of insulinin adolescent with type 1 diabetes• Postprandial glycemia was improved when fat and protein was countedalong with carbohydrate in adolescents with type 1 diabetes• When calculating insulin dose, the amount of fat and protein was con-sidered for glycemic control in adolescents with type 1 diabetes
* Aylin Bayindir Gümüş[email protected]
Alev [email protected]
Zeynep Ş[email protected]
Merih Berberoğ[email protected]
1 Faculty of Health Sciences, Department of Nutrition and Dietetics,Ankara University, Fatih Street No:197/A, Ankara, Keçiören, Turkey
2 Faculty of Medicine, Department of Pediatric Endocrinology,Ankara University, AÜ Tıp Fakültesi Hst. No:6,06620 Ankara, Mamak, Turkey
https://doi.org/10.1007/s13410-020-00836-1
/ Published online: 5 January 2021
International Journal of Diabetes in Developing Countries (2021) 41:249–258
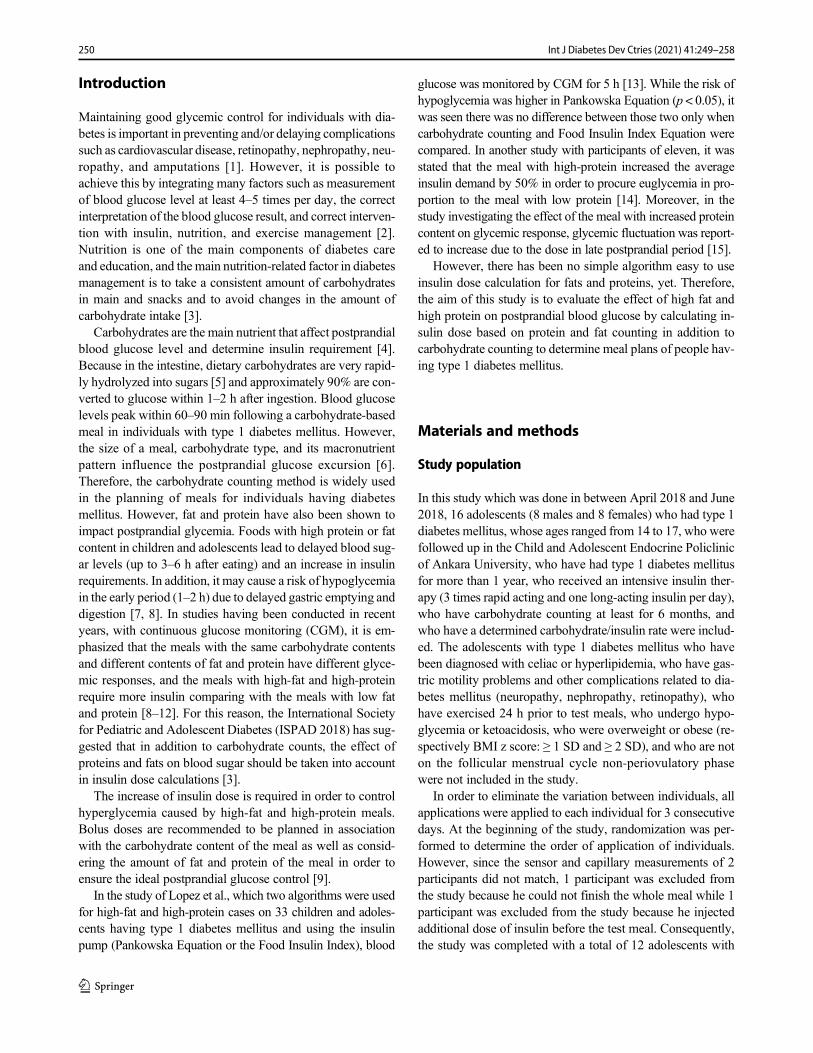
Introduction
Maintaining good glycemic control for individuals with dia-betes is important in preventing and/or delaying complicationssuch as cardiovascular disease, retinopathy, nephropathy, neu-ropathy, and amputations [1]. However, it is possible toachieve this by integrating many factors such as measurementof blood glucose level at least 4–5 times per day, the correctinterpretation of the blood glucose result, and correct interven-tion with insulin, nutrition, and exercise management [2].Nutrition is one of the main components of diabetes careand education, and the main nutrition-related factor in diabetesmanagement is to take a consistent amount of carbohydratesin main and snacks and to avoid changes in the amount ofcarbohydrate intake [3].
Carbohydrates are the main nutrient that affect postprandialblood glucose level and determine insulin requirement [4].Because in the intestine, dietary carbohydrates are very rapid-ly hydrolyzed into sugars [5] and approximately 90% are con-verted to glucose within 1–2 h after ingestion. Blood glucoselevels peak within 60–90 min following a carbohydrate-basedmeal in individuals with type 1 diabetes mellitus. However,the size of a meal, carbohydrate type, and its macronutrientpattern influence the postprandial glucose excursion [6].Therefore, the carbohydrate counting method is widely usedin the planning of meals for individuals having diabetesmellitus. However, fat and protein have also been shown toimpact postprandial glycemia. Foods with high protein or fatcontent in children and adolescents lead to delayed blood sug-ar levels (up to 3–6 h after eating) and an increase in insulinrequirements. In addition, it may cause a risk of hypoglycemiain the early period (1–2 h) due to delayed gastric emptying anddigestion [7, 8]. In studies having been conducted in recentyears, with continuous glucose monitoring (CGM), it is em-phasized that the meals with the same carbohydrate contentsand different contents of fat and protein have different glyce-mic responses, and the meals with high-fat and high-proteinrequire more insulin comparing with the meals with low fatand protein [8–12]. For this reason, the International Societyfor Pediatric and Adolescent Diabetes (ISPAD 2018) has sug-gested that in addition to carbohydrate counts, the effect ofproteins and fats on blood sugar should be taken into accountin insulin dose calculations [3].
The increase of insulin dose is required in order to controlhyperglycemia caused by high-fat and high-protein meals.Bolus doses are recommended to be planned in associationwith the carbohydrate content of the meal as well as consid-ering the amount of fat and protein of the meal in order toensure the ideal postprandial glucose control [9].
In the study of Lopez et al., which two algorithms were usedfor high-fat and high-protein cases on 33 children and adoles-cents having type 1 diabetes mellitus and using the insulinpump (Pankowska Equation or the Food Insulin Index), blood
glucose was monitored by CGM for 5 h [13]. While the risk ofhypoglycemia was higher in Pankowska Equation (p < 0.05), itwas seen there was no difference between those two only whencarbohydrate counting and Food Insulin Index Equation werecompared. In another study with participants of eleven, it wasstated that the meal with high-protein increased the averageinsulin demand by 50% in order to procure euglycemia in pro-portion to the meal with low protein [14]. Moreover, in thestudy investigating the effect of the meal with increased proteincontent on glycemic response, glycemic fluctuation was report-ed to increase due to the dose in late postprandial period [15].
However, there has been no simple algorithm easy to useinsulin dose calculation for fats and proteins, yet. Therefore,the aim of this study is to evaluate the effect of high fat andhigh protein on postprandial blood glucose by calculating in-sulin dose based on protein and fat counting in addition tocarbohydrate counting to determine meal plans of people hav-ing type 1 diabetes mellitus.
Materials and methods
Study population
In this study which was done in between April 2018 and June2018, 16 adolescents (8 males and 8 females) who had type 1diabetes mellitus, whose ages ranged from 14 to 17, who werefollowed up in the Child and Adolescent Endocrine Policlinicof Ankara University, who have had type 1 diabetes mellitusfor more than 1 year, who received an intensive insulin ther-apy (3 times rapid acting and one long-acting insulin per day),who have carbohydrate counting at least for 6 months, andwho have a determined carbohydrate/insulin rate were includ-ed. The adolescents with type 1 diabetes mellitus who havebeen diagnosed with celiac or hyperlipidemia, who have gas-tric motility problems and other complications related to dia-betes mellitus (neuropathy, nephropathy, retinopathy), whohave exercised 24 h prior to test meals, who undergo hypo-glycemia or ketoacidosis, who were overweight or obese (re-spectively BMI z score: ≥ 1 SD and ≥ 2 SD), and who are noton the follicular menstrual cycle non-periovulatory phasewere not included in the study.
In order to eliminate the variation between individuals, allapplications were applied to each individual for 3 consecutivedays. At the beginning of the study, randomization was per-formed to determine the order of application of individuals.However, since the sensor and capillary measurements of 2participants did not match, 1 participant was excluded fromthe study because he could not finish the whole meal while 1participant was excluded from the study because he injectedadditional dose of insulin before the test meal. Consequently,the study was completed with a total of 12 adolescents with
250 Int J Diabetes Dev Ctries (2021) 41:249–258
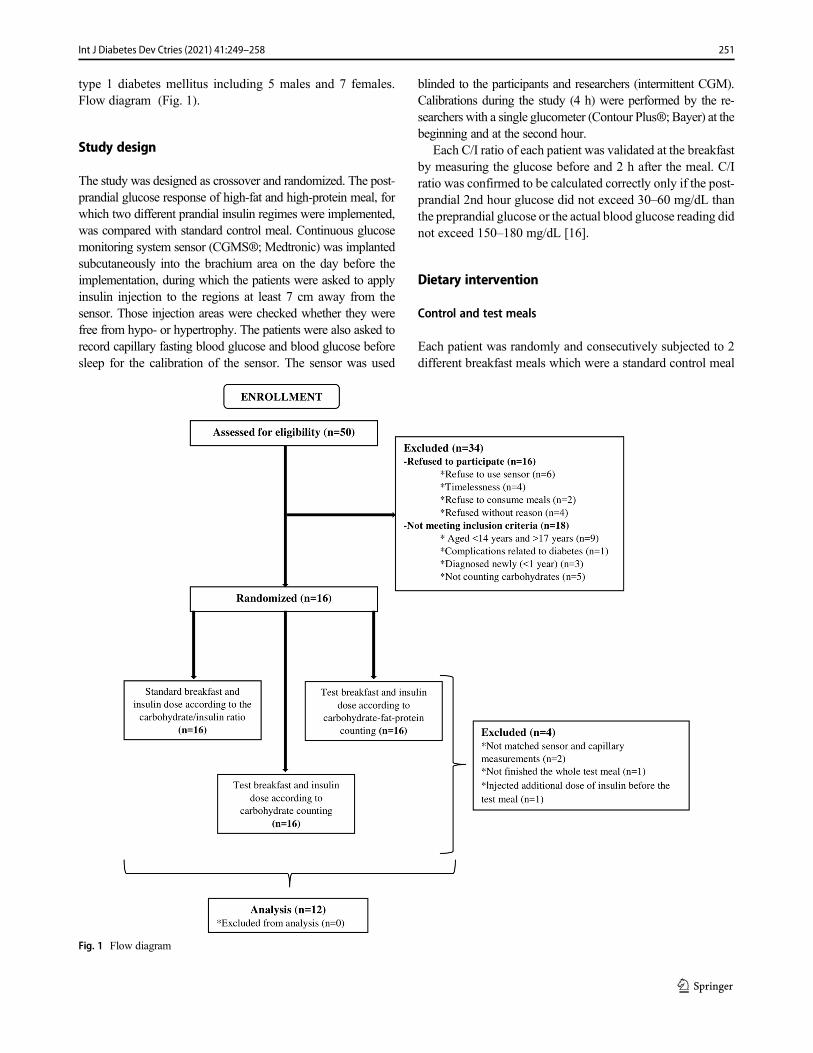
type 1 diabetes mellitus including 5 males and 7 females.Flow diagram (Fig. 1).
Study design
The study was designed as crossover and randomized. The post-prandial glucose response of high-fat and high-protein meal, forwhich two different prandial insulin regimes were implemented,was compared with standard control meal. Continuous glucosemonitoring system sensor (CGMS®; Medtronic) was implantedsubcutaneously into the brachium area on the day before theimplementation, during which the patients were asked to applyinsulin injection to the regions at least 7 cm away from thesensor. Those injection areas were checked whether they werefree from hypo- or hypertrophy. The patients were also asked torecord capillary fasting blood glucose and blood glucose beforesleep for the calibration of the sensor. The sensor was used
blinded to the participants and researchers (intermittent CGM).Calibrations during the study (4 h) were performed by the re-searchers with a single glucometer (Contour Plus®; Bayer) at thebeginning and at the second hour.
Each C/I ratio of each patient was validated at the breakfastby measuring the glucose before and 2 h after the meal. C/Iratio was confirmed to be calculated correctly only if the post-prandial 2nd hour glucose did not exceed 30–60 mg/dL thanthe preprandial glucose or the actual blood glucose reading didnot exceed 150–180 mg/dL [16].
Dietary intervention
Control and test meals
Each patient was randomly and consecutively subjected to 2different breakfast meals which were a standard control meal
Fig. 1 Flow diagram
251Int J Diabetes Dev Ctries (2021) 41:249–258
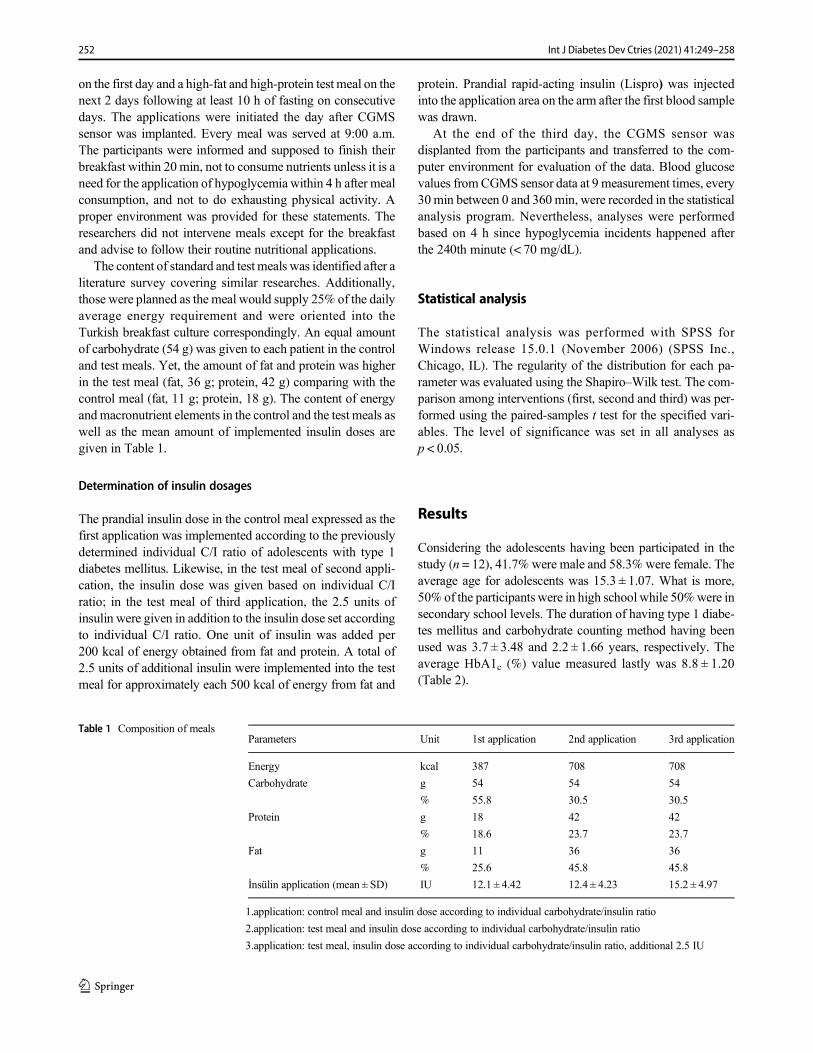
on the first day and a high-fat and high-protein test meal on thenext 2 days following at least 10 h of fasting on consecutivedays. The applications were initiated the day after CGMSsensor was implanted. Every meal was served at 9:00 a.m.The participants were informed and supposed to finish theirbreakfast within 20 min, not to consume nutrients unless it is aneed for the application of hypoglycemia within 4 h after mealconsumption, and not to do exhausting physical activity. Aproper environment was provided for these statements. Theresearchers did not intervene meals except for the breakfastand advise to follow their routine nutritional applications.
The content of standard and test meals was identified after aliterature survey covering similar researches. Additionally,those were planned as the meal would supply 25% of the dailyaverage energy requirement and were oriented into theTurkish breakfast culture correspondingly. An equal amountof carbohydrate (54 g) was given to each patient in the controland test meals. Yet, the amount of fat and protein was higherin the test meal (fat, 36 g; protein, 42 g) comparing with thecontrol meal (fat, 11 g; protein, 18 g). The content of energyandmacronutrient elements in the control and the test meals aswell as the mean amount of implemented insulin doses aregiven in Table 1.
Determination of insulin dosages
The prandial insulin dose in the control meal expressed as thefirst application was implemented according to the previouslydetermined individual C/I ratio of adolescents with type 1diabetes mellitus. Likewise, in the test meal of second appli-cation, the insulin dose was given based on individual C/Iratio; in the test meal of third application, the 2.5 units ofinsulin were given in addition to the insulin dose set accordingto individual C/I ratio. One unit of insulin was added per200 kcal of energy obtained from fat and protein. A total of2.5 units of additional insulin were implemented into the testmeal for approximately each 500 kcal of energy from fat and
protein. Prandial rapid-acting insulin (Lispro) was injectedinto the application area on the arm after the first blood samplewas drawn.
At the end of the third day, the CGMS sensor wasdisplanted from the participants and transferred to the com-puter environment for evaluation of the data. Blood glucosevalues fromCGMS sensor data at 9 measurement times, every30min between 0 and 360 min, were recorded in the statisticalanalysis program. Nevertheless, analyses were performedbased on 4 h since hypoglycemia incidents happened afterthe 240th minute (< 70 mg/dL).
Statistical analysis
The statistical analysis was performed with SPSS forWindows release 15.0.1 (November 2006) (SPSS Inc.,Chicago, IL). The regularity of the distribution for each pa-rameter was evaluated using the Shapiro–Wilk test. The com-parison among interventions (first, second and third) was per-formed using the paired-samples t test for the specified vari-ables. The level of significance was set in all analyses asp < 0.05.
Results
Considering the adolescents having been participated in thestudy (n = 12), 41.7% were male and 58.3% were female. Theaverage age for adolescents was 15.3 ± 1.07. What is more,50% of the participants were in high school while 50%were insecondary school levels. The duration of having type 1 diabe-tes mellitus and carbohydrate counting method having beenused was 3.7 ± 3.48 and 2.2 ± 1.66 years, respectively. Theaverage HbA1c (%) value measured lastly was 8.8 ± 1.20(Table 2).
Table 1 Composition of mealsParameters Unit 1st application 2nd application 3rd application
Energy kcal 387 708 708
Carbohydrate g 54 54 54
% 55.8 30.5 30.5
Protein g 18 42 42
% 18.6 23.7 23.7
Fat g 11 36 36
% 25.6 45.8 45.8
İnsülin application (mean ± SD) IU 12.1 ± 4.42 12.4 ± 4.23 15.2 ± 4.97
1.application: control meal and insulin dose according to individual carbohydrate/insulin ratio
2.application: test meal and insulin dose according to individual carbohydrate/insulin ratio
3.application: test meal, insulin dose according to individual carbohydrate/insulin ratio, additional 2.5 IU
252 Int J Diabetes Dev Ctries (2021) 41:249–258
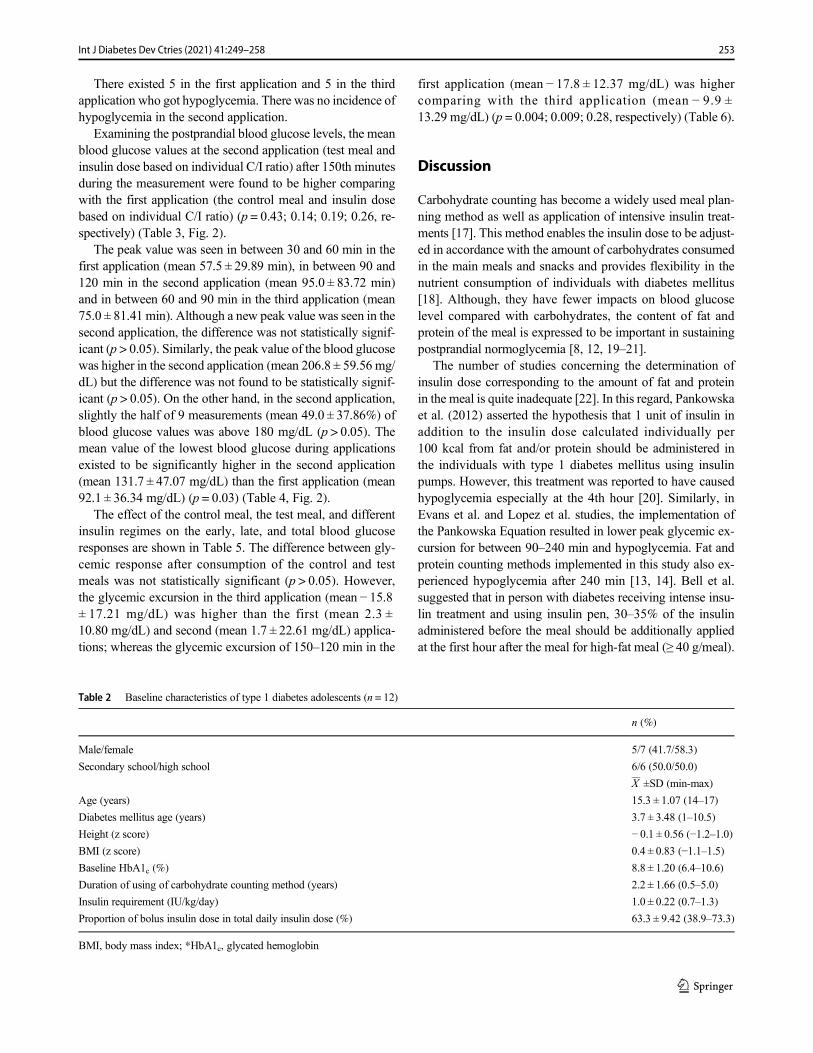
There existed 5 in the first application and 5 in the thirdapplication who got hypoglycemia. There was no incidence ofhypoglycemia in the second application.
Examining the postprandial blood glucose levels, the meanblood glucose values at the second application (test meal andinsulin dose based on individual C/I ratio) after 150th minutesduring the measurement were found to be higher comparingwith the first application (the control meal and insulin dosebased on individual C/I ratio) (p = 0.43; 0.14; 0.19; 0.26, re-spectively) (Table 3, Fig. 2).
The peak value was seen in between 30 and 60 min in thefirst application (mean 57.5 ± 29.89 min), in between 90 and120 min in the second application (mean 95.0 ± 83.72 min)and in between 60 and 90 min in the third application (mean75.0 ± 81.41 min). Although a new peak value was seen in thesecond application, the difference was not statistically signif-icant (p > 0.05). Similarly, the peak value of the blood glucosewas higher in the second application (mean 206.8 ± 59.56 mg/dL) but the difference was not found to be statistically signif-icant (p > 0.05). On the other hand, in the second application,slightly the half of 9 measurements (mean 49.0 ± 37.86%) ofblood glucose values was above 180 mg/dL (p > 0.05). Themean value of the lowest blood glucose during applicationsexisted to be significantly higher in the second application(mean 131.7 ± 47.07 mg/dL) than the first application (mean92.1 ± 36.34 mg/dL) (p = 0.03) (Table 4, Fig. 2).
The effect of the control meal, the test meal, and differentinsulin regimes on the early, late, and total blood glucoseresponses are shown in Table 5. The difference between gly-cemic response after consumption of the control and testmeals was not statistically significant (p > 0.05). However,the glycemic excursion in the third application (mean − 15.8± 17.21 mg/dL) was higher than the first (mean 2.3 ±10.80 mg/dL) and second (mean 1.7 ± 22.61 mg/dL) applica-tions; whereas the glycemic excursion of 150–120 min in the
first application (mean − 17.8 ± 12.37 mg/dL) was highercomparing with the third application (mean − 9.9 ±13.29 mg/dL) (p = 0.004; 0.009; 0.28, respectively) (Table 6).
Discussion
Carbohydrate counting has become a widely used meal plan-ning method as well as application of intensive insulin treat-ments [17]. This method enables the insulin dose to be adjust-ed in accordance with the amount of carbohydrates consumedin the main meals and snacks and provides flexibility in thenutrient consumption of individuals with diabetes mellitus[18]. Although, they have fewer impacts on blood glucoselevel compared with carbohydrates, the content of fat andprotein of the meal is expressed to be important in sustainingpostprandial normoglycemia [8, 12, 19–21].
The number of studies concerning the determination ofinsulin dose corresponding to the amount of fat and proteinin the meal is quite inadequate [22]. In this regard, Pankowskaet al. (2012) asserted the hypothesis that 1 unit of insulin inaddition to the insulin dose calculated individually per100 kcal from fat and/or protein should be administered inthe individuals with type 1 diabetes mellitus using insulinpumps. However, this treatment was reported to have causedhypoglycemia especially at the 4th hour [20]. Similarly, inEvans et al. and Lopez et al. studies, the implementation ofthe Pankowska Equation resulted in lower peak glycemic ex-cursion for between 90–240 min and hypoglycemia. Fat andprotein counting methods implemented in this study also ex-perienced hypoglycemia after 240 min [13, 14]. Bell et al.suggested that in person with diabetes receiving intense insu-lin treatment and using insulin pen, 30–35% of the insulinadministered before the meal should be additionally appliedat the first hour after the meal for high-fat meal (≥ 40 g/meal).
Table 2 Baseline characteristics of type 1 diabetes adolescents (n = 12)
n (%)
Male/female 5/7 (41.7/58.3)
Secondary school/high school 6/6 (50.0/50.0)
X ±SD (min-max)
Age (years) 15.3 ± 1.07 (14–17)
Diabetes mellitus age (years) 3.7 ± 3.48 (1–10.5)
Height (z score) − 0.1 ± 0.56 (−1.2–1.0)BMI (z score) 0.4 ± 0.83 (−1.1–1.5)Baseline HbA1c (%) 8.8 ± 1.20 (6.4–10.6)
Duration of using of carbohydrate counting method (years) 2.2 ± 1.66 (0.5–5.0)
Insulin requirement (IU/kg/day) 1.0 ± 0.22 (0.7–1.3)
Proportion of bolus insulin dose in total daily insulin dose (%) 63.3 ± 9.42 (38.9–73.3)
BMI, body mass index; *HbA1c, glycated hemoglobin
253Int J Diabetes Dev Ctries (2021) 41:249–258
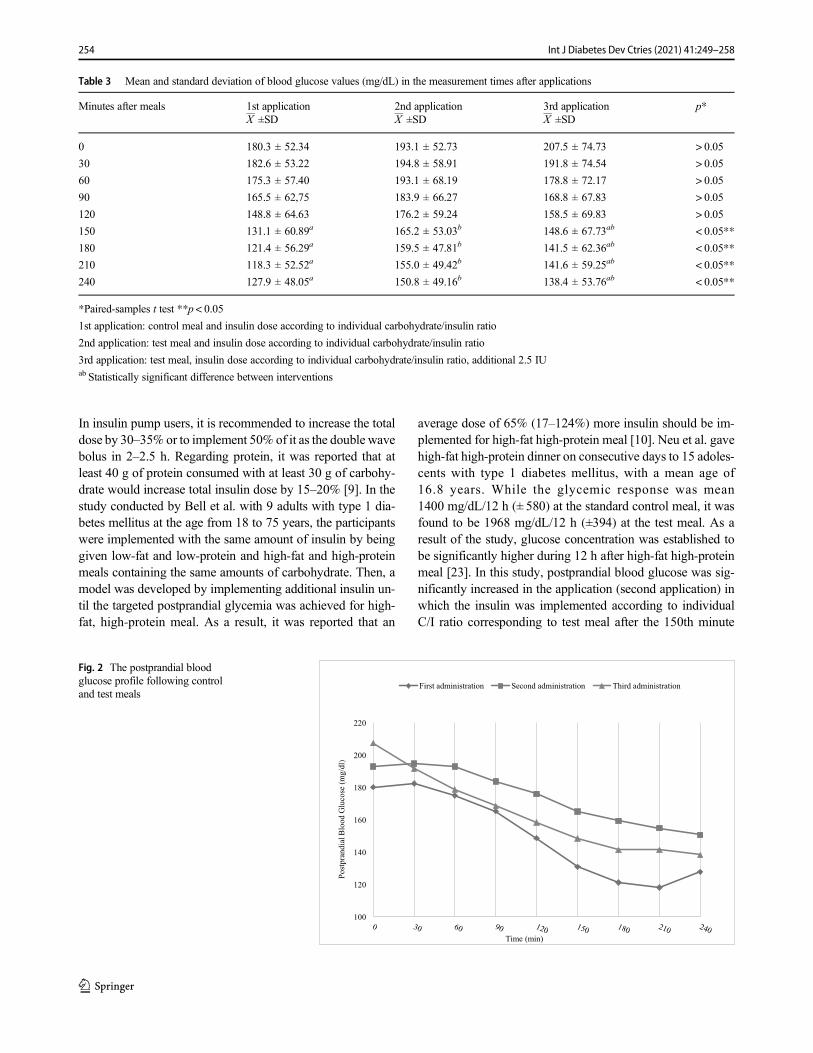
In insulin pump users, it is recommended to increase the totaldose by 30–35% or to implement 50% of it as the double wavebolus in 2–2.5 h. Regarding protein, it was reported that atleast 40 g of protein consumed with at least 30 g of carbohy-drate would increase total insulin dose by 15–20% [9]. In thestudy conducted by Bell et al. with 9 adults with type 1 dia-betes mellitus at the age from 18 to 75 years, the participantswere implemented with the same amount of insulin by beinggiven low-fat and low-protein and high-fat and high-proteinmeals containing the same amounts of carbohydrate. Then, amodel was developed by implementing additional insulin un-til the targeted postprandial glycemia was achieved for high-fat, high-protein meal. As a result, it was reported that an
average dose of 65% (17–124%) more insulin should be im-plemented for high-fat high-protein meal [10]. Neu et al. gavehigh-fat high-protein dinner on consecutive days to 15 adoles-cents with type 1 diabetes mellitus, with a mean age of16.8 years. While the glycemic response was mean1400 mg/dL/12 h (± 580) at the standard control meal, it wasfound to be 1968 mg/dL/12 h (±394) at the test meal. As aresult of the study, glucose concentration was established tobe significantly higher during 12 h after high-fat high-proteinmeal [23]. In this study, postprandial blood glucose was sig-nificantly increased in the application (second application) inwhich the insulin was implemented according to individualC/I ratio corresponding to test meal after the 150th minute
Table 3 Mean and standard deviation of blood glucose values (mg/dL) in the measurement times after applications
Minutes after meals 1st application 2nd application 3rd application p*X ±SD X ±SD X ±SD
0 180.3 ± 52.34 193.1 ± 52.73 207.5 ± 74.73 > 0.05
30 182.6 ± 53.22 194.8 ± 58.91 191.8 ± 74.54 > 0.05
60 175.3 ± 57.40 193.1 ± 68.19 178.8 ± 72.17 > 0.05
90 165.5 ± 62,75 183.9 ± 66.27 168.8 ± 67.83 > 0.05
120 148.8 ± 64.63 176.2 ± 59.24 158.5 ± 69.83 > 0.05
150 131.1 ± 60.89a 165.2 ± 53.03b 148.6 ± 67.73ab < 0.05**
180 121.4 ± 56.29a 159.5 ± 47.81b 141.5 ± 62.36ab < 0.05**
210 118.3 ± 52.52a 155.0 ± 49.42b 141.6 ± 59.25ab < 0.05**
240 127.9 ± 48.05a 150.8 ± 49.16b 138.4 ± 53.76ab < 0.05**
*Paired-samples t test **p < 0.05
1st application: control meal and insulin dose according to individual carbohydrate/insulin ratio
2nd application: test meal and insulin dose according to individual carbohydrate/insulin ratio
3rd application: test meal, insulin dose according to individual carbohydrate/insulin ratio, additional 2.5 IUab Statistically significant difference between interventions
100
120
140
160
180
200
220
ld/
gm(
esoc
ulG
do
olB
laid
narpts
oP
)
Time (min)
First administration Second administration Third administration
Fig. 2 The postprandial bloodglucose profile following controland test meals
254 Int J Diabetes Dev Ctries (2021) 41:249–258
compared with the standard meal (first application) (p < 0.05,Table 3). In order to reduce the risk of hypoglycemia observedin the study of Pankowska et al. [20], 1 unit of additionalinsulin was implemented in test meal per 200 kcal of energyfrom protein and fat (third application), and the glycemic re-sponse was found to be similar to the first application. Theincrease of insulin dose in this way caused a lower bloodglucose course statistically and clinically. Mean postprandialblood glucose levels were higher in the meal with high-fat andhigh-protein and without any additional dose of insulin(p < 0.05, Table 3). However, even though the area underthe curve (glycemic response) seems to be higher in the sec-ond application compared with other applications, the differ-ence in between was not statistically significant (Table 5,Fig. 2). These results suggest that the test meal increases post-prandial blood glucose compared with the control meal inadolescents with type 1 diabetes mellitus, but there is a needfor additional studies to provide normoglycemia.
During the treatment applications, the mean value of lowestblood glucose was found to be significantly higher in thesecond application comparing with the first application(p < 0.05), but no significant difference was found in termsof statistic at the peak values of postprandial blood glucose(p > 0.05, Table 4). In the study of Kaya, the effects of fats and
proteins on postprandial blood glucose were evaluated, peakblood glucose mean (mean 280.10 ± 62.22mg/dL) at the treat-ment of insulin according to C/I ratio corresponding to high-fat and high-protein meal was found to be higher comparedwith other treatments (p < 0.05) [24]. In this study, the meanof time at which postprandial blood glucose reached the peakpoint was found to be 57.5, 95, and 75 min, respectively(p > 0.05, Table 4). Similarly, in the study of Lodefalk et al.,7 adolescents with type 1 diabetes mellitus were given twotypes of meals with different content of fat and energy (2 g offat, containing 320 kcal of energy, and 38 g of fat, containing640 kcal of energy) and with the same content of protein andcarbohydrate, and their postprandial blood glucose were mon-itored during 4 h. As a result of the study, no significantrelationship was found between the meals at the peak glucosetime [25].
Even though the ratio of individual with postprandial bloodglucose level above > 180 mg/dL was the highest in the sec-ond application (49%) and the lowest in the first application(27.1%), the difference in between was not statistically signif-icant (p > 0.05, Table 4). In spite of the additional dose havingbeen implemented, blood glucose levels having higher coursein the third application than in the first application and a down-ward travel of the blood glucose suggest that the insulin
Table 4 Mean and standard deviation values of glycemic results
Glycemic outputs 1st application 2nd application 3rd application p*X ±SD X ±SD X ±SD
Peak value of the blood glucose (mg/dL) 189.8 ± 56.45 206.8 ± 59.56 201.3 ± 67.92 > 0.05
Peak time for the blood glucose (min) 57.5 ± 29.89 95.0 ± 83.72 75.0 ± 81.41 > 0.05
Lowest value of the blood glucose (mg/dL) 92.1 ± 36.34a 131.7 ± 47.07b 111.2 ± 48.64ab < 0.05**
Proportion of times that blood glucose values were above 180 mg/dL (%) 27.1 ± 36.48 49.0 ± 37.86 30.2 ± 38.60 > 0.05
*Paired-samples t test **p < 0.05
1st application: control meal and insulin dose according to individual carbohydrate/insulin ratio
2nd application: test meal and insulin dose according to individual carbohydrate/insulin ratio
3rd application: test meal, insulin dose according to individual carbohydrate/insulin ratio, additional 2.5 IUab Statistically significant difference between interventions
Table 5 Early and late postprandial glucose response after control and test meals
Area under the curve(mg/dLxmin) 1st application 2nd application 3rd application p*X ±SD X ±SD X ±SD
Early (0–120 min) 20,636.3 ± 6667.70 22,691.3 ± 7248.99 21,672.5 ± 8434.23 > 0.05
Late (120–240 min) 16,171.5 ± 6635.06 19,283.8 ± 5825.77 17,403.8 ± 7106.63 > 0.05
Total (0–240 min) 37,788.0 ± 12,455.21 41,985.0 ± 12,411.05 39,076.3 ± 14,817.73 > 0.05
*Paired-samples t test **p < 0.05
1st application: control meal and insulin dose according to individual carbohydrate/insulin ratio
2nd application: test meal and insulin dose according to individual carbohydrate/insulin ratio
3rd application: test meal, insulin dose according to individual carbohydrate/insulin ratio, additional 2.5 IU
255Int J Diabetes Dev Ctries (2021) 41:249–258
implemented for fat and protein needs to be applied as dis-pensing dose instead of bolus. In similar studies, it is sug-gested that high-fat and/or high-protein meals increase therequirement of insulin in 42–125 [10, 21]. In the study con-ducted by Wolpert et al., 7 individuals with type 1 diabetesmellitus using insulin pump were given high-fat (60 g) andlow-fat (10 g) meals at the dinner containing the same amountof carbohydrates and proteins on different days, and the con-tent of morning and lunch meals as well as physical activitylevels were fixed. The blood glucose level was monitored byCGM for 18 h following the consumption of test meal. As aresult of the study, it was revealed that the high-fat eveningmeal requires more insulin compared with low fat eveningmeal (p = 0.01), the C/I ratio at high-fat meal at the dinnerwas lower (p = 0.01), and the impact of diet fat on insulinrequirement showed individual differences (p = 0.03). It wasreported that a meal containing high-fat causes hyperglycemiaafter 5th hour and requires insulin [12]. However, in anotherstudy conducted with 17 individuals with type 1 diabetesmellitus with a similar method, it was observed that majorityof individuals had blood glucose in the normoglycemic range(70–180 mg/dL) within 180 min following high-fat and high-proteinmeals [26]. Such broad spectrum of increasing require-ment was considered to be stemmed from individual differ-ences [10].
In the study of Smart et al., it was though the glucoseexcursion of high-fat and high-protein test meal was also stat-ed to be higher [8]. In this study, the glycemic excursion of30–0 min at third application was higher compared with firstand second applications; the glycemic excursion of 150–120 min at first application was higher compared with thirdapplication (p < 0.05, Table 6). The studies conducted in theperson without diabetes and with type 1 diabetes have shownthat saturated fats cause deeper insulin resistance compared
with monounsaturated and polyunsaturated fatty acid [27,28]. In this study, the breakfast meal contained predominantlyunsaturated fatty acids (test meal 41% of saturated fat, 59% ofunsaturated fat). One of the reasons for the consequences thatare not similar to the literature was considered to be this situ-ation. On the other hand, further studies are needed to beconducted to determine the effects of diets with different fattyacid patterns on glycemic control in individuals having type 1diabetes mellitus.
The results of this study indicated that the fat and proteincontent of the meal may cause postprandial hyperglycemia inindividuals with type 1 diabetes mellitus. In an intensive in-sulin therapy, which is commonly used in the management oftype 1 diabetes mellitus, there are limitations to the currentcarbohydrate-based approach used to calculate the bolus insu-lin dose. Therefore, more studies are needed to develop andvalidate alternative insulin dose algorithms for high-fat andhigh-protein meals.
As a result, the presence of hypoglycemia cases in the firstand third applications, but no hypoglycemia in the secondapplication, proves that high fat and high protein meals in-crease the need of insulin. The mean postprandial blood glu-cose levels after high-fat and protein meal in the adolescentswith type 1 diabetes mellitus who receive intensive insulintreatment were significantly higher in terms of statistics after150 min compared with control meal. This study reveals asupportive evidence that the amount of protein and fat in ad-dition to carbohydrate should be taken into account in deter-mining the insulin dose. However, the results of studies eval-uating the effects of dietary fat and protein on blood glucoselevels and insulin requirements are inconsistent, the methodand quality of studies are significantly different, making itdifficult to develop an algorithm for fat and protein counting.Hence, further studies are required to explore the glycemic
Table 6 Glucose excursions (mg/dL) at 30-min intervals
Interval (min) 1st application 2nd application 3rd application p*X ±SD X ±SD X ±SD
30–0 2.3 ± 10.80a 1.7 ± 22.61a −15.8 ± 17.21b < 0.05**
60–30 −7.3 ± 16.40 −1.7 ± 18.65 −12.9 ± 11.81 > 0.05
90–60 −9.8 ± 18.75 −9.2 ± 12.22 −10.0 ± 14.30 > 0.05
120–90 −16.7 ± 12.54 −7.8 ± 11.36 −10.3 ± 16.08 > 0.05
150–120 −17.8 ± 12.37a −11.0 ± 15.38ab −9.9 ± 13.29b < 0.05**
180–150 −9.7 ± 16.95 −5.7 ± 15.32 −7.1 ± 14.81 > 0.05
210–180 −3.1 ± 20.72 −4.5 ± 13.34 0.1 ± 31.54 > 0.05
240–210 0.0 ± 19.22 −4.3 ± 12.02 −3.2 ± 11.42 > 0.05
*Paired-samples t test **p < 0.05
1st application: control meal and insulin dose according to individual carbohydrate/insulin ratio
2nd application: test meal and insulin dose according to individual carbohydrate/insulin ratio
3rd application: test meal, insulin dose according to individual carbohydrate/insulin ratio, additional 2,5 IUab Statistically significant difference between interventions
256 Int J Diabetes Dev Ctries (2021) 41:249–258
impact of fat and protein more thoroughly. Therefore, in orderto prevent hyperglycemia after high-fat and high-proteinmeals, it is considered that people with diabetes mellitusshould be evaluated individually. On the other hand, in thetraining of carbohydrate counting, patients and their familiesshould be informed about adequate and balanced meals to bepreferred rather than consuming high-fat and high-proteinmeals. Higher fat and higher protein meals appear to needadditional insulin and thus need to be evaluated on an individ-ual basis.
High-fat and high-protein meal raised postprandial bloodglucose after 150 min and this meal increased the requirementof insulin in adolescent with type 1 diabetes mellitus.Postprandial glycemia was improved when fat and proteinwas counted along with carbohydrate in adolescents with type1 diabetes mellitus. Calculating insulin dose, the amount of fatand protein was considered for glycemic control in adoles-cents with type 1 diabetes mellitus.
Limitations There are some limitations in the study. Firstly,the onlymeal having intervenedwas the breakfast, and routinemedical nutrition therapy was expected to continue for othermeals. However, commitment to nutritional therapy wasquestioned at the beginning of the study exclusively.Secondly, while determining the individual C/I ratio, the re-cord of the nutrient consumption was requested from the ad-olescents. However, incorrect or incomplete disclosure ofthese records was ignored.
In addition, most of the studies on this subject have beenperformed in people with type 1 diabetes mellitus using insu-lin pump, and individuals using insulin pen participated in thisstudy. Therefore, the insulin implemented for high-fat andhigh-protein meals since bolus is not as the spreading dose.Furthermore, blood glucose values before initial applicationare not in the euglycemia range. This is because the partici-pants are in adolescence, and their compliance to treatment ispoor. The difficulty in finding volunteer participants in thisstudy is the reason for the high glucose level in 0 min.Although the initial blood glucose level was not in the optimalrange, no statistically significant difference was found be-tween the applications, and the effect of the applications wasevaluated. However, the data of this study provided clinicallyimportant findings in Turkey as a developing country.
Acknowledgments We thank all adolescents who participated in thisstudy and Prof. Dr. Mehtap Akçil Ok for her benefits in statisticalanalysis.
Authors’ contributions A. B. G., A. K., Z. Ş., andM. B contributed to theconception and design of this study; A. B. G. performed the statisticalanalyses; A. B. G., A. K., Z. Ş., and M. B. were responsible for theglucose measurements and accounting insulin dosages. A. B. G. preparedbreakfast meals and helped participants consume this meal. A. B. G. andA. K. wrote the manuscript. All authors contributed to the interpretation
of the results or revision of the manuscript and approved the final manu-script. All authors reviewed and approved the final version of themanuscript.
Funding information This research was funded by Ankara UniversityScientific Researches Projects. (Project No. 18 L0241003).
Data availability Authors affirm that the submission represents originalwork that has not been published previously and that it is not currentlybeing considered by another journal.
Compliance with ethical standards
Conflict of interests The authors declare that they have no conflict ofinterest.
Ethical approval The study was conducted in accordance with theHelsinki Declaration and was approved by the local Ethics Committees.After the approval (69545805-044-E.22189) required for the study wasobtained from Ankara University, Faculty of Medicine, Cebeci Researchand Application Hospital; the study was executed with the EthicsCommittee Approvals received from Ankara University Clinic StudiesEthical Committee (18-1163-17) and from Turkish Republic Ministry ofHealth Turkey Pharmaceuticals and Medical Devices Agency(93189304-514.04.01-E.245193). All study performed as appropriate toHelsinki declaration and our institution ethical rules
Statement of informed consent All the patients and their parents wereinformed about the study and their consent was written obtained.
Transparency declaration The lead author affirms that this manuscriptis an honest, accurate and transparent account of the study being reported.The reporting of this work is compliant with CONSORT guidelines. Thelead author affirms that no important aspects of the study have beenomitted and that any discrepancies from the study as planned have beenexplained.
References
1. Russell WR, Baka A, Björck I, Delzenne N, Gao D, Griffiths HR,et al. Impact of diet composition on blood glucose regulation. CritRev Food Sci Nutr. 2016;56(4):541–90.
2. Amer DA. Standards of medical care in diabetes-2011 AmericanDiabetes Association. Diabetes Care. 2011;34:S11–61.
3. Smart CE, Annan F, Higgins LA, Jelleryd E, Lopez M, Acerini CL.ISPAD Clinical Practice Consensus Guidelines 2018: Nutritionalmanagement in children and adolescents with diabetes 2018.
4. Association AD. 9. Pharmacologic approaches to glycemic treat-ment: standards of medical care in diabetes—2019. Diabetes Care.2019;42(Supplement 1):S90–S102.
5. Franz MJ. Protein: metabolism and effect on blood glucose levels.Diabetes Educ. 1997;23(6):643–51.
6. Bell KJ, King BR, Shafat A, Smart CE. The relationship betweencarbohydrate and the mealtime insulin dose in type 1 diabetes. JDiabetes Complicat. 2015;29(8):1323–9.
7. Paterson M, Smart C, Lopez P, McElduff P, Attia J, Morbey C,et al. Influence of dietary protein on postprandial blood glucoselevels in individuals with type 1 diabetes mellitus using intensiveinsulin therapy. Diabet Med. 2016;33(5):592–8.
8. Smart CE, Evans M, O’connell SM, McElduff P, Lopez PE, JonesTW, et al. Both dietary protein and fat increase postprandial glucose
257Int J Diabetes Dev Ctries (2021) 41:249–258
excursions in children with type 1 diabetes, and the effect is addi-tive. Diabetes Care. 2013;36(12):3897–902.
9. Bell KJ, Smart CE, Steil GM, Brand-Miller JC, King B, WolpertHA. Impact of fat, protein, and glycemic index on postprandialglucose control in type 1 diabetes: implications for intensive diabe-tes management in the continuous glucose monitoring era. DiabetesCare. 2015;38(6):1008–15.
10. Bell KJ, Toschi E, Steil GM, Wolpert HA. Optimized mealtimeinsulin dosing for fat and protein in type 1 diabetes: application ofa model-based approach to derive insulin doses for open-loop dia-betes management. Diabetes Care. 2016;39(9):1631–4.
11. Van der Hoogt M, van Dyk J, Dolman R, Pieters M. Protein and fatmeal content increase insulin requirement in children with type 1diabetes–role of duration of diabetes. J Clin Transl Endocrinol.2017;10:15–21.
12. Wolpert HA, Atakov-Castillo A, Smith SA, Steil GM. Dietary fatacutely increases glucose concentrations and insulin requirementsin patients with type 1 diabetes: implications for carbohydrate-based bolus dose calculation and intensive diabetes management.Diabetes Care. 2013;36(4):810–6.
13. Lopez P, Evans M, King B, Jones T, Bell K, McElduff P, et al. Arandomized comparison of three prandial insulin dosing algorithmsfor children and adolescents with type 1 diabetes. Diabet Med.2018;35(10):1440–7.
14. Evans M, Smart C, Paramalingam N, Smith G, Jones T, King B,et al. Dietary protein affects both the dose and pattern of insulindelivery required to achieve postprandial euglycaemia in type 1diabetes: a randomized trial. Diabet Med. 2019;36(4):499–504.
15. PatersonM, Smart C, Lopez P, Howley P,McElduff P, Attia J, et al.Increasing the protein quantity in a meal results in dose-dependenteffects on postprandial glucose levels in individuals with type 1diabetes mellitus. Diabet Med. 2017;34(6):851–4.
16. Bode BW, Kaufman FR, Vint N. An expert opinion on advancedinsulin pump use in youth with type 1 diabetes. Diabetes TechnolTher. 2017;19(3):145–54.
17. Control D, Group CTR. The effect of intensive treatment of diabe-tes on the development and progression of long-term complicationsin insulin-dependent diabetes mellitus. N Engl J Med.1993;329(14):977–86.
18. Tascini G, Berioli M, Cerquiglini L, Santi E, Mancini G, Rogari F,et al. Carbohydrate counting in children and adolescents with type 1diabetes. Nutrients. 2018;10(1):109.
19. Kordonouri O, Hartmann R, Remus K, Bläsig S, Sadeghian E,Danne T. Benefit of supplementary fat plus protein counting ascompared with conventional carbohydrate counting for insulin bo-lus calculation in children with pump therapy. Pediatr Diabetes.2012;13(7):540–4.
20. Pańkowska E, Błazik M, Groele L. Does the fat-protein meal in-crease postprandial glucose level in type 1 diabetes patients oninsulin pump: the conclusion of a randomized study. DiabetesTechnol Ther. 2012;14(1):16–22.
21. Paterson M, Bell KJ, O’Connell SM, Smart CE, Shafat A, King B.The role of dietary protein and fat in glycaemic control in type 1diabetes: implications for intensive diabetes management. CurrDiabetes Rep. 2015;15(9):61.
22. Pańkowska E, Błazik M. Bolus calculator with nutrition databasesoftware, a new concept of prandial insulin programming for pumpusers. J Diabetes Sci Technol. 2010;4(3):571–6.
23. Neu A, Behret F, Braun R, Herrlich S, Liebrich F, Loesch-BinderM, et al. Higher glucose concentrations following protein-and fat-rich meals–the Tuebingen grill study: a pilot study in adolescentswith type 1 diabetes. Pediatr Diabetes. 2015;16(8):587–91.
24. Kaya N Tip 1 Diyabette Diyet Proteinlerinin ve Yağlarının KanGlukozu Üzerine Etkilerinin Belirlenmesi. 2014
25. Lodefalk M, Åman J, Bang P. Effects of fat supplementation onglycaemic response and gastric emptying in adolescents with type 1diabetes. Diabet Med. 2008;25(9):1030–5.
26. García-López JM, González-Rodriguez M, Pazos-Couselo M,Gude F, Prieto-Tenreiro A, Casanueva F. Should the amounts offat and protein be taken into consideration to calculate the lunchprandial insulin bolus? Results from a randomized crossover trial.Diabetes Technol Ther. 2013;15(2):166–71.
27. Bozzetto L, Alderisio A, Giorgini M, Barone F, Giacco A, RiccardiG, et al. Extra-virgin olive oil reduces glycemic response to a high–glycemic index meal in patients with type 1 diabetes: a randomizedcontrolled trial. Diabetes Care. 2016;39(4):518–24.
28. Xiao C, Giacca A, Carpentier A, Lewis G. Differential effects ofmonounsaturated, polyunsaturated and saturated fat ingestion onglucose-stimulated insulin secretion, sensitivity and clearance inoverweight and obese, non-diabetic humans. Diabetologia.2006;49(6):1371–9.
Publisher’s note Springer Nature remains neutral with regard to jurisdic-tional claims in published maps and institutional affiliations.
258 Int J Diabetes Dev Ctries (2021) 41:249–258
ORIGINAL ARTICLE
Real-world outcomes of insulin pump compared to multiple dailyinjection therapy in adult type 1 diabetes mellitus patientsin a Mediterranean scenario
Jesús Moreno-Ferández1 & José Alberto García-Seco1& Miriam Herrera-Moraleda2 & Angela María Seco1
&
José Ramón Muñoz-Rodríguez3
Received: 1 April 2020 /Accepted: 16 October 2020# Research Society for Study of Diabetes in India 2020
AbstractAim To analyze the real-life outcomes of insulin pump therapy, as compared to multiple daily injection (MDI) treatment, in adulttype 1 diabetes mellitus (T1DM) patients from a tertiary diabetes care hospital in a Mediterranean scenario.Materials and methods Observational cross-sectional study regarding all T1DM patients on insulin pump therapy compared(1:1) with MDI-treated patients selected through simple random sampling from our database. Primary efficacy outcome was todescribe glycated hemoglobin A1c (HbA1c) differences.Results Ninety patients were analyzed (male 53%). Mean age was 40.0 ± 14.4 years, and T1DM duration was 19.7 ± 11.8 years.Duration of continuous subcutaneous insulin infusion (CSII) therapy was 5.6 ± 3.9 years, and most frequent indication (47%) forCSII treatment was HbA1c ≥ 53 mmol/mol (7%). More patients treated with CSII used interstitial glucose monitoring comparedwith MDI patients (73% vs. 20%, p < 0.001). Self-monitoring of blood glucose (SMBG) daily frequency was higher amonginsulin pump–treated patients compared with patients receiving MDI therapy (5.0 ± 2.2 times/day vs. 3.8 ± 3.2 times/day, p =0.048). Glycated hemoglobin was lower among patients on insulin pump therapy compared with MDI-treated patients (54 ± 10mmol/mol vs. 60 ± 13 mmol/mol, 7.1 ± 0.9% vs. 7.6 ± 1.2%; p = 0.038). Besides, patients on insulin pump showed lesshypoglycemia frequency (6% vs. 11%, p = 0.006) and suffered less from frequent hypoglycemia (20% vs. 42%, p = 0.02).Conclusions Patients using insulin pump therapy had a better glycemic control relative to the injection therapy cohort in a real-world Mediterranean scenario.Trial registration Clinical Trials NCT03793283.
Keywords Real-world . Insulin pump . Continuous subcutaneous insulin infusion .Multiple daily injection therapy . Continuousglucose monitoring . Treatment . Type 1 diabetes
Introduction
Over the last two decades, the use of continuous subcutaneousinsulin infusion (CSII) has markedly increased [1–3]. CSIIsafely improves metabolic control and quality of life in pa-tients with type 1 diabetesmellitus (T1DM) [4, 5].Most recentmeta-analysis showed amodest significant 0.37% reduction inglycated hemoglobin A1c (HbA1c) with lower incidence ofnocturnal hypoglycemia in patients treated with CSII com-pared to multiple daily injections (MDI) [6]. Despite the in-cremental use of insulin pumps among T1DM patients, only aminority achieved glycemic goals [7].
Randomized controlled trials (RCTs) that evaluated CSII com-pared to MDI are based on selected population, for a short periodof time and under very specific conditions [8–10]. Therefore, they
do not reflect the actual routine use of these therapies. Real-lifestudies are deemed necessary to validate information gatheredfrom RCTs in order to add data in the real-world setting. Bothstudies have limitations and should be complementary.
So far, few real-world studies with CSII compared withMDI have been conducted [2, 11, 12], particularly in theMediterranean area [13]. In fact, the wider view comes fromthe Swedish National Diabetes Register where the group treat-ed with insulin pump therapy showed some clinical benefitsincluding less frequent fatal cardiovascular disease and all-causes mortality [2].
In our knowledge, no study has specifically compared real-life use and clinical effects of CSII with MDI in adult T1DMpatients in theMediterranean area. Here, we present the resultsfrom a Spanish tertiary diabetes care hospital.
https://doi.org/10.1007/s13410-020-00887-4
/ Published online: 10 November 2020
International Journal of Diabetes in Developing Countries (2021) 41:259–265
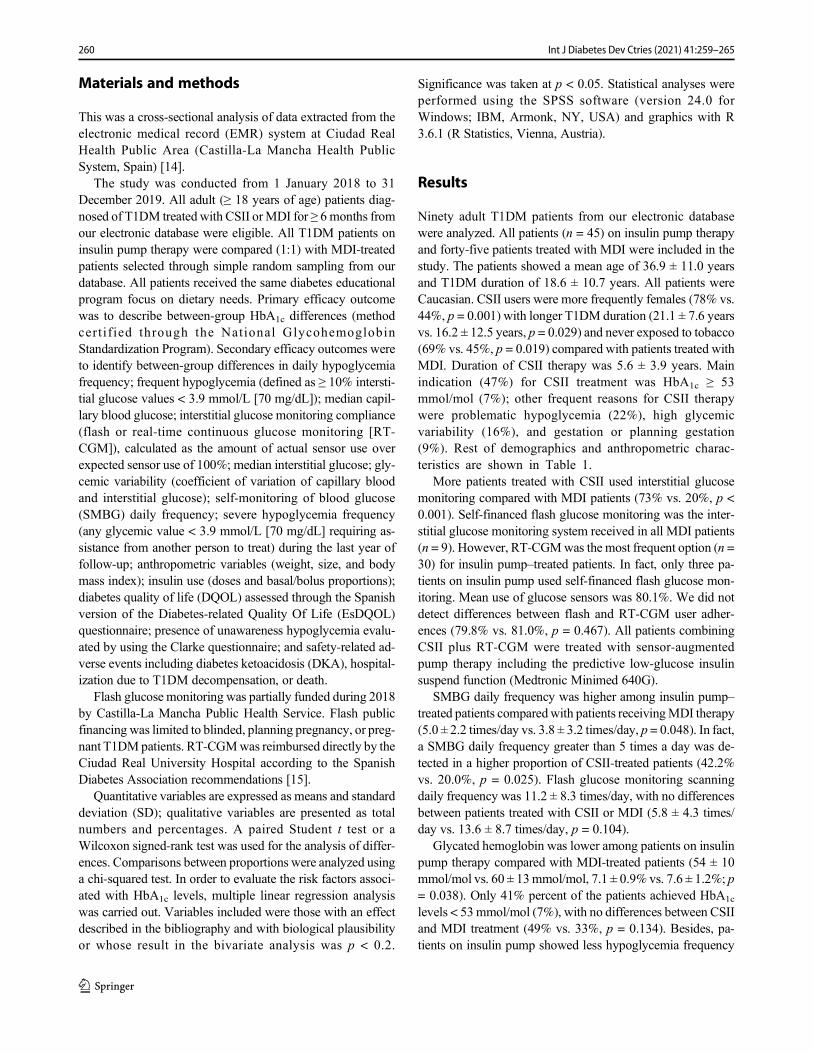
Materials and methods
This was a cross-sectional analysis of data extracted from theelectronic medical record (EMR) system at Ciudad RealHealth Public Area (Castilla-La Mancha Health PublicSystem, Spain) [14].
The study was conducted from 1 January 2018 to 31December 2019. All adult (≥ 18 years of age) patients diag-nosed of T1DM treated with CSII orMDI for ≥ 6months fromour electronic database were eligible. All T1DM patients oninsulin pump therapy were compared (1:1) with MDI-treatedpatients selected through simple random sampling from ourdatabase. All patients received the same diabetes educationalprogram focus on dietary needs. Primary efficacy outcomewas to describe between-group HbA1c differences (methodcert i f ied through the National GlycohemoglobinStandardization Program). Secondary efficacy outcomes wereto identify between-group differences in daily hypoglycemiafrequency; frequent hypoglycemia (defined as ≥ 10% intersti-tial glucose values < 3.9 mmol/L [70 mg/dL]); median capil-lary blood glucose; interstitial glucose monitoring compliance(flash or real-time continuous glucose monitoring [RT-CGM]), calculated as the amount of actual sensor use overexpected sensor use of 100%; median interstitial glucose; gly-cemic variability (coefficient of variation of capillary bloodand interstitial glucose); self-monitoring of blood glucose(SMBG) daily frequency; severe hypoglycemia frequency(any glycemic value < 3.9 mmol/L [70 mg/dL] requiring as-sistance from another person to treat) during the last year offollow-up; anthropometric variables (weight, size, and bodymass index); insulin use (doses and basal/bolus proportions);diabetes quality of life (DQOL) assessed through the Spanishversion of the Diabetes-related Quality Of Life (EsDQOL)questionnaire; presence of unawareness hypoglycemia evalu-ated by using the Clarke questionnaire; and safety-related ad-verse events including diabetes ketoacidosis (DKA), hospital-ization due to T1DM decompensation, or death.
Flash glucose monitoring was partially funded during 2018by Castilla-La Mancha Public Health Service. Flash publicfinancing was limited to blinded, planning pregnancy, or preg-nant T1DMpatients. RT-CGMwas reimbursed directly by theCiudad Real University Hospital according to the SpanishDiabetes Association recommendations [15].
Quantitative variables are expressed as means and standarddeviation (SD); qualitative variables are presented as totalnumbers and percentages. A paired Student t test or aWilcoxon signed-rank test was used for the analysis of differ-ences. Comparisons between proportions were analyzed usinga chi-squared test. In order to evaluate the risk factors associ-ated with HbA1c levels, multiple linear regression analysiswas carried out. Variables included were those with an effectdescribed in the bibliography and with biological plausibilityor whose result in the bivariate analysis was p < 0.2.
Significance was taken at p < 0.05. Statistical analyses wereperformed using the SPSS software (version 24.0 forWindows; IBM, Armonk, NY, USA) and graphics with R3.6.1 (R Statistics, Vienna, Austria).
Results
Ninety adult T1DM patients from our electronic databasewere analyzed. All patients (n = 45) on insulin pump therapyand forty-five patients treated with MDI were included in thestudy. The patients showed a mean age of 36.9 ± 11.0 yearsand T1DM duration of 18.6 ± 10.7 years. All patients wereCaucasian. CSII users were more frequently females (78% vs.44%, p = 0.001) with longer T1DM duration (21.1 ± 7.6 yearsvs. 16.2 ± 12.5 years, p = 0.029) and never exposed to tobacco(69% vs. 45%, p = 0.019) compared with patients treated withMDI. Duration of CSII therapy was 5.6 ± 3.9 years. Mainindication (47%) for CSII treatment was HbA1c ≥ 53mmol/mol (7%); other frequent reasons for CSII therapywere problematic hypoglycemia (22%), high glycemicvariability (16%), and gestation or planning gestation(9%). Rest of demographics and anthropometric charac-teristics are shown in Table 1.
More patients treated with CSII used interstitial glucosemonitoring compared with MDI patients (73% vs. 20%, p <0.001). Self-financed flash glucose monitoring was the inter-stitial glucose monitoring system received in all MDI patients(n = 9). However, RT-CGMwas the most frequent option (n =30) for insulin pump–treated patients. In fact, only three pa-tients on insulin pump used self-financed flash glucose mon-itoring. Mean use of glucose sensors was 80.1%. We did notdetect differences between flash and RT-CGM user adher-ences (79.8% vs. 81.0%, p = 0.467). All patients combiningCSII plus RT-CGM were treated with sensor-augmentedpump therapy including the predictive low-glucose insulinsuspend function (Medtronic Minimed 640G).
SMBG daily frequency was higher among insulin pump–treated patients comparedwith patients receivingMDI therapy(5.0 ± 2.2 times/day vs. 3.8 ± 3.2 times/day, p = 0.048). In fact,a SMBG daily frequency greater than 5 times a day was de-tected in a higher proportion of CSII-treated patients (42.2%vs. 20.0%, p = 0.025). Flash glucose monitoring scanningdaily frequency was 11.2 ± 8.3 times/day, with no differencesbetween patients treated with CSII or MDI (5.8 ± 4.3 times/day vs. 13.6 ± 8.7 times/day, p = 0.104).
Glycated hemoglobin was lower among patients on insulinpump therapy compared with MDI-treated patients (54 ± 10mmol/mol vs. 60 ± 13mmol/mol, 7.1 ± 0.9% vs. 7.6 ± 1.2%; p= 0.038). Only 41% percent of the patients achieved HbA1c
levels < 53mmol/mol (7%), with no differences between CSIIand MDI treatment (49% vs. 33%, p = 0.134). Besides, pa-tients on insulin pump showed less hypoglycemia frequency
260 Int J Diabetes Dev Ctries (2021) 41:259–265
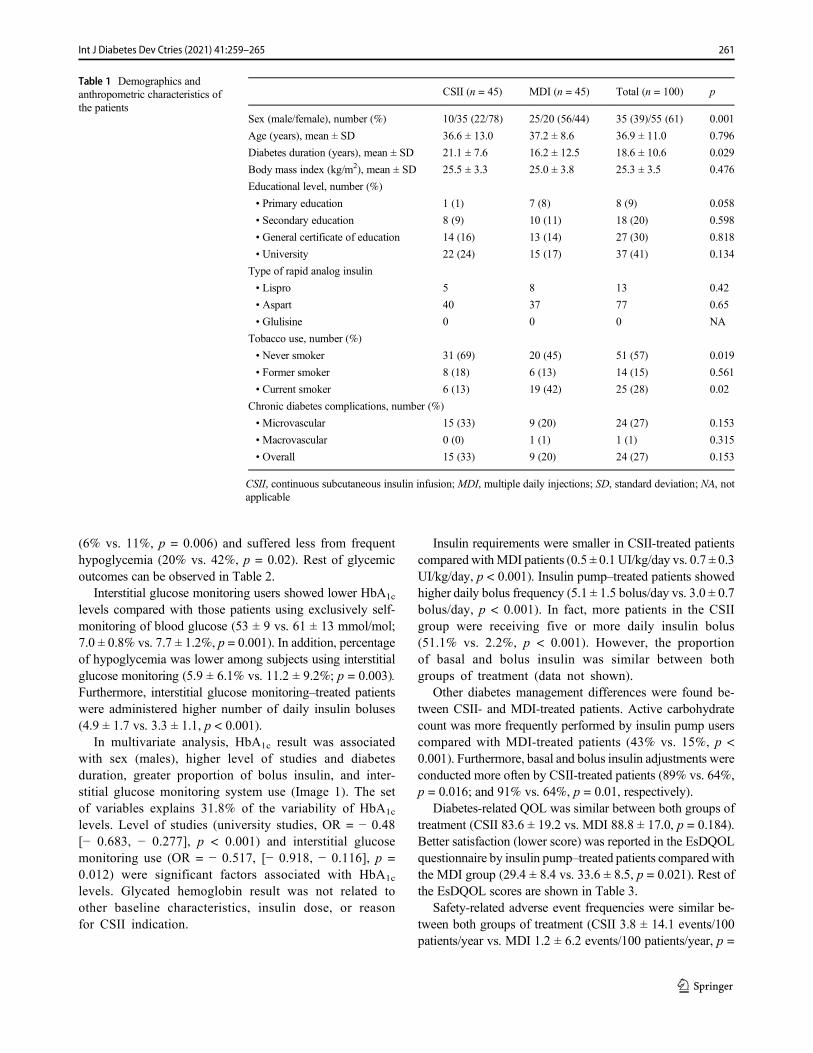
(6% vs. 11%, p = 0.006) and suffered less from frequenthypoglycemia (20% vs. 42%, p = 0.02). Rest of glycemicoutcomes can be observed in Table 2.
Interstitial glucose monitoring users showed lower HbA1c
levels compared with those patients using exclusively self-monitoring of blood glucose (53 ± 9 vs. 61 ± 13 mmol/mol;7.0 ± 0.8% vs. 7.7 ± 1.2%, p = 0.001). In addition, percentageof hypoglycemia was lower among subjects using interstitialglucose monitoring (5.9 ± 6.1% vs. 11.2 ± 9.2%; p = 0.003).Furthermore, interstitial glucose monitoring–treated patientswere administered higher number of daily insulin boluses(4.9 ± 1.7 vs. 3.3 ± 1.1, p < 0.001).
In multivariate analysis, HbA1c result was associatedwith sex (males), higher level of studies and diabetesduration, greater proportion of bolus insulin, and inter-stitial glucose monitoring system use (Image 1). The setof variables explains 31.8% of the variability of HbA1c
levels. Level of studies (university studies, OR = − 0.48[− 0.683, − 0.277], p < 0.001) and interstitial glucosemonitoring use (OR = − 0.517, [− 0.918, − 0.116], p =0.012) were significant factors associated with HbA1c
levels. Glycated hemoglobin result was not related toother baseline characteristics, insulin dose, or reasonfor CSII indication.
Insulin requirements were smaller in CSII-treated patientscompared withMDI patients (0.5 ± 0.1 UI/kg/day vs. 0.7 ± 0.3UI/kg/day, p < 0.001). Insulin pump–treated patients showedhigher daily bolus frequency (5.1 ± 1.5 bolus/day vs. 3.0 ± 0.7bolus/day, p < 0.001). In fact, more patients in the CSIIgroup were receiving five or more daily insulin bolus(51.1% vs. 2.2%, p < 0.001). However, the proportionof basal and bolus insulin was similar between bothgroups of treatment (data not shown).
Other diabetes management differences were found be-tween CSII- and MDI-treated patients. Active carbohydratecount was more frequently performed by insulin pump userscompared with MDI-treated patients (43% vs. 15%, p <0.001). Furthermore, basal and bolus insulin adjustments wereconducted more often by CSII-treated patients (89% vs. 64%,p = 0.016; and 91% vs. 64%, p = 0.01, respectively).
Diabetes-related QOL was similar between both groups oftreatment (CSII 83.6 ± 19.2 vs. MDI 88.8 ± 17.0, p = 0.184).Better satisfaction (lower score) was reported in the EsDQOLquestionnaire by insulin pump–treated patients comparedwiththe MDI group (29.4 ± 8.4 vs. 33.6 ± 8.5, p = 0.021). Rest ofthe EsDQOL scores are shown in Table 3.
Safety-related adverse event frequencies were similar be-tween both groups of treatment (CSII 3.8 ± 14.1 events/100patients/year vs. MDI 1.2 ± 6.2 events/100 patients/year, p =
Table 1 Demographics andanthropometric characteristics ofthe patients
CSII (n = 45) MDI (n = 45) Total (n = 100) p
Sex (male/female), number (%) 10/35 (22/78) 25/20 (56/44) 35 (39)/55 (61) 0.001
Age (years), mean ± SD 36.6 ± 13.0 37.2 ± 8.6 36.9 ± 11.0 0.796
Diabetes duration (years), mean ± SD 21.1 ± 7.6 16.2 ± 12.5 18.6 ± 10.6 0.029
Body mass index (kg/m2), mean ± SD 25.5 ± 3.3 25.0 ± 3.8 25.3 ± 3.5 0.476
Educational level, number (%)
• Primary education 1 (1) 7 (8) 8 (9) 0.058
• Secondary education 8 (9) 10 (11) 18 (20) 0.598
• General certificate of education 14 (16) 13 (14) 27 (30) 0.818
• University 22 (24) 15 (17) 37 (41) 0.134
Type of rapid analog insulin
• Lispro 5 8 13 0.42
• Aspart 40 37 77 0.65
• Glulisine 0 0 0 NA
Tobacco use, number (%)
• Never smoker 31 (69) 20 (45) 51 (57) 0.019
• Former smoker 8 (18) 6 (13) 14 (15) 0.561
• Current smoker 6 (13) 19 (42) 25 (28) 0.02
Chronic diabetes complications, number (%)
• Microvascular 15 (33) 9 (20) 24 (27) 0.153
• Macrovascular 0 (0) 1 (1) 1 (1) 0.315
• Overall 15 (33) 9 (20) 24 (27) 0.153
CSII, continuous subcutaneous insulin infusion; MDI, multiple daily injections; SD, standard deviation; NA, notapplicable
261Int J Diabetes Dev Ctries (2021) 41:259–265
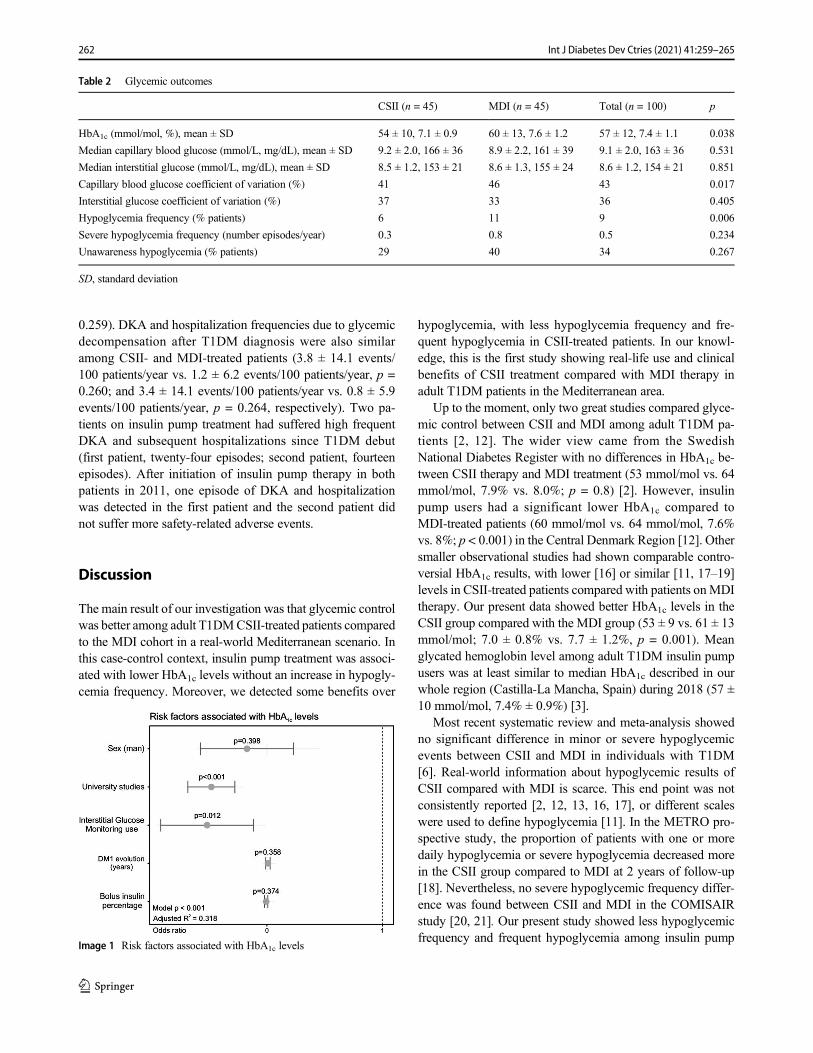
0.259). DKA and hospitalization frequencies due to glycemicdecompensation after T1DM diagnosis were also similaramong CSII- and MDI-treated patients (3.8 ± 14.1 events/100 patients/year vs. 1.2 ± 6.2 events/100 patients/year, p =0.260; and 3.4 ± 14.1 events/100 patients/year vs. 0.8 ± 5.9events/100 patients/year, p = 0.264, respectively). Two pa-tients on insulin pump treatment had suffered high frequentDKA and subsequent hospitalizations since T1DM debut(first patient, twenty-four episodes; second patient, fourteenepisodes). After initiation of insulin pump therapy in bothpatients in 2011, one episode of DKA and hospitalizationwas detected in the first patient and the second patient didnot suffer more safety-related adverse events.
Discussion
The main result of our investigation was that glycemic controlwas better among adult T1DMCSII-treated patients comparedto the MDI cohort in a real-world Mediterranean scenario. Inthis case-control context, insulin pump treatment was associ-ated with lower HbA1c levels without an increase in hypogly-cemia frequency. Moreover, we detected some benefits over
hypoglycemia, with less hypoglycemia frequency and fre-quent hypoglycemia in CSII-treated patients. In our knowl-edge, this is the first study showing real-life use and clinicalbenefits of CSII treatment compared with MDI therapy inadult T1DM patients in the Mediterranean area.
Up to the moment, only two great studies compared glyce-mic control between CSII and MDI among adult T1DM pa-tients [2, 12]. The wider view came from the SwedishNational Diabetes Register with no differences in HbA1c be-tween CSII therapy and MDI treatment (53 mmol/mol vs. 64mmol/mol, 7.9% vs. 8.0%; p = 0.8) [2]. However, insulinpump users had a significant lower HbA1c compared toMDI-treated patients (60 mmol/mol vs. 64 mmol/mol, 7.6%vs. 8%; p < 0.001) in the Central Denmark Region [12]. Othersmaller observational studies had shown comparable contro-versial HbA1c results, with lower [16] or similar [11, 17–19]levels in CSII-treated patients compared with patients onMDItherapy. Our present data showed better HbA1c levels in theCSII group compared with the MDI group (53 ± 9 vs. 61 ± 13mmol/mol; 7.0 ± 0.8% vs. 7.7 ± 1.2%, p = 0.001). Meanglycated hemoglobin level among adult T1DM insulin pumpusers was at least similar to median HbA1c described in ourwhole region (Castilla-La Mancha, Spain) during 2018 (57 ±10 mmol/mol, 7.4% ± 0.9%) [3].
Most recent systematic review and meta-analysis showedno significant difference in minor or severe hypoglycemicevents between CSII and MDI in individuals with T1DM[6]. Real-world information about hypoglycemic results ofCSII compared with MDI is scarce. This end point was notconsistently reported [2, 12, 13, 16, 17], or different scaleswere used to define hypoglycemia [11]. In the METRO pro-spective study, the proportion of patients with one or moredaily hypoglycemia or severe hypoglycemia decreased morein the CSII group compared to MDI at 2 years of follow-up[18]. Nevertheless, no severe hypoglycemic frequency differ-ence was found between CSII and MDI in the COMISAIRstudy [20, 21]. Our present study showed less hypoglycemicfrequency and frequent hypoglycemia among insulin pump
Table 2 Glycemic outcomes
CSII (n = 45) MDI (n = 45) Total (n = 100) p
HbA1c (mmol/mol, %), mean ± SD 54 ± 10, 7.1 ± 0.9 60 ± 13, 7.6 ± 1.2 57 ± 12, 7.4 ± 1.1 0.038
Median capillary blood glucose (mmol/L, mg/dL), mean ± SD 9.2 ± 2.0, 166 ± 36 8.9 ± 2.2, 161 ± 39 9.1 ± 2.0, 163 ± 36 0.531
Median interstitial glucose (mmol/L, mg/dL), mean ± SD 8.5 ± 1.2, 153 ± 21 8.6 ± 1.3, 155 ± 24 8.6 ± 1.2, 154 ± 21 0.851
Capillary blood glucose coefficient of variation (%) 41 46 43 0.017
Interstitial glucose coefficient of variation (%) 37 33 36 0.405
Hypoglycemia frequency (% patients) 6 11 9 0.006
Severe hypoglycemia frequency (number episodes/year) 0.3 0.8 0.5 0.234
Unawareness hypoglycemia (% patients) 29 40 34 0.267
SD, standard deviation
Image 1 Risk factors associated with HbA1c levels
262 Int J Diabetes Dev Ctries (2021) 41:259–265
users compared with patients on MDI therapy. However, wedid not observe severe hypoglycemic frequency differencesbetween the CSII and MDI groups. Our study size wasnot estimated to detect severe hypoglycemia differencesdue to the epidemiological characteristics of a real-world scenario study.
Interstitial glucose monitoring systems (flash or RT-CGM)as a stand-alone device or in combination with CSII (sensor-augmented pump, SAP) lead to improvements in HbA1c withreduced risk of hypoglycemic events [22–30]. SAP with sus-pend before low option reduces both HbA1c and hypoglyce-mic frequency [31–36]. These results are in consonance withour study where interstitial glucose monitoring (with an80% sensor adherence) was associated with an addition-al 8-mmol/mol (0.7%) HbA1c reduction together with53% of hypoglycemia.
Our last set of analysis was aimed at assessing the influenceof CSII compared with MDI on DQOL. This revealed thatCSII-treated patients showed similar DQOL to the MDI groupin the EsDQOL questionnaire. To date, available studies haveonly provided weak and/or insufficient evidence to sustainthat DQOL improves with insulin pump treatment [17, 19].Hoogma et al. described that CSII was not associated withdecreased quality of life [17]. Here, we only detected a signif-icant better score in the satisfaction section in accordance withour previous report [19].
A strength of this study is that although it is not a random-ized controlled trial, it analyzes real-world outcomes over aduration of time on CSII of 5.6 years in a Mediterranean area.CSII duration was not reported by most authors in real-worldstudies [12, 13, 16]. The COMISAIR and the METRO studiesperformed a 1-year and a 2-year follow-up, respectively [18,20]. The Swedish National Diabetes Register described amean follow-up of 6.8 years, although their results may notbe applicable to the Mediterranean scenario [2]. Anotherstrenght of this study is that it came from a population whereCSII patients were compared with a random sampling algo-rithm which minimizes a potential selection bias in the MDIgroup. Finally, the cohorts were managed by one team, somanagement protocols and education are the same for all sub-jects included in the study. However, our study is subject to a
series of limitations. Mainly, the external validity of theseresults is limited because the monocenter study populationmay not be representative of all adult T1DM treated in allpublic health areas in the Mediterranean. Moreover, our studywas not a RCT; therefore, subjects were already on insulinpumps before the study without any wash out period, andthere could be confounding factors not taken into account.
Conclusions
CSII-treated patients had improved glycemic control com-pared to the injection therapy cohort. This better control in-cluded lower HbA1c and less hypoglycemia frequency. Real-world data are necessary to help determine the benefits, cost-effectiveness, and burden of new diabetes technologies as theyare incorporated into clinical care.
Acknowledgment The authors are very grateful to Francisco JavierGomez Romero (Investigation support unit, Ciudad Real GeneralUniversity Hospital, Ciudad Real, Spain) for advice and assistance in dataanalysis.
Compliance with ethical standards
Conflict of interest The authors declare that they have no conflict ofinterest.
Ethical approval The protocol was approved by the reference Castilla-La Mancha Public Health Institute Ethic Committee. All participantsprovided written informed consent. The protocol was publicly registeredthrough Clinical Trials (NCT03793283).
References
1. Jankovec Z, HahnM, Grunder S, Lacigova S, Cechurova D, KrcmaM, et al. Analysis of continuous patient data from the CzechNational Register of patients with type 1 and type 2 diabetes usinginsulin pump therapy. Diabetes Res Clin Pract. 2010;87:219–23.
2. Steineck I, Cederholm J, Eliasson B, Rawshani A, Eeg-Olofsson K,Svensson A-M, et al. Insulin pump therapy, multiple daily injec-tions, and cardiovascular mortality in 18,168 people with type 1diabetes: observational study. BMJ. 2015;350:h3234.
Table 3 Diabetes-related qualityof life EsDQOL CSII (n = 45) MDI (n = 45) Total (n = 100) p
Satisfaction 29.4 ± 8.4 33.6 ± 8.5 31.5 ± 8.6 0.021
Impact 33.0 ± 8.7 33.5 ± 8.7 33.2 ± 7.8 0.790
Social/vacational concern 12.6 ± 5.1 12.7 ± 4.6 12.6 ± 4.8 0.930
Diabetes-related concern 8.9 ± 2.4 9.0 ± 2.8 9.0 ± 2.6 0.935
Total 83.6 ± 19.2 88.8 ± 17.0 86.2 ± 18.2 0.184
Data expressed as mean ± SD
EsDQOL, Spanish version of the Diabetes-related Quality Of Life questionnaire; SD, standard deviation
263Int J Diabetes Dev Ctries (2021) 41:259–265
3. Moreno-Fernandez J, Gomez FJ, Pinés P, González J, López J,López LM, et al. Continuous subcutaneous insulin infusion in adulttype 1 diabetes mellitus patients: results from a public health sys-tem. Diabetes Technol Ther. 2019;21:440–7.
4. Pickup JC, Sutton AJ. Severe hypoglycaemia and glycaemic con-trol in type 1 diabetes: meta-analysis of multiple daily insulin injec-tions compared with continuous subcutaneous insulin infusion.Diabet Med J Br Diabet Assoc. 2008;25:765–74.
5. Bruttomesso D, Costa S, Baritussio A. Continuous subcutaneousinsulin infusion (CSII) 30 years later: still the best option for insulintherapy. Diabetes Metab Res Rev. 2009;25:99–111.
6. Benkhadra K, Alahdab F, Tamhane SU, McCoy RG, Prokop LJ,Murad MH. Continuous subcutaneous insulin infusion versus mul-tiple daily injections in individuals with type 1 diabetes: a system-atic review and meta-analysis. Endocrine. 2017;55:77–84.
7. Foster NC, Beck RW, Miller KM, Clements MA, Rickels MR,DiMeglio LA, et al. State of type 1 diabetes management and out-comes from the T1D Exchange in 2016-2018. Diabetes TechnolTher. 2019;21:66–72.
8. Hanaire-Broutin H, Melki V, Bessières-Lacombe S, Tauber JP.Comparison of continuous subcutaneous insulin infusion and mul-tiple daily injection regimens using insulin lispro in type 1 diabeticpatients on intensified treatment: a randomized study. The studygroup for the development of pump therapy in diabetes. DiabetesCare. 2000;23:1232–5.
9. Tsui E, Barnie A, Ross S, Parkes R, Zinman B. Intensive insulintherapy with insulin lispro: a randomized trial of continuous subcu-taneous insulin infusion versus multiple daily insulin injection.Diabetes Care. 2001;24:1722–7.
10. Garg SK, Voelmle MK, Beatson CR, Miller HA, Crew LB, FresonBJ, et al. Use of continuous glucose monitoring in subjects withtype 1 diabetes on multiple daily injections versus continuous sub-cutaneous insulin infusion therapy: a prospective 6-month study.Diabetes Care. 2011;34:574–9.
11. Boulet G, Halpern EM, Lovblom LE, Weisman A, Bai J-W,Eldelekli D, et al. Prevalence of insulin pump therapy and its asso-ciation with measures of glycemic control: results from theCanadian study of longevity in type 1 diabetes. Diabetes TechnolTher. 2016;18:298–307.
12. Kampmann U, Madsen LR, Bjerg L, Witte DR, Hasselstrøm K,Østergård T, et al. Prevalence and geographical distribution of in-sulin pump therapy in the Central Denmark Region and its associ-ation with metabolic parameters. Diabetes Res Clin Pract.2018;141:148–55.
13. Sastre J, Pinés PJ, Moreno J, Aguirre M, Blanco B, Calderón D,et al. Metabolic control and treatment patterns in patients with type1 diabetes in Castilla-LaMancha: the DIAbetes tipo 1 in Castilla LaMancha study. Endocrinol Nutr Organo Soc Espanola EndocrinolNutr. 2012;59:539–46.
14. Adherence to guidelines Vaccination in type 1 Diabetes mellituspatients (AVADI-1). - Full Text View - ClinicalTrials.gov. [cited2019 Jul 16]. Available from: https://clinicaltrials.gov/ct2/show/NCT03478254.
15. Giménez M, Díaz-Soto G, Andía V. Ruíz de Adana MS, García-Cuartero B, Rigla M, et al. Documento de consenso SED-SEEPsobre el uso de la monitorización continua de la glucosa enEspaña. Endocrinol Diabetes Nutr. 2018;65:24–8.
16. Lepore G, Bruttomesso D, Bonomo M, Dodesini AR, Costa S,Meneghini E, et al. Continuous subcutaneous insulin infusion ismore effective than multiple daily insulin injections in preventingalbumin excretion rate increase in type 1 diabetic patients. DiabetMed J Br Diabet Assoc. 2009;26:602–8.
17. Hoogma RPLM, Spijker AJM, van Doorn-Scheele M, van DoornTT,Michels RPJ, vanDoorn RG, et al. Quality of life andmetaboliccontrol in patients with diabetes mellitus type 1 treated by
continuous subcutaneous insulin infusion or multiple daily insulininjections. Neth J Med. 2004;62:383–7.
18. Maiorino MI, Bellastella G, Casciano O, Cirillo P, Simeon V,Chiodini P, et al. The effects of subcutaneous insulin infusion ver-sus multiple insulin injections on glucose variability in young adultswith type 1 diabetes: the 2-year follow-up of the observationalMETRO study. Diabetes Technol Ther. 2018;20:117–26.
19. Lozano-Serrano M, García-Seco JA, García-Seco F, Lozano-Hernández MC, Seco-Segura ÁM, Moreno-Fernández J, et al.Satisfaction and quality of life evaluation in patients with type 1diabetes mellitus treated using continuous subcutaneous insulin in-fusion compared with multiple daily injections. Enfermeria Clin.2013;23:96–102.
20. Šoupal J, Petruželková L, FlekačM, Pelcl T,MatoulekM, DaňkováM, et al. Comparison of different treatment modalities for type 1diabetes, including sensor-augmented insulin regimens, in 52weeks of follow-up: a COMISAIR study. Diabetes Technol Ther.2016;18:532–8.
21. Šoupal J, Petruželková L, Grunberger G, Hásková A, Flekač M,Matoulek M, et al. Glycemic outcomes in adults with T1D areimpacted more by continuous glucose monitoring than by insulindelivery method: 3 years of follow-up from the COMISAIR study.Diabetes Care. 2019;43:37–43
22. Battelino T, Conget I, Olsen B, Schütz-Fuhrmann I, Hommel E,Hoogma R, et al. The use and efficacy of continuous glucose mon-itoring in type 1 diabetes treated with insulin pump therapy: arandomised controlled trial. Diabetologia. 2012;55:3155–62.
23. Juvenile Diabetes Research Foundation Continuous GlucoseMonitoring Study Group, Tamborlane WV, Beck RW, BodeBW, Buckingham B, Chase HP, et al. Continuous glucose moni-toring and intensive treatment of type 1 diabetes. N Engl J Med.2008;359:1464–76.
24. Beck RW, Riddlesworth T, Ruedy K, Ahmann A, Bergenstal R,Haller S, et al. Effect of continuous glucose monitoring on glycemiccontrol in adults with type 1 diabetes using insulin injections: theDIAMOND randomized clinical trial. JAMA. 2017;317:371–8.
25. Lind M, Polonsky W, Hirsch IB, Heise T, Bolinder J, Dahlqvist S,et al. Continuous glucose monitoring vs conventional therapy forglycemic control in adults with type 1 diabetes treated with multipledaily insulin injections: the GOLD randomized clinical trial.JAMA. 2017;317:379–87.
26. Viñals C, Quirós C, Giménez M, Conget I. Real-life managementand effectiveness of insulin pump with or without continuous glu-cose monitoring in adults with type 1 diabetes. Diabetes Ther ResTreat Educ Diabetes Relat Disord. 2019;10:929–36.
27. Dunn TC, Xu Y, Hayter G, Ajjan RA. Real-world flash glucosemonitoring patterns and associations between self-monitoring fre-quency and glycaemic measures: a European analysis of over 60million glucose tests. Diabetes Res Clin Pract. 2018;137:37–46.
28. Oskarsson P, Antuna R, Geelhoed-Duijvestijn P, Krӧger J,Weitgasser R, Bolinder J. Impact of flash glucose monitoring onhypoglycaemia in adults with type 1 diabetes managed with multi-ple daily injection therapy: a pre-specified subgroup analysis of theIMPACT randomised controlled trial. Diabetologia. 2018;61:539–50.
29. Dover AR, Stimson RH, Zammitt NN, Gibb FW. Flash glucosemonitoring improves outcomes in a type 1 diabetes clinic. JDiabetes Sci Technol. 2017;11:442–3.
30. Bolinder J, Antuna R, Geelhoed-Duijvestijn P, Kröger J,Weitgasser R. Novel glucose-sensing technology andhypoglycaemia in type 1 diabetes: a multicentre, non-masked,randomised controlled trial. Lancet Lond Engl. 2016;388:2254–63.
31. Nørgaard K, Scaramuzza A, Bratina N, LalićNM, Jarosz-Chobot P,Kocsis G, et al. Routine sensor-augmented pump therapy in type 1diabetes: the INTERPRET study. Diabetes Technol Ther. 2013;15:273–80.
264 Int J Diabetes Dev Ctries (2021) 41:259–265
32. Scaramuzza AE, Arnaldi C, Cherubini V, Piccinno E, Rabbone I,Toni S, et al. Use of the predictive low glucose management(PLGM) algorithm in Italian adolescents with type 1 diabetes:CareLinkTM data download in a real-world setting. Acta Diabetol.2017;54:317–9.
33. Beato-Víbora PI, Quirós-López C, Lázaro-Martín L, Martín-FríasM, Barrio-Castellanos R, Gil-Poch E, et al. Impact of sensor-augmented pump therapy with predictive low-glucose suspendfunction on glycemic control and patient satisfaction in adults andchildren with type 1 diabetes. Diabetes Technol Ther. 2018;20:738–43.
34. Gómez AM, Henao DC, Imitola A, Muñoz OM, Sepúlveda MAR,Kattah L, et al. Efficacy and safety of sensor-augmented pumptherapy (SAPT) with predictive low-glucose management in pa-tients diagnosed with type 1 diabetes mellitus previously treated
with SAPT and low glucose suspend. Endocrinol Diabetes Nutr.2018;65:451–7.
35. Agrawal P, Zhong A, Welsh JB, Shah R, Kaufman FR.Retrospective analysis of the real-world use of the threshold sus-pend feature of sensor-augmented insulin pumps. DiabetesTechnol Ther. 2015;17:316–9.
36. Zhong A, Choudhary P, McMahon C, Agrawal P, Welsh JB,Cordero TL, et al. Effectiveness of automated insulin managementfeatures of the MiniMed® 640G sensor-augmented insulin pump.Diabetes Technol Ther. 2016;18:657–63.
Publisher’s note Springer Nature remains neutral with regard to jurisdic-tional claims in published maps and institutional affiliations.
Affiliations
Jesús Moreno-Ferández1 & José Alberto García-Seco1&Miriam Herrera-Moraleda2 & Angela María Seco1
&
José Ramón Muñoz-Rodríguez3
José Alberto Garcí[email protected]
Miriam [email protected]
Angela María [email protected]
José Ramón Muñoz-Rodrí[email protected]
1 Endocrinology and Nutrition Department, Ciudad Real General
University Hospital, Obispo Rafael Torija St., 13005 Ciudad
Real, Spain
2 Ciudad Real Medicine School, Castilla-La Mancha University,
Camino de Moledores, 13071 Ciudad Real, Spain
3 Translational Research Unit, Ciudad Real University Hospital,
Obispo Rafael Torija St., 13005 Ciudad Real, Spain
265Int J Diabetes Dev Ctries (2021) 41:259–265
ORIGINAL ARTICLE
The efficacy of once-daily liraglutide as an add-on to oral antidiabeticagents on weight reduction and glycemic control in obese patientswith inadequately controlled type 2 diabetes: a retrospective analysisin relation to liraglutide dose escalation within a 7-monthtreatment period
Abbas Mahdi Rahmah1& Jameelah Kadhim Taher Al-Isawi2 & Osama Abbas Mahdi3
Received: 20 July 2020 /Accepted: 25 September 2020# Research Society for Study of Diabetes in India 2020
AbstractBackground This study aimed to evaluate the efficacy of once-daily liraglutide as an add-on to oral antidiabetics (OADs) onglycemic control and body weight in obese patients with inadequately controlled type 2 diabetes (T2D).Methods A total of 27 obese T2D patients who received 7 months (0.6 mg/day for the first month, 1.2 mg/day for3 months, and 1.8 mg/day for 3 months) of liraglutide treatment as an add-on to OADs were included. Data on bodyweight (kg), fasting plasma glucose (FPG, mg/dL), postprandial glucose (PPG, mg/dL), and HbA1c (%), wererecorded.Results Liraglutide doses of 1.2 mg/day and 1.8 mg/day were associated with significant decreases in body weight(by 8.0% and 11.9%, respectively, p < 0.01 for each) and HbA1c (by 20.0 and 26.5%, respectively, p < 0.01), whileall liraglutide doses yielded significant reductions in FPG (p ranging from < 0.001 to < 0.01) and PPG (p rangingfrom < 0.001 to < 0.01). Glycemic parameters showed a significant reduction from the 1.2 mg/day dose to the1.8 mg/day dose (p < 0.01 for each), whereas no further reduction in body weight was noted.Conclusion Our findings indicate favorable efficacy of liraglutide as an add-on to OADs in weight reduction andimproving glycemic parameters in obese patients with inadequately controlled T2D. Once-daily liraglutide treatmentwas associated with significant weight loss and improved HbA1c levels only at 1.2-mg and 1.8-mg doses, while a1.8-mg dose compared with a 1.2-mg dose seemed to enable a further improvement in glycemic control but not inweight loss.
Keywords Type2 diabetesmellitus .Glycemic control .HbA1c target .Obesity .Bodyweight . Liraglutide .Dose titration . Iraq
Introduction
Despite the availability of a variety of treatment options, aconsiderable proportion of patients with type 2 diabetes(T2D) worldwide have suboptimal glycemic control with fail-ure to achieve glycated hemoglobin (HbA1c) targets [1], andthis is more common in Arabian Gulf countries or the MiddleEast and North Africa (MENA) region [2–4] than in the USAor European countries [1].
In a past study conducted in 2008 with 3395 T2D patientsfrom Iraq, poor glycemic control (HbA1c ≥ 7%) was noted in2571 (75.7%) patients, and most of the patients stated that thecurrent health situation in Iraq (i.e., no drug supply at theprimary health care center or a drug shortage, drug or
* Abbas Mahdi [email protected]
Jameelah Kadhim Taher [email protected]
Osama Abbas [email protected]
1 National Diabetes Center, Mustansiriyah University, Baghdad, Iraq2 Department of Chemistry, College of Education for Pure Science-Ibn
al-Haitham, University of Baghdad, Baghdad, Iraq3 Al-Yarmook Teaching Hospital, Baghdad, Iraq
https://doi.org/10.1007/s13410-020-00878-5
/ Published online: 27 October 2020
International Journal of Diabetes in Developing Countries (2021) 41:266–272
laboratory expenses, or migration after war) was the cause oftheir poor glycemic control [5]. Nonetheless, rates for poorglycemic control remained unchanged in the following yearsin Iraq and were reported to be 83.6% (n = 337, HbA1c:10.1%, duration of diabetes: 8.7 years) in 2013 [6] and 82%(n = 100, HbA1c: 8.4%, duration of diabetes: 8.0 years) in2018 [7]. This seems notable given that consistent with world-wide trends for the prevalence of diabetes mellitus [8], diabe-tes has reached an epidemic status in Iraq over the last decade,with a dramatic (115%) increase from 19.58/1000 in 2000 to42.27/1000 in 2015 [9].
Glucagon-like peptide 1 (GLP-1) is an incretin hormoneresponsible for glucose-dependent stimulation of insulin se-cretion and the inhibition of glucagon secretion, while it alsodelays gastric emptying and induces satiety, leading to de-creased energy intake and weight reduction [10, 11]. In thisregard, GLP-1 analogs with receptor agonist (RA) activityhave emerged as effective antidiabetic treatments; they arerecommended by recent guidelines to be preferred followingmetformin, particularly in adults with T2D and additional CVrisk factors, given their potential to meet the criteria of optimalT2D treatment involving patient-oriented treatment goals (i.e.,reduced risk of weight gain, hypoglycemia and CV complica-tions) beyond glycemic control [12, 13].
Liraglutide is a long-acting GLP-1RA with an effect on bothfasting glucose (via enhanced glucose-dependent insulin secre-tion and reduced glucagon secretion in the fasting state) andpostprandial glucose (via enhanced postprandial insulin secretionand the inhibition of glucagon secretion) [14, 15]. Accordingly,along with its unique therapeutic potential enabling glycemiccontrol with no risk of hypoglycemia and the additional benefitof weight loss, liraglutide is considered a preferable noninsulininjectable agent both in obesity and in T2D [15–17].
Liraglutide was approved by the FDA in January 2010 as aonce-daily injection for patients with uncontrolled T2D de-spite lifestyle changes and metformin monotherapy, while af-ter the demonstration of CV benefits in high-risk patients bythe LEADER trial, it was also approved by the FDA for re-ducing 3-point major adverse cardiac events [14, 18].
This study was designed to evaluate the efficacy of once-daily liraglutide as an add-on to oral antidiabetics (OADs) inescalated doses of 0.6 mg, 1.2 mg, and 1.8 mg through a 7-month treatment period on glycemic control and body weightreduction in obese patients with inadequately controlled T2Din Iraq.
Methods
Study population
A total of 27 obese T2D patients (mean age: 48 years, rangingfrom 32 to 68 years, 51.9% were males) who received 7-
month liraglutide treatment as an add-on to OADs due tofailure to achieve glycemic control and weight reduction onprevious OADs (metformin with or without dipeptidylpeptidase-4 inhibitors (DPP-4i) or glimepiride) were includedin this retrospective study conducted between January 2017and August 2017.
While the present study was exempt from the requirementsof ethical approval because of its retrospective design, thestudy was conducted in full accordance with local GoodClinical Practice guidelines and current legislation, and per-mission was obtained from our institutional ethics committeefor the use of patient data for publication purposes.
Liraglutide treatment
The trial consisted of a 1-month starting dose (0.6 mg/day)period and two consecutive 3-month escalation periods for1.2 mg/day and 1.8 mg/day doses of once-daily subcutaneousliraglutide therapy. Accordingly, the study period included anoverall 7-month liraglutide treatment, with a starting dose of0.6 mg/day to avoid nausea and vomiting for the first 1 month,escalation to 1.2 mg for the next 3 months, and a final escala-tion to the maximum permissible dose of 1.8 mg daily for3 months.
Assessments
Data on patient demographics (age, sex) and the duration ofdiabetes were recorded at baseline. Data on body weight (kg)and glycemic parameters, including fasting plasma glucose(FPG, mg/dL), postprandial glucose (PPG, mg/dL), andHbA1c (%), were recorded at baseline and at three consecu-tive visits conducted at month 1 (after 1 month of the 0.6 mg/day treatment), month 4 (after 3 months of the 1.2 mg/daytreatment), and month 7 (after 3 months of the 1.8 mg/daytreatment) of liraglutide treatment. Changes from baseline inbody weight and glycemic parameters were evaluated for the0.6 mg, 1.2 mg, and 1.8 mg daily doses, while changes inthese parameters from the 1.2-mg dose were also evaluatedduring the 1.8-mg dose treatment period.
Statistical analysis
Statistical analysis was performed using IBM SPSS Statisticsfor Windows, version 23.0 (IBM Corp., Armonk, NY, USA).Changes over time are evaluated by dependent group t test orWilcoxon test depending on the distribution pattern of contin-uous variables. Data were expressed as the “mean (standarddeviation, SD),” minimum-maximum and percent (%) whereappropriate. p < 0.05 was considered statistically significant.
267Int J Diabetes Dev Ctries (2021) 41:266–272
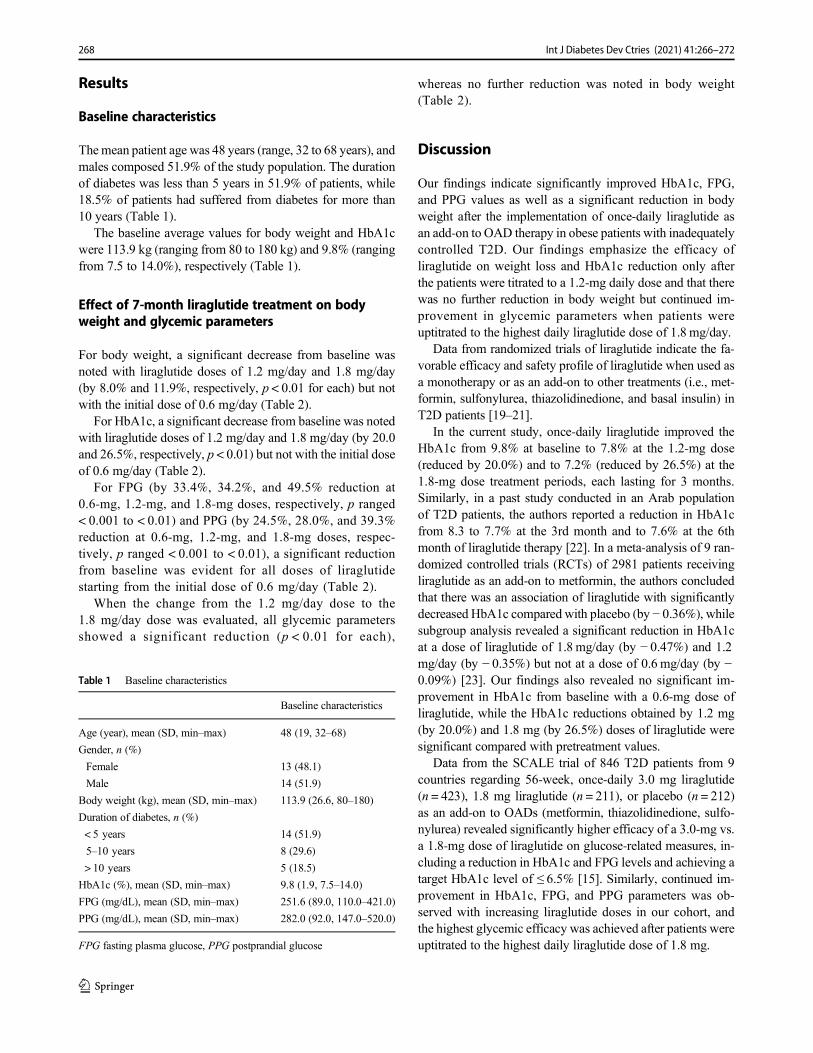
Results
Baseline characteristics
Themean patient age was 48 years (range, 32 to 68 years), andmales composed 51.9% of the study population. The durationof diabetes was less than 5 years in 51.9% of patients, while18.5% of patients had suffered from diabetes for more than10 years (Table 1).
The baseline average values for body weight and HbA1cwere 113.9 kg (ranging from 80 to 180 kg) and 9.8% (rangingfrom 7.5 to 14.0%), respectively (Table 1).
Effect of 7-month liraglutide treatment on bodyweight and glycemic parameters
For body weight, a significant decrease from baseline wasnoted with liraglutide doses of 1.2 mg/day and 1.8 mg/day(by 8.0% and 11.9%, respectively, p < 0.01 for each) but notwith the initial dose of 0.6 mg/day (Table 2).
For HbA1c, a significant decrease from baseline was notedwith liraglutide doses of 1.2 mg/day and 1.8 mg/day (by 20.0and 26.5%, respectively, p < 0.01) but not with the initial doseof 0.6 mg/day (Table 2).
For FPG (by 33.4%, 34.2%, and 49.5% reduction at0.6-mg, 1.2-mg, and 1.8-mg doses, respectively, p ranged< 0.001 to < 0.01) and PPG (by 24.5%, 28.0%, and 39.3%reduction at 0.6-mg, 1.2-mg, and 1.8-mg doses, respec-tively, p ranged < 0.001 to < 0.01), a significant reductionfrom baseline was evident for all doses of liraglutidestarting from the initial dose of 0.6 mg/day (Table 2).
When the change from the 1.2 mg/day dose to the1.8 mg/day dose was evaluated, all glycemic parametersshowed a significant reduction (p < 0.01 for each),
whereas no further reduction was noted in body weight(Table 2).
Discussion
Our findings indicate significantly improved HbA1c, FPG,and PPG values as well as a significant reduction in bodyweight after the implementation of once-daily liraglutide asan add-on to OAD therapy in obese patients with inadequatelycontrolled T2D. Our findings emphasize the efficacy ofliraglutide on weight loss and HbA1c reduction only afterthe patients were titrated to a 1.2-mg daily dose and that therewas no further reduction in body weight but continued im-provement in glycemic parameters when patients wereuptitrated to the highest daily liraglutide dose of 1.8 mg/day.
Data from randomized trials of liraglutide indicate the fa-vorable efficacy and safety profile of liraglutide when used asa monotherapy or as an add-on to other treatments (i.e., met-formin, sulfonylurea, thiazolidinedione, and basal insulin) inT2D patients [19–21].
In the current study, once-daily liraglutide improved theHbA1c from 9.8% at baseline to 7.8% at the 1.2-mg dose(reduced by 20.0%) and to 7.2% (reduced by 26.5%) at the1.8-mg dose treatment periods, each lasting for 3 months.Similarly, in a past study conducted in an Arab populationof T2D patients, the authors reported a reduction in HbA1cfrom 8.3 to 7.7% at the 3rd month and to 7.6% at the 6thmonth of liraglutide therapy [22]. In a meta-analysis of 9 ran-domized controlled trials (RCTs) of 2981 patients receivingliraglutide as an add-on to metformin, the authors concludedthat there was an association of liraglutide with significantlydecreased HbA1c compared with placebo (by − 0.36%), whilesubgroup analysis revealed a significant reduction in HbA1cat a dose of liraglutide of 1.8 mg/day (by − 0.47%) and 1.2mg/day (by − 0.35%) but not at a dose of 0.6 mg/day (by −0.09%) [23]. Our findings also revealed no significant im-provement in HbA1c from baseline with a 0.6-mg dose ofliraglutide, while the HbA1c reductions obtained by 1.2 mg(by 20.0%) and 1.8 mg (by 26.5%) doses of liraglutide weresignificant compared with pretreatment values.
Data from the SCALE trial of 846 T2D patients from 9countries regarding 56-week, once-daily 3.0 mg liraglutide(n = 423), 1.8 mg liraglutide (n = 211), or placebo (n = 212)as an add-on to OADs (metformin, thiazolidinedione, sulfo-nylurea) revealed significantly higher efficacy of a 3.0-mg vs.a 1.8-mg dose of liraglutide on glucose-related measures, in-cluding a reduction in HbA1c and FPG levels and achieving atarget HbA1c level of ≤ 6.5% [15]. Similarly, continued im-provement in HbA1c, FPG, and PPG parameters was ob-served with increasing liraglutide doses in our cohort, andthe highest glycemic efficacy was achieved after patients wereuptitrated to the highest daily liraglutide dose of 1.8 mg.
Table 1 Baseline characteristics
Baseline characteristics
Age (year), mean (SD, min–max) 48 (19, 32–68)
Gender, n (%)
Female 13 (48.1)
Male 14 (51.9)
Body weight (kg), mean (SD, min–max) 113.9 (26.6, 80–180)
Duration of diabetes, n (%)
< 5 years 14 (51.9)
5–10 years 8 (29.6)
> 10 years 5 (18.5)
HbA1c (%), mean (SD, min–max) 9.8 (1.9, 7.5–14.0)
FPG (mg/dL), mean (SD, min–max) 251.6 (89.0, 110.0–421.0)
PPG (mg/dL), mean (SD, min–max) 282.0 (92.0, 147.0–520.0)
FPG fasting plasma glucose, PPG postprandial glucose
268 Int J Diabetes Dev Ctries (2021) 41:266–272
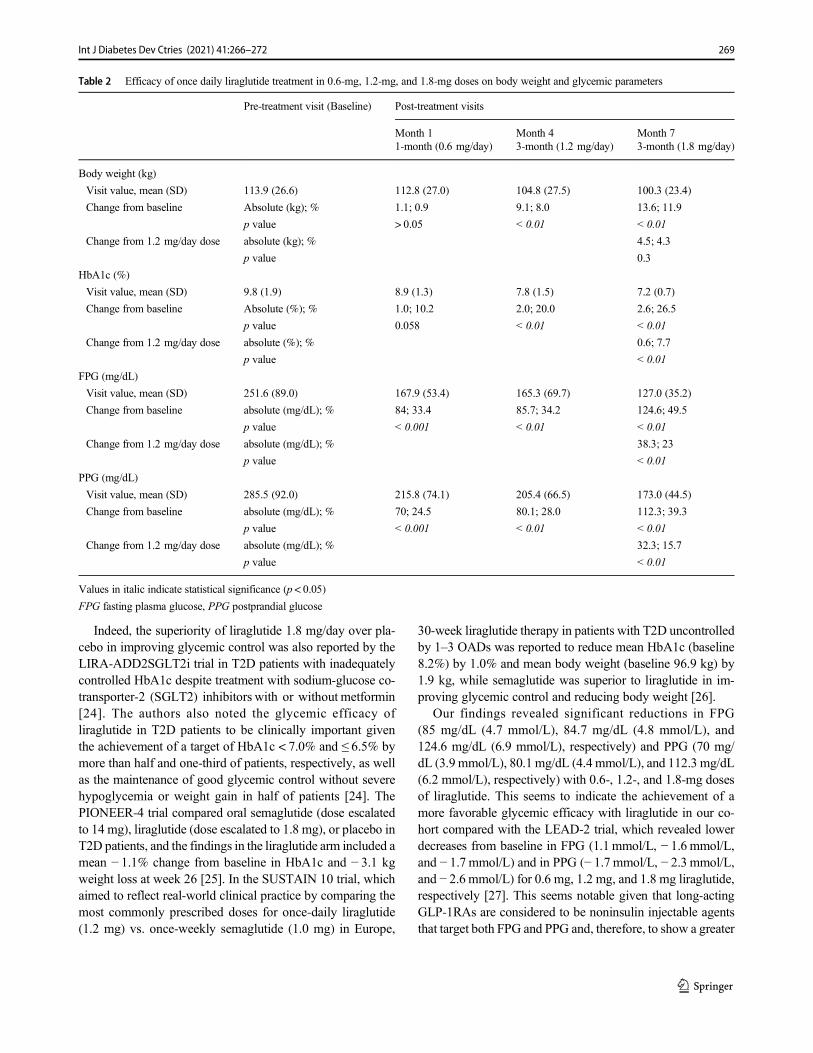
Indeed, the superiority of liraglutide 1.8 mg/day over pla-cebo in improving glycemic control was also reported by theLIRA-ADD2SGLT2i trial in T2D patients with inadequatelycontrolled HbA1c despite treatment with sodium-glucose co-transporter-2 (SGLT2) inhibitors with or without metformin[24]. The authors also noted the glycemic efficacy ofliraglutide in T2D patients to be clinically important giventhe achievement of a target of HbA1c < 7.0% and ≤ 6.5% bymore than half and one-third of patients, respectively, as wellas the maintenance of good glycemic control without severehypoglycemia or weight gain in half of patients [24]. ThePIONEER-4 trial compared oral semaglutide (dose escalatedto 14 mg), liraglutide (dose escalated to 1.8 mg), or placebo inT2D patients, and the findings in the liraglutide arm included amean − 1.1% change from baseline in HbA1c and − 3.1 kgweight loss at week 26 [25]. In the SUSTAIN 10 trial, whichaimed to reflect real-world clinical practice by comparing themost commonly prescribed doses for once-daily liraglutide(1.2 mg) vs. once-weekly semaglutide (1.0 mg) in Europe,
30-week liraglutide therapy in patients with T2D uncontrolledby 1–3 OADs was reported to reduce mean HbA1c (baseline8.2%) by 1.0% and mean body weight (baseline 96.9 kg) by1.9 kg, while semaglutide was superior to liraglutide in im-proving glycemic control and reducing body weight [26].
Our findings revealed significant reductions in FPG(85 mg/dL (4.7 mmol/L), 84.7 mg/dL (4.8 mmol/L), and124.6 mg/dL (6.9 mmol/L), respectively) and PPG (70 mg/dL (3.9 mmol/L), 80.1 mg/dL (4.4 mmol/L), and 112.3 mg/dL(6.2 mmol/L), respectively) with 0.6-, 1.2-, and 1.8-mg dosesof liraglutide. This seems to indicate the achievement of amore favorable glycemic efficacy with liraglutide in our co-hort compared with the LEAD-2 trial, which revealed lowerdecreases from baseline in FPG (1.1 mmol/L, − 1.6 mmol/L,and − 1.7 mmol/L) and in PPG (− 1.7 mmol/L, − 2.3 mmol/L,and − 2.6 mmol/L) for 0.6 mg, 1.2 mg, and 1.8 mg liraglutide,respectively [27]. This seems notable given that long-actingGLP-1RAs are considered to be noninsulin injectable agentsthat target both FPG and PPG and, therefore, to show a greater
Table 2 Efficacy of once daily liraglutide treatment in 0.6-mg, 1.2-mg, and 1.8-mg doses on body weight and glycemic parameters
Pre-treatment visit (Baseline) Post-treatment visits
Month 1 Month 4 Month 71-month (0.6 mg/day) 3-month (1.2 mg/day) 3-month (1.8 mg/day)
Body weight (kg)
Visit value, mean (SD) 113.9 (26.6) 112.8 (27.0) 104.8 (27.5) 100.3 (23.4)
Change from baseline Absolute (kg); % 1.1; 0.9 9.1; 8.0 13.6; 11.9
p value > 0.05 < 0.01 < 0.01
Change from 1.2 mg/day dose absolute (kg); % 4.5; 4.3
p value 0.3
HbA1c (%)
Visit value, mean (SD) 9.8 (1.9) 8.9 (1.3) 7.8 (1.5) 7.2 (0.7)
Change from baseline Absolute (%); % 1.0; 10.2 2.0; 20.0 2.6; 26.5
p value 0.058 < 0.01 < 0.01
Change from 1.2 mg/day dose absolute (%); % 0.6; 7.7
p value < 0.01
FPG (mg/dL)
Visit value, mean (SD) 251.6 (89.0) 167.9 (53.4) 165.3 (69.7) 127.0 (35.2)
Change from baseline absolute (mg/dL); % 84; 33.4 85.7; 34.2 124.6; 49.5
p value < 0.001 < 0.01 < 0.01
Change from 1.2 mg/day dose absolute (mg/dL); % 38.3; 23
p value < 0.01
PPG (mg/dL)
Visit value, mean (SD) 285.5 (92.0) 215.8 (74.1) 205.4 (66.5) 173.0 (44.5)
Change from baseline absolute (mg/dL); % 70; 24.5 80.1; 28.0 112.3; 39.3
p value < 0.001 < 0.01 < 0.01
Change from 1.2 mg/day dose absolute (mg/dL); % 32.3; 15.7
p value < 0.01
Values in italic indicate statistical significance (p < 0.05)
FPG fasting plasma glucose, PPG postprandial glucose
269Int J Diabetes Dev Ctries (2021) 41:266–272
HbA1c reduction with no risk of hypoglycemia and the addi-tional benefit of weight loss [12, 13, 16, 17].
In a model-based meta-analysis of 76 publications on theglycemic efficacy of 90-day DPP-4i, GLP-1RA, and SGLT2ias add-on treatments to metformin monotherapy in T2D pa-tients, long-acting GLP-1RAs including liraglutide (FPG re-duction by − 22.1% and HbA1c reduction by − 16.3%) wereconcluded to provide better glycemic control [28]. In fact,given that liraglutide was used as an add-on to either metfor-min alone or metformin plus insulin secretagogues (i.e., DPP-4 inhibitors and sulfonylureas) in our cohort, it should also benoted that higher efficacy of liraglutide has been suggestedwhen used as an add-on to metformin alone than when usedas an add-on to insulin secretagogues, particularly in reducingcardiovascular risk in T2D patients [29].
Data from the meta-analysis of 9 RCTs with 2981 patientsreceiving liraglutide as an add-on to metformin revealed thatliraglutide lowered body weight more than the placebo (by −2.13 kg), while subgroup analysis revealed significantly re-duced body weight at all three dosages, including 1.8 mg/day (by − 2.07 kg), 1.2 mg/day (by − 2.21 kg), and 0.6 mg/day (by − 1.90 kg) [23]. Data from a meta-analysis of 5 RCTsinvolving 1440 T2D patients revealed significantly lowerHbA1c with 1.2 mg (by 0.31%) and 1.8 mg (by 0.38%)liraglutide than with sitagliptin as an add-on to metformin,while only the 1.8 mg liraglutide group had significant bodyweight loss (by − 1.12%) [30]. Data from the SCALE trial of846 T2D patients from 9 countries comparing 56-week, once-daily 3.0 mg liraglutide (n = 423), 1.8 mg liraglutide (n = 211)and placebo (n = 212) as an add-on therapy to 0–3 OADs(metformin, thiazolidinedione, sulfonylurea) revealed signifi-cantly higher weight loss with 3.0 mg liraglutide (6.0%,6.4 kg) than with 1.8 mg liraglutide (4.7%, 5.0 kg) or placebo(2.0%, 2.2 kg) [15].
In the current study, only 1.2 mg (by − 9.1 kg, 8%) and1.8 mg (by − 13.6 kg, 11.9%) doses of liraglutide were asso-ciated with significant weight loss when compared with base-line, and no further reduction in body weight was noted whenthe dose was titrated from 1.2 to 1.8 mg. Past studies indicatedan association of a 1.8-mg dose of liraglutide with a 4–6-kgreduction in body weight and a greater proportion of patientsachieving a 5–10% loss of weight with liraglutide than withplacebo [31], while liraglutide versus placebo was also report-ed to reduce body weight by 4.8 kg, 5.5 kg, 6.3 kg, and 7.2 kgfor doses of 1.2 mg, 1.8 mg, 2.8 mg, and 3 mg, respectively[32]. A similar trend of liraglutide-dependent weight loss frombaseline to the 3rd month and 6th month of therapy was alsoreported in a past study in an Arabic T2D population (from96.0 to 94.8 kg and to 94.5 kg, respectively) [22].
The amount of weight loss obtained via 1.2-mg and 1.8-mgdoses of once-daily liraglutide in our obese T2D patientsseems much higher than those reported by other studies inT2D patients. This may be attributed to the fact that the T2D
patients enrolled in the current study were highly motivated tolose weight and keen to adhere to lifestyle interventions, andtheir socioeconomic status was favorable enough to affordout-of-pocket expenses.
In fact, poor glycemic control in younger age groups ofdiabetes patients has been considered to be associated withlower adherence to a diabetes care plan and lifestyle changesdue to the active occupational and social life in this age group[33, 34]. In this regard, given the relatively young age of ourpatients, with at least half of them having suffering from dia-betes only for less than 5 years, the efficacy of liraglutide inour study population also seems to indicate the likelihood ofobesity rather than early-stage diabetes (with no as-yet appar-ent diabetes-related complications) to be considered a majorcomplaint by patients, leading to the adoption of a better self-care practice towards improved adherence to lifestyle inter-ventions. Another important factor to be considered is theachievement of favorable outcomes in our T2D patients de-spite challenging circumstances due to vast destruction of theIraqi health system infrastructure after the 2003War, resultingin the restrictions in the provision of essential care [35] andpoor practice of daily diabetes self-management protocolswith strong adverse impact of stressful life factors (i.e., a lackof clean water and electricity and political instability) and theunavailability of educational programs in Iraq [36, 37].
In addition, it should be noted that higher doses ofliraglutide (3.0 mg vs. 1.8 mg) were reported to be associatedwith better scores of weight-related quality of life along with asignificant improvement in participants’ physical function,while improvements in quality of life and treatment satisfac-tion are suggested to reinforce desired behavior via betteradherence to treatment and lifestyle interventions [15].Moreover, for the same degree of weight loss, liraglutide treat-ment was also reported to be associated with a greater im-provement in β-cell function and more remarkable reductionin visceral fat than a standardized lifestyle intervention proto-col in T2D patients [38, 39].
Certain limitations to this study should be considered. First,due to the retrospective single-center design of the presentstudy, establishing causality between the drug and the ob-served effects is not possible. Second, the lack of data oncertain patient-reported outcome measures related to qualityof life or treatment satisfaction is another limitation, whichwould otherwise extend the knowledge achieved in the currentstudy.
In conclusion, our findings indicate favorable efficacy ofliraglutide as an add-on to metformin-based OADs in weightreduction and improved glycemic parameters, includingHbA1c, FPG, and PPG, in obese patients with inadequatelycontrolled T2D. Once-daily liraglutide treatment was associ-ated with significant weight loss and improved HbA1c levelsonly at 1.2-mg and 1.8-mg doses, while a 1.8-mg dose com-pared with a 1.2-mg dose seems to enable a further
270 Int J Diabetes Dev Ctries (2021) 41:266–272
improvement in glycemic control but not in weight loss.Accordingly, our findings support the utility of once-dailyliraglutide as an add-on to OADs as an effective option topromote weight loss along with glycemic control in obeseT2D patients and emphasize the likelihood of higher dosesto enable better glycemic control with similar weight loss.
Funding Medical writing and editorial assistance were provided byKAPPATraining Consulting&Research Ltd. and funded by a grant fromNovo Nordisk Scientific Bureau for Medicines’ Promotions. The authorstake full responsibility for the content and conclusions stated in this man-uscript. Novo Nordisk neither influenced the content of this publicationnor was it involved in the study design, data collection, analysis, orinterpretation.
Compliance with ethical standards
Conflict of interest The authors declare that they have no competinginterests.
Ethics approval While the present study was exempt from the require-ments of ethical approval because of its retrospective design, the studywas conducted in full accordance with local Good Clinical Practice guide-lines and current legislation, and permission was obtained from our insti-tutional ethics committee for the use of patient data for publicationpurposes.
Consent to participate This is a retrospective study.
Consent for publication Permission was obtained from our institutionalethics committee for the use of patient data for publication purposes.
References
1. Mauricio D,Meneghini L, Seufert J, Liao L,WangH, Tong L, et al.Glycaemic control and hypoglycaemia burden in patients with type2 diabetes initiating basal insulin in Europe and the USA. DiabetesObes Metab. 2017;19:1155–64.
2. Al-Rasheedi AA. Glycemic control among patients with type 2diabetes mellitus in countries of Arabic Gulf. Int J Health Sci(Qassim). 2015;9:345–50.
3. Alramadan MJ, Magliano DJ, Almigbal TH, Batais MA, Afroz A,Alramadhan HJ, et al. Glycaemic control for people with type 2diabetes in Saudi Arabia—an urgent need for a review of manage-ment plan. BMC Endocr Disord. 2018;18:62.
4. Esteghamati A, Larijani B, Aghajani MH, Ghaemi F, Kermanchi J,Shahrami A, et al. Diabetes in Iran: prospective analysis from firstNationwide diabetes report of National Program for Prevention andControl of Diabetes (NPPCD-2016). Sci Rep. 2017;7:13461.
5. Mansour AA. Patients' opinion on the barriers to diabetes control inareas of conflicts: the Iraqi example. Confl Health. 2008;2:7.
6. Al-Timimi DJ, Ali AF. Serum 25(OH) D in diabetes mellitus type2: relation to glycaemic control. J Clin Diagn Res. 2013;7:2686–8.
7. Saeed H, Haj S, Qasim B. Estimation of magnesium level in type 2diabetes mellitus and its correlation with HbA1c level. EndocrinolDiabetes Metab. 2018;2:e00048.
8. International Diabetes Federation. IDF Diabetes Atlas. 9th ed.Brussels: International Diabetes Federation; 2019. https://www.diabetesatlas.org/en/
9. Mansour AA, Al DF. Diabetes in Iraq: facing the epidemic. Asystematic review. Wulfenia. 2015;22:258–78.
10. Nauck MA, Meier JJ. The incretin effect in healthy individuals andthose with type 2 diabetes: physiology, pathophysiology, and re-sponse to therapeutic interventions. Lancet Diabetes Endocrinol.2016;4:525–36.
11. Drucker DJ, Nauck MA. The incretin system: glucagon-like pep-tide-1 receptor agonists and dipeptidyl peptidase-4 inhibitors intype 2 diabetes. Lancet. 2006;368:1696–705.
12. American Diabetes Association. 9. Pharmacologic approaches toglycemic treatment: standards of medical care in Diabetes - 2019.Diabetes Care. 2019;42(Suppl. 1):S90–102.
13. Davies MJ, D’Alessio DA, Fradkin J, Kernan WN, Mathieu C,Mingrone G, et al. Management of hyperglycaemia in type 2 dia-betes, 2018. A consensus report by the American DiabetesAssociation (ADA) and the European Association for the Studyof Diabetes (EASD). Diabetologia. 2018;61:2461–98.
14. Victoza [package insert]. Plainsboro, NJ: Novo Nordisk Inc; 2017.15. Davies MJ, Bergenstal R, Bode B, Kushner RF, Lewin A, Skjøth
TV, et al. NN8022-1922 study group. Efficacy of liraglutide forweight loss among patients with type 2 diabetes: the SCALE dia-betes randomized clinical trial. JAMA. 2015;314:687–99.
16. Howell R, Wright AM, Clements JN. Clinical potential ofliraglutide in cardiovascular risk reduction in patients with type 2diabetes: evidence to date. Diabetes Metab Syndr Obes. 2019;12:505–12.
17. Garber AJ. Long-acting glucagon-like peptide 1 receptor agonists: areview of their efficacy and tolerability. Diabetes Care.2011;34(Suppl. 2):S279–84.
18. Marso SP, Daniels GH, Brown-Frandsen K, Kristensen P, MannJF, Nauck MA, et al. LEADER steering committee; LEADER trialinvestigators. Liraglutide and cardiovascular outcomes in type 2diabetes. N Engl J Med. 2016;375:311–22.
19. Zinman B, Gerich J, Buse JB, Lewin A, Schwartz S, Raskin P, et al.LEAD-4 study investigators. Efficacy and safety of the humanglucagon-like peptide-1 analog liraglutide in combination with met-formin and thiazolidinedione in patients with type 2 diabetes(LEAD-4 Met+TZD). Diabetes Care. 2009;32:1224–30.
20. Russell-Jones D, Vaag A, Schmitz O, Sethi BK, Lalic N, Antic S,et al. Liraglutide Effect and Action in Diabetes 5 (LEAD-5) met+SU Study Group. Liraglutide vs insulin glargine and placebo incombination with metformin and sulfonylurea therapy in type 2diabetes mellitus (LEAD-5met+SU): a randomized controlled trial.Diabetologia. 2009;52:2046–55.
21. Buse JB, Rosenstock J, Sesti G, Schmidt WE, Montanya E, BrettJH, et al. LEAD-6 Study Group. Liraglutide once a day versusexenatide twice a day for type 2 diabetes: a 26-week randomised,parallel-group, multinational, open-label trial (LEAD-6). Lancet.2009;374:39–47.
22. Bashier AMK, Bin Hussain AAK, Abdelgadir EIE, Eltinay AT,Thadani P, Abdalla ME, et al. Liraglutide effect in reducingHbA1c and weight in Arab population with type2 diabetes, a pro-spective observational trial. J Diabetes Metab Disord. 2015;14:48.
23. Gu J, Meng X, Guo Y,Wang L, Zheng H, Liu Y, et al. The efficacyand safety of liraglutide added to metformin in patients with diabe-tes: a meta-analysis of randomized controlled trials. Sci Rep.2016;6:32714.
24. Blonde L, Belousova L, Fainberg U, Garcia-Hernandez PA, JainSM, Kaltoft MS, et al. Liraglutide as ADD-on to sodium-glucoseco-transporter-2 inhibitors in patients with inadequately controlledtype 2 diabetes: LIRA-ADD2SGLT2i, a 26-week, randomized,double-blind, Placebo-Controlled Trial. Diabetes Obes Metab.2020;22:929–37.
25. Pratley R, Amod A, Hoff ST, Kadowaki T, Lingvay I, NauckM. Etal; PIONEER 4 investigators. Oral semaglutide versus
271Int J Diabetes Dev Ctries (2021) 41:266–272
subcutaneous liraglutide and placebo in type 2 diabetes (PIONEER4): a randomised, double-blind, phase 3a trial. Lancet. 2019;394:39–50.
26. Capehorn MS, Catarig AM, Furberg JK, Janez A, Price HC,Tadayon S, et al. Efficacy and safety of once-weekly semaglutide1.0mg vs once-daily Liraglutide 1.2mg as add-on to 1-3 Oral anti-diabetic drugs in subjects with type 2 diabetes (SUSTAIN 10).Diabetes Metab. 2020;46:100–9.
27. Nauck M, Frid A, Hermansen K, Shah NS, Tankova T, Mitha IH,et al. LEAD-2 Study Group. Efficacy and safety comparison ofliraglutide, glimepiride, and placebo, all in combination with met-formin, in type 2 diabetes: the LEAD (liraglutide effect and actionin diabetes)-2 study. Diabetes Care. 2009;32:84–90.
28. Inoue H, Tamaki Y, Kashihara Y, Muraki S, Kakara M, Hirota T,et al. Efficacy of DPP-4 inhibitors, GLP-1 analogues, and SGLT2inhibitors as add-ons to metformin monotherapy in T2DM patients:a model-based meta-analysis. Br J Clin Pharmacol. 2019;85:393–402.
29. Ciresi A, Vigneri E, Radellini S, Pantò F, Giordano C. Liraglutideimproves cardiovascular risk as an add-on to metformin and not toinsulin secretagogues in type 2 diabetic patients: a real-life 48-month retrospective study. Diabetes Ther. 2018;9:363–71.
30. Li M, Yang Y, Jiang D, Ying M, Wang Y, Zhao R. Efficacy andsafety of liraglutide versus sitagliptin both in combination withmetformin in patients with type 2 diabetes: a systematic reviewand meta-analysis. Medicine (Baltimore). 2017;96:e8161.
31. Mehta A, Marso SP, Neeland IJ. Liraglutide for weight manage-ment: a critical review of the evidence. Obes Sci Pract. 2017;3:3–14.
32. Jelsing J, Vrang N, Hansen G, Raun K, Tang-Christensen M,Knudsen LB. Liraglutide: short-lived effect on gastric
emptying—long lasting effects on body weight. Diabetes ObesMetab. 2012;14:531–8.
33. Alramadan MJ, Afroz A, Hussain SM, Batais MA, Almigbal TH,Al-Humrani HA, et al. Patient-related determinants of glycaemiccontrol in people with type 2 diabetes in the Gulf cooperation coun-cil countries: a systematic review. J Diabet Res. 2018;2018:9389265.
34. Sanal TS, Nair NS, Adhikari P. Factors associated with poorcontrol of type 2 diabetes mellitus: a systematic review andmeta-analysis. J Diabetol. 2011;3:1–10.
35. Hussain AM, Lafta RK. Burden of non-communicable diseases inIraq after the 2003 war. Saudi Med J. 2019;40:72–8.
36. Mikhael EM, Hassali MA, Hussain SA, Shawky N. Self-management knowledge and practice of type 2 diabetes mellituspatients in Baghdad, Iraq: a qualitative study. Diabetes MetabSyndr Obes. 2018;12:1–17.
37. Alzubaidi H, Mc Namara K, Browning C, Marriott J. Barriers andenablers to healthcare access and use among Arabic-speaking andCaucasian English-speaking patients with type 2 diabetes mellitus:a qualitative comparative study. BMJ Open. 2015;5:e008687.
38. Færch K, Johansen NB, WitteDR LT, Jørgensen ME, Vistisen D.Relationship between insulin resistance and b-cell dysfunction insubphenotypes of prediabetes and type 2 diabetes. J ClinEndocrinol Metab. 2015;100:707–16.
39. Santilli F, Simeone PG, GuagnanoMT, LeoM,Maccarone MT, DiCastelnuovo A, et al. Effects of liraglutide on weight loss, fat dis-tribution, and β-cell function in obese subjects with Prediabetes orearly type 2 diabetes. Diabetes Care. 2017;40:1556–64.
Publisher’s note Springer Nature remains neutral with regard to jurisdic-tional claims in published maps and institutional affiliations.
272 Int J Diabetes Dev Ctries (2021) 41:266–272
ORIGINAL ARTICLE
Glycemic control rate of type 2 diabetes mellitus in Chinese adults:a multi-centered, retrospective, cross-sectional study
Li Yan1& Yan Liu2
& Jie Li2 & Hua Zhou2& Hongshan Ma3
Received: 16 January 2020 /Accepted: 16 October 2020# Research Society for Study of Diabetes in India 2020
AbstractObjectives This study aims to clarify the current status of glycemic control in type 2 diabetes mellitus (T2DM) patients in China.Methods This study was a multi-centered, retrospective, cross-sectional study based on electronic medical records. Individualswith T2DM who were admitted to a hospital between January 1, 2018, and December 31, 2018, and had either a fasting bloodglucose or HbA1c tests results were included to assess the glycemic control. T2DM patients with fasting blood glucose < 7.0mmol/L or/and HbA1c < 7.0% were defined as having adequate glycemic control.Results A total of 19,926 patients from 44 hospitals were included in this study. Among them, male patients were 9796 (49.2%).The mean age of T2DM patients was 62.0 ± 12.9 years and the mean duration of diabetes was 3.0 ± 3.0 years. Totally, 30.7%T2DM patients achieved the adequate glycemic control with fasting blood glucose < 7.0 mmol/L, 44.3% with HbA1c < 7.0%,and 23.0% with both fasting blood glucose < 7.0 mmol/L and HbA1c < 7.0%. T2DM patients with longer duration, admitting tosecondary hospitals, and living in the southern and undeveloped regions had lower glycemic control rate.Conclusions In China, only 23.0% of T2DMpatients achieved adequate glycemic control target (both fasting blood glucose < 7.0mmol/L and HbA1c < 7.0%). Glycemic control should be strengthened for T2DM patients with longer duration, admitting tosecondary hospitals, and living in the southern and undeveloped regions.
Keywords Type 2 diabetes . Glycemic control rate . Fasting blood glucose, HbA1c
Background
The prevalence of type 2 diabetes mellitus (T2DM) in Chinahas dramatically increased from 0.67% [1] in 1980 to 11.6%[2] in 2010 with the aging and lifestyle changes. At present,the number of T2DM patients in China has exceeded 110million [2]. T2DM-related complications including retinopa-thy, kidney disease, and neuropathy are the significant causesof increased disability and mortality in T2DM patients. At
present, T2DM has become the public health problem inChina [3, 4].
The main purpose for T2DM treatment is to achieve adequateglycemic control, thereby delaying or reducing the occurrence ofcomplications. Poor glycemic control can cause a variety of acuteand chronic complications [5], seriously affecting the quality oflife of T2DM patients and bringing heavy psychological andeconomic burden for them. A number of studies have demon-strated that glycemic control is critical to reduce the risk of car-diovascular diseases [6, 7]. Investigating the status of glycemiccontrol will provide an important basis for the T2DM preventionand control strategies in China.
The Chinese Diabetes Society (CDS) recommends < 7.0mmol/L for fasting blood glucose control and < 7% forHbA1c for T2DM patients. On July 15, 2019, China issuedthe “Healthy China Action (2019-2030)” which sets continu-ous improvement in glycemic control rate in T2DM patientsas one of its strategic goals [8]. A large-scale study investigat-ed the prevalence and control of diabetes in 98,658 Chineseadult populations in 2010, demonstrating that the adequateglycemic control could be achieved in 39.7% of treated
* Hongshan [email protected]
1 Department of Ophthalmology, The Third People’s Hospital ofDatong, Datong 037008, China
2 Department of Endocrinology, The Third People’s Hospital ofDatong, Datong 037008, China
3 Department of Cardiology, The Third People’s Hospital of Datong,No. 1 Wenchang Street, Datong City 037008, Shanxi Province,China
https://doi.org/10.1007/s13410-020-00886-5
/ Published online: 18 November 2020
International Journal of Diabetes in Developing Countries (2021) 41:273–279
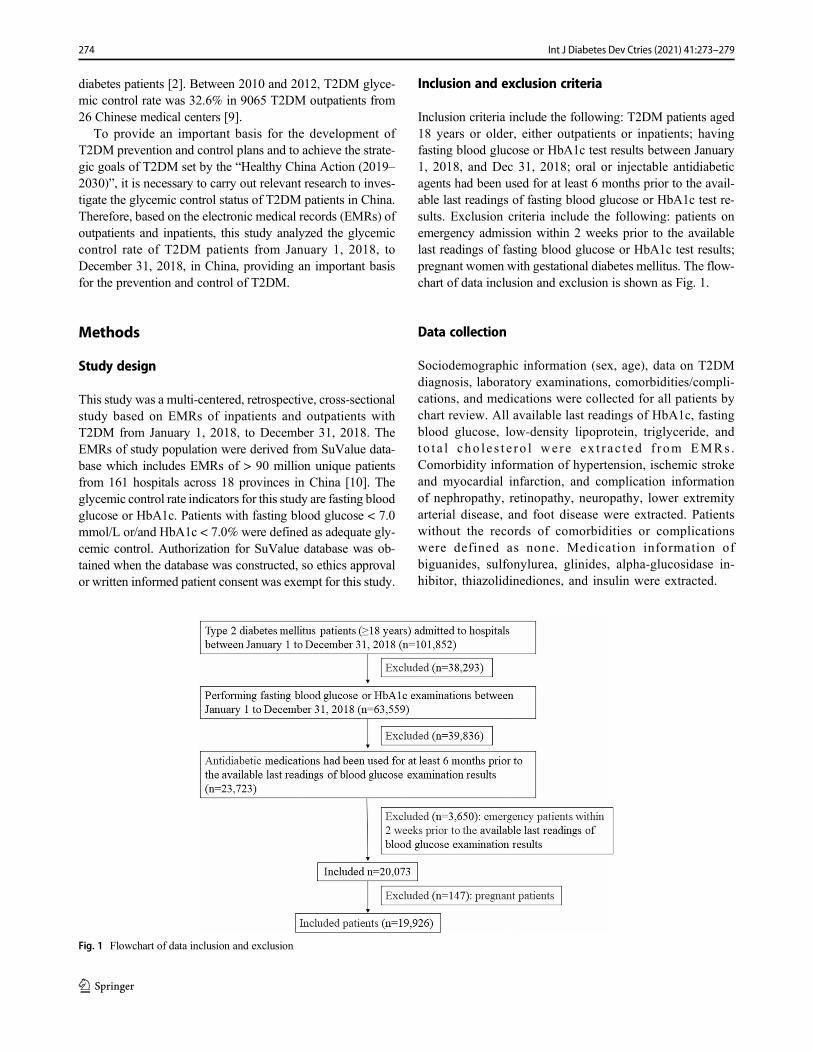
diabetes patients [2]. Between 2010 and 2012, T2DM glyce-mic control rate was 32.6% in 9065 T2DM outpatients from26 Chinese medical centers [9].
To provide an important basis for the development ofT2DM prevention and control plans and to achieve the strate-gic goals of T2DM set by the “Healthy China Action (2019–2030)”, it is necessary to carry out relevant research to inves-tigate the glycemic control status of T2DM patients in China.Therefore, based on the electronic medical records (EMRs) ofoutpatients and inpatients, this study analyzed the glycemiccontrol rate of T2DM patients from January 1, 2018, toDecember 31, 2018, in China, providing an important basisfor the prevention and control of T2DM.
Methods
Study design
This study was a multi-centered, retrospective, cross-sectionalstudy based on EMRs of inpatients and outpatients withT2DM from January 1, 2018, to December 31, 2018. TheEMRs of study population were derived from SuValue data-base which includes EMRs of > 90 million unique patientsfrom 161 hospitals across 18 provinces in China [10]. Theglycemic control rate indicators for this study are fasting bloodglucose or HbA1c. Patients with fasting blood glucose < 7.0mmol/L or/and HbA1c < 7.0% were defined as adequate gly-cemic control. Authorization for SuValue database was ob-tained when the database was constructed, so ethics approvalor written informed patient consent was exempt for this study.
Inclusion and exclusion criteria
Inclusion criteria include the following: T2DM patients aged18 years or older, either outpatients or inpatients; havingfasting blood glucose or HbA1c test results between January1, 2018, and Dec 31, 2018; oral or injectable antidiabeticagents had been used for at least 6 months prior to the avail-able last readings of fasting blood glucose or HbA1c test re-sults. Exclusion criteria include the following: patients onemergency admission within 2 weeks prior to the availablelast readings of fasting blood glucose or HbA1c test results;pregnant women with gestational diabetes mellitus. The flow-chart of data inclusion and exclusion is shown as Fig. 1.
Data collection
Sociodemographic information (sex, age), data on T2DMdiagnosis, laboratory examinations, comorbidities/compli-cations, and medications were collected for all patients bychart review. All available last readings of HbA1c, fastingblood glucose, low-density lipoprotein, triglyceride, andto t a l cho l e s t e r o l we r e ex t r a c t ed f r om EMRs .Comorbidity information of hypertension, ischemic strokeand myocardial infarction, and complication informationof nephropathy, retinopathy, neuropathy, lower extremityarterial disease, and foot disease were extracted. Patientswithout the records of comorbidities or complicationswere defined as none. Medication information ofbiguanides, sulfonylurea, glinides, alpha-glucosidase in-hibitor, thiazolidinediones, and insulin were extracted.
Fig. 1 Flowchart of data inclusion and exclusion
274 Int J Diabetes Dev Ctries (2021) 41:273–279
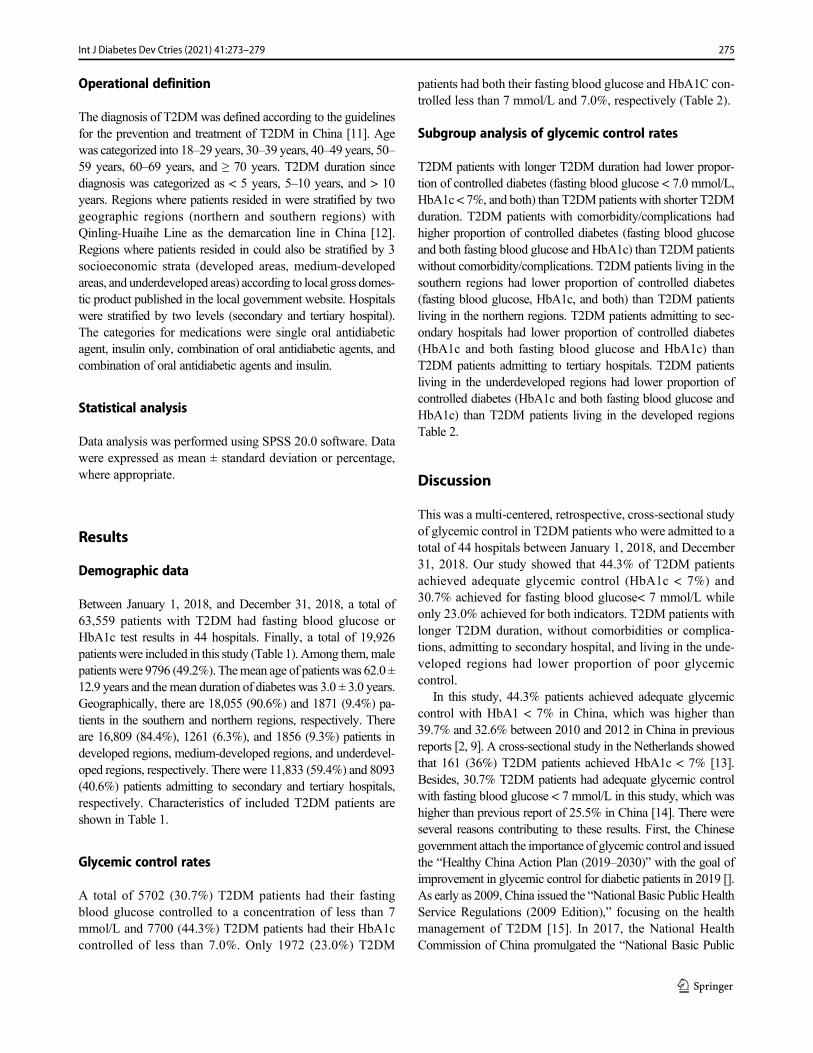
Operational definition
The diagnosis of T2DMwas defined according to the guidelinesfor the prevention and treatment of T2DM in China [11]. Agewas categorized into 18–29 years, 30–39 years, 40–49 years, 50–59 years, 60–69 years, and ≥ 70 years. T2DM duration sincediagnosis was categorized as < 5 years, 5–10 years, and > 10years. Regions where patients resided in were stratified by twogeographic regions (northern and southern regions) withQinling-Huaihe Line as the demarcation line in China [12].Regions where patients resided in could also be stratified by 3socioeconomic strata (developed areas, medium-developedareas, and underdeveloped areas) according to local gross domes-tic product published in the local government website. Hospitalswere stratified by two levels (secondary and tertiary hospital).The categories for medications were single oral antidiabeticagent, insulin only, combination of oral antidiabetic agents, andcombination of oral antidiabetic agents and insulin.
Statistical analysis
Data analysis was performed using SPSS 20.0 software. Datawere expressed as mean ± standard deviation or percentage,where appropriate.
Results
Demographic data
Between January 1, 2018, and December 31, 2018, a total of63,559 patients with T2DM had fasting blood glucose orHbA1c test results in 44 hospitals. Finally, a total of 19,926patientswere included in this study (Table 1). Among them,malepatients were 9796 (49.2%). Themean age of patients was 62.0 ±12.9 years and the mean duration of diabetes was 3.0 ± 3.0 years.Geographically, there are 18,055 (90.6%) and 1871 (9.4%) pa-tients in the southern and northern regions, respectively. Thereare 16,809 (84.4%), 1261 (6.3%), and 1856 (9.3%) patients indeveloped regions, medium-developed regions, and underdevel-oped regions, respectively. There were 11,833 (59.4%) and 8093(40.6%) patients admitting to secondary and tertiary hospitals,respectively. Characteristics of included T2DM patients areshown in Table 1.
Glycemic control rates
A total of 5702 (30.7%) T2DM patients had their fastingblood glucose controlled to a concentration of less than 7mmol/L and 7700 (44.3%) T2DM patients had their HbA1ccontrolled of less than 7.0%. Only 1972 (23.0%) T2DM
patients had both their fasting blood glucose and HbA1C con-trolled less than 7 mmol/L and 7.0%, respectively (Table 2).
Subgroup analysis of glycemic control rates
T2DM patients with longer T2DM duration had lower propor-tion of controlled diabetes (fasting blood glucose < 7.0 mmol/L,HbA1c < 7%, and both) than T2DMpatients with shorter T2DMduration. T2DM patients with comorbidity/complications hadhigher proportion of controlled diabetes (fasting blood glucoseand both fasting blood glucose and HbA1c) than T2DM patientswithout comorbidity/complications. T2DM patients living in thesouthern regions had lower proportion of controlled diabetes(fasting blood glucose, HbA1c, and both) than T2DM patientsliving in the northern regions. T2DM patients admitting to sec-ondary hospitals had lower proportion of controlled diabetes(HbA1c and both fasting blood glucose and HbA1c) thanT2DM patients admitting to tertiary hospitals. T2DM patientsliving in the underdeveloped regions had lower proportion ofcontrolled diabetes (HbA1c and both fasting blood glucose andHbA1c) than T2DM patients living in the developed regionsTable 2.
Discussion
This was a multi-centered, retrospective, cross-sectional studyof glycemic control in T2DM patients who were admitted to atotal of 44 hospitals between January 1, 2018, and December31, 2018. Our study showed that 44.3% of T2DM patientsachieved adequate glycemic control (HbA1c < 7%) and30.7% achieved for fasting blood glucose< 7 mmol/L whileonly 23.0% achieved for both indicators. T2DM patients withlonger T2DM duration, without comorbidities or complica-tions, admitting to secondary hospital, and living in the unde-veloped regions had lower proportion of poor glycemiccontrol.
In this study, 44.3% patients achieved adequate glycemiccontrol with HbA1 < 7% in China, which was higher than39.7% and 32.6% between 2010 and 2012 in China in previousreports [2, 9]. A cross-sectional study in the Netherlands showedthat 161 (36%) T2DM patients achieved HbA1c < 7% [13].Besides, 30.7% T2DM patients had adequate glycemic controlwith fasting blood glucose < 7 mmol/L in this study, which washigher than previous report of 25.5% in China [14]. There wereseveral reasons contributing to these results. First, the Chinesegovernment attach the importance of glycemic control and issuedthe “Healthy China Action Plan (2019–2030)” with the goal ofimprovement in glycemic control for diabetic patients in 2019 [].As early as 2009, China issued the “National Basic Public HealthService Regulations (2009 Edition),” focusing on the healthmanagement of T2DM [15]. In 2017, the National HealthCommission of China promulgated the “National Basic Public
275Int J Diabetes Dev Ctries (2021) 41:273–279
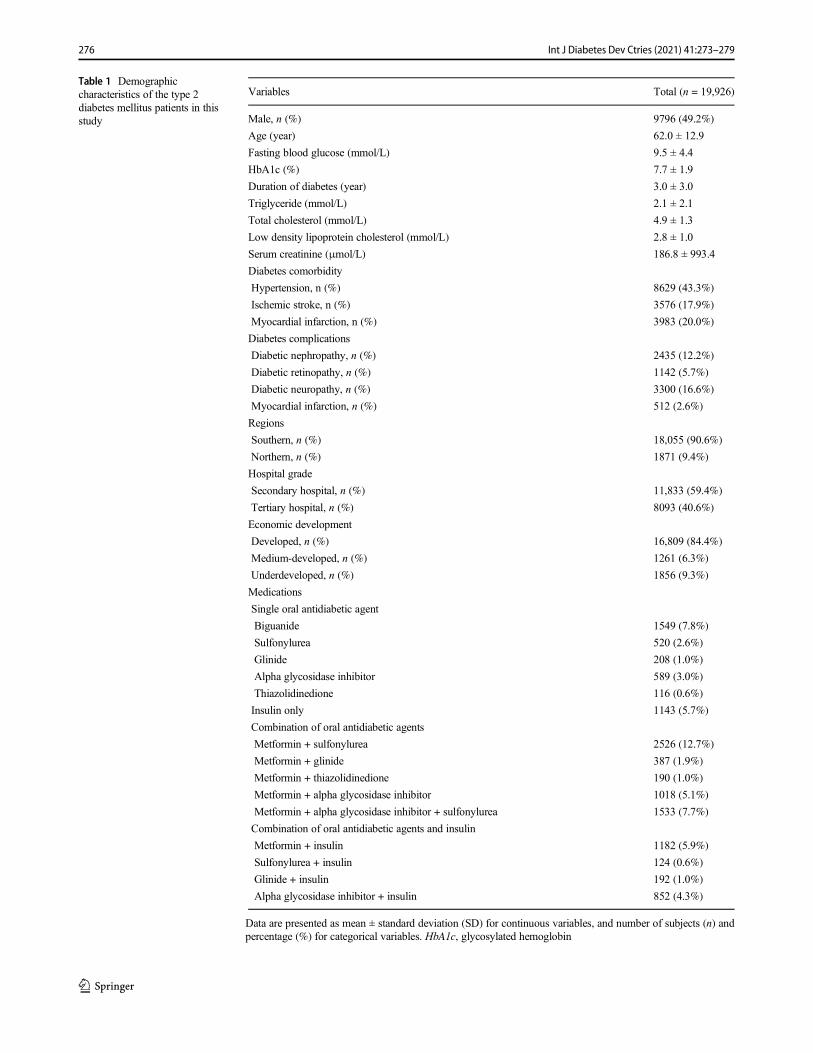
Table 1 Demographiccharacteristics of the type 2diabetes mellitus patients in thisstudy
Variables Total (n = 19,926)
Male, n (%) 9796 (49.2%)
Age (year) 62.0 ± 12.9
Fasting blood glucose (mmol/L) 9.5 ± 4.4
HbA1c (%) 7.7 ± 1.9
Duration of diabetes (year) 3.0 ± 3.0
Triglyceride (mmol/L) 2.1 ± 2.1
Total cholesterol (mmol/L) 4.9 ± 1.3
Low density lipoprotein cholesterol (mmol/L) 2.8 ± 1.0
Serum creatinine (μmol/L) 186.8 ± 993.4
Diabetes comorbidity
Hypertension, n (%) 8629 (43.3%)
Ischemic stroke, n (%) 3576 (17.9%)
Myocardial infarction, n (%) 3983 (20.0%)
Diabetes complications
Diabetic nephropathy, n (%) 2435 (12.2%)
Diabetic retinopathy, n (%) 1142 (5.7%)
Diabetic neuropathy, n (%) 3300 (16.6%)
Myocardial infarction, n (%) 512 (2.6%)
Regions
Southern, n (%) 18,055 (90.6%)
Northern, n (%) 1871 (9.4%)
Hospital grade
Secondary hospital, n (%) 11,833 (59.4%)
Tertiary hospital, n (%) 8093 (40.6%)
Economic development
Developed, n (%) 16,809 (84.4%)
Medium-developed, n (%) 1261 (6.3%)
Underdeveloped, n (%) 1856 (9.3%)
Medications
Single oral antidiabetic agent
Biguanide 1549 (7.8%)
Sulfonylurea 520 (2.6%)
Glinide 208 (1.0%)
Alpha glycosidase inhibitor 589 (3.0%)
Thiazolidinedione 116 (0.6%)
Insulin only 1143 (5.7%)
Combination of oral antidiabetic agents
Metformin + sulfonylurea 2526 (12.7%)
Metformin + glinide 387 (1.9%)
Metformin + thiazolidinedione 190 (1.0%)
Metformin + alpha glycosidase inhibitor 1018 (5.1%)
Metformin + alpha glycosidase inhibitor + sulfonylurea 1533 (7.7%)
Combination of oral antidiabetic agents and insulin
Metformin + insulin 1182 (5.9%)
Sulfonylurea + insulin 124 (0.6%)
Glinide + insulin 192 (1.0%)
Alpha glycosidase inhibitor + insulin 852 (4.3%)
Data are presented as mean ± standard deviation (SD) for continuous variables, and number of subjects (n) andpercentage (%) for categorical variables. HbA1c, glycosylated hemoglobin
276 Int J Diabetes Dev Ctries (2021) 41:273–279
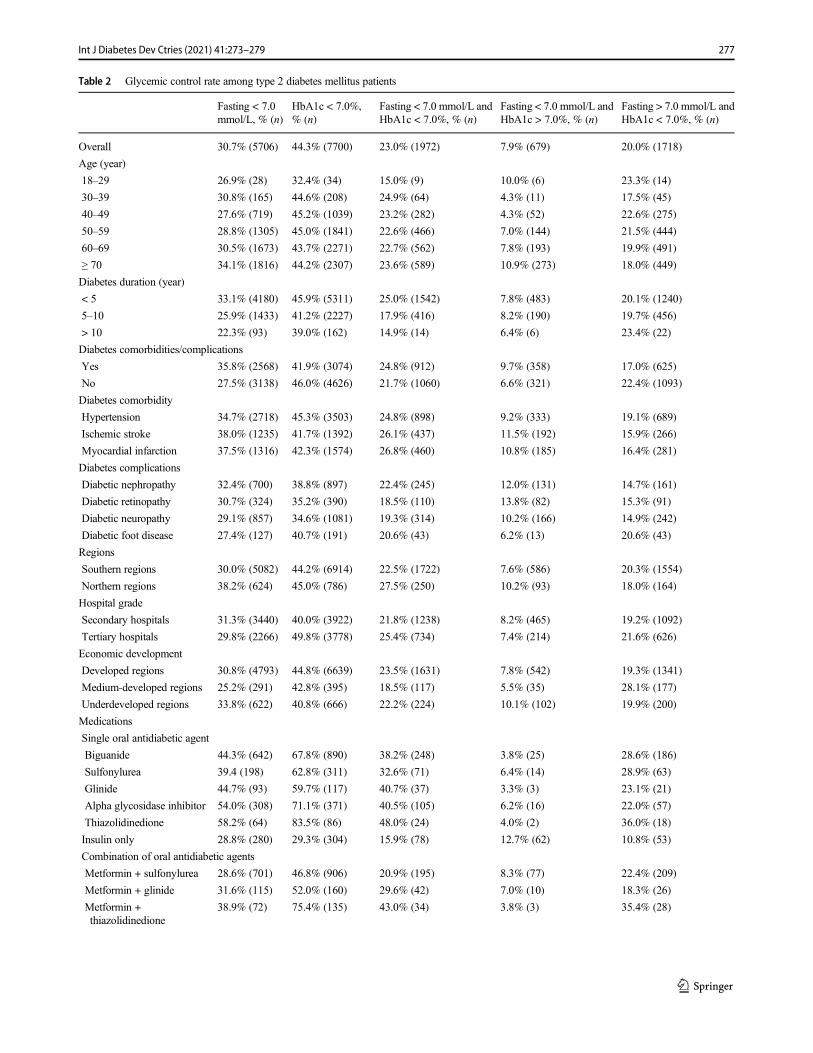
Table 2 Glycemic control rate among type 2 diabetes mellitus patients
Fasting < 7.0mmol/L, % (n)
HbA1c < 7.0%,% (n)
Fasting < 7.0 mmol/L andHbA1c < 7.0%, % (n)
Fasting < 7.0 mmol/L andHbA1c > 7.0%, % (n)
Fasting > 7.0 mmol/L andHbA1c < 7.0%, % (n)
Overall 30.7% (5706) 44.3% (7700) 23.0% (1972) 7.9% (679) 20.0% (1718)
Age (year)
18–29 26.9% (28) 32.4% (34) 15.0% (9) 10.0% (6) 23.3% (14)
30–39 30.8% (165) 44.6% (208) 24.9% (64) 4.3% (11) 17.5% (45)
40–49 27.6% (719) 45.2% (1039) 23.2% (282) 4.3% (52) 22.6% (275)
50–59 28.8% (1305) 45.0% (1841) 22.6% (466) 7.0% (144) 21.5% (444)
60–69 30.5% (1673) 43.7% (2271) 22.7% (562) 7.8% (193) 19.9% (491)
≥ 70 34.1% (1816) 44.2% (2307) 23.6% (589) 10.9% (273) 18.0% (449)
Diabetes duration (year)
< 5 33.1% (4180) 45.9% (5311) 25.0% (1542) 7.8% (483) 20.1% (1240)
5–10 25.9% (1433) 41.2% (2227) 17.9% (416) 8.2% (190) 19.7% (456)
> 10 22.3% (93) 39.0% (162) 14.9% (14) 6.4% (6) 23.4% (22)
Diabetes comorbidities/complications
Yes 35.8% (2568) 41.9% (3074) 24.8% (912) 9.7% (358) 17.0% (625)
No 27.5% (3138) 46.0% (4626) 21.7% (1060) 6.6% (321) 22.4% (1093)
Diabetes comorbidity
Hypertension 34.7% (2718) 45.3% (3503) 24.8% (898) 9.2% (333) 19.1% (689)
Ischemic stroke 38.0% (1235) 41.7% (1392) 26.1% (437) 11.5% (192) 15.9% (266)
Myocardial infarction 37.5% (1316) 42.3% (1574) 26.8% (460) 10.8% (185) 16.4% (281)
Diabetes complications
Diabetic nephropathy 32.4% (700) 38.8% (897) 22.4% (245) 12.0% (131) 14.7% (161)
Diabetic retinopathy 30.7% (324) 35.2% (390) 18.5% (110) 13.8% (82) 15.3% (91)
Diabetic neuropathy 29.1% (857) 34.6% (1081) 19.3% (314) 10.2% (166) 14.9% (242)
Diabetic foot disease 27.4% (127) 40.7% (191) 20.6% (43) 6.2% (13) 20.6% (43)
Regions
Southern regions 30.0% (5082) 44.2% (6914) 22.5% (1722) 7.6% (586) 20.3% (1554)
Northern regions 38.2% (624) 45.0% (786) 27.5% (250) 10.2% (93) 18.0% (164)
Hospital grade
Secondary hospitals 31.3% (3440) 40.0% (3922) 21.8% (1238) 8.2% (465) 19.2% (1092)
Tertiary hospitals 29.8% (2266) 49.8% (3778) 25.4% (734) 7.4% (214) 21.6% (626)
Economic development
Developed regions 30.8% (4793) 44.8% (6639) 23.5% (1631) 7.8% (542) 19.3% (1341)
Medium-developed regions 25.2% (291) 42.8% (395) 18.5% (117) 5.5% (35) 28.1% (177)
Underdeveloped regions 33.8% (622) 40.8% (666) 22.2% (224) 10.1% (102) 19.9% (200)
Medications
Single oral antidiabetic agent
Biguanide 44.3% (642) 67.8% (890) 38.2% (248) 3.8% (25) 28.6% (186)
Sulfonylurea 39.4 (198) 62.8% (311) 32.6% (71) 6.4% (14) 28.9% (63)
Glinide 44.7% (93) 59.7% (117) 40.7% (37) 3.3% (3) 23.1% (21)
Alpha glycosidase inhibitor 54.0% (308) 71.1% (371) 40.5% (105) 6.2% (16) 22.0% (57)
Thiazolidinedione 58.2% (64) 83.5% (86) 48.0% (24) 4.0% (2) 36.0% (18)
Insulin only 28.8% (280) 29.3% (304) 15.9% (78) 12.7% (62) 10.8% (53)
Combination of oral antidiabetic agents
Metformin + sulfonylurea 28.6% (701) 46.8% (906) 20.9% (195) 8.3% (77) 22.4% (209)
Metformin + glinide 31.6% (115) 52.0% (160) 29.6% (42) 7.0% (10) 18.3% (26)
Metformin +thiazolidinedione
38.9% (72) 75.4% (135) 43.0% (34) 3.8% (3) 35.4% (28)
277Int J Diabetes Dev Ctries (2021) 41:273–279
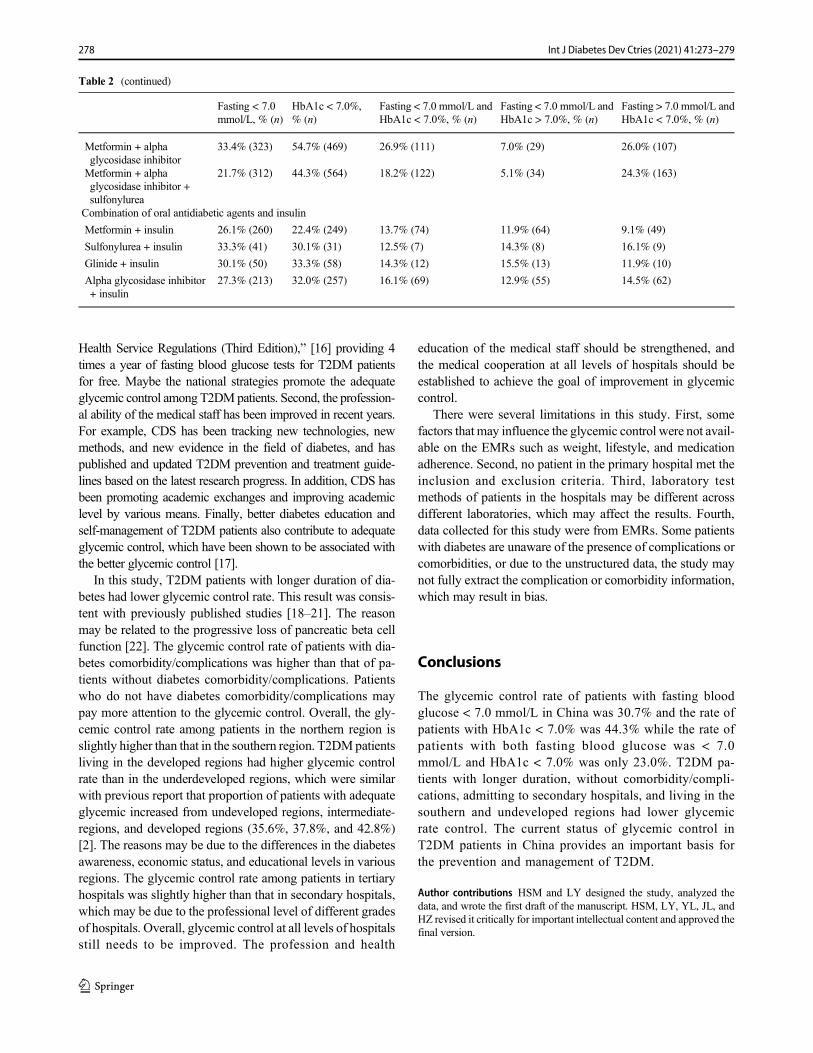
Health Service Regulations (Third Edition),” [16] providing 4times a year of fasting blood glucose tests for T2DM patientsfor free. Maybe the national strategies promote the adequateglycemic control among T2DMpatients. Second, the profession-al ability of the medical staff has been improved in recent years.For example, CDS has been tracking new technologies, newmethods, and new evidence in the field of diabetes, and haspublished and updated T2DM prevention and treatment guide-lines based on the latest research progress. In addition, CDS hasbeen promoting academic exchanges and improving academiclevel by various means. Finally, better diabetes education andself-management of T2DM patients also contribute to adequateglycemic control, which have been shown to be associated withthe better glycemic control [17].
In this study, T2DM patients with longer duration of dia-betes had lower glycemic control rate. This result was consis-tent with previously published studies [18–21]. The reasonmay be related to the progressive loss of pancreatic beta cellfunction [22]. The glycemic control rate of patients with dia-betes comorbidity/complications was higher than that of pa-tients without diabetes comorbidity/complications. Patientswho do not have diabetes comorbidity/complications maypay more attention to the glycemic control. Overall, the gly-cemic control rate among patients in the northern region isslightly higher than that in the southern region. T2DMpatientsliving in the developed regions had higher glycemic controlrate than in the underdeveloped regions, which were similarwith previous report that proportion of patients with adequateglycemic increased from undeveloped regions, intermediate-regions, and developed regions (35.6%, 37.8%, and 42.8%)[2]. The reasons may be due to the differences in the diabetesawareness, economic status, and educational levels in variousregions. The glycemic control rate among patients in tertiaryhospitals was slightly higher than that in secondary hospitals,which may be due to the professional level of different gradesof hospitals. Overall, glycemic control at all levels of hospitalsstill needs to be improved. The profession and health
education of the medical staff should be strengthened, andthe medical cooperation at all levels of hospitals should beestablished to achieve the goal of improvement in glycemiccontrol.
There were several limitations in this study. First, somefactors that may influence the glycemic control were not avail-able on the EMRs such as weight, lifestyle, and medicationadherence. Second, no patient in the primary hospital met theinclusion and exclusion criteria. Third, laboratory testmethods of patients in the hospitals may be different acrossdifferent laboratories, which may affect the results. Fourth,data collected for this study were from EMRs. Some patientswith diabetes are unaware of the presence of complications orcomorbidities, or due to the unstructured data, the study maynot fully extract the complication or comorbidity information,which may result in bias.
Conclusions
The glycemic control rate of patients with fasting bloodglucose < 7.0 mmol/L in China was 30.7% and the rate ofpatients with HbA1c < 7.0% was 44.3% while the rate ofpatients with both fasting blood glucose was < 7.0mmol/L and HbA1c < 7.0% was only 23.0%. T2DM pa-tients with longer duration, without comorbidity/compli-cations, admitting to secondary hospitals, and living in thesouthern and undeveloped regions had lower glycemicrate control. The current status of glycemic control inT2DM patients in China provides an important basis forthe prevention and management of T2DM.
Author contributions HSM and LY designed the study, analyzed thedata, and wrote the first draft of the manuscript. HSM, LY, YL, JL, andHZ revised it critically for important intellectual content and approved thefinal version.
Table 2 (continued)
Fasting < 7.0mmol/L, % (n)
HbA1c < 7.0%,% (n)
Fasting < 7.0 mmol/L andHbA1c < 7.0%, % (n)
Fasting < 7.0 mmol/L andHbA1c > 7.0%, % (n)
Fasting > 7.0 mmol/L andHbA1c < 7.0%, % (n)
Metformin + alphaglycosidase inhibitor
33.4% (323) 54.7% (469) 26.9% (111) 7.0% (29) 26.0% (107)
Metformin + alphaglycosidase inhibitor +sulfonylurea
21.7% (312) 44.3% (564) 18.2% (122) 5.1% (34) 24.3% (163)
Combination of oral antidiabetic agents and insulin
Metformin + insulin 26.1% (260) 22.4% (249) 13.7% (74) 11.9% (64) 9.1% (49)
Sulfonylurea + insulin 33.3% (41) 30.1% (31) 12.5% (7) 14.3% (8) 16.1% (9)
Glinide + insulin 30.1% (50) 33.3% (58) 14.3% (12) 15.5% (13) 11.9% (10)
Alpha glycosidase inhibitor+ insulin
27.3% (213) 32.0% (257) 16.1% (69) 12.9% (55) 14.5% (62)
278 Int J Diabetes Dev Ctries (2021) 41:273–279
Data availability The dataset will be available upon request unless thereare legal or ethical reasons for not doing so.
Compliance with ethical standards
Competing interests The authors declare that they have no competinginterests.
References
1. Society CD. Guidelines for prevention and treatment of type 2diabetes in China (2017 version). Chin J Diabetes Mellitus.2018;10(1):4–67.
2. Xu Y, Wang L, He J, Bi Y, Li M, Wang T, et al. Prevalence andcontrol of diabetes in Chinese adults. JAMA. 2013;310(9):948–59.
3. Liu Z, Fu C, Wang W, Xu B. Prevalence of chronic complicationsof type 2 diabetes mellitus in outpatients - a cross-sectional hospitalbased survey in urban China. Health Qual Life Outcomes.2010;8(1):62.
4. Wang W, McGreevey WP, Fu C, Zhan S, Luan R, Chen W, et al.Type 2 diabetes mellitus in China: a preventable economic burden.Am J Manag Care. 2009;15(9):593–601.
5. Esteghamati A, Ismail-Beigi F, Khaloo P, Moosaie F, Alemi H,Mansournia MA, et al. Determinants of glycemic control: phase 2analysis from nationwide diabetes report of National Program forPrevention and Control of Diabetes (NPPCD-2018). Prim CareDiabetes. 2019.
6. UK Prospective Diabetes Study (UKPDS) Group. Intensive blood-glucose control with sulphonylureas or insulin compared with con-ventional treatment and risk of complications in patients with type 2diabetes (UKPDS 33). Lancet (London, England). 1998;352(9131):837–53.
7. Skyler JS, Bergenstal R, Bonow RO, Buse J, Deedwania P, GaleEA, et al. Intensive glycemic control and the prevention of cardio-vascular events: implications of the ACCORD, ADVANCE, andVA diabetes trials: a position statement of the American DiabetesAssociation and a scientific statement of the American College ofCardiology Foundation and the American Heart Association.Diabetes Care. 2009;32(1):187–92.
8. The State Council of the People’s Republic of China. HealthyChina Action (2019- 2030). 2019. http://www.gov.cn/zhengce/2016-10/25/content_5124174.htm. Accessed 2 Sep 2020.
9. Chen R, Ji L, Chen L, Chen L, Cai D, Feng B, et al. Glycemiccontrol rate of T2DM outpatients in China: a multi-center survey.Med Sci Monit. 2015;21:1440–6.
10. Wang C, Gao Y, Zhu L, Huang M, Wu Y, Xuan J. Treatmentpatterns in patients with newly diagnosed type 2 diabetes in
China: a retrospective, longitudinal database study. Clin Ther.2019;41(8):1440–52.
11. Society CD. Guidelines for the prevention and treatment of type 2diabetes in China (2017 edition). J Chin J Diabetes. 2018;10:4–67.
12. Liu J, Yang Q, Liu J, Zhang Y, Jiang X, Yang YJS. Study on theSpatial Differentiation of the Populations on Both Sides of the“Qinling-Huaihe Line” in China. J Sustainability. 2020;12(11):4545.
13. Jalving AC, Gant CM, Binnenmars SH, Soedamah-Muthu SS,Bakker SJL, Navis G, et al. Glycaemic control in the diabetes andLifestyle Cohort Twente: a cross-sectional assessment of lifestyleand pharmacological management on Hba1c target achievement.Diabetes Obes Metab. 2018;20(10):2494–9.
14. Dong Q, Huang J, Liu S, Yang L, Li J, Li B, et al. A survey onglycemic control rate of type 2 diabetes mellitus with differenttherapies and patients' satisfaction in China. Patient PreferAdherence. 2019;13:1303–10.
15. China NHCotPsRo. National basic public health service regulations(2009 Edition). 2009.
16. National Health Commission of the People’s Republic of China.National Basic Public Health Service Regulations (2009 Edition).2009. http://www.nhc.gov.cn/zwgk/wtwj/201304/b175eb09dfd240f6bae36d2fb67c8619.shtml. Accessed 2 Sep 2020.
17. National Health Commission of the People’s Republic of China.National Basic Public Health Service Regulations (3rd Edition).2017. http://www.nhc.gov.cn/ewebeditor/uploadfile/2017/04/20170417104506514.pdf. Accessed 2 Sep 2020.
18. Sazlina SG, Mastura I, Cheong AT, BujangMohamad A, JamaiyahH, Lee PY, et al. Predictors of poor glycaemic control in olderpatients with type 2 diabetes mellitus. Singap Med J. 2015;56(5):284–90.
19. Li MZ, Ji LN, Meng ZL, Guo XH, Yang JK, Lu JM, et al.Management status of type 2 diabetes mellitus in tertiary hospitalsin Beijing: gap between guideline and reality. Chin Med J.2012;125(23):4185–9.
20. Khattab M, Khader YS, Al-Khawaldeh A, Ajlouni K. Factors as-sociated with poor glycemic control among patients with type 2diabetes. J Diabetes Complicat. 2010;24(2):84–9.
21. Ji LN, Lu JM, Guo XH, Yang WY, Weng JP, Jia WP, et al.Glycemic control among patients in China with type 2 diabetesmellitus receiving oral drugs or injectables. BMC Public Health.2013;13:602.
22. U.K. prospective diabetes study 16. Overview of 6 years’ therapy oftype II diabetes: a progressive disease. U.K. Prospective DiabetesStudy Group. Diabetes. 1995;44(11):1249–58.
Publisher’s note Springer Nature remains neutral with regard to jurisdic-tional claims in published maps and institutional affiliations.
279Int J Diabetes Dev Ctries (2021) 41:273–279
ORIGINAL ARTICLE
Healthcare seeking behavior and glycemic control in patientswith type 2 diabetes attending a tertiary hospital
Sheikh Mohammed Shariful Islam1,2,3,4& Riaz Uddin1
& Sojib Bin Zaman5& Tuhin Biswas4 & Tania Tansi6 &
Zahra Chegini7 & Mohammad Ali Moni8 & Louis Niessen4,9,10& Aliya Naheed4
& for the MPID Trial Investigators
Received: 9 May 2020 /Accepted: 25 September 2020# Research Society for Study of Diabetes in India 2020
AbstractPurpose To assess the relationship between healthcare seeking behaviors and glycemic control in patients with type 2 diabetes.Methods A secondary data analysis was conducted among patients with type 2 diabetes from a randomized controlled trialconducted in a tertiary hospital, Bangladesh. Data on health center use, healthcare providers visited, self-monitoring of bloodglucose, blood pressure, foot care, and physical activity were collected through structured questionnaires. Uncontrolled diabeteswas defined as HbA1c ≥ 7%. Multivariable logistic regression models were performed.Result Of the 265 patients (mean age 50.3 ± 9.9 years; 49.8% females), the majority (71.3%) had uncontrolled diabetes. Morethan one-third (34.9%) of the participants did not visit their physician or a healthcare center during the previous 3-months. Only12.4% of participants checked their blood glucose, and 35.8% checked their blood pressure during the last week. Participantswho did not visit a physician or a healthcare center during the past 3 months had twice the odds of having uncontrolled diabetes,compared with those who visited during the same period [OR 2.12, 95% CI (1.02–5.14), p = 0.04].Conclusion Regular consultation with a physician or visiting a healthcare center might help to improve glycemic control inpatients with type 2 diabetes in Bangladesh.
Keywords Healthcare seekingbehavior .Type2diabetes .Bloodpressure . Self-management .Healthcareprovider .Bangladesh
Introduction
Non-communicable diseases, including diabetes, cardiovas-cular diseases, chronic respiratory diseases, and cancers, aresignificant health burden globally causing 41.1 million deathsin 2017 [1], and affecting millions of people in low- and
middle-income countries (LMICs) [1, 2]. The InternationalDiabetes Federation estimated that in 2019, there were 463million adults with diabetes globally, which is projected torise to 700 million by 2045 [3]. In 2019, an estimated 4.2million global deaths were due to diabetes and related com-plications [3]. Diabetes is a costly condition with direct and
* Sheikh Mohammed Shariful [email protected]
1 Institute for Physical Activity and Nutrition, School of Exercise andNutrition Sciences, Deakin University, 221 Burwood Highway,Burwood, Melbourne, VIC 3125, Australia
2 Cardiovascular Division, The George Institute for Global Health,University of Sydney, Sydney, Australia
3 Sydney Medical School, The University of Sydney,Sydney, Australia
4 Initiative for Noncommunicable Diseases, Health Systems andPopulation Studies Division, International Centre for DiarrhoealDisease Research, Bangladesh (icddr,b), Dhaka, Bangladesh
5 Maternal and Child Health Division, International Centre forDiarrhoeal Disease Research, Bangladesh (icddr,b),Dhaka, Bangladesh
6 Bangladesh College of Home Economics, University of Dhaka,Dhaka, Bangladesh
7 Iranian Center of Excellence in Health Management, School ofManagement and Medical Informatics, Tabriz University of MedicalSciences, Tabriz, Iran
8 WHO Collaborating Centre on eHealth, UNSW Digital Health,School of Public Health and Community Medicine, Faculty ofMedicine, UNSW Sydney, Sydney, Australia
9 Centre for Applied Health Research and Delivery, Liverpool Schoolof Tropical Medicine, Liverpool, UK
10 Department of International Health, Johns Hopkins University,Baltimore, MD, USA
https://doi.org/10.1007/s13410-020-00875-8
/ Published online: 8 October 2020
International Journal of Diabetes in Developing Countries (2021) 41:280–287
indirect costs of USD 760 billion and 1.31 trillion, respective-ly [3]. In Bangladesh, diabetes has become an epidemic withincreasing prevalence over the last few decades and imposes asubstantial financial burden on the health systems [4, 5]. Astudy analyzing data from the 2011 Bangladesh Demographicand Health Survey reported that the overall prevalence of di-abetes and pre-diabetes among the adult population was 10%and 23% respectively, with a higher prevalence of diabetes inurban areas compared with rural areas (15.3 vs. 8.3%) [6]. Ifthis increasing trend continues, Bangladesh will be one of thehighest diabetic populous countries in the world.
Evidence suggests that healthcare seeking behaviors of pa-tients are directly related to disease incidence, prevalence, con-trol, and complications [7]. Previous studies in Bangladeshreported a high proportion of diabetes-related health problems,depression, and poor quality of life among patients with type 2diabetes attending an urban hospital [8–10]. Healthcare seekingbehavior is essential for planning diabetes care and manage-ment upon diagnosis so that complications can be minimized.National and international diabetes care guidelines recommendmaintaining optimum blood glucose levels of HbA1c < 7%.However, this is often difficult to achieve with medicationsalone as glucose levels are influenced by participants’ behav-iors. Healthcare seeking behavior can affect glycemic control inpeople with diabetes. The negative impact of delayedhealthcare seeking behavior for diabetes includes late diagno-sis, delayed treatment, and poor health outcomes, thereby in-creasing healthcare expenditure and suffering [4].
Healthcare seeking behavior is not just an isolated event butrather part and parcel of personal, family, and community iden-tity that results from an evolving mix of personal, social, cultur-al, and experiential factors. The process of responding to illnessand seeking care involves multiple steps. It is influenced bypeoples’ perceptions about a disease within the context of tradi-tional and cultural beliefs and attitudes [11]. It concerns factorsthat enable or prevent people frommaking healthy choices abouttheir lifestyles and adoption of medical care [12]. Understandinghealthcare seeking behavior is essential to determine the utiliza-tion of healthcare services, identifymost vulnerable patients, andsupport those with most significant needs. However, informa-tion regarding healthcare seeking behavior among patients withdiabetes is limited in Bangladesh. Therefore, we conducted thisstudy to assess the healthcare seeking behavior and its relation-ship with glycemic control among patients with type 2 diabetesand identify any gender disparity.
Methods
Study design and population
A secondary data-analyses was performed from the baselinedata of participants enrolled in the “Mobile phone intervention
for diabetes” (MPID) study, a randomized controlled trial formeasuring the effectiveness of mobile phone intervention fordiabetes in Bangladesh. The study protocol has been pub-lished previously [13]. Briefly, 265 patients with type 2 dia-betes attending the Bangladesh Institute of Health Science(BIHS) Hospital in Dhaka, Bangladesh, were enrolled be-tween September 1, 2013, and July 30, 2014. All consecutivepatients meeting the following inclusion criteria were includedin the trial: adults (aged ≥ 18 years), diagnosed with type 2diabetes within the last 5 years according to the WHO stan-dards by a BIHS attending physician, on oral medication ther-apy, living in Dhaka city, had access to a mobile phone andwere willing to return for a follow-up visit after 6 months.Patients with severe co-morbidities, type 1 diabetes, gestation-al diabetes, and not ready to perform HbA1c tests were ex-cluded. The BIHS hospital is a tertiary level hospital offeringquality outpatient and inpatient services to patients from allsocioeconomic classes in Dhaka city and surrounding neigh-borhoods. All patients registered with the BIHS receive one-time complementary health education and counseling for 20–30 min by trained health educators on diet and lifestyle, eyeexamination by an ophthalmologist, dental check-up by a den-tist, and lifelong subsidized blood tests at BIHS laboratory.
Data collection procedure
Data collection took place at the outpatient department ofBIHS hospital by the study team consisting of a research phy-sician, a research officer, and three research assistants. Theprincipal and senior investigators trained the data collectionteam for 2 weeks on study design and objectives, interviewtechniques and skills, anthropometric measurements, and re-search ethics. A draft questionnaire was developed in Englishand translated into Bengali using back-translation by two in-dependent bi-lingual researchers (SMSI and TB) according toWHO guidelines. The questionnaire was pre-tested in an out-patient department of another hospital among 30 diabetic pa-tients and was modified based on their feedback andsuggestions.
Variables and measurements
Glycemic control
Blood tests for fasting blood sugar, 2-h postprandial sugar,and glycated hemoglobin (HbA1c) were measured at theBIHS laboratory following standard protocol. Diabetes wasdefined according toWHO guideline as (venous) fasting plas-ma glucose ≥ 7.0 mmol/l (126 mg/dl), or random plasma glu-cose ≥ 11.1 mmol/l (200 mg/dl), or plasma glucose 2 h after a75 g oral load of glucose ≥ 11.1 mmol/l (200 mg/dl).Uncontrolled diabetes or poor glycemic control was defined
281Int J Diabetes Dev Ctries (2021) 41:280–287
as HbA1c > 7% according to the American DiabetesAssociation criteria.
Health seeking behaviors
Participants reported about the frequency of self-monitoringpractices of blood glucose, history of visiting a healthcarefacility and providers 3-months preceding the survey comple-tion, adherence to physicians’ advice, foot care, physical ac-tivity, weight, blood pressure monitoring, and current historyof tobacco use.
Sociodemographic and other variables
The following variables were included in the questionnaire:age, sex, education, occupation, monthly income, marital sta-tus, and distance of the healthcare center from home in kilo-meters. Body weight and height were measured to the nearest0.1 kg and 0.1 cm, respectively, using standard protocols [13].Body mass index (BMI) was calculated by dividing weight inkilograms by height in meter square (in kg/m2) and categorizedas: underweight (< 18.5 kg/m2), normal (18.5–24.9 kg/m2),and overweight/obese (≥ 25 kg/m2) as recommended byWHO for Asian populations [14]. Blood pressure (BP) wasmeasured using a digital blood pressure monitor (Omron,SEM-1, Omron Corp, Japan) twice in both arms at 5-min in-terval and after the patient had rested for 10 min. The averagevalue of the two readings was considered. Hypertension wasdefined as an average systolic BP (SBP) ≥ 140 mmHg or anaverage diastolic BP (DBP) ≥ 90 mmHg, based on the averageBP measurements, or if the patient was taking any BP-lowering medication.
Data analysis
Data were checked for errors and missing values manuallyafter collection by the data collector and re-checked by theresearch officer. We used the EpiInfo software for data entrywith customized built-in forms for range and consistencychecking to avoid data entry errors. Each variable was testedfor normality. Data were presented as frequency and percent-age for categorical variables and mean ± standard deviation(SD) and median (interquartile range; IQR) for continuousvariables. We performed Chi-square tests, t tests, andFishers’ exact test for comparing the group difference betweenmales and females as appropriate. Logistic regression wasperformed adjusting for potential confounders (age, sex, edu-cation, marital status, and distance of health center fromhome) to examine if health seeking behavior had attributedto uncontrolled diabetes. Odds ratios (OR) with 95% confi-dence intervals (CI) were presented. A p value < 0.05 wasconsidered significant. Data analysis was performed using
SPSS version 17 for Windows (SPSS Corporation, Chicago.IL, USA).
Ethical consideration
Written informed consent was obtained from each participantbefore enrollment, and the aims and objectives of the studywere explained. Respondents were informed about their rightto refuse and withdraw from the study at any time, which willnot hamper the services they receive at BIHS hospital or else-where. Data were collected following the Helsinki Declarationand Bangladesh Medical Research Council guidelines of eth-ical conduct. Permission was granted from the Director ofBIHS hospital for using their facility for data collection. Theethical and research review committee of the InternationalCenter for Diarrheal Diseases Research, Bangladesh (icddr,b)approved the study protocol.
Results
A total of 265 patients with type 2 diabetes on oral therapyparticipated in this study. Table 1 shows the sociodemographiccharacteristics of the study participants. The mean ± SD age ofpatients was 50.3 ± 9.9 years, and 49.8% were females. Themajority of the participants were married. The median (IQR)income per month was 30,000 (30,000, 40,000) BDT [1USD = 80 BDT, 2015]. Almost one-third (33.6%) of the par-ticipants completed college education (graduate, postgraduatediploma), 12.8% higher secondary education (year-12), 29.1%secondary education (year-10), 14.7% primary education(year-5), and 9.8% had no formal education. About half ofthe participants were homemakers (46.9%). More than half ofthe participants had hypertension (57.7%), which was signifi-cantly higher among females compared with males (65.2% vs.50.4%, p = 0.015). Two out of three participants (64.5%) hadoverweight/obesity, with more females overweight/obese thanmales (70.5% vs. 58.6%).
Table 2 shows the healthcare seeking behavior of the par-ticipants by gender. About 65% of the participants visited theirphysician or healthcare center during the past 3 months. Themajority (87.5%) of the participants had no problem remem-bering their physician’s appointment or visit the healthcarecenter as per their physician’s advice. Only 12.4% of partici-pants checked their blood glucose weekly at home, while30.6% and 57.0% of participants checked their blood glucosemonthly and at every 2–3 months or more, respectively.However, a vast majority of the participants did not take careof their feet (62.6%), measure blood pressure (64.2%), andweight (70.6%) during the last week before the interview.More than 70% of the participants reported walking regularlyfor 30 min per day in the previous week before the interview.
282 Int J Diabetes Dev Ctries (2021) 41:280–287
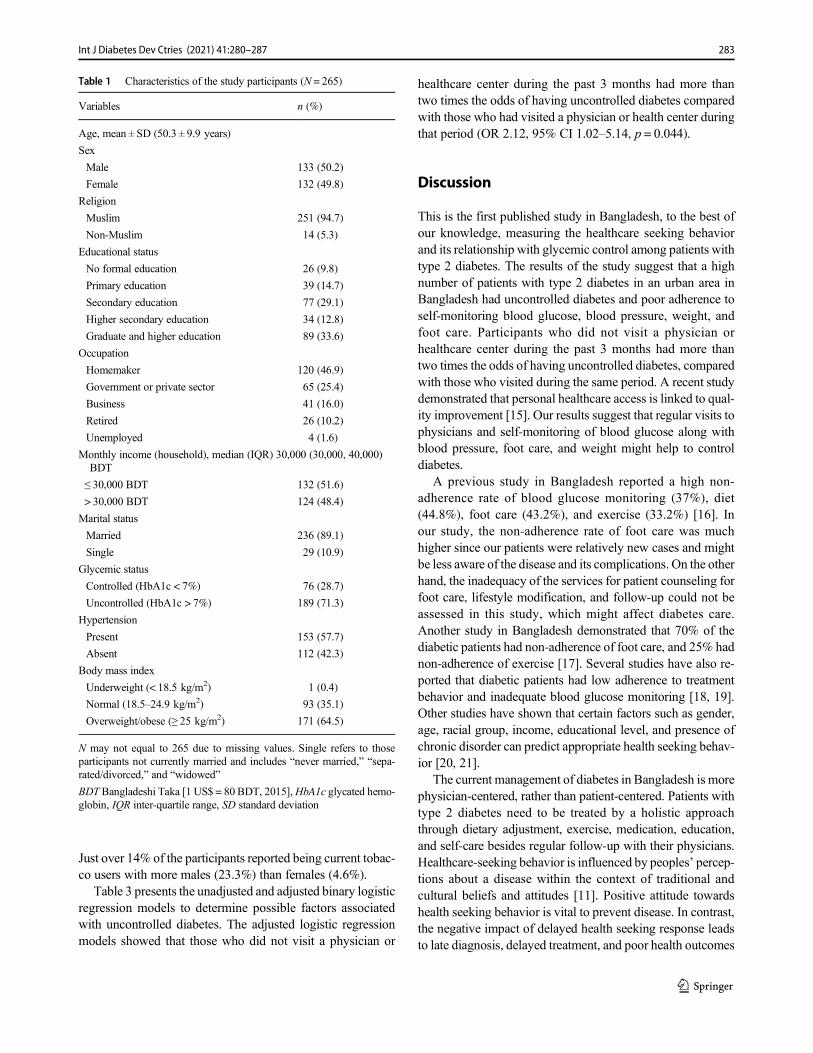
Just over 14% of the participants reported being current tobac-co users with more males (23.3%) than females (4.6%).
Table 3 presents the unadjusted and adjusted binary logisticregression models to determine possible factors associatedwith uncontrolled diabetes. The adjusted logistic regressionmodels showed that those who did not visit a physician or
healthcare center during the past 3 months had more thantwo times the odds of having uncontrolled diabetes comparedwith those who had visited a physician or health center duringthat period (OR 2.12, 95% CI 1.02–5.14, p = 0.044).
Discussion
This is the first published study in Bangladesh, to the best ofour knowledge, measuring the healthcare seeking behaviorand its relationship with glycemic control among patients withtype 2 diabetes. The results of the study suggest that a highnumber of patients with type 2 diabetes in an urban area inBangladesh had uncontrolled diabetes and poor adherence toself-monitoring blood glucose, blood pressure, weight, andfoot care. Participants who did not visit a physician orhealthcare center during the past 3 months had more thantwo times the odds of having uncontrolled diabetes, comparedwith those who visited during the same period. A recent studydemonstrated that personal healthcare access is linked to qual-ity improvement [15]. Our results suggest that regular visits tophysicians and self-monitoring of blood glucose along withblood pressure, foot care, and weight might help to controldiabetes.
A previous study in Bangladesh reported a high non-adherence rate of blood glucose monitoring (37%), diet(44.8%), foot care (43.2%), and exercise (33.2%) [16]. Inour study, the non-adherence rate of foot care was muchhigher since our patients were relatively new cases and mightbe less aware of the disease and its complications. On the otherhand, the inadequacy of the services for patient counseling forfoot care, lifestyle modification, and follow-up could not beassessed in this study, which might affect diabetes care.Another study in Bangladesh demonstrated that 70% of thediabetic patients had non-adherence of foot care, and 25% hadnon-adherence of exercise [17]. Several studies have also re-ported that diabetic patients had low adherence to treatmentbehavior and inadequate blood glucose monitoring [18, 19].Other studies have shown that certain factors such as gender,age, racial group, income, educational level, and presence ofchronic disorder can predict appropriate health seeking behav-ior [20, 21].
The current management of diabetes in Bangladesh is morephysician-centered, rather than patient-centered. Patients withtype 2 diabetes need to be treated by a holistic approachthrough dietary adjustment, exercise, medication, education,and self-care besides regular follow-up with their physicians.Healthcare-seeking behavior is influenced by peoples’ percep-tions about a disease within the context of traditional andcultural beliefs and attitudes [11]. Positive attitude towardshealth seeking behavior is vital to prevent disease. In contrast,the negative impact of delayed health seeking response leadsto late diagnosis, delayed treatment, and poor health outcomes
Table 1 Characteristics of the study participants (N = 265)
Variables n (%)
Age, mean ± SD (50.3 ± 9.9 years)
Sex
Male 133 (50.2)
Female 132 (49.8)
Religion
Muslim 251 (94.7)
Non-Muslim 14 (5.3)
Educational status
No formal education 26 (9.8)
Primary education 39 (14.7)
Secondary education 77 (29.1)
Higher secondary education 34 (12.8)
Graduate and higher education 89 (33.6)
Occupation
Homemaker 120 (46.9)
Government or private sector 65 (25.4)
Business 41 (16.0)
Retired 26 (10.2)
Unemployed 4 (1.6)
Monthly income (household), median (IQR) 30,000 (30,000, 40,000)BDT
≤ 30,000 BDT 132 (51.6)
> 30,000 BDT 124 (48.4)
Marital status
Married 236 (89.1)
Single 29 (10.9)
Glycemic status
Controlled (HbA1c < 7%) 76 (28.7)
Uncontrolled (HbA1c > 7%) 189 (71.3)
Hypertension
Present 153 (57.7)
Absent 112 (42.3)
Body mass index
Underweight (< 18.5 kg/m2) 1 (0.4)
Normal (18.5–24.9 kg/m2) 93 (35.1)
Overweight/obese (≥ 25 kg/m2) 171 (64.5)
N may not equal to 265 due to missing values. Single refers to thoseparticipants not currently married and includes “never married,” “sepa-rated/divorced,” and “widowed”
BDT Bangladeshi Taka [1 US$ = 80 BDT, 2015],HbA1c glycated hemo-globin, IQR inter-quartile range, SD standard deviation
283Int J Diabetes Dev Ctries (2021) 41:280–287
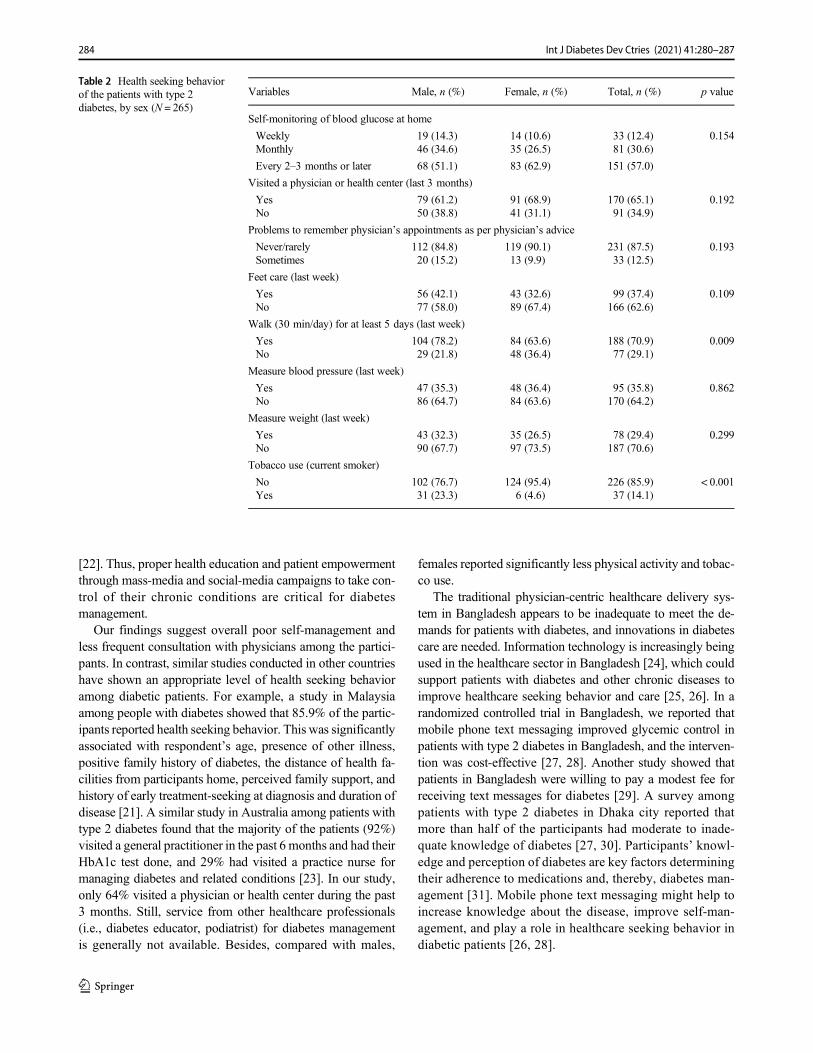
[22]. Thus, proper health education and patient empowermentthrough mass-media and social-media campaigns to take con-trol of their chronic conditions are critical for diabetesmanagement.
Our findings suggest overall poor self-management andless frequent consultation with physicians among the partici-pants. In contrast, similar studies conducted in other countrieshave shown an appropriate level of health seeking behavioramong diabetic patients. For example, a study in Malaysiaamong people with diabetes showed that 85.9% of the partic-ipants reported health seeking behavior. This was significantlyassociated with respondent’s age, presence of other illness,positive family history of diabetes, the distance of health fa-cilities from participants home, perceived family support, andhistory of early treatment-seeking at diagnosis and duration ofdisease [21]. A similar study in Australia among patients withtype 2 diabetes found that the majority of the patients (92%)visited a general practitioner in the past 6 months and had theirHbA1c test done, and 29% had visited a practice nurse formanaging diabetes and related conditions [23]. In our study,only 64% visited a physician or health center during the past3 months. Still, service from other healthcare professionals(i.e., diabetes educator, podiatrist) for diabetes managementis generally not available. Besides, compared with males,
females reported significantly less physical activity and tobac-co use.
The traditional physician-centric healthcare delivery sys-tem in Bangladesh appears to be inadequate to meet the de-mands for patients with diabetes, and innovations in diabetescare are needed. Information technology is increasingly beingused in the healthcare sector in Bangladesh [24], which couldsupport patients with diabetes and other chronic diseases toimprove healthcare seeking behavior and care [25, 26]. In arandomized controlled trial in Bangladesh, we reported thatmobile phone text messaging improved glycemic control inpatients with type 2 diabetes in Bangladesh, and the interven-tion was cost-effective [27, 28]. Another study showed thatpatients in Bangladesh were willing to pay a modest fee forreceiving text messages for diabetes [29]. A survey amongpatients with type 2 diabetes in Dhaka city reported thatmore than half of the participants had moderate to inade-quate knowledge of diabetes [27, 30]. Participants’ knowl-edge and perception of diabetes are key factors determiningtheir adherence to medications and, thereby, diabetes man-agement [31]. Mobile phone text messaging might help toincrease knowledge about the disease, improve self-man-agement, and play a role in healthcare seeking behavior indiabetic patients [26, 28].
Table 2 Health seeking behaviorof the patients with type 2diabetes, by sex (N = 265)
Variables Male, n (%) Female, n (%) Total, n (%) p value
Self-monitoring of blood glucose at home
Weekly 19 (14.3) 14 (10.6) 33 (12.4) 0.154Monthly 46 (34.6) 35 (26.5) 81 (30.6)
Every 2–3 months or later 68 (51.1) 83 (62.9) 151 (57.0)
Visited a physician or health center (last 3 months)
Yes 79 (61.2) 91 (68.9) 170 (65.1) 0.192No 50 (38.8) 41 (31.1) 91 (34.9)
Problems to remember physician’s appointments as per physician’s advice
Never/rarely 112 (84.8) 119 (90.1) 231 (87.5) 0.193Sometimes 20 (15.2) 13 (9.9) 33 (12.5)
Feet care (last week)
Yes 56 (42.1) 43 (32.6) 99 (37.4) 0.109No 77 (58.0) 89 (67.4) 166 (62.6)
Walk (30 min/day) for at least 5 days (last week)
Yes 104 (78.2) 84 (63.6) 188 (70.9) 0.009No 29 (21.8) 48 (36.4) 77 (29.1)
Measure blood pressure (last week)
Yes 47 (35.3) 48 (36.4) 95 (35.8) 0.862No 86 (64.7) 84 (63.6) 170 (64.2)
Measure weight (last week)
Yes 43 (32.3) 35 (26.5) 78 (29.4) 0.299No 90 (67.7) 97 (73.5) 187 (70.6)
Tobacco use (current smoker)
No 102 (76.7) 124 (95.4) 226 (85.9) < 0.001Yes 31 (23.3) 6 (4.6) 37 (14.1)
284 Int J Diabetes Dev Ctries (2021) 41:280–287
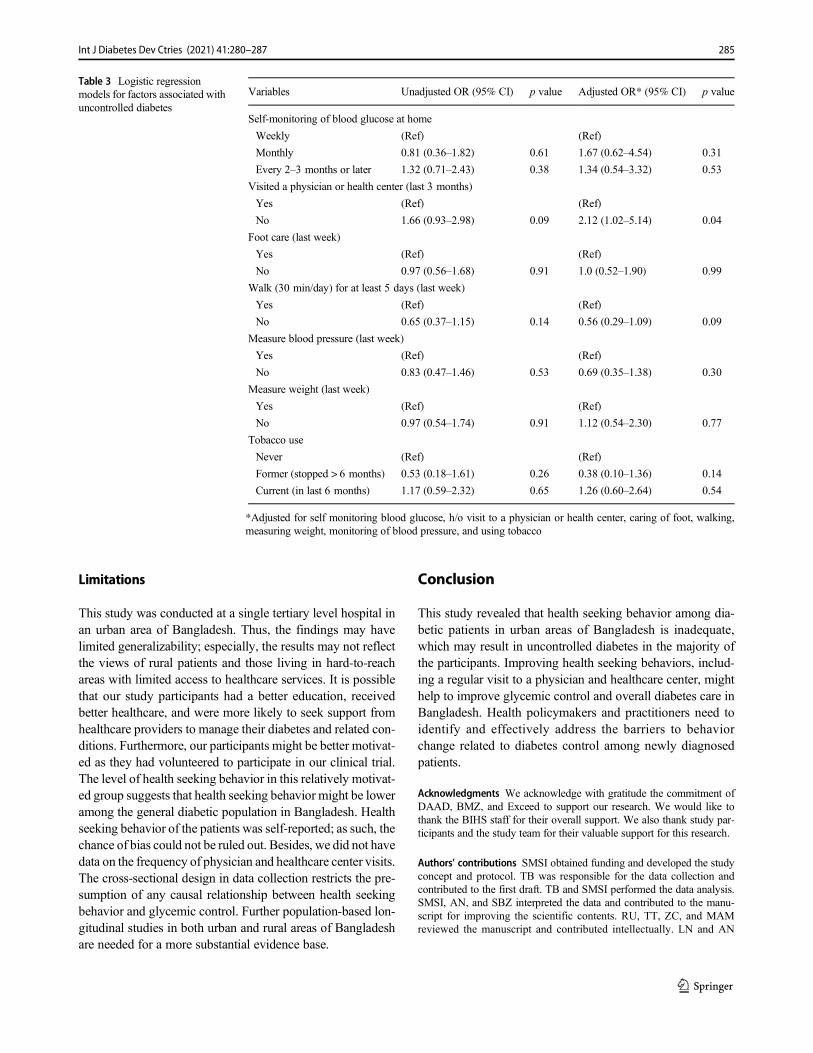
Limitations
This study was conducted at a single tertiary level hospital inan urban area of Bangladesh. Thus, the findings may havelimited generalizability; especially, the results may not reflectthe views of rural patients and those living in hard-to-reachareas with limited access to healthcare services. It is possiblethat our study participants had a better education, receivedbetter healthcare, and were more likely to seek support fromhealthcare providers to manage their diabetes and related con-ditions. Furthermore, our participants might be better motivat-ed as they had volunteered to participate in our clinical trial.The level of health seeking behavior in this relatively motivat-ed group suggests that health seeking behavior might be loweramong the general diabetic population in Bangladesh. Healthseeking behavior of the patients was self-reported; as such, thechance of bias could not be ruled out. Besides, we did not havedata on the frequency of physician and healthcare center visits.The cross-sectional design in data collection restricts the pre-sumption of any causal relationship between health seekingbehavior and glycemic control. Further population-based lon-gitudinal studies in both urban and rural areas of Bangladeshare needed for a more substantial evidence base.
Conclusion
This study revealed that health seeking behavior among dia-betic patients in urban areas of Bangladesh is inadequate,which may result in uncontrolled diabetes in the majority ofthe participants. Improving health seeking behaviors, includ-ing a regular visit to a physician and healthcare center, mighthelp to improve glycemic control and overall diabetes care inBangladesh. Health policymakers and practitioners need toidentify and effectively address the barriers to behaviorchange related to diabetes control among newly diagnosedpatients.
Acknowledgments We acknowledge with gratitude the commitment ofDAAD, BMZ, and Exceed to support our research. We would like tothank the BIHS staff for their overall support. We also thank study par-ticipants and the study team for their valuable support for this research.
Authors’ contributions SMSI obtained funding and developed the studyconcept and protocol. TB was responsible for the data collection andcontributed to the first draft. TB and SMSI performed the data analysis.SMSI, AN, and SBZ interpreted the data and contributed to the manu-script for improving the scientific contents. RU, TT, ZC, and MAMreviewed the manuscript and contributed intellectually. LN and AN
Table 3 Logistic regressionmodels for factors associated withuncontrolled diabetes
Variables Unadjusted OR (95% CI) p value Adjusted OR* (95% CI) p value
Self-monitoring of blood glucose at home
Weekly (Ref) (Ref)
Monthly 0.81 (0.36–1.82) 0.61 1.67 (0.62–4.54) 0.31
Every 2–3 months or later 1.32 (0.71–2.43) 0.38 1.34 (0.54–3.32) 0.53
Visited a physician or health center (last 3 months)
Yes (Ref) (Ref)
No 1.66 (0.93–2.98) 0.09 2.12 (1.02–5.14) 0.04
Foot care (last week)
Yes (Ref) (Ref)
No 0.97 (0.56–1.68) 0.91 1.0 (0.52–1.90) 0.99
Walk (30 min/day) for at least 5 days (last week)
Yes (Ref) (Ref)
No 0.65 (0.37–1.15) 0.14 0.56 (0.29–1.09) 0.09
Measure blood pressure (last week)
Yes (Ref) (Ref)
No 0.83 (0.47–1.46) 0.53 0.69 (0.35–1.38) 0.30
Measure weight (last week)
Yes (Ref) (Ref)
No 0.97 (0.54–1.74) 0.91 1.12 (0.54–2.30) 0.77
Tobacco use
Never (Ref) (Ref)
Former (stopped > 6 months) 0.53 (0.18–1.61) 0.26 0.38 (0.10–1.36) 0.14
Current (in last 6 months) 1.17 (0.59–2.32) 0.65 1.26 (0.60–2.64) 0.54
*Adjusted for self monitoring blood glucose, h/o visit to a physician or health center, caring of foot, walking,measuring weight, monitoring of blood pressure, and using tobacco
285Int J Diabetes Dev Ctries (2021) 41:280–287
provided overall supervision and final comments. All authors have readthe final manuscript and agreed for submission.
Funding This research study was supported by the icddr,b and the Centerfor International Health (CIH), Ludwig-Maximilians-Universitat,Munich, Germany through DAAD, BMZ, and Exceed.
Data availability The datasets used and/or analyzed during the currentstudy are available from the corresponding author on reasonable request.
Compliance with ethical standards
Conflict of interest The authors declare that they have no conflict ofinterest.
Ethical approval The study protocol was approved by the ethical andresearch review committee of the International Center for DiarrhealDiseases Research, Bangladesh (icddr,b).
Consent to participate Written informed consent was obtained fromeach participant before enrollment and the aims and objectives of thestudy were explained.
Consent for publication The participants consented for their data to beused in scientific communications, including publication in journals.
References
1. Martinez R, Lloyd-Sherlock P, Soliz P, Ebrahim S, Vega E,Ordunez P, et al. Trends in premature avertable mortality fromnon-communicable diseases for 195 countries and territories,1990–2017: a population-based study. Lancet Glob Health.2020;8(4):e511–e23.
2. Islam SMS, Purnat TD, Phuong NTA, Mwingira U, Schacht K,Fröschl G. Non-communicable diseases (NCDs) in developingcountries: a symposium report. Glob Health. 2014;10(1):81.
3. International Diabetes Federation (IDF). IDF Diabetes Atlas. 9thedition. 2019.
4. Islam SMS, Lechner A, Ferrari U, Laxy M, Seissler J, Brown J,et al. Healthcare use and expenditure for diabetes in Bangladesh.BMJ Glob Health. 2017;2(1):e000033.
5. Biswas T, Islam A, Rawal L, Islam S. Increasing prevalence ofdiabetes in Bangladesh: a scoping review. Public Health.2016;138:4–11.
6. Akter S, Rahman MM, Abe SK, Sultana P. Prevalence of diabetesand prediabetes and their risk factors among Bangladeshi adults: anationwide survey. Bull World Health Organ. 2014;92(3):204–13A.
7. Shah T, Patel M, Shah V. Health care seeking behavior of urbanand rural community in Ahmedabad district. Int J Med Sci PublicHealth. 2013;2(4):908–11.
8. Islam SMS, Alam DS, Wahiduzzaman M, Niessen LW, FroeschlG, Ferrari U, et al. Clinical characteristics and complications ofpatients with type 2 diabetes attending an urban hospital inBangladesh. Diab Metab Syndr. 2014;9(1):7–13.
9. Islam SMS, Ferrari U, Seissler J, Niessen L, Lechner A.Association between depression and diabetes amongst adults inBangladesh: a hospital based case–control study. J Glob Health.2015;5(2):020406.
10. Islam SMS, Rawal LB, Niessen LW. Prevalence of depression andits associated factors in patients with type 2 diabetes: a cross-
sectional study in Dhaka, Bangladesh. Asian J Psychiatr. 2015;17:36–41.
11. Nguma LK. Health seeking and health related behaviour for type 2diabetes mellitus among adults in an urban community in Tanzania:University of Otago. 2010.
12. MacKian S. A review of health seeking behaviour: problems andprospects. Health Systems Development Programme. University ofManchester. 2003.
13. Islam SM, Lechner A, Ferrari U, Froeschl G, Alam DS, Holle R,et al. Mobile phone intervention for increasing adherence to treat-ment for type 2 diabetes in an urban area of Bangladesh: protocolfor a randomized controlled trial. BMC Health Serv Res.2014;14(1):586. https://doi.org/10.1186/s12913-014-0586-1.
14. Who EC. Appropriate body-mass index for Asian populations andits implications for policy and intervention strategies. Lancet.2004;363(9403):157–63.
15. Access GH, Collaborators Q. Healthcare access and quality indexbased on mortality from causes amenable to personal health care in195 countries and territories, 1990–2015: a novel analysis from theGlobal Burden of Disease Study 2015. Lancet. 2017;390(10091):231–6.
16. Saleh F,Mumu SJ, Ara F, HafezMA, Ali L. Non-adherence to self-care practices &medication and health related quality of life amongpatients with type 2 diabetes: a cross-sectional study. BMC PublicHealth. 2014;14(1):431.
17. Mumu SJ, Saleh F, Ara F, Afnan F, Ali L. Non-adherence to life-style modification and its factors among type 2 diabetic patients.Indian J Public Health. 2014;58(1):40–4.
18. Martínez YV, Prado-Aguilar CA, Rascón-Pacheco RA, Valdivia-Martínez JJ. Quality of life associated with treatment adherence inpatients with type 2 diabetes: a cross-sectional study. BMC HealthServ Res. 2008;8(1):164.
19. Hankó B, KázmérM, Kumli P, Hrágyel Z, SamuA, Vincze Z, et al.Self-reported medication and lifestyle adherence in Hungarian pa-tients with type 2 diabetes. Pharm World Sci. 2007;29(2):58–66.
20. Wong LY, TohMP. Understanding of diabetes mellitus and health-preventive behaviour among Singaporeans. Ann AcadMed Singap.2009;38(6):478–9.
21. Inche Zainal Abidin S, Sutan R, Shamsuddin K. Prevalence anddeterminants of appropriate health seeking behaviour amongknown diabetics: results from a community-based survey. AdvEpidemiol. 2014;2014:793286.
22. Sethi B. Health and behaviour. Indian J Psychiatry. 1984;26(2):97–8.23. Rawal LB, Wolfe R, Joyce C, Riddell M, Dunbar JA, Li H, et al.
Utilisation of general practitioner services and achievement ofguideline targets by people with diabetes who joined a peer-support program in Victoria, Australia. Aust J Prim Health.2015;21(2):205–13.
24. Islam SMS, Tabassum R. Implementation of information and com-munication technologies for health in Bangladesh. Bull WorldHealth Organ. 2015;93(11):806–9.
25. Islam S, Tabassum R, Liu Y, Chen S, Redfern J, Kim S, et al. Therole of social media in preventing and managing non-communicable diseases in low-and-middle income countries: hopeor hype? Health Policy Technol. 2019;8(1):96–101.
26. Islam SMS, Farmer AJ, BobrowK,Maddison R,Whittaker R, DaleLAP, et al. Mobile phone text-messaging interventions aimed toprevent cardiovascular diseases (Text2PreventCVD): systematic re-view and individual patient data meta-analysis. Open Heart.2019;6(2):e001017.
27. Islam SMS, Niessen LW, Ferrari U, Ali L, Seissler J, Lechner A.Effects of mobile phone SMS to ImproveGlycemic control amongpatients with type 2 diabetes in Bangladesh: a prospective, parallel-group. Randomized Control Trial Diabetes Care. 2015;2015(38):112–3.
286 Int J Diabetes Dev Ctries (2021) 41:280–287
28. Islam SMS, Peiffer R, ChowCK,Maddison R, Lechner A, Holle R,et al. Cost-effectiveness of a mobile-phone text messaging interven-tion on type 2 diabetes—a randomized-controlled trial. HealthPolicy Technol. 2020;9(1):79–85.
29. Islam SMS, Lechner A, Ferrari U, Seissler J, Holle R, LW N.Mobile phone use and willingness to pay for SMS for diabetes inBangladesh. J Public Health. 2016;38(1):163–9.
30. Islam SMS, Niessen LW, Seissler J, Ferrari U, Biswas T, Islam A,et al. Diabetes knowledge and glycemic control among patientswith type 2 diabetes in Bangladesh. SpringerPlus. 2015;4:284.
31. Islam SMS, Biswas T, Bhuiyan FA, Mustafa K, Islam A. Patients’perspective of disease and medication adherence for type 2 diabetesin an urban area in Bangladesh: a qualitative study. BMC ResNotes. 2017;10(1):131.
Publisher’s note Springer Nature remains neutral with regard to jurisdic-tional claims in published maps and institutional affiliations.
287Int J Diabetes Dev Ctries (2021) 41:280–287
ORIGINAL ARTICLE
Could the appropriate anti-diabetic therapy be mixed insulinin dialysis patients?
Vehbi Demircan1& Yaşar Yıldırım2
& Emre Aydın2& Ali Veysel Kara2 & Fatma Yılmaz Aydın3
&
Zülfükar Yılmaz2 & Ali Kemal Kadiroğlu2& Alpaslan Kemal Tuzcu4
& Zafer Pekkolay4
Received: 24 May 2020 /Accepted: 28 October 2020# Research Society for Study of Diabetes in India 2020
AbstractBackground A good glycemic regulation should be provided to reduce mortality and morbidity in patients with end-stage renalfailure due to diabetes mellitus. However, the use of insulin therapies in patients with renal failure is troublesome due to theincreased rate of side effects. In our study, we investigated the frequency of hypoglycemia and its symptoms in patient groupsreceiving intensive and mixed insulin therapies.Materials and methods This prospective study included 89 hemodialysis patients with DM-related stage 5 chronic kidneydisease who were followed up in a nephrology clinic of a university hospital between January 2013 and August 2015. Our studygroup was divided into two groups as those receiving intensive insulin therapy and mixed insulin therapy. Group 1 and group 2consisted of 46 patients and 43 patients, respectively. Hypoglycemia (glucose < 70 mg/dl) was investigated in patients withHbA1c levels that decreased below 7% after treatment, and the symptoms were evaluated according to the hypoglycemic scale.The results between the groups were evaluated using chi-square and Student’s t testResults A total of 89 patients were included in the study. HbA1c was 6.83% in the group receiving intensive insulin therapy and6.95% in the group receiving mixed insulin therapy (p > 0.05). Hypoglycemia was detected in 27 patients (58.7%) in theintensive insulin therapy group and 14 patients (32.6%) in the mixed insulin therapy group. There was a significant level ofhypoglycemia in the group receiving intensive insulin therapy (p < 0.05). In our study, the group receiving intensive insulintherapy had higher frequency and severity of common hypoglycemia symptoms such as confusion, sweating, weakness, dys-phasia, palpitations, blurred vision, and feeling hungry.Conclusion There was a higher frequency of hypoglycemia under intensive insulin therapy in patients undergoing dialysis due tochronic kidney failure, which suggests that mixed insulin therapy is the ideal treatment to avoid hypoglycemia in this group ofpatients.
Keywords Diabetesmellitus . Hypoglycemia . Insulin therapy . Dialysis . Kidney failure
Background
Type 2 diabetes mellitus is a chronic disease characterized byhyperglycemia, resulting from partial deterioration in bothinsulin resistance and secretion [1]. Type 2 DM increasesproportionally with increasing prevalence of obesity [2].This disease, which is more common today, is an importantcause of mortality and morbidity due to its complications thatdevelop over the years. Diabetic nephropathy is one of thesecomplications. Increasing prevalence of diabetes mellitus(DM) increased the frequency of follow-up of patients withdiabetic nephropathy. In fact, DM is the most common causeof end-stage renal failure in many geographical regions [3, 4].However, if blood glucose levels are not regulated after the
* Vehbi [email protected]
1 Department of Haematology—Internal Medicine, Faculty ofMedicine, Dicle University, 21280 Diyarbakır, Turkey
2 Department of Nephrology, Faculty of Medicine, Dicle University,Diyarbakır, Turkey
3 Department of Internal Medicine, Faculty of Medicine, DicleUniversity, Diyarbakır, Turkey
4 Department of Endocrinology, Faculty of Medicine, DicleUniversity, Diyarbakır, Turkey
https://doi.org/10.1007/s13410-020-00892-7
/ Published online: 10 November 2020
International Journal of Diabetes in Developing Countries (2021) 41:288–292
onset of clinical signs of kidney failure, other micro andmacrovascular complications develop or progress. Therefore,strict clinical follow-up is important in patients with diabeticnephropathy. For example, cardiovascular complications arethe major cause of mortality in patients with end-stage renalfailure due to diabetic nephropathy, thus requiring effectivetreatment modality [5]. In addition, poor control of blood sug-ar levels is associated with comorbidities such as diabetic footulcers, peripheral vascular diseases, and increased risk of in-fection [6, 7]. An effective treatment improves the patient’squality of life as well as controlling these complications.However, the kidneys, which have an important role in insulinmetabolism, are dysfunctional in end-stage kidney disease.Ultimately, complications in patients with chronic kidney dis-ease due to diabetic nephropathy make regulation of bloodsugar levels important; on the other hand, it causes difficultiesin the use of insulin for an effective therapeutic purpose.Hypoglycemia comes first among these difficulties. The in-creasing number of hypoglycemia episodes increases mortal-ity. In addition, both hypoglycemia and hypoglycemic symp-toms can prevent effective treatment and cause the patient tostop treatment [8, 9]. As the increased risk of hypoglycemiaand the symptoms of hypoglycemia affect the patient’s per-formance, it can be difficult to determine the therapeutic insu-lin dose, treatment options, and target blood glucose value.Therefore, there is no consensus regarding the follow-up ofdiabetic patients with chronic renal failure in the treatmentrecommendations reported by the diabetes study groups.Therefore, it is controversial which treatment option is better.The absence of episodes and symptoms of hypoglycemia isimportant for therapeutic choice.
We also investigated the relationship between our thera-peutic preference and the development of hypoglycemia andhypoglycemia symptoms in patients whose HbA1c levelswere kept lower than 7 through an effective treatment regi-men. Our patients were divided into two groups: mixed insulinand intensive insulin groups. Although there are many studiescomparing the superiority of these two treatment regimens toeach other in diabetic patients, there are very few literaturestudies on this subject in the population with chronic renalfailure (CRF).
Our aim in this study is to compare the presence of hypo-glycemia and the frequency of symptoms of hypoglycemiaamong preferred insulin regimens to reach target HbA1clevels in diabetic patients who develop end-stage renal failure.
Methods
This prospective study included patients with DM-relatedstage 5 chronic kidney disease who were hospitalized in anephrology clinic of a university hospital between January2013 and August 2015. Our study group was divided into
two groups: intensive insulin therapy and mixed insulin ther-apy. Intensive insulin therapy was defined as basal insulinonce a day and three doses of fast-acting insulin a day withmeals. Mixed insulin therapy was defined as fast and medium-acting insulin administered twice a day in the morning andevening. In all patients, HbA1c value was targeted to be 7% orless during at least 3 months follow-up with current treatmentprotocols. Subsequently, we evaluated the frequency of hypo-glycemia and the presence and severity of symptoms based onthe hypoglycemic scale.
In the study, group 1 consisted of patients receiving inten-sive insulin therapy with target HbA1c levels, and group 2consisted of patients receiving mixed insulin therapy. Bloodglucose levels < 70 mg/dl were accepted as hypoglycemia [9].The presence and severity of symptoms were evaluated usingthe face-to-face interview method by referring to the scale inthe study of V. Macaulay et al Based on this scale, the pres-ence of confusion, sweating, drowsiness, weakness, dizziness,difficulty in speaking, palpitations, decreased concentration,tremor, double vision, blurred vision, feeling hungry, nausea,anxiety, fatigue, tingling in the tongue, and headache werequestioned. As the severity of symptoms increased, the scoreincreased from 1 to 7 points [10].
Biochemical (Abbott C16000 Device) and hematological(Flow cytometry CELL-DYN Ruby System) analyses wereperformed. HbA1c levels were calculated using high-performance liquid chromatography (HPLC) on Agilent1100 automated system. In addition, BioSystems SA kits wereused.With this method, the normal level of HbA1c is between4.4 and 5.7%. Blood glucose levels were monitored 4 times aday using Clever Chek device and strips.
Data were analyzed using SPSS Statistics 18.0 forWindows (SPSS Inc., Chicago, IL, USA). Descriptive statis-tics for continuous variables were expressed as mean, standarddeviation, and minimum and maximum values, whereas theywere expressed as numbers and percentages for categoricalvariables. Categorical variables were compared with chi-square test, while continuous variables were compared withStudent’s t test. A p value less than 0.05 was considered sta-tistically significant.
Results
A total of 89 patients (61 female and 28 male) were includedin the study. The number of patients and hypoglycemia per-centages of the groups are shown in Table 1.
Group 1 consisted of 46 patients receiving intensive insulintherapy, whereas group 2 consisted of 43 patients receivingmixed insulin therapy. While the duration of diabetes was23.8 years in group 1, it was 23.9 years in group 2 (p >0.05). The mean age of group 1 was 58.4 years and of group2 was 62 years (p > 0.05). The rate of hypoglycemia in male
289Int J Diabetes Dev Ctries (2021) 41:288–292
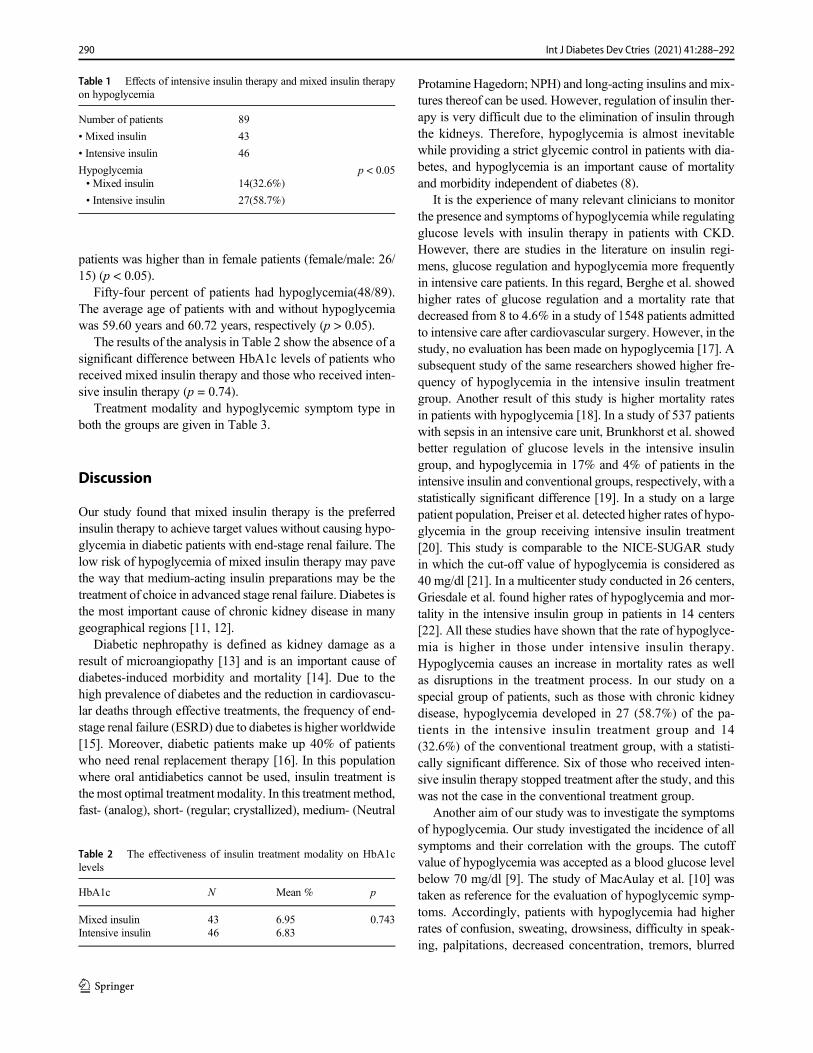
patients was higher than in female patients (female/male: 26/15) (p < 0.05).
Fifty-four percent of patients had hypoglycemia(48/89).The average age of patients with and without hypoglycemiawas 59.60 years and 60.72 years, respectively (p > 0.05).
The results of the analysis in Table 2 show the absence of asignificant difference between HbA1c levels of patients whoreceived mixed insulin therapy and those who received inten-sive insulin therapy (p = 0.74).
Treatment modality and hypoglycemic symptom type inboth the groups are given in Table 3.
Discussion
Our study found that mixed insulin therapy is the preferredinsulin therapy to achieve target values without causing hypo-glycemia in diabetic patients with end-stage renal failure. Thelow risk of hypoglycemia of mixed insulin therapy may pavethe way that medium-acting insulin preparations may be thetreatment of choice in advanced stage renal failure. Diabetes isthe most important cause of chronic kidney disease in manygeographical regions [11, 12].
Diabetic nephropathy is defined as kidney damage as aresult of microangiopathy [13] and is an important cause ofdiabetes-induced morbidity and mortality [14]. Due to thehigh prevalence of diabetes and the reduction in cardiovascu-lar deaths through effective treatments, the frequency of end-stage renal failure (ESRD) due to diabetes is higher worldwide[15]. Moreover, diabetic patients make up 40% of patientswho need renal replacement therapy [16]. In this populationwhere oral antidiabetics cannot be used, insulin treatment isthe most optimal treatment modality. In this treatment method,fast- (analog), short- (regular; crystallized), medium- (Neutral
Protamine Hagedorn; NPH) and long-acting insulins and mix-tures thereof can be used. However, regulation of insulin ther-apy is very difficult due to the elimination of insulin throughthe kidneys. Therefore, hypoglycemia is almost inevitablewhile providing a strict glycemic control in patients with dia-betes, and hypoglycemia is an important cause of mortalityand morbidity independent of diabetes (8).
It is the experience of many relevant clinicians to monitorthe presence and symptoms of hypoglycemia while regulatingglucose levels with insulin therapy in patients with CKD.However, there are studies in the literature on insulin regi-mens, glucose regulation and hypoglycemia more frequentlyin intensive care patients. In this regard, Berghe et al. showedhigher rates of glucose regulation and a mortality rate thatdecreased from 8 to 4.6% in a study of 1548 patients admittedto intensive care after cardiovascular surgery. However, in thestudy, no evaluation has been made on hypoglycemia [17]. Asubsequent study of the same researchers showed higher fre-quency of hypoglycemia in the intensive insulin treatmentgroup. Another result of this study is higher mortality ratesin patients with hypoglycemia [18]. In a study of 537 patientswith sepsis in an intensive care unit, Brunkhorst et al. showedbetter regulation of glucose levels in the intensive insulingroup, and hypoglycemia in 17% and 4% of patients in theintensive insulin and conventional groups, respectively, with astatistically significant difference [19]. In a study on a largepatient population, Preiser et al. detected higher rates of hypo-glycemia in the group receiving intensive insulin treatment[20]. This study is comparable to the NICE-SUGAR studyin which the cut-off value of hypoglycemia is considered as40 mg/dl [21]. In a multicenter study conducted in 26 centers,Griesdale et al. found higher rates of hypoglycemia and mor-tality in the intensive insulin group in patients in 14 centers[22]. All these studies have shown that the rate of hypoglyce-mia is higher in those under intensive insulin therapy.Hypoglycemia causes an increase in mortality rates as wellas disruptions in the treatment process. In our study on aspecial group of patients, such as those with chronic kidneydisease, hypoglycemia developed in 27 (58.7%) of the pa-tients in the intensive insulin treatment group and 14(32.6%) of the conventional treatment group, with a statisti-cally significant difference. Six of those who received inten-sive insulin therapy stopped treatment after the study, and thiswas not the case in the conventional treatment group.
Another aim of our study was to investigate the symptomsof hypoglycemia. Our study investigated the incidence of allsymptoms and their correlation with the groups. The cutoffvalue of hypoglycemia was accepted as a blood glucose levelbelow 70 mg/dl [9]. The study of MacAulay et al. [10] wastaken as reference for the evaluation of hypoglycemic symp-toms. Accordingly, patients with hypoglycemia had higherrates of confusion, sweating, drowsiness, difficulty in speak-ing, palpitations, decreased concentration, tremors, blurred
Table 2 The effectiveness of insulin treatment modality on HbA1clevels
HbA1c N Mean % p
Mixed insulin 43 6.95 0.743Intensive insulin 46 6.83
Table 1 Effects of intensive insulin therapy and mixed insulin therapyon hypoglycemia
Number of patients 89
• Mixed insulin 43
• Intensive insulin 46
Hypoglycemia p < 0.05• Mixed insulin 14(32.6%)
• Intensive insulin 27(58.7%)
290 Int J Diabetes Dev Ctries (2021) 41:288–292
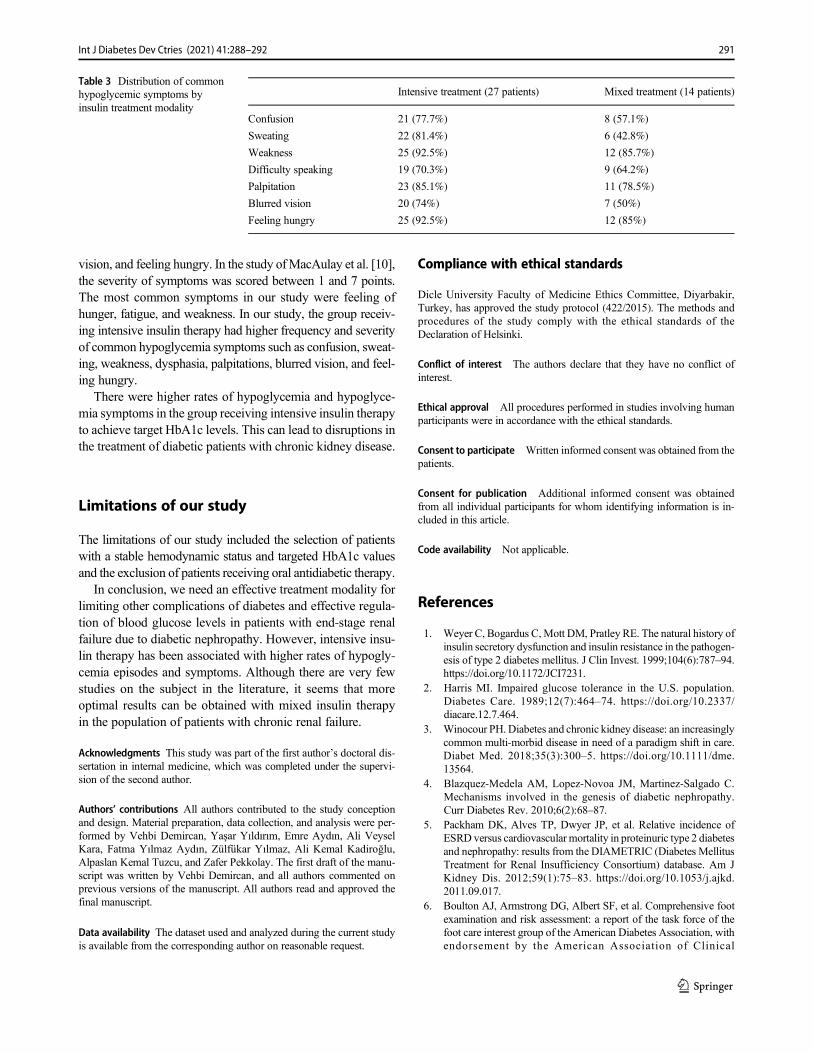
vision, and feeling hungry. In the study ofMacAulay et al. [10],the severity of symptoms was scored between 1 and 7 points.The most common symptoms in our study were feeling ofhunger, fatigue, and weakness. In our study, the group receiv-ing intensive insulin therapy had higher frequency and severityof common hypoglycemia symptoms such as confusion, sweat-ing, weakness, dysphasia, palpitations, blurred vision, and feel-ing hungry.
There were higher rates of hypoglycemia and hypoglyce-mia symptoms in the group receiving intensive insulin therapyto achieve target HbA1c levels. This can lead to disruptions inthe treatment of diabetic patients with chronic kidney disease.
Limitations of our study
The limitations of our study included the selection of patientswith a stable hemodynamic status and targeted HbA1c valuesand the exclusion of patients receiving oral antidiabetic therapy.
In conclusion, we need an effective treatment modality forlimiting other complications of diabetes and effective regula-tion of blood glucose levels in patients with end-stage renalfailure due to diabetic nephropathy. However, intensive insu-lin therapy has been associated with higher rates of hypogly-cemia episodes and symptoms. Although there are very fewstudies on the subject in the literature, it seems that moreoptimal results can be obtained with mixed insulin therapyin the population of patients with chronic renal failure.
Acknowledgments This study was part of the first author’s doctoral dis-sertation in internal medicine, which was completed under the supervi-sion of the second author.
Authors’ contributions All authors contributed to the study conceptionand design. Material preparation, data collection, and analysis were per-formed by Vehbi Demircan, Yaşar Yıldırım, Emre Aydın, Ali VeyselKara, Fatma Yılmaz Aydın, Zülfükar Yılmaz, Ali Kemal Kadiroğlu,Alpaslan Kemal Tuzcu, and Zafer Pekkolay. The first draft of the manu-script was written by Vehbi Demircan, and all authors commented onprevious versions of the manuscript. All authors read and approved thefinal manuscript.
Data availability The dataset used and analyzed during the current studyis available from the corresponding author on reasonable request.
Compliance with ethical standards
Dicle University Faculty of Medicine Ethics Committee, Diyarbakir,Turkey, has approved the study protocol (422/2015). The methods andprocedures of the study comply with the ethical standards of theDeclaration of Helsinki.
Conflict of interest The authors declare that they have no conflict ofinterest.
Ethical approval All procedures performed in studies involving humanparticipants were in accordance with the ethical standards.
Consent to participate Written informed consent was obtained from thepatients.
Consent for publication Additional informed consent was obtainedfrom all individual participants for whom identifying information is in-cluded in this article.
Code availability Not applicable.
References
1. Weyer C, Bogardus C,Mott DM, Pratley RE. The natural history ofinsulin secretory dysfunction and insulin resistance in the pathogen-esis of type 2 diabetes mellitus. J Clin Invest. 1999;104(6):787–94.https://doi.org/10.1172/JCI7231.
2. Harris MI. Impaired glucose tolerance in the U.S. population.Diabetes Care. 1989;12(7):464–74. https://doi.org/10.2337/diacare.12.7.464.
3. Winocour PH. Diabetes and chronic kidney disease: an increasinglycommon multi-morbid disease in need of a paradigm shift in care.Diabet Med. 2018;35(3):300–5. https://doi.org/10.1111/dme.13564.
4. Blazquez-Medela AM, Lopez-Novoa JM, Martinez-Salgado C.Mechanisms involved in the genesis of diabetic nephropathy.Curr Diabetes Rev. 2010;6(2):68–87.
5. Packham DK, Alves TP, Dwyer JP, et al. Relative incidence ofESRD versus cardiovascular mortality in proteinuric type 2 diabetesand nephropathy: results from the DIAMETRIC (Diabetes MellitusTreatment for Renal Insufficiency Consortium) database. Am JKidney Dis. 2012;59(1):75–83. https://doi.org/10.1053/j.ajkd.2011.09.017.
6. Boulton AJ, Armstrong DG, Albert SF, et al. Comprehensive footexamination and risk assessment: a report of the task force of thefoot care interest group of the American Diabetes Association, withendorsement by the American Association of Clinical
Table 3 Distribution of commonhypoglycemic symptoms byinsulin treatment modality
Intensive treatment (27 patients) Mixed treatment (14 patients)
Confusion 21 (77.7%) 8 (57.1%)
Sweating 22 (81.4%) 6 (42.8%)
Weakness 25 (92.5%) 12 (85.7%)
Difficulty speaking 19 (70.3%) 9 (64.2%)
Palpitation 23 (85.1%) 11 (78.5%)
Blurred vision 20 (74%) 7 (50%)
Feeling hungry 25 (92.5%) 12 (85%)
291Int J Diabetes Dev Ctries (2021) 41:288–292
Endocrinologists. Diabetes Care. 2008;31(8):1679–85. https://doi.org/10.2337/dc08-9021.
7. Abu-Ashour W, Twells LK, Valcour JE, Gamble JM. Diabetes andthe occurrence of infection in primary care: a matched cohort study.BMC Infect Dis. 2018;18(1):67. https://doi.org/10.1186/s12879-018-2975-2.
8. Seaquist ER, Anderson J, Childs B, et al. Hypoglycemia and dia-betes: a report of a workgroup of the American DiabetesAssociation and the Endocrine Society. J Clin Endocrinol Metab.2013;98(5):1845–59. https://doi.org/10.1210/jc.2012-4127.
9. Cryer PE. Preventing hypoglycaemia: what is the appropriate glu-cose alert value? Diabetologia. 2009;52:35–7.
10. McAulay V, Deary IJ and Frier NM. Department of Diabetes,Royal informary and Department of Psychology, University ofEdinburg, 2001.
11. Whicher CA, O'Neill S, Holt RIG. Diabetes in the UK: 2019.Diabet Med. 2020;37(2):242–7. https://doi.org/10.1111/dme.14225.
12. Müller N, Heller T, Freitag MH, Gerste B. at al. Healthcare utiliza-tion of people with type 2 diabetes in Germany: an analysis basedon health insurance data. Diabet Med. 2015;32(7):951–7. https://doi.org/10.1111/dme.12747.
13. Parving H-H, Osterby R, Ritz E. Diabetic nephropathy. In: BrennerBM, editor. The kidney. Philadelphia: W B Saunders; 2000. p.1731–73.
14. Magri CJ, Fava S. The role of tubular injury in diabetic nephropa-thy. Eur J Intern Med. 2009:551–5.
15. De Boer IH, Rue TC, Hall YN, Heagerty PJ, Weiss NS,Himmelfarb J. Temporal trends in the prevalence of diabetic kidneydisease in the United States. JAMA. 2011;305:2532–9.
16. Bloomgarden Zachary T, MD. Diabetic Nephropathy. DiabetesCare, (vol. 31 – no. 4): pp. 823-827, 2008.
17. Van den Berghe G, Wouters P, Weekers F, et al. Intensive insulintherapy in critically ill patients. N Engl J Med. 2001;345:1359–67.
18. Van den Berghe G, Wilmer A, Hermans G, et al. Intensive insulintherapy in the medical ICU. N Engl J Med. 2006;354:449–61.
19. Brunkhorst FM, Engel C, Bloos F, et al. Intensive insulin therapyand pentastarch resuscitation in severe sepsis. German CompetenceNetwork Sepsis (SepNet). N Engl J Med. 2008;358:125–39.
20. Praiser JC, Devos P, Ruiz Santana S, Melot C, Annane D,Groeneveld J, et al. A prospective randomised multı centre con-trolled trial on tight glucose control by intensive insülin therapy inadult intensive care unit : the glucontol study. Intensive Care Med.2009;35:1738–48.
21. Finfer S, Chittock DR, Su SY, et al. Intensive versus conventionalglucose control in critically ill patients. NICESUGAR StudyInvestigators. N Engl J Med. 2009;360:1283–97.
22. Griesdale DE, de Souza RJ, van Dam RM, et al. Intensive insulintherapy and mortality among critically ill patients: a meta-analysisincluding NICE-SUGAR study data. CMAJ. 2009;180:821–7.
Publisher’s note Springer Nature remains neutral with regard to jurisdic-tional claims in published maps and institutional affiliations.
292 Int J Diabetes Dev Ctries (2021) 41:288–292
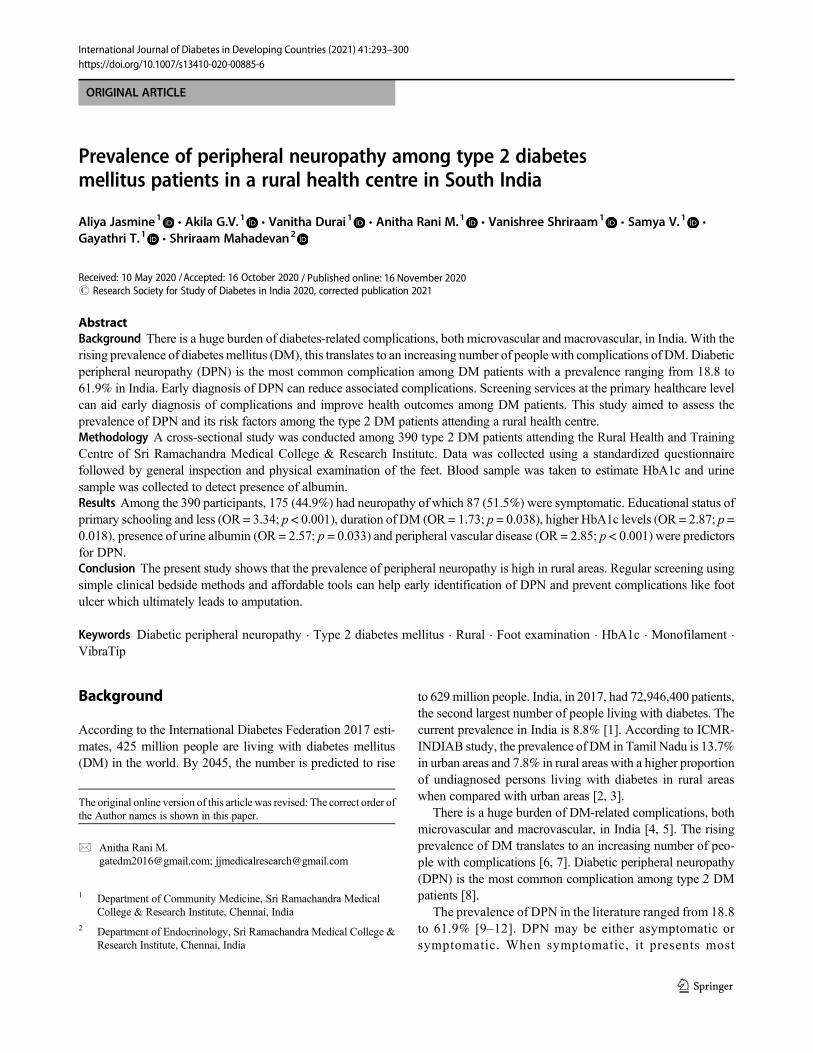
ORIGINAL ARTICLE
Prevalence of peripheral neuropathy among type 2 diabetesmellitus patients in a rural health centre in South India
Aliya Jasmine1& Akila G.V.1 & Vanitha Durai1 & Anitha Rani M.1 & Vanishree Shriraam1
& Samya V.1 &
Gayathri T.1 & Shriraam Mahadevan2
Received: 10 May 2020 /Accepted: 16 October 2020# Research Society for Study of Diabetes in India 2020, corrected publication 2021
AbstractBackground There is a huge burden of diabetes-related complications, both microvascular and macrovascular, in India. With therising prevalence of diabetesmellitus (DM), this translates to an increasing number of people with complications of DM. Diabeticperipheral neuropathy (DPN) is the most common complication among DM patients with a prevalence ranging from 18.8 to61.9% in India. Early diagnosis of DPN can reduce associated complications. Screening services at the primary healthcare levelcan aid early diagnosis of complications and improve health outcomes among DM patients. This study aimed to assess theprevalence of DPN and its risk factors among the type 2 DM patients attending a rural health centre.Methodology A cross-sectional study was conducted among 390 type 2 DM patients attending the Rural Health and TrainingCentre of Sri Ramachandra Medical College & Research Institute. Data was collected using a standardized questionnairefollowed by general inspection and physical examination of the feet. Blood sample was taken to estimate HbA1c and urinesample was collected to detect presence of albumin.Results Among the 390 participants, 175 (44.9%) had neuropathy of which 87 (51.5%) were symptomatic. Educational status ofprimary schooling and less (OR = 3.34; p < 0.001), duration of DM (OR = 1.73; p = 0.038), higher HbA1c levels (OR = 2.87; p =0.018), presence of urine albumin (OR = 2.57; p = 0.033) and peripheral vascular disease (OR = 2.85; p < 0.001) were predictorsfor DPN.Conclusion The present study shows that the prevalence of peripheral neuropathy is high in rural areas. Regular screening usingsimple clinical bedside methods and affordable tools can help early identification of DPN and prevent complications like footulcer which ultimately leads to amputation.
Keywords Diabetic peripheral neuropathy . Type 2 diabetes mellitus . Rural . Foot examination . HbA1c . Monofilament .
VibraTip
Background
According to the International Diabetes Federation 2017 esti-mates, 425 million people are living with diabetes mellitus(DM) in the world. By 2045, the number is predicted to rise
to 629 million people. India, in 2017, had 72,946,400 patients,the second largest number of people living with diabetes. Thecurrent prevalence in India is 8.8% [1]. According to ICMR-INDIAB study, the prevalence of DM in Tamil Nadu is 13.7%in urban areas and 7.8% in rural areas with a higher proportionof undiagnosed persons living with diabetes in rural areaswhen compared with urban areas [2, 3].
There is a huge burden of DM-related complications, bothmicrovascular and macrovascular, in India [4, 5]. The risingprevalence of DM translates to an increasing number of peo-ple with complications [6, 7]. Diabetic peripheral neuropathy(DPN) is the most common complication among type 2 DMpatients [8].
The prevalence of DPN in the literature ranged from 18.8to 61.9% [9–12]. DPN may be either asymptomatic orsymptomatic. When symptomatic, it presents most
The original online version of this article was revised: The correct order ofthe Author names is shown in this paper.
* Anitha Rani [email protected]; [email protected]
1 Department of Community Medicine, Sri Ramachandra MedicalCollege & Research Institute, Chennai, India
2 Department of Endocrinology, Sri Ramachandra Medical College &Research Institute, Chennai, India
https://doi.org/10.1007/s13410-020-00885-6
/ Published online: 16 November 2020
International Journal of Diabetes in Developing Countries (2021) 41:293–300
frequently with burning pain, tingling sensation and hyper-aesthesia which is distressing for the patient. About half ofthem will have no symptoms and are less likely to seekmedical care. Furthermore, primary care physicians mayalso overlook the need to do a foot examination amongthem. These asymptomatic DPN patients can only be diag-nosed on examination or when they present with a painlessfoot ulcer [13]. Foot ulcers and recurrent infections are iscommon among patients with DPN, and if not managedproperly, it eventually leads to amputation. This increasesdisability and further reduces the already impaired qualityof life among them [14]. Early diagnosis of DPN can helpreduce the high incidence of diabetic foot. Most of the am-putations among DM patients begin with ulcers. This can beprevented with appropriate foot care practices and regularscreening to assess the risk for foot complications. Hence,all DM patients should be screened for DPN at diagnosisand regularly thereafter. Besides, several studies haveshown that neuropathic symptoms can improve with opti-mization of blood sugar control and avoidance of extremeblood glucose fluctuations before any severe morbidity setsin [8].
Patients visiting this rural centre were from villages withlimited access to transportation for travel to a higher carecentre. In addition to this, most of the population are dailywage labourers. Hence, travel was a costly and burdensomeaffair for several families. The first point of contact with thehealthcare system for such a population in rural areas is aprimary health centre. Therefore, screening services at thislevel for early diagnosis can prevent complications and im-prove health outcomes. We focused on identifying patientswith DPN using simple clinical bedside methods and afford-able tools to aid diagnosis at a primary healthcare level.
The objective of this study was to assess the prevalence ofDPN among type 2 DMpatients attending a rural health centreand to identify its risk factors.
Materials and methods
Study setting
The study was conducted among type 2 DMpatients attendingthe Rural Health and Training Centre (RHTC) at Vayalanallurin Poonamallee block. The centre is owned by SriRamachandra Medical College & Research Institute and ad-ministered by the Department of Community Medicine.
All patients diagnosed with DM are registered at the centre,and a treatment card is issued for each registered patient torecord details of all the visits such as clinical examinationfindings, blood sugar values and treatment advised at eachvisit. The patients visit the centre once in a fortnight whenthe medical officer does a complete physical examination.
She then provides them with medications for 2 weeks. In caseof complications or uncontrolled blood glucose, the patientsare referred to the tertiary care centre for further evaluationand management.
Study design and population
This was a cross-sectional study conducted from January 2017to March 2017 to estimate the prevalence of DPN among type2 DM patients. This study was a part of a larger study whichenrolled all DM patients registered at the centre with regularfollow-up for the last 6 months. Gestational diabetes mellitusand type 1 diabetes mellitus patients were excluded. Newlydiagnosed type 2 DM patients were also excluded since regu-lar follow-up could not be ensured. The total number of DMpatients registered at the centre is 500. Of these, 100 were notvisiting the centre for follow-up visits regularly and 10 werenewly diagnosed, hence were excluded and the remaining 390were enrolled for the study. Of these 390, 104 were males and286 were females.
Study variables and data collection
Each patient was interviewed for approximately 30 min toobtain complete information. We used a pre-tested structuredquestionnaire to collect demographic information and to elicitsymptoms of DPN. This was followed by physical examina-tion. Anthropometric measures such as weight and heightwere measured according to the World Health Organizationguidelines. Body mass index (BMI) was calculated as a per-son’s weight in kilograms divided by the square of his heightin meters (kg/m2). The cut-off for overweight was greater thanor equal to 25 and for obesity was greater than or equal to 30[15, 16].
Blood pressure was measured, and patients with either sys-tolic blood pressure of > 140 mmHg or diastolic blood pres-sure of > 90 mmHg were diagnosed with hypertension [17,18].
A careful examination of the feet was then carried out in awell-lit room. The assessment was done under 4 categories:(a) dermatological, (b) musculoskeletal, (c) neurological and(d) vascular.
We started with an inspection of the feet which includeddermatological assessment and musculoskeletal assessment.For dermatological assessment, the feet were inspected forabsent hair, deformed nails, dry skin, fissures, ulceration,areas of erythema, old healed scars and gangrene. For muscu-loskeletal assessment, presence of wasting and deformitiessuch as claw toes, Charcot joint and prominent metatarsalheads were recorded [19].
Neurological assessment was done using 3 simple clinicaltests: (1)10-g monofilament, (2)128 Hz VibraTip and (3) an-kle reflexes.
294 Int J Diabetes Dev Ctries (2021) 41:293–300
Loss of protective sensation was determined using mono-filaments (10 g/5.07) [20, 21]. The sensation of pressure usingthe buckling 10-g monofilament was first demonstrated to thepatient on the upper arm. The sites of the foot were thenexamined by asking the patient to respond “yes” or “no”whenasked whether the monofilament is being applied to the par-ticular site; the patient was expected to recognize the percep-tion of pressure as well as identify the correct site. Areas ofcallus were avoided for testing.
VibraTip, which gives a vibratory stimulus of 128-Hztuning fork, was used to test vibration perception [22]. Itwas first demonstrated on the patient’s head and then testedon the feet.
Vibration and pressure, both, were tested on 5 areas of bothfeet: plantar surface of the distal hallux, 1st metatarsal, 5thmetatarsal, heel and dorsal surface of the foot. Inability toperceive pressure sensation or/and vibration sensation on atleast 3 of the 5 areas tested was labelled as an abnormal testresult. This was followed by testing ankle reflex using a reflexhammer with the patient resting on a couch. If a response wasinitially absent, the patient was asked to hook fingers togetherand pull, while the ankle reflex was tested again with rein-forcement. A total absence of ankle reflex either at rest or uponreinforcement was regarded as an abnormal result. Vascularexamination included palpation of the posterior tibial anddorsalis pedis pulses which was characterized as either “pres-ent” or “absent” [23, 24].
Blood investigations: the most recent fasting blood sugar(FBS) and postprandial blood sugar (PPBS) values were notedfrom the treatment card. Glycosylated hemoglobin (HbA1c)was measured for each patient using the Aina HbA1cMonitoring System, which is a smartphone-based device.This is a point-of-care testing device which measures glyco-sylated hemoglobin (HbA1c) levels using capillaryfingerstick. It has been validated at various clinical centresacross the world with comparable results to the gold standardanalysers [25]. It takes about 3 min to test and obtain the resultfor each patient. The investigators performed the test them-selves after they were trained in operating the device. HbA1clevels of > 9.5 were considered high uncontrolled sugarswhich implicate rapid progression of microvascular complica-tions. [26, 27]
A single spot urine specimen was collected from partici-pants and presence of albumin was assessed by the dipsticktest.
Operational definition
Diabetic peripheral neuropathy (DPN) was diagnosed in thepresence of the following in any one foot [19–24]:
1. Absence of ankle reflex
2. Diminished pressure sensation in at least 3 out of the 5areas tested
3. Diminished vibration perception in at least 3 out of the 5areas tested
Peripheral vascular disease (PVD) was diagnosed whenthe patient reported definitive history of intermittent claudica-tion or if one or more peripheral pulses absent in any one foot[25].
Data analysis
Data entry and analysis were done using Statistical Packagefor Social Sciences (SPSS) version 16 software after checkingfor completeness. Descriptive statistical analysis was used toanalyse the background variables. Median and range havebeen reported for quantitative variables. Frequency and per-centage are reported for qualitative variables. Using chi-square, the associations of risk factors were analysed. Theodds ratios (ORs) and their 95% confidence intervals (CIs)were computed. A p value of < 0.05 was considered to bestatistically significant. Binary logistic regression was per-formed using Backward-Wald method to find the predictorsfor occurrence of DPN. Variables and the main outcome wereentered in the logistic regression model. Adjusted odds ratio(AOR) was used to estimate the strength of the relationshipbetween DPN and the risk factors and a p value of < 0.05 wasconsidered statistically significant.
Results
The study included a total of 390 type 2 DMpatients, of which104 were males and 286 were females. The median age of thestudy participant was 56 years (IQR 50–64). Median BMI ofthe study participants was 25.88 kg/m2 (IQR 23.27–29.04). Apositive family history of DM was present among 179(45.9%) participants. Median duration since diagnosis ofDMwas 4 years (IQR 2–10). Majority of the participants wereon metformin, either alone or along with another oral hypo-glycemic agent (OHA), and only 4.6% of the participantswere on insulin along with another OHA. Details of the de-mographic characteristics are given in Table 1.
The prevalence of DPNwas 44.9%with almost equal prev-alence among males (46.2%) and females (44.4%). Amongthe study participants, pressure sensation was diminished/absent in 117 (30%) subjects, ankle reflex was absent in 90(23.1%) subjects and vibration perception was diminished/absent in 66 (16.9%) subjects (Fig. 1).
Among the study participants, 169 (43.3%) were reportedto have symptoms suggestive of DPN. Among those diag-nosed with DPN, 87 (51.5%) were symptomatic. The mostfrequently reported symptoms in this study were burning,
295Int J Diabetes Dev Ctries (2021) 41:293–300
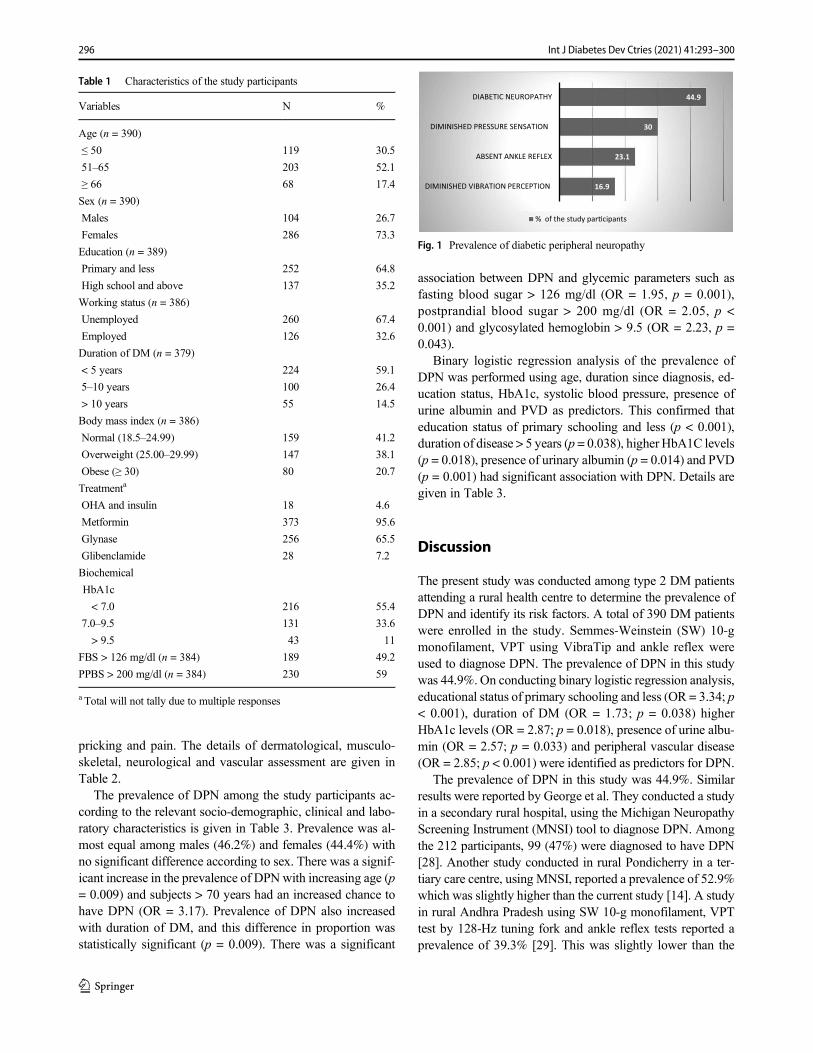
pricking and pain. The details of dermatological, musculo-skeletal, neurological and vascular assessment are given inTable 2.
The prevalence of DPN among the study participants ac-cording to the relevant socio-demographic, clinical and labo-ratory characteristics is given in Table 3. Prevalence was al-most equal among males (46.2%) and females (44.4%) withno significant difference according to sex. There was a signif-icant increase in the prevalence of DPN with increasing age (p= 0.009) and subjects > 70 years had an increased chance tohave DPN (OR = 3.17). Prevalence of DPN also increasedwith duration of DM, and this difference in proportion wasstatistically significant (p = 0.009). There was a significant
association between DPN and glycemic parameters such asfasting blood sugar > 126 mg/dl (OR = 1.95, p = 0.001),postprandial blood sugar > 200 mg/dl (OR = 2.05, p <0.001) and glycosylated hemoglobin > 9.5 (OR = 2.23, p =0.043).
Binary logistic regression analysis of the prevalence ofDPN was performed using age, duration since diagnosis, ed-ucation status, HbA1c, systolic blood pressure, presence ofurine albumin and PVD as predictors. This confirmed thateducation status of primary schooling and less (p < 0.001),duration of disease > 5 years (p = 0.038), higher HbA1C levels(p = 0.018), presence of urinary albumin (p = 0.014) and PVD(p = 0.001) had significant association with DPN. Details aregiven in Table 3.
Discussion
The present study was conducted among type 2 DM patientsattending a rural health centre to determine the prevalence ofDPN and identify its risk factors. A total of 390 DM patientswere enrolled in the study. Semmes-Weinstein (SW) 10-gmonofilament, VPT using VibraTip and ankle reflex wereused to diagnose DPN. The prevalence of DPN in this studywas 44.9%. On conducting binary logistic regression analysis,educational status of primary schooling and less (OR = 3.34; p< 0.001), duration of DM (OR = 1.73; p = 0.038) higherHbA1c levels (OR = 2.87; p = 0.018), presence of urine albu-min (OR = 2.57; p = 0.033) and peripheral vascular disease(OR = 2.85; p < 0.001) were identified as predictors for DPN.
The prevalence of DPN in this study was 44.9%. Similarresults were reported by George et al. They conducted a studyin a secondary rural hospital, using the Michigan NeuropathyScreening Instrument (MNSI) tool to diagnose DPN. Amongthe 212 participants, 99 (47%) were diagnosed to have DPN[28]. Another study conducted in rural Pondicherry in a ter-tiary care centre, using MNSI, reported a prevalence of 52.9%which was slightly higher than the current study [14]. A studyin rural Andhra Pradesh using SW 10-g monofilament, VPTtest by 128-Hz tuning fork and ankle reflex tests reported aprevalence of 39.3% [29]. This was slightly lower than the
Table 1 Characteristics of the study participants
Variables N %
Age (n = 390)
≤ 50 119 30.5
51–65 203 52.1
≥ 66 68 17.4
Sex (n = 390)
Males 104 26.7
Females 286 73.3
Education (n = 389)
Primary and less 252 64.8
High school and above 137 35.2
Working status (n = 386)
Unemployed 260 67.4
Employed 126 32.6
Duration of DM (n = 379)
< 5 years 224 59.1
5–10 years 100 26.4
> 10 years 55 14.5
Body mass index (n = 386)
Normal (18.5–24.99) 159 41.2
Overweight (25.00–29.99) 147 38.1
Obese (≥ 30) 80 20.7
Treatmenta
OHA and insulin 18 4.6
Metformin 373 95.6
Glynase 256 65.5
Glibenclamide 28 7.2
Biochemical
HbA1c
< 7.0 216 55.4
7.0–9.5 131 33.6
> 9.5 43 11
FBS > 126 mg/dl (n = 384) 189 49.2
PPBS > 200 mg/dl (n = 384) 230 59
a Total will not tally due to multiple responses
16.9
23.1
30
44.9
DIMINISHED VIBRATION PERCEPTION
ABSENT ANKLE REFLEX
DIMINISHED PRESSURE SENSATION
DIABETIC NEUROPATHY
% of the study par�cipants
Fig. 1 Prevalence of diabetic peripheral neuropathy
296 Int J Diabetes Dev Ctries (2021) 41:293–300
prevalence in the current study. A study conducted inLucknow using Neuropathy Symptom Score (NSS) andNeuropathy Disability Score (NDS) reported a prevalence of29.2%, which was lower than in this study. This could bebecause only patients diagnosed within the last 6 months wereincluded in the study. The same study though showed abnor-mal VPT using a VibraTip among 43.3% with a significantcorrelation with NDS, which is similar to our prevalence ofDPN [30]. The CURES-55 study used VibraTip for diagnosisof DPN and reported a prevalence of 26.1% [4]. This waslower than the prevalence of the current study which couldbe because the CURES-55 was a population-based study,whereas ours was a facility-based study. Our results confirma high prevalence of DPN in rural areas and are similar to theresults obtained with the use of the MNSI tool.
In the current study, the prevalence among males (46.2%)was slightly higher than among and females (44.4%) but thisdifference was not statistically significant. This was similar tofindings reported by Bansal et al., J Cazebas-Cerrato andJaved et al. [31–33], although there are studies that reportmales to be at a higher risk of developing DPN when com-pared to females [34–36].
Education of primary schooling or less was identified as arisk factor for the occurrence of DPN in this study. Van derMeer and colleague reported that DM patients with a low levelof education had worse outcomes in terms of complications
[37]. A study conducted in India reported a higher prevalenceof microvascular complications among DM patients with low-er educational status when compared to those with better ed-ucation [38]. These results support our study and can be at-tributed to the fact that individuals with higher educationalstatus are more aware of the disease and its complications.They are more likely to adopt and adhere to lifestyle modifi-cations, medications and appropriate dietary practices [39].
In the current study, high levels of HbA1c were also iden-tified as a risk factor for the presence of DPN. Ameta-analysiswas done by Liu et al. to study the risk factors for DPN whichincluded studies from China, India, Bangladesh and Kuwait.This study reported Hba1c as a risk factor for DPN [40]. Astudy by Kasper et al. reported that prolonged uncontrolledhyperglycemia has been associated with DPN and other mi-crovascular and macrovascular complications [41]. A studyby Ishibashi et al. reported tight glycemic control in newlydiagnosed type 2 DM patients can delay the occurrence ofmicrovascular complications including neuropathy and ne-phropathy [42]. This demonstrates that glycemic status influ-ences the occurrence and progression of diabetes-relatedcomplications.
The current study also reported the presence of PVD tobe a risk factor for DPN. A study conducted in Germany toassess risk factors of DPN reported that the presence ofdiabetes-related complications such as peripheral arterial
Table 2 Clinical profile of studyparticipants Symptoms of DPN N %
1. Any 1 or more symptoms 169 43.3
2. Burning 88 22.6
3. Pricking 84 21.5
4. Pain 72 18.5
5. Numbness 67 17.2
6. Tingling 35 8.9
Physical examination Right foot N (%) Left foot N (%)
A Dermatological and musculoskeletal assessment
1. Absent hair 89 (22.8) 89 (22.8)
2. Deformed nails 85 (21.8) 94 (24.1)
3. Fissured skin 78 (20) 81 (20.8)
4. Ulceration 10 (2.6) 13 (3.3)
5. Old healed scar 10 (2.6) 11 (2.8)
6. Gangrene 2 (0.5) 3 (0.8)
7. Deformities 24 (6.2)
B Neurological assessment
1. Monofilament test—pressure sensation absent/ reduced 110 (28.2) 107 (27.4)
2. Vibration test—vibration perception absent/ reduced 55 (14.1) 64 (16.4)
3. Ankle reflex—absent 81 (20.8) 85 (21.8)
C] Vascular assessment
1. Dorsalis pedis artery—pulsations absent 20(5.1) 19 (4.9)
2. Posterior tibial artery—pulsations absent 29 (7.4) 33 (8.5)
297Int J Diabetes Dev Ctries (2021) 41:293–300

disease, nephropathy and retinopathy was associated withincreased occurrence of DPN [43]. This is comparable toour results.
The current study has some limitations. Firstly, nerve con-duction studies (NCS) which is the gold standard test to diag-nose DPN could not be performed due to logistic and financialconstraints. This could have led to the underestimation ofDPN prevalence. Secondly, we did not assess other factorsresponsible for peripheral neuropathy like alcohol abuse, vi-tamin B12 deficiency, chronic inflammatory diseases, drugsand hereditary disorders [44].
The strength of this study is the use of simple, non-inva-sive, economical and quick methods to evaluate DPN. Theease to perform these bedside tests in a busy clinical settingand its availability at a low cost make them good screening
tests at a primary care level. Unfortunately, neuropathyscreening is underutilized in primary care practice.
In conclusion, this study reveals a high prevalence ofDPN among type 2 DM patients in a rural area. Almost halfof the participants with DPN had symptoms. Higher HbA1clevels and presence of urine albumin were associated withhigher risk of DPN. Using point-of-care tests for detectingurine albumin and HbA1c can help in early diagnosis.Additionally, participants who had lower educational sta-tus, higher duration of disease and presence of PVD wereat a higher risk for DPN. Presence of symptoms and riskfactors for DPN should urge the primary care physiciansto screen for DPN. Simple foot examination like inspectionof feet, testing of sensation, palpation of pulses and testingof reflexes done on a periodical basis for all diabetic patients
Table 3 Associated factors ofdiabetic peripheral neuropathyand logistic regression analysis
Variables Neuropathy OR (95% CI) p value Adjusted OR
(95% CI)
p valuePresent
No. (%)
Sex
Female 127 (44.4) 1
Male 48 (46.2) 1.07 (0.68–1.68) 0.759
Age
≤ 50 years 41(34.5) 1 0.009
51–70 years 119 (48.2) 1.77 (1.12–2.78)
> 70 years 15 (62.5) 3.17 (1.28–7.87)
Duration of diabetes mellitus
<5 years 88 (39.3) 1 1
>5 years 82 (52.9) 1.74 (1.15–2.63) 0.009 1.73 (1.03–2.92) 0.038
Education
High school and above 42 (30.7) 1 1
Primary and less 133 (52.8) 2.53 (1.63–3.92) < 0.001 3.34 (1.91–5.82) < 0.001
Tobacco use
No 164 (44) 1
Yes 11 (64.7) 2.34 (0.85–6.45) 0.093
HbA1c
< 7.0 93 (43.1) 1 1
7.0–9.5 55 (42) 0.96(0.62–1.48)
> 9.5 27 (62.8) 2.23(1.14–4.38) 0.043 2.87 (1.19–6.85) 0.018
Systolic BP
<120 45 (36) 1
120–139 97 (49) 1.71 (1.08–2.70)
≥ 140 33 (54.1) 2.09 (1.13–3.90) 0.026
Urine albumin
Absent 117 (44.5) 1 1
Present 21 (67.7) 2.62 (1.19–5.78) 0.014 2.57 (1.08–6.12) 0.033
Peripheral vascular disease (PVD)
Absent 135 (40.8) 1 1
Present 40 (67.8) 3.06 (1.69–5.51) < 0.001 3.93 (1.77–8.75) 0.001
298 Int J Diabetes Dev Ctries (2021) 41:293–300
attending primary health centres will help early diagnosisand timely management of the patients to reduce ulcerationand amputation.
Funding This study was supported by GATE–Young Faculty researchgrant of Sri Ramachandra Institute of Higher Education and Research.
Compliance with ethical standards
Conflicts of interest The authors declare that they have no conflicts ofinterest.
Ethics This study was performed in line with the principles of theDeclaration of Helsinki. The study protocol was approved by SriRamachandra Institutional Ethics Committee (Ref: IEC-NI/16/Nov/56/81). Written informed consent was obtained from all study participants.
References
1. Research E, Atlas I. IDF Diabetes Atlas. Idf.org. 2019 [cited 2019Aug 8]. Available from: https://www.idf.org/e-library/epidemiology-research/diabetes-atlas/134-idf-diabetes-atlas-8th-edition.html.
2. Anjana M, Pradeepa R, Guha R, Deepa R, Mohan D, et al.Prevalence of diabetes and pre-diabetes in urban and rural India.Phase 1 results of the Indian Council of Medical Research – IndiaDIABetes (ICMR-INDIAB) study. Diabetologia. 54:3022–7.https://doi.org/10.1007/s00125-011-2291-5.
3. Shashank RJ. Diabetes care in India. Ann Glob Health. 2015;81(6):830–8.
4. Pradeepa R, Rema M, Vignesh J, Deepa M, Deepa R, Mohan V.Prevalence and risk factors for diabetic neuropathy in an urbansouth Indian population: the Chennai Urban Rural EpidemiologyStudy (CURES-55). Diabet Med. 2008;25:407–12. https://doi.org/10.1111/j.1464-5491.2008.02397.
5. Mohan V, Deepa R, Shanthirani S, Rema M. Prevalence ofmicroalbuminuria in a selected South Indian population - theChennai Urban Population Study (CUPS). Diabetes Res ClinPract. 2000;50:261.
6. Ramachandran A, Chamukuttan S, Viswanathan V. Burden of type2 diabetes and its complications-The Indian scenario. Diab Res.2001;83.
7. Mohan V, Shah S, Saboo B. Current glycemic status and diabetesrelated complications among type 2 diabetes patients in India: datafrom the A1chieve study. J Assoc Physicians India. 2013;61(1Suppl):12–5.
8. Tesfaye S, Boulton AJ, Dyck PJ, et al. Diabetic neuropathies: up-date on definitions, diagnostic criteria, estimation of severity, andtreatments [published correction appears in Diabetes Care. 2010Dec;33(12):2725]. Diabetes Care. 2010;33(10):2285–93. https://doi.org/10.2337/dc10-1303.
9. Young MJ, Boulton AJ, MacLeod AF, Williams DR, Sonksen PH.A multicentre study of the prevalence of diabetic peripheral neu-ropathy in the United Kingdom hospital clinic population.Diabetologia. 1993;36(2):150–4. https://doi.org/10.1007/BF00400697.
10. Rani P, Raman R, Rachapalli S, Pal S, Kulothungan V, et al.Prevalence and risk factors for severity of diabetic neuropathy intype 2 diabetes mellitus. Indian J Med Sci; Mumbai. 2010;64(2):51–7. https://doi.org/10.4103/0019-5359.94400.
11. Ashok S, Ramu M, Deepa R, Mohan V. Prevalence of neuropathyin type 2 diabetic patients attending a diabetes centre in South India.J Assoc Physicians India. 2002;50:546–50.
12. Agrawal RP, Ola V, Bishnoi P, Gothwal S, Sirohi P, Agrawal R.Prevalence of micro andmacrovascular complications and their riskfactors in type-2 diabetes mellitus. J Assoc Physicians India.2014;62(6):504–8.
13. Boulton AJM, Vinik AI, Arezzo JC, Bril V, Feldman EL, FreemanR, et al. Diabetic Neuropathies. Diabetes Care. 2005;28(4):956–62.https://doi.org/10.2337/diacare.28.4.956.
14. Begum S, Venkatesan M, Ganapathy K. Foot care practices, itsbarriers and risk for peripheral neuropathy among diabetic patientsattending medical college in rural Puducherry. Int J Commun MedPubl Health. [S.l.], 2018;6(1)203–207. ISSN 2394-6040. https://doi.org/10.18203/2394-6040.ijcmph20185243. Available at:https://www.ijcmph.com/index.php/ijcmph/article/view/3747.
15 . Wor l d Hea l t h Organ i za t i on . h t t p s : / /www.who . i n t /dietphysicalactivity/media/en/gsfs_obesity.pdf. Published 2020.Accessed 29 Aug 2020.
16. WHO Expert Consultation Appropriate body-mass index for Asianpopulations and its implications for policy and intervention strate-gies. Lancet. 2004;363(9403):157–163.
17. WHO technical specifications for automated non-invasive bloodpressure measuring devices with cuff. Geneva: World HealthOrganization; 2020.
18. de Boer IH, Bangalore S, Benetos A, Davis AM, Michos ED,Muntner P, et al. Diabetes and hypertension: a position statementby the American Diabetes Association. Diab Care. 2017;40(9):1273–84. https://doi.org/10.2337/dci17-0026.
19. Boyko EJ, Ahroni JH, Cohen V, Nelson KM, Heagerty PJ.Prediction of diabetic foot ulcer occurrence using commonly avail-able clinical information: the Seattle Diabetic Foot Study. DiabetesCare. 2006;29:1202–7.
20. Mayfield JA, Reiber GE, Sanders LJ, Janisse D, Pogach LM.American Diabetes Association. Preventive foot care in people withdiabetes. Diabetes Care. 2003;26(Suppl 1):S78–9. https://doi.org/10.2337/diacare.26.2007.s78.
21. Mayfield JA, Sugarman JR. The use of the Semmes-Weinsteinmonofilament and other threshold tests for preventing foot ulcera-tion and amputation in persons with diabetes. J Fam Pract.2002;49(Suppl. 11):S17–29.
22. Young MJ, Breddy JL, Veves A, Boulton AJ. The prediction ofdiabetic neuropathic foot ulceration using vibration perceptionthresholds: a prospective study. Diabetes Care. 1994;17:557–60.
23. Boulton AJM, Armstrong DG, Albert SF, Frykberg RG, HellmanR, Kirkman MS, et al. Comprehensive foot examination and riskassessment. Diabetes Care. 2008;31(8):1679–85. https://doi.org/10.2337/dc08-9021.
24. Armstrong DG, Lavery LA, Vela SA, Quebedeaux TL, FleischliJG. Choosing a practical screening instrument to identify patients atrisk for diabetic foot ulceration. Arch Intern Med. 1998;158:289–92.
25. Aina blood monitoring system. Analytical performance summary.http://www.janacare.com/assets/pdf/LBL-AINA-13_C.pdf.Accessed 29 Aug 2020
26. Michigan Diabetes Research & Training Center. Hemoglobin A1cfact sheet. Available from http://diabetesresearch.med.umich.edu/Core_MDRC_Clinical_Hemoglobin.php. Published 2020.Accessed 22 August 2020.
27. American Diabetes Association. 6. Glycemic Targets: Standards ofMedical Care in Diabetes-2020. Diabetes Care. 2020;43(Suppl 1):S66-S76. https://doi.org/10.2337/dc20-S006.
28. George H, Rakesh P, Krishna M, et al. Foot care knowledge andpractices and the prevalence of peripheral neuropathy among peo-ple with diabetes attending a secondary care rural hospital in
299Int J Diabetes Dev Ctries (2021) 41:293–300
southern India. J Family Med Prim Care. 2013;2(1):27–32. https://doi.org/10.4103/2249-4863.109938.
29. Surendra D, Khadervali N, Khan PS, Bayapa RN, Sravana DC,Sekhar CC. Prevalence and its associated determinants of diabeticperipheral neuropathy (DPN) in individuals having type-2 diabetesmellitus in Rural South India. Indian J Community Med.2019;44(2):88–91.
30. Gill HK, Yadav SB, Ramesh V, Bhatia E. A prospective study ofprevalence and association of peripheral neuropathy in Indian pa-tients with newly diagnosed type 2 diabetes mellitus. J PostgradMed. 2014;60(3):270–5. https://doi.org/10.4103/0022-3859.138750.
31. Bansal D, Gudala K,Muthyala H, EsamHP, Nayakallu R, BhansaliA. Prevalence and risk factors of development of peripheral diabeticneuropathy in type 2 diabetes mellitus in a tertiary care setting. JDiabetes Investig. 2014;5:714–21.
32. Cabezas-Cerrato J. The Neuropathy Spanish Study Group of theSpanish Diabetes Society (SDS). Diabetologia. 1998;41:1263.https://doi.org/10.1007/s001250051063.
33. Javed A, Furqan A, Zaheer M, Kasuri N. Gender based differencesin diabetic peripheral neuropathy. Pak J Neurol Sci (PJNS).2014;9(4):6. Available at: http://ecommons.aku.edu/pjns/vol9/iss4/6.
34. Gogia S, Rao CR. Prevalence and risk factors for peripheral neu-ropathy among type 2 diabetes mellitus patients at a tertiary carehospital in coastal Karnataka. Indian J Endocr Metab. 2017;21:665–9.
35. Al-Maskari F, El-Sadig M. Prevalence of risk factors for diabeticfoot complications. BMC Fam Pract. 2007;8:59. https://doi.org/10.1186/1471-2296-8-59.
36. D'Souza M, Kulkarni V, Bhaskaran U, et al. Diabetic peripheralneuropathy and its determinants among patients attending a tertiaryhealth care centre in Mangalore, India. J Public Health Res.2015;4(2):450. Published 2015 Jul 30. https://doi.org/10.4081/jphr.2015.450.
37. Van der Meer JB, Mackenbach JP. The care and course of diabetes:differences according to level of education. Health Policy.1999;46(2):127–41.
38. Sharma N, Sharma SK, Maheshwari VD, Sharma KK, Gupta R.Association of low educational status with microvascular compli-cations in type 2 diabetes: Jaipur diabetes registry-1. Indian JEndocrinol Metab. 2015;19(5):667–72. https://doi.org/10.4103/2230-8210.163206.
39. Health 2020: Education and health through the life. World HealthOrganization; 2015. https://www.euro.who.int/__data/assets/pdf_file/0007/324619/Health-2020-Education-and-health-through-the-life-course-en.pdf?ua = 1. Accessed Aug 23 2020.
40. Liu X, Xu Y, AnM, Zeng Q. The risk factors for diabetic peripheralneuropathy: a meta-analysis. PLoS One. 2019;14(2):e0212574.https://doi.org/10.1371/journal.pone.0212574.
41. Kasper DL, Braunwald E, Fauci AS, Hauser SL, Longo DL,Jameson JL, et al., editors. 16th ed. Vol II. New York: McGrawHill, Medical Publishing Division; 1998. Harrison’s principles ofinternal medicine, pp. 2161–63.
42. Ishibashi F, Taniguchi M, Kosaka A, Uetake H, Tavakoli M.Improvement in neuropathy outcomes with normalizing HbA1c inpatients with type 2 diabetes. Diabetes Care. 2018;dc181560;https://doi.org/10.2337/dc18-156
43. Pfannkuche A, Alhajjar A, Ming A,Walter I, Piehler C, Mertens P.Prevalence and risk factors of diabetic peripheral neuropathy in adiabetics cohort: register initiative “diabetes and nerves”. EndocrMetab Sci. 2020;1(1-2):100053. https://doi.org/10.1016/j.endmts.2020.100053.
44. Hughes RA. Peripheral neuropathy. BMJ. 2002;324(7335):466–9.https://doi.org/10.1136/bmj.324.7335.466.
Publisher’s note Springer Nature remains neutral with regard to jurisdic-tional claims in published maps and institutional affiliations.
300 Int J Diabetes Dev Ctries (2021) 41:293–300
CORRECTION
Correction to: Prevalence of peripheral neuropathy among type 2diabetes mellitus patients in a rural health centre in South India
Aliya Jasmine1& G. V. Akila1 & Vanitha Durai1 & M. Anitha Rani1 & Vanishree Shriraam1
& V. Samya1 &
T. Gayathri1 & Shriraam Mahadevan2
# Research Society for Study of Diabetes in India 2021
Correction to: International Journal of Diabetes in Developing Countrieshttps://doi.org/10.1007/s13410-020-00885-6
The correct order of the Author names is shown in this paper.The original article has been corrected.
Publisher’s note Springer Nature remains neutral with regard to jurisdic-tional claims in published maps and institutional affiliations.
The online version of the original article can be found at https://doi.org/10.1007/s13410-020-00885-6
* M. Anitha [email protected]; [email protected]
1 Department of Community Medicine, Sri Ramachandra MedicalCollege & Research Institute, Chennai, India
2 Department of Endocrinology, Sri Ramachandra Medical College &Research Institute, Chennai, India
https://doi.org/10.1007/s13410-021-00925-9
Published online: 11 February 2021
International Journal of Diabetes in Developing Countries (2021) 41:301
ORIGINAL ARTICLE
Relationship of HbA1c with plasma atherogenic index and non-HDLcholesterol in patients with type 2 diabetes mellitus
Evin Bozkur1 & Ayse Esen1& Ozlem Polat2 & Yildiz Okuturlar3 & Yasemin Sefika Akdeniz1 & Hamide Piskinpasa1 &
Sema Dogansen1& Ilkay Cakir1 & Meral Mert1
Received: 9 May 2020 /Accepted: 16 October 2020# Research Society for Study of Diabetes in India 2020
AbstractPurpose Type 2 diabetes mellitus (T2DM) is a major risk factor for cardiovascular diseases (CVD). The plasma atherogenicindex (PAI) has been suggested as a novel marker of atherosclerosis and coronary heart disease. The present study is conducted toinvestigate the relationship between glycated hemoglobin (HbA1c), non-HDL (high-density lipoprotein) cholesterol, and ath-erogenic index within patients with T2DM.Materials and methods A total of 4252 patients with T2DM were screened retrospectively and parameters including glucose,HbA1c, high-density lipoprotein (HDL) cholesterol, low-density lipoprotein (LDL) cholesterol, triglyceride, TSH, age, andgender were recorded. Non-HDL cholesterol and PAI were calculated as follows:
PAI ¼ TG� HDL cholesterol
non−HDL ¼ total cholesterol−HDL cholesterol
Results Mean age was 57.06 ± 11.39 years. Mean HbA1c was 8.49 ± 1.86%, PAI ratio was 4.12 ± 3.88 mg/dl, and mean non-HDL cholesterol was 156.50 ± 45.39 mg/dl. Non-HDL cholesterol (r = 0.427; p < 0.001), HbA1c (r = 0.163; p < 0.001), andglucose (r = 0.154; p < 0.001) showed a significantly positive correlation with PAI.Conclusion Although a respectable attention is drawn to non-HDL cholesterol based on the present data, PAImay have a strongerrelationship with HbA1c in patients with T2DM. PAI may be beneficial in predicting patients who have high risk for CVD inclinical practice.
Keywords Diabetesmellitus . Non-HDL cholesterol . Plasma atherogenic index
Introduction
Type 2 diabetes mellitus (T2DM) is a prevalent chronic dis-ease that affects carbohydrate, lipid, and protein metabolismswith increasing incidence. It is accepted as a major risk factor
for cardiovascular diseases (CVD). Patients with T2DM areshown to have 2–4 times increased risk of CVD mortalitycompared to individuals without diabetes [1, 2]. Althoughpathophysiology is not fully understood, the factors like hy-pertension and dyslipidemia are thought to contribute to pro-gression of complications as well as hyperglycemia [3].
Based on these findings, current guidelines provide cleartargets for low-density lipoprotein (LDL)/high-density lipo-protein (HDL) cholesterol, triglyceride, and non-HDL choles-terol levels in patients with T2DM [4].
The plasma atherogenic index (PAI) has recently been thefocus of attention as a marker of atherosclerosis and coronaryheart disease [5–7]. There are remarkable accumulating dataabout the relationship between PAI and different groups in-cluding diabetics with not only macrovascular complicationsbut also microvascular complications. PAI may be consideredas a strong predictive marker in the early determination of
* Evin [email protected]
1 Division of Endocrinology and Metabolism, Department of InternalMedicine, BakirkoyDr. Sadi Konuk Training and Research Hospital,University of Health Sciences, Zuhuratbaba Mh, Tevfik Saglam Cd.No:11, Bakirkoy, Istanbul, Turkey
2 Department of Primary Care, Bakirkoy Dr. Sadi Konuk Training andResearch Hospital, University of Health Sciences, Istanbul, Turkey
3 Faculty of Medicine, Department of Internal Diseases, PrivateAtakent Hospital, Acibadem University, Istanbul, Turkey
https://doi.org/10.1007/s13410-020-00884-7
/ Published online: 10 November 2020
International Journal of Diabetes in Developing Countries (2021) 41:302–306
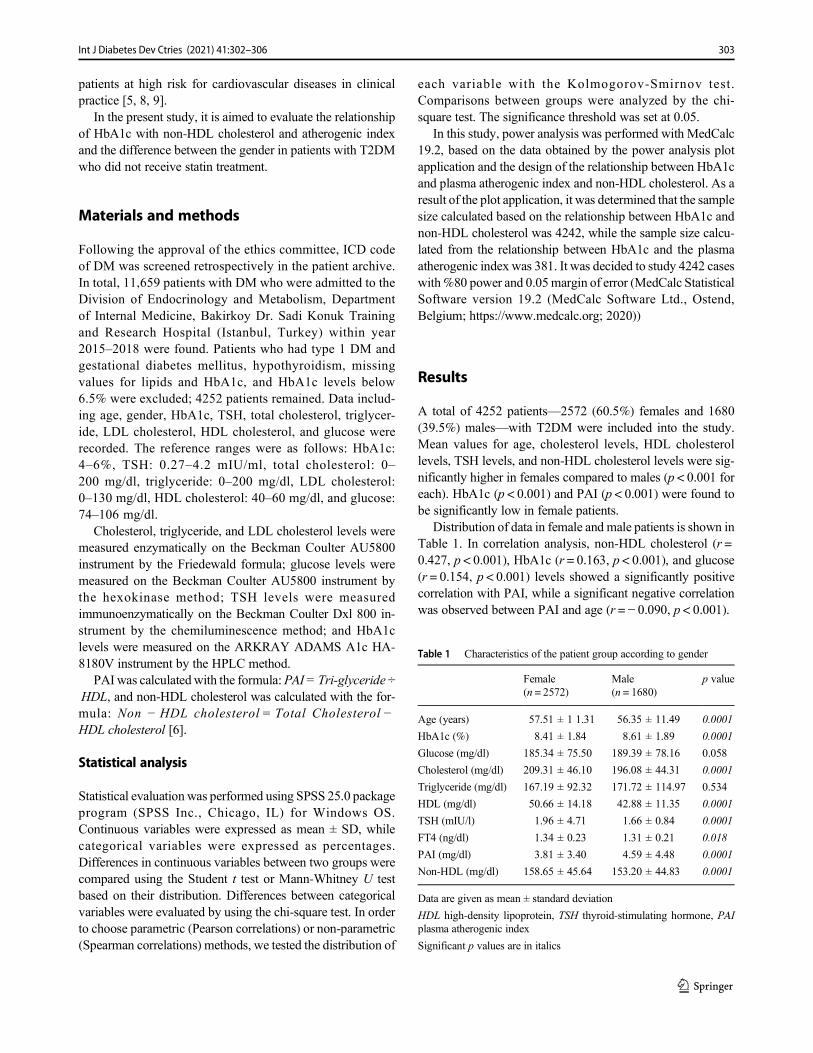
patients at high risk for cardiovascular diseases in clinicalpractice [5, 8, 9].
In the present study, it is aimed to evaluate the relationshipof HbA1c with non-HDL cholesterol and atherogenic indexand the difference between the gender in patients with T2DMwho did not receive statin treatment.
Materials and methods
Following the approval of the ethics committee, ICD codeof DM was screened retrospectively in the patient archive.In total, 11,659 patients with DM who were admitted to theDivision of Endocrinology and Metabolism, Departmentof Internal Medicine, Bakirkoy Dr. Sadi Konuk Trainingand Research Hospital (Istanbul, Turkey) within year2015–2018 were found. Patients who had type 1 DM andgestational diabetes mellitus, hypothyroidism, missingvalues for lipids and HbA1c, and HbA1c levels below6.5% were excluded; 4252 patients remained. Data includ-ing age, gender, HbA1c, TSH, total cholesterol, triglycer-ide, LDL cholesterol, HDL cholesterol, and glucose wererecorded. The reference ranges were as follows: HbA1c:4–6%, TSH: 0.27–4.2 mIU/ml, total cholesterol: 0–200 mg/dl, triglyceride: 0–200 mg/dl, LDL cholesterol:0–130 mg/dl, HDL cholesterol: 40–60 mg/dl, and glucose:74–106 mg/dl.
Cholesterol, triglyceride, and LDL cholesterol levels weremeasured enzymatically on the Beckman Coulter AU5800instrument by the Friedewald formula; glucose levels weremeasured on the Beckman Coulter AU5800 instrument bythe hexokinase method; TSH levels were measuredimmunoenzymatically on the Beckman Coulter Dxl 800 in-strument by the chemiluminescence method; and HbA1clevels were measured on the ARKRAY ADAMS A1c HA-8180V instrument by the HPLC method.
PAI was calculatedwith the formula:PAI = Tri-glyceride ÷HDL, and non-HDL cholesterol was calculated with the for-mula: Non − HDL cholesterol = Total Cholesterol −HDL cholesterol [6].
Statistical analysis
Statistical evaluation was performed using SPSS 25.0 packageprogram (SPSS Inc., Chicago, IL) for Windows OS.Continuous variables were expressed as mean ± SD, whilecategorical variables were expressed as percentages.Differences in continuous variables between two groups werecompared using the Student t test or Mann-Whitney U testbased on their distribution. Differences between categoricalvariables were evaluated by using the chi-square test. In orderto choose parametric (Pearson correlations) or non-parametric(Spearman correlations) methods, we tested the distribution of
each variable with the Kolmogorov-Smirnov test.Comparisons between groups were analyzed by the chi-square test. The significance threshold was set at 0.05.
In this study, power analysis was performed with MedCalc19.2, based on the data obtained by the power analysis plotapplication and the design of the relationship between HbA1cand plasma atherogenic index and non-HDL cholesterol. As aresult of the plot application, it was determined that the samplesize calculated based on the relationship between HbA1c andnon-HDL cholesterol was 4242, while the sample size calcu-lated from the relationship between HbA1c and the plasmaatherogenic index was 381. It was decided to study 4242 caseswith%80 power and 0.05margin of error (MedCalc StatisticalSoftware version 19.2 (MedCalc Software Ltd., Ostend,Belgium; https://www.medcalc.org; 2020))
Results
A total of 4252 patients—2572 (60.5%) females and 1680(39.5%) males—with T2DM were included into the study.Mean values for age, cholesterol levels, HDL cholesterollevels, TSH levels, and non-HDL cholesterol levels were sig-nificantly higher in females compared to males (p < 0.001 foreach). HbA1c (p < 0.001) and PAI (p < 0.001) were found tobe significantly low in female patients.
Distribution of data in female and male patients is shown inTable 1. In correlation analysis, non-HDL cholesterol (r =0.427, p < 0.001), HbA1c (r = 0.163, p < 0.001), and glucose(r = 0.154, p < 0.001) levels showed a significantly positivecorrelation with PAI, while a significant negative correlationwas observed between PAI and age (r = − 0.090, p < 0.001).
Table 1 Characteristics of the patient group according to gender
Female(n = 2572)
Male(n = 1680)
p value
Age (years) 57.51 ± 1 1.31 56.35 ± 11.49 0.0001
HbA1c (%) 8.41 ± 1.84 8.61 ± 1.89 0.0001
Glucose (mg/dl) 185.34 ± 75.50 189.39 ± 78.16 0.058
Cholesterol (mg/dl) 209.31 ± 46.10 196.08 ± 44.31 0.0001
Triglyceride (mg/dl) 167.19 ± 92.32 171.72 ± 114.97 0.534
HDL (mg/dl) 50.66 ± 14.18 42.88 ± 11.35 0.0001
TSH (mIU/l) 1.96 ± 4.71 1.66 ± 0.84 0.0001
FT4 (ng/dl) 1.34 ± 0.23 1.31 ± 0.21 0.018
PAI (mg/dl) 3.81 ± 3.40 4.59 ± 4.48 0.0001
Non-HDL (mg/dl) 158.65 ± 45.64 153.20 ± 44.83 0.0001
Data are given as mean ± standard deviation
HDL high-density lipoprotein, TSH thyroid-stimulating hormone, PAIplasma atherogenic index
Significant p values are in italics
303Int J Diabetes Dev Ctries (2021) 41:302–306
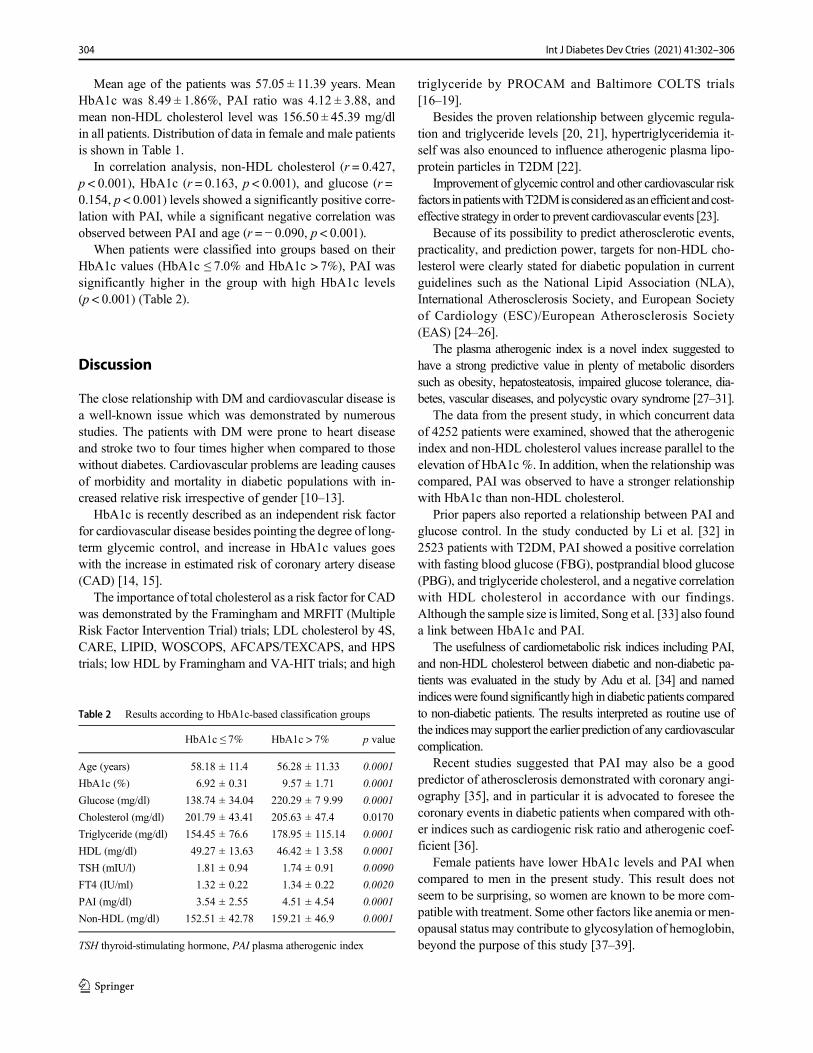
Mean age of the patients was 57.05 ± 11.39 years. MeanHbA1c was 8.49 ± 1.86%, PAI ratio was 4.12 ± 3.88, andmean non-HDL cholesterol level was 156.50 ± 45.39 mg/dlin all patients. Distribution of data in female and male patientsis shown in Table 1.
In correlation analysis, non-HDL cholesterol (r = 0.427,p < 0.001), HbA1c (r = 0.163, p < 0.001), and glucose (r =0.154, p < 0.001) levels showed a significantly positive corre-lation with PAI, while a significant negative correlation wasobserved between PAI and age (r = − 0.090, p < 0.001).
When patients were classified into groups based on theirHbA1c values (HbA1c ≤ 7.0% and HbA1c > 7%), PAI wassignificantly higher in the group with high HbA1c levels(p < 0.001) (Table 2).
Discussion
The close relationship with DM and cardiovascular disease isa well-known issue which was demonstrated by numerousstudies. The patients with DM were prone to heart diseaseand stroke two to four times higher when compared to thosewithout diabetes. Cardiovascular problems are leading causesof morbidity and mortality in diabetic populations with in-creased relative risk irrespective of gender [10–13].
HbA1c is recently described as an independent risk factorfor cardiovascular disease besides pointing the degree of long-term glycemic control, and increase in HbA1c values goeswith the increase in estimated risk of coronary artery disease(CAD) [14, 15].
The importance of total cholesterol as a risk factor for CADwas demonstrated by the Framingham and MRFIT (MultipleRisk Factor Intervention Trial) trials; LDL cholesterol by 4S,CARE, LIPID, WOSCOPS, AFCAPS/TEXCAPS, and HPStrials; low HDL by Framingham and VA-HIT trials; and high
triglyceride by PROCAM and Baltimore COLTS trials[16–19].
Besides the proven relationship between glycemic regula-tion and triglyceride levels [20, 21], hypertriglyceridemia it-self was also enounced to influence atherogenic plasma lipo-protein particles in T2DM [22].
Improvement of glycemic control and other cardiovascular riskfactors inpatientswithT2DMisconsideredasanefficientandcost-effective strategy in order to prevent cardiovascular events [23].
Because of its possibility to predict atherosclerotic events,practicality, and prediction power, targets for non-HDL cho-lesterol were clearly stated for diabetic population in currentguidelines such as the National Lipid Association (NLA),International Atherosclerosis Society, and European Societyof Cardiology (ESC)/European Atherosclerosis Society(EAS) [24–26].
The plasma atherogenic index is a novel index suggested tohave a strong predictive value in plenty of metabolic disorderssuch as obesity, hepatosteatosis, impaired glucose tolerance, dia-betes, vascular diseases, and polycystic ovary syndrome [27–31].
The data from the present study, in which concurrent dataof 4252 patients were examined, showed that the atherogenicindex and non-HDL cholesterol values increase parallel to theelevation of HbA1c %. In addition, when the relationship wascompared, PAI was observed to have a stronger relationshipwith HbA1c than non-HDL cholesterol.
Prior papers also reported a relationship between PAI andglucose control. In the study conducted by Li et al. [32] in2523 patients with T2DM, PAI showed a positive correlationwith fasting blood glucose (FBG), postprandial blood glucose(PBG), and triglyceride cholesterol, and a negative correlationwith HDL cholesterol in accordance with our findings.Although the sample size is limited, Song et al. [33] also founda link between HbA1c and PAI.
The usefulness of cardiometabolic risk indices including PAI,and non-HDL cholesterol between diabetic and non-diabetic pa-tients was evaluated in the study by Adu et al. [34] and namedindiceswere found significantly high in diabetic patients comparedto non-diabetic patients. The results interpreted as routine use ofthe indicesmay support the earlier prediction of any cardiovascularcomplication.
Recent studies suggested that PAI may also be a goodpredictor of atherosclerosis demonstrated with coronary angi-ography [35], and in particular it is advocated to foresee thecoronary events in diabetic patients when compared with oth-er indices such as cardiogenic risk ratio and atherogenic coef-ficient [36].
Female patients have lower HbA1c levels and PAI whencompared to men in the present study. This result does notseem to be surprising, so women are known to be more com-patible with treatment. Some other factors like anemia or men-opausal status may contribute to glycosylation of hemoglobin,beyond the purpose of this study [37–39].
Table 2 Results according to HbA1c-based classification groups
HbA1c ≤ 7% HbA1c > 7% p value
Age (years) 58.18 ± 11.4 56.28 ± 11.33 0.0001
HbA1c (%) 6.92 ± 0.31 9.57 ± 1.71 0.0001
Glucose (mg/dl) 138.74 ± 34.04 220.29 ± 7 9.99 0.0001
Cholesterol (mg/dl) 201.79 ± 43.41 205.63 ± 47.4 0.0170
Triglyceride (mg/dl) 154.45 ± 76.6 178.95 ± 115.14 0.0001
HDL (mg/dl) 49.27 ± 13.63 46.42 ± 1 3.58 0.0001
TSH (mIU/l) 1.81 ± 0.94 1.74 ± 0.91 0.0090
FT4 (IU/ml) 1.32 ± 0.22 1.34 ± 0.22 0.0020
PAI (mg/dl) 3.54 ± 2.55 4.51 ± 4.54 0.0001
Non-HDL (mg/dl) 152.51 ± 42.78 159.21 ± 46.9 0.0001
TSH thyroid-stimulating hormone, PAI plasma atherogenic index
304 Int J Diabetes Dev Ctries (2021) 41:302–306
The present study may contribute to the efforts in order todetermine a practicable, cost-effective clinical tool for earlierprediction of cardiovascular diseases. Although this is one ofthe largest studies by sample size to our knowledge, it was aretrospective study, and detailed information could not be ob-tained for duration of diabetes, cardiovascular history, historyof tobacco/alcohol use, and history of drug use. Comparisonwith the non-diabetic patient group was not performed.Prospect ive studies including control groups arerecommended.
Limitations of the study
As this was a retrospective study, detailed information couldnot be obtained for duration of diabetes, cardiovascular histo-ry, history of tobacco/alcohol use, and history of drug use.Comparison with the non-diabetic patient group was notperformed.
Authors’ contributions EB has made substantial contributions to the con-ception and design. AE, OP, YSA, HP, SD, and IC have made contribu-tions to the acquisition of data. YO has made contributions to analysis andinterpretation of data. EB, MM, and IC have given final approval of theversion to be published.
Compliance with ethical standards
Conflict of interest The authors declare that they have no conflict ofinterest.
Ethical approval This study was approved by the İstanbul SBU,Bakirkoy, Dr. Sadi Konuk SUAM Ethical Committee.
References
1. Sarwar N, Gao P, Seshasai SRK, et al. Diabetes mellitus, fastingblood glucose concentration, and risk of vascular disease: a collab-orative meta-analysis of 102 prospective studies. Lancet.2010;375(9733):2215–22. https://doi.org/10.1016/S0140-6736(10)60484-9.
2. Laakso M. Hyperglycemia and cardiovascular disease in type 2diabetes. Diabetes. 1999;48(5):937–42.
3. Vergès B. Pathophysiology of diabetic dyslipidaemia: where arewe? Affiliations expand. https://doi.org/10.1007/s00125-015-3525-8
4. The Society of Endocrinology and Metabolism of Turkey (SEMT)Clinical practice guideline for diagnosis, treatment and follow-up ofdiabetes mellitus and its complications – 2019.
5. Nwagha UI, Ikekpeazu EJ, Ejezie FE, Neboh EE, Maduka IC.Atherogenic index of plasma as useful predictor of cardiovascularrisk among postmenopausal women in Enugu, Nigeria. Afr HealthSci. 2010;10(3):248–52.
6. Dobiásová M, Frohlich J. The plasma parameter log (TG/HDL-C)as an atherogenic index: correlation with lipoprotein particle sizeand esterification rate in apoB-lipoprotein-depleted plasma (FERHDL). Clin Biochem. 2001;34:583–8.
7. Frohlich J, Dobiásová M. Fractional esterification rate of cholester-ol and ratio of triglycerides to HDL-cholesterol are powerful pre-dictors of positive findings on coronary angiography. Clin Chem.2003;49(11):1873–80.
8. Sharma S, Bhardwaj S, Jangir S, Gupta B. Influence of yoga onstatus of lipid indices in type 2 diabetes mellitus subjects. Int JDiabetes Dev Ctries. 2020.
9. Cai G, Shi G, Xue S, Lu W. The atherogenic index of plasma is astrong and independent predictor for coronary artery disease in theChinese Han population. Medicine. 2017;96(37):e8058.
10. Matheus AS, Tannus LR, Cobas RA, Palma CC, Negrato CA,Gomes MB. Impact of diabetes on cardiovascular disease: an up-date. Int J Hypertens. 2013;2013:653789.
11. Centers for Disease Control and Prevention. National diabetes factsheet: national estimates and general information on diabetes andprediabetes in the United States. Atlanta; 2011.
12. Centers for Disease Control and Prevention. National diabetes sta-tistics report: estimates of diabetes and its burden in the UnitedStates, 2014. Atlanta: US Department of Health and HumanServices; 2014.
13. Rivellese AA, Riccardi G, Vaccaro O. Cardiovascular risk in wom-en with diabetes. Nutr Metab Cardiovasc Dis. 2010;20:474–80.
14. Selvin E, Marinopoulos S, Berkenblit G, Rami T, Brancati FL,Powe NR.Meta-analysis : glycosylated hemoglobin and cardiovas-cular disease in diabetes mellitus. Ann Intern Med. 2004;14:421–314.
15. The Diabetes Control and Complications Trial -implications forpolicy and practice. N Eng J Med. 1993;329(14):1035–36.
16. Denke MA, Sempos CT, Grundy SM. Excess body weight: anunderrecognized contributor to high blood cholesterol levels inwhite American men. Arch Intern Med. 1993;153:1093–103.
17. Garrison RJ, Wilson PW, Castelli WP, Feinleib M, Kannel WB,McNamara PM. Obesity and lipoprotein cholesterol in theFramingham Offspring Study. Metabolism. 1980;29:1053–60.
18. Stern MP, Haffner SM. Body fat distribution and hyperinsulinemiaas risk factors for diabetes and cardiovasculardisease.Arteriosclerosis. 1986;6:123–30.
19. Berchtold P, Berger M, Jorgens V, Daweke C, Chantelau E, GriesFA, et al. Cardiovascular risk factors and HDL-cholesterol levels inobesity. Int J Obes. 1981;5:1–10.
20. Mudhaffar SK. Atherogenic index of plasma (AIP) as a parameterin predicting cardiovascular risk in males compared to the conven-tional dyslipidemic indices (cholesterol ratios) Karbala. J Med.2013;6(1):1506–13.
21. Hartopo AB, Arso IA, Setianto BY. Low plasma atherogenic indexassociated with poor prognosis in hospitalized patients with acutemyocardial infarction. Acta Med Indones. 2016;48(2):106–13.
22. Guérin M, Le Goff W, Lassel TS, Van Tol A, Steiner G, ChapmanMJ. Arterioscler Thromb Vasc Biol. 2001;21(2):282–8.
23. Stratton IM, Adler AI, Neil HAW, et al. Association of glycaemiawith macrovascular and microvascular complications of type 2 di-abetes (UKPDS 35): prospective observational study. BMJ. https://doi.org/10.1136/bmj.321.7258.405
24. Expert Dyslipidemia Panel of the International AtherosclerosisSociety Panel members. An International Atherosclerosis Societyposition paper: global recommendations for the management ofdyslipidemia – full report. J Clin Lipidol. 2014;8:29–60.
25. Catapano AL, Graham I, De Backer G, et al. Authors/ Task ForceMembers. 2016 ESC/EAS guidelines for the management ofdyslipidaemias. Eur Heart J. 2016;37:2999–3058.
26. Sanin V, Pfetsch V, Koenig W. Dyslipidemias and cardiovascularprevention: tailoring treatment according to lipid phenotype. CurrCardiol Rep. 2017;19:61.
27. Shen SW, Lu Y, Li F, Yang CJ, Feng YB, Li HW, et al.Atherogenic index of plasma is an effective index for estimating
305Int J Diabetes Dev Ctries (2021) 41:302–306
abdominal obesity. Lipids Health Dis. 2018;17(1):11. https://doi.org/10.1186/s12944-018-0656-1.
28. Wang Q, Zheng D, Liu J, Fang L, Li Q. Atherogenic index ofplasma is a novel predictor of non-alcoholic fatty liver disease inobese participants: a cross-sectional study. Lipids Health Dis.2018;17(1):284.
29. Zhu XW, Deng FY, Lei SF. Meta-analysis of atherogenic index ofplasma and other lipid parameters in relation to risk of type 2 dia-betes mellitus RSS Download PDF Primary Care Diabetes, 2015-02-01. 9(1)60–7.
30. Fernández-Macías JC, Ochoa-Martínez AC, Varela-Silva JA,Pérez-Maldonado IN. Atherogenic index of plasma: novel predic-tive biomarker for cardiovascular illnesses. Arch Med Res. 2019Jul;50(5):285–94.
31. Guelker JE, Bufe A, Blockhaus C, Kroeger K, Rock T, Akin I,Behnes M, Mashayekhi K. The atherogenic index of plasma andits impact on recanalization of chronic total occlusion. Cardiol J.2018. https://doi.org/10.5603/CJ.a2018.0064
32. Li Z, Huang Q, Sun L, Bao T, Dai Z. Atherogenic Index in Type 2Diabetes and Its Relationship with Chronic MicrovascularComplications. Int J Endocrinol. https://doi.org/10.1155/2018/1765835
33. Song P, Xu L, Xu J, Zhang HQ, Yu CX, Guan QB, et al. Atherogenicindex of plasma is associated with body fat level in type 2 diabetesmellitus patients. CurrVasc Pharmacol. 2018;16(6):589–95. https://doi.org/10.2174/1570161116666180103125456.
34. Adu EM, et al. Assessment of cardiovascular risk indices in type 2diabetes mellitus. Trop Med Surg. 2015;3:2. https://doi.org/10.4172/2329-9088.1000184.
35. Dobiásová M, Frohlich J, Sedová M, Cheung MC, Brown BG.Cholesterol esterification and atherogenic index of plasma correlatewith lipoprotein size and findings on coronary angiography. J LipidRes. 2011;52(3):566–71.
36. DobiásováM, Urbanová Z, SamánekM. Relations between particlesize of HDL and LDL lipoproteins and cholesterol esterificationrate. Physiol Res. 2005;54(2):159–65.
37. Yang YC, Lu FH, Wu JS, Chang CJ. Age and sex effects onHbA1c. A study in a healthy Chinese population. Diab Care.1997;20:988–91.
38. Yates AP, Laing I. Age-related increase in haemoglobin A1c andfasting plasma glucose is accompanied by a decrease in beta cellfunction without change in insulin sensitivity: evidence from across-sectional study of hospital personnel. Diabet Med. 2002;19:254–8.
39. Karar T, Alhammad RI, FattahMA, Alanazi A, Qureshi S. Relationbetween glycosylated hemoglobin and lipid and thyroid hormoneamong patients with type 2 diabetes mellitus at King AbdulazizMedical City, Riyadh. J Nat Sci Biol Med. 2015;6(Suppl 1):S75–9.
The sample sizes are very limited in the previous studies that investigatethe correlation between PAI and glucose and HbA1c levels. The datagained with this study show that the atherogenic index and non-HDLcholesterol values increase with the elevated levels of HbA1c. Althoughnon-HDL cholesterol is paid more attention in clinical practice, PAI mayhave a stronger relationship with HbA1c in diabetic patients. Payingenough attention to PAI may be beneficial for long-term cardiovascularrisk management in diabetic patients.
Publisher’s note Springer Nature remains neutral with regard to jurisdic-tional claims in published maps and institutional affiliations.
306 Int J Diabetes Dev Ctries (2021) 41:302–306
ORIGINAL ARTICLE
Investigating the relationship between myocardial infarctionand the ratio of glycated albumin to glycated hemoglobin in patientsadmitted to cardiac ward
Hossein Sadeghi1 & Elaheh Monazah2& Asghar Tavan3
& Gholamreza Yousefzadeh4& Mina Naderi5 & Asie Sadeghi6 &
Nadia Sedri7
Received: 15 May 2020 /Accepted: 16 October 2020# Research Society for Study of Diabetes in India 2020
AbstractIntroduction Diabetes mellitus is an associated risk factor for coronary artery disease (CAD). There is a growing interest inmyocardial infarction (MI) to better understand the relationship between hyperglycemia and CVD. Glycated hemoglobin(HbA1c) is the standard measure for assessing glucose regulation in diabetes mellitus and an indicator of potential cardiovascularrisk and exposure to glucose concentrations over a duration of approximately 3 months. Glycated albumin (GA) may be usefulfor evaluating hyperglycemia in settings in which HbA1c screening is problematic or inaccessible. Another indicator that hasbeen considered recently is the GA/HbA1c ratio. The goal of this study was to investigate the relationship between GA/HbA1cand the presence of MI and identify the sugar fluctuations as a suitable indicator for early screening and prevention of MI.Methods This was a case-control study of diabetic patients with MI and patients with type 2 diabetes with no history of heartproblems. Each group consisted of 117 participants (117 cases and 117 controls), and the total number of participants was 234.The data collection tools included laboratory tests and a demographic questionnaire. Each patient was assigned to either the caseor the control group in a simple and convenient way and the relationship between MI and the GA/HbA1c ratio was investigated.Results The findings of this study indicated that the ratio of glycated albumin to glycated hemoglobin was higher in the casegroup with MI than the control group (p = 0.001). To achieve the objectives of the study, descriptive statistics and the Mann-Whitney test were used to analyze the data.Conclusion This study revealed the relationship between MI and the GA/HbA1c ratio. It can be said that prior to the occurrenceof MI, blood glucose levels are a good indicator of recent glucose fluctuations, as well as the prediction and occurrence of MI.Therefore, the improved control of blood sugar and avoidance of high fluctuation may prevent MI from occurring.
Keywords Myocardial infarction .MI .Coronary arterydisease .CAD .Glycated albuminGA .Glycatedhemoglobin .HbA1c .
GA/HbA1c ratio . Diabetesmellitus . Iran
* Nadia [email protected]
Hossein [email protected]
Elaheh [email protected]
Asghar [email protected]
Gholamreza [email protected]
Mina [email protected]
Asie [email protected]
1 Cardiovascular Research Center, Institute of Basic and ClinicalPhysiology Sciences, Kerman University of Medical Sciences,Kerman, Iran
2 Endocrinology andMetabolismResearch Center, KermanUniversityof Medical Sciences, Kerman, Iran
3 Nursing Research Center, Razi Nursing and Midwifery Faculty,Kerman University of Medical Sciences, Kerman, Iran
4 Endocrinology and Metabolism Research Center, Institute of Basicand Clinical Physiology Sciences, Kerman University of MedicalSciences, Kerman, Iran
5 Cardiovascular Research Center, Kerman University of MedicalSciences, Kerman, Iran
6 Department of Clinical Biochemistry, Kerman University of MedicalSciences, Kerman, Iran
7 Nursing Research Center, Zarand Faculty of Nursing, KermanUniversity of Medical Sciences, Kerman, Iran
https://doi.org/10.1007/s13410-020-00883-8
/ Published online: 31 October 2020
International Journal of Diabetes in Developing Countries (2021) 41:307–313
Introduction
Diabetes mellitus (DM) is a chronic and metabolic diseasecharacterized by hyperglycemia which occurs as a conse-quence of severe insulin insufficiency or conditions that maycontribute to increased mortality and morbidity by affectingmultiple processes [1]. The International Diabetes Federation(IDF) reports that one in eleven adults has DM, totaling about415 million individuals, 193 million of which have not yetbeen diagnosed [2].
The main goal of diabetes treatment is to avoid the devel-opment and progression of chronic diabetic complications [3].Coronary artery disease (CAD) is one of the important com-plications associated with diabetes. Glucose metabolism ab-normalities and blood glucose levels are considered a contin-uous risk factor for cardiovascular diseases (CVDs) [4].Clinical studies have revealed that atherosclerosis, a chronicinflammatory process, is activated at the early stage ofhyperglycemia—when the level of glycemia is not sufficientlyhigh to indicate diabetes—rather than the next stages in whichthe diagnosis of diabetes is confirmed [3].
One of the most important factors in the pathophysiologyof diabetes is the role of non-enzymatic glycosylation of pro-teins, which has been shown by several reports [5].Glycosylated proteins also affect metabolic control and path-ogenesis of the complications of diabetes. In diabetes, theconcentration of glycosylated albumin (GA) and advancedglycation end-products (AGE) increases. Serum albumin isone of the important proteins which undergoes the non-enzymatic glycosylated process [6]. According to recent stud-ies, the lack of blood glucose control and glucose fluctuationsincrease the risk of CVD and cause most of the deaths inpatients with type 2 diabetes [7].
There is a growing interest in acute myocardial infarction(AMI) as an acute coronary syndrome (ACS) to better under-stand the relationship between hyperglycemia and CVD. Oneof the ways to reduce the risk of MI in diabetic patients is bypreventing glucose fluctuations [8]. There are some standardglycemic markers such as glycated hemoglobin A1c (HbA1c)and non-traditional glycemic markers including glycated al-bumin (GA); the ratio of GA to HbA1c (GA/HbA1c) candetermine the blood glucose levels in CAD patients at differ-ent times [9]. HbA1c, as a standard glycemic marker, repre-sents exposure to glucose concentrations over a duration ofapproximately 3 months, has long been used to monitor gly-cemic control in patients with DM [10], and is recommendedas a guide for the treatment of DM [11].
Moreover, HbA1c was recognized as a marker to evaluatethe secondary vascular complications such as MI, resultingfrom metabolic incidents in diabetic patients [12]. A meta-analysis study has shown the relationship between CVD andthe increase of HbA1c in type 2 diabetes [13]. However,HbA1c has significant limitations; for instance, it does not
change rapidly in response to the treatment changes, so ithas been known as a long-term glycemic marker. There is avariety of conditions that affect the reliability of the test resultand its accuracy, such as anemia, kidney disease, liver disease,and irregular hemoglobin types [14].
In addition, glycemic variability is not identified by theHbA1c test. Moreover, analysis of the data on the diabetesprevention program revealed the existence of ethnic heteroge-neity in HbA1c tests in patients with diabetes [6]. In severalcountries, including India, HbA1c has shown insufficient pre-dictive accuracy in diagnosing diabetes, and there is no opin-ion on the acceptable reference line of HbA1c for the diagno-sis of diabetes in this high-risk population [12]. All these lim-itations increase the probability that HbA1c might not be theonly glycemic control marker to reveal the cardiovascularcomplications of diabetes [15].
GA is the second glycemic biomarker, and is one of thefructosamines that is used less often than HbA1c, but can bemeasured in serum or plasma; it is useful for evaluating hy-perglycemia in settings in which HbA1c screening is inacces-sible or unreliable [10], or for monitoring the short-term glu-cose control changes in patients [6], because GA (glucosewhich is specifically bound to albumin) reflects the glycemiccontrol over the past 10–14 days [6] which is due to the shorterhalf-life of serum albumin circulation (17 days) [16]. Theresults of some studies have shown that following the additionof recognized and equivalent glucose concentrations, GA pro-duction was approximately 4.5 times higher than HbA1c, soGA is produced quicker than HbA1c [17]. This increases GAsensitivity to rapid fluctuations in glucose levels which maynot be detected efficiently with an independent plasma glu-cose measurement [18]. In contrast, HbA1c does not showrapid changes [14]. Hyperglycemia results in the productionof GA through the non-enzymatic attachment of glucose mol-ecules to the free primary amine residues which eventuallyleads to the production of AGE compounds [19]. GA alsohas a significant role in the diagnosis of acute cardiac compli-cations of diabetes. Regarding the prediction of CAD severity,several studies have shown that GA is preferable to HbA1c inpatients with type 2 diabetes for assessing the degree of CADprogression [20].
GA levels are not altered by anemia, chronic kidney dis-ease, pregnancy, or variant hemoglobin; however, in certaincases including infancy, hyperthyroidism, and nephrotic syn-drome, abnormally lowGA levels can occur [21]. Abnormallyelevated concentrations of GA can result in liver and hypo-thyroid cirrhosis [22]. Furthermore, there is a similar relation-ship between GA and BMI, such that the GA levels are low inobese individuals and elevated in thin individuals [23].
Total glycated proteins are an indicator of glycemic controland have been suggested as a valuable method for diagnosingdiabetes, assessing the appropriate diabetes treatment, andeven predicting the risk of comorbidities including CADs
308 Int J Diabetes Dev Ctries (2021) 41:307–313
such as ACS. Though HbA1c indicates the glycemic controlover a long period of time, it does not accurately reflect gly-cemic control in situations with rapid changes in the lifetimeof red cells. In addition, in hematologic disorders such asanemia and hemoglobin variants, HbA1c becomes abnormal.The Diabetes Management and Complication Trial (DCCT)suggested that HbA1c alone did not sufficiently describe theoccurrence of CVD.
HbA1c may not be a sensitive marker of glycemic fluctu-ation [16]; however, GA is not affected by the changes inerythrocytes’ lifetime and can be a good marker of rapid glu-cose fluctuations [21]. Despite all the advantages of GA, itdoes not replace the use of HbA1c, since every test has itsbenefits and limitations. Therefore, to predict the complicationof diabetes, both glycated protein markers can be good glyce-mic controls, when used together [24].
Another indicator that has recently been considered is theGA/HbA1c ratio. This ratio increases with the decrease of thebase function of B cells. A relationship has also been foundbetween this ratio and the ratio of fasting C-peptide immuno-reactivity (FCPR) to fasting plasma glucose (FPG) (FCPR in-dex) in type 2 diabetes. On this basis, it can be assumed that theGA/HbA1c ratio can perform better as a clinical marker ofblood glucose changes [25]. Since postprandial hyperglycemiais shown to be associated with cardiovascular mortality, thefactors causing postprandial glucose excursions need to be in-vestigated [26]. Recently, there has been much interest in usingan indicator of glycemic status to assess the extent of acuteCAD [21]. SerumGA in glucose excursions is a more sensitivemarker than HbA1c. According to this mechanism, which in-cludes marked fluctuations in plasma glucose levels, the GA/HbA1c ratio can be a good marker to show recent fluctuationsin diabetic patients [26]. ACS, such as MI, is one of the com-mon cardiovascular complications of diabetes, which increasestreatment costs and mortality [15], so it is better to find a pre-vention method for more accurate and earlier recognition.Between these glycated indicators, the GA/HbA1c ratio canbe a suitable indicator to identify glucose fluctuations of thepast 2 weeks, which is equivalent to the half-life of albumin[24], for the screening and prevention of MI. Nonetheless, fewstudies have compared the relationship between MI and theratio of GA to HbA1c in patients, at the same time.
The aim of this study was to investigate the relationshipbetween the GA/HbA1c ratio and MI. In addition, recent fluc-tuations in blood glucose before the onset of MI were evalu-ated to investigate whether these fluctuations were associatedwith MI.
Methods
This was a case-control study conducted during 2017–2018 inShafa and Afzalipour Educational Hospitals affiliated with
Kerman University of Medical Sciences. The research samplewas selected from the patients with MI and the diabetic pa-tients admitted to the cardiac ward and endocrine clinic ofthese hospitals.
In this study, the inclusion criteria of the case group were asfollows: patients who had diabetes for more than 5 years, hadmyocardial infarction, were admitted to the cardiac ward, andtheir disease was confirmed by the symptoms, physical exam-ination, ECG, cardiac enzymes, and other parameters that acardiologist considers. The age of the case group was 33–84 years.
The control group consisted of patients who had type 2diabetes for more than 5 years and had visited the endocrineclinic for their usual follow-up. These diabetic patients did nothave ACS according to their history, physical examination,and ECG.
Diagnosis of diabetic patients was based on the fastingblood glucose levels of more than 7 mmol/L or glucose ofmore than 11 mmol/L after a meal, or using hypoglycemicmedication. Approximately 20% of the diabetic patients inthis research used a combination of oral agents and insulin,and the rest used only oral agents. The control group’s age was27–88 years.
The exclusion criteria, on the other hand, included bloodtransfusion over the past 3 months, history of hypoglycemialeading to hospitalization within 3 weeks, hemoglobinopathyanemia, kidney or digestive diseases associated with proteinexcretion, liver disease, and medications that are related toalbumin (steroids).
The data collection tools included laboratory tests and ademographic questionnaire.
Laboratory tests were GA and HbA1c and the other teststhat were conducted at the same time included hemoglobintest to rule out anemia, fasting blood sugar (FBS) to controldiabetes, blood urea nitrogen (BUN) and creatinine (Cr) torule out kidney disease, liver functional tests including aspar-tate transaminase (AST) and alanine aminotransferase (ALT)to rule out liver disease, and low-density lipoprotein (LDL)and high-density lipoprotein (HDL) to identify hyperlipid-emia, which is a risk factor for MI. The demographic ques-tionnaire consisted of age, sex, cigarette smoking, hyperten-sion, and duration of diabetes. To determine the sample size,using the study by Pu et al (2007) and by selecting the alphaand power of 5% and 80%, respectively, the number of sam-ples for each group was obtained as 117 (117 cases and 117controls), and the total number of samples was 234 [27].
For the case group, any patient who was diagnosed withMIby a physician, based on cardiac enzymes, ECG, and symp-toms of the disease and was admitted to the cardiac ward, andfor the control group, any patient who was admitted to theendocrine clinic for the usual follow-up, had no symptomsof acute heart syndrome, and met the inclusion criteria, wasincluded in our study list. The researchers selected the eligible
309Int J Diabetes Dev Ctries (2021) 41:307–313
subjects for the case and control groups from the list of thepatients in the cardiac ward and endocrine clinic using a con-venient and simple method. After explaining the researchmethod, if the subjects were willing, the consent form wasfilled. In the case group, on the first day, a blood samplewas taken from the patients after 12 h of fasting, with a sterilemethod to perform tests such as hemoglobin, FBS, BUN, Cr,LFT, HDL, and LDL and then poured into special and stan-dard laboratory tubes. At the same time, 4 cc of blood waspoured into a separate tube to measure GA and HbA1c.Moreover, in the control group, patients had fasted for 12 hbefore the daily blood sugar test because routine follow-upwas recommended to them, and therefore participating inour first day test was not a concern for them. As the bloodsample was taken, the patient’s demographic questionnairewas being completed. It is notable that HbA1c shows theblood glucose fluctuations in the patient over the past3 months; however, GA shows the patient’s blood glucosefluctuations over the past 2 weeks. In this study, samplingwas performed on the first day, so stress due to MI did notsignificantly affect HbA1c and GA levels.
Each patient’s test tubes were sent to the laboratory withthe collaboration of the laboratory staff. The results of thehemoglobin, FBS, BUN, Cr, LFT, HDL, LDL, HbA1c, andGA tests were reported to the researchers and recorded in aunique sheet for each patient. The GA test sample was centri-fuged and its plasma was measured by the appropriatemethod.
Laboratory measurements
Biochemical parameters including FBS, BUN, Cr, AST, ALT,high-density lipoprotein cholesterol (HDL-C), and low-density lipoprotein cholesterol (LDL-C) were quantified usingcommercial kits (Pars Azmoon, Iran). HbA1c was measuredby the cation exchange chromatography method using theHbA1c Nycocard kits (Oslo, Norway).
Determination of GA serum levels
Serum levels of GA were measured using ELISA kits(Shanghai Crystal Day Biotech Co., LTD, China) accordingto the manufacturer’s instructions. Briefly, 50 μL of standardsolution (including secondary antibodies labeled with biotin)and 50 μL of streptavidin-HRP were added to the wells thatwere pre-coated with the GA monoclonal antibody.Moreover, 40 μL of the sample, 10 μL of secondary antibod-ies labeled with biotin, and 50 μL of streptavidin-HRP wereloaded into the wells. The plate was incubated at 37 °C for60 min. After the wells were rinsed 5 times with washingsolution, 50 μL of the chromogen solutions A and B wasadded to each well. After 10 min of incubation at 37 °C, thereaction was stopped with the help of a stop solution. The
optical density (OD) of each well was measured at the wave-length of 450 nm with an ELISA reader. The intra-assay co-efficients of variation (CV) and the inter-assay CV for GAwere < 10% and < 12%, respectively.
To achieve the objectives of the study, descriptive statisticsand the Mann-Whitney test were used to analyze the data anddescribe the numerical results. SPSS 23 software was utilizedfor statistical analysis.
Results
Descriptive statistics for the demographic data was calculated.The homogeneity of the distributions between the two groupswas examined using the chi-square test (Table 1). As can beseen, the demographic data such as age, gender, hypertension(HTN) history, and cigarette smoking are demonstrated inTable 1. The difference between the two groups in terms ofthese characteristics was analyzed using the chi-square test,and no statistically significant difference was observed be-tween the control and case groups.
According to the Kolmogorov-Smirnov test, the data wasnot normally distributed, so a non-parametric test was used foranalysis. The association between HbA1c levels, GA, andGA/HbA1c ratio was estimated using the Mann-Whitney test.The findings of this study indicated that the two groups hadstatistically significant differences in HbA1c levels and theGA/HbA1c ratio, but had no significant differences in GAaccording to the Mann-Whitney test (Table 2). The findingsshowed that GA was higher in the case group than the controlgroup, although the difference between the two groups wasnot statistically significant. HbA1c was higher in the controlgroup than the case group. The ratio of GA/HbA1c in the casegroup was higher than the control group.
Discussion
In this study, the relationship between MI, which is a diabetescomplication, and the ratio of GA to glycated hemoglobin wasinvestigated. The findings of the current study showed that theratio of GA/HbA1c in the case group was higher than in thecontrol group (p = 0.000). This indicates that prior to the occur-rence of MI, the changes in the blood glucose levels and thefluctuations can be a good indicator for the prediction and oc-currence of MI. Scientific studies have screened different ap-proaches to evaluate GA and the GA/HbA1c ratio for the diag-nosis of long-term diabetes complications. The benefits anddisadvantages of each of them are mentioned in the studies.
The findings of the current study indicated that the twogroups had no statistically significant differences in GA levels(p = 0.09), but the mean of GA in the case group was higherthan the control group. In a research conducted by
310 Int J Diabetes Dev Ctries (2021) 41:307–313
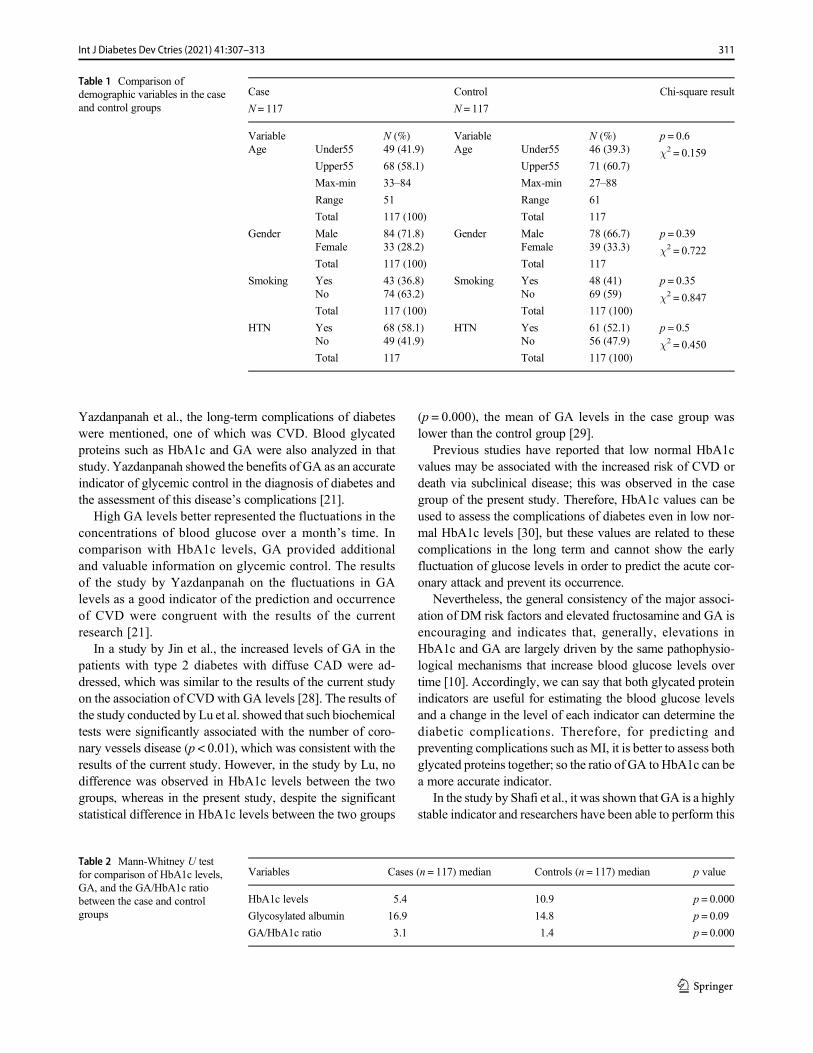
Yazdanpanah et al., the long-term complications of diabeteswere mentioned, one of which was CVD. Blood glycatedproteins such as HbA1c and GA were also analyzed in thatstudy. Yazdanpanah showed the benefits of GA as an accurateindicator of glycemic control in the diagnosis of diabetes andthe assessment of this disease’s complications [21].
High GA levels better represented the fluctuations in theconcentrations of blood glucose over a month’s time. Incomparison with HbA1c levels, GA provided additionaland valuable information on glycemic control. The resultsof the study by Yazdanpanah on the fluctuations in GAlevels as a good indicator of the prediction and occurrenceof CVD were congruent with the results of the currentresearch [21].
In a study by Jin et al., the increased levels of GA in thepatients with type 2 diabetes with diffuse CAD were ad-dressed, which was similar to the results of the current studyon the association of CVD with GA levels [28]. The results ofthe study conducted by Lu et al. showed that such biochemicaltests were significantly associated with the number of coro-nary vessels disease (p < 0.01), which was consistent with theresults of the current study. However, in the study by Lu, nodifference was observed in HbA1c levels between the twogroups, whereas in the present study, despite the significantstatistical difference in HbA1c levels between the two groups
(p = 0.000), the mean of GA levels in the case group waslower than the control group [29].
Previous studies have reported that low normal HbA1cvalues may be associated with the increased risk of CVD ordeath via subclinical disease; this was observed in the casegroup of the present study. Therefore, HbA1c values can beused to assess the complications of diabetes even in low nor-mal HbA1c levels [30], but these values are related to thesecomplications in the long term and cannot show the earlyfluctuation of glucose levels in order to predict the acute cor-onary attack and prevent its occurrence.
Nevertheless, the general consistency of the major associ-ation of DM risk factors and elevated fructosamine and GA isencouraging and indicates that, generally, elevations inHbA1c and GA are largely driven by the same pathophysio-logical mechanisms that increase blood glucose levels overtime [10]. Accordingly, we can say that both glycated proteinindicators are useful for estimating the blood glucose levelsand a change in the level of each indicator can determine thediabetic complications. Therefore, for predicting andpreventing complications such asMI, it is better to assess bothglycated proteins together; so the ratio of GA to HbA1c can bea more accurate indicator.
In the study by Shafi et al., it was shown that GA is a highlystable indicator and researchers have been able to perform this
Table 1 Comparison ofdemographic variables in the caseand control groups
Case
N = 117
Control
N = 117
Chi-square result
Variable N (%) Variable N (%) p = 0.6
χ2 = 0.159Age Under55 49 (41.9) Age Under55 46 (39.3)
Upper55 68 (58.1) Upper55 71 (60.7)
Max-min 33–84 Max-min 27–88
Range 51 Range 61
Total 117 (100) Total 117
Gender Male 84 (71.8) Gender Male 78 (66.7) p = 0.39
χ2 = 0.722Female 33 (28.2) Female 39 (33.3)
Total 117 (100) Total 117
Smoking Yes 43 (36.8) Smoking Yes 48 (41) p = 0.35
χ2 = 0.847No 74 (63.2) No 69 (59)
Total 117 (100) Total 117 (100)
HTN Yes 68 (58.1) HTN Yes 61 (52.1) p = 0.5
χ2 = 0.450No 49 (41.9) No 56 (47.9)
Total 117 Total 117 (100)
Table 2 Mann-Whitney U testfor comparison of HbA1c levels,GA, and the GA/HbA1c ratiobetween the case and controlgroups
Variables Cases (n = 117) median Controls (n = 117) median p value
HbA1c levels 5.4 10.9 p = 0.000
Glycosylated albumin 16.9 14.8 p = 0.09
GA/HbA1c ratio 3.1 1.4 p = 0.000
311Int J Diabetes Dev Ctries (2021) 41:307–313
test in multiple studies with high reliability and validity in thelong-term stored samples [31]. This study demonstrated thehigh ability of GA to estimate the glucose levels even in storedsamples. Therefore, it was concluded that to estimate the GA/HbA1c ratio, GA is a suitable factor, which is measured in ourstudy using the appropriate laboratory method and kits.
The findings of the present study indicated that the twogroups had statistically significant differences in HbA1clevels (p = 0.000). Measurement of HbA1c is internationallyrecognized as the gold standard indicator of glycemic controland is widely used to monitor the level of glucose in patientswith diabetes [32]. HbA1c has also been shown to be an in-dependent risk factor for CVD [33]. So it has an important rolein the assessment of diabetic patients and their CVD, whichshould not be eliminated. To estimate the GA/HbA1c ratio,we need to determine the HbA1c concentration; however, ithas some limitations such as delayed effects when applied inthe glucose reduction treatments. Moreover, it can only indi-cate the mean level of blood glucose over the past 3 monthsand is incapable of accurately reflecting short-term glycemicvariability [3]. Due to these limitations, this indicator shouldnot be used alone when analyzing recent blood glucosefluctuations.
Considering that in the present study, the HbA1c levelswere higher in the control group than the case group, it canbe concluded that HbA1c alone is not a good indicator forpredicting MI. However, GA was higher in the case groupand since GA determines the early glucose fluctuations, theGA/HbA1c ratio was also higher in the case group of ourstudy.
Shen et al. studied type 2 diabetes and compared theserum GA value with HbA1c to determine the existenceand extent of CAD. Among 829 patients with type 2 dia-betes, 664 patients had significant CAD. GA and HbA1clevels were measured in the participants. Diabetic patientswith pronounced CAD had higher serum GA, but nothigher HbA1c levels. GA also correlated better thanHbA1c with a number of indicators of CAD severity.Thus, GA was superior to HbA1c in determining the de-gree of CAD progression in patients with type 2 diabetes[20]. This result is in line with the results of our study onthe role of GA in the prediction of MI in the case group.Ma et al. also assessed GA, HbA1c, and the degree of CADseverity in 272 Chinese patients with CAD [34].
Some articles have discussed the advantages and disadvan-tages of HbA1c in the prediction of CVD, while others haveaddressed the GA approach to the prediction of CVD. TheGA/HbA1c ratio can be a more accurate glycemic indicatorin diabetic patients for revealing recent glucose fluctuationsbefore the occurrence of MI, which is a CVD. In our study,this has been shown in patients with type 2 diabetes. In severalstudies, there are some methods to determine the GA/HbA1c
ratio in type 1 diabetes or to compare it between the two typesof diabetes.
Matsumoto et al. investigated the efficacy of the GA/HbA1c ratio versus HbA1c alone in determining glycemiccontrol in type 1 diabetes. HbA1c, GA, and postprandial se-rum C-peptide immunoreactivity (CPR) were evaluated in 56patients. The GA/HbA1c ratio was substantially higher andcorrelated with the mean amplitude of glucose excursion.Thus, the GA/HbA1c ratio is a sensitive indicator of glycemiccontrol in diabetic patients [16].
In the study by Saisho et al. [15] a comparable relationshipwas demonstrated between GA/HbA1c and the beta cell func-tion in the patients with type 1 and type 2 diabetes, whereasKoga et al. showed a strong negative association between theGA/HbA1c ratio and beta cell activity in the patients with type2 diabetes [26]. According to the present research, there is arelationship between the GA/HbA1c ratio and MI in type 2diabetes patients.
Conclusion
Blood glycated proteins represent glycemic control and havebeen proposed as a useful tool for diagnosing diabetes, deter-mining the appropriate diabetes care, and even determiningthe risk of comorbidities, including CAD. Although HbA1cshows glycemic control over a reasonably long period of time,it does not accurately reflect glycemic control under condi-tions with rapid changes in the lifespan of red blood cells.GA is considered as an alternative indicator of glycemic con-trol in diabetic patients, but in some situations, GA levels areabnormal and therefore HbA1c may be a better tool in thesesituations. The findings of the present study showed that theratio of GA/HbA1c can be a good indicator to determine therisk of acute coronary diseases such as MI. The results of thecurrent study suggested that the ratio of AG/A1cwas higher inthe case group with MI, which is one of diabetes long-termcomplications, than in the control group. Before the occur-rence of MI, the GA/HbA1c ratio can be a good indicatorfor its prediction and occurrence because the AG/A1c ratiocan show the recent fluctuations more accurately thanHbA1c and GA alone. As a result, the improved control ofblood sugar and the avoidance of high fluctuation may preventMI from occurring.
Compliance with ethical standards
Conflict of interest The authors declare that they have no conflict ofinterest.
Ethical approval The researchers began the work after acquiring thecode of ethics no. IR.KMU.REC.1396.1748 from the Ethics Committee.
312 Int J Diabetes Dev Ctries (2021) 41:307–313
References
1. Umay E, Cevıkol A, Avluk O, Unlu E, Cakcı A. Relationshipbetween limited joint mobility syndrome and duration, metaboliccontrol, complications of diabetes as well as effects of the syndromeon quality of life. Int J Diabetes Dev Ctries. 2011;31(4):207–15.
2. Cho N, Shaw J, Karuranga S, Huang Y, da Rocha Fernandes J,Ohlrogge A, et al. IDF diabetes atlas: global estimates of diabetesprevalence for 2017 and projections for 2045. Diabetes Res ClinPract. 2018;138:271–81.
3. Ma X, Hu X, Zhou J, Hao Y, Luo Y, Lu Z, et al. Glycated albuminis more closely correlated with coronary artery disease than 1, 5-anhydroglucitol and glycated hemoglobin A1c. CardiovascDiabetol. 2015;14(1):16.
4. Kurihara O, TakanoM, YamamotoM, Shirakabe A, Kimata N, InamiT, et al. Impact of prediabetic status on coronary atherosclerosis: amultivessel angioscopic study. Diabetes Care. 2013;36(3):729–33.
5. Turner RC, Cull CA, Frighi V, Holman RR, Group UPDS.Glycemic control with diet, sulfonylurea, metformin, or insulin inpatients with type 2 diabetes mellitus: progressive requirement formultiple therapies (UKPDS 49). Jama. 1999;281(21):2005–12.
6. True, Mark W. Circulating biomarkers of glycemia in diabetes man-agement and implications for personalized medicine. 2009:743–747.
7. Clarke P, Gray A, Briggs A, Farmer A, Fenn P, Stevens R, et al. Amodel to estimate the lifetime health outcomes of patients with type2 diabetes: the United Kingdom Prospective Diabetes Study(UKPDS) Outcomes odel (UKPDS no. 68). Diabetologia.2004;47(10):1747–59.
8. Mapanga RF, Joseph DE, SaievaM, Boyer F, Rondeau P, BourdonE, et al. Glycation abolishes the cardioprotective effects of albuminduring ex vivo ischemia-reperfusion. Phys Rep. 2017;5(2):e13107.
9. Shen Y, Lu L, Liu ZH,Wu F, Zhu JZ, Sun Z, et al. Increased serumlevel of CTRP1 is associated with low coronary collateralization instable angina patients with chronic total occlusion. Int J Cardiol.2014;174(1):203–6.
10. Selvin E, Rawlings AM, Lutsey PL, Maruthur N, Pankow JS, SteffesM, et al. Fructosamine and glycated albumin and the risk of cardio-vascular outcomes and death. Circulation. 2015;132(4):269–77.
11. Koga M, Kasayama S. Clinical impact of glycated albumin as an-other glycemic control marker. Endocr J. (2010): 1008090468–1008090468.
12. Chawla R, Madhu S, Makkar B, Ghosh S, Saboo B, Kalra S. RSSDI-ESI clinical practice recommendations for the management of type 2diabetes mellitus 2020. Indian J Endocrinol Metab. 2020;24(1):1–122.
13. Elley C, Kenealy T, Robinson E, Drury P. Glycated haemoglobinand cardiovascular outcomes in people with type 2 diabetes: a largeprospective cohort study. Diabet Med. 2008;25(11):1295–301.
14. Bagi Z. Too much TRAFfic at the crossroads of diabetes and endothe-lial dysfunction. Am J Phys Heart Circ Phys. 2018;314(1):H65–H7.
15. Saisho Y, Tanaka K, Abe T, Shimada A, Kawai T, Itoh H. Glycatedalbumin to glycated hemoglobin ratio reflects postprandial glucoseexcursion and relates to beta cell function in both type 1 and type 2diabetes. Diabetol Int. 2011;2(3):146–53.
16. Matsumoto H, Murase-Mishiba Y, Yamamoto N, Sugitatsu-Nakatsukasa S, Shibasaki S, Sano H, et al. Glycated albumin toglycated hemoglobin ratio is a sensitive indicator of blood glucosevariability in patients with fulminant type 1 diabetes. Intern Med.2012;51(11):1315–21.
17. UedaY,MatsumotoH. Recent topics in chemical and clinical researchon glycated albumin. J Diabetes Sci Technol. 2015;9(2):177–82.
18. Danese E, Montagnana M, Nouvenne A, Lippi G. Advantages andpitfalls of fructosamine and glycated albumin in the diagnosis andtreatment of diabetes. J Diabetes Sci Technol. 2015;9(2):169–76.
19. Bagi Z. Too much TRAFfic at the crossroads of diabetes and endothe-lial dysfunction. Am J Phys Heart Circ Phys. 2017;314(1):H65–H7.
20. Shen Y, Pu LJ, Lu L, Zhang Q, Zhang RY, Shen WF. Glycatedalbumin is superior to hemoglobin A1c for evaluating the presenceand severity of coronary artery disease in type 2 diabetic patients.Cardiology. 2012;123(2):84–90.
21. Yazdanpanah S, Rabiee M, Tahriri M, Abdolrahim M, Rajab A,Jazayeri HE, et al. Evaluation of glycated albumin (GA) and GA/HbA1c ratio for diagnosis of diabetes and glycemic control: a com-prehensive review. Crit Rev Clin Lab Sci. 2017;54(4):219–32.
22. Koga M, Murai J, Saito H, Matsumoto S, Kasayama S. Effects ofthyroid hormone on serum glycated albumin levels: study on non-diabetic subjects. Diabetes Res Clin Pract. 2009;84(2):163–7.
23. Nishimura R, Kanda A, Sano H, Matsudaira T, Miyashita Y,Morimoto A, et al. Glycated albumin is low in obese, non-diabetic children. Diabetes Res Clin Pract. 2006;71(3):334–8.
24. Freitas PAC, Ehlert LR, Camargo JL. Glycated albumin: a potentialbiomarker in diabetes. Arch Endocrinol Metab. 2017;61(3):296–304.
25. Lyons T, Baynes J, Patrick J, Colwell J, Lopes-Virella M.Glycosylation of low density lipoprotein in patients with type I(insulin-dependent) diabetes: correlations with other parametersof glycaemic control. Diabetologia. 1986;29(10):685–9.
26. Koga M, Murai J, Saito H, Kasayama S. Glycated albumin andglycated hemoglobin are influenced differently by endogenous in-sulin secretion in patients with type 2 diabetes. Diabetes Care.2010;33(2):270–2.
27. Pu LJ, Lu L, Shen WF, Zhang Q, Zhang RY, Zhang JS, et al.Increased serum glycated albumin level is associated with the pres-ence and severity of coronary artery disease in type 2 diabetic pa-tients. Circ J. 2007;71(7):1067–73.
28. Jin C, Lu L, Zhang RY, Zhang Q, Ding FH, Chen QJ, et al.Association of serum glycated albumin, C-reactive protein andICAM-1 levels with diffuse coronary artery disease in patients withtype 2 diabetes mellitus. Clin Chim Acta. 2009;408(1–2):45–9.
29. Lu L, Pu LJ, Xu XW, Zhang Q, Zhang RY, Zhang JS, et al.Association of serum levels of glycated albumin, C-reactive proteinand tumor necrosis factor-α with the severity of coronary arterydisease and renal impairment in patients with type 2 diabetesmellitus. Clin Biochem. 2007;40(11):810–6.
30. Carson AP, Fox CS, McGuire DK, Levitan EB, Laclaustra M,Mann DM, et al. Low hemoglobin A1c and risk of all-cause mor-tality among US adults without diabetes. Circ Cardiovasc QualOutcomes. 2010;3(6):661–7.
31. Shafi T, Sozio SM, Plantinga LC, Jaar BG, Kim ET, Parekh RS,et al. Serum fructosamine and glycated albumin and risk of mortal-ity and clinical outcomes in hemodialysis patients. Diabetes Care.2013;36(6):1522–33.
32. Organization WH. Use of glycated haemoglobin (HbA1c) in diag-nosis of diabetes mellitus: abbreviated report of a WHO consulta-tion. Geneva: World Health Organization; 2011.
33. Ikeda F, Doi Y, Ninomiya T, Hirakawa Y, Mukai N, Hata J, et al.Haemoglobin A1c even within non-diabetic level is a predictor ofcardiovascular disease in a general Japanese population: theHisayama study. Cardiovasc Diabetol. 2013;12(1):164.
34. Ma X, Shen Y, Hu X, Hao Y, Luo Y, Tang J, et al. Associations ofglycated haemoglobin A1c and glycated albumin with subclinicalatherosclerosis in middle-aged and elderly Chinese population withimpaired glucose regulation. Clin Exp Pharmacol Physiol.2015;42(6):582–7.
35. Control D, Group CTR. The relationship of glycemic exposure(HbA1c) to the risk of development and progression of retinopathyin the diabetes control and complications trial. Diabetes.1995;44(8):968–83.
Publisher’s note Springer Nature remains neutral with regard to jurisdic-tional claims in published maps and institutional affiliations.
313Int J Diabetes Dev Ctries (2021) 41:307–313
ORIGINAL ARTICLE
Predictive factors for reduced functional mobility in elderly diabeticsand non-diabetics
Fernanda Thais Ferreira de Paiva1 & Marina Morato Stival2 & Luciano Ramos de Lima2&
Alessandro de Oliveira Silva3& Yuri Gustavo de Sousa Barbalho4
& Manoela Vieira Gomes da Costa4 &
Izabel Cristina Rodrigues da Silva2 & Silvana Schwerz Funghetto2
Received: 21 May 2020 /Accepted: 15 September 2020# Research Society for Study of Diabetes in India 2020
AbstractObjective The aim of this study was to evaluate the mobility of older adults treated in primary health care units in Brazil, as wellas to investigate the association between reduced mobility, sociodemographic characteristics, and health conditions in thediabetic and non-diabetic elderly.Methods This is a cross-sectional study carried out in two primary health care units with 205 elderly individuals. The “Timed-Up-and-Go” test was used to evaluate the mobility. The variables related to reduced mobility were verified by multivariatelogistic regression.Results A total of 80% were women, 52.2% had diabetes mellitus, and the prevalence of reduced mobility was81.0%. The following factors were significantly associated with reduced mobility in diabetics: occupation (p =0.040), alcoholism (p = 0.019), smoking (p = 0.039), sedentary lifestyle (p = 0.033), high blood pressure (p = 0.018),and the percentage of body fat (p = 0.001). The variables that were found to be predictive factors for diabetes wereas follows: triglyceride ((odds ratio [OR], 1.61; 95% confidence interval [95% CI], 1.05–2.34; p = 0.038)), sedentarylifestyle (OR, 2.50; 95% CI, 1.06–5.57; p = 0.018), and high blood pressure (OR, 2.03; 95% CI, 1.09–4.02; p =0.040).Conclusion The prevalence of reduced mobility among the diabetic older adults in the study is extremely high whencompared with results from other studies conducted in Brazil and worldwide. Moreover, a decrease in mobility isone of the main risk factors for falls in older people. Therefore, intervention and health promotion actions should beproposed to maintain and improve the mobility and autonomy of the elderly.
Keywords Diabetesmellitus . Elderly . Mobility
* Fernanda Thais Ferreira de [email protected]
Marina Morato [email protected]
Luciano Ramos de [email protected]
Alessandro de Oliveira [email protected]
Yuri Gustavo de Sousa [email protected]
Manoela Vieira Gomes da [email protected]
Izabel Cristina Rodrigues da [email protected]
Silvana Schwerz [email protected]
1 Unieuro University Center Brasília, Avenida das Nações, Trecho 0,Conjunto 05, Brasilia, Distrito Federal 70.200-001, Brazil
2 University of Brasília, Brasilia, Distrito Federal, Brazil
3 Center University of Brasilia, Brasilia, Distrito Federal, Brazil
4 University of Brasilia, Brasilia, Distrito Federal, Brazil
https://doi.org/10.1007/s13410-020-00873-w
/ Published online: 10 October 2020
International Journal of Diabetes in Developing Countries (2021) 41:314–321
Introduction
Aging is a natural and inevitable process. Over the years, changesin lifestyle and improvements in the health conditions of thepopulation have been observed, resulting in an increase in lifeexpectancy. In this sense, it is observed that the elderly popula-tion is the fastest growing segment today, with an estimated 605million people over the age of 65 in the world. In addition, it isestimated that in the next 30 years, the elderly population willincrease by up to 300% in Asia and Latin America [1].
Population aging is characterized by a decline in physicaland mental capacities, followed by limitations and increasedrisk for chronic-degenerative diseases. It is known that dis-eases can affect the functional capacity of the elderly, includ-ing mobility, which can result in functional limitations.Moreover, there are also other factors such as physical, envi-ronmental, socioeconomic, genetic, and lifestyle habits thatcan affect the body functions of the elderly, compromisingtheir mobility and making them more dependent [2].
Mobility is an extremely important component of physicalfunctioning [3]. It was broadly defined as the ability to moveindependently or using assistive devices from one place toanother, and is most often measured in adult individuals bythe Timed-Up-and-Go (TUG) and walking speed tests [4].Some studies have shown that reduced physical function andreduced gait speed were highly predictive of falls [5] anddependence on basic activities of daily living [6], factors thatare linked to the reduction of independence and autonomy ofthe elderly [7].
The aging process can cause some changes in the body,such as reduced muscle mass and decreased in musclestrength and power. These factors have a negative impact onthe balance and functional mobility of the elderly by reducingthe effectiveness of postural adjustment mechanisms and mo-tor control, contributing to an increase in the risk of falls andfractures [8].
In this sense, the assessment of functional mobility hasbecome a useful and important tool to evaluate the healthstatus of the elderly, since when identified in its initial stages,impairments in physical capacity can be contained or evenreversed by specific interventions, such as physical exerciseprograms [9]. In addition, a reduced mobility may reducesocial interaction and interfere with the well-being of the el-derly [10].
Also, there is evidence that an important consequence ofthe aging of people with diabetesmellitus (DM) is the physicaldisability, especially the loss of mobility. In addition, DM isassociated with other comorbidities that further compromisethe functionality of the elderly [11]. A study carried out inBrazil suggested that the diabetic elderly present higher riskof falls, since worse performance in the functional mobilitytest was found in this population when compared with theelderly without the disease [12].
Faced with these evidences, it is important to compare themobility of diabetic and non-diabetic elderly patients throughtests that evaluate the physical function and which can also bea general indicator of mobility. The TUG test is an easy-to-use, inexpensive, and efficient test for assessing mobility andhas been frequently used in research [13–15].
Thus, this study aimed to evaluate the mobility of olderadults treated in primary health care units in Brazil, as wellas to investigate the association between reduced mobility,sociodemographic characteristics, and health conditions inthe diabetic and non-diabetic elderly.
Materials and methods
This was a descriptive cross-sectional study carried out in twoprimary health care units (PHCUs) and in the University ofBrasilia (UnB), located in Brasilia, the capital of Brazil. Thedata collection period was from January to July 2017. Thesetwo PHCUs are part of the Family Health Strategy, a Braziliangovernment program in which community health workersprovide basic primary care to families in their area. In theseunits, the health professionals are able to resolve low-levelproblems, as well as forwarding complex issues to the appro-priate units. Moreover, the health workers also make consul-tations and conduct health education sessions.
The selection of the sample occurs randomly in a conven-tional manner, and the medical record number of each elderlypatient registered in the units was used for the sample draw.Then, the selected individuals were invited to participate in thestudy.
The study population consisted of 1000 elderly people whohad registered in those PHCU units. A 6% error, sample dis-tribution of 50%, and a 95% confidence interval were used tocalculate the sample size, totaling 205 elderly patients. Thesample was randomized and the patients having the followingcriteria were included age over 60 years (considered elderly inBrazil), enrolled in the PHCU, with preserved levels of con-sciousness to answer the research questionnaires. Also, onlypatients who had metal implants were excluded, because it isan impediment factor to perform the dual-energy X-ray ab-sorptiometry (DEXA).
The first phase of the procedures took place in the PHCUs,where sociodemographic data was collected, the blood pres-sure was measured, and the blood collection was scheduled. Astructured and previously tested instrument was applied todetermine sociodemographic variables (sex, age, marital sta-tus, schooling, and occupation), behaviors (smoking, alcohol-ism, and sedentary lifestyle), and comorbidities. Blood pres-sure was measured by the auscultatory technique, with a cal-ibrated sphygmomanometer, with an adapted cuff on the pa-tient’s left arm and a stethoscope positioned over the brachialartery line.
315Int J Diabetes Dev Ctries (2021) 41:314–321
The anthropometric variables weight and height were ob-tained from the application of Lohman’s techniques [16], andthe weight and height measurements were used to calculatethe body mass index (BMI). The following BMI referencevalues were considered for participants’ classification: normal(22.0 to 27.0 kg/m2), overweight (> 27 kg/m2), and obese (≥30 kg/m2) [17].
In the second phase, blood was collected through veni-puncture, preferably in the antecubital fossa, with a 12-h fast.Concentrations of triglycerides, high-density lipoprotein(HDL-C), low-density lipoprotein (LDL), total cholesterol,fasting blood glucose, and glycated hemoglobin (HbA1c)were measured in the clinical laboratory of Hospital SãoFrancisco. Following, the TUG test was applied to assessfunctional mobility [18, 19]. It allows quantifying functionalmobility of an individual by the time, in seconds, the task ofgetting up from a chair of 46 cm of height with support for thearms, to walk 3 m, to turn, and to lean back on the chair iscompleted. A colored mark was set on the floor to demarcate awalk of 3 m. Participants performed the TUG once before forfamiliarization and then again for data collection [18].Participants who performed the test in more than 12.47 s wereclassified as having reduced mobility (RM) [19].
In the third phase, the percentage of body fat (BF) wasevaluated by DEXA. The equipment was calibrated dailyand was operated by a technically trained professional. Theexamination was performed in the Biophysics’ Laboratory ofthe UnB and comprised a complete scan of the patient’s bodyin a position of dorsal decubitus. BF was classified as normalfrom 25 to 37.9% and 13 to 24.9%, overweight from 38 to42.9% and 25 to 30.9%, and obese when ≥ 43% and ≥ 31%,for women and men, respectively [20].
Statistical analysis
Data is disposed as mean ± standard deviation. The softwareStatistical Package for the Social Sciences (SPSS) version20.0 was used for data analysis. The Kolmogorov-Smirnovtest was applied to analyze the normality of the variables.ANOVA followed by Bonferroni’s post hoc test was used tocompare the means of the patients between the groups. For thefinal model, stepwise multiple logistic regression analysis wasperformed to determine the predictor variables of impairedfunctional capacity in the diabetic elderly and to calculatethe adjusted OR. For all analysis, statistical significance levelwas considered p < 0.05.
Results
A total of 205 elderly individuals were interviewed, of whom80.0% were female, 42.0% aged between 60 and 65 years,45.8% were married, 34.6% presented low schooling, and
48.8%were retired (Table 1). In addition, 5.7% presented highalcoholic intake level, 8.8% smokers, and 69.3% were seden-tary (Table 2). The mean age of the elderly was 68.0 ±6.0 years.
Of the 205 elderly people evaluated, 107 (52.2%) had DM,with an average diagnosis time of 5.56 ± 7.42 years. The prev-alence of reduced mobility (RM) was 81.0%. Age was notassociated with RM (p = 0.157), but a higher rate of RM wasobserved in the elderly over 80 years (92.3%), followed bythose aged 66–69 years (89.1%).
After the analysis of functional mobility, the sample of thisstudy was stratified into the following groups: RM+DM+ (di-abetic elderly with reduced mobility—47.3%), RM+DM− (el-derly without diabetes with reduced mobility—33.6%),RM−DM+ (diabetic elderly without reduced mobility—9.7%), and RM−DM− (elderly without diabetes and withoutreduced mobility—9.4%) (Table 2).
Occupation, alcoholism, smoking, and sedentary life-style were associated with RM in diabetics. Higher prev-alence of retirees was observed in the RM+DM+ group(54.8%) when compared with those in the RM−DM−
group (35.3%) (p = 0.040). In relation to inadequate life-style, alcoholism was associated with impaired functional
Table 1 Sociodemographic characteristics of the study subjects (n =205). Brasília, 2020
n %
Sex
Female 164 80.0
Male 41 20.0
Age (years)
60–65 86 42.0
66–69 46 22.4
70–75 43 21.0
76–79 17 8.3
≥ 80 13 6.3
Marital status
Single 36 17.6
Married 94 45.8
Divorced 18 8.8
Widower 57 27.8
Schooling
Unschooled 21 10.2
1–4 years 71 34.6
5–8 years 66 32.2
> 9 years 47 23.0
Occupation
Active 39 19.0
Retired 100 48.8
Inactive 66 32.2
316 Int J Diabetes Dev Ctries (2021) 41:314–321
capacity, since this behavior was more prevalent in theRM+DM+ group (9.7%) compared with that in theRM−DM+ group (5.6%) (p = 0.019).
On the other hand, smoking was only related to DM, sincethe elderly of the RM+DM+ group (12.4%) had a higher prev-alence than those of the RM+DM− group (1.4%) (p = 0.039).Higher sedentary indexes were observed in the elderlyRM+DM+ (67.0%) compared with those in the RM−DM−
(57.9%) (p = 0.033).It was observed that 78.8% of the elderly had high
blood pressure (HBP). In addition, a significant associa-tion was observed between HBP, reduced mobility, andDM, since the RM+ DM+ group had a higher prevalenceof HBP (83.9%) when compared with the RM−DM−
group (58.8%) (p = 0.018).Regarding body composition, it was observed that the per-
centage of body fat was significantly associated with the re-duced mobility in diabetics, since the elderly RM+DM+ hadhigher body fat mean (41.3%) when compared with those ofRM−DM− (39.5%) (p = 0.001).
Considering the biochemical profile of the elderly in-dicated in Table 2, it was shown that triglycerides, bloodglucose, and glycated hemoglobin (Hb1Ag) were associ-ated with reduced mobility and DM. Total cholesterol andLDL were related only to reduced mobility. In relation tothe lipidogram test, the triglycerides were significantlyelevated in the elderly RM+DM+ (M = 170.5 ± 86.3 mg/dL) when compared with those in RM−DM− (M = 110.4± 53.6 mg/dL) (p = 0.034). The total cholesterol levelswere higher in the elderly RM+DM− group (202.6 ±50.0 mg/dL) than in RM−DM− (M = 186.1 ± 39.6 mg/dL)(p = 0.038). Finally, the LDL was only associated withDM, since the RM+DM+ group had lower means (M =108.0 ± 38.1 mg/dL) than the RM−DM− group (M =126.3 ± 44.4 mg/dL) (p = 0.011).
Table 2 shows that the variables related to glycemic con-trol, such as blood glucose and HbA1c, were significantlyhigher in the RM+DM− group (M = 145 ± 58.7; 7.0 ± 1.8 mg/dL, respectively) when compared with those in the other threegroups in the study, thus demonstrating an association
Table 2 Demographic variables, life habits, comorbidity, body composition, muscular strength, and biochemical tests of the elderly according toreduced mobility (RM+/RM−) and diabetes mellitus (DM+/DM−), Brasília, 2020
RM+DM+ (n = 97) RM+DM− (n = 69) RM−DM+ (n = 20) RM−DM− (n = 19) Total (N = 205) p
Age (M ± SD) 68.4 ± 6.1 67.3 ± 5.4 69.2 ± 4.7 65.8 ± 6.1 67.9 ± 5.7 0.868
Sex (F/M) (%) 76.3/23.7 84.6/15.4 72.2/27.8 82.4/17.6 79.3/20.7 0.514
Occupation (%(
Active 20.5 20.0 11.1 29.4 20.2 0.040Retired 54.8* 32.3 61.1 35.3 46.1
Inactive 24.7 47.7 27.8 35.3 33.7
Alcoholism (%) 9.7*** 0.0 5.6 5.9 5.7 0.019
Smoking (%) 12.4** 1.4 10.0 10.5 8.3 0.039
Sedentary lifestyle (%) 67.0* 76.8 65.0 57.9 69.3 0.033
HBP (%) 83.9* 78.5 72.2 58.8 78.8 0.018
BMI (M ± SD) 30.5 ± 5.0 28.8 ± 5.4 30.1 ± 5.5 27.9 ± 3.6 29.8 ± 5.1 0.924
BF (M ± SD) 41.3 ± 7.0* 41.3 ± 7.8 39.0 ± 9.2 39.5 ± 5.4 40.9 ± 7.4 0.001
Triglycerides (M ± SD) 170.5 ± 86.3* 139.0 ± 55.2 129.1 ± 50.7 110.4 ± 53.6 154.1 ± 75.0 0.034
Cholesterol (M ± SD) 190.3 ± 42.7 202.6 ± 50.0***** 192.3 ± 34.5 186.1 ± 39.6 194.7 ± 44.8 0.038
LDL (< 100) (M ± SD) 108.0 ± 38.1** 126.3 ± 44.4 114.4 ± 30.4 110.4 ± 47.1 115.0 ± 40.8 0.011
HDL (> 60) (M ± SD) 45.9 ± 10.3 48.6 ± 9.6 51.9 ± 10.9 53.6 ± 21.9 47.5 ± 10.8 0.131
Blood glucose (M ± SD) 145.0 ± 58.5**** 90.2 ± 13.1 125.7 ± 73.7 83.2 ± 10.9 121.9 ± 54.1 0.001
HbA1c (M ± SD) 7.0 ± 1.8**** 5.6 ± 0.47 6.4 ± 1.8 5.3 ± 0.42 6.4 ± 1.5 0.001
TUG (M ± SD) 16.8 ± 4.0 **** 16.2 ± 4.0 7.5 ± 2.0 8.3 ± 1.0 14.9 ± 5.0 0.001
The italicized values mean p<0.05
M, mean; SD, standard deviation; HBP, high blood pressure; BMI, body mass index; BF, body fat; LDL, low-density lipoprotein; HDL, high-densitylipoprotein; HbA1c, glycated hemoglobin
*RM+DM+ versus RM−DM−
**RM+DM+ versus RM+DM−
***RM−DM+ versus RM+DM+
****RM+DM+ versus all groups
*****RM+DM− versus RM−DM−
317Int J Diabetes Dev Ctries (2021) 41:314–321
between blood glucose and HbA1c with RM and DM in theelderly (p = 0.001).
Regarding TUG performance, a longer test time was ob-served in the group of patients with DM (16.8 ± 4.0) whencompared with the other group (p < 0.001). Sex, age, musclestrength, BMI, and HDL were not associated with RM andDM in the elderly (Table 2).
Regarding the logistic regression analysis, the variablesthat showed an association with reduced mobility in diabeticelderly were as follows: smoking, alcoholism, sedentary life-style, occupation, high blood pressure, cholesterol, triglycer-ides, LDL, blood glucose, HbA1c, and percentage of body fat.
After the models were tested, triglycerides, sedentary life-style, and HBP remained as predictor factors of reduced mo-bility in diabetic patients. Table 3 shows that elevated triglyc-eride was a predictor of low mobility in DM, increasing therisk by 1.61 times. Sedentary diabetic patients are 2.5 timesmore likely to have reduced mobility. Finally, elderly dia-betics with hypertension have a twofold risk for reducedmobility.
Discussion
The results found in the present study indicated a high preva-lence of elderly patients with reduced mobility, while otherstudies have found a lower prevalence such as 67.9% [21].Some international studies also observed lower prevalence, asin the USA (36.6%) [22] and Italy (23%) [23], while similarprevalence has been observed in others, such as in the EnglishLongitudinal Study of Ageing (ELSA) (93%) [24] and in astudy conducted in South Korea (90%) [25]. The loss of
mobility leads to a disability that represents an important riskfactor for falls and that can affect the quality of life of theelderly, as evidenced by a study carried out in Chile with1334 participants over 60 years old, in which older adults withfunctional changes presented an increased risk of falling [26].
The majority of the elderly in this study performed theTUG in a greater time than the proposed one, and a poor testperformance was related to DM. A study in Japan with 211elderly subjects also observed a lower TUG performance inthe elderly with DM, corroborating the results of this study[27]. Also, a study conducted in the south of Brazil with dia-betic adults between 50 and 65 years of age showed that thosewith DM had worse functional mobility and cognitive perfor-mance, favoring the hypothesis that this disease influencesfunctional mobility and cognitive capacity [11].
It is important to highlight the evidence that suggests thatthe mean values of plantar pressure of the forefoot and thehind foot of patients with DM may increase, considering thatthe higher the percentage of load distribution in the hind foot,the longer the execution time of the TUG and, therefore, func-tional mobility will be diminished [28]. This can also be ex-plained by the complications of DM, such as vascular alter-ations, peripheral neuropathy, and loss of vision that directlythreaten the independence of this population [29].
The high prevalence of reduced mobility has a negativeimpact on the lives of these elderly people and those whoassist them in regular activities, since it is one of the compo-nents of functional capacity that is a public health problem, asit increases the risk of hospitalization, the risk of falls, anddeath [30].
In this context, it was observed that the inadequate glyce-mic control, expressed by higher glycemia and HbA1c levels,was shown to be associated with RM. Elderly people withinadequate glycemic control have a higher risk of functionalalterations with declines in physical function, resulting in in-capacity and death. Older adults with higher levels of glucoseare at a higher risk of functional decline [31]. A study con-ducted in the USA with women in the community aged 70–79 years found that HbA1c ≥ 8.0% (compared with < 5.5%)was associated with an increased risk of developing walkingdifficulty, low speed of walking, and low physical perfor-mance during an average follow-up of 8 years [32].Significant association was also found between elevatedlevels of HbA1c and lower lean body mass, as well as withlower muscle strength [33]. In addition, it is known that theelderly with DM and poor glycemic control may present ahigher risk of fractures, since higher blood glucose concentra-tions were associated with the accumulation of advancedglycation end products (AGES), which can lead to an increasein bone fragility [11].
For behavioral habits, alcoholism and sedentary lifestylewere significantly associated with DM and RM. It is knownthat alcohol may cause brain damage and cognitive
Table 3 Predictive variables for reduced mobility in the diabetic elderlyafter regression tests. Brasília, 2020
Variables OR 95% CI p
High triglycerides 1.61 1.05–2.34 0.038
Sedentary lifestyle 2.50 1.06–5.57 0.018
HBP 2.03 1.09–4.02 0.040
Smoking 0.40 0.28–0.84 0.503
Alcoholism 1.08 0.98–1.21 0.089
Occupation 0.47 0.06–0.74 0.462
High blood glucose 0.99 0.97–1.02 0.829
High cholesterol 1.01 0.99–1.03 0.299
High HbA1c 1.12 0.70–1.79 0.697
High LDL 0.95 0.89–1.02 0.194
High BF 0.99 0.88–1.10 0.879
The italicized values mean p<0.05
HBP, high blood pressure; HbA1c, glycated hemoglobin; LDL, low-den-sity lipoprotein; BF, body fat; OR, odds ratio; CI, confidence interval
318 Int J Diabetes Dev Ctries (2021) 41:314–321
dysfunction, which impairs brain activity and affects bodyfunctions, such as coordination and cognition. This may trig-ger a change in overall health status, resulting in reduced mo-bility [34]. Regarding inactivity, a Canadian study showedthat sedentary individuals had a 33% higher chance of func-tional disability than active individuals [35]. In addition, moreactive elderly people live better, since regular physical activitypractice tends to minimize the natural body debilitation pro-cess related to aging [35]. In this sense, the TUG test has beenconsidered an important tool for fragility and sarcopenia pre-diction, both conditions related to muscular weakness, whichmay cause restriction of mobility [36].
Smoking showed association only with DM. Available ev-idence shows that smoking increases insulin resistance, butthe exact mechanism by which this habit increases the riskof DM and impairs glucose homeostasis has not yet been fullyelucidated [37]. In addition, some studies [37, 38] have dem-onstrated that the adverse effects of smoking on DM are notonly macrovascular complications, but also the progression ofmicrovascular complications.
The majority of the elderly had HBP, which is significantlyassociated with reduced mobility and DM. DM and HBP are themost common risk factors for cardiovascular disease and oftenappear concomitantly. Therefore, the Brazilian NationalHousehold Sample Survey (PNAD) of 1998, 2003, and 2008found a similar result, which showed a significant associationbetween physical mobility and HBP and DM in older adults inthree representative moments in which they were evaluated [39].
Another interesting fact was the positive association of BFonly with RM. Individuals with obesity or overweight have alimitation in mobility since high-fat percentages increase jointand muscle stress [40]. Excess weight causes greater pressureon the plantar surface, while the accumulation of adipose tis-sue in the abdominal region displaces the center of gravity tothe anterior region in relation to the ankle joints, generatinggreater body instability. Added to these factors, the aging pro-cess associated with excess adiposity leads to a decrease inmuscle strength which affects the mobility in this population[41, 42].
Regarding the dyslipidemic indices, we evidenced that theelderly diabetics with higher levels of triglycerides, total cho-lesterol, and LDL tended to present reduced mobility. In thissense, as predictive variables of RM in the diabetic elderly, weobserved elevated triglyceride, sedentary lifestyle, and HBP.Triglyceride levels were positively correlated to TUG perfor-mance time, demonstrating that the higher the triglyceride inthe elderly, the longer the test run time. A study with 1622elderly people in London showed a 2.18 times higher risk offalls in elderly patients with increased triglyceride [43]. It isalso known that triglyceride is considered a component for thediagnosis of metabolic syndrome (MS). MS has been relatedto the physical decline in the elderly, revealing a greater prob-ability of developing mobility limitations, since older women
withMS had higher metabolic risk factors and lower capacity,lower limb strength, muscle strength, and lean leg mass [44].
Therefore, it is important to include physical exercisesaimed at increasing strength and muscle mass of the elderly,especially those with DM. A study also conducted in Brasiliawith 88 older women demonstrated that an increase in relativehandgrip strength of 1 kg/body mass index was associatedwith a decrease in the TUG test of 0.7 s, showing a possiblepositive effect of muscle strength on the mobility of elderlywomen [45].We believe that the sedentary lifestyle associatedwith the high level of triglycerides in the diabetic elderly con-tributes significantly to the increase of reduced mobility, con-sidering the profile of the elderly observed in the present studyand results of other researches already performed on thissubject.
The American Diabetes Association (ADA) together withthe American Society of Geriatrics (ASG) emphasized in aconsensus the need for studies to determine the functionaldecline in the elderly with DM in order to elucidate the con-tributing factors. In addition to changes in body compositiondue to aging, such as progressive loss of muscle mass, in-crease in fat mass, and consequent decline in muscle strength,this study points to additional indicators that should be con-sidered in the evaluation of the elderly, especially in the con-text of primary care.
As limitations of this study, we can refer to the non-evaluation of eating habits, which made it difficult to discusssome predictive factors that are related to diet, such as thehigher levels of triglycerides. Another limitation refers to thefact that the evaluation of the level of physical activity wasdone through self-report of the participants, and not throughan instrument. In addition, muscle strength could also havebeen assessed since it is related to functional capacity.
Conclusion
The prevalence of reduced mobility among the elderly in thestudy was higher than results from other studies conducted inBrazil and worldwide. Triglycerides, sedentary lifestyle, andhypertension showed to be predictive factors for reduced mo-bility in elderly diabetics. All these factors are modifiablefactors and are directly or indirectly related to lifestyle.Therefore, these results can be used for intervention and healthpromotion actions aimed at maintaining and improving thefunctional mobility and autonomy of elderly.
It is considered that new studies should be performed,and the intensity of the influence of these factors in themobility of this population should be further explored.Still, it would be interesting to look for variables that canbe used as predictive factors for good functional capacityin the elderly.
319Int J Diabetes Dev Ctries (2021) 41:314–321
Acknowledgments We would like to offer thanks to all patients whoaccepted to participate in this study. We also thank the director and theteam of the primary health care of Brasilia. We also thank the Departmentof Health (SES-DF) for authorizing the development of this research; andthe members of the Health Care and Aging Research Group (GEPSEN/UNB), professors, and students (PhD, master’s degree, scientific initia-tion, and volunteers) for the help in the development of this work.
Authors’ contribution FTFP, MMS, LRL, and SSF worked on studydesign, data collection and analysis, interpretation, drafting, and editingof the manuscript. YGSB and MVGC, also, worked on data collection.FTFP,MMS, AOS, and SSF collaborated on interpretation, data analysis,editing, and review of the manuscript data. ICRS collaborated on bloodcollection and biochemical exams. All authors read and approved thefinal manuscript.
Funding This study was financed in part by the Coordenação deAperfeiçoamento de Pessoal de Nível Superior – Brasil (CAPES),Fundação de Apoio a Pesquisa do Distrito Federal (FAP-DF), andConselho Nacional de Desenvolvimento Científico e Tecnológico -Brasil (CNPq).
Compliance with ethical standards
The data collection occurred after the approval of the ethics committeeand the participants’ signature in the free and informed consent term. Allthe participants received a description of the study and were informedabout the purpose, risks, and benefits. This research was approved by theEthics Committee of the Secretaria de Saude do Distrito Federal (SES/DF).
Competing interests The authors declare that they have no conflict ofinterest.
References
1. Amarya S, Singh K, Sabharwal M. Health consequences of obesityin the elderly. J Clin Gerontol Geriatr. 2014;5:63–7. https://doi.org/10.1016/j.jcgg.2014.01.004.
2. Ikegami ÉM, Souza LA, dos Santos Tavares DM, Rodrigues LR.Functional capacity and physical performance of community-dwelling elderly: a longitudinal study. Ciênc Saúde Coletiva.2020;25(3):1083–90. https://doi.org/10.1590/1413-81232020253.18512018.
3. World Health Organisation. International classification of function-ing, disability and health: ICF. Geneva: WHO; 2001.
4. Kuspinar A, Verschoor C, BeauchampM, Dushoff J, Ma J, AmsterE, et al. Modifiable factors related to life-space mobility incommunity-dwelling older adults: results from the CanadianLongitudinal Study on Aging. BMC Geriatr. 2020;20:35. https://doi.org/10.1186/s12877-020-1431-5.
5. Moyer VA. Force USPST. Prevention of falls in community-dwelling older adults: U.S. Preventive Services Task Force recom-mendation statement. Ann Intern Med. 2012;157(3):197–204.https://doi.org/10.7326/0003-4819-157-3-201208070-00462.
6. Rosano C, Newman AB, Katz R, Hirsch CH, Kuller LH.Association between lower digit symbol substitution test scoreand slower gait and greater risk of mortality and of developingincident disability in well-functioning older adults. J Am GeriatrSoc. 2008;56(9):1618–25. https://doi.org/10.1111/j.1532-5415.2008.01856.x.
7. Münch M, Weibel R, Sofios A, Huang H, Infanger D, Portegijs E,et al. Mobility assessment with modern technology in older pa-tients’ real-life by the general practitioner: theMOBITEC-GP studyprotocol. BMC Public Health. 2019;19:1703. https://doi.org/10.1186/s12889-019-8069-2.
8. Fernando R, Sofia G, Fantina T, Gabriela B, José O. Impact ofregular physical exercise participation in balance, functional mobil-ity and fall risk in institutionalized older adults. Rev Port CienDesp. 2009;9(1):36–42 http://www.scielo.mec.pt/scielo.php?script=sci_arttext&pid=S1645-05232009000100004&lng=pt.Accessed 28 April 2020.
9. PahorM, Guralnik JM, AmbrosiusWT, Blair S, Bonds DE, ChurchTS, et al. Effect of structured physical activity on prevention ofmajor mobility disability in older adults: the LIFE study random-ized clinical trial. JAMA. 2014;311(23):2387–96. https://doi.org/10.1001/jama.2014.5616.
10. dos Santos JD, Cachioni M, Yassuda M, deMelo R, Falcão D, NeriA, et al. Social participation of elderly: associations with health,mobility and purpose of life. Psic Saúde Doenças. 2019;20(2):367–83. https://doi.org/10.15309/19psd200208.
11. Ferreira MC, Tozatti J, Fachin SM, de Oliveira PP, dos Santos RF,da Silva MER. Reduction of functional mobility and cognitive ca-pacity in type 2 diabetes mellitus. Arq Bras Endocrinol Metab.2014 ;58 (9 ) :946–52 . h t t p s : / / do i . o rg /10 .1590 /0004 -2730000003097.
12. Alvarenga PP, Pereira DS, Anjos DMC. Functional mobility andexecutive function in elderly diabetics and non-diabetics. Rev BrasFisioter. 2010;14(6):491–6. https://doi.org/10.1590/S1413-35552010000600007.
13. de Oliveira VW, di Paschoale OTLV, Mateus F, Fornias SE,Zuniga DV. Test timed up and go and its correlation with age andfunctional exercise capacity in asymptomatic women. FisioterMov. 2017;30(3):463–71. https://doi.org/10.1590/1980-5918.030.003.ao04.
14. Bergland A, Jørgensen L, Emaus N, Strand BH. Mobility as apredictor of all-cause mortality in older men and women: 11.8 yearfollow-up in the Tromsø study. BMCHealth Serv Res. 2017;17(1):22. https://doi.org/10.1186/s12913-016-1950-0.
15. Lin S-I, Lee H-C, Chang K-C, Yang Y-C, Tsauoe J-Y. Functionalmobility and its contributing factors for older adults in differentcities in Taiwan. J Formos Med Assoc. 2017;116(2):72–9. https://doi.org/10.1016/j.jfma.2016.01.011.
16. Lohman TG, Roche AF, Martorell R. Anthropometric standardiza-tion reference manual. Champaign: Human Kinetics Books; 1988.
17. Lipschitz DA. Screening for nutritional status in the elderly. PrimCare. 1994;21(1):55–67.
18. Podsiadlo D, Richardson S. The timed “Up & Go”: a test of basicfunctional mobility for frail elderly persons. J Am Geriatr Soc.1991;39(2):142–8. https://doi.org/10.1111/j.1532-5415.1991.tb01616.x.
19. Alexandre TS, Meira DM, Rico NC, Mizuta SK. Accuracy ofTimed Up and Go test for screening risk of falls amongcommunity-dwelling elderly. Rev Bras Fisiot. 2012;16(5):381–8.https://doi.org/10.1590/S1413-35552012005000041.
20. Gallagher D, Heymsfield SB, Heo M, Jebb SA, Murgatroyd PR,Sakamoto Y. Healthy percentage body fat ranges: an approach fordeveloping guidelines based on body mass index. Am J Clin Nutr.2000;72(3):694–701. https://doi.org/10.1093/ajcn/72.3.694.
21. de Castro SLG, de Oliveira FS, da Silva MÍ, Sousa MFE, MeiraGTF, Albuquerque SACP. Evaluation of the functionality and mo-bility of community-dwelling older adults in primary health care.Rev Bras Geriatr Gerontol. 2019;22(5):e190086. https://doi.org/10.1590/1981-22562019022.190086.
22. Denise K. Houston, Rebecca H. Neiberg, Janet A. Tooze, DorothyB. Hausman, Mary Ann Johnson, Jane A. Cauley, Doug C. Bauer,M. Kyla Shea, Gary G. Schwartz, Jeff D. Williamson, Tamara B.
320 Int J Diabetes Dev Ctries (2021) 41:314–321
Harris, Stephen B Kritchevsky, for the Health ABC Study, Low 25-hydroxyvitamin D predicts the onset of mobility limitation anddisability in community-dwelling older adults: the Health ABCStudy, J Gerontol Ser A, 68, 2, February 2013, Pages 181–187.https://doi.org/10.1093/gerona/gls136
23. Stenholm S, Shardell M, Bandinelli S, Guralnik JM, Ferrucci L.Physiological factors contributing to mobility loss over 9 years offollow-up—results from the InCHIANTI study. J Gerontol Ser A.2015;70(5):591–7. https://doi.org/10.1093/gerona/glv004.
24. Gale CR, Cooper C, Sayer AA. Prevalence of frailty and disability:findings from the English Longitudinal Study of Ageing, Age andAgeing. 2015;44(1):162–5. https://doi.org/10.1093/ageing/afu148.
25. Yeom HA, Baldwin CM, Lee MA, Kim SJ. Factors affecting mo-bility in community-dwelling older Koreans with chronic illnesses.Asian Nurs Res (Korean Soc Nurs Sci). 2015;9(1):7–13. https://doi.org/10.1016/j.anr.2014.09.005.
26. Leiva AM, Troncoso-Pantoja C, Martínez-Sanguinetti MA,Petermann-Rocha F, Poblete-Valderrama F, Cigarroa-Cuevas I,et al. Factors associated with falls in older adults in Chile.Analysis of the National Health Survey 2009-2010. Rev MédChile. 2019;147(7):877–86. https://doi.org/10.4067/S0034-98872019000700877.
27. Chiba Y, Kimbara Y, Kodera R, Tsuboi Y, Sato K, Tamura Y, et al.Risk factors associated with falls in elderly patients with type 2diabetes. J Diabetes Comp. 2015;29(7):898–902. https://doi.org/10.1016/j.jdiacomp.2015.05.016.
28. SaraivaMSO. Relação entre pressão plantar, mobilidade, equilíbrioe risco de queda em idosos diabéticos. [Relation between plantarpressure, mobility, balance and risk of falls in diabetic elderly].Portugal. MS Thesis. College of Health Technology of Coimbra(ESTeSC); 2017. Available from: http://hdl.handle.net/10400.26/18831. Accessed 27 Apr 2020.
29. Nunes JD, Saes MO, Nunes BP, Siqueira FCV, Soares DC, FassaMEG, et al. Functional disability indicators and associated factorsin the elderly: a population-based study in Bagé, RioGrande do Sul,Brazil. Epidemiol Serv Saúde. 2017;26(2):295–304. https://doi.org/10.5123/s1679-49742017000200007.
30. Santos KA, Koszuoski R, Costa JSD, Pattussi MP. Factors associ-ated with functional incapacity among the elderly in Guatambu,Santa Catarina State, Brazil. Rio de Janeiro Cad Saúde Pública.2007;23(11):2781–8. ht tps: / /doi .org/10.1590/S0102-311X2007001100025.
31. Quartuccio M, Buta B, Kalyani RR. Comparative effectiveness forglycemic control in older adults with diabetes. Curr Geri Rep.2017;6:175–86. https://doi.org/10.1007/s13670-017-0215-z.
32. Kalyani RR, Tian J, Xue QL, Walston J, Cappola AR, Fried LP,et al. Hyperglycemia and incidence of frailty and lower extremitymobility limitations in older women. J AmGeriatr Soc. 2012;60(9):1701–7. https://doi.org/10.1111/j.1532-5415.2012.04099.x.
33. Bandeen-Roche K, Seplaki CL, Huang J, Buta B, Kalyani RR,Varadhan R, et al. Frailty in older adults: a nationally representativeprofile in the United States. J Gerontol Biol A Sci Med Sci.2015;70(11):1427–34. https://doi.org/10.1093/gerona/glv133.
34. Kim SJ, KimDJ. Alcoholism and diabetes mellitus. DiabetesMetabJ. 2012;36:108–15. https://doi.org/10.4093/dmj.2012.36.2.108.
35. Palma R, Conti MHS, Quintino NM, et al. Functional capacity andits associated factors in the elderly with low back pain. Acta OrtopBras. 2014;22(6):295–9. https://doi.org/10.1590/1413-78522014220600890.
36. Zarzeczny R, Nawrat-Szołtysik A, Polak A, Maliszewski J,Kiełtyka A, Matyja B, et al. Aging effect on the instrumentedTimed-Up-and-Go test variables in nursing home women aged80–93 years. Biogerontology. 2017;18(4):651–63. https://doi.org/10.1007/s10522-017-9717-5.
37. Chang SA. Smoking and type 2 diabetes mellitus. Diabetes MetabJ. 2012;36:399–403. https://doi.org/10.4093/dmj.2012.36.6.399.
38. Akter S, GotoA,Mizoue T. Smoking and the risk of type 2 diabetesin Japan: a systematic review and meta-analysis. J Epidemiol.2017;27:553–61. https://doi.org/10.1016/j.je.2016.12.017.
39. de Matos Nascimento C, Mambrini JV, de Oliveira CM, GiacominKC, Peixoto SV. Diabetes, hypertension and mobility amongBrazilian older adults: findings from the Brazilian NationalHousehold Sample Survey (1998, 2003 and 2008). BMC PublicHealth. 2015;15:591. https://doi.org/10.1186/s12889-015-1956-2.
40. Danielewicz AL, Barbosa AR, Del Duca GF. Nutritional status,physical performance and functional capacity in an elderly popula-tion in southern Brazil. Rev Assoc Med Bras. 2014;60(3):242–8.https://doi.org/10.1590/1806-9282.60.03.0013.
41. Neri SGR. Jóia LC, Kawano MM. Abdominal obesity can increasethe risk of falls in elderly women. Hígia Rev Ciências da Saúde doOeste Baiano. 2016; 1(1). Available from: http://www.fasb.edu.br/revista/index.php/higia/article/view/107 Accessed 27 april 2020.
42. Neri SGR, Gadelha AB, Correia ALM, et al. Association betweenobesity, risk of falls and fear of falling in older women. Rev BrasCineantropometria Desempenho Hum. 2017;19(4):450–8Available from: http://www.scielo.br/scielo.php?script=sci_arttext&pid=S1980-00372017000400450. Accessed 27 april 2020.
43. Ramsay SE, Arianayagam DS, Whincup PH, et al. Cardiovascularrisk profile and frailty in a population-based study of older Britishmen. Heart J. 2015;101:616–22. https://doi.org/10.1136/heartjnl-2014-306472.
44. Vieira DCL, Tibana RA, Tajra V, da Cunha ND, de Farias DL, deOliveira SA, et al. Decreased functional capacity and musclestrength in elderly women with metabolic syndrome. Clin IntervAging. 2013;8:1377–86. https://doi.org/10.2147/CIA.S50333.
45. Souza SW, Prestes J, Schwerz FS, Navalta JW, Tibana RA, daCunha ND. Relation between relative handgrip strength, chrono-logical age and physiological age with lower functional capacity inolder women. Open Access J Sports Med. 2019;10:185–90. https://doi.org/10.2147/OAJSM.S227720.
Publisher’s note Springer Nature remains neutral with regard to jurisdic-tional claims in published maps and institutional affiliations.
321Int J Diabetes Dev Ctries (2021) 41:314–321
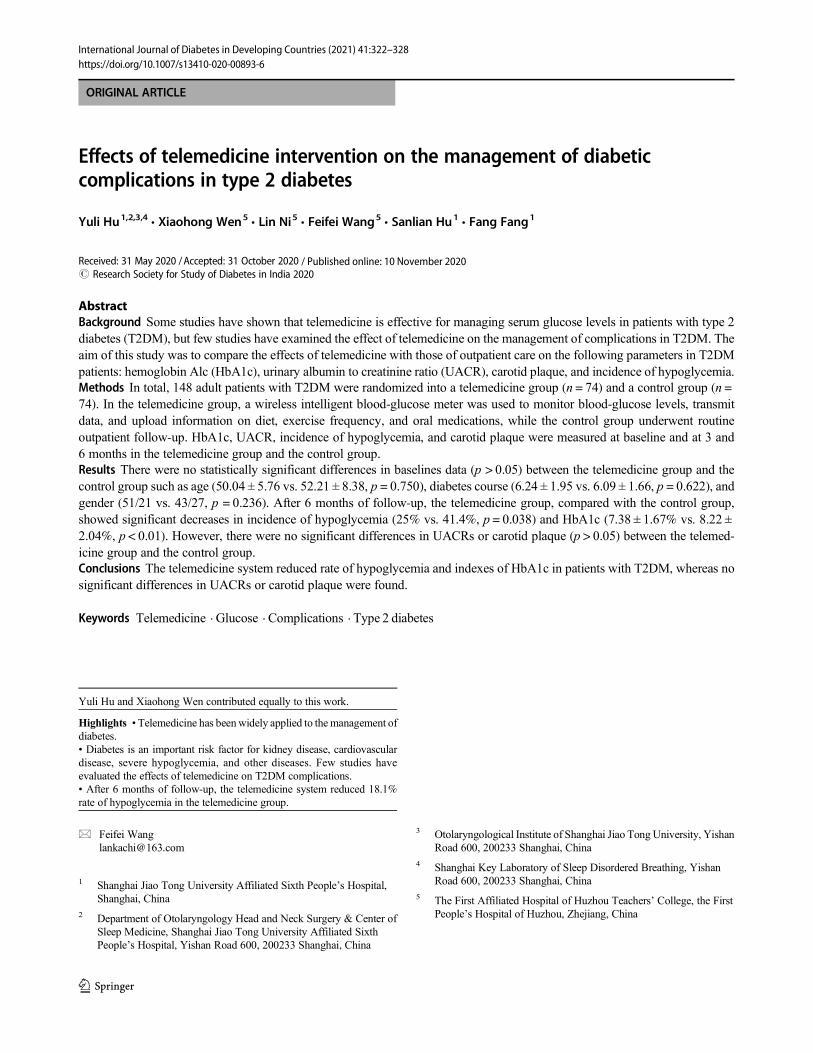
ORIGINAL ARTICLE
Effects of telemedicine intervention on the management of diabeticcomplications in type 2 diabetes
Yuli Hu1,2,3,4& Xiaohong Wen5
& Lin Ni5 & Feifei Wang5& Sanlian Hu1
& Fang Fang1
Received: 31 May 2020 /Accepted: 31 October 2020# Research Society for Study of Diabetes in India 2020
AbstractBackground Some studies have shown that telemedicine is effective for managing serum glucose levels in patients with type 2diabetes (T2DM), but few studies have examined the effect of telemedicine on the management of complications in T2DM. Theaim of this study was to compare the effects of telemedicine with those of outpatient care on the following parameters in T2DMpatients: hemoglobin Alc (HbA1c), urinary albumin to creatinine ratio (UACR), carotid plaque, and incidence of hypoglycemia.Methods In total, 148 adult patients with T2DM were randomized into a telemedicine group (n = 74) and a control group (n =74). In the telemedicine group, a wireless intelligent blood-glucose meter was used to monitor blood-glucose levels, transmitdata, and upload information on diet, exercise frequency, and oral medications, while the control group underwent routineoutpatient follow-up. HbA1c, UACR, incidence of hypoglycemia, and carotid plaque were measured at baseline and at 3 and6 months in the telemedicine group and the control group.Results There were no statistically significant differences in baselines data (p > 0.05) between the telemedicine group and thecontrol group such as age (50.04 ± 5.76 vs. 52.21 ± 8.38, p = 0.750), diabetes course (6.24 ± 1.95 vs. 6.09 ± 1.66, p = 0.622), andgender (51/21 vs. 43/27, p = 0.236). After 6 months of follow-up, the telemedicine group, compared with the control group,showed significant decreases in incidence of hypoglycemia (25% vs. 41.4%, p = 0.038) and HbA1c (7.38 ± 1.67% vs. 8.22 ±2.04%, p < 0.01). However, there were no significant differences in UACRs or carotid plaque (p > 0.05) between the telemed-icine group and the control group.Conclusions The telemedicine system reduced rate of hypoglycemia and indexes of HbA1c in patients with T2DM, whereas nosignificant differences in UACRs or carotid plaque were found.
Keywords Telemedicine . Glucose . Complications . Type 2 diabetes
Yuli Hu and Xiaohong Wen contributed equally to this work.
Highlights •Telemedicine has beenwidely applied to themanagement ofdiabetes.• Diabetes is an important risk factor for kidney disease, cardiovasculardisease, severe hypoglycemia, and other diseases. Few studies haveevaluated the effects of telemedicine on T2DM complications.• After 6 months of follow-up, the telemedicine system reduced 18.1%rate of hypoglycemia in the telemedicine group.
* Feifei [email protected]
1 Shanghai Jiao Tong University Affiliated Sixth People’s Hospital,Shanghai, China
2 Department of Otolaryngology Head and Neck Surgery & Center ofSleep Medicine, Shanghai Jiao Tong University Affiliated SixthPeople’s Hospital, Yishan Road 600, 200233 Shanghai, China
3 Otolaryngological Institute of Shanghai Jiao Tong University, YishanRoad 600, 200233 Shanghai, China
4 Shanghai Key Laboratory of Sleep Disordered Breathing, YishanRoad 600, 200233 Shanghai, China
5 The First Affiliated Hospital of Huzhou Teachers’ College, the FirstPeople’s Hospital of Huzhou, Zhejiang, China
https://doi.org/10.1007/s13410-020-00893-6
/ Published online: 10 November 2020
International Journal of Diabetes in Developing Countries (2021) 41:322–328
Introduction
According to estimates of the International DiabetesFederation, the number of people with diabetes worldwidewas close to 425 million in 2017. By 2045, there areexpected to be almost 629 million cases, with an increasein the prevalence of diabetes to 10.4% [1]. More than90% of all diabetes cases are type 2 diabetes mellitus(T2DM) [2], which was the focus of this study. Diabetesis an important risk factor for kidney disease, cardiovas-cular disease, severe hypoglycemia, and other diseases[3]. Approximately 20–40% of diabetics have chronickidney disease (CKD) or end-stage renal disease, andthese renal pathologies also increase the risks of cardio-vascular disease and mortality [4]. CKD affects 13.4% ofthe global population, with a prevalence of 14.3% in low-and middle-income countries [5–7]. The World HealthOrganization predicts that the CKD-related mortality ratewill continue to increase, reaching 14 deaths per 100,000population by 2030 [5]. One marker for kidney disease isthe urine albumin to creatinine ratio (UACR), which wasused in this study. A common complication of diabetes ishypoglycemia, which at the very least negatively affectsthe quality of life of diabetic patients and can be fatal [8].Therefore, consistent control of diabetes is important toprevent acute pathologies such as hypoglycemia as wellas the longer-term risks of kidney and cardiovascularevents. Diabetes and its complications also impose aheavy economic burden on patients and society. TheWorld Health Organization estimates that T2DM and itscomplications will account for 15% of total health costsby 2021. By 2030, the economic loss associated withT2DM will reach $1.7 trillion worldwide [9]. One ap-proach to diabetes management is telemedicine, which isdefined as the remote distribution of healthcare via infor-mation and communication technologies to people in dif-ferent cities and suburban areas [10].
Telemedicine has been widely applied to the managementof chronic diseases such as chronic viral hepatitis, chronicobstructive pulmonary disease patients, and hypertension[11–13]. The field of diabetes already benefits from telemed-icine approaches, which allow patients and physicians to com-municate electronically [14] as well as provide online diabeteseducation and regular physical activity management [15, 16],and programs to improve depression and self-efficacy in dia-betics [17, 18]. Telemedicine can result in decreased hemo-globin Alc (HbA1c) levels, improved quality of life, and re-duced economic costs for diabetics [19–21]. However, fewstudies have evaluated the effects of telemedicine on T2DMcomplications including cardiovascular disease, kidney dis-ease, and hypoglycemia. Therefore, the aim of this studywas to determine the efficacy of telemedicine in the manage-ment of T2DM complications by measuring participants’
carotid plaque levels, UACRs, and the incidence ofhypoglycemia.
Methods
Study design
In this randomized controlled trial, 148 T2DM patients wererandomized 1:1 using a random number table into a telemed-icine group (n = 74) and a control group (n = 74). Doctors whowere not part of the study prepared 148 sealed opaque enve-lopes containing odd and even numbers, and patients random-ly drew the envelopes for their group assignment (Fig. 1).
Definitions
Type 2 diabetes mellitus (T2DM) is an endocrine disease char-acterized by insulin resistance; pancreatic β cell function isabnormal and accompanied by relative insulin deficiency [22].
The American Diabetes Society Working Group defineshypoglycemia as a (fasting or non-fasting) blood-glucose lev-el ≤ 3.9 mmol/L and divides it into five categories. In ourstudy, we encountered all types of hypoglycemia, except forsevere hypoglycemia events [23].
One study identified carotid plaques as carotid intima-media thickness (CIMT) ≥ 1.5 mm and as a site of focal thick-ening (50% thicker than the surrounding segments) [24].
Study participants
The study enrolled 168 patients who visited the Department ofEndocrinology of the First People’s Hospital of Huzhou be-tween October 2017 and March 2019; 20 declined participa-tion after consent. The inclusion criteria were a diagnosis ofT2DM more than 3 months prior, age 18–70 years, ability touse a smartphone and blood-glucose meter, and voluntaryparticipation. The exclusion criteria were severe heart, liver,or renal insufficiency; a history of cancer, coronary heart dis-ease, or cerebral infarction; hyperthyroidism or hypothyroid-ism; severe infection; current treatment with adrenocorticalhormones or other drugs that affect blood-glucose levels;mental illness, communication disorder, or blindness; and ma-jor trauma, major surgery, or any severe illness.
Intervention
Each month, both groups of patients received diabetes educa-tion from a diabetes specialist nurse pertaining to self-monitoring of blood-glucose levels, dietary habits, importanceof medication timing, and physical activity. Participants withcarotid plaque received atorvastatin 20 mg/day or aspirin100 mg/day. The study duration was 6 months. The
323Int J Diabetes Dev Ctries (2021) 41:322–328
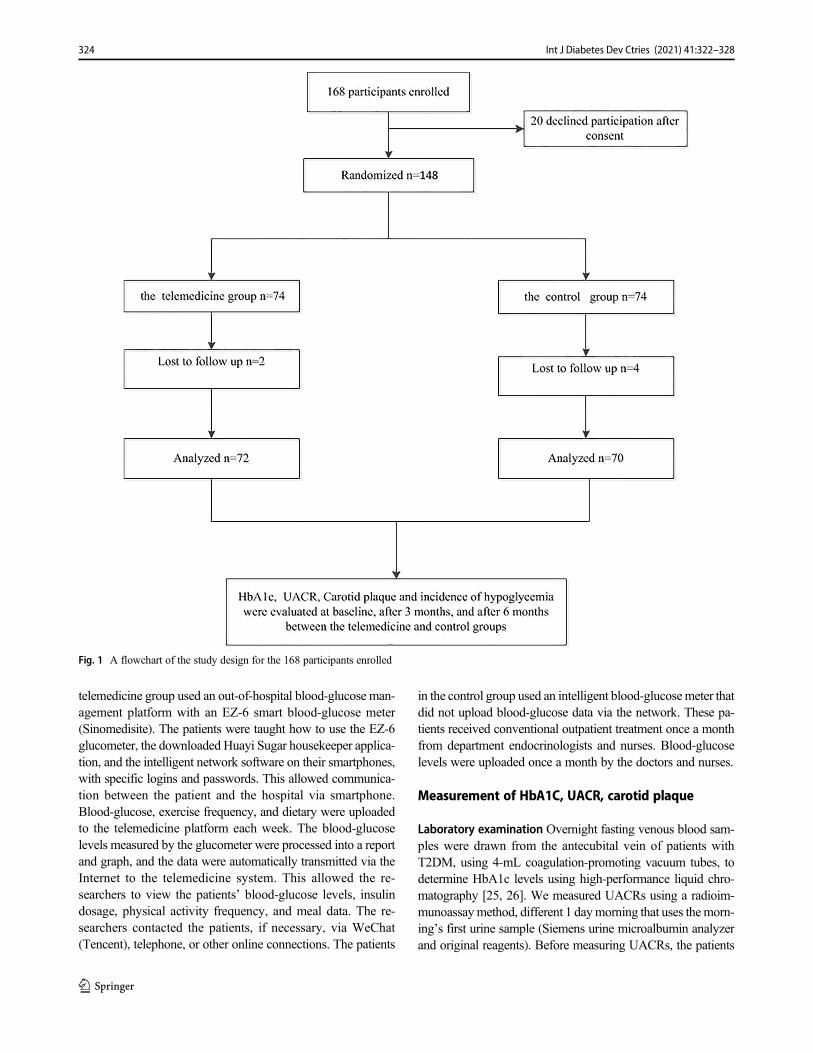
telemedicine group used an out-of-hospital blood-glucose man-agement platform with an EZ-6 smart blood-glucose meter(Sinomedisite). The patients were taught how to use the EZ-6glucometer, the downloaded Huayi Sugar housekeeper applica-tion, and the intelligent network software on their smartphones,with specific logins and passwords. This allowed communica-tion between the patient and the hospital via smartphone.Blood-glucose, exercise frequency, and dietary were uploadedto the telemedicine platform each week. The blood-glucoselevels measured by the glucometer were processed into a reportand graph, and the data were automatically transmitted via theInternet to the telemedicine system. This allowed the re-searchers to view the patients’ blood-glucose levels, insulindosage, physical activity frequency, and meal data. The re-searchers contacted the patients, if necessary, via WeChat(Tencent), telephone, or other online connections. The patients
in the control group used an intelligent blood-glucosemeter thatdid not upload blood-glucose data via the network. These pa-tients received conventional outpatient treatment once a monthfrom department endocrinologists and nurses. Blood-glucoselevels were uploaded once a month by the doctors and nurses.
Measurement of HbA1C, UACR, carotid plaque
Laboratory examination Overnight fasting venous blood sam-ples were drawn from the antecubital vein of patients withT2DM, using 4-mL coagulation-promoting vacuum tubes, todetermine HbA1c levels using high-performance liquid chro-matography [25, 26]. We measured UACRs using a radioim-munoassaymethod, different 1 daymorning that uses themorn-ing’s first urine sample (Siemens urine microalbumin analyzerand original reagents). Before measuring UACRs, the patients
Fig. 1 A flowchart of the study design for the 168 participants enrolled
324 Int J Diabetes Dev Ctries (2021) 41:322–328
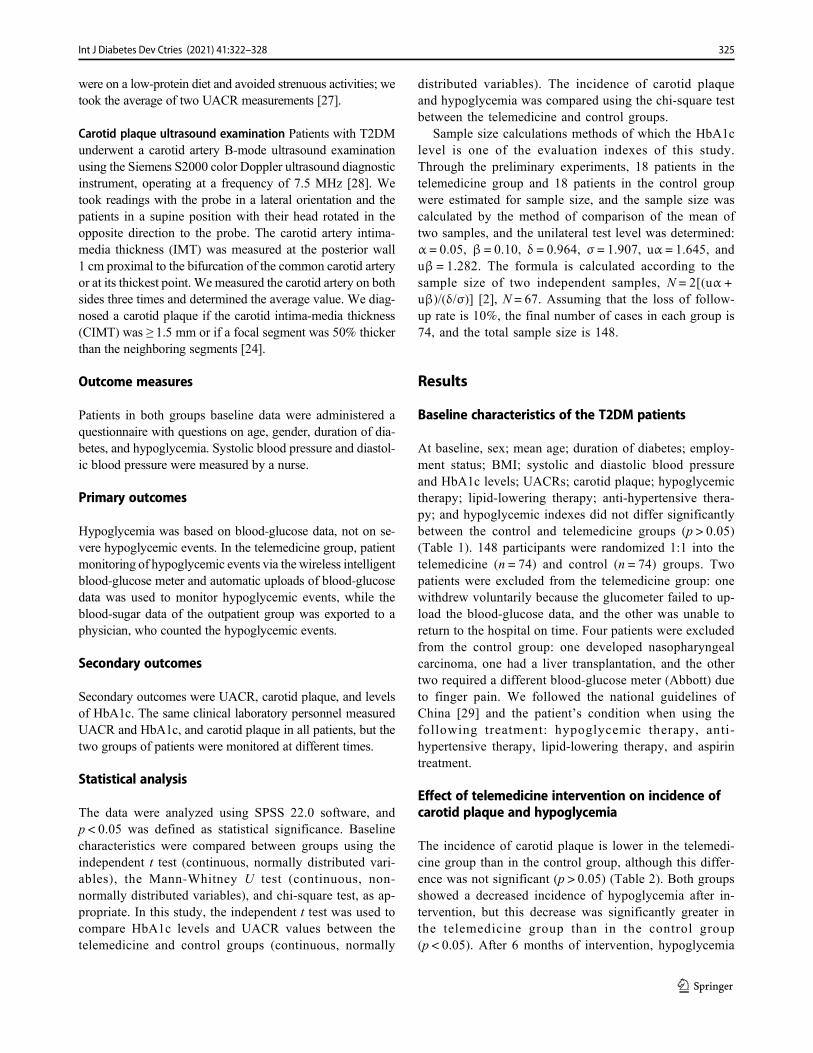
were on a low-protein diet and avoided strenuous activities; wetook the average of two UACR measurements [27].
Carotid plaque ultrasound examination Patients with T2DMunderwent a carotid artery B-mode ultrasound examinationusing the Siemens S2000 color Doppler ultrasound diagnosticinstrument, operating at a frequency of 7.5 MHz [28]. Wetook readings with the probe in a lateral orientation and thepatients in a supine position with their head rotated in theopposite direction to the probe. The carotid artery intima-media thickness (IMT) was measured at the posterior wall1 cm proximal to the bifurcation of the common carotid arteryor at its thickest point. We measured the carotid artery on bothsides three times and determined the average value. We diag-nosed a carotid plaque if the carotid intima-media thickness(CIMT) was ≥ 1.5 mm or if a focal segment was 50% thickerthan the neighboring segments [24].
Outcome measures
Patients in both groups baseline data were administered aquestionnaire with questions on age, gender, duration of dia-betes, and hypoglycemia. Systolic blood pressure and diastol-ic blood pressure were measured by a nurse.
Primary outcomes
Hypoglycemia was based on blood-glucose data, not on se-vere hypoglycemic events. In the telemedicine group, patientmonitoring of hypoglycemic events via the wireless intelligentblood-glucose meter and automatic uploads of blood-glucosedata was used to monitor hypoglycemic events, while theblood-sugar data of the outpatient group was exported to aphysician, who counted the hypoglycemic events.
Secondary outcomes
Secondary outcomes were UACR, carotid plaque, and levelsof HbA1c. The same clinical laboratory personnel measuredUACR and HbA1c, and carotid plaque in all patients, but thetwo groups of patients were monitored at different times.
Statistical analysis
The data were analyzed using SPSS 22.0 software, andp < 0.05 was defined as statistical significance. Baselinecharacteristics were compared between groups using theindependent t test (continuous, normally distributed vari-ables), the Mann-Whitney U test (continuous, non-normally distributed variables), and chi-square test, as ap-propriate. In this study, the independent t test was used tocompare HbA1c levels and UACR values between thetelemedicine and control groups (continuous, normally
distributed variables). The incidence of carotid plaqueand hypoglycemia was compared using the chi-square testbetween the telemedicine and control groups.
Sample size calculations methods of which the HbA1clevel is one of the evaluation indexes of this study.Through the preliminary experiments, 18 patients in thetelemedicine group and 18 patients in the control groupwere estimated for sample size, and the sample size wascalculated by the method of comparison of the mean oftwo samples, and the unilateral test level was determined:α = 0.05, β = 0.10, δ = 0.964, σ = 1.907, uα = 1.645, anduβ = 1.282. The formula is calculated according to thesample size of two independent samples, N = 2[(uα +uβ)/(δ/σ)] [2], N = 67. Assuming that the loss of follow-up rate is 10%, the final number of cases in each group is74, and the total sample size is 148.
Results
Baseline characteristics of the T2DM patients
At baseline, sex; mean age; duration of diabetes; employ-ment status; BMI; systolic and diastolic blood pressureand HbA1c levels; UACRs; carotid plaque; hypoglycemictherapy; lipid-lowering therapy; anti-hypertensive thera-py; and hypoglycemic indexes did not differ significantlybetween the control and telemedicine groups (p > 0.05)(Table 1). 148 participants were randomized 1:1 into thetelemedicine (n = 74) and control (n = 74) groups. Twopatients were excluded from the telemedicine group: onewithdrew voluntarily because the glucometer failed to up-load the blood-glucose data, and the other was unable toreturn to the hospital on time. Four patients were excludedfrom the control group: one developed nasopharyngealcarcinoma, one had a liver transplantation, and the othertwo required a different blood-glucose meter (Abbott) dueto finger pain. We followed the national guidelines ofChina [29] and the patient’s condition when using thefollowing treatment: hypoglycemic therapy, anti-hypertensive therapy, lipid-lowering therapy, and aspirintreatment.
Effect of telemedicine intervention on incidence ofcarotid plaque and hypoglycemia
The incidence of carotid plaque is lower in the telemedi-cine group than in the control group, although this differ-ence was not significant (p > 0.05) (Table 2). Both groupsshowed a decreased incidence of hypoglycemia after in-tervention, but this decrease was significantly greater inthe telemedicine group than in the control group(p < 0.05). After 6 months of intervention, hypoglycemia
325Int J Diabetes Dev Ctries (2021) 41:322–328
and carotid plaque are present in 18 (25%) and 29(41.4%), 27(37.5%), and 27(38.6%) patients in the tele-medicine and control groups, respectively (Table 2).
Effect of telemedicine intervention on HbA1c levelsand UACR
After 3 and 6months, the HbA1c levels are significantly lowerin the telemedicine group than in the control group (allp < 0.01) (Table 2). However, there is no significant differencein UACRs between the two groups (p > 0.05) (Table 2).
Discussion
In our 6-month study, the incidence of carotid plaque tendedto decrease in the telemedicine group from 30 (41.7%) to27(37.5%), whereas it tended to increase in the control groupfrom 22 (31.4%) to 27 (38.6), but there was no significantdifference between the two groups (p > 0.05). It may be thatmore time was needed for a significant difference to becomeapparent or that other factors are involved. The risk factors forcarotid plaque include blood-glucose level, smoking, sex, andblood fibrin level [30, 31]. Further studies with larger samplesizes and longer intervention times are needed to confirmthese results.
The 2002 clinical practice guidelines of the NationalKidney Foundation for CKD recommend using the UACRinstead of 24-h urinary protein quantification to evaluate uri-nary protein excretion in patients with kidney disease [32].The UACR is an accurate indicator of renal protein excretionand early diabetic nephropathy [33]. Therefore, we used theUACR to detect early diabetic nephropathy in patients withT2DM. After 6 months of telemedicine intervention, theUACR in the telemedicine group compared with the controlgroup is not statistically significant (p > 0.05). There are manyadditional risk factors for diabetic nephropathy, includinghigh blood-glucose and lipid levels, high blood pressure,smoking history, and a genetic history of diabetic nephropathy[34]. The lack of a significant difference in UACR values inthis study may have been due to the small sample size or afollow-up period that was insufficient to detect changes.
Periods of hypoglycemia increase the incidence of falls andcardiovascular and cerebrovascular disease, as well as medicalexpenses and hospital stays [35, 36]. Consequently, it is
Table 2 Comparisons between the telemedicine and control groups interms of metabolic and T2DM complications measures
Measures Telemedicine Control p value
Carotid plaque
3 months, n (%) 29 (40.3) 25 (35.7) 0.575
6 months, n (%) 27 (37.5) 27 (38.6) 0.895
Hypoglycemia
3 months, n (%) 26 (36.1) 30 (42.9) 0.411
6 months, n (%) 18 (25) 29 (41.4) 0.038
HbA1c (%)
3 months 7.51 ± 1.82 8.42 ± 2.29 0.009
6 months 7.38 ± 1.67 8.22 ± 2.04 0.008
UACR (mg/mmol)
3 months 4.29 ± 1.38 4.24 ± 1.33 0.830
6 months 4.36 ± 1.45 4.56 ± 1.11 0.367
Data are means ± SD (standard deviation)
Table 1 Comparisons betweenthe telemedicine and the controlgroups at baseline
Characteristic Telemedicine (n = 72) Control (n = 70) p value
Gender(male/female) 51/21 43/27 0.236
Age(years) 50.04 ± 5.76 52.21 ± 8.38 0.750
Duration of diabetes (years) 6.24 ± 1.95 6.09 ± 1.66 0.622
Employment(yes/no) 49/23 45/25 0.635
BMI (kg/m2) 24.69 ± 3.39 24.05 ± 3.98 0.333
SBP (mmHg) 130.22 ± 14.50 127.74 ± 14.00 0.302
DBP (mmHg) 80.08 ± 9.77 79.44 ± 9.67 0.695
HbA1C (%) 8.96 ± 1.78 8.63 ± 1.62 0.246
UACR (mg/mmol) 4.41 ± 1.45 4.22 ± 1.31 0.398
Carotid plaque, n (%) 30(41.7) 22(31.4) 0.205
Hypoglycemia, n (%) 31(43.1) 33(47.1) 0.625
Aspirin, n (%) 20(27.8) 16(22.9) 0.500
Hypoglycemic therapy, n (%) 43(59.7) 46(65.7) 0.460
Lipid-lowering therapy, n (%) 21(29.2) 15(21.4) 0.289
Anti-hypertensive therapy, n (%) 11(15.3) 8(11.4) 0.501
Data are mean ± SD (standard deviation)
326 Int J Diabetes Dev Ctries (2021) 41:322–328
important to prevent hypoglycemia. Telemedicine interven-tion led to a lower incidence of hypoglycemia compared withthe control group (p = 0.038). The telemedicine platform mayhave improved the patients’ understanding of hypoglycemia,enabling them to take measures to prevent it. Furthermore,medical staff may have checked blood-glucose levels moreregularly and provided timely treatment advice to prevent hy-poglycemia in the telemedicine group compared with the con-trol group. Similar to our study, a meta-analysis found thattelemedicine intervention decreased the incidence of hypogly-cemia [19].
The results of this randomized controlled trial imply thattelemedicine improved glucose metabolism in terms ofHbA1C levels, similar to other studies showing that telemed-icine reduced HbA1c [37, 38].
We determined the reason for the better glycemic con-trol in the patients of the telemedicine group than inothers after the intervention. The telemedicine systemwas established so that patients monitored their blood-glucose levels while connected to the WI-FI network,and the data were automatically transmitted via theInternet to the telemedicine system. The research teamregularly checked the patient data and contacted patientsin cases of abnormality to modify the treatment.Maintaining low HbA1c levels decreases the risk of mi-crovascular complications, death and cardiac infarction,and improves the life quality of patients.
This study has a few limitations. First, there was noblinding of the outcome measures, because one examiner(a member of the study team) measured all indicators inthe T2DM patients. However, a lack of blinding has lesseffect on objectively assessed outcomes [39]. Second, thestudy duration of 6 months was too short, and/or the sam-ple size was too small to observe differences in someindicators, such as carotid plaque and UACR. Therefore,increasing the study duration and sample size is necessaryto determine the effects of telemedicine in T2DM patients.Third, all participants were from a single hospital, andthus the generalizability of our results may be limited.
Conclusions
Our study found that the telemedicine system can reduceHbA1c levels and the occurrence of hypoglycemic events.We found no significant effects of telemedicine on UACRsor carotid plaque results.
Funding This study was supported by the Zhejiang ProvincialDepartment of Science and Technology Programme: Establishment andApplication of Blood Glucose Management Platform after DiabetesDischarge (grant number 2016 c33217).
Compliance with ethical standards The study is approved bythe Ethics Committee of The First People’s Hospital of Huzhou, ZhejiangProvince, China (no. 2016033), and all subjects provided written in-formed consent prior to participating.
References
1. International Diabetes Federation. IDF Diabetes Atlas. 9th ed.Brussels: International Diabetes Federation; 2019.
2. World Health Organization. Definition, diagnosis and classificationof diabetes mellitus and its complications [EB/OL]. Report of aWHO Consultation, 1999.
3. Fowler MJ. Microvascular and macrovascular complications of di-abetes. Clin Diabetes. 2011;26(2):77–82.
4. Weiner DE, Sarnak MJ. A decade after the KDOQI CKD guide-lines: impact on the cardiovascular disease-CKD paradigm. Am JKidney Dis. 2012;60(5):710–2.
5. Webster AC, Nagler EV,Morton RL, et al. Chronic kidney disease.Lancet [Internet]. Elsevier Ltd; 2017; 389(10075): 1238–1252.Available from: https://doi.org/10.1016/S0140-6736(16)32064-5.
6. Ene-lordache B, Perico N, Bikbov B, et al. Chronic kidney diseaseand cardiovascular risk in six regions of the world (ISN-KDDC): across-sectional study. Lancet Glob Health. 2016;4(5):e307–19.
7. Hill NR, Fatoba ST, Oke JL, Hirst JA, O’Callaghan CA, LassersonDS, et al. Global prevalence of chronic kidney disease-a systematicreview and meta-analysis. PLoS One. 2016;11(7):e0158765.
8. Oyer DS. The science of hypoglycemia in patients with diabetes.Curr Diabetes Rev. 2013;9(3):195–208.
9. Economic costs of diabetes in the U.S. in 2017. Diabetes Care.2018;41:917–28.
10. Wolk K,Marasek K, GlinkowskiW. Telemedicine as a special caseof machine translation. Comput Med Imaging Graphics J ComputMed Imaging Soc. 2015;46:249–56.
11. Keogh K, Clark P, Valery PC, McPhail SM, Bradshaw C, Day M,et al. Use of telehealth to treat and manage chronic viral hepatitis inregional Queensland. J Telemed Telecare. 2016;22(8):459–64.
12. Dyrvig AK, Gerke O, Kidholm K, et al. A cohort study followingup on a randomised controlled trial of a telemedicine application inCOPD patients. J Telemed Telecare. 2015;21(7):377–84.
13. Omboni S, Ferrari R. The role of telemedicine in hypertensionmanagement: focus on blood pressure telemonitoring. CurrHypertens Rep. 2015;17(4):535.
14. Ayatollahi H, Hasannezhad M, Fard HS, Haghighi MK. Type 1diabetes self-management: developing a web-based telemedicineapplication. Health Inf Manag J. 2016;45(1):16–26.
15. Glasgow RE, Kurz D, King D, et al. Twelve-month outcomes of anInternet-based diabetes self-management support program. PatientEduc Couns. 2012;87(1):81–92.
16. Fukuoka Y, Gay CL, Joiner KL, Vittinghoff E. A novel diabetesprevention intervention using a mobile app: a randomized con-trolled trial with overweight adults at risk. Am J Prev Med.2015;49(2):223–37.
17. Yu CH, Parsons JA, Mamdani M, Lebovic G, Hall S, Newton D,et al. A web-based intervention to support self-management of pa-tients with type 2 diabetes mellitus: effect on self-efficacy, self-careand diabetes distress. BMC Med Inf Decis Making. 2014;14(1):117.
18. Nobis S, Lehr D, Ebert DD, Baumeister H, Snoek F, Riper H, et al.Efficacy of a web-based intervention with mobile phone support intreating depressive symptoms in adults with type 1 and type 2diabetes: a randomized controlled trial. Diabetes Care.2015;38(5):776–83.
327Int J Diabetes Dev Ctries (2021) 41:322–328
19. Yuli H, Xiaohong W, Feifei W, et al. Effect of telemedicine inter-vention on hypoglycaemia in diabetes patients: a systematic reviewand meta-analysis of randomised controlled trials. J TelemedTelecare. 2019;25(7):402–13.
20. Kempf K, Altpeter B, Berger J, Reuß O, Fuchs M, Schneider M,et al. Efficacy of the Telemedical lifestyle intervention programTeLiPro in advanced stages of type 2 diabetes: a randomized con-trolled trial. Diabetes Care. 2017;40(7):863–71.
21. Zhai Y, Zhu W, Cai Y, Sun DX, Zhao J. Clinical-and cost-effec-tiveness of telemedicine in type 2 diabetes mellitus: a systematicreview and meta-analysis. Medicine. 2014;93(28):e312.
22. Colberg SR, Sigal RJ, Yardley JE, Riddell MC, Dunstan DW,Dempsey PC, et al. Physical activity/exercise and diabetes: a posi-tion statement of the American Diabetes Association. DiabetesCare. 2016;39(11):2065–79. https://doi.org/10.2337/dc16-1728.
23. American Diabetes Association Workgroup on Hypoglycemia.Defining and reporting hypoglycemia in diabetes: a report fromthe American Diabetes Association Workgroup on hypoglycemia.Diabetes Care. 2005;28(5):1245–9. https://doi.org/10.2337/diacare.28.5.1245.
24. Li C, Engström G, Berglund G, et al. Incidence of ischemic strokein relation to asymptomatic carotid artery atherosclerosis in subjectswith normal blood pressure. A prospective cohort study.Cerebrovasc Dis. 2008;26(3):297–303. https://doi.org/10.1159/000149577.
25. Kawamori R, Yamasaki Y, Matsushima H, Nishizawa H, Nao K,Hougaku H, et al. Prevalence of carotid atherosclerosis in diabeticpatients. Ultrasound high-resolution B-mode imaging on carotidarteries. Diabetes Care. 1992;15(10):1290–4. https://doi.org/10.2337/diacare.15.10.1290.
26. Penttilä I, Penttilä K, Holm P, et al. Methods, units and qualityrequirements for the analysis of haemoglobin A1c in diabetesmellitus. World J Methodol. 2016;6(2):133–42. Published 2016Jun 26. https://doi.org/10.5662/wjm.v6.i2.133.
27. Ke SU. The correlation analysis on urinary albumin-to-creatinineratio, carotid atherosclerosis and the risk factors of CAS in patientswith type 2 [D]. Zhengzhou University (in Chinese), 2016. https://k n s 8 . c n k i . n e t /KCMS / d e t a i l / d e t a i l . a s p x ? d b c o d e=CMFD&dbname=CMFD201701&filename=1016232494.nh&v=A lgnMm9z7 rRY2 l 87 rZyUz2 lOpVLXY10FQDOTYBpAPlM3OQ7jxJTnUAqpgJtLl18s.
28. Miao Li. Correlation analysis of bilirubin and uric acid levels withcarotid plaque for-mation in patients with type 2 diabetes
mellitus[D]. Jilin University (in Chinese), 2020. https://kns8.cnki.net/kns/DefaultResult/Index?dbcode=SCDB&kw=10.27162%2Fd.cnki.gjlin.2020.006032&korder=DOI.
29. Guidelines for the prevention and treatment of type 2 diabetes inChina (2017 Edition). Chin J Pract Intern Med. 2018;38(04):292–344. https://doi.org/10.19538/j.nk2018040108.
30. Kreutzenberg SVD, Coracina A, Volpi A, et al. Microangiopathy isindependently associated with presence, severity and compositionof carotid atherosclerosis in type 2 diabetes. NutrMetab CardiovascDis. 2010;21(4):286–93.
31. Santos IS, Bittencourt, Márcio S, et al. Carotid intima-media thick-ness value distributions in the Brazilian longitudinal study of adulthealth (ELSA-Brasil). Atherosclerosis. 2014;237(1):227–35.
32. Andrew S, Levey MD, Josef Coresh PD, et al. National KidneyFoundation. K/DOQI for chronic kidney disease: evaluation classi-fication, and stratification. Am J Kidney Dis. 2002;39(2 Suppl 1):S1–S266.
33. Ng W, Lui KF, Thai A. Evaluation of a rapid screening test formicro albuminuria with a spot meusurement of uriaealbumin-creatinine ratio. Diabet Med. 2000;17(1):7–10.
34. Dronavalli S, Duka I, Bakris GL. The pathogenesis of diabeticnephropathy. Nat Clin Pract Endocrinol Metab. 2008;4(8):444–52.
35. Elliott MB, Schafers SJ, McGill JB, Tobin GS. Prediction and pre-vention of treatment-related inpatient hypoglycemia. Diabetes SciTechnol. 2012;6:302–29.
36. Association WHOAD. Defining and reporting hypoglycemia indiabetes: a report from the American Diabetes AssociationWorkgroup on hypoglycemia. Diabetes Care. 2005;28(5):1245–9.
37. Jeong JY, Jeon JH, Bae KH, et al. Smart care based ontelemonitoring and telemedicine for type 2 diabetes care: multi-center randomized controlled trial. Telemed e-Health. 2018;24(8):563–70.
38. Zhou P, Xu L, Liu X, et al. Web-based telemedicine for manage-ment of type 2 diabetes through glucose uploads: a randomizedcontrolled trial. Int J Clin Exp Pathol. 2014;7(12):8848–54.
39. Lesley W, Matthias E, Lise Lotte G, et al. Empirical evidence ofbias in treatment effect estimates in controlled trials with differentinterventions and outcomes: meta-epidemiological study. BMJ.2008;336(7644):601–5.
Publisher’s note Springer Nature remains neutral with regard to jurisdic-tional claims in published maps and institutional affiliations.
328 Int J Diabetes Dev Ctries (2021) 41:322–328
ORIGINAL ARTICLE
Lipohypertrophy in insulin injecting patients with diabetes mellitus:an under-recognized barrier for glycemic control
Rajinder Kumar1 & Riddhi Das Gupta1 & Sahana Shetty1 & C. S. Prabhu1,2& Kirthi Sathyakumar1,2 &
Mahesh Doddabelavangala Mruthyunjaya1 & Felix K. Jebasingh1& Mercy Inbakumari1 & Flory Christina1 & H. S. Asha1 &
Thomas Vizhalil Paul1 & Nihal Thomas1
Received: 9 July 2020 /Accepted: 28 October 2020# Research Society for Study of Diabetes in India 2020
AbstractBackground Lipohypertrophy is the one of the commonest local complications that significantly affects glycemic control inpatients of diabetes mellitus on treatment with insulin. Our study aimed at assessing the clinical and ultrasonographic charac-teristics and risk factors for lipohypertrophy on the abdomen in a cohort of insulin-injecting Indian diabetes patients.Materials Eighty-eight consecutive patients with type 1 (15/88) or type 2 diabetes mellitus (73/88) were included in this cross-sectional study conducted over a period of 6 months. The prevalence of lipohypertrophy and associated risk factors was assessedby clinical examination. A novel ultrasonographic characterisation of lipohypertrophy (LH) using a predetermined gradingsystem was performed by two sonologists who were blinded to the underlying clinical findings. Kappa statistics was used tocalculate the agreement between the clinical and ultrasound methods of detection of lipohypertrophy.Results The prevalence of lipohypertrophy was 68% on clinical examination and 90% on ultrasonography with moderate kappaagreement (60%). The commonest patterns on clinical and ultrasonographic assessment were Grade 2 (palpable and visible − 43%)and nodular hyperechoic subcutaneous dystrophy (33%), respectively. Duration of insulin use, incorrect site rotation, and repeatedneedle reuse (p < 0.01) were the most important risk factors. The total daily dose of insulin (p = 0.01) and mean Hba1c (p = 0.02)were significantly higher in those with clinically detected lipohypertrophy. The needle length, caliber, the mode of delivery, orregimen of insulin used did not significantly impact development of lipohypertrophy (p = 0.15).Conclusion A thorough clinical examination of insulin injection sites is of paramount importance in detecting lipohyperyrophy.Adequate control of risk factors can significantly impact insulin requirements and glycemic control, while ultrasonography canprove to be a novel and sensitive tool to detect abdominal lipohypertrophy in the majority of patients, even when clinicalexamination is non-contributory.
Keywords Lipohyeprtrophy . Insulin . Injection . Rotation . Diabetes
Introduction
Intensive insulin therapy is the corner stone of treatmentto achieve optimal glycemic control and reduce the long-term complications in type 1 diabetes mellitus and long-standing type 2 diabetes mellitus [1, 2]. This form of
therapy is associated with cutaneous complications likeerythema, pruritus, induration, lipohypertrophy, and atypi-cal cutaneous infections. Lipohypertrophy is one of thecommonest local complications associated with subcutane-ous insulin therapy and one of the important under-recognized causes for poor glycemic control [1]. Insulinlipohypertrophy denotes a benign abnormal accumulationof adipose tissue at the insulin injection site, with thelipogenic effect of insulin being postulated as one of thekey mechanisms [3]. However, factors like repeatedmicrotrauma from long-term injection use, reuse of bluntedneedles, and improper injection technique are suggested tohave an equally important contribution to the developmentof lipohypertrophy. The prevalence of lipohypertrophy in
* Nihal [email protected]
1 Department of Endocrinology, Diabetes and Metabolism, ChristianMedical College, Vellore 632004, Tamil Nadu, India
2 Department of Radiology, Christian Medical College, Vellore, TamilNadu, India
https://doi.org/10.1007/s13410-020-00889-2
/ Published online: 23 November 2020
International Journal of Diabetes in Developing Countries (2021) 41:329–336
insulin injecting patients with diabetes mellitus has rangedfrom 30 to 65 % in various studies [3–6].
Ultrasonographic screening of insulin injecting sitesfor lipohypertrophy has been shown to reveal a higherdetection rate of 86.5% when compared with 30.7% byclinical examination in a study by Natalia et al. [7].Ultrasonography may also help in the characterizationof insulin lipohypertrophy.
However, there is limited literature on the prevalence oflipohypertrophy in Indian subjects [8, 9]. The data on theultrasonographic characterization of these lesions and the riskfactors are also limited. Therefore, we undertook this studyto look at the prevalence of lipohypertrophy in insulininjecting patients with diabetes mellitus as detected by clin-ical examination and ultrasonography. We also studiedtheir characteristics on ultrasonography, the risk factors,and their association with glycemic status.
Material and methods
This was a cross-sectional study where in consecutive patientswith type 1 diabetes mellitus (T1DM) and type 2 diabetesmellitus (T2DM) on subcutaneous insulin injections attendingthe department of Endocrinology as an outpatient were re-cruited. Subjects using insulin pumps, pregnant women, thosepatients on immune-suppressive agents, and those with sec-ondary diabetes such as acute and chronic pancreatitis,fibrocalcific pancreatic diabetes, pancreatic cancers, acromeg-aly, Cushing's syndrome, hyperthyroidism, primary hyper-parathyroidism, primary hyperaldosteronism, drug-induceddiabetes, congenital and acquired lipodystrophic diabetes,and syndromic presentations were excluded.
Data were obtained regarding the age, sex, body mass in-dex (BMI), type of diabetes mellitus, time since diagnosis ofDM, duration of insulin use, insulin regimen, insulin injectingdevices, needle length, frequency of needle change, and ro-tation of insulin injecting site. All subjects underwent adetailed clinical examination including anthropometry.Hba1c measured by the high-performance liquid chroma-tography method (HPLC) within the past 3 months wastaken for the analysis.
The presence of lipohypertrophy was assessed in patientsby clinical examination of the abdomen by inspection andpalpation and were graded from 0 to 2 as follows: grade 0:no changes, grade 1: visible hypertrophy of the fat tissue butpalpably normal consistency, grade 2: massive thickening ofthe fat tissue with a higher consistency [10].
Though some studies have considered lipoatrophy as grade3, the rarity of occurrence and completely differentetiopathogenetic mechanisms leading to lipoatrophy make it adistinct entity [11]. Therefore, we have not considered it in ourgrading system for lipohypertrophy.
All subjects underwent an ultrasound screening of the der-mis and subcutaneous tissue of the abdomen for evidence oflipohypertrophy by the radiologist who was blinded to thepatient's clinical findings. Ultrasonography was performedusing a Philips EPIQ 5G machine, transducer L18-5 broad-band linear array working on 18 to 5 MHz extended operatingfrequency. On the ultrasonography, the normal dermis ishomogenously hyperechoic when compared with the sub-dermal fatty tissue and ranges between 1 and 4 mm in thick-ness. There is a well-defined and regular demarcation betweendermis and the subcutis [12]. The subcutaneous tissue offers ahypoechoic background secondary to the fat lobules and ahyperechoic connective web with very thin septa betweenthe lobules. The hyperechoic muscularis fasciae are seen be-neath the subcutis layer [9]. Based on the thickness,echogenity, echotexture, delineation between dermis, subcutisand muscularis layers, and subcutis vasculature on ultrasound,the lipohypertrophy was further classified based on the systemsuggested by Kapeluto and colleagues [12, 13].
Statistical analysis
A sample size of 80 subjects was required to study the preva-lence of lipohypertrophy on clinical examination with a preci-sion of 10% and 95% confidence interval based on the 30%prevalence of lipohypertrophy reported by Natalia et al. [7].The clinical characteristics of the study populations wereexpressed as mean and standard deviation and percentages.The agreement between the clinical and ultrasonographic de-tection of the lipohypertrophy was determined using Kappa.The factors influencing the development of lipohypertrophywere evaluated using the chi-square test, and p < 0.05 wasconsidered significant. Independent variables influencing theoccurrence of lipohypertrophy were evaluated using multiplelogistic regression analysis.
Results
A total of n = 116 consecutive patients with diabetes mellitus(n = 89 T2DM and n = 27 T1DM subjects) on insulin therapywere screened for the study, of which n = 88 (64 male, 24female) were studied based on predetermined inclusioncriteria and willingness to give informed consent. The studyduration was for a period of one year (March 2016 to February2017). The T2DM patients constituted 83% (n = 73) of sub-jects and 17% (n = 15) were T1DM. The baseline character-istics of the T1DM and T2DM subjects are provided inTable 1. The mean duration of insulin usage was 77.5 ± 79.4months. The total daily dose (TDD) of insulin was 55.3 ± 28.0units. The mean Hba1c of the study subjects was 8.9 ± 2.1%.Sixty patients (68.2%) were found to have the clinical evi-dence of lipohypertrophy, of which 22 (36.7%) patients were
330 Int J Diabetes Dev Ctries (2021) 41:329–336
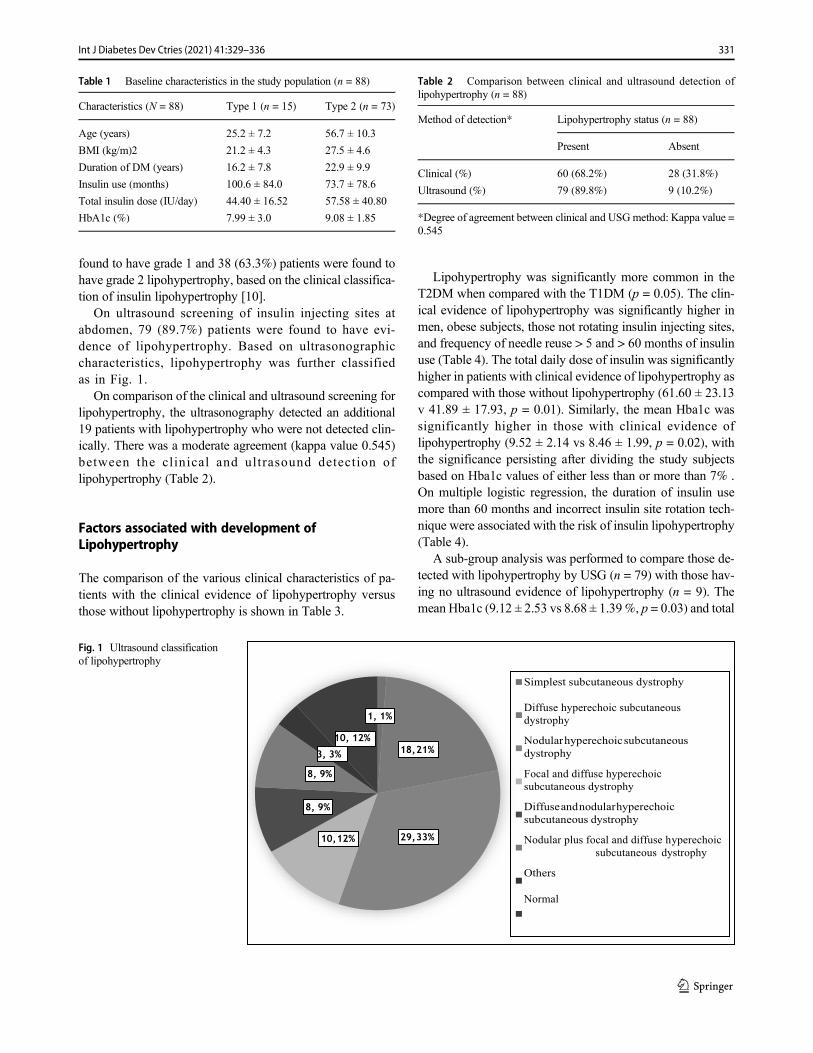
found to have grade 1 and 38 (63.3%) patients were found tohave grade 2 lipohypertrophy, based on the clinical classifica-tion of insulin lipohypertrophy [10].
On ultrasound screening of insulin injecting sites atabdomen, 79 (89.7%) patients were found to have evi-dence of lipohypertrophy. Based on ultrasonographiccharacteristics, lipohypertrophy was further classifiedas in Fig. 1.
On comparison of the clinical and ultrasound screening forlipohypertrophy, the ultrasonography detected an additional19 patients with lipohypertrophy who were not detected clin-ically. There was a moderate agreement (kappa value 0.545)between the clinical and ultrasound detection oflipohypertrophy (Table 2).
Factors associated with development ofLipohypertrophy
The comparison of the various clinical characteristics of pa-tients with the clinical evidence of lipohypertrophy versusthose without lipohypertrophy is shown in Table 3.
Lipohypertrophy was significantly more common in theT2DM when compared with the T1DM (p = 0.05). The clin-ical evidence of lipohypertrophy was significantly higher inmen, obese subjects, those not rotating insulin injecting sites,and frequency of needle reuse > 5 and > 60 months of insulinuse (Table 4). The total daily dose of insulin was significantlyhigher in patients with clinical evidence of lipohypertrophy ascompared with those without lipohypertrophy (61.60 ± 23.13v 41.89 ± 17.93, p = 0.01). Similarly, the mean Hba1c wassignificantly higher in those with clinical evidence oflipohypertrophy (9.52 ± 2.14 vs 8.46 ± 1.99, p = 0.02), withthe significance persisting after dividing the study subjectsbased on Hba1c values of either less than or more than 7% .On multiple logistic regression, the duration of insulin usemore than 60 months and incorrect insulin site rotation tech-nique were associated with the risk of insulin lipohypertrophy(Table 4).
A sub-group analysis was performed to compare those de-tected with lipohypertrophy by USG (n = 79) with those hav-ing no ultrasound evidence of lipohypertrophy (n = 9). Themean Hba1c (9.12 ± 2.53 vs 8.68 ± 1.39%, p = 0.03) and total
Table 1 Baseline characteristics in the study population (n = 88)
Characteristics (N = 88) Type 1 (n = 15) Type 2 (n = 73)
Age (years) 25.2 ± 7.2 56.7 ± 10.3
BMI (kg/m)2 21.2 ± 4.3 27.5 ± 4.6
Duration of DM (years) 16.2 ± 7.8 22.9 ± 9.9
Insulin use (months) 100.6 ± 84.0 73.7 ± 78.6
Total insulin dose (IU/day) 44.40 ± 16.52 57.58 ± 40.80
HbA1c (%) 7.99 ± 3.0 9.08 ± 1.85
Simplest subcutaneous dystrophy
Diffuse hyperechoic subcutaneous
dystrophy
Nodularhyperechoicsubcutaneous
dystrophy
Focal and diffuse hyperechoic
subcutaneous dystrophy
Diffuseandnodularhyperechoic
subcutaneous dystrophy
Nodular plus focal and diffuse hyperechoic
subcutaneous dystrophy
Others
Normal
Fig. 1 Ultrasound classificationof lipohypertrophy
Table 2 Comparison between clinical and ultrasound detection oflipohypertrophy (n = 88)
Method of detection* Lipohypertrophy status (n = 88)
Present Absent
Clinical (%) 60 (68.2%) 28 (31.8%)
Ultrasound (%) 79 (89.8%) 9 (10.2%)
*Degree of agreement between clinical and USGmethod: Kappa value =0.545
331Int J Diabetes Dev Ctries (2021) 41:329–336
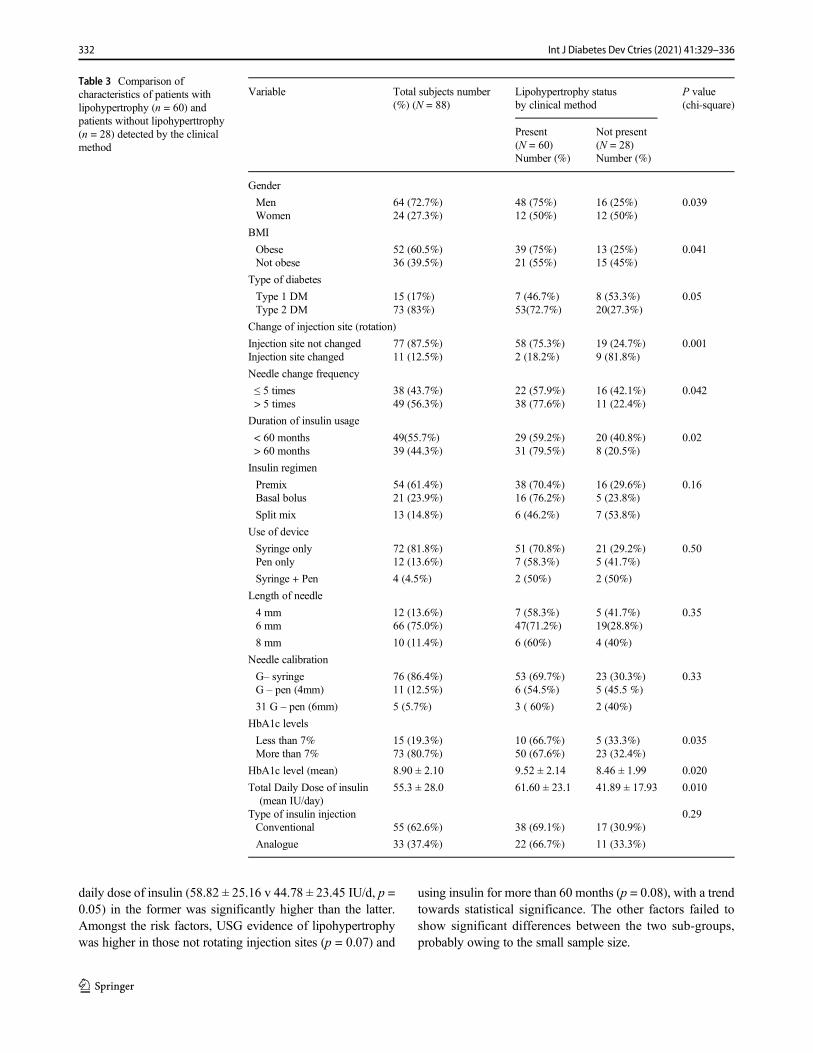
daily dose of insulin (58.82 ± 25.16 v 44.78 ± 23.45 IU/d, p =0.05) in the former was significantly higher than the latter.Amongst the risk factors, USG evidence of lipohypertrophywas higher in those not rotating injection sites (p = 0.07) and
using insulin for more than 60 months (p = 0.08), with a trendtowards statistical significance. The other factors failed toshow significant differences between the two sub-groups,probably owing to the small sample size.
Table 3 Comparison ofcharacteristics of patients withlipohypertrophy (n = 60) andpatients without lipohyperttrophy(n = 28) detected by the clinicalmethod
Variable Total subjects number(%) (N = 88)
Lipohypertrophy statusby clinical method
P value(chi-square)
Present(N = 60)
Not present(N = 28)
Number (%) Number (%)
Gender
Men 64 (72.7%) 48 (75%) 16 (25%) 0.039Women 24 (27.3%) 12 (50%) 12 (50%)
BMI
Obese 52 (60.5%) 39 (75%) 13 (25%) 0.041Not obese 36 (39.5%) 21 (55%) 15 (45%)
Type of diabetes
Type 1 DM 15 (17%) 7 (46.7%) 8 (53.3%) 0.05Type 2 DM 73 (83%) 53(72.7%) 20(27.3%)
Change of injection site (rotation)
Injection site not changed 77 (87.5%) 58 (75.3%) 19 (24.7%) 0.001Injection site changed 11 (12.5%) 2 (18.2%) 9 (81.8%)
Needle change frequency
≤ 5 times 38 (43.7%) 22 (57.9%) 16 (42.1%) 0.042> 5 times 49 (56.3%) 38 (77.6%) 11 (22.4%)
Duration of insulin usage
< 60 months 49(55.7%) 29 (59.2%) 20 (40.8%) 0.02> 60 months 39 (44.3%) 31 (79.5%) 8 (20.5%)
Insulin regimen
Premix 54 (61.4%) 38 (70.4%) 16 (29.6%) 0.16Basal bolus 21 (23.9%) 16 (76.2%) 5 (23.8%)
Split mix 13 (14.8%) 6 (46.2%) 7 (53.8%)
Use of device
Syringe only 72 (81.8%) 51 (70.8%) 21 (29.2%) 0.50Pen only 12 (13.6%) 7 (58.3%) 5 (41.7%)
Syringe + Pen 4 (4.5%) 2 (50%) 2 (50%)
Length of needle
4 mm 12 (13.6%) 7 (58.3%) 5 (41.7%) 0.356 mm 66 (75.0%) 47(71.2%) 19(28.8%)
8 mm 10 (11.4%) 6 (60%) 4 (40%)
Needle calibration
G– syringe 76 (86.4%) 53 (69.7%) 23 (30.3%) 0.33G – pen (4mm) 11 (12.5%) 6 (54.5%) 5 (45.5 %)
31 G – pen (6mm) 5 (5.7%) 3 ( 60%) 2 (40%)
HbA1c levels
Less than 7% 15 (19.3%) 10 (66.7%) 5 (33.3%) 0.035More than 7% 73 (80.7%) 50 (67.6%) 23 (32.4%)
HbA1c level (mean) 8.90 ± 2.10 9.52 ± 2.14 8.46 ± 1.99 0.020
Total Daily Dose of insulin(mean IU/day)
55.3 ± 28.0 61.60 ± 23.1 41.89 ± 17.93 0.010
Type of insulin injection 0.29Conventional 55 (62.6%) 38 (69.1%) 17 (30.9%)
Analogue 33 (37.4%) 22 (66.7%) 11 (33.3%)
332 Int J Diabetes Dev Ctries (2021) 41:329–336
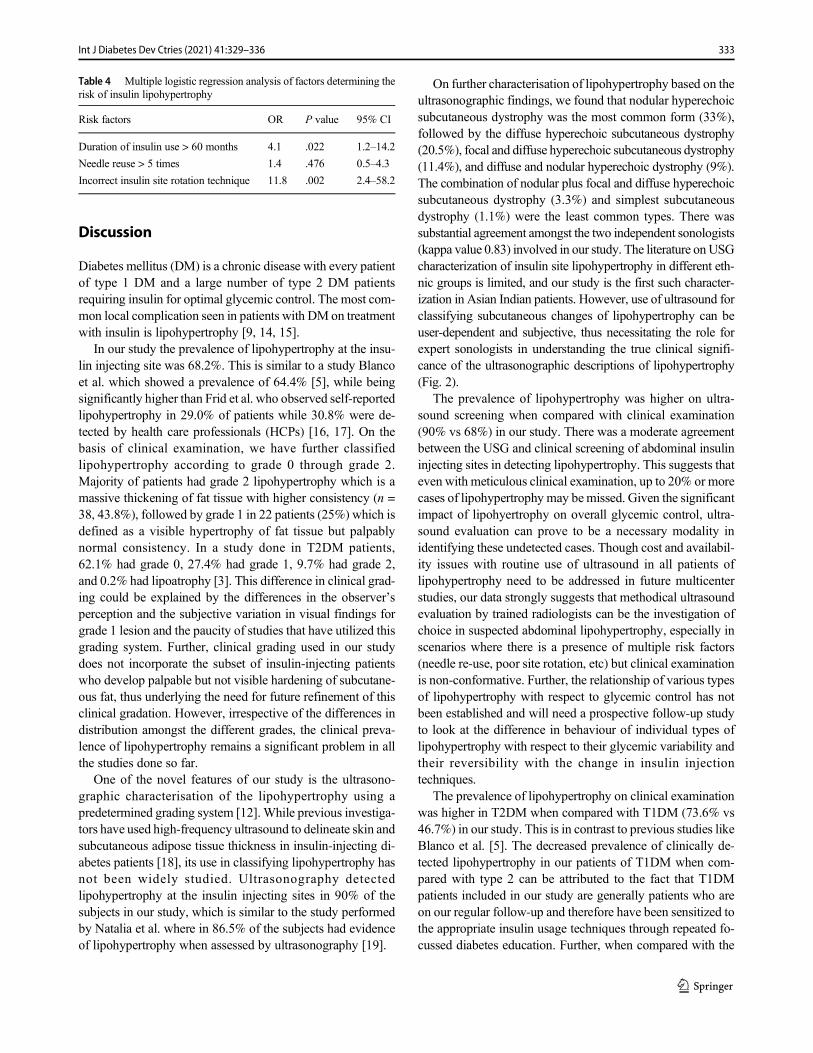
Discussion
Diabetes mellitus (DM) is a chronic disease with every patientof type 1 DM and a large number of type 2 DM patientsrequiring insulin for optimal glycemic control. The most com-mon local complication seen in patients with DMon treatmentwith insulin is lipohypertrophy [9, 14, 15].
In our study the prevalence of lipohypertrophy at the insu-lin injecting site was 68.2%. This is similar to a study Blancoet al. which showed a prevalence of 64.4% [5], while beingsignificantly higher than Frid et al. who observed self-reportedlipohypertrophy in 29.0% of patients while 30.8% were de-tected by health care professionals (HCPs) [16, 17]. On thebasis of clinical examination, we have further classifiedlipohypertrophy according to grade 0 through grade 2.Majority of patients had grade 2 lipohypertrophy which is amassive thickening of fat tissue with higher consistency (n =38, 43.8%), followed by grade 1 in 22 patients (25%) which isdefined as a visible hypertrophy of fat tissue but palpablynormal consistency. In a study done in T2DM patients,62.1% had grade 0, 27.4% had grade 1, 9.7% had grade 2,and 0.2% had lipoatrophy [3]. This difference in clinical grad-ing could be explained by the differences in the observer’sperception and the subjective variation in visual findings forgrade 1 lesion and the paucity of studies that have utilized thisgrading system. Further, clinical grading used in our studydoes not incorporate the subset of insulin-injecting patientswho develop palpable but not visible hardening of subcutane-ous fat, thus underlying the need for future refinement of thisclinical gradation. However, irrespective of the differences indistribution amongst the different grades, the clinical preva-lence of lipohypertrophy remains a significant problem in allthe studies done so far.
One of the novel features of our study is the ultrasono-graphic characterisation of the lipohypertrophy using apredetermined grading system [12]. While previous investiga-tors have used high-frequency ultrasound to delineate skin andsubcutaneous adipose tissue thickness in insulin-injecting di-abetes patients [18], its use in classifying lipohypertrophy hasnot been widely studied. Ultrasonography detectedlipohypertrophy at the insulin injecting sites in 90% of thesubjects in our study, which is similar to the study performedby Natalia et al. where in 86.5% of the subjects had evidenceof lipohypertrophy when assessed by ultrasonography [19].
On further characterisation of lipohypertrophy based on theultrasonographic findings, we found that nodular hyperechoicsubcutaneous dystrophy was the most common form (33%),followed by the diffuse hyperechoic subcutaneous dystrophy(20.5%), focal and diffuse hyperechoic subcutaneous dystrophy(11.4%), and diffuse and nodular hyperechoic dystrophy (9%).The combination of nodular plus focal and diffuse hyperechoicsubcutaneous dystrophy (3.3%) and simplest subcutaneousdystrophy (1.1%) were the least common types. There wassubstantial agreement amongst the two independent sonologists(kappa value 0.83) involved in our study. The literature onUSGcharacterization of insulin site lipohypertrophy in different eth-nic groups is limited, and our study is the first such character-ization in Asian Indian patients. However, use of ultrasound forclassifying subcutaneous changes of lipohypertrophy can beuser-dependent and subjective, thus necessitating the role forexpert sonologists in understanding the true clinical signifi-cance of the ultrasonographic descriptions of lipohypertrophy(Fig. 2).
The prevalence of lipohypertrophy was higher on ultra-sound screening when compared with clinical examination(90% vs 68%) in our study. There was a moderate agreementbetween the USG and clinical screening of abdominal insulininjecting sites in detecting lipohypertrophy. This suggests thateven with meticulous clinical examination, up to 20% or morecases of lipohypertrophy may bemissed. Given the significantimpact of lipohyertrophy on overall glycemic control, ultra-sound evaluation can prove to be a necessary modality inidentifying these undetected cases. Though cost and availabil-ity issues with routine use of ultrasound in all patients oflipohypertrophy need to be addressed in future multicenterstudies, our data strongly suggests that methodical ultrasoundevaluation by trained radiologists can be the investigation ofchoice in suspected abdominal lipohypertrophy, especially inscenarios where there is a presence of multiple risk factors(needle re-use, poor site rotation, etc) but clinical examinationis non-conformative. Further, the relationship of various typesof lipohypertrophy with respect to glycemic control has notbeen established and will need a prospective follow-up studyto look at the difference in behaviour of individual types oflipohypertrophy with respect to their glycemic variability andtheir reversibility with the change in insulin injectiontechniques.
The prevalence of lipohypertrophy on clinical examinationwas higher in T2DM when compared with T1DM (73.6% vs46.7%) in our study. This is in contrast to previous studies likeBlanco et al. [5]. The decreased prevalence of clinically de-tected lipohypertrophy in our patients of T1DM when com-pared with type 2 can be attributed to the fact that T1DMpatients included in our study are generally patients who areon our regular follow-up and therefore have been sensitized tothe appropriate insulin usage techniques through repeated fo-cussed diabetes education. Further, when compared with the
Table 4 Multiple logistic regression analysis of factors determining therisk of insulin lipohypertrophy
Risk factors OR P value 95% CI
Duration of insulin use > 60 months 4.1 .022 1.2–14.2
Needle reuse > 5 times 1.4 .476 0.5–4.3
Incorrect insulin site rotation technique 11.8 .002 2.4–58.2
333Int J Diabetes Dev Ctries (2021) 41:329–336
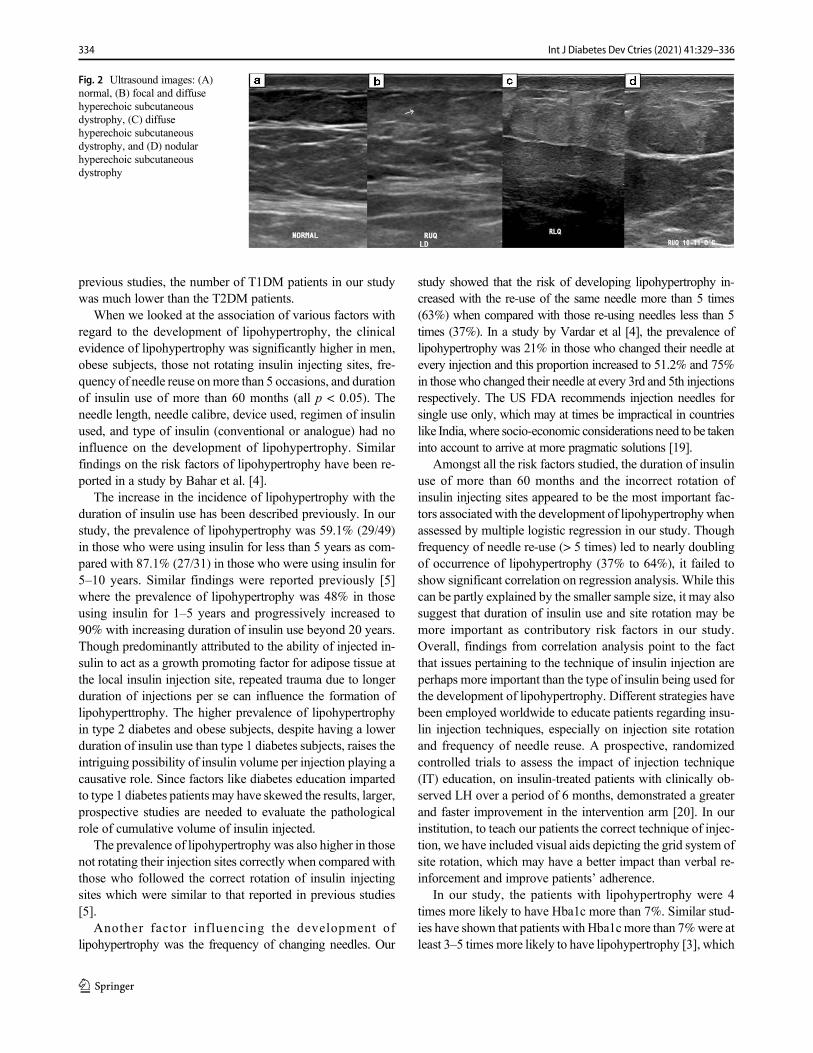
previous studies, the number of T1DM patients in our studywas much lower than the T2DM patients.
When we looked at the association of various factors withregard to the development of lipohypertrophy, the clinicalevidence of lipohypertrophy was significantly higher in men,obese subjects, those not rotating insulin injecting sites, fre-quency of needle reuse onmore than 5 occasions, and durationof insulin use of more than 60 months (all p < 0.05). Theneedle length, needle calibre, device used, regimen of insulinused, and type of insulin (conventional or analogue) had noinfluence on the development of lipohypertrophy. Similarfindings on the risk factors of lipohypertrophy have been re-ported in a study by Bahar et al. [4].
The increase in the incidence of lipohypertrophy with theduration of insulin use has been described previously. In ourstudy, the prevalence of lipohypertrophy was 59.1% (29/49)in those who were using insulin for less than 5 years as com-pared with 87.1% (27/31) in those who were using insulin for5–10 years. Similar findings were reported previously [5]where the prevalence of lipohypertrophy was 48% in thoseusing insulin for 1–5 years and progressively increased to90% with increasing duration of insulin use beyond 20 years.Though predominantly attributed to the ability of injected in-sulin to act as a growth promoting factor for adipose tissue atthe local insulin injection site, repeated trauma due to longerduration of injections per se can influence the formation oflipohyperttrophy. The higher prevalence of lipohypertrophyin type 2 diabetes and obese subjects, despite having a lowerduration of insulin use than type 1 diabetes subjects, raises theintriguing possibility of insulin volume per injection playing acausative role. Since factors like diabetes education impartedto type 1 diabetes patients may have skewed the results, larger,prospective studies are needed to evaluate the pathologicalrole of cumulative volume of insulin injected.
The prevalence of lipohypertrophy was also higher in thosenot rotating their injection sites correctly when compared withthose who followed the correct rotation of insulin injectingsites which were similar to that reported in previous studies[5].
Another factor influencing the development oflipohypertrophy was the frequency of changing needles. Our
study showed that the risk of developing lipohypertrophy in-creased with the re-use of the same needle more than 5 times(63%) when compared with those re-using needles less than 5times (37%). In a study by Vardar et al [4], the prevalence oflipohypertrophy was 21% in those who changed their needle atevery injection and this proportion increased to 51.2% and 75%in those who changed their needle at every 3rd and 5th injectionsrespectively. The US FDA recommends injection needles forsingle use only, which may at times be impractical in countrieslike India, where socio-economic considerations need to be takeninto account to arrive at more pragmatic solutions [19].
Amongst all the risk factors studied, the duration of insulinuse of more than 60 months and the incorrect rotation ofinsulin injecting sites appeared to be the most important fac-tors associated with the development of lipohypertrophy whenassessed by multiple logistic regression in our study. Thoughfrequency of needle re-use (> 5 times) led to nearly doublingof occurrence of lipohypertrophy (37% to 64%), it failed toshow significant correlation on regression analysis. While thiscan be partly explained by the smaller sample size, it may alsosuggest that duration of insulin use and site rotation may bemore important as contributory risk factors in our study.Overall, findings from correlation analysis point to the factthat issues pertaining to the technique of insulin injection areperhaps more important than the type of insulin being used forthe development of lipohypertrophy. Different strategies havebeen employed worldwide to educate patients regarding insu-lin injection techniques, especially on injection site rotationand frequency of needle reuse. A prospective, randomizedcontrolled trials to assess the impact of injection technique(IT) education, on insulin-treated patients with clinically ob-served LH over a period of 6 months, demonstrated a greaterand faster improvement in the intervention arm [20]. In ourinstitution, to teach our patients the correct technique of injec-tion, we have included visual aids depicting the grid system ofsite rotation, which may have a better impact than verbal re-inforcement and improve patients’ adherence.
In our study, the patients with lipohypertrophy were 4times more likely to have Hba1c more than 7%. Similar stud-ies have shown that patients with Hba1cmore than 7%were atleast 3–5 times more likely to have lipohypertrophy [3], which
Fig. 2 Ultrasound images: (A)normal, (B) focal and diffusehyperechoic subcutaneousdystrophy, (C) diffusehyperechoic subcutaneousdystrophy, and (D) nodularhyperechoic subcutaneousdystrophy
334 Int J Diabetes Dev Ctries (2021) 41:329–336
in turn led to a significantly higher total daily insulin doserequirement (56 IU/day vs 41 IU/day) [5].
At present there are worldwide 150–200 million insulin-using diabetes patients, of which approximately 3.2 millionpatients with diabetes in India are currently on insulin [21, 22].This would contribute to a significantly increased financialburden of managing diabetes in India. Thus, a massive impacton healthcare expenditure can be achieved if development oflipohypertrophy in DM patients can be reduced by patienteducation on correct insulin injecting techniques.Comprehensive therapeutic education, preferably coveringall topics related to insulin injection techniques, is one keyarea that is often overlooked in diabetes patients on insulin-injection therapy [23–25]. Innovative ways to involve the pa-tient in the decision-making process through a discussion for-mat of diabetes education has shown to be more effective thana rigid didactic form [26, 27]. Studies have shown better re-sults with group education, while initiating the health-careprovider in formal diabetes education training can ensure low-er subsequent Hba1c values and better adherence [28]. Datafrom Indian studies (ITQ) show only 30% of Indian injectorsget their sites checked this frequently with nearly a third onlyhaving sites check when they specifically complained andnearly 40% never having had their sites checked [8], whilethe worldwide data being even more dismal when comparedwith Indian studies in this regard [1]. This can be a major areaof thrust in improving diabetes education in diabetes patientsinjecting insulin regularly.
Conclusion
Insulin lipohypertrophy is a common under-reported compli-cation of insulin therapy leading to suboptimal glycemic con-trol. While a thorough clinical examination of insulin injectionsites has been traditionally used to detect lipohypertrophy, itmay prove to be inadequate in more than one-fifth of cases.Our study provides evidence to suggest that systematic ultra-sound evaluation may be successful in identifying majority ofcases (> 90%) and larger studies identifying its role in stan-dard diabetes care are necessary. Further, ultrasound-basedcharacterization of abdominal lipohypertrophy lesions andits relation to glycemic variations and possible reversibilitywith correction of injection techniques are areas that need tobe critically elucidated in future studies.
Improper insulin injecting technique is the most importantrisk factor for the development of lipohypertrophy. Increasingawareness about the lipohypertrophy and its risk factorsamongst health care providers and educating the patients oncorrect insulin injection practices are key to solving the prob-lem of insulin lipohypertrophy. The relatively better Hba1c inour type 1 diabetes subjects and lesser lipohypertrophy despiteusing multiple daily insulin injections for a longer duration
emphasizes the beneficial effect of regular, patient-oriented di-abetes education, both individually and in groups. Forresource-limited countries like India, this can be a simple andcost-effective tool to mitigate lipohypertrophy in insulin-injecting diabetes patients. The strength of our study is theuse of a novel ultrasonography-based gradation in addition toclinical examination for the detection of lipohypertrophy andstudy of various risk factors. The limitation of our study is thatthe impact of lipohypertrophy and its reversibility on the gly-cemic control could not be accurately assessed as it is a cross-sectional study and needs larger prospective studies.
Acknowledgments RK and RD researched data and wrote the manu-script, MI and FC helped in patient recruitment, SS wrote the manuscript,PCS and KS contributed to researching the data, MDM and FJ contrib-uted to the discussion and edited the manuscript, HAS researched the dataand contributed to the discussion, and TVP and NT reviewed and editedthe manuscript. The initial findings of this study has been previouslypresented in the 44th Annual Conference of Research Society for theStudy of Diabetes in India (RSSDI) in 2016 and the abstract of the pre-sentation has been published in the following issue of the journal: Int JDiabetes Dev Ctries. 37, 329–375 (2017). https://doi.org/10.1007/s13410-017-0568-z
Compliance with ethical standards
The study was approved by the Institutional review board (IRB Min No9926 dated 05.02.2016).
Conflict of interest The authors declare that they have no conflict ofinterest.
Informed consent Type 1 or type 2 DM subjects of age 18 years andolder injecting insulin subcutaneously on the abdomen for at least 6months duration were recruited after obtaining a written informedconsent.
References
1. Intensive blood glucose control with sulphonylureas or insulincompared with conventional treatment and risk of complicationsin patients with type 2 diabetes mellitus (UKPDS 33).UK prospec-tive diabetes study (UKPDS) Group. Lancet. 1998;352(9131):837–53.
2. Diabetes Control and Complications Trial Research Group. Theeffect of intensive treatment of diabetes on the development andprogression of long-term complications in insulin-dependent diabe-tes mellitus. N Engl J Med. 1993;329:977–86.
3. Al Ajlouni M, Abujbara M, Batieha A, Ajlouni K. Prevalence ofLipohypertrophy and associated risk factors in insulin treated pa-tients with Type 2 Diabetes Mellitus. Int J Endocrinol Metab.2015;13(2).
4. Vardar B, Kizilci S. Incidence of lipohypertrophyin diabetic pa-tients and a study of influencing factors. Diabetes Res Clin Pract.2007;77:231–6.
5. Blanco M, Hernández MT, Straussc KW, Amaya M. Prevalenceand risk actors of lipohypertrophyin insulin-injecting patients withdiabetes. Diabetes Metab. 2013;39:445–53.
335Int J Diabetes Dev Ctries (2021) 41:329–336
6. Ji L, Sun Z, Li Q, et al. Lipohypertrophy in China: prevalence, riskfactors, insulin consumption, and clinical impact. Diabetes TechnolTher. 2017;19:61–7.
7. Volkova Natalia, Davidenko Ilia, Rudakova and Segida Kristinaet al. Ultrasonoraphyof insulin injection sites in diabetic patients:a new method of Lipohypertrophy diagnostic presentation numberMON-833.Date of Presentation: 2013.
8. Kalra S, Mithal A, Sahay R, John M, Unnikrishnan AG, Saboo B,et al. Indian Injection technique study: population characteristicsand injection practices. Diabetes Ther. 2017;8(3):637–57.
9. Kalra S, Mithal A, Sahay R, John M, Unnikrishnan AG, Saboo B,et al. Indian injection technique study: injecting complications, ed-ucation, and the health care professional. Diabetes Ther. 2017;8(3):659–72.
10. Kordonouri O, Lauterborn R, Deiss D. Lipohypertrophy in youngpatients with type 1 diabetes. Diabetes Care. 2002;25(3):634.
11. Richardson T, Kerr D. Skin related complications of insulin thera-py: epidemiology and emerging management strategies. Am J ClinDermatol. 2003;4(10):661–7.
12. Kapeluto J, Paty BW, Chang SD, Eddy C, Vancouver GM, Cetal B.Criteria for the detection of insulin-induced lipohypertrophyusingultrasonography. Can J Diabetes. 2015;39(6):534.
13. Perciun R. Ultrasonographic aspects of subcutaneous tissue dystro-phies as a result of insulin injections. Med Ultrason. 2010;12(2):104–9.
14. Hambridge K. The management of lipohypertrophy in diabetescare. Br J Nurs. 2007;16(9):520–4.
15. Hauner H, Stockamp B, Haastert B. Prevalence of lipohypertrophyin insulin-treated diabetic patients and predisposing factors. ExpClin Endocrinol Diabetes. 1996;104(2):106–10.
16. Frid AH, Hirsch LJ, Menchior AR, Morel DR, Strauss KW.Worldwide injection technique questionnaire study: injecting com-plications and role of the professional. Mayo Clin Proc. 2016;91(9):1224–30.
17. Frid AH, Kerugel G, Grassi G, Halimi S, Hicks D, Hirsch LJ, et al.New insulin delivery recommendations. Mayo Clin Proc.2016;91(9):1231–55.
18. Gibney MA, Arce CH, Byron KJ, Hirsch LJ. Skin and subcutane-ous adipose layer thickness in adults with diabetes at sites used forinsulin injections: implications for needle length recommendations.Curr Med Res Opin. 2010;26(6):1519–30.
19. Volkova N et al. Ultrasonography of insulin injection sites in dia-betic patients: a new method of lipohypertrophy diagnostics.Endocrine reviews. Conference: 95th annual meeting and expo ofthe Endocrine Society, ENDO. 2013;34(3 Suppl. 1).
20. Campinos C, Le Floch JP, Petit C, Penfornis A, Winiszewski P,Bordier L, et al. An effective intervention for diabeticlipohypertrophy: results of a randomized, controlled, prospectivemulticenter study in France. Diabetes Technol Ther. 2017;19(11):623–32.
21. Tandon N, Kalra S, Balipohypertrophyara YS, BaruahMP, ChadhaM, Chandalia HB, et al. Forum for Injection Technique (FIT),India: The Indian recommendations 2.0, for best practice inInsulin Injection Technique, 2015. Indian J Endocr Metab.2015;19:317–31.
22. Garg SK, Rewers AH, Akturk HK. Ever-Increasing Insulin-Requiring Patients Globally. Diabetes Technol Ther.2018;20(S2):S21–4.
23. Strauss K, De Gols H, Hannet I, Partanen TM, Frid A. A pan-European epidemiologic study of insulin injection technique in pa-tients with diabetes. Pract Diab Int. 2002;19:71–6.
24. Martinez L, Consoli SM, Monnier L, Simon D, Wong O, YomtovB, et al. Studying the Hurdles of Insulin Prescription (SHIP): de-velopment, scoring and initial validation of a new self- administeredquestionnaire. Health Qual Life Outcomes. 2007;5:53.
25. Cefalu WT, Mathieu C, Davidson J. Patients’ perceptions of sub-cutaneous insulin in the OPTIMIZE study: a multicenter follow-upstudy. Diabetes Tech Ther. 2008;10:25–38.
26. DiMatteo RM, DiNicola DD, editors. Achieving patient compli-ance. The psychology of medical practitioner’s role. Oxford:Pergamon; 1982. p. 233–56.
27. Joy SV. Clinical pearls and strategies to optimize patient outcomes.Diabetes Educ. 2008;34:54S–9S.
28. Seyoum B, Abdulkadir J. Systematic inspection of insulin injectionsites for local complications related to incorrect injection technique.Trop Dr. 1996;26:159–61.
Publisher’s note Springer Nature remains neutral with regard to jurisdic-tional claims in published maps and institutional affiliations.
336 Int J Diabetes Dev Ctries (2021) 41:329–336
ORIGINAL ARTICLE
Knowledge, attitude, and practice towards self-managementamong diabetic patients at Debre Tabor General Hospital chronicdiseases follow-up clinic, Northwest Ethiopia
Enyew Getaneh Mekonen1
Received: 20 June 2020 /Accepted: 7 November 2020# Research Society for Study of Diabetes in India 2020
AbstractIntroduction Self-management in diabetic patients is vital to keep the illness under control and avert any long term complica-tions. Effective management of diabetes is a difficult task without an adequate understanding of the existing level of knowledge,attitude, and practice related to self-management. Knowing the level of knowledge, attitude, and practice towards self-management may help to provide information for health policy-makers to design and implement effective interventions to reducediabetes-related morbidity and mortality.Objective To assess the level of knowledge, attitude, and practice towards self-management among patients with diabetes atDebre Tabor General Hospital chronic diseases follow up clinic.Methods An institution-based cross-sectional study was conducted from February to March 2016. A systematic random sam-pling technique was employed to select 206 patients. A structured pretested interviewer-administered questionnaire was used tocollect data. The data were entered and analyzed using SPSS version 20.Results More than half of the study participants 114 (55.3%) had poor knowledge about diabetic self-management. Poor attitudeof diabetic self-management was detected among 109 (52.9%) of studied patients. Nearly two-thirds 136 (66.0%) of the studyparticipants had poor practice towards self-management.Conclusion More than half of the participants had poor knowledge and attitude towards self-management and nearly two-thirdsof them had poor practice. It is better to emphasize the importance of the patient as the key person in diabetic management.
Keywords Knowledge . Attitude . Practice . Diabetic self-management . Diabetic patients
Introduction
Non-communicable diseases have become one of the majorchallenges in terms of the damage they cause to humans andthe socio-economic condition of the countries. Diabetesmellitus is one of the most common non-communicable dis-eases and challenging health problems globally [1]. Diabetesis a group of metabolic diseases characterized by hyperglyce-mia resulting from defects in insulin secretion, insulin action,or both. The chronic hyperglycemia of diabetes is associatedwith long-term damage, dysfunction, and failure of different
organs, especially the eyes, kidneys, nerves, heart, and bloodvessels [2]. As a result of population growth, unhealthy diets,obesity, aging, urbanization, and sedentary lifestyles, the prev-alence of diabetes is increasing worldwide [3]. It is a rapidlyworsening, major risk to global public health, with one in 20deaths attributed to diabetes [4].
It is estimated that the number of people with diabetes isexpected to rise to 592 million by 2035. Of which, most peo-ple with diabetes live in low- and middle-income countriesand these will experience the greatest increase in cases ofdiabetes over the next 22 years [5]. Diabetes-related mortalityin 2013 in Africa region is expected to be over half a millionwith three-quarter of these deaths occurring in those < 60 yearsold [6]. World Health Organization (WHO) estimated that in2011 34% of the Ethiopian population is dying from non-communicable diseases, with a national diabetes mellitusprevalence of 2% [7]. Knowledge of diabetes and diabetescare is needed for the successful management of the disease.
* Enyew Getaneh [email protected]
1 Department of Surgical Nursing, School of Nursing, College ofMedicine and Health Sciences, University of Gondar,Gondar, Ethiopia
https://doi.org/10.1007/s13410-020-00896-3
/ Published online: 25 November 2020
International Journal of Diabetes in Developing Countries (2021) 41:337–345
The low level of knowledge and negative perceptions of dia-betes and its complications result in poor glycemic control [8].Lack of knowledge of diabetes and diabetes care was consid-ered as the primary barrier to diabetes self-management [9].
Diabetes-related morbidity and mortality can be preventedthrough dedicated self-management behaviors in numerousdomains, including food choices, physical exercise, good ad-herence to medications, and blood glucose monitoring fromthe patients. To enhance glycemic control, individuals mustengage in lifestyle changes and self- management activities[10]. Successful self-management requires knowledge, skills,and a willingness to modify food choices, increase physicalactivity, perform blood sugar monitoring, take medications,regular checkups, and blood pressure and cholesterol control[11].
Self-management in diabetic patients is vital to keep theillness under control and avert any long term complications.Effective management of diabetes is a difficult task without anadequate understanding of the existing level of knowledge,attitude, and practice related to self-management. Therefore,this study is aimed to assess the level of knowledge, attitude,and practice towards diabetic self-management among pa-tients with diabetes in Debre Tabor General Hospital,Northwest Ethiopia.
Methods and materials
Study design and period
An institution-based cross-sectional study was conductedfrom February to March 2016.
Study setting
The study was conducted at Debre Tabor General Hospital,the only hospital in Debre Tabor town, South Gondar zone ofAmhara Regional State. Debre Tabor town has one govern-mental hospital, three governmental health centers, two pri-vate clinics, and four governmental health posts.
Study participants
Patients with both diabetes type 1 and 2 attending chronicdisease follow-up clinic at Debre Tabor General Hospital fortheir regular follow-up during the study period were includedin the study. Those patients who were unwilling to participateand seriously ill were excluded.
Sample size determination and sampling procedure
The sample size was calculated using a single population pro-portion formula with the assumption of knowledge, attitude,
and practice of patients towards diabetic self-management is50% with a 5% marginal error and 95% confidence interval.The final sample size was 206, after using the correction for-mula and adding a 5% non-response rate. Study participantswere selected using a systematic random sampling techniqueby taking K-value 2.
Operational definitions
Knowledge Participants who answer the mean and above themean value of the ten knowledge-related questions were con-sidered having good knowledge and those participants whoanswer below the mean value were considered as having poorknowledge.
Attitude Participants who answer the mean and above themean value of the five attitude-related questions were consid-ered as having a good attitude and participants who answerbelow the mean value were considered as having a poorattitude.
Practice Participants who answer the mean and above themean value of the nine practice-related questions were con-sidered as having good practice and participants who answerbelow the mean value were considered as having poorpractice.
Data collection instruments and procedures
Data were collected using a structured pretestedinterviewer-administered questionnaire that was adaptedfrom a questionnaire developed by previous studies [12,13]. The questionnaire contains thirty-six questions ar-ranged into five sections; the first section contains sevenquestions regarding the socio-demographic characteris-tics of the participants, the second section contains fivequestions regarding health condition/background charac-teristics of patients, the third section contains ten ques-tions concerning knowledge of patients about diabetesand self-management, the fourth section contains fiveregarding the attitude of patients towards self-manage-ment, and the fifth section contains nine questions re-garding the practice of patients towards self-manage-ment. The tool’s face validity was examined by a publichealth expert, a diabetic expert, and a statistician. Datawere collected with the help of two trained BSc nursedata collectors and one MSc nurse supervisor. A writtenguideline was given to data collectors to assure thatevery participant received the same directions and infor-mation. Data were collected from the study participants,after guarantying their willingness to take part in thestudy.
338 Int J Diabetes Dev Ctries (2021) 41:337–345
Data quality assurance
The data collection instruments were tested with a pretest bytaking 5% of the sample size before the actual data collectiontime at the University of Gondar Hospital. Amendments onthe instrument, such as unclear questions and ambiguouswords, were made accordingly. The questionnaire wasreviewed by three experts (a public health expert, a diabeticexpert, and a statistician) and their suggestions were utilizedfor improving the questionnaire. The questionnaire originallyprepared in English was translated and back-translated to andfrom Amharic to ensure its consistency. Data collectors andsupervisors were recruited based on their experience in re-search, and half-day training was given on the objective ofthe study, instrument, and data collection procedures by theprincipal investigator.
Ethical consideration
Before conducting the study, ethical clearance was obtainedfrom the Institutional Review Board of the University ofGondar on behalf of the ethical review committee of theSchool of Nursing. A written permission letter was obtainedfrom the clinical director of the hospital. Participants wereinformed about the purpose of the study, and verbal informedconsent was obtained from them. Confidentiality was main-tained by omitting direct personal identifiers on the question-naire, by using code numbers, by storing data locked with apassword, and not misuse or wrongfully disclose their infor-mation. Participants were also informed that participation wasvoluntary and they could withdraw from the study participa-tion at any stage if they were not comfortable about the inves-tigation. The investigator prepared a one-page informationsheet regarding the purpose and nature of the study.
Data processing and analysis
All the collected data were checked for completeness andconsistency, then compiled, coded, and finally entered intoSPSS version 20 statistical software from IBM Corporation,Armonk, for analysis. Frequencies and percentages were usedto summarize the descriptive statistics of the data, and tablesand graphs were used for data presentation.
Results
Socio-demographic characteristics of the respondents
A total of 206 patients have participated in this study, with a100% response rate. The majority of 129 (62.6%) of the re-spondents were male. The mean age of the respondents was45.5 years and 49 (23.8%) of them fell in the age range of 50–
59 years. Concerning the educational level, a large proportionof respondents 93 (45.1%) cannot read and write. One hun-dred fifty-one (73.3%) of the study participants wereOrthodox in religion, and more than three-fourths of 160(77.7%) of them were self-employed. Half 103 (50.0%) ofthe participants indicated that they live with their wives. Alarge proportion of the participants 91 (44.2%) indicated thattheir food was prepared by the spouse (Table 1).
Health condition/background characteristics ofrespondents
Nearly one-third of 64 (31.1%) and 34 (16.5%) of the respon-dents were medically diagnosed with type 2 and type 1 diabe-tes, respectively, and 108 (52.4%) of them did not know thetype of diabetes. Of all the participants more than one-third of75 (36.4%) indicated that they were diagnosed with diabetesin the past 1–5 years. Concerning the type of medication,nearly half 102 (49.5%) of the respondents took insulin tocontrol their diabetes. More than three-fourths of 172(83.5%) patients had no other chronic conditions and the ma-jority 183 (88.8%) of them had no disability (Table 2).
Knowledge of diabetic patients towards diabetes anddiabetic self-management
More than half (56.8%) of 117 of the respondents didnot know the causes of diabetes. A large proportion ofthe participants 61 (29.6%) did not know the earlysymptoms of diabetes and seventy nine (38.4%) of themcould not name some of the things that are beneficial tocontrol diabetes. Nearly half 98 (47.6%) and 97 (47.1%)of the participants did not know the right time to taketheir medication and the symptoms of low blood sugarrespectively. The majority of 297 (95.6%) of the re-spondents did not know the normal blood glucose level.Sixty one (29.6%) of the participants ate or dranksweets when their blood sugar becomes low. Nearlythree-fourths (75.3%) of 155 of the participants didnot know the long term complications of diabetes, and169 (82.0%) of them did not know how often theyshould visit an eye doctor. Forty six (22.3%) of therespondents said that traditional/spiritual healers cantreat diabetes apart from doctors (Table 3).
The attitude of diabetic patients towards diabeticself-management
The majority of 181 (87.9%) of the respondents believed thatthe food they eat is important in controlling blood sugar levels.Ninety one (44.2%) and only 37 (18.0%) of them thought thatexercise and checking their foot every day are important inmanaging diabetes respectively. More than half 114 (55.3%)
339Int J Diabetes Dev Ctries (2021) 41:337–345
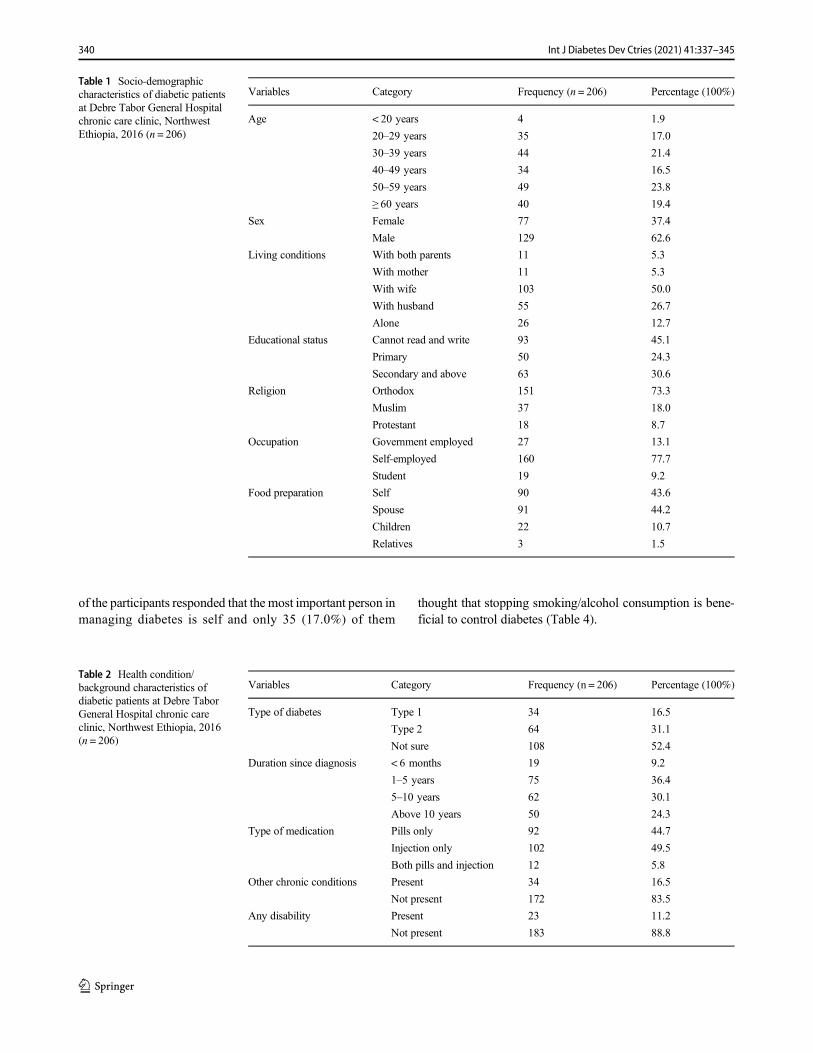
of the participants responded that the most important person inmanaging diabetes is self and only 35 (17.0%) of them
thought that stopping smoking/alcohol consumption is bene-ficial to control diabetes (Table 4).
Table 1 Socio-demographiccharacteristics of diabetic patientsat Debre Tabor General Hospitalchronic care clinic, NorthwestEthiopia, 2016 (n = 206)
Variables Category Frequency (n = 206) Percentage (100%)
Age < 20 years
20–29 years
30–39 years
40–49 years
50–59 years
≥ 60 years
4
35
44
34
49
40
1.9
17.0
21.4
16.5
23.8
19.4
Sex Female
Male
77
129
37.4
62.6
Living conditions With both parents
With mother
With wife
With husband
Alone
11
11
103
55
26
5.3
5.3
50.0
26.7
12.7
Educational status Cannot read and write
Primary
Secondary and above
93
50
63
45.1
24.3
30.6
Religion Orthodox
Muslim
Protestant
151
37
18
73.3
18.0
8.7
Occupation Government employed
Self-employed
Student
27
160
19
13.1
77.7
9.2
Food preparation Self
Spouse
Children
Relatives
90
91
22
3
43.6
44.2
10.7
1.5
Table 2 Health condition/background characteristics ofdiabetic patients at Debre TaborGeneral Hospital chronic careclinic, Northwest Ethiopia, 2016(n = 206)
Variables Category Frequency (n = 206) Percentage (100%)
Type of diabetes Type 1
Type 2
Not sure
34
64
108
16.5
31.1
52.4
Duration since diagnosis < 6 months
1–5 years
5–10 years
Above 10 years
19
75
62
50
9.2
36.4
30.1
24.3
Type of medication Pills only
Injection only
Both pills and injection
92
102
12
44.7
49.5
5.8
Other chronic conditions Present
Not present
34
172
16.5
83.5
Any disability Present
Not present
23
183
11.2
88.8
340 Int J Diabetes Dev Ctries (2021) 41:337–345
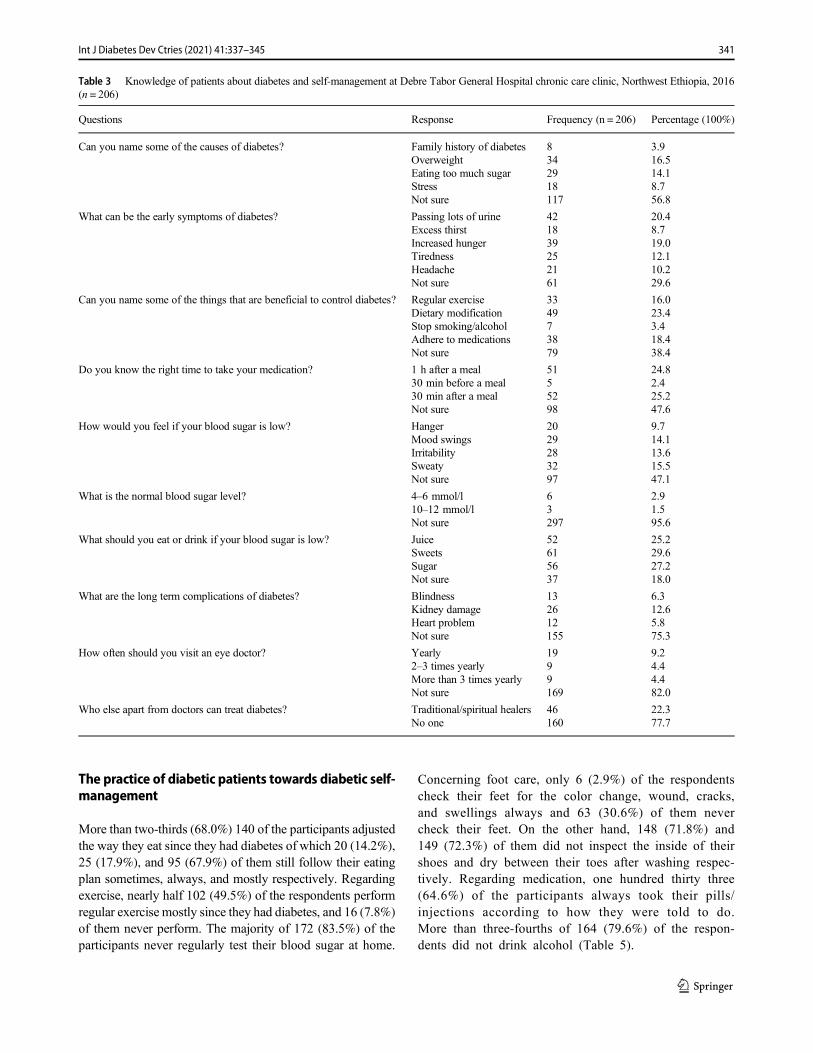
The practice of diabetic patients towards diabetic self-management
More than two-thirds (68.0%) 140 of the participants adjustedthe way they eat since they had diabetes of which 20 (14.2%),25 (17.9%), and 95 (67.9%) of them still follow their eatingplan sometimes, always, and mostly respectively. Regardingexercise, nearly half 102 (49.5%) of the respondents performregular exercise mostly since they had diabetes, and 16 (7.8%)of them never perform. The majority of 172 (83.5%) of theparticipants never regularly test their blood sugar at home.
Concerning foot care, only 6 (2.9%) of the respondentscheck their feet for the color change, wound, cracks,and swellings always and 63 (30.6%) of them nevercheck their feet. On the other hand, 148 (71.8%) and149 (72.3%) of them did not inspect the inside of theirshoes and dry between their toes after washing respec-tively. Regarding medication, one hundred thirty three(64.6%) of the participants always took their pills/injections according to how they were told to do.More than three-fourths of 164 (79.6%) of the respon-dents did not drink alcohol (Table 5).
Table 3 Knowledge of patients about diabetes and self-management at Debre Tabor General Hospital chronic care clinic, Northwest Ethiopia, 2016(n = 206)
Questions Response Frequency (n = 206) Percentage (100%)
Can you name some of the causes of diabetes? Family history of diabetesOverweightEating too much sugarStressNot sure
8342918117
3.916.514.18.756.8
What can be the early symptoms of diabetes? Passing lots of urineExcess thirstIncreased hungerTirednessHeadacheNot sure
421839252161
20.48.719.012.110.229.6
Can you name some of the things that are beneficial to control diabetes? Regular exerciseDietary modificationStop smoking/alcoholAdhere to medicationsNot sure
334973879
16.023.43.418.438.4
Do you know the right time to take your medication? 1 h after a meal30 min before a meal30 min after a mealNot sure
5155298
24.82.425.247.6
How would you feel if your blood sugar is low? HangerMood swingsIrritabilitySweatyNot sure
2029283297
9.714.113.615.547.1
What is the normal blood sugar level? 4–6 mmol/l10–12 mmol/lNot sure
63297
2.91.595.6
What should you eat or drink if your blood sugar is low? JuiceSweetsSugarNot sure
52615637
25.229.627.218.0
What are the long term complications of diabetes? BlindnessKidney damageHeart problemNot sure
132612155
6.312.65.875.3
How often should you visit an eye doctor? Yearly2–3 times yearlyMore than 3 times yearlyNot sure
1999169
9.24.44.482.0
Who else apart from doctors can treat diabetes? Traditional/spiritual healersNo one
46160
22.377.7
341Int J Diabetes Dev Ctries (2021) 41:337–345
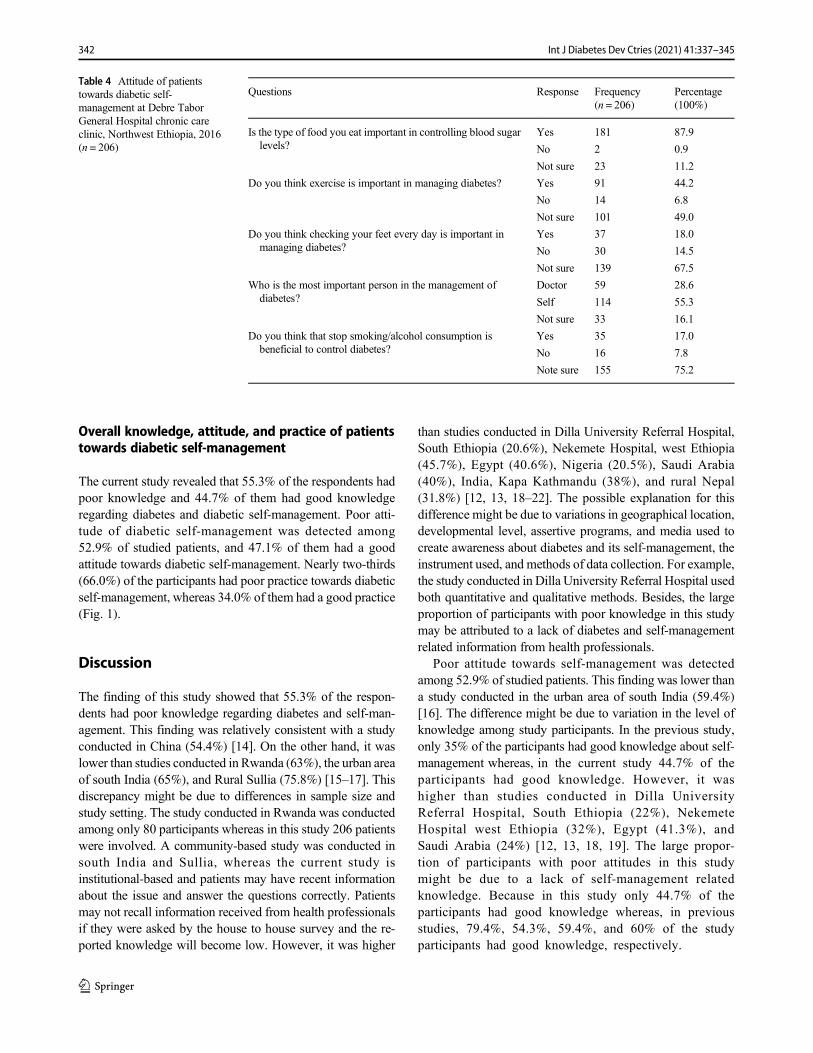
Overall knowledge, attitude, and practice of patientstowards diabetic self-management
The current study revealed that 55.3% of the respondents hadpoor knowledge and 44.7% of them had good knowledgeregarding diabetes and diabetic self-management. Poor atti-tude of diabetic self-management was detected among52.9% of studied patients, and 47.1% of them had a goodattitude towards diabetic self-management. Nearly two-thirds(66.0%) of the participants had poor practice towards diabeticself-management, whereas 34.0% of them had a good practice(Fig. 1).
Discussion
The finding of this study showed that 55.3% of the respon-dents had poor knowledge regarding diabetes and self-man-agement. This finding was relatively consistent with a studyconducted in China (54.4%) [14]. On the other hand, it waslower than studies conducted in Rwanda (63%), the urban areaof south India (65%), and Rural Sullia (75.8%) [15–17]. Thisdiscrepancy might be due to differences in sample size andstudy setting. The study conducted in Rwanda was conductedamong only 80 participants whereas in this study 206 patientswere involved. A community-based study was conducted insouth India and Sullia, whereas the current study isinstitutional-based and patients may have recent informationabout the issue and answer the questions correctly. Patientsmay not recall information received from health professionalsif they were asked by the house to house survey and the re-ported knowledge will become low. However, it was higher
than studies conducted in Dilla University Referral Hospital,South Ethiopia (20.6%), Nekemete Hospital, west Ethiopia(45.7%), Egypt (40.6%), Nigeria (20.5%), Saudi Arabia(40%), India, Kapa Kathmandu (38%), and rural Nepal(31.8%) [12, 13, 18–22]. The possible explanation for thisdifference might be due to variations in geographical location,developmental level, assertive programs, and media used tocreate awareness about diabetes and its self-management, theinstrument used, and methods of data collection. For example,the study conducted in Dilla University Referral Hospital usedboth quantitative and qualitative methods. Besides, the largeproportion of participants with poor knowledge in this studymay be attributed to a lack of diabetes and self-managementrelated information from health professionals.
Poor attitude towards self-management was detectedamong 52.9% of studied patients. This finding was lower thana study conducted in the urban area of south India (59.4%)[16]. The difference might be due to variation in the level ofknowledge among study participants. In the previous study,only 35% of the participants had good knowledge about self-management whereas, in the current study 44.7% of theparticipants had good knowledge. However, it washigher than studies conducted in Dilla UniversityReferral Hospital, South Ethiopia (22%), NekemeteHospital west Ethiopia (32%), Egypt (41.3%), andSaudi Arabia (24%) [12, 13, 18, 19]. The large propor-tion of participants with poor attitudes in this studymight be due to a lack of self-management relatedknowledge. Because in this study only 44.7% of theparticipants had good knowledge whereas, in previousstudies, 79.4%, 54.3%, 59.4%, and 60% of the studyparticipants had good knowledge, respectively.
Table 4 Attitude of patientstowards diabetic self-management at Debre TaborGeneral Hospital chronic careclinic, Northwest Ethiopia, 2016(n = 206)
Questions Response Frequency(n = 206)
Percentage(100%)
Is the type of food you eat important in controlling blood sugarlevels?
Yes
No
Not sure
181
2
23
87.9
0.9
11.2
Do you think exercise is important in managing diabetes? Yes
No
Not sure
91
14
101
44.2
6.8
49.0
Do you think checking your feet every day is important inmanaging diabetes?
Yes
No
Not sure
37
30
139
18.0
14.5
67.5
Who is the most important person in the management ofdiabetes?
Doctor
Self
Not sure
59
114
33
28.6
55.3
16.1
Do you think that stop smoking/alcohol consumption isbeneficial to control diabetes?
Yes
No
Note sure
35
16
155
17.0
7.8
75.2
342 Int J Diabetes Dev Ctries (2021) 41:337–345
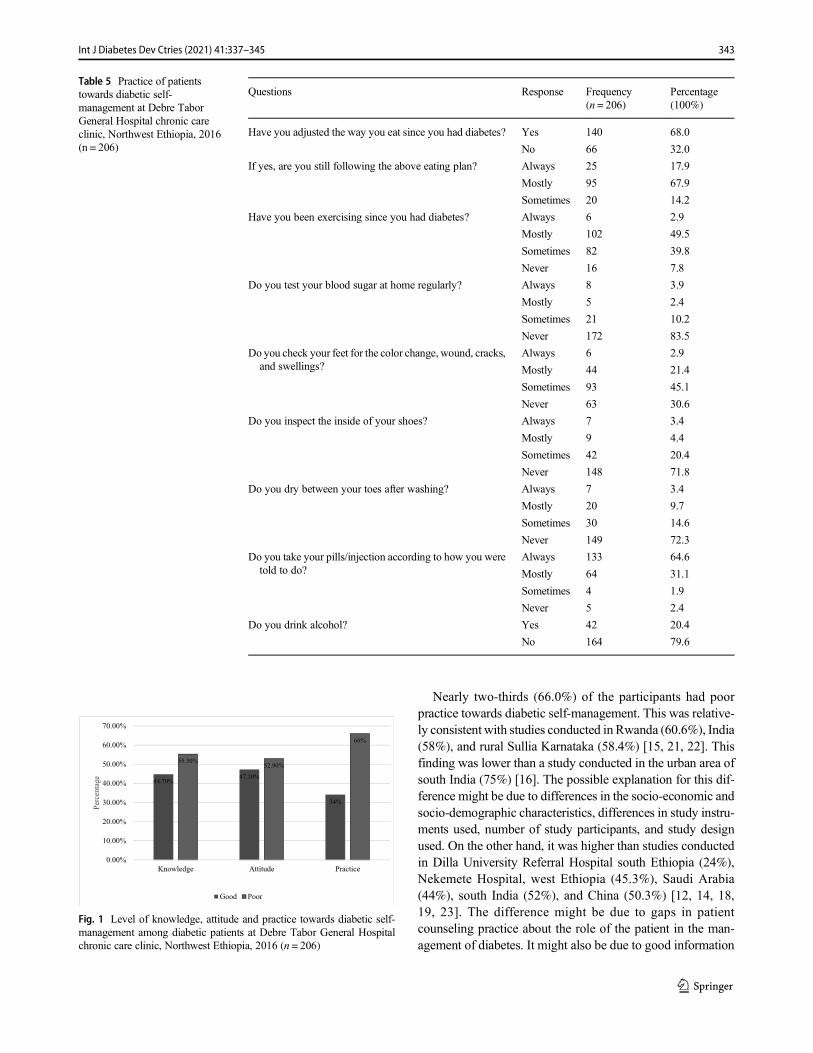
Nearly two-thirds (66.0%) of the participants had poorpractice towards diabetic self-management. This was relative-ly consistent with studies conducted in Rwanda (60.6%), India(58%), and rural Sullia Karnataka (58.4%) [15, 21, 22]. Thisfinding was lower than a study conducted in the urban area ofsouth India (75%) [16]. The possible explanation for this dif-ference might be due to differences in the socio-economic andsocio-demographic characteristics, differences in study instru-ments used, number of study participants, and study designused. On the other hand, it was higher than studies conductedin Dilla University Referral Hospital south Ethiopia (24%),Nekemete Hospital, west Ethiopia (45.3%), Saudi Arabia(44%), south India (52%), and China (50.3%) [12, 14, 18,19, 23]. The difference might be due to gaps in patientcounseling practice about the role of the patient in the man-agement of diabetes. It might also be due to good information
Table 5 Practice of patientstowards diabetic self-management at Debre TaborGeneral Hospital chronic careclinic, Northwest Ethiopia, 2016(n = 206)
Questions Response Frequency(n = 206)
Percentage(100%)
Have you adjusted the way you eat since you had diabetes? Yes
No
140
66
68.0
32.0
If yes, are you still following the above eating plan? Always
Mostly
Sometimes
25
95
20
17.9
67.9
14.2
Have you been exercising since you had diabetes? Always
Mostly
Sometimes
Never
6
102
82
16
2.9
49.5
39.8
7.8
Do you test your blood sugar at home regularly? Always
Mostly
Sometimes
Never
8
5
21
172
3.9
2.4
10.2
83.5
Do you check your feet for the color change, wound, cracks,and swellings?
Always
Mostly
Sometimes
Never
6
44
93
63
2.9
21.4
45.1
30.6
Do you inspect the inside of your shoes? Always
Mostly
Sometimes
Never
7
9
42
148
3.4
4.4
20.4
71.8
Do you dry between your toes after washing? Always
Mostly
Sometimes
Never
7
20
30
149
3.4
9.7
14.6
72.3
Do you take your pills/injection according to how you weretold to do?
Always
Mostly
Sometimes
Never
133
64
4
5
64.6
31.1
1.9
2.4
Do you drink alcohol? Yes
No
42
164
20.4
79.6
44.70%47.10%
34%
55.30%52.90%
66%
0.00%
10.00%
20.00%
30.00%
40.00%
50.00%
60.00%
70.00%
Knowledge Attitude Practice
Percentage
Good Poor
Fig. 1 Level of knowledge, attitude and practice towards diabetic self-management among diabetic patients at Debre Tabor General Hospitalchronic care clinic, Northwest Ethiopia, 2016 (n = 206)
343Int J Diabetes Dev Ctries (2021) 41:337–345
dissemination using different technologies which made theirpatients good in self-management in the previous studies.Self-monitoring of blood glucose (SMBG) was the mostneglected practice which is not performed by 83.5% of theparticipants even if performing SMBG regularly helps dia-betics maintain good blood glucose control. Similar findingswere reported in China and Assela General Hospital, Ethiopiain which 81.02% and 83.2% of respondents did not performSMBG respectively [24, 25]. The low level of adherence toSMBG might be due to the unavailability of blood glucoseself-monitoring equipment (glucometer), low economic sta-tus, and low educational level. Proper education and follow-up are very important to increase the level of adherence [26].
Strengths of the study The response rate in this study washigh (100%). Data collectors provide enough information tothe study participants regarding the purpose of the study toachieve this high response rate.
This study has some limitations. The study assessed self-care activities by self-report questionnaires, and this may dif-fer from what patients practiced. The study was also onlydescriptive and unable to identify the factors associated withknowledge, attitude, and practice towards self-management.
Conclusion
More than half of the participants had poor knowledge andattitude towards diabetic self-management, and nearly two-thirds of them had poor practice. It is better to emphasize theimportance of the patient as the key person in diabeticmanagement.
Acknowledgments The author is grateful to the University of Gondar,Debre Tabor General Hospital clinical director, data collectors, and studyparticipants.
Compliance with ethical standards
Conflict of interest The author declares that there is no conflict ofinterest.
Abbreviations DSM, diabetic self-management; KAP, knowledge atti-tude practice; SMBG, self-monitoring of blood glucose; SPSS, StatisticalPackage for Social Sciences; WHO, World Health Organization
References
1. World Health Organization. Global s tatus report onnoncommunicable diseases. 2014.
2. Diagnosis and classification of diabetes mellitus. Diabetes Care.2014;37(Supplement 1):S81–90.
3. Wild S, Roglic G, Green A, Sicree R, King H. Global prevalence ofdiabetes: estimates for the year 2000 and projections for 2030.Diabetes Care. 2004;27(5):1047–53.
4. World Health Organization. Diabetes action now: an initiative ofthe World Health Organization and the International DiabetesFederation. 2004.
5. Guariguata L, Whiting DR, Hambleton I, Beagley J, LinnenkampU, Shaw JE. Global estimates of diabetes prevalence for 2013 andprojections for 2035. Diabetes Res Clin Pract. 2014;103(2):137–49.
6. Peer N, Kengne A-P, Motala AA, Mbanya JC. Diabetes in theAfrica region: an update. Diabetes Res Clin Pract. 2014;103(2):197–205.
7. World Health Organization. Non-communicable diseases, countryprofiles. Geneva. 2011.
8. Wangnoo SK, Maji D, Das AK, Rao PV, Moses A, Sethi B, et al.Barriers and solutions to diabetes management: an Indian perspec-tive. Indian J Endocrinol Metab. 2013;17(4):594–601.
9. Kousoulis AA, Patelarou E, Shea S, Foss C, Ruud Knutsen IA,Todorova E, et al. Diabetes self-management arrangements inEurope: a realist review to facilitate a project implemented in sixcountries. BMC Health Serv Res. 2014;14.
10. Shrivastava SR, Shrivastava PS, Ramasamy J. Role of self-care inthe management of diabetes mellitus. J Diabetes Metab Dis.2013;12(1):14.
11. Beck J, Greenwood DA, Blanton L, Bollinger ST, Butcher MK,Condon JE, et al. 2017 National Standards for diabetes self-management education and support. Diabetes Spectr. 2017;30(4):301–14.
12. Aldossari K, Abdelrazik M, Kamal S, Al-Zahrani J, Al-Ghamdi S,Altamimi I, et al. Assessment of levels of knowledge, attitude andpractice about diabetes mellitus (DM), its complications and self-management of diabetic patients in AlKharj city, Saudi Arabia. IntJ. 2015;3(5):23–32.
13. El-Khawaga G, Abdel-Wahab F. Knowledge, attitudes, practice,and compliance of diabetic patients in Dakahlia, Egypt. Eur J ResMed Sci. 2015;3(1).
14. Zhong X, Tanasugarn C, Fisher EB, Krudsood S, Nityasuddhi D.Awareness and practices of self-management and influence factorsamong individuals with type 2 diabetes in urban community set-tings in Anhui Province, China. Southeast Asian J TropMed PublicHealth. 2011;42(1):184.
15. Dinesh PV, Kulkarni AG, Gangadhar NK. Knowledge and self-care practices regarding diabetes among patients with type 2 diabe-tes in rural Sullia, Karnataka: a community-based, cross-sectionalstudy. J Fam Med Prim Care. 2016;5(4):847–52.
16. Hawal NP, Shivaswamy M, Kambar S, Patil S, Hiremath M.Knowledge, attitude and behavior regarding self-care practicesamong type 2 diabetes mellitus patients residing in an urban areaof South India. Int Multidiscip Res J. 2012;2(12).
17. Mukeshimana M, Hakizimana G, Mwali C, Umuhoza C,Uwambajimana J, Asingizwe D. The knowledge and practice ofself-care management among patients attending a diabetes clinic inKigali, Rwanda. Rwanda J. 2015;2(1):24–30.
18. Addisu Y, Eshete A, Hailu E. Assessment of diabetic patient per-ception of diabetic disease and self-care practice in Dilla UniversityReferral Hospital. South Ethiopia J Metab Synd. 2014;3(166):2167–0943.1000166.
19. Amente T, Belachew T, Hailu E, Berhanu N. Self care practice andits predictors among adults with diabetes mellitus on follow up atNekemte hospital diabetic clinic, West Ethiopia. World J MedMedSci. 2014;2(3):1–16.
20. Chaurasia N,Mishra R, Ling H, Thapa B, Pokhre A, Kumar S, et al.A self-care management awareness study among diabetes mellituspatients in rural Nepal. Am J Public Health Res. 2015;3(5A):67–71.
344 Int J Diabetes Dev Ctries (2021) 41:337–345
21. Jackson IL, Adibe MO, Okonta MJ, Ukwe CV. Knowledge of self-care among type 2 diabetes patients in two states of Nigeria. PharmPract. 2014;12(3):404.
22. Sharma S, Bhadari SD. Knowledge and practice regarding self-careamong the patients with type II diabetes of Kapan, Kathmandu. JAdv Acad Res. 2014;1(2):85–91.
23. Selvaraj K, Ramaswamy G, Radhakrishnan S, Thekkur P,Chinnakali P, Roy G. Self-care practices among diabetes patientsregistered in a chronic disease clinic in Puducherry, South India. JSoc Health Diabetes. 2016;4(01):025–9.
24. Kassahun A, Fanta Gashe EM, Rike WA. Nonadherence and fac-tors affecting adherence of diabetic patients to anti-diabetic medi-cation in Assela General Hospital, Oromia region, Ethiopia. JPharm Bioallied Sci. 2016;8(2):124.
25. Yuan L, Guo X, Xiong Z, Lou Q, Shen L, Zhao F, et al. Self-monitoring of blood glucose in type 2 diabetic patients in China:current status and influential factors. Chin Med J. 2014;127(2):201–7.
26. Yekta Z, Pourali R, Aghassi MR, Ashragh N, Ravanyar L, RAHIMPMY. Assessment of self-care practice and its associated factorsamong diabetic patients in an urban area of Urmia, northwest ofIran. J Res Health Sci. 2011;11(1):33–8.
Publisher’s note Springer Nature remains neutral with regard to jurisdic-tional claims in published maps and institutional affiliations.
345Int J Diabetes Dev Ctries (2021) 41:337–345
ORIGINAL ARTICLE
Function of family of origin and current quality of life: exploringthe mediator role of resilience in Chinese patients with type2 diabetes
Guizhi Jia1 & Xin Li2 & Yuying Chu2& Hongliang Dai2
Received: 25 May 2020 /Accepted: 7 November 2020# Research Society for Study of Diabetes in India 2020
AbstractObjectives Early physical and mental experiences from family of origin and parents might influence individuals’ later adulthoodquality of life (QOL). The present study was undertaken to examine the inter-relationships among function of family of origin,resilience, and current quality of life in a T2DM sample from China.Methods Three hundred T2DM participants were included in this investigation. A Chinese version of Connor-DavidsonResilience Scale 25, an APGAR family functioning scale, and a Diabetes Specificity Quality of Life Scale were used to assessthe levels of mental resilience, function of family of origin, and QOL of these patients, respectively. Multiple stepwise regressionanalysis was performed to identify the predictors of QOL. A 3-step composite analysis was used to examine the predictedmediating effect.Results QOL total score was negatively related to resilience (r = − .299, p < 0.01) and family function (r = − .246, p < 0.01). Incontrast, a significantly positive correlation between resilience and family function (r = .302, p < 0.01) was found. Two subscalesof resilience (strength and optimism) and function of family of origin explained an additional 4.5% of the variance in QOLchanges after controlling for demographic variables. Resilience had a 26.3% mediating effect between function of family oforigin and current QOL.Conclusion In conclusion, the present work suggested a synthetic and stable association between function of family of origin andQOL level in the later life in a sample of Chinese T2DM population, with resilience acting as a mediating factor. Adultindividuals who have grown up in an unfavorable family setting may be low in mental resilience, and would have worseQOL in their mid- and later life, especially when they are confronted with certain adversity or stress, such as having diabetes.
Keywords Quality of life . Resilience . T2DM . Family function . Family of origin
Introduction
Chinese society is now confronted with a series of challengesincluding aging populations, soaring proportion of obese andoverweight individuals, and increasing prevalence of un-healthy lifestyles such as excessive consumption of high-energy and high-fat diet as well as insufficient physical activ-ity [1–3]. All the changes put people at greater risk of type 2
diabetes mellitus (T2DM) [4, 5]. According to a latest epide-miological study, approximately 11% of Chinese populationhas this disease [6]. T2DM is associated with various acuteand chronic complications, disability, and impaired physicaland mental functioning that greatly threaten the quality of life(QOL) of patients [7–9].
Family of origin refers to the family that one was born into,where he grows up in with other family members, such as hisparents, siblings, grandparents, single parents, or other rela-tives. Family of origin strongly influences the development ofan individual through family function, which refers to theroles of family in human life and social development.Accumulating studies have shown that early family environ-ment (e.g., parenting style) can affect the child developmentand resilience level significantly [10]. Of note, rememberedfamily atmosphere and parenting behaviors from childhood
* Hongliang [email protected]
1 Department of Physiology, Jinzhou Medical University,Jinzhou, China
2 School of Nursing, Jinzhou Medical University, No. 40, Section 3,Songpo Road, Jinzhou 121001, China
https://doi.org/10.1007/s13410-020-00894-5
/ Published online: 26 November 2020
International Journal of Diabetes in Developing Countries (2021) 41:346–353
continue to influence physiological well-being and depressivesymptom across the life span [11]. Early physical and mentalexperiences from family of origin and parents would alsodeeply impact individuals’ later adulthood development andoutcomes, such as QOL, career achievement, mental health,and resilience [12, 13].
Up to date, an explanation regarding the role of child-hood family environment in the psychological develop-ment and QOL level in mid- and later life of Chineseadult patients with type 2 diabetes is lacking. The purposeof this study was to examine the relationships amongfunction of family of origin, mental resilience, and QOLin a Chinese T2DM population. We hypothesized thatindividuals growing up under undesirable family atmo-sphere would be less resilient and would report poorerQOL than would those enjoying a positive family parent-ing environment during childhood and that resiliencewould mediate the relationship between childhood familyatmosphere and adulthood QOL of diabetic patients. Thiswork was aimed to provide a novel perspective on theinterrelationship between family of origin function, men-tal resilience, and their current QOL in Chinese T2DMpatients.
Materials and methods
Design and sample
A cross-sectional study was conducted among 300 T2DMpatients at twomajor tertiary hospitals in Jinzhou, China, fromMay to September 2019. Data were collected by researcherstogether with four well-trained research assistants. Theyassigned the questionnaires to the T2DM patients when theyroutinely visited the outpatient department. Participants weretold to complete the questionnaires voluntarily and anony-mously, and they were not required to complete the survey ifthey were not willing to go further out of whatever reasons.Inclusion criteria were as follows: age over 18 years; diabetesidentified as type 2; diabetes diagnosed ≥ 6 months; and canspeak and understand mandarin (standard spoken Chinese).Patients who had history of malignant tumor or other severecomorbidities and gestational diabetes were excluded from thestudy. Following collection of 306 questionnaires, it wasfound that 6 were invalid and thus excluded.
Measures
Mental resilience
The 25-item Chinese version of the Conner-DavidsonResilience Scale (CD-RISC25) was utilized to evaluate
the three dimensions of patients’ resilience. The threedimensions of this scale were tenacity (13 items),strength (8 items), and optimism (4 items). Each itemuses a 0-to-4 rating method, and the total score rangesfrom 0 to 100, with higher scores indicating higher lev-el of resilience. Cronbach’s α coefficient of internalconsistency of the three subscales ranged from 0.705to 0.879.
Family function
The Chinese version of APGAR score was used to evaluatefamily function. This scale contains five items/dimensions:adaptability, partnership, growth, affection, and resolve.Each item/dimension is scored from 0 to 2, and the total scoreranges from 0 to 10. Higher APGAR scoring means betterfamily function. Cronbach’s α coefficient of internal consis-tency of the scale was 0.824.
Quality of life
The Chinese version of Diabetes Specificity Quality ofLife Scale (DSQL) was applied to assess QOL amongpatients with T2DM. DSQL is a reliable and validatedinstrument for QOL measurement, and contains 27 itemsthat measure four different domains of health: physiolo-gy, psychology, social, and therapy. DSQL was scoredranging from 27 to 135, with higher score indicatingworse QOL. Cronbach’s α coefficient of internal con-sistency of the four subscales ranged from 0.909 to0.987.
Statistics analysis
Data analysis was carried out using Statistical Package for theSocial Sciences Version 17.0 (IBM Corp., Armonk, NY,USA). Descriptive statistics for sociodemographic and clinicalvariables are expressed as frequencies and percentages.Pearson correlation analysis was performed to assess correla-tions among resilience, family function, and QOL. Multiplelinear regression was performed using the DSQL total score asthe outcome variable and family function and resilience ascontinuous independent variables, controlling for demograph-ic and clinical variables.
Variables were considered as mediators when the fol-lowing correlation was identified: (a) independent vari-ables are strongly related to dependent variables; (b) in-dependent variables are associated with mediating vari-ables; (c) independent variables and mediating variablesare related to dependent variables [14]. Based on thecorrelation framework, a 3-step composite analysis wasused to examine the mediating effects, as routinely
347Int J Diabetes Dev Ctries (2021) 41:346–353
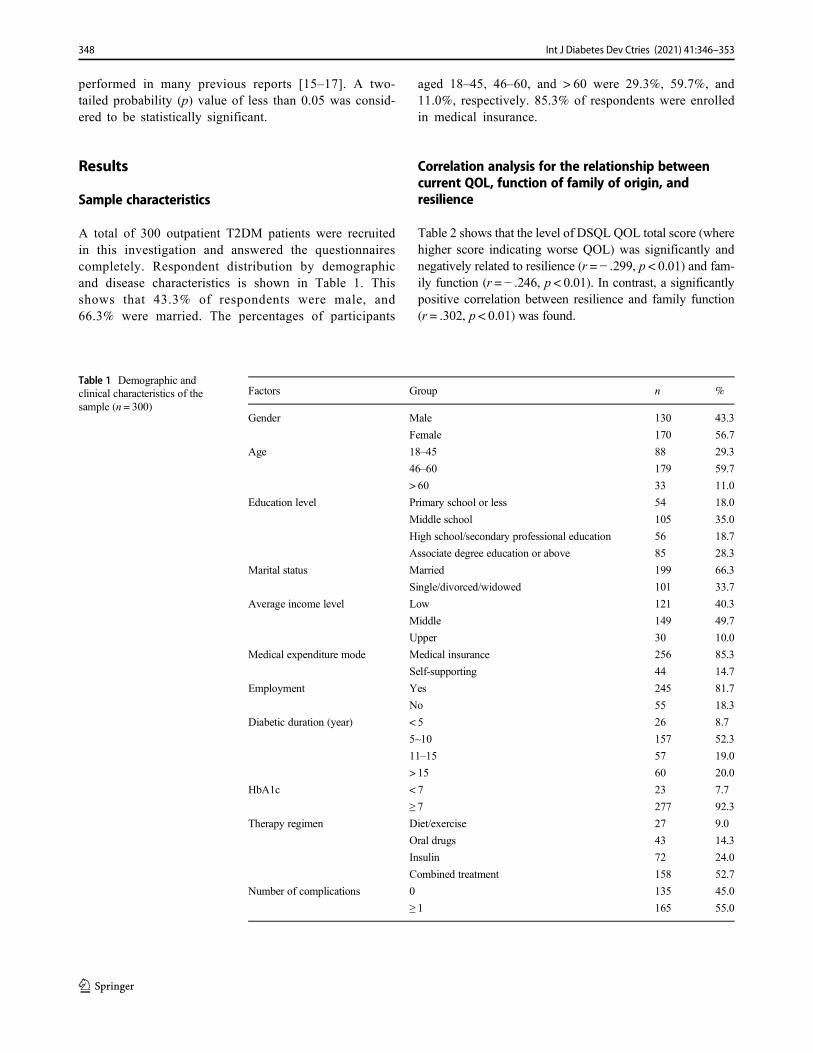
performed in many previous reports [15–17]. A two-tailed probability (p) value of less than 0.05 was consid-ered to be statistically significant.
Results
Sample characteristics
A total of 300 outpatient T2DM patients were recruitedin this investigation and answered the questionnairescompletely. Respondent distribution by demographicand disease characteristics is shown in Table 1. Thisshows that 43.3% of respondents were male, and66.3% were married. The percentages of participants
aged 18–45, 46–60, and > 60 were 29.3%, 59.7%, and11.0%, respectively. 85.3% of respondents were enrolledin medical insurance.
Correlation analysis for the relationship betweencurrent QOL, function of family of origin, andresilience
Table 2 shows that the level of DSQL QOL total score (wherehigher score indicating worse QOL) was significantly andnegatively related to resilience (r = − .299, p < 0.01) and fam-ily function (r = − .246, p < 0.01). In contrast, a significantlypositive correlation between resilience and family function(r = .302, p < 0.01) was found.
Table 1 Demographic andclinical characteristics of thesample (n = 300)
Factors Group n %
Gender Male 130 43.3
Female 170 56.7
Age 18–45 88 29.3
46–60 179 59.7
> 60 33 11.0
Education level Primary school or less 54 18.0
Middle school 105 35.0
High school/secondary professional education 56 18.7
Associate degree education or above 85 28.3
Marital status Married 199 66.3
Single/divorced/widowed 101 33.7
Average income level Low 121 40.3
Middle 149 49.7
Upper 30 10.0
Medical expenditure mode Medical insurance 256 85.3
Self-supporting 44 14.7
Employment Yes 245 81.7
No 55 18.3
Diabetic duration (year) < 5 26 8.7
5~10 157 52.3
11–15 57 19.0
> 15 60 20.0
HbA1c < 7 23 7.7
≥ 7 277 92.3
Therapy regimen Diet/exercise 27 9.0
Oral drugs 43 14.3
Insulin 72 24.0
Combined treatment 158 52.7
Number of complications 0 135 45.0
≥ 1 165 55.0
348 Int J Diabetes Dev Ctries (2021) 41:346–353

Multiple linear regression analysis for the relationshipbetween current QOL, function of family of origin,and resilience
To further explore the relationship of QOL with family func-tion and resilience, we conducted a thrice repeated multiplelinear regression analysis, in which QOL was used as theexplained variables, sociodemographic characteristics as thecontrolled variables, and family function and resilience di-mensions as principal significant variables. According to thefinal model in Table 3, namely model R3, two subscales ofresilience (strength and optimism) and family function wererelevant to the level of QOL.
The mediation effect of resilience between functionof family of origin and current QOL
A 3-step composite analysis was conducted to identify a po-tential mediator. As shown in Fig. 1, in the first step, resiliencewas significantly regressed on function of family of origin(β = .285, p < 0.001). In the second step, current QOL wassignificantly regressed on function of family of origin (β =− .170, p < 0.001). In the third step, when both functions offamily of origin and resilience were included in the samemodel, both factors remained significant predictors of current
QOL (β = − .125 and − .157, respectively; both p < 0.01).Through 3-step regression, resilience had a significant medi-ating effect between function of family of origin and currentQOL, with a mediation effect of .285 * (− .157) / (− .170) ≈26.3%.
Discussion
Principal findings
Against the background of continuously rising diabetic inci-dence, this study investigated the comprehensive relationshipsamong function of family of origin, mental resilience, andtheir current QOL. Our data indicated that function of familyof origin had a significant role in current QOL status in type 2diabetic patients, directly and indirectly via mediation bymen-tal resilience. As far as we know, this might be the first reportregarding exploration of the influence of function of family oforigin of type 2 diabetic patients on their current QOL status.Although certain studies have also examined the role of familyfunction in QOL of type 2 diabetic patients [18–20], theyexclusively focused on exploring the contribution of “currentfamily function” rather than “function of family of origin” asin our present study.
Table 2 Correlation analysis forthe relationship between functionof family of origin, resilience, andcurrent quality of life
Function of family of origin Resilience Current quality of life
Function of family of origin 1 .302** − .246**Resilience .302** 1 − .299**Current quality of life − .246** − .299** 1
**p < 0.01
Table 3 Multiple linear regression analysis for the relationship between current quality of life, function of family of origin, and resilience
Explanatory variables Model R1 Model R2 Model R3
t p t p t p
Sociodemographic variables Number of complications 6.703 .000 6.491 0.000 6.544 0.000
Marital status − 7.253 0.000 − 6.629 0.000 − 6.418 0.000
Education level − 2.992 0.003 − 3.195 0.002 − 2.924 0.004
Age 2.920 0.004 3.051 0.002 3.304 0.001
Therapy regimen − 2.973 0.003 − 3.103 0.002 − 3.087 0.002
Resilience Tenacity − 2.920 0.004 – –
Strength – – − 2.108 0.036
Optimism − 2.418 0.016 − 2.442 0.015
Function of family of origin − 3.733 0.000
F value 37.152 30.359 28.330
p value 0.000 0.000 0.000
Adjusted R2 0.377 0.407 0.422
349Int J Diabetes Dev Ctries (2021) 41:346–353
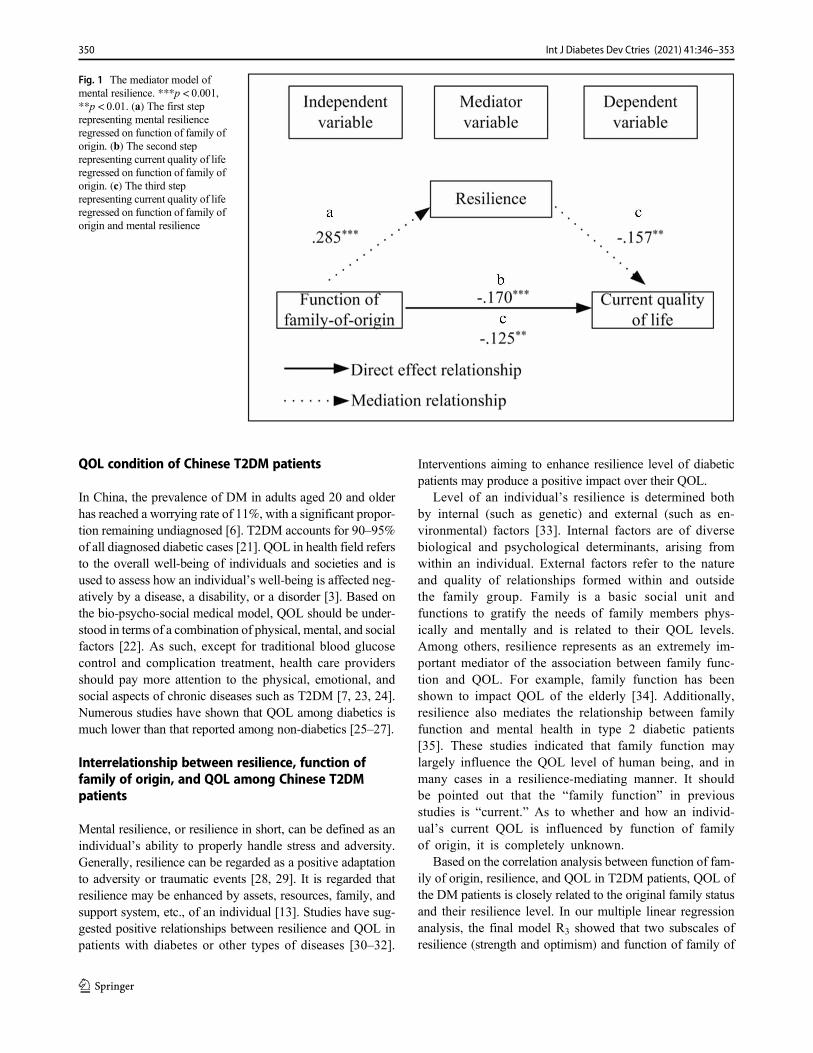
QOL condition of Chinese T2DM patients
In China, the prevalence of DM in adults aged 20 and olderhas reached a worrying rate of 11%, with a significant propor-tion remaining undiagnosed [6]. T2DM accounts for 90–95%of all diagnosed diabetic cases [21]. QOL in health field refersto the overall well-being of individuals and societies and isused to assess how an individual’s well-being is affected neg-atively by a disease, a disability, or a disorder [3]. Based onthe bio-psycho-social medical model, QOL should be under-stood in terms of a combination of physical, mental, and socialfactors [22]. As such, except for traditional blood glucosecontrol and complication treatment, health care providersshould pay more attention to the physical, emotional, andsocial aspects of chronic diseases such as T2DM [7, 23, 24].Numerous studies have shown that QOL among diabetics ismuch lower than that reported among non-diabetics [25–27].
Interrelationship between resilience, function offamily of origin, and QOL among Chinese T2DMpatients
Mental resilience, or resilience in short, can be defined as anindividual’s ability to properly handle stress and adversity.Generally, resilience can be regarded as a positive adaptationto adversity or traumatic events [28, 29]. It is regarded thatresilience may be enhanced by assets, resources, family, andsupport system, etc., of an individual [13]. Studies have sug-gested positive relationships between resilience and QOL inpatients with diabetes or other types of diseases [30–32].
Interventions aiming to enhance resilience level of diabeticpatients may produce a positive impact over their QOL.
Level of an individual’s resilience is determined bothby internal (such as genetic) and external (such as en-vironmental) factors [33]. Internal factors are of diversebiological and psychological determinants, arising fromwithin an individual. External factors refer to the natureand quality of relationships formed within and outsidethe family group. Family is a basic social unit andfunctions to gratify the needs of family members phys-ically and mentally and is related to their QOL levels.Among others, resilience represents as an extremely im-portant mediator of the association between family func-tion and QOL. For example, family function has beenshown to impact QOL of the elderly [34]. Additionally,resilience also mediates the relationship between familyfunction and mental health in type 2 diabetic patients[35]. These studies indicated that family function maylargely influence the QOL level of human being, and inmany cases in a resilience-mediating manner. It shouldbe pointed out that the “family function” in previousstudies is “current.” As to whether and how an individ-ual’s current QOL is influenced by function of familyof origin, it is completely unknown.
Based on the correlation analysis between function of fam-ily of origin, resilience, and QOL in T2DM patients, QOL ofthe DM patients is closely related to the original family statusand their resilience level. In our multiple linear regressionanalysis, the final model R3 showed that two subscales ofresilience (strength and optimism) and function of family of
Fig. 1 The mediator model ofmental resilience. ***p < 0.001,**p < 0.01. (a) The first steprepresenting mental resilienceregressed on function of family oforigin. (b) The second steprepresenting current quality of liferegressed on function of family oforigin. (c) The third steprepresenting current quality of liferegressed on function of family oforigin and mental resilience
350 Int J Diabetes Dev Ctries (2021) 41:346–353
origin had a significant influence on QOL: the comparisonbetween R3 and R1 indicated that these two factors explainedan additional 4.5% of the variance in QOL changes. In addi-tion, the 3-step composite analysis confirmed a 26.3% medi-ation ratio of resilience between the relationship of function offamily of origin and current QOL of the subjects.
In our study, resilience exhibited a positive influenceon QOL level of T2DM population, which is in line withprevious studies [30, 35, 36]. This seems easy to under-stand, as individuals with high resilience are often lifesatisfactory, optimistic, and having a tranquil mind.These fine psychological qualities would facilitate theircoping with difficulties and adversities when they arefaced with stressful occasions [37]. In compatible withthis notion, our current finding also found a significantpositive effect of optimism and strength on QOL.Family setting and parenting represent an initial and ex-tremely important context for the physical and mental de-velopment of individuals and would mold and even main-tain their resilience in the whole life [13, 38–40]. Previousresults have shown that adolescents growing up in chron-ically distressed families are more likely to be sociallyand emotionally problematic, and cannot effectively ad-dress a variety of adversities. As such, the negative influ-ence of unfavorable family setting on adolescent individ-uals seems to be long-termed and consecutive, going allthe way through the whole life of the victims. This mighthelp explain why the function of family of origin couldproduce a significant influence on the individuals’ mentalresilience and QOL, as shown in our study. Similar to theresults presented herein, it was shown that elderly indi-viduals who had grown up under a warm, supportive, andloving parenting style (authoritative parenting) tend to ex-hibit greater resilience and a lower level of depression. Incontrast, cold, unsupportive, and high demanding parent-ing style (authoritarian parenting) was related to less re-silience, and resulted in worse mental health outcomes[13].
Strengths of the study
In contrast to previous studies which indicated that the“current” family function may largely influence the QOLlevel of human being, and in many cases in a resilience-mediating manner, our present study for the first timereveals that an individual’s current QOL is also signifi-cantly influenced by function of family of origin wherethe type 2 diabetic patients lived with during childhood.Furthermore, we found that the influence of function offamily of origin on the current QOL of T2DM patientswas partially mediated by their mental resilience. Thesenovel findings would help understand and realize the im-portance of the early family environment on the later
adulthood life of an individual, especially when they areconfronted with an adversity, such as having T2DM.
Limitations
The present study bears several major limitations. Firstly,the subjects were limited to the urban community, whichmay limit the generalizability of our study results.Secondly, the study design was cross-sectional, so onecannot draw any causal relationships between QOL andmental resilience. Thus, future longitudinal studies or ran-domized controlled trials will be warranted to further con-firm our arguments. Thirdly, the sample size was relative-ly small, and the heterogeneity in our sample characteris-tics might have brought bias. Thus, the results should beinterpreted with caution. Fourthly, the function of familyof origin rating by diabetic population in our samplewould be subject to recall bias.
Conclusion
The findings of the present study suggest a close andstable correlation between function of family of originand the current QOL in Chinese adults with T2DM, whichis partly mediated by mental resilience. Adult individualswho have experienced unfavorable family setting may below in mental resilience. This negative influence con-tinues to function in their later life, and would decreasetheir QOL, especially under a certain adversity or stress,such as having diabetes. The findings of this study alsohighlight the importance of function and setting of familyof origin for the health-related QOL of minor familymembers in their mid- and later life.
Acknowledgments The authors would like to thank all the participants inthis investigation.
Authors’ contributions HongliangDai formulated the research questions,designed and supervised the study, developed the preliminary searchstrategy, and drafted the manuscript; Guizhi Jia, Xin Li, Yuying Chu,and Hongliang Dai collected and analyzed the data for study.Hongliang Dai wrote the manuscript. Guizhi Jia and Yuying Chu con-ducted the quality assessment. All authors critically reviewed the manu-script for relevant intellectual content. All authors have read and approvedthe final version of the manuscript.
Compliance with ethical standards
Conflict of interest The authors declare that they have no conflict of interest.
Ethical consideration All the participants were informed beforehandregarding the purpose and process of this study. Afterwards, the writteninformed consent was obtained from the eligible participants who readilyagreed to participate in this research before they completed the question-naires. They were also informed to have the right to withdraw from this
351Int J Diabetes Dev Ctries (2021) 41:346–353
survey if for any reason they were not interested in doing so. All proce-dures performed in studies involving human participants were in accor-dance with the 1964 Helsinki declaration and its later amendments orcomparable ethical standards. The study protocol was also reviewedand approved by Jinzhou Medical University Ethics Committee.
References
1. Hu L, Huang X, You C, Li J, Hong K, Li P, et al. Prevalence ofoverweight, obesity, abdominal obesity and obesity-related risk fac-tors in southern China. PLoS One. 2017;12(9):e0183934.
2. Fang EF, Scheibye-KnudsenM, JahnHJ, Li J, Ling L, Guo H, et al.A research agenda for aging in China in the 21st century. AgeingRes Rev. 2015;24(Pt B):197–205.
3. Dai H, Jia G, Liu K. Health-related quality of life and related factorsamong elderly people in Jinzhou, China: a cross-sectional study.Public Health. 2015;129(6):667–73.
4. Zheng Y, Ley SH, Hu FB. Global aetiology and epidemiology oftype 2 diabetes mellitus and its complications. Nat Rev Endocrinol.2018;14(2):88–98.
5. Zhu S, Hu J, McCoy TP, Li G, Zhu J, Lei M, et al. Socioeconomicstatus and the prevalence of type 2 diabetes among adults in north-west China. Diabetes Educ. 2015;41(5):599–608.
6. Ma RCW. Epidemiology of diabetes and diabetic complications inChina. Diabetologia. 2018;61(6):1249–60.
7. Al Hayek AA, Robert AA, Al Saeed A, Alzaid AA, Al Sabaan FS.Factors associated with health-related quality of life among Saudipatients with type 2 diabetes mellitus: a cross-sectional survey.Diabetes Metab J. 2014;38(3):220–9.
8. Derakhshanpour F, Vakili MA, Farsinia M, Mirkarimi K.Depression and quality of life in patients with type 2 diabetes.Iran Red Crescent Med J. 2015;17(5):e27676.
9. Sepulveda E, Poinhos R, Constante M, Pais-Ribeiro J, Freitas P,Carvalho D. Health-related quality of life in type 1 and type 2diabetic patients in a Portuguese central public hospital. DiabetesMetab Syndr Obes. 2015;8:219–26.
10. Treyvaud K. Parent and family outcomes following very preterm orvery low birth weight birth: a review. Semin Fetal Neonatal Med.2014;19(2):131–5.
11. Rothrauff TC, Cooney TM, An JS. Remembered parenting stylesand adjustment in middle and late adulthood. J Gerontol Ser BPsychol Sci Soc Sci. 2009;64(1):137–46.
12. Andersson L, Stevens N. Associations between early experienceswith parents and well-being in old age. J Gerontol. 1993;48(3):P109–16.
13. Zhong X, Wu D, Nie X, Xia J, Li M, Lei F, et al. Parenting style,resilience, and mental health of community-dwelling elderly adultsin China. BMC Geriatr. 2016;16:135.
14. Bennett JA. Mediator and moderator variables in nursing research:conceptual and statistical differences. Res Nurs Health. 2000;23(5):415–20.
15. Zhang H, Zhao Q, Cao P, Ren G. Resilience and quality of life:exploring the mediator role of social support in patients with breastcancer. Med Sci Monitor. 2017;23:5969–79.
16. Xu J, Ou L. Resilience and quality of life among Wenchuan earth-quake survivors: the mediating role of social support. Public Health.2014;128(5):430–7.
17. Rao D, Chen WT, Pearson CR, Simoni JM, Fredriksen-Goldsen K,Nelson K, et al. Social support mediates the relationship betweenHIV stigma and depression/quality of life among people living withHIV in Beijing, China. Int J STD AIDS. 2012;23(7):481–4.
18. Bennich BB, Munch L, Egerod I, Konradsen H, Ladelund S, KnopFK, et al. Patient assessment of family function, glycemic control
and quality of life in adult patients with type 2 diabetes and incipientcomplications. Can J Diabetes. 2019;43(3):193–200.
19. Wang J, He M, Zhao X. Depressive symptoms, family functioningand quality of life in Chinese patients with type 2 diabetes. Can JDiabetes. 2015;39(6):507–12.
20. Alves Costa MS, Pereira MG. Predictors and moderators of qualityof life in caregivers of amputee patients by type 2 diabetes.2018;32(2):933–42.
21. Tol A, Sharifirad G, Eslami A, Shojaeizadeh D, Alhani F, TehraniMM. Analysis of some predictive factors of quality of life amongtype 2 diabetic patients. J Educ Health Promot. 2015;4:9.
22. Zinszer KM, Mulhern JL, Kareem AA. The implementation of thechronic care model with respect to dealing with the biopsychosocialaspects of the chronic disease of diabetes. Adv Skin Wound Care.2011;24(10):475–84.
23. Camacho F, Anderson RT, Bell RA, Goff DC Jr, Duren-WinfieldV, Doss DD, et al. Investigating correlates of health related qualityof life in a low-income sample of patients with diabetes. Qual LifeRes Int J Qual Life Asp Treat Care Rehab. 2002;11(8):783–96.
24. Song Y, Nam S, Park S, Shin IS, Ku BJ. The impact of socialsupport on self-care of patients with diabetes: what is the effect ofdiabetes type? Systematic review and meta-analysis. DiabetesEduc. 2017;43(4):396–412.
25. Golicki D, Dudzinska M, Zwolak A, Tarach JS. Quality of life inpatients with type 2 diabetes in Poland - comparison with the gen-eral population using the EQ-5D questionnaire. Adv Clin ExpMed.2015;24(1):139–46.
26. Oguntibeju OO, Odunaiya N, Oladipo B, Truter EJ. Health behav-iour and quality of life of patients with type 2 diabetes attendingselected hospitals in south western Nigeria. West Indian Med J.2012;61(6):619–26.
27. Jing X, Chen J, Dong Y, Han D, Zhao H, Wang X, et al. Relatedfactors of quality of life of type 2 diabetes patients: a systematicreview and meta-analysis. Health Qual Life Outcomes. 2018;16(1):189.
28. Smith GD, Ng F. Ho Cheung Li W. COVID-19: emerging com-passion, courage and resilience in the face of misinformation andadversity. J Clin Nurs. 2020;29(9–10):1425–8.
29. Izydorczyk B, KwapniewskaA, Lizinczyk S, Sitnik-Warchulska K.Psychological resilience as a protective factor for the body image inpost-mastectomy women with breast cancer. Int J Environ ResPublic Health. 2018;15(6).
30. Nawaz A,Malik JA, Batool A. Relationship between resilience andquality of life in diabetics. J College Phys Surg–Pakistan: JCPSP.2014;24(9):670–5.
31. Kirby JS, Butt M, Esmann S, Jemec GBE. Association of resiliencewith depression and health-related quality of life for patients withhidradenitis suppurativa. JAMA Dermatol. 2017;153(12):1263–9.
32. Kasser SL, Zia A. Mediating role of resilience on quality of life inindividuals with multiple sclerosis: a structural equation modelingapproach. Arch Phys Med Rehabil. 2020;101:1152–61.
33. Amstadter AB, Maes HH, Sheerin CM, Myers JM, Kendler KS.The relationship between genetic and environmental influences onresilience and on common internalizing and externalizing psychiat-ric disorders. Soc Psychiatry Psychiatr Epidemiol. 2016;51(5):669–78.
34. Lu C, Yuan L, Lin W, Zhou Y, Pan S. Depression and resiliencemediates the effect of family function on quality of life of the el-derly. Arch Gerontol Geriatr. 2017;71:34–42.
35. Bahremand M, Rai A, Alikhani M, Mohammadi S, ShahebrahimiK, Janjani P. Relationship between family functioning and mentalhealth considering the mediating role of resiliency in type 2 diabetesmellitus patients. Global J Health Sci. 2014;7(3):254–9.
36. Wang RH, Lin KC, Hsu HC, Lee YJ, Shin SJ. Determinants forquality of life trajectory patterns in patients with type 2 diabetes.
352 Int J Diabetes Dev Ctries (2021) 41:346–353
Qual Life Res Int J Qual Life Asp Treat Care Rehab. 2019;28(2):481–90.
37. Zhai Y, Liu K, Zhang L, Gao H, Chen Z, Du S, et al. The relation-ship between post-traumatic symptoms, parenting style, and resil-ience among adolescents in Liaoning, China: a cross-sectionalstudy. PloS one. 2015;10(10):e0141102.
38. Chen P, Harris KM. Association of positive family relationshipswith mental health trajectories from adolescence to midlife.JAMA Pediatr. 2019:e193336.
39. Heerde JA, Bailey JA, Toumbourou JW, Catalano RF.Longitudinal associations between the adolescent family
environment and young adult substance use in Australia and theUnited States. Front Psychiatry. 2019;10:821.
40. Whittle S, Simmons JG, DennisonM, Vijayakumar N, Schwartz O,Yap MB, et al. Positive parenting predicts the development of ad-olescent brain structure: a longitudinal study. Dev Cogn Neurosci.2014;8:7–17.
Publisher’s note Springer Nature remains neutral with regard to jurisdic-tional claims in published maps and institutional affiliations.
353Int J Diabetes Dev Ctries (2021) 41:346–353
CASE REPORT
De novo mutation in HNF-1β gene as a cause for Maturity-onsetDiabetes of the Young type 5 with sustained hypomagnesemia
Bo Ren1& Yan Chen2
& Qiang Zhang3& Shuwen Chen4
& Shunxiao Zhang4& Jie Wang4
& Yan Zhang4
Received: 9 April 2020 /Accepted: 8 December 2020# Research Society for Study of Diabetes in India 2021
AbstractBackground Maturity-onset Diabetes of the Young type 5 (MODY5) is clinically heterogeneous, and the genetic examination isimportant to provide the accurate diagnosis. Identification of more cases will better understand the genotype-phenotype corre-lations of this disorder.Methods We collected the clinical and biochemical data, using the whole-exome gene detection and multiplex ligation–dependent probe Amplification to detect the pathogenic gene variants.Results The proband is a 39-year-old female, and presenting with symptoms including polyuria, polydipsia, and weight loss for 6months. Her BMI was 17.6 kg/m2. Laboratory tests indicated hypokalemia (3.1 mmol/L), hypomagnesemia (0.4 mmol/L), andhypocalcemia (1.91 mmol/L). Glycated hemoglobin (HbA1c) was 13.7%, fasting C-peptide was 0.24 ng/mL (normal range: 0.3–3.73 ng/mL). Both glutamic acid decarboxylase and islet cell antibodies were negative. Abdominal magnetic resonance imageshowed the agenesis of the tail and body of the pancreas and the presence of disseminated cysts of the left kidney. Geneticexamination displayed a de novo heterozygous deletion of the whole HNF-1Β gene (NM_000458.3). Three-year follow-up afterthe diagnosis showed that the patient has sustained hypomagnesemia and cannot maintain an appreciable increase in serummagnesium levels (0.52–0.61 mmol/L), although she was using the double-dose magnesium aspartate. Moreover, she cannotachieve good glucose control either.Conclusion Our findings indicted that MODY is highly heterogeneous and patients with additional extrapancreatic clinicalfeatures and hypomagnesemia should be screened for MODY5.
Keywords Maturity-onset Diabetes of the Young . Hypomagnesemia . Hepatocyte nuclear factor-1βeta (HNF-1β) . Mutation .
Diabetesmellitus
Introduction
Maturity-onset Diabetes of the Young (MODY) is a raregroup of dominantly inherited and clinically heterogeneous
diabetes mellitus [1]. MODY type 5 (MODY5) accounts for2–6% of MODY diagnoses, whose typical characterization isrelatively worse beta cell function and additionalextrapancreatic clinical features, like liver dysfunction, renaldisease, and genital malformation [2]. This disorder is causedby mutations of the hepatocyte nuclear factor-1beta (HNF1β)gene. HNF1β is an important transcription factor in the devel-opment of the pancreas, kidney, liver, and genital tract [3].HNF1β gene located on chromosome 17q12 and more than100 different mutations in this gene have been identified sinceit was associated with MODY5 in 1997 [1, 4].
Stiles et al. reportedHNF1β deletion as a cause for a patientwith chronic, treatment-resistant hypomagnesemia, but with-out diabetes mellitus (DM) [5]. In this report, we described arare heterozygous whole-gene deletion in HNF1β gene thatwas identified in a proband with MODY5 and sustainedhypomagnesemia.
* Yan [email protected]
1 Department of Neuroendocrinology, Laiwu Central Hospital ofXinwen Mining Group, Laiwu 271103, Shandong, China
2 Department of Radiology, Shanghai Baoshan Branch Hospital ofIntegrated Traditional Chinese & Western Medicine,Shanghai 201900, China
3 Department of PainManagement, Laiwu Central Hospital of XinwenMining Group, Laiwu 271103, Shandong, China
4 Department of Endocrinology, Shanghai Baoshan Branch Hospitalof Integrated Traditional Chinese & Western Medicine, 181, YouyiRd., Shanghai 201900, China
https://doi.org/10.1007/s13410-020-00904-6
/ Published online: 12 January 2021
International Journal of Diabetes in Developing Countries (2021) 41:354–357
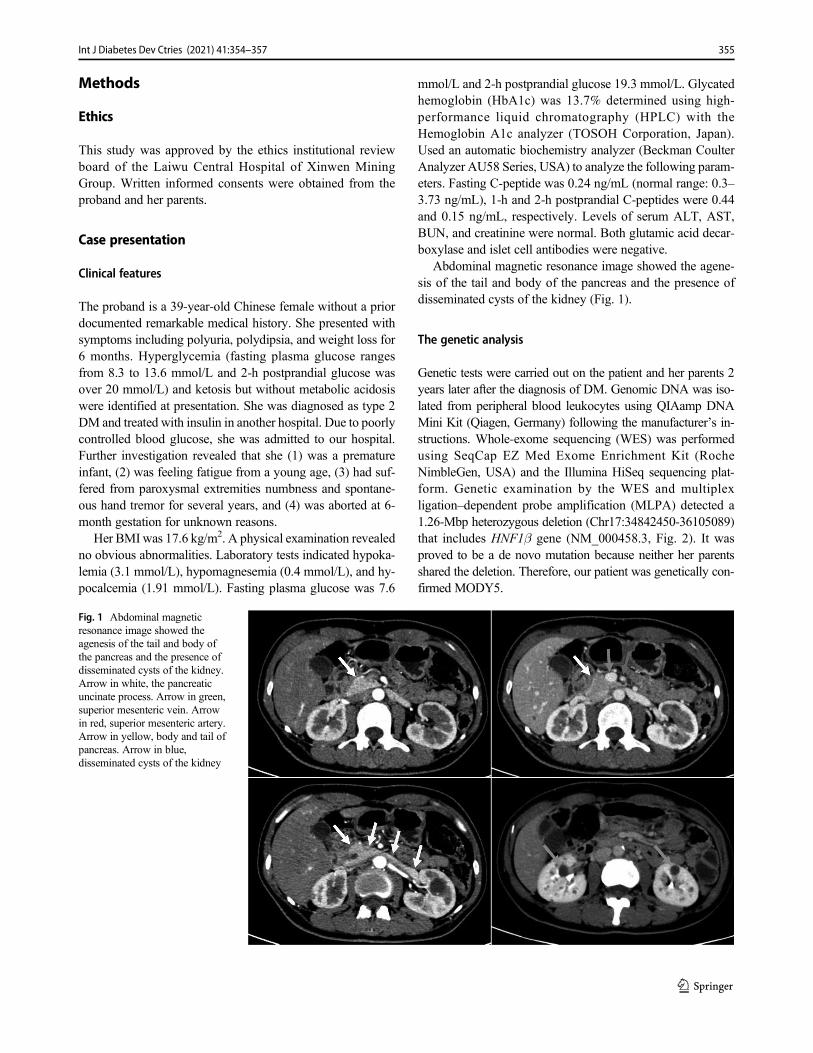
Methods
Ethics
This study was approved by the ethics institutional reviewboard of the Laiwu Central Hospital of Xinwen MiningGroup. Written informed consents were obtained from theproband and her parents.
Case presentation
Clinical features
The proband is a 39-year-old Chinese female without a priordocumented remarkable medical history. She presented withsymptoms including polyuria, polydipsia, and weight loss for6 months. Hyperglycemia (fasting plasma glucose rangesfrom 8.3 to 13.6 mmol/L and 2-h postprandial glucose wasover 20 mmol/L) and ketosis but without metabolic acidosiswere identified at presentation. She was diagnosed as type 2DM and treated with insulin in another hospital. Due to poorlycontrolled blood glucose, she was admitted to our hospital.Further investigation revealed that she (1) was a prematureinfant, (2) was feeling fatigue from a young age, (3) had suf-fered from paroxysmal extremities numbness and spontane-ous hand tremor for several years, and (4) was aborted at 6-month gestation for unknown reasons.
Her BMI was 17.6 kg/m2. A physical examination revealedno obvious abnormalities. Laboratory tests indicated hypoka-lemia (3.1 mmol/L), hypomagnesemia (0.4 mmol/L), and hy-pocalcemia (1.91 mmol/L). Fasting plasma glucose was 7.6
mmol/L and 2-h postprandial glucose 19.3 mmol/L. Glycatedhemoglobin (HbA1c) was 13.7% determined using high-performance liquid chromatography (HPLC) with theHemoglobin A1c analyzer (TOSOH Corporation, Japan).Used an automatic biochemistry analyzer (Beckman CoulterAnalyzer AU58 Series, USA) to analyze the following param-eters. Fasting C-peptide was 0.24 ng/mL (normal range: 0.3–3.73 ng/mL), 1-h and 2-h postprandial C-peptides were 0.44and 0.15 ng/mL, respectively. Levels of serum ALT, AST,BUN, and creatinine were normal. Both glutamic acid decar-boxylase and islet cell antibodies were negative.
Abdominal magnetic resonance image showed the agene-sis of the tail and body of the pancreas and the presence ofdisseminated cysts of the kidney (Fig. 1).
The genetic analysis
Genetic tests were carried out on the patient and her parents 2years later after the diagnosis of DM. Genomic DNA was iso-lated from peripheral blood leukocytes using QIAamp DNAMini Kit (Qiagen, Germany) following the manufacturer’s in-structions. Whole-exome sequencing (WES) was performedusing SeqCap EZ Med Exome Enrichment Kit (RocheNimbleGen, USA) and the Illumina HiSeq sequencing plat-form. Genetic examination by the WES and multiplexligation–dependent probe amplification (MLPA) detected a1.26-Mbp heterozygous deletion (Chr17:34842450-36105089)that includes HNF1β gene (NM_000458.3, Fig. 2). It wasproved to be a de novo mutation because neither her parentsshared the deletion. Therefore, our patient was genetically con-firmed MODY5.
Fig. 1 Abdominal magneticresonance image showed theagenesis of the tail and body ofthe pancreas and the presence ofdisseminated cysts of the kidney.Arrow in white, the pancreaticuncinate process. Arrow in green,superior mesenteric vein. Arrowin red, superior mesenteric artery.Arrow in yellow, body and tail ofpancreas. Arrow in blue,disseminated cysts of the kidney
355Int J Diabetes Dev Ctries (2021) 41:354–357
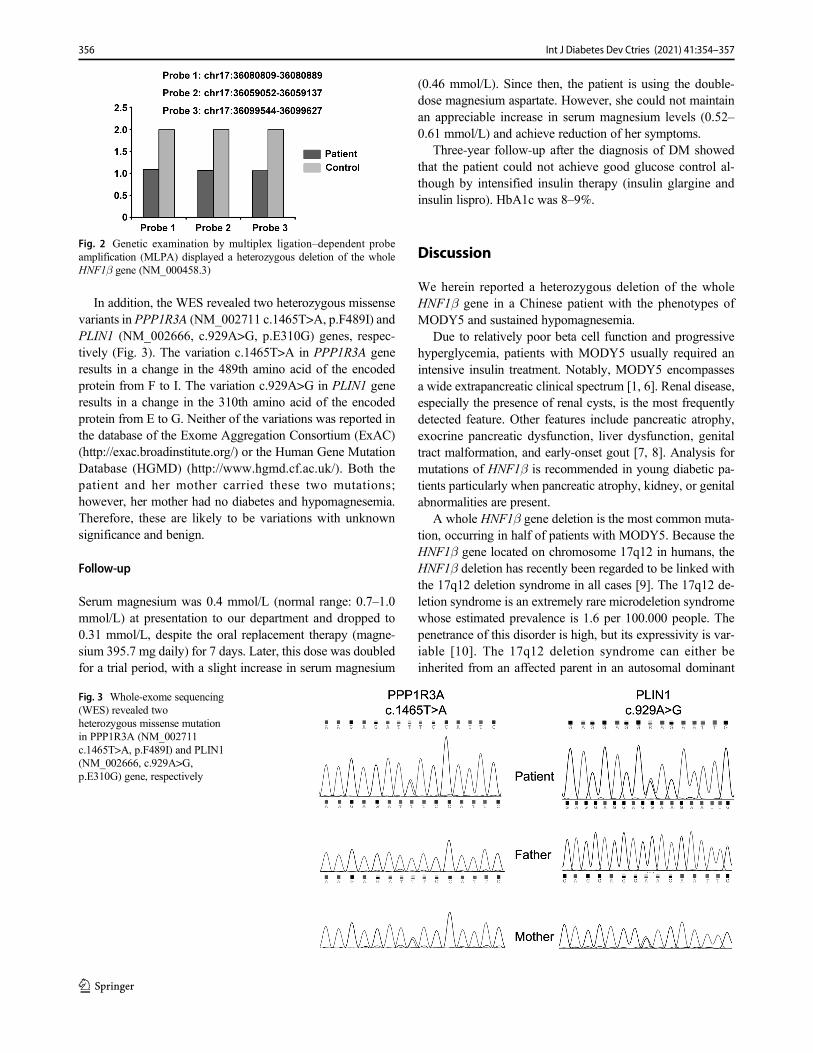
In addition, the WES revealed two heterozygous missensevariants in PPP1R3A (NM_002711 c.1465T>A, p.F489I) andPLIN1 (NM_002666, c.929A>G, p.E310G) genes, respec-tively (Fig. 3). The variation c.1465T>A in PPP1R3A generesults in a change in the 489th amino acid of the encodedprotein from F to I. The variation c.929A>G in PLIN1 generesults in a change in the 310th amino acid of the encodedprotein from E to G. Neither of the variations was reported inthe database of the Exome Aggregation Consortium (ExAC)(http://exac.broadinstitute.org/) or the Human Gene MutationDatabase (HGMD) (http://www.hgmd.cf.ac.uk/). Both thepatient and her mother carried these two mutations;however, her mother had no diabetes and hypomagnesemia.Therefore, these are likely to be variations with unknownsignificance and benign.
Follow-up
Serum magnesium was 0.4 mmol/L (normal range: 0.7–1.0mmol/L) at presentation to our department and dropped to0.31 mmol/L, despite the oral replacement therapy (magne-sium 395.7 mg daily) for 7 days. Later, this dose was doubledfor a trial period, with a slight increase in serum magnesium
(0.46 mmol/L). Since then, the patient is using the double-dose magnesium aspartate. However, she could not maintainan appreciable increase in serum magnesium levels (0.52–0.61 mmol/L) and achieve reduction of her symptoms.
Three-year follow-up after the diagnosis of DM showedthat the patient could not achieve good glucose control al-though by intensified insulin therapy (insulin glargine andinsulin lispro). HbA1c was 8–9%.
Discussion
We herein reported a heterozygous deletion of the wholeHNF1β gene in a Chinese patient with the phenotypes ofMODY5 and sustained hypomagnesemia.
Due to relatively poor beta cell function and progressivehyperglycemia, patients with MODY5 usually required anintensive insulin treatment. Notably, MODY5 encompassesa wide extrapancreatic clinical spectrum [1, 6]. Renal disease,especially the presence of renal cysts, is the most frequentlydetected feature. Other features include pancreatic atrophy,exocrine pancreatic dysfunction, liver dysfunction, genitaltract malformation, and early-onset gout [7, 8]. Analysis formutations of HNF1β is recommended in young diabetic pa-tients particularly when pancreatic atrophy, kidney, or genitalabnormalities are present.
A whole HNF1β gene deletion is the most common muta-tion, occurring in half of patients with MODY5. Because theHNF1β gene located on chromosome 17q12 in humans, theHNF1β deletion has recently been regarded to be linked withthe 17q12 deletion syndrome in all cases [9]. The 17q12 de-letion syndrome is an extremely rare microdeletion syndromewhose estimated prevalence is 1.6 per 100.000 people. Thepenetrance of this disorder is high, but its expressivity is var-iable [10]. The 17q12 deletion syndrome can either beinherited from an affected parent in an autosomal dominant
Fig. 2 Genetic examination by multiplex ligation–dependent probeamplification (MLPA) displayed a heterozygous deletion of the wholeHNF1β gene (NM_000458.3)
Fig. 3 Whole-exome sequencing(WES) revealed twoheterozygous missense mutationin PPP1R3A (NM_002711c.1465T>A, p.F489I) and PLIN1(NM_002666, c.929A>G,p.E310G) gene, respectively
356 Int J Diabetes Dev Ctries (2021) 41:354–357
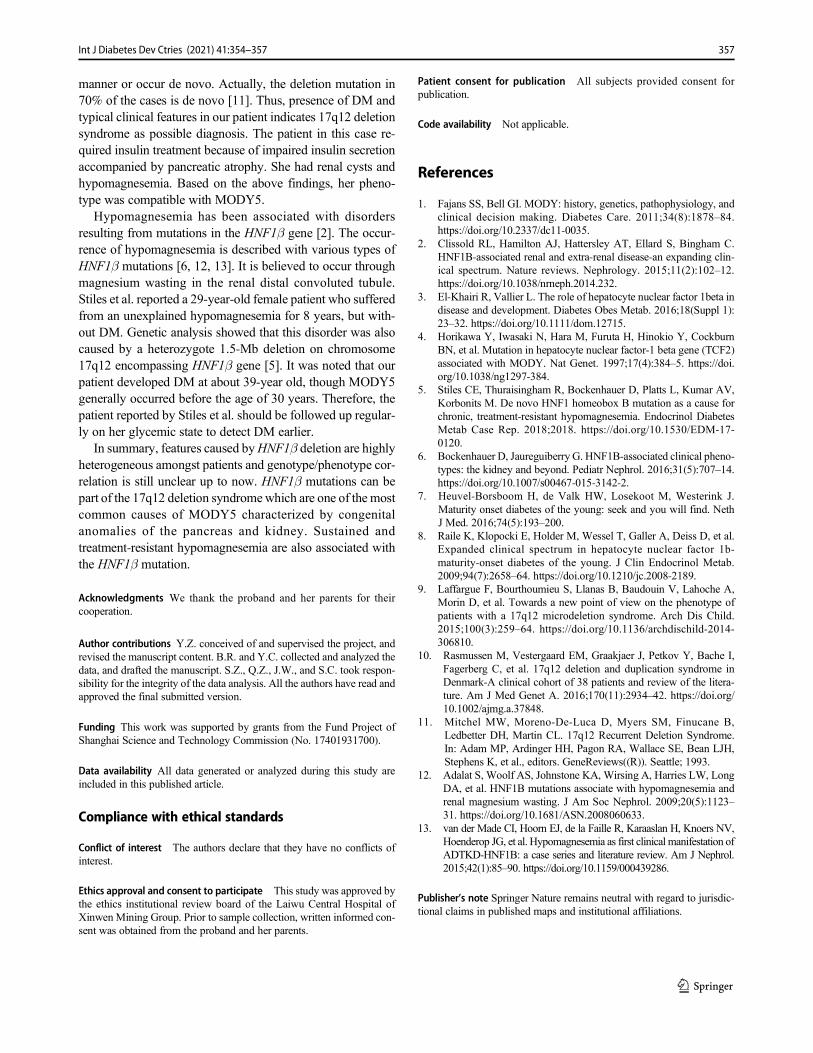
manner or occur de novo. Actually, the deletion mutation in70% of the cases is de novo [11]. Thus, presence of DM andtypical clinical features in our patient indicates 17q12 deletionsyndrome as possible diagnosis. The patient in this case re-quired insulin treatment because of impaired insulin secretionaccompanied by pancreatic atrophy. She had renal cysts andhypomagnesemia. Based on the above findings, her pheno-type was compatible with MODY5.
Hypomagnesemia has been associated with disordersresulting from mutations in the HNF1β gene [2]. The occur-rence of hypomagnesemia is described with various types ofHNF1β mutations [6, 12, 13]. It is believed to occur throughmagnesium wasting in the renal distal convoluted tubule.Stiles et al. reported a 29-year-old female patient who sufferedfrom an unexplained hypomagnesemia for 8 years, but with-out DM. Genetic analysis showed that this disorder was alsocaused by a heterozygote 1.5-Mb deletion on chromosome17q12 encompassing HNF1β gene [5]. It was noted that ourpatient developed DM at about 39-year old, though MODY5generally occurred before the age of 30 years. Therefore, thepatient reported by Stiles et al. should be followed up regular-ly on her glycemic state to detect DM earlier.
In summary, features caused byHNF1β deletion are highlyheterogeneous amongst patients and genotype/phenotype cor-relation is still unclear up to now. HNF1β mutations can bepart of the 17q12 deletion syndromewhich are one of the mostcommon causes of MODY5 characterized by congenitalanomalies of the pancreas and kidney. Sustained andtreatment-resistant hypomagnesemia are also associated withthe HNF1β mutation.
Acknowledgments We thank the proband and her parents for theircooperation.
Author contributions Y.Z. conceived of and supervised the project, andrevised the manuscript content. B.R. and Y.C. collected and analyzed thedata, and drafted the manuscript. S.Z., Q.Z., J.W., and S.C. took respon-sibility for the integrity of the data analysis. All the authors have read andapproved the final submitted version.
Funding This work was supported by grants from the Fund Project ofShanghai Science and Technology Commission (No. 17401931700).
Data availability All data generated or analyzed during this study areincluded in this published article.
Compliance with ethical standards
Conflict of interest The authors declare that they have no conflicts ofinterest.
Ethics approval and consent to participate This study was approved bythe ethics institutional review board of the Laiwu Central Hospital ofXinwenMining Group. Prior to sample collection, written informed con-sent was obtained from the proband and her parents.
Patient consent for publication All subjects provided consent forpublication.
Code availability Not applicable.
References
1. Fajans SS, Bell GI. MODY: history, genetics, pathophysiology, andclinical decision making. Diabetes Care. 2011;34(8):1878–84.https://doi.org/10.2337/dc11-0035.
2. Clissold RL, Hamilton AJ, Hattersley AT, Ellard S, Bingham C.HNF1Β-associated renal and extra-renal disease-an expanding clin-ical spectrum. Nature reviews. Nephrology. 2015;11(2):102–12.https://doi.org/10.1038/nrneph.2014.232.
3. El-Khairi R, Vallier L. The role of hepatocyte nuclear factor 1beta indisease and development. Diabetes Obes Metab. 2016;18(Suppl 1):23–32. https://doi.org/10.1111/dom.12715.
4. Horikawa Y, Iwasaki N, Hara M, Furuta H, Hinokio Y, CockburnBN, et al. Mutation in hepatocyte nuclear factor-1 beta gene (TCF2)associated with MODY. Nat Genet. 1997;17(4):384–5. https://doi.org/10.1038/ng1297-384.
5. Stiles CE, Thuraisingham R, Bockenhauer D, Platts L, Kumar AV,Korbonits M. De novo HNF1 homeobox B mutation as a cause forchronic, treatment-resistant hypomagnesemia. Endocrinol DiabetesMetab Case Rep. 2018;2018. https://doi.org/10.1530/EDM-17-0120.
6. Bockenhauer D, Jaureguiberry G. HNF1Β-associated clinical pheno-types: the kidney and beyond. Pediatr Nephrol. 2016;31(5):707–14.https://doi.org/10.1007/s00467-015-3142-2.
7. Heuvel-Borsboom H, de Valk HW, Losekoot M, Westerink J.Maturity onset diabetes of the young: seek and you will find. NethJ Med. 2016;74(5):193–200.
8. Raile K, Klopocki E, Holder M, Wessel T, Galler A, Deiss D, et al.Expanded clinical spectrum in hepatocyte nuclear factor 1b-maturity-onset diabetes of the young. J Clin Endocrinol Metab.2009;94(7):2658–64. https://doi.org/10.1210/jc.2008-2189.
9. Laffargue F, Bourthoumieu S, Llanas B, Baudouin V, Lahoche A,Morin D, et al. Towards a new point of view on the phenotype ofpatients with a 17q12 microdeletion syndrome. Arch Dis Child.2015;100(3):259–64. https://doi.org/10.1136/archdischild-2014-306810.
10. Rasmussen M, Vestergaard EM, Graakjaer J, Petkov Y, Bache I,Fagerberg C, et al. 17q12 deletion and duplication syndrome inDenmark-A clinical cohort of 38 patients and review of the litera-ture. Am J Med Genet A. 2016;170(11):2934–42. https://doi.org/10.1002/ajmg.a.37848.
11. Mitchel MW, Moreno-De-Luca D, Myers SM, Finucane B,Ledbetter DH, Martin CL. 17q12 Recurrent Deletion Syndrome.In: Adam MP, Ardinger HH, Pagon RA, Wallace SE, Bean LJH,Stephens K, et al., editors. GeneReviews((R)). Seattle; 1993.
12. Adalat S, Woolf AS, Johnstone KA, Wirsing A, Harries LW, LongDA, et al. HNF1Β mutations associate with hypomagnesemia andrenal magnesium wasting. J Am Soc Nephrol. 2009;20(5):1123–31. https://doi.org/10.1681/ASN.2008060633.
13. van der Made CI, Hoorn EJ, de la Faille R, Karaaslan H, Knoers NV,Hoenderop JG, et al. Hypomagnesemia as first clinical manifestation ofADTKD-HNF1Β: a case series and literature review. Am J Nephrol.2015;42(1):85–90. https://doi.org/10.1159/000439286.
Publisher’s note Springer Nature remains neutral with regard to jurisdic-tional claims in published maps and institutional affiliations.
357Int J Diabetes Dev Ctries (2021) 41:354–357
CASE REPORT
Extremely low HDL and residual cardiovascular risk—a case report
Joy Sanyal1 & Moushumi Lodh1& Ashok Kumar Parida1 & Arunangshu Ganguly1
Received: 21 July 2020 /Accepted: 8 December 2020# Research Society for Study of Diabetes in India 2021
AbstractIntroduction Extremely low high-density lipoprotein cholesterol (HDL-C) is defined as levels below 20 mg/dL. Associationbetween extremely low HDL-C levels may occur from artifactual, primary monogenic disorders or from secondary causes. Wepresent a 55-year-old known diabetic male with extremely low HDL, in the absence of severe hypertriglyceridemia, withapolipoprotein A1 deficiency and presenting with acute myocardial infarction.Results Transradial angiography revealed triple vessel disease, for which the patient was medically managed and sent home in astable condition and is presently on follow-up.Conclusion Such cases are infrequent and pose a diagnostic challenge.
Keywords Apo AI deficiency . Hypoalphalipoproteinemia . Reverse cholesterol transport . Extremely low HDL . Residualcardiovascular risk
Introduction
In addition to its role in reverse cholesterol transport, high-density lipoprotein (HDL) shows many other protective prop-erties towards atherosclerosis. It has an inhibitory effect onchemotaxis of monocytes, prevents endothelial dysfunctionand apoptosis, prohibits low-density lipoprotein (LDL) oxida-tion, and stimulates the proliferation of endothelial cells andsmooth muscle cells. These anti-inflammatory, antioxidative,antiaggregatory, anticoagulant, and pro-fibrinolytic activitiesare exerted by apolipoproteins, enzymes, and phospholipidcomponents of HDL [1]. HDL also enhances insulin sensitiv-ity and promotes insulin secretion by pancreatic beta isletcells. Elucidation of the HDL proteome has highlighted the“hormonal” characteristics of HDL in that it carries and
delivers messages systemically [2]. Low serum high-densitylipoprotein cholesterol (HDL-C) is known to be an importantcomponent of the metabolic syndrome.
We present a case of extremely low HDL (less than 20 mg/dL) and apolipoprotein A1 (Apo A1) deficiency, presentingwith acute myocardial infarction (AMI). Such patients withHDL-C less than 20 mg/dL in the absence of severe hypertri-glyceridemia are infrequently encountered in clinical practiceand fall below the 5th percentile [3]. The most common pat-tern of dyslipidemia found in India is a combination of bor-derline high LDL cholesterol, low HDL cholesterol, and hightriglycerides [4]. To our knowledge, there is no documentedcase from India of extremely low HDL, in the absence ofsevere hypertriglyceridemia, presenting with AMI.
Case report
A 55-year-old known diabetic male presented to cardiologyoutpatient department with complaint of recurrent typicalchest pain [3–4 episodes] for the last 5 days. His vitals atpresentation were as follows: blood pressure 128/80 mm Hg,pulse 70/min, respiratory rate 20/min, normal vesicular breathsounds, normal peripheral pulses, and S1 and S2 heart soundswere audible. His body mass index (BMI) was 19.2 kg/m2
(18.5–24.9). His abdomen was soft, non-tender, and non-distended, and there was no organomegaly. There was no
* Moushumi [email protected]
Ashok Kumar [email protected]
Arunangshu [email protected]
1 Healthworld Hospitals, C-49, Commercial Area, Gandhi More, CityCentre, Durgapur, West Bengal 713216, India
https://doi.org/10.1007/s13410-020-00907-3
/ Published online: 13 January 2021
International Journal of Diabetes in Developing Countries (2021) 41:358–360
neurological deficit. There was depression of ST wave in V4–V6 leads and elevation of AVR. Echocardiography showedregional wall motion abnormalities in basal inferior lateralwall in left circumflex coronary artery territory, with fair leftventricular systolic function. Left ventricular ejection fractionwas 52% (> 55%).
There was no significant allergy history, medication histo-ry, and past or family history, except that he was a known caseof diabetes mellitus on medication for 6 years. He reported afamily history of mildly reduced HDL-C, with his mother andfather demonstrating levels of 24 and 27 mg/dL, respectively.He had no family history of cardiovascular disease. He deniedtaking prescription medications or over-the-counter supple-ments. He was not a known alcoholic. No significant findingswere seen in examination of the skin, eyes, tonsils, and spleen.
The laboratory blood reports at admission were as follows:high sensitive troponin I > 40,000 ng/L (0–19), NT-proBNP409.7 pg/mL (0–125), CKMBmass 141.55 ng/mL (0–7), hemo-globin 13.6 g/dL (13–17), red blood cell count 4.47 million/μL(4.5–5.5), packed cell volume 40% (40–50), MCV 89.5femtoliter (83–101), MCH 30.4 pg (27–32), MCHC 34 g/dL(32–36), RDW 14.4% (11–16), platelet count 1.84 lacs/μL(1.00–3.00), total leucocyte count 15000 per μL (4–10), withneutrophils 84% (40–80), lymphocytes 14.5% (20–40), mono-cytes 1% (0–1), eosinophils 0.5% (1–6), aspartate transaminase218 U/L (0–35), alanine transaminase 47 U/L (0–45), gammaglutamyl transferase 28U/L (0–55), alkaline phosphatase 99U/L(40–130), total protein 6.1 g/dL (6.4–8.3), albumin 4 g/dL (3.5–5), prothrombin time 13.5 s (11–16), glycosylated hemoglobin6.5% (4–6%). Random plasma glucose, urea, creatinine, electro-lytes, and bilirubin were within reference range. His serologyreports were negative for HIV, HbsAg, and HCV. 12–14h over-night fasting serum tested the next morning showed the follow-ing results: cholesterol 81 mg/dL (0–200), triglyceride 235 mg/dL (0–150), high-density cholesterol 8 mg/dL (35–65), low-density cholesterol 26 mg/ dL (0–100), thyroid-stimulating hor-mone 4.6 μIU/mL (0.50–8.90), high sensitive C reactive protein0.9 mg/L (< 3), homocysteine 10.2 μmole/L (5.46–16.2).
Further investigations revealed the following results: total se-rum lipids: 888.8 mg/dL (450–800), apolipoprotein A1 94.40mg/dL (110–205), apolipoprotein B 77.40 (55–140), apolipopro-tein B/A1 0.82 (0.35–1.0), lipoprotein [a] 24.90 mg/dL (0–30),apolipoprotein E 0.05 g/L (0.023–0.063). Lipoprotein electro-phoresis revealed the following results: beta lipoproteins 46 %(38.6–69.4), pre-beta lipoproteins 34.5% (4.4–23.1), alpha lipo-proteins 19.5% (22.3–53.5), chylomicrons absent. Urine albumincreatinine ratio and urine routine examination were within refer-ence range.
NCCT whole abdomen and HRCT CHEST showed nosignificant abnormality, except thin subpleural band in theright lower lobe.
After proper workup and investigations, transradial coronaryangiogram was done under aseptic conditions, which showed
triple vessel coronary artery disease. There was 70% lesion inthe left anterior descending, 50% lesion in the left circumflex,and 100% lesion in the right coronary artery (chronic total occlu-sion). Medical management was advised and patient dischargedin stable condition. He was prescribed fenofibrate 160 mg/dayfor 6 months, rosuvastatin 10 mg/day for 6 months, niacin 1g/day for 6months, andmetformin 500mg/day sustained releasetablets to continue. He was also given antiplatelets clopidogrel75 mg per day and aspirin 150 mg per day for 6 months. He wasadvised 30–40-min brisk walk for at least 4 days per week andlow cholesterol, low carbohydrate diet.
At 6 months follow-up, HDL was 21 mg/dL, triglyceride132 mg/dL, LDLC 28 mg/dL, and cholesterol 76 mg/dL. Hewas advised to continue aspirin and rosuvastatin until the nextfollow-up.
Discussion
Apolipoprotein A1 (Apo AI) is the major HDL protein (65%)and cofactor for lecithin cholesterol acyl transferase (LCAT).Other proteins in HDL include apoA-II, apoC, apoA-IV, andparaoxonase (PON). Mutation, glycation, and oxidative modifi-cation of apoA-I destroy the structural and functional integrity ofapoA-I and markedly impair its ability to act as substrates forLCAT. Both PON1 and PON3 are almost exclusively associatedwithHDL, and reduced function of PONcripples their protectionof lipoproteins against oxidative modifications [5].
Evaluation of our patient revealed that he had the risk factorsof male gender, type 2 diabetes mellitus, low Apo A1 levels, andextremely lowHDLwith high (though not severely high) triglyc-eride levels. He presented with acute myocardial infarction. LowHDL is a cause for residual risk for cardiovascular disease, evenat LDL levels below 70mg/dL [6]. Our patient had LDL value atpresentation of 26 mg/dL. Residual risk also arises fromestablished risk factors, such as dyslipidemia, high blood pres-sure, hyperglycemia, inflammation, and unhealthy lifestyles andemerging or newer risk factors [7].
In pathological conditions like diabetes mellitus, as in ourpatient, oxidative modification and glycation of the HDL proteinoccur and the HDL proteome changes into a proinflammatoryprotein. HDL loses its antiatherogenic properties, including re-verse cholesterol transport, and oxidative and anti-inflammatoryproperties and becomes dysfunctional. The relative compositionof lipids and proteins and enzymatic activities associated toHDL,such as paraoxonase 1 (PON1) and lipoprotein-associated phos-pholipase 11 (Lp-PLA2), are altered [8].
Approximately 10% of individuals with extremely lowHDL-C levels are heterozygous for mutations in the genesof APOA1, ABCA1, LCAT, or Apo E gene polymorphisms,although data on the risk of atherosclerosis in these individ-uals are contradictory [9]. We could not perform mutationalstudies due to financial constraints. Patients exhibiting
359Int J Diabetes Dev Ctries (2021) 41:358–360
extremely lowHDL-C often have severe hypertriglyceridemia(triglyceride > 500 mg/dL). HDL-C of less than 20 mg/dL inthe absence of severe hypertriglyceridemia, as reported in ourpatient, arise from severe perturbations in the metabolic path-ways of HDL [3]. Compared to isolated low HDL-C, the riskof CVD is 30 to 60% higher when low HDL-C is accompa-nied by elevated triglyceride [10].
Extremely low HDL levels in the absence of hypertriglyc-eridemia have also been reported in Tangier disease, anabolicsteroid intake, and autoimmune lymphoproliferative disease[3, 11, 12].
Various strategies for increasing levels of HDL or its compo-nents and the rationale for these approaches have been docu-mented. Niacin when prescribed at a dose of 1 to 2 g per daycan increase HDL-C levels up to 25% [13, 14]. Fibrate therapylowers triglycerides while raising HDL-C ≈ 10 to 20% [15], andits effects occur via peroxisome proliferator–activated receptoralpha (PPARα) activation. Statins modestly increase HDL-Cby 5 to 10% and offset the risk of very low HDL [16].
Conclusion
Case-control studies have reported that there is significant asso-ciation of acute coronary events with raised apolipoprotein B,total cholesterol, LDL cholesterol, and non-HDL cholesteroland inverse association with high apolipoprotein A and HDLcholesterol. Subjects with HDL-C levels < 25 mg/dL have beenshown to have higher mortality than those with HDL levels 26–49 mg/dL [17]. Further large-scale prevalence studies on ex-tremely low HDL and trend studies of risk factor interrelation-ships in acute myocardial infarction are required. Physiciansshould be aware of the high possibility of low HDL cholesterol,especially in patients with type 2 diabetes or the metabolic syn-drome, and the best treatment options employed to optimize thelipid profile. There is also a need to find a standard method toevaluate HDL functionality and quality, given the challengesposed by the multifarious roles played by HDL.
Authors’ contributions All authors contributed to the study conceptionand design. Moushumi Lodh and Ashok Kumar Parida performed mate-rial preparation, data collection, and analysis. Moushumi Lodh wrote thefirst draft of the manuscript and all authors commented on previous ver-sions of the manuscript. All authors read and approved the finalmanuscript.
Data availability Not applicable.
Compliance with ethical standards
Conflict of interest The authors declare that they have no conflict ofinterest.
Ethics approval Not required for case report.
Consent for participation Informed consent was obtained.
Consent for publication The participant has consented to the submis-sion of the case report to the journal.
Code availability Not applicable.
References
1. Feng H, Li XA. Dysfunctional high-density lipoprotein. Curr OpinEndocrinol Diabetes Obes. 2009;16(2):156–62.
2. Kajani S, Curley S, McGillicuddy FC. Unravelling HDL-lookingbeyond the cholesterol surface to the quality within. Int J Mol Sci.2018 Jul 6;19(7):1971.
3. Rader DJ, de Goma EM. Approach to the patient with extremely lowHDL-cholesterol. J Clin Endocrinol Metab. 2012;97(10):3399–407.
4. Ingle S, et al. Low HDL is not associated with coronary heartdisease in non-diabetic agrarian rural community in central India.Ann Med Health Sci Res. 2018;8:354–9.
5. Shen Y, Ding FH, Sun JT, Pu LJ, Zhang RY, Zhang Q, et al.Association of elevated apoA-I glycation and reduced HDL-associated paraoxonase1, 3 activity, and their interaction with an-giographic severity of coronary artery disease in patients with type2 diabetes mellitus. Cardiovasc Diabetol. 2015;14:52.
6. Barter P. HDL-C: role as a risk modifier. Atheroscler Suppl.2011;12(3):267–70.
7. Mascarenhas-Melo F, Palavra F, Marado D, Sereno J, Teixeira-Lemos E, Freitas I, Isabel-Mendonça M, Pinto R, Teixeira F, ReisF. Emergent biomarkers of residual cardiovascular risk in patientswith low HDL-c and/or high triglycerides and average LDL-c con-centrations: focus on HDL subpopulations, oxidized LDL,adiponectin, and uric acid. 2013; Article ID 387849.16 pages.
8. Femlak M, Gluba-Brzózka A, Ciałkowska-Rysz A, Rysz J. Therole and function of HDL in patients with diabetes mellitus andthe related cardiovascular risk. Lipids Health Dis. 2017;16:207.
9. März W, Kleber ME, Scharnagl H, Speer T, Zewinger S, Ritsch A,et al. HDL cholesterol: reappraisal of its clinical relevance. Clin ResCardiol. 2017;106:663–75.
10. Bartlett J, Predazzi IM,Williams SMSM, BushWS, Kim Y, HavasS, et al. Is isolated low high-density lipoprotein cholesterol a car-diovascular disease risk factor? New insights from the FraminghamOffspring Study. Circ: Cardiovasc Qual Outcomes. 2016;9:206–12.
11. Li M, Rabkin SW. Extremely low HDL cholesterol and increasedLDL cholesterol induced by the use of anabolic steroids in a bodybuilder: a case study. Int J Sports Exerc Med. 2018;4:109.
12. Sriram S, Joshi AY, Rodriguez V, Kumar S. Autoimmune lympho-proliferative syndrome: a rare cause of disappearing HDL syn-drome. Case Rep Immunol. 2016; Article ID 7945953, 4 pages.
13. Mani P, Rohatgi A. Niacin therapy, HDL cholesterol, and cardio-vascular disease: is the HDL hypothesis defunct? Curr AtherosclerRep. 2015;17(8):43.
14. McKenney J. New perspectives on the use of niacin in the treatmentof lipid disorders. Arch Intern Med. 2004;164:697–705.
15. Feingold KR. Triglyceride lowering drugs. [Updated 2020 Apr 17].In: Feingold KR, Anawalt B, Boyce A, et al., editors. Endotext[Internet]. South Dartmouth (MA): MDText.com, Inc.; 2000-2.
16. Khera AV, Plutzky J. Management of low levels of high-densitylipoprotein-cholesterol. Circulation. 2013;128(1):72–8.
17. Tziomalos K. High-density lipoprotein: quantity or quality? JThorac Dis. 2016;8(11):2975–7.
Publisher’s note Springer Nature remains neutral with regard to jurisdic-tional claims in published maps and institutional affiliations.
360 Int J Diabetes Dev Ctries (2021) 41:358–360
LETTER TO THE EDITOR
A global view on prevalence of diabetes and the HumanDevelopment Index
Ang Mao1& Tingting Huang1
& Huaping Zhang1& Weizhong Chen1
& Ziqian Zeng1
Received: 25 August 2020 /Accepted: 23 December 2020# Research Society for Study of Diabetes in India 2021
Diabetes is caused by a combination effect of genetic, envi-ronmental, and social factors, and the incidence is increasingrapidly, especially in low- and middle-income countries. Theburden of diabetes has steadily increased over the last decadesacross the globe and the Global Diabetes Report of the WorldHealth Organization, 2016, pointed out that approximately463 million people live with diabetes worldwide [1, 2]. TheHuman Development Index (HDI) is a summary measure ofachievements in three key dimensions of human development:a long and healthy life, access to knowledge, and a decentstandard of living. The HDI is the geometric mean of normal-ized indices for each of these dimensions [3]. In this study, weaim to find the underlying relationship between the HDIscores and the prevalence of diabetes using the general addi-tive model (GAM).
The data was collected from World Health Organization(WHO) reports and United Nations DevelopmentProgramme (UNDP) reports, including the HDI scores, prev-alence of physical inactivity, tobacco use rate, alcohol use rate,and salt/sodium intake rate [4, 5]. According to the UNDP,countries with HDI score above 0.788 (HDI ≥ 0.788) areregarded as developed, while all others are developing. TheHDI score levels were also defined by UNDP as low (HDI <
0.550), medium (0.550 ≤HDI ≤ 0.699), high (0.700 ≤HDI ≤0.799), and very high (0.800 ≤HDI) [3]. We constructed ageneral additive model with physical inactivity, tobacco use,alcohol use, and salt intake to explore the pattern of associa-tion between the HDI and diabetes.
Among 182 countries, the prevalence rates of diabetesranged from 3 to 23%. The highest HDI score was 0.949and the lowest was 0.352. The prevalence rates of diabetesamong male, female, and total population were positively cor-related with the HDI, and Spearman’s rho values were esti-mated as 0.508, 0.311, and 0.409 respectively (all p < 0.001).Two models were conducted in this study and model 2 includ-ed four covariates (physical inactivity, tobacco use, alcoholuse, and salt intake). The R squares were improved in model2, and the values were 0.599, 0.660, and 0.639 among male,female, and total population respectively. Positive linear asso-ciations were found, and the regression coefficients were re-spectively 13.411, 9.835, and 12.419 in the three groups (p <0.001). In addition, the natural cubic smoothing splines werestatistically significant (p < 0.01).
Generally, S-shaped curve was obtained from the finalmodel. In the three populations, the prevalence of diabeteshas a rising trend in low and medium HDI scores, reaching apeak and turning point in the high-HDI range and a downwardtrend in the very high–HDI range (Fig. 1).
The results indicated that the high prevalence of diabeteswas found not only in low- or medium-HDI countries but alsoin some countries with high HDI and in which the problemsare easier to be ignored. Therefore, sufficient attention shouldbe paid to these countries with high HDI, and the inflectionpoint should be moved ahead in order to prevent diabetesbetter.
* Weizhong [email protected]
* Ziqian [email protected]
1 Department of Epidemiology and Statistics, School of Public Health,Chengdu Medical College, Chengdu, Sichuan, China
https://doi.org/10.1007/s13410-020-00914-4
/ Published online: 6 January 2021
International Journal of Diabetes in Developing Countries (2021) 41:361–363
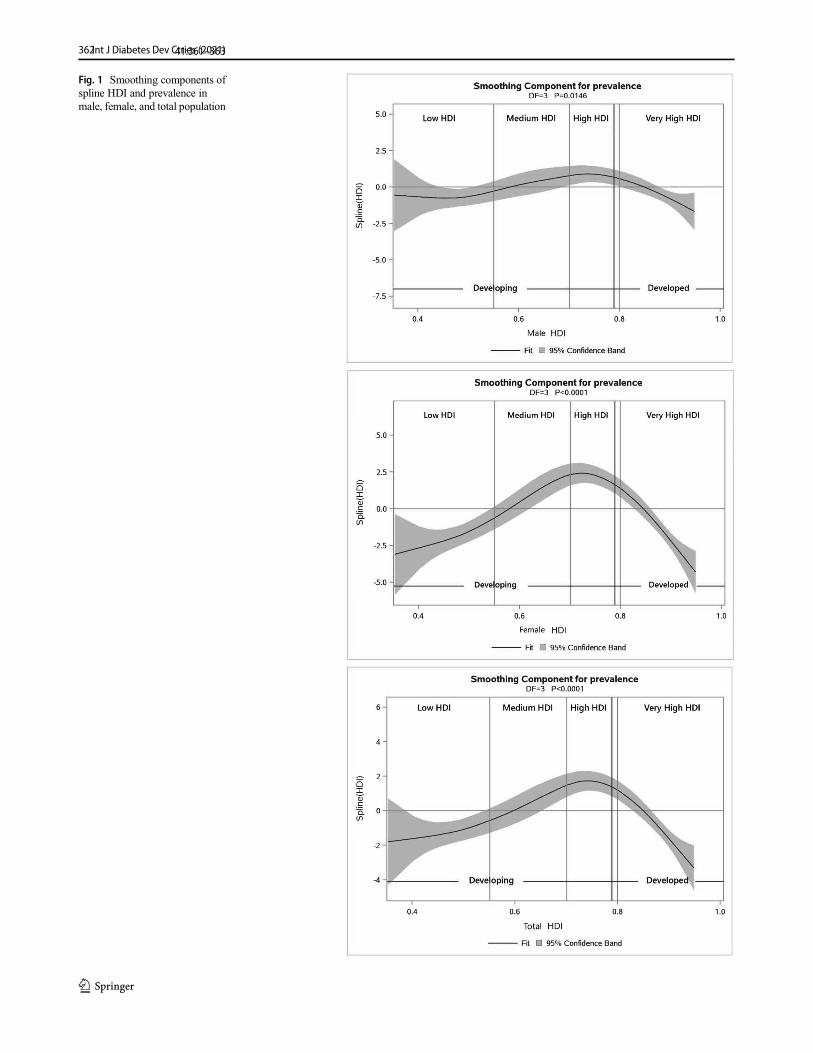
Fig. 1 Smoothing components ofspline HDI and prevalence inmale, female, and total population
362Int J Diabetes Dev Ctries (2021)41:361–363
Compliance with ethical standards
Conflict of interest The authors declare that they have no conflict ofinterest.
References
1. Saeedi P, Petersohn I, Salpea P, Malanda B, Karuranga S, Unwin N,et al. Global and regional diabetes prevalence estimates for 2019 andprojections for 2030 and 2045: results from the InternationalDiabetes Federation Diabetes Atlas, 9(th) edition. Diabetes ResClin Pract. 2019;157:107843.
2. GBD 2019 Diseases and Injury Collaborators. Global burden of 369diseases and injuries in 204 countries and territories, 1990-2019: asystematic analysis for the Global Burden of Disease Study 2019.Global Health Metrics. 2020;396:1204–22.
3. J K. Human Development Report 2010 – 20th Anniversary Edition.The real wealth of nations: pathways to human development(November 4, 2010) [Available from: https://ssrn.com/abstract=2294686].
4. UNDP. Human Development Report, 2015. New York: UnitedNations Development Programme; 2015.
5. WHO. Noncommunicable diseases country profiles, 2018. Geneva:World Health Organization; 2018.
Publisher’s note Springer Nature remains neutral with regard to jurisdic-tional claims in published maps and institutional affiliations.
363Int J Diabetes Dev Ctries (2021) 41:361–363
EULOGY FOR DR. OM PRAKASH GUPTA, BRILLIANT DIABETOLOGIST, TEACHER AND MENTOR
This is our chance to say ‘thank you’ to a man who is a symbol of diabetes in India of the past,
present, as well as of the future. Born in December 1929, Dr. Om Prakash Gupta had a bright,
unstoppable, career, securing first position in MBBS from Agra University, passing MD (Medicine),
MRCP (Endocrinology-UK) and MS (Medical Education-USA) in first attempts and receiving
FRCP (UK) for his outstanding contributions with a winning spree of 26 medals, prizes and awards
during his undergraduate, postgraduate and later career. Little did anyone know at that stage that
Dr. Gupta was to become a doyen of diabetology in India!
We all affectionately remember Dr. Gupta in our own different ways; yet there was always
something common amongst us. To all of us, he was the epitome of humility, gentleness and
level-headedness which underpinned all his other wonderful attributes. He touched the lives of
his countless colleagues, students and mentees. He had such an extraordinary appeal and was
so great a towering personality, that any person who attempts to describe Dr. Gupta’s greatness
would find it difficult to do full justice to him.
His contemporaries and compatriots and whosoever had come in contact with him, will recollect
Dr. Gupta’s pivotal role not only in promoting the discipline of diabetology but also in the fields of
teaching, patient care and administration. After a short stint as Assistant Professor of Medicine at
All India Institute of Medical Sciences, New Delhi, he had a rapid, but tranquil, ascent to the
highest positions any medical doctor could aspire for. His appointment as Professor and Head of
the Department of Medicine at the young age of 31 and Dean (Principal) of B, J. Medical College
at Ahmedabad which was soon followed by his appointment as Director, Medical Education and
Research and as Director, Health and Medical Services, Medical Education and Research,
Government of Gujarat serve as a testament to Dr. Gupta’s professional attributes. Apart from
being a much sought after physician, diabetologist and endocrinologist (both among the elite and
the downtrodden alike), Dr. Gupta had successfully added a valuable sheen to his professional
career by publication of a large number of research papers and book chapters. His skills were
also made abundantly clear through numerous orations, national and international awards, and
several recognitions. To name a few, these were the Government of India Fellowship for
advanced training and research in Endocrinology at the Royal Post Graduate Medical School and
associated Hammersmith Hospital in London, England, WHO Fellowship for medical educational
technology at University of Southern California, USA, the prestigious B C Roy Award from the
Medical Council of India and the training received at world renowned Joslin Clinic in Boston, USA,
among several other glorious achievements. Furthermore, Dr. Gupta’s continuing engagement
as a consultant physician and diabetologist for over 30 years, even after his formal retirement,
speaks volumes about his commitment towards his patients.
Dr. O.P. Gupta’s seminal paper published 50 years ago titled ‘A survey of the prevalence of
diabetes mellitus by means of a house to house survey in Ahmedabad (Gujarat), India’ came just
before the first collaborative nation-wide study on Epidemiology of Diabetes Mellitus began under
the sponsorship of the Indian Council of Medical Research (ICMR). Indeed, it is fair to state that
Dr. Gupta’s publication was one of the papers which ignited the interest of Indian diabetologists
in the field of diabetes epidemiology. When the Research Society for the Study of Diabetes in
India (RSSDI) was established in 1972, Dr. Gupta was invited to lead this organization as its first
President. Not only did he motivate youngsters to join the RSSDI, but, for the next half a century,
he ensured his own participation in practically every annual RSSDI scientific meeting. Same was
the story with regard to his participation in successive Diabetes Congresses of International
Diabetes Federation (IDF) held all over the world. He was also appointed as the Chairman of the
ICMR Expert Committee on Endocrinology for two years from 1972 to 1974 during which he
coordinated and guided the Committee Members regarding the large number of research
proposals submitted to ICMR for funding. Though an astute scientist, Dr. Gupta was open to all
ideas. His work on Ayurveda drugs in diabetes reflects his inquisitiveness to explore new
directions.
Sadly, Dr. Om Prakash Gupta left for his heavenly abode in April, 2021 but not without brightening
our lives, not without serving countless patients and organizations and not without enlightening
our way into the future of science and humanity. Dr. Gupta is survived by his wife and a daughter.
All we can say that a glory has departed but he will live on in our hearts, forever. Let us feel
beholden to our association with this gracious and mighty person and be worthy of him.
Dr. Vinod Kumar, Patron, RSSDI Dr. V. Mohan, Patron, RSSDI Dated: May 5th, 2021
VISION STATEMENTTo be recognized as a global leader for clinical care, education, training, research, advocacy and capacity building in the field of diabetes.
MISSION STATEMENT
1. Promotion of excellence in diabetes care to make India the Diabetes Care Capital
2. Empowerment of persons living with diabetes3. Support for diabetes research4. Dissemination of information and knowledge in diabetes care5. Advocacy for the cause of diabetology
NEW EXECUTIVE COMMITTEE AND OFFICE BEARERS 2021
Patrons of RSSDI
Dr. H.B. Chandalia, MumbaiDr. C. Munichhoodappa, Bengaluru Dr. Ashok K. Das, PuducherryDr. Binode K. Sahay, Hyderabad Dr. V. Seshiah, ChennaiDr. P.V Rao, HyderabadDr. Jitendra Singh, New Delhi Dr. V Mohan, ChennaiDr. Vinod Kumar, New Delhi
President
Dr. Banshi Saboo, Ahmedabad
President Elect
Dr. Ch.Vasanth Kumar, Hyderabad
Immediate Past President
Dr. Rajeev Chawla, New Delhi
Secretary
Dr. Sanjay Agarwal, Pune
Vice-President
Dr. Anuj Maheshwari, Lucknow
Vice-President
Dr. Vijay Viswanathan, Chennai
Joint Secretary
Dr. Sujoy Ghosh, Kolkata
Treasurer
Dr. Sunil Gupta, Nagpur
Executive Committee
Dr. C R Anand Moses, Chennai
Dr. Sudhir Bhandari, Jaipur Dr. J K Sharma, New DelhiDr. Bikash Bhattacharjee, Guwahati Dr. Pratap Jethwani, RajkotDr. L. Sreenivasa Murthy, Bengaluru Dr. Sanjay Reddy, BengaluruDr. Shalini Jaggi, New Delhi
Co-opted
Dr. Vijay Panikar, Mumbai Dr. Brij Makkar, New Delhi Dr. Rakesh Sahay, Hyderabad
TRAINEE GRANTS (Up to 10 grants)
Research Grants upto INR 200000 to support outstanding thesis/ research work by first year MD/DNB/ PHD students/Research fellows from India.
Eligibility CriteriaAll Postgraduates in First year MD, DM /DNB from any of the institutions in the country are eligible to apply
How to apply?Send in your Research proposals by email to the RSSDI Secy/ Chairman research committee by email/ apply directly on web site.
Research proposal should have following proofs-1. A supporting letter from your guide/ head of department
stating that this is a bonafide project for your thesis and also mentioning the dates of you joining the program and expected date of graduation. The guide must also state that he/she will stand guarantee for the work done
2. A detailed budget3. Thesis proposal approved by the department/appropriate
institutional authority4. Approval by the ethics committee
Selection ProcessProposals will be reviewed by the research committee of the RSSDI.
Disbursement of GrantA minimum of 50% of the grant amount will be disbursed initially. Further disbursement will be done annually based on submission of progress reports on the work done and utilisation of sanctioned amount. These reports must be filed to the secretary of the RSSDI
Responsibility:All grant awardees are expected to present their work at RSSDI Annual Conference during research presentation’s session. Failure to file progress reports annually and when requested by the RSSDI and failure to present progress at RSSDI Annual conf may result in the forfeiture of the grant.
All awardees are expected to follow the tenets of responsible and ethical conduct of research. Unethical or fraudulent use of RSSDI research funds will warrant adverse action from the society including
ORGANIZATIONAL NEWS
Bengaluru, Karnataka
A Complete Diabetes l Diabetes Hormone Institute
Ahmedabad,
Pvt Ltd.
Brahmachari
faridabad, Uttar Pradesh
forfeiture of grant, black listing in the society’s databases and other legal recourses that are available to the society.
PublicationThe RSSDI expects that the grant source be acknowledged in all publications and submissions made with regards to the research done with the grant.
All awardees are encouraged to submit their work to the RSDDI Journal IJDDC
CALL for RESEARCH PROPOSALS for GRANTS(up to 5 lacs)
Research proposals are invited from Indian scientists, who are members of RSSDI interested in conducting research in the field of Diabetes, Endocrinology& Metabolism, for funding by RSSDI
The proposals may of clinical or translational research importance. A maximum grant amount of INR 5 Lakhs will be sanctioned. All grants will be reviewed by the research committee.
The detailed proposals should include the following:Title, names of principal and co investigators, summary, intro- duction/ background, review of literature, aims, methodology, study design and detailed plan of work & bibliography.
Brief biodata of principal investigator and other co-investigators.
Importance of workDetailed Budget sought along with full justification/ proposed utilization, of funding sought from RSSDI
Criteria for the travel grant are as follows:
• Applicant should apply 2 months in advance.• Travel Grant is open only to the RSSDI members.• Applicant should submit Oral paper / Poster acceptance
document to RSSDI Secretariat.• Applicant should submit Declaration that he/she has not
receiving grant from any other agency / Organization – In case of receiving grant from any other Organization, RSSDI shall pay only the exceeding amount not covered by that agency.
ADVANCED CERTIFICATE COURSE IN DIABETOLOGY
(IN ASSOCIATION WITH JAIPUR NATIONAL UNIVERSITY)
Research Society for the Study of Diabetes in India (RSSDI) was founded by Prof. M.M.S. Ahuja in 1972. RSSDI is the largest body of professional doctors and researchers in Asia, working in the area of Diabetes & is the National Body recognized by IDF (International Diabetes Federation). One of the key areas of focus is to train doctors at all levels to better manage Diabetes and its complications. RSSDI recognizes this problem and runs a well-structured, full time, residential “Advanced Certificate Course in Diabetology”. This two-year course is like any other post graduate course and has immensely helped doctors to practice better diabetes care. RSSDI has
List of RSSDI Accredited Centres
Sl. No Institute Name Institute Location
Whether the project is being partly funded from any other source? 1. Diacon Hospital Bangalore, KarnatakaIf yes, please mention the source and the amount received.
Ethics Committee clearance of the Institution or other bonafide body. 2. North Delhi Diabetes Centre New Delhi, Delhi 3. Prithvi Hospital Tumkur, Karnataka
How to applyAll applications should be addressed to:1. The Secretary , RSSDI2. Soft copy of the research proposal should be sent to Secretary,
RSSDI
When to applyProposals will be accepted Twice a year. Once between 1st Jan - 31st April & then July 1st to 30th Nov.
All research proposals will be reviewed by Research committee over a period of 4-6 weeks & approved proposals will be provided Research Grant after fulfilling all documentation by 30th June & then 31st December of each year.
MAJOR RESEARCH GRANT PROPOSALS-usually not more than one at a given time.
Above 10 Lacs upto a total amount of 50 Lacs will be Granted to RSSDI initiated, owned, multi-centric, clinical or translational research, having long term application of scientific and clinical findings, which can translate into strategies for improving health- care delivery, patient outcomes, and community health in India.
Such research proposals will be carried out in only centres with research capabilities across India.
TRAVEL GRANTS FOR YOUNG DIABETES RESEARCHERS TO ATTEND INTERNATIONAL CONFERENCES
4. Total Diabetes Hormone Institute5. Dia Care - A Complete Diabetes
Care Centre 6. Sonal Diabetes Hospital 7. Jothydev’s Diabetes and Research
Center 8. Advanced Endocrine & Diabetes
Hospital 9. Sunil’s Diabetes Care N’
Research Centre10. Marwari Hospital and Research
Centre 11. Down Town Hospital 12. St.Theresa’s Hospital13. Aegle Clinic 14. Lilavati Hospital & Research
Centre 15. Srajan Hospital 16. Endeavour Clinics & Dr. Sambit's
Centre of Diabetes and Endocrinology
17. ILS Hospital, Salt Lake 18. Belle Vue Clinic
19. Arthur Asirvatham Hospital 20. M V Hospital for Diabetes 21. Sarvodaya Hospital
and Research Centre 22. Galaxy Speciality Centre
Indore, Madhya Pradesh Ahemdabad, Gujarat
Surat, Gujarat Trivandrum, Kerala
Hyderabad, Telangana
Nagpur, Maharashtra
Guwahati, Assam
Guwahati, Assam Hyderabad, Telangana Pune, Maharashtra Bandra West, Mumbai
Udaipur, Rajasthan Bhubaneswar, Odisha
Salt Lake City, Kolkata Dr. U N Brahmacahri
Sreet, Kolkata Mdurai, Tamil Nadu Chennai, Tamilnadu Faridabad, Uttar Pradesh
Sodala, Jaipur
ANNOUNCEMENTS
Dear Member,
Please update your Membership details like Complete Postal Address,Email Id, Pan No. & Mobile no. after log in your membership area onour website www.rssdi.in under sub heading Membership corner, sothat we can send you RSSDI Newsletter & Journals.
49th Annual Conference of RSSDI-RSSDI 2021
Date: 11th - 14th November 2021
Venue: Mumbai
Dates for Admission in ACCD 2021
1) Last date of submission of Application Form - 20th February 2021
2) Screening Interview - 27th February 2021
3) Declaration of Exam Result - 3rd March 2021
4) Last date of payment of course fee - 8th March 2021
5) Commencement of course - 10th March 2021
carefully looked into all aspects of this course & has accredited & recognized 22 centres across India at present and more centers are being inspected for accreditation. National Faculties and experts of RSSDI chosen from Academia visit these centers from time to time to ensure high standards. Now this Advanced Certificate Course has Dual Accreditation from RSSDI and Jaipur National University.
COURSE DETAILS
Name of the Course: Advanced Certificate Course in Diabetology
Duration: 2 Years – Post MBBS & 1 Year - Post MD / DNB (Gen - Medicine )* (Full Time) Educational.
Qualification: A candidate must possess MBBS degree from ANY of the recognized university approved by Medical Council of India (*The duration of the course is 1 Year for those with MD/ DNB in Internal Medicine. Candidates having MD degree in other specialties will have to do the course over 2 Years).
Number of seats: 2 seats per year for every eligible teacher as per rules of Medical Council of India (MCI).
Selection of Candidates: Selection for the Certificate course is through a performance evaluation by Theory test for 90 marks (90 minutes duration) which is conducted at all accredited centres. The result is displayed WITHIN 3 days on the Web site of JNU and RSSDI. Post MD (Internal Medicine) will be given !
COURSE FEES:
• Rs 30000/- (for post MD/DNB (internal medicine), 1 year program)
• Rs. 50000/- (for post MBBS, MD in other branches, 2 years program)
Session: Two sessions are run annually, in January and in July. Prospectus details are available on the RSSDI website. All applications must be sent to Jaipur National University.
Dates for Admission in ACCD 2021
1) Last date of submission of Application Form – 30th June 2021
2) Screening Interview - 7th July 2021
3) Declaration of Interview Result – 10th July 2021
4) Last date of payment of course fee - 15th July 2021
5) Commencement of course - 16th July 2021
ANNOUNCEMENTS
Dear Member,
Please update your Membership details like Complete Postal Address, Email Id, Pan No. & Mobile no. after log in your membership area on our website www.rssdi.in under sub heading Membership corner, so that we can send you RSSDI Newsletter & Journals.
49th Annual Conference of RSSDI-RSSDI 2021
Date: 11th - 14th November 2021

Copyright © 2022 FDOKUMEN