Training Material: Introduction to Accounting of Transactions
Upload
independentCategory
view
2download
0
This PDF is a selection from an out-of-print volume from the National Bureauof Economic Research
Volume Title: International Economic Transactions: Issues in Measurementand Empirical Research
Volume Author/Editor: Peter Hooper and J. David Richardson, editors
Volume Publisher: University of Chicago Press
Volume ISBN: 0-226-35135-1
Volume URL: http://www.nber.org/books/hoop91-1
Conference Date: November 3-4, 1989
Publication Date: January 1991
Chapter Title: Price Trends in U.S. Trade: New Data, New Insights
Chapter Author: William Alterman
Chapter URL: http://www.nber.org/chapters/c8429
Chapter pages in book: (p. 109 - 143)

4 Price Trends in U.S. Trade New Data, New Insights
William Alterman
4.1 Introduction
With the explosion of the U.S. trade deficit over the past decade and the issues which have become associated with it, substantial interest has focused on movements in the prices of U.S. exports and imports. These trends in prices have implications for U.S. international competitiveness, as well as for analysis of nominal and real trade flows, the effects of exchange-rate fluctua- tions, and the influence of developments abroad on domestic inflation. For several years analysts have had two separate series of data on U. S . trade prices to work with: the unit-value indexes constructed by the Bureau of the Census, and the import and export price indexes produced by the Bureau of Labor Statistics (BLS). Although the Census indexes are no longer being produced, a comparison of these two series is important, given the likelihood that unit- value series have been used and may continue to be used in certain instances (i.e., historical analysis, country-specific analysis). This paper begins by out- lining the basic methodology and limitations of the unit-value series-limita- tions which led the Bureau of the Census in 1989 to discontinue publication of these series. It then addresses the BLS series, which were designed to over- come these limitations. The two series will then be compared, focusing on the period from March 1985, when the dollar was at its strongest, to June 1989, the last period for which comparable data were available. In addition to mak-
William Alterman is a supervisory economist in the Bureau of Labor Statistics of the U.S. Department of Labor.
The author would like to express his thanks to Peter Hooper, Richard Marston, Kim Zieschang, Ken Dalton, Jack Alterman, Katrina Reut, and the attendees at the preconference in Boston and the conference in Washington for their helpful comments. The author would also like to thank Michelle Vachris, Nick Peters, and Melissa Leonard for their help in constructing the tables and charts. The views expressed are those of the author and do not necessarily reflect the policies of BLS or the views of other BLS staff members.
109

110 William Alterman
ing some observations about this comparison, the paper also outlines the im- plications of using one series versus another for economic analysis, in partic- ular how they affect the measurement of real trade flows and assessments of the impact of changes in exchange rates on the level of import and export prices. Some additional detailed analysis of the BLS data, using country of origin and currency of quotation, are also presented. Finally, the paper dis- cusses some of the limitations of the BLS data as well as steps that are being taken in order to enhance the quality and utility of these numbers.
4.2 Methodology of Price Series
4.2.1 Bureau of the Census Unit-Value Indexes
For many years the unit-value indexes (UVIs), produced by the Bureau of the Census as a byproduct of the collection of U.S. trade data, were the only comprehensive source of information on price trends of goods in U.S. trade. Since companies engaged in U.S. trade are required to declare the value and quantity of a shipment of goods, it was a relatively straightforward process to construct price indexes using these data (by dividing the total value of goods in each specific category by the total quantity of goods in that category).
The basic data are supplied on export declarations and import entries filed with the U.S. Customs Service. All U.S. import or export merchandise ship- ments are represented in the index calculations with certain exceptions. U.S. goods returned, military equipment and parts, low-value shipments, and mov- ies and exhibits are all excluded from the import index calculations. Military- type goods, low-value shipments, reexports, exposed film, repairs, and other special transactions are excluded from the export calculations.
The actual items included in the import and export indexes are based on a distinct nonrandom sample of commodities. The samples consist of those commodities having a significant value of trade each month for which reliable unit values can be drawn. Products that are only traded occasionally are ex- cluded from the samples. Commodities that do not require a quantity to be reported (especially common in parts categories) are also excluded from the sample, unless a reliable proxy for quantity, such as shipping weight, is avail- able. In addition, commodities which demonstrate erratic month-to-month changes, reflecting product mix changes rather than price changes, are not included in the sample.
The data used in the unit-value indexes reflect a customs value basis on imports (which excludes the cost of shipping, insurance, and duty), and an f.a.s. (free alongside ship at U.S. port) value for exports, which also excludes overseas shipping, insurance, and foreign duty. Until the recent decision to discontinue publication of these series, the indexes were released on a monthly, quarterly, and annual basis, usually several weeks after the trade

111 Price Trends in U.S. Trade
values for that period were published. The series were constructed using a chained Fisher formula (which uses both base and current-period weights), because it was felt that this formula was appropriate in light of the constantly changing nature of foreign trade. Historical data have been calculated as far back as 1919.’
There are four general problems with the unit-value indexes. First, they reflect not only underlying price changes, but changes in product mix as well, even at the finest level of commodity detail. For example, if there is a market shift from cheap economy cars to expensive luxury cars, the unit value of the commodity (autos) will increase, even if all prices for individual products remain constant. Second, unit-value indexes do not account for shifts in the specification (i.e., quality), of an item. If, for instance, one month an auto- mobile was imported without air-conditioning and the next month it was im- ported at a higher price but included air-conditioning, the unit-value index would reflect the full cost of the increase, even though the value of the basic good may not have increased. Third, not all data supplied to Customs can be used in the construction of these indexes, either because of unusable reported quantity figures or the heterogeneous nature of the products themselves. Over- all, U.S. unit-value indexes were calculated for 56 percent of the value of imports and 46 percent of exports in 1985, the last year for which coverage data are available. In particular, in the finished goods area a large portion of the raw data must be excluded.2 And finally, the Census data were only pub- lished at the one-digit end-use level of detail, making sectoral analysis diffi- cult if not impossible.
The problems associated with unit-value indexes were a concern for some time. The 1961 report of the Price Statistics Review Committee of the Na- tional Bureau of Economic Research (also known as the Stigler Report), a comprehensive survey of U.S. government price data, reviewed the limita- tions of unit-value data, both in general terms and specifically in the case of the export and import unit-value series. A later report by an interagency com- mittee, after comparing price and unit-value data, recommended that “speci- fication-price data (such as those from the BLS Wholesale and Industrial Price Index Programs and other similarly constructed data) should be used more extensively as deflators in the absence of positive evidence of their unsuitabil-
1 . For a more detailed methodology of the Census unit-value indexes, see U.S. Department of
2. More detailed coverage percentages based on 1985 trade values include: Commerce (1989).
lmports Exporfs
Foods, feeds, and beverages 59.9 91.7 Industrial supplies and materials 71.7 65.4 Capital goods 30.3 26.1 Automotive vehicles and parts 79.9 42.4 Consumer goods 37.0 40.5

112 William Alterman
ity in individual instances. This recommendation represents a change in order of preference from the present practice which provides for using unit values except where they seem unreasonable.”3
Numerous other studies of unit-value indexes, in both the domestic and external sectors, have also provided evidence confirming their shortcomings. A list of such studies would include Kravis and Lipsey (1971), Holmes (1973), Murphy (1972), the first to compare BLS export price indexes with export unit values, Shiells (1987), which compared the BLS import-price in- dexes with import unit values, and Lichtenberg and Griliches (1989), which did a comparison of the Producer Price Index and domestic unit-value figures. In general, the various studies have found evidence of greater accuracy of transaction-price indexes compared with unit-value indexes.
Until 1989, a significant advantage of the Census unit-value data was that they were produced monthly. Since the Bureau of Economic Analysis of the U.S. Department of Commerce attempts to produce the quarterly foreign trade component of the GNP data by deflating each month individually, the unit- value series was taken as the most appropriate price deflator for product areas, such as grain and crude petroleum, which are highly volatile and therefore require monthly estimates.
Despite the discontinuation of the unit-value numbers, an analysis of this series and comparison with other series is important for several reasons. First, as a consequence of the relative newness of the BLS program, the unit-value figures, which go back seventy years, will continue to be the only source of data for long-term analysis (and have thus made up much of the BEA’s histor- ical price series). Second, while the now-preferred BLS indexes have been available for several years, a number of recent studies have used (either know- ingly or otherwise) unit-value series in their analyses (e.g., Dornbusch 1987, Krugman 1987). Baldwin (1988), Froot and Klemperer (1989), and Kim (1990) appear to use the published BEA price-index values constructed from a combination of UVIs and BLS data. Third, since the original source data used in the construction of the Census unit-value indexes will still be available to the public, economists may still continue to construct their own series of unit-value indexes. See, for instance, Knetter (1989). Finally, given the lim- ited number of major countries that produce import and export price indexes (U.S., Japan, and Germany), many international price comparisons must rely, at least in part, on unit value data.
4.2.2 BLS Import and Export Price Indexes
The BLS data were designed to overcome the basic limitations of the unit- value figures. Like the unit-value numbers, the BLS import and export price
3. The report (Interagency Committee on Measurement of Real Output, Subcommittee on Prices 1973) included two detailed studies in its appendixes which highlighted the limitations of unit values. A United Nations report (1981) also extensively reviewed the advantages and disad- vantages of unit-value versus price indexes for external trade.
113 Price Trends in U.S. Trade
indexes are designed primarily to reflect price trends for the U.S. merchandise foreign trade sector. The BLS data, however, have the major advantage of being true price indexes, in that changes in the quality of an item are factored out of its price measures and the product mix is kept constant. Many of the concepts employed for these series, such as the use of a modified Laspeyres formula, are similar to those used in the BLS Consumer Price Index (CPI) and Producer Price Index (PPI) .
The current program to collect import and export price data drew upon the seminal work of Kravis and Lipsey (1971) and dates back to the mid-1960s. In the late 1940s an earlier attempt by BLS to construct import and export price indexes survived only a few years. BLS now has export price indexes for selected commodity categories going as far back as 1966, and the Kravis and Lipsey study reports a limited number of export indexes covering the early 1960s. However, complete coverage was not attained until September 1982 for imports and September 1983 for exports.
The samples for the BLS indexes are drawn from a universe of all exporters and all importers (and their respective products) who filed Customs docu- ments during a specified reference period (generally one year). The objective of the Bureau’s sample design is to provide an unbiased measure of price change in each published index. A multistage survey design is employed to provide a sample of exporters and importers for general product categories, as well as for specific items which can be repriced over time. The survey design is responsive to the constraints of both cost and the burden on reporters. The cost constraints impose limits on the number of establishments selected in a sample, while the number of items priced in each establishment is controlled to limit respondent burden. Samples are overdrawn in order to allow for a certain amount of deterioration due to respondent refusals (like nearly all BLS data-collection efforts, the International Price Program is voluntary), discon- tinued products, products that for one reason or another are out-of-scope (e.g., misclassified or discontinued products), and products which are only traded irregularly. The sample covers approximately 90 percent of exports (excluding primarily commercial and military aircraft) and 95 percent of im- ports (excluding primarily works of art and small shipment^).^
Price reporting by firms is initiated by a visit from a BLS representative. At the time of the visit the reporting requirements are explained verbally and in writing, and the selection of products for which the firm will report price information is made. The BLS has approximately 9,000 companies supplying data on roughly 23,000 items in the quarterly sample and approximately 2,000 companies and 4,000 products in the smaller monthly survey. In the overwhelming majority of cases, prices are collected directly from the ex- porter or importer, although in a few cases (e.g., crude petroleum and grain),
4. These items are excluded due to the difficulty in obtaining a consistent time series of prices for a comparable product (Le., each item is unique.)

114 William Alterman
prices are obtained from secondary sources, such as the U.S. Department of Agriculture and Department of Energy. Normally, price data are collected by mail questionnaire; in some cases the information is collected by telephone. Generally, BLS is seeking the first transaction in the appropriate month, and the vast majority of prices in the surveys are from the first week of the refer- ence month. Approximately 19,000 of the 23,000 products in the survey are only collected in March, June, September, and December. The other 4,000 products are repriced every month.
Accurate calculation of a price index requires that the collected price reflect the same item from period to period. To ensure this, the specifications for each product in the BLS survey include detailed physical and functional character- istics as well as the terms of the transaction (e.g., number of units bought or sold, class of buyer or seller). Any change in a product’s specifications or terms of trade is appraised to ascertain its significance. If data clarification is required, the individual at the firm who is responsible for providing the price information is contacted by telephone. If the change is substantive, product substitution is made by an adjustment process (similar to the procedures used in the calculation of the CPI and PPI indexes) that ensures the index reflects only actual or “pure” prices changes and is not affected by quality changes.’
Approximately 15 percent of the import prices supplied by respondents are quoted in a foreign currency. These prices are converted into dollar prices by using the average exchange rate for the month immediately preceding the ref- erence month.
The price basis used in the construction of the indexes varies and generally depends on industry practices. Products in the import price indexes are gen- erally priced either c.i.f. U.S. port (which includes cost, insurance, and freight, but excludes duty), or f.0.b. foreign port (which is similar to a cus- toms value basis and excludes insurance and freight). Exports are generally either f.0.b. factory (price at point of production) or f.a.s. (price at U.S. port). While ideally the basis for pricing the indexes would be consistent, at higher levels of aggregation an index may include product prices on different bases because different industries have differing pricing and shipping practices and procedures and are not able to supply price quotes consistent with another industry. In general, the only area where variations in price trends due to quo- tation basis may have an important impact is crude materials, for which trans- portation costs can be a significant portion of the delivered price.
Unlike the unit-value series, which use a Fisher index formula, the BLS
5 . At present no special procedures, other than oversampling, are used for product areas, such as computers, that are subject to rapidly changing technology. Beginning in September 1989, however, as part of its producer price index series, the Bureau began publication of a limited set of computer indexes, which make use of a more sophisticated methodology. The methodology used in these experimental figures was reviewed in an article in the Monthly Labor Review (Sin- clair and Catron 1990). Eventually, the Bureau intends to incorporate this new methodology into its import and export price indexes.

115 Price Trends in U.S. Trade
series use a Laspeyres formula. Conceivably the differences in index formula could have a substantial impact on index comparisons, particularly for in- dexes such as external price indexes, which use highly volatile trade flows for weights.6 The BLS indexes are based on 1985 trade values for calculations from 1985 to the present and 1980 weights for all index values prior to 1985.
Since all reporting is voluntary and confidential, no index is published in such a way as to reveal the name, price, or price behavior of any respondent. No index is published when fewer than three companies provide data; for the vast majority of indexes there are considerably more. The index values are generally available four weeks after the end of the pricing month. Where pos- sible, indexes have an index base of 1985 = 100.
BLS publishes indexes in three different classification structures: the Stan- dard International Trade Classification (SITC) of the United Nations, Revision 2; the Standard Industrial Classification (SIC); and the BEA end-use classifi- cation. The multitude of publication structures is recognition of the fact that the data can be used in a variety of ways. The SITC structure is most useful for international comparisons, since a number of countries produce trade data using this classification system. SIC tables are appropriate for domestic indus- try analysis, as well as for comparisons with the BLS PPI series. The end-use classification (used in this analysis) is consistent with the structure of the U.S. National Income and Product Accounts. Within each series BLS also attempts to publish enough detail to allow micro and cross-sectional analysis. BLS currently publishes approximately 400 SITC series, 240 SIC series, and 275 end-use series. In general BLS attempts to publish all product categories that recorded either $500 million worth of exports or $700 million worth of im- ports in 1985. Indexes that represent areas of trade with smaller dollar values are incorporated into the calculation of higher-level indexes and may be pub- lished separately if coverage and user interest warrant. Prior to 1989 BLS collected data for only the third month of each quarter, for what is referred to as its quarterly index. Since January 1989, the Bureau has been calculating and publishing monthly indexes for selected categories for a subset of data from its quarterly survey. The monthly indexes are currently published only at the one-digit end-use level. The more comprehensive quarterly press release contains detailed information by SITC and end-use categories, as well as the foreign currency indexes. Indexes by SIC are available on request.’
4.3 Comparison of Price Rends
This section compares the recent historical index trends for the BLS in- dexes and the Census unit-value numbers. As no detailed data are published
6. For a general discussion of differences in index formulas, see Allen (1975). 7. For a more detailed methodology of the quarterly BLS import and export price indexes, see
U.S. Department of Labor (1988).
116 William Alterman
by Census, comparisons are only made at the one-digit end-use level. In ad- dition, since comprehensive BLS export and import indexes have only been published since 1983, the historical comparison must be limited. The period beginning March 1985 was chosen because this month was the point when the dollar reached its recent peak and began its downward slide. The comparison was made between the quarterly BLS series (which actually covers the last month of each quarter) and monthly unit-value figures for March, June, Sep- tember, and December.
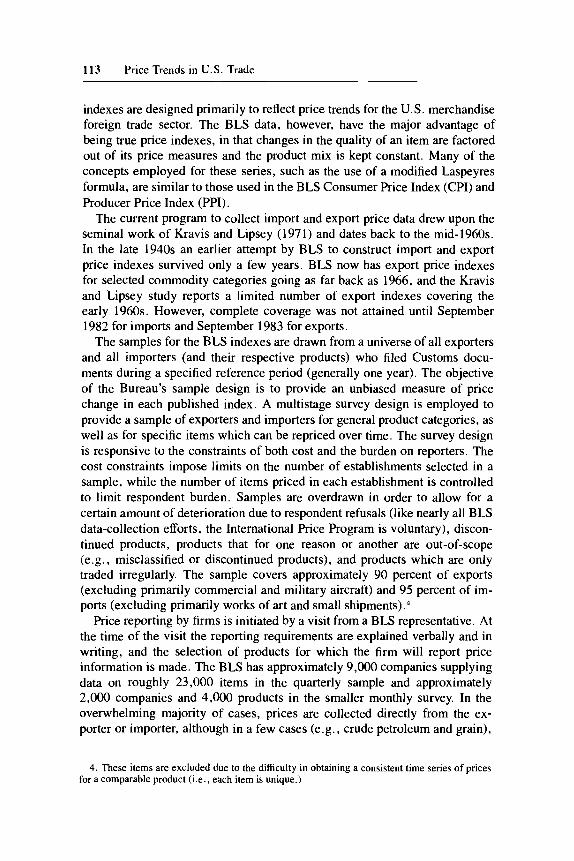
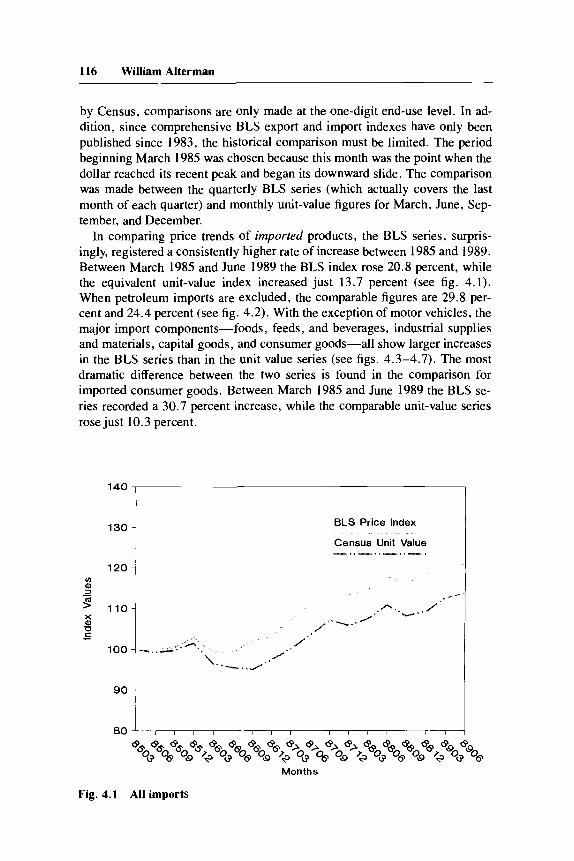
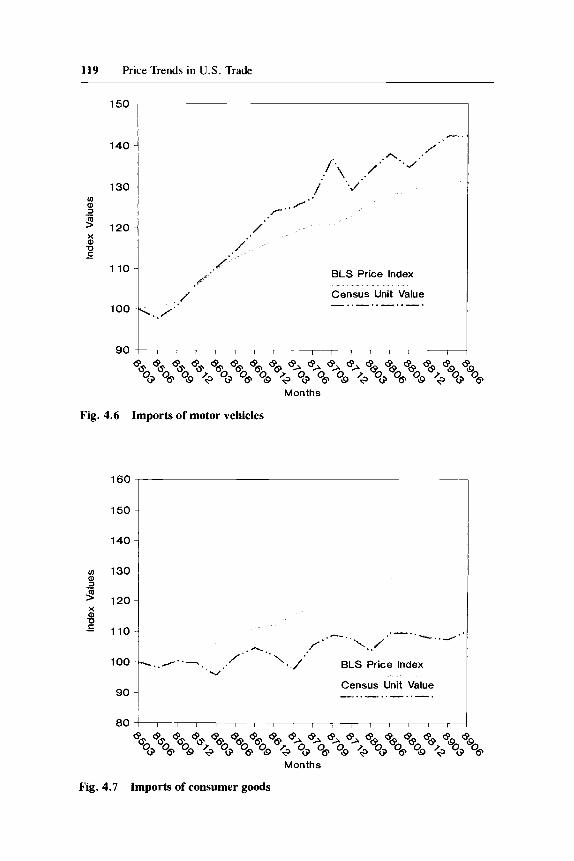
In comparing price trends of imported products, the BLS series, surpris- ingly, registered a consistently higher rate of increase between 1985 and 1989. Between March 1985 and June 1989 the BLS index rose 20.8 percent, while the equivalent unit-value index increased just 13.7 percent (see fig. 4.1). When petroleum imports are excluded, the comparable figures are 29.8 per- cent and 24.4 percent (see fig. 4.2). With the exception of motor vehicles, the major import components-foods, feeds, and beverages, industrial supplies and materials, capital goods, and consumer goods-all show larger increases in the BLS series than in the unit value series (see figs. 4.3-4.7). The most dramatic difference between the two series is found in the comparison for imported consumer goods. Between March 1985 and June 1989 the BLS se- ries recorded a 30.7 percent increase, while the comparable unit-value series rose just 10.3 percent.
120 l 3 O I
BLS Price Index
Census Unit Value __..__..__.. -.
r”
Months
Fig. 4.1 All imports

117 Price Trends in U.S. Trade
150
140
130 In a, 3 - >" 120 a, U C -
1 1 0
100
90
-..- .,.--.. BLS Price Index
../..-/. I--..- Census Unit Value _...-.._...-.
Months
Fig. 4.2 All imports, excluding petroleum
110
105
/-../
*\, . . I * * / 100
BLS Price Index 95 95 i BLS Price Index
Census Unit Value -..-..-..-.
Months
Fig. 4.3 Imports of foods, feeds, and beverages
118 William Alterman
105
100
95
90
85
80
75
70
65
/ BLS Price Index
\.. i Census Unit Value
8 8 8 8 8 8 8 8 8 8 8 8 8 8 8 8 8 8 *OG *o* 60Q *+ *OG *o* *OQ *+ %* %* >+ *o* *o* *OQ *+ QOG Qo*
Months
Fig. 4.4 Imports of industrial supplies and materials
150
140
130
110
100
90
.r .
.. BLS Price Index
Census Unit Value __ . . _. . . _I . 1 _. .
I , I / I I I I / l I I
Months
Fig. 4.5 Imports of capital goods
119 Price Trends in U.S. Trade
150
140
130
120
110
100
90
BLS Price Index
Census Unit Value -..-..-..-.
l l l l l l l l l l l l l l l ,
8 8 8 8 8 8 8 8 8 8 8 8 8 8 8 8 8 8 *O$ *o* *o* *$ *O$ *o* *o* *$ %$ %* %* >$ *O$ *o* 80* *$ QO$ Go*
Months
Fig. 4.6 Imports of motor vehicles
150 160 3 140
130
120 -I
90 Census Unit Value _.._..__.. -.
8 0 i 1 I I I I I I I I I I , I I r 8 8 8 8 8 8 8 8 8 8 8 8 8 8 8 8 8 8 *O$ *o* *o* *$ *OG *o* *o* *$ >OG >o* %* A$ @O$ "o* @o* @J+ *OG *o*
Months
Fig. 4.7 Imports of consumer goods
120 William Alterman
The major exception to this pattern of larger increases in the BLS numbers is in the automotive sector, where the unit-value series shows a relatively steeper rise, 42.2 percent, compared with a 30.8 percent increase in the com- parable BLS index (see fig. 4.6). The automotive series, of course, is an es- pecially interesting case. Since the motor vehicles category is a narrower grouping to begin with, it may be less affected by shifts over time in the weighting structure. There is considerable evidence that in the mid- 1980s, there were significant quality increases associated with imported autos, aris- ing from the voluntary export restraint agreement with the Japanese.8 Such practices would lead to sharper increases in a unit-value series.
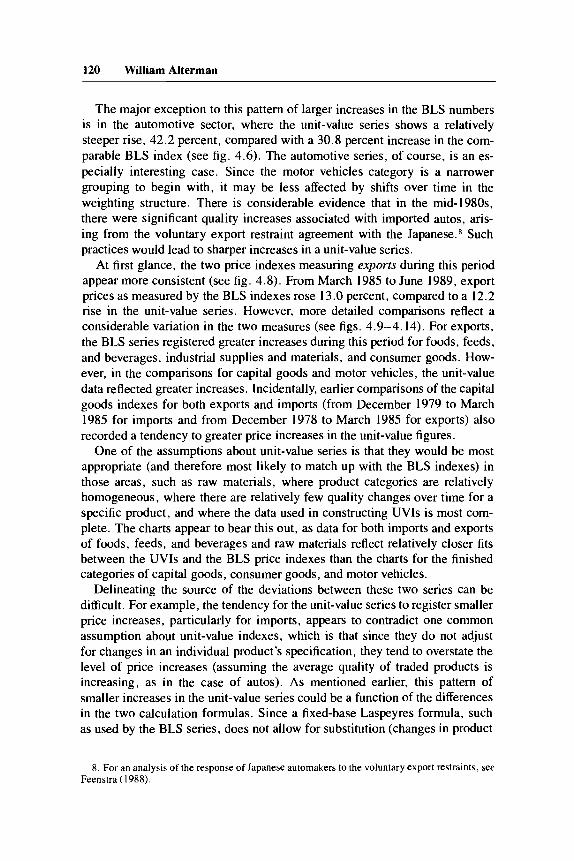
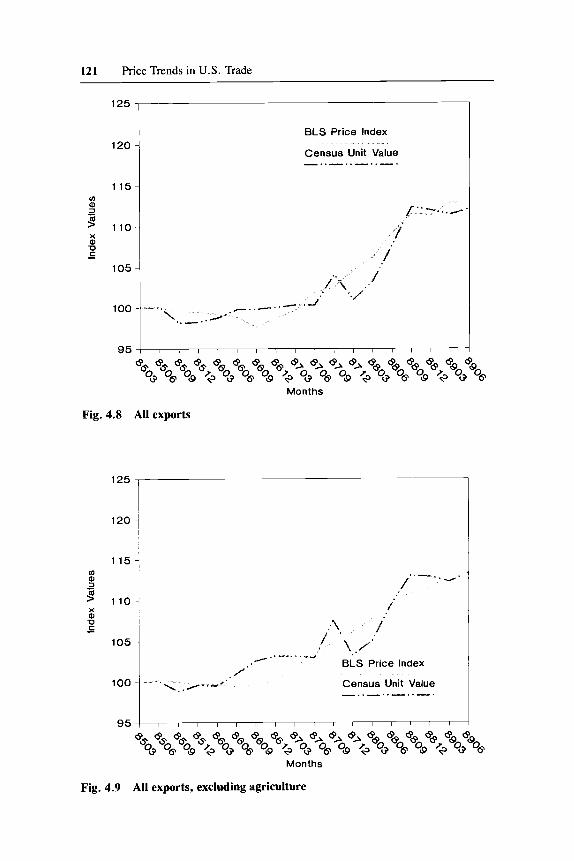
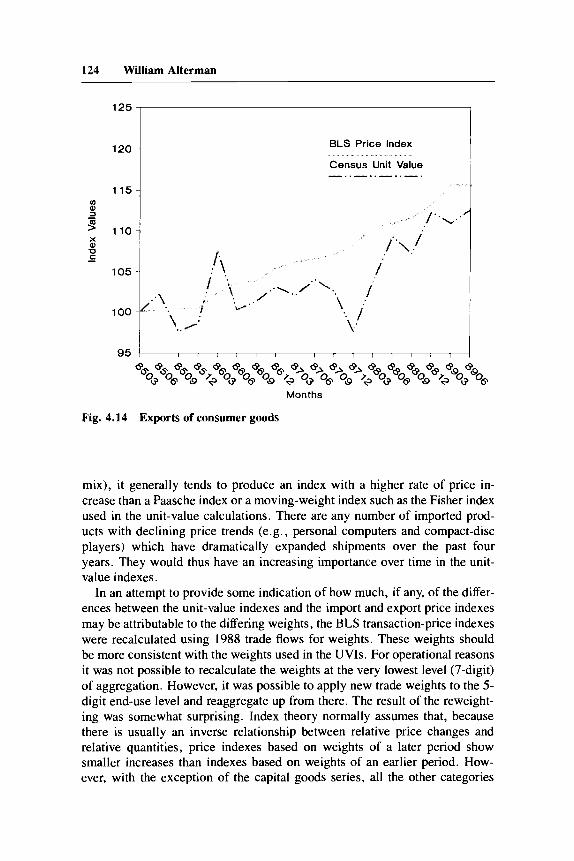
At first glance, the two price indexes measuring exports during this period appear more consistent (see fig. 4.8). From March 1985 to June 1989, export prices as measured by the BLS indexes rose 13.0 percent, compared to a 12.2 rise in the unit-value series. However, more detailed comparisons reflect a considerable variation in the two measures (see figs. 4.9-4.14). For exports, the BLS series registered greater increases during this period for foods, feeds, and beverages, industrial supplies and materials, and consumer goods. How- ever, in the comparisons for capital goods and motor vehicles, the unit-value data reflected greater increases. Incidentally, earlier comparisons of the capital goods indexes for both exports and imports (from December 1979 to March 1985 for imports and from December 1978 to March 1985 for exports) also recorded a tendency to greater price increases in the unit-value figures.
One of the assumptions about unit-value series is that they would be most appropriate (and therefore most likely to match up with the BLS indexes) in those areas, such as raw materials, where product categories are relatively homogeneous, where there are relatively few quality changes over time for a specific product, and where the data used in constructing UVIs is most com- plete. The charts appear to bear this out, as data for both imports and exports of foods, feeds, and beverages and raw materials reflect relatively closer fits between the UVIs and the BLS price indexes than the charts for the finished categories of capital goods, consumer goods, and motor vehicles.
Delineating the source of the deviations between these two series can be difficult. For example, the tendency for the unit-value series to register smaller price increases, particularly for imports, appears to contradict one common assumption about unit-value indexes, which is that since they do not adjust for changes in an individual product’s specification, they tend to overstate the level of price increases (assuming the average quality of traded products is increasing, as in the case of autos). As mentioned earlier, this pattern of smaller increases in the unit-value series could be a function of the differences in the two calculation formulas. Since a fixed-base Laspeyres formula, such as used by the BLS series, does not allow for substitution (changes in product
8. For an analysis of the response of Japanese automakers to the voluntary export restraints. see Feenstra (1988).
121 Price Trends in US. Trade
125
120
115
110
105
100
95
BLS Price Index
Census Unit Value _..-..-..-.
/ / I l I I / I I / / I I I I I
Months
Fig. 4.8 All exports
125
120
115
105
100
95
Census Unit Value -..-..-..-.
* * * * * * * * * * * @ * * * * * * *OG *o* *oo *+ *OG *06 *oo *+ -toG %* Aoo A+ *OG *o* *09 *$ "OGQO*
Months
Fig. 4.9 All exports, excluding agriculture

122 William Alterman
130
120
110 u) P) 3 - 9 100 % U c -
90
80
70
BLS Price Index
Months
Fig. 4.10 Exports of foods, feeds, and beverages
u) 115 - 3 9 110 a U
105
/ ' BLS Price Index
Census Unit Value - .- ._...-.
904 I , 1 I I I I I 1 I 1 I I I I 1 i
Months
Fig. 4.11 Exports of industrial supplies and materials

123 Price Trends in U.S. Trade
125 I- 120 -
115 ~
110 ~
105 1
BLS Price Index
Census Unit Value __*._/..-..-.
/' . . /.. . I .-"
Months
Fig. 4.12 Exports of capital goods
125
120
115
105
100
95
Months
Fig. 4.13 Exports of motor vehicles
124 William Alterman
125
120
115 fn - 2 9 110 Q U -
BLS Price Index
Census Unit Value - " .-.._...__.
Months
Fig. 4.14 Exports of consumer goods
mix), it generally tends to produce an index with a higher rate of price in- crease than a Paasche index or a moving-weight index such as the Fisher index used in the unit-value calculations. There are any number of imported prod- ucts with declining price trends (e.g., personal computers and compact-disc players) which have dramatically expanded shipments over the past four years. They would thus have an increasing importance over time in the unit- value indexes.
In an attempt to provide some indication of how much, if any, of the differ- ences between the unit-value indexes and the import and export price indexes may be attributable to the differing weights, the BLS transaction-price indexes were recalculated using 1988 trade flows for weights. These weights should be more consistent with the weights used in the UVIs. For operational reasons it was not possible to recalculate the weights at the very lowest level (7-digit) of aggregation. However, it was possible to apply new trade weights to the 5- digit end-use level and reaggregate up from there. The result of the reweight- ing was somewhat surprising. Index theory normally assumes that, because there is usually an inverse relationship between relative price changes and relative quantities, price indexes based on weights of a later period show smaller increases than indexes based on weights of an earlier period. How- ever, with the exception of the capital goods series, all the other categories

125 Price Trends in U.S. Trade
Table 4.1 Comparison of BLS Price Indexes and Census Unit Value Indexes; Percentage Changes from March 1985 to June 1989 (end-use categories)
Exports Imports
BLS Indexes BLS Indexes
Unit-Value 1985 1988 Unit-Value 1985 1988 Indexes Weights Weights Indexes Weights Weights
All Commodities All Commodities
excluding petroleum excluding agriculture
Foods, feeds, and bev- erages
Industrial supplies and materials
Capital goods Motor vehicles Consumer goods
12.2 13.0 16.4 13.7 20.8 26.8
24.4 29.8 31.4 13.4 13.1 14.9
7.7 14.7 25.5 10.5 11.8 16.6
9.1 20.3 27.2 -2.1 3.1 14.8 13.6 7.6 6.9 21.7 34.8 32.9 18.1 9.7 9.9 42.2 30.8 31.1 12.7 15.9 16.8 10.3 30.7 31.6
Sources: Bureau of Labor Statistics, Bureau of the Census. Nore; The experimental 1988 trade-weighted indexes were produced by attaching 1988 relative importance to 5-digit end-use indexes (constructed using 1985 relative importances). These in- dexes were then recalculated up to successively higher levels of aggregation using 1988 relative importances.
registered larger price increases when the indexes were recalculated using 1988 weights (as opposed to the calculations with 1985 weights). In general, changing the weights only served to exacerbate the differences in the overall trends during this particular period (see table 4.1).
Nonetheless, while the differences between these sets of indexes do not appear to be attributable to the weights used in their calculations, the sensitiv- ity of import and export price indexes to their weight structure should be noted, as foreign trade flows do shift r a ~ i d l y . ~ It was partially in recognition of this fact that BLS established a policy of reweighting the export-import price indexes every five years, (the CPI and PPI series are reweighted only every ten years). An illustrative example of the magnitude of this problem can be drawn from the petroleum component of the import price index. In 1980 petroleum represented one-third of U.S. imports. When the one-year change in the import price index from December 1985 to December 1986 was first published (using 1980 weights), the index declined 8.7 percent. However,
9. The weighting problem was also addressed in the NBER Reporr on the Price Statistics ofthe Federal Government (196 I): “The fundamental problem of price index number construction-that of coping with a changing basket of goods-seldom appears in so exacerbated a form as in the case of price indexes for exports and imports. The patterns of consumption and production change hut slowly compared to the rapid shifts that may occur in the commodity composition of imports and exports.” Bear in mind that this was written hack in 1961.

126 William Alterman
when the series was recalculated based on 1985 weights (petroleum repre- sented only one-sixth of imports in 1985), the index covering the same twelve months increased 0.3 percent.
One final observation to be drawn from the graphs is that the BLS series has been relatively stable and consistent compared to the unit-value numbers. After removing the major volatile components (agriculture on exports, petro- leum on imports), the BLS series are smoother than the unit-value series, particularly for exports, which tend to change both direction and magnitude frequently. This conclusion is supported by the simple analysis in table 4.2, which compares the unit-value indexes and the BLS indexes by the average of the absolute value of the quarterly percent changes, the standard deviation of the percentage changes, and the frequency of a change in the sign of the quar- terly percentage changes. These limited findings are consistent with the more detailed results in some of the studies cited earlier.
4.4 Bade Flow Analysis
Currently, the most important use of export and import price indexes is to deflate the foreign trade component of the National Accounts. Although the actual methodology presently used at the Department of Commerce relies pri- marily upon the BLS indexes, an analysis of deflated trade data using the two different series is of considerable interest. In particular, most historical (that is prior to the early 1980s) inflation adjustments by BEA to trade data were done using primarily unit-value data. Thus long-term intertemporal compari- sons of real trade flows may have been biased by the use of different indexes in making adjustments for inflation. In addition, some analysts have used, and may continue to use, unit-value indexes to construct country-specific esti- mates of inflation-adjusted trade flows, given that BLS does not currently pro- duce import and export price indexes for specific countries.
Table 4.2 Measures of Price Index and Unit Value Variability, Based on 1-Digit Components (3-month changes, March 1985 to June 1989)
Total Exports Imports
BLS Census BLS Census BLS Census Price Index Unit-Value Price Index Unit-Value Price Index Unit-Value
Average of absolute percentage change 2.035 3.012 1.713 2.944 2.358 3.081
Standard deviation 2.533 3.826 1.982 3.730 2.623 3.734 Changes in direction
of sign 45 86 22 46 23 40
Source: Bureau of Labor Statistics. Note; The standard deviation values are a simple average of the standard deviation of the quarterly per- centage changes within each of the 10 (5 import and 5 export) one-digit end-use categories over 17 quar- ters.

127 Price Trends in U.S. Trade
Table 4.3 Estimates of Constant Dollar ’Ztade Deficit (constant March 1985 dollars; annualized rates in billions of dollars)
Deflated by Deflated by BLS Indexes Census Unit-Values
1985: March June September December
March June September December
March June September December
March June September December
March June
1986:
1987:
1988:
1989:
99.3 117.5 119.1 134.2
160.3 162.3 160.7 160.2
140.3 135.6 139.6 139.5
126.7 113.7 125.7 121.8
98.0 98.8
99.3 117.9 116.9 133.8
157.5 172.9 189.1 184.6
166.0 155.5 161.0 156.3
147.9 135.2 158.7 162.8
127.4 128.4
Sources: Bureau of Labor Statistics, Bureau of the Census, Bureau of Economic Analysis
Deflating recent trade data by these two series separately results in consid- erably different values (see table 4.3). lo The annualized second-quarter 1989 “real” trade deficit, in terms of constant March 1985 dollars, would have been $128.4 billion if deflated by the unit-value series, but just $98.8 billion, 23 percent less, if adjusted for inflation by the BLS data. (The nominal trade deficit during the second quarter of 1989 was $108.9 billion.) Between 1985 and 1989 there is a $7.5 billion difference in the estimated annual growth in real net exports of goods, depending on which series is used. The BLS series produces a smaller inflation-adjusted trade deficit primarily because of the higher BLS import-price index, which results in a lower estimated quantity of imports. Also note that the month of greatest “real” trade deficit differs de- pending on which series is used. This point is critical given the keen interest
10. The actual deflation of the foreign-trade component of the National Incomc and Product Accounts is currently done (as of December 1989) based on 1982 constant dollars. For finished goods at least, deflators are applied at the most detailed level of data available, usually the 5-digit end-use class. This alleviates somewhat the problem of variation in indexes caused by the use of different weighting structures. For further details, see U.S. Department of Commerce, Survey of Current Business (1986).

128 William Alterman
in trying to establish when a trade deficit turns around (frequently referred to as the “J-curve” effect).
4.5 Analysis of the Price Effects of Exchange-Rate Changes
In order to expedite economic analysis for each 2-digit SITC import and export price index, BLS estimates a corresponding price index measured in foreign currency. These foreign-currency indexes are produced by multiplying the 2-digit SITC indexes in dollars by a trade-weighted index of the dollar’s exchange rate in terms of 40 foreign currencies, whose weights are derived from U.S. bilateral trade-flow patterns in the base period 1985.” For example, the trade-weighted exchange-rate index for imports in the motor vehicle cate- gory are heavily weighted toward the currencies of Canada, Japan, and West Germany, who supply most U.S. automotive imports.
This information can be used in several ways. First, the exchange-rate in- dex provides evidence as to which product categories may have been most affected by movements in the dollar’s exchange rate. For instance, in the price index for professional and scientific equipment (for which Japanese and West German companies have been the major suppliers), the trade-weighted dollar fell 41.1 percent from March 1985 to December 1988. In contrast, the average dollar exchange rate relevant to imported apparel (which comes primarily from the so-called newly industrializing economies, or NIEs) fell only 16.5 percent over the same period. This provides important evidence on the ques- tion of why import prices of professional and scientific instruments rose twice as fast as import prices of apparel during this period.
Second, the data can be used to indicate what has happened to the price of U.S. exports and imports from the standpoint of the average foreign buyer or seller. On the export side, the foreign-currency index gives users an indication of how much cheaper U.S. goods have become as a result of the depreciation of the dollar, for example, from the standpoint of the average foreign buyer. The data indicate that between March 1985 and June 1989 the average price of all U.S. merchandise exports fell 15 .O percent in terms of foreign currency. Table 4.4 provides data comparing dollar indexes, exchange-rate indexes and average foreign-currency indexes for selected categories of U.S. exports and imports.
Third, these foreign-currency series and the associated exchange-rate in- dexes can provide an indication of how companies engaged in U.S. trade have reacted to the fluctuation of the dollar over the past decade. For example, they
I 1. The exchange rate series and foreign-currency series published in the regular quarterly press release are based on data for 40 countries. In addition, the Bureau also produces an experimental foreign-currency series which includes data for 63 countries and which has been deflated by for- eign rates of inflation. This series set of countries was used in calculating the pass-through values in table 4.5. For further information on the methodology used in the construction of the foreign currency indexes, refer to Alterman, Goth, and Johnson (1987).
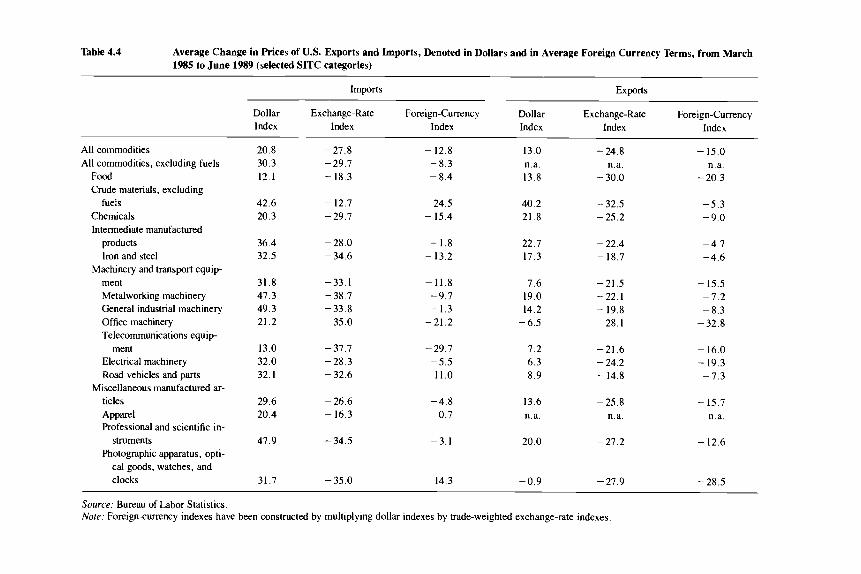
Table 4.4 Average Change in Prices of U.S. Exports and Imports, Denoted in Dollars and in Average Foreign Currency Terms, from March 1985 to June 1989 (selected SITC categories)
Imports Exports
Dollar Exchange-Rate Foreign-Currency Dollar Exchange-Rate Foreign-Currency Index Index Index Index Index Index
All commodities All commodities, excluding fuels
Food Crude materials, excluding
fuels Chemicals Intermediate manufactured
products Iron and steel
Machinery and transport equip- ment Metalworking machinery General industrial machinery Office machinery Telecommunications equip-
Electrical machinery Road vehicles and parts
ticles Apparel Professional and scientific in-
struments Photographic apparatus, opti-
cal goods, watches, and clocks
ment
Miscellaneous manufactured ar-
20.8 30.3 12.1
- 27.8 - 29.7 - 18.3
- 12.8 - 8.3 - 8.4
13.0 n.a. 13.8
- 24.8 n.a.
- 30.0
- 15.0 n.a.
- 20.3
42.6 20.3
- 12.7 -29.7
24.5 - 15.4
40.2 21.8
- 32.5 -25.2
-5.3 -9.0
36.4 32.5
-28.0 -34.6
- 1.8 - 13.2
22.7 17.3
- 22.4 - 18.7
-4.7 -4.6
31.8 47.3 49.3 21.2
-33.1 - 38.7 -33.8 -35.0
-11.8 -9.7 - 1.3
-21.2
7.6 19.0 14.2 - 6.5
-21.5 - 22.1 - 19.8 - 28.1
- 15.5 -7.2 -8.3
-32.8
13.0 32.0 32.1
-37.7 -28.3 -32.6
- 29.7 -5.5
-11.0
7.2 6.3 8.9
-21.6 - 24.2 - 14.8
- 16.0 - 19.3
-7.3
29.6 20.4
- 26.6 - 16.3
-4.8 0.7
13.6 n.a.
-25.8 n.a.
- 15.7 n.a.
47.9 - 34.5 -3.1 20.0 -27.2 - 12.6
31.7 - 35.0 - 14.3 -0.9 - 27.9 - 28.5
Source: Bureau of Labor Statistics. Nore: Foreign-currency indexes have been constructed by multiplying dollar indexes by trade-weighted exchange-rate indexes.

130 William Alterman
can be used to show to what extent foreign companies may, or may not, have “passed through” into higher dollar prices the changes caused by the exchange-rate fluctuation and to what extent they have absorbed the change, presumably either by lowering costs or lowering profit margins. While the literature on pass-through values is extensive, the availability of detailed product-category data permits considerably more detailed comparisons than would be possible using the more limited unit-value series.’* The import pass- through values constructed for this paper incorporate dollar-exchange rates with the currencies of 63 countries and consumer prices in the same 63 foreign countries. The numbers attempt to estimate to what extent a change in the exchange rate times the selling country’s CPI induces a change in the price faced by the buying country. The general formula used in construction of the pass-through values for importers is:
A PM,$ A (ER, * CPZ,*)
MPT, =
where MPT = import pass-through rate; PM$ = U.S. import price in dol- lars; ER = exchange rate, in dollars per foreign currency (weighted average for 63 countries); CPI* = foreign CPI in foreign currency (weighted average for 63 countries); i = pertains to the SITC group for which the index is cal- culated; and A (. . . ) = denotes the percentage change in the variable in parentheses over a specified period.
Pass-through figures can also be calculated for the export series. The for- mula used for export pass-through values is similar, except that exchange rates for four countries with extremely high rates of inflation were excluded:
where XPT = export pass-through rate; PMi* = foreign import price in lo- cal currency; CPP = U.S. CPI in dollars; PXS = U.S. export price in dol- lars; ER = exchange rate, in dollars per foreign currency (weighted average for 59 countries), i = pertains to the SITC group for which the index is cal- culated, and A (. . . ) = denotes the percentage change in the variable in parentheses over a specified period. Note that in this model of pass-through, U.S. and foreign CPIs are being used as proxies for U.S. and foreign produc- tion costs.
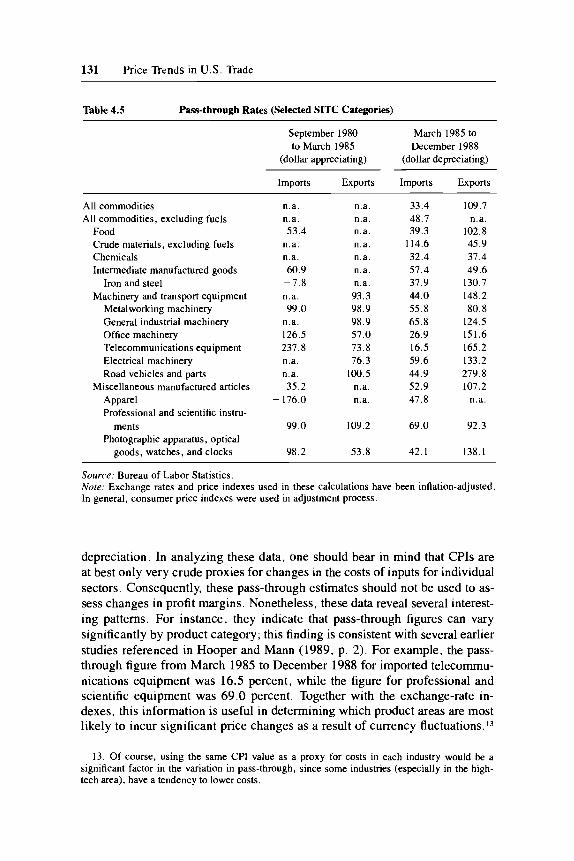
The calculation of pass-through estimates was made for two periods (as shown in table 4.5): September 1980 to March 1985, a period of strong appre- ciation of the dollar; and March 1985 to December 1988, a period of dollar
12. For a recent review of the literature on pass-through rates see Hooper and Mann (1989)
131 Price Trends in U.S. Trade
Table 4.5 Pass-through Rates (Selected SITC Categories)
September 1980 March 1985 to to March 1985 December 1988
(dollar appreciating) (dollar depreciating)
Imports Exports Imports Exports
All commodities n.a. n.a. 33.4 109.7 All commodities, excluding fuels n.a. n.a. 48.7 n.a.
Food 53.4 n.a. 39.3 102.8
Chemicals n.a. n.a. 32.4 37.4 Intermediate manufactured goods 60.9 n.a. 57.4 49.6
Iron and steel -7.8 n.a. 37.9 130.7
Crude materials, excluding fuels n.a. n.a. 114.6 45.9
Machinery and transport equipment Metalworking machinery General industrial machinery Office machinery Telecommunications equipment Electrical machinery Road vehicles and parts
Miscellaneous manufactured articles Apparel -
Professional and scientific instn- ments
n.a. 99.0
n.a. 126.5 237.8 n.a. n.a. 35.2
- 176.0
99.0
93.3 98.9 98.9 57.0 73.8 76.3
100.5 n.a. n.a.
109.2
44.0 55.8 65.8 26.9 16.5 59.6 44.9 52.9 47.8
69.0
148.2 80.8
124.5 151.6 165.2 133.2 279.8 107.2
n.a.
92.3 Photographic apparatus, optical
goods, watches, and clocks 98.2 53.8 42.1 138.1
Source: Bureau of Labor Statistics. Nore; Exchange rates and price indexes used in these calculations have been inflation-adjusted. In general, consumer price indexes were used in adjustment process.
depreciation. In analyzing these data, one should bear in mind that CPIs are at best only very crude proxies for changes in the costs of inputs for individual sectors. Consequently, these pass-through estimates should not be used to as- sess changes in profit margins. Nonetheless, these data reveal several interest- ing patterns. For instance, they indicate that pass-through figures can vary significantly by product category; this finding is consistent with several earlier studies referenced in Hooper and Mann (1989, p. 2). For example, the pass- through figure from March 1985 to December 1988 for imported telecommu- nications equipment was 16.5 percent, while the figure for professional and scientific equipment was 69.0 percent. Together with the exchange-rate in- dexes, this information is useful in determining which product areas are most likely to incur significant price changes as a result of currency fluctuations.i3
13. Of course, using the same CPI value as a proxy for costs in each industry would be a significant factor in the variation in pass-through, since some industries (especially in the high- tech area), have a tendency to lower costs.
132 William Alterman
Although the figures are somewhat sparse, the data indicate that for a given industry pass-through values are nearly always lower when the “home” cur- rency is appreciating rather than depreciating. The data further indicate that pass-through values for foreign-based industries (U.S. imports) tend to be lower than for corresponding U.S. industries (U.S. exports), particularly dur- ing periods of an appreciation of the home currency.
The finding that U.S. exporters to the world pass through more into the final selling price more of an exchange-rate change than foreign exporters to the U.S. do is consistent with earlier studies such as Mann (1986) and Moffett (1989). Two explanations come to mind. First, it is easier to pass along a depreciating currency, with the beneficial impact of lowering the selling price in foreign-currency terms without having to lower the home price, than it is to pass through an appreciating currency, with the negative impact of making goods more expensive in terms of the currency of the foreign buyer. Second, foreign companies may be less willing than U.S. companies to allow their selling prices (and presumably market share) to be affected by the vagaries of exchange-rate fluctuations. The results in table 4.5 seem to suggest that both factors may be at work.
Extreme care should be taken in analyzing pass-through rates for categories of raw and intermediate materials. Typically, volatile swings in prices in these categories reflect the influence of factors other than exchange rates. Prices for crude materials, for example, generally rose worldwide throughout the last half of the 1980s. This would account for the anomaly of the significantly higher pass-through rate during this period for crude materials for U.S. im- ports as compared to U.S. exports. Also note the inverse correlation between exchange rates and imported apparel prices during the early 1980s. One pos- sible explanation is the introduction of apparel quotas in 1983, which presum- ably allowed for an increase in the price of imports, despite a favorable shift in the dollar’s exchange rate.
Pass-through estimates based on the unit-value numbers would, of course, be different from those shown in table 4.5, because of the difference in price trends. For imports, the unit-value series would show a smaller rate of pass- through over the period of dollar depreciation, since the unit-value index was rising less rapidly than the BLS index. For imported capital goods, the pass- through figure using the BLS data would be roughly one-half, while using the unit-value data the corresponding figure would only be about one-third. l4
These differences have important implications for historical analysis of pass- through, since BEA only began to incorporate the BLS data into the construc- tion of its price indexes in the early 1980s. The process was not completed until 1989, when BLS price data for the food and raw materials components
14. As of June 1990, the exchange-rate indexes are only available by SITC category. Conse- quently, no exact estimate of pass-through values can be constructed by end-use category at this time. However, the BLS plans to calculate exchange-rate indexes by end-use and SIC groups beginning in 199 1 .

133 Price Trends in U.S. Trade
were incorporated. Thus, virtually the entire historical data-base for the im- plicit price deflators and fixed-weight price indexes published by BEA as part of the quarterly GNP estimates uses a mix of BLS prices and Census unit values (as well as other data). Consequently, any study of historical pass- through values that uses price indexes associated with the National Income and Product Accounts, such as those cited in section 4.2, could show changes in “pass-through’ behavior over time that to some degree may be merely sta- tistical artifact.
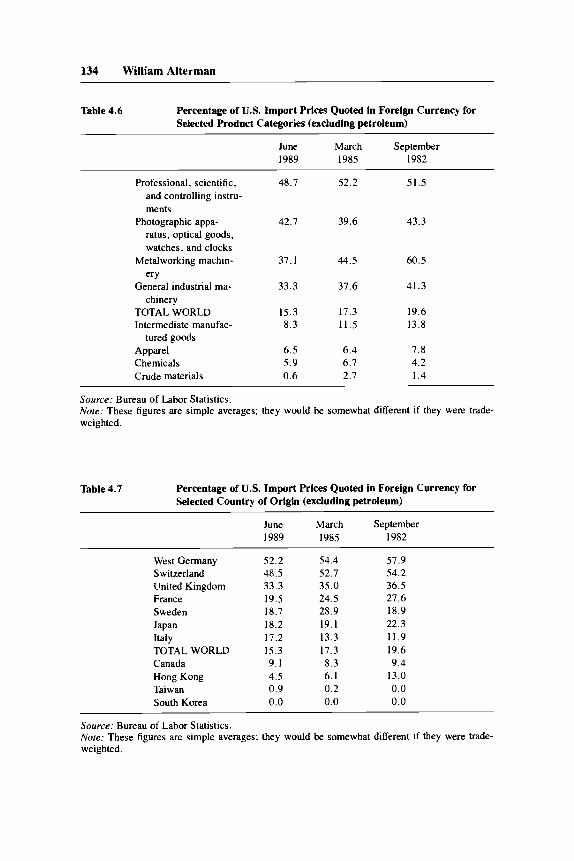
Perhaps even more important to facilitating analysis of the effects of move- ments in exchange rates is the availability of the BLS data broken down by country and currency. Unlike the Census data, the BLS data are collected in whatever currency the company chooses to report in (usually the invoice cur- rency). Since a significant portion of U.S. imports, approximately 15 percent, are invoiced in foreign currency, any fluctuation in exchange rates will have an immediate impact on the price data measured in dollars (as well as on nominal trade values in dollars). By looking at these patterns of currency in- voicing, one can deduce which product areas are likely to show the greatest sensitivity of prices to exchange-rate changes. As shown in table 4.6, approx- imately one-half of the products in the category for professional and scientific equipment are priced in foreign currency, primarily the Japanese yen and the West German mark. Since BLS must convert these foreign-currency prices into dollar prices, the direct effect of exchange-rate movements on the import- price index is quite apparent. In contrast to finished goods, crude materials are priced primarily in dollars, and therefore in these sectors exchange-rate fluctuations generally have only indirect effects on dollar prices. The infor- mation on currency invoicing can be used to determine which suppliers, by country, have a tendency to price in their own currency and which tend to price in dollars. The data in table 4.7 indicate that companies located in West- em Europe tend to price a higher portion of their U.S.-bound exports in their own currency than Japanese companies do. In turn, the Japanese tend to price a higher portion of their goods in yen than companies from the NIEs, such as South Korea and Taiwan, price in their currencies. There also appears to be a recent pattern of suppliers selling a higher percentage of goods to the U.S. in dollars. That this apparently was the case both when the dollar was appreciat- ing (from September 1982 to March 1985) and when the dollar was falling (from March 1985 to June 1989) provides further evidence of the increasing unwillingness of foreigners to let fluctuations in the exchange rate dictate their selling price in the United States.
In the export-price indexes, with few exceptions, every product collected by the Bureau is quoted in dollars.15
15. Statistics on currency of invoicing are collected by a number of other countries. In general, they are consistent with the figures reported here. They do, however, indicate that some U.S. exports are being invoiced in a foreign currency. See Page (1981) for a breakout of invoicing currency for selected other countries.
134 William Alterman
Table 4.6 Percentage of U.S. Import Prices Quoted in Foreign Currency for Selected Product Categories (excluding petroleum)
June March September 1989 1985 1982
Professional, scientific, 48.7 52.2 51.5 and controlling instru- ments
Photographic appa- 42.7 39.6 43.3 ratus, optical goods, watches, and clocks
Metalworking machin- ery
General industrial ma- chinery
TOTAL WORLD Intermediate manufac-
tured goods Apparel Chemicals Crude materials
37.1 44.5 60.5
33.3 37.6 41.3
15.3 17.3 19.6 8.3 11.5 13.8
6.5 6.4 7.8 5.9 6.7 4.2 0.6 2.7 1.4
Source: Bureau of Labor Statistics. Note: These figures are simple averages; they would be somewhat different if they were trade- weighted.
Table 4.7 Percentage of U.S. Import Prices Quoted in Foreign Currency for Selected Country of Origin (excluding petroleum)
June March September 1989 1985 1982
West Germany 52.2 54.4 57.9 Switzerland 48.5 52.7 54.2 United Kingdom 33.3 35.0 36.5 France 19.5 24.5 27.6 Sweden 18.7 28.9 18.9 Japan 18.2 19.1 22.3 Italy 17.2 13.3 11.9 TOTAL WORLD 15.3 17.3 19.6 Canada 9. I 8.3 9.4 Hong Kong 4.5 6.1 13.0 Taiwan 0.9 0.2 0.0 South Korea 0.0 0.0 0.0
Source: Bureau of Labor Statistics. Nore: These figures are simple averages; they would be somewhat different if they were trade- weighted.

135 Price Trends in U.S. Trade
4.6 Prospective Enhancements to the BLS International Price Indexes
In the mid-l980s, BLS undertook an extensive review of the International Price Program. The results of this review pointed to the desirability of further enhancements to the import and export price indexes in several areas. One enhancement concerned the development of monthly indexes, as discussed earlier. Others included the development of import-price indexes by country of origin, major revision in the sampling methodology, and modernization of the data-processing capabilities for the BLS International Price Program. Re- sources were made available in fiscal year 1989 to begin to address these areas over the next four years. In addition, work has been underway at BLS for several years to expand the coverage of price indexes to include international trade in services.
The demand for monthly indexes was associated primarily with a desire, particularly in the Reagan administration, to have the monthly merchandise trade data published on an inflation-adjusted basis. In addition, because of the short-term variability of U.S. import prices, it was felt that monthly import- price indexes would facilitate more accurate assessment of monthly fluctua- tions in the PPI and the CPI. In view of the critical need for this information, the Bureau developed and began publishing a limited number of monthly in- dexes at the beginning of 1989. By 1993 the BLS expects to begin publication of a complete set of monthly indexes. However, since budgetary constraints may require a reduction in the number of products priced monthly (compared to the current quarterly total), there may be some diminution in the number of series published.
Interest in the construction of indexes by country of origin was boosted in the mid-1980s by the uneven pattern of the dollar’s fall against other curren- cies, as well as by the tendency of importers to shift from suppliers in one country to another. Country-of-origin indexes would, of course, greatly facil- itate analysis of pass-through rates for U.S. imports. Although Census unit- value data at a very detailed level of commodity and country disaggregation have been used to construct country-of-origin indexes, those series tend to have the same problems as the published unit-value indexes. BLS is now in the process of addressing the methodological issues associated with country- of-origin indexes and plans to begin publication of a limited set of indexes by 1992.
Up until 1989, BLS’s sampling methodology replenished each product area approximately once every three years. Beginning in 1990, however, the Bu- reau shifted to a two-year replenishment cycle. Under this approach a given company and product will be used in an index for four years, after which a new sample will be drawn (which may or may not include the same companies or products). More importantly, two samples will be drawn for each product area, one initiated in year 1, the other in year 3. The revision of the sampling system has been designed to serve three major purposes: to permit more rapid introduction of new products into the indexes, which is important given the

136 William Alterman
highly volatile nature of external trade; to allow the entire sample to be re- placed completely over a four-year rotation (currently there is not a systematic probability-based process of sample updating); and to enlarge individual samples enough to permit the index algorithm to use company information. Currently, data on value of trade by company is incorporated into the sample selection process but cannot be properly used in the actual price-index esti- mator due to the relatively small size of each sample. Instead, products in similar item categories are given equal weight, regardless of their relative im- portance in the category.
The automated data-processing system currently being used for the inter- national price indexes is mainframe-based and dates back to the early 1970s. Although it has been modified several times, it has become increasingly inef- ficient over the years as the data-base has expanded and the need for faster turnaround has increased. The new system will make extensive use of the interactive processing capability of PCs, as well as wider and more effective use of optical scanning equipment. The new system will facilitate the produc- tion of additional outputs, reduce processing time, and enhance quality review procedures.
In order to accommodate the growth in the service sector, BLS has recently begun to construct price indexes for selected categories of services in interna- tional trade. Currently, BLS releases data for air-passenger fares, crude-oil tanker freight, and electricity. Where possible, the Bureau is attempting to construct two parallel series for each area of services. One will reflect a balance-of-payments definition: an individual in one country pays for a ser- vice provided by an individual in another country. The other will reflect a more inclusive definition of an international service: the service itself is of an international nature, regardless of who is the provider. For example, for ex- port airline fares, one set of data (on a balance-of-payments basis) reflects only foreigners traveling on American carriers. Under the broader definition, the second set of numbers would also include data on U.S. citizens flying overseas on U.S. carriers. The Bureau plans to expand indexes in this area during the next several years, as resources permit.
Despite the current expansion of the BLS program, several issues still need to be addressed. For example, unlike the CPI or PPI, the import and export price indexes are not seasonally adjusted. There are several difficulties in con- structing seasonal factors. First, since nearly all the historical data are avail- able only on a quarterly basis, there are at present just four observations per year to work with. Second, on the import side, the extreme volatility of the exchange rate over the past five years has overwhelmed any cyclical trends. However, the Bureau will continue to do ongoing research on seasonal factors in an effort to determine if they should be published.
Another area which needs some additional research is the transfer-pricing policies of multinational corporations. With the growing role of these compa- nies in international transactions (in 1987 38.2 percent of U.S. merchandise

137 Price Trends in U.S. Trade
trade was intracompanyI6), there is concern that a rising proportion of items in the Bureau’s sample do not represent “arm’s length” transactions and are therefore unusable for the purposes of the indexes.I7 A related concern is how to handle items that are classified in tariff codes 806 and 807. These are items that are produced in the United States, shipped to other countries for further processing or assembly, and then shipped back to the United States for final sale or final assembly.
One difficult issue revolves around the appropriate exchange rate to use in converting from a foreign-currency price to a dollar price. The Bureau cur- rently does not ask respondents what exchange-rate factor they use in making valuations. Instead, the Bureau uses an exchange-rate factor which represents an average for the month immediately preceding the pricing month. Although this appears to be a reasonable approach, it is not clear how closely this figure approximates the exchange-rate factor used in the valuation of the item.
Another important area BLS expects to review in the International Price Program is that of how the BLS series are used. This is a critical question, since how the data are used may have a significant bearing on what data will be collected and how the indexes will be constructed.’8 To date, these indexes have been designed primarily to be used as deflators for the National Ac- counts. For this purpose the data should reflect transaction prices (excluding duty) of commodities which cross the U.S. border in a particular period. However, a researcher studying the competitiveness of U.S. versus foreign merchandise might be more interested in the current market price of a good, regardless of the period in which it was shipped. (In fact, assessing competi- tiveness was the main intent of the price measures developed by Kravis and Lipsey, 1971). If one’s interest is in evaluating the impact of import prices on domestic price levels, an appropriate price index might very well include any duty assessment. In addition, the appropriate weights to be used in the con- struction of price indexes could differ substantially, depending upon the use to which the indexes are to be put. For example, for a deflator the appropriate weights would be current-period variable U.S. trade flows; as a competitive- ness measure some sort of world fixed weight may be necessary; and for do- mestic price analysis a Laspeyres fixed market basket consistent with PPI and
16. Data on the 1987 percentage of intrafirm trade were constructed from articles in the June and July 1989 issues of the Survey of Current Business. The percent of imports in intrafirm trade was 41 .O percent, while the figure on the export side was 33.8 percent. For a short discussion of the growing importance of multinational trade, see Little (1987). Many of the issues associated with transfer pricing are discussed in Rugman and Eden (1985).
17. If it is determined during the initiation process that the buyer and seller are affiliated and that the transaction price for the product selected does not mirror market trends, then the product will not be collected for repricing.
18. The NBER Report on the Price Statistics of the Federal Government (1961) did address the issue of multiple series, but noted: “While we recognize that for various purposes we would desire differently defined indexes, we suspect that the differences will not be so great as to warrant the calculation of more than one index number of export prices and one number of import prices.”

138 William Alterman
CPI might be most desirable. Work on reviewing and possibly revising or modifying the conceptual foundation for the indexes commenced in 1991.
4.7 Conclusion
I hope I have established the importance of the BLS import and export price indexes, despite the need for further enhancements to them, and in particular their superiority compared with unit-value indexes. Despite the supposed sim- ilarity of unit-value indexes to these new series, I found significant differences over the past decade in their trends. In particular, prices in import categories as measured by the BLS indexes generally rose more rapidly than prices in the same categories as measured by UVIs. It is critical to realize that analysts may get different results in their studies depending on which source of data is being used, given that much of the historical information on external price trends for the U.S. is available only via unit-value figures.
I also used the BLS price indexes to estimate some pass-through values and concluded from the results that U.S. companies appear less willing to adjust their home-currency export price than foreign companies in the face of fluc- tuating exchange rates. Finally, I constructed some new data, which became available as a byproduct of the BLS data collection, on the percentage of U.S. imports invoiced in a foreign currency, both by country of origin and product area. I concluded that imports from Western Europe and imports of finished goods are more likely to be priced in a foreign currency. In some cases up to 50 percent of a category was priced in a foreign currency.
References
Allen, R. G. D. 1975. Index Numbers in Theory and Practice. Chicago: Aldine Pub- lishing Company.
Alterman, William, John Goth, and Dave Johnson. 1987. BLS Publishes Average Ex- change Rate and Foreign Currency Price Indexes. Monthly Labor Review 110(12):47-49.
Baldwin, Richard. 1988. Hysteresis in Import Prices: The Beachhead Effect. American Economic Review 78(3):773-85.
Dombusch, Rudiger. 1987. Exchange Rates and Prices. American Economic Review
Feenstra, Robert C. 1988. Quality Changes under Trade Restraints in Japanese Autos.
Froot, Kenneth, and Paul Klemperer. 1989. Exchange Rate Pass-Through when Mar-
Holmes, R. A. 1973. The Inadequacy of Unit Value Indexes as Proxies for Canadian
Hooper, Peter, and Catherine Mann. 1989. Exchange Rate Pass Through in the 1980s:
77( 1):93-106.
Quarterly Journal of Economics 103( 1): 13 1-46.
ket Share Matters. American Economic Review 79(4):637-54.
Industrial Selling Prices. Review of Income and Wealth 19(3):271-77.

139 Price Trends in U.S. Trade
The Case of U.S. Imports of Manufactures. Paper presented at Brookings Panel on Economic Activity, 6-7 April 1989.
Interagency Committee on Measurement of Real Output, Subcommittee on Prices. 1973. Report on Criteria for Choice of Unit Values or Wholesale Prices in Deflators. Typescript (the Searle Committee Report). 17 June 1960. Reprinted with changes and a brief summary of the appendixes in Review of Income and Wealth 19(3): 253- 66.
Kim, Yoonbai. 1990. Exchange Rates and Import Prices in the United States: A Varying-Parameter Estimation of Exchange-Rate Pass-Through. Journal of Business and Statistics 8(3):305-15.
Knetter, Michael. 1989. Price Discrimination by U.S. and German Exporters. Ameri- can Economic Review 79( 1): 198-210.
Kravis, Irving B., and Robert Lipsey. 1971. Price Competitiveness in World Trade. New York: National Bureau of Economic Research.
Krugman, Paul. 1987. Pricing to Market when the Exchange Rate Changes. In Real- Financial Linkages among Open Economies, ed. S . W. Arndt and J. D. Richardson. Cambridge Mass.: MIT Press.
Lichtenberg, Frank R., and Zvi Griliches. 1989. Errors of Measurement in Output Deflators. Journal ofBusiness and Economic Statistics 7( 1): 1-9.
Little, Jane Sneddon. 1987. Intra-Firm trade: An Update. New England Economic Review May/June:46-5 1.
Mann, Catherine L. 1986. Prices, Profit Margins, and Exchange Rates. Federal Re- serve Bulletin 72(6):366-79.
Moffett, Michael H. 1989. The J-Curve Revisited: An Empirical Examination for the United States. Journal of International Money and Finance 8:425-44.
Murphy, Edward E. 1972. A Comparison of the Bureau of Labor Statistics’ Indexes of Export Prices for Selected U.S. Products with Unit Value and Wholesale Price In- dexes. American Statistical Association, Proceedings of the Business and Economic Statistics Section 69:462-67.
National Bureau of Economic Research, Price Statistics Review Committee. 1961. Report on the Price Statistics of the Federal Government. New York.
Page, S. A. B. 1981. The Choice of Invoicing Currency in Merchandise Trade. Na- tional Institute Economic Review 98(November):60-7 1.
Rugman, A. M., and L. Eden. 1985. Multinationals and Transfer Pricing. New York: St. Martins Press.
Shiells, C. R. 1987. Measurement Errors in Unit-Value Proxies for Import Prices. U.S. Department of Labor, Bureau of International Labor Affairs. Economic Dis- cussion Paper no. 24 (December).
Sinclair, James, and Brian Catron. 1990. An Experimental Price Index for the Com- puter Industry. Monthly Labor Review 1 13( 10): 16-24.
United Nations. 1981. Strategies for Price and Quantity Measurement in External Trade. Statistical Paper (series M) no. 69.
U.S. Department of Commerce, Bureau of the Census, Foreign Trade Division. 1989. U.S. Foreign Trade Indexes-Methodology. Typescript (May).
U.S. Department of Commerce, Bureau of Economic Analysis. 1986. Survey of Cur- rent Business 66( l1):35-36.
U.S. Department of Labor, Bureau of Labor Statistics. 1988. BLS Handbook of Meth- ods. Chapter 17, “International Price Indexes,” pp. 138-47.
. 1977. Estimating Price Trends of Industrial Countries’ Exports to OPEC. BLS Bulletin no. 1969.
Whichard, Obie G. 1989. U.S. Multinational Companies: Operations in 1987. Bureau of Economic Analysis, Survey of Current Business 69(6):27-40.

140 William Alterman
Comment Richard C. Marston
This paper compares the export and import price indexes developed over the past fifteen years by the Bureau of Labor Statistics with the unit-value indexes produced over a much longer period by the Department of Commerce. Since the unit-value indexes will be abolished shortly, the paper can be viewed in one of two ways. First, it is serving the valuable purpose of putting nails in the coffin of the unit-value indexes. Alterman has developed a clear case es- tablishing why the BLS indexes are superior, and therefore why resources should be directed toward improving and extending them. But in addition, Alterman is helping to assess how misleading it may be to use unit-value in- dexes for past years. Since the BLS coverage is so spotty before 1980 and even before 1985, we have to use unit-value series to analyze the earlier pe- riod. So it is useful to emphasize how faulty the alternative unit-value series can be. Alterman’s study thus is a valuable one; it should become a standard reference for research involving U.S. export and import prices.
I would like to add parenthetically that what puzzles me is why the U.S. government took so long to provide price indexes for exports and imports. The German and Japanese governments were years ahead of BLS in develop- ing a full range of export-price indexes. Indeed, it wasn’t until 1983 that BLS extended its coverage to all of manufacturing. Yet reports dating back to the early 1960s and academic research such as the 1971 study by Kravis and Lip- sey presented clearcut cases for using genuine price indexes rather than unit- value series. ’
Alterman uses data for the period from 1985 to 1989 to show how much difference there is between the two sets of price series. For most imports, the BLS series rises much more sharply than the unit-value series over this period. How important is the difference? Alterman shows that using the BLS series reduces the U.S. trade deficit in real terms for the second quarter of 1989 to $98.8 billion, rather than $128.4 billion if unit-value series are used to deflate trade in nominal terms.
Alterman investigates why the price series diverge so much. One reason may be that the BLS series uses base period weights, whereas the unit-value series uses Fisher-linked indexes. How important is the choice of weighting scheme? Does the fact that the BLS uses 1985 weights instead of current weights or Fisher-linked weights account for much of the deviation between the two series from 1985 to 1989? Alterman provides an answer to this ques- tion by reweighting the BLS series using 1988 rather than 1985 trade flows for weights. He finds that the 1988-weighted import series increase more than the 1985-weighted series. So the discrepancy between the BLS series and
Richard C. Marston is the James R. F. Guy Professor of Finance and Economics at the Wharton
1. Irving B. Kravis and Robert E. Lipsey, Price Competitiveness in World Trade, Studies in School of the University of Pennsylvania.
International Economic Relations, no. 6 (University Microfilms).
141 Price Trends in U.S. Trade
unit-value series cannot be attributed to the use of base period weights in the former.
So what accounts for the greater rise in the BLS series? The answer to this question remains a puzzle. One possible way to approach the question would be to compare unit-value series for a few individual industries with specially constructed BLS series, using the same weighting scheme as in the unit-value series. In that case, the weighting scheme is common to both series, so we can assess the importance of using genuine price indexes rather than unit- value data. Using detailed industry-level data, it may be possible to determine the biases introduced in the unit-value series by neglecting changes in product composition.
Alterman uses the BLS series to examine pass-through behavior in the 1980s. During this decade, fluctuations of the dollar have had a greater impact on U.S. competitiveness than has any other factor. So it is important to be able to use export and import price series to determine the impact of exchange-rate changes on relative prices. Alterman provides estimates of pass-through rates for U.S. imports and exports across a number of commodity categories. The pass-through rates are defined as the ratio of the percentage change in the import or export prices to the percentage change in the exchange rate times the exporting country’s consumer price index (as a proxy for production costs). The foreign-exchange rates and foreign consumer price indexes used are weighted averages constructed from data for 63 countries.
Because so many countries are included, it is necessary to use consumer price indexes as a proxy for costs. Consumer price indexes have obvious dis- advantages for this purpose, since over half of the commodities included in the indexes are not even traded. But if Alterman had used wholesale price indexes for manufacturing or unit labor costs, the set of countries would have had to be narrowed considerably. Nevertheless, I would have preferred using the narrower indexes where available, and the consumer price indexes for other countries.
Alterman provides an interesting comparison between pass-through rates for U.S. imports and exports in table 4.5. The table shows that foreign ex- porters generally passed through a much smaller proportion of the dollar’s recent depreciation than did American exporters. In the period from March 1985 to December 1988, the prices of American imports in dollars generally rose less than half as much as the change in the exchange rate, while many of the prices of American exports in foreign currency rose proportionately. Al- terman suggests two reasons for the difference. First, both American and for- eign firms may behave asymmetrically, passing through most of a depreciation of their currency, but passing through only a fraction of an appreciation. Sec- ond, American firms may pass through more than do foreign firms, regardless of the direction of the exchange-rate change.
Alterman looks for an asymmetric pattern of pass-throughs by comparing a period of dollar depreciation, September 1980 to March 1985, with a period

142 William Alterman
of dollar appreciation, March 1985 to December 1988. In all ten import sec- tors for which price data are available for both periods, the pass-through rates are greater in the second period of dollar appreciation. But because the BLS series cover only about half of the sectors in the earlier period, the comparison between periods remains incomplete.
Using table 4.5, it is also possible to look for asymmetries between Amer- ican and foreign behavior in periods when the exporter’s currency appre- ciated. That is, pass-through rates for U.S. exports in the early 1980s, when the dollar appreciated, can be compared with pass-through rates for U.S. im- ports in the late 1980s, when foreign currencies appreciated. In all eight sec- tors for which BLS series are reported for the earlier period, the pass-through rates are larger for U.S. exports (for 1980-85) than for imports from foreign countries (for 1985-88). So differences in pass-through arise from two sources: differences in behavior in appreciations and depreciations and differ- ences in behavior between U.S. and foreign firms.
One drawback of the pass-through effects that are estimated, however, is that they reflect two different influences on prices. Take the example of foreign exports to the United States. If foreign prices rise less than proportionately to the exchange rate, then this may be due to declines in costs abroad (that is, declines that are not adequately reflected in movements in consumer prices). In Japan, the costs of imported materials declined by one-half in yen terms, thus reducing Japanese costs of producing finished products, when the dollar appreciated after March 1985. Japanese consumer prices fell much less. But less than complete pass-throughs of foreign export prices may also be due to price discrimination or what has been called “pricing to market.” Foreign firms may reduce their export prices in their own currency relative to the price of exportables sold in the firms’ own market. In both cases, export prices in dollars rise less than proportionately to a depreciation of the dollar. But it would be useful to know the relative importance of each type of influence. As Alterman notes, consumer price indexes at best capture only part of the move- ment in costs within the exporter’s country. Moreover, the behavior of costs may differ widely across sectors.
In the case of U.S. exports, we can study pricing to market directly by examining how export prices move relative to the domestic prices for the same products. My study of Japanese pricing to market shows one way to pursue such an investigation.2 If such a price comparison is done at the sectoral level, the composition of the exports and domestic products will differ somewhat, but an examination of this ratio will still be instructive.
In the case of U.S. imports, it isn’t possible to obtain national price series disaggregated by sector for each foreign country. It is important to note, how- ever, that pass-through elasticities we see in table 4.5 may overstate the degree of pricing to market actually occurring. In any case, it is safe to say that the
2. Richard C. Marston, “Pricing to Market in Japanese Manufacturing,” Journal of Interna- rional Economics 29, no. 3/4 (November 1990):217-36.
143 Price Trends in U.S. Trade
inadequacy of foreign price data prevents us from fully understanding price behavior followed by foreign firms.
At the end of the paper, Alterman reports on several new price series being developed by BLS, including monthly rather than quarterly price indexes, indexes by country of origin, and indexes for some types of trade in services. Judging by the improvements in the BLS series that have already taken place and those that are planned for the future, we have moved far beyond the unit- value series of the past. All researchers on international trade should applaud BLS’s efforts.
Copyright © 2022 FDOKUMEN