Interleukin6 Signaling in Liver-Parenchymal Cells Suppresses Hepatic Inflammation and Improves...
13
Cell Metabolism Article Interleukin-6 Signaling in Liver-Parenchymal Cells Suppresses Hepatic Inflammation and Improves Systemic Insulin Action F. Thomas Wunderlich, 1,6 Peter Stro ¨ hle, 1,6 A. Christine Ko ¨ nner, 1 Sabine Gruber, 1 Sulay Tovar, 1 Hella S. Bro ¨ nneke, 2 Lisa Juntti-Berggren, 3 Luo-Sheng Li, 3 Nico van Rooijen, 4 Claude Libert, 5 Per-Olof Berggren, 3 and Jens C. Bru ¨ ning 1, * 1 Institute for Genetics, University of Cologne, Cologne Excellence Cluster on Cellular Stress Responses in Aging-Associated Diseases (CECAD), Center of Molecular Medicine Cologne (CMMC), 2nd Department for Internal Medicine University Hospital Cologne and Max Planck Institute for the Biology of Ageing, D-50674 Cologne, Germany 2 Phenotyping Facility of the Cologne Excellence Cluster on Cellular Stress Responses in Aging-Associated Diseases (CECAD), D-50674 Cologne, Germany 3 Rolf Luft Research Center for Diabetes and Endocrinology, Karolinska Institute, SE-171 77 Stockholm, Sweden 4 Department of Molecular Cell Biology, Vrije Universiteit, N-1081 Amsterdam, The Netherlands 5 Department for Molecular Biomedical Research, Flanders Institute for Biotechnology, University Ghent, B-9052 Ghent, Belgium 6 These authors contributed equally to this work *Correspondence: [email protected] DOI 10.1016/j.cmet.2010.06.011 SUMMARY The contribution of interleukin (IL)-6 signaling in obesity-induced inflammation remains controversial. To specifically define the role of hepatic IL-6 sig- naling in insulin action and resistance, we have generated mice with hepatocyte-specific IL-6 recep- tor (IL-6R) a deficiency (IL-6Ra L-KO mice). These animals showed no alterations in body weight and fat content but exhibited a reduction in insulin sensitivity and glucose tolerance. Impaired glucose metabolism originated from attenuated insulin-stim- ulated glucose transport in skeletal muscle and fat. Surprisingly, hepatic IL-6Ra-disruption caused an exaggerated inflammatory response during euglyce- mic hyperinsulinemic clamp analysis, as revealed by increased expression of IL-6, TNF-a, and IL-10, as well as enhanced activation of inflammatory sig- naling such as phosphorylation of IkBa. Neutraliza- tion of TNF-a or ablation of Kupffer cells restored glucose tolerance in IL-6Ra L-KO mice. Thus, our results reveal an unexpected role for hepatic IL-6 signaling to limit hepatic inflammation and to protect from local and systemic insulin resistance. INTRODUCTION Obesity-associated insulin resistance develops in the presence of activated inflammatory signaling in white adipose tissue (WAT), liver, skeletal muscle, and even in the central nervous system (CNS) (Cai et al., 2005; Hotamisligil et al., 1993; Kleinrid- ders et al., 2009; Plomgaard et al., 2005; Zhang et al., 2008). During obesity development, infiltration of immune cells such as macrophages and T-lymphocytes into WAT leads to increased secretion of tumor necrosis factor (TNF)-a and inter- leukin-6 (IL-6) (Nishimura et al., 2009; Xu et al., 2003). Whereas activation of TNF-a-inducible kinases in insulin target tissues impairs insulin signal transduction (Aguirre et al., 2000; Arkan et al., 2005; Cai et al., 2005; Hirosumi et al., 2002), the function of IL-6 in this context is not yet fully elucidated and is controver- sially debated (Pedersen and Febbraio, 2007). IL-6 serum levels are increased in obesity (Bastard et al., 2000), and IL-6 injection can cause hepatic insulin resistance mediated by IL-6-induced expression of suppressor of cytokine signaling (SOCS) 3 (Klover et al., 2003). Moreover, IL-6 infusion during euglycemic hyperinsulinemic clamp analysis caused reduced glucose infusion rates, indicating that IL-6 indeed causes insulin resistance (Kim et al., 2004). Similarly, blocking IL-6 action via application of neutralizing antibodies improved glucose tolerance and insulin sensitivity in mice with liver- specific overactivation of NFkB signaling (Cai et al., 2005). Strik- ingly, though these studies are in line with IL-6 causing insulin resistance and increased IL-6 concentrations and action con- tributing to the development of obesity-associated insulin resis- tance, numerous studies and independent approaches indicate that IL-6 may also improve glucose metabolism. Acute IL-6 stim- ulation leads to activation of AMP-dependent kinase (AMPK) by a yet undetermined mechanism and thus results in increased glucose uptake and b oxidation (Carey et al., 2006). Furthermore, IL-6 injection increased whole-body insulin sensitivity and improved glucose tolerance in a more recent study (Holmes et al., 2008). Of interest, central insulin action results in hepatic IL-6 release, leading to the activation of signal transducer and activator of transcription (Stat) 3-dependent signaling in hepato- cytes to inhibit expression of genes required for hepatic glu- cose production, such as glucose-6-phosphatase (G6Pase) and phosphoenolpyruvate carboxykinase (Inoue et al., 2006). It has been demonstrated that this effect depends on insulin action in agouti-related peptide-expressing neurons (Ko ¨ nner et al., 2007), which are essential for control of energy homeo- stasis, food intake, and glucose metabolism (Gropp et al., 2005; Plum et al., 2006). Moreover, IL-6 knockout mice devel- oped mature onset obesity under some conditions (Wallenius Cell Metabolism 12, 237–249, September 8, 2010 ª2010 Elsevier Inc. 237
Transcript of Interleukin6 Signaling in Liver-Parenchymal Cells Suppresses Hepatic Inflammation and Improves...
Cell Metabolism
Article
Interleukin-6 Signaling in Liver-ParenchymalCells Suppresses Hepatic Inflammationand Improves Systemic Insulin ActionF. Thomas Wunderlich,1,6 Peter Strohle,1,6 A. Christine Konner,1 Sabine Gruber,1 Sulay Tovar,1 Hella S. Bronneke,2
Lisa Juntti-Berggren,3 Luo-Sheng Li,3 Nico van Rooijen,4 Claude Libert,5 Per-Olof Berggren,3 and Jens C. Bruning1,*1Institute for Genetics, University of Cologne, Cologne Excellence Cluster on Cellular Stress Responses in Aging-Associated Diseases
(CECAD), Center of Molecular Medicine Cologne (CMMC), 2nd Department for Internal Medicine University Hospital Cologne andMax PlanckInstitute for the Biology of Ageing, D-50674 Cologne, Germany2Phenotyping Facility of the Cologne Excellence Cluster on Cellular Stress Responses in Aging-Associated Diseases (CECAD),
D-50674 Cologne, Germany3Rolf Luft Research Center for Diabetes and Endocrinology, Karolinska Institute, SE-171 77 Stockholm, Sweden4Department of Molecular Cell Biology, Vrije Universiteit, N-1081 Amsterdam, The Netherlands5Department for Molecular Biomedical Research, Flanders Institute for Biotechnology, University Ghent, B-9052 Ghent, Belgium6These authors contributed equally to this work
*Correspondence: [email protected] 10.1016/j.cmet.2010.06.011
SUMMARY
The contribution of interleukin (IL)-6 signaling inobesity-induced inflammation remains controversial.To specifically define the role of hepatic IL-6 sig-naling in insulin action and resistance, we havegenerated mice with hepatocyte-specific IL-6 recep-tor (IL-6R) a deficiency (IL-6RaL-KO mice). Theseanimals showed no alterations in body weight andfat content but exhibited a reduction in insulinsensitivity and glucose tolerance. Impaired glucosemetabolism originated from attenuated insulin-stim-ulated glucose transport in skeletal muscle and fat.Surprisingly, hepatic IL-6Ra-disruption caused anexaggerated inflammatory response during euglyce-mic hyperinsulinemic clamp analysis, as revealedby increased expression of IL-6, TNF-a, and IL-10,as well as enhanced activation of inflammatory sig-naling such as phosphorylation of IkBa. Neutraliza-tion of TNF-a or ablation of Kupffer cells restoredglucose tolerance in IL-6RaL-KO mice. Thus, ourresults reveal an unexpected role for hepatic IL-6signaling to limit hepatic inflammation and to protectfrom local and systemic insulin resistance.
INTRODUCTION
Obesity-associated insulin resistance develops in the presence
of activated inflammatory signaling in white adipose tissue
(WAT), liver, skeletal muscle, and even in the central nervous
system (CNS) (Cai et al., 2005; Hotamisligil et al., 1993; Kleinrid-
ders et al., 2009; Plomgaard et al., 2005; Zhang et al., 2008).
During obesity development, infiltration of immune cells such
as macrophages and T-lymphocytes into WAT leads to
increased secretion of tumor necrosis factor (TNF)-a and inter-
Cell Me
leukin-6 (IL-6) (Nishimura et al., 2009; Xu et al., 2003). Whereas
activation of TNF-a-inducible kinases in insulin target tissues
impairs insulin signal transduction (Aguirre et al., 2000; Arkan
et al., 2005; Cai et al., 2005; Hirosumi et al., 2002), the function
of IL-6 in this context is not yet fully elucidated and is controver-
sially debated (Pedersen and Febbraio, 2007).
IL-6 serum levels are increased in obesity (Bastard et al.,
2000), and IL-6 injection can cause hepatic insulin resistance
mediated by IL-6-induced expression of suppressor of cytokine
signaling (SOCS) 3 (Klover et al., 2003). Moreover, IL-6 infusion
during euglycemic hyperinsulinemic clamp analysis caused
reduced glucose infusion rates, indicating that IL-6 indeed
causes insulin resistance (Kim et al., 2004). Similarly, blocking
IL-6 action via application of neutralizing antibodies improved
glucose tolerance and insulin sensitivity in mice with liver-
specific overactivation of NFkB signaling (Cai et al., 2005). Strik-
ingly, though these studies are in line with IL-6 causing insulin
resistance and increased IL-6 concentrations and action con-
tributing to the development of obesity-associated insulin resis-
tance, numerous studies and independent approaches indicate
that IL-6may also improve glucosemetabolism. Acute IL-6 stim-
ulation leads to activation of AMP-dependent kinase (AMPK) by
a yet undetermined mechanism and thus results in increased
glucose uptake and b oxidation (Carey et al., 2006). Furthermore,
IL-6 injection increased whole-body insulin sensitivity and
improved glucose tolerance in a more recent study (Holmes
et al., 2008). Of interest, central insulin action results in hepatic
IL-6 release, leading to the activation of signal transducer and
activator of transcription (Stat) 3-dependent signaling in hepato-
cytes to inhibit expression of genes required for hepatic glu-
cose production, such as glucose-6-phosphatase (G6Pase)
and phosphoenolpyruvate carboxykinase (Inoue et al., 2006).
It has been demonstrated that this effect depends on insulin
action in agouti-related peptide-expressing neurons (Konner
et al., 2007), which are essential for control of energy homeo-
stasis, food intake, and glucose metabolism (Gropp et al.,
2005; Plum et al., 2006). Moreover, IL-6 knockout mice devel-
oped mature onset obesity under some conditions (Wallenius
tabolism 12, 237–249, September 8, 2010 ª2010 Elsevier Inc. 237
Cell Metabolism
Hepatic IL-6 Signaling Improves Insulin Action
et al., 2002), whereas other investigators did not find an effect of
IL-6 on body weight control (Chida et al., 2006; Di Gregorio et al.,
2004). However, more recently, it was demonstrated that over-
expression of human IL-6 in mice improves insulin sensitivity
(Sadagurski et al., 2010).
Taken together, the role of IL-6 action in obesity-associated
insulin resistance remains highly controversial, and the effect
of IL-6 signaling in individual tissues with respect to control of
glucose and energy homeostasis has not been addressed so
far. Here, we show that mice with hepatic deficiency of IL-6
receptor a (IL-6Ra) develop insulin resistance not only in liver,
but also in skeletal muscle andWAT. Systemic insulin resistance
in IL-6RaL-KO mice develops in the presence of an exaggerated
inflammatory response in liver and muscle. Depletion of TNF-a
or liver-resident Kupffer cells in themutantmice restores glucose
homeostasis and insulin sensitivity to normal. Thus, our results
reveal a function for hepatic IL-6 action to limit local but also
systemic inflammation originating from Kupffer cell activation
to prevent insulin resistance.
RESULTS
Generation of IL-6RaL-KO MiceTo determine the specific role of hepatocyte-autonomous IL-6
signaling in control of glucose homeostasis, i.e., insulin action
and the development of insulin resistance, we aimed to generate
mice with a conditionally inactivatable IL-6Ra allele. To this end,
we generated a targeting vector, in which exons 2 and 3 of the
IL-6Ra gene were flanked by loxP sites (Figure 1A). After electro-
poration of this vector in C57/BL6-derived Bruce-4 embryonic
stem (ES) cells, correctly targeted ES cell clones were identified
by Southern blot analysis (Figure 1B). Homologous recombinant
ES cell clones, which still contained a FRT site-flanked neomycin
resistance gene, were used to generate mice carrying the
IL-6RaFL-neo allele (Figure 1A). These mice were crossed with
mice expressing the Flp recombinase in the germline (Rodrıguez
et al., 2000) to remove the neomycin resistance gene and to yield
IL-6RaFL mice (Figure 1A). IL-6RaFL mice were crossed with
ALFP-Cre mice (Kellendonk et al., 2000), and double heterozy-
gous animals were further intercrossed to yield IL-6RaFL/FL
ALFP-Cre, i.e., hepatocyte-specific IL-6Ra knockout mice on
a C57/BL6 background (IL-6RaL-KO).
To investigate deletion efficiency and specificity of the loxP-
flanked IL-6Ra allele in these mice, we performed Southern
blot analyses on genomic DNA isolated from liver, WAT, skeletal
muscle, and tails of IL-6RaL-KO and control mice. This analysis
revealed efficient Cre-mediated recombination of the conditional
IL-6Ra allele exclusively in liver of IL-6RaL-KO mice, but not in
other organs (Figure 1C). Moreover, to directly determine hepatic
IL-6 responsiveness, we performed IL-6 injections into the vena
cava of anesthetized control and IL-6RaL-KO mice and analyzed
tyrosine phosphorylation of Stat-3. Whereas IL-6 injection
resulted in robust phosphorylation of Stat-3 in liver of con-
trol mice, this response was dramatically blunted in liver of
IL-6RaL-KO mice (Figure 1D). The residual IL-6-stimulated
Stat-3 phosphorylation in liver of IL-6RaL-KO mice most likely
arises from IL-6 responsiveness of the liver-resident Kupffer
cells, which are not affected by the ALFP-Cre transgene. Finally,
determination of IL-6Ra gene expression from livers of control
238 Cell Metabolism 12, 237–249, September 8, 2010 ª2010 Elsevie
and IL-6RaL-KO mice by real-time PCR demonstrated nearly
complete absence of IL-6Ra mRNA expression in IL-6RaL-KO
mice (Figure 1E).
The IL-6Ra chain exists in a membrane-bound and in
a cleaved, soluble form (sIL-6Ra), the latter of which also renders
cell types IL-6 responsive that do not express IL-6Ra (Mackie-
wicz et al., 1995). To investigate the contribution of hepato-
cyte-derived IL-6Ra to the bioavailability of sIL-6Ra, we deter-
mined serum sIL-6Ra concentrations in control and IL-6RaL-KO
mice (Figure 1F). However, this analysis revealed similar abun-
dance of the sIL-6Ra in both control and IL-6RaL-KO mice, indi-
cating that hepatocyte-specific inactivation of IL-6Ra does not
affect circulating sIL-6Ra concentrations. Moreover, ablation of
hepatic IL-6Ra expression had no effect on liver weight and his-
tomorphological appearance, as revealed by hematoxylin and
eosin (H&E) staining (Figures 1G and 1H). In summary, these
experiments unequivocally demonstrate the successful genera-
tion of hepatocyte-specific IL-6Ra knockout mice.
IL-6RaL-KO Mice Exhibit Unaltered Energy HomeostasisConventional IL-6 knockout mice—at least in some studies—
present with mature onset obesity; however, it is not clear in
which organ lack of IL-6 signaling may lead to the development
of obesity (Wallenius et al., 2002). To determine whether IL-6
signaling in liver affects energy homeostasis, we first analyzed
body weight of control mice and IL-6RaL-KO mice from 3 to
19 weeks of age. However, these experiments revealed no dif-
ference in body weight of IL-6RaL-KO mice when compared to
controls (Figure 2A). Similarly, body fat content and epigonadal
fat pad mass remained unchanged in IL-6RaL-KO compared to
control mice (Figure 2B). Moreover, as an indirect measure of
fat content, serum leptin concentrations were comparable
between control and IL-6RaL-KO mice (Figure 2C). In line with
these observations, IL-6RaL-KO mice ingested similar amounts
of food as compared to controls (Figure 2D). Furthermore, O2
consumption and CO2 production were not altered by hepato-
cyte-specific disruption of IL-6Ra, as assessed by indirect calo-
rimetrie (Figures 2E and 2F). Moreover, the respiratory exchange
ratio was comparable between control and IL-6RaL-KO mice
(Figure 2G). Finally, IL-6RaL-KO mice exhibited no detectable
alterations in locomotor activity (Figure 2H). Taken together,
hepatocyte-specific disruption of IL-6Ra signaling does not
result in alterations of body weight, adiposity, and energy
homeostasis.
Impaired Glucose Homeostasis in IL-6RaL-KO MiceNext, we assessed key parameters of glucose homeostasis in
control and IL-6RaL-KO mice. This analysis revealed unaltered
blood glucose concentrations in IL-6RaL-KO mice compared
to controls (Figure 3A). Strikingly, however, when we subjected
IL-6RaL-KO mice to glucose tolerance tests (GTT), these mice
exhibited significantly impaired glucose tolerance compared
to their control littermates (Figure 3B). To distinguish whether
impaired glucose tolerance in IL-6RaL-KO mice arises from
decreased glucose-stimulated insulin secretion or as a result
of insulin resistance, we next measured serum insulin concen-
trations during the GTT (Figure 3C). However, glucose-stimu-
lated insulin secretion was not significantly altered in IL-6RaL-KO
mice compared to controls. Also, pancreatic islet mass was
r Inc.
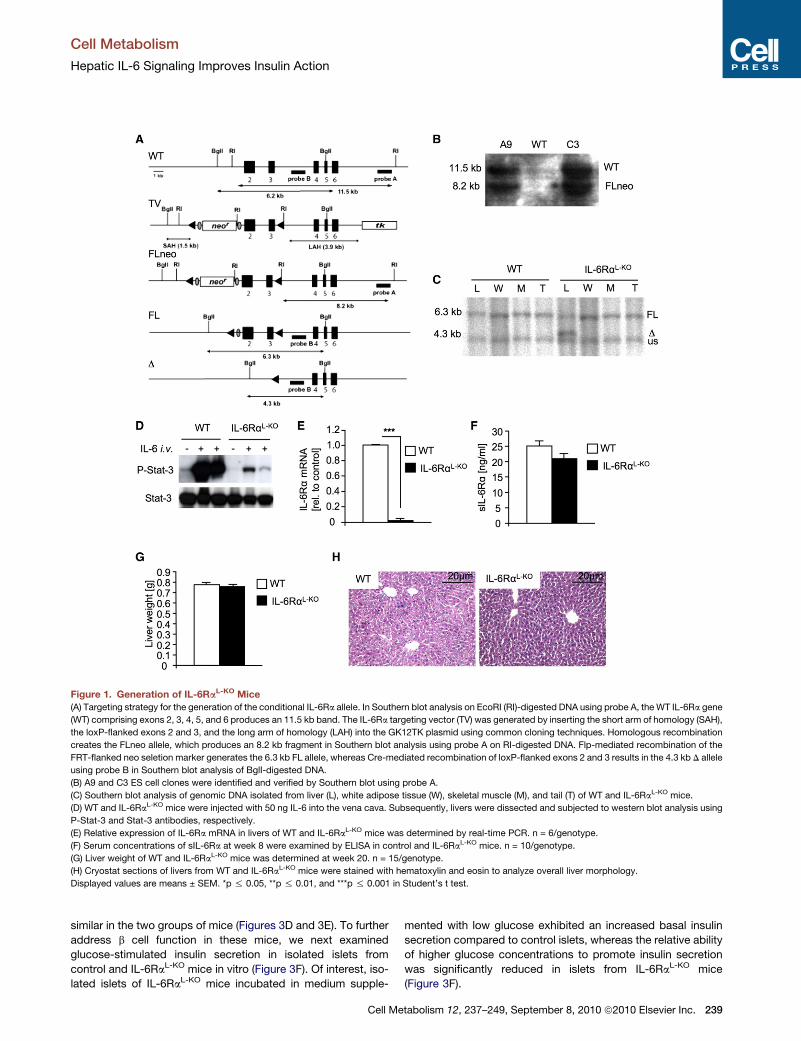
Figure 1. Generation of IL-6RaL-KO Mice(A) Targeting strategy for the generation of the conditional IL-6Ra allele. In Southern blot analysis on EcoRI (RI)-digested DNA using probe A, theWT IL-6Ra gene
(WT) comprising exons 2, 3, 4, 5, and 6 produces an 11.5 kb band. The IL-6Ra targeting vector (TV) was generated by inserting the short arm of homology (SAH),
the loxP-flanked exons 2 and 3, and the long arm of homology (LAH) into the GK12TK plasmid using common cloning techniques. Homologous recombination
creates the FLneo allele, which produces an 8.2 kb fragment in Southern blot analysis using probe A on RI-digested DNA. Flp-mediated recombination of the
FRT-flanked neo seletion marker generates the 6.3 kb FL allele, whereas Cre-mediated recombination of loxP-flanked exons 2 and 3 results in the 4.3 kb D allele
using probe B in Southern blot analysis of BglI-digested DNA.
(B) A9 and C3 ES cell clones were identified and verified by Southern blot using probe A.
(C) Southern blot analysis of genomic DNA isolated from liver (L), white adipose tissue (W), skeletal muscle (M), and tail (T) of WT and IL-6RaL-KO mice.
(D) WT and IL-6RaL-KO mice were injected with 50 ng IL-6 into the vena cava. Subsequently, livers were dissected and subjected to western blot analysis using
P-Stat-3 and Stat-3 antibodies, respectively.
(E) Relative expression of IL-6Ra mRNA in livers of WT and IL-6RaL-KO mice was determined by real-time PCR. n = 6/genotype.
(F) Serum concentrations of sIL-6Ra at week 8 were examined by ELISA in control and IL-6RaL-KO mice. n = 10/genotype.
(G) Liver weight of WT and IL-6RaL-KO mice was determined at week 20. n = 15/genotype.
(H) Cryostat sections of livers from WT and IL-6RaL-KO mice were stained with hematoxylin and eosin to analyze overall liver morphology.
Displayed values are means ± SEM. *p % 0.05, **p % 0.01, and ***p % 0.001 in Student’s t test.
Cell Metabolism
Hepatic IL-6 Signaling Improves Insulin Action
similar in the two groups of mice (Figures 3D and 3E). To further
address b cell function in these mice, we next examined
glucose-stimulated insulin secretion in isolated islets from
control and IL-6RaL-KO mice in vitro (Figure 3F). Of interest, iso-
lated islets of IL-6RaL-KO mice incubated in medium supple-
Cell Me
mented with low glucose exhibited an increased basal insulin
secretion compared to control islets, whereas the relative ability
of higher glucose concentrations to promote insulin secretion
was significantly reduced in islets from IL-6RaL-KO mice
(Figure 3F).
tabolism 12, 237–249, September 8, 2010 ª2010 Elsevier Inc. 239
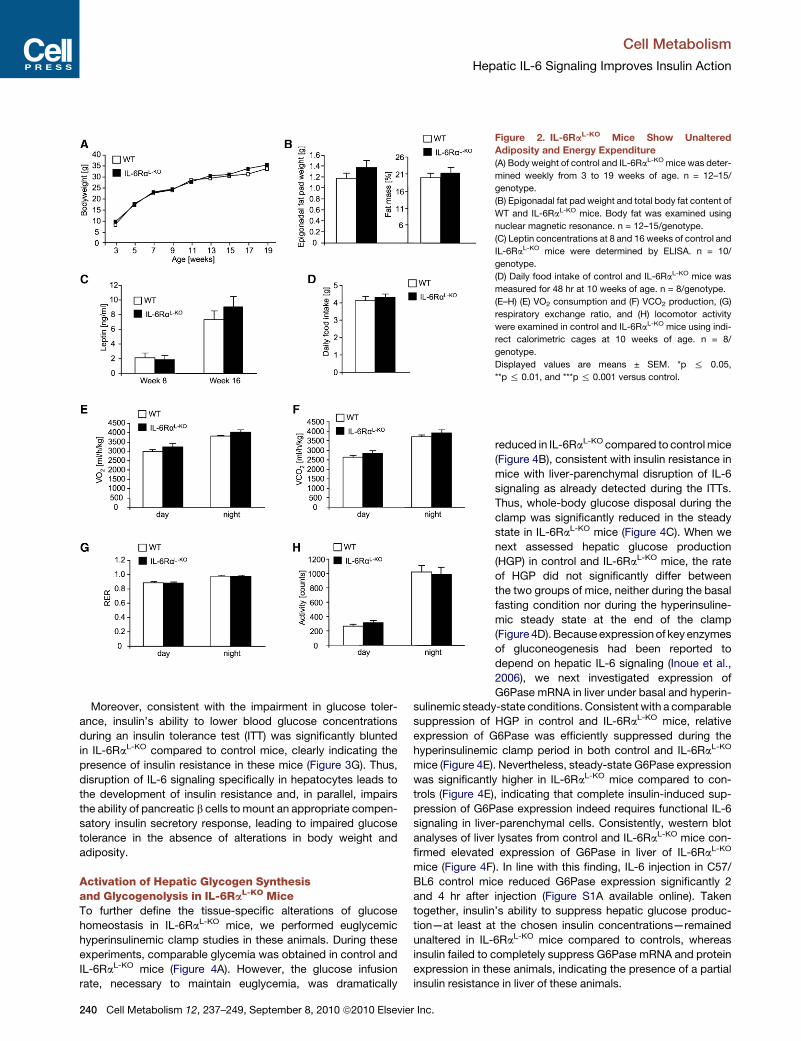
Figure 2. IL-6RaL-KO Mice Show Unaltered
Adiposity and Energy Expenditure
(A) Body weight of control and IL-6RaL-KO mice was deter-
mined weekly from 3 to 19 weeks of age. n = 12–15/
genotype.
(B) Epigonadal fat pad weight and total body fat content of
WT and IL-6RaL-KO mice. Body fat was examined using
nuclear magnetic resonance. n = 12–15/genotype.
(C) Leptin concentrations at 8 and 16 weeks of control and
IL-6RaL-KO mice were determined by ELISA. n = 10/
genotype.
(D) Daily food intake of control and IL-6RaL-KO mice was
measured for 48 hr at 10 weeks of age. n = 8/genotype.
(E–H) (E) VO2 consumption and (F) VCO2 production, (G)
respiratory exchange ratio, and (H) locomotor activity
were examined in control and IL-6RaL-KO mice using indi-
rect calorimetric cages at 10 weeks of age. n = 8/
genotype.
Displayed values are means ± SEM. *p % 0.05,
**p % 0.01, and ***p % 0.001 versus control.
Cell Metabolism
Hepatic IL-6 Signaling Improves Insulin Action
Moreover, consistent with the impairment in glucose toler-
ance, insulin’s ability to lower blood glucose concentrations
during an insulin tolerance test (ITT) was significantly blunted
in IL-6RaL-KO compared to control mice, clearly indicating the
presence of insulin resistance in these mice (Figure 3G). Thus,
disruption of IL-6 signaling specifically in hepatocytes leads to
the development of insulin resistance and, in parallel, impairs
the ability of pancreatic b cells to mount an appropriate compen-
satory insulin secretory response, leading to impaired glucose
tolerance in the absence of alterations in body weight and
adiposity.
Activation of Hepatic Glycogen Synthesisand Glycogenolysis in IL-6RaL-KO MiceTo further define the tissue-specific alterations of glucose
homeostasis in IL-6RaL-KO mice, we performed euglycemic
hyperinsulinemic clamp studies in these animals. During these
experiments, comparable glycemia was obtained in control and
IL-6RaL-KO mice (Figure 4A). However, the glucose infusion
rate, necessary to maintain euglycemia, was dramatically
240 Cell Metabolism 12, 237–249, September 8, 2010 ª2010 Elsevie
s
s
e
h
m
w
tr
p
s
a
fi
m
B
a
to
ti
u
in
e
in
r Inc.
reduced in IL-6RaL-KO compared to controlmice
(Figure 4B), consistent with insulin resistance in
mice with liver-parenchymal disruption of IL-6
signaling as already detected during the ITTs.
Thus, whole-body glucose disposal during the
clamp was significantly reduced in the steady
state in IL-6RaL-KO mice (Figure 4C). When we
next assessed hepatic glucose production
(HGP) in control and IL-6RaL-KO mice, the rate
of HGP did not significantly differ between
the two groups of mice, neither during the basal
fasting condition nor during the hyperinsuline-
mic steady state at the end of the clamp
(Figure 4D). Because expression of key enzymes
of gluconeogenesis had been reported to
depend on hepatic IL-6 signaling (Inoue et al.,
2006), we next investigated expression of
G6Pase mRNA in liver under basal and hyperin-
ulinemic steady-state conditions. Consistent with a comparable
uppression of HGP in control and IL-6RaL-KO mice, relative
xpression of G6Pase was efficiently suppressed during the
yperinsulinemic clamp period in both control and IL-6RaL-KO
ice (Figure 4E). Nevertheless, steady-state G6Pase expression
as significantly higher in IL-6RaL-KO mice compared to con-
ols (Figure 4E), indicating that complete insulin-induced sup-
ression of G6Pase expression indeed requires functional IL-6
ignaling in liver-parenchymal cells. Consistently, western blot
nalyses of liver lysates from control and IL-6RaL-KO mice con-
rmed elevated expression of G6Pase in liver of IL-6RaL-KO
ice (Figure 4F). In line with this finding, IL-6 injection in C57/
L6 control mice reduced G6Pase expression significantly 2
nd 4 hr after injection (Figure S1A available online). Taken
gether, insulin’s ability to suppress hepatic glucose produc-
on—at least at the chosen insulin concentrations—remained
naltered in IL-6RaL-KO mice compared to controls, whereas
sulin failed to completely suppress G6Pase mRNA and protein
xpression in these animals, indicating the presence of a partial
sulin resistance in liver of these animals.
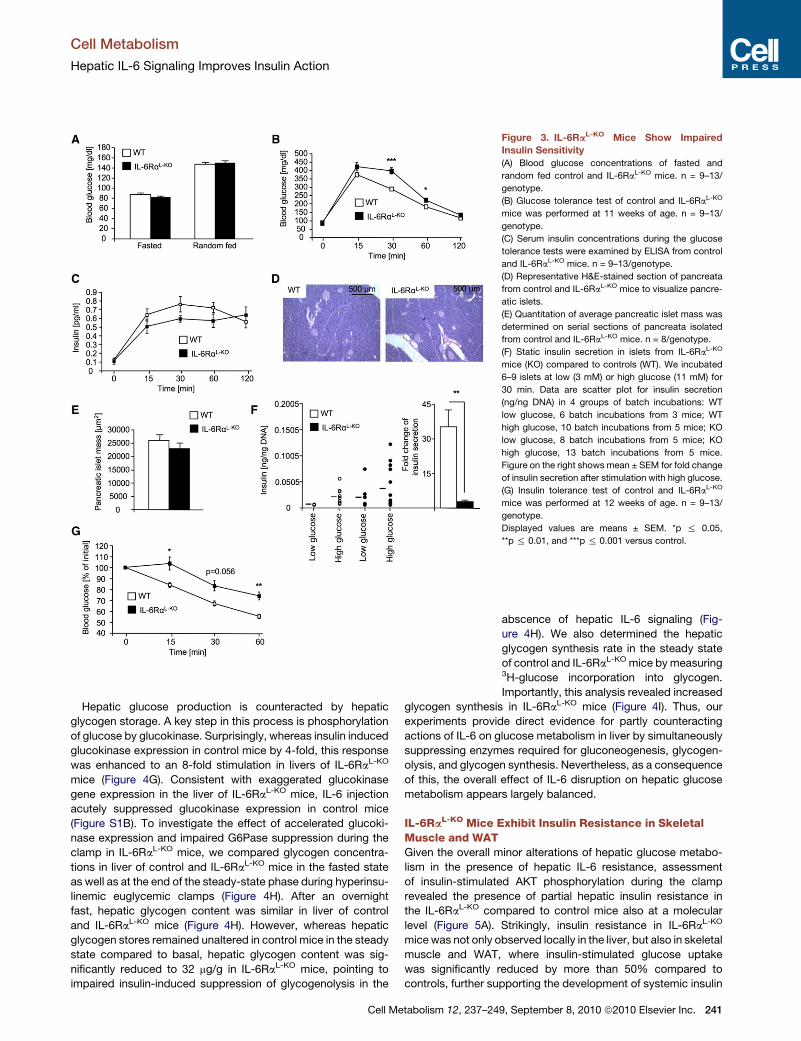
Figure 3. IL-6RaL-KO Mice Show Impaired
Insulin Sensitivity
(A) Blood glucose concentrations of fasted and
random fed control and IL-6RaL-KO mice. n = 9–13/
genotype.
(B) Glucose tolerance test of control and IL-6RaL-KO
mice was performed at 11 weeks of age. n = 9–13/
genotype.
(C) Serum insulin concentrations during the glucose
tolerance tests were examined by ELISA from control
and IL-6RaL-KO mice. n = 9–13/genotype.
(D) Representative H&E-stained section of pancreata
from control and IL-6RaL-KO mice to visualize pancre-
atic islets.
(E) Quantitation of average pancreatic islet mass was
determined on serial sections of pancreata isolated
from control and IL-6RaL-KO mice. n = 8/genotype.
(F) Static insulin secretion in islets from IL-6RaL-KO
mice (KO) compared to controls (WT). We incubated
6–9 islets at low (3 mM) or high glucose (11 mM) for
30 min. Data are scatter plot for insulin secretion
(ng/ng DNA) in 4 groups of batch incubations: WT
low glucose, 6 batch incubations from 3 mice; WT
high glucose, 10 batch incubations from 5 mice; KO
low glucose, 8 batch incubations from 5 mice; KO
high glucose, 13 batch incubations from 5 mice.
Figure on the right shows mean ± SEM for fold change
of insulin secretion after stimulation with high glucose.
(G) Insulin tolerance test of control and IL-6RaL-KO
mice was performed at 12 weeks of age. n = 9–13/
genotype.
Displayed values are means ± SEM. *p % 0.05,
**p % 0.01, and ***p % 0.001 versus control.
Cell Metabolism
Hepatic IL-6 Signaling Improves Insulin Action
Hepatic glucose production is counteracted by hepatic
glycogen storage. A key step in this process is phosphorylation
of glucose by glucokinase. Surprisingly, whereas insulin induced
glucokinase expression in control mice by 4-fold, this response
was enhanced to an 8-fold stimulation in livers of IL-6RaL-KO
mice (Figure 4G). Consistent with exaggerated glucokinase
gene expression in the liver of IL-6RaL-KO mice, IL-6 injection
acutely suppressed glucokinase expression in control mice
(Figure S1B). To investigate the effect of accelerated glucoki-
nase expression and impaired G6Pase suppression during the
clamp in IL-6RaL-KO mice, we compared glycogen concentra-
tions in liver of control and IL-6RaL-KO mice in the fasted state
as well as at the end of the steady-state phase during hyperinsu-
linemic euglycemic clamps (Figure 4H). After an overnight
fast, hepatic glycogen content was similar in liver of control
and IL-6RaL-KO mice (Figure 4H). However, whereas hepatic
glycogen stores remained unaltered in control mice in the steady
state compared to basal, hepatic glycogen content was sig-
nificantly reduced to 32 mg/g in IL-6RaL-KO mice, pointing to
impaired insulin-induced suppression of glycogenolysis in the
Cell Metabolism 12, 237–24
abscence of hepatic IL-6 signaling (Fig-
ure 4H). We also determined the hepatic
glycogen synthesis rate in the steady state
of control and IL-6RaL-KO mice bymeasuring3H-glucose incorporation into glycogen.
Importantly, this analysis revealed increased
glycogen synthesis in IL-6RaL-KO mice (Figure 4I). Thus, our
experiments provide direct evidence for partly counteracting
actions of IL-6 on glucose metabolism in liver by simultaneously
suppressing enzymes required for gluconeogenesis, glycogen-
olysis, and glycogen synthesis. Nevertheless, as a consequence
of this, the overall effect of IL-6 disruption on hepatic glucose
metabolism appears largely balanced.
IL-6RaL-KO Mice Exhibit Insulin Resistance in SkeletalMuscle and WATGiven the overall minor alterations of hepatic glucose metabo-
lism in the presence of hepatic IL-6 resistance, assessment
of insulin-stimulated AKT phosphorylation during the clamp
revealed the presence of partial hepatic insulin resistance in
the IL-6RaL-KO compared to control mice also at a molecular
level (Figure 5A). Strikingly, insulin resistance in IL-6RaL-KO
micewas not only observed locally in the liver, but also in skeletal
muscle and WAT, where insulin-stimulated glucose uptake
was significantly reduced by more than 50% compared to
controls, further supporting the development of systemic insulin
9, September 8, 2010 ª2010 Elsevier Inc. 241
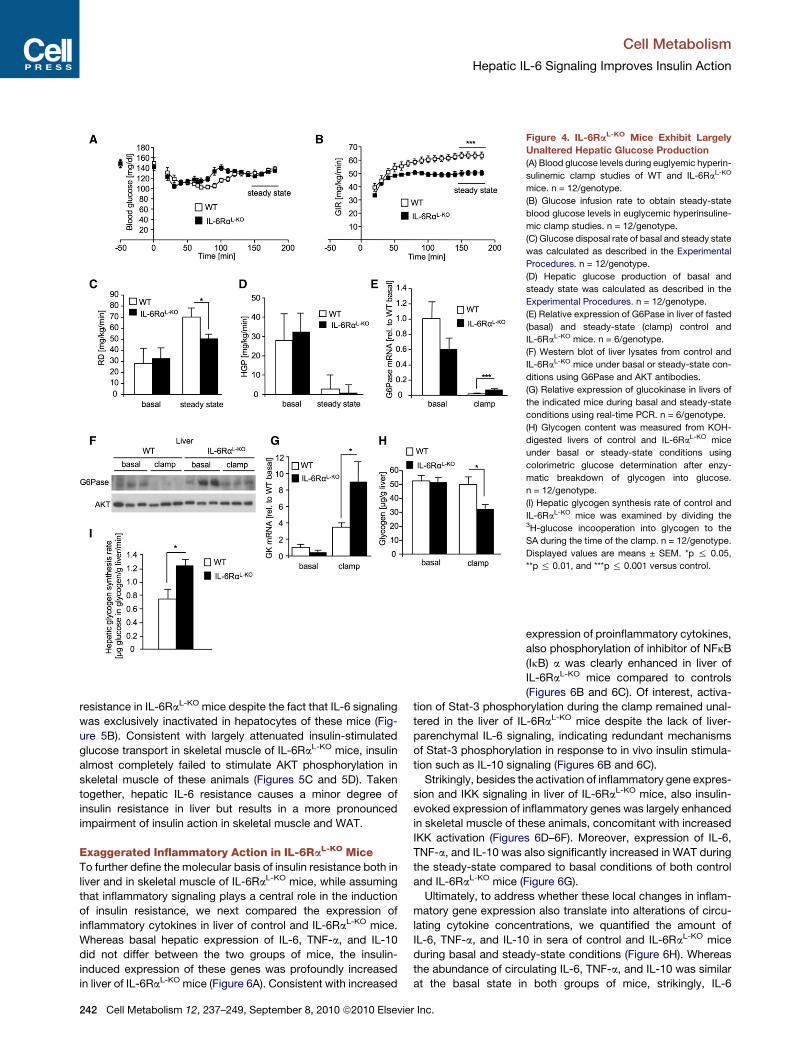
Figure 4. IL-6RaL-KO Mice Exhibit Largely
Unaltered Hepatic Glucose Production
(A) Blood glucose levels during euglyemic hyperin-
sulinemic clamp studies of WT and IL-6RaL-KO
mice. n = 12/genotype.
(B) Glucose infusion rate to obtain steady-state
blood glucose levels in euglycemic hyperinsuline-
mic clamp studies. n = 12/genotype.
(C) Glucose disposal rate of basal and steady state
was calculated as described in the Experimental
Procedures. n = 12/genotype.
(D) Hepatic glucose production of basal and
steady state was calculated as described in the
Experimental Procedures. n = 12/genotype.
(E) Relative expression of G6Pase in liver of fasted
(basal) and steady-state (clamp) control and
IL-6RaL-KO mice. n = 6/genotype.
(F) Western blot of liver lysates from control and
IL-6RaL-KO mice under basal or steady-state con-
ditions using G6Pase and AKT antibodies.
(G) Relative expression of glucokinase in livers of
the indicated mice during basal and steady-state
conditions using real-time PCR. n = 6/genotype.
(H) Glycogen content was measured from KOH-
digested livers of control and IL-6RaL-KO mice
under basal or steady-state conditions using
colorimetric glucose determination after enzy-
matic breakdown of glycogen into glucose.
n = 12/genotype.
(I) Hepatic glycogen synthesis rate of control and
IL-6RaL-KO mice was examined by dividing the3H-glucose incooperation into glycogen to the
SA during the time of the clamp. n = 12/genotype.
Displayed values are means ± SEM. *p % 0.05,
**p % 0.01, and ***p % 0.001 versus control.
Cell Metabolism
Hepatic IL-6 Signaling Improves Insulin Action
resistance in IL-6RaL-KO mice despite the fact that IL-6 signaling
was exclusively inactivated in hepatocytes of these mice (Fig-
ure 5B). Consistent with largely attenuated insulin-stimulated
glucose transport in skeletal muscle of IL-6RaL-KO mice, insulin
almost completely failed to stimulate AKT phosphorylation in
skeletal muscle of these animals (Figures 5C and 5D). Taken
together, hepatic IL-6 resistance causes a minor degree of
insulin resistance in liver but results in a more pronounced
impairment of insulin action in skeletal muscle and WAT.
Exaggerated Inflammatory Action in IL-6RaL-KO MiceTo further define the molecular basis of insulin resistance both in
liver and in skeletal muscle of IL-6RaL-KO mice, while assuming
that inflammatory signaling plays a central role in the induction
of insulin resistance, we next compared the expression of
inflammatory cytokines in liver of control and IL-6RaL-KO mice.
Whereas basal hepatic expression of IL-6, TNF-a, and IL-10
did not differ between the two groups of mice, the insulin-
induced expression of these genes was profoundly increased
in liver of IL-6RaL-KO mice (Figure 6A). Consistent with increased
242 Cell Metabolism 12, 237–249, September 8, 2010 ª2010 Elsevie
ti
te
p
o
ti
s
e
in
IK
T
th
a
m
la
IL
d
th
a
r Inc.
expression of proinflammatory cytokines,
also phosphorylation of inhibitor of NFkB
(IkB) a was clearly enhanced in liver of
IL-6RaL-KO mice compared to controls
(Figures 6B and 6C). Of interest, activa-
on of Stat-3 phosphorylation during the clamp remained unal-
red in the liver of IL-6RaL-KO mice despite the lack of liver-
arenchymal IL-6 signaling, indicating redundant mechanisms
f Stat-3 phosphorylation in response to in vivo insulin stimula-
on such as IL-10 signaling (Figures 6B and 6C).
Strikingly, besides the activation of inflammatory gene expres-
ion and IKK signaling in liver of IL-6RaL-KO mice, also insulin-
voked expression of inflammatory genes was largely enhanced
skeletal muscle of these animals, concomitant with increased
K activation (Figures 6D–6F). Moreover, expression of IL-6,
NF-a, and IL-10 was also significantly increased in WAT during
e steady-state compared to basal conditions of both control
nd IL-6RaL-KO mice (Figure 6G).
Ultimately, to address whether these local changes in inflam-
atory gene expression also translate into alterations of circu-
ting cytokine concentrations, we quantified the amount of
-6, TNF-a, and IL-10 in sera of control and IL-6RaL-KO mice
uring basal and steady-state conditions (Figure 6H). Whereas
e abundance of circulating IL-6, TNF-a, and IL-10 was similar
t the basal state in both groups of mice, strikingly, IL-6
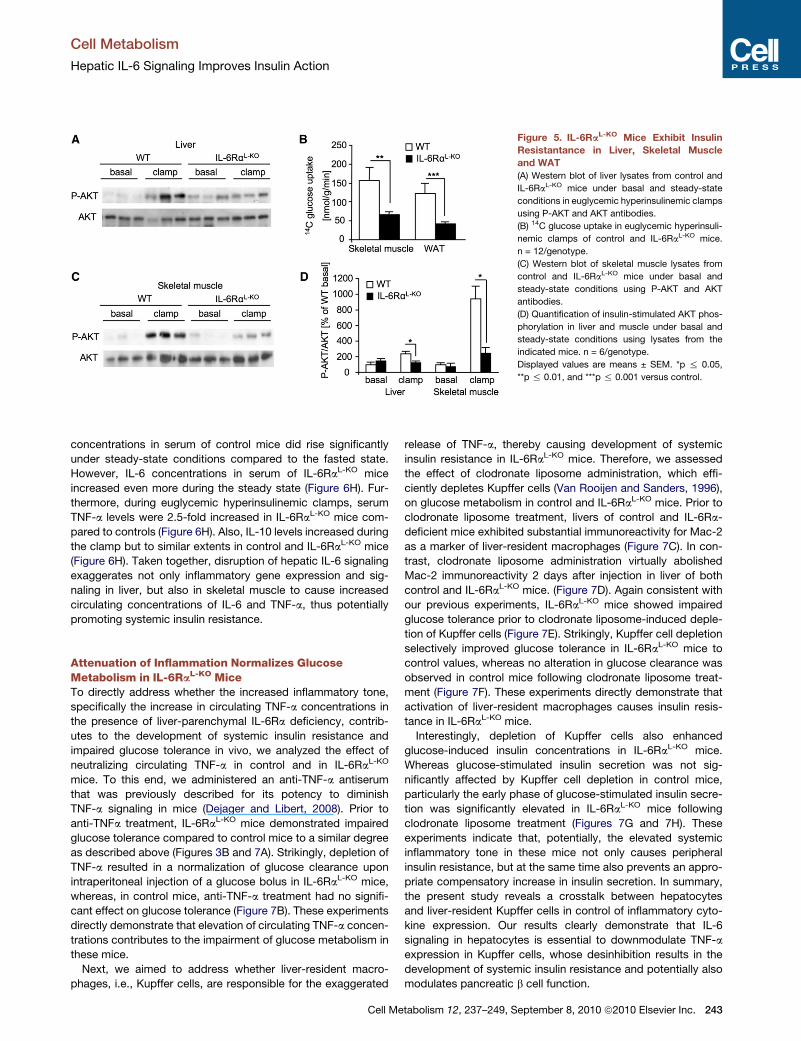
Figure 5. IL-6RaL-KO Mice Exhibit Insulin
Resistantance in Liver, Skeletal Muscle
and WAT
(A) Western blot of liver lysates from control and
IL-6RaL-KO mice under basal and steady-state
conditions in euglycemic hyperinsulinemic clamps
using P-AKT and AKT antibodies.
(B) 14C glucose uptake in euglycemic hyperinsuli-
nemic clamps of control and IL-6RaL-KO mice.
n = 12/genotype.
(C) Western blot of skeletal muscle lysates from
control and IL-6RaL-KO mice under basal and
steady-state conditions using P-AKT and AKT
antibodies.
(D) Quantification of insulin-stimulated AKT phos-
phorylation in liver and muscle under basal and
steady-state conditions using lysates from the
indicated mice. n = 6/genotype.
Displayed values are means ± SEM. *p % 0.05,
**p % 0.01, and ***p % 0.001 versus control.
Cell Metabolism
Hepatic IL-6 Signaling Improves Insulin Action
concentrations in serum of control mice did rise significantly
under steady-state conditions compared to the fasted state.
However, IL-6 concentrations in serum of IL-6RaL-KO mice
increased even more during the steady state (Figure 6H). Fur-
thermore, during euglycemic hyperinsulinemic clamps, serum
TNF-a levels were 2.5-fold increased in IL-6RaL-KO mice com-
pared to controls (Figure 6H). Also, IL-10 levels increased during
the clamp but to similar extents in control and IL-6RaL-KO mice
(Figure 6H). Taken together, disruption of hepatic IL-6 signaling
exaggerates not only inflammatory gene expression and sig-
naling in liver, but also in skeletal muscle to cause increased
circulating concentrations of IL-6 and TNF-a, thus potentially
promoting systemic insulin resistance.
Attenuation of Inflammation Normalizes GlucoseMetabolism in IL-6RaL-KO MiceTo directly address whether the increased inflammatory tone,
specifically the increase in circulating TNF-a concentrations in
the presence of liver-parenchymal IL-6Ra deficiency, contrib-
utes to the development of systemic insulin resistance and
impaired glucose tolerance in vivo, we analyzed the effect of
neutralizing circulating TNF-a in control and in IL-6RaL-KO
mice. To this end, we administered an anti-TNF-a antiserum
that was previously described for its potency to diminish
TNF-a signaling in mice (Dejager and Libert, 2008). Prior to
anti-TNFa treatment, IL-6RaL-KO mice demonstrated impaired
glucose tolerance compared to control mice to a similar degree
as described above (Figures 3B and 7A). Strikingly, depletion of
TNF-a resulted in a normalization of glucose clearance upon
intraperitoneal injection of a glucose bolus in IL-6RaL-KO mice,
whereas, in control mice, anti-TNF-a treatment had no signifi-
cant effect on glucose tolerance (Figure 7B). These experiments
directly demonstrate that elevation of circulating TNF-a concen-
trations contributes to the impairment of glucose metabolism in
these mice.
Next, we aimed to address whether liver-resident macro-
phages, i.e., Kupffer cells, are responsible for the exaggerated
Cell Me
release of TNF-a, thereby causing development of systemic
insulin resistance in IL-6RaL-KO mice. Therefore, we assessed
the effect of clodronate liposome administration, which effi-
ciently depletes Kupffer cells (Van Rooijen and Sanders, 1996),
on glucose metabolism in control and IL-6RaL-KO mice. Prior to
clodronate liposome treatment, livers of control and IL-6Ra-
deficient mice exhibited substantial immunoreactivity for Mac-2
as a marker of liver-resident macrophages (Figure 7C). In con-
trast, clodronate liposome administration virtually abolished
Mac-2 immunoreactivity 2 days after injection in liver of both
control and IL-6RaL-KO mice. (Figure 7D). Again consistent with
our previous experiments, IL-6RaL-KO mice showed impaired
glucose tolerance prior to clodronate liposome-induced deple-
tion of Kupffer cells (Figure 7E). Strikingly, Kupffer cell depletion
selectively improved glucose tolerance in IL-6RaL-KO mice to
control values, whereas no alteration in glucose clearance was
observed in control mice following clodronate liposome treat-
ment (Figure 7F). These experiments directly demonstrate that
activation of liver-resident macrophages causes insulin resis-
tance in IL-6RaL-KO mice.
Interestingly, depletion of Kupffer cells also enhanced
glucose-induced insulin concentrations in IL-6RaL-KO mice.
Whereas glucose-stimulated insulin secretion was not sig-
nificantly affected by Kupffer cell depletion in control mice,
particularly the early phase of glucose-stimulated insulin secre-
tion was significantly elevated in IL-6RaL-KO mice following
clodronate liposome treatment (Figures 7G and 7H). These
experiments indicate that, potentially, the elevated systemic
inflammatory tone in these mice not only causes peripheral
insulin resistance, but at the same time also prevents an appro-
priate compensatory increase in insulin secretion. In summary,
the present study reveals a crosstalk between hepatocytes
and liver-resident Kupffer cells in control of inflammatory cyto-
kine expression. Our results clearly demonstrate that IL-6
signaling in hepatocytes is essential to downmodulate TNF-a
expression in Kupffer cells, whose desinhibition results in the
development of systemic insulin resistance and potentially also
modulates pancreatic b cell function.
tabolism 12, 237–249, September 8, 2010 ª2010 Elsevier Inc. 243
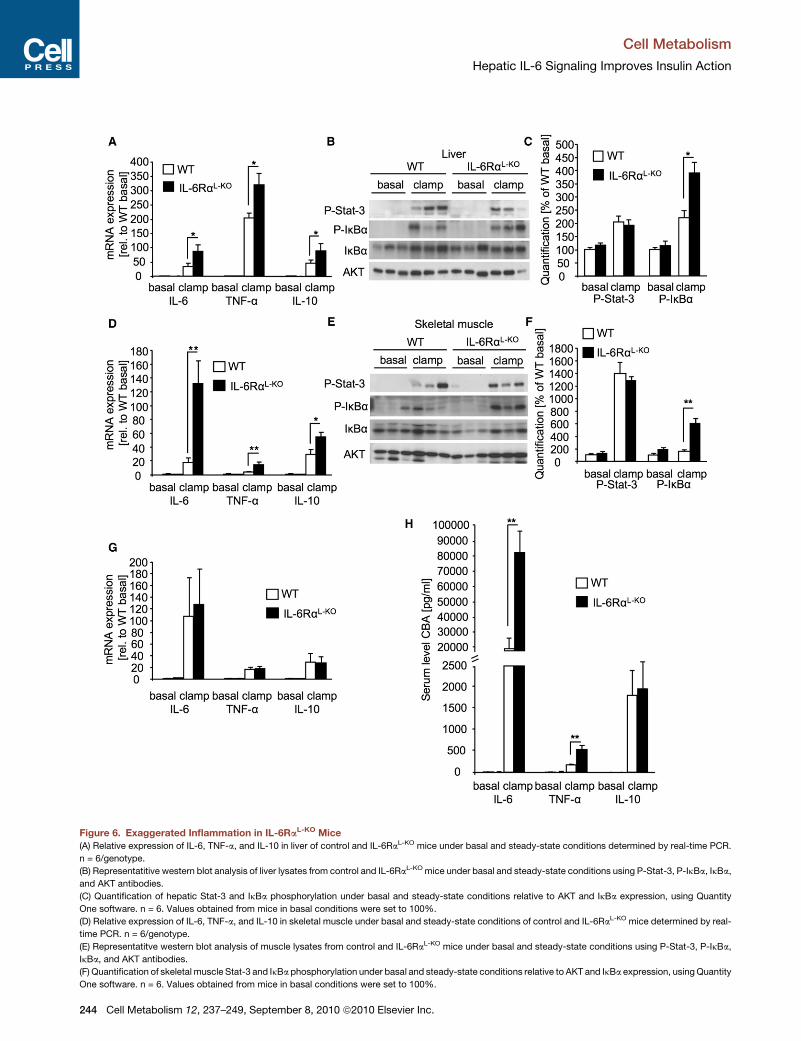
Figure 6. Exaggerated Inflammation in IL-6RaL-KO Mice
(A) Relative expression of IL-6, TNF-a, and IL-10 in liver of control and IL-6RaL-KO mice under basal and steady-state conditions determined by real-time PCR.
n = 6/genotype.
(B) Representatitive western blot analysis of liver lysates from control and IL-6RaL-KO mice under basal and steady-state conditions using P-Stat-3, P-IkBa, IkBa,
and AKT antibodies.
(C) Quantification of hepatic Stat-3 and IkBa phosphorylation under basal and steady-state conditions relative to AKT and IkBa expression, using Quantity
One software. n = 6. Values obtained from mice in basal conditions were set to 100%.
(D) Relative expression of IL-6, TNF-a, and IL-10 in skeletal muscle under basal and steady-state conditions of control and IL-6RaL-KO mice determined by real-
time PCR. n = 6/genotype.
(E) Representatitve western blot analysis of muscle lysates from control and IL-6RaL-KO mice under basal and steady-state conditions using P-Stat-3, P-IkBa,
IkBa, and AKT antibodies.
(F) Quantification of skeletal muscle Stat-3 and IkBa phosphorylation under basal and steady-state conditions relative to AKT and IkBa expression, usingQuantity
One software. n = 6. Values obtained from mice in basal conditions were set to 100%.
Cell Metabolism
Hepatic IL-6 Signaling Improves Insulin Action
244 Cell Metabolism 12, 237–249, September 8, 2010 ª2010 Elsevier Inc.
Cell Metabolism
Hepatic IL-6 Signaling Improves Insulin Action
DISCUSSION
Obesity-associated insulin resistance correlates with increased
concentrations of inflammatory cytokines in circulation, both in
obese rodent models and humans (Hotamisligil et al., 1997;
Olszanecka-Glinianowicz et al., 2004). Whereas increased
TNF-a expression inhibits insulin signaling and thus is a major
causal contributing factor in the development of insulin resis-
tance (Hotamisligil et al., 1994a, 1994b), the role of elevated IL-6
concentrations in obesity-induced insulin resistance is still
matter of debate (Pedersen and Febbraio, 2007). Whereas IL-6
levels are high during exercise (Pedersen et al., 2004), a situation
in which glucose uptake is critical for the energy supply of skel-
etal muscle, chronically increased IL-6 levels during the course
of obesity induce SOCS3 expression in liver, which in turn can
impair insulin signaling (Sabio et al., 2008; Ueki et al., 2004).
Besides the known effect of exercise to increase IL-6 concen-
trations (Penkowa et al., 2003), we demonstrate in the current
study that, during euglycemic hyperinsulinemic clamps, IL-6
expression is increased in liver, skeletal muscle, and WAT,
resulting in increased IL-6 concentrations in circulation. Of
interest, during the clamp, not only IL-6 expression is increased,
but also that of TNF-a and IL-10. Consistent with increased cyto-
kine expression, we could also detect activation of downstream
signaling events of these signals such as phosphorylation of IkBa
and Stat-3 in liver and muscle under euglycemic hyperinsuline-
mic clamp conditions. Thus, euglycemic hyperinsulinemic clamp
conditions seem to promote a proinflammatory tone.
The notion that endogenous IL-6 concentrations increase
during euglycemic hyperinsulinemic clamps may also explain
theminor effects observed when IL-6 was infused during clamps
to investigate the acute effect of IL-6 on glucose homeostasis
(Carey et al., 2006; Kim et al., 2004; Yuen et al., 2009).
Importantly, our study reveals an overall anti-inflammatory role
for IL-6 signaling in the liver. This is consistent with a study in
which IL-6 was shown to act as negative feedback regulator of
inflammatory signaling pathways in macrophages (Xing et al.,
1998). Here, the authors examined IL-6-deficient macrophages
and found that, in response to lipopolysaccharide stimulation,
they exhibit increased expression of TNF-a, indicating that IL-6
can function rather anti- than proinflammatory to downregulate
inflammatory signaling cascades. However, in our model, abro-
gation of IL-6 signaling in liver-parenchymal cells promotes an
activation of inflammatory cytokine expression in liver-resident
macrophages, i.e., Kupffer cells, indicating a crosstalk of an
IL-6-dependent signal in hepatocytes to the neighboring Kupffer
cells to limit inflammation. Whatever the nature of this signal is,
the functional significance of Kupffer cell activation in the mani-
festation of the phenotype on the IL-6RaL-KO mice is clearly
evident from the fact that Kupffer cell ablation improves impaired
glucose metabolism in these mice.
Of interest, Kupffer cell activation in the IL-6RaL-KO mice not
only causes a local inflammatory response in liver, but is also par-
(G) Relative expression of IL-6, TNF-a, and IL-10 in WAT under basal and steady-
n = 6/genotype.
(H) Serum concentrations of IL-6, TNF-a, and IL-10 under basal and steady-state c
array. n = 10/genotype.
Displayed values are means ± SEM. *p % 0.05 and **p % 0.01 versus control.
Cell Me
alleled by increased expression of IL-6, TNF-a, and IL-10 gene
expression in skeletal muscle andWAT, presumably as a conse-
quence of increased Kupffer cell-derived TNF-a. In line with this
notion, abrogation of TNF-a action completely reverses the
impaired glucose tolerance in the IL-6RaL-KO animals. However,
we cannot exclude that increased systemic IL-6 concentrations
in thesemice and subsequent activation of IL-6 signaling in other
organs than liver is responsible for the development of insulin
resistance, as only hepatocytes are IL-6 resistant in our model.
Nevertheless, besides the dramatic effect of TNF-a neutraliza-
tion, also unaltered Stat-3 phosphorylation in skeletal muscle of
IL-6RaL-KO mice argues against a direct effect of increased IL-6
action on skeletal muscle to cause insulin resistance.
Besides the effect of systemic inflammation to cause insulin
resistance, our experiments also indicate that activation of proin-
flammatory signaling can simultaneously impair b cell function,
consistent with the notion that inflammatory cytokines, particu-
larly TNF-a, can inhibit insulin release from the b cells (Southern
et al., 1990; Zhang and Kim, 1995).
In addition to the insights into the role of IL-6 action in liver to
control local and systemic inflammation, the present study
moreover revealed the complex effect of this cytokine on liver
glucose metabolism. Recently, insulin signaling in the CNS was
shown to inhibit hepatic glucose production via a mechanism
including stimulation of IL-6 expression from Kupffer cells, in
turn acting on hepatocytes to downregulate G6Pase expression
and to reduce hepatic glucose output (Inoue et al., 2006). Here,
we confirm the inhibitory action of IL-6 on G6Pase expression,
as G6Pase mRNA and protein expression are significantly
increased during hyperinsulinemic euglycemic clamps in liver
of IL-6RaL-KO mice compared to controls. However, G6Pase
expression in these animals is still largely suppressed compared
to the fasted state. Together with unaltered Stat-3 phosphoryla-
tion during the clamps in IL-6RaL-KO mice, our results thus indi-
cate the existence of additional and/or compensatory IL-6-inde-
pendent pathways responsible for insulin-induced Stat-3
phosphorylation in liver of these mice.
Strikingly, IL-6 not only controls gluconeogenesis, but also
negatively regulates glucokinase expression, thus promoting
breakdown of glycogen. Thus, lack of IL-6 signaling promotes
glycogen synthesis, as directly demonstrated under clamp con-
ditions, resulting in only a minor net effect on hepatic glucose
output in IL-6RaL-KO mice. Thus, we provide in vivo evidence
for partly antagonizing actions of IL-6 in hepatic glucose metab-
olism by simultaneously suppressing enzymes essential for
gluconeogenesis, glycogenolysis, and glycogen synthesis.
Given these complex effects of IL-6 signaling on hepatic
metabolism and the initiation of a systemic inflammatory
response upon inhibition of IL-6 signaling, caution should be
warranted to potential diabetogenic side effects of newly evolv-
ing therapies aiming to interfere with IL-6 signaling to treat
chronic inflammatory diseases, such as rheumatoid arthritis
(Choy et al., 2002; Nishimoto et al., 2004).
state conditions of control and IL-6RaL-KO mice determined by real-time PCR.
onditions in control and IL-6RaL-KOmice was examined using cytometric bead
tabolism 12, 237–249, September 8, 2010 ª2010 Elsevier Inc. 245
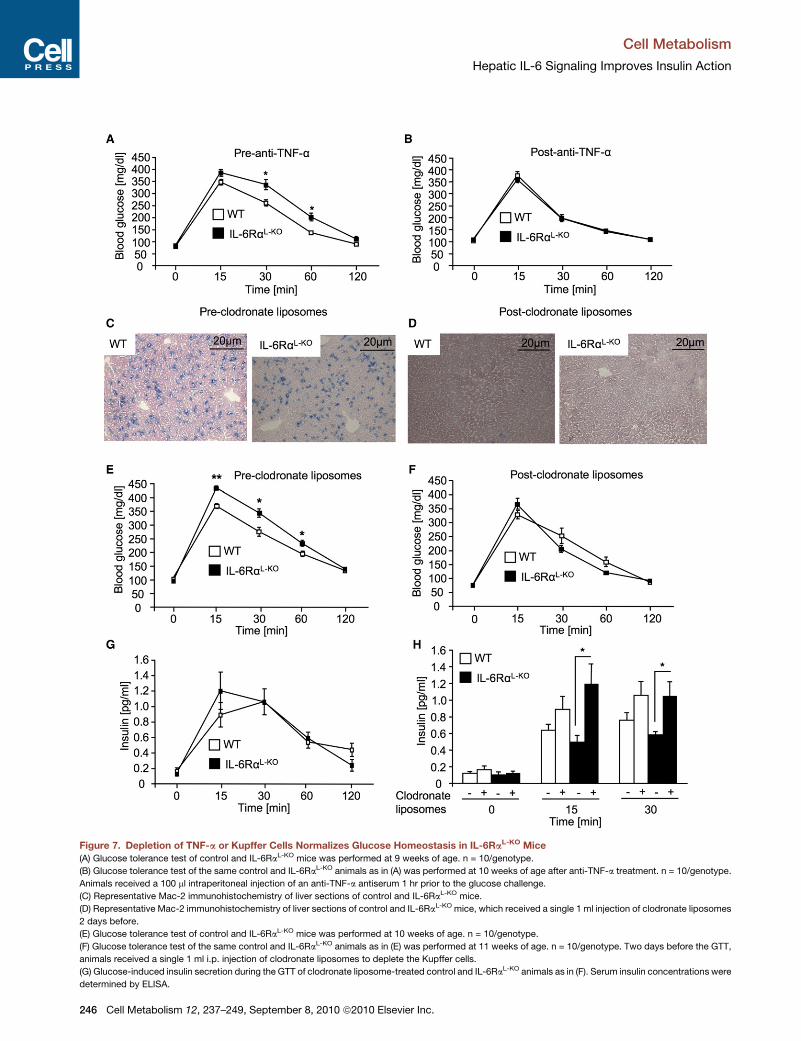
Figure 7. Depletion of TNF-a or Kupffer Cells Normalizes Glucose Homeostasis in IL-6RaL-KO Mice
(A) Glucose tolerance test of control and IL-6RaL-KO mice was performed at 9 weeks of age. n = 10/genotype.
(B) Glucose tolerance test of the same control and IL-6RaL-KO animals as in (A) was performed at 10 weeks of age after anti-TNF-a treatment. n = 10/genotype.
Animals received a 100 ml intraperitoneal injection of an anti-TNF-a antiserum 1 hr prior to the glucose challenge.
(C) Representative Mac-2 immunohistochemistry of liver sections of control and IL-6RaL-KO mice.
(D) Representative Mac-2 immunohistochemistry of liver sections of control and IL-6RaL-KO mice, which received a single 1 ml injection of clodronate liposomes
2 days before.
(E) Glucose tolerance test of control and IL-6RaL-KO mice was performed at 10 weeks of age. n = 10/genotype.
(F) Glucose tolerance test of the same control and IL-6RaL-KO animals as in (E) was performed at 11 weeks of age. n = 10/genotype. Two days before the GTT,
animals received a single 1 ml i.p. injection of clodronate liposomes to deplete the Kupffer cells.
(G) Glucose-induced insulin secretion during the GTT of clodronate liposome-treated control and IL-6RaL-KO animals as in (F). Serum insulin concentrations were
determined by ELISA.
Cell Metabolism
Hepatic IL-6 Signaling Improves Insulin Action
246 Cell Metabolism 12, 237–249, September 8, 2010 ª2010 Elsevier Inc.

Cell Metabolism
Hepatic IL-6 Signaling Improves Insulin Action
EXPERIMENTAL PROCEDURES
Animal Care
Care of all animals was within institutional animal care committee guidelines,
and all animal procedures were approved by local government authorities
(Bezirksregierung Koln, Cologne, Germany) and were in accordance with
NIH guidelines. Mice were housed in groups of 3–5 at 22�C–24�C using
a 12 hr light/12 hr dark cycle with lights on at 7 AM. Animals were fed regular
chow food (NCD; Teklad Global Rodent 2018; Harlan) containing 53.5%
carbohydrates, 18.5% protein, and 5.5% fat (12% of calories from fat).
Animals had ad libitum access to water at all times, and food was only with-
drawn when required for experimental procedures. At 20 weeks of age,
animals were sacrificed using CO2.
Body Weight and Body Composition
Body weight was measured weekly. Body fat content was measured in vivo by
nuclear magnetic resonance using the minispec mq 7.5 (Bruker).
Euglycemic Hyperinsulinemic Clamp Studies
Catheter implantation was performed as previously described (Fisher and
Kahn, 2003). Only mice that had regained at least 90% of their preoperative
bodyweight after 6 days of recovery were included in the experimental groups.
After starvation for 16 hr, awake animals were placed in restrainers for the
duration of the clamp experiment. After a D-[3-3H]Glucose (Amersham Biosci-
ences) tracer solution bolus infusion (5mCi), the tracer was infused continu-
ously (0.05 mCi/min) for the duration of the experiment. At the end of the
50 min basal period, a blood sample (50 ml) was collected for determination
of the basal parameters. Insulin (human regular insulin; NovoNordisc Pharma-
ceuticals) solution containing 0.1% BSA (Sigma) was infused at a fixed rate
(4 mU/g/min) following a bolus infusion (40 mU/g). Blood glucose levels were
determined every 10 min (B-Glucose Analyzer; Hemocue), and physiological
blood glucose levels (between 120 and 145 mg/dl) were maintained by adjust-
ing a 20% glucose infusion (DeltaSelect). Approximately 60 min before steady
state was achieved, a bolus of 2-Deoxy-D-[1-14C]Glucose (10 mCi, Amersham)
was infused. Steady state was ascertained when glucose measurements were
constant for at least 30 min at a fixed glucose infusion rate and was achieved
within 100 to 130 min. During the clamp experiment, blood samples (5 ml) were
collected after the infusion of the 2-Deoxy-D-[1-14C]Glucose at the time points
0, 5, 15, 25, 35min etc. until reaching the steady state. During the steady state,
blood samples (50 ml) for the measurement of steady-state parameters were
collected. All blood samples were kept at room temperature until centrifuga-
tion; serum samples were stored at �20�C.At the end of the experiment, mice were killed by cervical dislocation, and
brain, liver, white adipose tissue (WAT), and skeletal muscle were dissected
and stored at �80�C.Plasma [3-3H] Glucose radioactivity of basal and steady statewasmeasured
as previously described (Fisher and Kahn, 2003). Plasma Deoxy-[1-14C]
Glucose radioactivity was directly measured in the liquid scintillation counter.
WAT and skeletal muscle lysates were processed through ion exchange
chromatography columns (Poly-PrepR Prefilled Chromatography Columns,
AGR1-X8 formate resin, 200–400 mesh dry; Bio Rad Laboratories) to separate
2-Deoxy-D-[1-14C]Glucose (2DG) from 2-Deoxy-D-[1-14C]Glucose-6-Phos-
phate (2DG6P).
Glucose turnover rate (mg 3 kg�1 3 min�1) was calculated as previously
described (Fisher and Kahn, 2003). In vivo glucose uptake forWAT and skeletal
muscle (nmol 3 g�1 3 min�1) was calculated based on the accumulation of
2DG6P in the respective tissue and the disappearance rate of 2DG from
plasma as described previously (Ferre et al., 1985).
Glucose and Insulin Tolerance Test
Glucose tolerance tests were performed with 16 hr fasted animals. After deter-
mination of fasted blood glucose levels, each animal received an intraperito-
neal injection of 20% glucose (10 ml/kg) (DeltaSelect). Blood glucose levels
were detected after 15, 30, 60, and 120 min. To deplete TNF-a in control
(H) Comparison of serum insulin concentrations of nontreated or clodronate liposo
challenge taken from Figures 3C and 7G.
Displayed values are means ± SEM. *p % 0.05 and **p % 0.01 versus control.
Cell Me
and mutant mice, mice received a single 100 ml i.p. injection of the anti-
TNF-a anti-serum (Dejager and Libert, 2008) 2 hr before the glucose tolerance
test. Kupffer cells were depleted by i.p. injection of 1 ml clodronate liposomes
(Van Rooijen and Sanders, 1996) in control and IL-6RaL-KO mice 2 days before
the glucose tolerance test. Clodronate was a gift from Roche.
Insulin tolerance tests were performed with fasted mice. Animals were in-
jected with 0.75 U/kg body weight of human regular insulin (Novo Nordisk)
into the peritoneal cavity. Blood glucose levels were detected after 0, 15, 30,
and 60 min.
Glucose-Induced Insulin Secretion of Isolated Pancreatic Islets
The medium used for both isolation and the experiments was a HEPES buffer
containing (in mM): 125 NaCl, 5.9 KCl, 1.2 MgCl2, 1.28 CaCl2, and 3 glucose
(pH 7.4). Bovine serum albumin was added to the medium at a concentration
of 1 mg/ml. Pancreatic islets were isolated by a collagenase technique (Lern-
mark, 1974), and the islets were maintained overnight in RPMI 1640 culture
medium supplemented with 100 ug/ml streptomycin, 100 units of penicillin,
2 mM glutamine, and 10% FCS at 37�C in a humidified atmosphere of 5%
CO2 in air. Islets were preincubated in buffer containing 3 mM glucose for
30 min at 37�C. Batches of 6–9 islets were incubated for 30 min at 37�Cwith 3 or 11 mM glucose. The incubation was stopped by chilling the samples
on ice, samples were taken for analysis of insulin, and the islets were collected
for measurement of dsDNA. Insulin was measured using the TPX plate reader
(ArcDia International Oy Ltd, Turku, Finland) (Hanninen et al., 2000), and Pico-
Green dsDNA quantification reagent kit (Molecular Probes) was used to quan-
tify dsDNA in the islets.
Statistical Methods
Data were analyzed for statistical significance using a two-tailed unpaired
Student’s t test.
SUPPLEMENTAL INFORMATION
Supplemental Information includes Supplemental Experimental Procedures
and one figure and can be found with this article online at doi:10.1016/
j.cmet.2010.06.011.
ACKNOWLEDGMENTS
We thank Gisela Schmall and Tanja Rayle for excellent secretarial assistance
and Gabriele Ringeisen, Brigitte Hampel, Anke Lietzau, and Sigrid Irlenbusch
for excellent technical assistance. Moreover, we cordially thank Gunther
Schutz for providing the Alfp-Cre transgenic animals. This work was supported
by grants from the CMMC, the Novartis Foundation (to J.C.B.), and the
German Research Foundation (DFG) (grants 1492-7-1 and SFB 635 to
J.C.B. and SFB 832 to J.C.B. and F.T.W.).
Received: September 14, 2009
Revised: April 7, 2010
Accepted: June 1, 2010
Published: September 7, 2010
REFERENCES
Aguirre, V., Uchida, T., Yenush, L., Davis, R., andWhite, M.F. (2000). The c-Jun
NH(2)-terminal kinase promotes insulin resistance during association with
insulin receptor substrate-1 and phosphorylation of Ser(307). J. Biol. Chem.
275, 9047–9054.
Arkan, M.C., Hevener, A.L., Greten, F.R., Maeda, S., Li, Z.W., Long, J.M.,
Wynshaw-Boris, A., Poli, G., Olefsky, J., and Karin, M. (2005). IKK-beta links
inflammation to obesity-induced insulin resistance. Nat. Med. 11, 191–198.
Bastard, J.P., Jardel, C., Bruckert, E., Blondy, P., Capeau, J., Laville, M., Vidal,
H., and Hainque, B. (2000). Elevated levels of interleukin 6 are reduced in
me-treated control and IL-6RaL-KO animals 0, 15, and 30 min after the glucose
tabolism 12, 237–249, September 8, 2010 ª2010 Elsevier Inc. 247
Cell Metabolism
Hepatic IL-6 Signaling Improves Insulin Action
serum and subcutaneous adipose tissue of obese women after weight loss. J.
Clin. Endocrinol. Metab. 85, 3338–3342.
Cai, D., Yuan, M., Frantz, D.F., Melendez, P.A., Hansen, L., Lee, J., and Shoe-
lson, S.E. (2005). Local and systemic insulin resistance resulting from hepatic
activation of IKK-beta and NF-kappaB. Nat. Med. 11, 183–190.
Carey, A.L., Steinberg, G.R., Macaulay, S.L., Thomas, W.G., Holmes, A.G.,
Ramm, G., Prelovsek, O., Hohnen-Behrens, C., Watt, M.J., James, D.E.,
et al. (2006). Interleukin-6 increases insulin-stimulated glucose disposal in hu-
mans and glucose uptake and fatty acid oxidation in vitro via AMP-activated
protein kinase. Diabetes 55, 2688–2697.
Chida, D., Osaka, T., Hashimoto, O., and Iwakura, Y. (2006). Combined inter-
leukin-6 and interleukin-1 deficiency causes obesity in young mice. Diabetes
55, 971–977.
Choy, E.H., Isenberg, D.A., Garrood, T., Farrow, S., Ioannou, Y., Bird, H.,
Cheung, N., Williams, B., Hazleman, B., Price, R., et al. (2002). Therapeutic
benefit of blocking interleukin-6 activity with an anti-interleukin-6 receptor
monoclonal antibody in rheumatoid arthritis: a randomized, double-blind,
placebo-controlled, dose-escalation trial. Arthritis Rheum. 46, 3143–3150.
Dejager, L., and Libert, C. (2008). Tumor necrosis factor alpha mediates the
lethal hepatotoxic effects of poly(I:C) in D-galactosamine-sensitized mice.
Cytokine 42, 55–61.
Di Gregorio, G.B., Hensley, L., Lu, T., Ranganathan, G., and Kern, P.A. (2004).
Lipid and carbohydrate metabolism inmice with a targetedmutation in the IL-6
gene: absence of development of age-related obesity. Am. J. Physiol. Endocri-
nol. Metab. 287, E182–E187.
Ferre, P., Leturque, A., Burnol, A.F., Penicaud, L., and Girard, J. (1985).
A method to quantify glucose utilization in vivo in skeletal muscle and white
adipose tissue of the anaesthetized rat. Biochem. J. 228, 103–110.
Fisher, S.J., and Kahn, C.R. (2003). Insulin signaling is required for insulin’s
direct and indirect action on hepatic glucose production. J. Clin. Invest. 111,
463–468.
Gropp, E., Shanabrough, M., Borok, E., Xu, A.W., Janoschek, R., Buch, T.,
Plum, L., Balthasar, N., Hampel, B., Waisman, A., et al. (2005). Agouti-related
peptide-expressing neurons are mandatory for feeding. Nat. Neurosci. 8,
1289–1291.
Hanninen, P., Soini, A., Meltola, N., Soini, J., Soukka, J., and Soini, E. (2000).
A new microvolume technique for bioaffinity assays using two-photon excita-
tion. Nat. Biotechnol. 18, 548–550.
Hirosumi, J., Tuncman, G., Chang, L., Gorgun, C.Z., Uysal, K.T., Maeda, K.,
Karin, M., and Hotamisligil, G.S. (2002). A central role for JNK in obesity and
insulin resistance. Nature 420, 333–336.
Holmes, A.G., Mesa, J.L., Neill, B.A., Chung, J., Carey, A.L., Steinberg, G.R.,
Kemp, B.E., Southgate, R.J., Lancaster, G.I., Bruce, C.R., et al. (2008). Pro-
longed interleukin-6 administration enhances glucose tolerance and increases
skeletal muscle PPARalpha and UCP2 expression in rats. J. Endocrinol. 198,
367–374.
Hotamisligil, G.S., Shargill, N.S., and Spiegelman, B.M. (1993). Adipose
expression of tumor necrosis factor-alpha: direct role in obesity-linked insulin
resistance. Science 259, 87–91.
Hotamisligil, G.S., Budavari, A., Murray, D., and Spiegelman, B.M. (1994a).
Reduced tyrosine kinase activity of the insulin receptor in obesity-diabetes.
Central role of tumor necrosis factor-alpha. J. Clin. Invest. 94, 1543–1549.
Hotamisligil, G.S., Murray, D.L., Choy, L.N., and Spiegelman, B.M. (1994b).
Tumor necrosis factor alpha inhibits signaling from the insulin receptor.
Proc. Natl. Acad. Sci. USA 91, 4854–4858.
Hotamisligil, G.S., Arner, P., Atkinson, R.L., and Spiegelman, B.M. (1997).
Differential regulation of the p80 tumor necrosis factor receptor in human
obesity and insulin resistance. Diabetes 46, 451–455.
Inoue, H., Ogawa, W., Asakawa, A., Okamoto, Y., Nishizawa, A., Matsumoto,
M., Teshigawara, K., Matsuki, Y., Watanabe, E., Hiramatsu, R., et al. (2006).
Role of hepatic STAT3 in brain-insulin action on hepatic glucose production.
Cell Metab. 3, 267–275.
Kellendonk, C., Opherk, C., Anlag, K., Schutz, G., and Tronche, F. (2000).
Hepatocyte-specific expression of Cre recombinase. Genesis 26, 151–153.
248 Cell Metabolism 12, 237–249, September 8, 2010 ª2010 Elsevie
Kim, H.J., Higashimori, T., Park, S.Y., Choi, H., Dong, J., Kim, Y.J., Noh, H.L.,
Cho, Y.R., Cline, G., Kim, Y.B., and Kim, J.K. (2004). Differential effects of inter-
leukin-6 and -10 on skeletal muscle and liver insulin action in vivo. Diabetes 53,
1060–1067.
Kleinridders, A., Schenten, D., Konner, A.C., Belgardt, B.F., Mauer, J.,
Okamura, T., Wunderlich, F.T., Medzhitov, R., and Bruning, J.C. (2009).
MyD88 signaling in the CNS is required for development of fatty acid-induced
leptin resistance in diet-induced obesity. Cell Metab. 10, 249–259.
Klover, P.J., Zimmers, T.A., Koniaris, L.G., and Mooney, R.A. (2003). Chronic
exposure to interleukin-6 causes hepatic insulin resistance in mice. Diabetes
52, 2784–2789.
Konner, A.C., Janoschek, R., Plum, L., Jordan, S.D., Rother, E., Ma, X., Xu, C.,
Enriori, P., Hampel, B., Barsh, G.S., et al. (2007). Insulin action in AgRP-
expressing neurons is required for suppression of hepatic glucose production.
Cell Metab. 5, 438–449.
Lernmark, A. (1974). The preparation of, and studies on, free cell suspensions
from mouse pancreatic islets. Diabetologia 10, 431–438.
Mackiewicz, A., Wiznerowicz, M., Roeb, E., Karczewska, A., Nowak, J., Hein-
rich, P.C., and Rose-John, S. (1995). Soluble interleukin 6 receptor is biologi-
cally active in vivo. Cytokine 7, 142–149.
Nishimoto, N., Yoshizaki, K., Miyasaka, N., Yamamoto, K., Kawai, S., Takeu-
chi, T., Hashimoto, J., Azuma, J., and Kishimoto, T. (2004). Treatment of rheu-
matoid arthritis with humanized anti-interleukin-6 receptor antibody: a multi-
center, double-blind, placebo-controlled trial. Arthritis Rheum. 50, 1761–1769.
Nishimura, S., Manabe, I., Nagasaki, M., Eto, K., Yamashita, H., Ohsugi, M.,
Otsu, M., Hara, K., Ueki, K., Sugiura, S., et al. (2009). CD8+ effector T cells
contribute to macrophage recruitment and adipose tissue inflammation in
obesity. Nat. Med. 15, 914–920.
Olszanecka-Glinianowicz, M., Zahorska-Markiewicz, B., Janowska, J., and
Zurakowski, A. (2004). Serum concentrations of nitric oxide, tumor necrosis
factor (TNF)-alpha and TNF soluble receptors in women with overweight and
obesity. Metabolism 53, 1268–1273.
Pedersen, B.K., and Febbraio, M.A. (2007). Point: Interleukin-6 does have
a beneficial role in insulin sensitivity and glucose homeostasis. J. Appl. Physiol.
102, 814–816.
Pedersen, B.K., Steensberg, A., Fischer, C., Keller, C., Keller, P., Plomgaard,
P., Wolsk-Petersen, E., and Febbraio, M. (2004). The metabolic role of IL-6
produced during exercise: is IL-6 an exercise factor? Proc. Nutr. Soc. 63,
263–267.
Penkowa, M., Keller, C., Keller, P., Jauffred, S., and Pedersen, B.K. (2003).
Immunohistochemical detection of interleukin-6 in human skeletal muscle
fibers following exercise. FASEB J. 17, 2166–2168.
Plomgaard, P., Bouzakri, K., Krogh-Madsen, R., Mittendorfer, B., Zierath, J.R.,
and Pedersen, B.K. (2005). Tumor necrosis factor-alpha induces skeletal
muscle insulin resistance in healthy human subjects via inhibition of Akt
substrate 160 phosphorylation. Diabetes 54, 2939–2945.
Plum, L., Belgardt, B.F., and Bruning, J.C. (2006). Central insulin action in
energy and glucose homeostasis. J. Clin. Invest. 116, 1761–1766.
Rodrıguez, C.I., Buchholz, F., Galloway, J., Sequerra, R., Kasper, J., Ayala, R.,
Stewart, A.F., and Dymecki, S.M. (2000). High-efficiency deleter mice show
that FLPe is an alternative to Cre-loxP. Nat. Genet. 25, 139–140.
Sabio, G., Das, M., Mora, A., Zhang, Z., Jun, J.Y., Ko, H.J., Barrett, T., Kim,
J.K., and Davis, R.J. (2008). A stress signaling pathway in adipose tissue regu-
lates hepatic insulin resistance. Science 322, 1539–1543.
Sadagurski, M., Norquay, L., Farhang, J., D’Aquino, K., Copps, K., and White,
M.F. (2010). Human IL6 enhances leptin action in mice. Diabetologia 53,
525–535.
Southern, C., Schulster, D., and Green, I.C. (1990). Inhibition of insulin secre-
tion by interleukin-1 beta and tumour necrosis factor-alpha via an L-arginine-
dependent nitric oxide generating mechanism. FEBS Lett. 276, 42–44.
Ueki, K., Kondo, T., and Kahn, C.R. (2004). Suppressor of cytokine signaling 1
(SOCS-1) and SOCS-3 cause insulin resistance through inhibition of tyrosine
phosphorylation of insulin receptor substrate proteins by discrete mecha-
nisms. Mol. Cell. Biol. 24, 5434–5446.
r Inc.
Cell Metabolism
Hepatic IL-6 Signaling Improves Insulin Action
Van Rooijen, N., and Sanders, A. (1996). Kupffer cell depletion by liposome-
delivered drugs: comparative activity of intracellular clodronate, propamidine,
and ethylenediaminetetraacetic acid. Hepatology 23, 1239–1243.
Wallenius, V., Wallenius, K., Ahren, B., Rudling, M., Carlsten, H., Dickson, S.L.,
Ohlsson, C., and Jansson, J.O. (2002). Interleukin-6-deficient mice develop
mature-onset obesity. Nat. Med. 8, 75–79.
Xing, Z., Gauldie, J., Cox, G., Baumann, H., Jordana,M., Lei, X.F., and Achong,
M.K. (1998). IL-6 is an antiinflammatory cytokine required for controlling local
or systemic acute inflammatory responses. J. Clin. Invest. 101, 311–320.
Xu, H., Barnes, G.T., Yang, Q., Tan, G., Yang, D., Chou, C.J., Sole, J., Nichols,
A., Ross, J.S., Tartaglia, L.A., and Chen, H. (2003). Chronic inflammation in fat
Cell Me
plays a crucial role in the development of obesity-related insulin resistance.
J. Clin. Invest. 112, 1821–1830.
Yuen, D.Y., Dwyer, R.M., Matthews, V.B., Zhang, L., Drew, B.G., Neill, B.,
Kingwell, B.A., Clark, M.G., Rattigan, S., and Febbraio, M.A. (2009). Inter-
leukin-6 attenuates insulin-mediated increases in endothelial cell signaling
but augments skeletal muscle insulin action via differential effects on tumor
necrosis factor-alpha expression. Diabetes 58, 1086–1095.
Zhang, S., and Kim, K.H. (1995). TNF-alpha inhibits glucose-induced insulin
secretion in a pancreatic beta-cell line (INS-1). FEBS Lett. 377, 237–239.
Zhang, X., Zhang, G., Zhang, H., Karin, M., Bai, H., and Cai, D. (2008). Hypo-
thalamic IKKbeta/NF-kappaB and ER stress link overnutrition to energy imbal-
ance and obesity. Cell 135, 61–73.
tabolism 12, 237–249, September 8, 2010 ª2010 Elsevier Inc. 249