Intercomparison of spectroradiometers and Sun photometers for the determination of the aerosol...
15
Intercomparison of spectroradiometers and Sun photometers for the determination of the aerosol optical depth during the VELETA-2002 field campaign V. Estelle ´s, 1 M. P. Utrillas, 1 J. A. Martı ´nez-Lozano, 1 A. Alca ´ntara, 2 L. Alados-Arboledas, 2 F. J. Olmo, 2 J. Lorente, 3 X. de Cabo, 3 V. Cachorro, 4 H. Horvath, 5 A. Labajo, 6 M. Sorribas, 7 J. P. Dı ´az, 8 A. M. Dı ´az, 8 A. M. Silva, 9 T. Elı ´as, 9 M. Pujadas, 10 J. A. Rodrigues, 11 J. Can ˜ada, 12 and Y. Garcı ´a 13 Received 5 April 2005; revised 18 January 2006; accepted 2 May 2006; published 15 September 2006. [1] In July 2002 the VELETA-2002 field campaign was held in Sierra Nevada (Granada) in the south of Spain. The main objectives of this field campaign were the study of the influence of elevation and atmospheric aerosols on measured UV radiation. In the first stage of the field campaign, a common calibration and intercomparison between Licor- 1800 spectroradiometers and Cimel-318 Sun photometers was performed in order to assess the quality of the measurements from the whole campaign. The intercomparison of the Licor spectroradiometers showed, for both direct and global irradiances, that when the comparisons were restricted to the visible part of the spectrum the deviations were within the instruments’ nominal accuracies which allows us to rely on these instruments for measuring physical properties of aerosols at the different measurement stations. A simultaneous calibration on AOD data was performed for the Cimel-318 Sun photometers. When a common calibration and methodology was applied, the deviation was lowered to much less than 0.01 for AOD. At the same time an intercomparison has been made between the AOD values given by the spectroradiometers and the Sun photometers, with deviations obtained from 0.01 to 0.03 for the AOD in the visible range, depending on the channel. In the UVA range, the AOD uncertainty was estimated to be around 0.02 and 0.05 for Cimel and Licor respectively. In general the experimental differences were in agreement with this uncertainty estimation. In the UVB range the AOD measurements should not be used due to maximum instrumental uncertainties. Citation: Estelle ´s, V., et al. (2006), Intercomparison of spectroradiometers and Sun photometers for the determination of the aerosol optical depth during the VELETA-2002 field campaign, J. Geophys. Res., 111, D17207, doi:10.1029/2005JD006047. 1. Introduction [2] Aerosol optical depth (AOD) and other related aerosol characteristics are routinely acquired throughout the world by means of well-established international networks such as the Aerosol Robotic Network [Holben et al., 1998], Global Atmosphere Watch Programme (GAW) (available at http:// www.pmodwrc.ch), or SKYNET (http://atmos.cr.chiba-u. ac.jp/aerosol/skynet/). These networks originated in the last decade and have been growing continuously with time, increasing the possibilities of long-term aerosol climatolog- ical studies in many sites across the world. These networks allow us to increase our knowledge of the role of aerosols in climate change, the effect of pollution on public health, or the validity of satellite retrieved products. Obviously, the uncer- tainties of the measurements are directly linked to the quality of the derived products. This problem is crucial when global radiative forcing by aerosols is to be determined [Houghton et al., 2001], as the nature and quantity of atmospheric partic- ulate matter are highly variable in space and time. [3] Therefore the assessment and reduction of the uncer- tainty of the obtained aerosol optical parameters is a key JOURNAL OF GEOPHYSICAL RESEARCH, VOL. 111, D17207, doi:10.1029/2005JD006047, 2006 Click Here for Full Articl e 1 Grupo de Radiacio ´n Solar, Universitat de Vale `ncia, Vale `ncia, Spain. 2 Grupo de Fı ´sica de la Atmo ´sfera, Universidad de Granada, Granada, Spain. 3 Departemento de Astronomı ´a i Meteorologı ´a, Universitat de Barcelona, Barcelona, Spain. 4 Grupo de O ´ ptica Atmosfe ´rica, Universidad de Valladolid, Valladolid, Spain. 5 Experimental Physics Institute, University of Vienna, Vienna, Austria. Copyright 2006 by the American Geophysical Union. 0148-0227/06/2005JD006047$09.00 D17207 6 Instituto Nacional de Meteorologı ´a, Madrid, Spain. 7 Estacion de Sondeos Atmosfe ´ricos de El Arenosillo, INTA, Huelva, Spain. 8 Departemento de Fı ´sica Ba ´sica, Universidad de La Laguna, Spain. 9 E ´ vora Geophysics Centre, University of E ´ vora, E ´ vora, Portugal. 10 Departemento de Impacto Ambiental de la Energı ´a, CIEMAT, Madrid, Spain. 11 Departamento de Fı ´sica, Universidade do Algarve, Faro, Portugal. 12 Grupo de Radiacio ´n Solar, Universidad Polite ´cnica de Valencia, Spain. 13 Repsol YPF, Madrid, Spain. 1 of 15
-
Upload
independent -
Category
Documents
-
view
2 -
download
0
Transcript of Intercomparison of spectroradiometers and Sun photometers for the determination of the aerosol...

Intercomparison of spectroradiometers and Sun photometers for the
determination of the aerosol optical depth during the VELETA-2002
field campaign
V. Estelles,1 M. P. Utrillas,1 J. A. Martınez-Lozano,1 A. Alcantara,2 L. Alados-Arboledas,2
F. J. Olmo,2 J. Lorente,3 X. de Cabo,3 V. Cachorro,4 H. Horvath,5 A. Labajo,6
M. Sorribas,7 J. P. Dıaz,8 A. M. Dıaz,8 A. M. Silva,9 T. Elıas,9 M. Pujadas,10
J. A. Rodrigues,11 J. Canada,12 and Y. Garcıa13
Received 5 April 2005; revised 18 January 2006; accepted 2 May 2006; published 15 September 2006.
[1] In July 2002 the VELETA-2002 field campaign was held in Sierra Nevada (Granada)in the south of Spain. The main objectives of this field campaign were the study of theinfluence of elevation and atmospheric aerosols on measured UV radiation. In the firststage of the field campaign, a common calibration and intercomparison between Licor-1800 spectroradiometers and Cimel-318 Sun photometers was performed in order toassess the quality of the measurements from the whole campaign. The intercomparison ofthe Licor spectroradiometers showed, for both direct and global irradiances, that when thecomparisons were restricted to the visible part of the spectrum the deviations were withinthe instruments’ nominal accuracies which allows us to rely on these instruments formeasuring physical properties of aerosols at the different measurement stations. Asimultaneous calibration on AOD data was performed for the Cimel-318 Sun photometers.When a common calibration and methodology was applied, the deviation was lowered tomuch less than 0.01 for AOD. At the same time an intercomparison has been madebetween the AOD values given by the spectroradiometers and the Sun photometers, withdeviations obtained from 0.01 to 0.03 for the AOD in the visible range, depending on thechannel. In the UVA range, the AOD uncertainty was estimated to be around 0.02 and0.05 for Cimel and Licor respectively. In general the experimental differences were inagreement with this uncertainty estimation. In the UVB range the AOD measurementsshould not be used due to maximum instrumental uncertainties.
Citation: Estelles, V., et al. (2006), Intercomparison of spectroradiometers and Sun photometers for the determination of the aerosol
optical depth during the VELETA-2002 field campaign, J. Geophys. Res., 111, D17207, doi:10.1029/2005JD006047.
1. Introduction
[2] Aerosol optical depth (AOD) and other related aerosolcharacteristics are routinely acquired throughout the world bymeans of well-established international networks such as theAerosol Robotic Network [Holben et al., 1998], GlobalAtmosphere Watch Programme (GAW) (available at http://www.pmodwrc.ch), or SKYNET (http://atmos.cr.chiba-u.ac.jp/aerosol/skynet/). These networks originated in the lastdecade and have been growing continuously with time,increasing the possibilities of long-term aerosol climatolog-
ical studies in many sites across the world. These networksallow us to increase our knowledge of the role of aerosols inclimate change, the effect of pollution on public health, or thevalidity of satellite retrieved products. Obviously, the uncer-tainties of the measurements are directly linked to the qualityof the derived products. This problem is crucial when globalradiative forcing by aerosols is to be determined [Houghton etal., 2001], as the nature and quantity of atmospheric partic-ulate matter are highly variable in space and time.[3] Therefore the assessment and reduction of the uncer-
tainty of the obtained aerosol optical parameters is a key
JOURNAL OF GEOPHYSICAL RESEARCH, VOL. 111, D17207, doi:10.1029/2005JD006047, 2006ClickHere
for
FullArticle
1Grupo de Radiacion Solar, Universitat de Valencia, Valencia, Spain.2Grupo de Fısica de la Atmosfera, Universidad de Granada, Granada,
Spain.3Departemento de Astronomıa i Meteorologıa, Universitat de Barcelona,
Barcelona, Spain.4Grupo de Optica Atmosferica, Universidad de Valladolid, Valladolid,
Spain.5Experimental Physics Institute, University of Vienna, Vienna, Austria.
Copyright 2006 by the American Geophysical Union.0148-0227/06/2005JD006047$09.00
D17207
6Instituto Nacional de Meteorologıa, Madrid, Spain.7Estacion de Sondeos Atmosfericos de El Arenosillo, INTA, Huelva,
Spain.8Departemento de Fısica Basica, Universidad de La Laguna, Spain.9Evora Geophysics Centre, University of Evora, Evora, Portugal.10Departemento de Impacto Ambiental de la Energıa, CIEMAT, Madrid,
Spain.11Departamento de Fısica, Universidade do Algarve, Faro, Portugal.12Grupo de Radiacion Solar, Universidad Politecnica de Valencia,
Spain.13Repsol YPF, Madrid, Spain.
1 of 15

priority for the success of any of the already cited monitor-ing programs. As an example, the AERONET network hasdesigned a carefully planned calibration program in order tomaintain the uncertainty of the field instruments at aminimum [Holben et al., 1998], at the same time thatstudies of the sensibility of the obtained retrievals havebeen published [Dubovik et al., 2002]. The general schememakes the whole program more reliable than other olderprograms, such as the Background Air Pollution MonitoringNetwork (BAPMoN) program which was discontinued in1993 due to a lack of adequate data quality assurance[World Meteorological Organization (WMO), 1994].[4] Occasional field campaigns also benefit from precali-
brations and intercomparisons of their instruments, espe-cially when nonfederated AERONET instruments areemployed, as they usually come from a diversity of inde-pendent research groups that use different calibration strat-egies and aerosol parameter retrieval methodologies.[5] In this paper we analyze the calibration and intercom-
parison issues for the VELETA 2002 field campaign, heldin the Sierra Nevada Mountains (Granada) in southernSpain, from 8 to 22 July 2002. During the first week ofthe campaign, calibrations were obtained for all theinstruments using both laboratory lamps and Langleycalibrations. At the same time these instruments wereintercompared. We present here the results relating to sixLicor 1800 spectroradiometers and six Cimel CE318s. Theanalyzed results make reference to the calibration itself aswell as the values that these instruments provide for theAOD within previous campaigns carried out by otherauthors [Schmid et al., 1999; Mitchell and Forgan, 2003;McArthur et al., 2003]. The importance of the AOD is that itcan be considered the single most comprehensive variableto monitor the atmospheric aerosol load in the atmosphere[Holben et al., 2001] and is a key parameter in remotesensing assessment of aerosol climatology across the world.
2. VELETA-2002 Campaign
[6] The VELETA-2002 field campaign was carried out inJuly 2002 in the area of Sierra Nevada (Spain) [Alados-Arboledas et al., 2003]. This field campaign was designedto obtain experimental data about the effects of altitude andatmospheric aerosols on solar ultraviolet irradiance. For thispurpose a set of radiometers and spectroradiometers wereinstalled on and around the slopes of the Sierra NevadaMassif, from the coast to inland locations. The field stationsincluded Motril, a coastal location at sea level, Pitres locatedon the south slope of the Sierra Nevada Massif, the VeletaPeak, Las Sabinas located on the north slope of themountain range, and Armilla located in the valley near tothe city of Granada.[7] Figure 1 shows the locations of the stations. The
vertical units represent elevation in meters above meansea level. The principal feature of the locations is that theyprovide a strong altitudinal gradient considering that thehorizontal separation from the Veleta Peak does not exceed40 km. An additional feature is the proximity to theMediterranean Sea and North Africa.[8] At each station a Yankee UVB-1 radiometer, similar
to those operated in the Spanish UVB radiation network[Martınez-Lozano et al., 2002], was operated. Additionally,
UV spectral measurements have been performed usingdifferent spectroradiometers including Brewer MK-IV, Ben-tham DM150, Optronic 754, Mechelle 900, and Orielinstruments. A complete coverage of the aerosol load ateach station has been obtained from direct solar radiationextinction measurements obtained by LICOR Li1800 spec-troradiometers equipped with collimator devices. In order toacquire additional information concerning the aerosol char-acteristics over each one of the stations, CIMEL CE318robotic photometers were operated at four locations (ex-cluding the Veleta Peak, 3398 m a.s.l.). In each of themeasurement stations a meteorological station was alsoinstalled to continuously register the surface temperature,relative humidity, pressure and wind speed, and direction.
3. Instrumentation
[9] For the purposes of obtaining the AOD in the visiblerange six Licor 1800 spectroradiometers were used. In thefollowing text these instruments are referred to as BCN(Univ. de Barcelona), UGR (Univ. de Granada), UV (Univ.de Valencia), VAL (Univ. de Valladolid), UPV (Univ.Politecnica de Valencia), and REP (Repsol YPF).[10] The Licor 1800 spectroradiometer is equipped with a
single monochromator that allows measurements in the300–1100 nm range, with a full width at half maximum(FWHM) of approximately 6 nm and a wavelength step of 1nm. The receiver in all the instruments is a Teflon diffuser,except in the VAL instrument in which it is a remote cosinesensor with a fiber optic probe. The main specifications ofall the instruments used are listed in Table 1.[11] Several papers have studied the uncertainty of the
Licor 1800 spectroradiometer [Riordan et al., 1989; Nannand Riordan, 1991; Cachorro et al., 1998;Martınez-Lozanoet al., 2003]. The measurement error with these instrumentsdepends on the spectral region considered. The greateststandard uncertainties (around 20%) correspond to theUVB range due primarily to the very broad slit functionand single monochromator (i.e., stray light). In the visible andnear-infrared regions (400–1000 nm) the standard uncer-tainty in the irradiance, governed by the calibration andmeasurement uncertainties, is 5% [Martınez-Lozano et al.,2003], while in the range between 1000 and 1100 nm thestandard uncertainty can increase significantly because of thesensitivity of the spectroradiometer to external temperature.[12] For the direct irradiance measurements, collimators
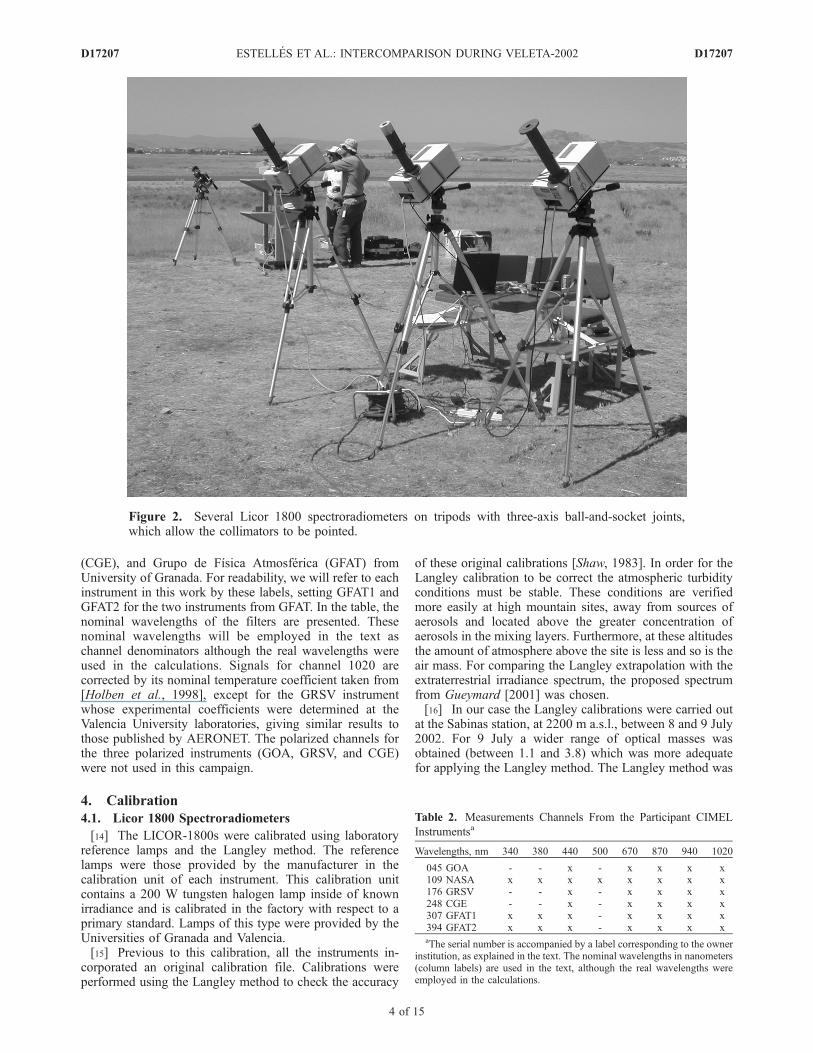
were used which had different FOVs (about 5�). Thecollimators were designed and constructed based on adesign previously developed at the SERI (Solar EnergyResearch Institute), nowadays NREL (National RenewableEnergy Laboratory) [Cannon, 1986]. In all cases, except theVAL instrument, in order to carry out the direct measure-ments a collimator was attached directly over the instru-ments’ entrance. The measurements were made bymounting the complete spectroradiometer on a tripod witha three-axis ball-and-socket joint which, together with theincorporated Sun-pointing viewfinder, allowed the collima-tor to be pointed (see Figure 2). In the VAL case thecollimator was directly adjusted over the remote cosinesensor, and it was this that was mounted on the tripod andball-and-socket joint. The standard uncertainty associatedwith the circumsolar irradiance, which is typical of this type
D17207 ESTELLES ET AL.: INTERCOMPARISON DURING VELETA-2002
2 of 15
D17207

of collimator, has been evaluated by Martınez-Lozano et al.[2003], concluding that, when measuring direct irradiance,the magnitude of the uncertainty is of the order of 0.2%.[13] In addition to these spectroradiometers, six Cimel
CE318 Sun photometers were also used. This automaticinstrument is the standard Sun/sky photometer from theAERONET network [Holben et al., 1998]. It consists of asensor head, equipped with a filter wheel with eightinterference filters, and a temperature sensor for the tem-perature correction of the signal for temperature dependentchannels. A twin collimator tube (FOV 1.2�) is attached tothe double windowed sensor head, in order to measure Sunand sky radiance with two different Si photodiodes. Thescan of each series of eight channels lasts only 10 s,although three direct measurement cycles are taken 30 sapart for cloud discrimination and variability estimation. InTable 2 we show the filters used for the instruments used inthe campaign. The letter labels attached to the serial numberof the instruments stand for Grupo de Optica Atmosferica(GOA) from University of Valladolid, National Aeronautic
and Space Agency (NASA) that corresponds to AERONETinstrument and was lent to the GOA for the campaign,Grupo de Radiacion Solar de Valencia (GRSV) fromUniversity of Valencia, Centro de Geofısica de Evora
Figure 1. Location of the stations over the slice of the GTOPO DEM map from 36.5�N to 37.5�N and3�W to 4�W. The horizontal coordinate system is decimal degrees of latitude and longitude referenced toWGS84.
Table 1. Main Licor 1800 Specifications
Specification Value
Entrance optic PTFE (Teflon) cosine diffuser(except VAL, with remote cosinesensor with a fiber optic probe)
Quantity measured IrradianceGrating, groove mm�1 800Slit dimensions, nm 0.5Filter trip point, nm 348, 418, 558, 678, 775, 938Wavelength range, nm 300–1100Resolution (FWHM), nm 6.25Sampling step, nm 1Collimator FOV 5.7 � (except for VAL, 5.2 �)Detector Silicon PhotodiodeCalibration Standard 1800-02L/ORL815
D17207 ESTELLES ET AL.: INTERCOMPARISON DURING VELETA-2002
3 of 15
D17207
(CGE), and Grupo de Fısica Atmosferica (GFAT) fromUniversity of Granada. For readability, we will refer to eachinstrument in this work by these labels, setting GFAT1 andGFAT2 for the two instruments from GFAT. In the table, thenominal wavelengths of the filters are presented. Thesenominal wavelengths will be employed in the text aschannel denominators although the real wavelengths wereused in the calculations. Signals for channel 1020 arecorrected by its nominal temperature coefficient taken from[Holben et al., 1998], except for the GRSV instrumentwhose experimental coefficients were determined at theValencia University laboratories, giving similar results tothose published by AERONET. The polarized channels forthe three polarized instruments (GOA, GRSV, and CGE)were not used in this campaign.
4. Calibration
4.1. Licor 1800 Spectroradiometers
[14] The LICOR-1800s were calibrated using laboratoryreference lamps and the Langley method. The referencelamps were those provided by the manufacturer in thecalibration unit of each instrument. This calibration unitcontains a 200 W tungsten halogen lamp inside of knownirradiance and is calibrated in the factory with respect to aprimary standard. Lamps of this type were provided by theUniversities of Granada and Valencia.[15] Previous to this calibration, all the instruments in-
corporated an original calibration file. Calibrations wereperformed using the Langley method to check the accuracy
of these original calibrations [Shaw, 1983]. In order for theLangley calibration to be correct the atmospheric turbidityconditions must be stable. These conditions are verifiedmore easily at high mountain sites, away from sources ofaerosols and located above the greater concentration ofaerosols in the mixing layers. Furthermore, at these altitudesthe amount of atmosphere above the site is less and so is theair mass. For comparing the Langley extrapolation with theextraterrestrial irradiance spectrum, the proposed spectrumfrom Gueymard [2001] was chosen.[16] In our case the Langley calibrations were carried out
at the Sabinas station, at 2200 m a.s.l., between 8 and 9 July2002. For 9 July a wider range of optical masses wasobtained (between 1.1 and 3.8) which was more adequatefor applying the Langley method. The Langley method was
Figure 2. Several Licor 1800 spectroradiometers on tripods with three-axis ball-and-socket joints,which allow the collimators to be pointed.
Table 2. Measurements Channels From the Participant CIMEL
Instrumentsa
Wavelengths, nm 340 380 440 500 670 870 940 1020
045 GOA - - x - x x x x109 NASA x x x x x x x x176 GRSV - - x - x x x x248 CGE - - x - x x x x307 GFAT1 x x x - x x x x394 GFAT2 x x x - x x x xaThe serial number is accompanied by a label corresponding to the owner
institution, as explained in the text. The nominal wavelengths in nanometers(column labels) are used in the text, although the real wavelengths wereemployed in the calculations.
D17207 ESTELLES ET AL.: INTERCOMPARISON DURING VELETA-2002
4 of 15
D17207

applied to all the Licor instruments in the wavelength rangefrom 340 to 1100 nm.[17] In Table 3 the values of the relative MAD (Mean
Absolute Difference) (in %) defined as
MAD ¼ 1
n
Xni¼1
Il0 � Ilij j; ð1Þ
are shown for each of the instruments that made measure-ments on 9 July, for the wavebands of the Cimelinstruments. In this expression, Il0 and Ili refer to thecalibration coefficients from the extraterrestrial spectrumgiven by Gueymard [2001] and the Langley derivedcoefficients, respectively. The MAD was employed insteadof the standard deviation because the Gaussian shape of thedifferences distribution is not a priori satisfied. As can beseen, the deviations in the Langley fits against theextraterrestrial irradiance in the visible range were less thanthe given precision of the instruments, except in the case ofthe BCN instrument. This instrument, owing to technicalproblems at the beginning of the morning measured a verysmall range of optical masses for which the results of theLangley method were not valid. Thus for the calibration ofthis instrument the coefficients derived from the laboratoryreference lamp of the Valencia University were used.
4.2. Cimel CE318 Sun Photometers
4.2.1. Simultaneous Langley Calibration[18] Table 4 shows the measurement sites of the different
Cimel instruments during the first phase of the campaign.For the Langley calibration of the instruments, morningsfrom 8 to 11 July were devoted to simultaneously measuringdirect irradiance at Las Sabinas site, 2200 m.a.s.l. Themorning of 9 July was chosen as the most stable after a
careful analysis of the data sets, and therefore preliminarycalculations were made with these calibration factors,except for the failed GFAT2 instrument that used a trans-ferred calibration from GFAT1. When we took the calibra-tion coefficients obtained in this way for the AERONETinstrument, and compare them to the coefficients obtainedfrom AERONET for this Sun photometer, the results inTable 5 were found. In this table we show the deviation, asthe difference between the two values divided by theAERONET value, written in percentage. The correlationcoefficient (R) and the percentual standard deviation of thefit (s) written in terms of V, are also presented. Moreover,the whole available air mass range for this instrument hasbeen used (from 1.3 to 3.5), that is narrower than the otherinstruments air mass ranges (1.3 to 5.0 or 6.0) due todifferences in the deployment time.[19] A sensitivity study of the calibration constants with
the air mass range was previously made for this day. Tworeasons are given: first, a robust calibration should beindependent of slight changes on the plot air mass range[Kuester et al., 2003]. Second, if the instruments havedifferent available air mass ranges, the calibration cannotbe dependent on them. On the contrary, the calibrationcould not be homogeneous, in spite of their simultaneity.These preliminary results showed the calibration to be onlydependent by 0–1% except for the UV channels. TheNASA instrument complete air mass range (up to 3.5) gavegood results in comparison with the AERONET providedcalibration, except for 340 and 380 nm. For these lowestwavelengths, a reduced air mass range gave better results,with a maximum air mass of 2 [Slusser et al., 2000]. Withthis reduced range, the deviations for 340 and 380 nm werefound to be 1.8 and 0.11%. A reason to this calibrationdependence on the air mass could be related to a higherdiffuse and straylight contribution for higher air masses[Slusser et al., 2000]. Calibration of UV filters remains inany case more problematic than visible wavelengths, as theAERONET uncertainty is also higher at this band.[20] In spite of the relatively low deviations found for the
retrieved calibration coefficients, some problems remained.First, not all the mornings at Las Sabinas were stableenough. After a careful analysis of the available data wasmade, only one Langley plot was performed. Usually,several Langley plots are recommended to be performedfor an adequate uncertainty estimation. Second, not all theinstruments were available all four days. Third, each instru-ment started to measure at slightly different times, a few
Table 3. Average Values of the Deviations Between the Extra-
terrestrial Irradiance Value and the Value Obtained Through
Langley Fitting for the Different Instruments Available on 9 July
2002a
MAD, % BCN UGR REP UPV UV VAL
340 56.6 5.4 1.2 3.0 1.0 6.3380 27.2 3.8 3.8 1.9 3.9 3.0440 29.0 0.8 2.1 0.4 5.1 5.0670 8.7 0.5 0.03 0.8 1.3 4.1870 0.4 1.6 0.4 2.4 1.8 2.71020 2.8 8.4 2.4 2.8 2.9 6.5aDeviations are shown for the wavebands of the Cimel instruments.
Table 4. Location of the Cimel Instruments During the First Phase
of the Campaigna
Instrument
8 Jul 9 Jul 10 Jul 11 Jul
m a m a m a m a
GOA (045) X O X + X + +NASA (109) O X + X + + +GRSV (176) X O X + X + + +GFAT1 (307) X O X + X + + +GFAT2 (394) X O X + X + + +CGE (248) X O X + X + + +
aHere the crosses represent the Las Sabinas site, the circle is the Lampcalibration, and the plus symbol is the Armilla site. Here m is morning anda is afternoon.
Table 5. Deviation Between AERONET Provided Calibration
Coefficients and Our Retrieved Coefficients by Langley Plot Fit for
9 July, for NASA Instrument, When the Whole Available Air Mass
Range Was Useda
l, nm s, % R Deviation, %
340 0.40 0.998 3.8380 0.39 0.999 1.9440 0.69 0.996 0.6500 0.26 0.999 0.3670 0.29 0.992 0.9870 0.17 0.98 0.051020 0.15 0.98 0.6
aR stands for the correlation coefficient and s for the standard deviationof the fit (in percentage).
D17207 ESTELLES ET AL.: INTERCOMPARISON DURING VELETA-2002
5 of 15
D17207

minutes, due to deployment delays (the site was notsupervised and the instruments were daily brought fromthe Armilla site; at this time of the year, delays of fewminutes easily lead to no negligible differences in air mass),therefore different air mass ranges were available for eachinstrument. Fourth, one of the Sun photometers (GFAT2)failed due to robot and filter problems. Therefore thisprocedure could not be generalized for all the instrumentsand some of them were not well calibrated or their calibra-tion could not be verified.[21] In addition, the procedure explained above accepts
the AERONET supplied calibration as a reference calibra-tion. The main question that arose at this point is related toits reliability as a reference instrument. As this instrumenthas been only calibrated by comparison with a true refer-ence Sun photometer in Goddard Space Flight Center(GSFC), the calibration could possibly be degraded in sucha way that the uncertainty of our instruments could beunexpectedly high. If we considered the reference instru-ments in AERONET to have an uncertainty in their cali-bration coefficients of around 0.25–0.5% in the visiblerange and 0.5–2.0% in the UV band [Holben et al.,1998] and we accept that this uncertainty could be evendoubled in the transfer process when collocated instrumentsare compared under clear sky conditions [Pietras et al.,2001], we would conclude that the field instruments caneasily reach a calibration uncertainty of 1–2% [Campanelliet al., 2004], higher for UV wavelengths. The uncertainty inour instruments will be higher after a calibration transfer fromthis AERONET field instrument. Even higher errors couldappear in cases of spurious problems in the AERONETinstrument. Errors in the AERONET calibration coefficientshave been previously reported by other authors [Cachorroet al., 2004].4.2.2. Master Langley Calibration and its Transferto the Other Sun Photometers[22] To provide a workable reference in this situation, a
master instrument was selected amongst our available Sunphotometers. The GFAT1 instrument was chosen, mainlybecause it was deployed at the Las Sabinas site, the highestavailable CIMEL site in our field campaign (over2200 m.a.s.l.). Moreover, this instrument measures at allthe wavelengths used in the field campaign and it showedno technical problems in the intercalibration stage comparedunder good conditions.[23] The Langley procedure was applied to the available
morning and afternoon measurements. The results shownhere correspond to Langley plots computed on the totaloptical depth without separation of the contribution ofthe different attenuators at each waveband [Mitchell andForgan, 2003; Schmid and Wehrli, 1995; Kuester et al.,
2003]. In doing this we had to bear in mind that the filters ofthe instruments, excluding the one at 936 nm, correspond tobands of low gaseous absorption. In this sense the use ofdifferent air masses for each atmospheric component pro-vided results that are only slightly different than thoseobtained assuming the same air mass for all of them. Thusfor good quality Langleys the discrepancies between thecalibration coefficients obtained by both methods were lessthan 0.1% [Alcantara et al., 2004].[24] From the available Langley plots retrieved using
morning and afternoon data we have selected those withlower aerosol optical depth (AOD at 670 nm less than 0.09).Finally, three morning and one afternoon Langley plotswere selected. For the selected cases the correlation coef-ficients were always greater than 0.995. The calibrationcoefficients applied were the averages of these four cases. Inall circumstances the selected Langley plots presentedcalibration coefficients for all the channels that differedfrom the average value by less than 3 times the standarddeviation. Table 6 shows the retrieved calibration coeffi-cients, including the average value and the standard error ofthe mean. The last column shows this error in percent. It isimportant to say that this column divided by 100 gives anestimate of the maximum error associated to the aerosoloptical depth in each channel. It is evident that theerrors were close to 0.01 with better results in the longerwavelengths, results that were in the range of those ofAERONET [Holben et al., 1998; Eck et al., 1999]. It mustbe said that during the periods used for the Langleycalibration the total columnar ozone do not vary morethan 5% according to the analyses of the measurementsperformed by a Brewer MKIII at Armilla main station.[25] Once the calibration was performed for this instru-
ment, the coefficients were transferred to the other CimelSun photometers. For the transfer only data that met severalcriteria were accepted. First, the air mass had to be lowerthan 3.5. Second, stable conditions had to be met, to avoidrapid changes in the optical depth that could have led tohidden trends in the coefficient ratios. Third, measurementshad to be simultaneous or within 5 s difference.[26] After these criteria were met, a 3s filter was applied
to the obtained ratio datasets, and a mean value and standarddeviation were calculated for each instrument and wave-length. The uncertainty for the transferred calibration coef-ficients was estimated to be the sum of the uncertainty of thereference coefficients and the standard deviation from theratio data set. This estimated uncertainty was 1–2%,depending on wavelength and coincident with AERONETfield instruments calibration uncertainties [Campanelli etal., 2004].[27] The deviation shown in Table 7 refers to the com-
parison between the AERONET supplied calibration coef-ficients for 109 and the 109 new coefficients resulting fromthe GFAT1 transfer. As can be seen in this table, the percentdifferences were not high in most cases, taking into accountthat the nominal uncertainty for calibration coefficients fromAERONET field instruments is around 1–2%. Therefore ingeneral, we can consider our procedure to have been veryconsistent in comparison with the AERONET calibration.[28] The exceptions were the 340 nm and 670 nm
channels. A possible reason for such a high deviation forchannel 340 nm could be related to the air mass range
Table 6. Retrieved Calibration Coefficientsa
Wavelength,nm V0
Standard Errorof the Mean % Error
340 21024.29 244.46 1.16380 33057.31 329.16 1.00440 3971.52 27.83 0.70670 9508.00 37.51 0.39870 4936.30 25.72 0.521020 3526.47 19.56 0.55
aAverage value and standard error of the mean.
D17207 ESTELLES ET AL.: INTERCOMPARISON DURING VELETA-2002
6 of 15
D17207

employed in the Langley plot. As mentioned before, in thework of Holben et al. [1998] it is stated that the UVchannels have a higher uncertainty in their calibrationcoefficients even for the master instruments (0.5–2.0%).The optimum air mass range for performing a Langley plotin the UV range is not completely agreed [Slusser et al.,2000; Morys et al., 2001] (http://aeronet.gsfc.nasa.gov/)leaving an inherent difficulty in calibration and therefore ahigher resulting uncertainty. However, for channel 670 nm,the problem probably comes (at least in part) from theAERONET calibration. Two reasons were found: on onehand, the results of another Langley calibration performedon the GFAT instruments after the end of the campaignconfirmed the calibration coefficients obtained within thefield campaign; and on the other hand, the aerosol opticaldepth spectra became smoother when our retrieved valuewas used instead of the AERONET supplied coefficients.The slight difference on central wavelengths from NASAand GFAT1 filters in the cross-calibration stage [Pietras etal., 2001] would not explain this deviation.
5. Intercomparison
5.1. Licors 1800 Intercomparison
[29] The intercomparisons between the Licor 1800s wereperformed in Armilla during 10 and 11 July including bothglobal and direct irradiances. Measurements were takenfrom 0600 to 1800 UTC every 15 min, alternating globaland direct irradiance measurements. Each scan has a lengthof 27 s. As an indicator of the goodness of the comparisonthe MAD (in %) was used. We analyzed first the spectralmeasurement series using the original calibration file ofeach instrument, i.e., the last calibration available for eachinstrument before the field campaign, obtained routinely bythe instrument owners. Figure 3 shows the spectral globalirradiance measurements corresponding to 10 and 11 July atsolar noon. In Figure 4 the average values of MAD (in %)are summarized for the visible range (400–670 nm)corresponding to the relative values for each day, for eachpair of instruments. These average values refer to theaverage MAD corresponding to the 271 spectral values ofall the measurements available each day. This type ofanalysis was chosen for instrument pairs instead of takingthe average value of the weighted results as a reference as isusual in this sort of intercomparison [Labajo et al., 2004] inorder to better detect possible malfunction in specificinstruments. It should be noted that no measurement serieshas been excluded, having included all the series taken from0600 solar time to 1800 solar time, despite the deviationsdetected in a previous work in relation to the global
irradiance measurements for zenith angles greater than 60�[Martınez-Lozano et al., 2003]. Table 8 summarizes theaverage MAD values (in %) for each of the instrument pairsfor the wavebands of the Cimel instruments. From Table 8 itcan be seen that all pairs of instruments showed acceptableresults, around 5% which is the instruments’ uncertainty,except those pairs including the VAL instrument for wave-lengths lower that 670 nm. It should be remembered thatthis instrument was the only one that used a differentmeasurement procedure to the rest with a fiber opticconnected to a remote cosine sensor mounted over theoptical window.
Table 7. Deviation Between AERONET Provided Calibration
Coefficients and Our Transferred Coefficients From GFAT1
Instrument, for 109 Unit
l, nm Deviation, %
340 4.0380 0.4440 0.5670 1.6870 0.4936 0.81020 0.3
Figure 3. Global spectral irradiance measurements takenwith the different Licor 1800s at Armilla at solar noon.
D17207 ESTELLES ET AL.: INTERCOMPARISON DURING VELETA-2002
7 of 15
D17207

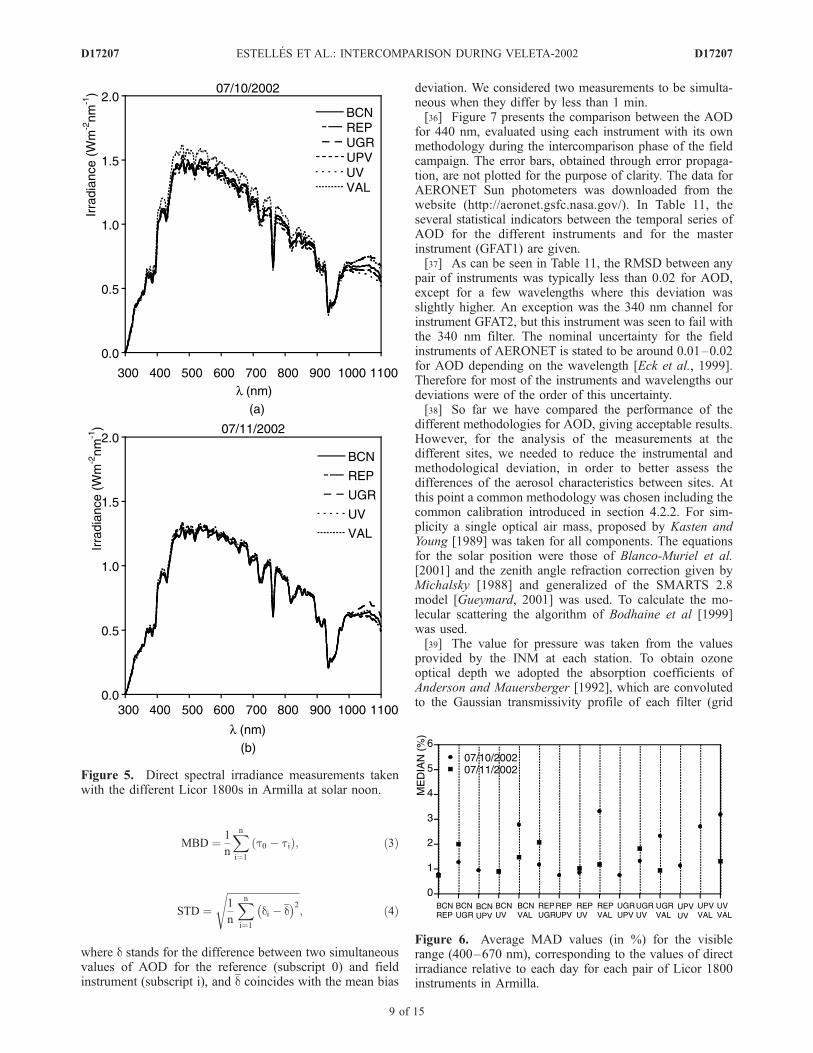
[30] A similar analysis to the previous one has been carriedout for the measurements of direct irradiance. Figure 5 showsthe spectral direct irradiance measurements at solar nooncorresponding to 10 and 11 July, respectively. Figure 6summarizes the average MAD values (in %) for the visiblerange (400–670 nm) corresponding to all the relative valuesfor each day, for each pair of instruments. It should be notedthat the UPV instrument did not measure direct irradiance on11 July due to a software problem. In Table 8 the averageMAD values (in %) are summarized for each instrument pairfor the wavebands of the Cimel instruments.[31] From Table 8 it can be seen that in the case of the
BCN instrument the errors were a little higher than the rest,whilst those involving comparisons with the VAL instru-ment gave errors notably greater than the rest of the instru-ments. The UGR, REP, UPV, and UV instruments presentedvery similar and highly accurate results.[32] All the Licor instruments were recalibrated by the
Langley plot method, except BCN and VAL units, whichcalibration was carried out with the LICOR 1800-02 lampfrom the University of Valencia. The BCN and VALwere theonly two instrument not calibrated right before the field
campaign. After applying the new calibration, the previousanalysis was repeated, giving the results shown in Table 9. Inthis case, for the direct irradiance, all the deviations stayedbelow 3% in the visible range, the established error for thistype of measurement for these instruments [Martınez-Lozanoet al., 2003]. Table 8 allows us to get information on thecalibration stability of Licor instruments, particularly in theUV range.[33] This allows us to affirm that the Licors are adequate
instruments for measuring direct solar irradiance, and theresults that they give are comparable, even when the optics ofthe receiver and the FOVof the collimator are different. Forglobal irradiance the results were somewhat similar, in allcases the deviation was less than 5% (the established preci-sion of these instruments for these measurements).
5.2. Cimel CE318 Intercomparison
[34] The intercomparison of the Cimel 318 instrumentswas carried out based on the measurements they provided ofthe AOD. The determination of AOD is affected by a seriesof factors such as: the calibration, the optical mass, theRayleigh dispersion model, and the absorption coefficientsof O3, H2O, and NO2. A preliminary comparison of AODwas made after the initial calibration was completed, asdiscussed in section 4.2.1. As the instruments were operatedindividually by the different research groups, several differ-ences were present in the methodology employed forcalculating AOD. AERONET methodology can be foundelsewhere [Holben et al., 1998]. In Table 10 the maindifferences in the other computation methodologies arepresented. Here we show the results in order to point outthe importance of getting a common methodology whendata from different instruments are being used.[35] For the quantitative comparison, several statistical
indicators were used. These were the root mean squareddeviation (RMSD), the mean bias deviation (MBD), and thestandard deviation of the differences (STD).
RMSD ¼ffiffiffiffiffiffiffiffiffiffiffiffiffiffiffiffiffiffiffiffiffiffiffiffiffiffiffiffiffiffiffiffi1
n
Xni¼1
t0 � t1ð Þ2s
; ð2Þ
Figure 4. Average MAD values (in %), for the visiblerange (400–670 nm), corresponding to all the values ofglobal irradiance relative to each day for each pair of Licor1800 instruments in Armilla.
Table 8. Average MAD Values, %, Corresponding to Direct and Global Irradiance for the 2 Days of the
Intercomparison, for Each Pair of Instruments, in the Wavebands of the Cimel Instrumentsa
GLOBAL DIRECT
MAD, % 340 380 440 670 870 1020 340 380 440 670 870 1020BCN-REP 33.8 26.7 8.9 2.7 2.6 1.0 32.0 25.0 7.2 0.8 1.4 1.6BCN-UGR 31.1 28.8 7.4 2.4 2.1 4.7 32.8 28.4 8.4 2.3 2.2 3.5BCN-UPV 31.1 28.5 8.2 1.4 1.7 2.0 31.9 28.0 7.9 1.1 1.7 1.7BCN-UV 28.0 27.7 5.5 1.4 1.7 4.3 27.4 27.3 6.6 1.4 1.2 3.1BCN-VAL 27.9 30.1 15.8 7.6 4.3 3.6 29.1 31.2 15.8 8.4 4.5 2.7REP-UGR 3.0 1.9 2.1 1.5 1.0 5.8 1.6 3.3 3.3 1.6 1.1 7.5REP-UPV 2.4 1.2 1.0 1.6 1.0 1.9 1.8 2.4 2.4 0.6 0.9 2.9REP-UV 5.2 1.8 2.9 2.5 3.0 1.8 3.9 3.3 3.3 1.0 1.5 1.4REP-VAL 3.1 6.9 10.3 8.1 4.7 4.3 2.5 7.0 9.0 8.3 3.7 4.8UGR-UPV 1.4 1.1 1.1 0.6 0.6 3.7 0.7 0.5 0.5 1.3 1.4 4.8UGR-UV 3.4 1.0 1.0 1.5 2.3 8.1 4.3 1.0 1.0 1.7 2.1 8.1UGR-VAL 3.0 4.7 12.0 9.5 5.6 2.2 3.6 3.3 8.3 6.9 2.9 2.5UPV-UV 2.1 1.3 1.7 1.5 3.0 4.9 2.8 1.4 1.4 1.2 1.4 3.8UPV-VAL 3.7 5.6 10.2 8.9 5.1 2.7 1.8 6.0 10.3 9.4 5.5 3.2UV-VAL 2.9 5.6 13.1 10.4 7.9 7.2 2.6 5.0 10.0 8.5 5.1 6.8
aAnalysis performed using the original calibration file of each instrument.
D17207 ESTELLES ET AL.: INTERCOMPARISON DURING VELETA-2002
8 of 15
D17207
MBD ¼ 1
n
Xni¼1
t0 � tið Þ; ð3Þ
STD ¼ffiffiffiffiffiffiffiffiffiffiffiffiffiffiffiffiffiffiffiffiffiffiffiffiffiffiffiffiffi1
n
Xni¼1
di � d� �2s
; ð4Þ
where d stands for the difference between two simultaneousvalues of AOD for the reference (subscript 0) and fieldinstrument (subscript i), and d coincides with the mean bias
deviation. We considered two measurements to be simulta-neous when they differ by less than 1 min.[36] Figure 7 presents the comparison between the AOD
for 440 nm, evaluated using each instrument with its ownmethodology during the intercomparison phase of the fieldcampaign. The error bars, obtained through error propaga-tion, are not plotted for the purpose of clarity. The data forAERONET Sun photometers was downloaded from thewebsite (http://aeronet.gsfc.nasa.gov/). In Table 11, theseveral statistical indicators between the temporal series ofAOD for the different instruments and for the masterinstrument (GFAT1) are given.[37] As can be seen in Table 11, the RMSD between any
pair of instruments was typically less than 0.02 for AOD,except for a few wavelengths where this deviation wasslightly higher. An exception was the 340 nm channel forinstrument GFAT2, but this instrument was seen to fail withthe 340 nm filter. The nominal uncertainty for the fieldinstruments of AERONET is stated to be around 0.01–0.02for AOD depending on the wavelength [Eck et al., 1999].Therefore for most of the instruments and wavelengths ourdeviations were of the order of this uncertainty.[38] So far we have compared the performance of the
different methodologies for AOD, giving acceptable results.However, for the analysis of the measurements at thedifferent sites, we needed to reduce the instrumental andmethodological deviation, in order to better assess thedifferences of the aerosol characteristics between sites. Atthis point a common methodology was chosen including thecommon calibration introduced in section 4.2.2. For sim-plicity a single optical air mass, proposed by Kasten andYoung [1989] was taken for all components. The equationsfor the solar position were those of Blanco-Muriel et al.[2001] and the zenith angle refraction correction given byMichalsky [1988] and generalized of the SMARTS 2.8model [Gueymard, 2001] was used. To calculate the mo-lecular scattering the algorithm of Bodhaine et al [1999]was used.[39] The value for pressure was taken from the values
provided by the INM at each station. To obtain ozoneoptical depth we adopted the absorption coefficients ofAnderson and Mauersberger [1992], which are convolutedto the Gaussian transmissivity profile of each filter (grid
Figure 5. Direct spectral irradiance measurements takenwith the different Licor 1800s in Armilla at solar noon.
Figure 6. Average MAD values (in %) for the visiblerange (400–670 nm), corresponding to the values of directirradiance relative to each day for each pair of Licor 1800instruments in Armilla.
D17207 ESTELLES ET AL.: INTERCOMPARISON DURING VELETA-2002
9 of 15
D17207

function) where possible using the effective wavelength ofthe channel rather than the nominal wavelength. Also forsimplicity a unique daily value of column ozone, providedby GOME, was used. Brewer measurements were not usedas they were available only for Armilla site, and usually forthe used spectral windows the differences between Brewerand GOME values do not lead to considerable differences inAOD. For the calculation of the optical depth of water vaporand NO2 we adopted the SMARTS 2.8 model algorithm[Gueymard, 2001]. For the content of each gas we consid-ered the MLS (Middle Latitude Summer) standard values,corrected by height. This input showed to be better thancolumnar water vapor contents estimated from RH measure-ments. No independent measurements of NO2 content wereavailable, but the area is not polluted. Again, the absorptioncoefficients of water vapor and NO2 were convoluted forthe transmissivity profiles of each channel. In each case anassumed profile based on a Gaussian centered on theeffective wavelength, with half width taken from the nom-inal filter bandpass, was used.[40] In Figure 8 we show the compared behavior of the
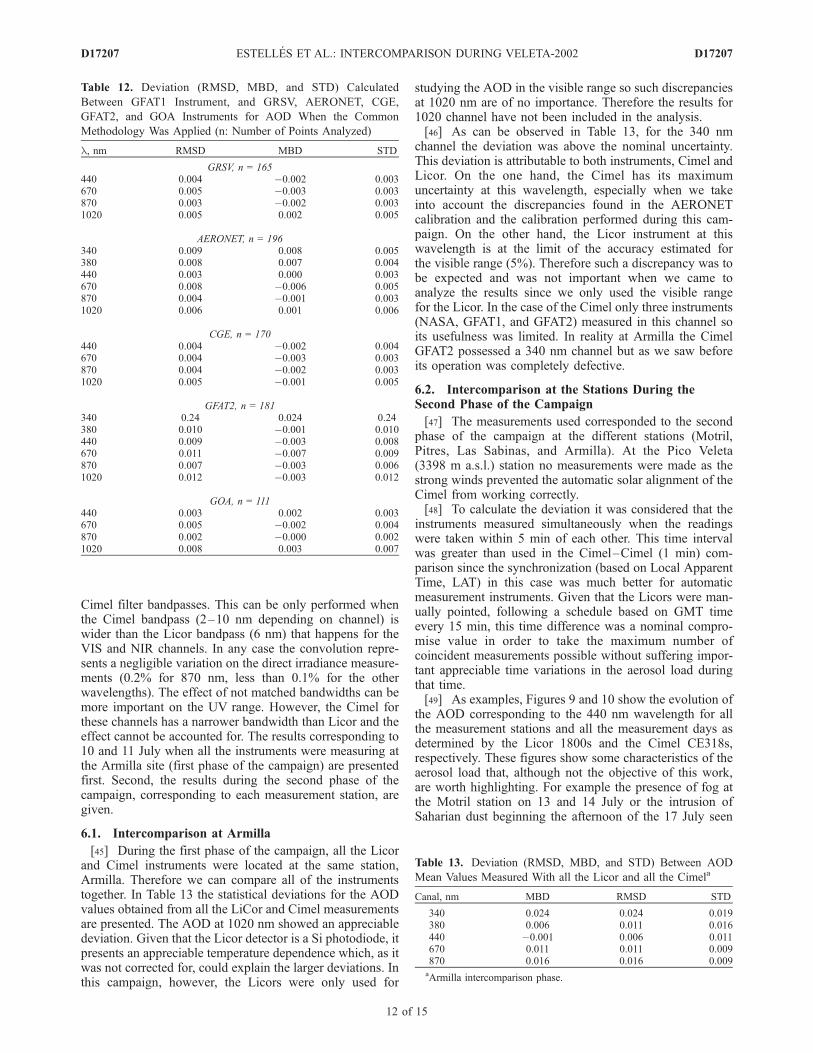
AOD, obtained with a common methodology and calibra-tion source, during the intercomparison phase of the fieldcampaign. In Table 12 the new deviations are presented. Ascan be seen in this table, the deviations between thedifferent instruments decreased considerably compared toTable 12, and therefore we can confidently attempt tocompare AOD for the instruments when deployed at thedifferent sites for the field campaign, with a deviation in theretrievals that is well within the uncertainty.[41] However, the deviation in Table 12 should not be
understood as an improvement on the retrievals, as compared
to results from Table 11, but rather it points out onlyminimized differences. It will be useful for later analyzingthe atmospheric differences between the sites. In Figure 8 theerror bars are not presented for clarity purposes although theywere obtained again by the use of the error propagationmethod. The AOD maximum uncertainty computed in thisway is very consistent with the nominal value 0.01–0.02from Eck et al. [1999], although variable with the airmassduring the day. This uncertainty is obviously dependent onthe uncertainty of the calibration and the estimated uncer-tainty of the employed methodologies and input values. ForAOD, it can be seen how the deviation was higher for theGFAT2 instrument. This deviationwasmaximum for 340 nm,related to a problem with the filter and the pointing system.These data have not been used for the analysis of thecampaign, at least without a manual quality screening.
6. Intercomparison Licor-Cimel for AODMeasurements
[42] The comparison Licor-Cimel is only possible fromthe values of AOD. The AOD with the Licor 1800 wasdetermined from the spectral irradiance measurements atnormal incidence using the Bouger-Lambert-Beer exponen-tial law, by following a series of steps which have beendescribed by the authors in previous works [see, e.g.,Martınez-Lozano et al., 2001; Pedros et al., 2003]. Wecan summarize these steps by noting that the total opticaldepth can be expressed as the sum of the optical depthsrelated to the different atmospheric components:
tTl ¼ tRl þ tal þ tOl þ twl þ tNl ð5Þ
Table 9. Average MAD Values, %, Corresponding to Direct and Global Irradiance for the 2 Days of the
Intercomparison, for Each Pair of Instruments, in the Wavebands of the Cimel Instrumentsa
GLOBAL DIRECT
MAD, % 340 380 440 670 870 1020 340 380 440 670 870 1020BCN-REP 1.9 1.8 1.8 1.7 1.9 2.2 1.3 3.4 3.4 0.7 0.8 2.2BCN-UGR 1.5 1.4 1.3 1.3 1.3 3.4 0.6 0.8 0.8 1.4 1.5 5.4BCN-UPV 1.8 0.5 1.3 0.8 1.5 1.4 1.3 0.6 0.6 0.6 1.0 1.6BCN-UV 3.8 1.7 1.5 1.2 1.7 3.3 4.5 1.3 1.3 0.9 0.9 3.1BCN-VAL 3.4 3.4 2.8 2.6 2.0 2.6 4.5 2.6 2.6 1.5 1.5 0.8REP-UGR 2.0 1.8 2.1 1.5 0.9 5.0 1.4 3.0 3.0 1.4 1.0 7.0REP-UPV 2.3 1.2 0.9 1.6 0.9 1.8 1.8 2.4 2.4 0.6 0.9 2.9REP-UV 5.0 1.4 2.4 2.5 2.5 1.8 3.9 3.3 3.0 1.0 1.5 1.4REP-VAL 2.7 2.9 1.3 3.5 2.8 2.6 3.4 1.5 1.5 2.3 1.8 3.1UGR-UPV 1.4 1.1 1.1 0.6 0.6 3.5 0.7 0.5 0.5 1.2 1.4 4.0UGR-UV 3.0 1.0 0.9 1.5 2.3 6.1 4.0 1.0 1.0 1.5 2.1 7.1UGR-VAL 2.4 2.7 3.5 2.2 2.6 3.7 4.4 2.5 2.5 1.2 1.1 4.0UPV-UV 2.1 1.3 1.7 1.5 2.6 4.9 2.8 1.4 1.4 1.2 1.2 3.8UPV-VAL 3.0 2.8 2.3 2.3 2.5 2.2 1.6 1.5 1.5 2.8 2.9 1.4UV-VAL 1.4 1.7 5.2 3.7 4.7 5.3 1.5 1.3 1.3 2.7 2.9 4.9
aAnalysis performed using the new calibration files for the BCN and VAL instruments.
Table 10. Main Differences in the Preliminary Methodology Employed for AOD Retrieval With Cimel Instruments
GOA GRSV CGE GFAT (1 and 2)
Calibration source VELETA Langley VELETA Langley VELETA Langley VELETA MasterAir mass Plane parallel Kasten and Young [1989] Plane parallel Gueymard [2001]Rayleigh scattering Gueymard [2001] Bodhaine [1999] Hansen and Travis [1974] Gueymard [2001]Ozone content TOMS Microtops II TOMS Sounding (corrected)Water absorption None Gueymard [2001] None NoneNO2 absorption None Gueymard [2001] None Gueymard [2001]Solar position Iqbal [1983] Blanco-Muriel et al. [2001] Iqbal [1983] Blanco-Muriel et al. [2001]Refraction correction None Michalsky [1998] None None
D17207 ESTELLES ET AL.: INTERCOMPARISON DURING VELETA-2002
10 of 15
D17207

where tRl is the molecular scattering optical depth (whichis usually calculated using the Rayleigh approximation), talis the aerosol extinction optical depth, and tOl, twl and tNlare the optical depths due to O3, H2O and NO2 absorption,respectively. The absorption due to NO2 has not beenconsidered due to the rural character of the measurementsite, leaving equation (5) as follows:
tTl ¼ tRl þ tal þ tOl ð6Þ
To determine tTl we employed the values of theextraterrestrial spectrum proposed by the SMARTS2 model[Gueymard, 2001], smoothing the data to the band pass ofour spectroradiometer. For the air mass, the empiricalexpression proposed by Kasten and Young [1989] was used.The Rayleigh optical depth was calculated from theapproximation of Bodhaine et al. [1999], and the ozoneabsorption coefficients from Anderson and Mauersberger[1992] were assumed.[43] Error propagation methods were applied to obtain the
AOD error. Utrillas [1995] developed a simplified methodto estimate the error associated with the AOD valuesretrieved from spectral irradiance measurements. Thismethod is similar to that developed by Russell et al. [1993]and Schmid et al. [1997]. In our case the error in the AOD ismainly conditioned by the error in the measurement of thedirect spectral irradiance and thevalueof theoptical airmass atthe instant of the measurement. The authors have previouslyused this method with experimental measurements made atother sites, and the values that were obtained were similar tothose presented by Kaufman et al [1994].[44] The results of the intercomparisons of the Licor-
Cimel AOD measurements are presented below. The wave-lengths used for this intercomparison were thosecorresponding to the Cimel central wavelengths, after con-voluting the Licor irradiance measurements to match the
Figure 7. Comparison of the evolution of AOD during theintercomparison, obtained with independent methodologiesfor the different instruments.
Table 11. Deviation (RMSD, MBD and STD) Calculated
Between GFAT1 Instrument, and GRSV, AERONET, CGE,
GFAT2, and GOA Instruments for AOD (n: Number of Points
Analyzed)
l, nm RMSD MBD STD
GRSV, n = 165440 0.019 0.018 0.008670 0.013 0.011 0.007870 0.011 0.008 0.0071020 0.012 0.009 0.008
AERONET, n = 196340 0.019 �0.007 0.018380 0.022 0.015 0.016440 0.019 0.016 0.010670 0.017 0.016 0.004870 0.012 0.011 0.0071020 0.014 0.011 0.010
CGE, n = 170440 0.020 0.016 0.012670 0.008 �0.001 0.008870 0.013 0.011 0.0071020 0.014 0.012 0.007
GFAT2, n = 181340 0.71 0.69 0.15380 0.012 �0.003 0.012440 0.010 �0.002 0.010670 0.010 �0.001 0.010870 0.007 �0.002 0.0071020 0.014 �0.003 0.014
GOA, n = 111440 0.019 0.018 0.008670 0.011 0.009 0.007870 0.011 0.008 0.0071020 0.015 0.010 0.011
Figure 8. Comparison of the evolution of AOD during theintercomparison, obtained with a common methodology andcalibration source.
D17207 ESTELLES ET AL.: INTERCOMPARISON DURING VELETA-2002
11 of 15
D17207
Cimel filter bandpasses. This can be only performed whenthe Cimel bandpass (2–10 nm depending on channel) iswider than the Licor bandpass (6 nm) that happens for theVIS and NIR channels. In any case the convolution repre-sents a negligible variation on the direct irradiance measure-ments (0.2% for 870 nm, less than 0.1% for the otherwavelengths). The effect of not matched bandwidths can bemore important on the UV range. However, the Cimel forthese channels has a narrower bandwidth than Licor and theeffect cannot be accounted for. The results corresponding to10 and 11 July when all the instruments were measuring atthe Armilla site (first phase of the campaign) are presentedfirst. Second, the results during the second phase of thecampaign, corresponding to each measurement station, aregiven.
6.1. Intercomparison at Armilla
[45] During the first phase of the campaign, all the Licorand Cimel instruments were located at the same station,Armilla. Therefore we can compare all of the instrumentstogether. In Table 13 the statistical deviations for the AODvalues obtained from all the LiCor and Cimel measurementsare presented. The AOD at 1020 nm showed an appreciabledeviation. Given that the Licor detector is a Si photodiode, itpresents an appreciable temperature dependence which, as itwas not corrected for, could explain the larger deviations. Inthis campaign, however, the Licors were only used for
studying the AOD in the visible range so such discrepanciesat 1020 nm are of no importance. Therefore the results for1020 channel have not been included in the analysis.[46] As can be observed in Table 13, for the 340 nm
channel the deviation was above the nominal uncertainty.This deviation is attributable to both instruments, Cimel andLicor. On the one hand, the Cimel has its maximumuncertainty at this wavelength, especially when we takeinto account the discrepancies found in the AERONETcalibration and the calibration performed during this cam-paign. On the other hand, the Licor instrument at thiswavelength is at the limit of the accuracy estimated forthe visible range (5%). Therefore such a discrepancy was tobe expected and was not important when we came toanalyze the results since we only used the visible rangefor the Licor. In the case of the Cimel only three instruments(NASA, GFAT1, and GFAT2) measured in this channel soits usefulness was limited. In reality at Armilla the CimelGFAT2 possessed a 340 nm channel but as we saw beforeits operation was completely defective.
6.2. Intercomparison at the Stations During theSecond Phase of the Campaign
[47] The measurements used corresponded to the secondphase of the campaign at the different stations (Motril,Pitres, Las Sabinas, and Armilla). At the Pico Veleta(3398 m a.s.l.) station no measurements were made as thestrong winds prevented the automatic solar alignment of theCimel from working correctly.[48] To calculate the deviation it was considered that the
instruments measured simultaneously when the readingswere taken within 5 min of each other. This time intervalwas greater than used in the Cimel–Cimel (1 min) com-parison since the synchronization (based on Local ApparentTime, LAT) in this case was much better for automaticmeasurement instruments. Given that the Licors were man-ually pointed, following a schedule based on GMT timeevery 15 min, this time difference was a nominal compro-mise value in order to take the maximum number ofcoincident measurements possible without suffering impor-tant appreciable time variations in the aerosol load duringthat time.[49] As examples, Figures 9 and 10 show the evolution of
the AOD corresponding to the 440 nm wavelength for allthe measurement stations and all the measurement days asdetermined by the Licor 1800s and the Cimel CE318s,respectively. These figures show some characteristics of theaerosol load that, although not the objective of this work,are worth highlighting. For example the presence of fog atthe Motril station on 13 and 14 July or the intrusion ofSaharian dust beginning the afternoon of the 17 July seen
Table 12. Deviation (RMSD, MBD, and STD) Calculated
Between GFAT1 Instrument, and GRSV, AERONET, CGE,
GFAT2, and GOA Instruments for AOD When the Common
Methodology Was Applied (n: Number of Points Analyzed)
l, nm RMSD MBD STD
GRSV, n = 165440 0.004 �0.002 0.003670 0.005 �0.003 0.003870 0.003 �0.002 0.0031020 0.005 0.002 0.005
AERONET, n = 196340 0.009 0.008 0.005380 0.008 0.007 0.004440 0.003 0.000 0.003670 0.008 �0.006 0.005870 0.004 �0.001 0.0031020 0.006 0.001 0.006
CGE, n = 170440 0.004 �0.002 0.004670 0.004 �0.003 0.003870 0.004 �0.002 0.0031020 0.005 �0.001 0.005
GFAT2, n = 181340 0.24 0.024 0.24380 0.010 �0.001 0.010440 0.009 �0.003 0.008670 0.011 �0.007 0.009870 0.007 �0.003 0.0061020 0.012 �0.003 0.012
GOA, n = 111440 0.003 0.002 0.003670 0.005 �0.002 0.004870 0.002 �0.000 0.0021020 0.008 0.003 0.007
Table 13. Deviation (RMSD, MBD, and STD) Between AOD
Mean Values Measured With all the Licor and all the Cimela
Canal, nm MBD RMSD STD
340 0.024 0.024 0.019380 0.006 0.011 0.016440 �0.001 0.006 0.011670 0.011 0.011 0.009870 0.016 0.016 0.009aArmilla intercomparison phase.
D17207 ESTELLES ET AL.: INTERCOMPARISON DURING VELETA-2002
12 of 15
D17207

first at Motril (on the south side of the Sierra Nevada) andlater on the 18 July at the other measurement stations.[50] Table 14 gives the deviations for each of the stations
and for each measurement wavelength. From this table canbe seen once again that the deviations between optical depthusing the Cimels and the Licors in the visible range wasaround 0.01–0.03, depending on the channel and themeteorological conditions at the station. In all cases thesedeviations continued to be within the Licor uncertainty,ranging between 0.02 and 0.05, although they were occa-
sionally above the nominal errors of the Cimel at 0.01–0.02.
7. Conclusions
[51] In relation to the Langley calibration of the Licor1800s the constant values obtained for each of the spectror-adiometers have been analyzed and the results showed thatfor the visible spectrum it was possible to reproduce in allcases the extraterrestrial irradiance within the range ofexperimental errors.[52] The intercomparison of the Licor spectroradiometers,
both for direct and global irradiance measurements, showedthat when the entire spectral band was used the errors(average MAD in %) were almost all less than the instru-ment error. If the values were restricted to the visible rangethe errors between them were even less. These results forthe behavior of the Licor-1800s used in the VELETA-2002campaign allow us to affirm, by different methods, thesuitability of these instruments for use at different measure-ment stations to obtain the physical properties of aerosols.[53] A simultaneous calibration on AOD data was under-
taken for the Cimel-318 Sun photometers, in order to assesstheir uncertainty and validity. Preliminary results withindependent calibration and methodologies for each instru-ment showed that acceptable results could be achievedwhen compared with a field AERONET instrument, witha deviation mostly below 0.02 for AOD. However, ifaerosol properties need to be compared between differentsites at different heights, the deviation should be reduced inorder to better identify the differences due only to aerosols,and not to instrumentation or methodology. Once thiscommon calibration and methodology was applied, thedeviation diminished to much less than 0.01 for AOD, also
Figure 9. AOD for 440 nm determined by the Licor1800s, for all the stations and all the days of the secondphase of the measurement campaign.
Figure 10. AOD for 440 nm determined by the Cimel318s, for all the stations and all the days of the second phaseof the measurement campaign.
Table 14. Average Deviations (in RMSD) for Each Measurement
Station and for Each Selected Wavelengtha
Canal, nm RMSD MBD STD
Motril. Cimel GRSV-Licor GRSV, n = 86440 0.011 0.000 0.011670 0.021 �0.018 0.013870 0.027 �0.024 0.012
Armilla. Cimel CGE- Licor REPSOL, n = 133440 0.015 �0.009 0.012670 0.014 �0.011 0.009870 0.013 �0.010 0.009
Pitres. Cimel NASA-Licor GOA, n = 128340 0.099 �0.093 0.033380 0.033 �0.030 0.013440 0.016 0.010 0.026500 0.011 0.003 0.010670 0.010 0.001 0.019870 0.018 �0.016 0.008
Las Sabinas. Cimel UGR1-Licor UGR, n = 118340 0.024 �0.021 0.012380 0.013 0.007 0.022440 0.013 0.011 0.019670 0.005 0.003 0.009870 0.009 �0.007 0.005aMeasurements were considered simultaneous when they differed by less
than 5 min (n: number of points analyzed).
D17207 ESTELLES ET AL.: INTERCOMPARISON DURING VELETA-2002
13 of 15
D17207

compared with AERONET values, and was well within theuncertainty of the measurements.[54] An intercomparison was made between the AOD
values provided by the spectroradiometers and by the Sunphotometers giving a deviation between the results obtainedfor the optical depth using the Cimels and the Licors in thevisible range from 0.01–0.03, depending on the channeland the meteorological conditions at each station. In someinstance the deviation was above the nominal uncertainty ofthe Cimel (0.01–0.02) although always within the nominaluncertainty of the Licor (0.02–0.05).[55] On the UVA range, from the estimated uncertainty on
the calibration values of Cimel and Licor channels, weestimated the largest uncertainty on AOD (0.02 and 0.05 forCimel and Licor respectively at 340 nm). These values werein agreement with the differences found in the Cimel–Cimel and Cimel–Licor comparisons, except for the GOALicor (due to its optical probe) and the GFAT2 Cimel at340 nm (due to a defective filter).[56] Finally, it must be pointed out that as one of the
objectives of the field campaign is ‘‘to obtain experimentaldata about the effects of atmospheric aerosols on solarultraviolet irradiance,’’ its usefulness will be limited at theUVA spectral range, due to instrumental uncertainties on thedetermination of the aerosol optical depth in the UVBspectral range.
[57] Acknowledgments. This work was financed by CICYT-MCYTthrough the Coordinated Project CLI2000-0903. V. Estelles, A. Alcantara,and A.M. Dıaz currently hold research grants from the CICYT. Thanks tothe MADOC, at the Base Aerea de Armilla, the Parque Nacional de SierraNevada, and the Ayuntamientos de Pitres and Motril for the support giventhroughout the campaign. We also would like to acknowledge B. Holbenand other AERONET people for the 109 instrument and its data availability.
ReferencesAlados-Arboledas, L., et al. (2003), VELETA 2002 field campaign, Geo-phys. Res. Abstr., 5, 12,218.
Alcantara, A., F. J. Olmo, and L. Alados-Arboledas (2004), Langley cali-brations of sunphotometer at Sierra Nevada, Granada, Spain, Opt. PuraApl., 37, 3263.
Anderson, S. M., and K. Mauersberger (1992), Measurements of ozoneabsorption cross section in the Chappuis band, Geophys. Res. Lett., 19,933.
Blanco-Muriel, M., D. C. Alarcon-Padilla, T. Lopez-Moratalla, andM. Lara-Coira (2001), Computing the solar vector, Solar Energy,70, 431.
Bodhaine, B. A., N. B. Wood, E. G. Dutton, and J. R. Slusser (1999), OnRayleigh optical depth calculations, J. Atmos. Oceanic Technol., 16,1854.
Cachorro, V. E., M. P. Utrillas, R. Vergaz, P. Duran, A. de Frutos, and J. A.Martınez-Lozano (1998), Determination of the atmospheric water-vaporcontent in the 940 nm absorption band by use of moderate spectral-resolution measurements of direct solar irradiance, Appl. Opt., 37, 4678.
Cachorro, V. E., C. Toledano, R. Vergaz, A. M. de Frutos, M. Sorribas, J. M.Vilaplana, and B. de la Morena (2004), The PHOTONS-AERONET sitesin Spain. Calibration problems and KCICLO correction method, Opt.Pura Apl., 37, 3401.
Campanelli, M., T. Nakajima, and B. Olivieri (2004), Determination of thesolar calibration constant for a Sun-sky radiometer: Proposal of an in-situprocedure, Appl. Opt., 43, 651.
Cannon, T. W. (1986), Spectral solar irradiance instrumentation and mea-surement techniques, Solar Cells, 18, 233.
Dubovik, O., B. N. Holben, T. F. Eck, A. Smirnov, Y. J. Kaufman, M. King,D. Tanre, and I. Slutsker (2002), Variability of absorption and opticalproperties of key aerosol types observed in worldwide locations,J. Atmos. Sci., 59, 590.
Eck, T. F., B. N. Holben, J. S. Reid, O. Dubovik, N. T. O’Neill, I. Slutsker,and S. Kinne (1999), Wavelength dependence of the optical depth ofbiomass burning, urban and desert dust aerosols, J. Geophys. Res.,104, 31,333.
Gueymard, C. A. (2001), Parameterized transmittance model for directbeam and circumsolar spectral irradiance, Solar Energy, 71, 325.
Holben, B. N., et al. (1998), AERONET - A Federated instrument networkand data archive for aerosol characterization, Remote Sens. Environ., 66, 1.
Holben, B. N., et al. (2001), An emerging ground-based aerosol climatol-ogy: Aerosol optical depth from AERONET, J. Geophys. Res., 106,12,067.
Houghton, J., et al. (Eds.) (2001), Climate Change: The Sicientific Basis,Cambridge Univ. Press, New York.
Iqbal, M. (1983), An Introduction to Solar Radiation, Springer, New York.Kasten, F., and M. T. Young (1989), Revised optical air mass tables andapproximation formula, Appl. Opt., 28, 4735.
Kaufman, Y. J., A. Gitelson, A. Karnieli, E. Ganor, R. S. Fraser, T. Nakajima,S. Mattoo, and B. N. Holben (1994), Size distribution and scatteringphase function of aerosol particles retrieved from sky brightness measure-ments, J. Geophys. Res., 99, 10,341.
Kuester, M. A., K. J. Kurtis, and A. Reagan (2003), Automated statisticalapproach to Langley evaluation for a solar radiometer, Appl. Opt., 42,4919.
Labajo, A., , E. Cuevas, and B. de la Morena (Eds.) (2004), The first IberianUV-visible instruments intercomparison, final report, 114 pp., Inst.Nacional de Meteorol., Ministerio de Medio Ambiente, Barcelona, Spain.
Martınez-Lozano, J. A., M. P. Utrillas, F. Tena, R. Pedros, J. Canada, J. V.Bosca, and J. Lorente (2001), Aerosol optical characteristics fromSummer Campaign in an Urban Coastal Mediterranean Area, IEEETrans. Geosci. Remote Sens., 39, 1573.
Martınez-Lozano, J. A., et al. (2002), UV Index experimental values duringthe years 2000 and 2001 from the Spanish broadband UVB radiometricnetwork, Photochem. Photobiol., 76, 181.
Martınez-Lozano, J. A., et al. (2003), Intercomparison of spectroradi-ometers for global and direct solar irradiance in the visible range,J. Atmos. Ocean Technol., 20, 997.
McArthur, L. J. B., D. H. Halliwell, O. J. Niebergall, N. T. O’Neill, J. R.Slusser, and C. Wehrli (2003), Field comparison of network Sun photo-meters, J. Geophys. Res., 108(D19), 4596, doi:10.1029/2002JD002964.
Michalsky, J. J. (1988), The Astronomical Almanac’s algorithm for approx-imate solar position (1950–2050), Solar Energy, 40, 227.
Mitchell, R. M., and B. W. Forgan (2003), Aerosol measurement in theAustralian Outback: Intercomparison of Sun photometers, J. Atmos.Oceanic Technol., 20, 54.
Morys, M., F. M. Mims III, S. Hagerup, S. E. Anderson, A. Baker, J. Kia,and T. Walkup (2001), Design, calibration and performance of MICRO-TOPS II handheld ozone monitor and Sun photometer, J. Geophys. Res.,106, 14,573.
Nann, S., and C. Riordan (1991), Solar spectral irradiance under clear andcloudy skies: Measurements and a semiempirical model, J. Appl. Meteor-ol., 30, 447.
Pedros, R., J. A. Martinez-Lozano, M. P. Utrillas, J. L. Gomez-Amo, andF. Tena (2003), Column-integrated aerosol optical properties fromground-based spectroradiometer measurements at Barrax (Spain) duringDAISEX (Digital Airborne Spectrometer Experiment) campaigns,J. Geophys. Res., 108(D18), 4571, doi:10.1029/2002JD003331.
Pietras, C., M. Miller, R. Frouin, T. Eck, B. Holben, and J. Marketon(2001), Calibration of Sun photometers and sky radiance sensors, in InSitu Aerosol Optical Thickness Collected by the SIMBIOS Program(1997–2000): Protocols, and Data QC and Analysis, NASA/TM-2001-209982, NASA, Washington, D. C.
Riordan, C., D. Myers, M. Rymes, M. Hulstrom, W. Marion, C. Jennings,and C. Whitaker (1989), Spectral solar radiation data base at SERI, SolarEnergy, 42, 67.
Russell, P., et al. (1993), Pinatubo and pre-Pinatubo optical depth spectra:Mauna Loa measurements, comparisons inferred particle size distribu-tions, radiative effects, and relationships to lidar data, J. Geophys. Res.,98, 22,969.
Shaw, G. E. (1983), Sun photometry, Bull. Am. Meteorol. Soc., 64, 4.Schimid, B., and C. Wehrli (1995), Comaparison of Sun photometer cali-bration by use of the Lanley technique and the standard lamp, Appl. Opt.,34, 4500.
Schmid, B., C. Matzler, A. Heimo, and N. Kampfer (1997), Retrievalof optical depth and particle size distribution of tropospheric and strato-spheric aerosols by means of sun photometry, IEEE Trans. Geosci.Remote Sens., 35, 172.
Schmid, J., R. Michalsky, M. Halthore, L. Beauharnois, J. Harrison,P. Livingston, P. Russell, B. Holben, T. Eck, and A. Smirnov (1999),Comparison of aerosol optical depth from four solar radiometers duringthe fall 1997 ARM intensive observation period, Geophys. Res. Lett., 26,2725.
Slusser, J., J. Gibson, D. Bigelow, D. Kolinsky, P. Disterhoft, K. Lantz, andA. Beaubien (2000), Langley method of calibrating UV filter radio-meters, J. Geophys. Res., 105, 4841.
D17207 ESTELLES ET AL.: INTERCOMPARISON DURING VELETA-2002
14 of 15
D17207

Utrillas, M. P. (1995), Estudio de aerosoles a partir de medidas de irradian-cia solar spectral (in Spanish), Ph.D. thesis, Valencia Univ., Valencia,Spain.
World Meteorological Organization (WMO) (1994), Report on the mea-surements if atmospheric turbidity in BAPMoN, GAW Rep. 94, Geneva.
�����������������������L. Alados-Arboledas, A. Alcantara, and F. J. Olmo, Grupo de Fısica de la
Atmosfera, Dpto. de Fısica Aplicada, Universidad de Granada, Fuentenuevas/n 18071, Granada, Spain.V. Cachorro, Grupo de Optica Atmosferica, Dpto. de Optica y Fısica
Aplicada, Universidad de Valladolid, Prado de la Magdalena, s/n, E-47071Valladolid, Spain.J. Canada, Grupo de Radiacion Solar, Universidad Politecnica de
Valencia, Camino de Vera s/n, E-46022 Valencia, Spain.A. M. Dıaz and J. P. Dıaz, Dpto. de Fısica Basica, Universidad de La
Laguna, Avd. Astrofısico Fco. Sanchez s/n, E-38206, La Laguna, Spain.X. de Cabo and J. Lorente, Dpt de Astronomıa i Meteorologıa,
Universitat de Barcelona, Martı i Franques, 1, E-08028 Barcelona, Spain.
T. Elıas, and A. M. Silva, Evora Geophysics Centre, University of Evora,Rua Romao Ramalho 59, 7000 671 Evora, Portugal.V. Estelles, J. A. Martınez-Lozano, and M. P. Utrillas, Grupo de
Radiacion Solar, Universitat de Valencia, Dr. Moliner, 50, E-46100Burjassot, Spain. ([email protected])Y. Garcıa, Centro Tecnologico Repsol-YPF, Carretera Extremadura A5
Km 18, E-28931 Mostoles, Madrid, Spain.H. Horvath, Experimental Physics Institute, University of Vienna,
Boltzmanngasse 5, Vienna, A-1090, Austria.A. Labajo, Instituto Nacional de Meteorologıa, Camino de las Moreras
s/n, Ciudad Universitaria, E-28040 Madrid, Spain.M. Pujadas, Dpto de Impacto Ambiental de la Energıa, CIEMAT, Avd.
Complutense, 22, E-28040 Madrid, Spain.J. A. Rodrigues, Departamento de Fısica, Universidade do Algarve,
Departamento de Fisica, Campus de Gambelas, 8005-139 Faro, Portugal.M. Sorribas, Estacion de Sondeos Atmosfericos de El Arenosillo, INTA,
Ctra. San Juan del Puerto- Matalascanas Km.33, E-21130 Mazagon,Huelva, Spain.
D17207 ESTELLES ET AL.: INTERCOMPARISON DURING VELETA-2002
15 of 15
D17207