Interactive Performance for Musicians with a Hearing Impairment
304
INTERACTIVE PERFORMANCE FOR MUSICIANS WITH A HEARING IMPAIRMENT Robert James Fulford A thesis submitted in partial fulfilment of the requirements of Manchester Metropolitan University for the degree of Doctor of Philosophy ROYAL NORTHERN COLLEGE OF MUSIC AND MANCHESTER METROPOLITAN UNIVERSITY IN COLLABORATION WITH UNIVERSITY OF LIVERPOOL JULY 2013
Transcript of Interactive Performance for Musicians with a Hearing Impairment
INTERACTIVE PERFORMANCE FOR
MUSICIANS WITH A HEARING
IMPAIRMENT
Robert James Fulford
A thesis submitted in partial fulfilment of the requirements of
Manchester Metropolitan University for the degree of
Doctor of Philosophy
ROYAL NORTHERN COLLEGE OF MUSIC AND
MANCHESTER METROPOLITAN UNIVERSITY
IN COLLABORATION WITH
UNIVERSITY OF LIVERPOOL
JULY 2013
i
INTELLECTUAL PROPERTY AND
PUBLICATIONS
The work submitted in this thesis is solely that of the candidate (RF), except where
collaborating researchers, Carl Hopkins (CH), Jane Ginsborg (JG), Saúl Maté-Cid
(SMC) and Gary Seiffert (GS) have taken a role in experimental design, technology
development, data collection and/or data analysis. JG provided supervision for all thesis
chapters. Other contributions relate only to three experiments reported in Chapter 6 of
this thesis and are summarised below.
• Experiment A: Designed by CH with assistance from JG, RF and SMC.
Technology developed by GS. Data collected by SMC. Data analysed by
CH, SMC and RF. Appropriate credit is given for figures and illustrations
used from a jointly-authored conference paper (Hopkins, Maté-Cid, Seiffert,
Fulford, & Ginsborg, 2012)
• Experiment B1: Designed by RF, JG and CH. Technology developed by
GS. MATLAB® programmed by SMC. Data collected by RF and SMC.
Data analysed by RF.
• Experiment B2: Designed by RF, JG and CH. Technology developed by
GS. MATLAB® programmed by SMC. Data collected and analysed by RF.
In addition, substantial parts of the literature reviews and data from interviews,
observations and experiments reported in this thesis have been included in the
following peer-reviewed publications:
Fulford, R. (2013a). The formation and development of musical identities with a
hearing impairment. In: Stakelum, M. (Ed.) Developing the Musician (pp.
45-62). Surrey: Ashgate
Fulford, R. & Ginsborg, J. (2013). Can you see me? The effects of visual contact
on musicians’ movements in performance. In: Wyers, M. (Ed.) Sound Music

ii
and the Moving-Thinking Body (pp.109-118). UK: Cambridge Scholars
Publishing.
Fulford, R., Ginsborg, J., & Goldbart, J. (2012). Functions and uses of auditory and
visual feedback: Exploring the possible effects of a hearing impairment on
music performance. Proceedings of the 12th International Conference of
Music Perception and Cognition and 8th Triennial Conference of the
European Society for the Cognitive Sciences of Music, 335-343. Retrieved
from:
http://icmpc-escom2012.web.auth.gr/sites/default/files/papers/335_Proc.pdf
Fulford, R., Ginsborg, J., & Goldbart, J. (2011). Learning not to listen: the
experiences of musicians with hearing impairments. Music Education
Research, 13(4), 429-446.
A further publication drawing on observational data is in press:
Fulford, R. & Ginsborg, J. (2014, in press). The sign language of music: ‘Musical
Shaping Gestures’ (MSGs) in rehearsal talk by performers with hearing
impairments. Empirical Musicology Review.
iii
ACKNOWLEDGEMENTS
I thank Carl Hopkins for his support and advice about acoustics and the
measurement of sound and vibration and for creating such a rewarding, collaborative
research project. I thank Jane Ginsborg, for her ideas about social interaction in
music and for her unfailing support, and Juliet Goldbart, for providing a strategic
overview of my work and pointing me towards useful references and theories. I
thank Paul Whittaker, for his experiences, talks, workshops and advice, and his
charity, Music and the Deaf, for supporting the project’s aims, providing valuable,
practical advice and for connecting us with our target population. I also thank my
parents for supporting me and allowing me to concentrate on my research. Lastly and
most importantly, my thanks go to the participants, specifically the musicians with
hearing impairments, who gave up their time and energy to share their experiences
with me, take part in our studies and confirm (or refute!) my interpretation of the
data.
I dedicate this thesis to Paul Whittaker’s charity Music and the Deaf. I hope that,
over time, more people will understand that deafness need not be a disabling barrier
to music but is simply a different way of experiencing it.
iv
ABSTRACT
How can we perceive music if we cannot hear it properly? The achievements of deaf
musicians suggest it is possible not only to perceive music, but to perform with other
musicians. Yet very little research exists to explain how this is possible. This thesis
addresses this problem and explores the premise that vibrations felt on the skin may
facilitate interactive music making.
An initial interview study found that, while vibrations are sometimes perceived, it is
predominantly the use of visual and physical cues that are relied upon in group
performance to help stay in time and in tune with other players. The findings
informed the design of two observation studies exploring the effects of i) artificial
attenuation of auditory information and ii) natural deafness on performance
behaviours. It was shown that profound congenital deafness affected the players’
movements and their gazes/glances towards each other while mild or moderate levels
of attenuation or deafness did not. Nonetheless, all players, regardless of hearing
level, reciprocated the behaviours of co-performers suggesting the influence of social
factors benefitting verbal and non-verbal communication between players.
Finally, a series of three psychophysical experiments was designed to explore the
perception of pitch on the skin using vibrations. The first study found that
vibrotactile detection thresholds were not affected by hearing impairments. The
second established that the relative pitches of intervals larger than a major 6th
were
easy to discriminate, but this was not possible for semitones. The third showed that
tones an octave apart could be memorised and identified accurately, but were
confused when less than a perfect 4th
apart.
The thesis concludes by evaluating the potential of vibrotactile technology to
facilitate interactive performance for musicians with hearing impairments. By
considering the psychophysical, behavioural and qualitative data together, it is
suggested that signal processing strategies in vibrotactile technology should take
social, cognitive and perceptual factors into account.
v
TABLE OF CONTENTS
Intellectual property and publications i
Acknowledgements iii
Abstract iv
Table of contents v
List of figures xi
List of tables xiii
Chapter 1: Introduction 1
1.1 Evelyn Glennie.................................................................... 3
1.2 The collaborative project..................................................... 4
1.3 My role, responsibilities and me......................................... 6
1.4 Summary of thesis content.................................................. 8
Chapter 2: Literature Reviews 9
2.1 Review 1: Music and deafness............................................ 10
2.1.1 Audiology and music................................................................. 13
2.1.2 Cochlear implants and hearing aids........................................... 14
2.1.3 Music education and music therapy.......................................... 17
2.1.4 Summary 1................................................................................. 18
2.2 Review 2: Cross-modal communication and perception..... 20
2.2.1 Communication in music........................................................... 20
2.2.2 Movement as communication.................................................... 22
2.2.3 Auditory musical perception...................................................... 26
2.2.4 Cross-modal perception 1: auditory – physical......................... 29
2.2.5 Cross-modal perception 2: auditory – visual............................. 30
2.2.6 Summary 2................................................................................. 33
2.3 Conclusion……………………………………………………….. 34
Chapter 3: The experiences of musicians with hearing
impairments
35
3.1 Aims.................................................................................... 35
3.2 Method................................................................................. 36

vi
3.3 Results and discussion......................................................... 38
3.3.1 Love of music and musicality.................................................... 40
3.3.2 Social challenges....................................................................... 45
3.3.3 Music-making challenges.......................................................... 48
3.3.4 Music-making strategies............................................................ 50
3.3.5 Vibrotactile feedback................................................................. 57
3.3.6 Managing the sensory experience…………………………...... 58
3.4 The development of musical and deaf identities................. 63
3.4.1 Overcoming deafness (choosing music in spite of a hearing
impairment)................................................................................
65
3.4.2 Deafness is irrelevant (life as a working/professional
musician with a hearing impairment)........................................
68
3.4.3 Performing deafness (integrating musical and deaf identities
in adulthood).............................................................................
70
3.5 Conclusions...................................................................................... 73
Chapter 4: The effects of auditory and visual feedback on
musicians’ physical behaviour in interactive
performance
76
4.1 Aims and rationale............................................................... 77
4.2 Questions and hypotheses.................................................... 78
4.3 Method................................................................................. 79
4.3.1 Design........................................................................................ 79
4.3.2 Participants................................................................................ 80
4.3.3 Apparatus and materials............................................................ 80
4.3.4 Procedure................................................................................... 81
4.3.5 Analyses..................................................................................... 81
4.3.6 Coding Scheme.......................................................................... 82
4.4 Results................................................................................. 83
4.4.1 Coding Scheme and reliability................................................... 83
4.4.2 Hypothesis 1: The effect of auditory attenuation on movement
duration......................................................................................
84
4.4.3 Hypothesis 2: The effect of auditory attenuation on looking
behaviour...................................................................................
85
4.4.4 Hypothesis 3: The effect of auditory attenuation on ensemble
synchrony...................................................................................
85
4.4.5 Hypothesis 4: The effect of visual attenuation on movement
behaviour...................................................................................
85
vii
4.4.6 Hypothesis 5: The effect of visual attenuation on looking
behaviour...................................................................................
87
4.4.7 Hypothesis 6: The effect of visual attenuation on ensemble
synchrony...................................................................................
87
4.4.8 Post-hoc analyses....................................................................... 87
4.5 Discussion............................................................................ 91
4.5.1 Hypothesis 1: Auditory attenuation and movement behaviour 92
4.5.2 Hypothesis 2: Auditory attenuation and looking behaviour...... 92
4.5.3 Hypothesis 3 & 6: Auditory attenuation, visual feedback and
ensemble synchrony..................................................................
92
4.5.4 Hypothesis 4: Visual feedback and movement behaviour......... 93
4.5.5 Hypothesis 5: Visual feedback (including eye contact) and
looking behaviour......................................................................
95
4.6 Conclusions...................................................................................... 97
Chapter 5: The effects of hearing impairments on verbal and
non-verbal communication during rehearsal and
performance
100
5.1 Aims, questions and hypotheses.......................................... 101
5.2 Method................................................................................. 102
5.2.1 Participants................................................................................ 102
5.2.2 Design........................................................................................ 103
5.2.3 Materials.................................................................................... 103
5.2.4 Procedure................................................................................... 104
5.2.5 Analyses..................................................................................... 104
5.2.6 Participant feedback................................................................... 108
5.2.7 Inter-rater reliability................................................................... 108
5.3 Results 1: Effects of hearing impairments on behaviours... 108
5.3.1 Non-verbal communication: Looking behaviour....................... 109
5.3.2 Non-verbal communication: Speech gestures........................... 111
5.3.3 Verbal communication: Rehearsal talk...................................... 113
5.3.4 Verbal communication: Rehearsal strategy............................... 115
5.4 Discussion 1......................................................................... 117
5.4.1 Non-verbal communication: Looking behaviour....................... 117
5.4.2 Non-verbal communication: Speech gestures........................... 118
5.4.3 Verbal communication: Rehearsal talk...................................... 119
5.4.4 Verbal communication: Rehearsal strategy............................... 121
5.5 Results 2: Within-subjects analysis..................................... 122

viii
5.5.1 Kai-Li (flute, hearing)................................................................ 123
5.5.2 Manny (piano, hearing)............................................................. 124
5.5.3 Ruth (flute, profoundly deaf)..................................................... 125
5.5.4 Paul (piano, profoundly deaf).................................................... 126
5.5.5 William (flute, moderately deaf)............................................... 126
5.5.6 Angie (piano, moderately deaf)................................................. 127
5.6 Discussion 2......................................................................... 128
5.6.1 Kai-Li (flute, hearing)................................................................ 128
5.6.2 Manny (piano, hearing)............................................................. 129
5.6.3 Ruth (flute, profoundly deaf)..................................................... 131
5.6.4 Paul (piano, profoundly deaf)................................................... 133
5.6.5 William (flute, moderately deaf)............................................... 135
5.6.6 Angie (piano, moderately deaf)................................................. 136
5.7 Summary.............................................................................. 138
5.8 Post-hoc analysis: a case study of looking behaviour and
ensemble synchrony in Ruth and Paul’s rehearsal of the
Adagio.................................................................................
139
5.9 Conclusions......................................................................... 144
Chapter 6: The vibrotactile perception of pitch 146
6.1 Literature review................................................................. 146
6.1.1 Neurophysiology: the cutaneous senses.................................... 147
6.1.2 Psychophysics 1: Factors influencing vibrotactile perception... 149
6.1.3 Psychophysics 2: Perception of pitch using vibrations.............. 151
6.1.4 Cross-modal perception 3: Auditory – tactile............................ 152
6.1.5 Psychophysics 3: Learning in the vibrotactile mode................. 155
6.1.6 Existing vibrotactile technologies for music............................. 157
6.1.7 Summary and research questions............................................... 162
6.2 Experiment A: Vibrotactile thresholds................................ 164
6.2.1 Aims and hypotheses................................................................. 164
6.2.2 Experimental set-up................................................................... 165
6.2.3 Participants................................................................................ 166
6.2.4 Procedure................................................................................... 166
6.2.5 Post-hoc test............................................................................... 167
6.2.6 Results....................................................................................... 167
6.2.7 Discussion.................................................................................. 169
6.3 Experiment B1: Relative pitch discrimination.................... 173

ix
6.3.1 Aims and hypotheses................................................................. 173
6.3.2 Experimental set-up................................................................... 174
6.3.3 Participants................................................................................ 174
6.3.4 Procedure................................................................................... 175
6.3.5 Results........................................................................................ 175
6.3.6 Discussion.................................................................................. 179
6.4 Experiment B2: Absolute pitch perception......................... 181
6.4.1 Introduction............................................................................... 181
6.4.2 Aims, questions and hypotheses................................................ 182
6.4.3 Experimental set-up................................................................... 183
6.4.4 Participants................................................................................ 183
6.4.5 Procedure................................................................................... 183
6.4.6 Analysis..................................................................................... 184
6.4.7 Results........................................................................................ 184
6.4.8 Discussion.................................................................................. 187
6.5 Conclusions......................................................................... 190
Chapter 7: Evaluation 191
7.1 Summary of findings........................................................... 191
7.2 Limitations........................................................................... 195
7.3 Further research................................................................... 196
7.3.1 Hearing aid technology.............................................................. 196
7.3.2 The effects of hearing impairments on performance
behaviours..................................................................................
197
7.3.3 The effects of hearing impairments on vibrotactile perception. 199
7.3.4 Pitch-perception using vibrations.............................................. 199
7.3.5 Feeling music (rhythms, dynamics, chords and melodies)........ 202
7.4 The case of Evelyn Glennie................................................. 205
7.5 How can vibrations facilitate interactive musical
performance? ......................................................................
206
7.6 Final remarks....................................................................... 213
References 216

x
Appendices 235
Appendix A: Fulford, Ginsborg & Goldbart (2012)................... 235
Appendix B: Fulford, Ginsborg & Goldbart (2011)................... 244
Appendix C: Interview schedule................................................ 263
Appendix D: Full Thematic Network Map................................. 266
Appendix E: Score of Sketch by Emma-Ruth Richards............. 267
Appendix F: Results Tables........................................................ 269
Appendix G: Score of Adagio from Sonata in E Major by J. S.
Bach.......................................................................
273
Appendix H: Score of Petite Sonate by Jacob Thompson-Bell 275
Appendix J: Participant instruction email.................................. 279
Appendix K: Participant feedback survey.................................. 280
Appendix L: Maté-Cid, Hopkins, Seiffert, Fulford & Ginsborg
(2012)....................................................................
281
Appendix M: Participant Questionnaire used in experiments.... 289

xi
LIST OF FIGURES
Figure 1.1 ‘The interdisciplinary world of music psychology’ (Hodges &
Sebald, 2011, p .4)........................................................................
2
Figure 1.2 Concept for vibrating performance deck and/or vibrating
pads/bars......................................................................................
5
Figure 2.1 Handshapes used by conductors in non-dominant hand gestures,
from Boyes Braem and Bräm (2000, p. 150)................................
24
Figure 3.1 Thematic network showing global themes and hierarchy........... 39
Figure 3.2 A thematic map of the global theme: Love of music and
musicality......................................................................................... 40
Figure 3.3 A thematic map of the global theme: Social Challenges................ 45
Figure 3.4 A thematic map of the global theme: Music Making Challenges.. 48
Figure 3.5 A thematic map of the global theme: Managing the Music-
Making Situation............................................................................ 51
Figure 3.6 A thematic map of the global theme: Managing the Sensory
Experience....................................................................................... 59
Figure 4.1 The musical context of entry marker M14..................................... 89
Figure 5.1 Mean percentages of all utterances by IPA category..................... 114
Figure 5.2 Mean percentages of all utterances by rehearsal strategy.............. 116
Figure 5.3 Paul’s rate of looking during episodes of play in rehearsal of
Adagio with Ruth............................................................................ 140
Figure 5.4 Frequency of Paul’s looking towards Ruth in synchronous and
asynchronous play........................................................................... 141
Figure 6.1 Cutaneous receptors (Carlson, 2004, p. 223).................................. 148
Figure 6.2 Perceived frequency ranges adapted from Merchel, Altinsoy &
Stamm (2010).................................................................................. 149
Figure 6.3 The ‘Emoti-chair’ (Karam, et al., 2009)......................................... 158
Figure 6.4 The ‘Haptic Chair’ (Nanayakkara, et al., 2013).............................. 160
Figure 6.5 Two toneholes of the ‘Tactilicious Flute Display’ showing
actuators (Birnbaum & Wanderley, 2007)...................................... 161
Figure 6.6 Distal phalanx of middle finger placed on the contactor (Hopkins
et al., 2012)..................................................................................... 165
xii
Figure 6.7 Vibrotactile thresholds on the finger by hearing level groups........ 168
Figure 6.8 Flat response of thresholds between G4 and C6 (Hopkins et al.,
2012)...............................................................................................
168
Figure 6.9 Percentage of participants identifying transient or sustained
vibration as salient..........................................................................
169
Figure 6.10 Comparison of VPT curves in present study with those found in
other studies (Maté-Cid, et al., 2012)..............................................
170
Figure 6.11 Measured thresholds as frequency weighted acceleration (Maté-
Cid, et al., 2012)..............................................................................
171
Figure 6.12 Mean percentage of correct responses in training sessions with
linear trend line...............................................................................
176
Figure 6.13 Percentage of correct responses by interval size............................. 176
Figure 6.14 Mean percentage of correct responses, pre- and post-training........ 177
Figure 6.15 Mean reaction times over training sessions.................................... 178
Figure 6.16 Mean change in percentage of correct responses by proximity to
new tone..........................................................................................
186
Figure 7.1 Experimental set up for a study involving controlled auditory
feedback..........................................................................................
198
Figure 7.2 Considerations to be taken into account when using VT
technology for interactive musical performance............................
208

xiii
LIST OF TABLES
Table 3.1 Interview study: Participant summary........................................... 37
Table 4.1 Condition matrix showing same condition pairs in bold.............. 80
Table 4.2 Violin duo participants.................................................................. 80
Table 4.3 Location and description of entry markers in ‘Sketch’ (Both;
Vln 1; Vln 2)................................................................................
81
Table 4.4 Coding scheme.............................................................................. 83
Table 4.5 Mean durations of movement in hearing and auditory-attenuated
conditions (seconds).....................................................................
84
Table 4.6 Mean frequency and duration (seconds) of looking behaviour
per performance in hearing and auditory-attenuated conditions..
85
Table 4.7 Mean durations (seconds) of movement behaviour per
performance in visual and non-visual conditions.........................
86
Table 4.8 Mean durations (seconds) of movement behaviour per
performance in one-way and two-way looking conditions..........
86
Table 4.9 Mean frequency and durations (seconds) of looking behaviour
per performance in one-way and two-way looking conditions.....
87
Table 4.10 Lag sequential analysis showing probability of coded
behaviours occurring +/- 1 second around entry markers............
89
Table 4.11 Total and sum total durations in seconds (and frequencies) of
looking and movement behaviour by player and condition.........
90
Table 5.1 Flute-piano duos: Participant summary........................................ 103
Table 5.2 Coding scheme used in Noldus Observer...................................... 105
Table 5.3 Interactional Process Analysis codes adapted from Bales (1950,
1999)..............................................................................................
106
Table 5.4 Modes of Communication codes adapted from Seddon &
Biasutti (2009)......................................................................
107
Table 5.5 Categories of references to rehearsal strategies............................ 108
Table 5.6 The effects of player and partner hearing level on looking
behaviour......................................................................................
110
Table 5.7 The effects of player role, performance context and piece on
xiv
looking behaviour.......................................................................... 111
Table 5.8 Frequency of gestures by Modes of Communication (Seddon &
Biasutti, 2009)...............................................................................
111
Table 5.9 The effects of player’s and partner’s hearing level on the use of
speech gestures..............................................................................
112
Table 5.10 The effect of hearing level on the proportion of rehearsal time
spent talking...................................................................................
113
Table 5.11 The effects of player’s hearing level on the proportion and
content of rehearsal talk...............................................................
115
Table 5.12 The effects of player’s hearing level on verbal rehearsal
strategies and play modes.............................................................
117
Table 5.13 Players and partners by hearing level and session......................... 122
Table 5.14 Summary of looking behaviours, talk and speech gestures by
player.............................................................................................
123
Table 5.15 Behaviours of hearing players by partner hearing level: Kai-Li
and Manny.....................................................................................
125
Table 5.16 Behaviours of profoundly deaf players by partner hearing level:
Ruth and Paul..............................................................................
126
Table 5.17 Behaviours of moderately deaf players by partner hearing level:
William and Angie.......................................................................
127
Table 6.1 Tactile receptor properties, adapted from Kaczmarek et al.
(1991)............................................................................................
149
Table 6.2 Experiment A: Number of participants by sex and hearing
level...............................................................................................
166
Table 6.3 Experiment A: Number and age of participants with valid
threshold tests................................................................................
167
Table 6.4 Experiment B1: Number of participants by hearing level, sex
and musical background................................................................
174
Table 6.5 Experiment B2: Number of participants by sex and AP
ability............................................................................................
183
Table 6.6 Experiment B2: Tones tested by session....................................... 184
Table 6.7 Experiment B2: Percentage of tones identified correctly by
session............................................................................................
185
xv
Table 6.8 Experiment B2: Percentage of correct responses by test and
session............................................................................................
187
Table 6.9 Experiment B2: Number of study session trials by tone (% of
total)...............................................................................................
187
1
CHAPTER 1 – INTRODUCTION
The perception of music is central to this thesis but the scope goes beyond that which we can
hear with our ears. Auditory sound waves are formed by the regular contraction and
expansion of air molecules from a vibrating source as perceived by the ears. Our sense of
hearing has evolved to transfer efficiently the energy of these sound waves in the air to the
liquid inside the cochlea and subsequently into electrical neural responses in the brain. But
what happens to our perception of music if this route of auditory perception is compromised
or damaged? How does deafness or a hearing impairment affect our perception of music?
Stephen Pinker famously wrote in his book How the Mind Works that “music is auditory
cheesecake” (Pinker, 1997, p. 534). He argued that the pleasure we experience from music
was not, in itself, adaptive in evolutionary terms. Rather, it is an artifice designed to
capitalise on an adaptive source of auditory pleasure that has its roots in language. Opposing
this view, George Miller has argued that music was indeed an adaptive factor in the
communicative display of attributes favoured in sexual selection (Miller, 2000). We may
never have a definitive answer to this question. Instead, it is helpful to acknowledge the
many ways music can be expressed within human culture and behaviour:
The meaning of music is not reducible to its significance in human evolution. […]
from the underpinning of ritual to the articulation of filmic narrative, from the
shaping of interaction in dance to the socialization of infants in song, from the
evocation of connotative complexes in the concert hall to the framing of adolescent
rites of passage (Cross, 2005, p. 41).
A similar approach can be adopted regarding the idea of music as a purely auditory
phenomenon. In the last century our understanding of the physiology, psychology and
neurology of auditory perception has expanded; however, modern imaging techniques have
been used to show, repeatedly, that musical processes occur in many different parts of the
brain beyond the auditory cortices: music reaches deep into primitive areas of the brain
associated with responses that are both physical and emotional. These responses have the
capacity to bring us together; common socio-emotional responses to music are often
observed. Yet music is expressed very differently in different cultures around the globe,
which prompts the question: ‘when we listen to music, do we really all hear the same thing?’
If our sense of hearing is damaged or impaired in some way, then the answer is probably not.
We can simulate the sound of music as it would be heard through a cochlear implant, for

2
example, but we might struggle to term the resulting sounds ‘music’ (some simulations can
be found on the Action On Hearing Loss website:
http://www.actiononhearingloss.org.uk/your-hearing/about-deafness-and-hearing-
loss/cochlear-implants/sound-through-a-cochlear-implant.aspx). The very existence of deaf
musicians however, suggests that, like responses to music, the perception of music may also
extend beyond the auditory.
We can perceive the vibrations that produce sound waves in other ways. We possess
receptors both inside our body and on the surface of the skin. These receptors can perceive
the rumble of a bass guitar or drum beat, if the sound is loud and low enough, without any
physical contact with the sound source. We may also feel the vibrations of a loudspeaker on
our skin if we touch it directly. Thus, excluding our highly evolved sense of hearing, we
have other ways of perceiving vibration and these are closely linked to senses for touch and
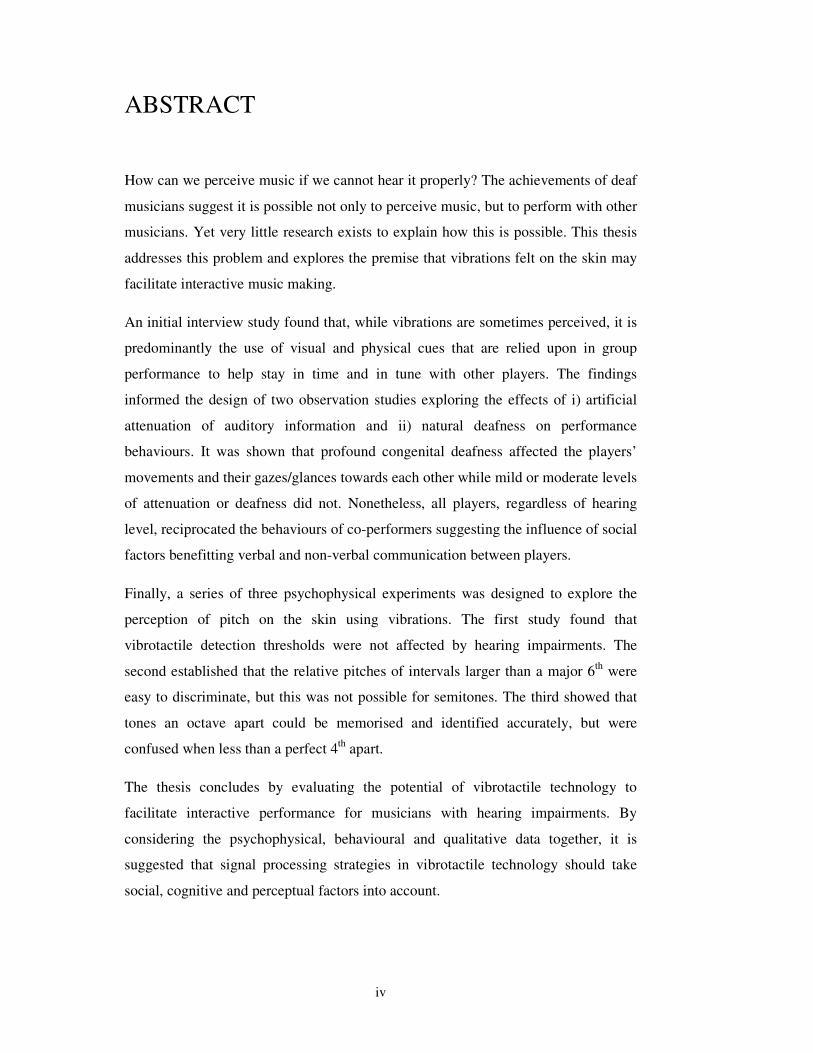
movement. Vibrations are a fundamental part of our sensory world and, as sources of sound,
influence a great deal of what we do. Viewed in this way, the amount of knowledge and
behaviour that can be attributed to the existence of vibrations, from the sub-atomic to the
cosmic, is vast (Figure 1.1).
Figure 1.1 ‘The interdisciplinary world of music psychology’ (Hodges & Sebald, 2011,
p .4)
3
1.1 Evelyn Glennie
This thesis reports research undertaken as part of a project entitled ‘Interactive performance
for musicians with a hearing impairment’ funded by the Arts and Humanities Research
Council (AHRC). The original inspiration for the project occurred over 10 years ago when
Dr Carl Hopkins (Principal Investigator (PI) and Reader in Acoustics at University of
Liverpool) heard a radio programme about Dame Evelyn Glennie. Glennie is perhaps the
most famous percussionist in the world and is also known for her profound deafness. She
began to lose her hearing when she was eight years old and was profoundly deaf by the time
she was twelve (Glennie, 1990, 2010b). She plays a huge variety of instruments and
describes being able to listen to the sounds of her music by feeling the vibrations they create.
Hopkins was fascinated by the idea that she plays barefoot in order to feel the vibrations of
her instruments and wondered if it would be possible to create an artificial platform or deck
that would help musicians like her play in different concert halls and venues and with other
musicians. In 2007, he contacted music psychologist Prof. Jane Ginsborg, an expert on
collaborative performance, who agreed to collaborate on the project as Co-Investigator (CI).
Glennie is not the only musician who has acquired a profound deafness nor is she the only
musician who uses vibrations in her playing. Beethoven in his time was reported to use a
wooden stick to help him feel the vibrations of his piano in the final years of his life (Barry,
2008). Hopkins and Ginsborg formulated ideas for new technology and research into the
ways it would function, often raising many questions that appeared to be, as yet, un-
researched and un-answered. Perhaps vibrations are only used by musicians with a profound
deafness? Perhaps an artificial performance deck would only be practical for solo performers
like Glennie? Existing research in music psychology shows that musicians use a variety of
visual and auditory cues to facilitate group performance (Davidson & Good, 2002; King &
Ginsborg, 2011; Williamon & Davidson, 2002) but very little research was found to suggest
how a hearing impairment may affect these. Clearly a survey involving interviews with, and
observations of, musicians with hearing impairments was needed to explore these social and
cognitive processes further. Regarding the perception of vibrations, the case study of Evelyn
Glennie provided anecdotal evidence at best. Hopkins proposed that different floor types and
constructions must affect the vibrations available to Glennie in different performance
venues. A more versatile man-made solution could transmit different vibration signals to
different musicians simultaneously. Therefore, in addition to interviews and observations,
experiments would need to be carried out into the perception of music using vibrations.
4
1.2 The collaborative project
A proposal was submitted to the AHRC in 2009 and subsequently accepted. The proposal
sought to make links between research in the arts, humanities and the science of sound and
vibration by exploring the potential of vibrotactile technology to facilitate interactive
performance for musicians with a hearing impairment. The project drew on four broad fields
of research: i) collaborative rehearsal and performance, ii) music and the D/deaf, iii) the
tactile perception of speech and music and, finally, iv) the perception of sound using
vibration. Two research questions were posed:
1. How do musicians with hearing impairments rehearse and perform music together,
and with other musicians that have normal hearing?
2. How can technology be used to help them do so more effectively?
The first question relates to the first two research areas, collaborative performance and music
and deafness, and saw music as including as many genres as possible from classical, pop,
jazz, rock and folk. Research would provide an understanding of the cues needed by
musicians with hearing impairments which, in turn, would inform the development of the
technological solution to which the second question refers. This would draw on the tactile
perception of sound and music. Possible technological outcomes could include vibrating
decks on which musicians could stand or sit, pads that could be attached to the body and
arrays of bars that would present vibrations produced by different instruments. Research
supporting the second objective would be needed to find out how vibration signals might be
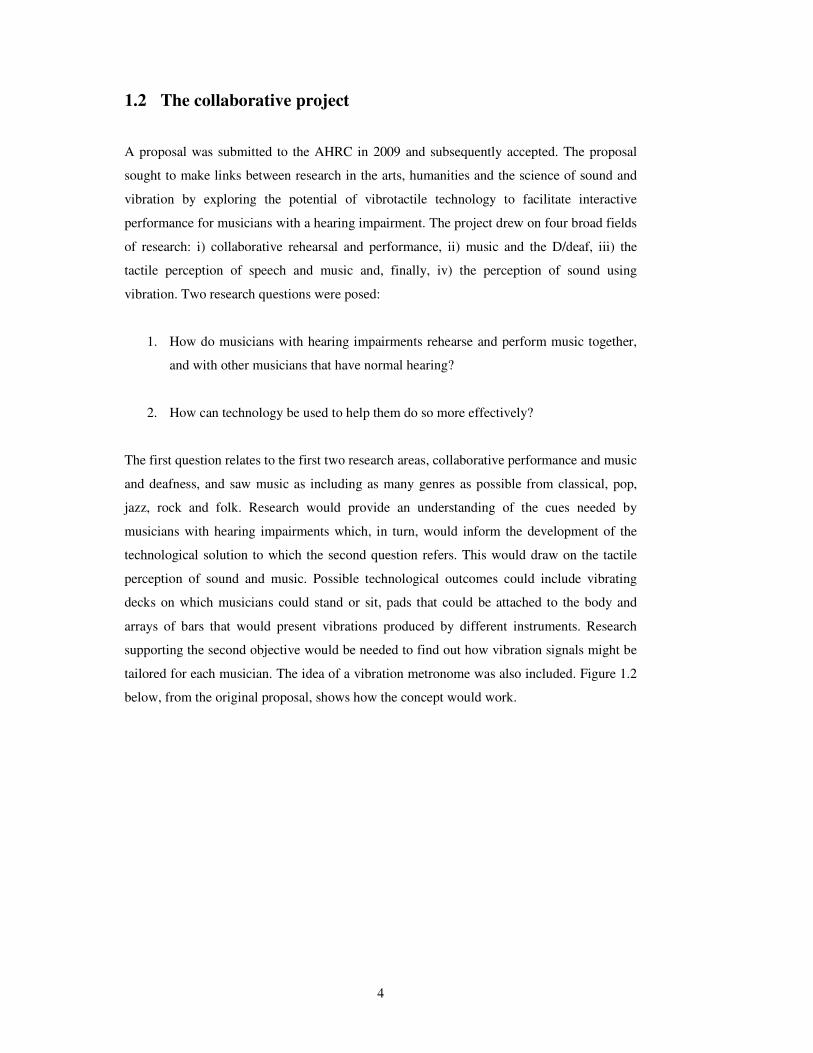
tailored for each musician. The idea of a vibration metronome was also included. Figure 1.2
below, from the original proposal, shows how the concept would work.
5
Figure 1.2 Concept for vibrating performance deck and/or vibrating pads/bars
Sound from acoustic instruments would be picked up by conventional microphones and sent
to a mixer. Output would then be sent back to the musicians each of whom would have
individual control over the feedback depending on their needs. The concept mirrors the
common use of foldback monitors in live performance today, the difference being that
feedback is provided not as sound to the ear, but rather, as vibrations to the skin. The aim
was not to create fully marketable technology, rather to create prototypes for use in
experiments designed to answer the second question. Part of the concept was the design of
software to create an artificial neural network (ANN) to control the mix of signals to be
presented back to the musician as vibration. It was anticipated that for educational
applications, the ANN could be programmed based on the research findings, while
professional musicians would remain able to customise the acoustic content of their
vibrotactile feedback. Given the complexity of musical signals, it was hoped that research
designed to address the second question would support new methods of signal processing for
the conversion of auditory signals to vibrations.
A key partnership within the collaborative project was formed between the University of
Liverpool (UoL), the Royal Northern College of Music (RNCM) and the charity Music and
the Deaf, based in Huddersfield, and run by Dr Paul Whittaker OBE. This was deemed to be
crucial in ensuring a two-way transfer of knowledge: the charity would provide access to
musicians with hearing impairments and also valuable advice about the development of the
technology. In turn, the research project would provide ideas and expertise about how
vibrations can be used in music performance and education. The project received written
6
support from Music and the Deaf, Evelyn Glennie, Hearing Concern and the Royal
Association for Deaf People. It was hoped that this support would facilitate dissemination of
the research findings within the deaf community and the general media. It was anticipated
that findings would be of interest to researchers in psychology, education, psychoacoustics,
human vibration and physics. Perhaps composers might be able to create new works
involving vibrations and new ways of teaching music to deaf and hearing impaired children
might be conceived.
The project team comprised Dr Carl Hopkins (PI), Prof Jane Ginsborg (CI), Saúl Maté-Cid
(Post-Graduate Research Assistant/PGRA), Dr Gary Seiffert (Experimental Officer) and me
(PhD student). The PI, PGRA and Experimental Officer were based at the Acoustics
Research Unit (ARU) at UoL. The CI and PhD were based at the Centre for Music
Performance Research at RNCM. Broadly speaking, research exploring interactive
performance (Research Question 1) was conducted by the RNCM team; research exploring
the perception of vibration (RQ2) was conducted by the UoL. The Experimental Officer was
responsible for building the technology upon which the experiments were carried out. The
experiments replicated tests found in audiology for establishing detection thresholds and
extended them to identify other aspects of vibrotactile perception. The experiments were
designed jointly, but with analysis primarily being carried out by the RNCM team.
Experiments were carried out to explore i) thresholds of detection (Experiment A) and, ii)
the perception and learning of relative (Experiment B1) and absolute pitch (Experiment B2)
using vibrations on the skin. Experiment A was designed, developed and run at the ARU in
Liverpool and analysed jointly. Experiment B1 and B2 were designed jointly but run at the
RNCM and analysed by the current author. Further studies were carried out in Liverpool but
are not reported here.
1.3 My role, responsibilities and me
This thesis addresses RQ1, being concerned with how musicians with hearing impairments
rehearse and perform together with other musicians. Literature reviews summarise existing
research relating to i) music and deafness and ii) cross-modal perception and communication
(Chapter 2). In practice, these reviews helped formulate the protocols used for interviews
with deaf musicians (Chapter 3) and informed the design of subsequent observation studies
(Chapters 4 and 5). A third literature review considers the potential for the perception of
vibrations to contribute to interactive musical performance. This review informed the design
of experiments into the perception of music using vibrations (Chapter 6). Finally, an
7
evaluation is made of the acceptability and effectiveness of the vibration technology for
musicians with hearing impairments based on the evidence (Chapter 7). In this way, the
thesis contributes to RQ2 relating to the creation of vibrotactile technology.
One aspect of my role on the project that I have particularly enjoyed has been that of linking
the various academic disciplines together. While acousticians and music psychologists are
both concerned with the perception of sound, there are substantial differences in language
and approach that had to be overcome in order to facilitate the cross-discipline research
reported here. Often, these differences were best overcome by agreeing on common goals,
aims and outcomes, while acknowledging that our respective paths towards these outcomes
would, inevitably, be different, not only because of our different roles and responsibilities
but because of our different academic and social backgrounds. In retrospect, my experience
in education and music has been useful: it has prompted me to conceptualise potential
technologies not only from the perspectives of the performer and co-performer, but also
from those of the audience, the teacher, the adult, the child, etc. Over the course of the
project (from June 2010 to May 2013) I have performed with deaf musicians and facilitated
performance between musicians with and without hearing impairments. I also lead a deaf
youth orchestra, teaching and facilitating music making for deaf children, and have passed
Level 2 British Sign Language. While I am not deaf myself, these experiences have taught
me more about issues relating to music and deafness, the Deaf community, communication
and about what music really is, than I could have ever learned in a library. In sum, this thesis
is not only the product of literature reviews and empirical studies but also of my experiences
of cross-disciplinary research and music making in the presence of a hearing impairment,
two activities which have been consistently challenging, but highly rewarding.
8
1.4 Summary of thesis content
• Chapter 1 has described how the project came about, the collaborative team, their
roles and responsibilities and how this thesis helps to address the two research
questions investigated by the wider project.
• Chapter 2 contains two literature reviews: the first on music and deafness
(contributing mainly to the interview study in Chapter 3) and the second on cross-
modal perception and communication in music (which informed the observation
studies in Chapters 4 and 5).
• Chapter 3 reports an interview study designed to find out about how musicians with
hearing impairments go about performing with other musicians and to what extent
they are aware of, and use, the vibrations of music.
• Chapter 4 presents the first of two observation studies, originally conceived as a
pilot study, which examined the effects of artificial attenuation and visual contact
between two violinists with ‘normal’ hearing on their looking and movement
behaviour.
• Chapter 5 presents a second observation study (the main observation study), which
explored how communication between players is affected by naturally occurring
hearing impairments. The study involved moderately and profoundly deaf
participants who had taken part in the interview study in reported Chapter 3.
• Chapter 6 begins with a literature review about the perception of pitch using
vibrations and current vibration technologies used in musical contexts. It then
reports the findings of three psychophysical experiments designed to explore i)
thresholds of detection, ii) relative pitch perception and iii) absolute pitch learning
of vibrations on the skin.
• Chapter 7 summarises and discusses the limitations and implications of all the
findings together to explore the extent to which vibrotactile technology can facilitate
interactive performance for musicians with hearing impairments. Suggestions are
made for further research into the perception of music using vibrations.
9
CHAPTER 2 – Literature Reviews
This chapter contains two reviews of the literature that addressed RQ1: How do musicians
with hearing impairments rehearse and perform music together, and with other musicians
that have normal hearing? Review 1, ‘Music and deafness’ (Section 2.1), summarises
research on deafness and hearing impairments in musical contexts, including ‘Audiology
and music’ (2.1.1), ‘Cochlear implants and hearing aids’ (2.1.2) and ‘Music education and
therapy’ (2.1.3). This review provided the backdrop to the interview study reported in
Chapter 3. Review 2, entitled ‘Cross-modal communication and perception’ (Section 2.2),
contains sections on ‘Communication in music’ (2.2.1), ‘Movement as communication’
(2.2.2), ‘Auditory musical perception’ (2.2.3), two sections on cross-modal perception
(2.2.4-5) and a summary (2.2.6). This literature helped formulate the research questions for
the observation studies reported in Chapters 4 and 5, in which the effects of both artificial
auditory attenuation and natural deafness on musical performance behaviours were
examined.
10
Review 1 - Music and deafness 2.1
The term ‘deaf musician’ might initially be seen as an oxymoron, but evidence suggests
otherwise. Ludwig van Beethoven was profoundly deaf for the last eight years of his life.
During this period (1817-1824) he composed his Ninth Symphony and it is reported that he
used a wooden stick held between his teeth and the piano to compose by feeling the
vibrations of the piano (Barry, 2008). The Czech composer Bedřich Smetana became deaf
10 years before his death, during which time he wrote the movements Vysˇehrad and Vltava
of his symphonic cycle Ma´Vlast (Ottlová, 2001). There are also performers with hearing
impairments; as noted in Chapter 1, Evelyn Glennie is extremely well known as a solo
percussionist and, thanks to vast media exposure, also known for her deafness. Profoundly
deaf from the age of 12 (Cleall, 1983), Glennie reports that she experiences music by feeling
the vibrations created by her instruments:
Hearing is basically a specialised form of touch. Sound is simply vibrating air which
the ear picks up and converts to electrical signals, which are then interpreted by the
brain. … Deafness does not mean that you can’t hear, only that there is something
wrong with the ears (Glennie, 2010b, p. 1).
For every high-profile deaf musician (in May 2013 Wikipedia listed 22 including
Beethoven, Smetana and Vaughan Williams) there are many more skilled deaf musicians
who are not so well known. The Association of Adult Musicians with a Hearing Loss (based
in the US) lists 24 musicians (www.aamhl.org). Action on Hearing Loss (AoHL) states that
there are over 10 million deaf and hard of hearing people in the UK representing one in six
of the population (AoHL, 2011) including more than 41,000 deaf children and young people
(CRIDE, 2012). The value of music for those with hearing impairments is evidenced in the
work of the UK based charity Music and the Deaf (www.matd.org.uk). Founded by Paul
Whittaker in 1988, it facilitates access to music through creative workshops and the national
deaf orchestras programme and published guides in 2006 designed to assist teachers to
‘unlock’ the National Curriculum for deaf and hearing impaired children (Whittaker, 2008).
These facts and figures suggest that, contrary to the view that music making with a hearing
impairment must be unfeasible (as some may think), it is actually quite prevalent.
Music is a powerful means of positive communication and expression, especially between
and within groups of people (Cross, 2009). As the profoundly deaf flautist and teacher Ruth
Montgomery states in the opening line of her college dissertation, “Music is not about

11
hearing any more than language is” (Montgomery, 2005, p. 10). Ruth highlights this
communicative role of music and gives a succinct justification for deaf people to make
music, defining music furthermore without reducing it to its modus operandi or need to be
heard. Consider also that Beethoven continued to compose long after his hearing had begun
to deteriorate, which provides further evidence that the skills needed to make music, whether
created in notation or performed, does not entirely depend on the physiological ability to
hear. As the profoundly deaf professional musician Liz Varlow writes: “I think musicality is
something that exists irrespective of hearing” (Varlow, pers. comm.).
There is no denying that hearing loss does, however, have a tangible impact on an
individual’s ability to perceive information in the auditory signal. Levels of deafness are
measured by identifying the threshold, or quietest sound, that a person can hear and the
following definitions are applied: ‘Normal’ hearing (threshold of 0-20 dB); mild deafness
(25-39 dB); moderate (40-69 dB); severe (79-94 dB) and profound deafness (>95 dB)
(AoHL, 2011). Unlike speech, which averages 65 dB with only a 12-15 dB range, a musical
auditory signal can range from 20 dB (brushes on a snare drum) to 90 dB (solo trumpet or
horn playing mp) and even 120 dB for a full orchestra (Chasin, 2006; Hansford, 2011). It is
therefore likely that a mild level of deafness will cause the listener to lose some quiet sounds
in music, while a severe or profound deafness will make it impossible for listener to perceive
the all but the loudest musical auditory signals. Primary source data about the perception of
music with a hearing impairment is scarce but a good example is that of Elke Bartlmä,
written up in Salmon’s book ‘Hearing – Feeling – Playing’ (Bartlmä, 2008). Being
profoundly deaf, Elke’s first experiences of music were not auditory at all, but instead,
vibrotactile. It was not until the age of 11 that Elke, now a profoundly deaf music
educationalist, realised that it was the regularly occurring vibrations in the floorboards in the
ballet studio that helped her fellow dancers know when to move, and she discovered the
‘beat’ (Bartlmä, 2008). During the following year she also realised that what she felt
underfoot in her dance classes was in fact caused by the music: “I learned to give in to and
follow this ‘rumbling’ which was in reality the vibrations caused by music” (Bartlmä, 2008,
p. 24). Before this, she had very little idea as to what music was. Bartlmä recalls her
experience of watching the reactions of her family members listening to her uncle play the
guitar: “Heads were nodded, strange faces were pulled, eyebrows were raised and more
often than not everyone looked sad” (Bartlmä, 2008, p. 22).
Other clues about the effects of deafness of the perception of music can be found in research
on childhood development, which reveals that some aspects of the human preference for
music are innate, unaffected by pre- or post-natal experience. For example, infants’
12
preference for infant-directed singing as opposed to adult-directing singing is present at
birth, even in two-day-old hearing babies born to deaf parents whose first language is sign
language (Masataka, 1999). Other aspects of musical development, however, are ignited by
exposure. Vestibular/physical-auditory associations can occur as early as 4-7 months in
normally-hearing babies (Morgan, Killough, & Thompson, 2011; Phillips-Silver & Trainor,
2005) but anecdotal evidence suggests that hearing impairments may slow initial musical
development, just as it has been shown to impede children’s perception of emotion in music
(Darrow, 2006).
In adulthood too, a hearing impairment has an impact on the musicians’ ability to perform.
Helga Wilberg, a deaf music educationalist, writes, “It was utterly impossible for me to tune
[my violin] with the orchestra, because I need absolute silence” (Wilberg, 2008, p. 18).
However, this does not imply an inability to tune per se. Wilberg also states that “the fine
tuning, paying attention to the intonation and careful listening” required for the violin suited
her (2008, p. 16). For Evelyn Glennie, a gradual hearing loss during her teens coupled with
on-going musical training resulted in the development of a new way of listening. At the
2003 TED Conference in Monterey, Canada, Evelyn Glennie told her audience, “My job is
all about listening. And my aim really, is to teach the world to listen – that’s my only real
aim in life” (Glennie, 2003). She went on to say that unique emotional experiences of music
can be obtained by opening up one’s whole body, not just one’s ears. She argued
persuasively for a broader definition of listening, allowing for the body to feel sound, both
physically and emotionally. The effects of hearing impairments on music perception is
further complicated by the use of hearing aid and cochlear implant technology, which
process auditory signals in different ways, as described below in Section 2.1.2.
Treating a hearing impairment as a disability is problematic. Firstly, the use of British Sign
Language (BSL) in Deaf communities means that people may have little reason to think of
themselves as disabled at all. The social model of disability defines disability as socially
constructed and places the onus on society to reduce or eliminate discriminatory practices
(Oliver, 1990). Within a community of BSL users, the socially constructed communication
impairment disappears and people are not, therefore, disabled. A criticism of the social
disability model is that it places an “unsustainable distinction between impairment (bodily
difference) and disability (social creation)” (Shakespeare & Watson, 2001, p.18). Indeed, it
is the social perception of musical task demands and the ability of a person with a hearing
impairment to perform them that renders deafness a ‘disability’ in musical contexts and
heightens the duality of impairment and disability. As Evelyn Glennie points out:
13
The definition of the category of “Deaf”, i.e., not being able to hear sound, and the
category of Music, which is sound, are mutually exclusive. My career, like that of
Beethoven's and a number of others, is an impossibility. There are only three
possible explanations: I am not a musician, I'm not deaf, or the general
understanding of the categories of “Deaf” or “Music” must be incorrect. (Glennie,
2010a, p. 2).
Music can be visual, physical and tactile; it can be perceived using the visual, vestibular, and
the somatosenses which include the proprioceptive (or kinaesthetic) senses and the
somatosenses or skin senses. The use of hearing aids or cochlear implant technology means
that it is very rare that an individual with a hearing impairment hears absolutely nothing. It is
impossible to know, however, exactly what it is like to experience music with a hearing
impairment: no two people have exactly the same type or level of impairment. Similarly, the
question of whether we all experience colours in the same way is both phenomenological
and philosophical. Furthermore, musical training influences auditory perception by means of
perceptual learning. For example, we perceive a triad [chord] as a single thing until we learn
that it is made up of component parts and that, if we direct our attention to them, we can
perceive them individually (Clarke, 2005, p. 24). Thus, the flexibility of our ability to listen
means that whatever the level or quality of the information received via the ears, our
subjective auditory experiences are unique, and perhaps more so than our visual experiences.
Audiology and music 2.1.1
Although a brief summary is given below, a detailed account of hearing loss, its implications
and treatment using amplification technology is beyond the remit of this thesis. Useful texts
include Moore’s book, An Introduction to the Psychology of Hearing (2003) and Stach’s
Clinical Audiology, An Introduction (2010). There are two main categories of hearing
impairment that result in loss in hearing sensitivity: conductive and sensorineural hearing
loss. Conductive hearing loss occurs when a problem, typically in the outer or middle ear,
reduces the transmission of sound waves to the cochlea. A build-up of earwax (cerumen) in
the outer ear, for example, or a chronic infection of the middle ear can cause a conductive
hearing loss. A conductive loss of the inner ear can be caused by otosclerosis, an
abnormality of the bone. In most cases, the direct result of a conductive hearing loss is the
attenuation of incoming sound, which can usually be addressed to some degree using
hearing aids (Moore, 2003). The second type, sensorineural hearing loss, is typically a result
of a defect in the hair cells of the cochlea but can be caused by a lesion or tumour on the

14
vestibulocochlear nerve (auditory brainstem) (Stach, 2010). Congenital hearing impairments
can significantly affect children’s ability to learn language (Halliday & Moore, 2010), while
losses acquired later in life, such as noise induced hearing loss (NIHL), can make it hard to
understand speech (Moore, 2003).
Audiological studies that address the topic of music tend to be framed around the issue of
NIHL in musical contexts. Little evidence has been found to suggest that classical music
causes hearing loss in the conservatoire (Schmidt, Verschuure, & Brocaar, 1994). Mean
hearing level thresholds (HTLs) of orchestral players do not differ significantly from normal
populations and while the asymmetric playing positions of some instruments has been
suggested as a cause of lateral variances in HLTs (Royster, Royster, & Killion, 1991), it may
not explain all variance in this respect (Backus & Williamon, 2009). The damaging effects
of loud music on hearing in the context of the club scene are well documented (Potier et al.,
2009). It is difficult to quantify the risk of hearing loss as the result of exposure to music, in
any context, since it cannot easily be isolated from other sounds. Nevertheless, the findings
of studies examining the use of earplugs by musicians in preventing and managing NIHL in
musical contexts indicate a lack of awareness of the potential risks (Chesky, Pair,
Yoshimura, & Landford, 2009; Drennan, 2010; Laitinen & Poulsen, 2008). In 2008, the UK
Control of Noise at Work Regulations were extended to include the music and entertainment
sector, and the BBC launched their Noise Project, measuring noise using dose badges. Some
musical performers recorded a level of exposure per day (LEPd) of over 85dB(A) (average
exposure), the level at which an employer is obliged to provide hearing protection and the
initiative heightened musicians’ awareness of the risks associated with noise exposure
(Hansford, 2011).
Cochlear implants and hearing aids 2.1.2
The use of cochlear implant (CI) and hearing aid (HA) technology by people with hearing
impairments is an important factor in the consideration of the effects of deafness on the
perception of musical auditory signals. In September 2010 there were about 7000 people in
the UK with CIs and the criteria for deciding who may benefit from a CI are changing as the
technology develops (Deafness Research UK, 2010). CIs are designed to facilitate verbal
communication. Auditory speech signals from an external microphone are delivered to an
array of electrodes implanted in the cochlea which directly stimulates the auditory nerve
making speech more intelligible and enabling users to regulate the volume and pitch of their
own voice. This signal processing has a negative effect on the perception of musical auditory
15
signals, in particular on the preservation of pitch spectra. The limited number of electrodes
in a CI means that, while rhythm perception can rival that of listeners with normal hearing,
the perception of pitch and timbre in music is very poor (Looi, McDermott, McKay, &
Hickson, 2007, 2008a, 2008b; McDermott, 2004), can vary greatly from person to person
(Townshend, Cotter, Van Compernolle, & White, 1987) and affects even children’s
engagement with music (van Besouw, Grasmeder, Hamilton, & Baumann, 2011). Melody
perception, however, can be achieved using rhythmic cues (Pijl & Schwarz, 1995). As might
be expected, adult CI users who become deaf later in life report being disappointed with the
sound of music. In contrast, child CI users enjoy music and benefit from musical activities
(Mitani et al., 2007; Trehub, Vongpaisal, & Nakata, 2009). The endeavour to improve music
perception for CI users has generated the use of assessment tools such as Music EAR
(Alexander, Bartel, Friesen, Shipp, & Chen, 2011), the Clinical Assessment of Music
Perception (Nimmons et al., 2008) and applications of existing measures such as the
Glasgow Benefit Inventory to the issue of music perception using CIs (Lassaletta et al.,
2007). Auditory and musical training has been shown to improve pitch perception in pre-
lingually deaf child CI users (Chen et al., 2010) and this endeavour has been extended to
post-lingually deaf adult CI populations. For example, the University of Southampton
received an extension in 2012 to their AHRC-funded project Compositions for Cochlear
Implantees to create a prototype music rehabilitation programme for CI users (information
about this work can be found here:
http://www.southampton.ac.uk/mfg/news/new_compositions_project.shtml).
Of the one in six of the UK population with a hearing impairment (10 million people) at
least 2 million possess hearing aid technology and, of these people, 1.4 million actually use
it (Deafness Research UK, 2009). These figures have probably risen since 2009. There are
far more users of HA technology than CIs and, as such, it is more likely that musicians with
acquired hearing impairments will be HA users. However, there seem to be far fewer studies
investigating music perception using HAs than there are for CIs, despite the larger
proportion of the population affected. This disparity was confirmed in a review by Tozer and
Crook (2012) at the Sheffield Teaching Hospitals NHS Trust. Perhaps music perception
using CIs is easier to research than music perception using HAs because it is difficult to
design experiments controlling for auditory processing through HAs. As with CIs, HAs HAs
are designed and programmed to maximise speech perception, not music perception.
Marshall Chasin, a musician, audiologist and Director of Auditory Research at the
Musicians' Clinics of Canada, has done much work to quantify the ways in which auditory
speech signals differ from music signals, which Tozer and Crook (2012) summarise as
follows. Firstly, music has larger dynamic ranges, intensity ranges and crest factors (the

16
difference between the peak intensities and average intensity level of the spectrum) than
speech (Chasin & Russo, 2004), which can cause listeners to perceive music as either too
loud or too quiet (Leek, Molis, Kubli, & Tufts, 2008). Secondly, music has a far larger
frequency range than speech: from the lowest note of the piano to the highest harmonics of
the violin or piccolo music can cover a bandwidth of over 18kHz (Russo, 2006; Tozer &
Crook, 2012). Distortions to music can result from the signal processing applied to HA
technology to optimise speech perception, namely non-linear amplification and automatic
gain control (Chasin, 2010; Chasin & Russo, 2004; Moore, 2003). That said, Chasin and
others have made recommendations for the optimal programming of inputs, frequency
compressions, amplifications and noise reduction parameters of digital hearing aids for
music (Chasin, 2006, 2010; Killion, 2009) and even older analogue hearing aids (in use until
around 1995) can be optimised for use with music with good results (Dalgarno, 1990).
Unfortunately, such improvements usually cost both time and money and require the user to
employ technical skills.
In sum, hearing aids and cochlear implants manipulate auditory signals in different ways and
cause a variety of effects on the perception of musical signals. Objectively, HAs preserve far
more of the auditory signal than CIs. Rhythm perception is not likely to be negatively
affected in either user group, although the perception of pitch, melody, texture and timbre
may be distorted by HAs and is certainly severely compromised by CIs. Surprisingly, it has
been shown that adult CI users rate music as sounding more pleasant than do HA users
(Looi, et al., 2007). These ratings however, are likely to be affected by the age of onset of
deafness and therefore the ability to make prior comparisons with auditory musical
memories; differences in the sample demographics of HA and CI users may account for
these ratings. If deafness is acquired, HA users may have to adjust to, and report being less
satisfied by, new, imperfect musical sounds. Conversely, CI users, who are typically
profoundly deaf before implantation, are less likely to have prior musical memories and may
rate new musical auditory experiences more favourably.

17
Music education and music therapy 2.1.3
It is perhaps in the fields of music education, music therapy and hearing therapy, that the
practical interactions between HA and CI technology, music and the deaf community are
best understood, where the primary aim is access to and engagement with music for learning
or wellbeing. According to the latest Consortium for Research in Deaf Education (CRIDE)
report, 72% of deaf children in the UK attend mainstream schools, of which only 11% have
specialist resource provisions for deaf children (see Table 12 in CRIDE, 2012). The issue of
adequate access to music for deaf children is therefore a concern: hearing aid technology
increases access to auditory information about timbre, texture and rhythm but access to the
emotional content of music, such as happiness, sadness or fear, has been shown to be limited
for deaf children (Darrow, 2006). Children with severe or profound deafness who do not use
HA or CI technology, may grow up in almost silent worlds; music is a force of which they
may simply not be aware.
A hearing impairment can, therefore, have a dramatic effect on musical development, but
this does not render music education worthless for deaf children. The Mary Hare School for
the Deaf, in Newbury, UK, was the first deaf school to integrate music fully into its
curriculum. Music became established in the school in the late 1970s and 1980s and between
1981 and 2009 over 300 ABRSM examinations were passed by pupils at the school (Fawkes
& Ratnanather, 2009). This was possible largely because of improvements to HA
technology: powerful, analogue, behind-the-ear HAs provided enough auditory information
to pupils for music to be incorporated gradually into assemblies, clubs, after-school
activities, even discos (Fawkes & Ratnanather, 2009). Despite the limiting effects of a
hearing impairment and the use of HA or CI technology on the perception of music, the
inherent musicality of young children requires expression (Yennari, 2010) and it has been
shown that engagement in musical tasks need not be compromised by a hearing impairment
(Chen-Hafteck & Schraer-Joiner, 2011), further justifying the provision of music education
for deaf children. In addition, the non-musical outcomes of musical activity, such as intrinsic
enjoyment, emotional reward and social benefits, have long been identified as being
especially important in music pedagogy for the deaf (Williams, 1989). Even during the years
Evelyn Glennie was becoming deaf, her descriptions of the enjoyment she experienced
learning music and exploring the sound world around her support this (Glennie, 1990). For
those who lose their hearing later in life, losing the music can be extremely distressing.
Hearing therapists work with these individuals to help them regain access and control of
their musical worlds.
18
The distinction between music education and music therapy is important. The World
Federation of Music Therapy (WFMT) describes music therapists’ aims to use music to
improve “physical, social, communicative, emotional, intellectual, and spiritual health and
wellbeing” (WFMT, 2011) where hearing impairments may be encountered alongside other
mental or physical disabilities. This is, of course, not a problem in itself. Expertise in music
therapy has provided materials, lesson plans, ideas and perspectives (Robbins & Robbins,
1980) that have advanced the provision and practice of music in special education including
the Mary Hare School for the Deaf (Rocca, 2008). Indeed, recent research suggests that
music can benefit children’s language development. For example, modern brain imaging
methods have revealed links between musical rhythmic entrainment and phonological
deficits that underpin language disorders such as developmental dyslexia (Goswami, 2011).
Irrespective of the therapeutic or educational aims of social musical situations, music clearly
offers emotional, intellectual, psychological and physical rewards and benefits. The founder
of the charity Music and the Deaf, Paul Whittaker, has stated that “what we’re interested in
is giving people a creative, social, cultural and emotional skill and outlet that they can begin
to explore at a young age and take right the way through life” (Whittaker, 2008, p. 32).
Prioritising extra-musical benefits, however, above the intrinsic enjoyment of learning,
creating and performing music can lead to music being negatively associated with such
educational interventions, the result of which can seem very patronising to the deaf musician
(Whittaker, 1986).
Summary 1 2.1.4
The issue of access to music for people with hearing impairments is primarily one of
improving quality of life. The benefits of musical training, engagement and activity,
however, reach beyond quality of life and include measurable improvements to musical
performance and listening skills (as evidenced by the existence of music education for the
deaf) and social, communication and even literacy skills (as evidenced in music therapy for
the deaf and findings in developmental psychology). While research on music and deafness
in education and therapeutic fields is easy to find, there is a relative paucity of research
about how musical engagement and activity is affected by a hearing impairment into
adulthood and over the life span. Nevertheless, the evidence shows that music making with a
hearing impairment is prevalent, and therefore not as unfeasible as one might expect (Barry,
2008; Bartlmä, 2008; Glennie, 1990; Montgomery, 2005; Whittaker, 2008). The fact that
there are so few subjective accounts of the personal and social subjective experiences of

19
musicians with hearing impairments may be due to social stigma or prejudice about deafness
in musical contexts.
Clearly, deafness need be no barrier to music making, nor should it limit the potential
standard that can be attained and enjoyed by people with hearing impairments. There
remains a tension, however, between therapeutic engagement in music by the deaf for social
and emotional (non-musical) ends, and intrinsic engagement in music and music theory for
its own sake. While most music education research today takes a more holistic stance, it
remains focused on children and young people. Clearly there is scope to improve our
understanding about how musical behaviours are affected by hearing impairments over the
life-span.

20
Review 2 – Cross modal communication and perception 2.2
In order to gain an understanding of how hearing impairments may affect musical perception
by way of empirical research, it is necessary to explore the many ways in which music can
be perceived using all our senses, that is to say, the cross-modal perception of music. Given
the focus on interactive performance in the wider project’s aims, it is also necessary to
extend this understanding to the many ways in which performers can use information in
different sensory modalities to communicate, both with listeners and with co-performers.
This review therefore adopts a top-down approach in order to explore the ways in which our
senses mediate the perception and cognition of music and our communicative behaviours in
music performance. It begins by exploring social communication in musical ensembles
(2.2.1) and the use of movement and gesture (2.2.2). Subsequently, key aspects of auditory
musical perception are introduced (2.2.3) before exploring how visual and physical sensory
information interacts with auditory perception (2.2.4-6). Throughout, the question of how a
hearing impairment may affect perception and communication in music is considered.
Communication in music 2.2.1
Communication in music, as in everyday life, occurs both verbally and non-verbally.
Research into the communicative aspects of music making has only begun to be undertaken
relatively recently given the models of group interaction developed by social psychologists
in the 50s and 60s (Bales, 1950; Young & Colman, 1979). One frequently-cited study
examined the social dynamics of 80 professional British sting-quartets with a view to
informing understanding of group processes in organisational psychology, and highlighted
paradoxes of leadership and democracy, the role of the second violinist, and confrontation
versus compromise. The authors showed how the most successful quartets manage these
dynamics implicitly rather than explicitly; they recognise that they exist and work with
rather than against them (Murnighan & Conlon, 1991).
Since 2000, music psychologists have begun to explore social aspects of non-verbal
communicative behaviours between (as opposed to within) different rehearsals, performers
and co-performers. Verbal interactions between singers and pianists have been analysed,
showing the ways in which individual performance cues become shared, facilitating both
memorisation for the individual and cohesive performance for the duo (Ginsborg, Chaffin, &
Nicholson, 2006a). Thus, case-study research on specific (groups of) musicians has provided
21
glimpses into the processes linking idiosyncratic and social musical behaviour. To control
for idiosyncratic behaviours, singers and pianists were observed in rehearsal with different
partners of same and different levels of expertise and familiarity (King & Ginsborg, 2011).
The authors found that physical gestures were used more with familiar and same-expertise
partners. However, quantifying the effects of social parameters such as age, expertise,
familiarity and social roles on communication between performers in rehearsal and
performance remains difficult as they so are specific to individuals. Goodman (2002) arrived
at this conclusion, stating that “an ensemble performer exhibits individual, ‘solo’ tendencies
in performance at the same time as he or she tries to blend with the rest of the group”
(Goodman, 2002, p. 165).
It is generally accepted that too much talk in rehearsal is a bad thing while more time spent
playing is good. This has been reinforced by observations that high-expertise ensembles talk
less than low-expertise ensembles (Ginsborg & King, 2012; Murnighan & Conlon, 1991). In
Davidson & Good’s string quartet study (2002) the amount and the content of rehearsal talk
was used to show how social (and gender) roles were maintained. Since then, various coding
schemes for talk have been developed and explored in musical rehearsal contexts. Ginsborg
et al. (2006a; 2006b) extended one for ‘musical dimensions’ developed by Chaffin et al.
(2002) to capture the breadth of topics present in musical discussions and grouped them
according to the following categories: basic, structure, interpretation, metacognition,
performance and memory. Seddon & Biasutti (2009) extended earlier research on string
quartets by focusing on a jazz sextet, arguing for the existence of a special kind of
communication in long-established groups with high levels of expertise. A hierarchy of three
‘modes of communication’, Instructive, Co-operative and Collaborative, were applied to
both verbal and nonverbal behaviour. The Collaborative mode was deemed to be indicative
of a state of empathetic creativity in which spontaneous musical variations can be made
during performance. Talk in Collaborative mode included discussions of the interpretative
and stylistic aspects of the performance. Ginsborg and King (2012), in their study of singers
and pianists, used a well-established taxonomy of verbal interaction, Interaction Process
Analysis (IPA, Bales, 1950, 1999), and found that students were more likely than
professionals to ask for orientation and that professionals were more likely than students to
ask for, and give, opinions.

22
Movement as communication 2.2.2
In music, as in everyday life, nonverbal communication between people takes place using
movement and gesture. The concept of gesture is commonly used in discourses about
movement in music. There is also a strong relationship between gesture and sign used in
literature on non-verbal human communication and sign languages used by people with
hearing impairments. This section begins by defining ‘gesture’ before outlining the ways
musicians use movement and gesture to facilitate learning and communication in rehearsal
and performance.
Gesture exists within a wider context of non-verbal communication, outside that of musical
performance. It happens every day when human beings interact and communicate with each
other. The Oxford English Dictionary states that gestures are movements that express ideas
or meaning, presumably as opposed to movements that do not. Kendon has published widely
on gesture and sign language and defines gesture as:
…those actions or those aspects of another’s actions that, having these features (of
manifest deliberate expressiveness), tend to be directly perceived as being under the
guidance of the observed person’s voluntary control and being done for the purpose
of expression rather than in the service of some practical aim (Kendon, 2004, p. 15).
Volitional control or the conscious intention to communicate is central to working
definitions of gesture, while specific meanings are less important; it is simply the perception
of intended expressiveness that makes an action a gesture. Gesturing during speech is a
robust phenomenon that is stable across cultures and contexts (Goldin-Meadow, 1999). Even
blind people use their hands when they talk to other people, including those they know to be
blind too, although they may never have seen others gesture (Iverson & Goldin-Meadow,
1998). According to McNeill, “the gesticulations with which speech is obligatorily present
are the least language-like; the signs from which speech is obligatorily absent have linguistic
properties of their own” (McNeill, 2000, p. 4). Gestures have been differentiated from signs
in this way (Kendon, 1988) on what is now termed the Kendon continuum (McNeill, 1992),
spontaneous gesticulation – speech-linked gestures – emblems – pantomime – sign
language, in which each type of gesture varies according to a number of factors, the most
salient being its relationship to speech. Spontaneous gesticulation accompanies speech.
Speech-linked gestures are illustrative and can replace words, for example, “He went
[gesture]”, or they can be deictic, for example, “There [points]”. Emblems (or signs) are
gestures representing consistent meanings or functions within a particular culture, such as
23
the thumbs-up meaning “OK”, rendering speech unnecessary. Pantomime and true sign
language are used, by contrast, in place of speech. Thus communication can involve the
vocal and manual modalities separately and combined to different extents.
Although differing in their scope, the taxonomies of gesture produced by Ekman and Friesen
(1969) and McNeill (1992) contain common elements. In addition to emblems (defined
above), illustrators can encompass both spontaneous gesticulation and those speech-linked
gestures that are made during speech. Ekman and Friesen’s original taxonomy encompassed
all kinds of non-verbal cues, however, not just those conveyed by gesture: emblems can
include uniforms, since they signal authority, and regulators can include eye contact, used in
conversation to mediate turn-taking. Gestures are categorised, not only by type but also
meaning, as deictic, iconic or metaphoric. As we have seen from the example of pointing
given above, those described as deictic assign meaning to different locations in space such as
places, people and points in time (Liddell, 2000). When a gesture imitates an action it can be
described as iconic. For example, a speaker might cup his hand, the palm facing towards
him, and bring it towards him, as though bending the branch of a tree, while saying “He
bends it way back” (McNeill, 2000). Metaphoric gestures present an abstract concept,
known as the ‘referent’ of the gesture, via concrete imagery, known as the ‘base’ of the
gesture which provides the vehicle for the metaphor (McNeill, 1992, p. 80).
The study of musicians’ movements and gestures has become established alongside a
“movement away from a narrow focus on the musical mind towards a broader focus on the
musical body” (Gritten & King, 2006, p. xix). Musicians use gestures in many different
ways while practising independently, rehearsing together and performing in public;
taxonomies of gesture used in verbal and non-verbal communication have been adapted and
used to code musicians’ movements in these situations. Some gestures are used in the
context of speech or are linked to speech but others reflect the performer’s ideas about
musical shape and motion. In rehearsal and during practice, musicians develop visual mental
representations of the instrument, the notated score and auditory representations, particularly
when memorising music. These representations are also kinaesthetic involving
proprioception (awareness of the body in space) and other, learned, physical behaviours. For
example, singers have been shown to gesticulate in rehearsal, most commonly maintaining a
pulse or beating time (King & Ginsborg, 2011). Subsequently, such movements may be
suppressed in performance (Ginsborg, 2009), or replaced by choreographed gestures such as
those described by Davidson in her studies of Annie Lennox and Robbie Williams
(Davidson, 2001, 2006). While it may come naturally to singers to gesture while singing as
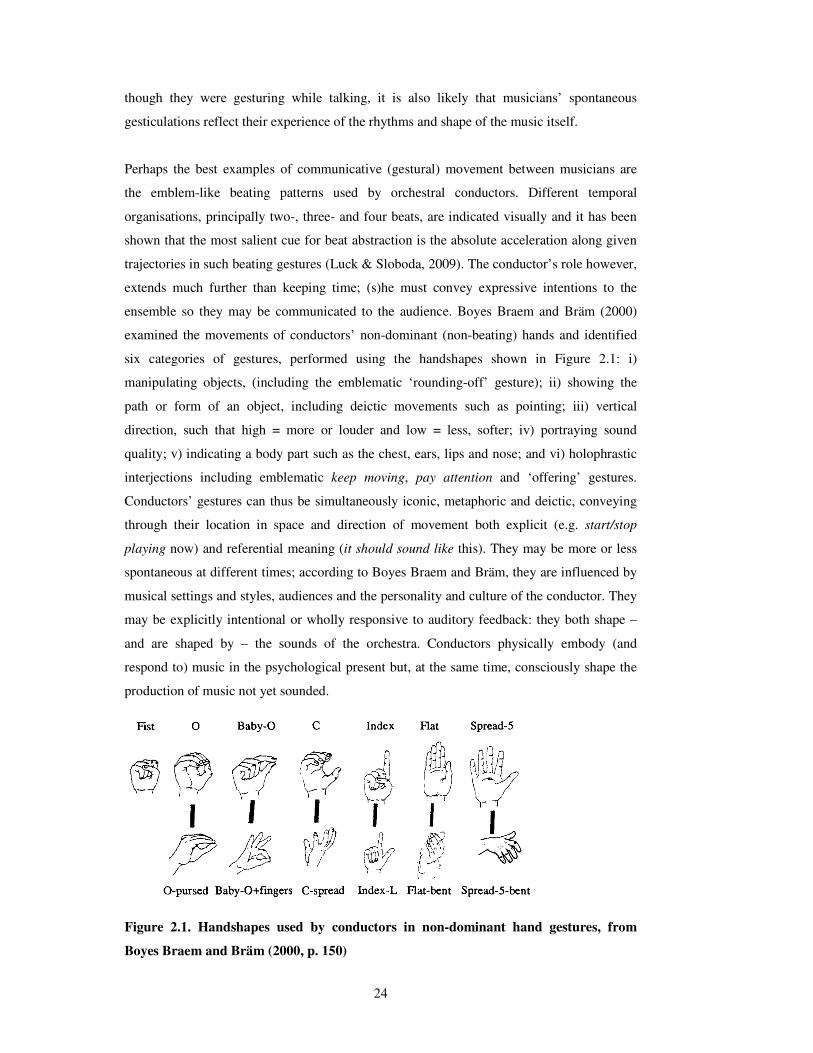
24
though they were gesturing while talking, it is also likely that musicians’ spontaneous
gesticulations reflect their experience of the rhythms and shape of the music itself.
Perhaps the best examples of communicative (gestural) movement between musicians are
the emblem-like beating patterns used by orchestral conductors. Different temporal
organisations, principally two-, three- and four beats, are indicated visually and it has been
shown that the most salient cue for beat abstraction is the absolute acceleration along given
trajectories in such beating gestures (Luck & Sloboda, 2009). The conductor’s role however,
extends much further than keeping time; (s)he must convey expressive intentions to the
ensemble so they may be communicated to the audience. Boyes Braem and Bräm (2000)
examined the movements of conductors’ non-dominant (non-beating) hands and identified
six categories of gestures, performed using the handshapes shown in Figure 2.1: i)
manipulating objects, (including the emblematic ‘rounding-off’ gesture); ii) showing the
path or form of an object, including deictic movements such as pointing; iii) vertical
direction, such that high = more or louder and low = less, softer; iv) portraying sound
quality; v) indicating a body part such as the chest, ears, lips and nose; and vi) holophrastic
interjections including emblematic keep moving, pay attention and ‘offering’ gestures.
Conductors’ gestures can thus be simultaneously iconic, metaphoric and deictic, conveying
through their location in space and direction of movement both explicit (e.g. start/stop
playing now) and referential meaning (it should sound like this). They may be more or less
spontaneous at different times; according to Boyes Braem and Bräm, they are influenced by
musical settings and styles, audiences and the personality and culture of the conductor. They
may be explicitly intentional or wholly responsive to auditory feedback: they both shape –
and are shaped by – the sounds of the orchestra. Conductors physically embody (and
respond to) music in the psychological present but, at the same time, consciously shape the
production of music not yet sounded.
Figure 2.1. Handshapes used by conductors in non-dominant hand gestures, from
Boyes Braem and Bräm (2000, p. 150)
25
Beyond the orchestral conductor, communicative movements also exist within small
ensembles and between performers themselves. Davidson and Good (2002) observed that
certain physical movements served explicitly communicative functions within the classical
string quartet. A key example was the ‘gestural marking of exits and entrances’, which
served to co-ordinate the ensemble synchrony of the group. Other categories of movement
included ‘marking of dynamics’ and ‘circular body sway’, which also served to
communicate information between performers but perhaps to a lesser extent: “[as] each
musician made an entry, s/he appeared to add an extra ripple to the wave of backwards and
forwards movement that was passing between them” (Davidson & Good, 2002, p. 198). This
study was a key step in linking non-verbal communicative processes with social group roles
within the quartet including issues of musical expertise and social familiarity. At a similar
time, Williamon and Davidson (2002) demonstrated that the co-ordination of eye contact
and non-verbal gestures between two pianists increased over during the rehearsal process as
the players became more familiar with both the musical score, and each other. The gestures
of instrumental musicians however, are rarely entirely spontaneous, as the presence of the
musical score contributes to their repeatability over successive performances (Wanderley &
Vines, 2006). Davidson’s (2007) case study involving a single pianist showed that the size
and location of expressive movements were largely consistent over repeated performances,
confirming these findings.
As was shown to be the case for verbal communication (Section 2.2.1), social factors affect
non-verbal communication between players using visually-perceived movement. It has been
shown that gestures are used to a greater extent when rehearsing with familiar partners and
those of a similar level of expertise, than with new or different-level expertise partners and
the range of gestures used is bigger (King & Ginsborg, 2011). A recent ethnographic study
of duo partners in North Indian music by Nikki Moran reinforces the idea that musicians’
use of gesture goes beyond what is needed to produce sound. In this study, movement cues
used by the musicians to co-ordinate their participation in musical performance were found
to be socially constructed and embedded in the relationships between players (Moran, 2011).
Remaining at the social level, it is only in Western classical contexts that constraints are
placed on audience movement to music, since audiences are (typically) seated at concerts;
movement to music is considered a natural phenomenon in most other musical contexts in
the world (Hodges, 2009). Within Western classical traditions, constraints on movement
extend to the performer as a result of performance conventions arising from the score and
the musicological contexts inherent in different genres, periods and compositional styles
(Ginsborg, 2009).
26
The examples above illustrate that boundaries between movement and gesture are blurred in
musical performance contexts. Musicians’ gestures, like everyday speech gestures, can carry
meaning and facilitate communication, both during speech, and non-verbally. Movements
help musicians to learn music during private practice, generate shared performance cues in
rehearsal and communicate expressive intentions both to their co-performers and to their
audience during performance. Thus, musicians’ movements serve practical purposes as well
as communicative or expressive ones: they must move in order to create sound on their
instruments. The relationship between music and movement is dynamic: music makes
certain demands on the performer to move, usually in order to make particular sounds, but
the performer may demand movement of him- or herself to colour the sound, to add
expression and to communicate.
So what can be said of the possible effects of a hearing impairment on communicative
processes in music? To the extent that much of the research has emphasised the importance
of nonverbal communication in music, either with the audience or co-performers, a hearing
impairment per se should not render a musician less able to communicate using visual and
physical cues. If anything, we can hypothesise that a hearing impairment heightens the
salience of nonverbal cues based on anecdotal evidence provided by deaf musicians
(Bartlmä, 2008; Glennie, 2003). On the other hand, the idiosyncratic nature of
communicative behaviour in music rehearsal and performance suggest that it may be
difficult to extrapolate how a hearing impairment affects behaviour, amidst the additional
confounding effects of age or expertise, familiarity and length of rehearsal time.
Auditory musical perception 2.2.3
In order to communicate socially, humans make sense of visual (movement) and auditory
(speech) information generated by other people. In music, auditory perception centres on
two fundamental parameters: rhythm and pitch. This section will introduce the concepts of
entrainment and absolute and relative pitch, and explore what possible effects a hearing
impairment may have on these sensory processes.
Entrainment is a term borrowed from physics whereby coupled oscillators with different
natural periods assume a phase relationship, most often becoming synchronous. This is a
good way of illustrating how humans are able to keep in time with, and adapt to changes to,
a regular beat. Human musical rhythmic behaviour evolved socially but the ability of
humans to entrain their movements to an external beat is unique (Bispham, 2006). Older

27
theories propose ‘internal clock’ models whereby an accumulator counts the neural pulses
that occur while the task is being carried out (Creelman, 1962). More recent theories explain
rhythmic entrainment abilities by referring to subconscious attentional processes and
conscious decision-making. For example, a recent review of the literature on tapping and its
effects on sensorimotor synchronisation revealed two key error-correction processes: period
correction, the implicit adjustment of the internal timekeeper, and phase correction, the
explicit adjustment of successive taps (Repp, 2005). These error-correction processes form
part of a wider theory of dynamic attending, which seeks to explain how the internal
oscillator adapts to the external rhythmic stimuli using synchronised attentional pulses
(Grondin, 2010). Musical rhythmic behaviours, however, involve more than simple beat-
keeping. Body movement providing vestibular and proprioceptive feedback links to many
aspects of our higher-level musical rhythmic processing and this is discussed fully in Section
2.2.4.
Although it has not been researched explicitly, there are a number of studies that reveal how
a hearing impairment may affect the ability to synchronise with beats and rhythms generated
by other performers. Goebl and Palmer (2009) examined temporal synchrony in piano duos,
manipulating auditory feedback, and found that reduced auditory feedback led to poorer
synchrony and more reliance on visual cues such as finger height and head nods. Research
by Loehr and Palmer (2009) supports these findings, and other work by Richardson and
colleagues has shown that visual contact alone produces powerful, unintentional coupling in
a variety of joint action tasks (Richardson, Campbell, & Schmidt, 2008; Richardson, Marsh,
Isenhower, Goodman, & Schmidt, 2007; Richardson, Marsh, & Schmidt, 2005). Similar
effects were seen in children as young as two-and-a-half years old carrying out joint
drumming tasks (Kirschner & Tomasello, 2009). In sum, visual and physical cues appear to
be the strongest enablers of group synchrony, while auditory cues have a weaker effect,
especially where physical or motor cues are also present. By its nature, musical rhythmic
synchrony is stronger in social, interactive settings and it follows that a hearing impairment
may not significantly compromise ensemble synchrony in interactive performance. It should
be acknowledged however, that profound congenital deafness can hamper a child’s ability to
perceive ‘the beat’ in music, as was the case for Elke Bartlmä (discussed in Review 1,
Section 2.1).
This section outlines the perception of pitch at a cognitive level (rather than at a
physiological or neural level), focussing specifically on absolute (AP) and relative pitch
(RP) processing. AP is the ability to name a pitch in isolation (passive AP) or to produce an
exact pitch in absence of a reference note (active AP). AP is rare, with an estimated
28
prevalence of less than 1 in 10,000 people (Takeuchi & Hulse, 1993; Tan, Pfordresher, &
Harré, 2010). In contrast, RP is an ability all musicians learn during the course of their
training that enables the identification or production of musical intervals, or relations
between pitches (Levitin & Rogers, 2005). Deutsch has questioned the rarity of AP
(Deutsch, Henthorn, Marvin, & Xu, 2006). While its prevalence has been found to be higher
in Asian populations, the relative influences of genetics, musical training and exposure to
tonal languages remain uncertain (Deutsch, Dooley, Henthorn, & Head, 2009; Gregersen,
Kowalsky, Kohn, & Marvin, 1999; Schellenberg & Trehub, 2008). It is likely that AP
abilities are genetically heterogeneous and subject to a variety of environmental factors. A
debate also continues about the extent to which we all may have AP abilities: even non-AP
musicians are usually correct to within 4 semitones when identifying musical pitches
(Zatorre, Perry, Beckett, Westbury, & Evans, 1998). The phenomenon whereby learned
melodies are usually retrieved from long-term memory (LTM) at the correct pitch (Levitin,
1994) is known as absolute memory (or the ‘Levitin effect’), supported by research using
well-known television soundtracks in which starting pitches were reproduced with
deviations of only +/- 1 or 2 semitones (Schellenberg & Trehub, 2003) and maternal singing
in which deviations were less than 1 semitone (Bergeson & Trehub, 2002). The theory of
absolute memory (Levitin & Rogers (2005) proposes that an extracted pitch is compared
with either a pitch template (explaining AP) or an interval template (explaining RP) in LTM.
The role of muscle memory in sung melody production, however, has also been considered
(Saah & Marvin, 2009). Quasi-absolute pitch has been described as the ability to label the
pitch of only one chroma, for example a tuning note (Levitin & Rogers, 2005), or only one
instrument, commonly the piano. Lastly, Deutsch also identified the ‘tritone paradox’
whereby 2-octave ambiguous tritones are perceived as ascending or descending as a function
of the position of the tones on the pitch class wheel, providing yet further support for
implicit AP abilities (2006).
In sum, humans have complex auditory representations for pitch and melody, whether or not
they have had musical training. Regarding the possible effects of a hearing impairment, it is
plausible that a profound, pre-lingual hearing impairment may cause a child not to develop
such auditory representations in LTM. Nonetheless, there is evidence that the common use
of HA and CI technology enables children with hearing impairments to identify familiar
melodies, benefitting from rhythmic cues, and discern small changes in pitch (HA users
only) (see Sections 2.1.2-3). Furthermore, anecdotal evidence exists that AP abilities
acquired prior to a hearing impairment may remain unaffected. This is the reported to be the
case for Glennie, who capitalised on this prior ability using it to make sense of new
vibrotactile sensory information as she became deaf (Glennie, 1990).
29
Cross-modal perception 1: auditory – physical 2.2.4
The last 20 years have seen an expansion in the research activity and understanding of cross-
modal sensory interactions of musical stimuli. The following two sections, 2.2.4 and 2.2.5,
explore the ways in which auditory signals may interact with physical and visual sensory
stimuli, respectively. (A further review of interactions between auditory and tactile stimuli is
given in Chapter 6, Section 6.1.4, where the literature informs experiments into the
perception of music using vibrations). In this section, a number of theories are presented
which attempt to explain the bases of auditory-physical cross-modal perception and why
these associations can be particularly powerful in musical contexts.
Section 2.2.2 showed how musicians’ movements not only produce musical sounds, but are
themselves a response to musical auditory information, and a conduit for communication
between performers and their audiences. Auditory and physical responses are linked at a
deeper perceptual level: the limits of auditory perception dictate the extent to which we can
entrain to, and physically embody rhythmic patterns. The highest rate (fastest beats) we can
perceive aurally is about 600 events/beats per minute (an inter-onset interval of 100ms)
which represents a subdivision of the fastest tapping movements we can create with our
fingers. The lowest rate (slowest beats) that can be psychologically entrained to is 30
events/beats per minute (IOI of 2000ms) which corresponds to the natural swing of our legs
when walking (London, 2006). Furthermore, proponents of dynamic attending theory (DAT)
suggest that we can only synchronise our attention and motor behaviour to aurally-perceived
rhythms within this range (Repp, 2005). This suggests that the human body itself and the
proprioceptive sensory information it generates (that is, the relative positions of muscles and
joints in the body) may have influenced our auditory perception limits. Research on
rhythmic entrainment and DAT is usually undertaken in non-naturalistic laboratory settings
involving (finger) tapping methodologies. Research in developmental psychology however,
in more ecologically valid settings, has shown some fundamental links between musical
rhythms and the movements of the body. For example, seven-month-old infants trained to
bounce in either duple or triple time will subsequently listen longer to music accented in the
trained meter, suggesting that auditory-physical interaction is intrinsically pleasurable;
rocking or bouncing to music is a strong precursor of human musical behaviour and persists
into adulthood (Phillips-Silver & Trainor, 2005, 2007). In this case, the interaction may have
been especially powerful due to the involvement, and reinforcing effect, of the vestibular
system resulting from movement of the infants’ heads. There is also evidence that the
vestibular system may itself be responsible for acoustic output due to the role of the
sacculus, a small vestigial sensory organ at the base of the cochlear. It has been proposed

30
that this ‘vestibulomotor’ mechanism may explain subjective perceptions of, and interactions
between, music and motion (Todd, 1999). Together with the behavioural evidence, these
theories help to explain the strength of auditory-physical interactions in cross-modal
perception of musical stimuli, on the basis of proprioceptive and vestibular sensory
feedback.
The expressive, ancillary gestures of performing musicians, however, are clearly much more
than basic physical responses to rhythmic, auditory input. Keller proposes that “auditory
imagery facilitates interpersonal coordination by enhancing the operation of internal models
that simulate one’s own and others’ actions during ensemble performance” (Keller & Appel,
2010, p. 27). Thus, auditory information facilitates the regulation of physical movement.
This being the case, how might the attenuation of auditory information, perhaps as the result
of hearing impairment, affect a musician’s movement production? More or larger
movements during performance might indicate that they have a self-regulatory function,
supporting or bolstering the performer’s internal representations of the music. Perhaps deaf
musicians move more to improve the integrity of auditory imagery impaired by the
attenuation of auditory information? The existence of links between mental auditory
representation and physical action are agreed, but poorly understood. Conversely, if deaf
musicians move less during performance, this might confirm the universal, proportional
relationship between musical stimuli and physical movement proposed by Hodges (2009).
Further work is therefore needed to establish whether the relationship between auditory
feedback and physical movement can be reversed: might physical action be recruited by
musicians with hearing impairments to improve the integrity of internal auditory imagery?
These questions contributed to the hypotheses and design of the observation study reported
in Chapter 4.
Cross-modal perception 2: auditory-visual 2.2.5
Auditory-visual associations are ubiquitous in daily life and are a fundamental part of
general sensory perception. In music too, these senses reinforce each other: movement
resulting from, and resulting in, the perception of auditory sound, is typically perceived
visually by audiences and co-performers. Todd (1999) has proposed that, alongside the
‘vestibulomotor’ mechanism mentioned above, a second ‘audio-visuo-motor’ is responsible
for powerful subjective perceptions of music and motion. This section presents behavioural
evidence, both within and outwith musical contexts, which supports the notion that visual
31
information affects auditory perception, and vice versa. The possible effects of a hearing
impairment on this interaction are also discussed.
Laboratory research (using methods that are arguably more naturalistic than tapping) has
shown the effects of visual feedback on physical movement to music. For example, four- to
seven-month-old infants produced less spontaneous rhythmic movement to music when
visual information was presented simultaneously (Morgan et al., 2011). While this is
evidence that if music is heard, it is moved to, Morgan et al. argue that their findings reflect
the so-called Colavita effect of visual sensory dominance: human beings are more likely to
rely on visual than auditory information when carrying out temporal processing tasks
(Colavita, 1974), perhaps to compensate for the fact that information about the environment
such as alerts and cues is conveyed more effectively via the auditory modality (Posner,
Nissen, & Klein, 1976). Selective attention to other sensory modalities can modulate visual
dominance (Sinnett, Spence, & Soto-Faraco, 2007), but it is only the simplest of rhythmic
tasks that tends to elicit auditory dominance. Furthermore, when physical and auditory
information are coupled, particularly when involving vestibular feedback, visual information
can become wholly unnecessary, for example in the auditory encoding of musical rhythm
(Phillips-Silver & Trainor, 2005, 2007).
Section 2.2.2 introduced the idea that visual information in musical performance is indeed
useful and used by audiences. In 1993, Davidson reported the communicative power of
musicians’ movements using point-light techniques involving reflective ribbons on black
clothing to record the movements of musicians in repeated performances. Not only did
musicians’ movements communicate emotion to an audience, they were more effective in
conveying the expressive manner of a piece than the corresponding audible sounds,
especially to non-musicians (Davidson, 1993). Participants were asked to perform in
different expressive manners; deadpan, projected and exaggerated, while observers rated the
performances on a 7-point scale from deadpan to exaggerated. The head and upper torso
were found to convey the most helpful information for making judgements about expressive
manner and these judgements became even more accurate when the hands were in view.
More recent studies support these findings (Thompson, Russo, & Quinto, 2008; Vines,
Krumhansl, Wanderley, Dalca, & Levitin, 2011) and have even extended the utility of visual
information in music performance from abstract emotions to concrete pitch relations. In one
study, observers identified interval size from the movements of singers’ heads and mouths
(Thompson, Russo, & Livingstone, 2010) confirming that musical meaning is constructed by
an audience by integrating the visual and auditory aspects of a performance.
32
Audiences aside, the influence of visual feedback on the production of performers’
movements per se has not been the subject of much empirical research to date. There is
evidence, for example, that visual information helps mediate and control musicians’ fine
motor movements. Banton (1995) found no difference between the performances of pianists
who were prevented from hearing what they were playing while sight-reading unfamiliar
scores and those who sight-read as normal. Pianists who were prevented from seeing their
hands on the keyboard, however, made significantly more errors. Thus, Colavita’s visual
sensory dominance not only affects the performance of simple motor tasks but also complex
musical tasks such as sight-reading.
Finally, how might hearing impairments affect the use of visual information in music-
making? Here, sensory compensation hypotheses can be considered, for example, the
hypothesis that blind people have better hearing than people without visual impairments.
Attempts over the last four decades to obtain empirical evidence to test such hypotheses for
deafness and increased visual recruitment or ability have had mixed success largely due to
heterogeneous samples and confounding variables. Longitudinal research shows that people
born profoundly deaf develop different abilities at different times; cross-sectional research
with congenitally deaf participants in different age-groups shows that visual compensation
for deafness may not develop until adulthood (Rettenbach, Diller, & Sireteanu, 1999).
Typically, researchers have measured the amount of attention paid by participants to targets
and distractors in the laboratory. One study found that deaf individuals “possessed greater
attentional resources in the periphery [of the visual field] but less in the centre when
compared to hearing individuals” (Proksch & Bavelier, 2002, p. 687). Another found
‘enhanced function’ effects but only in a small sample of (congenitally) deaf native signers
(Bavelier, Dye, & Hauser, 2006). Bosworth and Dobkins (2002) found that deaf participants
differed in their performance of a visual motion discrimination task whereas hearing
participants did not, and argue that enhanced attention to visual stimuli is therefore more
likely to be caused by auditory deprivation than exposure to sign language. More recently,
differences between profoundly deaf and hearing individuals in the retina and optic nerve at
the neural level prior to the visual cortex, responsible for peripheral vision, have been found
(Codina et al., 2011). If musical situations present high attentional demands on looking
behaviour of the kind that might foster enhanced visual perception in profoundly deaf adults
(Proksch & Bavelier, 2002), increases in looking behaviour when auditory information is
attenuated might reveal a broad human ‘kneejerk’ response whereby the visual modality is
recruited to a greater extent, as suggested by theories of sensory compensation. Additionally,
research suggests that visual dominance prevails in complex situations and that “without an

33
increase in attention to the auditory stimuli, visual stimuli remain prepotent” (Morgan, et al.,
2011, p. 13).
In Section 2.2.4, it was proposed that a hearing impairment may cause a musician to make
more movement in performance to strengthen their own auditory representations of music.
Here, an additional link can be made: if musicians with hearing impairments explicitly place
importance on visual information in performance, they may recognise its value for co-
performers. Thus, more movement may be produced for explicit, altruistic, purposes (not
just for implicit ones) and they may look more towards their co-performers than ‘normally’
hearing musicians. In their 2010 study, Keller and Appel stated that “The lack of beneficial
effects of visual contact on basic ensemble co-ordination is perhaps not surprising. The
requirement to perform in synchrony with invisible co-performers is not uncommon (in
recording studios or via the internet, for example)” (p. 41). It may the case here however,
that visual contact between players with hearing impairments is, indeed, beneficial for
ensemble co-ordination.
Summary 2 2.2.6
Review 2 presented a top-down picture of cross-modal perception and communication in
musical performance. It showed that sensory information in different modalities is perceived
and used to guide physical actions, both communicative and performative. Social aspects
such as familiarity with co-performers and the expertise of performers themselves were
shown to affect communicative processes but these are hard to extrapolate, being highly
idiosyncratic. Expressive communication to an audience depends on visual, as well as
auditory information, as shown by the manipulation of ‘performance manners’. Likewise,
communicative processes between players are also cross-modal: eye contact and gestural
physical movements are important in creating temporally and stylistically cohesive musical
performances. These factors, being present for hearing players, suggest that hearing
impairments should not affect visual modes of communication between players.
Furthermore, the processes involved in human entrainment to a beat are sometimes more
strongly affected by visual and physical cues, which rely on proprioceptive and vestibular
feedback mechanisms, than auditory ones, suggesting again that a hearing impairment itself
may not be prohibitive. Auditory pitch perception processes such as AP may even develop in
the presence of hearing impairments. It was suggested that hearing impairments may result
in more movement in performance in order to bolster the formation of mental auditory
representations and also to provide visual cues to co-performers.
34
Conclusion 2.3
The two reviews above suggest that very little is understood about music and deafness.
Primary source data about the lives of deaf composers and performers is scarce and
mediated by social stigmas about deafness in musical contexts. A number of musicians
including Elke Bartlmä, Paul Whittaker and, of course, Beethoven, have reported that
vibrations help/helped them access music albeit mainly in listening, rather than performing,
situations, although Evelyn Glennie is a famous exception to this rule. Yet there is very little
empirical research that explores how hearing impairments affect musical performance
behaviours. This is evidenced by the largely speculative nature of the proposals made
throughout Review 2. These proposals suggested that, if anything, hearing impairments
should pose fewer problems in group music making than one might think. Unless deafness is
profound and congenital, the use of HA and CI technology provides children with a good
level of access to rhythmic information in music. A hearing impairment should not
negatively affect non-verbal communication involving visual information and physical
movement. On the contrary, sensory compensation hypotheses propose that a hearing
impairment may even favour non-verbal situations while the use of gesture and sign in Deaf
contexts may also compensate for barriers to verbal communication as a result of deafness.
These reviews provided a basis for the research questions used to explore experiences of
musicians with hearing impairments in the next chapter (Chapter 3) and the hypothesis
formulated regarding the experimental manipulation of auditory feedback (Chapter 4) and
natural hearing impairments (Chapter 5) in subsequent observational studies.
35
CHAPTER 3 – The experiences of musicians with hearing
impairments
This chapter reports an interview study exploring the experiences of 12 musicians with
hearing impairments. Parts of the study, in particular the ‘Results and Discussion’ (Section
3.3), have been published in Fulford, Ginsborg & Goldbart (2011) and ‘The development of
musical and deaf identities’ (Section 3.4) is included in Fulford (2013a).
The review of literature presented in Section 2.2 suggests that there is a shortage of literature
and therefore understanding about how a hearing impairment or deafness can affect musical
behaviours including listening and performance. This is in spite of on-going research in
music education and therapy where the aim to provide access to music for deaf children is,
today, not questioned in itself. A tension was identified between therapeutic and educational
approaches such that deaf musicians clearly do not appreciate attempts to use music for
‘curing’ them of speech or language impairments as a result of their deafness (Whittaker,
1986). A small number of cases were identified showing, unequivocally, that it is indeed
possible to compose, perform and identify as a musician in the presence of even profound
deafness (Barry, 2008; Bartlmä, 2008; Glennie, 1990; Montgomery, 2005; Whittaker, 2008).
However, the review showed that there is very little knowledge about how deafness affects
human musical behaviours, based on empirical findings: there is a (perceived) scarcity of
individual cases and our understanding of known ones (Beethoven and Glennie) is relatively
superficial and dominated by secondary source data (Barry, 2008; Straus, 2011). The
experiences of musicians with hearing impairments are rarely reported without being
influenced by extraneous personal opinions: some attempt to deflect the audience’s attention
away from the issue of deafness (Glennie, 2010a), others address political issues about
music therapy, education and social prejudices (Whittaker, 1986). Indeed, social prejudice
and stigma about music and deafness may be responsible for the lack of literature and
general understanding: listening to music, and therefore composing and performing music,
are simply deemed impossible if you are deaf, especially in musical circles.
Aims 3.1
The study reported in the remainder of this chapter aimed to find out how musical listening
and performance behaviours are affected by deafness by interviewing deaf musicians in
order to explore issues of greatest relevance to them. Specifically, it aimed to describe the
36
participants’ musical background, current musical activity, and use of hearing aids. It
explored their preferences for musical activity and the challenges they encountered. In line
with the aim of the wider project to explore the use of vibrotactile technology for facilitating
interactive performance, the participants’ awareness and use of vibrotactile feedback was
explored alongside their experiences of interactive and group music making.
Method 3.2
Qualitative research “begins with an intention to explore a particular area, collect ‘data’
(observations and interviews), and generates ideas and hypotheses from these data largely
through what is known as inductive reasoning” (Greenhalgh & Taylor, 1997, p.740). As the
aims of the study were exploratory, and very little prior research existed to guide a field of
enquiry, it was considered that an interview study would facilitate the emergence of themes
and issues better than a survey might. Thus, the semi-structured interview schedule
contained questions on a broad range of topics: personal background; musical experience;
history of hearing loss; hearing aids and use in music making; interactive music making,
rehearsal, performance and teaching; and vibrotactile feedback (see Appendix C). Schedules
were tailored to include items that were instrument- and background-specific where
possible, and a large degree of freedom was tolerated in the order and discussion of the
topics. Respondents were recruited initially with the help of Music and the Deaf. These
initial contacts, and friends of the members of the project team, provided the basis for an
opportunistic sample, and close links between musical people in the deaf community
facilitated the recruitment of further respondents through snowball sampling.
The final sample consisted of a mix of amateur and professional, regularly-practising
musicians, male and female, summarised in Table 3.1. There was a large range of ages from
17 to 72 years. All but three respondents opted to waive anonymity and be identified in this
research; pseudonyms were adopted for these three (first names only). In the absence of
audiometric data describing exact hearing thresholds by frequency, respondents’ levels of
deafness were reported subjectively, accurate to the best of their memory, ranging from mild
(with a threshold of 25-39 dB), moderate (40-69 dB), severe (79-94 dB) to the modal level
of profound deafness (95-dB) (AoHL, 2011). Those with mild, moderate or severe levels of
deafness identified themselves socially as ‘hearing impaired’ rather than deaf or Deaf.
Causes of the respondents’ hearing impairment varied; the most common being
sensorineural, a problem with the inner ear or the hair cells of the cochlea, or the

37
vestibulocochlear nerve itself (Moore, 2003). Two respondents had a conductive hearing
loss: a problem in the outer or middle ear, attenuating the transmission of sound waves to the
cochlea, which can be caused by an infection or otosclerosis, for example (Moore 2003).
Seven respondents had had their hearing impairments from birth, while the others became
deaf or were deafened in their childhood, teenage or adult years. The flutist and teacher,
Jessica Quiñones, was included in the study, despite having no hearing impairment, in order
to discuss her experience of teaching profoundly deaf flautist Alison Stephenson (Quiñones,
2011, see also http://www.jqflute.com/index.html and www.deafmusician.350.com).
Table 3.1 Interview study: Participant summary
Name / Pseudonym Level of deafness Deaf since birth Hearing aid(s)
Angela Taylor Moderate Yes Digital
Anne Profound No None worn
Anthony Moderate/Severe No Digital
Danny Lane Profound Yes Analogue
Evelyn Glennie Profound No None worn
Janice Brown Moderate/Severe No Digital
Janine Roebuck Profound No Digital
Jessica Quiñones N/A N/A N/A
Nick Palfreyman Profound Yes Digital
Paul Whittaker Profound Yes Analogue
Penny Mild Yes None worn
Ruth Montgomery Profound Yes Analogue
William Morton Moderate No Digital
The interviews were carried out face-to-face by the first author and the services of a sign
language interpreter were offered where necessary. Interviews were recorded on a Roland
Edirol R-09 24bit recorder, transcribed and loaded into QSR NVivo 8. Transcription was
conducted using traditional orthography with pauses indicated simply by dashes.
Data were analysed and interpreted using thematic analysis as described by Braun and
Clarke (2006), which allowed flexibility in generating ‘themes’ and the coding process to be
inductive. In the absence of a single psychological theory within which to generate
hypotheses, an active approach to theme generation was deemed necessary. Emerging
themes would be considered in relation to their strength within the overall thematic map, not
simply on the frequency of coded data. The coding of themes would therefore be inductive
38
or ‘bottom-up’ by necessity, having no single pre-existing framework to drive the analysis.
Likewise, it was considered unlikely that the analysis would involve theoretical deductions;
data-induced themes would be tested against the wider literature in the hope this would
provide a richer, more meaningful interpretation. Lastly, considering the nature of the
subject matter, it was acknowledged that the analysis would tend toward an essentialist
interpretation where participants’ experiences are taken at face value as an accurate
depiction of their reality, as opposed to the more interpretative approach adopted in
interpretative phenomenological analysis (IPA), for example. Therefore, while it was
deemed likely that responses would be coded at a semantic level, it was acknowledged that
should aspects of deafness and society be raised a consideration of the ways in which
deafness is socially constructed should not be ruled out.
To facilitate this analysis, a thematic network (Attride-Stirling, 2001) was created in NVivo.
Thematic network analysis (TNA) is a form of thematic analysis and produces is a web-like
visual representation of the themes showing their hierarchy and inter-relationships. TNA
was used as a tool to aid the generation of themes and patterns, while the principles of
thematic analysis were retained to guide a deeper analysis and interpretation of the data
(Braun & Clarke, 2006).
Results and discussion 3.3
Data are presented in relation to the thematic network, where global themes comprise
smaller organising themes which are themselves made up of basic themes that relate most
closely to coded sections of transcript. Basic themes are grouped into organising themes and
in turn rolled up into global themes to create a final thematic network that emphasises the
interconnectivity of the network but also its non-hierarchical nature (Attride-Stirling, 2001).
Themes were arranged in the network according to whether they related to personal or social
aspects, or if they were challenges (with negative connotations) or strategies (with positive
connotations), as illustrated in Figure 3.1. The global theme love of music and musicality is
neither challenge nor strategy. Some topics such as hyperacusis and tinnitus in musical
situations and the use of hearing aids with music, occurring under the global themes
physiological challenges and technological challenges, were omitted from this thesis and
indeed from Fulford et al. (2011) but have been disseminated elsewhere (Fulford, 2013b).
Themes relating to teaching and learning strategies are discussed in Fulford et al. (2011) but
not here.

39
Figure 3.1 Thematic network showing global themes and hierarchy
This section will present the data classified under the five remaining global themes in turn,
beginning with love of music and musicality, moving on to social and music-making
challenges and finally music-making strategies and sensory strategies. The full thematic
network map is given in Appendix D. Each section begins with a map of the global theme
and presents examples of its underlying organising and basic themes. Inclusion was justified
both by the actual frequency of coded responses and the perceived strength of these
responses. During the coding process, where a basic or organising theme achieved a low
response rate, this theme was either combined with another or kept on the basis of its
perceived importance in the analysis. The following section is not exhaustive: some basic
themes are omitted according to their relevance to the aims of the thesis.

40
3.3.1 Love of music and musicality
Figure 3.2 A thematic map of the global theme: Love of music and musicality
What motivates people with hearing impairments to make music? The themes coded under
love of music and musicality relate to this question and form an important backdrop to this
thesis, justifying the endeavour to assist such people in their music making.
� Musical background � Influential early experiences � Positive musical experiences �
Musical family � Deafness facilitating music-making
All participants spoke about their musical backgrounds and career decisions. Most
respondents gave examples of influential early experiences that were either emotionally
positive or helped in making a mind up to the pursuit of music as a career. Janine talked
about her first proper stage role in a school production:
I remember the moment the curtains opened and I was onstage... singing the
first notes and thinking this is where I want to be for the rest of my life... I was
13.
All but one respondent in this study grew up in a musical family. For some, this meant that
recorded music was played and listened to in the house, while others made music, actively,
41
with other family members. This was particularly important for those with pre-lingual
deafness (Angela, Danny, Nick, Paul, Penny and Ruth) and indeed it has been shown that
access to music may be delayed if it is not provided in the home environment (Bartlmä,
2008). However, in some cases, deafness could actually be a catalyst for music-making. For
Ruth, music was a safe haven, away from the pressures of school:
I think because I spoke well, they assumed that I could get along fine, but
actually I struggled a lot... But when I went home I had piano lessons – and I
felt like I was given something from – I found music such a source of comfort.
You know – it was a gift really – and it makes me feel good, it makes me feel
better...
Anne too, spoke about the difficulties in keeping up with communication in mainstream
schooling:
Interestingly I probably wouldn’t have done this if I hadn’t gone deaf. I found
conversation disappeared – socialising with friends was much more difficult –
sitting in a room, practising was fine. It’s something you do on your own – it’s
an isolating thing. So yes, that started when I went deaf.
While Ruth was born profoundly deaf and Anne acquired her deafness in her teens, it
appears that social isolation as a result of deafness facilitated the turning to music as a
source of comfort and expression for both women. Ruth described how as a very young
child her father used to cover his mouth and ask her to identify what nursery rhyme he was
singing. Aside from being a great way to engage a profoundly deaf child with music, this
game provided the basis for later musical activity, where Ruth and her father would begin a
collaboration that continues to this day playing guitar and flute duets. Two participants
spoke about making contact with Evelyn Glennie as a role model for their identity as a deaf
musician.
� Musical self-efficacy � Musical confidence � Importance of music theory � Absolute pitch
ability
A further organising theme contributing to a love of music was musical self-efficacy. This
was implicit for many, and at times, a necessary bolster in the face of prejudice about music
and deafness, as illustrated by Anne:
42
At the colleges it was alright, I would go and play to people – fine. It’s very easy
with music because you just get your fiddle out and you play to them – they go “oh
alright you can play” – it’s very easy thing to prove.
Musical confidence was important for Anthony too:
There has to be that self-confidence – to say that’s just confirmed what I believe
already, that I’m good at what I do. You have to have that self-belief as a musician.
And I think that’s something which for me is intact.
The examples of self-efficacy here not only show how musical self-confidence can enable
the achievement of goals (for example, being accepted into a music college) but also how
self-confidence became a necessary tool for confronting social challenges and pre-
conceptions about music and deafness, as Danny stated:
Well it’s very natural to me- I believe that I can play and just by playing I know that
I can do it. And having passed my exams and everything – deafness never came into
it. And even if I didn’t hear and I thought it was lost or whatever, I’d have still found
a way.
A number of the respondents, in particular Nick, described how possessing absolute pitch
enables them to hear music in their mind’s ear from a score, being confident not only of
pitch relations but also exact pitch and sonority. For Paul, a good knowledge of music theory
including chord progression, harmony and counterpoint underpins this ability:
I think that – for any young person with a hearing loss, you have to fill in so
many gaps yourself. So I think it’s absolutely vital that you read about music –
you read textbooks, you read scores.
� Intrinsic musical satisfaction � Positive musical experiences � Interactive is rewarding �
Kinaesthetic satisfaction � Multi-modal experiences
The reasons why someone with a hearing impairment chooses to participate in the abstract,
primarily auditory and often interactive art of music-making are similar to those that apply
for all musicians: a particular kind of positive musical experience that comes from loving
43
music for its own sake. Janice described emotional satisfaction:
It’s an emotional reaction. Music can make you cry, it can make you laugh. It just
takes over your whole being.
Many positive experiences were described which helped cement musical career decisions.
Janine stated:
I encountered a really delightful conductor and erm- he told the orchestra you
know, after I’d done a rehearsal or something – I just need you to know that actually
– she’s deaf – they applauded me and I just thought – gosh I can retire now, I was
so touched you know – so moving.
Other experiences represented a point of significant personal achievement. For Nick, who
did not follow a musical career, they are good memories:
I played with the Sheffield Chamber Orchestra the second movement of Beethoven’s
Emperor Concerto, gorgeous piece of music. It’s one of those moments in my life
that I really wish I could have done more than once.
Paul referred to the social aspects of making music with other people and the idea that
interactive performance is rewarding:
The great thing about being in a choir when you are young is it’s music making
as a community. When you play the piano or an orchestral instrument, you do it
on your own. There’s a lot of fun in making music with other people.
Nick also stated:
The collaboration is the fun part. For me, I mean I’m not doing this professionally,
so that would be the whole point of doing it.
And so too, Janine:
I feel more whole, when I’m performing with others, rather than in isolation.
Although it’s cleaner and easier for me to hear myself when I’m on my own, but it’s
– It’s lovely performing with others – Yes, because that’s what it’s about, making

44
music with other people. Although, that can be more difficult! You know – when
you’re deaf. It’s – It’s perfectly easy to sing all on your own or with an accompanist,
but – yes – and the more musicians you work with the more complicated it becomes.
These statements form positive reinforcement for the aims of the wider project to support
interactive performance and underline that it presents a challenge for deaf musicians. These
challenges are outlined in Section 3.3.3. Some forms of musical satisfaction were not social.
Nick reported his enjoyment of playing the piano by himself, understanding the theory
behind the harmonies and the kinaesthetic satisfaction of feeling the chords and intervals
under his fingers:
The harmony when I play it – is to do with the gaps that I perceive between my
fingers, it’s to do with what I know the harmony is going to sound like in my
head.
These quotes set up the premise that satisfaction can be found in the multi-modal experience
of music. Some responses related to the awareness of vibrotactile feedback in music and the
sensory experience of live performance and these are discussed later in 3.4.5. A true multi-
modal experience is one where auditory information combines with visual, kinaesthetic and
vestibular sensory information to create a perceptual whole, worth more than the sum of its
parts. Such experiences are powerful, foster emotional responses and are seen as directly
contributing to the participants’ love of music and musicality. During a conversation about
vibrations in music, Paul was asked “If you weren’t able to feel anything, do you think the
experience would be better or worse?” He replied “Worse”. Regarding the isolation of
specific sensory modalities in music, Penny stated:
But when it comes to performing, what you hear and what you do are all kind of tied
in together, they're not separate, they are one thing – and they all kind of –
combine with each other to create what ends up coming over to an audience.
Summary
The themes influencing a love of music and musicality describe why musicians with
hearing impairments are compelled towards music. Participants spoke about their musical
families and their positive, influential, early musical experiences. As is always the case, self-
efficacy relates to achievement, with the importance of theory and absolute pitch abilities
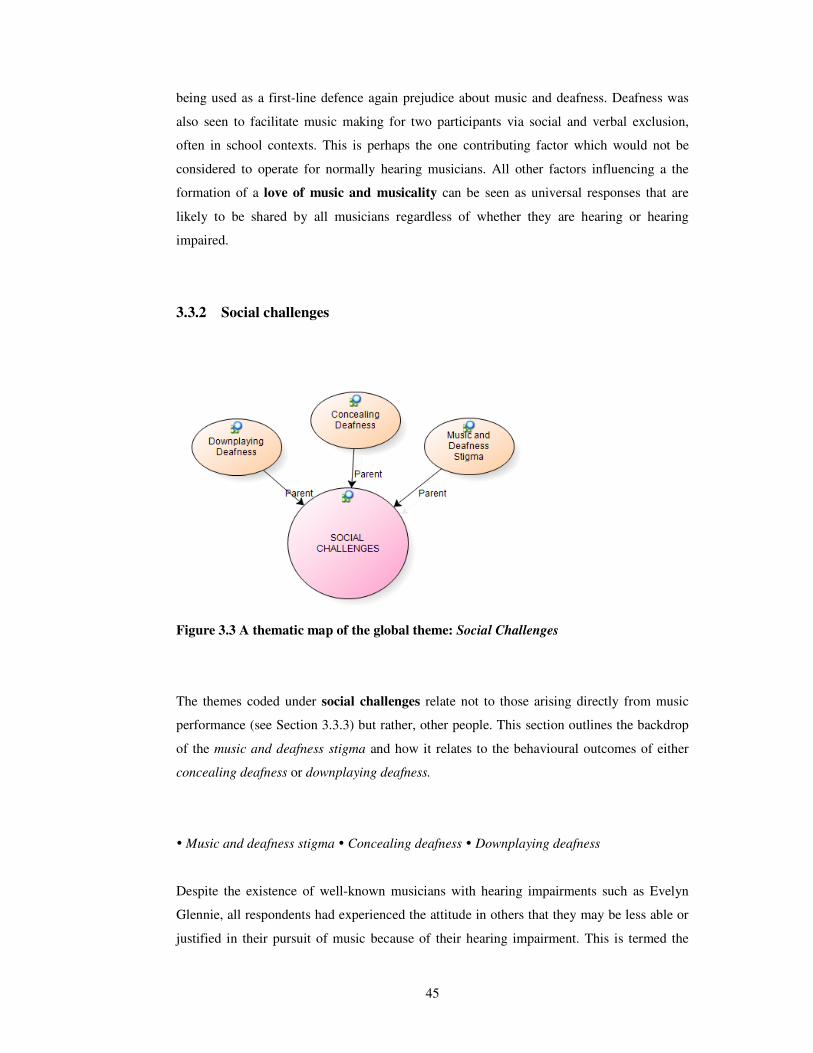
45
being used as a first-line defence again prejudice about music and deafness. Deafness was
also seen to facilitate music making for two participants via social and verbal exclusion,
often in school contexts. This is perhaps the one contributing factor which would not be
considered to operate for normally hearing musicians. All other factors influencing a the
formation of a love of music and musicality can be seen as universal responses that are
likely to be shared by all musicians regardless of whether they are hearing or hearing
impaired.
3.3.2 Social challenges
Figure 3.3 A thematic map of the global theme: Social Challenges
The themes coded under social challenges relate not to those arising directly from music
performance (see Section 3.3.3) but rather, other people. This section outlines the backdrop
of the music and deafness stigma and how it relates to the behavioural outcomes of either
concealing deafness or downplaying deafness.
� Music and deafness stigma � Concealing deafness � Downplaying deafness
Despite the existence of well-known musicians with hearing impairments such as Evelyn
Glennie, all respondents had experienced the attitude in others that they may be less able or
justified in their pursuit of music because of their hearing impairment. This is termed the
46
music and deafness stigma. Paul was rejected by 12 universities before successfully securing
a place:
But the music department said “no – don’t be silly, you’re deaf” – even though
I had three grade eights and two diplomas they said I would take up too much
of their time and cost them too much money.
Further problems were not necessarily resolved on entry to music college, as Anne
explained:
One chamber music teacher told me that I couldn’t play chamber music – that
there was no point because I wouldn’t be able to play with anyone else… he
dropped me.
It is perhaps not surprising that Anthony, who works in a professional orchestra and has
become deafened later in life, made the decision to conceal his hearing impairment from
colleagues. The possibility that his hearing level may worsen in the future means that his
present job is very important to him. He talked about his decision to conceal his deafness to
safeguard his career:
I haven’t told colleagues at large – and I sort of feel now that there’s no real
need to, because what I want is to be able to carry on doing what I do as well
as I can in the same way I have in the past – and until someone turns around
and says you know, “can I have a word with you about your playing?”
Where deafness is not concealed in professional scenarios conflicts can arise. For example,
Janine described a disagreement with a studio producer who would not allow her to invite
her teacher into the studio to assist her in the recording:
It was very unpleasant, and in the end I said you know, have you read the disability
discrimination act? And he said “sue me then”! And I said, “One more word from
you – and it won’t – I may well consider it”. Really nasty. And it really undermined
my confidence – It really left a nasty taste in my mouth for a long time.
Janine and Ruth both concealed deafness in their early career before subsequently ‘coming
out’ as deaf. Janine kept her hearing loss a secret throughout music college and into her early
career. She even kept it a secret from her college teacher. Ruth never told her recital
47
examiners at her music college, preferring to be assessed on a level playing field with her
fellow students. In this sense, the women operated a form of ‘don’t ask don’t tell’ approach
toward their deafness. The issue of concealing deafness is double-sided. Some argued for the
benefits of being open:
Yes – have to be [open about it]. It’s pointless if you don’t tell them because
they start saying “do that”, and they’ll look in the opposite way and I won’t do
it.
Others acknowledged that being open with employers about deafness can still result in
problems:
I had to convince them a little bit. I remember them asking me, “Are you feeling
confident enough about teaching, ‘cause of your hearing problem?” And I said
“I’ve come this far – I’ve got a degree in music” – they didn’t know that I was deaf
at my audition and I’ve done teaching experience.
While concealment was shown to be typically an explicit decision or action (or inaction),
downplaying deafness seemed to be more covert, and was revealed in such a way that the
participant may or may not have been consciously aware. One participant, Anne, a
professional orchestral musician with profound deafness, does not conceal her deafness. For
Anne, there is a strong sense of having “bigger fish to fry” as it were:
It’s very hard for me to think you know – just because of what I do, you know –
I’m paying my mortgage to bring up my children as well as everything else. I’m
not sitting there going “hmm” [how do I do this] am I?
Similarly Anthony stated:
Well, I suppose on one level, you go to work and you do what you do don’t you. That
is my job so I’m going to do it.
These two participants spoke in such a way that illustrated the theme downplaying deafness.
At the time of interviewing, they were the only two participants employed as professional
orchestral musicians and perhaps therefore, had the most reason to downplay their deafness
amidst the fiercely competitive classical music world and, instead, focus on their musical
abilities. The concept does not appear relate to concealing deafness: Anne is public about
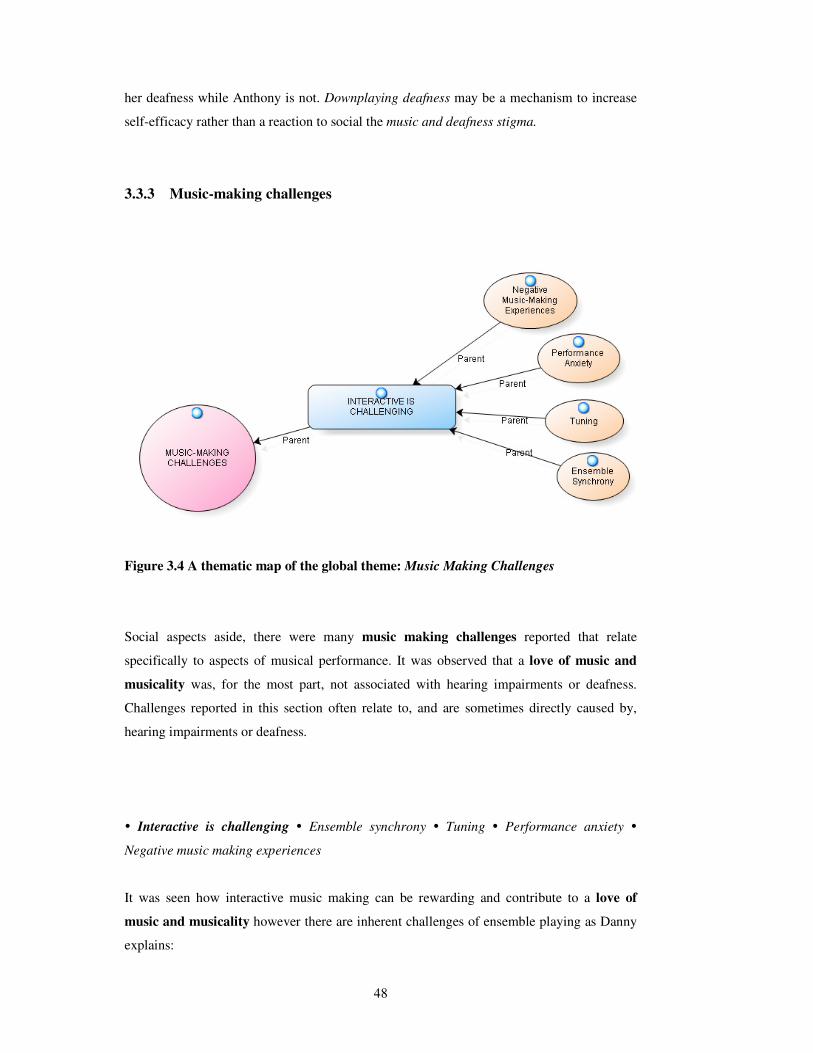
48
her deafness while Anthony is not. Downplaying deafness may be a mechanism to increase
self-efficacy rather than a reaction to social the music and deafness stigma.
3.3.3 Music-making challenges
Figure 3.4 A thematic map of the global theme: Music Making Challenges
Social aspects aside, there were many music making challenges reported that relate
specifically to aspects of musical performance. It was observed that a love of music and
musicality was, for the most part, not associated with hearing impairments or deafness.
Challenges reported in this section often relate to, and are sometimes directly caused by,
hearing impairments or deafness.
� Interactive is challenging � Ensemble synchrony � Tuning � Performance anxiety �
Negative music making experiences
It was seen how interactive music making can be rewarding and contribute to a love of
music and musicality however there are inherent challenges of ensemble playing as Danny
explains:
49
If you’ve got a combination of instruments, it’s more complex and it’s harder for me
to hear- to pick up the melody or probably the rhythm.
Much of the challenge surrounding interactive performance relates to ensemble synchrony,
that is, the need to be exactly in time with co-performers. Anne related a story about when
her orchestra recorded a film score in a studio:
But that’s difficult, I find that difficult – when I’m Principal. Because if I’m leading
the section – you’ve got to think with the strings, so I’m in charge of my section –
maybe 10 people – and we’re all wearing a click track and I can’t hear it – It’s still
me who has to come in. That I find difficult.
Solutions to the challenge of maintaining ensemble synchrony are discussed in the next
section (3.3.4). The next most salient music making challenge was tuning, specifically with
other co-performers and participants implicitly acknowledged that issues were a
consequence of hearing impairment. Penny, who has only a mild hearing impairment,
reported that tuning to a piano is harder for her than tuning to other flutes:
I wasn't aware of when I was playing out of tune. So I would be about a semitone
flat and I couldn't hear it, which he [my teacher] was very worried about.
Most participants spoke about solutions to the problem of tuning and these are given in
Section 3.3.4. However, the challenges of tuning and ensemble synchrony can increase
performance anxiety, a complex psychological phenomenon which may begin in early in
childhood and persist over time (Kenny & Osborne, 2009). Janine, a singer, finds this affects
her performance:
I think the anxiety of course is very counterproductive, because you want your
body to be free and relaxed as possible, not knotted up with fear.
These factors contributed to a large number of reports of negative music making
experiences, most of which leave a long-lasting, negative emotional effect on the individual.
Paul’s account of his organ diploma recital illustrates this:
I said “I’m deaf; I need someone there to check the balance between the
manuals because I can’t work this out”. They refused. And then they failed me
50
because they said that I didn’t play for the acoustics of the room... I’ve never
been in that building again since.
As does Janine’s experience of having to drill a section of her part over and over at her New
Sadler’s Wells Opera debut:
So I turn up and we note bash it – and I have no idea – and I’m there all day in
abject misery and terror because I’m hearing all these people sing it in 4 part
harmony – and maybe my notes bashed out once – but I never work like that – and it
was just – I wanted to die – couldn’t wait to get home to learn it properly.
Generally, respondents agreed that the more complex the group, the bigger the challenge to
the musician with a hearing impairment and the greater the likelihood of having a negative
experience, linking back to the organising theme.
3.3.4 Music-making strategies
The following section presents solutions to the music making challenges reported by the
participants. There are social-personal variations within them: music making strategies are
those that benefit interactive performance and usually (but not always) involve other people;
managing the sensory experience describes a manipulation of sensory information to
ensure it is useful and aesthetically pleasing on a personal level.

51
Figure 3.5 A thematic map of the global theme: Managing the Music-Making Situation.
� Personal strategies � Rigorous preparation � Memorising or internalising music � Social
strategies � Social feedback and support � No talk in rehearsal� Ensemble preferences
The most salient personal strategy was rigorous preparation often involving memorising or
internalising music and was reported by all participants. In other words, learning the score,
the relationships between parts, practising tuning techniques and practising in the
performance venue were important. This preparation often extended to learning or
memorising the parts of other players in the ensemble, either out of curiosity (Evelyn) or, for
Ruth, necessity:
I have to know the piano score as well as mine. I have to know what the piano is
doing […] Because you cannot ignore the piano part – flute and piano parts are
married together […] I need to read and remember what the piano is doing and then
it’ll make sense of what I’m hearing.
Likewise, for Janine:
I would prepare my music inside out and backwards – I have to be much more
prepared than normal I really have to know it well. And – so I would note-bash-
note-bash, note-bash, note-bash, note-bash!
52
Memorisation carries the additional advantage of freeing the eyes from the score to perceive
visual cues from co-performers (see visual cues, below). All musicians undertake rigorous
preparation. However, some respondents indicated that their reliance on an internalisation of
the music (memorised or not) was borne of the need to rely on the score rather than a
recording. As Paul said:
They will go away and they will listen to it and there’s a limit to what the ear
can pick up. You can’t do that. You have to sit down with a score and you have
to read it and therefore you notice everything.
Again emphasising that all musicians prepare, Anne described how rigorous preparation
can address the challenge of tuning:
Loads and loads of scales. You know, making sure that that physical memory is
there. Scales, arpeggios, I still do all that. But then you – that’s what most of us to
do anyway to some extent.
Rigorous preparation can therefore address many music making challenges such as tuning,
performance anxiety and ensemble synchrony. The data suggest that, for the musician with a
hearing impairment, preparation goes beyond what hearing musicians would normally do as
there are additional benefits and needs that can be met. Motivations for memorising and
internalising music are complex and go beyond simple rigorous preparation: for many,
memorising is an essential element of the learning process made necessary when auditory
information received is compromised, in order to understand the ensemble. Anne spoke
about the advantages of memorising:
I mean a lot of people would go and listen to things. I would never go and listen to
things, I have to work it out.
Likewise, Paul explained why his organ teacher at Oxford thought he was an easy student to
teach:
[He said] It’s purely and simply because you’re deaf. If you tell most music students
to go away and analyse a piece of music or write about a piece of music whatever,
they will go away and they will listen to it but there’s a limit to what the ear can pick
up. You can’t do that Paul. You have to sit down with a score and you have to read
it and therefore you notice everything.
53
In contrast to personal strategies, the following are social and rely on other people as
sources of information. The strongest factor is perhaps the simplest one: social feedback and
support, as Anthony explained:
You’re in this job, they gave you this job – and they said well yes, that’s true, but
how do we know if we’re any good? It’s only because other people tell us! Actually
isn’t it. You know, you get an accolade for something you’ve done or you get praise.
Such verbal feedback can go beyond bolstering musical self-efficacy and tackle challenges
such as tuning:
[Janice] I’ve always told people since I was young, if ever I’m singing not in tune,
tell me.
[Anne] I’d say “oh this is in tune” to my mum or my piano teacher and she’d say
“no, you’re not, you’re a tone and a half out” […] So what I need is – I still need
someone to tell me that I’ve got the same A as the oboe […] so people will say to me
– “oh gosh, do you think that needs to come up a bit?” […] I’d always say “oh I
feel a bit flat” is that alright? And they say “no you’re going a bit flat”.
Social feedback can therefore be a crucial source of practical and emotional support but does
presuppose that the hearing impairment is not concealed from colleagues. Another social
strategy is no talk in rehearsal which, for some participants is the only way to make sure
that verbal instructions are not missed, especially where a music channel is being used on
hearing aids, as Janice stated:
I wouldn’t tend to have a chat with the person next to me – like people do
sometimes…’cause you want to make sure – you’re aware of what the
conductor is going to do next.
Participants had many preferences for different instruments or instrument combinations
which related both to creating the best sensory experience (see Section 3.4.5) but also to
facilitating the best musical output based on the sensory information available. Janice
reported that she prefers to sing with a piano as opposed to an organ:

54
And you can hear – you’ve got a run up to whatever you’re doing. You can hear the
beat. But with an organ it sort of just floats in and floats out again and back in
sometimes.
Similarly, Paul reported that he prefers to accompany singers rather than instrumentalists:
I like accompanying singers rather than instrumentalists. There’s more to watch-
the words are a bit of a guideline and you can lip-read. But what I do with singers
is, I’m watching their breathing and I’m watching their neck muscles. And so you
know when they’re actually going to create the sound. It’s great working with
singers.
Thus ensemble preferences can help tackle the challenge of ensemble synchrony and, in this
case, is an example of using visual cues (discussed next).
� Music-making strategies � Visual cues � Importance of spatial location � Lip reading �
Physical cues � Muscle memory � Vibrotactile feedback
The use of visual cues that is, perceiving musically relevant information using the eyes,
were reported by all participants and are especially useful in facilitating ensemble
synchrony. Many visual cues exist in the orchestral or ensemble music situation for anyone
to use, hearing or hearing-impaired and the importance of having the conductor in clear
sightline was frequently reported. Ruth described a situation where she had to find a new
way to ‘see’ the beat, as the conductor’s beat was too vague to be understood:
I said to him sorry, “I don’t understand your hands!” I was really frustrated. And
then I said “use your mouth – would you count” and he said “I can’t really count,
but I’ll go [makes ‘b’ lip pattern]” I said “please can you just – [ba ba ba] give me
that beat with your mouth, because that’s what I’m needing”.
A technique for identifying beat cues from the movements and gestures of fellow players
was described by William: the raising of a wind instrument to the mouth, for example, might
reinforce a written cue in an orchestral part. Ruth also reported watching for when other flute
players in a band raised their instruments and she mentioned how reassuring it was to see a
tapping foot keeping the beat. It is likely that individuals with mild losses and hearing aids
use visual cues only to reinforce and confirm ambiguous auditory information as William
55
explained:
You get cues in the part – Cor Anglais cue for example. And I’m tending to look
over and see when she picks it up. Or the oboe even – It’s only 2 people away. And
I can look and I can see – Is that this oboe cue coming up? Yes. I mean normally
you would count the bars. But the cues are there to help confirm.
Anne’s reliance on visual information and cues, however, is high because of her profound
hearing loss and her rejection of hearing aid technology altogether:
Everything I do in the orchestra is visual… I know what the strings are doing ’cause
the strings are quite visual… I mean everyone knows that I can’t hear, but there are
enough people in positions that I can see who would just give me a visual [nods] –
and then you’re on. But of course that’s difficult.
Anne’s statement also illustrates how non-concealment of deafness can promote social
support in the form of visual cues, and enables lip-reading. In addition, the importance of
spatial location for maintaining sight lines was highlighted, many respondents going to great
lengths to make sure they and other people are positioned ideally. Ruth talked about her
preference to be positioned so as to see her accompanist’s hands on the piano. Paul,
likewise, spoke about his position on stage when providing British Sign Language (BSL)
interpretation for musicals and how it allowed him to lip-read the singers:
As long as I’m in a position where I can see most of the stage and I can see a
conductor either live or on a monitor, then I’m happy […] what most singers don’t
realise is how much their faces betray them. If they are not confident in what they’re
singing or if they sing a wrong note- so quite often you can tell.
The importance of spatial location was not just to facilitate the use of visual cues: spatial
location influences the relative auditory salience of different instruments and many
participants reported preferences about this.
Whereas visual cues were used primarily to tackle the challenge of ensemble synchrony or
staying in time, physical cues, those relating to the use of information gained from the body,
were found to be used primarily (but not exclusively) for maintaining good tuning, primarily
by using some form of muscle memory. William talked extensively about the use of and his
56
reliance on changes to his embouchure when playing flute and piccolo in his professional
career, in order to maintain good tuning:
If you’re playing a flute and the organ that you’re playing with in the church is
about a semitone sharp, you realise you’ve got to push in as far as you can and
lip up!
As did Ruth:
She [Ruth’s teacher] used to help me with the lip position and it just becomes
automatic, that I lift my jaw up a bit, that I raise my forehead to get the pitch up a
bit – I would have symbols like this [arrows] to keep the pitch down, keep the pitch
up.
Tuning by paying attention to embouchure was also something Penny had worked on at
length with her music college teacher, alongside the use of reference tones. For professional
string players such as Anne and Anthony, the ‘muscle memory’ of the fingers plays an
important role in tuning. Their descriptions of the tuning process provide a very different
insight into the usual feedback loop between playing, listening and adjusting that string
players might associate with ‘tuning up’:
[Anne] Your hearing is a feedback mechanism to tell you that the note you’ve made
– you’ve already made – is in tune… but basically you’ve made the note – you’ve
played it, it’s right, you know you’ve – it – it’s in the right place. […] Yeah is that
muscle memory? And then yes, you can check with the open strings where you’ve
got – sometimes it might be an octave, it might be a fifth – or it might be something
that’ll ring, like a third or a second which won’t ring, but you’ll be able to make
sure that that feels in the centre. So I do a lot of that.
Some examples were given of physical cues being used to facilitate ensemble synchrony.
When Ruth played the flute with her father accompanying her on his guitar he would
sometimes place his foot gently on her foot and tap the beat. Likewise, in her early years,
Anne had a friend develop a mechanical metronome for her to use during her personal
practice that would tap her ankle to a given beat. This had the advantage over a metronome
with a flashing light of freeing her to look at the music, so she did not have to memorise
complex studies for the purpose of honing her technique.
57
3.3.5 Vibrotactile feedback
Another physical cue is vibrotactile feedback which participants were explicitly asked
about. Paul, profoundly deaf from birth, is receptive to felt sound when giving BSL
interpreted performances:
No. It’s fundamental. I need it. There are environments where I know I’m not
going to get it – where I know I’m not going to get that physical feedback and
reaction… in situations like that I have to rely far more on what I feel than
follow the guy with the stick..
Similarly, Ruth described her performance on stage with an orchestra playing the Danzi flute
concerto:
I just wanted to get that pulse. And that was missing for me. So I had to walk back a
bit, and I’m being the ‘cello players – and with my long dress I could feel the
vibration on my long dress – that’s what I was really needing. That was that little
extra – with the vibrations on my dress and my hair – that’s brilliant.
The professional string players Anne and Anthony described the way they use vibrotactile
feedback to help with tuning. Anthony described how an awareness of the ‘beats’, that is,
fluctuations in volume perceived when two notes of very similar pitch are played together
(Davis, 2009), is essential in tuning the lower notes on the double bass:
If the vibrations are wrong, the beats are fighting, you know that your section’s not
in tune. And often you’ll see a good bass section – when there’s a low note playing
and something seems a bit muddy, their ears go to the neck – “is it me? Or is it
him?” So you know, in a sense it’s different with a bass, you’re already using
vibration as part of your check for intonation as well as what you hear. Because you
feel it.
For both players, the question of whether ‘beats’ are heard or felt is not clear, perhaps due to
the tactile nature of string instruments and the proximity of the body to the vibrations of the
strings, as Anne stated:

58
I can tune my strings by fifths. I reckon every orchestral player does it – because
there’s always so much racket going on, they can’t actually hear what’s going on.
So at octaves and at fifths, you know when you get two notes that aren’t […] you get
your beat. I use that a lot. [Interviewer asks whether you hear or feel the beats] I
think you feel them. But you’d possibly hear them too.
Opinions as to the usefulness of vibrotactile feedback varied. Although Ruth and Paul
wanted this feedback and Anne and Anthony provided tangible examples of its use in tuning,
others considered it desirable but not useful musically (Penny and William). Nick even
described it as a distraction and not central to his experience of music:
But whenever anyone asks me to explain how it is I can play the piano as a deaf
person, they always suggest to me that it might be the vibrations before I even have
chance to give them an answer. They say “oh yes, it’s the vibrations isn’t it” – so I
always tend to explain that it’s not the vibrations because I’ve always felt quite
strongly that it’s been the absolute pitch, and I still do.
Anne, who acknowledged the usefulness of vibrations in helping her tune her string
instrument, like Nick, reinforced her opinion that vibrations are not central to her
experience:
I have no interest in for example feeling a CD – I don’t even know if people do it –
but feeding Beethoven 7 through a vibrotactile floor and sitting on it and going “this
is what Beethoven 7 feels like”.
This section has presented a variety of strategies used by the participants to tackle challenges
relating directly to their hearing impairment in group performance situations. Whilst these
strategies are employed rigorously by musicians with hearing impairments, they are not in
themselves specific to deaf musicians: using visual and physical cues are techniques that any
professional musician will encounter in their training and practice.
3.3.6 Managing the sensory experience
As mentioned, the global theme managing the sensory experience describes a
manipulation of sensory information to ensure it is useful and aesthetically pleasing on a
personal level. This section outlines these strategies coded and they are typically personal,

59
unique and therefore highly subjective. Participants reported a great deal of information
about their hearing aid technology and its use in music which was a key organising theme:
many problems and issues were reported however, there were also good examples of
participants making HA technology work for them in musical situations. This section will
focus on the existence of different listening styles and preferences within the sample.
Figure 3.6 A thematic map of the global theme: Managing the Sensory Experience
� Listening style and preferences � Instrument preference � Acoustic awareness � CD
listening � Reliance on auditory information (learning not to listen) � Vibrotactile awareness
Instrument preferences related to both the auditory, physical and sometimes vibrotactile
properties they possess. For example, Paul reported that he now prefers the piano and
harpsichord to the organ as the potential for vibrotactile and physical feedback is higher:
Playing computer organs, electric organs, electric pianos, I really don’t like […] I
really like playing the harpsichord. It’s a very unforgiving instrument in that if you
make a mistake – It’s right there! It’s the precision of what you’re doing. Absolutely
wonderful.
Some preferences varied with the participants’ range and level of residual hearing. Anne
switched from violin to viola for this reason. Some participants reported transposing up or
down an octave on the piano to hear better. Janine and Ruth both reported that they enjoy
performing with a guitar because of its clarity and chordal sound. Acoustic instruments

60
aside, many participants reported that CD listening is problematic if not impossible. In
particular, those who were born hearing but have acquired a hearing loss later in life can find
listening to recordings that do not match auditory memories quite distressing. Acoustic
awareness was evident in most of the participants’ experiences. Anthony and William spoke
about the ‘boomy’ acoustic of certain locations in the orchestra pit which can itself
contribute to NIHL. The most common preference however, was to play or perform in older,
wooden buildings that afford a more resonant acoustic, more conducive to vibrotactile
feedback:
[Anne] Oh yes, so I’d much rather play on a wooden stage.
[Paul] It just gives me more to feel. If you’re having a concrete floor it’s hell […] so
in terms of feeling what’s going on, it’s a dead sound in there. I like older theatres
better.
These themes highlight the degree to which auditory preferences are idiosyncratic. The
variety of general sensory preferences that was identified by respondents prompted a search
within the data for differences in reliance on hearing per se in musical situations. Large
differences emerged, alongside patterns that related these differences in ‘listening style’ to
the respondent’s history of hearing loss and use of hearing aids. Ruth, profoundly deaf from
birth, stated:
But I do rely on my hearing more than anything else. Without my hearing aids I
wouldn’t enjoy it as much.
And likewise, Danny:
I rely on hearing aids. I think without, I would probably stop being a musician.
This represented a view shared by, Danny, Janine, Paul and Penny. These individuals could
be described as ‘auditory-attending’ musicians where, for the purposes of making music, it is
auditory input that is relied upon and the auditory characteristics of music that facilitate their
emotional engagement. Their definition of music would be, as is conventionally the case,
primarily auditory. In contrast, Anne and Evelyn were born hearing and were therefore able
to compare their early memories of sound and music with the distorted renderings afforded
by their hearing aids. Both subsequently dispensed with hearing aid technology, preferring
to find new ways to experience sound and music in the world. Both are exceptionally good
61
lip-readers, and have found new ways to obtain the information they need when making
music as Anne explained:
[Asked about the level of her residual hearing] Not much at all. I don’t tend to use it.
I mean there isn’t very much of it and I don’t – I know it’s totally untrained residual
hearing now – I don’t use it at all […] I definitely had to learn to stop listening to
what I was hearing because it wasn’t accurate.
Anne became profoundly deaf from the age of 15 to 18, most likely due to cochlear
otosclerosis. She does not wear hearing aids for music and therefore, with profound
deafness (thresholds of 95 +dB) she can only hear the loudest sounds of the orchestra. She
went on to say:
I never really like being a second-rate hearing person – so I didn’t like to feel like I
was relying on something that wasn’t reliable. So it was much easier to just get rid
of it [meaning her hearing aids].
It may be hard at first to understand how two professional musicians, both virtuoso
performers, could have become non-listening, or rather, ‘non-auditory-attending’. It is clear
that the salient difference between auditory-attending musicians and musicians (Anne and
Evelyn) that could be described as non-auditory-attending is that the latter have developed
the ability to attend, perhaps more closely than can people with lesser degrees of hearing
impairment, to characteristics of sound other than those which can be heard, for example,
the vibrotactile. The rest of the sample appeared to occupy a middle ground, where, in the
music-making situation, hearing was sometimes relied upon and sometimes ignored. This
was the case for Angela, Anthony, Janice, Nick, and William who could be described as
‘discriminate-auditory-attending’ musicians, although regarding music listening behaviour,
Nick described how auditory information has become entirely optional:
But because I’ve got music in my head anyway, I don’t I don’t need to listen to it.
It’s quite funny really because it’s almost like short-circuiting the entire music
process – so I don’t need to bother with instruments or musicians any more. I just
need the composer and a clear head and then – I don’t think the music union would
be very pleased!
For all three notional groups, the respondents’ history and background of hearing loss and
rate of change of hearing level appeared to influence the development of subsequent adult
62
listening styles. Auditory-attending musicians tended to be those born with their hearing
impairment (Danny, Paul, Penny, Ruth), who had experienced very little change in the level
of their hearing over time, and who learned to use and rely on the analogue hearing aid
technology they grew up with. As such, there was a tendency to prefer analogue hearing
aids, and reject the digital aids introduced in the 90s (Ruth, Danny, Paul), favouring the
power and the wider spectrum of sound analogue technology provides. Janine termed these
musicians ‘sound junkies’. Discriminate-auditory-attending musicians tended to be those
with born with typical hearing and who had subsequently acquired a moderate hearing
impairment (Anthony, Janice, William). These musicians were generally happy to work with
new digital hearing aids, but were acutely aware of the various pitch and timbral distorting
effects they can present, having ‘perfect’ early memories of music. All high-level
performers, these musicians were aware of when they could and could not trust their
hearing. As Anthony said:
If I think I’m making a scratchy sound – ugh – that’s not very nice – perhaps
everyone else can hear it, and it kind of knocks your confidence I suppose. Now I
know… I know it’s hearing. So I’m in my head, [I’m] saying “don’t worry – to him
over there, you don’t sound any different to how you did ten years ago. But to you it
sounds a bit different”.
In this way, discriminate-auditory attending may be a result of performance standard: in a
professional orchestra, mistakes are not tolerated and musicians must develop an acute
knowledge of the distinction between how sounds produced by their instrument sound to
them, and how they sound to other hearing musicians around them. In this way, they avoid
wrongly ‘correcting’ notes that seem out of tune aurally, but that a combination of social
feedback, visual cues and physical muscle memory assure them is not. It is likely that the
development of listening styles is influenced by the physiological and sensory experiences
associated with hearing impairment, the success of technological interventions such as
hearing aids, social contexts, and even practical, extrinsic factors such as the instrument
played.
The data suggest that musicians with hearing impairments use contrasting ways of
managing of the sensory experience and the music-making situation by recruiting
variously on different sensory modalities according to personal need and preference. This
includes the use of sensory visual, physical and social information, but also extends to the
attenuation of certain sensory modalities, in particular auditory information, where either the
hearing impairment itself or hearing aid technology interferes with the accuracy of the
63
information received. Vibrotactile information is also used by some participants to assist
with tuning (‘beats’). All participants, however, reported being aware of vibrotactile
information when available and Evelyn, Nick and Ruth recalled a heightened awareness of
felt vibrations when turning their hearing aids off. Ruth described how on taking her hearing
aids out, she suddenly becomes more aware of the vibrations of her flute, particularly in the
lower octave:
But the interesting thing is that when I turn my hearing aids off I can feel – aww it’s
amazing vibrations!
This was also the case for Nick after two years working in Indonesia:
I went without my hearing aid for 2 years […] and when I came home and in the
intervening period, I was playing the piano also without my hearing aid in, and I
realised then, that I was getting quite a lot of information through the vibrations.
Evelyn too described the same phenomenon during her lessons with her timpani teacher:
And he said “Evelyn, can you actually feel that timpani?” And I said, “yes”, I
was really concentrating [...] I took the hearing aids out, and discovered that
less was coming through here [point to her ears], but much more was coming
through the body. And it was really – that for me was a turning point without a
doubt.
As mentioned in the previous section on using vibrotactile feedback, the most commonly
held preference was that vibrotactile feedback is a positive addition to music performance: it
has been shown to contribute to the multi-modal experience of music and where this is
possible, it is desired.
The development of musical and deaf identities 3.4
This section outlines the ways in which musical and deaf identities interact over the lifespan
based on the interview data. As stated above, a love of music and musicality appears to be
unaffected by a hearing impairment. The prevalence of musical families in the present
sample, however, is unlikely to be a coincidence and ensured a potential for auditory

64
exposure to, and a socially constructed knowledge of music that would otherwise be rare for
children born to deaf parents. Ruth achieved Grade 8 flute at the age of 18. Both her parents
were music teachers and her three brothers, all hearing, played the piano to a high standard:
it is safe to say she had a musical upbringing. Ruth and Anne both experienced a pull toward
music as a result of social isolation experienced as a result of profound deafness. In this way,
deafness promoted the kind of deliberate practising behaviour in Ruth and Anne that has
been shown to predict musical expertise (Ericsson, Krampe, & Tesch-Römer, 1993) and
general levels of musical attainment (Hallam, 2004). The provision of music at school, as
well as in the home, was also influential. Danny described how his primary school teacher
would give pupils a mini-music lesson at the front of the class during general class time,
spending five or ten minutes on their piece:
And I think actually it was good because you got used to playing in front of people.
And it didn’t really affect anyone while they were working. It was a normal part of
school life, you know, seeing people dragged up in the middle of the lesson! It was
fine. But she did a lot of one to one work with me – she’d take me into the Hall,
she’d have someone cover her in the lesson, and she used cards with music notes on,
and she’d have separate cards with the note names – C, D, E, F, G – and I’d have to
match them up. And it wasn’t like a boring theory lesson, it was quite fun.
A hearing impairment does not, therefore, appear to alter initial motivations for engaging in
musical activity. A love of music, the intrinsic satisfaction it provides, the rewards of
making music with other people and musical self-efficacy were found to be key (Fulford et
al., 2011). Some differences were identified, and the importance of kinaesthetic and
proprioceptive feedback was reported, for example, in relation to the dexterity of piano
playing. In addition, knowledge of music theory and absolute pitch were shown to be
important tools for accessing music and facilitating listening while score reading.
Motivations aside, the examples above show how factors influencing the development of
musical expertise can compensate for each other: positive musical experiences at home (or at
school) help to reduce the impact of prejudice about music and deafness experienced early
on. The following three sections outline three contrasting ways in which musical and deaf
identities co-exist.
65
3.4.1 Overcoming deafness (choosing music in spite of a hearing impairment)
All musicians experience setbacks and challenges that must be overcome on the ‘pathway to
excellence’ (MacNamara, Holmes, & Collins, 2006) and applying to a music college or to
further musical education is one such challenge. For some respondents in this sample it was
the first time that a barrier, in the form of prejudice about music and deafness, was
encountered. Janine was advised by her mother that she should not go into singing straight
away but rather attend university first. It was while at university, having joined the Gilbert
and Sullivan and University Operatic Societies, that she met an audiologist who became
interested in both her musical ability and her hearing:
He was very interested in the fact that there is a history of deafness in the
family – and offered to test my hearing […] He met me on campus a few days
later and said you know, “just enjoy your singing as a hobby, because with the
hearing loss that you are going to have, there’s absolutely no way that you
could possibly have a career”, and I sort of – smiled and said “thank you very
much”, you know – I sobbed for days – but then I decided to do it anyway
because I loved it more than anything.
Paul’s setback is widely known and has been reported above. He failed his organ
performance diploma recital on the grounds that he did not play for the acoustic of the
building; his request for a colleague to accompany him to his practice session had been
denied. He was also, famously, rejected from 12 universities over 2 years applying to read
music before finally being accepted by Wadham College, Oxford. Anne was already playing
the violin when she began to lose her hearing at age 5. An operation restored her hearing at
this early stage, but it subsequently worsened from the age of 15. She switched from the
violin to the viola as the tessitura best fit the range of her residual hearing but finding an
open minded viola teacher was a challenge:
My first ever viola teacher was very negative […] He put on a record and asked
me what I could hear of it – and you know, it was all a bit jumbled by then. And
he said – “there’s no point – I’m wasting my time. I want to go” – [laughs]! I’m
earning my living now by professionally playing and, I mean he’s probably died
now – I obviously didn’t keep in touch.
As setbacks go, being dropped by a music teacher ranks high. The quality of musical
learning outcomes attained by music students (as assessed by grade examination marks) has
66
been shown to be best predicted by self-esteem and teacher ratings of ability (Hallam, 2004);
such a negative event would certainly not promote the former. Undeterred, however, Anne
went on to attend the Royal College of Music. Any concerns the examiners had about
Anne’s hearing were usually mitigated by the standard of her performance, highlighting how
important playing opportunities are in demonstrating talent. As Paul also found, universities
were less open minded and Anne was turned down from one because taking on a deaf
musician would be ‘ridiculous’. Some respondents were able to avoid the issue of prejudice
by concealing their deafness. Ruth attended the Royal Welsh College of Music and Drama
and is proud of the fact that none of her recital examiners knew about her deafness and were
therefore not in a position to give any special dispensation:
Well when I was at the Royal Welsh College of Music and Drama – do you
know, you have your end of year recital? And you have examiners come from
outside – my examiner didn’t know that I was deaf, so I just went – and started
– performed, and that was the aim really, I did not want them to know that I
was deaf.
Angela concealed her hearing status from her piano teacher, alluding to a more personal
reason for doing so:
I was all for keeping it quiet. Erm – the visiting piano teacher at college that I
then went on and had at the Royal Academy, she didn’t know, I didn’t tell her
which is fascinating. That she didn’t actually know – so I’d be playing the
piano and she’d be talking over me you know the way they do – and I couldn’t
[hear her] I really couldn’t! Oh well, I wasn’t going to tell her, I was in the
height of denial, I wasn’t going to tell anybody.
The examples in this section demonstrate that a hearing impairment can present itself as a
social barrier in musical development. Taking a task-oriented perspective, however,
impairments are evidently not a barrier to music performance: those who believed otherwise
usually moderated their opinion after hearing performances. So why did rejection from 12
universities and failing a diploma exam because of his deafness not affect Paul’s confidence
in his musical abilities in the long term? How was profound deafness not sufficient to
dissuade Anne or Janine from careers as professional musicians despite their both being told
by music teachers, explicitly, that they would never achieve this?
67
It has long been advocated that incremental beliefs about task-oriented ability are
advantageous as they reflect the reality that talents, defined as the observable outcomes of
innate gifts (Gagne, 2004), can be improved with effort (Dweck, 1986). More recently,
Dweck has argued that these beliefs correspond with growth mindsets, as opposed to fixed
mindsets, which enable the individual to seek out challenges and be resilient to setbacks
because they understand failure does not mean they have no talent (Dweck, 2006). Music
educators and teachers should therefore provide explanations for musical success or failure
that acknowledge the role of pupils’ efforts and learning strategies and de-emphasise the role
of innate talent or sheer luck (O'Neill, 2011). Time spent practising music, whether or not
motivated by a retreat from the social and emotional demands of verbal communication,
clearly involves personal effort. Furthermore, it is unlikely that a hearing impairment could
directly affect the higher-level cognition involved in learning styles described as ‘mastery-
orientated’ or ‘learned helplessness’ which instead relate to underlying personality traits
(Dweck & Leggett, 1988) and which might indicate the kind of focussed, effectual practice
time that increases musical achievement (Sloboda, Davidson, Howe, & Moore, 1996).
In addition to meeting musical performance requirements, most musicians do not have to
convince institutions further that they are worth educating or training at all because they are
deaf or have a hearing impairment. Being told by a music teacher that a musical career will
be impossible is a somewhat different kind of set-back than not winning an important
competition or audition; the examples above demonstrate extreme resilience in musical
contexts. O’Neill has suggested that fostering growth mindsets in music students teaches
them to overcome setbacks: ‘This can help to improve students’ resilience and increase their
resistance to the influence of negative stereotypes about their abilities’ (O'Neill, 2011, p. 40).
For musicians with hearing impairments, encountering the kind of fatalistic, negative
feedback from teachers and institutions described above, I propose that the ideal mindset
comprises an unassailable element of self-esteem, primarily fuelled by the individual’s
ability to play (or sing) and to perform. The degree to which the individual considers this
ability to be improvable (a growth mindset) may be more important in explaining cognitive
behavioural responses to failure in local teaching or learning scenarios, rather than fostering
the resilience required to cope with such global setbacks rooted in social musical contexts.
68
3.4.2 Deafness is irrelevant (life as a working/professional musician with a
hearing impairment)
Musicians with hearing impairments may encounter problems convincing employers that
their deafness does not interfere with their ability to do their job. This assumes the candidate
discloses their hearing status to the prospective employer. Deafness, the invisible disability,
can be successfully concealed depending on the level of impairment, lip-reading skill and/or
the type of hearing aid technology used, if any. Discrimination on the grounds of disability
was outlined in the original Disability Discrimination Act 1995 and in the more recent
Equality Act 2010. The problem facing the musician with a hearing impairment is that a
defence to a discrimination claim can arise where an employer is able to show that an
occupational requirement cannot be met as a result of the hearing impairment or disability
(Chartered Institute of Personnel Development [CIPD], 2011). Thankfully, recruitment
processes in professional orchestras include blind auditions and subsequent trial periods
giving the candidate ample opportunity to demonstrate their capabilities. Nevertheless, as in
the educational settings described above, the following examples highlight continuing issues
of concealment or of ‘downplaying’ deafness, but this time in employment or at work.
Evelyn Glennie has long preferred to separate her deafness from her music making.
According to Joseph Straus, “Glennie argues that whatever she has achieved has come not in
spite of deafness (the familiar narrative of overcoming) or because of it (an activist stance of
claiming disability). Rather, her deafness has had no significant impact” (Straus, 2011, p.
147). Perhaps this relates to her status in and impact on mainstream classical music: Evelyn
is perhaps the most famous solo percussionist in the world and is a renowned performer and
communicator. She writes:
For me my deafness is no more important that the fact that I am a 5’2” female with
brown eyes. Sure, I sometimes have to find solutions to problems related to my
hearing and music but so do all musicians […] Please enjoy the music and forget
the rest (Glennie, 2010b).
Other respondents in the sample share this standpoint. Anthony’s hearing impairment
became evident in his mid-30s while employed as a string player by a London orchestra.
Having seen an audiologist, he told the orchestra management about his need for hearing aid
technology but chose to not to disclose the fact to fellow players. Anthony’s hearing aids are
‘completely-in-canal’ and therefore visually very discreet. He can adjust the degree to which
69
his hearing aids amplify sound using a small remote control, which he finds indispensable
for negotiating the ever-changing acoustic world of rehearsal talk and rehearsal play.
Performances are easier. He spoke about his self-confidence and stated that praise from
others should merely serve to confirm what you already believe. In this way he is able to
separate his musical abilities from his hearing abilities:
You have to have that self-belief as a musician. And I think that’s something
which for me is intact. Because I look at it and I say OK - nothing has changed
my musical ability, all that’s changed is my hearing organs don’t work as well
as they did and so I have to have artificial help […] I’ve got hearing aids to
kind of boost the frequencies I need and so on and so forth. And so I carry on as
normal – I still love the music and still love playing in the orchestra. So I didn't
initially feel my hearing loss affected my music-making – I didn't feel it affected
my work.
Anne dispensed with hearing aids altogether at the age of 25. In her professional orchestral
work, a desk partner tunes her A string and she is able to tune the other strings by relying on
muscle memory and a vibrotactile perception for the ‘beats’ between notes. The challenge of
maintaining good ensemble synchrony with other players is achieved for Anne, primarily, by
using her eyes. As well as watching the conductor, she watches the other players in her
section. If she is principal, her job is to watch the leader. Fortunately, string instruments
provide a wealth of visual information about the relative pitch of notes, the length of time
they are sounded and the way in which they are played. Anne is able to map physical
gestures and movements to the score by watching for movements of the bow arm, the bow
on the string and the position and movements of the fingers on the fingerboard. As reported
above, the sound of a click-track presented via headphones is inaudible for Anne. However,
she wears the headphones regardless; unplugging them or putting them on her knee, to avoid
feedback, would only draw attention. A visual or tactile click-track would benefit Anne, but
it is certain that unless it could be operated with minimal effort or disruption, the solution
would not work in professional settings. Despite all this, the intrinsic motivation for Anne to
persist in her chosen career is clear:
I couldn’t do what I do – I don’t mean just to pay the mortgage, but I wouldn’t
do what I do if everything I did was a struggle […] I didn’t decide to become a
professional until after I went to music college. I never expected to be able to
get into the world of music – I just imagined that I would keep going until I
couldn’t get any further.
70
While Anne has always wished for minimal assistance to avoid disruption, the example
given above by Janine as she recalled the anger and prejudice of her recording producer
shows that asking for assistance can indeed cause disruption, distress and is contentious in
any professional musical situation. This is most likely because the stakes are so high.
William, who worked for 40 years in the pit at the Royal Opera House, Covent Garden,
spoke about his experiences of working with resident orchestra doctors:
They attend rehearsals so that anyone can be seen talking to the doctor without
suspicions – because anybody seen talking to the doctor they’ll say – “ooh look,
look- they’ve got a problem”. And because of the freelance nature of music, you’ve
always got to appear perfect. It’s desperately high pressure – and so hint of a
hearing problem, hint of a bowing tremble, or anything like this can be curtains to
your career.
Prejudice may be encountered both within and outside of musical employment. Ruth
described her difficulties in persuading a Local Music Service that she was capable of
teaching the flute in spite of her profound deafness. Similarly, Janice, a private piano teacher
with a moderate to severe hearing loss, talked about the reactions of prospective parents and
pupils to her hearing impairment. In this kind of scenario, where no formal recruitment
process exists to protect employer and prospective employee, the stigma is especially
evident:
And it has affected my teaching – I’ve lost my confidence about taking on
anyone new. Because, if you tell them, at their first piano lesson that you’re
deaf – they think what? [laughs] You’ve got to sort of – it’s not so bad with
some people, but you’ve got to be careful how you phrase it ‘cause they’re
thinking if she can’t hear then she can’t teach. That perception that I won’t be
able to hear them play.
3.4.3 Performing deafness (integrating musical and deaf identities in
adulthood)
The examples above, of both gaining entry to school or college and the experience of
working as a professional musician, are often characterised by the concealment of hearing
71
impairments. For some, this may represent an overcoming of deafness in that achievements
(such as Ruth’s recitals at college; Angela’s grade and professional exams; Janine’s early
performances; Anthony and William’s daily life in the orchestras and the blind auditions that
enable musicians to prove their worth) can be attributed solely to the individual’s innate
musicianship and hard work and not to any special dispensation they might otherwise
receive. Where a hearing impairment cannot be concealed in musical settings, however, the
narratives of overcoming the impairment become harder to maintain and the problematic
dualism between music and deafness is foregrounded; it becomes harder for musicians to
integrate their deaf and musical identities. At this point, a musician may either draw upon
their impairment or ignore it completely. They may choose to be open to the influence of a
hearing impairment on their behaviour, or ignore it completely, depending on the demands
of the individual and the demands of the particular situation. The view that a hearing
impairment is completely irrelevant to musical performance is true, in different ways, for
Evelyn Glennie and Anthony, and was evidenced for both Ruth and Janice in their efforts to
secure jobs as music teachers. It follows that professional musical situations may force
individuals to down-play or conceal a hearing impairment as there is a monetary value
placed on the quality of musical output; it is often assumed that the hearing impairment will
cause musical impairment. However, where music-making happens for intrinsic pleasure,
artistic or educational outcomes, there may be a greater interaction between musical and deaf
identities. Angela describes how, over time, she has increasingly allowed her hearing
impairment to become part of her identity as a musician:
Obviously there’s a disadvantage because you’re trying to hide something – which
is, you know, of debateable value. And so although the hearing – myself as a
hearing impaired person, is not something that I foreground, and certainly not in
music, it inevitably underscores everything that I do. So when people say “my
disability is only a little bit of me”, I would question that. They may like it to be “a
little bit of me”, they may not identify with it, but inevitably it’s going to affect their
motivation for whatever.
Angela’s words show how deaf identities and musical identities may co-exist over time.
They reveal the extent to which she now accepts the hearing loss she was hiding throughout
secondary school and music college. In a personal communication following the original
interview she wrote:
I now accept my hearing impairment in relation to music and no longer feel the
need to actively conceal it not least of all because I no longer need to prove

72
myself musically. Of course I don't particularly broadcast it either because
most of the time it isn't relevant or helpful because of peoples' prejudices. I do
ask my piano pupils to speak up because my hearing isn't as good as it could be
and I do ask duo partners to face me during rehearsal and my [musical] friends
do know of my hearing loss. I see my musical identity as musician [performer
and teacher], not deaf-musician. […] What I'm saying is that my need to
perform is unaffected by my hearing loss. Music is part of what I do for self-
fulfilment for as long as I am able to.
Angela is not the only musician for whom musical and deaf identities may become closer
over time. Straus proposes that Evelyn Glennie’s decision to learn sign language may not
only alter her relationship with the Deaf community, but also her musical output: “perhaps
Glennie will learn new ways of performing her deafness even as she continues to evolve as a
performer of music” (Straus, 2011, p. 149). The desire to down-play or conceal deafness is
likely to be driven by the social contexts of professional orchestras and of the role of the
paid performer. Yet performance is not the only role available to musicians; the composer
and playwright, Ailís Ní Ríain, has forged a successful musical and artistic career and is
funded by many organisations. Ailís has also spoken about how her deafness is increasingly
informing her work, providing an example of an artist who is successfully combining
musical and deaf identities:
I’ve been losing my hearing since 2005 – I wear hearing aids at present, and
basically becoming increasingly isolated and frustrated by this. Within my practice,
I want to reflect some of these feelings and experience (Ní Ríain, 2010).
In 2012, Janine sang in an opera exploring a biographical narrative of hearing loss. Her
written recollections suggest that any anxiety she experienced resulted not from her
deafness, but from the demands of singing into complex, dissonant harmonies in a genre of
music she would not normally attempt. This refreshing change was the result of a
collaborative environment in which Janine felt able to discuss issues of instrumentation and
orchestration with the composer:
It gradually occurred to me that the composer, and indeed all my colleagues,
genuinely wanted to find ways of helping and enabling me to do it. So I started to
relax and began to gain in confidence and the sense of achievement I currently feel
is huge.

73
The integration of musical and deaf identities afforded in the project facilitated Janine’s
development as a musician, not to mention her enjoyment. Discourses of overcoming
deafness, or making music in spite of deafness, are therefore not true for everyone, all of the
time. For Danny, deafness was never an obstacle to be overcome:
Well it’s very natural to me – I believe that I can play and just by playing, I know
that I can do it. And having passed my exams and everything – deafness never came
into it. And even if I didn’t hear and I thought it was lost or whatever, I’d have still
found a way. I had encouragement from my parents and teachers and because I was
exposed to music every day, it felt natural for me to take an interest in it. I never saw
deafness as a barrier to learning music.
Conclusions 3.5
This study has revealed that there are many ways in which a hearing impairment can
influence music-making. For some, deafness itself facilitated early involvement in music,
but otherwise motivations seemed unrelated to hearing impairment. Reasons given by
respondents for pursuing music as an occupation or a hobby were similar to those of the
hearing population: for example, the support of their parents and the involvement of their
families (Moore, Burland, & Davidson, 2003). Influential early experiences and inherent
musicality were found to promote self-efficacy and a love of music in the same way that they
might for hearing musicians. In the present sample of professionals and keen amateurs, it is
perhaps not surprising that 11 of 12 respondents came from musical families. However, for
some (Anne and Ruth), music became a means of escaping the challenges of day-to-day
verbal interaction and it is likely that, whatever the motivation, the quantity and quality of
this initial practice in childhood supported the development of adult musical expertise and
identity (Jørgensen & Hallam, 2009). The extent to which deafness may facilitate music-
making in this way is likely to depend on the amount of early exposure to music itself and,
given the lack of literature exploring the influence of hearing impairments on music-making
over time, this may be a developmental hypothesis worth exploring further.
Physiological and social challenges were attributed directly by respondents to their hearing
impairments and influenced the way in which their musicality was expressed: in their
choices of instrument, hearing aids and ultimately career. For some, the challenge of
negotiating digital hearing aid technology was almost as great as meeting professional

74
expectations of ensemble synchrony and tuning. The strategies used to tackle these
challenges were found to be wide-ranging. The use of visual cues to provide information
about the ensemble was commonly reported as was the use of proprioceptive, kinaesthetic
and vibrotactile cues, to a lesser extent, to provide information about one’s own playing. A
wide range of sensory information in different modalities is therefore drawn upon and the
methods reported of harnessing these cues indicate extreme resourcefulness on the part of
the individual to fulfil his or her unique requirements for music performance.
The auditory attending styles of the musicians in this study appear to be dynamic: some
musicians reported relying on all auditory information in music-making, others
discriminated and some preferred not to attend to auditory information at all, especially
when aural fidelity was not guaranteed (often as a result of music distortion through HAs).
In short, a hearing impairment may alter the recruitment of other senses in music
performance. Of all the sensory strategies described, non-auditory-attending seemed the
most paradoxical, given the context, but was also perhaps the most conservative. The
respondents who described this process were arguably those for whom accuracy when
interpreting auditory information was paramount: in this sample, those players earning their
living as professional orchestral or solo musicians. This finding may not be generalizable,
however. Influencing factors, such as whether deafness was pre- or post-lingual (and
therefore whether the musician had early memories of ‘full’ hearing before their loss), the
type of hearing aid technology used, the success of that technology, the musical context and
the instrument played, or their voice, may all be related to the development of listening style.
It cannot be assumed, therefore, that auditory-attending styles predict musical outcomes.
Furthermore, these categories refer to one-dimensional concept of listening; that is, auditory
listening. It would be more accurate to state that, for the purposes of making music, Anne
and Evelyn have found new ways to listen; the former relying on visual cues for exact
ensemble synchrony and vibrotactile cues for precise tuning, the latter relying primarily on
vibrotactile cues for timbre, colour and for communicative, musical expression.
Analysis of auditory attending styles was useful in shedding light on the various social,
interpersonal, musical, behavioural and cognitive processes involved in interactive music
making. While primary source literature alludes to these processes in terms of visual and
physical cues, they are, according to respondents, extremely difficult to describe objectively
(Glennie, 2010b; Whittaker, 2008). Further observational studies will be conducted to
explore the use of physical gesture and eye contact in music, aiming to establish
relationships between the use of sensory modalities in group performance. The present study
75
shows that individuals develop their own ways of experiencing music; no one way is right or
wrong, and no one way is best for everyone.
The experiences recounted above also highlighted the ways in which a hearing impairment
can affect musical development over the life-span. They reveal a variety of perspectives:
deafness as facilitating practice, as something to be concealed from recital examiners or,
conversely, revealed to orchestral employers, and ranging from being completely irrelevant
to being integral to musical performance. The evidence suggests that social stigma and
prejudice about music and deafness remain the biggest obstacles for musicians with hearing
impairments in mainstream education and employment sectors; as suggested by the social
disability model, society is the ‘disabler’ in most examples. Behavioural responses such as
concealing deafness and the performance anxiety experienced in social situations would be
lessened if the stigma of being a deaf musician was also reduced. Artists such as Glennie and
Ní Ríain have an important role to play in changing public perceptions in this respect.
Education also has a key role to play given the evidence of the influential nature of support
received by participants in this study from their teachers and schools. Given that roughly
72% of deaf children in England attend mainstream schools (CRIDE, 2012), the role of
teachers and educators is crucial in conveying the possibility that people with hearing
impairments can develop strong musical identities (be musicians) that, in turn, allow the
formation of healthy relationships with music over time (remain musicians). In short, the
focus should be on what can be achieved, rather than what cannot be achieved.
The experiences of musicians with hearing impairments demonstrate that musicality – the
way in which people respond to and make music – is not constrained by physiological
limitations on hearing. Musical engagement – including listening, performance and
composition – involves emotional, creative and communicative processes. Music is a
powerful and pervasive force: hearing impairments do not impede music-making as much as
people may think. Careers in the musical profession should not be ruled out on these
grounds alone and, even more importantly, a hearing impairment should not prevent music
from becoming a source of self-expression and well-being over the lifetime. Few
generalisations can be drawn from this small-scale qualitative study; however, all the
respondents demonstrated an intrinsic love of music that, for the individual, makes the
practice and performance of music a pleasurable and worthwhile endeavour in spite of the
challenges presented by a hearing impairment.
76
CHAPTER 4 – The effects of auditory and visual feedback on
musicians’ physical behaviour in interactive performance
This chapter reports a study that was originally intended as a pilot for an observational study
of musicians with naturally-occurring hearing impairments, using as participants the
members of two violin duos with normal hearing for whom auditory information was
attenuated artificially. It was informed by the review of literature on cross-modal
communication and perception in music (Section 2.2) and the finding of the interview study
reported in Chapter 3 that people with hearing impairments may rely more than people
without hearing impairments on visual information. The results have been published, in full,
in Fulford, Ginsborg & Goldbart (2012) and also appear, in part, in Fulford & Ginsborg
(2013a).
As shown in Section 2.2.2 movements and gestures in music can fulfil several functions
simultaneously. They can be social (Davidson, 2009) and involve performance conventions
(Ginsborg & Chaffin, 2011), inter-personal, between co-performers (Davidson & Good,
2002) and influenced by their respective levels of expertise and familiarity (King &
Ginsborg, 2011), physiological (London, 2006), perceptual, according to sensory dominance
(Morgan, Killough, & Thompson, 2011) and sensory compensation theories (Bavelier, Dye,
& Hauser, 2006); and cognitive involving intentionality (Küle, 2011) and auditory
representations (Keller & Appel, 2010). Empirical research on musicians’ movements, even
in naturalistic contexts, requires control over many variables, which becomes harder to exert
the larger the musical ensemble. This may explain why few attempts have been made to
investigate co-performers’ perceptions of each other’s movements. Research relevant to the
possible effects of hearing impairment on movement suggests that vestibular/proprioceptive
feedback may reinforce the auditory processing of rhythmic information and vice versa
(Phillips-Silver & Trainor, 2007) within physiological limits (Repp, 2005). If music directly
influences rhythmic movement (Morgan, et al., 2011), do hearing impairments impede this
process resulting in less movement?
Research on visual perception in group performance and how performers communicate
using visual information was reviewed in Sections 2.2.2 and 2.2.5. Performers use visual
information to play their own instruments more accurately (Banton, 1995) and communicate
their expressive intentions to audiences (Davidson, 1993; Thompson, Russo, & Livingstone,
2010). Infants are likely to make more rhythmic movements to music in the presence of
visual as well as auditory information (Morgan et al., 2011). The reliance of people with

77
hearing impairments on visual information as reported in Chapter 3 may relate to sensory
compensation mechanisms (Bavelier et al., 2006). Interactive musical performance provides
a rich sensory environment in which cues are utilised to inform behaviour and actions in real
time: such situations present high attentional demands of the kind that have been shown to
foster enhanced visual perception in profoundly deaf adults (Proksch & Bavelier, 2002).
Perhaps, instead of impeding physical responses, hearing impairments may be associated
with increased movements to music for social or altruistic reasons?
4.1 Aims and rationale
The present study aimed to explore the effects of auditory and visual information on
musicians’ movement and looking behaviour so as to determine the function of musical
movements (gestural or otherwise) in performance. Although research demonstrates a clear
association between auditory feedback and movement to music via links between
vestibular/proprioceptive feedback and auditory processing, the influence of a hearing
impairment on movement to music has not been addressed. Furthermore, the existence of
sensory compensation mechanisms in the profoundly deaf alongside anecdotal evidence of
increased looking behaviour in musicians with hearing impairments has not been tested in a
musical context. Research has also demonstrated the expressive power of the musical
performance that is perceived visually, yet very little attention has been paid to the use and
function of visual perception of the performer on the co-performer, as opposed to the
audience. To explore these issues it is necessary to observe performing musicians in groups
while controlling for auditory feedback and visual contact with co-performers.
Manipulation of auditory information (the sound of the music played and heard) was carried
out in preparation for a subsequent study investigating the effect of hearing impairment on
the production and perception of movement and gesture when making music. It is not
possible, however, fully to control for the severity of hearing impairment; while pure-tone
audiometry can quantify hearing levels over eight different sinusoid frequencies, it cannot
provide objective information as to the listener’s subjective, phenomenological experience:
what the individual actually hears. Neither is it possible to control for the nature of hearing
impairment as there are many types of hearing loss: conductive, sensorineural or mixed and
congenital or acquired. Furthermore, people with hearing impairments use different kinds of
hearing aids, digital and/or analogue, and some musicians with hearing impairments prefer
not to use hearing aids at all when performing (Fulford, et al., 2011).
78
In the present study, four violinists with ‘normal’ hearing experienced ‘auditory attenuation’
defined as a reduction in the quality and/or absolute volume of sound. Visual information
was manipulated by preventing one or both co-performers from seeing the other, resulting in
‘visual attenuation’ whereby the extent to which the other performer’s movements could be
seen was reduced. Two kinds of behaviour were then measured: first, the physical
movements of the body or ‘movement behaviour’, since this could represent either a
response to the music or communication with the other performer and second, ‘looking
behaviour’, defined as the extent to which players glanced or gazed towards their co-
performer during performance on the assumption that musicians attend visually to cues that
are useful to them and ignore those that are not useful. Finally, as movement and looking
behaviour seem to be driven by the need to stay together and in time with other players in
group music performance, ensemble synchrony was also measured.
4.2 Questions and hypotheses
Two broad questions were formulated in light of the literature review, aims and rationale
presented above:
1. What is the effect of attenuating auditory information on musicians’ movement
behaviour, looking behaviour and ensemble synchrony?
2. What is the effect of attenuating visual information on musicians’ movement
behaviour, looking behaviour and ensemble synchrony?
Six hypotheses were formulated as follows:
Hypothesis 1 was made on the basis that auditory information provides a stimulus for
movement and that this movement can in turn facilitate the encoding of auditory
information. It predicted that participants would make less movement when auditory
feedback when was attenuated than when it was not.
Hypothesis 2 was based on the findings of interviews reported in Chapter 3 suggesting that
musicians with hearing impairments are likely to rely on visual rather than auditory
information, and evidence of enhanced peripheral vision and attentional processing in
profoundly deaf adults. It predicted that participants would look towards their partner more
79
when auditory information (the sound of their own, and their partner’s playing) was
attenuated.
Hypothesis 3 predicted that ensemble synchrony would be better when auditory feedback
was not attenuated.
Hypothesis 4 was based on research showing that physical movements carrying semantic
meaning are produced for the benefit of co-performers. It predicted that participants would
make more movements when they could see their co-performer than when they could not.
Hypothesis 5 predicted that participants would look towards their partner more when they
had the opportunity to do so, i.e. when they were facing toward their partner and/or their
partner was facing towards, rather than away, from them.
Hypothesis 6 predicted that ensemble synchrony would be better when players could see
their co-performer than when they were facing away.
4.3 Method
4.3.1 Design
The study combined the use of observation and experimental methods in that the behaviours
of each violinist while playing were observed, coded and counted in each experimental
condition. The independent variables were the level of auditory input, either normal or
attenuated, and visual contact between players, either possible or impossible. Players wore
earplugs in ‘attenuated-auditory’ but not ‘hearing’ conditions (see Apparatus and Materials).
Players faced away from their partner in ‘attenuated-visual’ (hereafter, ‘non-visual’)
conditions and towards each other in ‘visual’ conditions; players could not see their partner
in non-visual conditions. As shown in Table 4.1, the four experimental conditions were
therefore: hearing with visual contact (HV), hearing with no visual contact (HnV),
attenuated-auditory with visual contact (AV) and attenuated-auditory with no visual contact
(AnV). As there were two players, there were 16 experimental conditions including four
‘same-condition’ pairs (bold in Table 4.1).
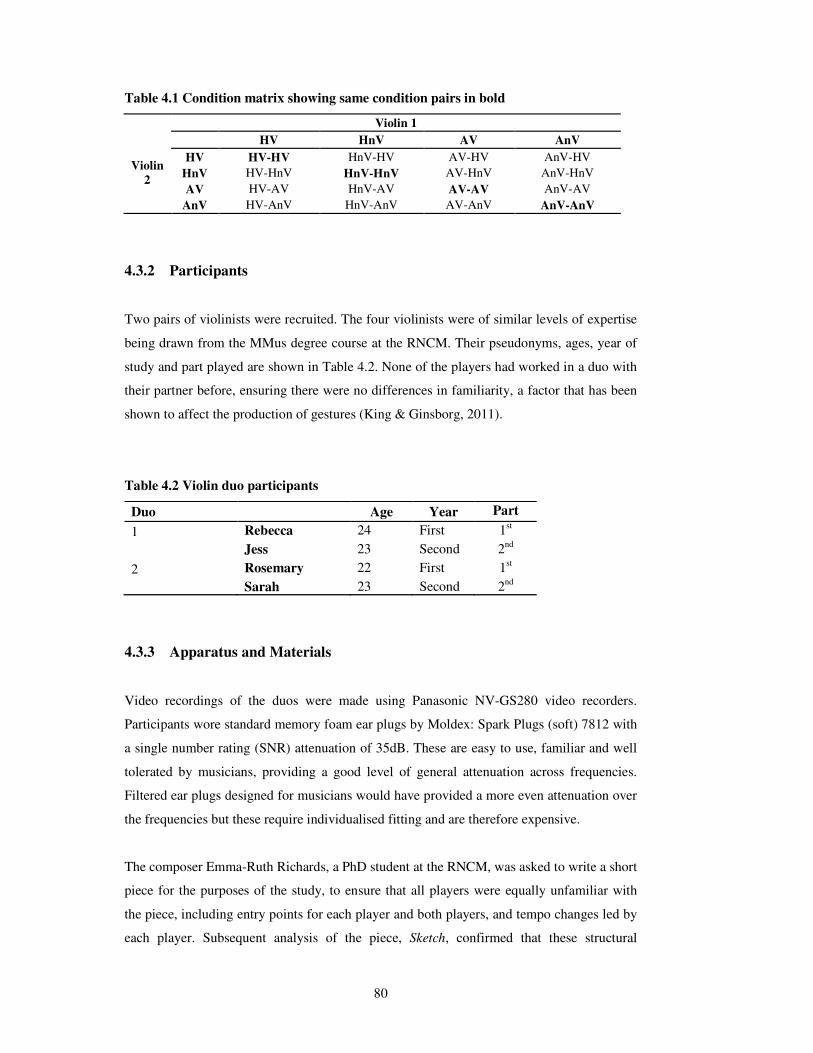
80
Table 4.1 Condition matrix showing same condition pairs in bold
Violin 1
Violin
2
HV HnV AV AnV
HV HV-HV HnV-HV AV-HV AnV-HV
HnV HV-HnV HnV-HnV AV-HnV AnV-HnV
AV HV-AV HnV-AV AV-AV AnV-AV
AnV HV-AnV HnV-AnV AV-AnV AnV-AnV
4.3.2 Participants
Two pairs of violinists were recruited. The four violinists were of similar levels of expertise
being drawn from the MMus degree course at the RNCM. Their pseudonyms, ages, year of
study and part played are shown in Table 4.2. None of the players had worked in a duo with
their partner before, ensuring there were no differences in familiarity, a factor that has been
shown to affect the production of gestures (King & Ginsborg, 2011).
Table 4.2 Violin duo participants
Duo Age Year Part
1 Rebecca 24 First 1st
Jess 23 Second 2nd
2 Rosemary 22 First 1st
Sarah 23 Second 2nd
4.3.3 Apparatus and Materials
Video recordings of the duos were made using Panasonic NV-GS280 video recorders.
Participants wore standard memory foam ear plugs by Moldex: Spark Plugs (soft) 7812 with
a single number rating (SNR) attenuation of 35dB. These are easy to use, familiar and well
tolerated by musicians, providing a good level of general attenuation across frequencies.
Filtered ear plugs designed for musicians would have provided a more even attenuation over
the frequencies but these require individualised fitting and are therefore expensive.
The composer Emma-Ruth Richards, a PhD student at the RNCM, was asked to write a short
piece for the purposes of the study, to ensure that all players were equally unfamiliar with
the piece, including entry points for each player and both players, and tempo changes led by
each player. Subsequent analysis of the piece, Sketch, confirmed that these structural
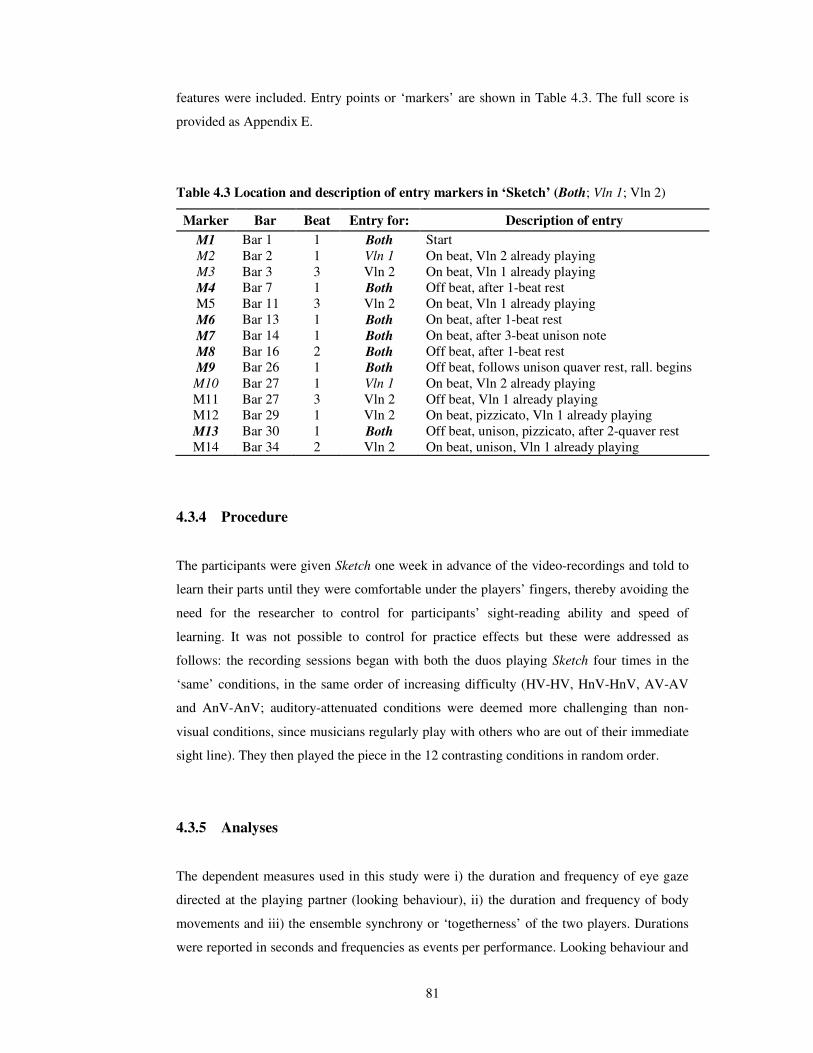
81
features were included. Entry points or ‘markers’ are shown in Table 4.3. The full score is
provided as Appendix E.
Table 4.3 Location and description of entry markers in ‘Sketch’ (Both; Vln 1; Vln 2)
Marker Bar Beat Entry for: Description of entry
M1 Bar 1 1 Both Start
M2 Bar 2 1 Vln 1 On beat, Vln 2 already playing
M3 Bar 3 3 Vln 2 On beat, Vln 1 already playing
M4 Bar 7 1 Both Off beat, after 1-beat rest
M5 Bar 11 3 Vln 2 On beat, Vln 1 already playing
M6 Bar 13 1 Both On beat, after 1-beat rest
M7 Bar 14 1 Both On beat, after 3-beat unison note
M8 Bar 16 2 Both Off beat, after 1-beat rest
M9 Bar 26 1 Both Off beat, follows unison quaver rest, rall. begins
M10 Bar 27 1 Vln 1 On beat, Vln 2 already playing
M11 Bar 27 3 Vln 2 Off beat, Vln 1 already playing
M12 Bar 29 1 Vln 2 On beat, pizzicato, Vln 1 already playing
M13 Bar 30 1 Both Off beat, unison, pizzicato, after 2-quaver rest
M14 Bar 34 2 Vln 2 On beat, unison, Vln 1 already playing
4.3.4 Procedure
The participants were given Sketch one week in advance of the video-recordings and told to
learn their parts until they were comfortable under the players’ fingers, thereby avoiding the
need for the researcher to control for participants’ sight-reading ability and speed of
learning. It was not possible to control for practice effects but these were addressed as
follows: the recording sessions began with both the duos playing Sketch four times in the
‘same’ conditions, in the same order of increasing difficulty (HV-HV, HnV-HnV, AV-AV
and AnV-AnV; auditory-attenuated conditions were deemed more challenging than non-
visual conditions, since musicians regularly play with others who are out of their immediate
sight line). They then played the piece in the 12 contrasting conditions in random order.
4.3.5 Analyses
The dependent measures used in this study were i) the duration and frequency of eye gaze
directed at the playing partner (looking behaviour), ii) the duration and frequency of body
movements and iii) the ensemble synchrony or ‘togetherness’ of the two players. Durations
were reported in seconds and frequencies as events per performance. Looking behaviour and
82
body movements were coded using Noldus Observer XT9 software (see below for coding
scheme) and post-hoc lag sequential analyses were performed to explore the temporal
relationships between looking behaviour and movement at and around entry markers. The
differences between the frequencies and durations of looking behaviour and body
movements in the different conditions were explored using descriptive statistics and
inferential tests: t-tests at group level (hypotheses 1, 2, 4 and 5) and Mann Whitney U rank
tests for post-hoc analyses at the player level where normal distributions and equal variances
were not achieved (Coolican, 2004). Groups were treated as independent, not related,
samples in analyses as the same participants took part in all conditions. Ensemble synchrony
was rated by trained musicians who were blind to experimental condition. Judges listened to
CDs containing the audio component only of the four same-condition performances while
reading the musical score. They provided a tally of instances of asynchrony and rated overall
performance synchrony using a 7-point Likert scale anchored by 1=good and 7=bad.
4.3.6 Coding Scheme
Table 4.4 describes the categories that were coded using Noldus Observer. The software
provided data in the form of frequencies and durations per performance (in seconds) for each
code, with the exception of Head which was coded as a ‘point event’ with no duration. Co-
performer-directed looking behaviour (Eyes) was not coded in non-visual conditions.
Movements that were explicitly required to produce sound on the violin, for example, the
movement of the right (bowing) arm, were not coded. The coding scheme was informed by
prior literature on musicians’ movements, specifically the coding of torso curl movements in
string players (Davidson & Good, 2002) and of looking behaviour between the members of
singer-piano duos (King & Ginsborg, 2011) which provided criterion (concurrent) validity.

83
Table 4.4 Coding scheme
Code Description
Looking behaviour
Eyes
Glances at or gaze directed towards the player’s partner. Frequency and
duration of looking behaviour coded in visual conditions only i.e. when both
players could see each other (‘two-way looking’), and when the player whose
behaviour was being coded could see only the back of the other player (‘one-
way looking’).
Movement behaviour
Eyebrows
Eyebrow lifts: coded as frequency and duration from the moment they rose
until the first point at which they started to relax. The tendency was for
eyebrows to be raised very suddenly and then to come down slowly.
Head
Quick jerks, nods or bobs, usually forward or backwards on a central axis, with
no simultaneous movement of the torso. The latter tended to correspond with
down-bows. The player’s hair often moved with quick head movements.
Coded as frequency only.
Scroll
Scroll lifts: coded as frequency and duration, from the moment the player
began to raise her left arm up, away from the torso so that the scroll of the
violin lifted, until the moment the scroll was still again.
Torso
Torso curls: coded as frequency and duration from the moment the torso began
to move until the moment it was still. Movement was forward or lateral and
could end in a new position or return to the starting position. The scroll
typically moved down with the torso curl.
Legs
Dips using the knees or raises caused by rising onto the balls of the feet,
typically very short: coded as frequency and duration from start of the dip/raise
until the player was still again. Crucially, there was no observable change in
torso position for changes on the vertical axis involving legs and feet. Frequent
shifting of weight between the legs was not coded as leg movement.
4.4 Results
4.4.1 Coding scheme and reliability
To establish inter-rater reliability and Cohen’s Kappa values for the coding scheme, a
researcher not involved in the study was asked to code video footage from six different
performances representing 10% of the total data, using a description of the coding scheme.
Confusion matrixes were produced using Noldus Observer allowing agreements and
disagreements to be visualised. Kappas ranged from .42 to .71 for individual observations
with a figure of .61 achieved overall on 8.3% of the data, representing a substantial level of
agreement between coders (Landis & Koch, 1977).
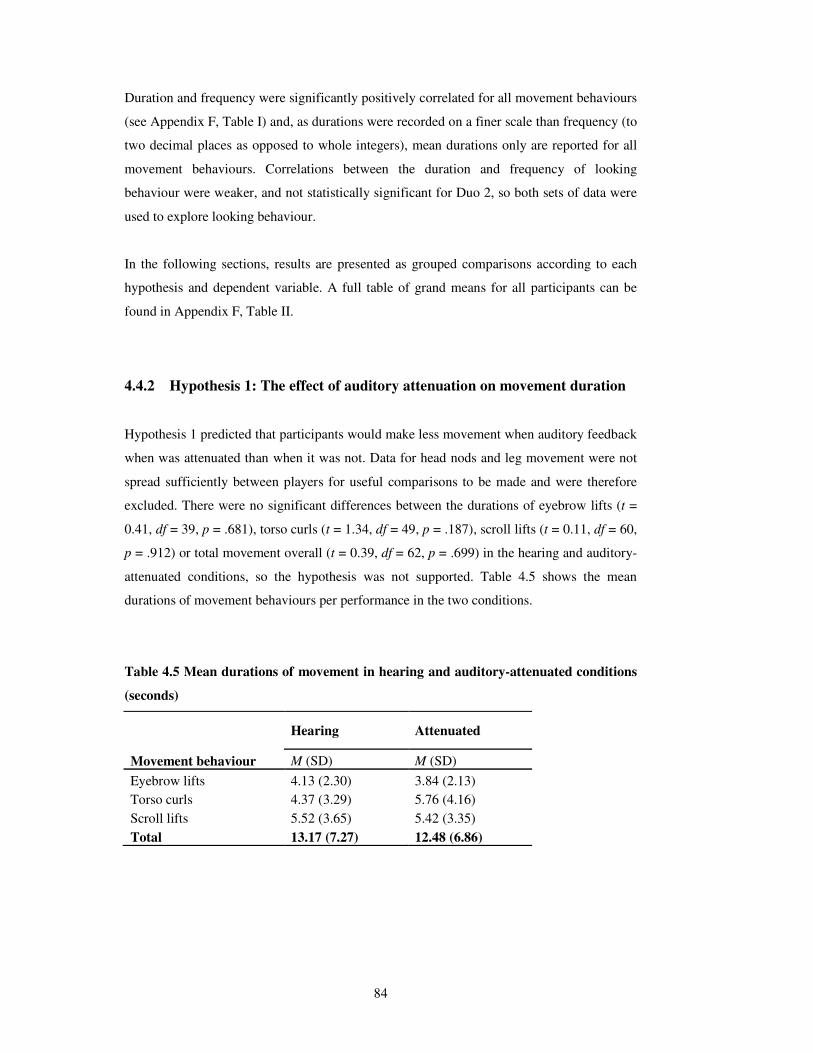
84
Duration and frequency were significantly positively correlated for all movement behaviours
(see Appendix F, Table I) and, as durations were recorded on a finer scale than frequency (to
two decimal places as opposed to whole integers), mean durations only are reported for all
movement behaviours. Correlations between the duration and frequency of looking
behaviour were weaker, and not statistically significant for Duo 2, so both sets of data were
used to explore looking behaviour.
In the following sections, results are presented as grouped comparisons according to each
hypothesis and dependent variable. A full table of grand means for all participants can be
found in Appendix F, Table II.
4.4.2 Hypothesis 1: The effect of auditory attenuation on movement duration
Hypothesis 1 predicted that participants would make less movement when auditory feedback
when was attenuated than when it was not. Data for head nods and leg movement were not
spread sufficiently between players for useful comparisons to be made and were therefore
excluded. There were no significant differences between the durations of eyebrow lifts (t =
0.41, df = 39, p = .681), torso curls (t = 1.34, df = 49, p = .187), scroll lifts (t = 0.11, df = 60,
p = .912) or total movement overall (t = 0.39, df = 62, p = .699) in the hearing and auditory-
attenuated conditions, so the hypothesis was not supported. Table 4.5 shows the mean
durations of movement behaviours per performance in the two conditions.
Table 4.5 Mean durations of movement in hearing and auditory-attenuated conditions
(seconds)
Hearing Attenuated
Movement behaviour M (SD) M (SD)
Eyebrow lifts 4.13 (2.30) 3.84 (2.13)
Torso curls 4.37 (3.29) 5.76 (4.16)
Scroll lifts 5.52 (3.65) 5.42 (3.35)
Total 13.17 (7.27) 12.48 (6.86)
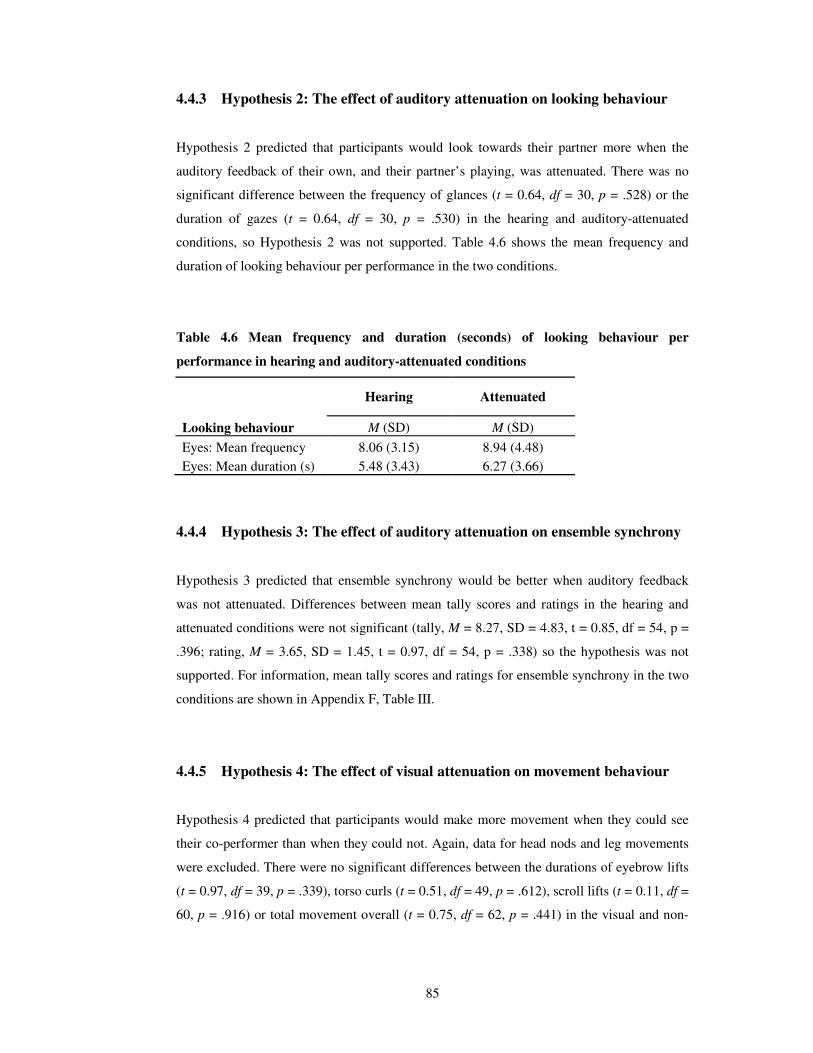
85
4.4.3 Hypothesis 2: The effect of auditory attenuation on looking behaviour
Hypothesis 2 predicted that participants would look towards their partner more when the
auditory feedback of their own, and their partner’s playing, was attenuated. There was no
significant difference between the frequency of glances (t = 0.64, df = 30, p = .528) or the
duration of gazes (t = 0.64, df = 30, p = .530) in the hearing and auditory-attenuated
conditions, so Hypothesis 2 was not supported. Table 4.6 shows the mean frequency and
duration of looking behaviour per performance in the two conditions.
Table 4.6 Mean frequency and duration (seconds) of looking behaviour per
performance in hearing and auditory-attenuated conditions
Hearing Attenuated
Looking behaviour M (SD) M (SD)
Eyes: Mean frequency 8.06 (3.15) 8.94 (4.48)
Eyes: Mean duration (s) 5.48 (3.43) 6.27 (3.66)
4.4.4 Hypothesis 3: The effect of auditory attenuation on ensemble synchrony
Hypothesis 3 predicted that ensemble synchrony would be better when auditory feedback
was not attenuated. Differences between mean tally scores and ratings in the hearing and
attenuated conditions were not significant (tally, M = 8.27, SD = 4.83, t = 0.85, df = 54, p =
.396; rating, M = 3.65, SD = 1.45, t = 0.97, df = 54, p = .338) so the hypothesis was not
supported. For information, mean tally scores and ratings for ensemble synchrony in the two
conditions are shown in Appendix F, Table III.
4.4.5 Hypothesis 4: The effect of visual attenuation on movement behaviour
Hypothesis 4 predicted that participants would make more movement when they could see
their co-performer than when they could not. Again, data for head nods and leg movements
were excluded. There were no significant differences between the durations of eyebrow lifts
(t = 0.97, df = 39, p = .339), torso curls (t = 0.51, df = 49, p = .612), scroll lifts (t = 0.11, df =
60, p = .916) or total movement overall (t = 0.75, df = 62, p = .441) in the visual and non-

86
visual conditions, so the hypothesis was not supported. Table 4.7 shows the mean durations
of movement behaviours per performance in the two conditions.
Table 4.7 Mean durations (seconds) of movement behaviour per performance in visual
and non-visual conditions
Non-Visual Visual
Movement behaviour M (SD) M (SD)
Eyebrow lifts 3.63 (1.94) 4.30 (2.40)
Torso curls 5.30 (4.01) 4.76 (3.52)
Scroll lifts 5.52 (3.45) 5.43 (3.58)
Total movement 12.14 (6.58) 13.51 (7.47)
Differences between the durations of movement behaviours in the two visual conditions,
one-way and two-way looking, were investigated. There were no significant differences
between the durations of eyebrow lifts (t = 0.65, df = 20, p = .520), torso curls (t = 0.18, df =
27, p = .858) or scroll lifts (t = 1.48, df = 29, p = .149), but there was a near-significant
difference between total movement overall in the two conditions such that movement lasted
longer when performers could see each other (M = 16.03, SD = 8.08 seconds) than when
only one could see the back of the other (M = 10.98, SD = 6.05 seconds, t = 2.00, df = 30, p
= .055). Table 4.8 shows the mean durations of movement behaviours per performance in
one-way and two-way looking conditions.
Table 4.8 Mean durations (seconds) of movement behaviour per performance in one-
way and two-way looking conditions
Movement behaviour
One-way looking Two-way looking Significant Differences
M (SD) M (SD) p<.05
Eyebrow lifts 3.92 (1.91) 4.61 (2.79) -
Torso curls 4.63 (3.47) 4.87 (3.67) -
Scroll lifts 4.46 (2.06) 6.33 (4.45) -
Total movement 10.98 (6.05) 16.03 (8.08) (.055)

87
4.4.6 Hypothesis 5: The effect of visual attenuation on looking behaviour
Hypothesis 5 predicted that participants would look towards their partner more when their
partner was facing towards rather than away from them. Excluding non-visual conditions
reduced the number of permutations from 16 to 8 and therefore the group sizes for
comparisons to 4 and 4. Significantly more glances were made in two-way than one-way
looking conditions (t = 2.86, df = 30, p = .008). To this extent the hypothesis was supported.
There was, however, no significant difference between the durations of gaze in the one- and
two-way looking conditions. Table 4.9 shows the mean frequencies and durations of looking
behaviour per performance in the two conditions.
Table 4.9 Mean frequency and durations (seconds) of looking behaviour per
performance in one-way and two-way looking conditions
One-way looking Two-way looking
Significant Differences
Looking behaviour M (SD) M (SD) p<.05
Eyes: Mean frequency 6.75 (3.75) 10.25 (3.13) .008
Eyes: Mean duration (s) 5.59 (3.39) 6.16 (3.72) -
4.4.7 Hypothesis 6: The effect of visual attenuation on ensemble synchrony
Hypothesis 6 predicted that ensemble synchrony would be better when players could see
their co-performer than when they were facing away. Differences between mean tally scores
and ratings in the visual and non-visual conditions were not significant (tally, M = 8.27, SD
= 4.83, t = 0.97, df = 54, p = .338; rating, M = 3.65, SD = 1.45, t = 0.58, df = 54, p = .553) so
the hypothesis is not supported. For information, mean tally scores and ratings for ensemble
synchrony in the two conditions are shown in Appendix F, Table III.
4.4.8 Post-hoc analyses
A post-hoc, lag-sequential analysis using Noldus Observer was conducted for two reasons:
first, to explore the possibility that lifting the scroll of the violin while playing may be partly
functional because it is necessary to shift the hand on the fingerboard to a new position;
secondly, to test the idea that looking behaviour is linked to ensemble synchrony because
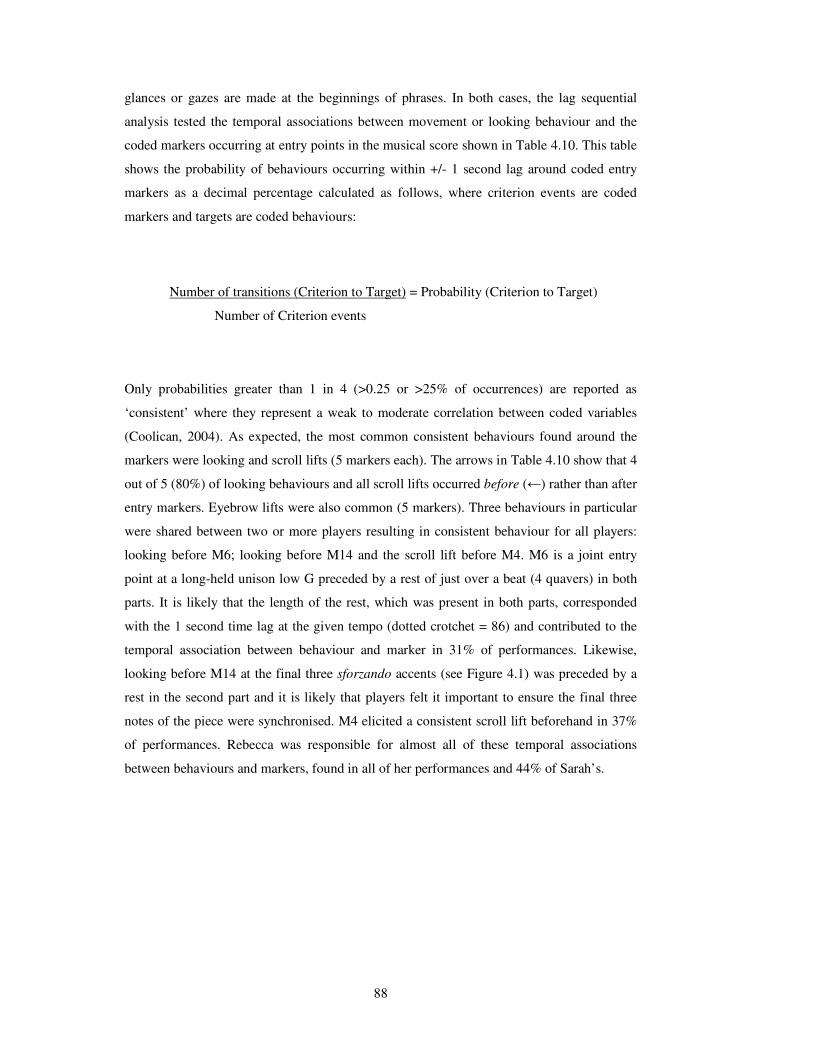
88
glances or gazes are made at the beginnings of phrases. In both cases, the lag sequential
analysis tested the temporal associations between movement or looking behaviour and the
coded markers occurring at entry points in the musical score shown in Table 4.10. This table
shows the probability of behaviours occurring within +/- 1 second lag around coded entry
markers as a decimal percentage calculated as follows, where criterion events are coded
markers and targets are coded behaviours:
Number of transitions (Criterion to Target) = Probability (Criterion to Target)
Number of Criterion events
Only probabilities greater than 1 in 4 (>0.25 or >25% of occurrences) are reported as
‘consistent’ where they represent a weak to moderate correlation between coded variables
(Coolican, 2004). As expected, the most common consistent behaviours found around the
markers were looking and scroll lifts (5 markers each). The arrows in Table 4.10 show that 4
out of 5 (80%) of looking behaviours and all scroll lifts occurred before (←) rather than after
entry markers. Eyebrow lifts were also common (5 markers). Three behaviours in particular
were shared between two or more players resulting in consistent behaviour for all players:
looking before M6; looking before M14 and the scroll lift before M4. M6 is a joint entry
point at a long-held unison low G preceded by a rest of just over a beat (4 quavers) in both
parts. It is likely that the length of the rest, which was present in both parts, corresponded
with the 1 second time lag at the given tempo (dotted crotchet = 86) and contributed to the
temporal association between behaviour and marker in 31% of performances. Likewise,
looking before M14 at the final three sforzando accents (see Figure 4.1) was preceded by a
rest in the second part and it is likely that players felt it important to ensure the final three
notes of the piece were synchronised. M4 elicited a consistent scroll lift beforehand in 37%
of performances. Rebecca was responsible for almost all of these temporal associations
between behaviours and markers, found in all of her performances and 44% of Sarah’s.
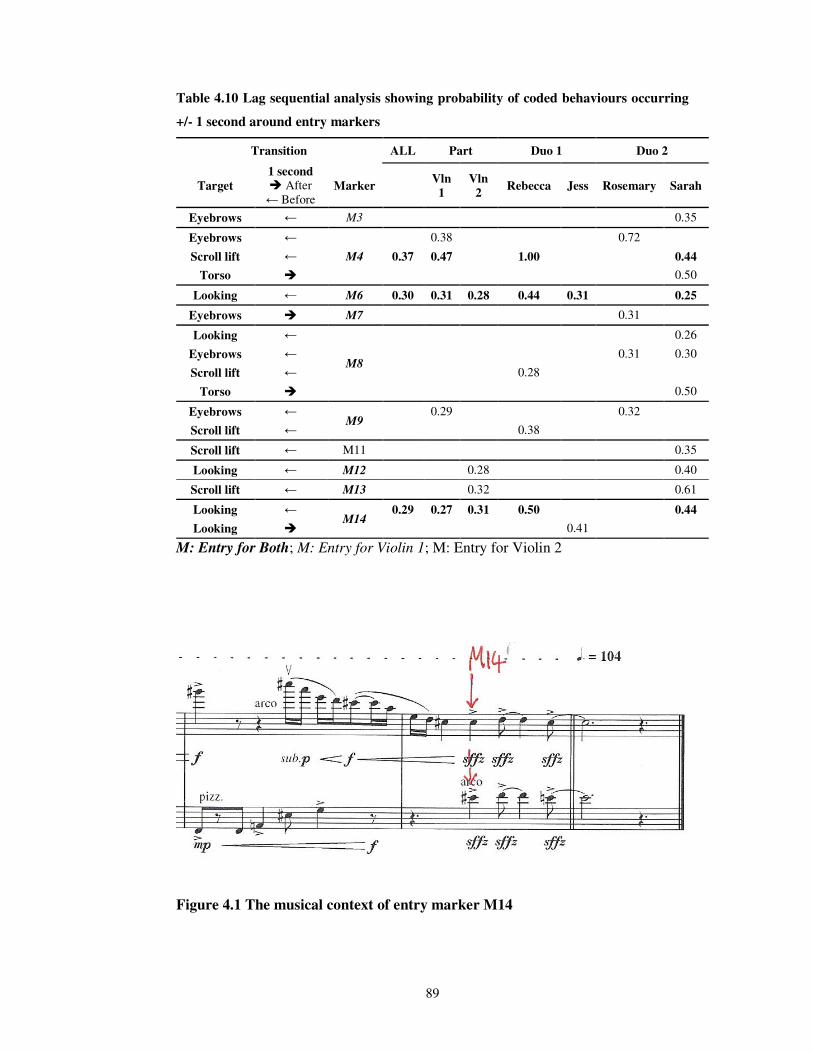
89
Table 4.10 Lag sequential analysis showing probability of coded behaviours occurring
+/- 1 second around entry markers
Transition ALL Part Duo 1 Duo 2
Target
1 second � After
← Before Marker
Vln 1
Vln 2
Rebecca Jess Rosemary Sarah
Eyebrows ← M3 0.35
Eyebrows ← 0.38 0.72
Scroll lift ← M4 0.37 0.47 1.00 0.44
Torso � 0.50
Looking ← M6 0.30 0.31 0.28 0.44 0.31 0.25
Eyebrows � M7 0.31
Looking ←
M8
0.26
Eyebrows ← 0.31 0.30
Scroll lift ← 0.28
Torso � 0.50
Eyebrows ← M9
0.29 0.32
Scroll lift ← 0.38
Scroll lift ← M11 0.35
Looking ← M12 0.28 0.40
Scroll lift ← M13 0.32 0.61
Looking ← M14
0.29 0.27 0.31 0.50 0.44
Looking � 0.41
M: Entry for Both; M: Entry for Violin 1; M: Entry for Violin 2
Figure 4.1 The musical context of entry marker M14
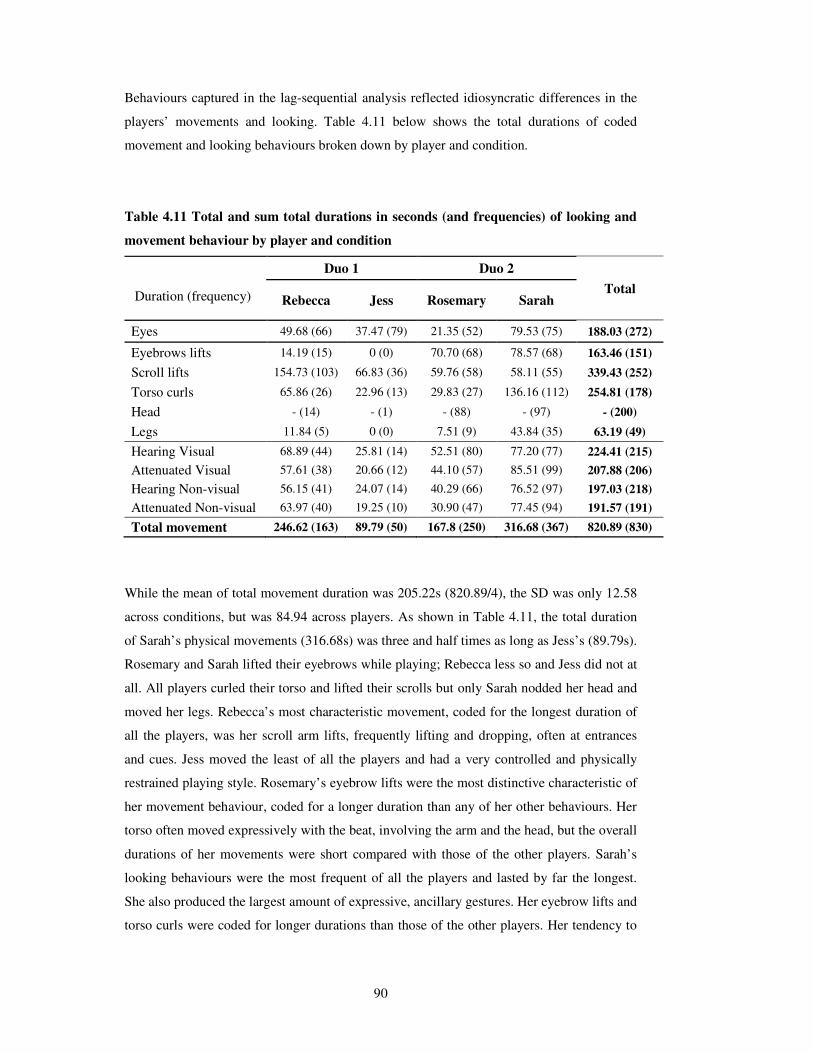
90
Behaviours captured in the lag-sequential analysis reflected idiosyncratic differences in the
players’ movements and looking. Table 4.11 below shows the total durations of coded
movement and looking behaviours broken down by player and condition.
Table 4.11 Total and sum total durations in seconds (and frequencies) of looking and
movement behaviour by player and condition
Duration (frequency)
Duo 1 Duo 2
Total Rebecca Jess Rosemary Sarah
Eyes 49.68 (66) 37.47 (79) 21.35 (52) 79.53 (75) 188.03 (272)
Eyebrows lifts 14.19 (15) 0 (0) 70.70 (68) 78.57 (68) 163.46 (151)
Scroll lifts 154.73 (103) 66.83 (36) 59.76 (58) 58.11 (55) 339.43 (252)
Torso curls 65.86 (26) 22.96 (13) 29.83 (27) 136.16 (112) 254.81 (178)
Head - (14) - (1) - (88) - (97) - (200)
Legs 11.84 (5) 0 (0) 7.51 (9) 43.84 (35) 63.19 (49)
Hearing Visual 68.89 (44) 25.81 (14) 52.51 (80) 77.20 (77) 224.41 (215)
Attenuated Visual 57.61 (38) 20.66 (12) 44.10 (57) 85.51 (99) 207.88 (206)
Hearing Non-visual 56.15 (41) 24.07 (14) 40.29 (66) 76.52 (97) 197.03 (218)
Attenuated Non-visual 63.97 (40) 19.25 (10) 30.90 (47) 77.45 (94) 191.57 (191)
Total movement 246.62 (163) 89.79 (50) 167.8 (250) 316.68 (367) 820.89 (830)
While the mean of total movement duration was 205.22s (820.89/4), the SD was only 12.58
across conditions, but was 84.94 across players. As shown in Table 4.11, the total duration
of Sarah’s physical movements (316.68s) was three and half times as long as Jess’s (89.79s).
Rosemary and Sarah lifted their eyebrows while playing; Rebecca less so and Jess did not at
all. All players curled their torso and lifted their scrolls but only Sarah nodded her head and
moved her legs. Rebecca’s most characteristic movement, coded for the longest duration of
all the players, was her scroll arm lifts, frequently lifting and dropping, often at entrances
and cues. Jess moved the least of all the players and had a very controlled and physically
restrained playing style. Rosemary’s eyebrow lifts were the most distinctive characteristic of
her movement behaviour, coded for a longer duration than any of her other behaviours. Her
torso often moved expressively with the beat, involving the arm and the head, but the overall
durations of her movements were short compared with those of the other players. Sarah’s
looking behaviours were the most frequent of all the players and lasted by far the longest.
She also produced the largest amount of expressive, ancillary gestures. Her eyebrow lifts and
torso curls were coded for longer durations than those of the other players. Her tendency to
91
lift up onto her toes was coded as leg movement as it resulted in unambiguous movement up
and down on a vertical axis.
The behaviours captured in the lag-sequential analysis (Table 4.10) reflect the idiosyncratic
differences described above. Sarah’s active looking and movement style was captured the
most overall (12 temporal associations between marker and behaviour) while Rosemary’s
eyebrow lifts were the only behaviours captured for her (4 temporal associations) and Jess’
behaviour was only captured twice. There were, of course, non-significant differences that
were at least consistent between players: eyebrow lifts were observed more in hearing than
in attenuated-auditory conditions, visual than in non-visual and two-way than in one-way
looking conditions for three of the players (Jess did not lift her eyebrows); all four players
curled their torso for longer durations of time in visual conditions while three players did the
same in two-way looking conditions and three players lifted their scrolls for longer in
hearing conditions and two-way looking conditions. The following discussion therefore
addresses each result in turn and refers to idiosyncratic behaviour and playing styles
enabling an evaluation of the relative influences of both individual playing styles and the
experimental conditions on observed behaviour.
4.5 Discussion
This study aimed to explore the effects of auditory and visual information on musicians’
movement and looking behaviours to identify the functions of movement for, and between,
co-performers. It was predicted that there would be more looking behaviour but less
movement behaviour and ensemble synchrony when auditory information was attenuated,
and less looking behaviour, movement behaviour and ensemble synchrony when visual
information was attenuated. The results show no differences between the violinists’ looking
or movement behaviour, nor ratings of their ensemble synchrony, in hearing and attenuated
auditory conditions, at the level used in this study. There were no differences between their
movement behaviour in visual and non-visual conditions but, where there was the possibility
of eye-contact, there was more looking and movement behaviour. It is likely that
inconsistencies between the players contributed to the non-significance of the differences
between the groups. For example, some players looked or moved more, and some looked or
moved less. In short, inter-player variances were far larger than intra-player variances
elicited by manipulating experimental conditions.
92
4.5.1 Hypothesis 1: Auditory attenuation and movement behaviour
There were no significant differences between movement behaviours in the hearing and
auditory attenuation conditions. This has the important implication (certainly for the wider
project) that there is little reason to suspect that musicians with hearing impairments will
move or behave differently to other musicians, on the basis of auditory feedback alone.
While changes in hearing level over the life span cannot be accounted for here, it is likely
that variance in observed movement can be largely attributed to individual differences in
playing or performance styles. This highlights the importance of acknowledging players’
uniqueness: no one person will use their body in exactly the same way as another. Likewise,
no one person will think in exactly the same way as another, and given that movements can
be consciously altered or ‘projected’ (Davidson, 1993), individual differences in musicians’
movement must be attributed to the uniqueness of their bodies and minds. Physical gestures
in music may be in part a basic response to auditory input and in part a projected
communication of intended manner to audiences and co-performers alike.
4.5.2 Hypothesis 2: Auditory attenuation and looking behaviour
There were no significant differences between looking behaviours in the hearing and
auditory attenuation conditions. It is possible that the attenuation provided by the ear plugs
was not large enough to disturb normal looking patterns in group music performance.
Earplugs of the type used in this study are distributed to musicians to mitigate the risk of
noise induced hearing loss. While uptake of earplugs by professional musicians is typically
low due to concerns about changes to the subjective perception of sound using the plugs
(Hansford, 2011), these results are reassuring in that such ear plugs do not appear to cause
players to alter their looking behaviour in performance.
4.5.3 Hypotheses 3 & 6: Auditory attenuation, visual feedback and ensemble
synchrony
There were no significant differences between ratings for temporal synchrony in the hearing
and attenuated auditory conditions, or the visual and non-visual conditions. The level of
auditory attenuation provided by ear plugs in this study was, therefore, not large enough to
93
compromise ensemble synchrony, which is reassuring for musicians who use these plugs to
mitigate the risks of noise induced hearing loss. Ensemble synchrony is arguably the most
fundamental of requirements for music making in ensembles and is primarily an auditory
task (Goodman, 2002). Musicians regularly perform in ensembles where sight lines do not
allow for direct eye contact with other players. Furthermore, direct visual contact is not
always possible in group music making, for example, for singers on stage, or between
orchestral musicians. However, other results in this study suggest that visual information
may facilitate ensemble synchrony as evidenced by the use of looking behaviour around
entry markers (see discussion of Hypothesis 5 below).
The low ranking and rating for the first performance played by Duo 1 (HV) may simply be
an order effect, with subsequent improvement showing after the first performance. Ratings
and rankings were better overall for Duo 2 suggesting that Rosemary and Sarah’s
performances were the most temporally synchronised. While the absolute ability of the
players was not controlled for in this study, (beyond constraints on ability as dictated by the
sampling frame as both players were conservatoire students) it may be that Sarah’s prevalent
looking behaviour combined with Rosemary’s communicative, gestural physical style
contributed to good synchrony between the players, both temporally and in manner.
4.5.4 Hypothesis 4: Visual feedback and movement behaviour
There were no significant differences between the amounts of movement behaviours
produced in the visual and non-visual conditions. However, there were differences between
the players. For example, Rosemary’s eyebrow lifts were coded for over three times as long
as her gazing or glancing toward Sarah (Table 4.11). For all other players, eyebrow lifts
were coded for an equal or shorter duration than looking behaviour overall. The frequency
and duration of her eyebrow lifts increased significantly when they were facing each other
(frequency: visual, M = 4.88, SD = 1.46; non-visual, M = 3.63, SD = 0.74; t = 2.16, d.f. = 14,
p = .049 and duration: visual M = 5.40s, SD = 1.17; non-visual, M = 3.44s, SD = 1.06; t =
3.51, d.f. = 14, p = .003) (Appendix F, Table IV). Given Rosemary’s tendency to glance
often towards Sarah, a physiological link between the two behaviours might be proposed
whereby partner-directed looking (not possible in non-visual conditions) is involuntarily
accompanied by a raised eyebrow. In fact eyebrow lifts occurred independently of looking
behaviour. They are likely to be a function of the musician’s unique physical and
performance style although Rosemary’s eyebrow lifts, in particular, show that they can be
used as an ancillary expressive gesture in music performance, as in normal conversation.
94
That torso curls did not disappear in non-visual conditions suggests that visual contact with
the playing partner alone is not the sole factor in the generation of such movement. Rather,
auditory feedback alone and the physical demands of sound production on the instrument are
enough to stimulate ancillary gestural movement as shown by existing research with solo
musicians (Davidson, 1993; Wanderley & Vines, 2006).
Subsequent comparisons between the amounts of physical movement in the one- and two-
way looking conditions revealed stronger effects; the overall increase in total movement
when players faced each other, enabling eye contact, approached significance and was
consistent for all four players. Of the component movements, Rebecca lifted her scroll
significantly more often when there was the possibility of eye contact with her partner Jess
(one-way looking, 4; two-way looking, 8) coded for a significantly longer duration (one-
way, 6.92 s; two-way, 11.9 s, in both cases U = 16.00, N1 = 4, N2 = 4, p = .003, two-tailed)
(Appendix F, Table V). The lag sequential analysis suggested that lifting the scroll was
functional, at least in part, for all players, resulting from the necessary shifting of the hand
on the fingerboard to a new position at entry points and beginnings of phrases. For Rebecca
however, the use of the scroll lift movement was further used to ‘keep the beat’, facilitating
ensemble synchrony with Jess at entry points. Rebecca exaggerated her scroll lifts for this
purpose and for Jess’s benefit as evidenced by their increased frequency and duration in
two-way looking conditions where the two players were facing towards each other.
Thus, the following questions remain: were players explicitly projecting their movements for
their co-performers’ benefit? Or did the potential for eye contact produce an increase in
physical movement as a pre-conscious response in the perception-action process? There may
be some truth in both alternatives. Rebecca’s scroll lifts were more emphatic when eye
contact with Jess was possible, suggesting that she was using them consciously and in a
communicative gestural way. This element of intentionality elevates such movements to the
status of ‘gesture’ according to conventional definitions (Kendon, 2004), yet they are also
functional in that violinists have to lift their scrolls to produce sound. Conversely,
Rosemary’s eyebrow lifts were not made consciously for the benefit of her co-performer.
This does not undermine the idea that eyebrow lifts in music performance could be a less
conscious, ancillary movement that may be expressive of the individual’s internal auditory
representations of music, since they were observed in the present study even when musicians
could not see their co-performers’ faces. It is not implausible that they could even be
perceived by co-performers as gestural. The model of shared affective motion experience
(SAME) (Overy & Molnar-Szakacs, 2009), whereby mirror behaviour evoked by the mirror
95
neurone system may suggest a mechanism by which performers move more when they can
see their fellow performer(s).
4.5.5 Hypothesis 5: Visual feedback (including eye contact) and looking
behaviour
The effect of visual feedback on looking behaviour was explored by comparing its frequency
and duration in one-way and two-way looking conditions. All four players looked at each
other significantly more often when they had the opportunity to do so in two-way conditions
but not for significantly longer. The potential for eye contact, therefore, appears to alter the
kind of looking behaviour produced by players; there were more frequent glances but gazes
were no longer in two-way looking conditions. This suggests that the potential for eye
contact prompts, but does not prolong, eye contact. Perhaps it feels inappropriate to gaze
directly into co-performers’ eyes for too long when playing. It is known that long gazes,
unless directed towards a lover, are usually taken as a challenge (Ellsworth & Langer, 1976)
and that, in dyadic conversation, eye contact is used to regulate turn-taking with the talker
looking up to ‘hand over’ when they have finished speaking (Kendon, 1967). It may be that
the two-way looking condition in this study, where both players faced each other, added a
conversational dimension to the situation whereby the intensity of direct eye-contact resulted
in players looking towards each other more often but for less time.
Analysis of the frequency and duration of looking behaviours revealed the differences in
looking style between and within the duos. Rebecca and Jess looked towards each other for
similar amounts of time in total, 49s and 37s respectively (Table 4.11), but it was Jess’s
looking that was captured more frequently around entry markers in the lag sequential
analysis, indicating following behaviour at entry points where she would look at Rebecca,
her ‘leader’, to ensure synchrony. Despite this, Rebecca seemed to have a more ‘active’
looking style than Jess; the frequency and duration of her looking behaviour were not
significantly correlated indicating that she used a mixture of short glances and long gazes
towards Jess. Conversely, Jess used short glances of consistent duration when looking
towards Rebecca. The different looking styles of the two players may reflect differences in
their learning of the music or ability to read ahead. Their looking behaviour was not
influenced by the potential for eye contact with the other player. Rather, it seems that
maintaining ensemble synchrony by visually tracking the movements of their partner was
more important than making eye contact per se.
96
There were more contrasts between the looking behaviours of the two players in Duo 2 than
between those of Duo 1. Rosemary’s looking behaviour was made up of short glances
towards Sarah, of consistent duration as evidenced by the significant correlation between
their frequency and duration. Her glances toward Sarah were also short (Table 4.11). Sarah’s
looking behaviours were most frequent and lasted longest of all the players so her looking
style was much more active than Rosemary’s. Like Rebecca’s, in Duo 1, it was made up of a
mixture of short glances and long gazes towards Rosemary (frequency and duration were not
significantly correlated, Appendix F Table I). The contrast between their looking styles may
indicate a leader-follower dynamic whereby Sarah used her eyes to maintain synchrony of
timing and manner with Rosemary who, as leader, looked back far less. Alternatively, they
may simply represent idiosyncratic differences between the players. While Rosemary tended
only to glance towards Sarah, she looked more often and for longer when Sarah was facing
towards her, enabling the possibility of eye contact (frequency: two-way, Md = 12.00, R =
7.00; one-way Md = 2.00, R = 1.00 and duration: two-way, Md = 4.86s, R = 3.02; one-way
Md = 1.12, range = 0.13 and U = 16.00, N1 = 4, N2 = 4, p = .028, two-tailed, in both cases).
Her looking was therefore augmented by visual contact with Sarah, perhaps because the
desire for eye contact, as opposed to the need to maintain temporal synchrony, was more
important for her. Alternatively, Sarah’s active looking style influenced Rosemary’s, which
is perhaps naturally more passive. Sarah clearly enjoyed her moments of eye contact with
Rosemary and, of all the players, seemed most able to play from memory, allowing her to
look towards Rosemary instead of at the score.
Although there were more glances in the two-way conditions, looking behaviour was
nevertheless maintained by all players in one-way conditions. The frequency of one-way
looking was 66% of two-way looking, and the duration of one-way looking was 90% of two-
way looking. Clearly eye contact is not the sole purpose of partner-directed looking. Rather,
there is value for musicians in being able to perceive co-performers’ movements and
gestures, even if viewed from behind, or players would not need to look towards them at all.
This supports the finding that co-performer-directed looking (including direct eye contact)
helps musicians achieve performances that are both temporally synchronous and unified in
manner (Davidson & Good, 2002). The lag sequential analysis in the present study confirms
this but also shows that looking behaviour was the most common behaviour +/- 1s around
entry markers. It should be noted, however, that players’ short-term memory and familiarity
with the piece influence their ability to look away from the score. More frequent looking in
two-way conditions might also be explained by the model of ‘intimacy equilibrium’ as
proposed by Argyle and Dean whereby looking behaviour and physical proximity have an
97
inverse relationship, both signalling intimacy. They propose that looking functions as both a
channel for feedback and a signal that the channel is open (Argyle & Dean, 1965). Here, the
increased frequency of looking events in two-way conditions may be a ‘signal’ of the
intimacy between players afforded by the face-to-face configuration in these conditions.
That the duration of looking events in one-way and two-way conditions was similar suggests
that the potential for eye contact between players did not alter the way in which the players
visually perceive information about their partner’s movements; in this way, the intimacy
between players is revealed by looking toward the co-performer more frequently, but not for
longer.
4.6 Conclusions
This study explored the use of looking and movement behaviour in violin duos in order to
understand the possible uses of auditory and visual information by the players. Although the
study began life as a pilot and therefore using only a small sample, the results extend current
knowledge about how movements are visually perceived and used by musicians and their
co-performers. Players used more looking and movement behaviours when they had the
potential for eye-contact, but not when their auditory feedback was attenuated. This finding
supports the idea that players’ conscious knowledge of ‘being seen’ by co-performers can
add intentionality to physical movement regardless of their own sensory feedback.
Movements required for the sound production (such as the scroll lift of a violinist) as well as
ancillary gestures (such as torso curls and eyebrow lifts) both have the potential, therefore,
to be perceived by co-performers as well as the audience as carrying the conscious intent of
‘gesturalness’ or a specific ‘manner’. The influence of the visually-perceived co-performer
on performers’ looking and movement behaviour highlights the generative processes behind
the execution and delivery of movement to music. Movements form as a response to
auditory and visual stimuli and yet can be altered, augmented and projected for the benefit of
co-performers. More research must be done with larger numbers of duos or bigger
ensembles to establish the extent to which movements in interactive performance settings
are altruistic and/or communicative.
The uniqueness of human bodies was highlighted; it was clear that individual physiology,
intentions and mental understanding of the music affect the ways in which movements are
produced and expressed. Individuals also use and process sensory information in different
ways. Further research with musicians with hearing impairments is necessary to explore the
98
role of visual information in the idiosyncratic communicative processes that result from such
musical collaborations. At a basic level, the importance of spatial location in relation to co-
performers is important, not only for musicians with hearing impairments, but for those with
‘normal’ hearing, given the effects of face-to-face orientation on player behaviour shown in
this study. Furthermore, there is still a gap between the conception of ensemble synchrony as
a primarily auditory task, not affected by visual attenuation, and the reports of musicians
with hearing impairments that visual information is crucial for its attainment. These
questions were addressed in the observational study reported in Chapter 5.
Kendon’s definition of gesture as ‘manifest deliberate expressiveness’ provided a useful
foundation for discussion in this study. Yet the results of the present study highlight the fact
that, in music, the origin and function of movements are heterogeneous. Apparently
functional movements, such as the violinist’s lifting of the left ‘scroll’ arm, may also be
gestural if the mover intends them to be, as was the case for Rebecca. In the repertoire of
violinists’ movements coded in this study, each was found to be unique in its degree of
functionality as auditory (sound production), communicative (co-performer directed) and
expressive or gestural. Head nods occurring on strong accents mirrored forceful down-bow
motions in the opposite direction and were expressive in function but also linked to the
physiology of sound production on the violin. Conversely, torso curls and eyebrow lifts,
being truly ancillary to sound production on the violin, were almost wholly expressive either
of internal representations of the music (Rosemary’s eyebrows) or for the benefit of the co-
performer.
Every movement in music can therefore be said to vary on a number of dimensions: i) the
degree to which the movement is requisite for sound production; ii) the degree to which the
musician adds or mediates the element of consciously intended expression; and iii) the
degree to which the movement is (consciously) perceived as being expressive, having an
expressive manner or being expressive of something particular. The generation of expressive
gesture (ii) is subject to the influences of physiology and the cognitive processes of the
individual performer as well as socio-cultural influences. A movement may be expressive
regardless of what was consciously intended and there may be disconnect between the
performer’s intention and what the observer perceives. It may have been that Rebecca’s
consciously exaggerated scroll arm movements provided a useful visual cue for her co-
performer, Jess, in facilitating ensemble synchrony. However, it is likely that an audience
would perceive far more expressive manner in Rosemary’s (apparently unintentional)
eyebrow lifts given their role in facial expression. There is a distinction, therefore, between
the function of movement in conveying expressive meaning to the observing listener and to

99
the observing co-performer. While most research has focused on the former, the present
study suggests that co-performer-directed physical expression may be just as salient for the
performer as that which is audience-directed.
Davidson (2009) has written that her most interesting work on co-performance cues was
undertaken with blind musicians, which revealed the power of proxemics and non-verbal
cues. She states that a performer’s capacity to deal with moment-by-moment processing of
tempo changes or memory slips depends on “an opening of ears and eyes to hear and see
cues” (2009, p. 370). The results of the present study support Davidson’s observation by
highlighting the value of visually-perceived information from co-performers in group music
making.
100
CHAPTER 5 – The effects of hearing impairments on verbal and
non-verbal communication during rehearsal and performance
This chapter reports a second observation study, originally conceived as the main
observation study for which the previous observation study reported in Chapter 4 was
intended as a pilot, involving musicians with naturally-occurring hearing impairments.
Again, the review in Chapter 2 of literature on cross-modal perception and communication
in music, particularly that on the social aspects of group performance (Section 2.2.1), was
drawn upon to help develop aims, questions and hypotheses for the study. Two results and
discussion sections are presented in this chapter. The results relating directly to the research
question, that is, the effects of hearing impairment on the dependent variables, are reported
in Section 5.3 and discussed in Section 5.4. The results of analyses relating to individual
players are reported in Section 5.5, discussed in Section 5.6 and summarised in Section 5.7.
Finally, a case study of ensemble synchrony is described in Section 5.8 and the chapter ends
with a short conclusion (5.9). Ideas about the use of gesture and sign in music stemming
from data captured in this study will be included in Fulford & Ginsborg (2014, in press).
In Chapter 2 it was shown that the empirical observation of deaf and hearing-impaired
musicians, especially adults, is rarely undertaken or reported in the academic literature. The
benefits of music for the general development of children have been extolled in music
education (Chen-Hafteck & Schraer-Joiner, 2011; Yennari, 2010) and there is also evidence
that children with hearing impairments are able to access the emotional content of music,
with therapeutic benefits (Darrow, 2006). And yet there seems to be a lack of awareness in
society that it is possible for people with hearing impairments to become musicians, by
listening to music, studying and practising music. This lack of awareness can be experienced
as a social stigma by adult musicians who have grown up with their hearing impairments
(Whittaker, 2008), and this was echoed in the findings of the interview study (Chapter 3)
which showed that many musicians conceal or downplay hearing impairments in musical
contexts (Fulford, Ginsborg, & Goldbart, 2011).
To learn more, it would be necessary to observe musicians with hearing impairments in a
diversity of ecologically-valid settings that reflect the reality of rehearsal and performance.
Participants in the interview study performed in choirs, orchestras and chamber ensembles;
in venues including concert halls, youth centres, churches and theatres; at a variety of levels
both amateur and professional; and in different roles including conductor, player, singer,
performer, musical sign language interpreter and teacher. A single study cannot fully address
101
the gaps in academic and general social knowledge regarding musicians with hearing
impairments. The present study was conceived, however, with a focus on the ways in which
naturally-occurring hearing impairments affect the communicative aspects of interactive
performance.
5.1 Aims, questions and hypotheses
The broad aim of this study was to explore the effects of a hearing impairment on the
processes underlying the rehearsal and performance of music, in particular communication
and collaboration between players. The observation of musicians with hearing impairments
in rehearsal and performance provided an opportunity to test the hypothesis that reduced or
impaired auditory feedback increases the reliance on visually perceived physical cues, as
reported by musicians with hearing impairments (Chapter 3) and as evidenced by increases
in the movement and looking behaviour of musicians with typical (or ‘normal’) hearing in
conditions where eye contact between players was possible (Chapter 4). The following
research questions were formulated:
1. Non-verbal communication: Looking behaviour
a. Do musicians with hearing impairments rely more than musicians with typical
hearing on visually perceived physical cues from co-performers, evidenced by
increased looking behaviour and if so, to what extent?
b. What are the differences, if any, between flautists’ and pianists’ looking behaviour?
c. (How) does looking behaviour vary between rehearsal and performance of the two
pieces?
While the previous observational study manipulated visual and auditory feedback
systematically, the primary independent variable in this study was hearing, with different
levels occurring naturally. The design of the study was therefore quasi-experimental. No
other independent variables were included. Instead, additional data were gathered to address
questions about the potential effects of a hearing impairment on communication and
collaboration in interactive music making. Instead of analysing and coding individual
movements in repeated performances, as in the previous study, the focus in the present study
was on the rehearsal process, including rehearsal talk, structure, strategy and the use of
102
gesture and sign during talk. The following questions were asked relating to verbal and
visual communication between players and the resulting rehearsal strategies:
2. Non-verbal communication: Speech gestures
a. What kinds of gestures are used in rehearsal talk?
b. (How) is the production of speech gestures affected by a hearing
impairment?
3. Verbal communication: Rehearsal talk
a. How does a hearing impairment affect the relative proportions of time spent
talking in rehearsal, as opposed to playing?
b. What is the nature of rehearsal talk?
c. (How) is the nature of rehearsal talk affected by a hearing impairment?
4. Verbal communication: Rehearsal strategy
a. What rehearsal strategies do players suggest and use?
b. (How) is rehearsal strategy affected by a hearing impairment?
5.2 Method
5.2.1 Participants
An opportunity sample was used, drawing on the contacts and networks of musicians with
hearing impairments made during the first year of the project, and decisions were made
about possible combinations of instruments and naturally-occurring hearing levels. The
result was the formation of three flute-piano duos; one pair with typical hearing, one pair
with moderate hearing loss and one pair with profound deafness (see Table 5.1). The players
with profound deafness had been so since birth and were fluent in British Sign Language
(BSL). Of those with a moderate hearing impairment, William’s was acquired at various
points in his life most likely due to a combination of military work and 40 years of piccolo
playing in the orchestra of the Covent Garden Opera House, while Angie’s was present from
birth.
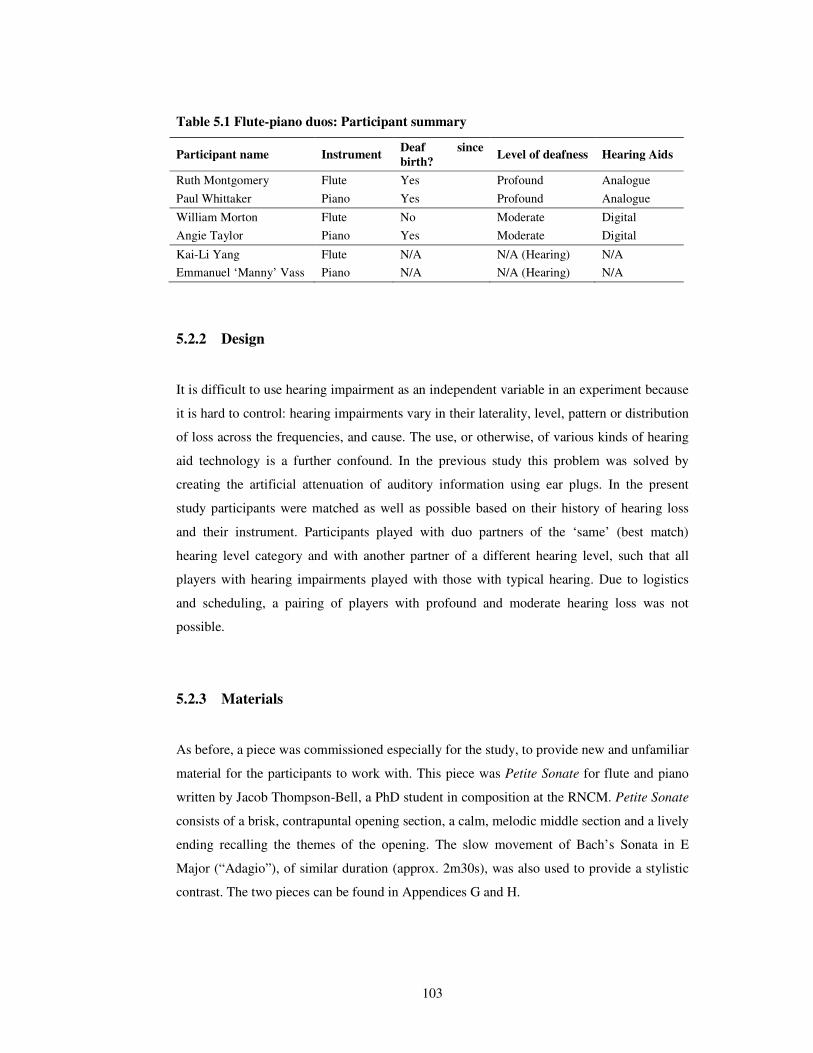
103
Table 5.1 Flute-piano duos: Participant summary
Participant name Instrument Deaf since
birth? Level of deafness Hearing Aids
Ruth Montgomery Flute Yes Profound Analogue
Paul Whittaker Piano Yes Profound Analogue
William Morton Flute No Moderate Digital
Angie Taylor Piano Yes Moderate Digital
Kai-Li Yang Flute N/A N/A (Hearing) N/A
Emmanuel ‘Manny’ Vass Piano N/A N/A (Hearing) N/A
5.2.2 Design
It is difficult to use hearing impairment as an independent variable in an experiment because
it is hard to control: hearing impairments vary in their laterality, level, pattern or distribution
of loss across the frequencies, and cause. The use, or otherwise, of various kinds of hearing
aid technology is a further confound. In the previous study this problem was solved by
creating the artificial attenuation of auditory information using ear plugs. In the present
study participants were matched as well as possible based on their history of hearing loss
and their instrument. Participants played with duo partners of the ‘same’ (best match)
hearing level category and with another partner of a different hearing level, such that all
players with hearing impairments played with those with typical hearing. Due to logistics
and scheduling, a pairing of players with profound and moderate hearing loss was not
possible.
5.2.3 Materials
As before, a piece was commissioned especially for the study, to provide new and unfamiliar
material for the participants to work with. This piece was Petite Sonate for flute and piano
written by Jacob Thompson-Bell, a PhD student in composition at the RNCM. Petite Sonate
consists of a brisk, contrapuntal opening section, a calm, melodic middle section and a lively
ending recalling the themes of the opening. The slow movement of Bach’s Sonata in E
Major (“Adagio”), of similar duration (approx. 2m30s), was also used to provide a stylistic
contrast. The two pieces can be found in Appendices G and H.

104
5.2.4 Procedure
Participants were given copies of Petite Sonate and the Bach Adagio one month before the
observations were made. They were informed that they would be playing with two partners
(or three in the case of the hearing musicians) with different levels of hearing than
themselves.
Since it was not possible to control for participants’ age and level of experience, it was
decided that the amount of time spent practising the pieces would, likewise, not be
controlled. The effects of familiarity and, more importantly, unfamiliarity were considered.
While some of the participants already knew each other, for example Ruth and Paul and also
Kai-Li and Manny, they had not played together as a duo before. Therefore, the primary aim
was to ensure that all participants were comfortable and relaxed in the observation sessions
so as to reduce potential performance anxiety. The participants were therefore instructed
simply to practise the pieces until they were ‘under the fingers’. The email instructing all
participants can be found in Appendix J.
Each observation session consisted of a 12-minute rehearsal followed by a final run-through
of the two pieces, beginning with the Bach Adagio. The sessions were filmed using two
Panasonic NV-GS280 video recorders. Each camera was focused closely enough on one
player to ensure that the direction of his or her gaze could be identified, either towards the
music or the co-performer.
5.2.5 Analyses
As in the previous study, Noldus Observer XT9 was used to code the data. The coding
scheme is summarised in Table 5.2.
1. Non-verbal communication: Looking behaviour
The initial state of the behaviour Looking was coded as Music, and as Partner whenever the
player looked up from their music in the direction of the co-performer. Partner was modified
on the basis of intuition as Glance (short) or Gaze (long).

105
Table 5.2 Coding scheme used in Noldus Observer
Participants
Behaviours (mutually exclusive,
exhaustive) Modifiers
• Ruth Talk/Play
• Paul • Talk (initial)
• William • Play • Full run, Intended (FRI)
• Angie • Run, Not intended (RNI)
• Kai-Li • Section, Intended (SI)
• Manny • Section, Not intended
(SNI)
• Player
alone/Demonstration
Looking
• Music (initial)
• Partner • Gaze
• Glance
Gesture
• Still (initial)
• Gesture • Beating
• Demonstrator
• Emblem / Sign
• Illustrator
• Shaping
2. Non-verbal communication: Speech gestures
The initial state of Gesture was Still. When participants moved their arms or hands to
illustrate or help express the meaning of talk, their movements were coded in Noldus
Observer as Gestures, modified as shown in Table 5.2 as either Emblems or Illustrators.
Emblems (or signs) were gestures that conveyed explicit, culturally-embedded, referential
meaning (such as the ‘thumbs-up’ gesture) including signs borrowed from BSL. (According
to Ekman & Friesen, 1969, emblems are non-verbal cues carrying signification, whether or
not they accompany speech, so the speech gestures coded as emblems in the present study
represent only a subset of emblems according to Ekman & Friesen’s taxonomy of gesture).
Expressive gestures carrying no explicit referential meaning were coded as Illustrators and
were, if possible, coded as one of three further sub-categories. Thus, any gesture indicating
the temporal aspect of music was categorized as Beating, in line with King and Ginsborg
(2011); those accompanying functional descriptions such as requests for physical cues (e.g.
‘You could help by moving a little bit more’) were categorized as Demonstrators; gestures
drawing on familiar cross-modal mappings (e.g. height to pitch, size to loudness) were
categorised as Shaping. In order to map the location and type of speech gesture to each
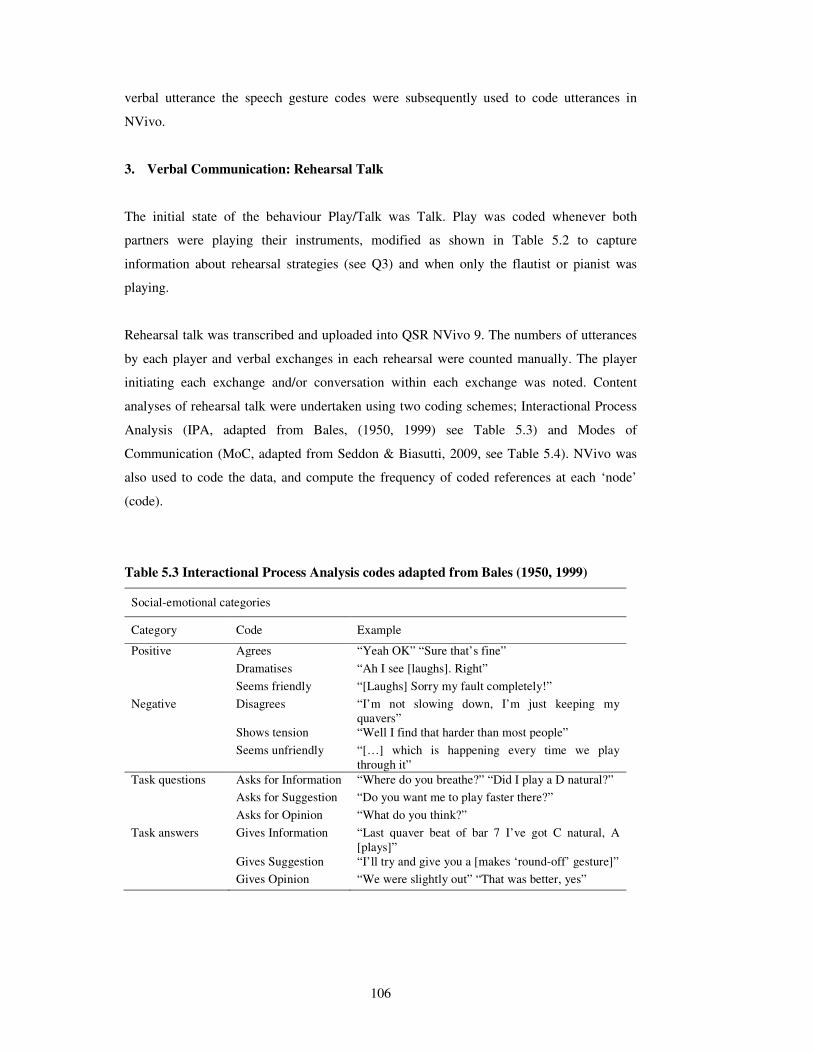
106
verbal utterance the speech gesture codes were subsequently used to code utterances in
NVivo.
3. Verbal Communication: Rehearsal Talk
The initial state of the behaviour Play/Talk was Talk. Play was coded whenever both
partners were playing their instruments, modified as shown in Table 5.2 to capture
information about rehearsal strategies (see Q3) and when only the flautist or pianist was
playing.
Rehearsal talk was transcribed and uploaded into QSR NVivo 9. The numbers of utterances
by each player and verbal exchanges in each rehearsal were counted manually. The player
initiating each exchange and/or conversation within each exchange was noted. Content
analyses of rehearsal talk were undertaken using two coding schemes; Interactional Process
Analysis (IPA, adapted from Bales, (1950, 1999) see Table 5.3) and Modes of
Communication (MoC, adapted from Seddon & Biasutti, 2009, see Table 5.4). NVivo was
also used to code the data, and compute the frequency of coded references at each ‘node’
(code).
Table 5.3 Interactional Process Analysis codes adapted from Bales (1950, 1999)
Social-emotional categories
Category Code Example
Positive Agrees “Yeah OK” “Sure that’s fine”
Dramatises “Ah I see [laughs]. Right”
Seems friendly “[Laughs] Sorry my fault completely!”
Negative Disagrees “I’m not slowing down, I’m just keeping my
quavers”
Shows tension “Well I find that harder than most people”
Seems unfriendly “[…] which is happening every time we play
through it”
Task questions Asks for Information “Where do you breathe?” “Did I play a D natural?”
Asks for Suggestion “Do you want me to play faster there?”
Asks for Opinion “What do you think?”
Task answers Gives Information “Last quaver beat of bar 7 I’ve got C natural, A
[plays]”
Gives Suggestion “I’ll try and give you a [makes ‘round-off’ gesture]”
Gives Opinion “We were slightly out” “That was better, yes”
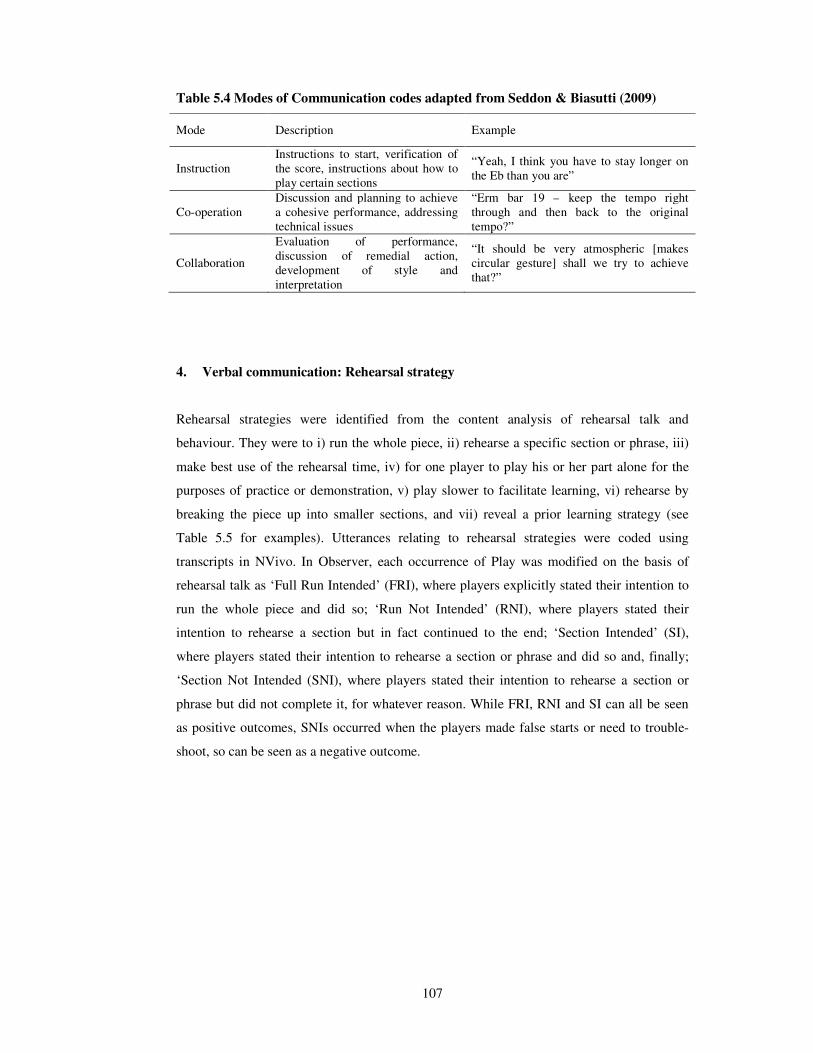
107
Table 5.4 Modes of Communication codes adapted from Seddon & Biasutti (2009)
Mode Description Example
Instruction
Instructions to start, verification of
the score, instructions about how to
play certain sections
“Yeah, I think you have to stay longer on
the Eb than you are”
Co-operation
Discussion and planning to achieve
a cohesive performance, addressing
technical issues
“Erm bar 19 – keep the tempo right
through and then back to the original
tempo?”
Collaboration
Evaluation of performance,
discussion of remedial action,
development of style and
interpretation
“It should be very atmospheric [makes
circular gesture] shall we try to achieve
that?”
4. Verbal communication: Rehearsal strategy
Rehearsal strategies were identified from the content analysis of rehearsal talk and
behaviour. They were to i) run the whole piece, ii) rehearse a specific section or phrase, iii)
make best use of the rehearsal time, iv) for one player to play his or her part alone for the
purposes of practice or demonstration, v) play slower to facilitate learning, vi) rehearse by
breaking the piece up into smaller sections, and vii) reveal a prior learning strategy (see
Table 5.5 for examples). Utterances relating to rehearsal strategies were coded using
transcripts in NVivo. In Observer, each occurrence of Play was modified on the basis of
rehearsal talk as ‘Full Run Intended’ (FRI), where players explicitly stated their intention to
run the whole piece and did so; ‘Run Not Intended’ (RNI), where players stated their
intention to rehearse a section but in fact continued to the end; ‘Section Intended’ (SI),
where players stated their intention to rehearse a section or phrase and did so and, finally;
‘Section Not Intended (SNI), where players stated their intention to rehearse a section or
phrase but did not complete it, for whatever reason. While FRI, RNI and SI can all be seen
as positive outcomes, SNIs occurred when the players made false starts or need to trouble-
shoot, so can be seen as a negative outcome.
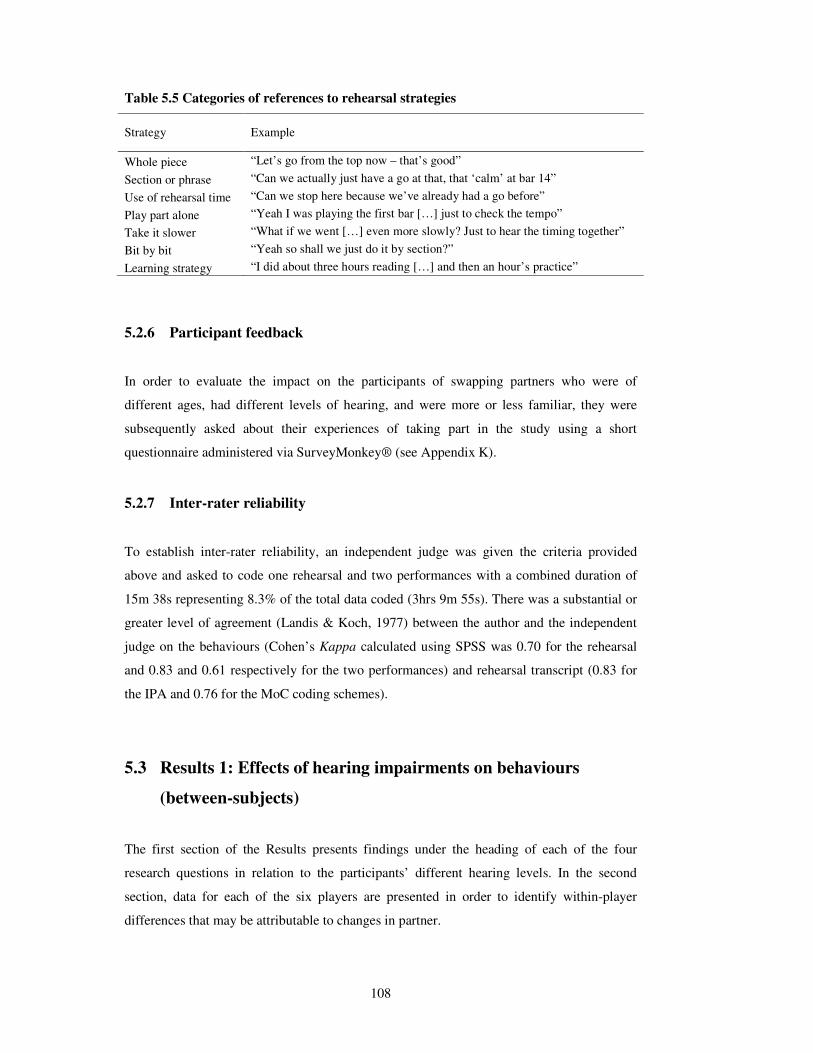
108
Table 5.5 Categories of references to rehearsal strategies
Strategy Example
Whole piece “Let’s go from the top now – that’s good”
Section or phrase “Can we actually just have a go at that, that ‘calm’ at bar 14”
Use of rehearsal time “Can we stop here because we’ve already had a go before”
Play part alone “Yeah I was playing the first bar […] just to check the tempo”
Take it slower “What if we went […] even more slowly? Just to hear the timing together”
Bit by bit “Yeah so shall we just do it by section?”
Learning strategy “I did about three hours reading […] and then an hour’s practice”
5.2.6 Participant feedback
In order to evaluate the impact on the participants of swapping partners who were of
different ages, had different levels of hearing, and were more or less familiar, they were
subsequently asked about their experiences of taking part in the study using a short
questionnaire administered via SurveyMonkey® (see Appendix K).
5.2.7 Inter-rater reliability
To establish inter-rater reliability, an independent judge was given the criteria provided
above and asked to code one rehearsal and two performances with a combined duration of
15m 38s representing 8.3% of the total data coded (3hrs 9m 55s). There was a substantial or
greater level of agreement (Landis & Koch, 1977) between the author and the independent
judge on the behaviours (Cohen’s Kappa calculated using SPSS was 0.70 for the rehearsal
and 0.83 and 0.61 respectively for the two performances) and rehearsal transcript (0.83 for
the IPA and 0.76 for the MoC coding schemes).
5.3 Results 1: Effects of hearing impairments on behaviours
(between-subjects)
The first section of the Results presents findings under the heading of each of the four
research questions in relation to the participants’ different hearing levels. In the second
section, data for each of the six players are presented in order to identify within-player
differences that may be attributable to changes in partner.
109
One-way ANOVAs were performed on all dependent variables (DVs) grouped by the
hearing level first of the player and second of the partner (three groups: profoundly deaf,
moderately deaf and hearing). Effect sizes were calculated using Omega squared. Post-hoc
comparisons were made using Tukey’s HSD. Where data were not normally distributed,
Kruskal-Wallis tests were used and post-hoc comparisons made using a maximum of two
Mann-Whitney tests with Bonferroni corrections. Only the results of post-hoc tests
significant at p < .05 are reported.
5.3.1 Non-verbal communication: Looking behaviour
The musicians with hearing impairments were Ruth and Paul (profoundly deaf) and William
and Angie (mild or moderately deaf); those with typical hearing were Manny and Kai-Li.
Looking behaviour consisted of events that were coded from the moment a player looked up
from their music towards their co-performer until the moment they looked back towards the
music. Event frequencies were used to compute rates per minute and event durations were
used to calculate the percentage of time spent looking (duration of looking divided by total
playing time) using ‘corrected’ durations (mean playing time multiplied by percentage
looking). Looking events were coded intuitively as glances and gazes. Analysis of the length
of glances and gazes across all 56 rehearsals and performances showed that the difference
between them was statistically significant (z = -5.76, p < .001, r = -.86, glances: mean = 0.86
s; gazes: mean = 2.14 s), confirming the initial distinction made subjectively between them.
1a. Do musicians with hearing impairments rely more than musicians with typical
hearing on visually perceived physical cues from co-performers, evidenced by
increased looking behaviour and if so, to what extent?
The results of Kruskal-Wallis tests are shown in Table 5.6 below. Profoundly deaf musicians
spent a significantly higher proportion of time looking towards their partners than
moderately deaf and hearing players and their rate of looking (frequency per minute) was
also significantly higher. A reciprocal effect was found such that players looked for longer,
and more frequently, with profoundly deaf partners than moderately deaf or hearing
partners. Jonckheere’s Trend tests showed that the two hearing players (Kai-Li and Manny)
looked more often the greater their partners’ hearing loss (J = 54, z = -2.22, p = .026, r = -
.30).
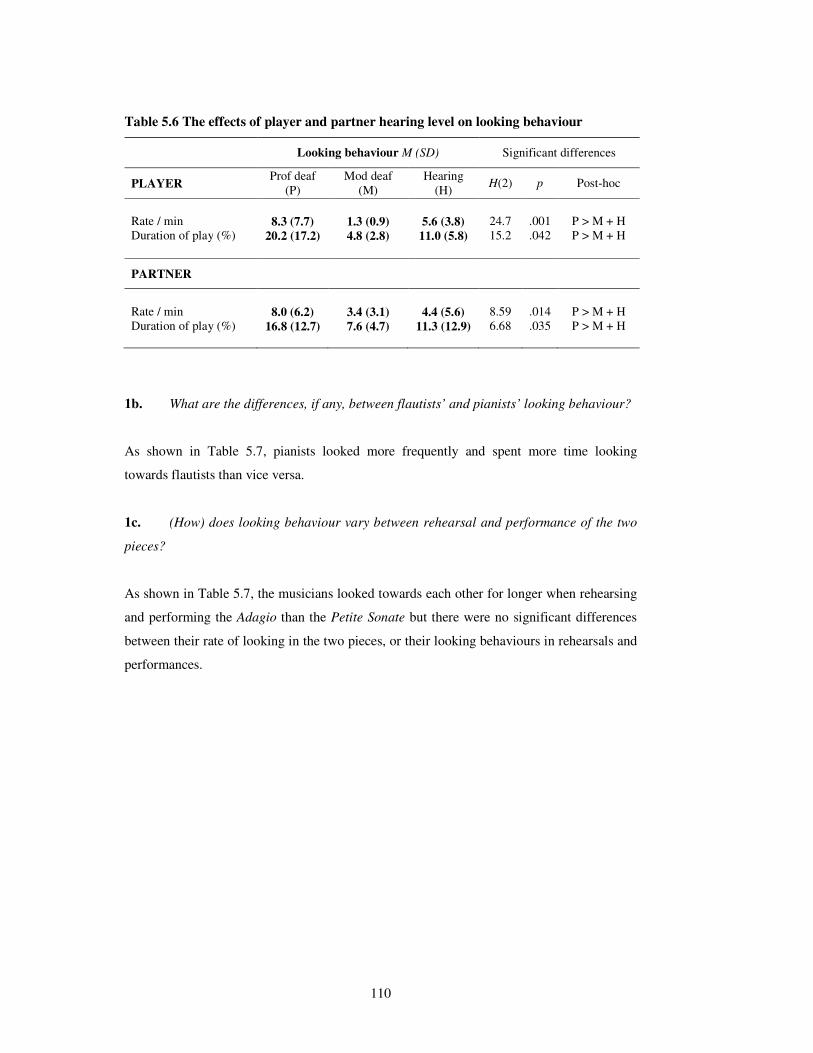
110
Table 5.6 The effects of player and partner hearing level on looking behaviour
Looking behaviour M (SD) Significant differences
PLAYER Prof deaf
(P)
Mod deaf
(M)
Hearing
(H) H(2) p Post-hoc
Rate / min 8.3 (7.7) 1.3 (0.9) 5.6 (3.8) 24.7 .001 P > M + H
Duration of play (%) 20.2 (17.2) 4.8 (2.8) 11.0 (5.8) 15.2 .042 P > M + H
PARTNER
Rate / min 8.0 (6.2) 3.4 (3.1) 4.4 (5.6) 8.59 .014 P > M + H
Duration of play (%) 16.8 (12.7) 7.6 (4.7) 11.3 (12.9) 6.68 .035 P > M + H
1b. What are the differences, if any, between flautists’ and pianists’ looking behaviour?
As shown in Table 5.7, pianists looked more frequently and spent more time looking
towards flautists than vice versa.
1c. (How) does looking behaviour vary between rehearsal and performance of the two
pieces?
As shown in Table 5.7, the musicians looked towards each other for longer when rehearsing
and performing the Adagio than the Petite Sonate but there were no significant differences
between their rate of looking in the two pieces, or their looking behaviours in rehearsals and
performances.

111
Table 5.7 The effects of player role, performance context and piece on looking
behaviour
Looking behaviour
MD (range) Significant differences
ROLE Flute Piano U (r) p
Rate / min 1.9 (7.2) 6.2 (20.8) U = 644.0, r = .55 .001
Duration of play (%) 5.6 (16.5) 11.7 (46.7) U = 647.0, r = .56 .001
CONTEXT Rehearsal Performance
Rate / min 3.3 (19.2) 2.9 (21.0) U = 346.5 .456
Duration of play (%) 9.0 (49.0) 7.2 (44.2) U = 355.0 .544
PIECE Adagio Petite Sonate
Rate / min 3.3 (20.8) 3.0 (10.1) U = 323.5 .262
Duration of play (%) 9.6 (47.7) 7.2 (28.4) U = 266.0, r = .28 .039
5.3.2 Non-verbal communication: Speech gestures
2a. What kinds of gestures are used in rehearsal talk?
One hundred and sixty-two gestures were observed in a total of two hours and 23 minutes of
talk during rehearsals, representing a frequency of 1.13 gestures per minute. Table 5.8
displays the frequencies of gestures in each category. Of the Illustrators, produced most
often, 38% were coded into sub-categories using functional descriptors and 14% were
identified as Emblems.
Table 5.8 Frequency of gestures by Modes of Communication (Seddon & Biasutti,
2009)
Emblems Illustrators:
Total
Beating Demonstrators Shaping
Instruction
Co-operation
Collaboration
Total
4
13
3
20
3
63
37
103
0
12
1
13
0
8
1
9
0
5
12
17
7
101
54
162
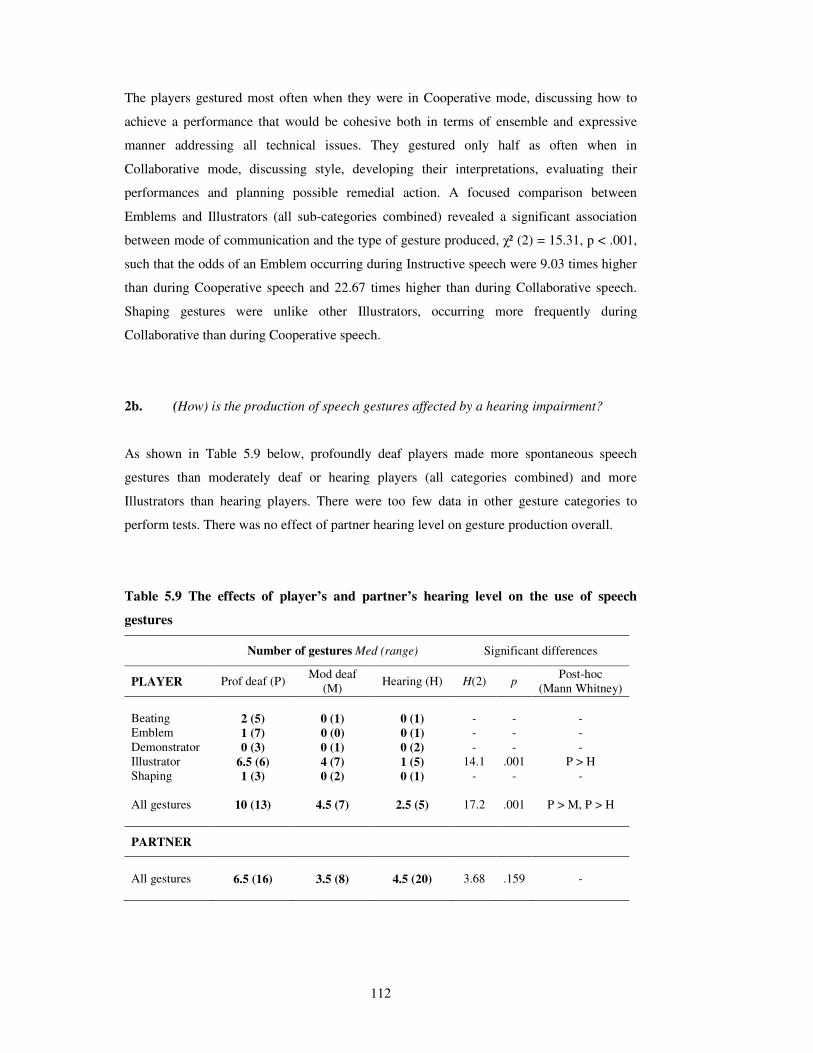
112
The players gestured most often when they were in Cooperative mode, discussing how to
achieve a performance that would be cohesive both in terms of ensemble and expressive
manner addressing all technical issues. They gestured only half as often when in
Collaborative mode, discussing style, developing their interpretations, evaluating their
performances and planning possible remedial action. A focused comparison between
Emblems and Illustrators (all sub-categories combined) revealed a significant association
between mode of communication and the type of gesture produced, χ² (2) = 15.31, p < .001,
such that the odds of an Emblem occurring during Instructive speech were 9.03 times higher
than during Cooperative speech and 22.67 times higher than during Collaborative speech.
Shaping gestures were unlike other Illustrators, occurring more frequently during
Collaborative than during Cooperative speech.
2b. (How) is the production of speech gestures affected by a hearing impairment?
As shown in Table 5.9 below, profoundly deaf players made more spontaneous speech
gestures than moderately deaf or hearing players (all categories combined) and more
Illustrators than hearing players. There were too few data in other gesture categories to
perform tests. There was no effect of partner hearing level on gesture production overall.
Table 5.9 The effects of player’s and partner’s hearing level on the use of speech
gestures
Number of gestures Med (range) Significant differences
PLAYER Prof deaf (P) Mod deaf
(M) Hearing (H) H(2) p
Post-hoc
(Mann Whitney)
Beating 2 (5) 0 (1) 0 (1) - - -
Emblem 1 (7) 0 (0) 0 (1) - - -
Demonstrator 0 (3) 0 (1) 0 (2) - - -
Illustrator 6.5 (6) 4 (7) 1 (5) 14.1 .001 P > H
Shaping 1 (3) 0 (2) 0 (1) - - -
All gestures 10 (13) 4.5 (7) 2.5 (5) 17.2 .001 P > M, P > H
PARTNER
All gestures 6.5 (16) 3.5 (8) 4.5 (20) 3.68 .159 -
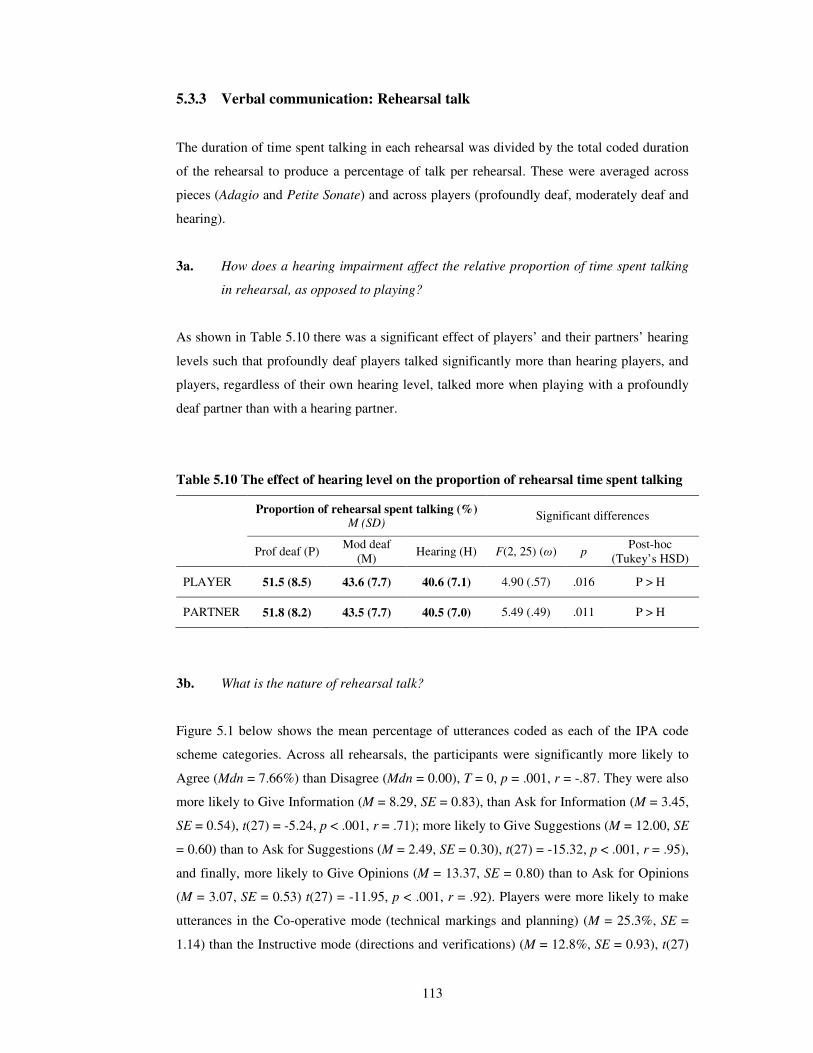
113
5.3.3 Verbal communication: Rehearsal talk
The duration of time spent talking in each rehearsal was divided by the total coded duration
of the rehearsal to produce a percentage of talk per rehearsal. These were averaged across
pieces (Adagio and Petite Sonate) and across players (profoundly deaf, moderately deaf and
hearing).
3a. How does a hearing impairment affect the relative proportion of time spent talking
in rehearsal, as opposed to playing?
As shown in Table 5.10 there was a significant effect of players’ and their partners’ hearing
levels such that profoundly deaf players talked significantly more than hearing players, and
players, regardless of their own hearing level, talked more when playing with a profoundly
deaf partner than with a hearing partner.
Table 5.10 The effect of hearing level on the proportion of rehearsal time spent talking
Proportion of rehearsal spent talking (%) M (SD)
Significant differences
Prof deaf (P) Mod deaf
(M) Hearing (H) F(2, 25) (ω) p
Post-hoc
(Tukey’s HSD)
PLAYER 51.5 (8.5) 43.6 (7.7) 40.6 (7.1) 4.90 (.57) .016 P > H
PARTNER 51.8 (8.2) 43.5 (7.7) 40.5 (7.0) 5.49 (.49) .011 P > H
3b. What is the nature of rehearsal talk?
Figure 5.1 below shows the mean percentage of utterances coded as each of the IPA code
scheme categories. Across all rehearsals, the participants were significantly more likely to
Agree (Mdn = 7.66%) than Disagree (Mdn = 0.00), T = 0, p = .001, r = -.87. They were also
more likely to Give Information (M = 8.29, SE = 0.83), than Ask for Information (M = 3.45,
SE = 0.54), t(27) = -5.24, p < .001, r = .71); more likely to Give Suggestions (M = 12.00, SE
= 0.60) than to Ask for Suggestions (M = 2.49, SE = 0.30), t(27) = -15.32, p < .001, r = .95),
and finally, more likely to Give Opinions (M = 13.37, SE = 0.80) than to Ask for Opinions
(M = 3.07, SE = 0.53) t(27) = -11.95, p < .001, r = .92). Players were more likely to make
utterances in the Co-operative mode (technical markings and planning) (M = 25.3%, SE =
1.14) than the Instructive mode (directions and verifications) (M = 12.8%, SE = 0.93), t(27)
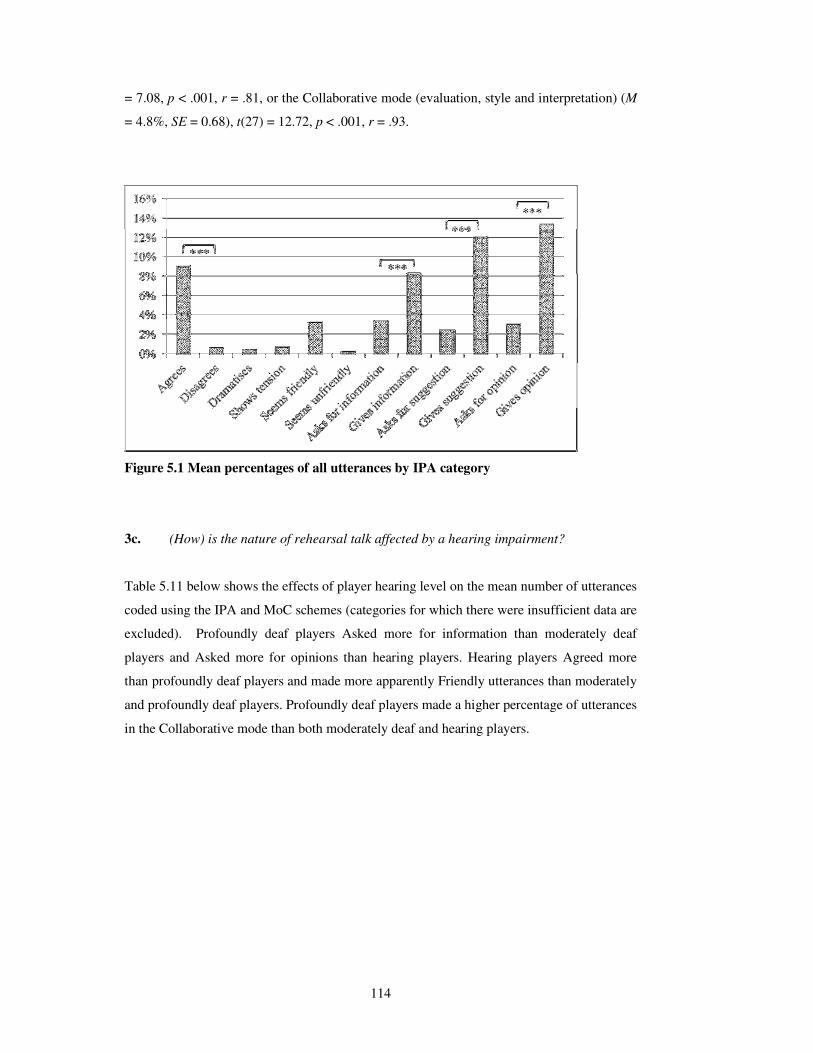
114
= 7.08, p < .001, r = .81, or the Collaborative mode (evaluation, style and interpretation) (M
= 4.8%, SE = 0.68), t(27) = 12.72, p < .001, r = .93.
Figure 5.1 Mean percentages of all utterances by IPA category
3c. (How) is the nature of rehearsal talk affected by a hearing impairment?
Table 5.11 below shows the effects of player hearing level on the mean number of utterances
coded using the IPA and MoC schemes (categories for which there were insufficient data are
excluded). Profoundly deaf players Asked more for information than moderately deaf
players and Asked more for opinions than hearing players. Hearing players Agreed more
than profoundly deaf players and made more apparently Friendly utterances than moderately
and profoundly deaf players. Profoundly deaf players made a higher percentage of utterances
in the Collaborative mode than both moderately deaf and hearing players.

115
Table 5.11 The effects of player’s hearing level on the proportion and content of
rehearsal talk
Percentage of utterances M (SD) Significant differences
Prof deaf
(P)
Mod deaf
(M)
Hearing
(H)
F(2, 25)
(ω) p
Post-hoc
(Tukey’s
HSD)
IPA
Agrees 9.5 (3.0) 14.9 (6.1) 20.8 (7.0) 4.90 (.37) .001 P < H
Seems friendly 3.8 (1.4) 2.1 (3.0) 9.1 (4.9) 9.11 (.39) .001 P < H, M < H
Asks for information 9.5 (4.3) 3.8 (3.3) 5.1 (5.6) 3.30 (.14) .054 P > M
Asks for suggestion 3.4 (2.6) 6.3 (3.0) 3.7 (2.1) - - -
Asks for opinion 8.4 (5.8) 6.5 (4.6) 2.6 (2.9) 4.59 (.20) .020 P > H
Gives information 18.3 (4.9) 15.0 (7.6) 11.4 (8.1) - - -
Gives suggestion 17.0 (5.7) 23.1 (2.9) 22.3 (5.4) - - -
Gives opinion 25.1 (6.8) 23.6 (7.6) 22.5 (9.1) - - -
MoC
Instruction 24.2 (6.9) 32.9 (10.5) 31.4 (12.6) - - -
Cooperation 56.5 (9.6) 62.0 (8.8) 57.9 (15.1) - - -
Collaboration 19.3 (9.0) 5.1 (5.9) 10.7 (5.9) 8.68 (.35) .001 P > M, P > H
5.3.4 Verbal communication: Rehearsal strategy
4a. What rehearsal strategies do players suggest and use?
As shown in Figure 5.2 below, the participants were significantly more likely to suggest
rehearsing a specific section or phrase (M = 7.54, SE = 0.74) than running the whole piece
(M = 2.23, SE = 0.44), t(27) = 5.50, p < .001, r = .53) or using any other method categorised,
separately or in combination with all others (M = 1.33, SE = 0.30), t(27) = 7.24, p < .001, r =
.66.
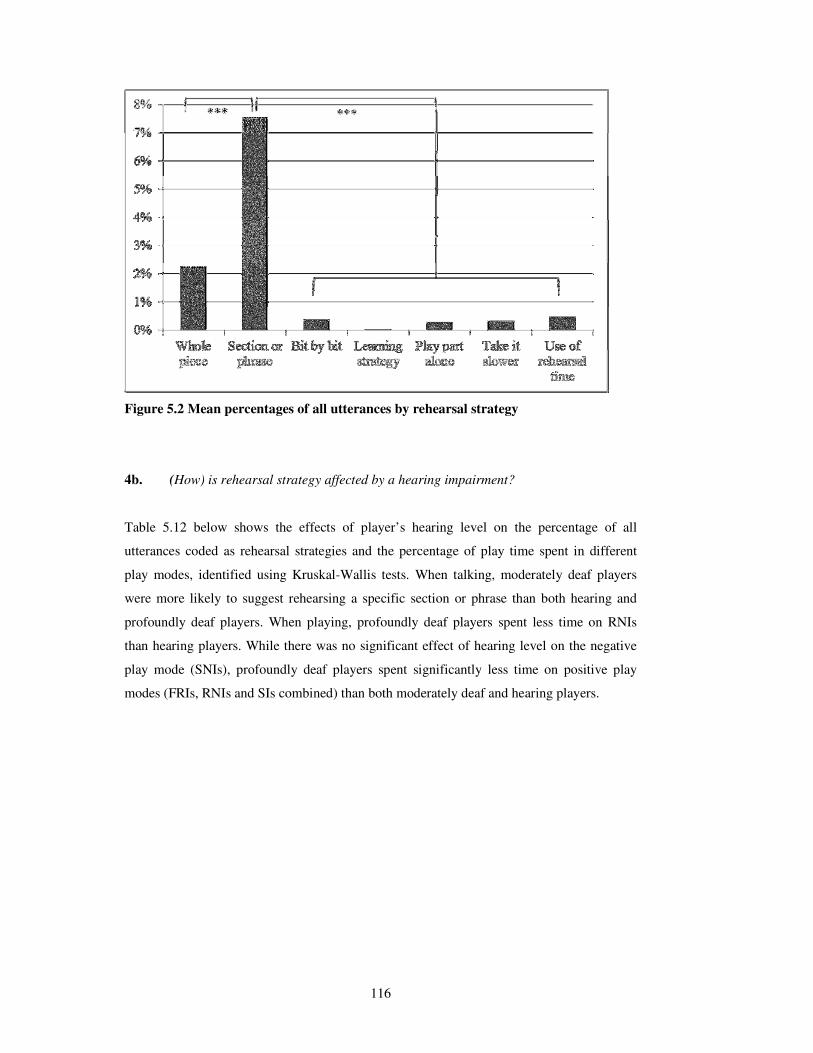
116
Figure 5.2 Mean percentages of all utterances by rehearsal strategy
4b. (How) is rehearsal strategy affected by a hearing impairment?
Table 5.12 below shows the effects of player’s hearing level on the percentage of all
utterances coded as rehearsal strategies and the percentage of play time spent in different
play modes, identified using Kruskal-Wallis tests. When talking, moderately deaf players
were more likely to suggest rehearsing a specific section or phrase than both hearing and
profoundly deaf players. When playing, profoundly deaf players spent less time on RNIs
than hearing players. While there was no significant effect of hearing level on the negative
play mode (SNIs), profoundly deaf players spent significantly less time on positive play
modes (FRIs, RNIs and SIs combined) than both moderately deaf and hearing players.
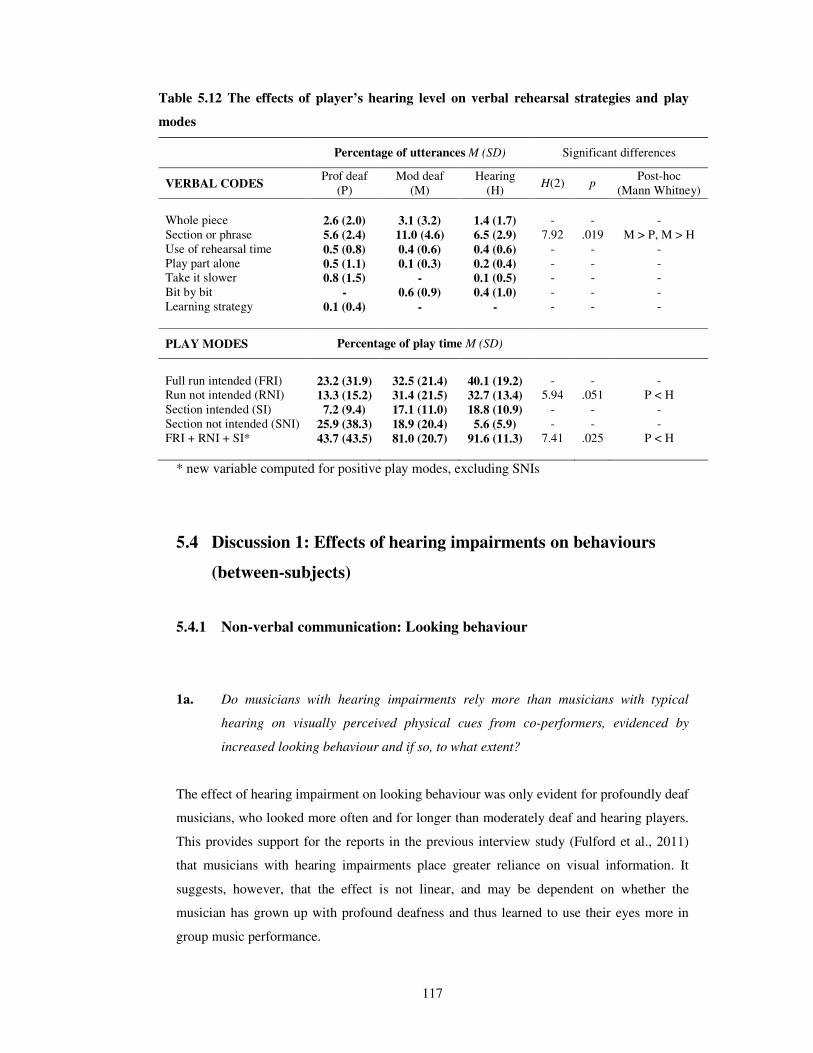
117
Table 5.12 The effects of player’s hearing level on verbal rehearsal strategies and play
modes
Percentage of utterances M (SD) Significant differences
VERBAL CODES Prof deaf
(P)
Mod deaf
(M)
Hearing
(H) H(2) p
Post-hoc
(Mann Whitney)
Whole piece 2.6 (2.0) 3.1 (3.2) 1.4 (1.7) - - -
Section or phrase 5.6 (2.4) 11.0 (4.6) 6.5 (2.9) 7.92 .019 M > P, M > H
Use of rehearsal time 0.5 (0.8) 0.4 (0.6) 0.4 (0.6) - - -
Play part alone 0.5 (1.1) 0.1 (0.3) 0.2 (0.4) - - -
Take it slower 0.8 (1.5) - 0.1 (0.5) - - -
Bit by bit - 0.6 (0.9) 0.4 (1.0) - - -
Learning strategy 0.1 (0.4) - - - - -
PLAY MODES Percentage of play time M (SD)
Full run intended (FRI) 23.2 (31.9) 32.5 (21.4) 40.1 (19.2) - - -
Run not intended (RNI) 13.3 (15.2) 31.4 (21.5) 32.7 (13.4) 5.94 .051 P < H
Section intended (SI) 7.2 (9.4) 17.1 (11.0) 18.8 (10.9) - - -
Section not intended (SNI) 25.9 (38.3) 18.9 (20.4) 5.6 (5.9) - - -
FRI + RNI + SI* 43.7 (43.5) 81.0 (20.7) 91.6 (11.3) 7.41 .025 P < H
* new variable computed for positive play modes, excluding SNIs
5.4 Discussion 1: Effects of hearing impairments on behaviours
(between-subjects)
5.4.1 Non-verbal communication: Looking behaviour
1a. Do musicians with hearing impairments rely more than musicians with typical
hearing on visually perceived physical cues from co-performers, evidenced by
increased looking behaviour and if so, to what extent?
The effect of hearing impairment on looking behaviour was only evident for profoundly deaf
musicians, who looked more often and for longer than moderately deaf and hearing players.
This provides support for the reports in the previous interview study (Fulford et al., 2011)
that musicians with hearing impairments place greater reliance on visual information. It
suggests, however, that the effect is not linear, and may be dependent on whether the
musician has grown up with profound deafness and thus learned to use their eyes more in
group music performance.

118
The hearing players, Kai-Li and Manny, were found to look more towards their partner, the
greater the level of their hearing impairment. This tendency suggests that the perceived
needs of the co-performer elicited a conscious, empathetic response from the hearing
players. It seems also that this trend was not simply a mirroring of the increased looking
behaviour of their partners, for this was not always the case. For example, when rehearsing
together, Kai-Li’s looking behaviour was more active than Angie’s, going against the trends
for hearing players and flautists to look less than deaf players and pianists. However, the
needs or moods of the players within the duos may have also mediated these altruistic
responses (see 5.6.7).
1b. What are the differences, if any, between flautists’ and pianists’ looking behaviour?
The pianists in the study were found to look significantly more often and for longer than
flautists. The Bach Adagio was essentially for solo flute with piano accompaniment while
the Petite Sonate was for more equal partners. Regardless, the present result suggests that
the typical relationship between players was that of ‘leader-follower’, where the flute took
the lead and the piano followed, as exemplified by looking behaviour. Players were found to
look for longer in the Adagio than the Petite Sonate, probably because the Petite Sonate was
harder. They therefore had to spend more time looking at the score to ensure accuracy thus
reducing their opportunities to look towards their partners. This difference was more marked
in pianists than flautists.
1c. (How) does looking behaviour vary between rehearsal and performance?
No significant difference was found between the rates or durations of looking behaviour in
rehearsals and performances.
5.4.2 Non-verbal communication: Speech gestures
2a. What kinds of gestures are used in rehearsal talk?
The prevalence of Illustrators over Emblems observed in the rehearsals that were analysed
suggests that, unlike conductors, players do not use a common repertoire of gestures (Boyes
Braem & Bräm, 2000). Although fewer in number, Emblems tended to be either universal,
such as thumbs-up or OK gestures, or BSL signs for bar numbers, which is consistent with
119
their significant association with the Instructive communication mode. It is likely that the
profoundly deaf musicians produced more gestures than the moderately deaf or hearing
musicians because they were accustomed to communicating through BSL. The majority of
Illustrative speech gestures could not be further classified as either Shaping, Beating or
Demonstrators and were polysemous in that their meaning and form depended on musical
and verbal contexts. Their prevalence during Cooperative speech suggests Illustrative
gestures were best suited to supporting the communication of ideas about phrasing,
dynamics and tempo. In contrast, Shaping gestures, which were produced most often in the
Collaborative mode, may be better suited to illustrating more abstract concepts of style and
interpretation. It has been proposed that illustrative gestures in music be termed ‘Musical
Shaping Gestures’ and, while a full discussion of their forms and functions is outside the
remit of this thesis, the present data has been used as a basis for a paper submitted for
publication (Fulford & Ginsborg, 2014, in press).
2b. (How) is the production of speech gestures affected by a hearing impairment?
Profoundly deaf players made more gestures than moderately deaf players, who made more
than hearing players. This may be explained partially by the fluency in BSL of the
profoundly deaf players, Paul and Ruth, who produced the most gestures in all categories,
including Emblems. More of the moderately deaf players’ gestures were made by Angie
than William. There was also a significant effect of partner’s hearing level for hearing
players such that they adapted their behaviour for the benefit of their partners not only by
looking more but also by making more gestures the greater the level of their partner’s
hearing impairment.
5.4.3 Verbal communication: Rehearsal talk
3a. How does a hearing impairment affect the relative proportions of time spent playing
and talking in rehearsal?
Profoundly deaf players were found to spend a higher proportion of rehearsal time talking
than hearing players. One possible reason for this is that profoundly deaf musicians need to
articulate in advance the technical aspects of the performance involving ensemble
coordination, such as tempo and rubato. As was found for looking behaviour however, there
was no significant trend for participants with greater degrees of hearing loss to talk more
than those with less or no hearing loss.
120
There was, however, a strong effect of partner’s hearing level on the proportion of rehearsal
time spent talking such that there was more talking the greater the level of the partner’s
hearing loss. This may simply be a reciprocal effect: if one player talks more it is likely that
the other will have to respond more. However, it may also indicate empathetic behaviour if
the musician with less or no hearing loss recognises the partner’s need to plan the
performance.
3b. What is the nature of rehearsal talk?
As coded using IPA, players Agreed more than they Disagreed. More utterances were coded
as Giving Information / Suggestion / Opinion than Asking for Information / Suggestion /
Opinion. It is likely that task answers simply tend to require more utterances than task
questions as it takes longer to answer questions than to ask them. Furthermore, it has been
previously identified that Gives Opinion is the most frequently used code of the IPA code
scheme (Allen, Comerford, & Ruhe, 1989). The high proportion of utterances assigned to
this code in the present study reflects this.
Using MoC, more utterances were coded in the Co-operative mode than the Instructive or
Collaborative modes indicating that more talk was devoted to resolving issues of ensemble
synchrony, dynamics and phrasing than either verifying the score (Instructive) or discussing
the interpretation or stylistic aspects of the music (Collaboration), probably because the
players had not performed together before these sessions. Previous research has suggested
that there may be links between expertise and/or familiarity and the increased use of the
Collaborative mode such that less experienced groups spend more time focusing on basic
and technical aspects (Seddon & Biasutti, 2009). The transcripts can be regarded as ‘typical’
rehearsal talk in that they represent the middle-position mode of communication in a
hierarchy in which Instructive is ‘low’ and Collaborative ‘high’.
3c. (How) is the nature of rehearsal talk affected by a hearing impairment?
As we have seen, profoundly deaf players were found to Ask for Information and Ask for
Opinions significantly more than hearing players, with a view to establishing agreement
between players in advance. Topics included the interpretation of tempo markings, tempo
changes and dynamics. It is likely that profound deafness compromises the auditory
feedback available to the player thereby reducing his or her flexibility in performance.
Hearing players were found to Seem Friendly and to Agree more often than profoundly deaf
121
players. This is likely to have a social explanation, rather than one relating to hearing level.
The hearing players in this study were students and somewhat younger than the other
participants and their relative age and unfamiliarity may have resulted in heightened
politeness during these sessions. Participant feedback presented in the next section provides
support for this theory.
Profoundly deaf players were also found to make significantly more utterances in the
Collaborative mode than either moderately deaf or hearing players, talking about musical
style and interpretation. This implies that they were no more or less capable of addressing
stylistic and interpretative aspects of music making and discredits any notion that a hearing
impairment may render players less able to engage with higher-level aspects of music
making. Thus, while the hierarchical nature of Modes of Communication is not contested,
the present evidence suggests that deafness does not negatively affect their use as
inexperience or unfamiliarity might.
5.4.4 Verbal communication: Rehearsal strategy
4a. What rehearsal strategies do players suggest and use?
As in other studies of the processes underlying collaborative rehearsal, participants were
significantly more likely to suggest a particular section or phrase to work on than any other
strategy. All but two of the strategies used in Ginsborg & King’s (2012) study of rehearsal
talk in singer-pianist duos were also found in the present study. The two exceptions were
‘play vocal line and accompaniment’ and ‘play chords under melody line’. There are three
potential explanations: differences between 1) the expertise of the musicians in the two
studies as individuals and in terms of the relative expertise of the two members of each duo;
2) the works rehearsed and performed; 3) the relationships between the two members of
each duo on a spectrum between soloist/accompanist and equal partners.
Playing was divided equally between the four categories Full Run, Intended (FRI), Run, Not
Intended (RNI), Section, Intended (SI) and Section, Not Intended (SNI).
4b. (How) is rehearsal strategy affected by a hearing impairment?
The strategy of suggesting a particular section or phrase to work on was the only one
mentioned sufficiently often for it to be tested for the probability that it was used to different
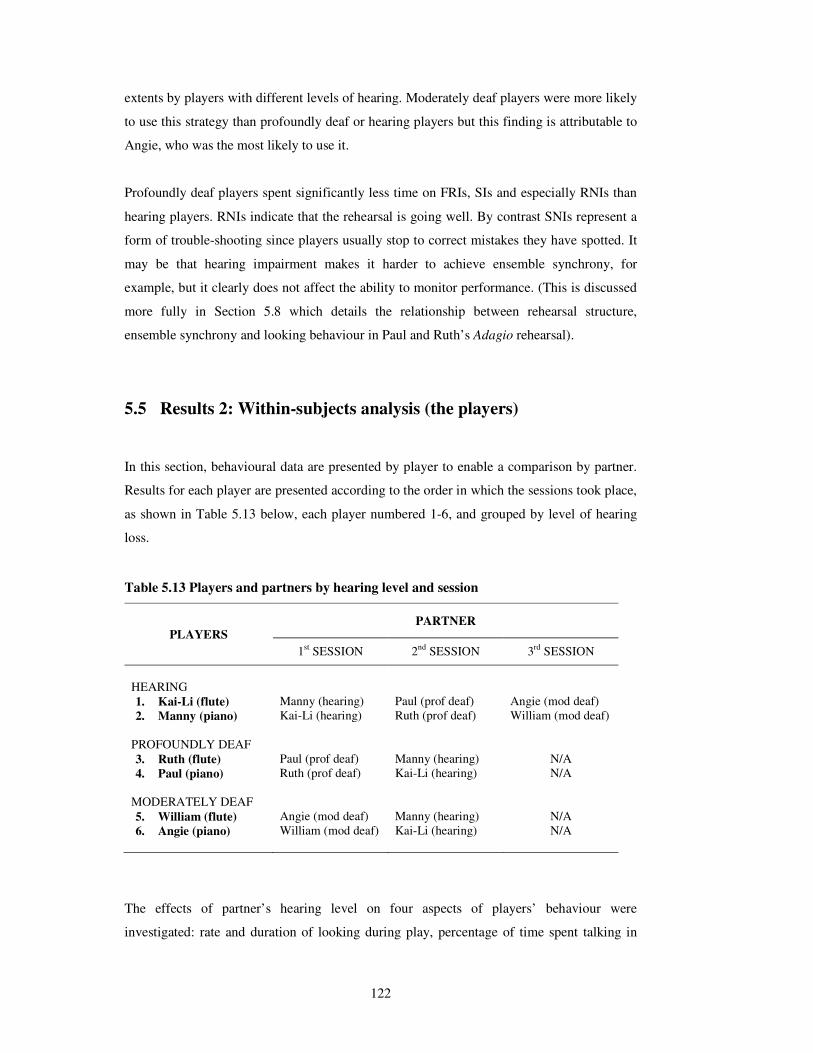
122
extents by players with different levels of hearing. Moderately deaf players were more likely
to use this strategy than profoundly deaf or hearing players but this finding is attributable to
Angie, who was the most likely to use it.
Profoundly deaf players spent significantly less time on FRIs, SIs and especially RNIs than
hearing players. RNIs indicate that the rehearsal is going well. By contrast SNIs represent a
form of trouble-shooting since players usually stop to correct mistakes they have spotted. It
may be that hearing impairment makes it harder to achieve ensemble synchrony, for
example, but it clearly does not affect the ability to monitor performance. (This is discussed
more fully in Section 5.8 which details the relationship between rehearsal structure,
ensemble synchrony and looking behaviour in Paul and Ruth’s Adagio rehearsal).
5.5 Results 2: Within-subjects analysis (the players)
In this section, behavioural data are presented by player to enable a comparison by partner.
Results for each player are presented according to the order in which the sessions took place,
as shown in Table 5.13 below, each player numbered 1-6, and grouped by level of hearing
loss.
Table 5.13 Players and partners by hearing level and session
PLAYERS PARTNER
1st SESSION 2
nd SESSION 3
rd SESSION
HEARING
1. Kai-Li (flute) Manny (hearing) Paul (prof deaf) Angie (mod deaf)
2. Manny (piano) Kai-Li (hearing) Ruth (prof deaf) William (mod deaf)
PROFOUNDLY DEAF
3. Ruth (flute) Paul (prof deaf) Manny (hearing) N/A
4. Paul (piano) Ruth (prof deaf) Kai-Li (hearing) N/A
MODERATELY DEAF
5. William (flute) Angie (mod deaf) Manny (hearing) N/A
6. Angie (piano) William (mod deaf) Kai-Li (hearing) N/A
The effects of partner’s hearing level on four aspects of players’ behaviour were
investigated: rate and duration of looking during play, percentage of time spent talking in
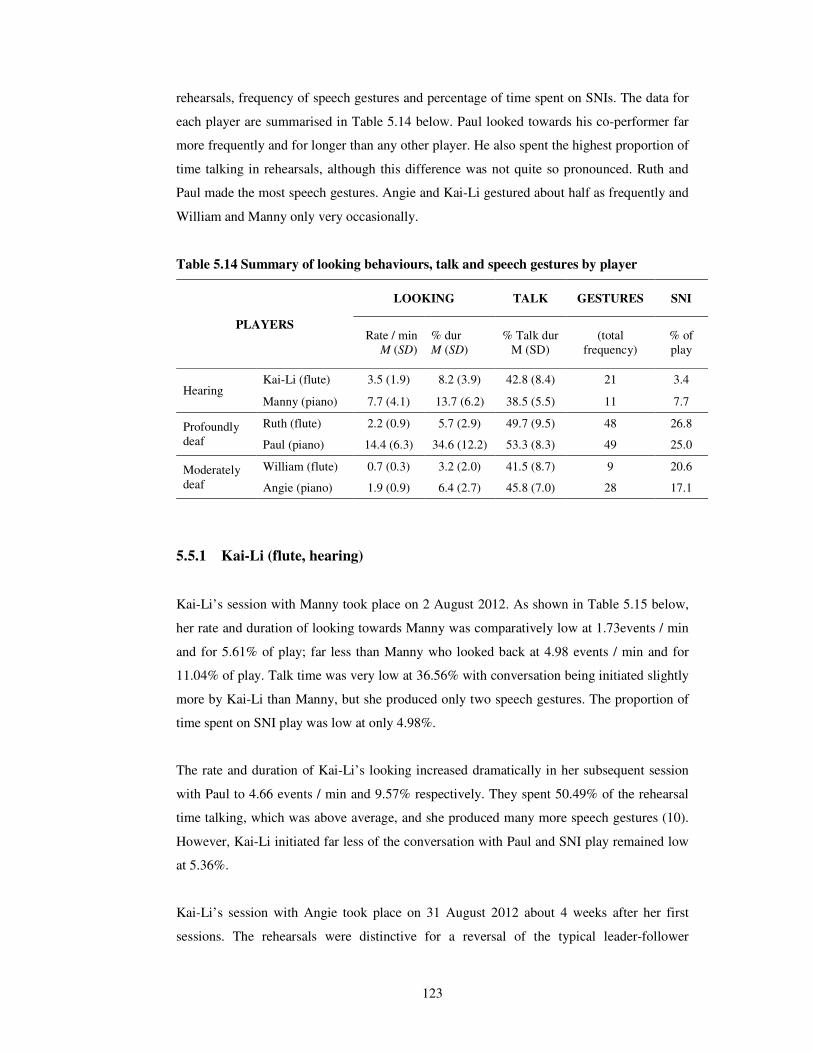
123
rehearsals, frequency of speech gestures and percentage of time spent on SNIs. The data for
each player are summarised in Table 5.14 below. Paul looked towards his co-performer far
more frequently and for longer than any other player. He also spent the highest proportion of
time talking in rehearsals, although this difference was not quite so pronounced. Ruth and
Paul made the most speech gestures. Angie and Kai-Li gestured about half as frequently and
William and Manny only very occasionally.
Table 5.14 Summary of looking behaviours, talk and speech gestures by player
PLAYERS
LOOKING TALK GESTURES SNI
Rate / min
M (SD)
% dur
M (SD)
% Talk dur
M (SD)
(total
frequency)
% of
play
Hearing Kai-Li (flute) 3.5 (1.9) 8.2 (3.9) 42.8 (8.4) 21 3.4
Manny (piano) 7.7 (4.1) 13.7 (6.2) 38.5 (5.5) 11 7.7
Profoundly
deaf
Ruth (flute) 2.2 (0.9) 5.7 (2.9) 49.7 (9.5) 48 26.8
Paul (piano) 14.4 (6.3) 34.6 (12.2) 53.3 (8.3) 49 25.0
Moderately
deaf
William (flute) 0.7 (0.3) 3.2 (2.0) 41.5 (8.7) 9 20.6
Angie (piano) 1.9 (0.9) 6.4 (2.7) 45.8 (7.0) 28 17.1
5.5.1 Kai-Li (flute, hearing)
Kai-Li’s session with Manny took place on 2 August 2012. As shown in Table 5.15 below,
her rate and duration of looking towards Manny was comparatively low at 1.73events / min
and for 5.61% of play; far less than Manny who looked back at 4.98 events / min and for
11.04% of play. Talk time was very low at 36.56% with conversation being initiated slightly
more by Kai-Li than Manny, but she produced only two speech gestures. The proportion of
time spent on SNI play was low at only 4.98%.
The rate and duration of Kai-Li’s looking increased dramatically in her subsequent session
with Paul to 4.66 events / min and 9.57% respectively. They spent 50.49% of the rehearsal
time talking, which was above average, and she produced many more speech gestures (10).
However, Kai-Li initiated far less of the conversation with Paul and SNI play remained low
at 5.36%.
Kai-Li’s session with Angie took place on 31 August 2012 about 4 weeks after her first
sessions. The rehearsals were distinctive for a reversal of the typical leader-follower
124
dynamic whereby Kai-Li looked more frequently and for longer than Angie, at 4.05 events /
min and 9.43% of play, similar to her looking with Paul. The proportion of talk was more
than with Manny but less than with Paul, and below average at only 41.21%, initiated
predominantly by Angie. Kai-Li made nine speech gestures. There was no SNI play at all.
In sum, Kai-Li looked more frequently and for longer during play and talked more in
rehearsal when working with musicians with profound and moderate deafness. A post-hoc
trend test showed that the rate of her looking varied significantly between partners, H(2) =
7.42, p = .024, increasing the greater the level of her partner’s hearing loss, J = 9, z = -2.20,
p = .028, r = -.63 (Jonckheere’s). She also produced more speech gestures with the
musicians with hearing impairments than with Manny.
5.5.2 Manny (piano, hearing)
Manny’s first session with Kai-Li was most notable for the low proportion of talk (36.56%).
The rate of his looking towards Kai-Li (4.98 events / min) was far higher than the rate at
which she looked back, and its duration was twice as long, evidencing a typical leader-
follower dynamic.
Manny’s rate of looking was twice as fast in his subsequent session with Ruth, 10.59 events
/ min and for 17.82% of play, well above average in both cases. As before with Kai-Li, Ruth
did not look back as frequently or for as long. The proportion of talk in rehearsals with Ruth
was higher than with Kai-Li at 44.36%, initiated fairly equally by the two players. As was
the case with Kai-Li, Manny produced more speech gestures with Ruth than with Kai-Li (7
and 3). The proportion of SNI play, 10.69%, was also higher with Ruth.
Manny’s rehearsals with William did not last the full 12 minutes as they both felt the time
was simply not needed. His rate of looking towards William was similar to that with Ruth
(7.5 events / min) and, while representing only 12.38% of play, was close to the average.
William barely looked towards Manny at all, except at the final cadence. The proportion of
talk was even lower than it had been with Kai-Li at only 34.64% (due to the shortened
session) and Manny made just one speech gesture.
In sum, the variations in Manny’s behaviours attributable to the hearing level of his partners
followed a similar pattern to Kai-Li’s: he looked and talked more with profoundly and
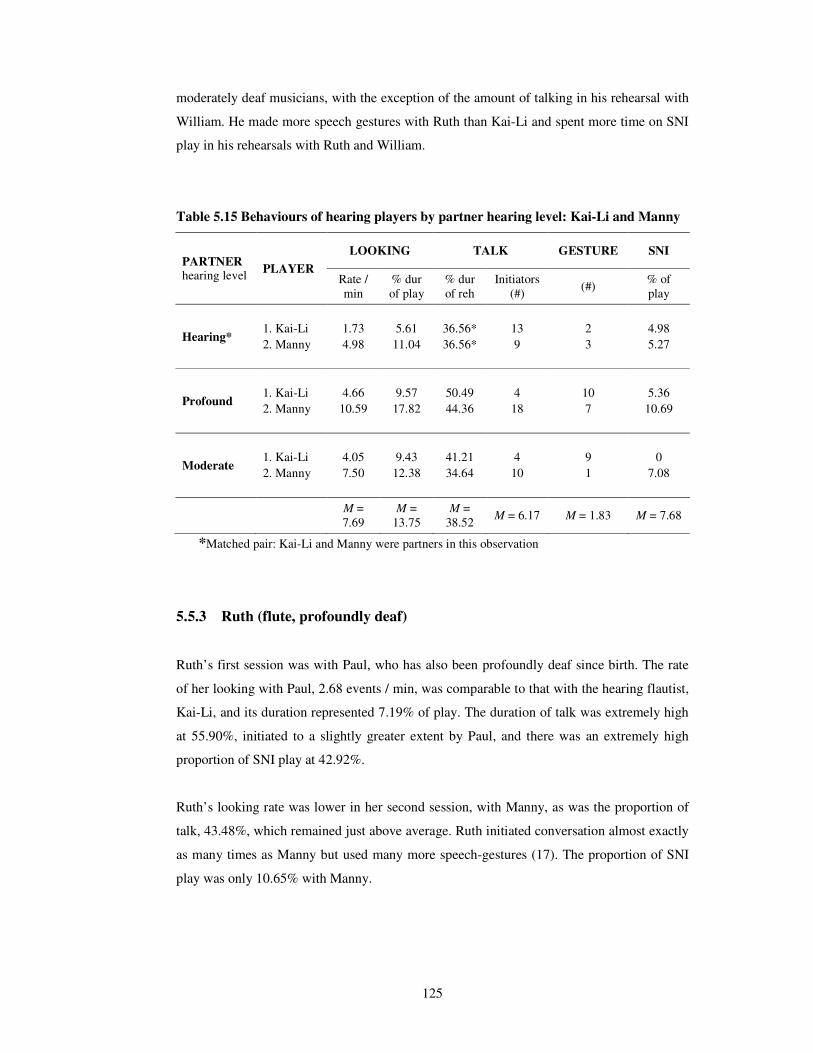
125
moderately deaf musicians, with the exception of the amount of talking in his rehearsal with
William. He made more speech gestures with Ruth than Kai-Li and spent more time on SNI
play in his rehearsals with Ruth and William.
Table 5.15 Behaviours of hearing players by partner hearing level: Kai-Li and Manny
PARTNER hearing level
PLAYER
LOOKING TALK GESTURE SNI
Rate /
min
% dur
of play
% dur
of reh
Initiators
(#) (#)
% of
play
Hearing* 1. Kai-Li 1.73 5.61 36.56* 13 2 4.98
2. Manny 4.98 11.04 36.56* 9 3 5.27
Profound 1. Kai-Li 4.66 9.57 50.49 4 10 5.36
2. Manny 10.59 17.82 44.36 18 7 10.69
Moderate 1. Kai-Li 4.05 9.43 41.21 4 9 0
2. Manny 7.50 12.38 34.64 10 1 7.08
M =
7.69
M =
13.75
M =
38.52 M = 6.17 M = 1.83 M = 7.68
*Matched pair: Kai-Li and Manny were partners in this observation
5.5.3 Ruth (flute, profoundly deaf)
Ruth’s first session was with Paul, who has also been profoundly deaf since birth. The rate
of her looking with Paul, 2.68 events / min, was comparable to that with the hearing flautist,
Kai-Li, and its duration represented 7.19% of play. The duration of talk was extremely high
at 55.90%, initiated to a slightly greater extent by Paul, and there was an extremely high
proportion of SNI play at 42.92%.
Ruth’s looking rate was lower in her second session, with Manny, as was the proportion of
talk, 43.48%, which remained just above average. Ruth initiated conversation almost exactly
as many times as Manny but used many more speech-gestures (17). The proportion of SNI
play was only 10.65% with Manny.

126
5.5.4 Paul (piano, profoundly deaf)
Paul’s first session was with Ruth who is also profoundly deaf. His behaviour was
distinctive from that of the other players in that his rate of looking was well above average:
13.94 events / min for 32.58% of play with Ruth, over 10 times the rate and almost five
times the duration of Ruth’s. Paul’s looking exemplifies what might be considered an
exaggerated form of ‘following’ within the typical leader-follower dynamic of the duos. The
amount of talk was the highest of all the sessions at 56.41%. He also initiated most of the
conversation and made the most speech gestures of all players (33). There was a very high
proportion of SNI play in this session (44.35%).
In his second session, with Kai-Li, Paul’s rate of looking was even higher at 14.94 events /
min for 36.61% of play. He initiated far more conversation than Kai-Li, and used many
more speech gestures (16). The proportion of SNI with Kai-Li was only 5.63% of play.
Table 5.16 Behaviours of profoundly deaf players by partner hearing level: Ruth and
Paul
PARTNER hearing level
PLAYER
LOOKING TALK GESTURE SNI
Rate /
min
% dur of
play
% dur
of reh
Initiators
(#) (#)
% of
play
Profound* 3. Ruth 2.68 7.19 55.90 9 18 42.92
4. Paul 13.94 32.58 56.41 13 33 44.35
Hearing 3. Ruth 1.77 4.24 43.48 17 30 10.65
4. Paul 14.94 36.61 50.17 16 16 5.63
*Matched pair: Ruth and Paul were partners in this observation
5.5.5 William (flute, moderately deaf)
William’s first session was with Angie who also has a moderate hearing impairment. His
rate of looking was minimal at a rate of only 0.65 events / min for only 3.12% of play. The
duration of talk was high at 48.19% but most of the conversation was not initiated by
William and he produced fewer speech gestures than Angie (5 and 15). The proportion of

127
SNI was high at 34.54%. His second session with Manny was shorter than intended by the
researcher. William’s looking rate was marginally higher and its duration marginally longer.
The proportion of talk was only 34.72%, initiated fairly equally by the two players, and the
proportion of SNI play was also lower at 6.69%.
5.5.6 Angie (piano, moderately deaf)
Of all the pianists, Angie looked towards her co-performer the least. With her first partner,
William, she looked at a rate of only 1.37 events / min for 5.67% of play. There was more
talk than average in this session (50.03%); she initiated most of the conversation (27) and
made many more speech gestures (15). As mentioned above, the proportion of SNI play was
high.
In her second session, with Kai-Li, Angie’s looking was higher at 2.36 events / min for
7.11% of play but was still below average. In fact, she looked less often and for a shorter
time at Kai-Li than Kai-Li looked back, which was the only example found in this study of a
reversed ‘leader-follower’ dynamic as shown by looking behaviour. The amount of talk was
lower at 41.51% but was again initiated mostly by her.
Table 5.17 Behaviours of moderately deaf players by partner hearing level: William
and Angie
PARTNER
hearing level PLAYER
LOOKING TALK GESTURE SNI
Rate /
min
% dur of
play
% dur of
reh
Initiators
(#) (#)
% of
play
Moderate* 5. William 0.65 3.12 48.19 6 5 34.54
6. Angie 1.37 5.67 50.03 27 15 34.20
Hearing 5. William 0.75 3.29 34.72 8 4 6.69
6. Angie 2.36 7.11 41.51 11 13 0.00
*Matched pair: William and Angie were partners in this observation
128
5.6 Discussion 2 – Within-subjects analysis (the players)
The results relating to each player are discussed in the context of data from rehearsal
transcripts and participants’ responses to the request for feedback, in order to help evaluate
the relative influences of hearing level and other factors such as expertise, familiarity, and
age on players’ verbal and non-verbal behaviour.
5.6.1 Kai-Li (flute, hearing)
Taken as a measure of rehearsal productivity, the short time spent talking in Kai-Li’s first
session, with Manny, suggested a no-nonsense approach and a good rapport between the
players, neither dominating the conversation.
After the comparatively smooth rehearsals of the two pieces of music with Manny, Kai-Li
adapted her behaviour by increasing her looking behaviour and speech gesture production
with partners who were profoundly and moderately deaf. In her rehearsal of the first piece
with Paul she reported realising very quickly the extra lengths she would need to go to so as
to maintain ensemble synchrony as a result of Paul’s deafness (response to Q9 concerning
communication difficulties):
One of the main difficulties was to keep in time with each other. I felt I had to be
more physically engaging and leading starts and ends of phrases more than I'd
usually do.
Both Kai-Li and Paul knew the piece very well after their previous sessions and it was
unlikely therefore that unfamiliarity with the piece had a bearing on the structure of the
rehearsal at this stage. Kai-Li looked more and for longer at Paul no doubt in response to his
looking behaviour, since he clearly wanted to establish and maintain good visual contact to
facilitate ensemble.
By her third session, with Angie, she was very familiar with the piece and was not relying on
looking for ensemble synchrony, though she did look consistently at Angie. Kai-Li raised
potential issues relating to age differences and unfamiliarity not addressed explicitly in the
study, although these were quickly resolved (response to Q9):
129
I felt very comfortable playing with all three pianists! I found that the rehearsal with
Manny was more light-hearted as we were both around the same age and knew each
other already. But with the other two pianists I felt that I had to take it more
seriously (and be more professional) but quickly settled down as they both had
wonderful personalities!
5.6.2 Manny (piano, hearing)
Manny’s first session was with Kai-Li. It was notable for the calm, no-nonsense approach of
the players, perhaps facilitated by the perceived equality of the players in age, level of
expertise and familiarity. The low proportion of talk time in this session and the following
quote from Manny in response to Q6 (musical issues) supports this:
I think Kai-Li and I worked very well together - we tried things out, were honest
with each other and raised specific issues regarding phrasing and direction,
dynamics, tempo and ensemble cohesion. […] On a musical and technical level, I
felt very much an equal with Kylie, which is why I think we were both comfortable
and honest with regards to what we could expect from ourselves and each other.
Manny’s second session, with Ruth, was somewhat different. As was the case with Kai-Li,
Manny’s looking behaviour increased with profoundly and moderately deaf players, albeit
from a higher starting point. However, while Kai-Li had found the musical aspect of
ensemble synchrony a problem in her first rehearsal with a profoundly deaf partner (Paul)
making it necessary to look and gesture more, Manny’s problems in his first rehearsal with a
profoundly deaf player were not so much musical as social. He seemed a little abrupt in his
conversation, probably as the result of nerves and unfamiliarity, and the Adagio rehearsal
was slightly stilted as a result. He reported in response to Q6 (musical aspects):
I have to admit, I feel as if I struggled somewhat with Ruth for a variety of different
reasons. Numerous musical issues arose and I really wasn't sure how or if I could
broach them with her. I am amazed that she has achieved what she has, and I am
neither belittling her nor her abilities. On a musical and technical level, I felt we
were somewhat different, and perhaps I was expecting too much from her - maybe
this was influenced by the fact that I was paired with Kai-Li first, so I had certain
pre-defined expectations and demands? I tried to be as sensitive and undemanding
as possible with her. For instance, I noticed that there were moments where she was

130
playing wrong notes/accidentals or her tied rhythms weren't quite tight or accurate.
I largely "ignored" these, but mentioned them tactfully when I felt appropriate.
Manny’s musical difficulty related to accompaniment: he realised quickly that Ruth could
not keep time with him, because she could not hear him properly, so he would need to
follow her. This seems to have come as a surprise to Manny, who is more experienced as a
soloist, but the task was well within his capability. They spent twice as long as Manny had
with Kai-Li on SNI play indicating that they were monitoring and correcting errors.
Manny’s feedback (again in response to Q6) emphasises difficulties in communicating about
technical issues:
I didn't always agree with what Ruth was doing in terms of
articulation/dynamics/tempo/etc; perhaps she's saying exactly the same about me!!
Strangely, because of her disability, I felt like it would be rude to comment on her
playing, but maybe I should have been honest instead of being polite? Then again, if
I had said, "Your intonation isn't always consistent/correct" how on earth could she
have corrected that if she can't hear properly?! A difficult one...
Nevertheless, their Petite Sonate rehearsal was an improvement on that of the Adagio. They
made better eye contact and there were many more smiles. Rehearsal talk was far more
relaxed and the result was a synchronous, musical performance that realised many more of
their creative ideas.
Manny’s final session was with William. They were both relaxed and were not inclined to
rehearse the pieces in great detail for the purposes of performance. Indeed there seems to
have been a degree of problem-dodging by Manny in order to make life easier. This was
confirmed in his feedback (Q6) where it became clear he was ‘picking his battles’:
My pairing with William was some time later, and after my experience with Ruth, I
felt much more prepared in terms of what I could/could not expect/demand from a
musician with a hearing difficulty. As with Kai-Li, I felt very much at ease with
William which is interesting. […] When musical issues arose, I picked the ones
which I felt more able to change and influence (phrasing, ensemble togetherness
etc.) and accepted the ones I couldn't change (inconsistencies in timbre, intonation
and tone production etc.) Perhaps I should have taken this approach with Ruth.
131
Manny looked towards William more than Kai-Li, perhaps because of his experience with
Ruth who had explicitly requested that there be much more visual contact in performance.
There was therefore a strong leader-follower dynamic, the two players watching each other
closely at the final cadence.
In sum, while Manny had to adjust his playing style from that of a soloist to that of an
accompanist (the difference was most obvious between his first and second sessions with
Kai-Li and Ruth respectively), it was clear from his feedback that the social challenges
presented by rehearsing with musicians with hearing impairments left a much stronger
impression. In response to Q7 (social aspects), Manny wrote:
Prior to our pairing, I didn't actually know Kai-Li that well; rather, we had a
number of mutual friends and of course we are both students of similar age. As
mentioned prior, I think this facilitated our relationship and duo. I have no problem
with unfamiliar people. I believe myself to be an easy, outgoing and sociable
person; I very rarely find myself in awkward social situations due to introversion.
With this in mind, I don't really know why I found working with Ruth so challenging,
but it definitely made me nervous and affected the way in which I approached
certain issues with her. I don't know if she picked up on this, but sometimes people
just don't work well together for no apparent reason! I felt completely fine with
William. I don't feel as though our age difference made the relationship any easier
nor harder, but again maybe he has a contrasting opinion!
5.6.3 Ruth (flute, profoundly deaf)
Ruth’s first session, with Paul, was significant in that it is very rare for two musicians with
profound deafness to play together and even more so for a researcher to have the opportunity
to document their first rehearsal. The rate and duration of Ruth’s looking during play was
comparable to those of Kai-Li but by contrast does not seem to have been influenced by
Paul’s extreme looking behaviour. Their Adagio rehearsal began with a brief false start
followed by a partial run in which they struggled to maintain ensemble synchrony. After
trying out a number of sections, they achieved a full and more or less successful run at the
end of the rehearsal. Identifying and resolving the problem of ensemble synchrony was the
defining characteristic of this rehearsal, which forms the basis of a full case study reported in
Section 5.8 below. It includes Figure 5.3 detailing the occurrences of synchronous and
132
asynchronous playing and the extent to which they can be attributed to Paul’s looking
behaviour. Ruth mentioned this issue in her response to Q6 (musical aspects):
I felt working with Paul his timing is very much like playing along with the
metronome, whereas I like to add 'rubato' in some areas, and there was a lot of
discussion with me trying to explain to Paul what I would like to achieve! Manny
tended to follow my lead in the Bach performance which was nice. However it
wasn't good when we were doing the modern piece. Therefore I felt better connected
with Paul doing the modern piece.
Their rehearsal of the Petite Sonate went well. Building up to two full runs, the structure was
‘bitty’ at first because the players stopped every time one of them noticed they were not
playing in time with the other. Ensemble synchrony seems to have been less of a problem in
the Petite Sonate than in the Adagio, perhaps it has more section boundaries and textural
variety. Potential difficulties related to the timing of individual notes rather than
coordination within extended passages as the melodic lines in the Petite Sonate were much
shorter than in Adagio. Furthermore Ruth reported having spent much more time preparing
the Petite Sonate, the new work, than the Adagio with which she was already familiar. In
response to Q4 (stylistic differences) she said:
I have always liked the Adagio by Bach as I have learned this from my college days.
I love its smoothness, shape, direction, clever rhythmic ideas and the changes in
harmony. I found the modern piece a challenge: mainly to communicate with the
piece and to make sense of it. After more time with it I felt I got the composers’
ideas. I had to spend more time working on the top notes as I know the flute has a
tendency to sound 'sharp' and I wanted to control that. The Petite Sonate took a fair
bit of studying for me to develop appreciation for its style and ideas. Had to look
and play both flute and piano parts. The constant change of time signatures does
make it challenging about being very firm with counting because the piece plays
along with piano accompaniment and I rely heavily on being accurate with my pulse
and rhythm/note values to be able to play successfully together with another person.
After a while of practising I began to enjoy the piece as a whole.
Ruth’s second session, with Manny, did not start well. Manny spoke fast so it may be that
the communication difficulties they experienced in their rehearsal of the Adagio were
because Ruth found it hard to follow what he was saying. Ruth contrasted her experience of
the two rehearsals with Paul and Manny in her response to Q7 (social aspects):
133
I felt Paul had more experience playing together with deaf people and he was
always conscious about working to keep timing intact. I think for Manny he was a
little unsure about the expectations of working with deaf musicians and I felt the
relationship was a little loose at times - which made the music seem a little less on
the timing-spot together.
However, they were less tense in their rehearsal of the Petite Sonate which went more
smoothly. Ruth initiated conversation more often and made more speech gestures, to an even
greater extent, surprisingly, than she had with Paul. She was explicit in requesting certain
cues to facilitate good synchrony and in voicing her creative opinions, asking: ‘Could you
make your playing a bit stronger?’, ‘Can you be a bit more helpful about the timing?’ and
‘You could help by moving a little bit more’. Manny responded well to these requests.
Despite the shaky start in the Adagio rehearsal, it seemed as if Ruth regained her confidence
working with Manny, and this was evident in her response to Q8 (partner differences):
I think Paul had a much more firmer dynamic level for both pieces whereas Manny
the opposite. Paul liked to challenge my ideas whereas Manny will listen and
respect what I think.
In sum, Ruth met with some big challenges in her sessions, both musical and social, and
coped extremely well. In her first session, with Paul, she worked hard to ensure that stylistic
and interpretative goals were achieved as well as ensemble synchrony. In her second session
she developed enough confidence to ask Manny, who was not accustomed using visual or
physical strategies in the context of accompaniment, to provide her with the cues she
needed.
5.6.4 Paul (piano, profoundly deaf)
Paul’s challenge in his first session, with Ruth, was establishing and maintaining ensemble
synchrony. A frequent topic of conversation was the use of rubato and, although he looked at
Ruth more than she looked at him from the outset, Paul very quickly realised that he needed
to look towards her even more. He said:

134
I actually found it harder playing with Ruth [than Kai-Li]. She's very much the
soloist, expecting the accompanist to follow her, rather than it being an equal
musical partnership.
While the data show that Paul looked more in the Adagio than the Petite Sonate, he
remembered it differently:
There were more points in the Bach, especially of ensemble synchrony. It felt there
was less need to watch each other in this piece as there's a uniform tempo (more or
less!) whereas in Petite Sonate far more eye contact and cueing were required.
Paul noted that Ruth was better acquainted with the accompaniment for the Adagio than the
accompaniment for the Petite Sonate. He hinted that he preferred the resulting equality in
their roles as opposed to the soloist-accompanist dynamic that was so evident in Petite
Sonate:
I felt she wasn't that aware of what the piano part was doing in the Petite, in
particular, and where the musical structure and argument demanded a closer
partnership.
Paul’s second session was striking for the extreme nature of his looking towards Kai-Li, in
terms of its sheer density (rate and duration). Having realised this was essential in his
previous session, with Ruth, Paul seemed to feel that he needed to achieve a heightened level
of concentration and visual attentiveness with his unfamiliar partner, Kai-Li so as to ensure
ensemble synchrony in performance. (This contrasted with Ruth’s behaviour in her session
with the unfamiliar partner, Manny: unlike Paul she looked far less). In his feedback Paul
did not raise any issues regarding the musical content of the rehearsals with either partner;
social and personal factors were more salient to him. Responding to Q7 (social aspects) he
discussed the role of familiarity:
I know Ruth and have played with her before. Communication was easier with Ruth.
I was slightly more wary of playing with her, though, probably because I know her
better. […] With Kai-Li, I sensed that she was more nervous and wary, so was more
inclined to go with my suggestions and follow me rather than us working together.
He also explained his personal preference for the Petite Sonate over the Adagio (Q4):
135
Surprisingly, I preferred the Petite Sonate. Probably because it was more of a
challenge, both as a pianist and in rehearsal/performance. With the Bach you have
a good idea of where it's going, with the Petite you don't! It took me a while to get
into it, but was ultimately the more satisfying piece of the two.
Finally, regarding the overall experience of participating in the study, Paul stated:
It was fun. Made me realise how much I enjoy working with other musicians to
create a performance. And how rusty my playing is!
5.6.5 William (flute, moderately deaf)
William’s first session with Angie was extremely productive in terms of music-making.
They began with a complete run-through of the Petite Sonate at a fast tempo followed by a
total of 11 different sections, another complete run-through, and a further four sections, so
they covered a lot of ground. Socially, it was a rather tense and stilted rehearsal with a
number of false starts before the players settled down. William did not seem nervous, but
sometimes spoke tersely. While Angie seemed to prefer to talk through any technical issues,
William’s preferred strategy was to play more and talk less: “It’s getting to know it […]
which is happening every time we play through it”. In performance, neither player looked
towards the other except to co-ordinate the rallentando into the final cadence. This could be
interpreted as a function of their expertise – they didn’t need to look at each other – or
perhaps representing limited rapport between them. William gave only brief responses to the
post-performance questions, but commented on the differences between the pieces of music,
referring also to the effects of age on the relative ease with which they were learned:
The Adagio I 'learned' about 50 years ago, but it always helps to keep it 'polished'.
The Petite Sonate was much more difficult, in that the rhythms and note sequences
were not predictable like the Bach, but not impossible. As we get older our brains
take longer to learn new things, though this was of course building on established
playing patterns. […] Angie was more aware of my slowing down for the triplets
than I was, but finally adjusted and agreed. Petite Sonate was more difficult for us
both because we had to concentrate so much on our own parts, but net result was
fairly unanimous.
136
William’s second session, with Manny, went more smoothly and, having worked on the
Adagio already, he did not feel he needed to use all the rehearsal time available. More
ground was covered in the rehearsal of the Petite Sonate. He clearly felt sufficiently relaxed
to keep stopping at Bar 5 so as to make sure he and Manny were playing together. Indeed he
stated:
I felt more relaxed and it seemed to go better with Manny
In sum, William’s sessions did not expose any musical issues that may have arisen as a
result of his, or his partner’s, hearing impairment. However, moderate deafness may have
caused some social issues in his rehearsal with Angie, also moderately deaf, where it was
evident, and mentioned by Angie, that verbal communication was not as easy as it might
have been.
5.6.6 Angie (piano, moderately deaf)
Angie’s session with William was a little stilted: rapport between the players seemed low
and Angie stated at one point, “I’m just a little nervous I suppose”. Looking behaviour was
sparse and only tended to occur at changes in tempo, the ends of phrases and the end of
pieces. There were also occasions when the players misheard or misunderstood each other.
This was evident in Angie’s response to Q9 (communication difficulties):
I also recognised hearing loss in him when he didn't notice what I was saying to him
on a couple of occasions which you'll notice on camera and we picked up from
places other than what I'd suggested! So these are social rather than musical things
and that's of course the difference isn't it with people like us. I'm sure there were
things he noticed with me.
Nevertheless, and reassuringly, Angie’s session with William was actually very productive.
Much of the discussion was about Angie’s suggestion to ignore the pianissimo in Bar 17 of
the Bach and instead to build up gradually to a climax in the third beat of Bar 19 to which
William eventually conceded.
Angie’s second session, with Kai-Li, was calm and relaxed by comparison. It was distinctive
for the reversal of the typical leader-follower dynamic as exemplified by the players’
137
looking behaviour. As with William, Angie tended to look towards Kai-Li only when
necessary, for example at cadences and tempo changes. However, with Kai-Li, the periods
of play were cut short less often to the extent that there was no SNI play. Angie’s response
to Q8 (player differences) shed light on the possible reasons for this:
I found it quite a bit easier and therefore more enjoyable to play with Kai-Li than
with William because there seemed to be a greater empathy between us and I really
enjoyed her flexible sound which seemed to reach more directly […] To what extent
this is to do with processing things as an older person rather than with hearing loss
it's hard to tell. I also know that the piece felt easier for me with Kai-Li than with
William. And she may have been able to listen to me more easily than William did.
[…] It's entirely possible that the attractiveness of the second flautist's performance
for me may also have been due to better intonation? Although I couldn't identify
anything the matter as such with William's intonation the student's sound was
clearer and blended better with the piano and I found myself relaxing after the very
first few notes with her.
Like William, Angie also acknowledged the possible effects of age on the rehearsal process:
I also know that I wasn't always as consistent in the Bach as I could have been and
that I forgot the odd detail when it came to the 'performances'. Memory in music
learning whether it's new notes/interpretation is something that as an older person I
really do come up against which is also why I practise hard – I simply don't
remember in the way that I used to and that's nothing to do with hearing. I found
that the new piece got easier with the flute anyway as it became familiar. That sort
of thing also takes longer when you're older. I'm coming up to 60 and I would say
I've noticed the difference in about the last 5 years.
In sum, Angie’s approach to her sessions was professional and reflective, no doubt
influenced by her experience as a performance researcher herself. She identified that many
of the issues she encountered in her session with William may not have been solely due to
her hearing impairment. Rather, the joint effect of two players’ hearing impairments seemed
to cause communication difficulties in rehearsal, rather than ensemble synchrony difficulties
in performance. The points raised by Angie about the possible effects of age on memory,
rapport and familiarity were identified in the feedback of all the players and were therefore
particularly useful.

138
5.7 Summary
The most marked behavioural changes as a result of switching partners were found in the
two hearing players, Kai-Li and Manny, especially between their first session with each
other and their second with the profoundly deaf players. In their second sessions there was
more looking, talking and gesturing by the players. This is not surprising given that it was
the first time the hearing students had ever encountered a profoundly deaf musician, let
alone played in a duo with one, and it presented the young players with real challenges, both
musical and social. The social challenges seemed more memorable to the students,
according to their written feedback. There was more trouble-shooting in their rehearsals with
the profoundly deaf players than in the others, according to the proportion of SNI play.
Ruth and Paul’s session was notable in that it is rare for two profoundly deaf musicians to
perform together; although long-acquainted, the pair had never done so. There was a high
proportion of talking, during which the players did not sign (use BSL) but occasionally used
Sign-Supported English (SSE). Ensemble synchrony was a real challenge. (A detailed
analysis of their Adagio rehearsal is given in the next section). The sensory attending styles
of the two profoundly deaf musicians also differed: Ruth did not look very much in
performance but gestured frequently during verbal communication; Paul maintained
exceptionally high levels of visual contact during play, initiated a lot of conversation and,
likewise, gestured a lot during speech. It might be said that his many years of experience
working with musicians with hearing impairments had equipped him with many of the
strategies he would need for a task such as this. Ruth gestured more frequently with Manny
than with Paul which may indicate that gesture was used as a behavioural strategy to
improve the communication issues the pair experienced. They both did much more trouble-
shooting than in their rehearsals with the hearing players.
Of the moderately deaf players, William had the least attentive looking style and was also
the player to initiate conversation the least. With Kai-Li he did much less trouble-shooting
than with Angie. Similarly, Angie did not look a great deal towards her co-performers. In
her session with Kai-Li the typical leader (flute)-follower (pianist) relationship was reversed,
since Angie looked even less at Kai-Li than vice versa. Angie initiated conversation more
than any other players, however, and made almost as many gestures while she talked as the
profoundly deaf players.
139
Aside from any connection between partner-directed looking and ensemble synchrony,
looking behaviour indicated proximity and rapport between players and facilitated verbal
and non-verbal communication. For example, Ruth and Paul, who have known each other
for many years, looked at each other a great deal. Ruth looked less at Manny, with whom
she was unfamiliar. Yet Paul looked more at Kai-Li, his unfamiliar partner. Thus the
relationship between looking behaviour and familiarity is clearly not consistent.
A large variety of personal and social factors such as tiredness or fatigue, familiarity
between players, familiarity with the pieces, concentration levels, age and even a social
loafing of sorts (William and Manny) were observed to have had an impact on rehearsal
processes. This suggests that the findings, particularly the results reporting effects of hearing
level on the players’ behaviours, should be interpreted with great care. For example, Ruth
and Paul’s profound deafness undoubtedly caused problems of ensemble synchrony in
performance, yet their verbal communication was very successful. Meanwhile, Ruth and
Manny’s rehearsal was initially problematic for social, rather than musical reasons. William
and Angie’s moderate deafness did not appear to cause problems in performance but their
verbal communication in rehearsal was less successful because they had comparatively less
eye contact and social rapport, and did not use BSL.
Finally, the various idiosyncratic and extraneous factors affecting the musicians’ observed
behaviours summarised here serve as a cautionary reminder regarding the use of statistics
with such small samples: where individual differences between players contribute to
observed effects at group level, the discussed implications of such results should be
conservative.
5.8 Post-hoc analysis: a case study of looking behaviour and
ensemble synchrony in Ruth and Paul’s rehearsal of the Adagio
The problem of synchrony
This rehearsal was unique in the present study insofar as the musicians did not detect that
their playing was asynchronous until structural and textural markers in the music revealed it.
The musicians played for a total of 4m55s, of which they were in synchrony for 2m18s, that
is, only 46.9% of the time (durations calculated using Noldus Observer). Figure 5.3, below,
shows the overall structure of the rehearsal and plots the periods of synchrony and

140
asynchrony within each of the first six ‘episodes’ of playing (as opposed to talking) against
Paul’s rate of looking towards Ruth. This averaged 18.6 events / min over the whole
rehearsal increasing slightly from 12.49 events / min in the first episode to 18.54 events /
min in the final episode of play. In the first, second and fourth episodes the players began
playing together and stopped when they realised they were not together. They were ‘out of
sync’ for the whole of the third episode although they played perfectly together in the fifth.
The sixth episode was unusual in that the musicians alternated between synchrony and
asynchrony five times; the reasons for this are discussed below. Only the fifth episode
represented an RNI, all the others were trouble-shooting SNIs, suggesting that the
musicians’ goals included ensemble synchrony.
Figure 5.3 Paul’s rate of looking during episodes of play in rehearsal of Adagio with
Ruth
Figure 5.4, below, shows the correlation between Paul’s rate of looking and the durations of
periods of synchronous and asynchronous play within episodes, of which there were seven
of each. There was a significant correlation between these variables: r = .876, N = 14, p <
.001. The difference between the rates of Paul’s looking in synchronous and asynchronous
play however, was not significant: U = 22.0, N = 14, p = .805).

141
Figure 5.4 Frequency of Paul’s looking towards Ruth in synchronous and
asynchronous play
Identifying the problem
The musicians were aware that ensemble synchrony was a problem to be solved. For Ruth,
the realisation that they were not together often occurred at rests in her part, where she could
hear Paul’s playing better. For Paul, it tended to occur at cadences where he would look up
to find that Ruth was still playing when according to the score they should both have
stopped. Their verbal interactions at the end of each of these episodes show how they
tackled the problem (and who they believed was to blame!):
1. The first episode consisted of an almost complete run-through from Bar 9 to Bar 19.
At her brief rest in Bar 19 Ruth realised she and Paul were not together and stopped.
Paul carried on playing despite being more than a beat ahead. She challenged him
comically: “Can you follow my part? Perfectly.” He replied indignantly, “Yes! I can
read three staves at the same time...” Ruth conceded that [next time] she would not
slow down too much at Bar 9.
2. The next episode began at Bar 15. The musicians stayed together until the end of
Bar 16 where Ruth took a little more time over her demi-semi-quaver run towards
the cadence than Paul, thus losing time. Paul noticed this as he arrived at the
cadence in the third beat of Bar 17. Ruth was about a beat behind, admitting: “I
think it might be me! OK, 15 again”.
0
2
4
6
8
10
12
14
16
18
20
0 10 20 30 40 50 60 70 80
Fre
quen
cy o
f P
aul's
loo
kin
g t
ow
ard
Ruth
Duration of play
Synchronous
Asynchronous
142
3. They began as before but by the time Paul reached the first beat of Bar 18 he had
realised once again that Ruth was ahead. However, neither player was able to
identify exactly where they had lost each other. In fact, Ruth had begun at Bar 16.
4. They began the fourth episode at the second beat of Bar 17, suspecting that the
cadence was the source of problem. Although Ruth did indeed take less time over
the demi-semi-quavers just before the cadence, which they negotiated successfully,
they lost each other once again at the first beat of Bar 18 where Ruth was taking
more time. Paul did not notice until the second beat of Bar 19 but he did correctly
note that she wanted to slow down from Bar 17: “It’s more reflective – it’s more
reflective from 17”. Nevertheless he did not admit liability: “I’m not speeding up,
I’m sure I’m not speeding up”.
5. Restarting from Bar 17 they managed to get to the end of the piece. Paul looked
towards Ruth at a rate of 20.9 events / min during this episode, which clearly helped
him track her playing in relation to the score. His exaggerated physical movements
at cadences also assisted her. At the end of this episode the musicians’ mode of
communication shifted from Co-operative to Collaborative as they started discussing
rubato in the opening phrases of the Adagio.
6. The sixth episode was intended as a run-through of the whole piece. They lost each
other twice. At the first beat of Bar 2, Ruth was a quaver ahead. By the third beat of
Bar 5, however, Paul had caught up and they were together again. At the fourth beat
of Bar 9 Ruth began to fall behind again. Paul did not notice until the second beat of
Bar 11 while he was looking towards her during her long held G. He therefore
waited until he could see her beginning her falling demi-semi-quaver melody. They
stayed together until the second beat of Bar 13 but did not realise they were out of
sync again until the cadence at the third beat of Bar 17 when Paul looked up and
realised Ruth was still playing: “No – no. No.” Ruth replied: “Oh dear, that’s a
shame. Did it go wrong in the triplets?” In actual fact, as we have seen, they had
lost each other well before the start of the triplets in Bar 15.
Resolving the problem
The summary above highlights several points. First, Paul found it hard to hear Ruth over the
sound of his piano playing. In the rehearsal of the Petite Sonate that followed the rehearsal
of the Adagio, Ruth asked “Can you hear the high notes? On the flute?” and Paul replied
“No”. It is likely that, in addition, he was unable to hear much of the flute’s middle or low
register. Paul’s solution was to use a visual strategy: he was very adept at spotting the music
that Ruth was playing, in relation to the score, by watching to see if her lips were on the flute
143
and whether her fingers were moving. He correctly identified asynchrony four times in this
way, although sometimes after a long period of asynchronous play. Second, Ruth was
clearly unable to hear Paul fully while she was playing. She was obviously used to playing
the piece, with which she was very familiar, with a hearing accompanist who could follow
her. Ruth’s solution was to use an aural strategy: she could tell when she and Paul were not
together from the discrepancy between the sounds of the piano she expected, and could
actually hear at the ends of her phrases. In this way she identified asynchrony as discussed
above and on two other occasions, saying: “The reason why I go [shows confusion] is
because […] when I stop playing I’m expecting to hear [beats] – but then it’s a little bit –
half a beat in or out”.
Other strategies relating to the use of rubato were evident from the rehearsal talk. First, the
players identified the location of ritardandos and accelerandos and negotiated their extent
and how they should be achieved: for example, Ruth: “You just have to listen for a natural
stretch” to which Paul replied, “But if you do it too much then by the time you get to the
sixth bar it actually feels like [makes exaggerated push-pull gesture]”. Second, Paul
established what might be regarded as a ground rule for rubato, generally: “…when I play
Bach, I very, very rarely shift that [gestures a block measure of time]”. Thirdly, Ruth
expressed a preference for more rather than less rubato, since her usual accompanists find it
relatively easy to follow her: “This piece is quite expressive so I do tend to hold back and let
go a little bit”. Thereafter (and most notably between the fourth and fifth episodes illustrated
above), although he likes to keep a strict pulse in ensemble playing, Paul was prepared to
compromise once he realised that Ruth needed more temporal flexibility within which to
create a musically expressive performance.
Paul’s strategy of watching Ruth closely to ensure ensemble synchrony is arguably the most
important finding from the present analysis. Between the first and second episodes it is clear
that he realised he needed to look towards Ruth more often to interpret her visual cues: the
movements of her body, particularly those relating to breathing, and her fingers. The high
rate of looking he reached with Ruth (18.6 events / min) was maintained in his subsequent
rehearsal of the Adagio with Kai-Li where his average rate of looking was even higher, at
19.4 events / min.

144
5.9 Conclusions
The manipulation of naturally occurring levels of hearing and hearing loss in this quasi-
experimental study yielded significant effects on the dependent variables of rates and
duration of looking, proportion of rehearsal devoted to talk, content of rehearsal talk and
rehearsal strategies. There was only a weak effect of hearing level (profoundly deaf versus
hearing, but not moderately deaf) on musicians’ looking behaviour. Nevertheless, these
findings confirm anecdotal evidence from the interviews reported in Chapter 3 concerning
sensory compensation in music-making, whereby reliance on visual information increases
when the quality or quantity of auditory information is lessened as a result of hearing
impairment. There was, however, a moderate effect of co-performer’s hearing level on the
looking behaviour of hearing musicians, suggesting empathetic modification of behaviour
for the benefit of the co-performer.
There was a strong effect of hearing level on the proportion of rehearsal time spent talking,
and a strong reciprocal effect of the co-performer’s hearing level, particularly in relation to
task questions (according to the IPA framework). This suggests that since it is harder for
musicians with hearing impairments to hear their co-performers over the sound of their own
instrument it is essential to ask questions about and discuss tempo, tempo changes and
dynamics in advance. There was also a strong effect of hearing level on positive outcome
play modes such that for players with hearing impairments it may be more necessary to
trouble-shoot in rehearsal.
There were also significant effects of hearing level on rehearsal talk that may be due to
social factors besides hearing impairment, such as the duo partners’ relative age and
experience. A ‘politeness’ effect whereby the hearing musicians who were not only students
but younger than their partners tended to Agree with them may represent a confound
between age and experience as discussed by Ginsborg and King (2012). There was a strong
effect of hearing level on the Collaborative mode of communication, suggesting once again,
that it is advantageous for profoundly deaf players to resolve issues of interpretation before
starting to play. This effect calls into question, however, the hierarchical nature of the modes
of communication as proposed by Seddon and Biasutti (2009), since high-level issues of
musical interpretation can be addressed even in the (partial) absence of ensemble synchrony.
This provides further support for efforts to provide music education for deaf children as
discussed in Section 2.1.3 (Review 1).

145
The discussion of the findings relating to each of the duo partnerships underlines the
importance of social dynamics. While it is clear that musicians with hearing impairments –
particularly those who are profoundly deaf – find it more challenging to play with each other
than with hearing musicians, for the simple reason that they cannot hear each other very
well, challenges also arise from the effects of age, experience, familiarity, unfamiliarity,
nervousness, verbal communication styles, gesture, and ultimately personality on group
music-making. Given the stigma of deafness in a variety of musical communities, this is
something many musicians may find hard to believe: other aspects of communication can be
as important as hearing such as being able to express one’s musical intentions in words or
through signs, make eye contact and use gesture. If these forms of communication are
compromised by nervousness with other people, unfamiliarity with the score, stage fright, or
anything else, the impact on enjoyable, productive rehearsal and performance can be just as
damaging, if not more so, than hearing impairment.
The fact that many of the rehearsal processes involving social communication were
identified from DVD recordings highlights the potential importance for musicians – and
particularly music performance students at conservatoires – of using videos to evaluate
themselves. It is easy to forget that in music, and in the arts in general, our personalities are a
necessary and intrinsic aspect of our work to the extent they can facilitate positive
interactions or render collaborations between musicians impossible. While actors are trained
to spent a great deal of time analysing their interactions with other people on stage, it would
be advantageous for musicians-in-training to spend some time considering how their natural
social communication styles (the amount of eye contact they maintain with fellow
performers, the manner of their speech and their use of gesture both in speech and
performance) facilitates or hampers their group music making and think about ways to
modify their behaviours.
146
CHAPTER 6 – The vibrotactile perception of pitch
In the literature review (Chapter 2), a number of examples were given of deaf musicians
using vibrations in musical situations. The music teacher Elke Bartlmä, has described how
vibrations helped her to realise that most music has a beat (Bartlmä, 2008) and the
percussionist Evelyn Glennie has written and spoken about how vibrations are an integral
part of her listening experience (Glennie, 1990, 2010b). The interview study reported in
Chapter 3 again raised the idea that musicians with hearing impairments may be aware of the
vibrations created by instruments in musical performance (3.3.5). Some participants in this
study reported that feeling the vibrations of musical sounds was crucial to their
performances (Paul, Evelyn). Others reported using vibrations for specific purposes,
especially for tuning string instruments (Anne, Anthony). The majority reported being aware
of the vibrations but not relying on them for specific musical purposes (Penny, Philip,
Angie, Danny, Janice, Janine). In the presence of reduced auditory feedback, for example,
when turning off hearing aids, the awareness of felt vibrations can increase (Ruth, Nick).
This chapter begins with a review of the literature on vibrotactile perception (Section 6.1).
Three psychophysical studies into the vibrotactile perception of pitch are then reported and
discussed (Sections 6.2-6.4). The findings of these studies together with those of the
interview and observational data will be evaluated in Chapter 7.
6.1 Literature Review
Evelyn Glennie has reported that she learnt to feel the vibrations of her percussion
instruments, in particular the timpani, as a way of accessing the sound of her playing:
Ron Forbes taught me how to develop my sensory awareness. He used to get me to
put my hands on the wall outside the music room and then he would play two notes
on two drums and ask me, “Okay, which was the higher note?” I’d tell him which I
thought it was, and he’d ask me, “How do you know?” So I’d tell him I could feel
maybe in upper part of my hand while I felt the other note all the way down to my
wrist. (Glennie, 1990, p. 73)
147
The quotation above, from her autobiography, highlights the method by which Glennie
learned to distinguish between the pitches of notes played on the timpani by her teacher by
feeling the vibrations. The following quote from her ‘Hearing Essay’ highlights the extent to
which this experience benefitted her sense of musical pitch:
Eventually I managed to distinguish the rough pitch of notes by associating where
on my body I felt the sound with the sense of perfect pitch I had before losing my
hearing. The low sounds I feel mainly in my legs and feet and high sounds might be
particular places on my face, neck and chest (Glennie, 2010b. p. 1).
It is clear that she feels vibrations not just on the skin, but with her whole body, most likely
via bone conduction. The question of what exact skills Glennie learned using this sensory
feedback is less clear. The quote implies that Glennie is able to discern the relative pitches of
notes as higher or lower than each other. We cannot know how accurately she does this, but
the reference to her “sense of perfect pitch” implies that she became able to map vibrotactile
information on to a previously existing auditory labelling template. If this is the case, it
provides an exciting prospect for research into the vibrotactile perception of pitch. To this
day, Glennie continues to perform with bare feet so that she can feel the vibrations of her
instruments through the floor.
The following literature review will examine the way in which we perceive vibrations with
our body, specifically on the skin (Section 6.1.1) including the various factors which affect
this sense of touch (Section 6.1.2). Research will be presented on the perception of pitch
using vibrations (Section 6.1.3), neural bases for the cross-modal perception of sound and
vibration (Section 6.1.4), the learning of tactile information (Section 6.1.5) and the range of
technologies that exist for the perception of music using vibrations (Section 6.1.6). A final
summary will identify gaps in the literature and set out the research questions that guided the
design of the three experiments reported in this chapter.
6.1.1 Neurophysiology: the cutaneous senses
Vibrations on the skin are felt via the cutaneous – or skin – senses. Figure 6.1 shows the
various receptor organs in the skin. The hairless skin on the palms and soles of the feet is
called glabrous skin and contains a greater variety of mechanoreceptors than hairy skin:
glabrous skin has four afferent (neural) channels, henceforth referred to as ‘tactile channels’
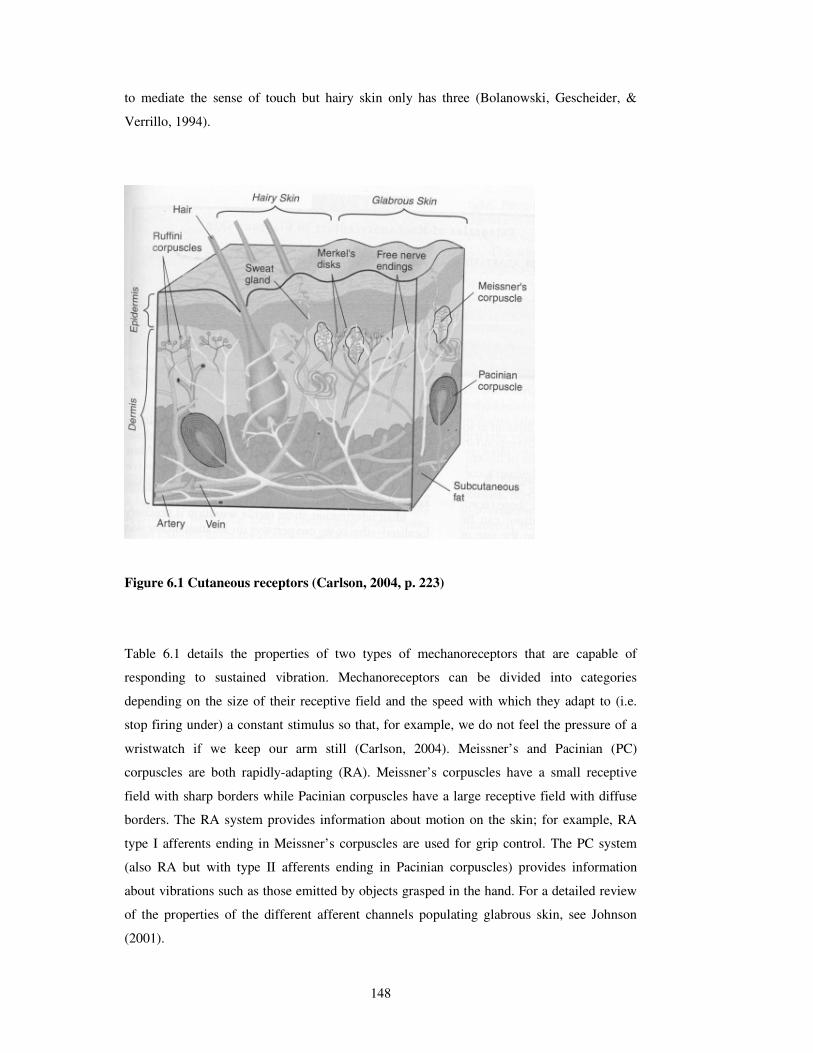
148
to mediate the sense of touch but hairy skin only has three (Bolanowski, Gescheider, &
Verrillo, 1994).
Figure 6.1 Cutaneous receptors (Carlson, 2004, p. 223)
Table 6.1 details the properties of two types of mechanoreceptors that are capable of
responding to sustained vibration. Mechanoreceptors can be divided into categories
depending on the size of their receptive field and the speed with which they adapt to (i.e.
stop firing under) a constant stimulus so that, for example, we do not feel the pressure of a
wristwatch if we keep our arm still (Carlson, 2004). Meissner’s and Pacinian (PC)
corpuscles are both rapidly-adapting (RA). Meissner’s corpuscles have a small receptive
field with sharp borders while Pacinian corpuscles have a large receptive field with diffuse
borders. The RA system provides information about motion on the skin; for example, RA
type I afferents ending in Meissner’s corpuscles are used for grip control. The PC system
(also RA but with type II afferents ending in Pacinian corpuscles) provides information
about vibrations such as those emitted by objects grasped in the hand. For a detailed review
of the properties of the different afferent channels populating glabrous skin, see Johnson
(2001).

149
Table 6.1 Tactile receptor properties, adapted from Kaczmarek et al. (1991)
Receptor Class*, Type Skin type Frequency
range (most
sensitive)
Sensory correlate
Meissner’s
corpuscle RA, I Glabrous
10-200Hz
(20-40Hz)
Touch, tickle,
flutter, tapping,
motion
Pacinian
corpuscle RA, II
Glabrous &
hairy
40-800Hz
(200-300Hz) Vibration, tickle
* RA = rapidly adapting
The overlap between the perceptible frequency ranges of the cutaneous senses and our sense
of hearing therefore lies between about 30-1000Hz, or in musical terms, from C1 to C6,
where middle C, or C4, is 261.6Hz (see Figure 6.2).
Figure 6.2 Perceived frequency ranges adapted from Merchel, Altinsoy & Stamm
(2010)
6.1.2 Psychophysics 1: factors influencing vibrotactile perception
The relationship between physical stimuli and psychological sensations is explored within
the domain of psychophysics. The most common method is to identify the detection
threshold, that is, the lowest level of physical stimuli that can be perceived. This method is
used in standard audiometry in order to quantify the level of a person’s deafness. For
vibrational stimuli, this has been termed the vibrotactile perception threshold (VPT). VPTs
on the skin are affected by a number of physiological and environmental factors, which have
been identified using these psychophysical methods.

150
One of these factors is age. Verrillo (1982) showed that people in their 60s were less
sensitive to vibrations on the skin than those in their 20s, although this difference was more
pronounced in the PC channel than the RA I channel. Subsequent studies confirmed that the
rate of increases in VPTs is greater after the age of 65 than before (Gescheider, Bolanowski,
Hall, Hoffman, & Verrillo, 1994) and that the reason for increases in thresholds is primarily
because the peripheral nerves function less effectively with age (Deshpande, Metter, Ling,
Conwit, & Ferrucci, 2008). It must be remembered, however, that age cannot be used as an
independent variable in experimental research, since it cannot be manipulated; it may only
be found to correlate with measured variables and therefore findings from research on the
relationship between age and VT sensitivity must be interpreted with caution. For example, a
study looking at the effects of aging on VPTs on different parts of the body showed that the
fingertip, being the most sensitive part of the body tested, was more resistant to age-related
decline in VT sensitivity than the shoulder or forearm (Stuart, Turman, Shaw, Walsh, &
Nguyen, 2003).
Another factor is sex, although findings are mixed: an early study comparing men’s and
women’s VPTs found no significant difference between them although women perceived
stimuli of equal magnitude as more intense than the men (Verrillo, 1979). Gescheider et al.
(1994), however, did find that women were more sensitive than men (Gescheider,
Bolanowski, Hall, et al., 1994). A study using high levels of vibration, designed to explore
thresholds of discomfort in the hand and arm, found no significant differences in VPTs but
did, however, find that females were significantly more sensitive, as reported subjectively, to
high intensity vibrations at high frequencies (Neely & Burström, 2006). There is even
evidence that VPTs vary as a function of the female menstrual cycle (Gescheider & Verrillo,
1984).
VPTs are affected by the size of the area of skin that comes into contact with vibrations,
such that increasing the size of the contactor results in lower thresholds (Verrillo, 1963).
This process is now known as spatial summation (Gescheider, Güçlü, Sexton, Karalunas, &
Fontana, 2005). One explanation is that more mechanoreceptor cells can be stimulated when
the contactor is larger so the likelihood of a signal being sent to the brain is increased (a
neural mechanism known as probability summation), while another is that the integration of
many mechanoreceptor inputs in the central nervous system increases the sensitivity of the
receptor channel (Gescheider et al., 2005). The effects of spatial summation differ between
varying tactile channels and vary as a function of the density of receptor cells on the skin.
This explains why certain areas of the body such as the hands and feet are more sensitive
than others such as the torso. Adjusting the location of contactors on the palm and fingers
151
produced more variance in VPTs for the RA I channel than the PC channel (Morioka &
Griffin, 2005). Finally, VPTs can be affected by skin temperature, such that vibrations are
perceived as being more intense at higher temperatures (Verrillo & Bolanowski, 2003).
6.1.3 Psychophysics 2: perception of pitch using vibrations
The basic parameters of VT pitch perception were established in the 1920s, again using
psychophysical methods. Here, primary measures include the frequency difference limen
(FDL) and the intensity difference limen, which describe thresholds of the detection of
difference in either pitch or intensity (loudness) at suprathreshold levels.
In an early study using only two participants, the lowest and highest frequencies detectable
were found to be 15Hz and 1600Hz, with the highest degree of sensitivity occurring around
256Hz (Knudsen, 1928). Knudsen concluded that variations in the intensity of speech could
be perceived equally well in the VT mode as the auditory, but that the perception of
frequency, or pitch discrimination, is far worse. The perception of music using vibrations
would be very difficult; indeed Knudsen concluded that “the tactual interpretation of music
[…] would be almost void of melody or pitch coloring” (Knudsen, 1928, p. 351). Later
experiments by von Békésy revealed crucial interaction effects between the parameters of
frequency and intensity, adaptation to VT stimuli and the size of the skin area (von Békésy,
1959). These studies led Knudsen and von Békésy to be pessimistic about the potential for
meaningful information about speech to be conveyed using vibrations on the skin. The main
reason for this is a confound between the two basic dimensions of hearing, pitch and
loudness. The relationship between frequency of vibrations and their perceived pitch is not
linear as the former is influenced by the amplitude of the signal (Geldard, 1957, 1960).
Typically, increases in pitch are reported alongside increases in intensity (Morley & Rowe,
1990). The presence of a non-linear interaction effect between frequency and amplitude is
therefore a significant challenge to any attempt to preserve the fidelity of a musical signal
from the aural to the VT mode.
Another significant challenge is masking: if two vibrations are presented to the same spot on
the skin, only the lower frequency will usually be perceived because vibrations of different
frequencies are perceived using different tactile channels with cross-channel suppression
occurring at suprathreshold levels (Gescheider, Bolanowski, Zwislocki, Hall, & Mascia,
1994; Hollins & Roy, 1996). Morley & Rowe (1990) concluded that the presence of more
than one afferent channel of tactile perception means that it is likely that pitch perception is

152
achieved using a combination of temporal or ‘rate’ coding, where neural responses are phase
locked to the vibration frequency, and ratio coding, which describes a higher level
mechanism by which pitch information is abstracted by analysing the relative activity of
tactile channels (Morley & Rowe, 1990, p.404). This conclusion has been largely upheld by
more recent research in which brain imaging techniques have confirmed that neurons in S1
fire with the exact periodicity of the stimulus supporting rate coding processes (although
exact mechanisms remain unknown) (Salinas, Hernández, Zainos, & Romo, 2000). Pitch
perception via the cutaneous senses is therefore both quantitatively and qualitatively
different from aural pitch perception In the auditory mode, rate coding via phase locking
occurs only for frequencies of < 5kHz, while higher frequencies are differentiated in a
tonotopic map the primary auditory cortex via ‘place coding’ (Moore, 2003). Modern
imaging methods have enabled the identification of parts of the brain that are involved in the
perception of changes to the pitch or frequency of felt vibrations. A study using functional
magnetic resonance imaging (fMRI) examined blood-oxygen-level-dependent (BOLD)
adaptation: where vibrations are repeated at the same frequency, adaptation occurs and blood
oxygen levels are lower; where frequencies are changed, adaptation does not occur and the
blood oxygen levels stay the same. Using this method, the authors showed that the cortical
areas responsible for processing changes in VT frequency are the primary somatosensory
cortex (S1), precentral gyrus, superior temporal gyrus and the secondary somatosensory
cortex (S2) (Hegner et al., 2007), thus revealing a network involving both somatosensory
and auditory cortices.
6.1.4 Cross-modal perception 3: auditory – tactile
Section 2.2.5 addressed the issue of sensory compensation, suggesting that deaf people may
be better than hearing people at perceiving visual information because they have better
peripheral vision. This section considers interactions between the sense of touch and the
sense of hearing and evaluates the premise that people with (particularly congenital)
deafness are better than hearing people at perceiving vibrotactile stimuli.
The physical link between vibrations as a tactile sensation and sound are relatively easy to
define: something that vibrates will, by definition, produce oscillating pressure waves in the
air which, depending on their frequency, can be perceived by the ear. We can also perceive
the vibrations of a standard electrical loudspeaker simply by touching it. Although not as
salient as auditory-visual interactions, the availability of audio-tactile interactions in the
environment can be evidenced by the presence of audio-tactile metaphors in speech about

153
music. A recent study examining the way these metaphors relate to each other found that
higher pitches are perceived as being sharper, rougher, harder, colder, drier and lighter than
lower pitches (Eitan & Rothschild, 2011).
It is difficult to conclude the extent to which such associations between vibration and sound
are learned or innate. They are certainly very easily confused in subjective accounts. For
example, the issue of confusion between auditory and vibrotactile sensations at the ear has
long been acknowledged by audiologists. While profoundly deaf participants were able to
distinguish between the two kinds of sensation under laboratory conditions, Boothroyd and
Cawkwell (1970) concluded that performance on standard audiometric tasks would very
likely be facilitated by perception of vibrations at the ear. This prompted the
recommendation that the requirement to detect sound, not vibration, should made explicit in
verbal protocols for audiometry.
The integration of vibrotactile and auditory information has also been observed at a
psychophysical level. Merchel, Leppin, & Altinsoy (2009) used a loudness matching task
with auditory only and auditory and tactile conditions where participants adjusted the
loudness of an auditory signal to match a vibratory stimulus. They found that estimates of
auditory loudness were on average 1dB higher when accompanied by vibrations and that this
was consistent for different intensity levels. This replicated an observation made in
Schurmann et al.’s (2004) study, which found that participants matching an auditory probe
and reference tone for loudness chose levels that were 12% lower when they were also
touching a vibrating tube.
Behavioural research supports the idea that profoundly deaf adults may be particularly
sensitive to vibrations. A psychophysical study identifying detection thresholds and
frequency difference limens (FDLs) in both normally hearing and congenitally deaf
participants found that the latter were significantly better at identifying pitch changes above
threshold. There were, however, no significant differences between their absolute threshold
levels and the findings were attributed to a combination of neural plasticity and increased
attention (Levänen & Hamdorf, 2001).
It was previously understood that the neural integration of sensory information in different
modalities to form a truly cross-modal percept happens in high-level association cortices,
rather than in early sensory areas. However, recent findings suggest that the integration of
touch and sound does indeed happen in lower-level sensory-specific regions. An fMRI study

154
found this to be the case in macaque monkeys where this integration occurred in the primary
auditory cortex and the caudal auditory belt (Kayser, Petkov, Augath, & Logothetis, 2005).
In humans, a study using magnetoencephalography (MEG) showed that the parts of the brain
normally used for processing auditory pitch were recruited when a congenitally deaf adult
was asked to discriminate between two pitches presented as vibrations to the palm and
fingers (Levänen, Jousmaki, & Hari, 1998). Another study used fMRI to compare the
responses of a sample of congenitally deaf students and hearing students on a task involving
the identification of a 50Hz vibration on the palm of the hand. While universal responses
were observed in the primary somatosensory cortex (S1), activity in the primary auditory
cortex was observed only for deaf participants. On this basis, the authors claimed that
congenitally deaf people ‘hear’ vibrations in the same way that hearing people hear audible
sound (Shibata & Zhong, 2001).
This provided the impetus to investigate the premise that deaf people may process vibrations
in the same way that hearing people process audible sound. Using MEG as before, the
Levänen research group found that vibrations presented to right-hand fingertips of normally-
hearing adults elicited responses first in the primary somatosensory cortex (S1) at 60ms, and
subsequently the secondary somatosensory cortex (S2) and the auditory cortices at 100-
200ms (Caetano & Jousmaki, 2006). Another study using fMRI found that responses in the
auditory cortex to vibrations presented to the hand were higher and more widespread in
adults with early onset deafness than normally-hearing participants (Auer, Bernstein,
Sungkarat, & Singh, 2007).
In sum, differences between the perception of vibration by deaf and hearing subjects can be
identified at a neural level, although the involvement of the auditory cortex in vibration
perception does not appear to be exclusive to congenitally deaf people. The role of sensory
plasticity in the auditory cortex in the perception of vibration and as a result of congenital
deafness is not yet fully understood. Certainly, the auditory cortex seems to be responsive to
input from many different sensory pathways and reveals high levels of plasticity. The
volume of the auditory cortex does not appear to be affected (or reduced) by congenital
deafness (Penhune, Cismaru, Dorsaint-Pierre, Petitto, & Zatorre, 2003), underlining the idea
that the auditory cortex is potentially able to process general information via different
sensory modalities.
155
6.1.5 Psychophysics 3: Learning in the vibrotactile mode
The study of learning in the vibrotactile mode is relatively recent, building on newer
knowledge about the afferent channels of tactile perception, interaction effects between them
and factors affecting thresholds and difference limens. As a result, experimental designs in
vibrotactile learning studies have remained simple so as to control for these effects.
Neuropsychological methods involve extracellular recordings of neuron firing patterns in
non-human primates (Mountcastle, Reitboeck, Poggio, & Steinmetz, 1991). Monkeys, like
humans, are able to perform simple frequency discrimination tasks and while it is generally
accepted that memories for tactile information are based on low-level somatosensory
representations, this is not always the case. The firing rate of neurons in the prefrontal cortex
of monkeys varies as a function of the base (first) stimulus frequency in the short period of
time between the two vibrotactile stimuli (Romo, Brody, Hernandez, & Lemus, 1999). The
researchers suggest that this neural trace is evidence of how monkeys use working memory
to compare the base stimulus to the second stimulus in these tasks. Vibrotactile stimuli
produce responses in many areas of the brain involving neural networks that are more
complex in humans than in monkeys. This finding is supported by behavioural research
examining the transfer of learned tactile discrimination abilities to different parts of the
body. A recent study used electroencephalography (EEG) to identify responses to a
frequency matching task (Spitzer, Wacker, & Blankenburg, 2010). During tasks, the authors
located initial stimulus-locked (evoked) responses in S1 for the duration of the first stimulus.
At the stimulus offset, induced responses were found in the prefrontal cortex which related
directly to the stimulus frequency providing brain based evidence for the existence of human
working memory for VT information (Spitzer, et al., 2010, p. 4500).
Studies of learning using tactile channels provide mixed evidence as to the degree to which
the perception of vibrations can be learned and generalised across tasks or to other locations
on the body. Gescheider and Wright tested thresholds at two frequencies: a 250Hz stimulus
to target the PC (RAII) channel and a 20Hz stimulus to target the RAI channel. They found
that improvements to thresholds were not transferred from one hand to another or between
channels. Improvements did, however, transfer to different intensity levels within the same
channel. They argue therefore that training results in changes to sensory processes rather
than the acquisition of general skills (Gescheider & Wright, 2012). Another study involved
the discrimination of two different sensations across different fingertips in three different
modes: vibration, pressure and roughness. Performance on the trained fingertip was best for
all tasks; however, learning for the vibration task did not transfer to other fingertips, while
learning for pressure and roughness did (Harris, Harris, & Diamond, 2001). The authors
156
posit that this is evidence that tactile learning in humans is organised within a somatotopic
framework that is stimulus-specific.
The findings of a very recent study involving a static pressure task (participants used a
stimulus akin to braille rather than vibration) provide the basis for a theoretical explanation
of VT learning. The authors applied reverse hierarchy theory (RHT) normally used in the
field of visual perceptual learning to the field of tactile learning (Kaas, van de Ven, Reithler,
& Goebel, 2013). RHT suggests that learning first occurs in high-level cortical fields and
progresses backward to lower-level cortical fields related to sensory input when the changes
due to learning no longer result in improvements on the task. If learning of the task goes
beyond procedural aspects to those that are somatotopically specific, then transfer of
learning is impeded. They propose that learning in S1 therefore only occurs for low-level
tasks requiring high signal-to-noise ratio for detecting low-level features. This is consistent
with neuroimaging studies showing activity for simple frequency discrimination tasks in
S1and S2 in both monkeys and humans, and those showing enlargements to regions in S1
corresponding to learning a tactile task on specific fingers (Pleger et al., 2003). The authors
suggest that tasks involving variable stimuli are more conducive to learning transfer as
learning does not involve the S1, thus freeing higher-level cortical regions with bilateral
receptive fields or cross-collosal connections to facilitate task performance using sensory
input from different sensory channels (Kaas, et al., 2013, p. 487). While their study did not
involve vibrotactile stimuli, RHT is useful in explaining why vibrotactile frequency
discrimination tasks have not demonstrated successful transfer of learning (see Gescheider &
Wright [2012], and Harris et al. [2001]): the specificity of vibrotactile frequency responses
in somatosensory cortices require high signal-to-noise ratios and while learning can be
observed in somatotopic regions, it is not conducive to transfer. In contrast, using a task
involving the discrimination of different temporal intervals marked by bursts of vibration,
Nagarajan et al. (1998), found that trained intervals successfully and completely transferred
to untrained skin locations, providing further evidence that tasks involving the abstraction of
global information from vibrotactile stimuli restrict learning to higher-level fields, which in
turn facilitates learning transfer.
Perceptual learning is dependent on a number of processes and there are tensions between
them (Seitz & Dinse, 2007). Theories of attentional learning are based on the idea that we
only learn what is behaviourally important to us and this is supported by neuroscientific
evidence of brain plasticity for attentional tasks. Learning may also be gated to protect
sensory systems from unnecessary plasticity. On the other hand, there is evidence that neural
re-organisation can occur when exposure to sensory information is passive. The common
157
principle being that a certain amount of sensory information is necessary to reach beyond a
learning threshold. The learning of VT information is more challenging than visual or
auditory information; however, there is evidence that increasing the amount of VT
information, for example by using larger contactors, facilitates learning and associated brain
plasticity (Seitz & Dinse, 2007).
6.1.6 Existing vibrotactile technologies for music
Having carried out a great deal of psychophysical research into vibrotactile perception,
Verrillo went on to apply his findings to music performance. He speculated that natural,
acoustic VT feedback is already present for many musicians on and in different parts of the
body, including the hands, of course, but extending to internal cavities especially for singers
(Verrillo, 1992). He had concluded that artificially created VT feedback could facilitate
music performance but only if it was “secondary and in support of auditory feedback”
(Verrillo, 1992, p. 296). This viewpoint is consistent with the subjective accounts, reported
in Section 3.3.5 (Chapter 3), of the musicians with hearing impairments who stated that
although they may occasionally be aware of VT feedback, it is not something they rely upon.
By contrast, Anthony and Anne reported using vibrations felt on the fingertips to help with
tuning their stringed instruments (respectively, the double bass and viola) and Evelyn
Glennie reports that the perception of vibrations is her primary means of sensory perception
when performing. Many of the VT technologies outlined below also position VT feedback
as a way of augmenting sensory perception. Verrillo speculated that VT feedback would be
able to help with tonal control for string and wind instruments and for singers too. With
regard to percussionists, he proposed that as adjustments for tonal control are made before
the instrument is struck, VT feedback may be of less use (Verrillo, 1992, p. 296). Evelyn
Glennie would be likely to disagree.
In recent years VT technologies for use in music have become available on the market. ‘The
Buttkicker®’ is part of a family of VT products designed for use in music and gaming
contexts (see http://www.thebuttkicker.com/pro-audio.php). The ‘Soundbox’ is part of a
group of ‘Soundbeam’ products used in music therapy contexts (see
http://www.soundbeam.co.uk/vibroacoustic/). Both these devices deliver low-frequency
vibrations to the body primarily via bone conduction, rather than the skin senses, and have
not been scientifically evaluated. Many subsequent, empirically-tested, applications have
been integrated into chairs that users sit in and experience the vibrations of music. These
have commonly been designed with the aim of improving access to music and the

158
experience of listening to music for people who are deaf and those with hearing
impairments. For example, Ezawa (1988) used two actuators placed under a chair so that
vibrations could be felt on the back of the legs. Children played freely with various
percussion instruments while watching a visual display of rhythm patterns and subsequently
provided satisfaction ratings: 97% of the children reported that they enjoyed the feeling of
the rhythms (Ezawa, 1988).
More recently, a team at Ryerson University, Canada, have created a vibrotactile chair called
the ‘Emoti-chair’. In 1928, researchers interested in the VT representation of speech divided
frequencies between the fingers of the hand, the thumb receiving the lowest pitches, and the
little finger the highest (Gault & Crane, 1928) and this has remained a popular way of
overcoming perceptual masking and capitalising on spatial location. In the Emoti-chair, VT
information is split across eight tactors prioritising different frequencies or pitches (Figure
6.3). This array of speakers is termed the ‘Model Human Cochlear’ (MHC) as it replicates
the tonotopic map of frequencies in the human ear (Karam, Russo, & Fels, 2009). In the
cochlear, vibrations of different frequencies are separated along the basilar membrane,
enabling the perception of different frequencies via place coding, with only the lowest
frequencies (~200Hz) travelling all the way to the apex (von Békésy, 1947; Carlson, 2004).
Figure 6.3 The ‘Emoti-chair’ (Karam, et al., 2009)
159
Experiments were carried out to determine the extent to which emotional information about
the music could be perceived using the MHC. Hearing participants were artificially deafened
using earplugs and headphones playing white noise and rated pieces of music according to
emotion scales. The researchers found that users were indeed capable of identifying the
mood of the music presented in the VT mode as either happy or sad and that they were able
to do so more accurately when the frequencies in the VT signal were split across the MHC
than when using a combined signal (Karam, Price, Russo, Fels, & Branje, 2008). In another
study, participants were played eight randomised ‘vibetracks’ of different pieces of classical
music and asked to rate each one using Likert scales representing type and intensity of
emotion and enjoyment. Results showed that participants rated emotions as more positive,
were more aroused and felt more enjoyment where the signal was split between the eight
contactors than when the vibetrack was sent to just a pair of contactors (Karam, et al., 2009).
The researchers found that frequency difference limens (FDLs) were consistently less than a
third of an octave and could be as small as 200 cents (Branje, Maksimowski, Karam, Fels, &
Russo, 2010), meaning that people could reliably distinguish between the vibrations
produced by two pitches one or more tones apart.
Another chair was researched and designed by a cross-departmental team at the National
University of Singapore: the ‘Haptic Chair’ (Figure 6.4). Shakers were attached to a chair
providing VT stimuli to the back, buttocks, arms and feet of the user in order to target as
many parts of the body as possible (as opposed to splitting the frequencies over a single part
of the body). The aim is not to convey precise musical information to users but by
incorporating visual effects in the system to enhance the cross-modal perception of music
(Nanayakkara, 2009; Nanayakkara, Wyse, Ong, & Taylor, 2013). Deaf participants listened
to musical stimuli while rating their enjoyment with and without visual feedback. The results
showed that all participants preferred to have either the haptic feedback alone (54%) or
haptic feedback with visual display (46%) and that, overall, the participants benefitted from
and enjoyed the additional VT feedback (Nanayakkara, Taylor, Wyse, & Ong, 2009).
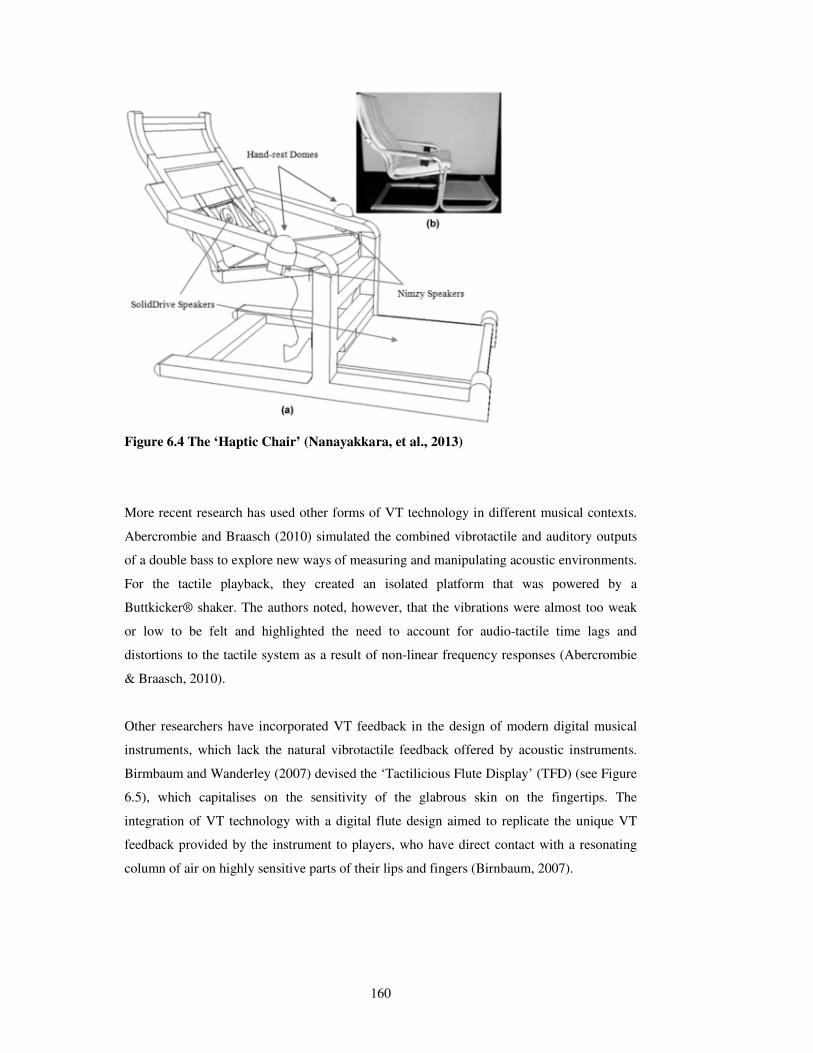
160
Figure 6.4 The ‘Haptic Chair’ (Nanayakkara, et al., 2013)
More recent research has used other forms of VT technology in different musical contexts.
Abercrombie and Braasch (2010) simulated the combined vibrotactile and auditory outputs
of a double bass to explore new ways of measuring and manipulating acoustic environments.
For the tactile playback, they created an isolated platform that was powered by a
Buttkicker® shaker. The authors noted, however, that the vibrations were almost too weak
or low to be felt and highlighted the need to account for audio-tactile time lags and
distortions to the tactile system as a result of non-linear frequency responses (Abercrombie
& Braasch, 2010).
Other researchers have incorporated VT feedback in the design of modern digital musical
instruments, which lack the natural vibrotactile feedback offered by acoustic instruments.
Birmbaum and Wanderley (2007) devised the ‘Tactilicious Flute Display’ (TFD) (see Figure
6.5), which capitalises on the sensitivity of the glabrous skin on the fingertips. The
integration of VT technology with a digital flute design aimed to replicate the unique VT
feedback provided by the instrument to players, who have direct contact with a resonating
column of air on highly sensitive parts of their lips and fingers (Birnbaum, 2007).
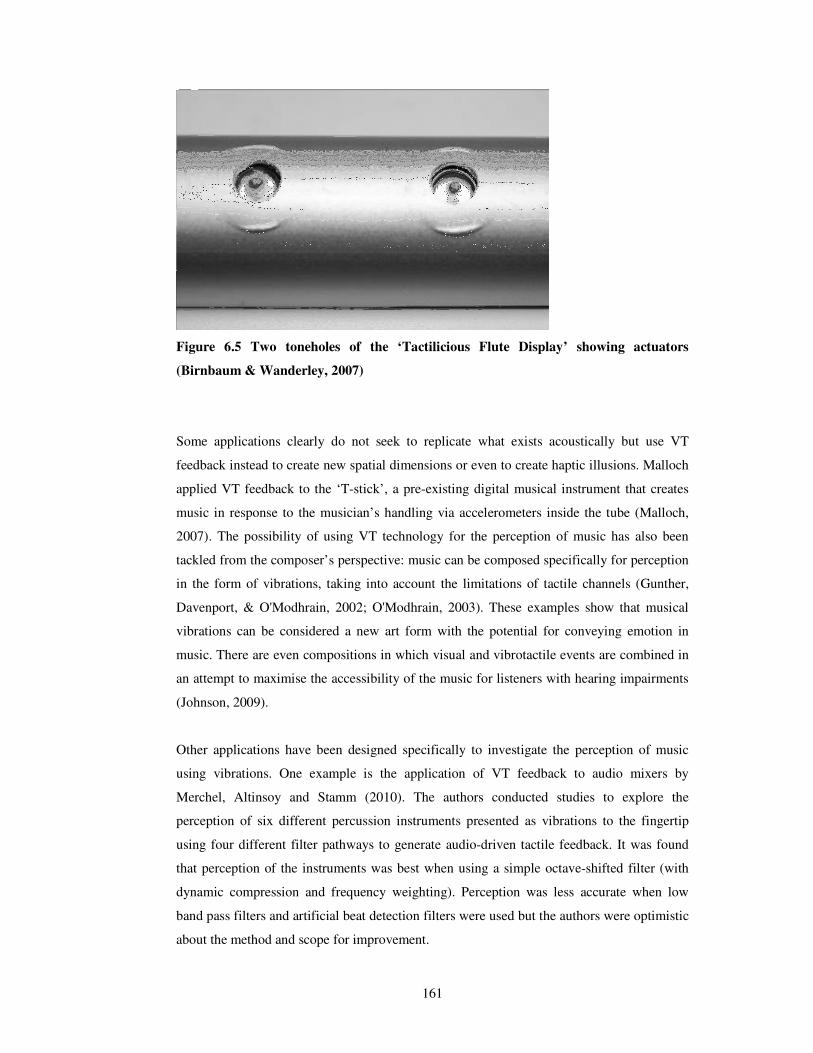
161
Figure 6.5 Two toneholes of the ‘Tactilicious Flute Display’ showing actuators
(Birnbaum & Wanderley, 2007)
Some applications clearly do not seek to replicate what exists acoustically but use VT
feedback instead to create new spatial dimensions or even to create haptic illusions. Malloch
applied VT feedback to the ‘T-stick’, a pre-existing digital musical instrument that creates
music in response to the musician’s handling via accelerometers inside the tube (Malloch,
2007). The possibility of using VT technology for the perception of music has also been
tackled from the composer’s perspective: music can be composed specifically for perception
in the form of vibrations, taking into account the limitations of tactile channels (Gunther,
Davenport, & O'Modhrain, 2002; O'Modhrain, 2003). These examples show that musical
vibrations can be considered a new art form with the potential for conveying emotion in
music. There are even compositions in which visual and vibrotactile events are combined in
an attempt to maximise the accessibility of the music for listeners with hearing impairments
(Johnson, 2009).
Other applications have been designed specifically to investigate the perception of music
using vibrations. One example is the application of VT feedback to audio mixers by
Merchel, Altinsoy and Stamm (2010). The authors conducted studies to explore the
perception of six different percussion instruments presented as vibrations to the fingertip
using four different filter pathways to generate audio-driven tactile feedback. It was found
that perception of the instruments was best when using a simple octave-shifted filter (with
dynamic compression and frequency weighting). Perception was less accurate when low
band pass filters and artificial beat detection filters were used but the authors were optimistic
about the method and scope for improvement.

162
6.1.7 Summary and research questions
In the context of music perception and performance, it can often be unclear to what extent
music is felt on the skin using the cutaneous senses. Sound waves from music can be strong
enough to be felt via bone conduction and using receptors surrounding our internal organs
contributing to our kinaesthetic senses (the movement and relative position of our muscles
and joints, often referred to as proprioceptive feedback). It is easy to see therefore how a
wealth of sensory information surrounding the performing musician may be perceived in
many ways. Nonetheless, there are clearly strong interactions between vibratory and
auditory sensations in humans: when we feel vibrations, we tend to report that we also hear
sounds. Data from brain imaging studies show that vibrotactile stimuli are processed both in
somatosensory areas representing our sense of touch and also (to varying degrees) in parts of
the auditory cortex. This may be due to cross-modal associations learned early in childhood.
Today, VT technology in music typically aims to increase access and enjoyment for listeners
with hearing impairments by augmenting the sensory experience of music with VT feedback
using chair designs (Karam, et al., 2009; Nanayakkara, et al., 2013). Other applications
provide tactile feedback for electronic musical instruments to enhance the playing
experience with no specific focus on musicians with hearing impairments (Birnbaum &
Wanderley, 2007). Most applications involve presenting VT feedback to the palm or
fingertips for practical and ergonomic reasons. Psychophysical factors also support this: the
comparative sensitivity of the fingertips means that the area is less susceptible to age-related
decline in sensitivity. Furthermore, the receptor channel commonly recruited for the VT
perception of music, the PC channel, has relatively stable response characteristics on the
palm or fingertips and is not adversely affected by small changes to contactor location. The
use of VT technologies has shown that vibrations have the potential to influence our
perception of music and evoke emotions that are consistent with those experienced when
listening to music played only in the auditory mode. They can also be used to convey
different timbres. Thus vibrations can be used to augment the conventional auditory
perception of music in the context of listening and even performance. VT technologies tend
to position VT feedback alongside visual and auditory feedback.
Although many applications exist, empirical research on the cognitive and psychophysical
processes involved in the perception of musical information using vibrations is scant: very
few studies are formulated with this aim. Notable exceptions include the study of emotional
responses to music using the Emoti-chair by Karam et al. (2009) and the perception of
various different percussion and tuned instruments using a VT audio mixer by Merchel et al.
163
(2012). Although the neural effects of congenital deafness on VT perception have been
explored (with mixed results), no study has yet addressed the question of how a hearing
impairment may affect the perception of musical information presented as vibrations.
Existing training studies suggest that the perception of pitch using vibrations is a challenge
for everyone and that the perceptual learning of vibrotactile frequency discrimination does
not occur as successfully as with other forms of tactile stimuli (such as static pressure).
Vibrotactile learning on one finger does not tend to transfer successfully to other fingers and
learning to feel pitch in the form of vibrations may present real challenges. Nevertheless,
there is evidence that participants asked to carry out higher-level tasks involving the
abstraction of temporal information from vibrotactile stimuli are more responsive to training
and can transfer learning to different skin locations.
Research questions
In sum, not much is known about the processing of vibrotactile stimuli. The perception of
pitch presented in the form of vibrations was a particular focus, given the aims of the wider
project and the anecdotal evidence provided by Evelyn Glennie. The three experiments
reported below were undertaken to address the following research questions and subsidiary
aims. When musical notes are presented in the form of vibrations…
1. What are the lowest and highest notes that can be detected? (Experiment A, Section
6.2)
a. Identify VPTs for frequencies corresponding to musical notes
b. Find out if a hearing impairment affects VPTs.
2. To what extent can relative pitches of two tones be determined? (Experiment B1,
Section 6.3)
a. Determine the smallest musical interval for which it is possible to identify
the RP of two tones presented to the fingertip as vibrations
b. Quantify the extent to which this ability can be improved with training
c. Find out if a hearing impairment affected RP discrimination ability.
3. To what extent can the specific pitch of each note be identified? (Experiment B2,
Section 6.4)
a. Quantify the extent to which tones be identified and memorised over time
b. Confirm whether a reference tone facilitates learning and accuracy.
164
6.2 Experiment A: Vibrotactile thresholds
In the light of the literature review above and the wider objective of the project to develop
VT technology to help musicians with hearing impairments to perform together in groups,
an initial experiment was designed to address the question:
1. What are the lowest and highest notes that can be detected?
6.2.1 Aims and hypotheses
Two subsidiary aims were established:
a. Identify VPTs for frequencies corresponding to musical notes
b. Find out if a hearing impairment affects VPTs
VPTs vary according to contactor size as well as stimulus frequency. So the same contactor
size had to be used in all studies. The observation of changes in VPTs across the whole
frequency range would provide the basis for setting intensity levels in subsequent tests and
establishing the range for which thresholds are relatively similar (‘flat’). While the effects on
thresholds and difference limens of a multitude of variables, such as age and temperature,
have been explored in psychophysical studies (Section 6.1.2) the potential effects of hearing
impairment are less well documented. While thresholds do not seem to be affected, people
with congenital deafness may be slightly more sensitive to frequency change detection as a
result of neural plasticity and increased attention to VT information (Levänen & Hamdorf,
2001). The present study sought to explore further the effect of naturally occurring hearing
impairments on the VPTs of both hearing and deaf participants for vibrations at frequencies
corresponding to musical ‘pitches’ and ‘notes’, by testing for differences between the
groups.
It was hypothesised that:
a. VPTs would be similar to those reported in psychophysical studies, with the
caveat that those for some pitches may not yet have been tested.
b. VPTs would not be affected by a hearing impairment although this
hypothesis was tentative and differences would therefore still be tested for.
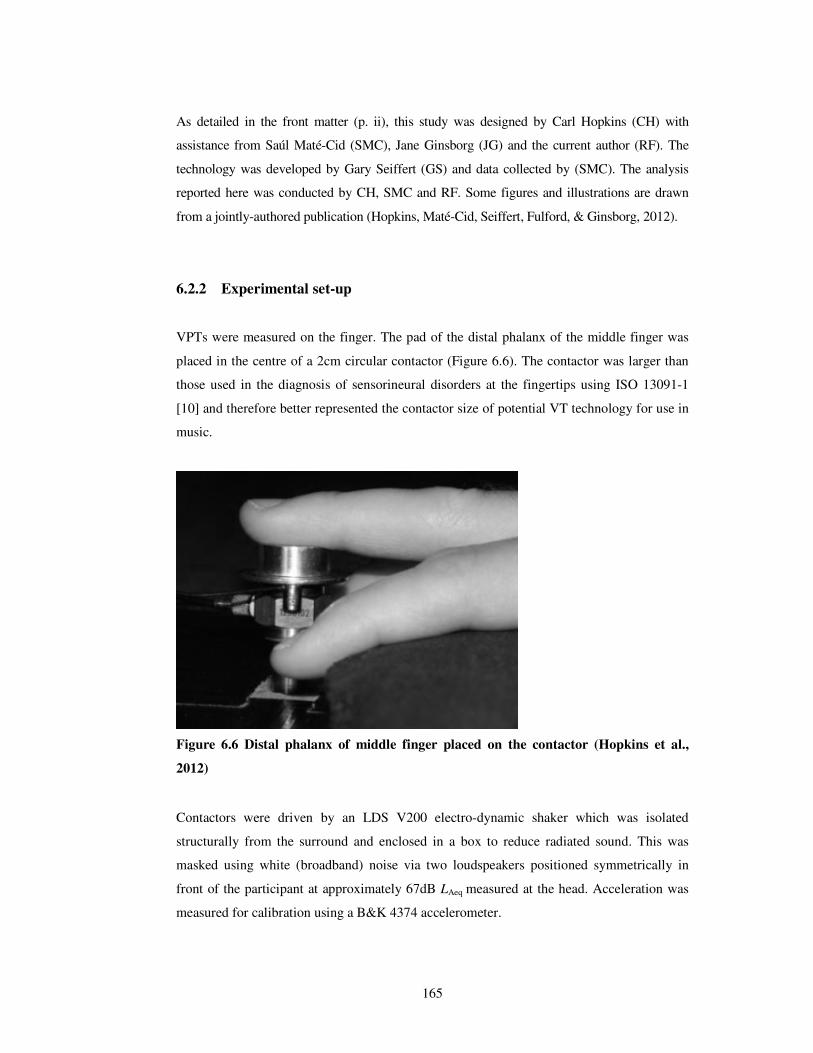
165
As detailed in the front matter (p. ii), this study was designed by Carl Hopkins (CH) with
assistance from Saúl Maté-Cid (SMC), Jane Ginsborg (JG) and the current author (RF). The
technology was developed by Gary Seiffert (GS) and data collected by (SMC). The analysis
reported here was conducted by CH, SMC and RF. Some figures and illustrations are drawn
from a jointly-authored publication (Hopkins, Maté-Cid, Seiffert, Fulford, & Ginsborg, 2012).
6.2.2 Experimental set-up
VPTs were measured on the finger. The pad of the distal phalanx of the middle finger was
placed in the centre of a 2cm circular contactor (Figure 6.6). The contactor was larger than
those used in the diagnosis of sensorineural disorders at the fingertips using ISO 13091-1
[10] and therefore better represented the contactor size of potential VT technology for use in
music.
Figure 6.6 Distal phalanx of middle finger placed on the contactor (Hopkins et al.,
2012)
Contactors were driven by an LDS V200 electro-dynamic shaker which was isolated
structurally from the surround and enclosed in a box to reduce radiated sound. This was
masked using white (broadband) noise via two loudspeakers positioned symmetrically in
front of the participant at approximately 67dB LAeq measured at the head. Acceleration was
measured for calibration using a B&K 4374 accelerometer.
166
6.2.3 Participants
A total of 57 participants took part. Table 6.2 below shows a summary of these participants
by their sex and level of hearing. All except one participant was right-handed.
Table 6.2 Experiment A: Number of participants by sex and hearing level
Male Female TOTAL
Normal hearing 22 20 42
Mild/Mod/Severe deafness 2 6 8
Profound deafness 4 3 7
TOTAL 28 29 57
6.2.4 Procedure
VPTs were determined using an algorithm derived from standard audiometry based on the
shortened version of the ascending method in ISO 8253-1 [13], which involves applying
stimuli with successively increasing intensity until the participant signals that a stimulus has
been detected. Discrete steps were reduced from 5dB to 2dB to give better resolution. Skin
temperature on the distal phalanx was measured every 20 minutes using an infra-red
thermometer to ensure it was between 20 and 36ºC for notes C1 to G2 and between 24 and
36ºC for notes C3 to C6 as recommended by Verrillo and Bolanowski (1967). The stimulus
consisted of a test tone presented three times for 1s each separated by a 2s interval.
Participants were instructed to press a response button whenever they felt a tone. Eleven
tones were presented corresponding to the musical notes C and G in the range C1-C6.
Frequencies were calculated using the ratio 21/12
, in equal temperament, to give the
frequency of notes relative to A4 such that C1 corresponded to 32.7Hz, C4 to 261.6Hz and
C6 to 1046.5Hz. The order of presentation began with C4 (which corresponds approximately
to the optimal sensitivity of the PC channel (Verrillo, 1992) and reflects audiometric
procedure in this respect), ascended to C6 and then descended from G3 to C1. A full account
of the experimental procedure is given in Maté-Cid, Hopkins, Seiffert, Fulford & Ginsborg
(2012) (also included in Appendix L).
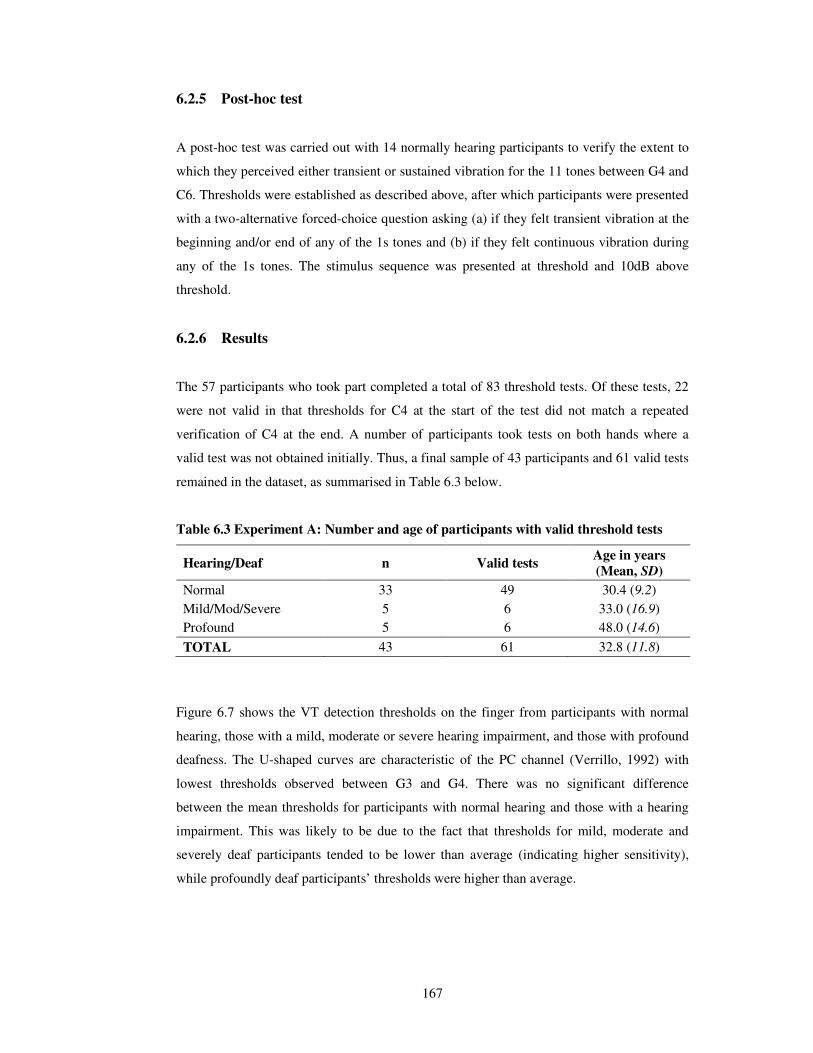
167
6.2.5 Post-hoc test
A post-hoc test was carried out with 14 normally hearing participants to verify the extent to
which they perceived either transient or sustained vibration for the 11 tones between G4 and
C6. Thresholds were established as described above, after which participants were presented
with a two-alternative forced-choice question asking (a) if they felt transient vibration at the
beginning and/or end of any of the 1s tones and (b) if they felt continuous vibration during
any of the 1s tones. The stimulus sequence was presented at threshold and 10dB above
threshold.
6.2.6 Results
The 57 participants who took part completed a total of 83 threshold tests. Of these tests, 22
were not valid in that thresholds for C4 at the start of the test did not match a repeated
verification of C4 at the end. A number of participants took tests on both hands where a
valid test was not obtained initially. Thus, a final sample of 43 participants and 61 valid tests
remained in the dataset, as summarised in Table 6.3 below.
Table 6.3 Experiment A: Number and age of participants with valid threshold tests
Hearing/Deaf n Valid tests Age in years (Mean, SD)
Normal 33 49 30.4 (9.2)
Mild/Mod/Severe 5 6 33.0 (16.9)
Profound 5 6 48.0 (14.6)
TOTAL 43 61 32.8 (11.8)
Figure 6.7 shows the VT detection thresholds on the finger from participants with normal
hearing, those with a mild, moderate or severe hearing impairment, and those with profound
deafness. The U-shaped curves are characteristic of the PC channel (Verrillo, 1992) with
lowest thresholds observed between G3 and G4. There was no significant difference
between the mean thresholds for participants with normal hearing and those with a hearing
impairment. This was likely to be due to the fact that thresholds for mild, moderate and
severely deaf participants tended to be lower than average (indicating higher sensitivity),
while profoundly deaf participants’ thresholds were higher than average.
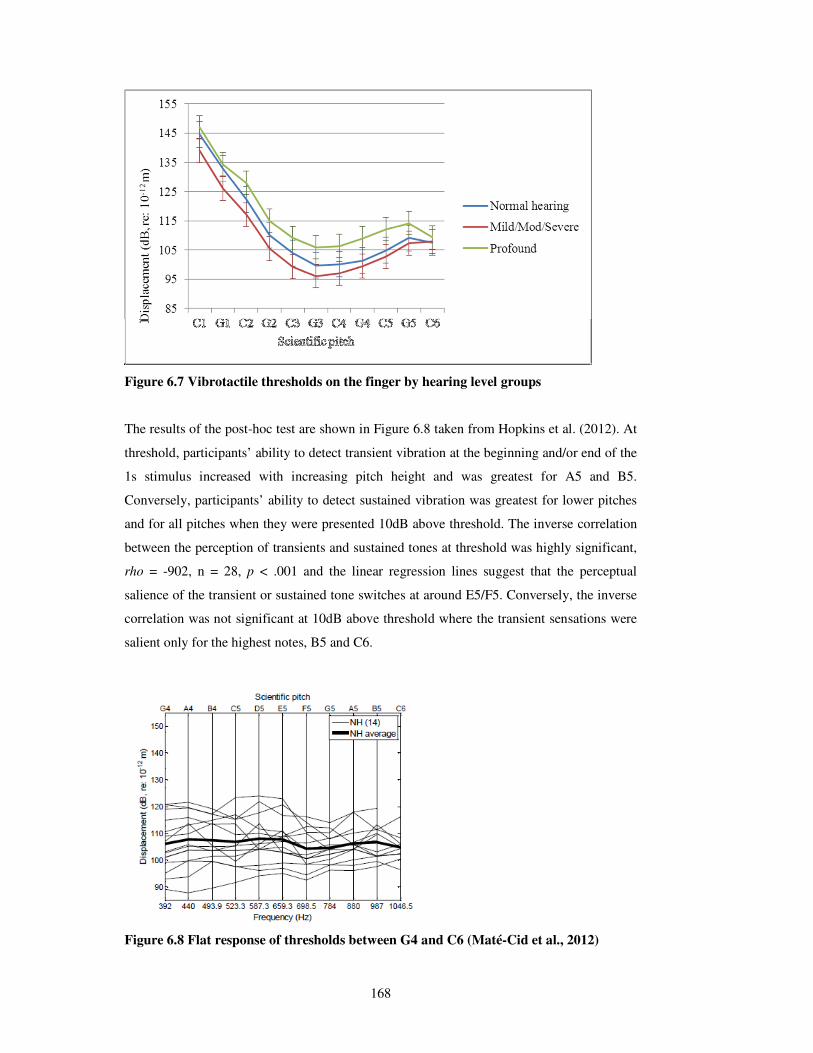
168
Figure 6.7 Vibrotactile thresholds on the finger by hearing level groups
The results of the post-hoc test are shown in Figure 6.8 taken from Hopkins et al. (2012). At
threshold, participants’ ability to detect transient vibration at the beginning and/or end of the
1s stimulus increased with increasing pitch height and was greatest for A5 and B5.
Conversely, participants’ ability to detect sustained vibration was greatest for lower pitches
and for all pitches when they were presented 10dB above threshold. The inverse correlation
between the perception of transients and sustained tones at threshold was highly significant,
rho = -902, n = 28, p < .001 and the linear regression lines suggest that the perceptual
salience of the transient or sustained tone switches at around E5/F5. Conversely, the inverse
correlation was not significant at 10dB above threshold where the transient sensations were
salient only for the highest notes, B5 and C6.
Figure 6.8 Flat response of thresholds between G4 and C6 (Maté-Cid et al., 2012)

169
Figure 6.9 Percentage of participants identifying transient or sustained vibration as
salient
6.2.7 Discussion
Experiment A was designed to confirm VPTs across a range of musical notes and to explore
the idea that a hearing impairment might affect VPTs. It was hypothesised that VTPs would
be similar to those reported in psychophysical studies. Although different studies tested
VTPs for different frequencies, it was possible to compare the shape and position of the
response curves plotted in the present study with those from similar studies reported by
Morioka and Griffin (2005) (see Figure 6.10).
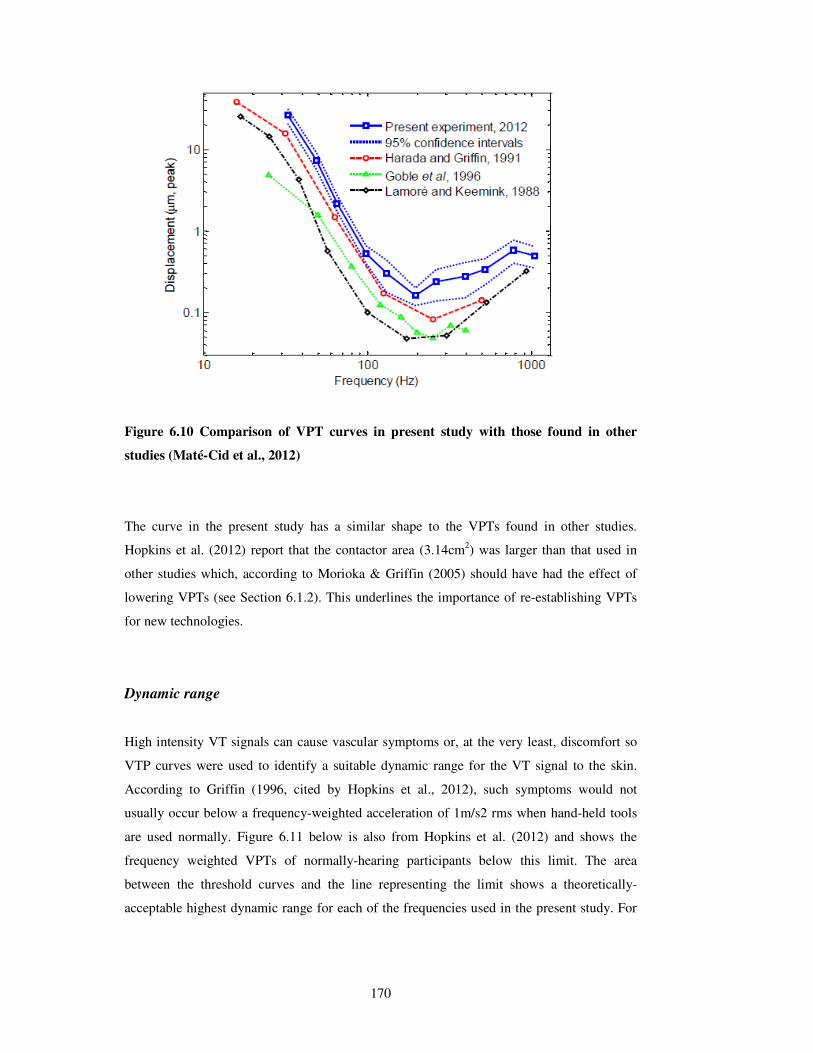
170
Figure 6.10 Comparison of VPT curves in present study with those found in other
studies (Maté-Cid et al., 2012)
The curve in the present study has a similar shape to the VPTs found in other studies.
Hopkins et al. (2012) report that the contactor area (3.14cm2) was larger than that used in
other studies which, according to Morioka & Griffin (2005) should have had the effect of
lowering VPTs (see Section 6.1.2). This underlines the importance of re-establishing VPTs
for new technologies.
Dynamic range
High intensity VT signals can cause vascular symptoms or, at the very least, discomfort so
VTP curves were used to identify a suitable dynamic range for the VT signal to the skin.
According to Griffin (1996, cited by Hopkins et al., 2012), such symptoms would not
usually occur below a frequency-weighted acceleration of 1m/s2 rms when hand-held tools
are used normally. Figure 6.11 below is also from Hopkins et al. (2012) and shows the
frequency weighted VPTs of normally-hearing participants below this limit. The area
between the threshold curves and the line representing the limit shows a theoretically-
acceptable highest dynamic range for each of the frequencies used in the present study. For
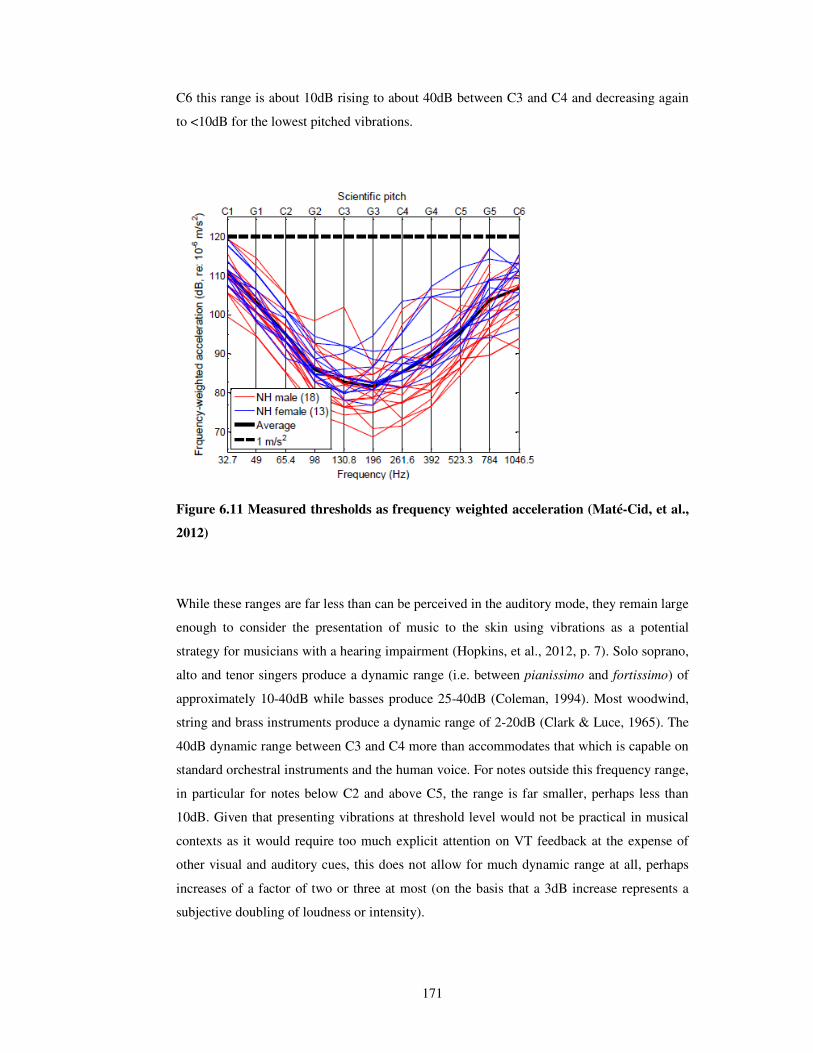
171
C6 this range is about 10dB rising to about 40dB between C3 and C4 and decreasing again
to <10dB for the lowest pitched vibrations.
Figure 6.11 Measured thresholds as frequency weighted acceleration (Maté-Cid, et al.,
2012)
While these ranges are far less than can be perceived in the auditory mode, they remain large
enough to consider the presentation of music to the skin using vibrations as a potential
strategy for musicians with a hearing impairment (Hopkins, et al., 2012, p. 7). Solo soprano,
alto and tenor singers produce a dynamic range (i.e. between pianissimo and fortissimo) of
approximately 10-40dB while basses produce 25-40dB (Coleman, 1994). Most woodwind,
string and brass instruments produce a dynamic range of 2-20dB (Clark & Luce, 1965). The
40dB dynamic range between C3 and C4 more than accommodates that which is capable on
standard orchestral instruments and the human voice. For notes outside this frequency range,
in particular for notes below C2 and above C5, the range is far smaller, perhaps less than
10dB. Given that presenting vibrations at threshold level would not be practical in musical
contexts as it would require too much explicit attention on VT feedback at the expense of
other visual and auditory cues, this does not allow for much dynamic range at all, perhaps
increases of a factor of two or three at most (on the basis that a 3dB increase represents a
subjective doubling of loudness or intensity).
172
Perception of onsets and sustained tones
During threshold tests, several participants reported that for higher-pitched notes they were
aware only of tiny jolts at the onset of stimuli rather than the vibrations themselves. In order
to test this percept, thresholds were obtained for notes between G4 and C6 and participants
were asked whether they felt the onset or the continuous vibration of the tone the most. The
results of this test showed that for notes above E5/F5 at threshold, the onset was salient. At
10dB above threshold, onsets were salient only for the highest two tones, B5 and C6.
Perception of onsets was most likely attributable to the mechanics of the motor itself and the
fact that the highest three notes, A6, B6 and C6, are beyond the upper limit of perception in
the Pacinian channel of 800Hz (Carlson, 2004): A6 = 880Hz. At these high frequencies, it
was therefore easier to perceive the onset of the vibration – subjectively perceived as a tiny
jolt – rather than the length of the sustained vibration itself. This has implications for the
perception of music using vibrations. While limits on the detection of pitch on the skin were
acknowledged from the outset (Section 6.1.1), there may be additional technical challenges
involved in transmitting VT signals at frequencies approaching these upper limits as the
subjective percepts may be altered.
The effect of a hearing impairment on VPTs
Prior research has suggested that reductions in VPTs as a result of a hearing impairment may
be restricted to profound congenital deafness and depend on the task and intensity level of
vibrotactile stimuli (Levänen & Hamdorf, 2001). Statistical tests (Levene’s test for equality
of variances and an independent t-test) revealed no significant differences between two
groups of participants with normal hearing and a severe or profound hearing impairment
(Hopkins et al., 2012). Mean VPT curves were highest for profoundly deaf participants and
lowest for those with mild, moderate or severe impairments (Figure 6.7) suggesting no linear
effect of level of hearing impairment on VPTs. These results are likely to be due to the
idiosyncrasies of the sample. Of the 10 participants with hearing impairments whose test
results were valid and could therefore be included in the analysis, 5 had been profoundly
deaf from birth. While mean thresholds for these participants were generally higher than
those for participants with mild or moderate hearing impairments, the small sample sizes
meant that statistical tests could not accurately identify differences between these groups. To
increase the power of the study and draw more robust conclusions, it would be necessary to
test more participants, particularly those with profound, congenital deafness.
173
6.3 Experiment B1: Relative pitch discrimination
Experiment A enabled the range within which VPTs occurred at similar levels of intensity to
be identified: the two octaves between the notes C3 and C5. Within this range, interaction
effects between intensity and pitch could be minimised. Using this range of notes, the
following study sought to address the research question:
2. To what extent can relative pitches of two tones be determined, when presented as
vibrations?
6.3.1 Aims and hypotheses
Given the variability of existing data on FDLs for VT information, the present study was
designed to identify the smallest musical interval for which it is possible to say that the
second of two notes presented consecutively is higher or lower than the first, in other words
to be able to identify the relative pitches (RP) of two tones. Participants would need this skill
to take part in a follow-up training study exploring the extent to which the vibrations of
specific pitches could be learned. According to Branje et al. (2010) users of the Emoti-chair
were consistently able to distinguish between two notes a third of an octave apart and
sometimes as little as 200 cents (or two equally-tempered semitones) but the authors
acknowledge that more work is needed to establish the effects of contactor size, frequency
range and location on the body. Continuing in the tradition of psychophysical studies, this
experiment aimed to:
a. Determine the smallest musical interval for which it is possible to identify
the RP of two tones presented to the fingertip as vibrations
b. Quantify the extent to which this ability can be improved with training
c. Find out if a hearing impairment affected RP discrimination ability.
It was hypothesised that:
a. The smallest interval would be 2 semitones, although participants would be
consistently able to discriminate the RP of intervals of 4 or more semitones
(Branje, et al., 2010)
b. Training would improve RP discrimination ability
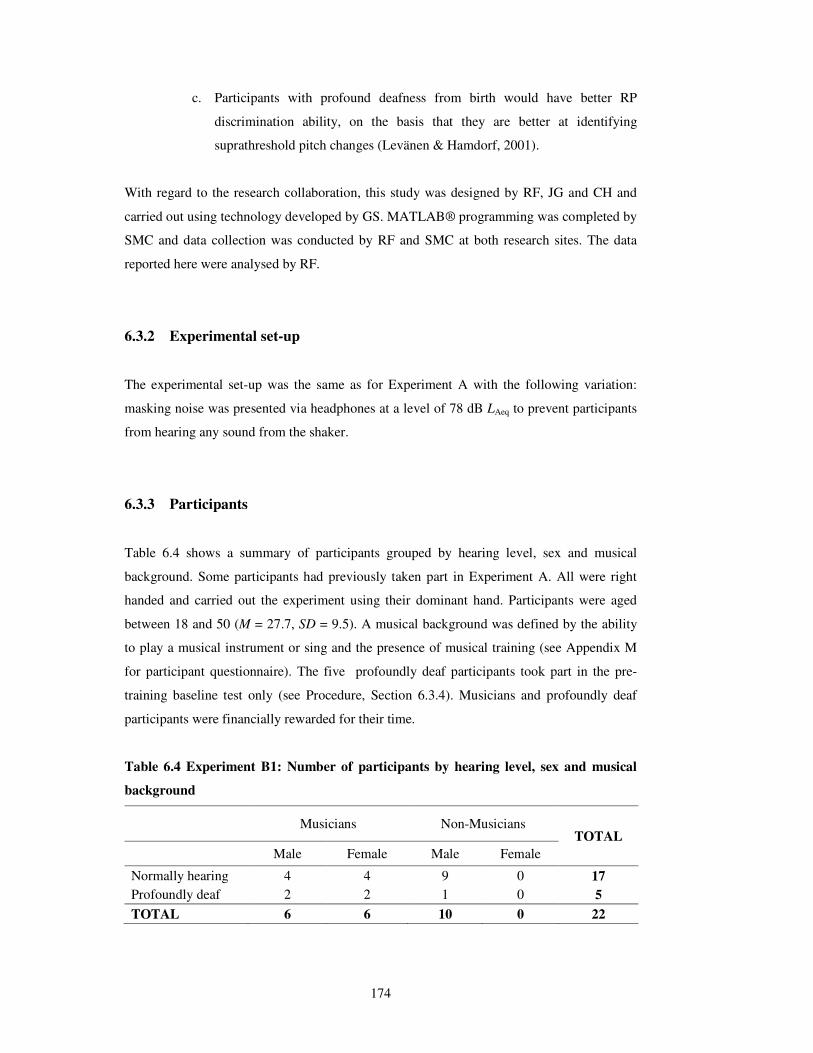
174
c. Participants with profound deafness from birth would have better RP
discrimination ability, on the basis that they are better at identifying
suprathreshold pitch changes (Levänen & Hamdorf, 2001).
With regard to the research collaboration, this study was designed by RF, JG and CH and
carried out using technology developed by GS. MATLAB® programming was completed by
SMC and data collection was conducted by RF and SMC at both research sites. The data
reported here were analysed by RF.
6.3.2 Experimental set-up
The experimental set-up was the same as for Experiment A with the following variation:
masking noise was presented via headphones at a level of 78 dB LAeq to prevent participants
from hearing any sound from the shaker.
6.3.3 Participants
Table 6.4 shows a summary of participants grouped by hearing level, sex and musical
background. Some participants had previously taken part in Experiment A. All were right
handed and carried out the experiment using their dominant hand. Participants were aged
between 18 and 50 (M = 27.7, SD = 9.5). A musical background was defined by the ability
to play a musical instrument or sing and the presence of musical training (see Appendix M
for participant questionnaire). The five profoundly deaf participants took part in the pre-
training baseline test only (see Procedure, Section 6.3.4). Musicians and profoundly deaf
participants were financially rewarded for their time.
Table 6.4 Experiment B1: Number of participants by hearing level, sex and musical
background
Musicians Non-Musicians TOTAL
Male Female Male Female
Normally hearing 4 4 9 0 17
Profoundly deaf 2 2 1 0 5
TOTAL 6 6 10 0 22
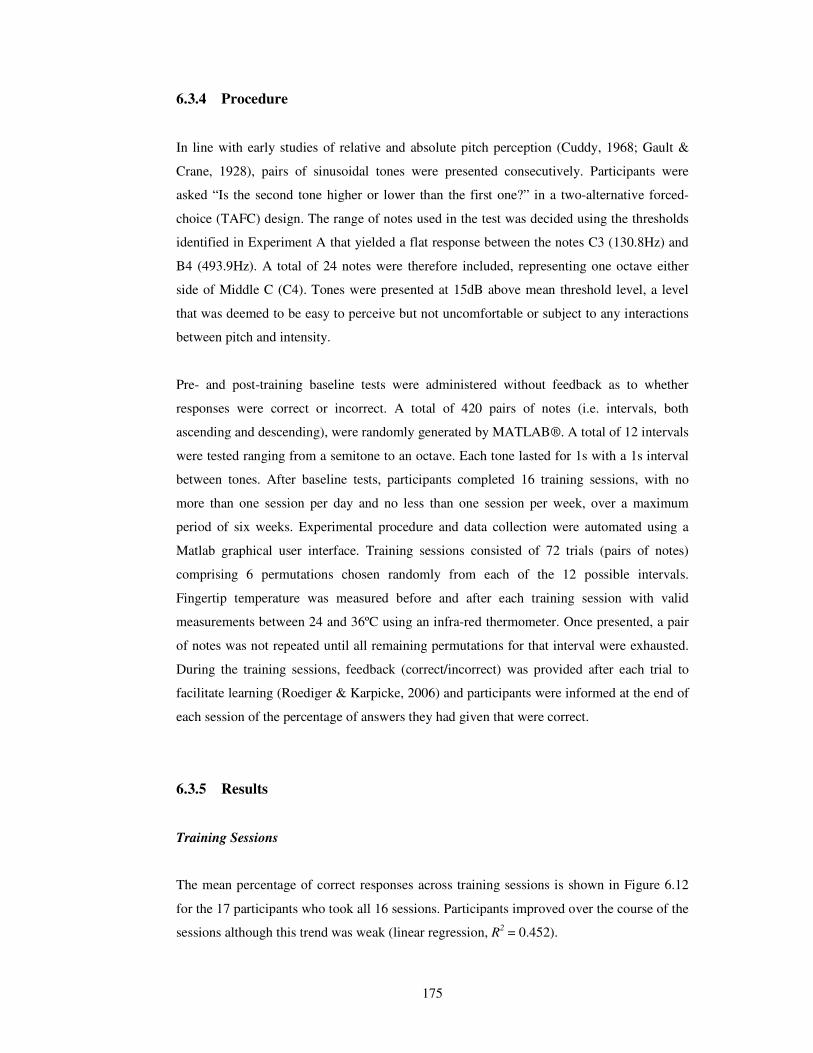
175
6.3.4 Procedure
In line with early studies of relative and absolute pitch perception (Cuddy, 1968; Gault &
Crane, 1928), pairs of sinusoidal tones were presented consecutively. Participants were
asked “Is the second tone higher or lower than the first one?” in a two-alternative forced-
choice (TAFC) design. The range of notes used in the test was decided using the thresholds
identified in Experiment A that yielded a flat response between the notes C3 (130.8Hz) and
B4 (493.9Hz). A total of 24 notes were therefore included, representing one octave either
side of Middle C (C4). Tones were presented at 15dB above mean threshold level, a level
that was deemed to be easy to perceive but not uncomfortable or subject to any interactions
between pitch and intensity.
Pre- and post-training baseline tests were administered without feedback as to whether
responses were correct or incorrect. A total of 420 pairs of notes (i.e. intervals, both
ascending and descending), were randomly generated by MATLAB®. A total of 12 intervals
were tested ranging from a semitone to an octave. Each tone lasted for 1s with a 1s interval
between tones. After baseline tests, participants completed 16 training sessions, with no
more than one session per day and no less than one session per week, over a maximum
period of six weeks. Experimental procedure and data collection were automated using a
Matlab graphical user interface. Training sessions consisted of 72 trials (pairs of notes)
comprising 6 permutations chosen randomly from each of the 12 possible intervals.
Fingertip temperature was measured before and after each training session with valid
measurements between 24 and 36ºC using an infra-red thermometer. Once presented, a pair
of notes was not repeated until all remaining permutations for that interval were exhausted.
During the training sessions, feedback (correct/incorrect) was provided after each trial to
facilitate learning (Roediger & Karpicke, 2006) and participants were informed at the end of
each session of the percentage of answers they had given that were correct.
6.3.5 Results
Training Sessions
The mean percentage of correct responses across training sessions is shown in Figure 6.12
for the 17 participants who took all 16 sessions. Participants improved over the course of the
sessions although this trend was weak (linear regression, R2 = 0.452).
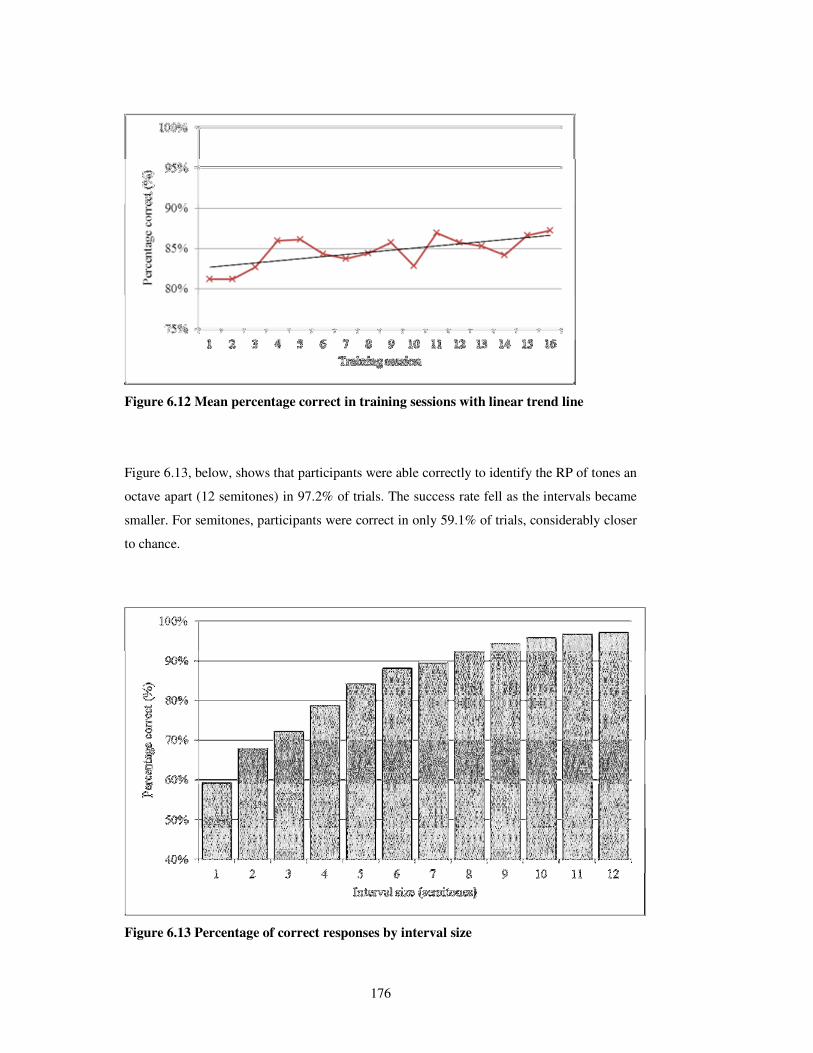
176
Figure 6.12 Mean percentage correct in training sessions with linear trend line
Figure 6.13, below, shows that participants were able correctly to identify the RP of tones an
octave apart (12 semitones) in 97.2% of trials. The success rate fell as the intervals became
smaller. For semitones, participants were correct in only 59.1% of trials, considerably closer
to chance.
Figure 6.13 Percentage of correct responses by interval size
177
Training effects
Figure 6.14 shows the percentage of mean correct responses from individual intervals for
both pre- and post-training by interval. For intervals of a perfect 4th (5 semitones) or larger,
participants scored at least 75% correct both before and after training. The same pattern was
therefore observed, such that the RP of two widely-spaced tones was easier to identify than
tones that were closer together. Across all intervals, the ability to identify the RP of two
tones was significantly higher after training (Median = 87.5%, Range = 54.8) than before
training (Median = 80.3%, Range = 58.7), T = 3888.5, p < .001; representing a medium-
sized effect, r = -.38. This was supported by an increase in the correlation between interval
size and % correct between pre-training (rs = .664, p < .001) and post-training (rs = .842, p <
.001). Improvement on specific intervals was found for larger intervals: participants were
significantly better at identifying the RP of intervals of 9 semitones or more after training
(Median = 96.4%, Range = 21.4) than before training (Median = 95.8%, Range = 50.0), T =
181.5, p = <.001; representing a medium to large effect, r = -.49.
Figure 6.14 Mean percentage of correct responses pre- and post-training
Reaction times
Figure 6.15 below charts mean reaction times within a 3s response window. There was a
significant but weak inverse correlation between training session and reaction time such that
participants’ reaction times decreased over the course of the sessions (rs = -.116, p < .001).
50%
55%
60%
65%
70%
75%
80%
85%
90%
95%
100%
1 2 3 4 5 6 7 8 9 10 11 12
Per
centa
ge
corr
ect
(%)
Interval size (semitones)
Pre-training
Post-training
* * *
*
* significant
at p < .05

178
There was no significant difference, however, between reaction times in the pre- and post-
training baseline tests.
Figure 6.15 Mean reaction times over training sessions
Group comparisons
1) Profoundly deaf (n = 5) and hearing participants (n = 17)
On average, the hearing participants were significantly better at identifying the RP of two
tones presented as vibrotactile stimuli (Median = 80.3, SE = 1.17) than profoundly deaf
participants (Median = 66.0, SE = 2.22), U = 7801.5, z = 3.24, p = .001; however, this only
represented a small effect, r = .20. There was no significant difference between the reaction
times of deaf and hearing participants. Further tests were carried out on subsets of the
sample groups based on musical training. On average, the hearing musicians (n = 8) were
significantly better at identifying RP (Median = 82.4, SE = 1.72) than profoundly deaf
musicians (n = 4) (Median = 63.9, SE = 2.57), U = 3135.0, z = 3.53, p < .001, which
represented a medium-sized effect, r = .29. There was no significant difference between the
reaction times of hearing musicians and deaf musicians.
2) Musicians (n = 8) and non-musicians (n = 9)
Excluding the 5 profoundly deaf participants, musicians’ reaction times were found to be
significantly shorter (Median = 0.51s, SE = 0.01) than those of non-musicians’ (Median =
179
0.55s, SE = 0.02), U = 7165.0, z = -2.88, p = .017, r = .15. There was however, no
significant difference between musicians’ and non-musicians’ ability to identify RP
(Medians = 74.4 and 78.3 respectively, both SE = 1.49).
6.3.6 Discussion
Experiment B1 aimed to determine the extent to which participants could identify the
relative pitches of two notes. They carried out an initial baseline test involving all 420
possible intervals between notes within two octaves (C3 to C5), 16 training sessions and
lastly a repetition of the initial baseline test.
The results confirmed the hypothesis that the RP of two notes further apart would be easier
to identify than two are closer together. They also supported the findings of Branje et al.
(2010) using the Emoti-chair that the smallest interval would lie between 2 and 4 semitones.
The results added further clarity by showing that the RP of intervals of 1 semitone apart
cannot be identified accurately, but that those of 4 semitones (a major third) can be
identified successfully.
It was then hypothesised that the undertaking of a series of training sessions would improve
performance at the task. Results supported this hypothesis. There was a weak linear increase
of the percentage of correct scores over the 16 sessions and task performance was
significantly higher post-training than pre-training. Given that the learning of associations
between vibrations and pitch labels were not required in this study, only comparison,
improvements in task performance within the perceptual limits after training may be
attributed to consolidation of the task procedure. Although the method used in the present
study was different from that used by Spitzer, et al. (2010) involving a ‘higher-lower’ rather
than a ‘same-different’ comparison, it is likely that similar cognitive and neural processes
were involved. Both tasks require the first tone to be held in working memory until the onset
of the second tone, enabling a comparison of frequency-locked neural responses.
Dynamic feedback (‘correct’ / ‘incorrect’) was provided after the responses in the training
sessions on the basis of evidence from studies of memorization showing that such feedback
benefits task performance by allowing for the improvement and consolidation of memory
between tests by either correcting memory errors or providing error correction mechanisms
for low-confidence correct responses (Butler, Karpicke, & Roediger, 2008, p. 918).
180
Anecdotal evidence from the participants about the feedback was positive: most preferred to
know whether they were correct or incorrect between trials.
Improvements in performance over the training sessions, in particular for intervals larger
than 4 semitones, can be attributed to the beneficial effects of consolidation over successive
days on the perception of vibrations on the fingertip and thus changes in the representations
of the fingertip in S1 for the frequencies tested (Hegner, et al., 2007; Salinas, et al., 2000).
Another study of perceptual learning, albeit in the auditory mode, provides an insight into
the effects of exposure on performance using a frequency discrimination task. Wright and
Sabin (2007) found that over 360 trials per day were needed for significant improvement and
proposed a critical threshold for daily exposure above which no additional learning is
possible. By contrast performance on a temporal discrimination task improved after only 72
trials per day. This is consistent with the reverse hierarchy theory (RHT) put forward by
Kaas et al. (2013), which suggests that simple tasks are learned quickly but only once they
have been learned can improvements to sensory perception within the same task be
observed. Reaction times fell over the first 7 training sessions and levelled out thereafter.
This may be an indicator of the consolidation of procedural aspects of the task and of
improvements in perception as a result of training.
With regard to group differences, hearing participants were found to be significantly better
at RP discrimination than the profoundly deaf participants. This disconfirms prior findings
(Levänen & Hamdorf, 2001) and may have been because the sample was skewed in size (5
with hearing impairments, 17 without) and experience: the former were unused to
undertaking such tasks while the latter - musicians and acousticians - were accustomed to
taking part in behavioural research. The wide variety of hearing impairments present in the
sample limit the validity of comparisons between the sample groups: normally hearing and
hearing impaired is therefore a false dichotomy in this case. Similarly, the grouped
comparisons of musicians and non-musicians may also be limited: while musicians’ reaction
times were significantly faster, this may not be due to musical factors. Instead, the
participants’ age and experience of empirical research may have contributed to this finding.

181
6.4 Experiment B2: Absolute pitch perception
6.4.1 Introduction
This study was designed to address speculations about the extent to which Evelyn Glennie
might have been able to learn to recognise different pitches using vibrations, enabling her to
map these vibrations to her existing sense of absolute pitch which was increasingly deprived
of auditory input throughout her teenage years (Glennie, 1990). It was also deemed crucial
to quantify the extent to which discrete vibrotactile sensations can be identified given the
lack of empirical evidence for this. It was speculated that if labels could be assigned to
discrete VT sensations, then one might, in theory, be able to learn to identify the
relationships between them in the same way that musicians can abstract interval
relationships between auditory pitches. For example, different cognitive processes may be
involved in interval identification for AP and RP possessors: RP possessors (most trained
musicians) learn to recognise intervals by comparing it to a known melody or counting the
distance in tones or semitones whereas AP possessors (a minority of musicians) can identify
each tone in absolute terms. In this study it was presumed that participants would not have
any previously learned sense of pitch recognition for vibrations.
Experiment B1 showed that as musical intervals decreased towards one semitone, RP
discrimination fell towards 50% (chance level) suggesting that, for the most part,
participants were guessing whether one tone was higher or lower than the other. Given that
they could identify the RP of two notes 2 semitones apart with reasonable accuracy, and that
accuracy improved rapidly as intervals increased to 9 semitones, it would be possible to find
out if associations could be learned between VT information and their pitch labels when
presented in the context of large enough intervals – in other words, to establish if vibrations
could be identified as belonging to a specific pitch chroma (e.g. D or F#). The present study
addressed the question:
3. To what extent can the specific pitch of each note be identified, when presented as
vibrations?
Glennie implies that she learned to do this, to some degree, by mapping the physical
sensations of the vibrations from her timpani to her existing sense of absolute pitch of which
she made use before she lost her hearing (Glennie, 2010b). There is also anecdotal evidence
that Paul Whittaker has used a similar technique to identify the pitch of a sung note by
182
feeling the throat of the singer (as demonstrated at a recent British Voice Association event:
http://www.britishvoiceassociation.org.uk/events_lend-me-your-ears_2013.htm). Research
on absolute pitch (AP) and pitch perception using the cutaneous senses suggests that the
development of the skills described by Glennie and Whittaker is unlikely to be
straightforward. Auditory AP is a rare ability resulting from the complex interplay between
genetic and environmental factors (see Chapter 2, Section 2.2.3). However, some researchers
argue that we all have AP abilities as demonstrated by the tendency to recall well-known
songs consistently in the same key (Bergeson & Trehub, 2002; Halpern, 1989). Physical
factors including proprioceptive feedback may contribute to this ability but there is no
specific empirical evidence as to the role of vibrations.
6.4.2 Aim, questions and hypotheses
The experiment aimed to determine the extent to which participants could learn to associate
tones presented as VT information with pitch labels with the following aims:
a. Quantify the extent to which tones be identified and memorised over time
b. Confirm whether a reference tone facilitates learning and accuracy
It was hypothesised that
a. Participants would only be able to identify a small number of tones, a large distance
apart.
b. Accuracy would improve when a reference tone was provided, since this would
allow participants to identify the RP of the two notes.
As in Experiment B1, this study was designed by RF with assistance from JG and CH.
Technology was developed by GS and MATLAB® programming completed by SMC. The
data reported here were collected and analysed by RF at the Royal Northern College of
Music.
183
6.4.3 Experimental set-up
Vibrations were presented to the distal pad of the fingertip 15 dB above threshold, as in
Experiment B1. Participants were asked to identify them using a two-octave piano keyboard
(ION Discover Keyboard USB) programmed to produce VT frequencies corresponding to
the pitches C3 to C5. Given that RP for semitones was close to chance in Experiment B, the
smallest interval presented was 2 semitones (RP correctly identified in 67.8% of trials). The
‘tone-bank’ available on the keyboard therefore consisted of C3, D3, E3, G3, A3, C4
(middle C), D4, E4, G4, A4 and C5.
6.4.4 Participants
18 normally hearing participants were recruited, aged between 18 and 57 (M = 23.4, SD =
8.9). All undertook an online pre-test of AP ability with permission from Glenn
Schellenberg (University of Toronto) and 9 were found to possess AP (see Table 6.5). All
participants were right handed and carried out the experiment using their dominant hand.
Table 6.5 Experiment B2: Number of participants by sex and AP ability
Male Female TOTAL
AP 5 4 9
Non-AP 4 5 9
TOTAL 9 9 18
6.4.5 Procedure
Participants completed 9 training sessions over a maximum of 4 weeks with minimum and
maximum inter-session intervals of 1 day to 1 week. Each session consisted of a study
period followed by two tests (STT). Table 6.6 shows the length of time for each study and
test period and the number and pitches of the tones used in each session. In Session 1, for
example, the tone-bank consisted of C4, C3 and C5. During the study period participants
explored these tones freely by pressing the piano keys and feeling the corresponding
vibrations. Every study period began with 30s devoted to familiarisation with C4 only, the
‘reference tone’. Each depression of a piano key resulted in a 1s vibration via the fingertip
contactor. In both tests, two sinusoid tones, each lasting 1s, were presented with a 1s pause
between tones. In Test 1, the first tone was always the reference tone (C4) followed by a test
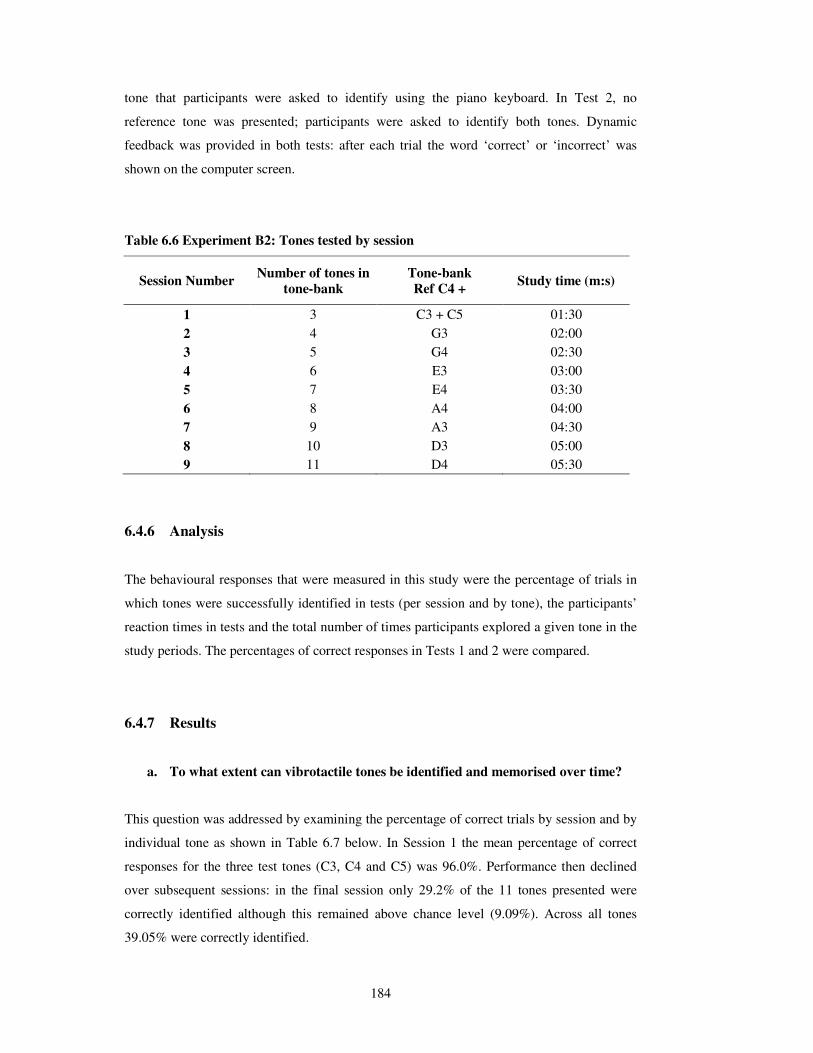
184
tone that participants were asked to identify using the piano keyboard. In Test 2, no
reference tone was presented; participants were asked to identify both tones. Dynamic
feedback was provided in both tests: after each trial the word ‘correct’ or ‘incorrect’ was
shown on the computer screen.
Table 6.6 Experiment B2: Tones tested by session
Session Number Number of tones in
tone-bank Tone-bank Ref C4 +
Study time (m:s)
1 3 C3 + C5 01:30
2 4 G3 02:00
3 5 G4 02:30
4 6 E3 03:00
5 7 E4 03:30
6 8 A4 04:00
7 9 A3 04:30
8 10 D3 05:00
9 11 D4 05:30
6.4.6 Analysis
The behavioural responses that were measured in this study were the percentage of trials in
which tones were successfully identified in tests (per session and by tone), the participants’
reaction times in tests and the total number of times participants explored a given tone in the
study periods. The percentages of correct responses in Tests 1 and 2 were compared.
6.4.7 Results
a. To what extent can vibrotactile tones be identified and memorised over time?
This question was addressed by examining the percentage of correct trials by session and by
individual tone as shown in Table 6.7 below. In Session 1 the mean percentage of correct
responses for the three test tones (C3, C4 and C5) was 96.0%. Performance then declined
over subsequent sessions: in the final session only 29.2% of the 11 tones presented were
correctly identified although this remained above chance level (9.09%). Across all tones
39.05% were correctly identified.
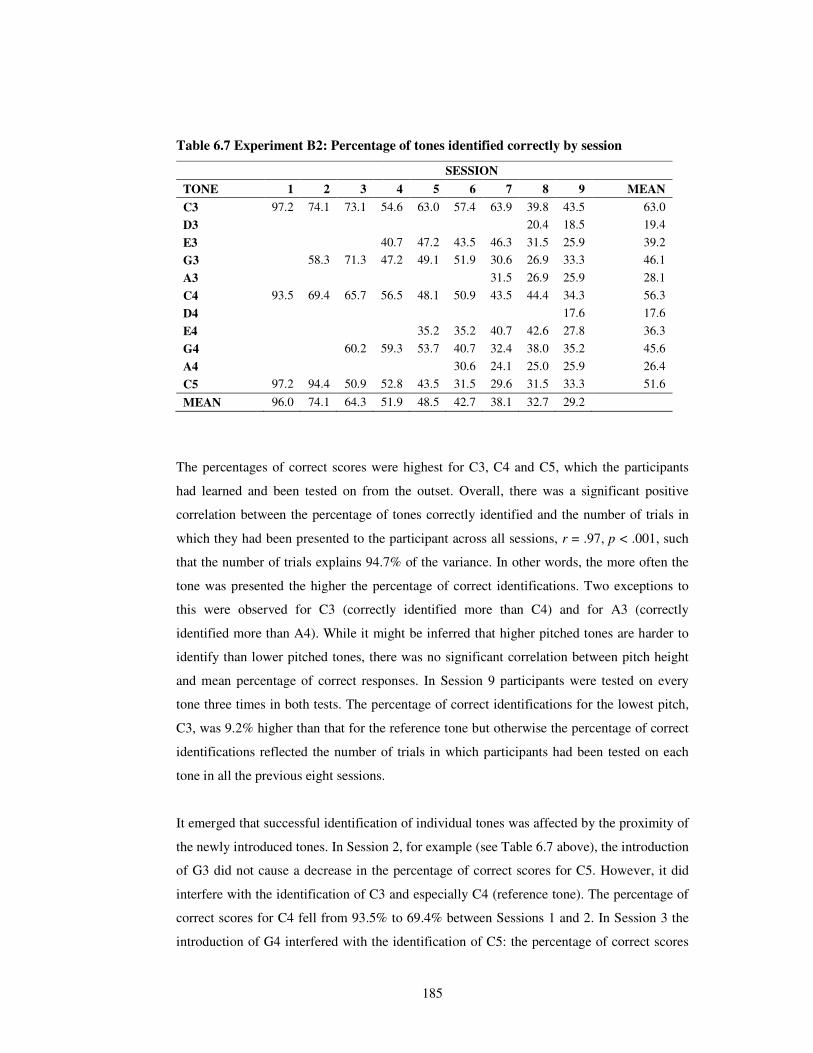
185
Table 6.7 Experiment B2: Percentage of tones identified correctly by session
SESSION
TONE 1 2 3 4 5 6 7 8 9 MEAN
C3 97.2 74.1 73.1 54.6 63.0 57.4 63.9 39.8 43.5 63.0
D3 20.4 18.5 19.4
E3 40.7 47.2 43.5 46.3 31.5 25.9 39.2
G3 58.3 71.3 47.2 49.1 51.9 30.6 26.9 33.3 46.1
A3 31.5 26.9 25.9 28.1
C4 93.5 69.4 65.7 56.5 48.1 50.9 43.5 44.4 34.3 56.3
D4 17.6 17.6
E4 35.2 35.2 40.7 42.6 27.8 36.3
G4 60.2 59.3 53.7 40.7 32.4 38.0 35.2 45.6
A4 30.6 24.1 25.0 25.9 26.4
C5 97.2 94.4 50.9 52.8 43.5 31.5 29.6 31.5 33.3 51.6
MEAN 96.0 74.1 64.3 51.9 48.5 42.7 38.1 32.7 29.2
The percentages of correct scores were highest for C3, C4 and C5, which the participants
had learned and been tested on from the outset. Overall, there was a significant positive
correlation between the percentage of tones correctly identified and the number of trials in
which they had been presented to the participant across all sessions, r = .97, p < .001, such
that the number of trials explains 94.7% of the variance. In other words, the more often the
tone was presented the higher the percentage of correct identifications. Two exceptions to
this were observed for C3 (correctly identified more than C4) and for A3 (correctly
identified more than A4). While it might be inferred that higher pitched tones are harder to
identify than lower pitched tones, there was no significant correlation between pitch height
and mean percentage of correct responses. In Session 9 participants were tested on every
tone three times in both tests. The percentage of correct identifications for the lowest pitch,
C3, was 9.2% higher than that for the reference tone but otherwise the percentage of correct
identifications reflected the number of trials in which participants had been tested on each
tone in all the previous eight sessions.
It emerged that successful identification of individual tones was affected by the proximity of
the newly introduced tones. In Session 2, for example (see Table 6.7 above), the introduction
of G3 did not cause a decrease in the percentage of correct scores for C5. However, it did
interfere with the identification of C3 and especially C4 (reference tone). The percentage of
correct scores for C4 fell from 93.5% to 69.4% between Sessions 1 and 2. In Session 3 the
introduction of G4 interfered with the identification of C5: the percentage of correct scores
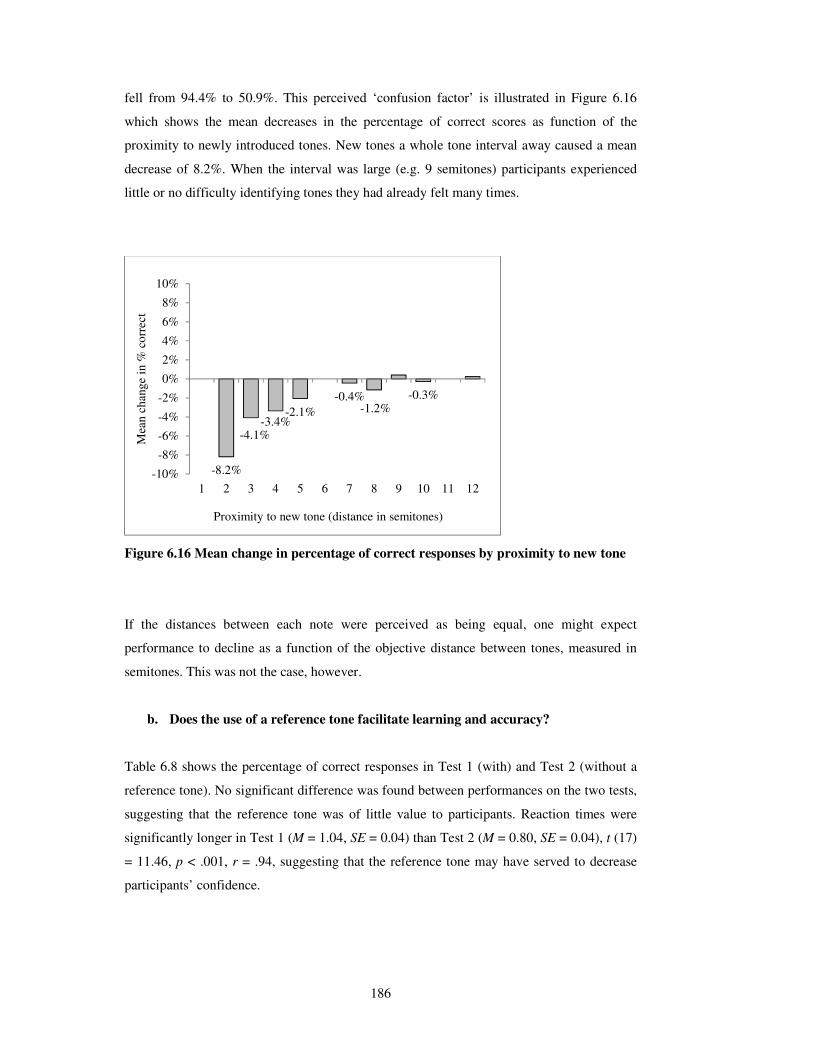
186
fell from 94.4% to 50.9%. This perceived ‘confusion factor’ is illustrated in Figure 6.16
which shows the mean decreases in the percentage of correct scores as function of the
proximity to newly introduced tones. New tones a whole tone interval away caused a mean
decrease of 8.2%. When the interval was large (e.g. 9 semitones) participants experienced
little or no difficulty identifying tones they had already felt many times.
Figure 6.16 Mean change in percentage of correct responses by proximity to new tone
If the distances between each note were perceived as being equal, one might expect
performance to decline as a function of the objective distance between tones, measured in
semitones. This was not the case, however.
b. Does the use of a reference tone facilitate learning and accuracy?
Table 6.8 shows the percentage of correct responses in Test 1 (with) and Test 2 (without a
reference tone). No significant difference was found between performances on the two tests,
suggesting that the reference tone was of little value to participants. Reaction times were
significantly longer in Test 1 (M = 1.04, SE = 0.04) than Test 2 (M = 0.80, SE = 0.04), t (17)
= 11.46, p < .001, r = .94, suggesting that the reference tone may have served to decrease
participants’ confidence.
-8.2%
-4.1%-3.4%
-2.1%
-0.4%-1.2%
-0.3%
-10%
-8%
-6%
-4%
-2%
0%
2%
4%
6%
8%
10%
1 2 3 4 5 6 7 8 9 10 11 12
Mea
n c
han
ge
in %
co
rrec
t
Proximity to new tone (distance in semitones)

187
Table 6.8 Experiment B2: Percentage of correct responses by test and session
Session 1 2 3 4 5 6 7 8 9
% correct T1 96.3 75.0 62.2 52.8 46.3 40.7 39.9 34.6 29.8
% correct T2 95.7 73.1 66.3 50.9 50.8 44.7 36.2 30.7 28.6
% correct TOTAL 96.0 74.1 64.3 51.9 48.5 42.7 38.1 32.7 29.2
Table 6.9 below shows the percentage of trials spent on each tone in study sessions and
session means. The tone studied the most was the C4 reference tone which was played far
more than average across all sessions. The tone studied the least was the highest tone in the
tonebank, C5. In general, tones in the lower octave (D3 – A3) were studied more than
average, while those in the higher octave (D4 – A4) were studied less than average.
Table 6.9 Experiment B2: Number of study session trials per tone (% of total)
SESSION
TONE 1 2 3 4 5 6 7 8 9 MEAN
C3 32.6 18.8 16.6 18.1 13.1 7.8 8.8 10.1 9.2 15.0
D3 9.0 7.3 8.2
E3 26.1 14.3 9.5 12.9 12.2 9.1 14.0
G3 39.4 20.2 20.0 11.7 8.4 12.9 9.6 9.5 16.5
A3 13.0 9.1 8.4 10.2
C4 38.3 33.5 26.5 17.1 22.8 22.3 20.8 20.0 20.0 24.6
D4 8.1 8.1
E4 13.6 10.7 7.8 9.6 8.9 10.1
G4 21.0 8.8 12.8 14.7 8.3 6.9 7.5 11.4
A4 15.2 7.5 6.0 5.5 8.6
C5 29.2 8.4 15.8 9.9 11.6 11.4 8.1 7.5 6.5 12.0
MEAN 33.4 25.0 20.0 16.7 14.3 12.5 11.1 10.0 9.1
6.4.8 Discussion
The literature review above (6.1) cited anecdotal evidence that Evelyn Glennie learned to
map the vibrations she felt from her timpani to her existing auditory sense of absolute pitch,
allowing her to identify the pitch of different vibrations. Given the lack of empirical
evidence for this, Experiment B2 sought to explore the extent to which associations between
vibrations and their note labels could be learned and whether the use of a reference tone
would help. It was hypothesised that participants would only be able to consistently identify

188
a small number of tones, a wide interval apart, over subsequent sessions and that the
presence of a reference tone would improve accuracy.
Results showed that identification of three tones, each an octave apart, was achieved with
almost 100% accuracy. This was an expected finding: ad hoc tests in the laboratory
confirmed that tones an octave apart could be identified as discrete sensations. This may be
due to perceptual distinctiveness as a result of different neural channels responding to
stimuli of different frequencies. For example, 261.6Hz (C4) is an optimal frequency to be
perceived by the Pacinian corpuscles (PC) but outside the perceptual field of the RA I
channel. The frequency 523.3Hz (C5) is at the upper end of the perceptual field of the PC
channel and although 130.8Hz (C3) is not in the optimum range of perception for either the
RA I or PC afferent channels it may be perceived to some extent by both (Carlson, 2004).
Although all tones were presented as vibrations, the relative mix of mechanoreceptors
stimulated as a result may contribute to the perceptual distinctiveness necessary for the task.
The introduction of new tones in subsequent sessions compromised participants’ ability to
successfully identify these three original tones. New tones introduced within a distance of 5
semitones (a perfect fourth) produced a confusion effect such that the new tone and the tones
nearby were not easily distinguished apart, either in the presence of a reference tone, or in
isolation, thus reducing the % correct scores. The explanation of perceptual distinctiveness
can be extended to account for this result: once further tones were introduced, participants
lost their ability to associate the notes they had learned with pitch labels because their
perceptual distinctiveness was reduced.
The reference tone itself did not have a beneficial effect on performance, suggesting that RP
processing also depends on perceptual distinctiveness: if the vibration rates of two notes are
so similar that they cannot be accurately distinguished, then it follows that RP discrimination
will not assist in AP identification. Judgements about rates of vibrations of tones are bound
up in their perceptual distinctiveness. Experiment B1 showed that RP discrimination is
accurate for two tones > 9 semitones (major 6th) apart. Experiment B2 suggests that
perceptual distinctiveness is compromised for tones < 5 semitones apart which may explain
why RP discrimination ability declines as tones become closer.
The discussion of RP ability above (Section 6.1.5) raised the point that we are able to hold a
vibrotactile trace in working memory long enough to compare it to a second tone enabling us
to perform pitch comparison tasks. The question of how long such VT traces can remain in
pre-frontal regions and be available for useful comparison with a second tone is not known.
189
It is likely that VT traces are not as stable as auditory representations held in the acoustic
store used for the abstraction of audible intervals, for example. It has been proposed that
expert performers are able to increase the performance of short term working memory by
accessing domain specific information in long term memory (Ericsson & Kintsch, 1995).
Further research is necessary to identify how long vibrotactile representations for specific,
perceptually distinct tones can be retained over time in S1 and if these longer term memory
traces can be drawn on in absolute pitch identification tasks.
The identification of the three tones presented as vibrations in this study involved a
combination of absolute and relative pitch processing: the perception of discrete vibrations
was a pre-requisite for the comparison of the relative speeds of vibration of the three tones,
enabling successful task performance in Session 1. True absolute perception, however,
requires no comparison, either with a reference tone or with a trace in long term memory.
We do not talk about remembering that certain colours are red: absolute memory for colour
frequencies means we can identify, imagine and reproduce different shades of red such as
scarlet and maroon.
The design of Experiment B2 was flawed by the confounding effects of repeated exposure to
existing tones over subsequent sessions and the newly introduced tone in each session. It
was hypothesised that training would have a positive effect on task performance. Results
supported this hypothesis to the extent that the percentage of correct scores varied as a
function of the number of trials, suggesting that additional exposure to tones provided over
the sessions facilitated correct identification. However, the introduction of new tones each
session had a negative effect as observed by sharp decreases in the percentage of correct
figures for tones adjacent or within 4 semitones of a newly introduced tone. As such, the
results cannot fully support the hypothesis that training facilitated the identification of tones
in this study, although the results suggest this was the case. Nonetheless, identifying
confusion thresholds may be useful: discriminating the RP of tones a whole tone apart may
be possible but this ability may be affected by the proximity of other tones < 5 semitones
away.
190
6.5 Conclusions
This chapter presented literature relating to the neurophysiology of the sense of touch, the
perception of pitch using vibrations and existing VT technologies designed for use in
musical contexts. Following this, three experiments about the perception of pitch using
vibrations were reported:
• The results of the VT threshold test (Experiment A, Section 6.2) suggested that a
hearing impairment does not affect detection thresholds of vibrations on the skin.
The threshold curves indicated that the potential dynamic range available for
musicians using VT feedback is between 10 and 40dB for pitches between the
pitches C1 and C6. A post-hoc test confirmed subjective reports that transient
sensations at the onset and/or end of vibrotactile tones were more salient than
sustained vibrations for higher notes but the effect was reduced at 10dB above
threshold.
• Experiment B1 (6.3) confirmed that it is easier to identify the relative pitch of tones
when they are separated by larger intervals than smaller intervals. Training sessions
resulted in a significant improvement only for intervals of 9 semitones (major 6th) or
more but reaction times decreased overall. Hearing participants performed the task
more successfully than profoundly deaf participants. Those with musical training did
not perform better than those without, although their reaction times were shorter.
• Experiment B2 (6.4) showed that the identification of VT tones is aided by their
perceptual distinctiveness; three tones, each an octave apart, were identified with
almost 100% accuracy. New tones introduced less than 5 semitones away (perfect
4th) from the test tone produced a confusion effect such that performance on the test
tone decreased. The use of a reference tone did not facilitate identification of VT
pitches.
The next and final chapter will consider how vibrotactile perception may be integrated with
visual and auditory perception in interactive musical performance, combining the anecdotal
evidence reported in Chapter 3 and the behavioural results from the two observational
studies reported in Chapters 4 and 5 with the psychophysical data from the three empirical
studies reported in this chapter.
191
CHAPTER 7 - EVALUATION
This thesis has explored the ways in which hearing impairments affect interactive musical
performance. The experiences of musicians with hearing impairments reported in Chapter 3
were used to inform the observational studies reported in Chapters 4 and 5 that were
designed to address the first of two main research questions:
1. How do musicians with hearing impairments rehearse and perform music together,
and with other musicians that have normal hearing?
The thesis has also explored the possibility that vibrotactile (VT) feedback may facilitate
interactive performance. A series of psychophysical studies about the perception of pitch
using vibrations were reported in Chapter 6. In this concluding chapter, the results of all
studies are evaluated together and ideas for future research are presented. In addition, some
potential scenarios for integrating VT feedback into musical performance will be proposed.
In this way, the second main research question will be addressed:
2. How can vibrotactile technology be used to help them do so more effectively?
7.1 Summary of findings
It was identified in Section 2.1 that despite the existence of case studies and primary source
evidence, very little empirical research has explored how musicians with profound deafness
can perform music at all, let alone with other musicians. Many challenges affecting
musicians with hearing impairments, and the strategies adopted to address them, were
revealed in the interviews reported in Chapter 3, namely:
• Deafness and hearing impairments affect musicians’ choices of instrument,
preferences for different ensembles and spatial locations within them, but not
motivations for performing or learning about music
• Staying in time or achieving ensemble synchrony and staying in tune with co-
performers are two of the biggest challenges encountered
• Ensemble synchrony is most commonly achieved using visual cues
• Good tuning can be facilitated using a combination of physical and VT cues
• Auditory listening styles ranged from attending and discriminate-attending to non-
attending

192
• Vibrations were found to be desirable but generally not relied upon in performance,
although they may be used to assist tuning.
These findings strongly suggest that deafness and hearing impairments affect the way
musicians attend to sensory, particularly auditory and visual, information in performance
situations. Sensory cues may be relied upon, attended to, or ignored, depending on personal
preference and the demands of the situation. Observational studies were conducted to
explore this further. Existing research on visually-perceived movement in music focuses
largely on the performer-audience pathway; there is little research exploring the use of
movement by co-performers (Section 2.2), although this was highly salient to the interview
participants, as shown in Chapter 3. In the first observational study, reported in Chapter 4,
the auditory and visual feedback available to performers in violin duos was manipulated. It
was found that:
• Performers looked towards their co-performers more when there was potential for
eye contact (two-way looking)
• Performers also moved more when there was potential for eye contact
• Attenuation of auditory feedback of ~35dB did not adversely affect looking
behaviour, players’ movements or their ensemble synchrony.
These findings suggest that mild or moderate hearing impairments should not affect
performance behaviours or players’ ability to keep time with each other. They also reflect
previous findings that music stimulates ancillary movement (Davidson, 1993; Wanderley &
Vines, 2006), but that some movements can be exaggerated for co-performers’ benefit,
supporting the idea that these movements are communicative and therefore gestural
(Kendon, 2004). The review of the literature on cross-modal communication and perception
in music (Section 2.2) concluded that hearing impairments should not negatively affect non-
verbal communication processes in music involving visual and physical (including gestural)
cues but that there is a lack of research linking sensory compensation mechanisms to
musical contexts. A second observational study (Chapter 5) examined the effects of natural
deafness and hearing impairments on communication behaviours in flute-piano duos
including looking, talk and gesture. It was found that:
• Profoundly deaf musicians looked more towards co-performers than hearing
musicians but the effect of hearing impairment on looking behaviour was not linear
• All performers tended to reciprocate the looking behaviour of their co-performer

193
• Profoundly deaf musicians used more speech gestures perhaps due to their
familiarity with visuo-spatial communication as a result of fluency in BSL
• The proportion of rehearsal time spent talking increased with increasing hearing
impairment and there was an associated, reciprocal effect on co-performers
• Profoundly deaf musicians spent less time on positive play modes and
proportionally more time troubleshooting.
The study supported the idea that mild or moderate hearing impairments do not substantially
affect musical performance behaviours any more than social factors such as age, perceived
expertise, (un)familiarity and personal idiosyncrasies. Lifelong profound deafness, however,
affects communication in music performance most likely because it affects the development
of verbal and non-verbal communication in general. Although some effects may be
perceived as negative, others are positive: enhanced visual attending carries many benefits in
interactive performance. Similarly, the hierarchical nature of Seddon and Biasutti’s (2009)
Modes of Communication scheme can be challenged in that profoundly deaf musicians
remain capable of tackling high-level, stylistic and interpretative issues, even when
struggling to maintain ensemble synchrony.
Given the wider purpose of the project (outlined in Chapter 1) alongside reports of
musicians using VT feedback to perceive musical sounds (Bartlmä, 2008; Glennie, 1990)
and to assist in the tuning of percussion and string instruments (Fulford, Ginsborg, &
Goldbart, 2011), further psychophysical experiments were designed to explore to what
extent it is possible to perceive vibrations on the skin. The first study (Experiment A,
Section 6.2) examined vibrotactile perception thresholds (VPTs) on the fingertip for 43
participants with a range of hearing impairments and found that:
• VPTs were not affected by hearing impairments in the present sample
• There is a potential dynamic range of 10 to 40dB for pitches between C1 and C6
• Onsets can be perceived more strongly than sustained vibrations for pitches between
A5 and C6 but this effect was reduced at suprathreshold levels.
The idea that profoundly deaf people are more sensitive to VT signals was not supported
here, although existing research is also not consistent in this respect and depends on the
experimental task (Levänen & Hamdorf, 2001). VPTs were found to be similar to existing
threshold studies, acknowledging for variations in contactor type and size. A second study
194
(Experiment B1, Section 6.3) was designed to establish relative pitch (RP) discrimination
thresholds for musical intervals and found that:
• Relative pitch (RP) discrimination is easier for larger intervals than smaller ones
• Training sessions resulted in improvements for larger intervals of a Major 6th or
larger and a decrease in reaction times
• Hearing musicians were better at RP discrimination than profoundly deaf musicians
• Musicians’ reaction times were faster than non-musicians’.
Improvements in the task were likely due to a combination of consolidation of the task
procedure and improvements in sensitivity to vibrations. The response curves support the
existing evidence that the smallest perceptible intervals are between 2 and 4 semitones
(Branje, Maksimowski, Karam, Fels, & Russo, 2010) and that RP discrimination is accurate
for intervals a major 6th or larger. This finding enabled the design of a study exploring the
learning and memorisation of discrete pitches over time (Experiment B2, Section 6.4) where
the smallest interval between tones was a whole tone (2 semitones). It was found that:
• Three tones, each one octave apart, can be identified independently with almost
100% accuracy
• The ability to learn labels for discrete vibrations declines as a function of the
distance between tones: tones become confused when they are less than a perfect 4th
apart
• A reference tone does not facilitate the identification of vibrations.
The study strongly suggested that perceptual distinctiveness, as a result of different
combinations of mechanoreceptors, is a pre-requisite for VT perception tasks: where there is
insufficient perceptual distinctiveness between tones < 5 semitones apart, RP discrimination
and also absolute pitch (AP) identification abilities decline.
195
7.2 Limitations
In spite of the findings, there were a number of predominantly methodological limitations to
the studies reported in this thesis that directly impact the suggestions made for future
research described in the following section (Section 7.3), and which are summarised here.
The interview study reported in Chapter 2 provided a vast amount of useful data.
Nonetheless, a not insubstantial portion related to issue of the perception of music using
hearing aids (HAs), which appears to be contentious. Eliciting the data may have been
avoided by using survey methods on a larger sample group although some depth to the
responses would no doubt be lost. The data may be useful however, in generating a follow-
on survey as discussed in Section 7.3.1 below. Conversely, to add depth to the analysis,
Interpretative Phenomenological Analysis might provide perspectives on the subjective
perception of sound and music with hearing impairments that are not possible with thematic
analyses.
The observation study reported in Chapter 4 was limited by a very small sample size; two
violin duos. This allowed a deep analysis of idiosyncratic differences, but a larger sample of
duos would help draw firmer conclusions about the effects of artificial attenuation on
performers’ behaviours. Furthermore, the earplugs used provided attenuation of only ~35dB
which did not significantly affect the players’ looking or movement behaviours. The
additional use of ear defenders may have challenged the players more, thus inducing the
hypothesised increases in looking and movement behaviour. With regard to the study
reported in Chapter 5, the pairing of players with profound and moderate deafness was not
possible, limiting the combinations of naturally-occurring deafness in the observation. If it
had been, stronger conclusions may be drawn about players’ altruistic modifications to
looking, movement and gestural behaviours to facilitate communication within duos. The
possibilities of further research in this field are discussed below in Section 7.3.2.
Finally, a number of limitations applied to the psychophysical studies reported in Chapter 6.
First, although a number of recruitment strategies were adopted involving local Deaf Centres
and the collaborative partner Music and the Deaf, it proved very difficult to recruit and retain
a balanced sample of participants with hearing impairments for the studies, in spite of
financial compensation. Furthermore, it was not possible to conduct audiometric tests on
participants to confirm their level of hearing; participants were assigned to groups based on
self-reported data. These constrains limit the strength of the conclusions that can be drawn,
especially regarding the effects of hearing impairments on measured variables, as sample
196
sizes were disparate and rarely truly homogenous. Second, the design of Experiment B2
involved a confound between the exposure time to a given tone and the total number of
tones being learned over sessions, which was discussed in Section 6.4.8. Lastly, while the
tasks in Experiments B1 and B2 were necessarily straightforward in order to establish
thresholds to perception and cognition, the ecological validity of these tests should be taken
into account when considering how music may be perceived using vibrations. Future
research on the effects of hearing impairments on VT perception, VT pitch perception and
feeling music is proposed below in Sections 7.3.3-5.
7.3 Future research
The summary of findings (Section 7.1) and the limitations described above (Section 7.2)
have helped to identify many areas where more research could help tackle the aim of using
vibrations to perceive music by musicians with hearing impairments.
7.3.1 Hearing aid technology
As mentioned in Section 7.2 (Limitations), many issues relating to the perception of music
using HAs emerged in the interview study (Chapter 3). Modern digital HAs use complex
signal processing tools, such as frequency compression, automatic gain control (to control
loudness peaks) and non-linear amplification, to provide bespoke amplification to speech
sounds. It is not disputed that speech perception should remain a primary function of HAs,
but the data suggest that such digital processing has a negative impact on the perception of
music, causing distortions to pitch and loudness. Some participants, especially those born
profoundly deaf, preferred to use old analogue HAs available before the mid-1990s as they
provide a more powerful, linear, amplification with fewer limits which, for some users, may
provide a truer experience of music. Likewise, the use of ‘music channels’ on digital HAs is
inconsistent and idiosyncratic suggesting that they are not wholly successful in their
purpose. Many participants reported difficulties in working with audiologists who are
typically trained only to fit HAs for use with speech. There appear to be pockets of expertise
in the UK (notably Paul Checkley of Harley Street Hearing and Adam Schulberg at Cubex),
whilst the biggest name in the field seems to be Marshall Chasin of Musicians’ Clinics of
Canada (Chasin & Russo, 2004). Nonetheless, the fitting of HAs for music listening and
especially for musicians is typically a lengthy process requiring not only time but also
197
money and an open mind. Having conducted an initial interview study and established the
main areas of enquiry, a survey could now be developed to confirm to what extent HAs are
indeed problematic for music listening and seek to identify patterns in within user groups;
which listening situations are most problematic? What instruments or types of music are
distorted using HAs? What makes and models of HA are best for listening to music?
Research is needed to identify the training needs of audiologists and hearing aid dispensers,
affect changes to policy and procedure, and raise public awareness to improve the current
situation.
7.3.2 The effects of hearing impairments on performance behaviours
Anecdotal evidence relating to dynamic sensory attending and sensory compensation
emerged from analysis of the interview data, particularly with respect to interactions
between visual and auditory information. Subsequent observational studies showed that
small attenuations of auditory information akin to mild or moderate hearing impairments
themselves do not prompt increased visual attending, but that profound deafness from birth
is associated with increased visual attending in music performance and that visual attending
per se can prompt it also in co-performers. It is likely that dynamic attending leads to
sensory compensation for extreme cases in musical performance. For example, the case
study of the profoundly deaf players, Ruth and Paul (Section 5.8), showed that their looking
behaviour increased when they were aware of asynchronies.
The use of ear plugs providing a ~35dB attenuation of auditory information did not however
result in increased looking behaviour or problems with ensemble synchrony (Chapter 4).
Further research should therefore attempt to identify what levels of attenuation are
associated with difficulties with ensemble synchrony and/or increased visual attending and
how these factors may be linked to musical performance demands. It might be the case that
behaviours are only learned with long-term, profound deafness. A study conducted at the
RNCM in 2012 was designed to replicate the violin-duo study of Chapter 4, controlling
auditory feedback via headphones in two acoustically-isolated rooms separated by a glass
window (see Figure 7.1) in place of earplugs. It is hoped that results will confirm the relative
level of auditory attenuation associated with changes to looking behaviour between co-
performers and problems with ensemble synchrony.
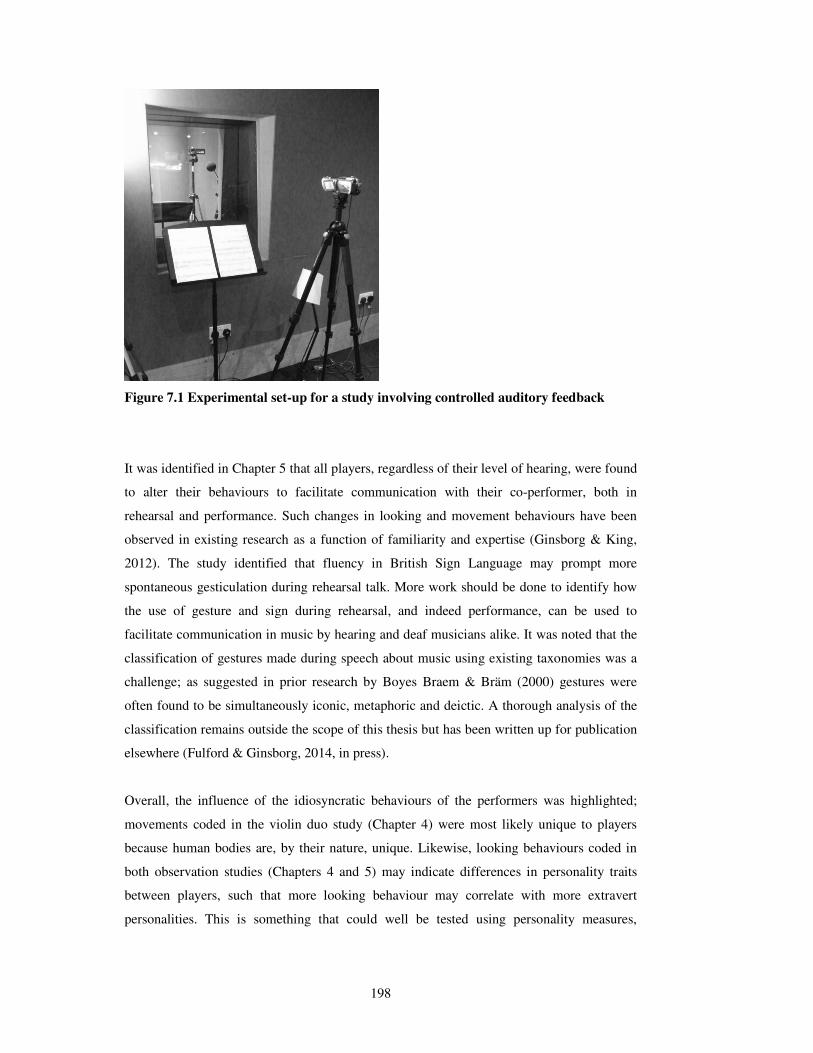
198
Figure 7.1 Experimental set-up for a study involving controlled auditory feedback
It was identified in Chapter 5 that all players, regardless of their level of hearing, were found
to alter their behaviours to facilitate communication with their co-performer, both in
rehearsal and performance. Such changes in looking and movement behaviours have been
observed in existing research as a function of familiarity and expertise (Ginsborg & King,
2012). The study identified that fluency in British Sign Language may prompt more
spontaneous gesticulation during rehearsal talk. More work should be done to identify how
the use of gesture and sign during rehearsal, and indeed performance, can be used to
facilitate communication in music by hearing and deaf musicians alike. It was noted that the
classification of gestures made during speech about music using existing taxonomies was a
challenge; as suggested in prior research by Boyes Braem & Bräm (2000) gestures were
often found to be simultaneously iconic, metaphoric and deictic. A thorough analysis of the
classification remains outside the scope of this thesis but has been written up for publication
elsewhere (Fulford & Ginsborg, 2014, in press).
Overall, the influence of the idiosyncratic behaviours of the performers was highlighted;
movements coded in the violin duo study (Chapter 4) were most likely unique to players
because human bodies are, by their nature, unique. Likewise, looking behaviours coded in
both observation studies (Chapters 4 and 5) may indicate differences in personality traits
between players, such that more looking behaviour may correlate with more extravert
personalities. This is something that could well be tested using personality measures,
199
although researchers would need to identify a theoretical rationale for testing such a
hypothesis.
7.3.3 The effects of hearing impairments on VT perception
The effect of deafness and hearing impairment on VT sensitivity is a perennial question.
Recent neuroscientific research on the nature of auditory-tactile perception in the brain and
the neural plasticity of these regions (reviewed in Chapter 6, Section 6.1) provides a
biological mechanism enabling cross-modal sensory perception. This fuels ideas about the
possibility of using vibrations to augment or indeed replace aspects of auditory cognition,
the present project included. Psychophysical and behavioural studies however tend to
produce mixed results, most likely because of sampling issues: it is difficult to create
homogenous sample groups according to profiles of hearing loss. No firm conclusions can
be drawn from the results presented in this thesis with regard to the effects of hearing
impairments: only small, inconsistent or non-significant effects of hearing impairment on
VT thresholds and RP discrimination ability were found and further research on larger
sample groups is therefore needed. Nanyakkara et al. found no effect of level of deafness on
the flow states of users of the Haptic Chair (Nanayakkara, Wyse, Ong, & Taylor, 2013).
This may be advantageous. For VT thresholds, uniform sensitivity for all users would
facilitate the calibration of VT technology so that mean response curves could be used to
adjust intensities of different notes over the frequency range. Equal-intensity curves should
be established for any new technologies to ensure that the vibrations are perceived in the
same way by most users. Nonetheless, research was presented in Chapter 6 that showed
some enhanced tactile ability in profoundly deaf participants (Levänen & Hamdorf, 2001)
and therefore further research should explore for which tasks congenital deafness may yield
a functional advantage in behavioural tasks. Here, effects of profound, congenital deafness
were found for variables relating to social and verbal communication, but not those relating
to the perception of vibrations.
7.3.4 Pitch perception using vibrations
The three studies reported in Chapter 6 drew upon psychophysical research aiming to
explore perceptual limits of the tactile senses, but extended them toward musical contexts,
distinguishing them from most psychophysical studies of VT perception. Classic

200
psychophysical studies tend use target frequencies based on the optimum perception of
specific mechanoreceptor channels (such as 20Hz targeting RAI channel and 250Hz
targeting RAII or PC channel). The studies involving frequency discrimination tasks to
determine thresholds that have been reported in this thesis focused on wider frequency
ranges reflecting those found in music, whilst retaining a psychophysical approach. The
threshold curves found were similar to those reported in earlier studies but, given the number
of factors affecting VPTs, threshold tests remain essential for the development of any VT
technology to understand fully the nature of specific response patterns. Future research
should focus on explanations for group differences in psychophysical responses to
vibrations, particularly those relating to behaviourally-relevant tasks. Future studies should
also verify the nature of frequency discrimination abilities for pitches below C3 and above
C5. Nanayakkara conducted post-hoc tests on the ‘Haptic Chair’ to investigate reports from
participants that they were aware of high frequencies of 2000 and 4000 Hz which are beyond
the upper perceptual limits of cutaneous mechanoreceptors. Responses remained positive,
albeit at higher intensities, and the team attributed these to spatial integration (the whole
glabrous surface of the palm was used) and the possibility of low frequency noise
(Nanayakkara, 2009). It is possible too that bone conduction and internal senses may
facilitate detection.
Aspects relating to RP discrimination and AP identification therefore warrant further study
and two main fields emerge: first, the idea of ‘perceptual distinctiveness’ and second, VT
perceptual learning. The present results showed that two tones less than a perfect 4th apart
cannot be successfully learned over time: if they are a wider distance apart and are
‘perceptually distinct’, they can be identified with very little training. If tones cannot be
reliably discriminated between, it follows that they cannot be assigned individual labels as
the percepts are not sufficiently distinct. This will in turn have a negative impact on the
learning and memorising of tones over time. Further research should explore the concept of
perceptual distinctiveness. Birnbaum and Wanderley cite Verillo (1992) stating that:
[…] certain frequency ranges give rise to distinct subjective sensations, implying
that although vibration frequency may not be fed back preserving all the frequency
content of the sound, and does not directly correlate to vibrotactile pitch, it is still a
signal property that can be used for communication (Birnbaum & Wanderley, 2007,
p. 2).
Thus, it may be that perceptual distinctiveness can be used to create frequency bands which
communicate different aspects of musical information to the user. A second area for further

201
study is perceptual learning of VT information. For RP discrimination, training resulted in a
weak improvement over time, raising questions about the extent to which people can learn to
use VT information. The results supported the ‘reverse hierarchy theory’ (RHT) of
perceptual learning in that the task may have been simple enough to result in some changes
in S1 (see Section 6.1.5). Further research should confirm whether these small
improvements can transfer to untrained skin locations and whether improvements continue
to occur over longer time periods. For AP identification, further research should seek to
identify how exposure and rehearsal affects the long term retention of perceptually distinct
vibrations. To what extent are learned associations with VT stimuli stable over time? We
may borrow from existing paradigms in music psychology to explore the extent to which
intervening tones disturb pitch discrimination and identification ability. Deutsch’s early
studies showed that auditory tones more than an octave higher or lower create a large
interference effect (Snyder, 2009): future studies could explore whether this is the case for
VT tones. Although three tones (C3, C4 and C5) were perceptually distinct and could be
identified in absolute terms, there is nothing to suggest that they were perceived as octaves,
per se. In the auditory mode, one note played an octave higher than another produces
spectral energy at similar points and thus stimulates a similar set of hair cells along the
basilar membrane producing the percept of a similar note. There is no analogous process for
VT perception. Mechanoreceptor afferent channels lead to a somatotopic representation in
S1: there is no region analogous to the primary auditory cortex containing a tonotopic
frequency map for any vibration felt anywhere on the skin. The absolute identification of
vibrations may only be possible for specific areas of the skin and after extensive exposure
and/or training (see ‘The case of Evelyn Glennie’ in Section 7.4 below).
Learning to use VT information appears to be slower and more challenging than for auditory
of visual information; perceptual limits may be less plastic when sensory information is not
immediately behaviourally relevant (Seitz & Dinse, 2007). Future research should test the
hypothesis that passive learning over longer time periods may result in significant changes to
S1 for that particular area of skin and for the specific task. Perceptual learning of vibrations
seems to be specific both to the type of VT information and the task requirements (Harris,
Harris, & Diamond, 2001) which suggests that learning is best achieved using VT
information that is internally consistent over time. This may pose a challenge for the
perception of music using vibrations as it is a highly variable signal. According to RHT,
studies should keep tasks at a behaviourally relevant level and incorporate variability in
order to yield changes in the brain at higher levels and, therefore, transfer of learning to
other skin areas (but precluding improvements in perceptual limits according to RHT). We
understand the neural mechanisms by which we can compare two VT tones, holding a
202
frequency-matched neural trace of one in working memory, but future research should
explore the limits of this store. Can we perceive and recall pitch information about a string
of tones or a simple melody? Are the temporal limits similar to those found in the acoustic
store?
Psychophysical experiments can be combined with brain imaging techniques which, in the
field of auditory science, have broken down boundaries between psychoacoustics (auditory
psychophysics) and physiology (Plack, 2010). The same can be said for VT psychophysics.
Experiment B1, which involved only a two-alternative fixed choice response, would be
particularly suitable for such a combined approach. The use of a keyboard in Experiment B2
increased the ecological validity of the task, but would pose a challenge for brain imaging
techniques that restrict visual feedback, although the use of EEG methods may be possible.
Identifying response curves for RP discrimination usefully extended earlier findings, but
more can be done to extend our knowledge of frequency difference limens on different parts
of the body and for larger ranges representing the full range of musical pitch frequencies.
Existing research has provided data on the neural bases of VT pitch comparison tasks.
Future work should extend this to identify the neural representations of learned associations
with specific VT pitches. Given the lack of an equivalent tonotopic frequency map in the
brain for vibrations, this would help address the question of where in the brain
representations of learned vibrations might be stored.
7.3.5 Feeling music (rhythms, dynamics, chords and melodies)
The experiments reported here focussed on the perception of musical pitch and (by way of
threshold tests) intensity. There is therefore much scope for further work into the perception
of other musical parameters. Prior research suggests that temporal information can be
accurately perceived using VT cues. Given the importance of temporal cues to musicians
with hearing impairments, we may ask ‘what is the best way to convey temporal information
using vibrations?’ In visual terms, we know that fast increases in acceleration along a single
trajectory provide the beat temporal cues for musicians (Luck & Sloboda, 2009). In auditory
terms, we know that amplitude rise-times provide rhythmic cues which help us parse the
speech stream (Goswami, 2011). Perhaps rise-times in a VT signal could influence beat
extraction in a similar fashion, such that faster rise times give clearer temporal cues and
therefore enable better synchrony than slower ones? This would be a hypothesis worth
testing over a range of different frequencies on the skin. Questions can be asked regarding
thresholds of temporal perception or beat detection: what are the fastest and slowest beats
203
that can be discerned on the skin? Are they similar to the limits on auditory rhythm
perception found in ‘tapping’ studies? Simple tests could be devised drawing on auditory
perception tests presenting VT stimuli at easily detectable frequencies (250Hz targeting the
PC channel, for example). It is likely that thresholds will vary as a function of the density
and relative proportion of different mechanoreceptors on different parts of the body; studies
could examine the effects of targeted frequencies to identify if rhythmic information is best
perceived using a specific afferent channel.
Experiment A established that there is a potential dynamic range of 10 to 40dB for pitches
between C1 and C6, with the largest range possible between C3 and C4. This is an
encouraging finding. Similar orders of magnitude are present on most orchestral instruments
and the human voice, although subjective doublings of loudness or intensity do not map
directly between the VT and auditory modes. Assigning information about dynamics to
frequencies within this range would provide an optimum resolution for the perception of
dynamics and may avoid the worst of the pitch/intensity confounds. Further work is needed
to establish how intensity changes can be used to provide temporal cues to facilitate
ensemble synchrony.
The perception of chords and harmony also requires further attention. The confusion effect
found in the present AP study (Experiment. B2) for tones less than 5 semitones apart
(perfect 4th) may be lessened if contactors are spatially separated. VT signals containing
multiple frequencies result in ‘rougher’ percepts analogous to ‘thicker’ textures, but
abstracting accurate pitch information is therefore unlikely. Even if it is possible, however,
to learn to associate pitch labels with specific vibrations, adding further notes is still likely to
compromise this ability: the accurate identification of the number of notes in a chord, for
example, or the ability to say whether it is major, minor, diminished or augmented, seems
impossible. On a positive note, separating frequencies so they are presented via spatially
differentiated contactors can overcome the perceptual masking that occurs when perceiving
vibrations on the skin, as evidenced by the ‘Model Human Cochlear’ (MHC) used in the
‘Emoti-Chair’ (Karam, Russo, & Fels, 2009). However, while the user study cited above
showed that the MHC was more effective in conveying emotional information, there is
further scope to interrogate the perceptual limits of such frequency banding and of multiple
contactors per se: how many different frequencies can be perceived at once? How are
frequency difference limens affected by multiple contactors? The authors of a study
modelling threshold data have proposed that populations of Pacinian afferents can indeed
perceive multiple frequency components (Bensmaia, Hollins, & Yau, 2005). This is exciting:
perhaps more complex tones can be presented to the skin, if not to be perceived as true
204
chords, but to convey difference timbres or vibrato. Vibrato might be transmitted quite well
using VT signals as it is likely that slow oscillations in pitch and intensity would be
perceptible whilst remaining clearly within a specific perceptual channel. Again, there is
much scope for further research.
The perception of melody using vibrations has also escaped explicit attention. It is
understood that auditory melody perception is not exact but a higher-order abstraction
(Snyder, 2009). We identify melodies using contours, not exact pitches. Using insights from
music psychology, future research should seek to find out if higher level cognitive processes
for perceiving and remembering melodies can be utilised to make sense of contours in a VT
signal. The frequency resolution of the pitch contours need not be less than a whole tone,
based on the findings of Experiment B1. Although this would involve judgements less fine-
grained than are possible in the auditory mode, existing applications suggest that it is
nevertheless possible to perceive melodic shape and contour using VT technology, and this
could be explored further using methods from music psychology. Contours could be used to
help identify melodic cues which might, in turn, facilitate ensemble synchrony or tonal
control. As is often the case, the separation of musical parameters in perception studies can
be arbitrary: attending to higher order percepts relating to shape, contour, texture or
structure, which themselves contain salient rhythmic and pitch information, may provide the
best cues to facilitate performance. MUVISTA (MUsic VISualized by means of a graphics
TAblet) technology and software used on the CMPCP ‘Shaping Music in Performance’
project (Küssner, Gold, Tidhar, Prior, & Leech-Wilkinson, 2011) could be coupled with VT
feedback technology to explore the kinds of representations and cues elicited by controlled
changes in the VT signal: can musical contours and shapes be perceived using vibrations
alone? Results could be compared to existing data using auditory stimuli and used to explore
potential differences in the perception of music using vibrations and sound.
In sum, much further research is needed to map VT signal processing strategies to higher-
level aspects of music perception. The previous section (7.3.4) showed that there are real
limits on pitch perception abilities using vibration. There is however, potential to convey
musical attributes such as rhythm, dynamics, texture and melody contour. Further research
must establish difference (or change) limens for all these parameters across the frequency
range, so we understand what can and cannot be perceived by users. In this way, a VT signal
could provide melodic and rhythmic cues to assist musicians with hearing impairments with
ensemble synchrony and tonal control.

205
7.4 The case of Evelyn Glennie
The idea that Glennie once learned to map VT pitches to her existing sense of AP provided a
stimulating basis for Experiments B1 and B2 reported in Chapter 6, which found that the
perception and identification of vibrations is affected by at least the following variables: i)
proximity of tones to adjacent tones; ii) the pitch of the tone in relation to optimum
sensitivity of mechanoreceptors on the skin and; iii) to a lesser extent, exposure time in
study periods. What can the evaluations above (in particular Section 7.3.4) tell us about
Glennie’s ability to identify specific pitches using vibrations and the link she proposes with
her auditory AP ability in light of the psychophysical results?
It is certainly possible that the RP of tones at least two semitones apart could be identified,
especially if the vibrations were strong enough to be felt with additional bone conduction.
Furthermore, if tones were a fourth or fifth apart, as would likely have been the case with
timpani, it is likely that they would be perceptually distinct on the skin. Given the number of
factors affecting VT pitch perception, including intensity, temperature, contactor area and
location (Section 6.1.2), it would be crucial that as many of these variables as possible were
held constant during the training period: that is, if she felt the same tones from the same
timpani, played at same intensities, in a room of constant temperature, with her hands placed
at the same points on the wall each time. It is not known to what extent this was the case in
Glennie’s early timpani lessons. The desire, and need, to use the perceptual information for
higher level tasks, for example, to facilitate tuning and tonal control would likely have
facilitated learning. The reason that training on reducing intensity difference limens has not
been successfully transferred to different parts of the body (Gescheider & Wright, 2012)
may be that the tasks involve high levels of attention to sensory stimuli but have very little
application to higher-level behavioural tasks (Kaas et al., 2013). The influences of explicit
attending or passive exposure to sensory information in tasks are key factors in general
theories of perceptual learning, which can occur as a result of both (Seitz & Dinse, 2007).
Lastly, research has consistently provided evidence for the plasticity of the auditory cortex
to tactile sensory inputs (Section 6.1.4) but only for individuals with congenital deafness for
whom auditory sensations were never (or rarely) experienced.
Unfortunately, the extent of Glennie’s attending to auditory information over the time of her
tactile learning is not known. The fact her hearing loss was not sudden but gradual may have
facilitated the mapping process, and while neural plasticity provides a mechanism for this,
there still remains no empirical evidence of the cross-modal mapping of absolute auditory
206
pitch to VT pitch perception. There is, however, an example of a colour-blind man who uses
an artificial implanted eye that maps light frequencies to sound frequencies enabling him to
‘hear’ different colours (information can be found on Wikipedia:
http://en.wikipedia.org/wiki/Neil_Harbisson). In sum, Glennie’s account of her tactile
perception abilities is highly exceptional and unconfirmed, but, theoretically, not impossible.
Neural plasticity is proposed as a mechanism by which tactile sensory inputs may be
mapped onto pre-existing representations of pitch in the auditory cortex, although the exact
nature of this plasticity and the conditions under which it occurs remain unknown.
Nonetheless, it could be argued that the extent of her subjective awareness of, and reliance
on, vibrations in musical performance is truly unique.
7.5 How can vibrations facilitate interactive musical performance?
This section will evaluate the original conceptual design of the VT technology as outlined in
Chapter 1 in the light of the project findings. A system was originally proposed to allow VT
feedback to be conveyed to each player in a group of musicians via a central mixing desk.
Individual performers would be able to customise the VT signal sent to pads, decks or bars
on which they could stand, sit or hold depending on their instrument. Further research is
needed to understand how vibrations can be integrated into musical performance at
behavioural and perceptual levels, acknowledging idiosyncratic performance needs. The
interview findings reported in Chapter 3 showed that music performance is a multi-modal
experience for musicians with hearing impairments: auditory, visual, proprioceptive, and VT
feedback play a part. It appeared that auditory and visual sensory information was reported
being relied upon explicitly while VT (and proprioceptive) feedback may be attended to less
consciously; Anne and Anthony reported using vibrations to help tune their string
instruments while most other participants found vibrations a desirable, reassuring, auxiliary
form of feedback. Nick, however, reported that the vibrations he felt while playing the
trombone could actually be quite distracting.
Interviews and observations (Chapters 3, 4 and 5) confirmed that musicians with hearing
impairments need strong cues to facilitate ensemble synchrony, which are most commonly
provided visually. They may also benefit from additional feedback to do with the balance of
the ensemble: providing VT feedback may reduce a player’s instinct to play louder when
they cannot hear themselves. The vibrations made by instruments and voices exist, however,
in a complex mix of social contexts, personal factors and multi-modal sensory information.
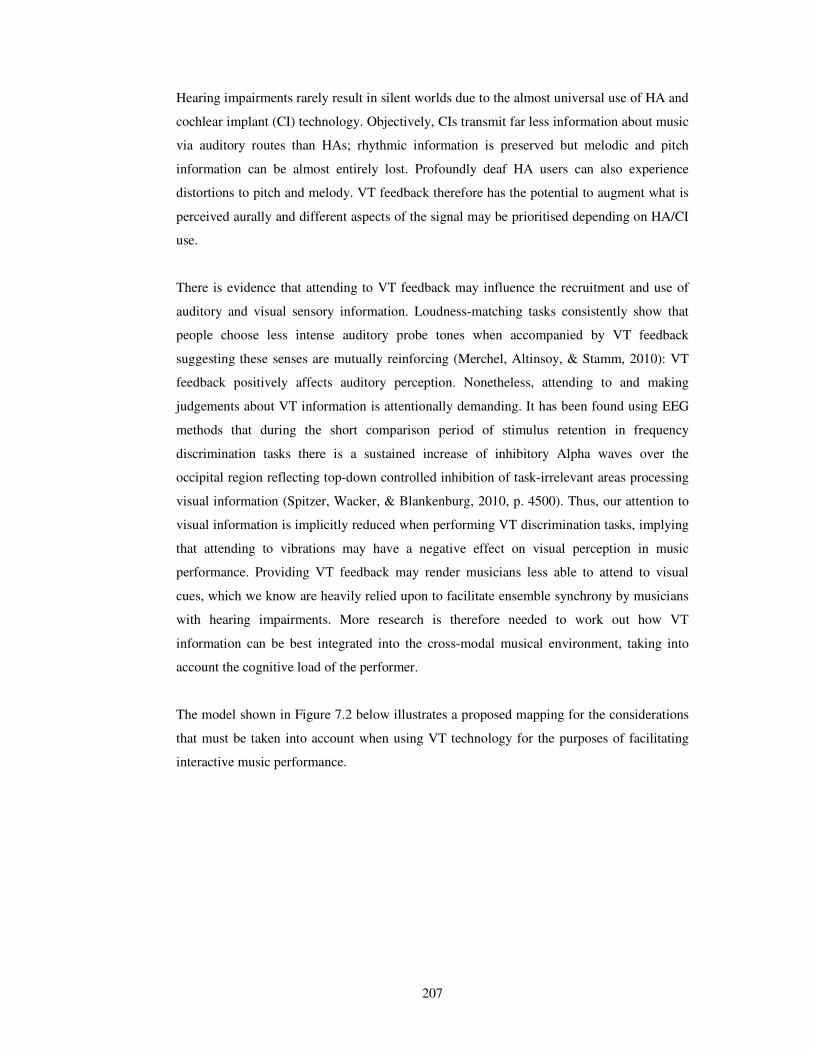
207
Hearing impairments rarely result in silent worlds due to the almost universal use of HA and
cochlear implant (CI) technology. Objectively, CIs transmit far less information about music
via auditory routes than HAs; rhythmic information is preserved but melodic and pitch
information can be almost entirely lost. Profoundly deaf HA users can also experience
distortions to pitch and melody. VT feedback therefore has the potential to augment what is
perceived aurally and different aspects of the signal may be prioritised depending on HA/CI
use.
There is evidence that attending to VT feedback may influence the recruitment and use of
auditory and visual sensory information. Loudness-matching tasks consistently show that
people choose less intense auditory probe tones when accompanied by VT feedback
suggesting these senses are mutually reinforcing (Merchel, Altinsoy, & Stamm, 2010): VT
feedback positively affects auditory perception. Nonetheless, attending to and making
judgements about VT information is attentionally demanding. It has been found using EEG
methods that during the short comparison period of stimulus retention in frequency
discrimination tasks there is a sustained increase of inhibitory Alpha waves over the
occipital region reflecting top-down controlled inhibition of task-irrelevant areas processing
visual information (Spitzer, Wacker, & Blankenburg, 2010, p. 4500). Thus, our attention to
visual information is implicitly reduced when performing VT discrimination tasks, implying
that attending to vibrations may have a negative effect on visual perception in music
performance. Providing VT feedback may render musicians less able to attend to visual
cues, which we know are heavily relied upon to facilitate ensemble synchrony by musicians
with hearing impairments. More research is therefore needed to work out how VT
information can be best integrated into the cross-modal musical environment, taking into
account the cognitive load of the performer.
The model shown in Figure 7.2 below illustrates a proposed mapping for the considerations
that must be taken into account when using VT technology for the purposes of facilitating
interactive music performance.
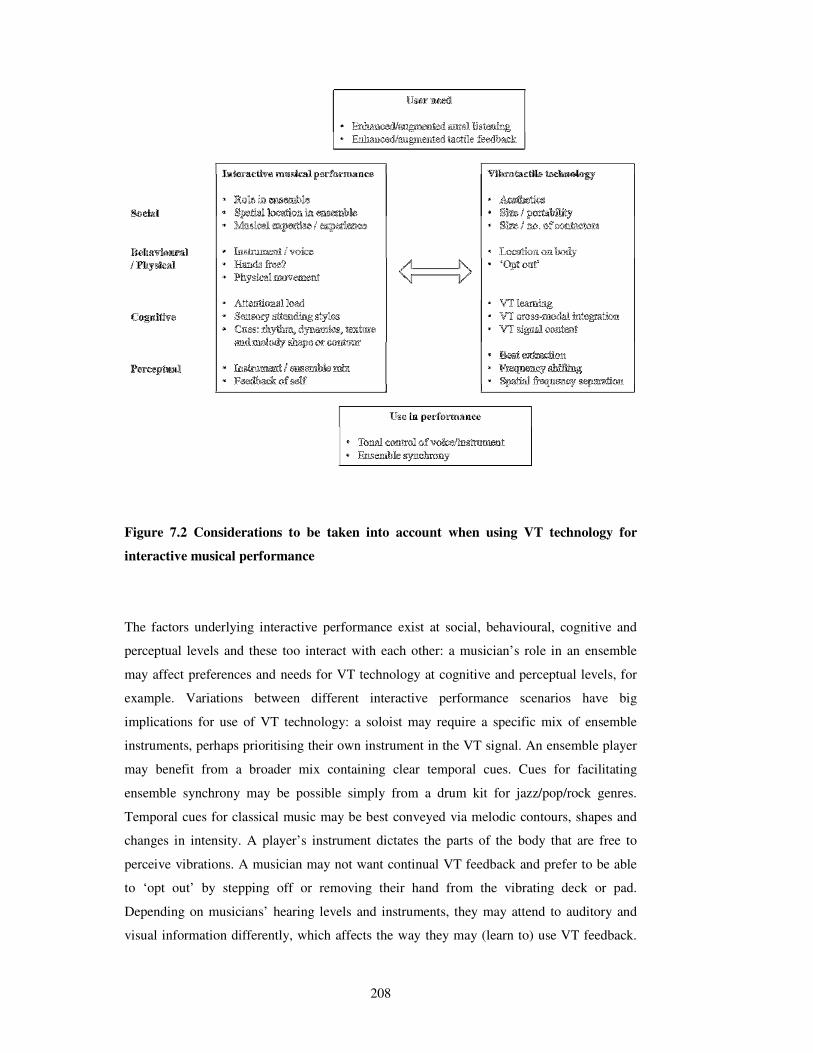
208
Figure 7.2 Considerations to be taken into account when using VT technology for
interactive musical performance
The factors underlying interactive performance exist at social, behavioural, cognitive and
perceptual levels and these too interact with each other: a musician’s role in an ensemble
may affect preferences and needs for VT technology at cognitive and perceptual levels, for
example. Variations between different interactive performance scenarios have big
implications for use of VT technology: a soloist may require a specific mix of ensemble
instruments, perhaps prioritising their own instrument in the VT signal. An ensemble player
may benefit from a broader mix containing clear temporal cues. Cues for facilitating
ensemble synchrony may be possible simply from a drum kit for jazz/pop/rock genres.
Temporal cues for classical music may be best conveyed via melodic contours, shapes and
changes in intensity. A player’s instrument dictates the parts of the body that are free to
perceive vibrations. A musician may not want continual VT feedback and prefer to be able
to ‘opt out’ by stepping off or removing their hand from the vibrating deck or pad.
Depending on musicians’ hearing levels and instruments, they may attend to auditory and
visual information differently, which affects the way they may (learn to) use VT feedback.
209
All musicians would need to learn to use VT equipment and identify cues in the signal: such
learning may occur differently for adults than for children. Given these factors, the designers
of VT technology must carefully consider the needs of the potential user. In order to increase
the size of the user group, and therefore the economic viability of a VT solution, it must be
flexible and allow the user to learn and adapt to the technology.
A central question remains regarding signal processing: what is the best way to transmit a
musical signal to the skin? Technologies designed to provide ‘listening’ experiences
generally contain far less processing than technologies designed to allow users to make
decisions or ‘perform’ using VT feedback. The most emotionally rewarding aspects of the
VT perception of music can be achieved relatively easily, with minimal signal processing,
although many of these applications invariably involve some bone conduction. Simply
placing loudspeakers facing up inside wooden boxes provides a very effective way to create
vibrations and make music accessible for deaf children (as used by the BBC National
Orchestra of Wales at a recent workshop in Cardiff with MatD in 2012). While the signal in
Russo’s ‘Emoti-Chair’ can be split over eight channels by frequency or input track, the
frequency or spectral content is largely unaltered nonetheless providing an enjoyable and
immersive experience for music listening, as found in user studies (Karam et al., 2009).
Likewise, the ‘Haptic Chair’ by Nanayakkara and colleagues involved coupling an auditory
output to shakers, with no signal processing, and this was found to increase the enjoyment of
a cross-modal music listening experience for users (Nanayakkara, et al., 2013). As
Nanayakkara explains:
The human CNS is still largely a ‘black box’ in data processing terms and it would
be unforgivable to assume we can create a computerised system to replace its many
and various abilities (Nanayakkara, 2009, p. 4)
However, forms of VT technology used to facilitate perception and action tend to
incorporate more signal processing: the audio signal in Birnbaum and Wanderley’s
‘Tactilicious Flute Display’ involved discarding frequencies outside the tactile range,
flattening the signal to match equal loudness contours and reducing the dynamic range
before presenting VT signal (Birnbaum & Wanderley, 2007). Likewise, Merchel et al.
experimented with three different signal processing strategies on VT technology for use in
audio mixers, i) using a low band pass filter set at 1000 Hz, ii) shifting all frequencies down
one octave and iii) deploying a beat extraction technique replacing peaks in the amplitude
envelope with sinusoidal pulses at 100 Hz: the second strategy proved the most effective
way to identify individual percussion instruments (Merchel, et al., 2010). Existing

210
prototypes and research support the argument for signal processing where VT information is
used in making behavioural decisions: research in VT perception supports signal processing
and represents a fundamental difference in approaches to VT technology development.
It is crucial that signal processing is led by empirical evidence of what is psychologically
perceptible and, in turn, what musical purposes it serves. The case study of Evelyn Glennie
(Section 7.4) highlights the uniqueness of the environmental and psychological factors
required for the development of AP identification skills using vibration, even at a
hypothetical level. If future research shows that VT pitches cannot be consistently
recognised over time, this would support a move away from AP identification toward more
holistic uses of VT pitch information for wider populations, in conveying general shapes,
contours and textures. This would pose a challenge for signal processing which should draw
on further psychophysical research to establish perceptual limits and behavioural studies to
establish how the information can be used to help achieve ensemble synchrony and/or tonal
control. A big opportunity exists for the field of music psychology to link pre-existing
methods and designs with expertise in acoustics, psychoacoustics and psychophysics so as to
develop the understanding of higher-level aspects of the perception and cognition of
vibrations.
In sum, what should vibrotactile technology add to the music making situation? Put simply,
vibrations should provide musicians with feedback that complements and reinforces that
which is available aurally, but does not disrupt that which is available visually. A ‘VT opt
out’ made possible using pads and decks that are not strapped to the musician’s body would
be one solution, providing musicians with the means of avoiding sensory overload during
performance. The following examples detail aspects of the model shown in Figure 7.2 and
show how potential uses of VT feedback may vary across different interactive performance
scenarios.
1. Soloist with piano or orchestra
Participants in the present research who have performed in this role include Evelyn Glennie,
Ruth Montgomery and Janine Roebuck. Ruth and Janine in particular mentioned the
challenge of ‘coming in at the right place’ and both rely heavily on visual cues to achieve
this. In this important role, there is great potential for VT feedback both to help, but also to
hinder. Soloists would require vibrations to enhance their ability to identify temporal cues
facilitating their entries but, during play, feedback is needed primarily to ensure good tonal
control. In the presence of cues at entry points, a continual beat track would probably be

211
redundant as the soloist-accompaniment relationship would enable the player a degree of
licence over the tempo to which the conductor and orchestra would follow, within rehearsed
limits. They may not be able to see the orchestra but should have good visual contact with
the conductor; nonetheless these visual cues may not always be clear. Most singers and
instrumentalists stand and have good mobility when not playing their instruments and before
their entries. A foot pad would carry the benefit of contact during play. Soloists may prefer a
bespoke mix of instruments in the VT signal based on which instruments or textural aspects
will facilitate their entries. Aesthetics would be important: the technology would ideally be
small and discreet, allowing the user to move their foot or hand on and off the pad before,
during and after their solo passages.
2. Piano accompanist
Participants who adopt this role are Paul Whittaker and Angie Taylor, both of whom are
very used to accompanying singers and have experience with other instrumentalists. The
spatial location of the players with respect to their soloists is very important given their
reliance on visual cues: their role is to follow the soloist providing support and responding to
subtle changes in performance manner and expression from moment to moment. VT
feedback would therefore be useful for providing accurate feedback as to the relative sound
intensity levels produced by both performers. In this way, the accompanist could feel more
assured of the balance in dynamics and avoid playing too loudly. Temporal information
could probably be conveyed amply by allowing the melodic contours of the soloist to
dominate in the VT signal. It is likely that the accompanist would remain reliant on visual
cues from the soloist, although a good VT signal might lessen the need for (restrictively)
close visual contact. A pianist using both hands and potentially both feet on the pedals
would benefit from either a food pad for occasional use, a seat pad providing continual
feedback or perhaps a bracelet or pad strapped to the body.
3. Orchestral / band instrumentalist
The orchestral musicians who participated in the interview study included Anne, Anthony,
Penny and William who play the viola, double bass, flute and piccolo respectively. The
string players were unique in that they reported using vibrations to help tune their
instruments but not relying on them while playing. Salient challenges include both ensemble
synchrony and tonal control (including tuning) and the players respond to these challenges
via discriminate attending to auditory feedback. Some aspects of this are important for them,
others less so: the players are exposed to vast and complex combinations of melodies,
212
textures and rhythms and must decide what they need to attend to in order to receive the
temporal and melodic cues they need. As for accompanists, ensemble musicians need both
temporal and tonal information but they need more of the former as groups get larger to
facilitate ensemble synchrony. A VT signal delivered via a small foot pad might be ideal
and, in professional contexts, aesthetics and ease of set up would be crucial. The signal
would likely need to contain as much of the original auditory signal as possible. Separate
sections of the orchestra could be delivered within perceptually distinct frequency bands in
order that textures and melodic contours and cues could be detected. Just as the musicians
are adept at ‘pulling out’ useful cues from the auditory mix, any VT technology should
allow the musicians to do the same with the VT signal: the human brain is arguably better
placed than a mixing desk to make decisions about which cues are important, providing they
are perceptible (see quote above from Nanayakkara, 2009). It may be helpful for the players
to have an additional VT channel, perhaps a spatially separate pad on the body, which feeds
back their own playing, in order that players can retain tonal control during loud passages
when they cannot hear themselves. Orchestral musicians should always be able to see and be
seen by the conductor and be adept at decoding visual beat signals. However, new
technology might be developed which abstracts beat information from the auditory signal or
even the conductor’s gestures and adds them to the VT signal. In a scenario such as that
described by Anne, where all players wore headsets playing a beat track during a film score
recording, a VT signal could accurately and effectively replicate the beat track.
4. Children’s music lesson / teacher
Project participants Janice Brown, Danny Lane, and Jessica Quinones are all involved in
music education in some way and priorities here are somewhat different. Young children
with hearing impairments face real barriers to accessing music education in mainstream
settings where both verbal instruction and the subject matter itself (being primarily auditory)
may be hard to attend to. Teachers may not know how to give clear visual instructions in
group music lessons, although these are easy to achieve. VT technology may play an
important part in bridging these gaps. As HA and CI technology have improved, deaf
children are likely to grow up with a good understanding of musical ‘beat’. They can
therefore learn to keep a beat with others and learn how to use visual cues to maintain it –
skills that underpin group social action and communication. Augmenting auditory feedback
with vibrations may help deaf children participate in such activities. Furthermore, VT
feedback would not only the benefit the deaf child but also augment the listening experience
for all other children, lessening both the need to differentiate between them and the (sadly
typical) positioning of deafness as a disability in music making. A VT solution for the
213
classroom would need to require minimal set-up time, be practical, easy to use and allow
teachers flexibility. A deck would allow children to move freely and learn about the
associations between sound and vibration while making music. The VT signal should
encompass the maximum perceptible frequency and intensity ranges to clearly represent
high and low pitches and loudness levels of the children’s playing. The signal should require
minimal learning or conscious ‘decoding’. VT technology should improve upon existing
applications where loudspeakers are used to create vibrations by limiting the amount of bone
conduction and converting sound energy into kinetic energy more efficiently. The central
musical outcome goals of tonal control and ensemble synchrony are just as important for
children as for professional adult musicians: all VT signals should enable children to learn
how to exert physical control over their instruments and understand how changes to their
playing affect acoustic outcomes, whether perceived aurally or with the cutaneous senses.
The aesthetics, size and portability of VT technology will be important in encouraging
uptake by potential users. Ideal solutions will be small, easy to set up and use and
lightweight. VT equipment used on this project cost roughly ~£320 for the fingertip and
~£2500 for the foot shakers and costs will increase as further efforts are made to create
smaller, lightweight technological solutions. Most of the technology needed to produce VT
equipment for use in music already exists: from small shakers typically used in mobile
phones to larger ones used in industry. Instead, the challenge for future research will be to
integrate new signal processing strategies with practical, useable technology. It must be
ensured that VT technology itself does not affect the perception of sustained vibrations (as
was shown to be the case in Experiment A). Vibration sources are always natural sound
emitters. While this may not be a problem in some musical settings, for example in the
classroom or at a loud rock concert, it would certainly be distracting and undesirable in
classical orchestral or chamber music contexts, where VT technology would ideally be
silent.
7.6 Final remarks
This chapter has summarised the project findings and shown that interactive music
performance is a strongly cross-modal sensory experience for musicians with hearing
impairments. The empirical findings regarding the use of visual cues to support auditory
sensory information in music (Chapters 4 and 5)_confirmed both the anecdotal evidence
from interview participants (Chapter 2) and also theories explaining cross-modal interactions

214
between audition and vision. Ideas about music expressed as speech-gestures by the
participants in the flute piano duo study (Chapter 5) were found to draw on cross-modal
associations of musical parameters with motion and space, further supporting Todd’s ‘audio-
visuo-motor’ mechanism of cross-modal perception of motion in music (Todd, 1999).
Subjective reports of interactions between vibration and audible sounds by participants of
the vibrotactile studies (Chapter 6) provided anecdotal evidence of the strength of the
association between the vibrotactile and auditory senses, as learned by experience
throughout childhood (Eitan & Rothschild, 2011) and explained by neural plasticity.
Experiments showed that pitch perception and learning abilities are limited when using
vibrations. The results suggest that the perceptual abilities of Evelyn Glennie are not easily
attained and may be attributable to systematic exposure to vibrations over a long period of
time, during which her hearing level was changing. While Glennie does not use HAs in
performance, many other musicians with hearing impairments do. Thus, it was proposed that
VT technology must be integrated in performance in such a way that complements auditory
feedback but does not disrupt visual feedback or the physical behaviours needed to perform.
There is enormous scope for future research. Music psychologists must collaborate with
technologists not just to consolidate existing research on the perception of pitch and
loudness using vibration, but to establish a knowledge-base about the cognition of musical
Gestalts using vibrations, such as melody contour, rhythms textures and shapes. In turn, this
must inform the development of signal processing strategies. A model was proposed that
highlights initial considerations for the application of VT technology in music at perceptual,
cognitive, behavioural and social levels. It was shown that these considerations will vary
depending on the performance situation and most will apply for hearing, as well as deaf,
musicians. Technology developers must work closely with researchers to ensure that an
appropriate level of signal processing is embedded within practical technology to ensure
good responses from users.
Over two decades ago, Verrillo proposed that VT could be used to help musicians control
tone but that much further work was needed to establish i) thresholds on other parts of the
body than the hand and ii) the VT outputs of acoustic instruments (Verrillo, 1992). These
assertions are confirmed by current anecdotal evidence: for orchestral string players in
particular (Anthony and Anne), VT feedback is helpful for tuning (Fulford, et al., 2011, p.
458). Today, however, the field is arguably broader and possibilities greater. We can
conceive of the possibility that VT technology can help musicians with hearing impairments
not only control their tone, but harness temporal cues that help them stay in perfect
synchrony with their co-performers. Not only can vibrations be used to provide feedback
215
about the musician’s own playing, but they can also include signals representing the
intensity and balance of the entire ensemble.
The wider project of which this thesis forms a part sought to explore the use VT technology
in facilitating performance specifically for musicians with hearing impairments. The present
research includes some of the first empirical evidence for the effects of hearing impairments
on music performance and there is much scope to build upon this. Nonetheless, VT
technology is only one part of a larger picture. Improvements to CI technology are
happening rapidly and music perception is part of this effort (see research by Rachel van
Besouw at the University of Southampton:
http://www.southampton.ac.uk/mfg/current_projects/compositions.html). There is also much
scope to improve existing HA technology as music perception research has taken a back seat
to developments in digital signal processing for speech perception since the mid-90s. Thus,
technological developments for both aural and VT feedback may together improve access to
music for people with hearing impairments and the contentious position of music listening
within the Deaf community. Ensuring access to music for deaf children in mainstream
education remains a concern. The success of such technologies will be evident from any
reduction in social stigma towards about music-making with a hearing impairment in both
Deaf and hearing communities.
Cross-disciplinary research poses its own challenges. Tensions can arise, not for personal
reasons, but simply because of the distance between the academic disciplines: in this project,
the desire to quantify the nature of vibration and sound was juxtaposed with the desire to
understand and produce human behavioural outcomes that could also be measured both
qualitatively and quantitatively. These approaches were resolved to some extent in the
design of the psychophysical experiments reported in Chapter 6. But it was perhaps only in
the design of a controlled observational study carried out in the RNCM recording studio and
vocal booth (mentioned above but not reported in this thesis; see Section 7.3.2, Figure 7.1),
in which disciplines were truly linked, both in objective and method. Despite such
challenges, similar attempts should be made to bridge the gap between psychophysical
studies of VT perception and qualitative measures of users’ enjoyment when using VT
technology. The recent potential of technology to help tackle social issues in this field
should be celebrated.

216
References
Abercrombie, C. L., & Braasch, J. (2010). Auralization of audio-tactile stimuli from acoustic
and structural measurements. Journal of the Audio Engineering Society, 58(10),
818-827.
Alexander, A. J., Bartel, L., Friesen, L., Shipp, D., & Chen, J. (2011). From fragments to the
whole: a comparison between cochlear implant users and normal-hearing listeners in
music perception and enjoyment. Journal of Otolaryngology Head & Neck Surgery,
40(1), 1-7.
AoHL. (2011). Facts and figures on hearing loss and tinnitus. [Factsheet by Action on
Hearing Loss Information]. Retrieved from
http://www.actiononhearingloss.org.uk/supporting-you/factsheets-and-leaflets/deaf-
awareness.aspx
Argyle, M., & Dean, J. (1965). Eye-contact, distance and affiliation. Sociometry, 28, 289-
304. doi: 10.2307/2786027
Attride-Stirling, J. (2001). Thematic networks: an analytic tool for qualitative research.
Qualitative Research, 1, 385-405.
Auer, E., Bernstein, L., Sungkarat, W., & Singh, M. (2007). Vibrotactile activation of the
auditory cortices in deaf versus hearing adults. Neuroreport, 18(7), 645-648.
Backus, B., & Williamon, A. (2009). Evidence of noise-induced hearing loss among
orchestral musicians. Paper presented at the International Symposium on
Performance Science, Aukland, New Zealand.
Bales, R. F. (1950). A set of categories for the analysis of small group interaction. American
Sociological Review, 15, 257-263.
Bales, R. F. (1999). Social interaction systems: Theory and measurement. New Jersey:
Transaction Publishers.
Banton, L. J. (1995). The role of visual and auditory feedback during the sight-reading of
music. Psychology of Music, 23(1), 3-16. doi: 10.1177/0305735695231001
Barry, C. (2008). Beethoven. Oxford: Oxford University Press.
Bartlmä, E. (2008). Viva la Musica! In S. Salmon (Ed.), Hearing - Feeling - Playing (pp. 21-
28). Germany: Zeitpunkt Musik.
Bavelier, D., Dye, M. W. G., & Hauser, P. C. (2006). Do deaf individuals see better? Trends
in Cognitive Sciences, 10(11), 512-518. doi: 10.1016/j.tics.2006.09.006
Bensmaia, S., Hollins, M., & Yau, J. (2005). Vibrotactile intensity and frequency
information in the Pacinian system: A psychophysical model. Perception &
Psychophysics, 67(5), 828-841. doi: 10.3758/bf03193536
217
Bergeson, T. R., & Trehub, S. E. (2002). Absolute pitch and tempo in mothers' songs to
infants. Psychological Science, 13(1), 72-75.
Birnbaum, D. (2007). Musical vibrotactile feedback. Master of the Arts in Music
Technology, McGill University, Unpublished thesis.
Birnbaum, D., & Wanderley, M. M. (2007). A systematic approach to musical vibrotactile
feedback. Paper presented at the International Computer Music Conference,
Copenhagen, Denmark.
Bispham, J. (2006). Rhythm in music: What is it? Who has it? And why? Music Perception,
24(2), 125-134. doi: 10.1525/mp.2006.24.2.125
Bolanowski, S. J., Gescheider, G. A., & Verrillo, R. T. (1994). Hairy skin – psychophysical
channels and their substrates. Somatosensory and Motor Research, 11(3), 279-290.
doi: 10.3109/08990229409051395
Boothroyd, A., & Cawkwell, S. (1970). Vibrotactile thresholds in pure tone audiometry.
Acta Oto-Laryngologica, 69(6), doi: 10.3109/00016487009123382
Bosworth, R. G., & Dobkins, K. R. (2002). The effects of spatial attention on motion
processing in deaf signers, hearing signers, and hearing nonsigners. Brain and
Cognition, 49(1), 152-169. doi: 10.1006/brcg.2001.1497
Boyes Braem, P., & Bräm, T. (2000). A pilot study of the expressive gestures used by
classical orchestral conductors. In K. Emmorey & H. Lane (Eds.), The Signs of
Language Revisted. An Anthology to Honor Ursula Bellugi and Edward Klima. (pp.
143-167). New Jersey: Lawrence Erlbaum Associates.
Branje, C., Maksimowski, M., Karam, M., Fels, D. I., & Russo, F. (2010). Vibrotactile
display of music on the human back. In R. Jarvis & C. Dini (Eds.), Third
International Conference on Advances in Computer-Human Interactions: Achi 2010
(pp. 154-159). Los Alamitos: Ieee Computer Soc.
Braun, V. & Clarke, V. (2006). Using thematic analysis in psychology. Qualitative Research
in Psychology, 3, 77-101.
Butler, A. C., Karpicke, J. D., & Roediger, H. L. (2008). Correcting a metacognitive error:
Feedback increases retention of low-confidence correct responses. Journal of
Experimental Psychology-Learning Memory and Cognition, 34(4), 918-928. doi:
10.1037/0278-7393.34.4.918
Caetano, G., & Jousmaki, V. (2006). Evidence of vibrotactile input to human auditory
cortex. Neuroimage, 29(1), 15-28. doi: 10.1016/j.neuroimage.2005.07.023
Carlson, N. (2004). Audition, the body senses, and the chemical senses. In N. Carlson (Ed.),
Physiology of Behaviour (pp. 202-243). US: Pearson, Allyn and Bacon.
Chaffin, R., Imreh, G., & Crawford, M. (2002). Practicing Perfection: Memory and Piano
Performance. Mahwah, NJ: Lawrence Erlbaum Associates.
218
Chasin, M. (2006). Hearing aids for musicians. Hearing Review. Retrieved from
http://www.hearingreview.com/issues/articles/2006-03_02.asp
Chasin, M. (2010). Six ways to improve listening to music through hearing aids. Hearing
Journal, 63(9), 27-30.
Chasin, M., & Russo, F. (2004). Music and hearing aids. Trends in Amplification 8, 35-47.
Chen-Hafteck, L., & Schraer-Joiner, L. (2011). The engagement in musical activities of
young children with varied hearing abilities. Music Education Research, 13(1), 93-
106. doi: 10.1080/14613808.2011.553279
Chen, J. K., Chuang, A. Y., McMahon, C., Hsieh, J. C., Tung, T. H., & Li, L. P. (2010).
Music training improves pitch perception in prelingually deafened children with
cochlear implants. Pediatrics, 125(4), 793-800. doi: 10.1542/peds.2008-3620
Chesky, K., Pair, M., Yoshimura, E., & Landford, S. (2009). An evaluation of musician
earplugs with college music students. International Journal of Audiology, 48(9),
661-670. doi:10.1080/14992020903019320
CIPD. (2011). Disability and employment [online factsheet by Chartered Institute of
Personnel and Development]. Retrieved from http://www.cipd.co.uk/hr-
resources/factsheets/disability-employment.aspx
Clark, M., & Luce, D. (1965). Intensities of orchestral instrument scales played at prescribed
dynamic markings. Journal of the Audio Engineering Society, 13(2), 151-157.
Clarke, E. (2005). Ways of listening. New York: Oxford University Press.
Cleall, C. (1983). Notes on a young deaf musician. Psychology of Music, 11(2), 101-102.
Codina, C., Pascalis, O., Mody, C., Toomey, P., Rose, J., Gummer, L., & Buckley, D.
(2011). Visual advantage in deaf adults linked to retinal changes. Plos One, 6(6).
doi: 10.1371/journal.pone.0020417
Colavita, F. (1974). Human sensory dominance. Attention, Perception, & Psychophysics,
16(2), 409-412. doi: 10.3758/bf03203962
Coleman, R. (1994). Dynamic intensity variations of individual choral singers. Journal of
Voice, 8(3), 196-201.
Coolican, H. (2004). Research Methods and Statisticsin Psychology. London: Hodder
Arnold
Creelman, C. (1962). Human discrimination of auditory duration. Journal of the Acoustical
Society of America, 34(5), 582-593.
CRIDE. (2012). Consortium for Research in Deaf Education (CRIDE) Report on 2012
survey on educational provision for deaf children: UK-wide summary. Retrieved
from
http://www.ndcs.org.uk/professional_support/national_data/uk_education_.html
219
Cross, I. (2005). Music and meaning, ambiguity and evolution. In D. Miell, R. MacDonald
& D. Hargreaves (Eds.), Musical Communication (pp. 27-43). Oxford: Oxford
University Press.
Cross, I. (2009). The nature of music and its evolution. In S. Hallam, I. Cross & M. Thaut
(Eds.), The Oxford Handbook of Music Psychology (pp. 3-13). New York: Oxford
University Press.
Cuddy, L. L. (1968). Practice effects in the absolute judgment of pitch. J Acoust Soc Am,
43(5), 1069-1076.
Dalgarno, G. (1990). Improving on what is possible with hearing aids for listening to music.
British Journal of Music Education, 7(2), 99-121. doi:
10.1017/S0265051700007610
Darrow, A. (2006). The role of music in deaf culture: Deaf students' perception of emotion
in music. Journal of Music Therapy, 43(1), 2-15.
Davidson, J. (1993). Visual perception of performance manner in the movements of solo
musicians. Psychology of Music, 21(2), 103-113. doi:
10.1177/030573569302100201
Davidson, J. (2001). The role of the body in the production and perception of solo vocal
performance: A case study of Annie Lennox. Musicae Scientiae, 2, 235-256.
Davidson, J. (2006). "She's the One": Multiple functions of body movement in a stage
performance by Robbie Williams. In A. Gritten & E. King (Eds.), Music and
Gesture (pp. 208-226). Aldershot: Ashgate.
Davidson, J. (2007). Qualitative insights into the use of expressive body movement in solo
piano performance: a case study approach. Psychology of Music, 35(3), 381-401.
doi: 10.1177/0305735607072652
Davidson, J. (2009). Movement and collaboration in musical performance. In R. Parncutt
(Ed.), The Oxford Handbook of Music Psychology (pp. 364-376). New York: Oxford
University Press.
Davidson, J., & Good, J. (2002). Social and musical co-ordination between members of a
string quartet: an exploratory study. Psychology of Music, 30(2), 186-201.
Davis, R. (2009). Improving Intonation. Masters Dissertation.
Deafness Research UK. (2009). Deafness – the facts. [Factsheet by Deafness Research UK)
Retrieved from http://www.deafnessresearch.org.uk/factsheets/deafness-the-
facts.pdf
Deafness Research UK. (2010). Cochlear implants - your questions answered. [Factsheet by
Deafness Research UK]. Retrieved from
http://www.deafnessresearch.org.uk/factsheets/Cochlear%20Implants%20-
%20Your%20Questions%20Answered.pdf
220
Deshpande, N., Metter, E., Ling, S., Conwit, R., & Ferrucci, L. (2008). Physiological
correlates of age-related decline in vibrotactile sensitivity. Neurobiology of Aging,
29(5), 765-773. doi: 10.1016/j.neurobiolaging.2006.12.002
Deutsch, D. (2006). The enigma of absolute pitch. Acoustics Today, 2(4), 11-19.
Deutsch, D., Dooley, K., Henthorn, T., & Head, B. (2009). Absolute pitch among students in
an American music conservatory: Association with tone language fluency. Journal
of the Acoustical Society of America, 125(4), 2398-2403. doi: 10.1121/1.3081389
Deutsch, D., Henthorn, T., Marvin, E., & Xu, H. S. (2006). Absolute pitch among American
and Chinese conservatory students: Prevalence differences, and evidence for a
speech-related critical period. Journal of the Acoustical Society of America, 119(2),
719-722. doi: 10.1121/1.2151799
Drennan, W. R. (2010). Hearing loss in musicians: Prevention and management by Marshall
Chasin [Book review]. International Journal of Audiology, 49(11), 855. doi:
10.3109/14992020903433914
Dweck, C. S. (1986). Motivational processes affecting learning. American Psychologist,
41(10), 1040-1048. doi: 10.1037/0003-066x.41.10.1040
Dweck, C. S. (2006). Mindset: the new psychology of success. New York, NY: Ballantine
Books
Dweck, C. S., & Leggett, E. L. (1988). A social cognitive approach to motivation and
personality. Psychological Review, 95(2), 256-273. doi: 10.1037//0033-
295x.95.2.256
Eitan, Z., & Rothschild, I. (2011). How music touches: Musical parameters and listeners'
audio-tactile metaphorical mappings. Psychology of Music, 39(4), 449-467. doi:
10.1177/0305735610377592
Ekman, P., & Friesen, W. (1969). The repertoire of non-verbal behaviour: Categories,
origins, sage and coding. Semiotica, 1, 49-98.
Ellsworth, P. C., & Langer, E. J. (1976). Staring and approach - interpretation of stare as a
nonspecific activator Journal of Personality and Social Psychology, 33(1), 117-122.
doi: 10.1037//0022-3514.33.1.117
Ericsson, K. A., & Kintsch, W. (1995). Long-term working memory. Psychological Review,
102(2), 211-245. doi: 10.1037//0033-295x.102.2.211
Ericsson, K. A., Krampe, R. T., & Tesch-Römer, C. (1993). The role of deliberate practice
in the acquisition of expert performance. Psychological Review, 100(3), 363-406.
doi: 10.1037/0033-295x.100.3.363
Ezawa, M. (1988). Rhythm perception equipment for skin vibratory stimulation. IEEE
Engineering in Medicine and Biology Magazine, 7(3), 30-34. doi: 10.1109/51.7932
221
Fawkes, W., & Ratnanather, T. (2009). Music at the Mary Hare Grammar school for the deaf
from 1975 to 1988. Visions of Research in Music Education, 14.
Fulford, R. (2013a). The formation and development of musical identities with a hearing
impairment. In: Stakelum, M. (Ed.) Developing the Musician (pp. 45-62). Surrey:
Ashgate.
Fulford, R. (2013b). Uses and experiences of hearing aid technology by musicians with a
hearing impairment. Paper presented at the MSc Advanced Audiology Masterclass,
UCL Ear Institute, London, UK.
Fulford, R. & Ginsborg, J. (2013). Can you see me? The effects of visual contact on
musicians’ movements in performance. In: Wyers, M. (Ed.) Sound Music and the
Moving-Thinking Body (pp. 109-118). UK: Cambridge Scholars Publishing.
Fulford, R. & Ginsborg, J. (2014, in press). The sign language of music: ‘Shaping gestures’
used by musicians with hearing impairments whilst talking about music. Empirical
Musicology Review.
Fulford, R., Ginsborg, J., & Goldbart, J. (2012). Functions and uses of auditory and visual
feedback: Exploring the possible effects of a hearing impairment on music
performance. Proceedings of the 12th International Conference of Music Perception
and Cognition and 8th Triennial Conference of the European Society for the
Cognitive Sciences of Music, 335-343. Retrieved from http://icmpc-
escom2012.web.auth.gr/sites/default/files/papers/335_Proc.pdf.
Fulford, R., Ginsborg, J., & Goldbart, J. (2011). Learning not to listen: The experiences of
musicians with hearing impairments. Music Education Research, 13(4), 429-446.
Gagne, F. (2004). Transforming gifts into talents: the DMGT as a developmental theory.
High Ability Studies, 15(2), 119-147.
Gault, R. H., & Crane, G. W. (1928). Tactual patterns from certain vowel qualities
instrumentally communicated from a speaker to a subject's fingers. Journal of
General Psychology, 1, 353-359.
Geldard, F. (1957). Adventures in tactile literacy. American Psychologist, 12(3), 115-124.
Geldard, F. (1960). Some neglected possibilities of communication. Science, 131, 1583-
1588. doi: 10.1126/science.131.3413.1583
Gescheider, G. A., Bolanowski, S. J., Hall, K. L., Hoffman, K. E., & Verrillo, R. T. (1994).
The effects of aging on information-processing channels in the sense of touch: I.
absolute sensitivity. Somatosensory & Motor Research, 11(4), 345-357. doi:
10.3109/08990229409028878
Gescheider, G. A., Bolanowski, S. J., Zwislocki, J. J., Hall, K. L., & Mascia, C. (1994). The
effects of masking on the growth of vibrotactile sensation magnitude and on the
amplitude difference limen - a test of the equal sensation magnitude equal difference
222
limen hypothesis. Journal of the Acoustical Society of America, 96(3), 1479-1488.
doi: 10.1121/1.410290
Gescheider, G. A., Güçlü, B., Sexton, J., Karalunas, S., & Fontana, A. (2005). Spatial
summation in the tactile sensory system: Probability summation and neural
integration. Somatosensory & Motor Research, 22(4), 255-268. doi:
10.1080/08990220500420236
Gescheider, G. A., & Verrillo, R. (1984). Effects of the menstrual cycle on vibrotactile
sensitivity. The Journal of the Acoustical Society of America, 76(S1) p. S49. doi:
http://dx.doi.org/10.1121/1.2021889
Gescheider, G. A., & Wright, J. H. (2012). Learning in tactile channels. Journal of
Experimental Psychology-Human Perception and Performance, 38(2), 302-313. doi:
10.1037/a0024180
Ginsborg, J. (2009). Beating time: the role of kinaesthetic learning in the development of
mental representations for music. In A. Mornell (Ed.), Art in Motion (pp. 121-142).
Frankfurt: Peter Lang.
Ginsborg, J., & Chaffin, R. (2011). Performance cues in singing: evidence from practice and
recall. In I. Deliege & J. Davidson (Eds.), Music and the Mind: Investigating the
functions and processes of music (a book in honour of John Sloboda). Oxford:
Oxford University Press.
Ginsborg, J., Chaffin, R., & Nicholson, G. (2006a). Shared performance cues in singing and
conducting: a content analysis of talk during practice. Psychology of Music, 34(2),
167-194. doi: 10.1177/0305735606061851
Ginsborg, J., Chaffin, R., & Nicholson, G. (2006b). Shared performance cues: Predictors of
expert individual practice and ensemble rehearsal. Paper presented at the 9th
International Conference on Music Perception and Cognition, Bologna
Ginsborg, J., & King, E. (2012). Rehearsal talk: Familiarity and expertise in singer-pianist
duos. Musicae Scientiae, 16(2), 148-167. doi: 10.1177/1029864911435733
Glennie, E. (1990). Good Vibrations. London: Arrow.
Glennie, E. (2003). Evelyn Glennie shows how to listen. TED Ideas worth spreading.
Retrieved from
http://www.ted.com/talks/lang/eng/evelyn_glennie_shows_how_to_listen.html
Glennie, E. (2010a). Disability essay. Retrieved from
http://www.evelyn.co.uk/Resources/Essays/Disability%20Essay.pdf
Glennie, E. (2010b). Hearing Essay. Retrieved from
http://www.evelyn.co.uk/hearing_essay.aspx
Goebl, W., & Palmer, C. (2009). Synchronization of timing and motion among performing
musicians. Music Perception, 26(5), 427-438. doi: 10.1525/mp.2009.26.5.427

223
Goldin-Meadow, S. (1999). The role of gesture in communicating and thinking Trends in
Cognitive Sciences, 3(11), 419-429.
Goodman, E. (2002). Ensemble performance. In J. Rink (Ed.), Musical Performance (pp.
153-167). Cambridge: Cambridge University Press.
Goswami, U. (2011). A temporal sampling framework for developmental dyslexia. Trends in
Cognitive Sciences(15), 3-10.
Greenhalgh, T., & Taylor, R. (1997). Papers that go beyond numbers (qualitative research).
British Medical Journal 315, 740-743.
Gregersen, P. K., Kowalsky, E., Kohn, N., & Marvin, E. W. (1999). Absolute pitch:
Prevalence, ethnic variation, and estimation of the genetic component. American
Journal of Human Genetics, 65(3), 911-913.
Gritten, A., & King, E. (2006). Introduction. In A. Gritten & E. King (Eds.), Music and
Gesture (pp. xix - xxv). Aldershot, UK: Ashgate.
Grondin, S. (2010). Timing and time perception: A review of recent behavioral and
neuroscience findings and theoretical directions. Attention, Perception &
Psychophysics, 72(3), 561-582. doi: 10.3758/app.72.3.561
Gunther, E., Davenport, G., & O'Modhrain, S. (2002). Cutaneous grooves: composing for
the sense of touch. Paper presented at the Proceedings of the 2002 conference on
New interfaces for musical expression, Dublin, Ireland.
Hallam, S. (2004). How important is practicing as a predictor of learning outcomes in
instrumental music? Paper presented at the 8th International Conference on Music
Perception and Cognition, Evaston, Il.
Halliday, L., & Moore, D. (2010). Auditory basis of language and learning disorders. In C.
Plack (Ed.), The Oxford Handbook of Auditory Science, Hearing (pp. 349-374).
Oxford, UK: Oxford University Press.
Halpern, A. (1989). Memory for the absolute pitch of familiar songs. Memory & Cognition,
17(5), 572-581.
Hansford, R. (2011). Musicians' guide to noise and hearing. Retrieved from
http://downloads.bbc.co.uk/safety/documents/safety-guides/audio-and-music/Safety-
Musician_noise_guide_Part_I.pdf
Harris, J. A., Harris, I. M., & Diamond, M. E. (2001). The topography of tactile learning in
humans. The Journal of Neuroscience, 21(3), 1056-1061.
Hegner, Y., Saur, R., Veit, R., Butts, R., Leiberg, S., Grodd, W., & Braun, C. (2007). BOLD
Adaptation in vibrotactile stimulation: Neuronal networks involved in frequency
discrimination. Journal of Neurophysiology, 97(1), 264-271. doi:
10.1152/jn.00617.2006
224
Hodges, D. (2009). Bodily responses to music. In S. Hallam, I. Cross & M. Thaut (Eds.),
The Oxford Handbook of Music Psychology (pp. 121-103). Oxford: Oxford
University Press.
Hodges, D., & Sebald, D. (2011). Music in the Human Experience. An Introduction to Music
Psychology. Abingdon, UK: Taylor & Francis.
Hollins, M., & Roy, E. A. (1996). Perceived intensity of vibrotactile stimuli: The role of
mechanoreceptive channels. Somatosensory and Motor Research, 13(3-4), 273-286.
doi: 10.3109/08990229609052583
Hopkins, C., Maté-Cid, S., Seiffert, G., Fulford, R., & Ginsborg, J. (2012). Measurement of
vibrotactile thresholds on the fingertip to assess vibrotactile presentation of musical
notes to people with and without a hearing impairment. Paper presented at the
Proceedings of Internoise 12, INCE, New York, NY.
Iverson, J. M., & Goldin-Meadow, S. (1998). Why people gesture when they speak. Nature,
396(6708), 228-228.
Johnson, K. (2001). The roles and functions of cutaneous mechanoreceptors. Current
Opinion in Neurobiology, 11(4), 455-461. doi: 10.1016/s0959-4388(00)00234-8
Johnson, M. (2009). Composing music more accessible to the hearing impaired. Master of
Music University of North Carolina, Greensboro.
Jørgensen, H., & Hallam, S. (2009). Practising. In S. Hallam, I. Cross & M. Thaut (Eds.),
The Oxford Handbook of Music Psychology (pp. 265-273). UK: Oxford University
Press.
Kaas, A., van de Ven, V., Reithler, J., & Goebel, R. (2013). Tactile perceptual learning:
learning curves and transfer to the contralateral finger. Experimental Brain
Research, 224(3), 477-488.
Kaczmarek, K. A., Webster, J. G., Bachyrita, P., & Tompkins, W. J. (1991). Electrotactile
and vibrotactile displays for sensory substitution systems. IEEE Transactions on
Biomedical Engineering, 38(1), 1-16. doi: 10.1109/10.68204
Karam, M., Price, E., Russo, F., Fels, D. I., & Branje, C. (2008). Towards a Model Human
Cochlea: Sensory substitution for crossmodal audio-tactile displays. Paper
presented at the Graphics Interface Conference 2008, Windsor, Ontario, Canada.
Karam, M., Russo, F. A., & Fels, D. I. (2009). Designing the Model Human Cochlea: An
ambient crossmodal audio-tactile display. IEEE Transactions on Haptics, 2(3), 160-
169. doi: 10.1109/toh.2009.32
Kayser, C., Petkov, C., Augath, M., & Logothetis, N. (2005). Integration of touch and sound
in auditory cortex. Neuron, 48(2), 373-384.
225
Keller, P. E., & Appel, M. (2010). Individual differences, auditory imagery and the co-
ordinatory of body movements and sounds in musical ensembles. Music Perception,
28(1), 27-46. doi: 10.1525/mp.2010.28.1.27
Kendon, A. (1967). Some functions of gaze-direction in social interaction. Acta
psychologica, 26(1), 22-63. doi: 10.1016/0001-6918(67)90005-4
Kendon, A. (1988). How gestures can become like words. In F. Poyatos (Ed.), Crosscultural
Perspectives in nonverbal Communication (pp. 131-141). Toronto: C. J. Hogrefe
Publishers.
Kendon, A. (2004). Visible action as gesture. In A. Kendon, Gesture. Visible Action as
Utterance (pp. 7-16). Cambridge: Cambridge University Press.
Kenny, D. T., & Osborne, M. S. (2009). Music performance anxiety: New insights from
young musicians Advances in Cognitive Psychology, 2(2-3), 103-112.
Killion, M. (2009). What special hearing aid properties do performing musicians require.
Hearing Review, 16(2), 20-31.
King, E., & Ginsborg, J. (2011). Gestures and glances: Interactions in ensemble rehearsal. In
A. Gritten & K. E (Eds.), New Perspectives of Music and Gesture (pp. 177-202).
Surrey: Ashgate.
Kirschner, S., & Tomasello, M. (2009). Joint drumming: Social context facilitates
synchronization in preschool children. Journal of Experimental Child Psychology,
102(3), 299-314. doi: 10.1016/j.jecp.2008.07.005
Knudsen, V. O. (1928). “Hearing” with the sense of touch. The Journal of General
Psychology, 1(2), 320-352. doi: 10.1080/00221309.1928.9920128
Küle, O. (2011). The Semiotic Gesture In A. Gritten & E. King (Eds.), New Perspectives on
Music and Gesture (pp. 123-130). Surrey, UK: Ashgate.
Küssner, M., Gold, N., Tidhar, D., Prior, H., & Leech-Wilkinson, D. (2011). Synaesthetic
traces: Digital acquisition of musical shapes. Proceedings of the 2nd Supporting
Digital Humanities Conference: ‘Answering the unaskable’, Copenhagen, Denmark.
Laitinen, H., & Poulsen, T. (2008). Questionnaire investigation of musicians' use of hearing
protectors, self reported hearing disorders, and their experience of their working
environment. International Journal of Audiology, 47(4), 160-168. doi:
10.1080/14992020801886770
Landis, J. R., & Koch, G. G. (1977). Measurement of observer agreement for categorical
data. Biometrics, 33(1), 159-174. doi: 10.2307/2529310
Lassaletta, L., Castro, A., Bastarrica, M., Perez-Mora, R., Madero, R., De Sarria, J., &
Gavilan, J. (2007). Does music perception have an impact on quality of life
following cochlear implantation? Acta Otolaryngol, 127(7), 682-686. doi:
10.1080/00016480601002112

226
Leek, M., Molis, R., Kubli, L., & Tufts, J. (2008). Enjoyment of music by elderly hearing-
impaired listeners. Journal of the American Academy of Audiology, 19(6), 519-526.
Levänen, S., & Hamdorf, D. (2001). Feeling vibrations: enhanced tactile sensitivity in
congenitally deaf humans. Neuroscience Letters, 301(1), 75-77. doi: 10.1016/s0304-
3940(01)01597-x
Levänen, S., Jousmaki, V., & Hari, R. (1998). Vibration-induced auditory-cortex activation
in a congenitally deaf adult. Current Biology, 8(15), 869-872. doi: 10.1016/s0960-
9822(07)00348-x
Levitin, D. J. (1994). Absolute memory for musical pitch - evidence from the production of
learned melodies. Perception & Psychophysics, 56(4), 414-423.
Levitin, D. J., & Rogers, S. E. (2005). Absolute pitch: perception, coding, and controversies.
Trends in Cognitive Sciences, 9(1), 26-33. doi: 10.1016/j.tics.2004.11.007
Liddell, S. (2000). Blended spaces and diexis in sign language discourse. In D. McNeill
(Ed.), Language and Gesture (pp. 331-357). Cambridge: Cambridge University
Press.
Loehr, J. & Palmer, C. (2009). Subdividing the beat: Auditory and motor contributions to
synchronisation. Music Perception, 26(5). 415-425. doi: 10.1525/mp.2009.26.5.415
London, J. (2006). Musical rhythm: motion, pace and gesture. In A. Gritten & E. King
(Eds.), Music and Gesture (pp. 126-141). Aldershot: Ashgate.
Looi, V., McDermott, H., McKay, C., & Hickson, L. (2007). Comparisons of quality ratings
for music by cochlear implant and hearing aid users. Ear and Hearing, 28(2), 59S-
61S.
Looi, V., McDermott, H., McKay, C., & Hickson, L. (2008a). The effect of cochlear
implantation on music perception by adults with usable pre-operative acoustic
hearing. International Journal of Audiology, 47(5), 257-268. doi:
10.1080/14992020801955237
Looi, V., McDermott, H., McKay, C., & Hickson, L. (2008b). Music perception of cochlear
implant users compared with that of hearing aid users. Ear and Hearing, 29(3), 421-
434. doi: 10.1097/AUD.0b013e31816a0d0b
Luck, G., & Sloboda, J. A. (2009). Spatio-temporal cues for visually mediated
synchronization. Music Perception, 26(5), 465-473.
MacNamara, A., Holmes, P., & Collins, D. (2006). The pathway to excellence: the role of
psychological characteristics in negotiating the challenges of musical development.
British Journal of Music Education, 23, 285-302.
Malloch, J. (2007). Adding vibrotactile feedback to the T-stick digital musical instrument.
Music Technology Area: McGill University.

227
Masataka, N. (1999). Preference for infant-directed singing in 2-day-old hearing infants of
deaf parents. Developmental Psychology, 35(4), 1001-1005. doi: 10.1037/0012-
1649.35.4.1001
Maté-Cid, S., Hopkins, C., & Seiffert, G., Fulford, R., & Ginsborg, J. (2012). Establishing
vibrotactile thresholds on the fingertip for people with and without a hearing
impairment over the musical frequency range between C1 and C6. Paper presented
at the The 19th International Congress on Sound and Vibration, Vilnius, Lithuania
McDermott, H. J. (2004). Music perception with cochlear implants: a review. Trends Amplif,
8(2), 49-82.
McNeill, D. (1992). Hand and Mind. Chicago: The University of Chicago Press Ltd.
McNeill, D. (Ed.). (2000). Language and Gesture. Cambridge: Cambridge University Press.
Merchel, S., Altinsoy, E., & Stamm, M. (2010). Tactile music instrument recognition for
audio mixers. Paper presented at the Audio Engineering Society 128th Convention,
London, UK.
Merchel, S., Altinsoy, E., & Stamm, M. (2012). Touch the sound: audio-driven tactile
feedback for audio mixing applications. Journal of the Audio Engineering Society,
60(1/2), 47-53.
Merchel, S., Leppin, A., & Altinsoy, E. (2009). Hearing with your body: The influence of
whole-body vibrations on loudness perception Paper presented at the Proceedings of
the Sixteenth International Congress on Sound and Vibration.
Miller, G. (2000). Evolution of human music through sexual selection. In N. Wallin, B.
Merker & S. Brown (Eds.), The origins of music (pp. 329-360). Cambridge, MA:
MIT Press.
Mitani, C., Nakata, T., Trehub, S. E., Kanda, Y., Kumagami, H., Takasaki, K., . . .
Takahashi, H. (2007). Music recognition, music listening, and word recognition by
deaf children with cochlear implants. Ear Hear, 28(2 Suppl), 29S-33S. doi:
10.1097/AUD.0b013e318031547a
Montgomery, R. (2005). There's no point in teaching deaf children music, is there? BMus
Dissertation
Moore, D. G., Burland, K., & Davidson, J. W. (2003). The social context of musical success:
A developmental account. British Journal of Psychology, 94, 529-549.
Moore, B. C. J. (2003). An Introduction to the Psychology of Hearing. San Diego, USA
Academic Press.
Moran, N. (2011). Music, bodies and relationships: An ethnographic contribution to
embodied cognition studies. Psychology of Music. doi: 10.1177/0305735611400174
228
Morgan, G., Killough, C. M., & Thompson, L. A. (2011). Does visual information influence
infants’ movement to music? Psychology of Music. doi:
10.1177/0305735611425897
Morioka, M., & Griffin, M. (2005). Thresholds for the perception of hand-transmitted
vibration: Dependence on contact area and contact location. Somatosensory &
Motor Research, 22(4), 281-297.
Morley, J., & Rowe, M. (1990). Perceived pitch of vibrotactile stimuli: Effects of vibration
amplitude, and implications for vibration frequency coding. Journal of Physiology,
431, 403-416.
Mountcastle, V. B., Reitboeck, H. J., Poggio, G. F., & Steinmetz, M. A. (1991). Adaptation
of the Reitboeck method of multiple microelectrode recording to the neocortex of
the waking monkey. J Neurosci Methods, 36(1), 77-84.
Murnighan, J., & Conlon, D. (1991). The dynamics of intense work groups: A study of
British string quartets. Administrative Science Quarterly, 36(2), 165-186.
Nagarajan, S. S., Blake, D. T., Wright, B. A., Byl, N., & Merzenich, M. M. (1998). Practice-
related improvements in somatosensory interval discrimination are temporally
specific but generalize across skin location, hemisphere, and modality. The Journal
of Neuroscience, 18(4), 1559-1570.
Nanayakkara, S. (2009). Enhancing musical experience for the hearing-impairment using
visual and haptic displays. PhD Thesis.
Nanayakkara, S., Taylor, E., Wyse, L., & Ong, S. (2009). An enhanced musical experience
for the Deaf: Design and evaluation of a music display and a haptic chair.
Proceedings of the SIGCHI Conference on Human Factors in Computing Systems,
337-346, New York, USA. doi: 10.1145/1518701.1518756
Nanayakkara, S., Wyse, L., Ong, S., & Taylor, E. (2013). Enhancing musical experience for
the hearing-impaired using visual and haptic displays. Human–Computer
Interaction, 28(2), 115-160.
Neely, G., & Burström, L. (2006). Gender differences in subjective responses to hand–arm
vibration. International Journal of Industrial Ergonomics, 36(2), 135-140. doi:
10.1016/j.ergon.2005.09.003
Ní Ríain, A. (2010). Ailis Ni Riain introduces Brief-Blue-Electric-Bloom. [video] Retrieved
from http://www.youtube.com/watch?v=sYqSgTg6SOc
Nimmons, G. L., Kang, R. S., Drennan, W. R., Longnion, J., Ruffin, C., Worman, T., . . .
Rubinstein, J. T. (2008). Clinical assessment of music perception in cochlear
implant listeners. Otology & Neurotology, 29(2), 149-155.
O'Modhrain, S. (2003). Cutaneous grooves: Composing for the sense of touch. Journal of
New Music Research, 32(4), 369-381.
229
O'Neill, S. (2011). Developing a young musician's growth mindset: the role of motivation,
self-theories, and resiliency. In I. Deliege & J. Davidson (Eds.), Music and the mind:
essays in honour of John Sloboda (pp. 31-46). Oxford: Oxford University Press.
Oliver, M. (1990). Understanding disability; from theory to practice. Basingstoke:
Macmillan.
Ottlová, M. (2001). Smetana, Bedřich. In S. Sadie (Ed.), The New Grove Dictionary of
Music and Musicians (Second ed., Vol. 23, pp. 537-558): Macmillan.
Overy, K. & Molnar-Szakacs, I. (2009), Being together in time: musical experience and the
mirror neuron system. Music Perception, 26(5), 489-504. doi:
10.1525/MP.2009.26.5.489
Penhune, V. B., Cismaru, R., Dorsaint-Pierre, R., Petitto, L. A., & Zatorre, R. J. (2003). The
morphometry of auditory cortex in the congenitally deaf measured using MRI.
Neuroimage, 20(2), 1215-1225. doi: 10.1016/s1053-8119(03)00373-2
Phillips-Silver, J., & Trainor, L. J. (2005). Feeling the beat: Movement influences infant
rhythm perception. Science, 308(5727), 1430-1430. doi: 10.1126/science.1110922
Phillips-Silver, J., & Trainor, L. J. (2007). Hearing what the body feels: Auditory encoding
of rhythmic movement. Cognition, 105(3), 533-546. doi:
10.1016/j.cognition.2006.11.006
Pijl, S., & Schwarz, D. W. (1995). Melody recognition and musical interval perception by
deaf subjects stimulated with electrical pulse trains through single cochlear implant
electrodes. J Acoust Soc Am, 98(2 Pt 1), 886-895.
Pinker, S. (1997). How the Mind Works. New York: W. W. Norton.
Plack, C. (2010). Overview. In C. Plack (Ed.), The Oxford Handbook of Auditory Science,
Hearing (pp. 1-5). Oxford: Oxford University Press.
Pleger, B., Foerster, A.-F., Ragert, P., Dinse, H. R., Schwenkreis, P., Malin, J.-P., . . .
Tegenthoff, M. (2003). Functional imaging of perceptual learning in human primary
and secondary somatosensory cortex. Neuron, 40(3), 643-653. doi:
http://dx.doi.org/10.1016/S0896-6273(03)00677-9
Posner, M. I., Nissen, M. J., & Klein, R. M. (1976). Visual dominance - information-
processing account of its origins and significance. Psychological Review, 83(2),
157-171. doi: 10.1037//0033-295x.83.2.157
Potier, M., Hoquet, C., Lloyd, R., Nicolas-Puel, C., Uziel, A., & Puel, J.-L. (2009). The risks
of amplified music for disc-jockeys working in nightclubs. Ear and Hearing, 30(2),
291-293
Proksch, J., & Bavelier, D. (2002). Changes in the spatial distribution of visual attention
after early deafness. Journal of Cognitive Neuroscience, 14(5), 687-701. doi:
10.1162/08989290260138591

230
Quiñones, J. (2011). Developing tone based on feel. Flute Talk Magazine, 31(1), 24-8
Repp, B. (2005). Sensorimotor synchronisation: a review of the tapping literature
Phychonomic Bulletin and Review 12(6), 969-992.
Rettenbach, R., Diller, G., & Sireteanu, R. (1999). Do deaf people see better? Texture
segmentation and visual search compensate in adult but not in juvenile subjects.
Journal of Cognitive Neuroscience, 11(5), 560-583. doi: 10.1162/089892999563616
Richardson, M., Campbell, W., & Schmidt, R. (2008). Movement interference during action
observation as emergent coordination. Neuroscience Letters. doi:
10.1016/j.neulet.2008.10.092
Richardson, M., Marsh, K., Isenhower, R., Goodman, J., & Schmidt, R. (2007). Rocking
together: Dynamics of intentional and unintentional interpersonal coordination.
Human Movement Science, 26(6), 867-891. doi: 10.1016/j.humov.2007.07.002
Richardson, M., Marsh, K., & Schmidt, R. (2005). Effects of visual and verbal interaction on
unintentional interpersonal coordination. Journal of Experimental Psychology:
Human Perception and Performance, 31(1), 62-79. doi: 10.1037/0096-1523.31.1.62
Robbins, C., & Robbins, C. (1980). Music for the hearing impaired. USA: Magnamusic-
Baton.
Rocca, C. (2008). The emerging "musical self" - the role of the Nordoff-Robbins music
therapy approach for teenagers at the Mary Hare Schools for the Deaf. In S. Salmon
(Ed.), Hearing - Feeling - Playing (pp. 263-272). Germany: Zeitpunkt Musik.
Roediger, H. L., & Karpicke, J. D. (2006). The power of testing memory: Basic research and
implications for educational practice. Perspectives on Psychological Science, 1(3),
181-210. doi: 10.1111/j.1745-6916.2006.00012.x
Romo, R., Brody, C. D., Hernandez, A., & Lemus, L. (1999). Neuronal correlates of
parametric working memory in the prefrontal cortex. Nature, 399(6735), 470-473.
doi: 10.1038/20939
Royster, J., Royster, L., & Killion, M. (1991). Sound exposures and hearing thresholds of
symphony-orchestra musicians. Journal of the Acoustical Society of America, 89(6),
2793-2803.
Russo, F. (2006). Perceptual considerations in designing and fitting hearing aids for music.
Psychology Publications and Research (Paper 16).
Saah, V., & Marvin, E. (2009). Absolute memory of learned melodies in children trained by
the suzuki violin method. Paper presented at the ICMPC8, Evanston, IL.
Salinas, E., Hernández, A., Zainos, A., & Romo, R. (2000). Periodicity and firing rate as
candidate neural codes for the frequency of vibrotactile stimuli. The Journal of
Neuroscience, 20(14), 5503-5515.
231
Schellenberg, E. G., & Trehub, S. E. (2003). Good pitch memory is widespread.
Psychological Science, 14(3), 262-266.
Schellenberg, E. G., & Trehub, S. E. (2008). Is there an Asian advantage for pitch memory?
Music Perception, 25(3), 241-252. doi: 10.1525/mp.2008.25.3.241
Schurmann, M., Caetano, G., Jousmaki, V., & Hari, R. (2004). Hands help hearing:
Facilitatory audiotactile interaction at low sound-intensity levels. Journal of the
Acoustical Society of America, 115(2), 830-832. doi: 10.1121/1.1639909
Schmidt, J., Verschuure, J., & Brocaar, M. (1994). Hearing loss in students at a
conservatory. International Journal of Audiology, 33(4), 185-194. doi:
10.3109/00206099409071879
Seddon, F., & Biasutti, M. (2009). A comparison of modes of communication between
members of a string quartet and a jazz sextet. Psychology of Music, 37(4), 395-415.
Seitz, A. R., & Dinse, H. R. (2007). A common framework for perceptual learning. Current
Opinion in Neurobiology, 17(2), 148-153. doi: 10.1016/j.conb.2007.02.004
Shakespeare, T., & Watson, N. (2001). The social model of disability: an outdated ideology.
In S. Barnartt & B. Altman (Eds.), Expanding Theories and Expanding
Methodologies: Where We Are and Where We Need To Go (pp. 9-28). UK: Emerald
Group Publishing
Shibata, D. K., & Zhong, J. (2001). Tactile vibrations are heard in auditory cortex in the
deaf: Study with FMRI. Radiology, 221, 484-484.
Sinnett, S., Spence, C., & Soto-Faraco, S. (2007). Visual dominance and attention: The
Colavita effect revisited. Perception & Psychophysics, 69(5), 673-686. doi:
10.3758/bf03193770
Sloboda, J. A., Davidson, J. W., Howe, M. J. A., & Moore, D. G. (1996). The role of
practice in the development of performing musicians. British Journal of Psychology,
87(2), 287-309. doi: 10.1111/j.2044-8295.1996.tb02591.x
Snyder, B. (2009). Memory for music. In S. Hallam, I. Cross & M. Thaut (Eds.), The Oxford
Handbook of Music Psychology (pp. 107-118). Oxford, UK: OUP.
Spitzer, B., Wacker, E., & Blankenburg, F. (2010). Oscillatory correlates of vibrotactile
frequency processing in human working memory. The Journal of Neuroscience,
30(12), 4496-4502. doi: 10.1523/jneurosci.6041-09.2010
Stach, B. (2010). Clinical Audiology, An Introduction. Clifton Park, NY: Delmar.
Straus, J. (2011). Extraordinary Measures. Oxford: Oxford University Press.
Stuart, M., Turman, A., Shaw, J., Walsh, N., & Nguyen, V. (2003). Effects of aging on
vibration detection thresholds at various body regions. BMC Geriatrics, 3, 1-1. doi:
10.1186/1471-2318-3-1
Takeuchi, A. H., & Hulse, S. H. (1993). Absolute pitch. Psychol Bull, 113(2), 345-361.
232
Tan, S. L., Pfordresher, P., & Harré, R. (2010). Psychology of Music Hove, UK: Psychology
Press.
Thompson, W. F., Russo, F., & Quinto, L. (2008). Audio-visual integration of emotional
cues in song. Cognition & Emotion, 22(8), 1457-1470. doi:
10.1080/02699930701813974
Thompson, W. F., Russo, F. A., & Livingstone, S. R. (2010). Facial expressions of singers
influence perceived pitch relations. Psychonomic Bulletin & Review, 17(3), 317-322.
doi: 10.3758/pbr.17.3.317
Todd, N. (1999). Motion in Music: A Neurobiological Pespective. Music Perception, 17(1),
115-126.
Townshend, B., Cotter, N., Van Compernolle, D., & White, R. L. (1987). Pitch perception
by cochlear implant subjects. J Acoust Soc Am, 82(1), 106-115.
Tozer, C., & Crook, H. (2012). Music listening with hearing aids: A review of the literature.
Paper presented at the Music Mind Machine in Sheffield Launch Event, Humanities
Research Institute, Sheffield.
Trehub, S. E., Vongpaisal, T., & Nakata, T. (2009). Music in the lives of deaf children with
cochlear implants. Ann N Y Acad Sci, 1169, 534-542. doi: 10.1111/j.1749-
6632.2009.04554.x
van Besouw, R., Grasmeder, M., Hamilton, M., & Baumann, S. (2011). Music activities and
responses of young cochlear implant recipients. International Journal of Audiology,
50(5), 340-348. doi: 10.3109/14992027.2010.550066
Verrillo, R. (1963). Effect of contactor area on the vibrotactile threshold. The Journal of the
Acoustical Society of America, 35(12), 1962-1966. doi: 10.1121/1.1918868
Verrillo, R. (1979). Comparison of vibrotactile threshold and suprathreshold responses in
men and women. Perception & Psychophysics, 26(1), 20-24.
Verrillo, R. (1982). Effects of aging on the suprathreshold responses to vibration. Perception
& Psychophysics, 32(1), 61-68.
Verrillo, R. (1992). Vibration sensation in humans. Music Perception, 9(3), 291-302.
Verrillo, R., & Bolanowski, S. J. (2003). Effects of temperature on the subjective magnitude
of vibration. Somatosensory & Motor Research, 20(2), 133-137.
Vines, B. W., Krumhansl, C. L., Wanderley, M. M., Dalca, I. M., & Levitin, D. J. (2011).
Music to my eyes: Cross-modal interactions in the perception of emotions in
musical performance. Cognition, 118(2), 157-170. doi:
10.1016/j.cognition.2010.11.010
von Békésy, G. (1959). Synchronism of neural discharges and their demultiplication in pitch
perception on the skin and in gearing. The Journal of the Acoustical Society of
America, 31(3), 338-349.

233
von Békésy, G. (1947). The variation of phase along the basilar membrane with sinusoidal
vibrations. The Journal of the Acoustical Society of America, 19(3), 452-460.
Wanderley, M., & Vines, B. (2006). Origins and functions of clarinettists' ancillary gestures.
In A. Gritten & K. E (Eds.), Music and Gesture (pp. 165-191). Farnham, UK:
Ashgate.
WFMT. (2011). What is music therapy? [Website of World Federation of Music Therapy].
Retrieved from
http://www.musictherapyworld.net/WFMT/FAQ_Music_Therapy.html
Whittaker, P. (1986). Music Potential in the Profoundly Deaf. BA thesis, University of
Oxford.
Whittaker, P. (2008). MatD - Music and the Deaf. In S. Salmon (Ed.), Hearing - Feeling -
Playing (pp. 29-40). Germany: zeitpunkt musik.
Wilberg, H. (2008). With my hearing aids I'm actually quite normal! In S. Salmon (Ed.),
Hearing - Feeling - Playing (pp. 15-19). Germany: Zeitpunkt Musik.
Williamon, A., & Davidson, J. W. (2002). Exploring co-performer communication. Musicae
Scientiae, 6(1), 53-72.
Williams, H. (1989). The value of music to the Deaf. British Journal of Music Education,
6(01), 81-98. doi: 10.1017/S0265051700006859
Wright, B. & Sabin, A. (2007). Perceptual learning: how much daily training is enough?
Experimental Brain Research, 180(4), 727-736. doi: 10.1007/s00221-007-0898-z
Yennari, M. (2010). Beginnings of song in young deaf children using cochlear implants: the
song they move, the song they feel, the song they share. Music Education Research,
12(3), 281-297.
Young, V. M., & Colman, A. M. (1979). Some psychological processes in string quartets.
Psychology of Music, 7(1), 12-18. doi: 10.1177/030573567971002
Zatorre, R. J., Perry, D. W., Beckett, C. A., Westbury, C. F., & Evans, A. C. (1998).
Functional anatomy of musical processing in listeners with absolute pitch and
relative pitch. Proceedings of the National Academy Sciences of the USA, 95(6),
3172-3177.
Functions and Uses of Auditory and Visual Feedback: Exploring the Possible Effects
of a Hearing Impairment on Music Performance
Robert Fulford, 1*
Jane Ginsborg, 2*
Juliet Goldbart 3#
*Centre for Music Performance Research, Royal Northern College of Music, Manchester, UK
# Research Institute for Health and Social Change, Manchester Metropolitan University, Manchester, UK
ABSTRACT
Musicians with hearing impairments develop complex strategies for
interactive performance relying on dynamic, or sometimes reduced,
auditory attending and increased visual attending in music-making
situations. Research suggests that there may be a relationship between
auditory feedback and the use of visual cues by musicians with
hearing impairments. To improve understanding of these processes,
the present study explored the use of auditory and visual cues by
examining the movement and looking behaviours of performing
musicians. Four violinists with normal hearing were observed playing
together as two duos in four experimental conditions involving the
attenuation of auditory and visual information in which participants
wore earplugs and/or faced away from their partner. Dependent
measures were the duration and frequency of physical movements and
looking behaviour as coded in Noldus Observer XT9. Analysis
showed that auditory attenuation of the level used in this study had no
effect on the violinists’ movement or looking behaviour. The ability to
see a co-performer did not affect movement behaviour but, where
there was the possibility of eye contact, the amount of both movement
and looking behaviour increased. Idiosyncratic, inter-player
differences were far larger than intra-player differences resulting from
the manipulation of experimental conditions, highlighting the
uniqueness of individual playing styles. The results confirm that
physical movement in music serves many purposes: it is used
expressively by the player but can be consciously modified for the
benefit of the co-performer.
I. INTRODUCTION
A. Movement and gesture in music
The study of musicians’ physical movements in performance
has become established alongside a ‘movement away from a
narrow focus on the musical mind towards a broader focus on
the musical body’ (Gritten & King, 2006, p. xix). While
musicological studies have focused on the physical and
metaphorical correlates of auditory ‘gestures’, studies using
psychological methods have attempted to provide an
understanding of the perception of physical movements and
their use and function in music performance. But when can a
movement be described as a gesture? Gesture exists in a wider
context of non-verbal communication; we illustrate size,
position and shape using actions of the fingers, hands, arms,
body and face. Adam Kendon defines gesture as:
…those actions or those aspects of another’s actions that, having
these features (of manifest deliberate expressiveness), tend to be
directly perceived as being under the guidance of the observed
person’s voluntary control and being done for the purpose of
expression rather than in the service of some practical aim (Kendon,
2004, p. 15).
Volitional control is therefore important but semantic
content is less so; it is simply the perception of intended
expressiveness that makes an action a gesture. Küle (2011)
argues that ‘[the] most important, stable element in a musical
semantics is the primary signification from musical phrase to
gesture and from musical gesture to emotional content’ (Küle,
2011, p. 129). Kendon’s definition does not contradict Küle’s
but neither acknowledges that, in music, movements serve
practical purposes. Visual information is relied upon by all
musicians to maintain good temporal synchrony and stylistic
cohesion (Davidson & Good, 2002), and is especially important
for musicians with hearing impairments (Fulford, Ginsborg, &
Goldbart, 2011). The boundary between movement and gesture
is therefore blurred in musical performance. Musical influences
on movement include the musical score itself which contributes
to the repeatability of ancillary gesture production by musicians
over successive performances (Wanderley & Vines, 2006).
Expertise and familiarity between co-performers (King &
Ginsborg, 2011) and musical performance conventions
(Ginsborg, 2009) have been shown to affect musicians’
movements, and ethnographic studies highlight the fact that
movement cues that co-ordinate joint action in musical
performance are socially constructed and embedded in the
relationships between players (Moran, 2011).
Musicians’ movements can be more effective in conveying
the expressive manner of a piece to an audience than the audible
sounds that correspond to the movements, especially to a
non-musician audience (Davidson, 1993). Visual perception of
the performer’s head, upper torso and hands help audiences
construct meaning in music by integrating auditory and visual
information (Thompson, Russo, & Quinto, 2008). Expressive
manners also have what might be thought of as altruistic utility
for co-performers within musical ensembles. Davidson
identified three kinds of gesture used by players in a string
quartet: exit and entrance cues, dynamic cues (for loudness and
softness) and circular body sway, and showed how the latter
related to musical structure. ‘[As] each musician made an entry,
s/he appeared to add an extra ripple to the wave of backwards
and forwards movement that was passing between them’
(Davidson & Good, 2002, p. 198).
B. The influence of auditory feedback on movement in
music
The distinction between gesture in musical and non-musical
contexts is especially clear when the role of auditory feedback
is considered. The limits of auditory perception dictate the
extent to which we can entrain to, and physically embody
rhythmic patterns. The highest rate (fastest beats) we can
perceive aurally is about 600 events/beats per minute (an
inter-onset interval of 100ms) while the lowest rate (slowest
beats) that can be entrained to psychologically is 30
events/beats per minute (IOI of 2000ms) (London, 2006).
Furthermore, proponents of dynamic attending theory (DAT)
suggest that we can only synchronise our attention and motor
behaviour to aurally perceived rhythms within this range (Repp,
2005). Movements to music are therefore governed by our
physiology, but also our psychology. Developmental research
has shown that seven-month-old infants trained to bounce in
either duple or triple time will subsequently listen longer to
music accented in the trained meter, suggesting that
vestibular-auditory interaction is intrinsically pleasurable;
rocking or bouncing to music is a strong precursor of human
musical behaviour and persists into adulthood (Phillips-Silver
& Trainor, 2005, 2007). However, the expressive, ancillary
gestures of performing musicians are clearly much more than
basic physical responses to rhythmic, auditory input.
Keller has shown that ‘auditory imagery facilitates
interpersonal coordination by enhancing the operation of
internal models that simulate one’s own and others’ actions
during ensemble performance’ (Keller & Appel, 2010). If
auditory information is needed for the formation of auditory
imagery, it implies that auditory information facilitates the
regulation of physical movement. This being the case, how
might the attenuation of auditory information, perhaps as the
result of hearing impairment, affect a musician’s movement
production? More or larger movements during performance
might indicate that they have a self-regulatory function,
supporting or bolstering the performer’s internal
representations of the music. Perhaps musicians recruit
movement to improve the integrity of auditory imagery
impaired by the attenuation of auditory information?
Conversely, less movement when auditory information is
attenuated would confirm the universal, proportional
relationship between musical stimuli and physical movement
proposed by Hodges (2009).
C. The influence of visual feedback on movement in
music
Laboratory research has shown that four- to seven-month-old
infants produced less spontaneous rhythmic movement to music
when visual information was presented simultaneously
(Morgan, Killough, & Thompson, 2011). While this is evidence
that if music is heard, it is moved to, Morgan et al. argue that
their findings reflect the ‘Colavita effect’ of visual sensory
dominance: human beings are more likely to rely on visual than
auditory information when carrying out temporal processing
tasks (Colavita, 1974), perhaps to compensate for the fact that
information about the environment such as alerts and cues is
conveyed more effectively via the auditory modality (Posner,
Nissen, & Klein, 1976). However, while only the simplest
rhythmic tasks tend to elicit auditory dominance, selective
attention to other sensory modalities can modulate visual
dominance (Sinnett, Spence, & Soto-Faraco, 2007). Visual
information appears to be wholly unnecessary for tasks
involving vestibular and/or proprioceptive feedback in the
auditory encoding of musical rhythm (Phillips-Silver & Trainor,
2005, 2007).
Music performance is, however, a special case. Recent
studies of cross-modal perception of music have demonstrated
that it is possible to obtain emotional information (similar to
Davidson’s ‘expressive manner’) from the visual perception of
solo singing (Thompson, et al., 2008) and instrumental playing
(Vines, Krumhansl, Wanderley, Dalca, & Levitin, 2011). It is
also possible to infer pitch relationships from solo singing using
visual information (Thompson, Russo, & Livingstone, 2010).
Performers, as well as audiences, use visual information for
tasks such as sight-reading. Banton (1995) found no difference
between the performances of pianists who were prevented from
hearing what they were playing while sight-reading unfamiliar
scores and those who sight-read as normal. Pianists who were
prevented from seeing their hands on the keyboard, however,
made significantly more errors. Thus, Colavita’s visual sensory
dominance not only affects the performance of simple motor
tasks but also complex musical tasks such as sight-reading.
Returning to the question of the effect of a hearing
impairment on music-making, there is evidence that musicians
compensate for hearing impairments by recruiting the visual
channel for information about timing and expressive manner
(Fulford, et al., 2011). The sensory compensation hypothesis
states that, for example, blind people have better hearing than
people without visual impairments. However, people born with
profound deafness develop different abilities at different times
and cross-sectional research has shown that visual
compensation for deafness may not develop until adulthood
(Rettenbach, Diller, & Sireteanu, 1999). Nevertheless, deaf
individuals ‘possessed greater attentional resources in the
periphery [of the visual field] but less in the centre when
compared to hearing individuals’ (Proksch & Bavelier, 2002, p.
687) and differences between profoundly deaf and hearing
individuals have been found in the retina and optic nerve (prior
to the visual cortex), responsible for peripheral vision (Codina
et al., 2011). If musical situations present high attentional
demands on looking behaviour of the kind that might foster
enhanced visual perception in profoundly deaf adults (Proksch
& Bavelier, 2002), increases in looking behaviour when
auditory information is attenuated might reveal a broad human
‘kneejerk’ response whereby the visual modality is recruited to
a greater extent, as suggested by theories of sensory
compensation. Additionally, research suggests that visual
dominance prevails in complex situations and that ‘without an
increase in attention to the auditory stimuli, visual stimuli
remain prepotent’ (Morgan, et al., 2011, p. 13).
D. Aims and research questions
The present study aimed to explore the relationship between,
and effects of, auditory and visual information on musicians’
movement and looking behaviours in musical performance.
Research demonstrates a clear association between auditory
feedback and movement to music via links between
vestibular/proprioceptive feedback and auditory processing,
but the influence of a hearing impairment on movement to
music has not been addressed. Furthermore, the existence of
sensory compensation mechanisms in the profoundly deaf
alongside anecdotal evidence of increased looking behaviour in
musicians with hearing impairments has not been tested in a
musical context. Research has also demonstrated the expressive
power of the musical performance that is perceived visually, yet
very little attention has been paid to the use and function of
visual perception of the performer on the co-performer, as
opposed to the audience. To explore these issues it is necessary
to observe performing musicians in groups while controlling for
auditory feedback and visual contact with co-performers.
As it is not possible to fully control for the level of a naturally
occurring hearing impairment in an experimental context
(confounds include type and history of hearing loss and use of
hearing aid technology), four violinists with normal hearing
experienced the attenuation of auditory information defined as a
reduction in the quality and/or absolute volume of sound.
Visual information was manipulated by preventing one or both
co-performers from seeing the other, resulting in the attenuation
of visual information whereby the extent to which the other
performer’s movements could be seen was reduced. The
dependent variables were ‘movement behaviour’ (the physical
movements of the body) representing either a response to the
music or communication with the other performer, and ‘looking
behaviour’ (players’ glances and gazes towards their
co-performer during performance), given that musicians are
likely to attend to visual cues that are useful to them and ignore
those that are not. Finally, as movement and looking behaviours
seem to be driven by the need to stay together and in time with
other players in group music performance, ensemble synchrony
was also measured. Two broad questions were formulated in
light of the literature review, aims and rationale stated above:
Q1. What is the effect of attenuating auditory information
on musicians’ movement behaviour, looking behaviour
and ensemble synchrony?
Q2. What is the effect of attenuating visual information on
musicians’ movement behaviour, looking behaviour and
ensemble synchrony?
Six hypotheses were formulated as follows:
Hypothesis 1 was made on the basis that auditory
information provides a stimulus for movement and that this
movement can in turn facilitate the encoding of auditory
information. It predicted that participants would make less
movement when auditory feedback when was attenuated than
when it was not.
Hypothesis 2 was based on the findings of interviews
undertaken by the first author with musicians with hearing
impairments and evidence of enhanced peripheral vision and
attentional processing in profoundly deaf adults. It predicted
that participants would look towards their partner more when
auditory information (the sound of their own, and their partner’s
playing) was attenuated.
Hypothesis 3 predicted that ensemble synchrony would be
better when auditory feedback was not attenuated.
Hypothesis 4 was based on research showing that physical
movements carrying semantic meaning are produced for the
benefit of co-performers. It predicted that participants would
make more movements when they could see their co-performer
than when they could not.
Hypothesis 5 predicted that participants would look towards
their partner more when they had the opportunity to do so, i.e.
when they were facing toward their partner and/or their partner
was facing towards, rather than away, from them.
Hypothesis 6 predicted that ensemble synchrony would be
better when players could see their co-performer than when
they were facing away.
II. METHOD
A. Design
The study combined the use of observation and experimental
methods in that the behaviours of each violinist while playing
were observed, coded and counted in each experimental
condition. The independent variables were the level of auditory
input, either normal or attenuated, and visual contact between
players, either possible or impossible. Players wore earplugs in
‘attenuated-auditory’ (hereafter ‘attenuated’) but not ‘hearing’
conditions. Players faced away from their partner in
‘attenuated-visual’ (hereafter, ‘non-visual’) conditions and
towards each other in ‘visual’ conditions; players could not see
their partner in non-visual conditions. As shown in Table 1, the
four experimental conditions were therefore: hearing with
visual contact (HV), hearing with no visual contact (HnV),
attenuated with visual contact (AV) and attenuated with no
visual contact (AnV). As there were two players, there were 16
experimental conditions including four ‘same-condition’ pairs
(bold in Table 1).
Table 1. Condition matrix showing same condition pairs in bold
HV-HV HnV-HV AV-HV AnV-HV
HV-HnV HnV-HnV AV-HnV AnV-HnV
HV-AV HnV-AV AV-AV AnV-AV
HV-AnV HnV-AnV AV-AnV AnV-AnV
B. Participants
Two pairs of violinists were recruited. The four violinists
were of similar levels of expertise being drawn from the MMus
degree course at the RNCM. Their pseudonyms, ages, year of
study and part played are shown in Table 2. None of the players
had worked in a duo with their partner before, ensuring there
were no differences in familiarity, a factor that has been shown
to affect gesture production (King & Ginsborg, 2011).
Table 2. Participants
Duo Age Year Part
1 Rebecca 24 First 1st
Jess 23 Second 2nd
2 Rosemary 22 First 1st
Sarah 23 Second 2nd
C. Apparatus and Materials
Video recordings of the duos were made using Panasonic
NV-GS280 video recorders. Participants wore standard
memory foam ear plugs by Moldex: Spark Plugs (soft) 7812
with a single number rating (SNR) attenuation of 35dB. These
are easy to use, familiar and well tolerated by musicians,
providing a good level of general attenuation across
frequencies.
The composer Emma-Ruth Richards, a PhD student at the
RNCM, was commissioned to write a short piece for the study
(Sketch) to ensure that all players were equally unfamiliar with
the piece. The commission included ‘entry markers’ and tempo
changes for each player individually and both players.
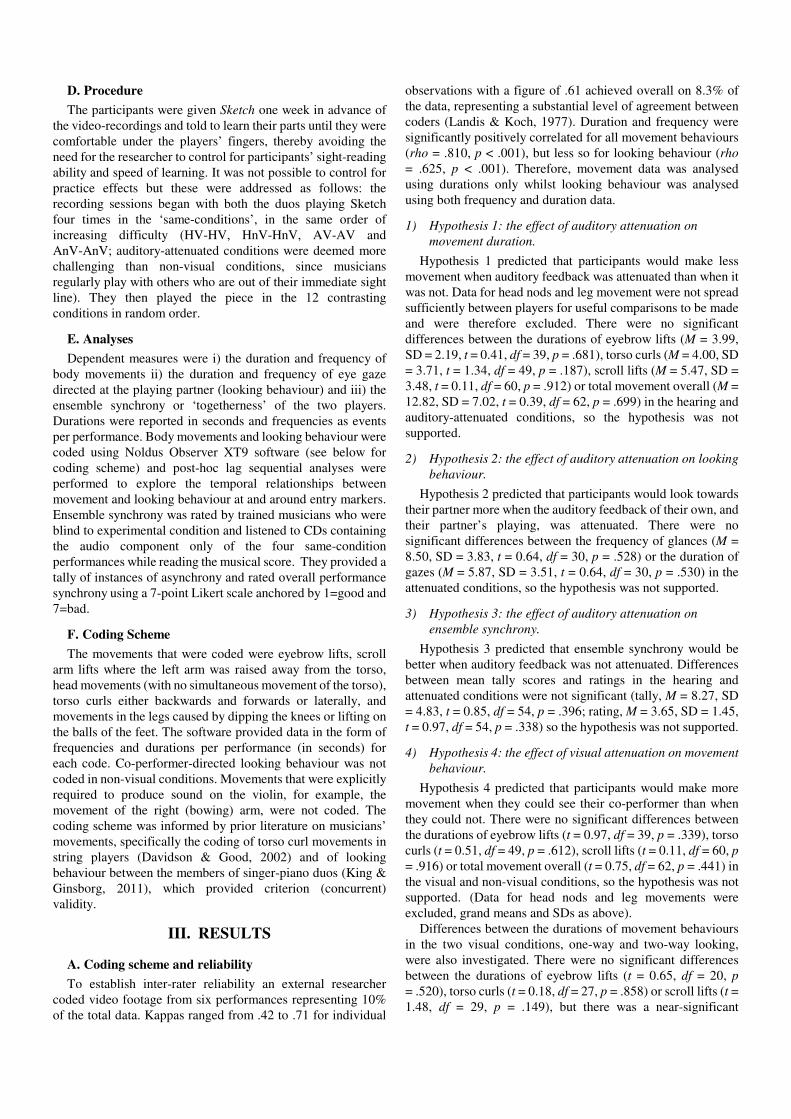
D. Procedure
The participants were given Sketch one week in advance of
the video-recordings and told to learn their parts until they were
comfortable under the players’ fingers, thereby avoiding the
need for the researcher to control for participants’ sight-reading
ability and speed of learning. It was not possible to control for
practice effects but these were addressed as follows: the
recording sessions began with both the duos playing Sketch
four times in the ‘same-conditions’, in the same order of
increasing difficulty (HV-HV, HnV-HnV, AV-AV and
AnV-AnV; auditory-attenuated conditions were deemed more
challenging than non-visual conditions, since musicians
regularly play with others who are out of their immediate sight
line). They then played the piece in the 12 contrasting
conditions in random order.
E. Analyses
Dependent measures were i) the duration and frequency of
body movements ii) the duration and frequency of eye gaze
directed at the playing partner (looking behaviour) and iii) the
ensemble synchrony or ‘togetherness’ of the two players.
Durations were reported in seconds and frequencies as events
per performance. Body movements and looking behaviour were
coded using Noldus Observer XT9 software (see below for
coding scheme) and post-hoc lag sequential analyses were
performed to explore the temporal relationships between
movement and looking behaviour at and around entry markers.
Ensemble synchrony was rated by trained musicians who were
blind to experimental condition and listened to CDs containing
the audio component only of the four same-condition
performances while reading the musical score. They provided a
tally of instances of asynchrony and rated overall performance
synchrony using a 7-point Likert scale anchored by 1=good and
7=bad.
F. Coding Scheme
The movements that were coded were eyebrow lifts, scroll
arm lifts where the left arm was raised away from the torso,
head movements (with no simultaneous movement of the torso),
torso curls either backwards and forwards or laterally, and
movements in the legs caused by dipping the knees or lifting on
the balls of the feet. The software provided data in the form of
frequencies and durations per performance (in seconds) for
each code. Co-performer-directed looking behaviour was not
coded in non-visual conditions. Movements that were explicitly
required to produce sound on the violin, for example, the
movement of the right (bowing) arm, were not coded. The
coding scheme was informed by prior literature on musicians’
movements, specifically the coding of torso curl movements in
string players (Davidson & Good, 2002) and of looking
behaviour between the members of singer-piano duos (King &
Ginsborg, 2011), which provided criterion (concurrent)
validity.
III. RESULTS
A. Coding scheme and reliability
To establish inter-rater reliability an external researcher
coded video footage from six performances representing 10%
of the total data. Kappas ranged from .42 to .71 for individual
observations with a figure of .61 achieved overall on 8.3% of
the data, representing a substantial level of agreement between
coders (Landis & Koch, 1977). Duration and frequency were
significantly positively correlated for all movement behaviours
(rho = .810, p < .001), but less so for looking behaviour (rho
= .625, p < .001). Therefore, movement data was analysed
using durations only whilst looking behaviour was analysed
using both frequency and duration data.
1) Hypothesis 1: the effect of auditory attenuation on
movement duration.
Hypothesis 1 predicted that participants would make less
movement when auditory feedback was attenuated than when it
was not. Data for head nods and leg movement were not spread
sufficiently between players for useful comparisons to be made
and were therefore excluded. There were no significant
differences between the durations of eyebrow lifts (M = 3.99,
SD = 2.19, t = 0.41, df = 39, p = .681), torso curls (M = 4.00, SD
= 3.71, t = 1.34, df = 49, p = .187), scroll lifts (M = 5.47, SD =
3.48, t = 0.11, df = 60, p = .912) or total movement overall (M =
12.82, SD = 7.02, t = 0.39, df = 62, p = .699) in the hearing and
auditory-attenuated conditions, so the hypothesis was not
supported.
2) Hypothesis 2: the effect of auditory attenuation on looking
behaviour.
Hypothesis 2 predicted that participants would look towards
their partner more when the auditory feedback of their own, and
their partner’s playing, was attenuated. There were no
significant differences between the frequency of glances (M =
8.50, SD = 3.83, t = 0.64, df = 30, p = .528) or the duration of
gazes (M = 5.87, SD = 3.51, t = 0.64, df = 30, p = .530) in the
attenuated conditions, so the hypothesis was not supported.
3) Hypothesis 3: the effect of auditory attenuation on
ensemble synchrony.
Hypothesis 3 predicted that ensemble synchrony would be
better when auditory feedback was not attenuated. Differences
between mean tally scores and ratings in the hearing and
attenuated conditions were not significant (tally, M = 8.27, SD
= 4.83, t = 0.85, df = 54, p = .396; rating, M = 3.65, SD = 1.45,
t = 0.97, df = 54, p = .338) so the hypothesis was not supported.
4) Hypothesis 4: the effect of visual attenuation on movement
behaviour.
Hypothesis 4 predicted that participants would make more
movement when they could see their co-performer than when
they could not. There were no significant differences between
the durations of eyebrow lifts (t = 0.97, df = 39, p = .339), torso
curls (t = 0.51, df = 49, p = .612), scroll lifts (t = 0.11, df = 60, p
= .916) or total movement overall (t = 0.75, df = 62, p = .441) in
the visual and non-visual conditions, so the hypothesis was not
supported. (Data for head nods and leg movements were
excluded, grand means and SDs as above). Differences between the durations of movement behaviours
in the two visual conditions, one-way and two-way looking,
were also investigated. There were no significant differences
between the durations of eyebrow lifts (t = 0.65, df = 20, p
= .520), torso curls (t = 0.18, df = 27, p = .858) or scroll lifts (t =
1.48, df = 29, p = .149), but there was a near-significant
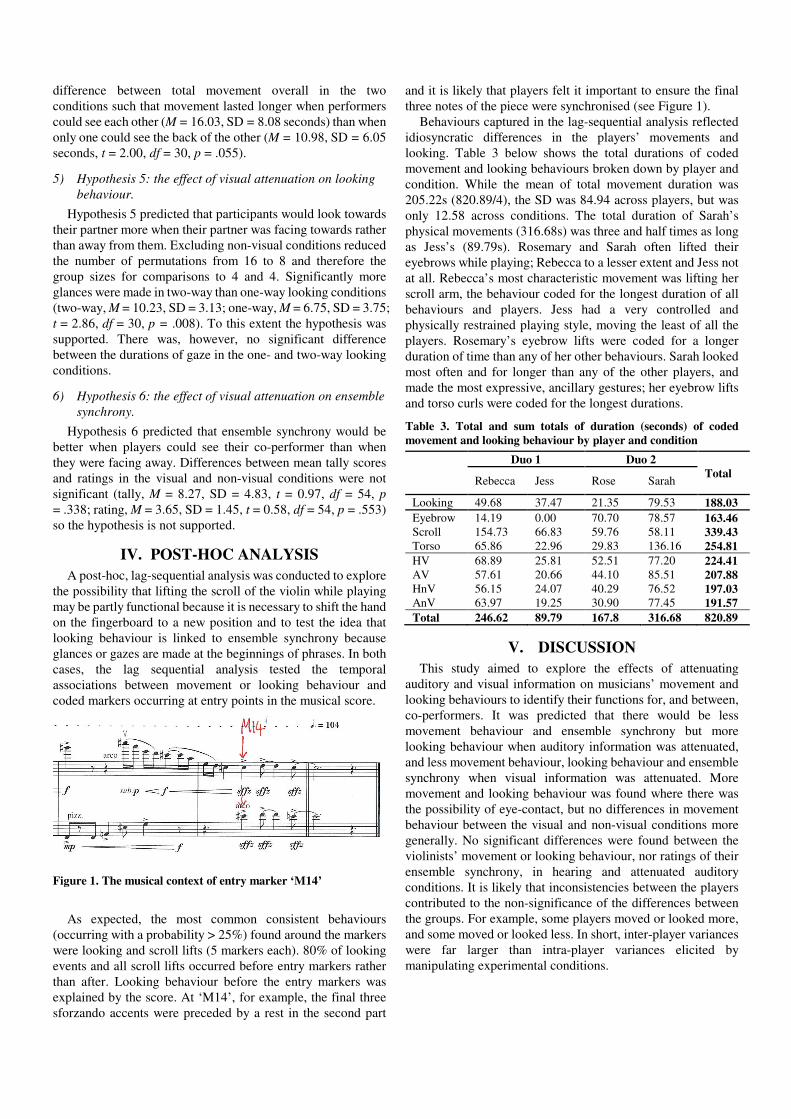
difference between total movement overall in the two
conditions such that movement lasted longer when performers
could see each other (M = 16.03, SD = 8.08 seconds) than when
only one could see the back of the other (M = 10.98, SD = 6.05
seconds, t = 2.00, df = 30, p = .055).
5) Hypothesis 5: the effect of visual attenuation on looking
behaviour.
Hypothesis 5 predicted that participants would look towards
their partner more when their partner was facing towards rather
than away from them. Excluding non-visual conditions reduced
the number of permutations from 16 to 8 and therefore the
group sizes for comparisons to 4 and 4. Significantly more
glances were made in two-way than one-way looking conditions
(two-way, M = 10.23, SD = 3.13; one-way, M = 6.75, SD = 3.75;
t = 2.86, df = 30, p = .008). To this extent the hypothesis was
supported. There was, however, no significant difference
between the durations of gaze in the one- and two-way looking
conditions.
6) Hypothesis 6: the effect of visual attenuation on ensemble
synchrony.
Hypothesis 6 predicted that ensemble synchrony would be
better when players could see their co-performer than when
they were facing away. Differences between mean tally scores
and ratings in the visual and non-visual conditions were not
significant (tally, M = 8.27, SD = 4.83, t = 0.97, df = 54, p
= .338; rating, M = 3.65, SD = 1.45, t = 0.58, df = 54, p = .553)
so the hypothesis is not supported.
IV. POST-HOC ANALYSIS
A post-hoc, lag-sequential analysis was conducted to explore
the possibility that lifting the scroll of the violin while playing
may be partly functional because it is necessary to shift the hand
on the fingerboard to a new position and to test the idea that
looking behaviour is linked to ensemble synchrony because
glances or gazes are made at the beginnings of phrases. In both
cases, the lag sequential analysis tested the temporal
associations between movement or looking behaviour and
coded markers occurring at entry points in the musical score.
Figure 1. The musical context of entry marker ‘M14’
As expected, the most common consistent behaviours
(occurring with a probability > 25%) found around the markers
were looking and scroll lifts (5 markers each). 80% of looking
events and all scroll lifts occurred before entry markers rather
than after. Looking behaviour before the entry markers was
explained by the score. At ‘M14’, for example, the final three
sforzando accents were preceded by a rest in the second part
and it is likely that players felt it important to ensure the final
three notes of the piece were synchronised (see Figure 1).
Behaviours captured in the lag-sequential analysis reflected
idiosyncratic differences in the players’ movements and
looking. Table 3 below shows the total durations of coded
movement and looking behaviours broken down by player and
condition. While the mean of total movement duration was
205.22s (820.89/4), the SD was 84.94 across players, but was
only 12.58 across conditions. The total duration of Sarah’s
physical movements (316.68s) was three and half times as long
as Jess’s (89.79s). Rosemary and Sarah often lifted their
eyebrows while playing; Rebecca to a lesser extent and Jess not
at all. Rebecca’s most characteristic movement was lifting her
scroll arm, the behaviour coded for the longest duration of all
behaviours and players. Jess had a very controlled and
physically restrained playing style, moving the least of all the
players. Rosemary’s eyebrow lifts were coded for a longer
duration of time than any of her other behaviours. Sarah looked
most often and for longer than any of the other players, and
made the most expressive, ancillary gestures; her eyebrow lifts
and torso curls were coded for the longest durations.
Table 3. Total and sum totals of duration (seconds) of coded
movement and looking behaviour by player and condition
Duo 1 Duo 2
Total Rebecca Jess Rose Sarah
Looking 49.68 37.47 21.35 79.53 188.03
Eyebrow 14.19 0.00 70.70 78.57 163.46
Scroll 154.73 66.83 59.76 58.11 339.43
Torso 65.86 22.96 29.83 136.16 254.81
HV 68.89 25.81 52.51 77.20 224.41
AV 57.61 20.66 44.10 85.51 207.88
HnV 56.15 24.07 40.29 76.52 197.03
AnV 63.97 19.25 30.90 77.45 191.57
Total 246.62 89.79 167.8 316.68 820.89
V. DISCUSSION
This study aimed to explore the effects of attenuating
auditory and visual information on musicians’ movement and
looking behaviours to identify their functions for, and between,
co-performers. It was predicted that there would be less
movement behaviour and ensemble synchrony but more
looking behaviour when auditory information was attenuated,
and less movement behaviour, looking behaviour and ensemble
synchrony when visual information was attenuated. More
movement and looking behaviour was found where there was
the possibility of eye-contact, but no differences in movement
behaviour between the visual and non-visual conditions more
generally. No significant differences were found between the
violinists’ movement or looking behaviour, nor ratings of their
ensemble synchrony, in hearing and attenuated auditory
conditions. It is likely that inconsistencies between the players
contributed to the non-significance of the differences between
the groups. For example, some players moved or looked more,
and some moved or looked less. In short, inter-player variances
were far larger than intra-player variances elicited by
manipulating experimental conditions.

1) Hypothesis 1: Auditory attenuation and physical
movement.
There were no significant differences between movement
behaviour in the hearing and auditory attenuation conditions.
While it should not be inferred that movement behaviour would
always be the same in the two conditions, this has the important
implication (certainly for the wider project) that there is little
reason to suspect that musicians with hearing impairments will
move or behave differently to other musicians, on the basis of
auditory feedback alone. While changes in hearing level over
the life span cannot be accounted for here, it is likely that
variance in observed movement can be largely attributed to
individual differences in playing or performance styles. This
highlights the importance of acknowledging players’
uniqueness: no one person will use their body in exactly the
same way as another. Likewise, no one person will think in
exactly the same way as another, and given that movements can
be consciously altered or ‘projected’ (Davidson, 1993),
individual differences in musicians’ movement must be
attributed to the uniqueness of their bodies and minds. Physical
gestures in music may be in part a basic response to auditory
input and in part a projected communication of intended
manner to audiences and co-performers alike.
2) Hypothesis 2: Auditory attenuation and looking
behaviour.
There were no significant differences between looking
behaviour in the hearing and auditory attenuation conditions. It
is likely that the attenuation provided by the ear plugs was not
large enough to disturb normal looking patterns in group music
performance. Earplugs of the type used in this study are
distributed to musicians to mitigate the risk of noise induced
hearing loss. While uptake of earplugs by professional
musicians is typically low due to concerns about changes to the
subjective perception of sound using the plugs (Hansford,
2011), these results are reassuring in that such ear plugs do not
appear to cause players to alter their looking behaviour in
performance.
3) Hypotheses 3 & 6: Auditory attenuation, visual feedback
and ensemble synchrony.
There were no significant differences between ratings for
temporal synchrony in the hearing and attenuated auditory
conditions, or the visual and non-visual conditions. The level of
auditory attenuation provided by ear plugs in this study was,
reassuringly, not large enough to compromise ensemble
synchrony. Ensemble synchrony is arguably the most
fundamental of requirements for music-making in ensembles
and is primarily an auditory task (Goodman, 2002). Musicians
regularly perform in ensembles where sight lines do not allow
for direct eye contact with other players. Furthermore, direct
visual contact is not always possible in group music-making, for
example, for singers on stage, or between orchestral musicians.
However, other results in this study suggest that visual
information facilitates ensemble synchrony as evidenced by the
use of looking behaviour around entry markers (see discussion
of Hypothesis 5 below).
4) Hypothesis 4: Visual feedback and physical movement.
There were no significant differences overall between the
amounts of movement behaviours produced in the visual and
non-visual conditions. However, there were differences
between the players. For example, Rosemary’s eyebrow lifts
were coded for over three times as long as her gazing or
glancing toward Sarah (Table 3). For all other players, eyebrow
lifts were coded for an equal or shorter duration than looking
behaviour overall. The frequency and duration of her eyebrow
lifts increased significantly when they were facing each other
(frequency: visual, M = 4.88, SD = 1.46; non-visual, M = 3.63,
SD = 0.74; t = 2.16, df = 14, p = .049 and duration: visual M =
5.40s, SD = 1.17; non-visual, M = 3.44s, SD = 1.06; t = 3.51, df
= 14, p = .003). Given Rosemary’s tendency to glance often
towards Sarah, a physiological link between the two behaviours
might be proposed whereby partner-directed looking (not
possible in non-visual conditions) is involuntarily accompanied
by raising the eyebrows. In fact eyebrow lifts occurred
independently of looking behaviour. They are likely to be a
function of the musician’s unique physical and performance
style although Rosemary’s eyebrow lifts, in particular, show
that they can be used as an ancillary expressive gesture in music
performance, as in normal conversation.
Subsequent comparisons between the amounts of physical
behaviour in the one- and two-way looking conditions revealed
stronger effects; the overall increase in total movement when
players faced each other, enabling eye contact, approached
significance and was consistent for all four players. Of the
component movements, Rebecca lifted her scroll significantly
more often when there was the possibility of eye contact with
her partner Jess (one-way looking, 4; two-way looking, 8)
coded for a significantly longer duration (one-way, 6.92 s;
two-way, 11.9 s, in both cases U = 16.00, N1 = 4, N2 = 4, p
= .003, two-tailed). The lag sequential analysis suggested that
lifting the scroll was functional, at least in part, for all players,
resulting from the necessary shifting of the hand on the
fingerboard to a new position at entry points and beginnings of
phrases. For Rebecca however, the use of the scroll lift
movement was further used to keep the beat, facilitating
ensemble synchrony with Jess at entry points. Rebecca
exaggerated her scroll lifts for this purpose and for Jess’s
benefit as evidenced by their increased frequency and duration
in two-way looking conditions where the two players were
facing towards each other.
So were players consciously moving more or deliberately
projecting their movement for the benefit of their co-performers?
Or does the potential for eye contact produce an increase in
physical movement as a response at a pre-conscious level in the
sensory-motor process? The answer appears to be a bit of both.
Rebecca’s scroll lifts were more emphatic when eye contact
with Jess was possible suggesting that she was using them
consciously and in a communicative gestural way. This element
of intentionality elevates such movements to the status of
‘gesture’ according to conventional definitions (Kendon, 2004),
yet they are also functional in that violinists appear to lift their
scrolls to produce sound. Conversely, as we have seen,
Rosemary’s eyebrow lifts were not made consciously for the
benefit of her co-performer. This does not undermine the idea
that eyebrow lifts in music performance could be a less
conscious, ancillary movement that may be expressive of the
performer’s internal auditory representations of music, since
they were observed in the present study even when musicians
could not see their co-performers’ faces. It is not implausible
that they could even be perceived by co-performers as gestural.
5) Hypothesis 5: Visual feedback (including eye contact) and
looking behaviour.
The effect of visual feedback on looking behaviour was
explored by comparing its frequency and duration in one-way
and two-way looking conditions. All four players looked at
each other significantly more often when they had the
opportunity to do so in two-way conditions but not for
significantly longer. The potential for eye contact, therefore,
appears to alter the kind of looking behaviour produced by
players; there were more frequent glances but gazes were no
longer in two-way looking conditions. This suggests that the
potential for eye contact prompts, but does not prolong, eye
contact. Perhaps it feels inappropriate to gaze directly into
co-performers’ eyes for too long when playing. It is known that
long gazes, unless directed towards a lover, are usually taken as
a challenge (Ellsworth & Langer, 1976) and that, in dyadic
conversation, eye contact is used to regulate turn-taking with
the talker looking up to ‘hand over’ when they have finished
speaking (Kendon, 1967). It may be that the two-way looking
condition in this study, where both players faced each other,
added a conversational dimension to the situation whereby the
intensity of direct eye-contact resulted in players looking
towards each other more often but for less time.
Analysis of the frequency and duration of looking behaviours
revealed the differences in looking style between and within the
duos. Rebecca and Jess (Duo 1) looked towards each other for
similar amounts of time in total, 49s and 37s respectively (Table
3), but it was Jess’s looking that was captured more frequently
around entry markers in the lag sequential analysis, indicating
‘following’ behaviour at entry points where she would look at
Rebecca, her ‘leader’, to ensure synchrony. The different
looking styles of the two players may reflect differences in their
learning of the music or ability to read ahead. Their looking
behaviour was not influenced by the potential for eye contact
with the other player. Rather, it seems that, for Jess, maintaining
ensemble synchrony by visually tracking the movements of her
leader was more important than making eye contact per se.
There were more contrasts between the looking behaviours
of the two players in Duo 2 than between those of Duo 1.
Rosemary’s looking behaviour was made up of relatively short
glances towards Sarah that were consistent in duration. Sarah’s
looking behaviour was the most frequent and lasted longest of
all the players. The contrast between their looking styles may
again indicate leader-follower dynamics: Sarah used her eyes to
maintain synchrony of timing and manner with Rosemary who,
as leader, looked back far less. The duration and frequency of
Rosemary’s looking behaviour was significantly higher when
Sarah was facing toward her enabling the possibility of eye
contact (frequency: two-way, Md = 12.00, R = 7.00; one-way
Md = 2.00, R = 1.00 and duration: two-way, Md = 4.86s, R =
3.02; one-way Md = 1.12, range = 0.13 and U = 16.00, N1 = 4,
N2 = 4, p = .028, two-tailed, in both cases). Rosemary’s looking
was therefore augmented by visual contact with Sarah, perhaps
because the desire for eye contact, as opposed to the need to
maintain temporal synchrony, was more important for her.
Sarah clearly enjoyed her moments of eye contact with
Rosemary and, of all the players, seemed most able to play from
memory, allowing her to look towards Rosemary instead of at
the score.
Although there were more glances in the two-way conditions,
looking behaviour was nevertheless maintained by all players in
one-way conditions. The frequency of one-way looking was
66% of two-way looking, and the duration of one-way looking
was 90% of two-way looking. Clearly eye contact is not the sole
purpose of partner-directed looking. Rather, there is value for
musicians in being able to perceive co-performers’ movements
and gestures, even if viewed from behind, or players would not
need to look towards them at all. This supports the finding that
co-performer-directed looking (including direct eye contact)
helps musicians achieve performances that are both temporally
synchronous and unified in manner (Davidson & Good, 2002).
The lag sequential analysis in the present study supports this by
showing that looking behaviour was the most common
behaviour +/- 1s around entry markers. More frequent looking
in two-way conditions might also be explained by the model of
‘intimacy equilibrium’ as proposed by Argyle and Dean
whereby looking behaviour and physical proximity have an
inverse relationship, both signalling intimacy. They propose
that looking functions as both a channel for feedback and a
signal that the channel is open (Argyle & Dean, 1965). Here, the
increased frequency of looking events in two-way conditions
may be a signal of increased intimacy between the players
afforded by the face-to-face configuration. That the duration of
looking events in one-way and two-way conditions was similar
suggests that the potential for eye contact between players did
not alter the way in which the players visually perceive
information about their partner’s movements. Rather, it is
intimacy between players that is revealed by looking toward the
co-performer more frequently, but not for longer.
VI. CONCLUSIONS
This study explored the use of movement and looking
behaviour in violin duos in order to understand the possible
uses of auditory and visual information by the players.
Although the study began life as a pilot, reflected in the small
sample size, the results extend current knowledge about how
movements are visually perceived and used by musicians and
their co-performers. Players used more movement and looking
behaviour when they had the potential for eye-contact, but not
when their auditory feedback was attenuated. This finding
supports the idea that players’ conscious knowledge of ‘being
seen’ by co-performers adds intentionality to physical
movement, regardless of their own sensory feedback.
Movements required for the sound production (such as the
scroll lift of a violinist) as well as ancillary gestures (such as
torso curls and eyebrow lifts) both have the potential, therefore,
to be perceived by co-performers (and the audience) as carrying
the conscious intent of ‘gesturalness’ or a specific ‘manner’.
The influence of the visually-perceived co-performer on
performers’ movement and looking behaviour highlights the
generative processes behind the execution and delivery of
movement to music. Movements form as a response to auditory
and visual stimuli. Yet they can be altered, augmented and

projected for the benefit of co-performers. More research must
be done with larger samples and ensembles to establish to what
degree movements in interactive performance settings are
altruistic and communicative.
The uniqueness of human bodies was highlighted. While the
coding scheme encompassed general movements, it was clear
that individual physiology, intentions and mental understanding
of the music affect the ways in which movements are produced
and expressed. Individuals also use and process sensory
information in different ways. Further research with musicians
with hearing impairments is necessary to explore the role of
visual information in the idiosyncratic communicative
processes that result from such musical collaborations. The
importance of spatial location in relation to co-performers is
important, not only for musicians with hearing impairments, but
for those with normal hearing, given the effects of face-to-face
orientation on player behaviour shown in this study.
Furthermore, there remains a discrepancy between the
conception of ensemble synchrony as a primarily auditory task,
not affected by visual attenuation, and the reports of musicians
with hearing impairments which state that visual information is
crucial for its attainment.
Kendon’s definition of gesture as ‘manifest deliberate
expressiveness’ provided a useful foundation for discussion in
this study. Yet the present results highlight the fact that, in
music, the origin and function of movements are heterogeneous.
Seemingly functional movements such as the violinist’s lifting
of the left ‘scroll’ arm may also be gestural if the mover intends
them to be, as was the case for Rebecca. In the repertoire of
violinists’ movements coded in this study, each was found to be
unique in its degree of functionality as auditory
(sound-production), communicative (co-performer directed)
and expressive or gestural. Head nods occurring on strong
accents mirrored forceful down-bow motions in the opposite
direction and were expressive in function but also linked to the
physiology of sound production on the violin. Conversely, torso
curls and eyebrow lifts, being ancillary to sound production on
the violin, were expressive of internal representations of the
music (Rosemary’s eyebrows) yet could still benefit the
co-performer (torso curls in one-way looking conditions).
Every movement in music performance can therefore be said
to vary on a number of dimensions: i) the degree to which
movement represents a response to (pre-conscious) internal
auditory representations of music; ii) the degree to which the
movement is requisite or facilitates sound production from an
instrument or voice; iii) the degree to which the musician adds
or mediates the element of consciously intended expression;
and iv) the degree to which the movement is (consciously)
perceived as being expressive, having an expressive manner or
being expressive of something particular, by co-performers
and/or an audience. The volitional generation of expressive
gesture (iii) is subject to the influences of physiology and the
cognitive processes of the individual performer as well as
socio-cultural influences. A movement may be expressive
regardless of what was consciously intended and there may be
disconnect between the performer’s intention and what the
observer perceives. It may have been that Rebecca’s
consciously exaggerated scroll arm movements provided a
useful visual cue for her co-performer, Jess, in facilitating
ensemble synchrony. However, it is likely that an audience
would perceive more expressivity in Rosemary’s (apparently
unintentional) eyebrow lifts given their role in the generation
and perception of facial expression. There is a distinction,
therefore, between the function of movement in conveying
expressive meaning to the observing listener and to the
observing co-performer. While most research has focused on
the former, this study suggests that co-performer-directed
physical expression may be just as salient for the performer as
that which is audience-directed.
Jane Davidson has written that her most interesting work on
co-performance cues took place while working with blind
musicians where the power of proxemics and non-verbal cues
was revealed. She states that a performer’s capacity to deal with
moment-by-moment processing of tempo changes or memory
slips depends on ‘an opening of ears and eye to hear and see
cues’ (Davidson, 2009). The present results support Davidson’s
observation by highlighting the value of visually-perceived
information from co-performers in group music-making.
Subsequent work with musicians with hearing-impairments will
further explore the use of verbal and non-verbal communication
in music performance; shaping gestures and rehearsal talk.
ACKNOWLEDGMENT
The present study was financially supported by the AHRC.
The authors would like to thank the violinists who
enthusiastically gave up their time to take part.
REFERENCES
Argyle, M., & Dean, J. (1965). Eye-contact, distance and affiliation.
Sociometry, 28, 289-304.
Banton, L. J. (1995). The Role of Visual and Auditory Feedback
during the Sight-Reading of Music. Psychology of Music, 23(1),
3-16.
Bavelier, D., Dye, M. W. G., & Hauser, P. C. (2006). Do deaf
individuals see better? Trends in Cognitive Sciences, 10(11),
512-518.
Bosworth, R. G., & Dobkins, K. R. (2002). The effects of spatial
attention on motion processing in deaf signers, hearing signers,
and hearing nonsigners. Brain and Cognition, 49(1), 152-169.
Codina, C., Pascalis, O., Mody, C., Toomey, P., Rose, J., Gummer, L.,
& Buckley, D. (2011). Visual Advantage in Deaf Adults Linked to
Retinal Changes. Plos One, 6(6).
Colavita, F. (1974). Human sensory dominance. Attention, Perception,
& Psychophysics, 16(2), 409-412.
Coolican, H. (Ed.) (2004). Research Methods and Statistics in
Psychology. London: Hodder Arnold.
Davidson, J. (1993). Visual Perception of Performance Manner in the
Movements of Solo Musicians. Psychology of Music, 21(2),
103-113.
Davidson, J. (2009). Movement and collaboration in musical
performance. In R. Parncutt (Ed.), The Oxford Handbook of
Music Psychology (pp. 364-376). New York: Oxford University
Press.
Davidson, J., & Good, J. (2002). Social and Musical Co-Ordination
between Members of a String Quartet: An Exploratory Study.
Psychology of Music, 30(2), 186-201.
Ellsworth, P. C., & Langer, E. J. (1976). Staring and approach -
interpretation of stare as a nonspecific activator. Journal of
Personality and Social Psychology, 33(1), 117-122.
Fulford, R., Ginsborg, J., & Goldbart, J. (2011). Learning not to listen:
the experiences of musicians with hearing impairments. Music
Education Research, 13(4), 429-446.
Ginsborg, J. (2009). Beating time: the role of kinaesthetic learning in
the development of mental representations for music. In A.
Mornell (Ed.), Art in Motion (pp. 121-142). Frankfurt: Peter
Lang.
Ginsborg, J., & Chaffin, R. (2011). Performance cues in singing:
evidence from practice and recall. In I. Deliege & J. Davidson
(Eds.), Music and the Mind: Investigating the functions and
processes of music (a book in honour of John Sloboda). Oxford:
Oxford University Press.
Goodman, E. (2002). Ensemble performance. In J. Rink (Ed.),
Musical Performance (pp. 153-167). Cambridge: Cambridge
University Press.
Gritten, A., & King, E. (2006). Introduction. In A. Gritten & E. King
(Eds.), Music and Gesture (pp. xix - xxv). Aldershot, UK:
Ashgate.
Hansford, R. (2011). Musicians' guide to noise and hearing Retrieved
30 March 2012 from http://www.bbc.co.uk/safety/pdf/Safety-
Musician_noise_guide_Part_I.pdf
Hodges, D. (2009). Bodily responses to music. In S. Hallam, I. Cross
& M. Thaut (Eds.), The Oxford Handbook of Music Psychology
(pp. 121-103). Oxford: Oxford University Press.
Keller, P. E., & Appel, M. (2010). Individual differences, auditory
imagery and the co-ordinatory of body movements and sounds in
musical ensembles. Music Perception, 28(1), 27-46.
Kendon, A. (1967). Some functions of gaze-direction in social
interaction. Acta psychologica, 26(1), 22-63.
Kendon, A. (2004). Visible action as gesture. In A. Kendon, Gesture.
Visible Action as Utterance (pp. 7-16). Cambridge: Cambridge
University Press.
King, E., & Ginsborg, J. (2011). Gestures and Glances: Interactions in
Ensemble Rehearsal. In A. Gritten & K. E (Eds.), New
Perspectives of Music and Gesture (pp. 177-202). Surrey:
Ashgate.
Küle, O. (2011). The Semiotic Gesture In A. Gritten & E. King (Eds.),
New Perspectives on Music and Gesture (pp. 123-130). Surrey,
UK: Ashgate.
Landis, J. R., & Koch, G. G. (1977). Measurement of Observer
Agreement for Categorical Data. Biometrics, 33(1), 159-174.
London, J. (2006). Musical rhythm: motion, pace and gesture. In A.
Gritten & E. King (Eds.), Music and Gesture (pp. 126-141).
Aldershot: Ashgate.
Moran, N. (2011). Music, bodies and relationships: An ethnographic
contribution to embodied cognition studies. Psychology of Music.
doi: 10.1177/0305735611400174
Morgan, G., Killough, C. M., & Thompson, L. A. (2011). Does visual
information influence infants’ movement to music? Psychology of
Music. doi: 10.1177/0305735611425897
Overy, K., & Molnar-Szakacs, I. (2009). Being Together in Time:
Musical Experience and the Mirror Neuron System. Music
Perception, 26(5), 489-504.
Phillips-Silver, J., & Trainor, L. J. (2005). Feeling the beat:
Movement influences infant rhythm perception. Science,
308(5727), 1430-1430.
Phillips-Silver, J., & Trainor, L. J. (2007). Hearing what the body
feels: Auditory encoding of rhythmic movement. Cognition,
105(3), 533-546.
Posner, M. I., Nissen, M. J., & Klein, R. M. (1976). Visual
Dominance – Information-processing account of its origins and
significance. Psychological Review, 83(2), 157-171.
Proksch, J., & Bavelier, D. (2002). Changes in the spatial distribution
of visual attention after early deafness. Journal of Cognitive
Neuroscience, 14(5), 687-701.
Repp, B. (2005). Sensorimotor synchronisation: a review of the
tapping literature Phychonomic Bulletin and Review 12(6),
969-992.
Rettenbach, R., Diller, G., & Sireteanu, R. (1999). Do deaf people see
better? Texture segmentation and visual search compensate in
adult but not in juvenile subjects. Journal of Cognitive
Neuroscience, 11(5), 560-583.
Sinnett, S., Spence, C., & Soto-Faraco, S. (2007). Visual dominance
and attention: The Colavita effect revisited. Perception &
Psychophysics, 69(5), 673-686.
Thompson, W. F., Russo, F., & Quinto, L. (2008). Audio-visual
integration of emotional cues in song. Cognition & Emotion,
22(8), 1457-1470.
Thompson, W. F., Russo, F. A., & Livingstone, S. R. (2010). Facial
expressions of singers influence perceived pitch relations.
Psychonomic Bulletin & Review, 17(3), 317-322
Vines, B. W., Krumhansl, C. L., Wanderley, M. M., Dalca, I. M., &
Levitin, D. J. (2011). Music to my eyes: Cross-modal interactions
in the perception of emotions in musical performance. Cognition,
118(2), 157-170.
Wanderley, M., & Vines, B. (2006). Origins and Functions of
Clarinettists' Ancillary Gestures. In A. Gritten & K. E (Eds.),
Music and Gesture (pp. 165-191). Farnham, UK: Ashgate.
This article was downloaded by: [Royal Northern College Music]On: 01 December 2011, At: 05:01Publisher: RoutledgeInforma Ltd Registered in England and Wales Registered Number: 1072954 Registeredoffice: Mortimer House, 37-41 Mortimer Street, London W1T 3JH, UK
Music Education ResearchPublication details, including instructions for authors andsubscription information:http://www.tandfonline.com/loi/cmue20
Learning not to listen: the experiencesof musicians with hearing impairmentsRobert Fulford a , Jane Ginsborg a & Juliet Goldbart ba Centre for Music Performance Research, Royal Northern Collegeof Music, 124 Oxford Road, Manchester, M13 9RD, UKb School of Health, Psychology & Social Care, ManchesterMetropolitan University, Gaskell Campus, Hathersage Road,Manchester, M13 0JA, UK
Available online: 01 Dec 2011
To cite this article: Robert Fulford, Jane Ginsborg & Juliet Goldbart (2011): Learning not to listen:the experiences of musicians with hearing impairments, Music Education Research, 13:4, 447-464
To link to this article: http://dx.doi.org/10.1080/14613808.2011.632086
PLEASE SCROLL DOWN FOR ARTICLE
Full terms and conditions of use: http://www.tandfonline.com/page/terms-and-conditions
This article may be used for research, teaching, and private study purposes. Anysubstantial or systematic reproduction, redistribution, reselling, loan, sub-licensing,systematic supply, or distribution in any form to anyone is expressly forbidden.
The publisher does not give any warranty express or implied or make any representationthat the contents will be complete or accurate or up to date. The accuracy of anyinstructions, formulae, and drug doses should be independently verified with primarysources. The publisher shall not be liable for any loss, actions, claims, proceedings,demand, or costs or damages whatsoever or howsoever caused arising directly orindirectly in connection with or arising out of the use of this material.
Learning not to listen: the experiences of musicians with hearingimpairments
Robert Fulforda*, Jane Ginsborga and Juliet Goldbartb
aCentre for Music Performance Research, Royal Northern College of Music, 124 Oxford Road,Manchester M13 9RD, UK; bSchool of Health, Psychology & Social Care, ManchesterMetropolitan University, Gaskell Campus, Hathersage Road, Manchester M13 0JA, UK
(Received 16 July 2011; final version received 29 September 2011)
The journey from playful musical exploration in childhood to an adult identity asa skilled musician is likely to be problematic for people with hearing impairments.Although a number of subjective accounts have been published, there is a lack ofempirical research in the area. In this study, twelve musicians with hearingimpairments were interviewed about their musical background, hearing loss andexperiences of interactive music making. A thematic network analysis wasperformed on the verbatim transcripts. Musical families were shown to facilitatepositive, early, influential experiences helping individuals to develop musical self-efficacy. These themes were found to operate independently of the challengesposed by a hearing impairment and in spite of negative music-makingexperiences. Dynamic listening styles were identified, ranging from full relianceon hearing to discriminate and even non-auditory attending. The development oflistening styles was found to be crucial in negotiating problems in auditoryperception caused by physiological changes in hearing level and the distortingeffects of hearing aids.
Keywords: deafness; music; development; listening; vibrotactile
Context
This paper reports exploratory research into the field of music making with a hearing
impairment.1 As part of a larger AHRC-funded project investigating how
vibrotactile technology may facilitate this, the present study aimed to find out
more about how, why and in what social contexts people with hearing impairments
make music.
Introduction
The term ‘deaf musician’ might initially be seen as an oxymoron, but the evidence
suggests otherwise. Ludwig van Beethoven was profoundly deaf for the last eight
years of his life. During this period (1817�1824) he composed his Ninth Symphony
and it is reported that he used a wooden stick held between his teeth and the piano to
compose by feeling the vibrations of the piano (Barry 2008). The Czech composer
Bedrich Smetana became deaf 10 years before his death, during which time he wrote
*Corresponding author. Email: [email protected] at the RIME conference 2011, Exeter, UK.
Music Education Research
Vol. 13, No. 4, December 2011, 447�464
ISSN 1461-3808 print/ISSN 1469-9893 online
# 2011 Taylor & Francis
http://dx.doi.org/10.1080/14613808.2011.632086
http://www.tandfonline.com
Dow
nloa
ded
by [
Roy
al N
orth
ern
Col
lege
Mus
ic]
at 0
5:01
01
Dec
embe
r 20
11
the movements Vysehrad and Vltava of his symphonic cycle Ma vlast (Ottlova 2001).
There are also performers with hearing impairments; Evelyn Glennie is extremely
well known as a solo percussionist and, thanks to a vast media exposure, also known
for her deafness. Profoundly deaf from the age of 12 (Cleall 1983), Glennie reports
that she experiences music by feeling the vibrations created by her instruments
(Glennie 2010). This experience itself provided inspiration for the wider project of
which the present study forms a part.
For every high-profile deaf musician (in June 2011 Wikipedia listed 17) there are
many more skilled deaf musicians who are not so well known. The Association of
Adult Musicians with a Hearing Loss (based in the US) lists a further 20 performers
(www.aamhl.org) and there are about 10 million deaf and hard of hearing people in
the UK including more than 34,000 deaf children and young people (RNID 2010).
The value of music for those with hearing impairments is evidenced in the work of
the UK based charity Music and the Deaf (www.matd.org.uk). Founded by Paul
Whittaker in 1988, it facilitates access to music through creative workshops and the
national deaf orchestras programme and published guides in 2006 designed to assist
teachers to ‘unlock’ the National Curriculum for deaf and hearing impaired children
(Whittaker 2008).
These facts and figures suggest that, contrary to the view that music making with
a hearing impairment must be unfeasible, as some may think, it is actually quite
prevalent. Music is a powerful means of positive communication and expression,
especially between and within groups of people (Cross 2009). The profoundly deaf
flautist and teacher Ruth Montgomery states in the opening line of her college
dissertation:
Music is not about hearing any more than language is. (Montgomery 2005, 10)
In Ruth’s statement, the communicative role of music is highlighted and a succinct
justification for deaf people to make music is given, where the definition of music is
not reduced to its modus operandi or its need to be ‘heard’. There is even less need for
justification if we consider that musicians do not lose the musical skills they have
acquired if they subsequently lose their hearing. It has been shown that temporal
structuring tasks are performed in similar ways regardless of whether they are
presented in the visual or auditory modality, suggesting that sound may not always
be necessary for musical cognition (Karma 1994). This supports a distinction
between the skills needed to make music and the physiological ability to hear. As the
profoundly deaf professional musician Liz Varlow writes:
I think musicality is something that exists irrespective of hearing. (Varlow, pers. comm.)
Hearing loss has, however, a tangible impact on the individual’s ability to listen.
Evelyn Glennie told her audience at the 2003 TED conference:
My job is all about listening. And my aim really, is to teach the world to listen � that’smy only real aim in life. (Glennie 2003)
Glennie went on to say that unique emotional experiences of music can be obtained
by opening up one’s whole body, not just one’s ears. She argued persuasively for a
448 R. Fulford et al.
Dow
nloa
ded
by [
Roy
al N
orth
ern
Col
lege
Mus
ic]
at 0
5:01
01
Dec
embe
r 20
11
broader definition of listening, allowing for the body to feel sound, both physically
and emotionally.
The theme of music and deafness can be found in diverse fields of academic
literature. In applied audiology, studies have addressed the issue of noise-induced
hearing loss (NIHL) in musical contexts. Little evidence was found to suggest that
‘classical’ music causes hearing loss in the conservatoire (Schmidt, Verschuure, andBrocaar 1994). Mean hearing level thresholds (HTLs) of orchestral players do not
differ significantly from normal populations and while the asymmetric playing
positions of some instruments has been suggested as a cause of lateral variances in
HLTs (Royster, Royster, and Killion 1991), it may not explain all variance in this
respect (Backus and Williamon 2009). The damaging effects of loud music on
hearing in the context of the club scene are well documented (Potier et al. 2009). It is
difficult to quantify the risk of hearing loss as the result of exposure to music, in
whatever context, since it cannot easily be isolated from other sounds. Nevertheless,
studies published examining the use of earplugs by musicians in preventing and
managing NIHL in musical contexts indicate a lack of awareness of the potential
risks (Chesky et al. 2009; Drennan 2010; Laitinen and Poulsen 2008). In 2008, the
UK Control of Noise at Work Regulations were extended to include the music and
entertainment sector, and the BBC launched their Noise Project, measuring noise
using dose badges. Some musical performers recorded a level of exposure per day
(LEPd) of over 85dB(A) (average exposure), the level at which an employer is obliged
to provide hearing protection and the initiative heightened musicians’ awareness ofthe risks associated with noise exposure.
The use and effects of hearing aid technology on music perception are addressed
by the academic audiology and psychology literature. There is evidence that cochlear
implants can worsen pitch perception (Looi et al. 2008) and digital hearing aids can
be problematic too: distortions to pitch and timbre are caused by programming and
fitting to maximise speech intelligibility using non-linear amplification or automatic
gain control (Chasin and Russo 2004; Moore 2003). Nevertheless, analogue hearing
aid technology can be optimised for use with music with good results (Dalgarno
1990) as can digital aids if the correct input, frequency compression, amplification
and noise reduction parameters are applied (Chasin 2006). Unfortunately, such
improvements usually cost both time and money.
It is perhaps in the fields of music education and music therapy that the
interaction between technology, music and the deaf community is best understood.
Hearing impairments place tangible limits on access to music, best evidenced in the
self-reports of deaf musicians. Elke Bartlma describes learning the emotive power ofmusic by proxy, when watching the behaviour of her family at musical events; ‘heads
were nodded, strange faces were pulled’ (Bartlma 2008, 22). Although hearing aid
technology increases access to auditory information about timbre, texture and
rhythm, access to the emotional content of music, such as happiness, sadness or fear,
has been shown to be limited for deaf children (Darrow 2006). Despite these
perceptual limits, inherent musicality in young children requires expression (Yennari
2010) and engagement in musical tasks need not be compromised by a hearing
impairment (Chen-Hafteck and Schraer-Joiner 2011). The non-musical outputs of
musical activity, such as intrinsic enjoyment, emotional reward and social benefits,
have long been identified as being especially important in music pedagogy for the
deaf (Williams 1989). Even during the years she was becoming deaf, Glennie’s
Music Education Research 449
Dow
nloa
ded
by [
Roy
al N
orth
ern
Col
lege
Mus
ic]
at 0
5:01
01
Dec
embe
r 20
11

descriptions of the enjoyment of learning music and exploring the sound world
around her (Glennie 1990) support this.
Whilst the above review has introduced research in disparate fields, the common
implication is that deafness is no barrier to music making, nor should it limit the
potential standard that can be attained and enjoyed. Beyond empirical audiology
there is a pedagogical tension between therapeutic engagement in music by the
hearing-impaired, for social and emotional (non-musical) ends, and intrinsic
engagement in music and music theory for its own sake (Whittaker 1986). While
music education research today is holistic, a focus on children and young people
creates a need to increase knowledge and understanding of engagement in music
making by hearing-impaired adults over the lifespan. This study attempts to address
this need.
Method
To explore issues of greatest relevance to participants, an interview study was
conceived. Qualitative research ‘begins with an intention to explore a particular area,
collect ‘‘data’’ (observations and interviews), and generates ideas and hypotheses
from these data largely through what is known as inductive reasoning’ (Greenhalgh
and Taylor 1997). To this end, semi-structured interview schedules contained
questions on a broad range of topics: personal background; musical experience;
history of hearing loss; hearing aids and use in music making; interactive music
making, rehearsal, performance and teaching; and vibrotactile feedback. Schedules
were tailored to include items that were instrument- and background-specific where
possible. Respondents were initially recruited with the help of Music and the Deaf.
Close links between musical people in the deaf community facilitated the recruitment
of further respondents, through snowball sampling, whereby existing respondents
suggested potential participants known to them.
The final sample consisted of a mix of amateur and professional, regularly
practising musicians, male and female, summarised in Table 1. There was a large
range of ages from 17 to 72 years. All but three respondents were happy to be
Table 1. Participant summary.
Name/Pseudonym Deaf since birth? Level of deafness Digital/analogue hearing aids
Angela Taylor Yes Moderate Digital
Anne No Profound None worn
Anthony No Moderate/severe Digital
Danny Lane Yes Profound Analogue
Evelyn Glennie No Profound None worn
Janice Brown No Moderate/severe Digital
Janine Roebuck No Profound Digital
Jessica Quinones N/A N/A None worn
Nick Palfreyman Yes Profound Digital
Paul Whittaker Yes Profound Analogue
Penny Yes Mild None worn
Ruth Montgomery Yes Profound Analogue
William Morton No Moderate Digital
450 R. Fulford et al.
Dow
nloa
ded
by [
Roy
al N
orth
ern
Col
lege
Mus
ic]
at 0
5:01
01
Dec
embe
r 20
11

identified in this research with pseudonyms being adopted in these cases. In the
absence of audiometric data describing exact hearing thresholds by frequency,
respondents’ levels of deafness were reported subjectively, accurate to the best of
their memory, ranging from mild (with a threshold of 25�39 dB), moderate (40�69
dB), severe (79�94 dB) to the modal level of profound deafness (95�dB) (RNID
2010). Those with mild, moderate or severe levels of deafness identified socially as
‘hearing impaired’ rather than deaf or Deaf. Causes of the respondents’ hearing
impairment varied, the most common being sensorineural, a problem with the inner
ear, cochlear hair cells or the vestibulocochlear nerve itself (Moore 2003). Two
respondents had a conductive hearing loss: a problem in the outer or middle ear,
attenuating the transmission of sound waves to the cochlear, which can be caused by
an infection or otosclerosis, for example (Moore 2003). Seven respondents had had
their hearing impairments from birth, while the others became deaf or were deafened
in their childhood, teenage or adult years.
The interviews were carried out, face-to-face, by the first author and the service
of a sign language interpreter was offered. Interviews were recorded on a Roland
Edirol R-09 24bit recorder, transcribed and loaded into QSR NVivo 8. Transcription
was conducted using traditional orthography with pauses indicated simply by dashes.
Data were analysed and interpreted using thematic analysis as described by Braun
and Clarke (2006), which allowed flexibility in generating ‘themes’ and the coding
process to be inductive. To facilitate this analysis, a thematic network (Attride-
Stirling 2001) was created in NVivo. The network is a web-like visual representation
of the themes showing their hierarchy and inter-relationships.
Results and discussion
Data are presented in relation to the thematic network, where global themes comprise
smaller organising themes which are themselves made up of basic themes that relate
most closely to coded sections of transcript. The degree to which challenges and
strategies for interactive music making with a hearing impairment were personal and/
or social helped notionally organise the global themes, as illustrated in Figure 1. The
focus here is on factors influencing musical development, particularly in relation to
the variety and development of respondents’ listening styles. Some topics have
therefore been excluded from this report. The most notable omissions are data
relating to physiological challenges such as hyperacusis and tinnitus, and the
technological challenges of using hearing aids with music. Both are discussed
elsewhere (Fulford, 2011).
Love of music and musicality � Intrinsic musical satisfaction � Interactive is rewarding
� Kinaesthetic satisfaction
Reassuringly, the reasons why someone with a hearing impairment might choose
to participate in the abstract, primarily auditory and largely interactive art of music
making are likely to function as motivations for all musicians, hearing or hearing-
impaired, and contribute to the global theme ‘love of music and musicality’. Paul
referred to the potential for social and emotional rewards when making music with
other people:
Music Education Research 451
Dow
nloa
ded
by [
Roy
al N
orth
ern
Col
lege
Mus
ic]
at 0
5:01
01
Dec
embe
r 20
11

The great thing about being in a choir when you are young, it’s music making as acommunity. When you play the piano or an orchestral instrument, you do it on yourown. There’s a lot of fun in making music with other people.
Interactive aspects of music were not found to provide the same reward for everyone,
however. Jessica, a flute teacher, spoke about her profoundly deaf student Alison,
describing her most significant achievement as performing Muczynski’s unaccom-
panied flute sonata. Nick, who has absolute pitch, reported on his ability to create an
accurate and multilayered auditory picture in his mind’s ear. For him, the enjoyment
of playing the piano by himself, understanding the theory behind the harmonies and
the kinaesthetic satisfaction of feeling the chords and intervals under his fingers, is
where the intrinsic musical satisfaction lies:
The harmony when I play it � is to do with the gaps that I perceive between my fingers,it’s to do with what I know the harmony is going to sound like in my head.
Love of music and musicality � Musical background � Influential early experiences
� Positive musical experiences � Musical family � Deafness facilitating music
making
Most respondents gave examples of experiences that were either emotionally
positive or helped in making a mind up to the pursuit of music as a career. Janine
talked about her first proper stage role in a school production:
Figure 1. Thematic network showing global themes and hierarchy.
452 R. Fulford et al.
Dow
nloa
ded
by [
Roy
al N
orth
ern
Col
lege
Mus
ic]
at 0
5:01
01
Dec
embe
r 20
11
I remember the moment the curtains opened and I was onstage . . . singing the first notesand thinking this is where I want to be for the rest of my life . . . I was 13.
All but one respondent in this study grew up in a musical family. For some, this
meant that recorded music was played and listened to in the house, while others
made music, actively, with other family members. This was particularly important for
those with pre-lingual deafness (Angela, Danny, Nick, Paul, Penny and Ruth) and
indeed it has been shown that access to music may be delayed if it is not provided in
the home environment (Bartlma 2008). However, in some cases, deafness could
actually be a catalyst for music making. For Ruth, music was a safe haven, away from
the pressures of school:
I think because I spoke well, they assumed that I could get along fine, but actually Istruggled a lot . . . But when I went home I had piano lessons � and I felt like I was givensomething from � I found music such a source of comfort. You know � it was a giftreally � and it makes me feel good, it makes me feel better . . .
Anne too, spoke about the difficulties in keeping up with communication in
mainstream schooling:
Interestingly I probably wouldn’t have done this if I hadn’t gone deaf. I foundconversation disappeared � socialising with friends was much more difficult � sitting ina room, practising was fine. It’s something you do on your own � it’s an isolating thing.So yes, that started when I went deaf.
Love of music and musicality � Musical self-efficacy � Musical confidence �
Importance of music theory � Absolute pitch ability
A further organising theme contributing to a love of music was musical self-
efficacy. A number of the respondents described how possessing absolute pitch enables
them to hear music in their mind’s ear from a score, being confident not only of pitch
relations but also exact pitch and sonority. For Paul, a good knowledge of music theory
including chord progression, harmony and counterpoint underpins this ability:
I think that � for any young person with a hearing loss, you have to fill in so many gapsyourself. So I think it’s absolutely vital that you read about music � you read textbooks,you read scores.
Musical self-efficacy was implicit for many, and at times, a necessary bolster in the
face of prejudice about music and deafness, as illustrated by Anne:
You just get your fiddle out and you play to them � they go ‘oh alright you can play’ �it’s very easy thing to prove.
Social challenges � Music and deafness stigma � Concealing deafness � Downplaying
deafness
Despite the existence of well-known musicians with hearing impairments such as
Evelyn Glennie, the respondents were familiar with the attitude that someone may
Music Education Research 453
Dow
nloa
ded
by [
Roy
al N
orth
ern
Col
lege
Mus
ic]
at 0
5:01
01
Dec
embe
r 20
11
be less able or justified in their pursuit of music because of their hearing
impairment. Paul was rejected by 12 universities before successfully securing a
place:
But the music department said no � don’t be silly, you’re deaf � even though I had threegrade eights and two diplomas they said I would take up too much of their time and costthem too much money.
Further problems were not necessarily resolved on entry to music college, as Anne
explained:
One chamber music teacher told me that I couldn’t play chamber music � that there wasno point because I wouldn’t be able to play with anyone else . . . he dropped me.
It is perhaps not surprising that Anthony, who works in a professional orchestra and
has become deafened later in life, made the decision to conceal his hearing
impairment from colleagues:
I haven’t told colleagues at large � and I sort of feel now that there’s no real need to,because what I want is to be able to carry on doing what I do as well as I can in the sameway I have in the past.
The issue of concealing deafness is double-sided. Some argued for the benefits of
being open:
Yes � have to be [open about it]. It’s pointless if you don’t tell them because they startsaying ‘do that’, and they’ll look in the opposite way and I won’t do it.
Others do not conceal their impairment although, like Anthony, they may
downplay it in conversation. For Anne, there is a strong sense of having bigger
fish to fry:
It’s very hard for me to think you know � just because of what I do, you know � I’mpaying my mortgage to bring up my children as well as everything else. I’m not sittingthere going ‘hmm’ [how do I do this] am I?
For Anthony, however, the possibility of further changes to his hearing level in the
future mean that, at present, his job is very important to him:
Well, I suppose on one level, you go to work and you do what you do don’t you. Thatwas my job so I went to do it.
Music-making challenges � Interactive is challenging � Negative music making
experiences � Performance anxiety � Tuning � Ensemble synchrony
Contextual challenges aside, performing music with others presents many task-
related challenges for the player with a hearing impairment, especially in interactive
settings. Negative music making experiences, such as Paul’s account of his organ
diploma recital, leave lasting effects:
454 R. Fulford et al.
Dow
nloa
ded
by [
Roy
al N
orth
ern
Col
lege
Mus
ic]
at 0
5:01
01
Dec
embe
r 20
11

I said I’m deaf, I need someone there to check the balance between the manualsbecause I can’t work this out. They refused. And then they failed me because they saidthat I didn’t play for the acoustics of the room . . . I’ve never been in that building againsince.
Likewise, performance anxiety goes beyond the expected and necessary level of
nervous tension and adrenaline required for a good performance and Janine, the
singer, was especially aware of the negative effects this can have:
I think the anxiety of course is very counterproductive, because you want your body tobe free and relaxed as possible, not knotted up with fear.
The main challenges that cause anxiety and negative experiences arise from the need
to stay in time (ensemble synchrony) and stay in tune with other players. Anne
described the challenge of ensemble synchrony in the context of an orchestral film
score recording:
Because if I’m leading the section . . . and we’re all wearing a click track and I can’t hearit � it’s still me who has to come in. That I find difficult.
Meanwhile, Penny spoke about the amount of work involved in staying in tune:
I wasn’t aware of when I was playing out of tune. So I would be about a semitone flatand I couldn’t hear it, which he [my teacher] was very worried about . . .
Generally, respondents agreed that the more complex the group, the bigger the
challenge to the musician with a hearing impairment, and the greater the likelihood
of having a negative experience. As Danny put it:
If you’ve got a combination of instruments, it’s more complex and it’s harder for me tohear � to pick up the melody or probably the rhythm . . . to identify what music is beingplayed.
Music-making strategies � Personal strategies � Rigorous preparation � Memorising
or internalising music � Social strategies � No talk in rehearsal � Social feedback and
support
Many music-making strategies were described, both personal and social. Janine
gave an example of one occasion on which her requirement for rigorous preparation
could not be met:
So I turn up and we note bash it � and I’m there all day in abject misery and terror � andmaybe my notes bashed out once � but I never work like that � and it was just � Iwanted to die � couldn’t wait to get home to learn it properly.
For others, this preparation extended to learning or memorising the parts of other
players in the ensemble, either out of curiosity (Evelyn) or, for Ruth, necessity:
I have to know the piano score as well as mine. I have to know what the piano isdoing . . . Because you cannot ignore the piano part
Music Education Research 455
Dow
nloa
ded
by [
Roy
al N
orth
ern
Col
lege
Mus
ic]
at 0
5:01
01
Dec
embe
r 20
11
All serious musicians undertake Rigorous preparation. However, some respondents
indicated that their reliance on an internalisation of the music (memorised or not)
was borne of the need to rely on the score rather than a recording. As Paul said:
They will go away and they will listen to it and there’s a limit to what the ear can pickup. You can’t do that. You have to sit down with a score and you have to read it andtherefore you notice everything.
Likewise, although talking in rehearsal is usually tolerated within limits, Janice
indicated that with a hearing impairment, this becomes impossible:
I wouldn’t tend to have a chat with the person next to me � like people dosometimes . . . ’cause you want to make sure � you’re aware of what the conductor isgoing to do next.
For those respondents who do not conceal their deafness, however, social feedback
outside the rehearsal can be beneficial. Janice described how she would always want
people to tell her if she was singing out of tune and Anthony pointed out that it’s
often only praise and feedback from others that lets us know how good we are,
however well or not you are able to hear yourself play.
Music-making strategies � Visual cues � Importance of spatial location � Lip reading
� Physical cues � Muscle memory � Vibrotactile feedback
Important strategies in the group music-making situation relate to the use of visual
and physical cues. Many of these cues exist in the orchestral or ensemble music
situation for anyone to use, hearing or hearing-impaired. However, even a
conductor’s beat can be unclear and this caused problems for Ruth, playing the
Danzi flute concerto:
I said to him sorry, I don’t understand your hands! I was really frustrated. And then Isaid use your mouth � I said please can you just � beat with your mouth . . . ’Cause that’swhat I’m needing.
A technique for identifying beat cues from the movements and gestures of fellow
players was described by William: the raising of a wind instrument to the mouth, for
example, might reinforce a written cue in an orchestral part. Ruth also reported
watching for when other flute players in a band raised their instruments and she
mentioned how reassuring it was to see a tapping foot keeping the beat. It is likely
that individuals with mild losses and hearing aids use visual cues only to reinforce
and confirm ambiguous auditory information. Anne’s reliance on visual information
and cues, however, is high because of her profound hearing loss and her rejection of
hearing aid technology altogether:
Everything I do in the orchestra is visual . . . I know what the strings are doing ’cause thestrings are quite visual . . . I mean everyone knows that I can’t hear, but there are enoughpeople in positions that I can see who would just give me a visual [nods] � and thenyou’re on. But of course that’s difficult.
456 R. Fulford et al.
Dow
nloa
ded
by [
Roy
al N
orth
ern
Col
lege
Mus
ic]
at 0
5:01
01
Dec
embe
r 20
11

Anne’s statement also illustrates how non-concealment of deafness can promote
social support in the form of visual cues and enables lip-reading. In addition, the
importance of spatial location for maintaining sight lines was highlighted, many
respondents going to great lengths to make sure they and other people are positioned
ideally.
Whereas visual cues were used primarily to tackle the challenge of staying in time,
physical cues, those relating to the use of information gained from the body, were
found to be used primarily (but not exclusively) for staying in tune, often by using
some form of muscle memory. William talked extensively about the use of and his
reliance on changes to his embouchure when playing flute and piccolo in his
professional career, to maintain good tuning:
If you’re playing a flute and the organ that you’re playing with in the church is about asemitone sharp, you realise you’ve got to push in as far as you can and lip up.
Tuning by paying attention to embouchure was also something Penny had worked on
at length with her music college teacher, alongside the use of reference tones. For
professional string players such as Anne and Anthony, the ‘muscle memory’ of the
fingers plays an important role in tuning. Their descriptions of the tuning process
provide a very different insight into the usual feedback loop between playing,
listening and adjusting that string players might associate with ‘tuning up’:
Your hearing is a feedback mechanism to tell you that the note you’ve made � you’vealready made � is in tune . . . but basically you’ve made the note � you’ve played it, it’sright, you know you’ve � it � it’s in the right place.
Some examples were given of physical cues being used to facilitate ensemble
synchrony. When Ruth played the flute with her father accompanying her on his
guitar he would sometimes place his foot gently on her foot and tap the beat.
Likewise, in her early years, Anne had a friend develop a mechanical metronome forher to use during her personal practice that would tap her ankle to a given beat. This
had the advantage over a metronome with a flashing light of freeing her to look at
the music, meaning that she need not memorise complex studies for the purpose of
honing her technique.
Managing the sensory experience � Vibrotactile feedback � Listening style andpreferences � Reliance on hearing (learning not to listen) � Acoustic awareness � CD
listening � Instrument preference � Hearing aid technology
Perhaps the most complex strategies reported in this study relate to the manipulation
of sensory information by the individual. These strategies are personal and therefore
unique; they are, of course, highly subjective. Respondents were asked explicitly
about vibrotactile feedback. For Evelyn, in particular, this is central to her music
making:
And he [my teacher] said ’Evelyn, can you actually feel that timpani?’ And I said, yes,I was really concentrating . . . I took the hearing aids out, and discovered that less wascoming through here [ears], but much more was coming through the body. And it wasreally � that for me was a turning point without a doubt.
Music Education Research 457
Dow
nloa
ded
by [
Roy
al N
orth
ern
Col
lege
Mus
ic]
at 0
5:01
01
Dec
embe
r 20
11
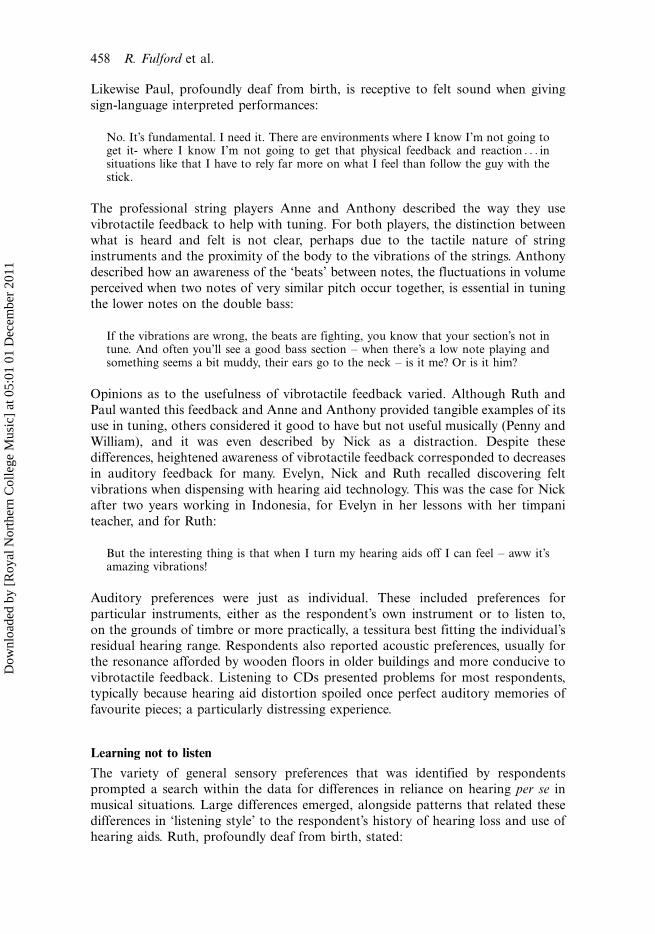
Likewise Paul, profoundly deaf from birth, is receptive to felt sound when giving
sign-language interpreted performances:
No. It’s fundamental. I need it. There are environments where I know I’m not going toget it- where I know I’m not going to get that physical feedback and reaction . . . insituations like that I have to rely far more on what I feel than follow the guy with thestick.
The professional string players Anne and Anthony described the way they use
vibrotactile feedback to help with tuning. For both players, the distinction between
what is heard and felt is not clear, perhaps due to the tactile nature of string
instruments and the proximity of the body to the vibrations of the strings. Anthony
described how an awareness of the ‘beats’ between notes, the fluctuations in volume
perceived when two notes of very similar pitch occur together, is essential in tuning
the lower notes on the double bass:
If the vibrations are wrong, the beats are fighting, you know that your section’s not intune. And often you’ll see a good bass section � when there’s a low note playing andsomething seems a bit muddy, their ears go to the neck � is it me? Or is it him?
Opinions as to the usefulness of vibrotactile feedback varied. Although Ruth and
Paul wanted this feedback and Anne and Anthony provided tangible examples of itsuse in tuning, others considered it good to have but not useful musically (Penny and
William), and it was even described by Nick as a distraction. Despite these
differences, heightened awareness of vibrotactile feedback corresponded to decreases
in auditory feedback for many. Evelyn, Nick and Ruth recalled discovering felt
vibrations when dispensing with hearing aid technology. This was the case for Nick
after two years working in Indonesia, for Evelyn in her lessons with her timpani
teacher, and for Ruth:
But the interesting thing is that when I turn my hearing aids off I can feel � aww it’samazing vibrations!
Auditory preferences were just as individual. These included preferences for
particular instruments, either as the respondent’s own instrument or to listen to,
on the grounds of timbre or more practically, a tessitura best fitting the individual’s
residual hearing range. Respondents also reported acoustic preferences, usually forthe resonance afforded by wooden floors in older buildings and more conducive to
vibrotactile feedback. Listening to CDs presented problems for most respondents,
typically because hearing aid distortion spoiled once perfect auditory memories of
favourite pieces; a particularly distressing experience.
Learning not to listen
The variety of general sensory preferences that was identified by respondentsprompted a search within the data for differences in reliance on hearing per se in
musical situations. Large differences emerged, alongside patterns that related these
differences in ‘listening style’ to the respondent’s history of hearing loss and use of
hearing aids. Ruth, profoundly deaf from birth, stated:
458 R. Fulford et al.
Dow
nloa
ded
by [
Roy
al N
orth
ern
Col
lege
Mus
ic]
at 0
5:01
01
Dec
embe
r 20
11
But I do rely on my hearing more than anything else. Without my hearing aids Iwouldn’t enjoy it as much.
This represents a view shared by, Danny, Janine, Paul and Penny. These individuals
can be described as ‘listening’ musicians where, for the purposes of making music, it
is auditory input that is relied on and the auditory characteristics of music that
facilitate their emotional engagement. Their definition of music would be, as is
conventionally the case, primarily auditory. In contrast, Anne and Evelyn were born
hearing and were therefore able to compare their early memories of sound and music
with the distorted renderings afforded by their hearing aids. Both subsequently
dispensed with hearing aid technology, preferring to find new ways to experience
sound and music in the world. Both are exceptionally good lip-readers, and have
found new ways to obtain the information they need when making music. Yet, in
Anne’s words:
I definitely had to learn to stop listening to what I was hearing because it wasn’taccurate.
It may be hard at first to understand how two professional musicians, both virtuoso
performers, could have become ‘non-listening’. ‘Non-auditory attending’ is a better
description, however, and it is clear that the salient difference between the ‘auditory-
attending’ musicians described previously and the ‘non-auditory-attending’ (Anne
and Evelyn) is that the latter have developed the ability to attend, perhaps more
closely than can people with lesser degrees of hearing impairment, to characteristics
of sound other than those which can be heard, for example, the vibrotactile.
The rest of the sample appeared to occupy a middle ground, where, in the music-
making situation, hearing was sometimes relied on and sometimes ignored. This was
the case for Angela, Anthony, Janice, Nick and William who could be described as
‘discriminate auditory-attending’ musicians. For all three notional groups, the
respondents’ history of hearing loss and background appeared to influence the
development of their adult listening style.
Auditory-attending musicians tended to be those born with their hearing
impairment (Danny, Paul, Penny, Ruth) who learned to use and rely on the
analogue hearing aid technology they grew up with. As such, there was a tendency
to prefer analogue hearing aids, and reject the digital aids introduced in the 90s
(Ruth, Danny, Paul), favouring the power and the wider spectrum of sound
analogue technology provides. Discriminate attending musicians tended to be those
with born with ‘full’ hearing who had an acquired moderate hearing impairment
(Anthony, Janice, William). These musicians were generally happy to work with new
digital hearing aids, but were acutely aware of the various pitch and timbral
distorting effects they can present, having ‘perfect’ early memories of music. All
high-level performers, these musicians were aware of when they could and could not
trust their hearing. As Anthony said:
If I think I’m making a scratchy sound � ugh � that’s not very nice � perhaps everyoneelse can hear it, and it kind of knocks your confidence I suppose. Now I know . . . I knowit’s hearing. So I’m in my head, [I’m] saying don’t worry � to him over there, you don’tsound any different to how you did ten years ago. But to you it sounds a bit different.
Music Education Research 459
Dow
nloa
ded
by [
Roy
al N
orth
ern
Col
lege
Mus
ic]
at 0
5:01
01
Dec
embe
r 20
11
It is likely that the development of listening styles is influenced by the physiological
and sensory experiences associated with hearing impairment, the success of
technological interventions such as hearing aids, social contexts, and even practical,
extrinsic factors such as the instrument played.
Teaching � Teacher challenges � Music and deafness pedagogy � Use of vibrotactile
feedback in education
When describing their musical backgrounds, respondents spoke about their
experiences of being taught and for some, teaching others. Janine and Ruth
concealed their deafness from college teachers, but later ‘came out’ as deaf. Many
of the respondents described reciprocal learning, once it was public knowledge that
they were deaf: in effect, they taught their teachers how to teach them. Paul told his
organ teacher at university that the most powerful way to teach him was simply by
demonstration. Others reported the use of touch and vibrotactile feedback. Ruth
described how she placed her hand on her teacher’s neck and throat to be able to feel
and see what was actually happening when she used double tonguing. Her
experiences later informed her own teaching practice:
Deaf pupils rely on the physical feelings they experience, for example, for a forte note,they need to create a greater force from their diaphragm. This obviously takes a littlemore time to self-monitor than relying on accurate hearing. (Montgomery 2007)
Jessica reports that a combination of vibrotactile feedback and muscle memory
enables her student Alison to map tone production to her body, producing a
homogenous tone and controlling harmonics in a way that even hearing flautists may
find challenging (Quinones 2011), and suggested how this might be achieved:
The reference point was always the way she felt when she played a note . . . so she playsDe La Sonorite � [hums a note] � and then she plays it you know, not so hot, and I say‘Alison, the tone today is a little bit fuzzy’ . . . And she goes ‘yeah I can feel that it’s notquite right’. And I say ‘Right OK, so what is it � what are you feeling that’s different?’And she says something like ‘you know I’m not feeling the vibrations in the same way �the resonance’ . . . a lot of the time she says on the low notes that she can really feel like itgoes all the way through her arms.
Jessica also observes that Alison seemed to lose her ability to produce a focused tone
after breaks in her playing. Good embouchure is highly dependent on dynamic
auditory feedback and it may be that Alison’s impaired access to this channel of
sensory information is the cause.
The teachers among the respondents in the present sample also reported the use
of analogy when communicating complex musical ideas; Ruth refers to different
kinds of chocolate to convey to children the ‘similar, yet different’ concept of major
and minor tonalities. The semantic meanings of ‘sound words’ may also be
constructed differently by people with and without hearing impairments, such that
physical associations may be more salient for the former than auditory ones. For
Alison, the concept of forte means little in terms of sound or loudness; rather, it
simply means to use more air to focus the tone (Quinones 2011). For this reason, it is
all the more important for teachers to use visual imagery to convey complex musical
460 R. Fulford et al.
Dow
nloa
ded
by [
Roy
al N
orth
ern
Col
lege
Mus
ic]
at 0
5:01
01
Dec
embe
r 20
11
moods and colours. Similes and metaphors are also useful. Alison would write
elaborate stories, full of verbs and adjectives describing the ‘mood journey’ of the
pieces she was learning, to which Jessica would ask her to add bar numbers, so she
could relate the stories back to the musical score.
The development of a variety of imaginative teaching styles based on full
knowledge of the hearing impairment can contribute to special teacher-pupil
relationships with positive outcomes for both. Janine’s teacher Arwel learned how
to play effectively to her range of hearing and listening preferences: ‘[he] knows what
I like to hear’. Jessica’s account shows how much can be learned by the hearing
teacher from teaching music to those with hearing impairments, while Ruth and
Janice had benefited themselves from such teaching. When asked about how deaf
children can learn about music, Evelyn stated:
Literally find the sounds . . . because then it makes you look at things, look at textures,look at shapes, look at materials . . . Posture is really crucial... so that the sound isflowing through their system and they have control over that sound.
Conclusion
This study has revealed that there are many ways in which a hearing impairment can
influence music making. For some, deafness itself facilitated early involvement in
music, but otherwise, motivations seemed unrelated to hearing impairment. Reasons
given by respondents for pursuing music as an occupation or a hobby were similar to
those of the hearing population: for example, the support of their parents and the
involvement of their families (Moore, Burland, and Davidson 2003). Influential early
experiences and inherent musicality were found to promote self-efficacy and a love of
music in the same way that they might for hearing musicians. In the present sample
of professionals and keen amateurs, it is perhaps not surprising that 11 of 12
respondents came from musical families. However, for some (Anne and Ruth), music
became a means of escaping the challenges of day-to-day verbal interaction and it is
likely that, whatever the motivation, the quantity and quality of this initial practice in
childhood supported the development of adult musical expertise and identity
(Jørgensen and Hallam 2009). The extent to which deafness may facilitate music
making in this way is likely to depend on the amount of early exposure to music itself
and, given the lack of literature exploring the influence of hearing impairments on
music making over time, this may be a developmental hypothesis worth exploring
further.
Physiological and social challenges were attributed directly by respondents to
their hearing impairments and influenced the way in which their musicality was
expressed: in their choices of instrument, hearing aids and ultimately career. For
some, the challenge of negotiating digital hearing aid technology was almost as great
as meeting professional expectations of ensemble synchrony and tuning. The
strategies used to tackle these challenges were found to be wide-ranging. Cues are
extracted from a wide range of sensory information in different modalities, auditory,
visual and vibrotactile, and the methods reported of harnessing these cues indicate
extreme resourcefulness on the part of the individual to fulfil his or her unique
requirements for music performance.
Music Education Research 461
Dow
nloa
ded
by [
Roy
al N
orth
ern
Col
lege
Mus
ic]
at 0
5:01
01
Dec
embe
r 20
11

Of all the sensory strategies described, learning not to listen seemed the most
paradoxical, given the context, but was also perhaps the most conservative. The
respondents who described this process were arguably those for whom accuracy when
interpreting auditory information was paramount: in this sample, those earning their
living as professional orchestral or solo musicians. However, this finding may well
not be generalisable. Influencing factors, such as whether deafness was pre- or post-
lingual (and therefore whether the musician had early memories of ‘full’ hearing
before their loss), the type of hearing aid technology used, the success of that
technology, the musical context and the instrument played, or their voice, may all be
related to the development of listening style. It cannot be assumed, therefore, that
listening styles predict musical outcomes. The listening style categories created in this
study were used to establish patterns within the data only and such reductionist
analysis of rich data inevitably results in a loss of depth. It is also important to note
that these categories refer to one-dimensional concept of listening; that is, auditory
listening. It would be more accurate to state that, for the purposes of making music,
Anne and Evelyn have found new ways to listen; the former relying on visual cues for
exact ensemble synchrony and vibrotactile cues for precise tuning, the latter relying
primarily on vibrotactile cues for timbre, colour and for communicative, musical
expression.
Analysis of listening styles was useful in shedding light on the various social,
interpersonal, musical, behavioural and cognitive processes involved in interactive
music making. While primary source literature alludes to these processes in terms of
visual and physical cues, they are, according to respondents, extremely difficult to
describe objectively (Glennie 2010; Whittaker 2008). Further observational studies
will therefore be conducted to explore the use of physical gesture and eye contact in
music, aiming to establish relationships between the use of sensory modalities in
group performance. The present study shows that individuals develop their own ways
of experiencing music; no one way is right or wrong, and no one way is best for
everyone. As preferences for the use of visual and vibrotactile cues also varied greatly,
it might not be too far-fetched to refer to different ‘seeing styles’ or ‘feeling styles’,
and this too will be explored further. While few generalisations can be drawn from
this small-scale qualitative study, all respondents demonstrated an intrinsic love of
music that, for the individual, makes the practice and performance of music a
pleasurable and worthwhile endeavour in spite of the challenges presented by a
hearing impairment.
Acknowledgements
The present study was financially supported by the AHRC. The authors would like to thankall respondents who enthusiastically gave up their time to take part.
Note
1. In this study, a hearing impairment is defined as including any level of hearing that is not‘full hearing’. It should be acknowledged that this definition does not extend to or implycultural identity: respondents in this study varied in their socio-cultural identities ashearing-impaired, deaf, or Deaf.
462 R. Fulford et al.
Dow
nloa
ded
by [
Roy
al N
orth
ern
Col
lege
Mus
ic]
at 0
5:01
01
Dec
embe
r 20
11
Notes on contributors
Robert Fulford is a PhD student in Music Psychology at the Royal Northern College ofMusic. He studied Music with Education and subsequently gained an MPhil in EducationalPsychology at Homerton College, Cambridge. His current research focuses on interactivemusic-making for musicians with a hearing impairment and is part of an AHRC-fundedproject in collaboration with the Acoustics Research Unit at the University of Liverpool.
Jane Ginborg is Associate Dean of Research, Director of the Centre for Music PerformanceResearch and Programme Leader for Research Degrees at the Royal Northern College ofMusic, where she holds a Personal Chair. Formerly a professional singer, with a BA (Hons.)degree in Music from the University of York and an Advanced Diploma in Singing from theGuildhall School of Music and Drama, she subsequently gained a BA (Hons.) degree inPsychology with the Open University and completed her PhD in Psychology at KeeleUniversity. She has published widely on expert musicians’ preparation for performance,collaborative music making and musicians’ health, and is Managing Editor of the on-line peer-reviewed journal Music Performance Research. In 2002 she was awarded the British VoiceAssociation’s Van Lawrence Award for her research on singers’ memorising strategies.
Juliet Goldbart is Professor of Developmental Disabilities at Manchester MetropolitanUniversity. She has a longstanding commitment to collaborative research particularly withspeech and language therapists, psysiotherapists and teachers and was awarded an HonoraryFellowship of the Royal College of Speech and Language Therapists in 1998. She haspublished widely on communication and intellectual disability, augmentative and alternativecommunication (AAC), working with families and service delivery models in the UK andIndia. Her report Communication and people with the most complex needs: What works andwhy this is essential was published by Mencap in December 2010.
References
Attride-Stirling, J. 2001. Thematic networks: An analytic tool for qualitative research.Qualitative Research 1: 385�405.
Backus, B., and A. Williamon. 2009. Evidence of noise-induced hearing loss among orchestralmusicians. Paper read at International Symposium on Performance Science, 15�18December 2009, in Aukland, New Zealand.
Barry, C. 2008. Beethoven. Oxford: Oxford University Press.Bartlma, E. 2008. Viva la Musica! In Hearing � Feeling � Playing, ed. S. Salmon, 21�28.
Germany: Zeitpunkt Musik.Braun, V., and V. Clarke. 2006. Using thematic analysis in psychology. Qualitative Research in
Psychology 3: 77�101.Chasin, M. 2006. Can your hearing aid handle loud music? A quick test will tell you. The
Hearing Journal 59, no. 12: 22�4.Chasin, M., and F. Russo. 2004. Music and hearing aids. Trends in Amplification 8: 35�47.Chen-Hafteck, L., and L. Schraer-Joiner. 2011. The engagement in musical activities of young
children with varied hearing abilities. Music Education Research 13, no. 1: 93�106.Chesky, K., M. Pair, E. Yoshimura, and S. Landford. 2009. An evaluation of musician
earplugs with college music students. International Journal of Audiology 48, no. 9: 661�70.Cleall, C. 1983. Notes on a young deaf musician. Psychology of Music 11, no. 2: 101�2.Cross, I. 2009. The nature of music and its evolution. In The oxford handbook of music
psychology, ed. S. Hallam, I. Cross, and M. Thaut, 3�13. New York: Oxford UniversityPress.
Dalgarno, G. 1990. Improving on what is possible with hearing aids for listening to music.British Journal of Music Education 7, no. 2: 99�121.
Darrow, A. 2006. The role of music in deaf culture: Deaf students’ perception of emotion inmusic. Journal of Music Therapy 43, no. 1: 2�15.
Drennan, W.R. 2010. Review of Hearing loss in musicians: Prevention and Management byMarshall Chasin. International Journal of Audiology 49, no. 11: 855.
Music Education Research 463
Dow
nloa
ded
by [
Roy
al N
orth
ern
Col
lege
Mus
ic]
at 0
5:01
01
Dec
embe
r 20
11
Fulford, R. 2011. Uses and experiences of hearing aid technology by musicians with a hearingimpairment. Paper read at Sound Thought, 3�5 February 2011, Glasgow.
Glennie, E. 1990. Good vibrations. London: Arrow.Glennie, E. 2010. Hearing essay. http://www.evelyn.co.uk/hearing_essay.aspxGlennie, E. 2003. Evelyn Glennie shows how to listen. TED Ideas worth spreading. http://www.
ted.com/talks/lang/eng/evelyn_glennie_shows_how_to_listen.htmlGreenhalgh, T., and R. Taylor. 1997. Papers that go beyond numbers (qualitative research).
British Medical Journal 315: 740�3.Jørgensen, H., and S. Hallam. 2009. Practising. In The oxford handbook of music psychology,
ed. S. Hallam, I. Cross, and M. Thaut, 265�73. Oxford: Oxford University Press.Karma, K. 1994. Auditory and visual temporal structuring: How important is sound to
musical thinking? Psychology of Music 22, no. 1: 20�30.Laitinen, H., and T. Poulsen. 2008. Questionnaire investigation of musicians’ use of hearing
protectors, self reported hearing disorders, and their experience of their workingenvironment. International Journal of Audiology 47, no. 4: 160�8.
Looi, V., H. McDermott, C. McKay, and L. Hickson. 2008. The effect of cochlearimplantation on music perception by adults with usable pre-operative acoustic hearing.International Journal of Audiology 47, no. 5: 257�68.
Montgomery, R. 2005. There’s no point in teaching deaf children music, is there? BMus diss.,Royal Welsh College of Music and Drama.
Montgomery, R. 2007. Deaf flute teacher to front consultation with deaf children. MusicTeacher Magazine October 13.
Moore, B.C.J. 2003. An introduction to the psychology of hearing. San Diego, CA: AcademicPress.
Moore, K.B., and J.W. Davidson. 2003. The social context of musical success: A develop-mental account. British Journal of Psychology 94: 529�49.
Ottlova, M. 2001. Smetana, Bedrich. In The New Grove Dictionary of Music and Musicians,2nd ed., Vol 23, ed. S. Sadie, 537�58. London: Macmillan.
Potier, M., C. Hoquet, R. Lloyd, C. Nicolas-Puel, A. Uziel, and J.-L. Puel. 2009. The risks ofamplified music for disc-jockeys working in nightclubs. Ear and Hearing 30, no. 2: 291�3.
Quinones, J. 2011. Developing tone based on feel. Flute Talk Magazine, September 2011, 31,no. 1: 24�8.
RNID. 2010. Producing information for people with hearing loss. http://www.actiononhearingloss.org.uk/supporting-you/factsheets-and-leaflets/deaf-awareness.aspx
Royster, J., L. Royster, and M. Killion. 1991. Sound exposures and hearing thresholds ofsymphony-orchestra musicians. Journal of the Acoustical Society of America 89, no. 6:2793�803.
Schmidt, J., J. Verschuure, and M. Brocaar. 1994. Hearing loss in students at a conservatory.International Journal of Audiology 33, no. 4: 185�94.
Whittaker, P. 1986. Music potential in the profoundly deaf. BA thesis. University of Oxford.Whittaker, P. 2008. MatD � Music and the deaf. In Hearing � Feeling � Playing, ed. S. Salmon,
29�40. Germany: zeitpunkt musik.Williams, H. 1989. The value of music to the deaf. British Journal of Music Education 6, no. 1:
81�98.Yennari, M. 2010. Beginnings of song in young deaf children using cochlear implants: The
song they move, the song they feel, the song they share. Music Education Research 12, no. 3:281�97.
464 R. Fulford et al.
Dow
nloa
ded
by [
Roy
al N
orth
ern
Col
lege
Mus
ic]
at 0
5:01
01
Dec
embe
r 20
11
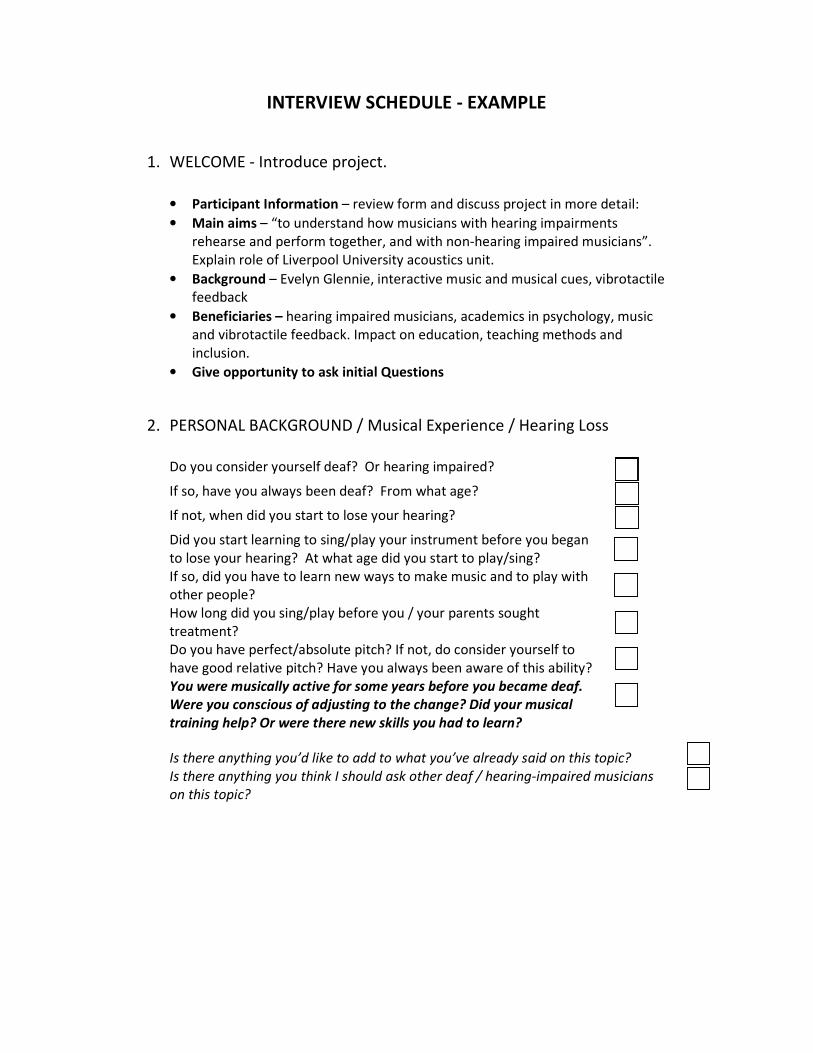
INTERVIEW SCHEDULE - EXAMPLE
1. WELCOME - Introduce project.
• Participant Information – review form and discuss project in more detail:
• Main aims – “to understand how musicians with hearing impairments
rehearse and perform together, and with non-hearing impaired musicians”.
Explain role of Liverpool University acoustics unit.
• Background – Evelyn Glennie, interactive music and musical cues, vibrotactile
feedback
• Beneficiaries – hearing impaired musicians, academics in psychology, music
and vibrotactile feedback. Impact on education, teaching methods and
inclusion.
• Give opportunity to ask initial Questions
2. PERSONAL BACKGROUND / Musical Experience / Hearing Loss
Do you consider yourself deaf? Or hearing impaired?
If so, have you always been deaf? From what age?
If not, when did you start to lose your hearing?
Did you start learning to sing/play your instrument before you began
to lose your hearing? At what age did you start to play/sing?
If so, did you have to learn new ways to make music and to play with
other people?
How long did you sing/play before you / your parents sought
treatment?
Do you have perfect/absolute pitch? If not, do consider yourself to
have good relative pitch? Have you always been aware of this ability?
You were musically active for some years before you became deaf.
Were you conscious of adjusting to the change? Did your musical
training help? Or were there new skills you had to learn?
Is there anything you’d like to add to what you’ve already said on this topic?
Is there anything you think I should ask other deaf / hearing-impaired musicians
on this topic?
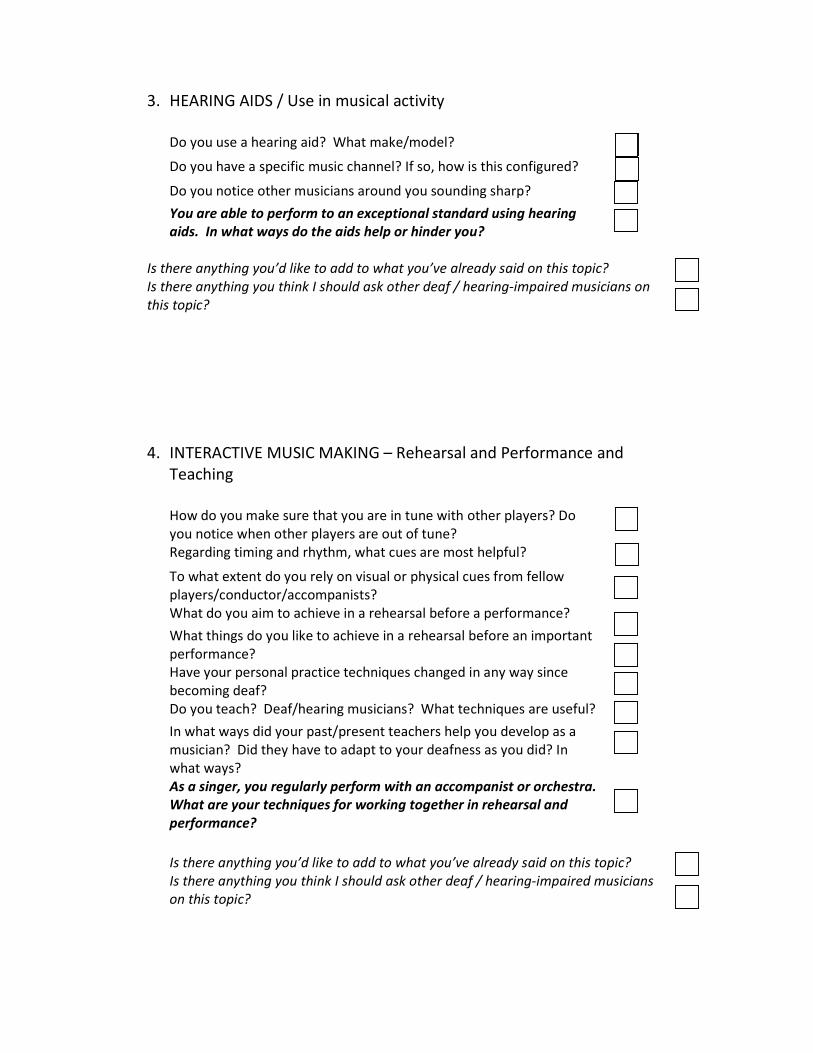
3. HEARING AIDS / Use in musical activity
Do you use a hearing aid? What make/model?
Do you have a specific music channel? If so, how is this configured?
Do you notice other musicians around you sounding sharp?
You are able to perform to an exceptional standard using hearing
aids. In what ways do the aids help or hinder you?
Is there anything you’d like to add to what you’ve already said on this topic?
Is there anything you think I should ask other deaf / hearing-impaired musicians on
this topic?
4. INTERACTIVE MUSIC MAKING – Rehearsal and Performance and
Teaching
How do you make sure that you are in tune with other players? Do
you notice when other players are out of tune?
Regarding timing and rhythm, what cues are most helpful?
To what extent do you rely on visual or physical cues from fellow
players/conductor/accompanists?
What do you aim to achieve in a rehearsal before a performance?
What things do you like to achieve in a rehearsal before an important
performance?
Have your personal practice techniques changed in any way since
becoming deaf?
Do you teach? Deaf/hearing musicians? What techniques are useful?
In what ways did your past/present teachers help you develop as a
musician? Did they have to adapt to your deafness as you did? In
what ways?
As a singer, you regularly perform with an accompanist or orchestra.
What are your techniques for working together in rehearsal and
performance?
Is there anything you’d like to add to what you’ve already said on this topic?
Is there anything you think I should ask other deaf / hearing-impaired musicians
on this topic?

5. VIBROTACTILE FEEDBACK
To what extent are you aware of the vibrations that music creates?
Are you sensitive to it in your music making?
Do you use vibro-tactile feedback to help your music making? In what
ways does it help?
[If participant has AP ONLY] Do you associate particular feelings with
particular sounds? (Passive vibro-tactile pitch). Are you able to discern
a pitch by feeling a vibration only? (Active vibro-tactile pitch)
Singers can often use feedback from internal resonance chambers in
the body to enhance their musicality and performance. To what
extent is this true for you?
In your experience, do you find different frequencies of sound/pitches
can be felt in different parts of the body? If so which sounds and
where? How does this help your music performance?
Is there anything you’d like to add to what you’ve already said on this topic?
Is there anything you think I should ask other deaf / hearing-impaired musicians
on this topic?
6. SUBJECTIVE EXPERIENCE
When Evelyn Glennie talks about how she experiences music, she says that listening
without feeling is like eating without tasting. Glennie closely associates physically
feeling the music with emotionally feeling the music. As such, it is logical that for
her, the true ‘experience’ of music is in the feeling, both physical and emotional, as
she perceives them as one and the same.
When you listen to or perform music, do you think there’s any
difference between physical feelings, vibrations and resonations, and
the emotional feelings that music creates?
In your experience, where does the music really lie?
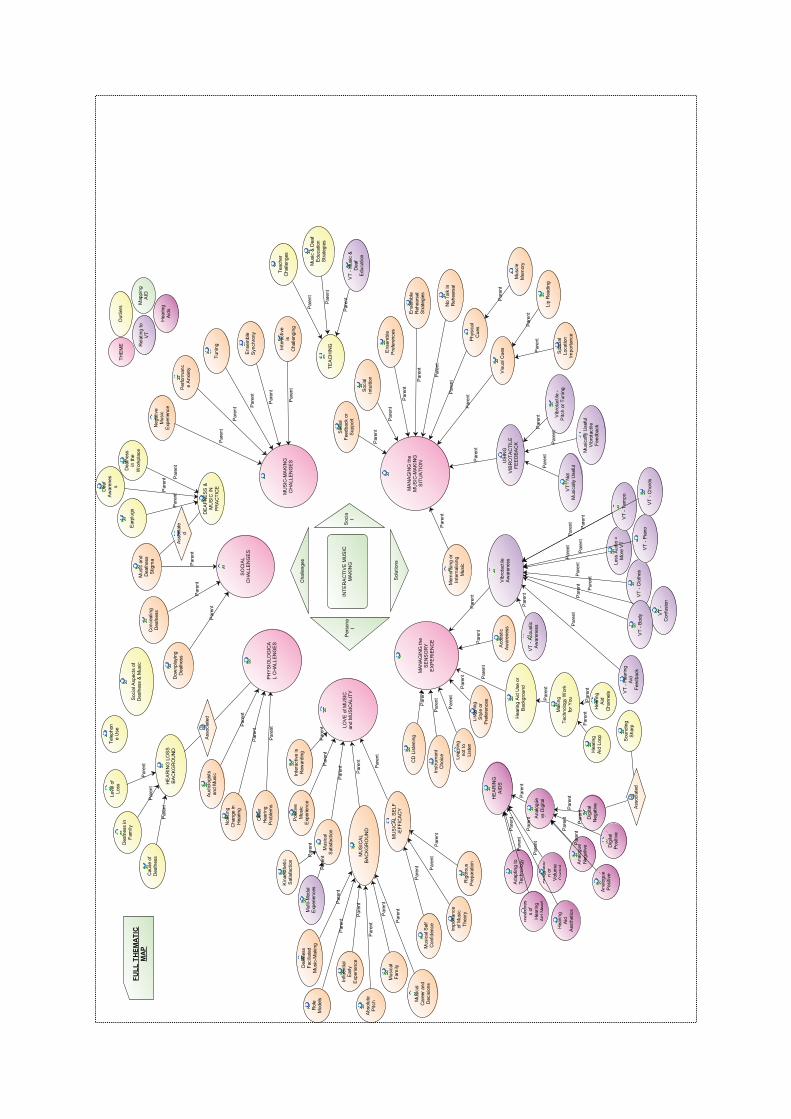
������������
�� ������
�����������
����������
����������
��
�����������
��������
�����
����������
����������
������
��������
�������
����!�
�������
���������
��������
����������
��!���������
�������������
�����
��������"#�����
������������
$������%
&������
���
����������
'���!���
���������
����������
���������
������
(������
�������
$�!��"
�&'�'
������
�������
������
$������%��
��))���
��������
���)�������
������
���������
� ������
���
&������
���(���
&'���(*
�� �
��)�������
'���!���
�����������
�������
������������
������������
��
(�������
��������
&������
������
��!��"
�������
$���������
��������%���
����������
�������
���
� ������
�
����������
�������
�������
��������
(������
����������
��
�������������
�������������
��������
����)
�!)�������
�������
�����"
����)���
�#��
���)������
���������"
����
������
���������
$�!��"
(����%��
���������
� �)��"���
�������
�����!)�
�������
�
������������
��������
�)�����
��������
�!)�������
���(��
��������"#�����
��"�����
����
������������
� �������
#��(*
��+�,������'
$'' +��-
����������
���
���������
������
����
&������
����
(������
�����
'.)�������
��������)������
�������/�����
'��)����
����������
���
����!�
�������
�����������
'���"
'.)�������
��������
� ������
�������
�����
'.)�������
������!���
���.���"
&'���(*�,��
+��-*�,#(
����������
��������
�������
,����
&������
������!�
���&������
���
$������%
��������
��))���
��
�������
�����
0��%)����
,�������
�#������'�$
�'$$����1
���������
�#�����
+��-*�,#(
������
'���!���
�"������"
������
������
������
������
������
������
������
������
������
������
������
������
������
������
������
������
������
������
������
������
������
������
������
������
������
������
������
������
������
������
������
������
������
������
������
������
������
������
������
������
������
������
������
������
������
������
������
������
������
������
������
������
������
������
������
������
������
������
������
������
������
������
������
������
������
������
������
������
������
������
������
������
������
������
������
������
������
������
������
�����������
'.)��������
-�����������
������������
��������
� �������
�����������
� �������
&���������#����
+��%������
��%���
���������"0��%
���1��
&������
���
��������
&������
������)
� ���������
������!���
������
��������
�����
������
���������
��"����
�����������
���+��"
�'��&�(*
�������
����������
�����/ ���
'��������
����������
��������/
���
'��������
�,�'���#���
����#�������1
�&1��,�,*���
��&���'(*'�
�#������-�(*
�&���'(*'�
�,����
�&���'(*'�
'�$('��/
�#����(
�������'
���������
�
��(�*�(*���
�'(�,�1
'2�'��'(�'
�(�'������'�#���
��-�(*
������
��(�*�(*���
�#������-�(*
���#���,(

Violin 1
Violin 2
sfz
ff p mf p
q. = c.86
sfz p f sfz mp mf
Vln. 1
Vln. 2
f p f p pp f pp f
5
sfz mp sfz mp p f pp
Vln. 1
Vln. 2
p mf f sf sf p
9
f f sf sf p
Vln. 1
Vln. 2
ff ppp p f ff p
13
ff mp f p f p mp
measured
sketchfor 2 violins
emma-ruth richards
measured pizz.
arco
pizz. arco
pizz.
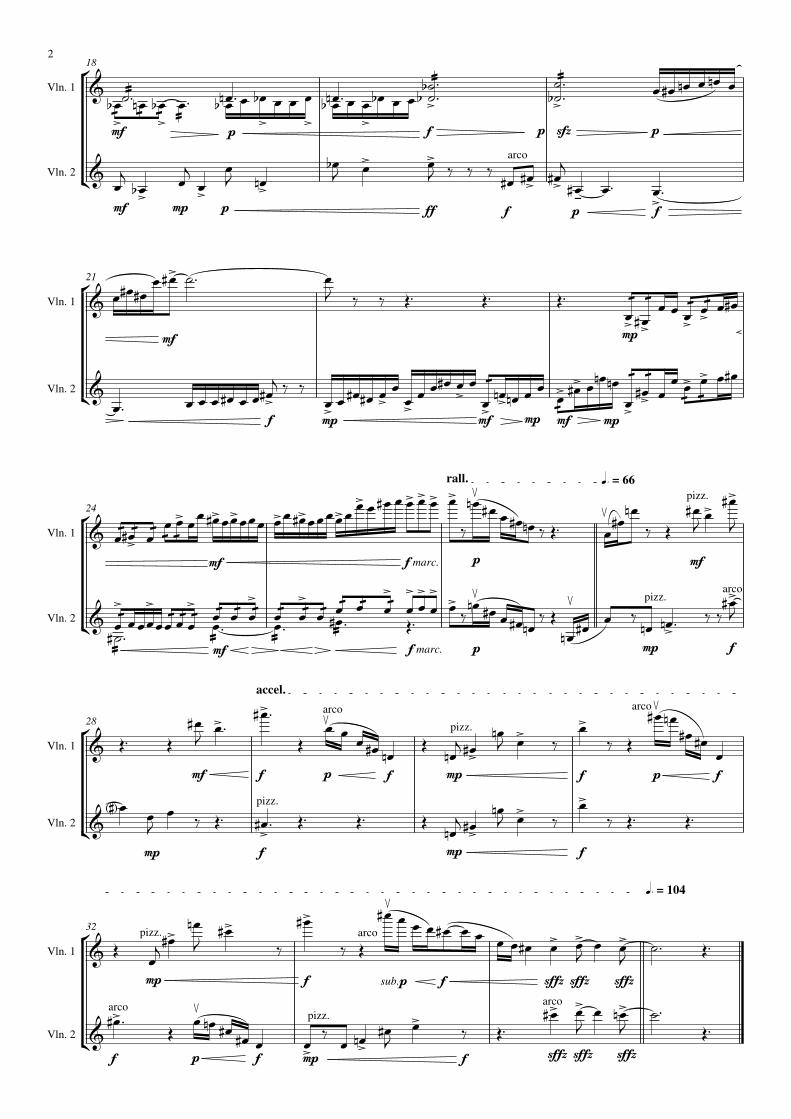
Vln. 1
Vln. 2
mf p f p sfz p
18
mf mp p ff f p f
Vln. 1
Vln. 2
mf mp
21
f mp mf mp mf mp
Vln. 1
Vln. 2
mf f marc. p mf
q. = 66rall.
24
mf f marc. p mp f
Vln. 1
Vln. 2
mf f p f mp f p f
accel.
28
mp f mp f
Vln. 1
Vln. 2
mp f sub.p f sffz sffz sffz
q. = 104
32
f p f mp f sffz sffz sffz
arco
pizz.
pizz.
arco
arco
pizz.
arco
pizz.
pizz.
arco
arco
pizz.
arco
2

Table I Spearmans rho correlations between the frequency and duration of behaviours by player
Eyes Eyebrows Torso Scroll
Rebecca .62 .84** .92** .96**
Jess .92** - .13 .97**
Rosemary .92** .59* .85** .95**
Sarah .39 .77** .90** .95**
ALL PLAYERS .62** .85** .87** .90**
* = p < .05; ** = p < .01
Table II Grand means and standard deviations (in brackets) of frequencies and durations (in
seconds) of behaviours by player
Rebecca Jess Rosemary Sarah
M (SD) M (SD) M (SD) M (SD)
Eyes frequency 8.25 (1.83) 9.88 (4.67) 6.50 (5.04) 9.38 (2.62)
Eyes duration (s) 6.21 (2.44) 4.68 (1.81) 2.67 (1.91) 9.94 (3.06)
Eyebrows frequency 0.00 (0.00) 0.00 (0.00) 4.25 (1.29) 4.25 (1.61)
Eyebrows duration (s) 0.00 (0.00) 0.00 (0.00) 4.42 (1.48) 4.91 (2.31)
Torso frequency 2.36 (1.21) 1.08 (0.29) 2.25 (2.09) 7.00 (2.16)
Torso duration (s) 5.99 (3.17) 1.91 (0.72) 2.49 (1.84) 8.51 (3.13)
Scroll frequency 6.44 (1.82) 2.57 (1.34) 3.63 (1.82) 3.44 (1.59)
Scroll duration (s) 9.67 (2.59) 4.77 (3.06) 3.74 (2.36) 3.63 (1.69)
Legs frequency 1.67 (1.15) 0.00 (0.00) 1.50 (0.84) 2.50 (1.74)
Legs duration (s) 3.95 (3.41) 0.00 (0.00) 1.25 (1.24) 3.13 (1.99)
Head frequency 2.00 (1.41) 1.00 (0.00) 5.50 (2.56) 6.06 (2.89)
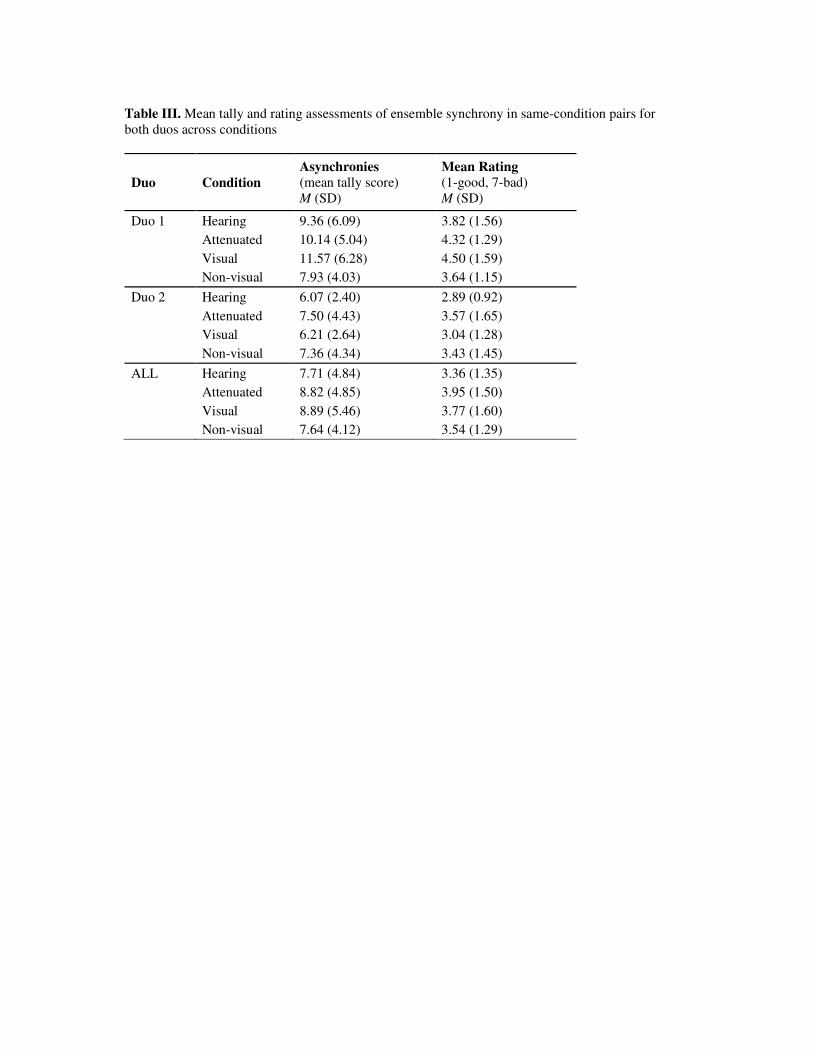
Table III. Mean tally and rating assessments of ensemble synchrony in same-condition pairs for
both duos across conditions
Duo Condition
Asynchronies
(mean tally score)
M (SD)
Mean Rating
(1-good, 7-bad)
M (SD)
Duo 1 Hearing 9.36 (6.09) 3.82 (1.56)
Attenuated 10.14 (5.04) 4.32 (1.29)
Visual 11.57 (6.28) 4.50 (1.59)
Non-visual 7.93 (4.03) 3.64 (1.15)
Duo 2 Hearing 6.07 (2.40) 2.89 (0.92)
Attenuated 7.50 (4.43) 3.57 (1.65)
Visual 6.21 (2.64) 3.04 (1.28)
Non-visual 7.36 (4.34) 3.43 (1.45)
ALL Hearing 7.71 (4.84) 3.36 (1.35)
Attenuated 8.82 (4.85) 3.95 (1.50)
Visual 8.89 (5.46) 3.77 (1.60)
Non-visual 7.64 (4.12) 3.54 (1.29)
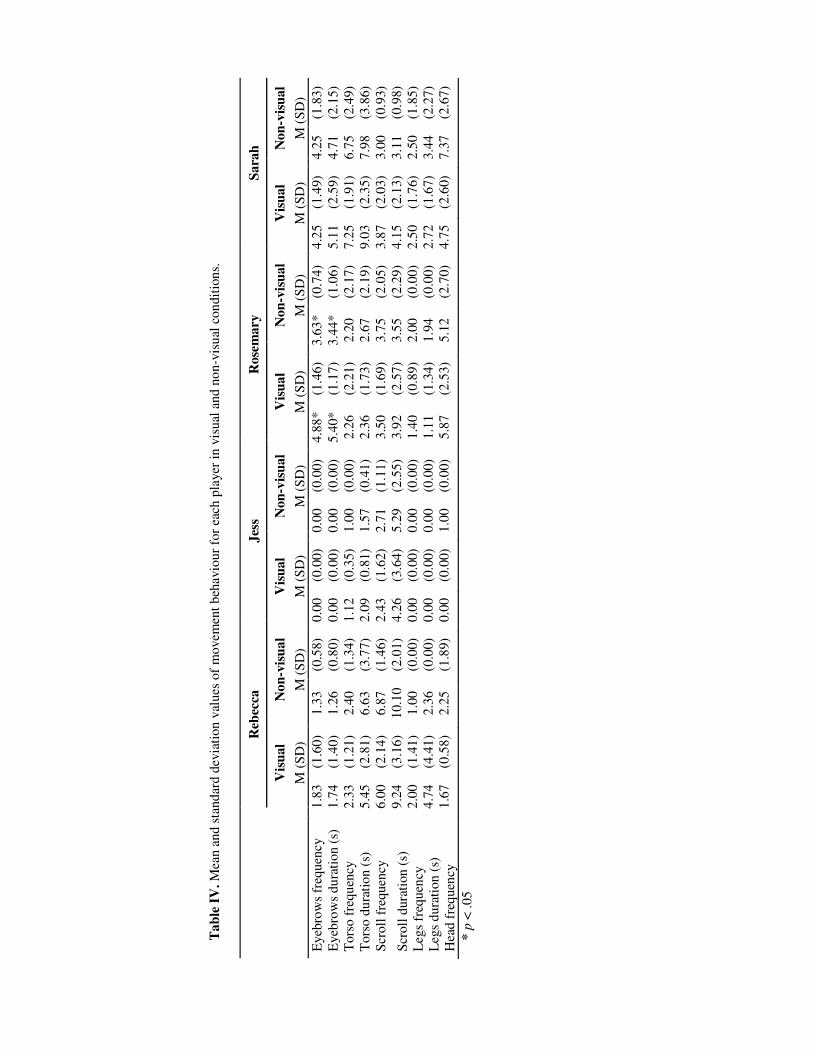
Ta
ble
IV
. M
ean a
nd
sta
nd
ard d
evia
tion
val
ues
of
movem
ent
beh
avio
ur
for
each
pla
yer
in v
isual
and
no
n-v
isu
al c
on
dit
ion
s.
R
ebec
ca
Jes
s R
ose
mary
S
ara
h
V
isu
al
No
n-v
isu
al
Vis
ual
Non
-vis
ual
Vis
ua
l N
on
-vis
ual
Vis
ual
Non
-vis
ual
M
(S
D)
M (
SD
) M
(S
D)
M (
SD
) M
(S
D)
M (
SD
) M
(S
D)
M (
SD
)
Eyeb
row
s fr
equen
cy
1.8
3
(1.6
0)
1.3
3
(0.5
8)
0.0
0
(0.0
0)
0.0
0
(0.0
0)
4.8
8*
(1.4
6)
3.6
3*
(0.7
4)
4.2
5
(1.4
9)
4.2
5
(1.8
3)
Eyeb
row
s du
rati
on
(s)
1
.74
(1.4
0)
1.2
6
(0.8
0)
0.0
0
(0.0
0)
0.0
0
(0.0
0)
5.4
0*
(1.1
7)
3.4
4*
(1.0
6)
5.1
1
(2.5
9)
4.7
1
(2.1
5)
Tors
o f
requ
ency
2
.33
(1.2
1)
2.4
0
(1.3
4)
1.1
2
(0.3
5)
1.0
0
(0.0
0)
2.2
6
(2.2
1)
2.2
0
(2.1
7)
7.2
5
(1.9
1)
6.7
5
(2.4
9)
Tors
o d
ura
tio
n (
s)
5.4
5
(2.8
1)
6.6
3
(3.7
7)
2.0
9
(0.8
1)
1.5
7
(0.4
1)
2.3
6
(1.7
3)
2.6
7
(2.1
9)
9.0
3
(2.3
5)
7.9
8
(3.8
6)
Scr
oll
fre
quen
cy
6.0
0
(2.1
4)
6.8
7
(1.4
6)
2.4
3
(1.6
2)
2.7
1
(1.1
1)
3.5
0
(1.6
9)
3.7
5
(2.0
5)
3.8
7
(2.0
3)
3.0
0
(0.9
3)
Scr
oll
dura
tion
(s)
Leg
s fr
equen
cy
Leg
s d
ura
tion (
s)
Hea
d f
req
uen
cy
9.2
4
2.0
0
4.7
4
1.6
7
(3.1
6)
(1.4
1)
(4.4
1)
(0.5
8)
10.1
0
1.0
0
2.3
6
2.2
5
(2.0
1)
(0.0
0)
(0.0
0)
(1.8
9)
4.2
6
0.0
0
0.0
0
0.0
0
(3.6
4)
(0.0
0)
(0.0
0)
(0.0
0)
5.2
9
0.0
0
0.0
0
1.0
0
(2.5
5)
(0.0
0)
(0.0
0)
(0.0
0)
3.9
2
1.4
0
1.1
1
5.8
7
(2.5
7)
(0.8
9)
(1.3
4)
(2.5
3)
3.5
5
2.0
0
1.9
4
5.1
2
(2.2
9)
(0.0
0)
(0.0
0)
(2.7
0)
4.1
5
2.5
0
2.7
2
4.7
5
(2.1
3)
(1.7
6)
(1.6
7)
(2.6
0)
3.1
1
2.5
0
3.4
4
7.3
7
(0.9
8)
(1.8
5)
(2.2
7)
(2.6
7)
* p
< .05
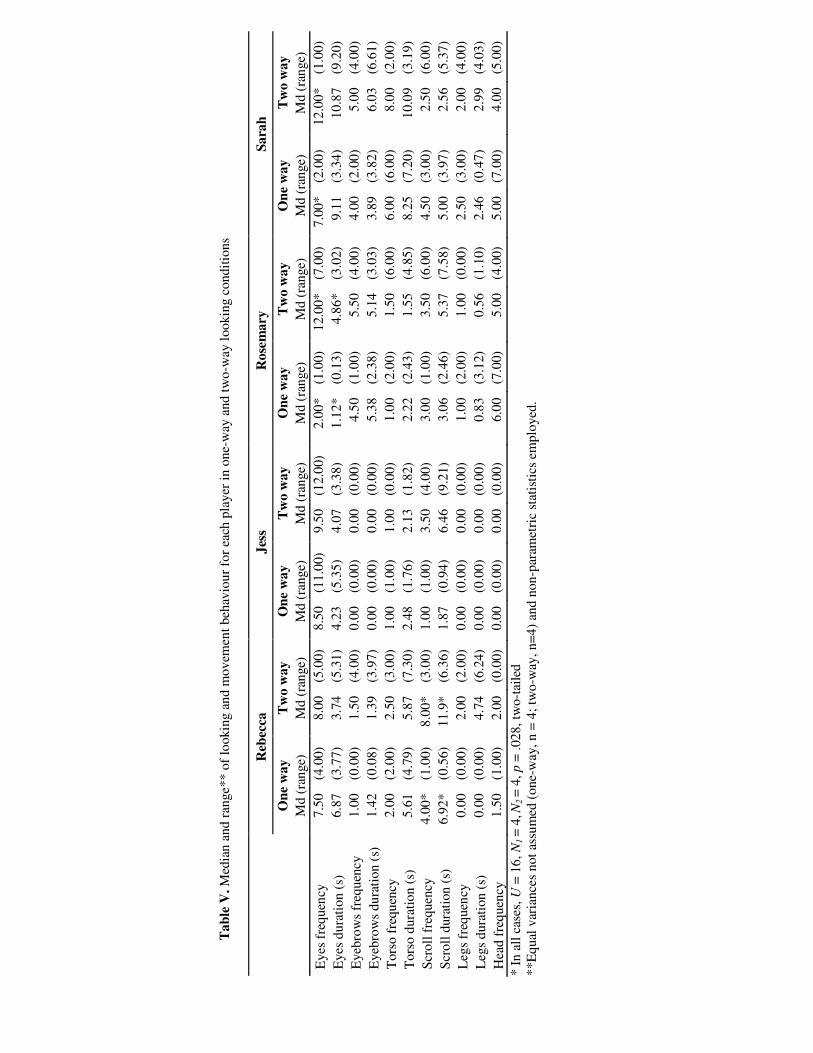
Ta
ble
V. M
edia
n a
nd r
ange*
* o
f lo
okin
g a
nd m
ov
emen
t beh
avio
ur
for
each
pla
yer
in
one-
way
and t
wo
-way
lookin
g c
ondit
ions
Reb
ecca
J
ess
Rose
mary
S
ara
h
On
e w
ay
T
wo w
ay
On
e w
ay
Tw
o w
ay
On
e w
ay
T
wo
wa
y
On
e w
ay
Tw
o w
ay
Md (
ran
ge)
M
d (
ran
ge)
M
d (
range)
M
d (
range)
M
d (
ran
ge)
M
d (
range)
M
d (
ran
ge)
M
d (
ran
ge)
Eyes
fre
quen
cy
7.5
0
(4.0
0)
8.0
0
(5.0
0)
8.5
0
(11
.00)
9.5
0
(12.0
0)
2.0
0*
(1.0
0)
12.0
0*
(7.0
0)
7.0
0*
(2.0
0)
12
.00
*
(1.0
0)
Eyes
dura
tion (
s)
6.8
7
(3.7
7)
3.7
4
(5.3
1)
4.2
3
(5.3
5)
4.0
7
(3.3
8)
1.1
2*
(0.1
3)
4.8
6*
(3.0
2)
9.1
1
(3.3
4)
10.8
7
(9.2
0)
Eyeb
row
s fr
equ
ency
1.0
0
(0.0
0)
1.5
0
(4.0
0)
0.0
0
(0.0
0)
0.0
0
(0.0
0)
4.5
0
(1.0
0)
5.5
0
(4.0
0)
4.0
0
(2.0
0)
5.0
0
(4.0
0)
Eyeb
row
s du
rati
on
(s)
1.4
2
(0.0
8)
1.3
9
(3.9
7)
0.0
0
(0.0
0)
0.0
0
(0.0
0)
5.3
8
(2.3
8)
5.1
4
(3.0
3)
3.8
9
(3.8
2)
6.0
3
(6.6
1)
Tors
o f
requ
ency
2.0
0
(2.0
0)
2.5
0
(3.0
0)
1.0
0
(1.0
0)
1.0
0
(0.0
0)
1.0
0
(2.0
0)
1.5
0
(6.0
0)
6.0
0
(6.0
0)
8.0
0
(2.0
0)
Tors
o d
ura
tio
n (
s)
5.6
1
(4.7
9)
5.8
7
(7.3
0)
2.4
8
(1.7
6)
2.1
3
(1.8
2)
2.2
2
(2.4
3)
1.5
5
(4.8
5)
8.2
5
(7.2
0)
10.0
9
(3.1
9)
Scr
oll
fre
quen
cy
4.0
0*
(1.0
0)
8.0
0*
(3.0
0)
1.0
0
(1.0
0)
3.5
0
(4.0
0)
3.0
0
(1.0
0)
3.5
0
(6.0
0)
4.5
0
(3.0
0)
2.5
0
(6.0
0)
Scr
oll
dura
tion
(s)
6.9
2*
(0.5
6)
11.9
*
(6.3
6)
1.8
7
(0.9
4)
6.4
6
(9.2
1)
3.0
6
(2.4
6)
5.3
7
(7.5
8)
5.0
0
(3.9
7)
2.5
6
(5.3
7)
Leg
s fr
equen
cy
0.0
0
(0.0
0)
2.0
0
(2.0
0)
0.0
0
(0.0
0)
0.0
0
(0.0
0)
1.0
0
(2.0
0)
1.0
0
(0.0
0)
2.5
0
(3.0
0)
2.0
0
(4.0
0)
Leg
s d
ura
tion (
s)
0.0
0
(0.0
0)
4.7
4
(6.2
4)
0.0
0
(0.0
0)
0.0
0
(0.0
0)
0.8
3
(3.1
2)
0.5
6
(1.1
0)
2.4
6
(0.4
7)
2.9
9
(4.0
3)
Hea
d f
req
uen
cy
1.5
0
(1.0
0)
2.0
0
(0.0
0)
0.0
0
(0.0
0)
0.0
0
(0.0
0)
6.0
0
(7.0
0)
5.0
0
(4.0
0)
5.0
0
(7.0
0)
4.0
0
(5.0
0)
* I
n a
ll c
ases
, U
= 1
6, N
1 =
4, N
2 =
4, p =
.028,
two-t
aile
d
**E
qual
var
iance
s n
ot
assu
med
(one-
way
, n =
4;
two
-way
, n=
4)
and n
on-p
aram
etri
c st
atis
tics
em
plo
yed
.
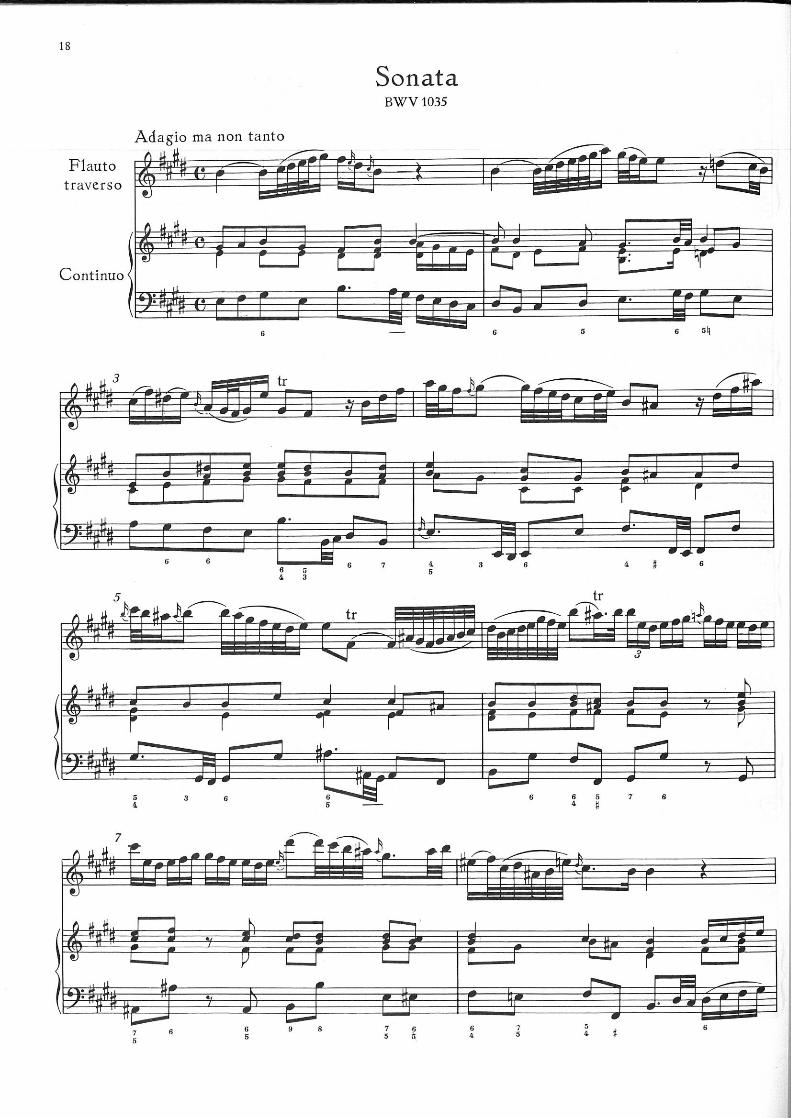
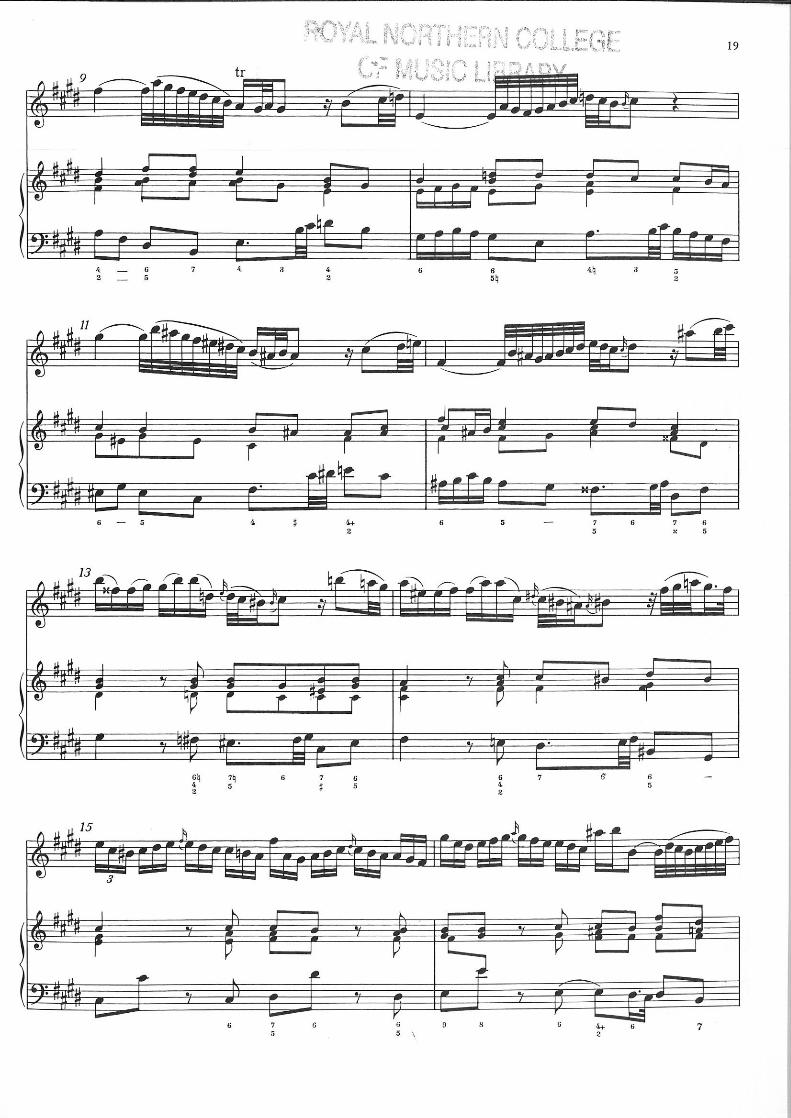

Flute
Piano
f
Light, angular
q=63
f
Fl.
Pno.
5
© Jacob Thompson-Bell 2011
Fl.
Pno.
7
3
Petite Sonate
3
Fl.
Pno.
9
Fl.
Pno.
mf mp
11
mp
Fl.
Pno.
mf cantabile
q=42
Calm, with full voice
13
mf
3 5
ben marc.
3 5 3 3
5
3
2
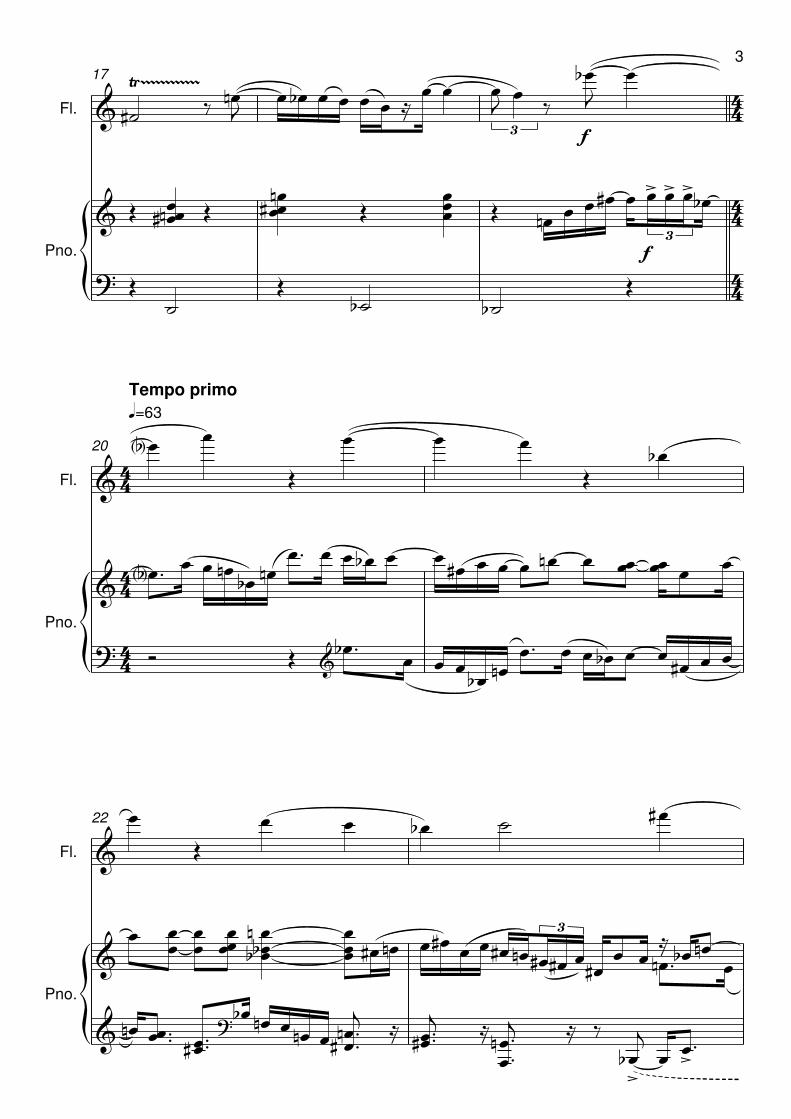
Fl.
Pno.
f
17
f
Fl.
Pno.
Tempo primo
q=63
20
Fl.
Pno.
22
3
3
3
3
Fl.
Pno.
24
Fl.
Pno.
mf mp
26
mp
Fl.
Pno.
p
28
p
3 5
3 5 3 3
5
5
5
3
4

Dear XXX, I hope you are well? I can finally confirm the extracts and plan for the Observation-Study Performance day. Extracts 1) Petite Sonate by Jacob Thompson-Bell. (Jacob is a PhD student composer here at the RNCM). 2) Adagio ma non tanto, J. S. Bach from flute Sonata No. 6 in E. I will send hard copies of these extracts today and they should be with you by the end of the week at the latest. In addition, if you are curious, I have attached pdf copies of the Petite Sonate in advance. Observations During the half hour sessions, you will have 24 minutes of free rehearsal on both extracts. I will be in the room with you during the sessions and I will let you know when you are half way through to swap to the next extract. There will then be a final ‘run’ of both extracts at the end, as if they are being performed. As I’ve said before, the standard achieved is not relevant to this study. I’m interested in exploring the collaborative rehearsal and performance process more generally. You can practise as much or as little as you like but it may be useful to have the pieces ‘under the fingers’ so that you feel comfortable on the day. Many, many thanks again for taking part. It’s going to be a very fun morning! Please do get back to me if you have any questions. In the meantime, all the best, Robbie Robert Fulford PhD Student - Interactive Performance for Musicians with a Hearing Impairment Centre for Music Performance Research Royal Northern College of Music Tel: +44 161 907 5320 Mob: +44 7870 200039 Email: [email protected]
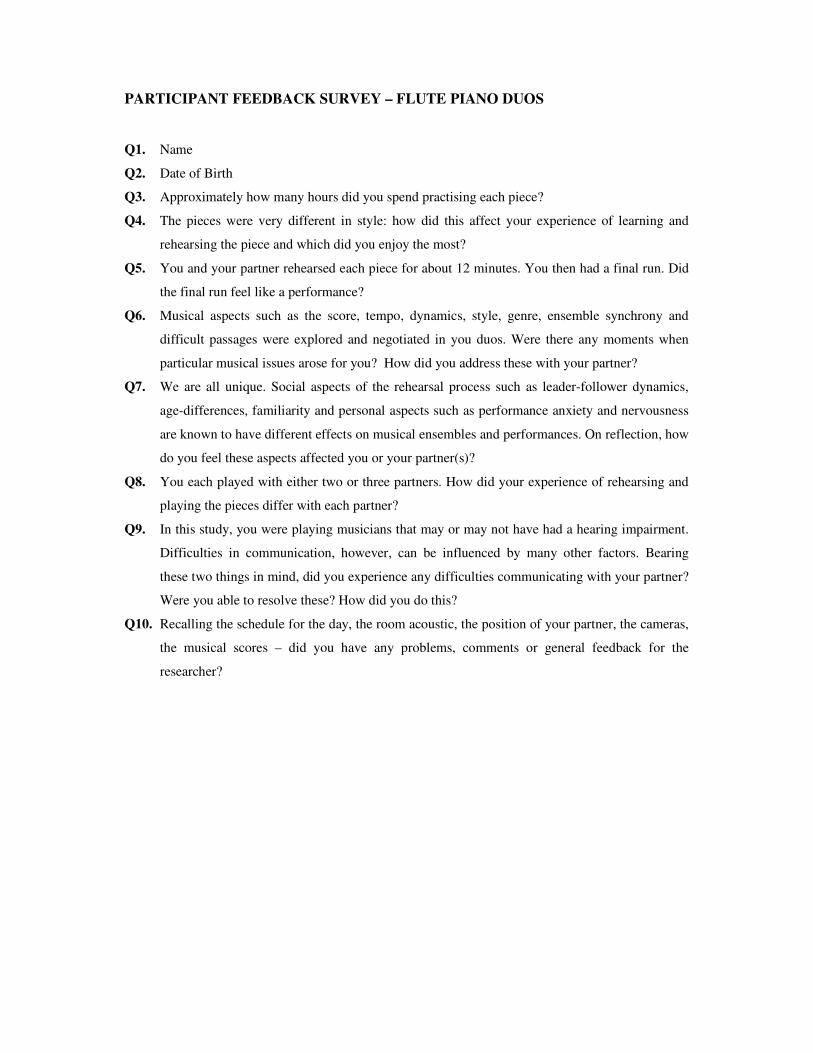
PARTICIPANT FEEDBACK SURVEY – FLUTE PIANO DUOS
Q1. Name
Q2. Date of Birth
Q3. Approximately how many hours did you spend practising each piece?
Q4. The pieces were very different in style: how did this affect your experience of learning and
rehearsing the piece and which did you enjoy the most?
Q5. You and your partner rehearsed each piece for about 12 minutes. You then had a final run. Did
the final run feel like a performance?
Q6. Musical aspects such as the score, tempo, dynamics, style, genre, ensemble synchrony and
difficult passages were explored and negotiated in you duos. Were there any moments when
particular musical issues arose for you? How did you address these with your partner?
Q7. We are all unique. Social aspects of the rehearsal process such as leader-follower dynamics,
age-differences, familiarity and personal aspects such as performance anxiety and nervousness
are known to have different effects on musical ensembles and performances. On reflection, how
do you feel these aspects affected you or your partner(s)?
Q8. You each played with either two or three partners. How did your experience of rehearsing and
playing the pieces differ with each partner?
Q9. In this study, you were playing musicians that may or may not have had a hearing impairment.
Difficulties in communication, however, can be influenced by many other factors. Bearing
these two things in mind, did you experience any difficulties communicating with your partner?
Were you able to resolve these? How did you do this?
Q10. Recalling the schedule for the day, the room acoustic, the position of your partner, the cameras,
the musical scores – did you have any problems, comments or general feedback for the
researcher?
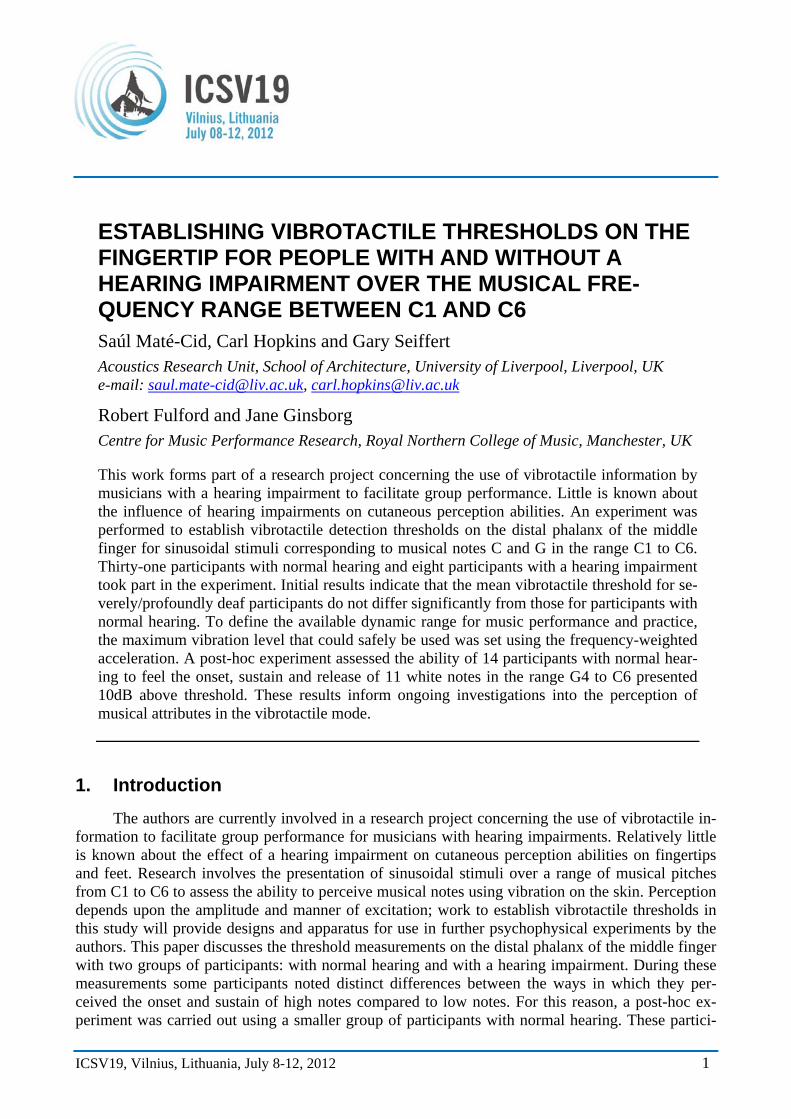
ICSV19, Vilnius, Lithuania, July 8-12, 2012 1
ESTABLISHING VIBROTACTILE THRESHOLDS ON THE FINGERTIP FOR PEOPLE WITH AND WITHOUT A HEARING IMPAIRMENT OVER THE MUSICAL FRE-QUENCY RANGE BETWEEN C1 AND C6 Saúl Maté-Cid, Carl Hopkins and Gary Seiffert Acoustics Research Unit, School of Architecture, University of Liverpool, Liverpool, UK e-mail: [email protected], [email protected]
Robert Fulford and Jane Ginsborg Centre for Music Performance Research, Royal Northern College of Music, Manchester, UK
This work forms part of a research project concerning the use of vibrotactile information by musicians with a hearing impairment to facilitate group performance. Little is known about the influence of hearing impairments on cutaneous perception abilities. An experiment was performed to establish vibrotactile detection thresholds on the distal phalanx of the middle finger for sinusoidal stimuli corresponding to musical notes C and G in the range C1 to C6. Thirty-one participants with normal hearing and eight participants with a hearing impairment took part in the experiment. Initial results indicate that the mean vibrotactile threshold for se-verely/profoundly deaf participants do not differ significantly from those for participants with normal hearing. To define the available dynamic range for music performance and practice, the maximum vibration level that could safely be used was set using the frequency-weighted acceleration. A post-hoc experiment assessed the ability of 14 participants with normal hear-ing to feel the onset, sustain and release of 11 white notes in the range G4 to C6 presented 10dB above threshold. These results inform ongoing investigations into the perception of musical attributes in the vibrotactile mode.
1. Introduction The authors are currently involved in a research project concerning the use of vibrotactile in-
formation to facilitate group performance for musicians with hearing impairments. Relatively little is known about the effect of a hearing impairment on cutaneous perception abilities on fingertips and feet. Research involves the presentation of sinusoidal stimuli over a range of musical pitches from C1 to C6 to assess the ability to perceive musical notes using vibration on the skin. Perception depends upon the amplitude and manner of excitation; work to establish vibrotactile thresholds in this study will provide designs and apparatus for use in further psychophysical experiments by the authors. This paper discusses the threshold measurements on the distal phalanx of the middle finger with two groups of participants: with normal hearing and with a hearing impairment. During these measurements some participants noted distinct differences between the ways in which they per-ceived the onset and sustain of high notes compared to low notes. For this reason, a post-hoc ex-periment was carried out using a smaller group of participants with normal hearing. These partici-
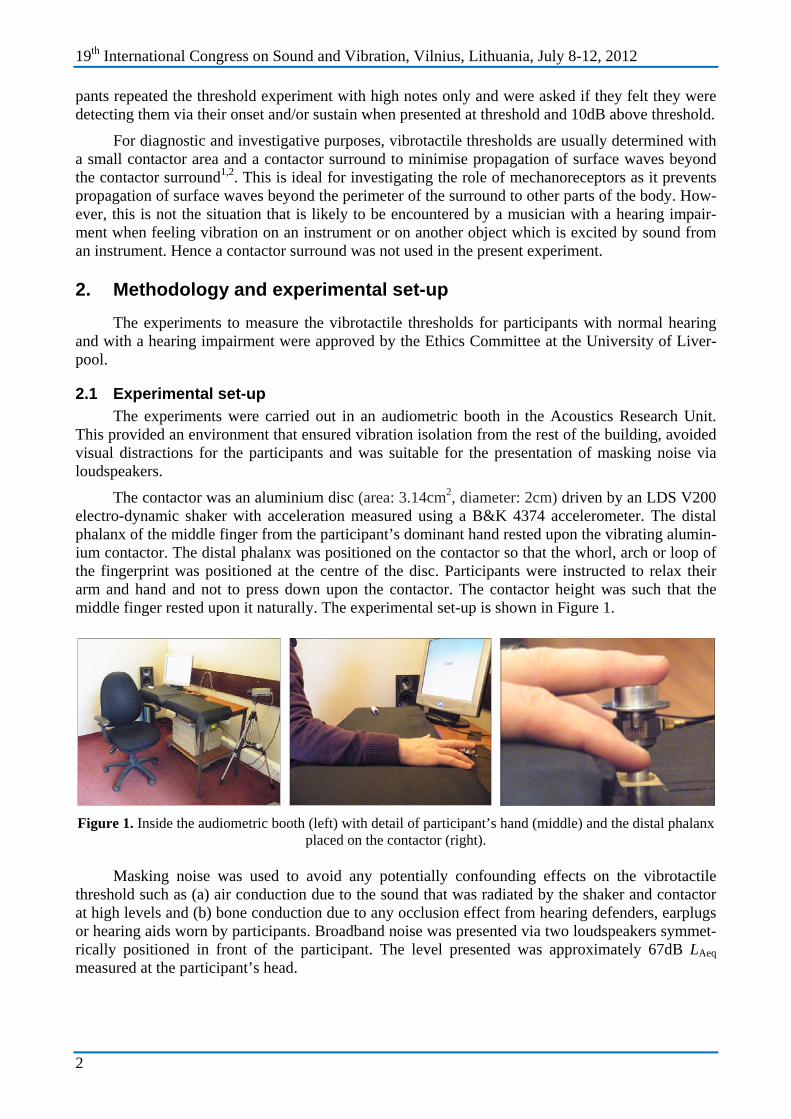
19th International Congress on Sound and Vibration, Vilnius, Lithuania, July 8-12, 2012
2
pants repeated the threshold experiment with high notes only and were asked if they felt they were detecting them via their onset and/or sustain when presented at threshold and 10dB above threshold.
For diagnostic and investigative purposes, vibrotactile thresholds are usually determined with a small contactor area and a contactor surround to minimise propagation of surface waves beyond the contactor surround1,2. This is ideal for investigating the role of mechanoreceptors as it prevents propagation of surface waves beyond the perimeter of the surround to other parts of the body. How-ever, this is not the situation that is likely to be encountered by a musician with a hearing impair-ment when feeling vibration on an instrument or on another object which is excited by sound from an instrument. Hence a contactor surround was not used in the present experiment.
2. Methodology and experimental set-up The experiments to measure the vibrotactile thresholds for participants with normal hearing
and with a hearing impairment were approved by the Ethics Committee at the University of Liver-pool.
2.1 Experimental set-up The experiments were carried out in an audiometric booth in the Acoustics Research Unit.
This provided an environment that ensured vibration isolation from the rest of the building, avoided visual distractions for the participants and was suitable for the presentation of masking noise via loudspeakers.
The contactor was an aluminium disc (area: 3.14cm2, diameter: 2cm) driven by an LDS V200 electro-dynamic shaker with acceleration measured using a B&K 4374 accelerometer. The distal phalanx of the middle finger from the participant’s dominant hand rested upon the vibrating alumin-ium contactor. The distal phalanx was positioned on the contactor so that the whorl, arch or loop of the fingerprint was positioned at the centre of the disc. Participants were instructed to relax their arm and hand and not to press down upon the contactor. The contactor height was such that the middle finger rested upon it naturally. The experimental set-up is shown in Figure 1.
Figure 1. Inside the audiometric booth (left) with detail of participant’s hand (middle) and the distal phalanx placed on the contactor (right).
Masking noise was used to avoid any potentially confounding effects on the vibrotactile
threshold such as (a) air conduction due to the sound that was radiated by the shaker and contactor at high levels and (b) bone conduction due to any occlusion effect from hearing defenders, earplugs or hearing aids worn by participants. Broadband noise was presented via two loudspeakers symmet-rically positioned in front of the participant. The level presented was approximately 67dB LAeq measured at the participant’s head.
19th International Congress on Sound and Vibration, Vilnius, Lithuania, July 8-12, 2012
3
2.2 Procedure The procedure to determine vibrotactile thresholds was adapted from audiometric procedures
to determine thresholds for air conduction and was based on the shortened version of the ascending method in ISO 8253-13. This procedure was programmed in Matlab to complete a ‘tactovibrometer’ as a tool that would automate the presentation of stimuli to the participant and simplify the process of data collection.
The audiometric procedure uses discrete steps in level of 5dB HL. However, this was consid-ered to be insufficient resolution for vibrotactile thresholds; hence a step of 2dBV was used.
The temperature of the skin on the distal phalanx was monitored at approximately 20 minute intervals using an infra-red thermometer. Based on the findings of Verrillo and Bolanowski4 the acceptable ranges for valid measurements were chosen to be between 20 to 36ºC for notes C1 to G2 and between 24 to 36ºC for notes C3 to C6.
The signal was a continuous pure tone of 1s duration. In practice this varied between 0.994s and 1.009s depending on the frequency of the tone to ensure that there were no abrupt truncations at the end of the sinusoidal tone. The stimulus consisted of this 1s tone presented three times in a row, with each tone separated by a two second interval without any signal. Participants were instructed to press a response button whenever they felt a tone.
Eleven tones were presented as stimuli corresponding to the musical notes C and G in the range from C1 to C6. The frequencies were calculated using the ratio 21/12 in twelve-tone equal temperament using the equation ( ) ( ) 4912 2440 −= nnf to give the frequency of the nth piano key relative to A4. For example, C1 corresponded to 32.7Hz, C4 to 261.6Hz and C6 to 1046.5Hz. In audiometry, the starting tone is chosen as 1kHz which is in the frequency range of highest sensitiv-ity for the human ear. Similarly, to determine vibrotactile thresholds the note C4 was chosen be-cause it approximately corresponds to the frequency of highest sensitivity for the Pacinian corpus-cle1. Therefore, the order of presentation of tones began with C4 ascending up to C6, followed by tones descending from G3 to C1. For each tone, the following stages were followed:
Familiarisation stage: (a) The stimulus C4 was presented at a maximum level that could be felt by all participants; (b) the level of the stimulus was then reduced in steps of 20dBV until no response was elicited; (c) the level of the stimulus was then increased in 2dBV steps until a response was elicited; (d) the stimulus was then presented again at the maximum level.
Stage 1: The stimulus was presented 10dBV below the lowest level of the participant’s response elicited during the familiarisation stage. The level was then increased in steps of 2dBV until a re-sponse was elicited.
Stage 2: After the response, the level was decreased by 10dBV and then another ascent was started. The process continued until two responses were elicited at the same level out of a maximum of three ascents (excluding the familiarisation stage).
The next stimulus was then presented starting from the familiarisation stage through to Stage 2. Once the 11 tones had been presented the following verification stage was carried out.
Verification stage: The stepwise presentation of stimulus tone C4 was repeated. If the results were within ±4dBV of the first measurement and the skin temperature was within the acceptable range, the measurement was deemed valid and the results were included in the analysis.
A complete test for each participant lasted approximately 1.5 hours. This included approxi-mately 15 minutes to brief the participant on the test procedure and two or three rest periods. Each rest period lasted approximately five minutes after approximately 20 minutes of testing.
19th International Congress on Sound and Vibration, Vilnius, Lithuania, July 8-12, 2012
4
2.3 Participants Thirty-one participants with normal hearing and eight participants with a hearing impairment
have been tested. All participants were healthy with no impairment in sensation from their hands. All participants, except one, were right handed.
Participants with normal hearing consisted of 18 males and 13 females with an age range of 18 to 65 (μ: 30.3 years, σ: 11.3). Note that only one participant was aged 65 with all others being under 50 years old. Participants with a hearing impairment consisted of 2 males and 6 females with an age range of 23 to 67 (μ: 40.6 years, σ: 11.9). Note that only one participant was aged 67 with all others being under 58. The eight participants had hearing impairments classified as mild, moderate, severe or profound according to the RNID classification used in the UK.
2.4 Post-hoc experiment During the threshold measurements, some participants commented that for high notes there
were distinct differences in perceiving the onset and sustain of high notes compared to low notes. For this reason, a post-hoc experiment was carried out using 14 of the participants with normal hearing. These participants repeated the threshold experiment for the 11 white notes from G4 to C6. Once the threshold had been determined for a tone, the participant was again presented with the stimulus sequence at threshold level and a two-alternative forced choice was used to ask (a) whether they felt transient vibration at the beginning and/or end of any of the 1s tones in the sequence and (b) whether they felt continuous vibration during any of the 1s tones in the sequence. The same stimulus sequence was then presented at 10dB above threshold and the questions were repeated before proceeding with the next tone.
3. Results Figure 2 shows the vibrotactile thresholds from all participants with normal hearing. The
threshold curves show the characteristic U-shape for the Pacinian corpuscle where the lowest threshold is in the vicinity of G3 and C41,2. The numbering for each participant has been used to identify outlier responses with circles. The box plots show the spread of response values; each box showing the 25th to 75th percentile values around the median (thick black line) with whiskers ex-tending up to 1.5 times the box spread.
Figure 2. Detection thresholds measured on the distal phalanx for 31 participants with normal hearing. The red dots indicate outliers with participant number.
19th International Congress on Sound and Vibration, Vilnius, Lithuania, July 8-12, 2012
5
Figure 3 shows the mean thresholds expressed in terms of peak displacement for comparison with other psychophysical studies in the literature5,6,7 which are summarised by Morioka and Grif-fin2. The shape of the curve is similar to thresholds measured in other studies without a contactor surround but using different equipment and procedures. However, the present thresholds are higher. Unfortunately, it is rarely possible to determine the standard deviation from other published studies; hence 95% confidence intervals are only shown for the present experiment. Assuming that the con-fidence intervals in the other studies are similar it would be reasonable to expect the confidence intervals from the present experiment to overlap with those reported by Harada and Griffin.
The main differences between the present experiment and these other studies are a different contactor area and, in some cases, different stimuli duration. The contactor area used by Harada and Griffin was 0.39cm2, by Goble et al, 1.4cm2 and by Lamoré and Keemink, 1.5cm2. These areas are significantly smaller than the 3.14cm2 contactor area used in the present experiment. The duration of the stimuli in the present experiment was 1s as in Lamoré and Keemink but longer than in Goble et al who used 0.5s; no duration is stated by Harada and Griffin. The present results can therefore be said to resemble prior findings, consistent differences being due to experimental equipment, design and procedure.
Figure 3. Comparison of mean detection thresholds measured on the distal phalanx without contactor surround with those from other studies.
Figure 4 allows comparison of the vibrotactile thresholds for participants with normal hearing
and with a hearing impairment. Using Levene’s test for equality of variances and an independent t-test for equality of means, no significant difference (p > 0.05) was found between the mean values of thresholds for participants with normal hearing and participants with a severe/profound hearing impairment. This was regardless of whether linear displacement or the displacement in decibels was used. However, to draw more robust conclusions, more participants with a hearing impairment need to be tested. It is hoped that more results will be available for presentation at the conference.
The measured vibrotactile thresholds can be used to assess the dynamic range that is poten-
tially available if music in the form of vibration were to be relayed to a musician without causing vascular symptoms. The thresholds were converted into frequency-weighted acceleration magni-tudes8 for comparison against a proposed upper limit for frequency-weighted acceleration of 1m/s2 rms. This is based upon previous data referenced by Griffin9 which suggests that vascular symp-toms would not usually occur below this value when considering normal usage of hand-tools. The frequency-weighted accelerations are shown in Figure 5 and indicate that the available dynamic
10 100 1000
0.1
1
10
Frequency (Hz)
Dis
plac
emen
t (μm
, pea
k)
Present experiment, 201295% confidence intervalsHarada and Griffin, 1991Goble et al, 1996Lamoré and Keemink, 1988
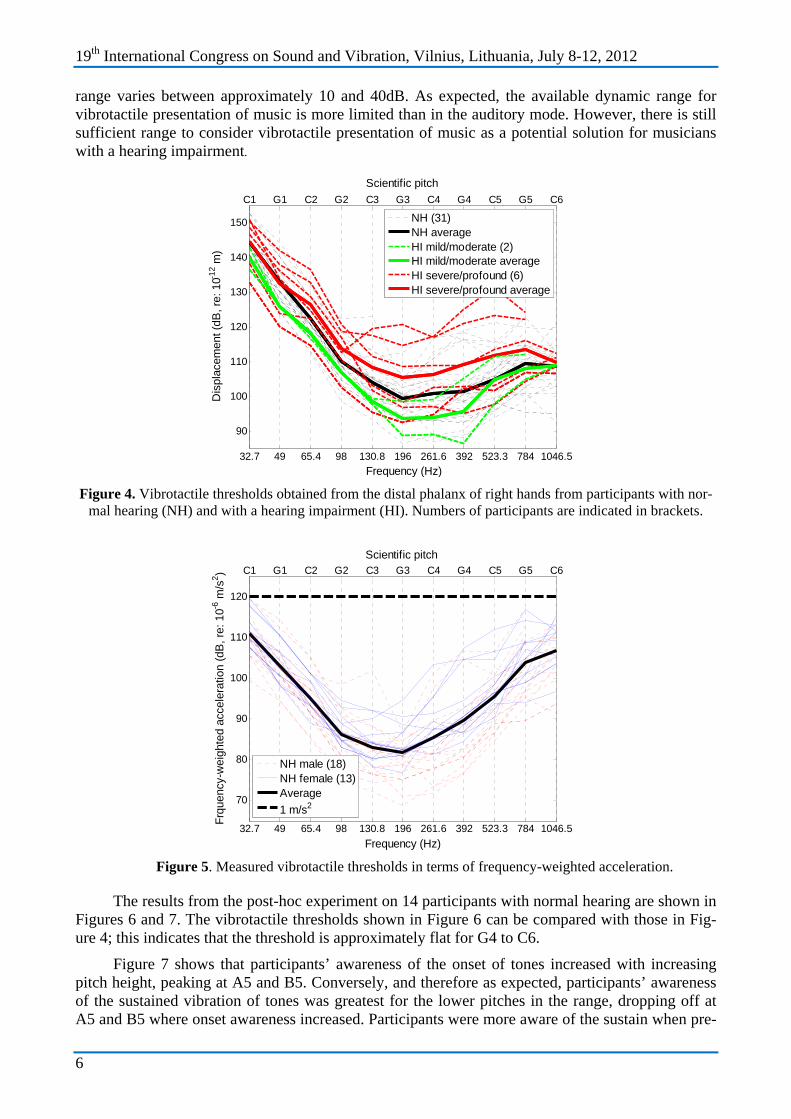
19th International Congress on Sound and Vibration, Vilnius, Lithuania, July 8-12, 2012
6
range varies between approximately 10 and 40dB. As expected, the available dynamic range for vibrotactile presentation of music is more limited than in the auditory mode. However, there is still sufficient range to consider vibrotactile presentation of music as a potential solution for musicians with a hearing impairment.
Figure 4. Vibrotactile thresholds obtained from the distal phalanx of right hands from participants with nor-
mal hearing (NH) and with a hearing impairment (HI). Numbers of participants are indicated in brackets.
Figure 5. Measured vibrotactile thresholds in terms of frequency-weighted acceleration.
The results from the post-hoc experiment on 14 participants with normal hearing are shown in
Figures 6 and 7. The vibrotactile thresholds shown in Figure 6 can be compared with those in Fig-ure 4; this indicates that the threshold is approximately flat for G4 to C6.
Figure 7 shows that participants’ awareness of the onset of tones increased with increasing pitch height, peaking at A5 and B5. Conversely, and therefore as expected, participants’ awareness of the sustained vibration of tones was greatest for the lower pitches in the range, dropping off at A5 and B5 where onset awareness increased. Participants were more aware of the sustain when pre-
32.7 49 65.4 98 130.8 196 261.6 392 523.3 784 1046.5
90
100
110
120
130
140
150
Frequency (Hz)
Dis
plac
emen
t (dB
, re:
10-1
2 m)
C1 G1 C2 G2 C3 G3 C4 G4 C5 G5 C6
Scientific pitch
NH (31)NH averageHI mild/moderate (2)HI mild/moderate averageHI severe/profound (6)HI severe/profound average
32.7 49 65.4 98 130.8 196 261.6 392 523.3 784 1046.5
70
80
90
100
110
120
Frequency (Hz)
Frqu
ency
-wei
ghte
d ac
cele
ratio
n (d
B, r
e: 1
0 -6 m
/s2 )
C1 G1 C2 G2 C3 G3 C4 G4 C5 G5 C6
Scientific pitch
NH male (18)NH female (13)Average1 m/s2
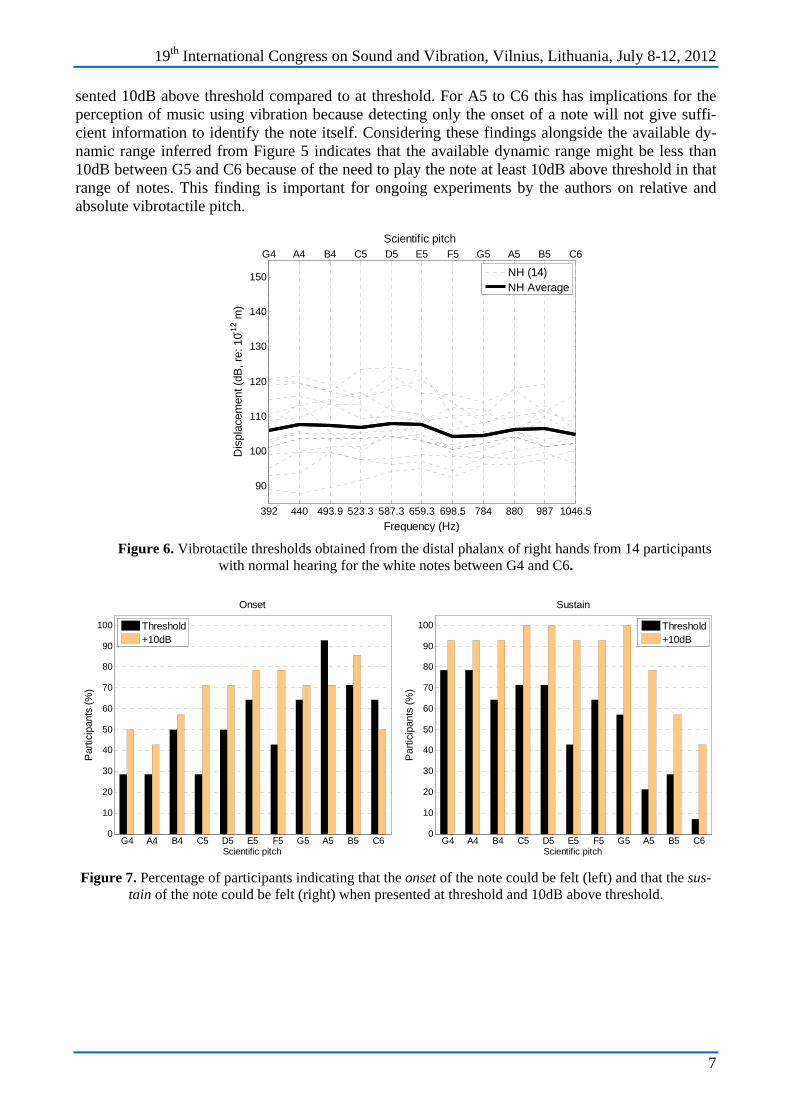
19th International Congress on Sound and Vibration, Vilnius, Lithuania, July 8-12, 2012
7
392 440 493.9 523.3 587.3 659.3 698.5 784 880 987 1046.5
90
100
110
120
130
140
150
Frequency (Hz)
Dis
plac
emen
t (dB
, re:
10-1
2 m)
G4 A4 B4 C5 D5 E5 F5 G5 A5 B5 C6
Scientific pitch
NH (14)NH Average
sented 10dB above threshold compared to at threshold. For A5 to C6 this has implications for the perception of music using vibration because detecting only the onset of a note will not give suffi-cient information to identify the note itself. Considering these findings alongside the available dy-namic range inferred from Figure 5 indicates that the available dynamic range might be less than 10dB between G5 and C6 because of the need to play the note at least 10dB above threshold in that range of notes. This finding is important for ongoing experiments by the authors on relative and absolute vibrotactile pitch.
Figure 6. Vibrotactile thresholds obtained from the distal phalanx of right hands from 14 participants with normal hearing for the white notes between G4 and C6.
Figure 7. Percentage of participants indicating that the onset of the note could be felt (left) and that the sus-tain of the note could be felt (right) when presented at threshold and 10dB above threshold.
G4 A4 B4 C5 D5 E5 F5 G5 A5 B5 C60
10
20
30
40
50
60
70
80
90
100
Onset
Scientific pitch
Par
ticip
ants
(%)
Threshold+10dB
G4 A4 B4 C5 D5 E5 F5 G5 A5 B5 C60
10
20
30
40
50
60
70
80
90
100
Sustain
Scientific pitch
Par
ticip
ants
(%)
Threshold+10dB
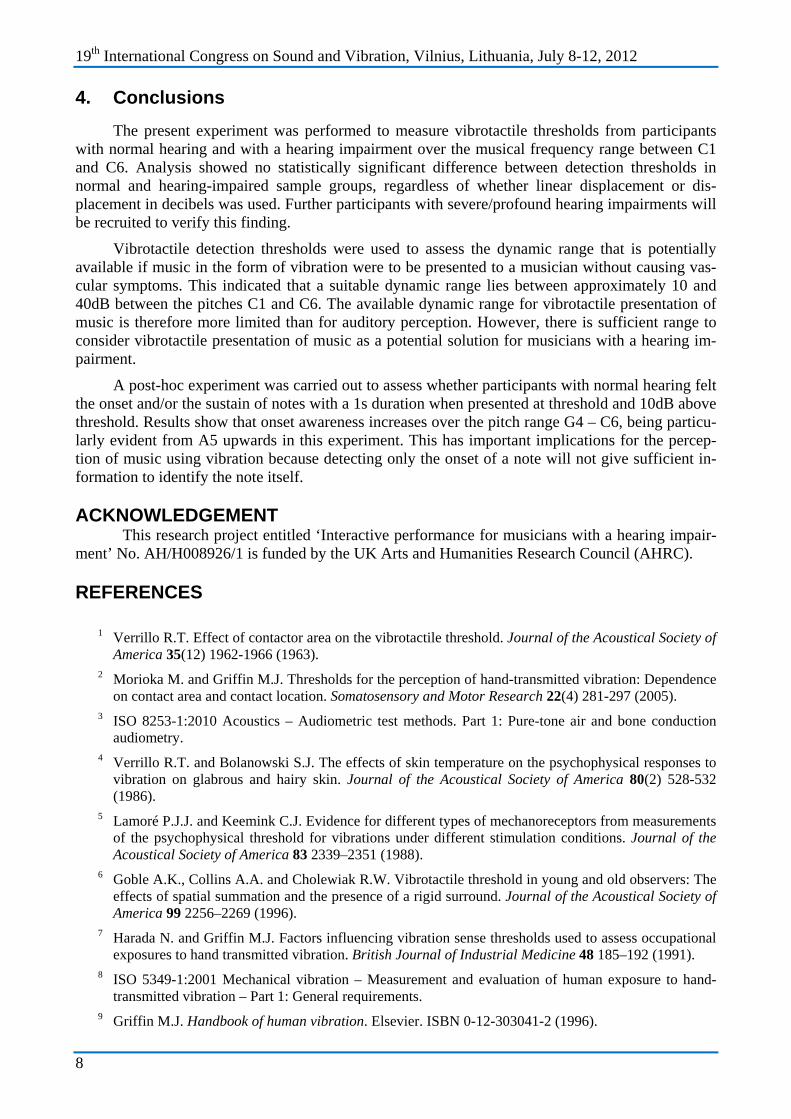
19th International Congress on Sound and Vibration, Vilnius, Lithuania, July 8-12, 2012
8
4. Conclusions The present experiment was performed to measure vibrotactile thresholds from participants
with normal hearing and with a hearing impairment over the musical frequency range between C1 and C6. Analysis showed no statistically significant difference between detection thresholds in normal and hearing-impaired sample groups, regardless of whether linear displacement or dis-placement in decibels was used. Further participants with severe/profound hearing impairments will be recruited to verify this finding.
Vibrotactile detection thresholds were used to assess the dynamic range that is potentially available if music in the form of vibration were to be presented to a musician without causing vas-cular symptoms. This indicated that a suitable dynamic range lies between approximately 10 and 40dB between the pitches C1 and C6. The available dynamic range for vibrotactile presentation of music is therefore more limited than for auditory perception. However, there is sufficient range to consider vibrotactile presentation of music as a potential solution for musicians with a hearing im-pairment.
A post-hoc experiment was carried out to assess whether participants with normal hearing felt the onset and/or the sustain of notes with a 1s duration when presented at threshold and 10dB above threshold. Results show that onset awareness increases over the pitch range G4 – C6, being particu-larly evident from A5 upwards in this experiment. This has important implications for the percep-tion of music using vibration because detecting only the onset of a note will not give sufficient in-formation to identify the note itself.
ACKNOWLEDGEMENT
This research project entitled ‘Interactive performance for musicians with a hearing impair-ment’ No. AH/H008926/1 is funded by the UK Arts and Humanities Research Council (AHRC).
REFERENCES
1 Verrillo R.T. Effect of contactor area on the vibrotactile threshold. Journal of the Acoustical Society of America 35(12) 1962-1966 (1963). 2 Morioka M. and Griffin M.J. Thresholds for the perception of hand-transmitted vibration: Dependence on contact area and contact location. Somatosensory and Motor Research 22(4) 281-297 (2005). 3 ISO 8253-1:2010 Acoustics – Audiometric test methods. Part 1: Pure-tone air and bone conduction audiometry. 4 Verrillo R.T. and Bolanowski S.J. The effects of skin temperature on the psychophysical responses to vibration on glabrous and hairy skin. Journal of the Acoustical Society of America 80(2) 528-532 (1986). 5 Lamoré P.J.J. and Keemink C.J. Evidence for different types of mechanoreceptors from measurements of the psychophysical threshold for vibrations under different stimulation conditions. Journal of the Acoustical Society of America 83 2339–2351 (1988). 6 Goble A.K., Collins A.A. and Cholewiak R.W. Vibrotactile threshold in young and old observers: The effects of spatial summation and the presence of a rigid surround. Journal of the Acoustical Society of America 99 2256–2269 (1996). 7 Harada N. and Griffin M.J. Factors influencing vibration sense thresholds used to assess occupational exposures to hand transmitted vibration. British Journal of Industrial Medicine 48 185–192 (1991). 8 ISO 5349-1:2001 Mechanical vibration – Measurement and evaluation of human exposure to hand- transmitted vibration – Part 1: General requirements. 9 Griffin M.J. Handbook of human vibration. Elsevier. ISBN 0-12-303041-2 (1996).
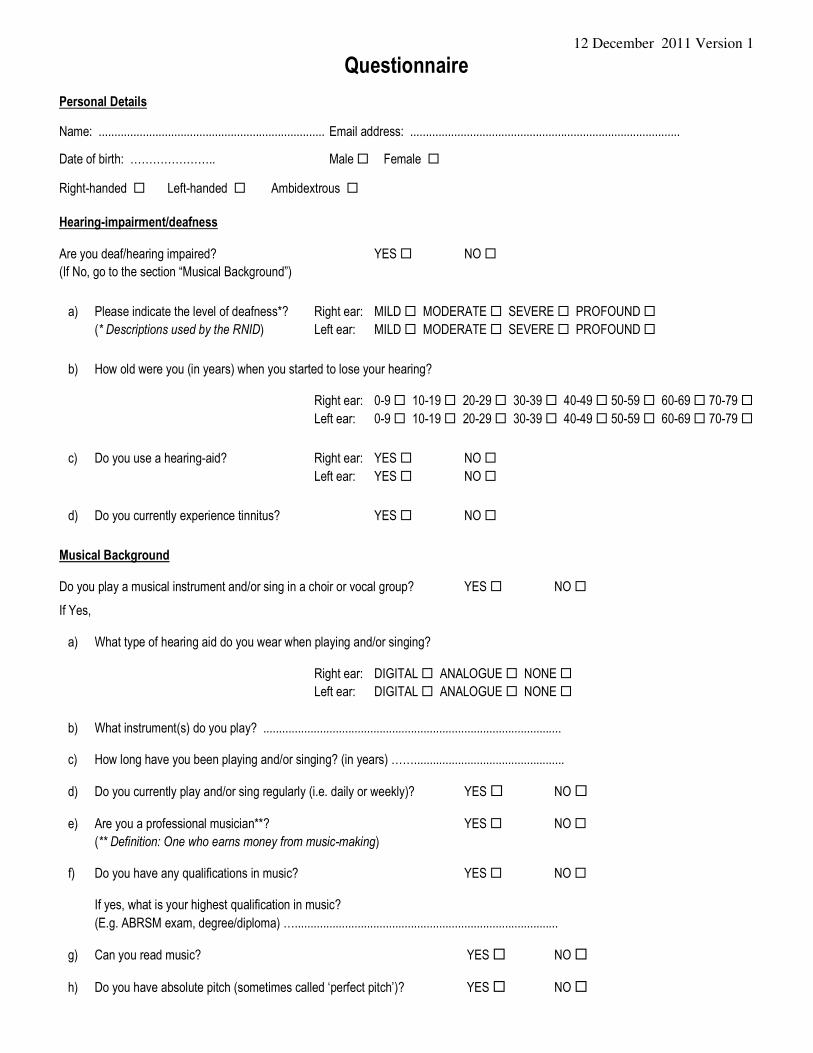
12 December 2011 Version 1
Questionnaire Personal Details Name: ........................................................................ Email address: ...................................................................................... Date of birth: ………………….. Male � Female � Right-handed � Left-handed � Ambidextrous �
Hearing-impairment/deafness Are you deaf/hearing impaired? YES � NO �
(If No, go to the section “Musical Background”)
a) Please indicate the level of deafness*? Right ear: MILD � MODERATE � SEVERE � PROFOUND �
(* Descriptions used by the RNID) Left ear: MILD � MODERATE � SEVERE � PROFOUND �
b) How old were you (in years) when you started to lose your hearing? Right ear: 0-9 � 10-19 � 20-29 � 30-39 � 40-49 � 50-59 � 60-69 � 70-79 �
Left ear: 0-9 � 10-19 � 20-29 � 30-39 � 40-49 � 50-59 � 60-69 � 70-79 �
c) Do you use a hearing-aid? Right ear: YES � NO �
Left ear: YES � NO �
d) Do you currently experience tinnitus? YES � NO �
Musical Background Do you play a musical instrument and/or sing in a choir or vocal group? YES � NO �
If Yes,
a) What type of hearing aid do you wear when playing and/or singing?
Right ear: DIGITAL � ANALOGUE � NONE �
Left ear: DIGITAL � ANALOGUE � NONE �
b) What instrument(s) do you play? ...............................................................................................
c) How long have you been playing and/or singing? (in years) ……................................................
d) Do you currently play and/or sing regularly (i.e. daily or weekly)? YES � NO �
e) Are you a professional musician**? YES � NO �
(** Definition: One who earns money from music-making)
f) Do you have any qualifications in music? YES � NO �
If yes, what is your highest qualification in music?
(E.g. ABRSM exam, degree/diploma) …....................................................................................
g) Can you read music? YES � NO �
h) Do you have absolute pitch (sometimes called ‘perfect pitch’)? YES � NO �