Shrubland management to promote Quercus suber L. establishment

www.newphytologist.org
819
Research
Blackwell Publishing Ltd
Interactions of drought and shade effects on seedlings of four
Quercus
species: physiological and structural leaf
responses
José Luis Quero
1,2
, Rafael Villar
2
, Teodoro Marañón
3
and Regino Zamora
1
1
Grupo de Ecología Terrestre, Departamento de Ecología, Facultad de Ciencias, Universidad de Granada, E
−
18071 Granada, Spain;
2
Área de Ecología, Facultad
de Ciencias, Universidad de Córdoba, E
−
14071 Córdoba, Spain;
3
Instituto de Recursos Naturales y Agrobiología, CSIC, PO Box 1052, E-41080 Sevilla, Spain
Summary
• Here, we investigated the physiological and structural leaf responses of seedlingsof two evergreen and two deciduous
Quercu
s species, grown in a glasshouse andsubjected to contrasted conditions of light (low, medium and high irradiance) andwater (continuous watering vs 2-months drought).• The impact of drought on photosynthetic rate was strongest in high irradiance,while the impact of shade on photosynthetic rate was strongest with high watersupply, contradicting the hypothesis of allocation trade-off.• Multivariate causal models were evaluated using d-sep method. The model thatbest fitted the dataset proposed that the variation in specific leaf area affectsphotosynthetic rate and leaf nitrogen concentration, and this trait determinesstomatal conductance, which also affects photosynthetic rate.• Shade conditions seemed to ameliorate, or at least not aggravate, the droughtimpact on oak seedlings, therefore, the drought response on leaf performancedepended on the light environment.
Key words:
deciduous, evergreen, leaf traits, Mediterranean oaks, photosynthesis,nitrogen, specific leaf area, water-use efficiency.
New Phytologist
(2006)
170
: 819–834
© The Authors (2006). Journal compilation ©
New Phytologist
(2006)
doi
: 10.1111/j.1469-8137.2006.01713.x
Author for correspondence:
José Luis Quero Tel: +34 958 243242 Fax: +34 958 243238 Email: [email protected]
Received:
19 December 2005
Accepted:
6 February 2006
Introduction
Light and water are main resources affecting leaf traits,regulating plant growth and survival, and determining thedistribution of plants at global scale. The functional responseof seedlings to the combination of shade and drought involvesbiochemical, physiological, and structural changes at the leafand whole-plant level (Holmgren, 2000; Sack & Grubb, 2002;Sack, 2004; Aranda
et al
., 2005). Some hypotheses predictthat under limiting light availability (primary limitation), theshortage of another resource such as water should have lessimpact on plant performance (Canham
et al
., 1996). Inaddition, shade by the tree canopy has indirect effects, such asreducing leaf and air temperatures, vapour pressure deficit andoxidative stress, that would alleviate the drought impact on
seedlings in the understorey (Holmgren, 2000). Empiricalevidence of facilitation effects of shrubs and trees on seedlingsin the understorey in Mediterranean environments has beenwidely documented (Castro
et al
., 2004a; Gómez-Aparicio
et al
., 2004). A contrary hypothesis predicts that deep shadewill aggravate the stress imposed by drought, based on theproposed trade-off mechanism that shaded plants allocatemore to shoot, and to leaf area, than to root, thereby diminishingthe ability to capture water (Smith & Huston, 1989). In fact,some studies have found a higher impact of water stresson shaded plants (Abrams & Mostoller, 1995; Valladares &Pearcy, 2002). A third group of hypotheses posits that theeffects of shade and water-shortage are independent, that is,their impacts are orthogonal (Sack & Grubb, 2002; Sack,2004).

New Phytologist
(2006)
170
: 819–834
www.newphytologist.org
© The Authors (2006). Journal compilation ©
New Phytologist
(2006)
Research820
In woody species, there is a suite of leaf traits associatedto leaf life span. Deciduous species tend to achieve higherphotosynthetic and respiration rates and higher stomatalconductance, and have higher nitrogen (N) concentration inthe leaf, compared with related evergreen species (Reich
et al
.,1992, 1997; Villar
et al
., 1995; Takashima
et al
., 2004; Wright
et al
., 2004). In Mediterranean environments, deciduous speciestend to be more abundant in habitats with greater availabilityof water and nutrients, where the overstorey canopy is denser.Hence, it would be expected that seedlings of deciduousspecies are more shade-tolerant and water-demanding. Bycontrast, evergreen species tend to dominate in habitats thatare drier and poorer in nutrients, where the overstorey canopyis sparse. We would therefore expect that seedlings of ever-green species are more tolerant to drought but not necessarilyto shade.
One way to understand plants function is to exploreleaf-trait relationships in different environmental conditions;however, most studies have discussed simple bivariate rela-tionships. In order to develop a quantitative model of plantfunctioning relating to gas exchange, it would be necessary tomove to multivariate relationships to be investigated by causalmodel (Meziane & Shipley, 2001). These authors proposed amodel in which SLA was the forcing variable directly affectingboth leaf N and net photosynthetic rate. Leaf N then directlyaffects photosynthetic rate, which in turn affects stomatalconductance. This model was found to agree with severaldatasets (Meziane & Shipley, 2001). To date, these modelshave not been applied to datasets with limiting light and waterconditions, as are typical of Mediterranean forest.
We have designed an experiment with controlled conditionsof light and water to investigate the physiological and struc-tural leaf traits responses of tree seedlings to six combinationsof light (three levels) and water (two levels). Four species of thesame genus (
Quercus
) differing in leaf life span, were selected:two evergreens and two deciduous. Thus, we compared decid-uous and evergreen species under the same genus, includingthe phylogeny in the design and data analysis.
There are some specific questions to investigate plantresponses to different light–water scenarios: Are shade anddrought impacts on seedlings positive, negative or independent?Do species or functional groups (evergreen vs deciduous) responddifferently? Which physiological and structural leaf traits aremost affected by the combined stress? What are the functionalrelationships among those variables? The answers to thesequestions would help to understand the functioning of plantsand their implications for the species distribution in nature.
Materials and Methods
Experimental design
Acorns of four oak species, major components of Mediterraneanforest –
Quercus suber
L.,
Quercus ilex
ssp.
ballota
(Desf.) Samp.(evergreen),
Quercus canariensis
Willd. and
Quercus pyrenaica
Willd. (deciduous) – were collected in the south of Spain.At landscape scale, the evergreen species tend to occupy drierhabitats than the deciduous species at each site, although theregional ranges overlap (see Table 1 for more details). Singleacorns were weighted individually and sown (in December2002) in cylindrical pots of 3.9-l volume (50 cm high
×
10 cmdiameter), thereby avoiding as much as possible interferenceduring root growth. Pots contained a mixed soil of 2 : 3 sandand 1 : 3 peat. Ten grams of a slow-release fertilizer (Plantacote,Pluss NPK: 14 : 9 : 15, Aglukon, Valencia, Spain) were addedat the middle of the experiment. The experiment was carriedout in a glasshouse of the University of Córdoba (Spain,37
°
51
′
N, 4
°
48
′
W; at an altitude of 100 m) with anautomatic irrigation system and regulation of air temperature.
Oak seedlings were subjected to three light levels: (1) high-irradiance treatment (HI), receiving available radiation insidethe glasshouse; (2) medium-irradiance treatment (MI), coveredby a light-green screen (27% of available radiation); and (3)deep-shade or low-irradiance treatment (LI), covered by a densegreen cloth (3% of available radiation). Each light treatmentwas imposed using a shade frame (150
×
120
×
200 cm) and
Table 1 Oak species included in the experiment (nomenclature follows Amaral, 1990), their leaf life span, frequency in southern Spain (calculated from 12572 records in the National Forest Inventory) and range of precipitation where they were recorded
Species Origin of seedsFunctional group
Frequency in southern Spain (%)
Precipitation (mm)
Mean Range
Quercus canariensis Willd. Sierra del Aljibe Deciduous 2.4 1073 628–1338(SE Spain)
Quercus ilex ssp. ballota (Desf.) Samp Sierra Nevada Evergreen 50.8 668 268–1366(SW Spain)
Quercus pyrenaica Willd. Sierra de Cardeña Deciduous 0.4 773 604–990(S Spain)
Quercus suber L. Sierra del Aljibe Evergreen 15.8 839 489–1366(SE Spain)
Data from the National Meteorological Institute; Urbieta et al. (2004).
© The Authors (2006). Journal compilation ©
New Phytologist
(2006)
www.newphytologist.org
New Phytologist
(2006)
170
: 819–834
Research 821
replicated four times; therefore, there were 12 shade frames intotal. Each of the four species and the two levels of wateringwere set up within each shade frame, each by one plant in asingle pot. The experimental light treatments simulated thefield conditions in the forest understorey, distinguishing threetypes of microhabitat: open (HI), under single tree cover (MI),and under shrub and tree cover (LI) (Marañón
et al
., 2004).The mean
±
SE of the photosynthetic active radiation measured(with EMS7, canopy transmission meter, PP-system, UK) atmidday on May 28, 2003, for each light treatment was 760
±
150, 187
±
27 and 23
±
2 µmol of photons m
−
2
s
−
1
in HI,MI and LI respectively. Light quality (red:far red (R : FR)ratio, measured with sensor SKR 110; Skye Instruments,Llandrindod Wells, UK) was different from 1 only in LI, butthis value (0.25
±
0.004) was similar to that for dense forestmicrohabitat (0.28
±
0.03,
t
-test,
P
= 0.31).Pots were watered weekly during the first stage of the
experiment. Once the seedlings emerged ( January–February,2003), a drip-irrigation system was inserted in the pots. Fourmonths after sowing (at the end of April 2003), half of thepots stopped receiving any watering (low-water treatment,LW) while the other half was kept continuously moist (high-water treatment, HW). Low-water treatment simulated atypical Mediterranean-climate situation of seasonal drought,compared with a continuously moist one (HW) with reducedor no drought. During the experiment, we measured soilmoisture (in volumetric water content, VWC), measured alongthe first 20 cm depth (with a TDR mod 100; Spectrum Tech-nologies, Inc., Plainfield, IL, USA) each
c
. 3 d, in a subsampleof five pots under different light and water treatments. Potsunder LW decrease their water content similarly for the three
light treatments (Table 2a; repeated measures
ANOVA
,
P
= 0.17).At the same time of photosynthetic measurements (end ofJuly 2003,
c
. 2 months after stopping irrigation), we measuredVWC of each pot. For each water treatment, there were nodifferences in water content between the pots of differentspecies or between the three different light treatments at theend of the experiment (Table 2b). The mean
±
SE values inJuly 2003, were 13.20
±
0.20% (for HW treatment) and2.96
±
0.13% (for LW). The latter value was very similar tothose found under field conditions at the end of thedrought period (Gómez-Aparicio
et al
., 2005).
Physiological and structural measurements
Photosynthesis response to irradiance was measured in mid-height fully expanded leaf of, in general, six plants per speciesand treatment combination. The measurements were donein the four different shade frames (replicates) for each lighttreatment to avoid pseudoreplication. We used a gas-exchangeportable analyser (Ciras-2; PP-System, Hitchin, UK). Theinstrument was adjusted to have constant conditions of CO
2
concentration (360 p.p.m), flow (150 cm
3
min
−
1
), and leaftemperature (25
°
C) inside the leaf chamber. Photosyntheticrate was measured at 10 light intensities of PAR obtained byusing a quartz halogen light unit coupled to leaf chamberfollowing the order 1000, 1300, 1500, 800, 600, 400, 200,100, 50 and 0 µmol m
−
2
s
−
1
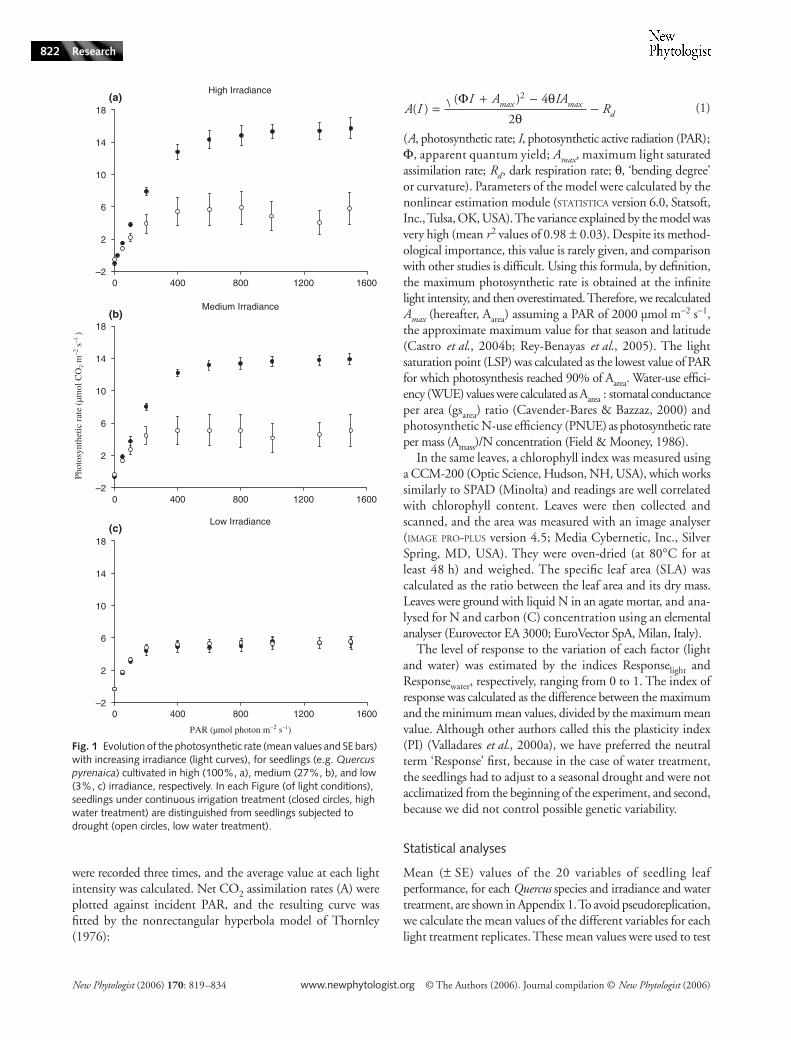
(Fig. 1), to reduce the equilibriumtime required for stomatal opening and photosynthesis induction(Kubiske & Pregitzer, 1996). Each leaf was kept for 1 min atthe same light intensity into the leaf chamber; net assimilationrate, transpiration rate and intercellular CO
2
concentration
Table 2 (a) Soil water content (measured with TDR) at the beginning, middle and end of the experiment (mean ± SE) in a subsample of pots under the six light and water combinations; (b) results of the three-way ANOVA for the effects of water supply (W), irradiance treatments (I), and species (S), and their interactions at the end of the experiment for all pots where photosynthetic measurements were done
Time (d)
Combined treatments
High water Low water
LI MI HI LI MI HI
(a)Soil water content (%) 0 13.8 ± 0.6 12.4 ± 0.6 12.0 ± 0.6 13.1 ± 0.6 10.3 ± 0.6 11.1 ± 0.6
30 11.8 ± 0.5 11.0 ± 0.5 11.0 ± 0.5 6.6 ± 0.5 5.2 ± 0.5 3.6 ± 0.560 12.8 ± 0.4 13.2 ± 0.4 13.2 ± 0.4 3.2 ± 0.4 2.4 ± 0.1 2.2 ± 0.1
(b)3-way ANOVA results Factor df Mean squares P
Water (W) 1 3053 < 0.001Irradiance (I) 2 69.02 0.408Species (S) 3 66.14 0.461W × I 2 16.70 0.804W × S 3 6.98 0.965I × S 6 32.96 0.856I × W × S 6 7.63 0.996Error 111 76.38
HI, high irradiance; MI, medium irradiance; LI, low irradiance (see the Materials and Methods section for details).
New Phytologist
(2006)
170
: 819–834
www.newphytologist.org
© The Authors (2006). Journal compilation ©
New Phytologist
(2006)
Research822
were recorded three times, and the average value at each lightintensity was calculated. Net CO
2
assimilation rates (A) wereplotted against incident PAR, and the resulting curve wasfitted by the nonrectangular hyperbola model of Thornley(1976):
(1)
(A, photosynthetic rate; I, photosynthetic active radiation (PAR);Φ, apparent quantum yield; Amax, maximum light saturatedassimilation rate; Rd, dark respiration rate; θ, ‘bending degree’or curvature). Parameters of the model were calculated by thenonlinear estimation module (STATISTICA version 6.0, Statsoft,Inc., Tulsa, OK, USA). The variance explained by the model wasvery high (mean r2 values of 0.98 ± 0.03). Despite its method-ological importance, this value is rarely given, and comparisonwith other studies is difficult. Using this formula, by definition,the maximum photosynthetic rate is obtained at the infinitelight intensity, and then overestimated. Therefore, we recalculatedAmax (hereafter, Aarea) assuming a PAR of 2000 µmol m−2 s−1,the approximate maximum value for that season and latitude(Castro et al., 2004b; Rey-Benayas et al., 2005). The lightsaturation point (LSP) was calculated as the lowest value of PARfor which photosynthesis reached 90% of Aarea. Water-use effici-ency (WUE) values were calculated as Aarea : stomatal conductanceper area (gsarea) ratio (Cavender-Bares & Bazzaz, 2000) andphotosynthetic N-use efficiency (PNUE) as photosynthetic rateper mass (Amass)/N concentration (Field & Mooney, 1986).
In the same leaves, a chlorophyll index was measured usinga CCM-200 (Optic Science, Hudson, NH, USA), which workssimilarly to SPAD (Minolta) and readings are well correlatedwith chlorophyll content. Leaves were then collected andscanned, and the area was measured with an image analyser(IMAGE PRO-PLUS version 4.5; Media Cybernetic, Inc., SilverSpring, MD, USA). They were oven-dried (at 80°C for atleast 48 h) and weighed. The specific leaf area (SLA) wascalculated as the ratio between the leaf area and its dry mass.Leaves were ground with liquid N in an agate mortar, and ana-lysed for N and carbon (C) concentration using an elementalanalyser (Eurovector EA 3000; EuroVector SpA, Milan, Italy).
The level of response to the variation of each factor (lightand water) was estimated by the indices Responselight andResponsewater, respectively, ranging from 0 to 1. The index ofresponse was calculated as the difference between the maximumand the minimum mean values, divided by the maximum meanvalue. Although other authors called this the plasticity index(PI) (Valladares et al., 2000a), we have preferred the neutralterm ‘Response’ first, because in the case of water treatment,the seedlings had to adjust to a seasonal drought and were notacclimatized from the beginning of the experiment, and second,because we did not control possible genetic variability.
Statistical analyses
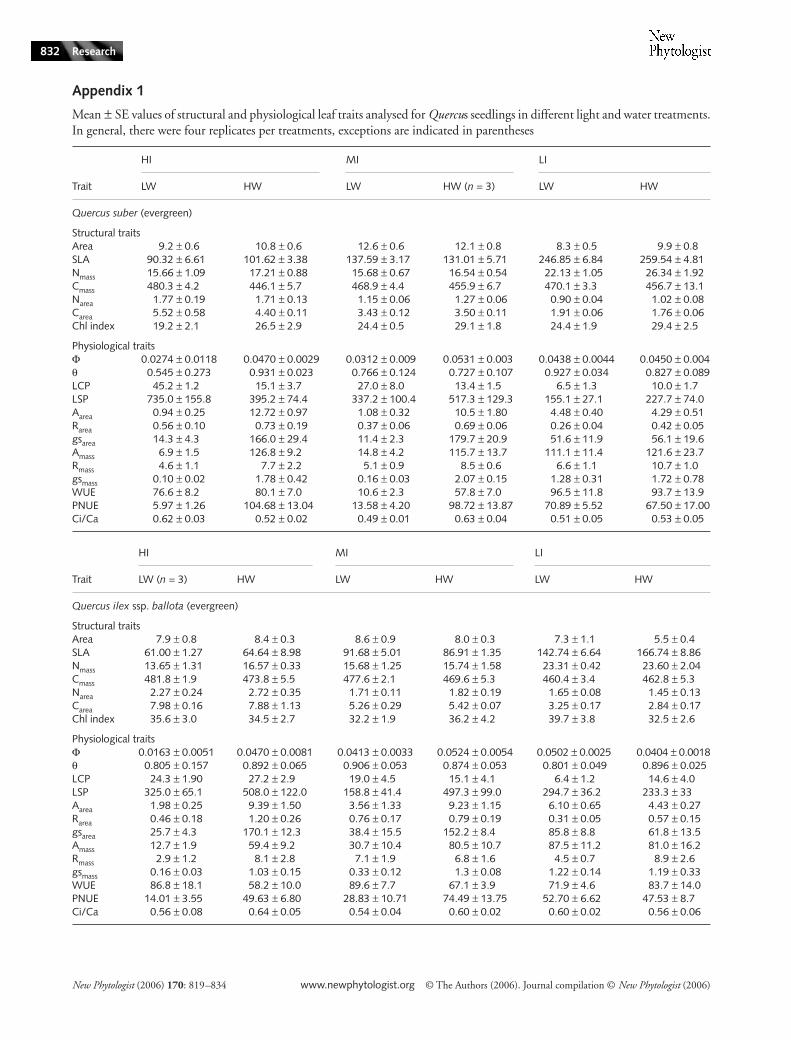
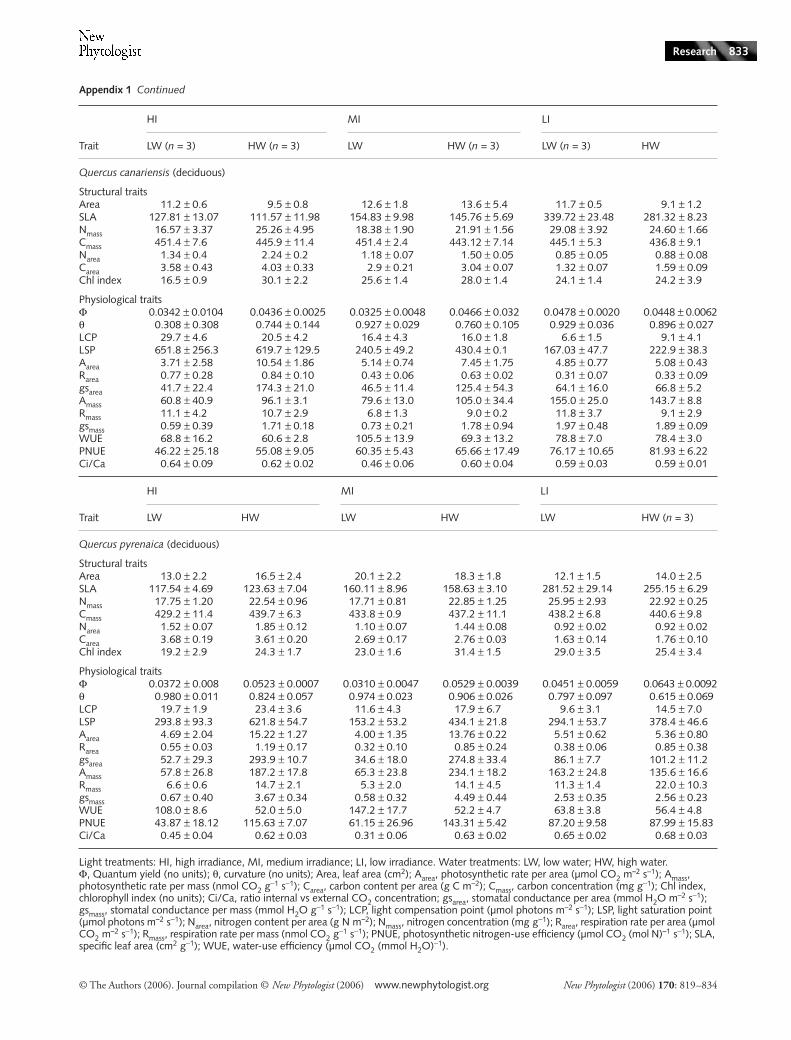
Mean (± SE) values of the 20 variables of seedling leafperformance, for each Quercus species and irradiance and watertreatment, are shown in Appendix 1. To avoid pseudoreplication,we calculate the mean values of the different variables for eachlight treatment replicates. These mean values were used to test
Fig. 1 Evolution of the photosynthetic rate (mean values and SE bars) with increasing irradiance (light curves), for seedlings (e.g. Quercus pyrenaica) cultivated in high (100%, a), medium (27%, b), and low (3%, c) irradiance, respectively. In each Figure (of light conditions), seedlings under continuous irrigation treatment (closed circles, high water treatment) are distinguished from seedlings subjected to drought (open circles, low water treatment).
A I
I A IARmax max
d( ) ( )
=+ −
−Φ 2 4
2
θθ
© The Authors (2006). Journal compilation © New Phytologist (2006) www.newphytologist.org New Phytologist (2006) 170: 819–834
Research 823
the differences among species and the effects of light and watertreatments on each variable by three-way ANOVAs (species, light,and water as source factors) with Type III sums of squares.Previously, ANCOVA was explored considering the seed mass ascovariable; seed mass did not significantly affect leaf traits of6-month-old seedlings (P > 0.05 in all cases); therefore, wepresent here only the ANOVA results for simplicity. A similarANOVA procedure was used to explore the differences betweendeciduous and evergreen species, using leaf habit as factor insteadof species. When the difference was significant, a multiplecomparison of means test (post hoc Unequal N Tukey’s HonestlySignificant Difference test) was carried out. Before ANCOVA andANOVA, data were square-root-, arcsine-, or log-transformed tosatisfy the normality and homoscedasticity assumptions (Zar,1984). Leaf-trait relationships were studied by Pearson’s correla-tion analyses between pairs of variables, separating wateredand drought conditions. The program STATISTICA version 6.0(Statsoft, Inc., Tulsa, OK, USA) was used for statistical analyses.
In order to explain the empirical patterns of direct andindirect covariation between variables, a multivariate analysiswas carried out to test for causal models linking changesin main leaf traits (SLA and N content) with physiologicalperformance (photosynthetic rate and stomatal conductance),following Shipley’s d-sep method (Shipley, 2000). Significancewas fixed at the 0.05 level throughout the study. In order tocontrol the inflation of type I error derived from repeated test-ing, the false discovery rate (FDR, the expected proportion oftests erroneously declared as significant) criterion was appliedto repeated test tables throughout the paper. The FDR wascontrolled at the 5% level using a standard step-up procedure(see García, 2004). However, when testing multiple path models,we obtained an estimate for the expected number of erroneouslyaccepted null hypotheses (type II errors), while controlling theFDR at the 5% level (Ventura et al., 2004). This approachallowed us to focus the attention on those accepted modelswhich had a low probability of being type II errors.
Results
Combined effects of shade and drought
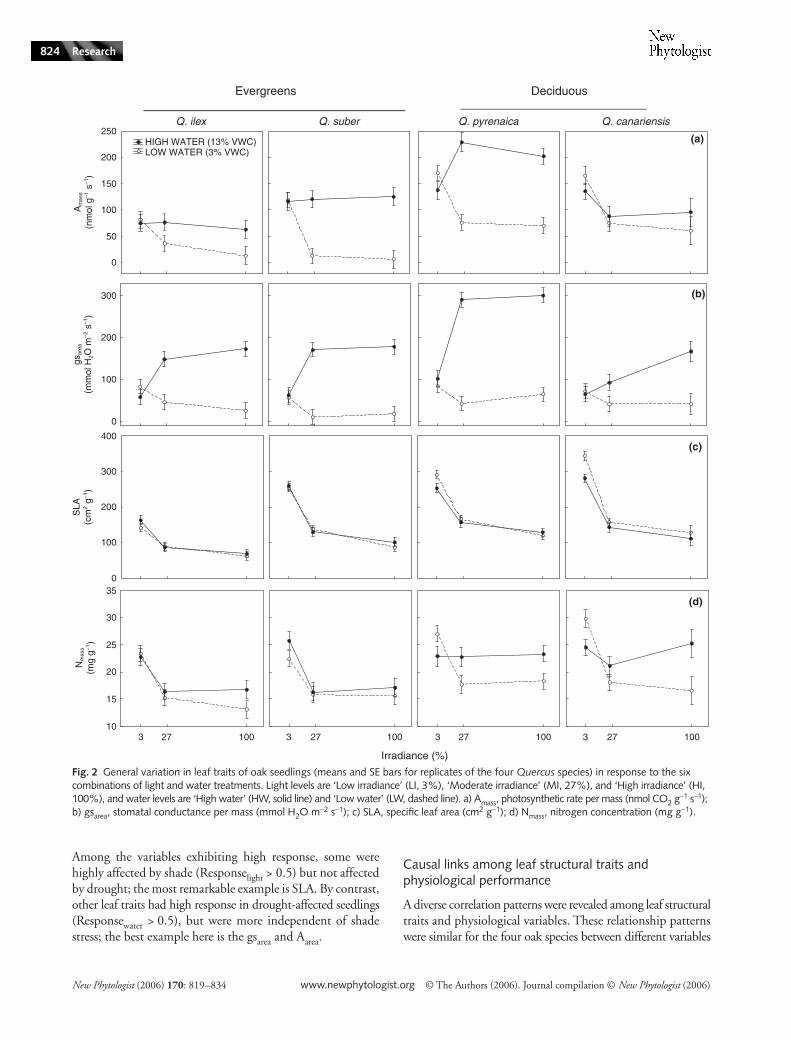
The reduction in the availability of light and water imposedstructural changes in the leaves of oak seedlings and affectedtheir physiological performance (Figs 1 and 2).
Most variables showed strong interactions of light andwater effects (as demonstrated by the ANOVAs, Table 3 andFig. 2), reflecting that the drought impact on the physiologicaland structural traits of seedlings was highly significant underHI and MI but negligible under LI. Some exceptions wereSLA and N concentration (Fig. 2).
Photosynthetic rate and stomatal conductance of the fouroak species were similar along the three irradiance levels inHW (Fig. 2a,b). However, these traits decreased with irradi-ance under the LW. WUE (ratio between these traits) showed
differences in water treatments, being higher in LW. However,PNUE decreased in LW as whole (Table 3).
Leaves of oak seedlings grown under LI had higher SLA(Fig. 2c) and were richer in N (Fig. 2d).
Differences among Quercus species
Leaf structural traits were characteristic of each species andshowed significant differences in the ANOVAs (see species asfactor in Table 3; Appendix 1). For example, leaf area variedacross the species (54% of variance explained) and SLA showedstatistical differences among each of the four Quercus species(30% of variance), with the rank Q. ilex < Q. suber < Q. pyrenaica< Q. canariensis (Fig. 2C).
Fewer physiological features varied across the Quercusspecies (only 6 out of 13; Table 3). For example, Amass differedamong species (22% of variance; deciduous Q. pyrenaica andQ. canariensis had higher values than evergreen Q. ilex and Q.suber) (Fig. 2a). In general, the effects of shade and/or droughton physiological variables were higher than the interspecificvariation (for example, LCP was highly affected by light (38%of variance), but varied only slightly across species (1% ofvariance)) (Table 3).
Differences between functional groups
Leaf traits of seedlings were related to the leaf habit. When theseedlings of deciduous species (Q. pyrenaica and Q. canariensis)were grouped and compared by ANOVAs with the evergreenspecies (Q. ilex and Q. suber), all seven leaf structural traitsshowed significant differences (Appendix 1). Seedlings ofdeciduous species had higher leaf area, SLA (Fig. 2c), and Nconcentration (Nmass, Fig. 2d), but lower chlorophyll (Chl)index (Appendix 1).
Differences in life span also predicted some variation inseedling physiological performance (significant ANOVAs for 5out of 13 variables). Seedlings of deciduous species had higherAmass (19% of variance), respiration rate per mass (Rmass) (13%of variance), PNUE (13% of variance), and stomatal conductance(3% of variance) than evergreens. There were no apparentdifferences between deciduous and evergreen seedlings in WUE.
Responses to variation of light and water
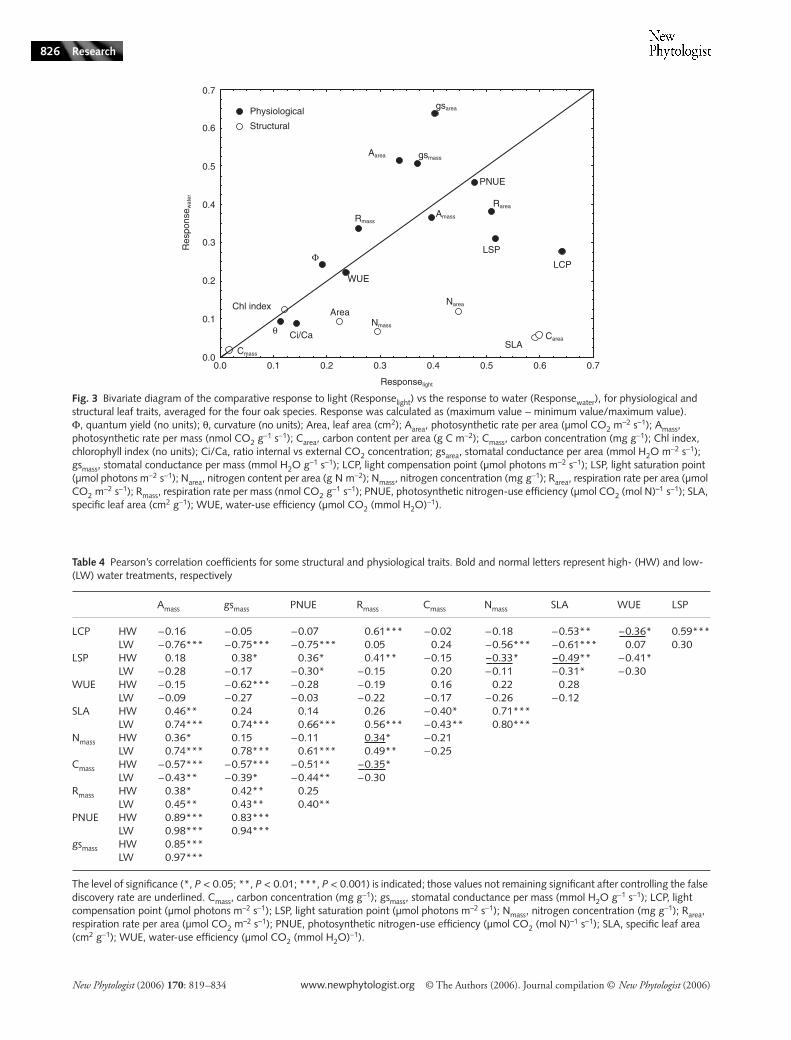
There was a high variation in the degree of response to lightvs that to water, for the 20 variables measured (Fig. 3). Resultsfor the four species were averaged to show the general responsepattern. The response to light (Responselight) had a mean valueof about 0.35 for the 20 variables, with a wide variationamong them (Fig. 3). The structural water-induced responseof leaf traits was very low (mean Responsewater of 0.07), whilethe general physiological response was relatively high (meanResponsewater of 0.35) (Fig. 3). Some variables had relativelypersistent values even for stressed seedlings (low response traits).
New Phytologist (2006) 170: 819–834 www.newphytologist.org © The Authors (2006). Journal compilation © New Phytologist (2006)
Research824
Among the variables exhibiting high response, some werehighly affected by shade (Responselight > 0.5) but not affectedby drought; the most remarkable example is SLA. By contrast,other leaf traits had high response in drought-affected seedlings(Responsewater > 0.5), but were more independent of shadestress; the best example here is the gsarea and Aarea.
Causal links among leaf structural traits and physiological performance
A diverse correlation patterns were revealed among leaf structuraltraits and physiological variables. These relationship patternswere similar for the four oak species between different variables
Fig. 2 General variation in leaf traits of oak seedlings (means and SE bars for replicates of the four Quercus species) in response to the six combinations of light and water treatments. Light levels are ‘Low irradiance’ (LI, 3%), ‘Moderate irradiance’ (MI, 27%), and ‘High irradiance’ (HI, 100%), and water levels are ‘High water’ (HW, solid line) and ‘Low water’ (LW, dashed line). a) Amass, photosynthetic rate per mass (nmol CO2 g
−1 s−1); b) gsarea, stomatal conductance per mass (mmol H2O m−2 s−1); c) SLA, specific leaf area (cm2 g−1); d) Nmass, nitrogen concentration (mg g−1).
© The Authors (2006). Journal compilation © New Phytologist (2006) www.newphytologist.org New Phytologist (2006) 170: 819–834
Research 825
shown in the four oak species (test of Homogeneity of slopesmodel, P > 0.05 for all cases; data not shown). In many cases,correlations between leaf traits differed depending on the watertreatment (44% of bivariate relationships were different, Table 4).Amass and Rmass were significantly correlated in both droughtand watered conditions (Table 4). Amass was also correlatedwith gsarea, under drought and water treatments (Fig. 4d).
In some cases, leaf structural traits can be used as predictorsof physiological performance. Nmass was a good predictor ofgsarea; but only for drought-affected seedlings (Fig. 4c). Thespecific leaf area (SLA) was a good predictor for several phys-iological activities. Seedlings of higher SLA tended to havehigher photosynthetic rate (Fig. 4B), higher Nmass (Fig. 4a), andlower LCP and LSP (Table 4). The instantaneous water-useefficiency (WUE) was negatively correlated with the instanta-neous photosynthetic N-use efficiency (PNUE) for wateredseedlings, but not when affected by drought (Table 4). TheSLA of drought-affected seedlings (unlike watered ones) wassignificantly correlated with PNUE. The WUE was notcorrelated with SLA for either of the water treatments.
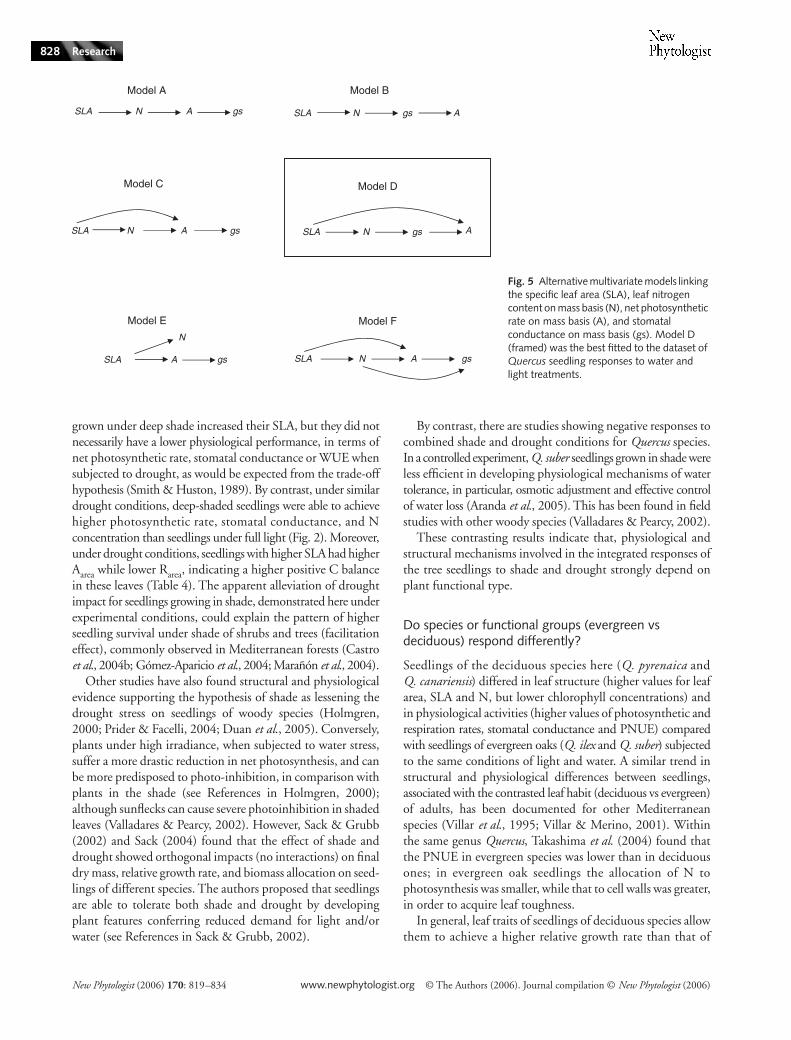
The results of the multivariate analyses (d-sep test) of causalmodels linking leaf traits (SLA and Nmass) and physiologicalfunctions (Amass and gsmass) are shown in Table 5 and Fig. 5.Model D was accepted by the whole dataset and most of thedifferent light and water treatments. According to this model,the variation in SLA affects Amass and Nmass, and this traitdetermines gsmass, which also affects photosynthetic rate. ModelF, which best fitted the datasets in the study by Meziane &Shipley (2001), was also accepted by most datasets in thisexperiment but did not fit the data of LI, and hence it wasrejected for the combined dataset (Table 5).
Discussion
Are the impacts of shade and drought on seedlings, positive, negative or independent?
Most leaf traits showed strong interactions in their responsesto light and water treatments (Table 3; Fig. 2), and hence theirvariation was not independent. We did find that oak seedlings
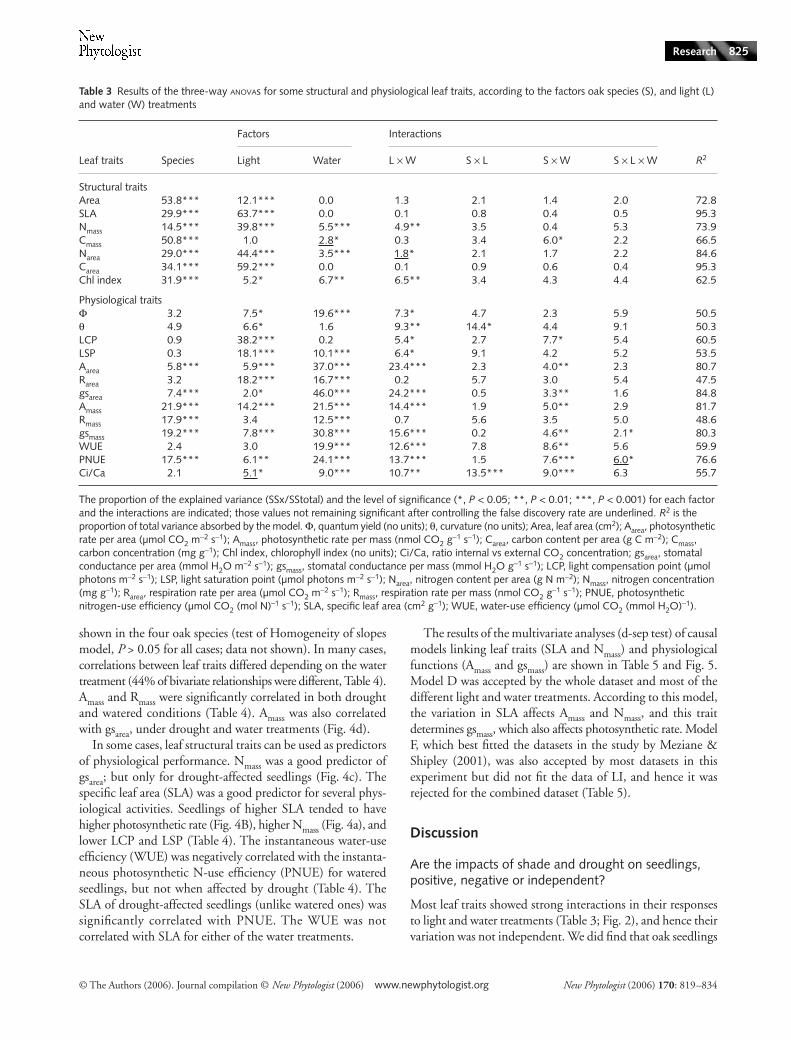
Table 3 Results of the three-way ANOVAs for some structural and physiological leaf traits, according to the factors oak species (S), and light (L) and water (W) treatments
Leaf traits Species
Factors Interactions
R2Light Water L × W S × L S × W S × L × W
Structural traitsArea 53.8*** 12.1*** 0.0 1.3 2.1 1.4 2.0 72.8SLA 29.9*** 63.7*** 0.0 0.1 0.8 0.4 0.5 95.3Nmass 14.5*** 39.8*** 5.5*** 4.9** 3.5 0.4 5.3 73.9Cmass 50.8*** 1.0 2.8* 0.3 3.4 6.0* 2.2 66.5Narea 29.0*** 44.4*** 3.5*** 1.8* 2.1 1.7 2.2 84.6Carea 34.1*** 59.2*** 0.0 0.1 0.9 0.6 0.4 95.3Chl index 31.9*** 5.2* 6.7** 6.5** 3.4 4.3 4.4 62.5
Physiological traitsΦ 3.2 7.5* 19.6*** 7.3* 4.7 2.3 5.9 50.5θ 4.9 6.6* 1.6 9.3** 14.4* 4.4 9.1 50.3LCP 0.9 38.2*** 0.2 5.4* 2.7 7.7* 5.4 60.5LSP 0.3 18.1*** 10.1*** 6.4* 9.1 4.2 5.2 53.5Aarea 5.8*** 5.9*** 37.0*** 23.4*** 2.3 4.0** 2.3 80.7Rarea 3.2 18.2*** 16.7*** 0.2 5.7 3.0 5.4 47.5gsarea 7.4*** 2.0* 46.0*** 24.2*** 0.5 3.3** 1.6 84.8Amass 21.9*** 14.2*** 21.5*** 14.4*** 1.9 5.0** 2.9 81.7Rmass 17.9*** 3.4 12.5*** 0.7 5.6 3.5 5.0 48.6gsmass 19.2*** 7.8*** 30.8*** 15.6*** 0.2 4.6** 2.1* 80.3WUE 2.4 3.0 19.9*** 12.6*** 7.8 8.6** 5.6 59.9PNUE 17.5*** 6.1** 24.1*** 13.7*** 1.5 7.6*** 6.0* 76.6Ci/Ca 2.1 5.1* 9.0*** 10.7** 13.5*** 9.0*** 6.3 55.7
The proportion of the explained variance (SSx/SStotal) and the level of significance (*, P < 0.05; **, P < 0.01; ***, P < 0.001) for each factor and the interactions are indicated; those values not remaining significant after controlling the false discovery rate are underlined. R2 is the proportion of total variance absorbed by the model. Φ, quantum yield (no units); θ, curvature (no units); Area, leaf area (cm2); Aarea, photosynthetic rate per area (µmol CO2 m
−2 s−1); Amass, photosynthetic rate per mass (nmol CO2 g−1 s−1); Carea, carbon content per area (g C m−2); Cmass,
carbon concentration (mg g−1); Chl index, chlorophyll index (no units); Ci/Ca, ratio internal vs external CO2 concentration; gsarea, stomatal conductance per area (mmol H2O m−2 s−1); gsmass, stomatal conductance per mass (mmol H2O g−1 s−1); LCP, light compensation point (µmol photons m−2 s−1); LSP, light saturation point (µmol photons m−2 s−1); Narea, nitrogen content per area (g N m−2); Nmass, nitrogen concentration (mg g−1); Rarea, respiration rate per area (µmol CO2 m
−2 s−1); Rmass, respiration rate per mass (nmol CO2 g−1 s−1); PNUE, photosynthetic
nitrogen-use efficiency (µmol CO2 (mol N)–1 s−1); SLA, specific leaf area (cm2 g−1); WUE, water-use efficiency (µmol CO2 (mmol H2O)−1).
New Phytologist (2006) 170: 819–834 www.newphytologist.org © The Authors (2006). Journal compilation © New Phytologist (2006)
Research826
Fig. 3 Bivariate diagram of the comparative response to light (Responselight) vs the response to water (Responsewater), for physiological and structural leaf traits, averaged for the four oak species. Response was calculated as (maximum value − minimum value/maximum value). Φ, quantum yield (no units); θ, curvature (no units); Area, leaf area (cm2); Aarea, photosynthetic rate per area (µmol CO2 m
−2 s−1); Amass, photosynthetic rate per mass (nmol CO2 g
−1 s−1); Carea, carbon content per area (g C m−2); Cmass, carbon concentration (mg g−1); Chl index, chlorophyll index (no units); Ci/Ca, ratio internal vs external CO2 concentration; gsarea, stomatal conductance per area (mmol H2O m−2 s−1); gsmass, stomatal conductance per mass (mmol H2O g−1 s−1); LCP, light compensation point (µmol photons m−2 s−1); LSP, light saturation point (µmol photons m−2 s−1); Narea, nitrogen content per area (g N m−2); Nmass, nitrogen concentration (mg g−1); Rarea, respiration rate per area (µmol CO2 m
−2 s−1); Rmass, respiration rate per mass (nmol CO2 g−1 s−1); PNUE, photosynthetic nitrogen-use efficiency (µmol CO2 (mol N)–1 s−1); SLA,
specific leaf area (cm2 g−1); WUE, water-use efficiency (µmol CO2 (mmol H2O)−1).
Table 4 Pearson’s correlation coefficients for some structural and physiological traits. Bold and normal letters represent high- (HW) and low- (LW) water treatments, respectively
Amass gsmass PNUE Rmass Cmass Nmass SLA WUE LSP
LCP HW −0.16 −0.05 −0.07 0.61*** −0.02 −0.18 −0.53** –0.36* 0.59***LW −0.76*** −0.75*** −0.75*** 0.05 0.24 −0.56*** −0.61*** 0.07 0.30
LSP HW 0.18 0.38* 0.36* 0.41** −0.15 –0.33* –0.49** −0.41*LW −0.28 −0.17 −0.30* −0.15 0.20 −0.11 −0.31* −0.30
WUE HW −0.15 −0.62*** −0.28 −0.19 0.16 0.22 0.28LW −0.09 −0.27 −0.03 −0.22 −0.17 −0.26 −0.12
SLA HW 0.46** 0.24 0.14 0.26 −0.40* 0.71***LW 0.74*** 0.74*** 0.66*** 0.56*** −0.43** 0.80***
Nmass HW 0.36* 0.15 −0.11 0.34* −0.21LW 0.74*** 0.78*** 0.61*** 0.49** −0.25
Cmass HW −0.57*** −0.57*** −0.51** –0.35*LW −0.43** −0.39* −0.44** −0.30
Rmass HW 0.38* 0.42** 0.25LW 0.45** 0.43** 0.40**
PNUE HW 0.89*** 0.83***LW 0.98*** 0.94***
gsmass HW 0.85***LW 0.97***
The level of significance (*, P < 0.05; **, P < 0.01; ***, P < 0.001) is indicated; those values not remaining significant after controlling the false discovery rate are underlined. Cmass, carbon concentration (mg g−1); gsmass, stomatal conductance per mass (mmol H2O g−1 s−1); LCP, light compensation point (µmol photons m–2 s−1); LSP, light saturation point (µmol photons m–2 s−1); Nmass, nitrogen concentration (mg g−1); Rarea, respiration rate per area (µmol CO2 m
–2 s−1); PNUE, photosynthetic nitrogen-use efficiency (µmol CO2 (mol N)–1 s−1); SLA, specific leaf area (cm2 g−1); WUE, water-use efficiency (µmol CO2 (mmol H2O)−1).

© The Authors (2006). Journal compilation © New Phytologist (2006) www.newphytologist.org New Phytologist (2006) 170: 819–834
Research 827
Fig. 4 Correlations between leaf traits. (a) Nitrogen concentration (Nmass) and (b) photosynthetic rate on mass basis (Amass) vs specific leaf area (SLA); (c) stomatal conductance on area basis (gsarea) vs Nmass; (d) Amass vs gsarea. Circles, Quercus ilex ssp. ballota; diamonds, Q. canariensis; squares, Q. suber; triangles, Q. pyrenaica. Values for seedlings grown under high-water conditions (closed symbols) are distinguished from those grown under low-water conditions (open symbols).
Table 5 Probabilities under the null hypothesis that the data accord with each of the six proposed models, for each of the treatment conditions and combinations using the d-sep method
Treatment
Model type
A B C D E F
HI HW 0.02258 0.01406 0.66464 0.01595 0.81801 0.36896HI LW 0.66877 0.41394 0.74490 0.48724 0.07526 0.50847MI HW 0.46033 0.52570 0.79599 0.34195 0.72478 0.67319MI LW 0.45570 0.45980 0.57111 0.66589 0.64803 0.32076LI HW 0.00745 0.01084 0.09345 0.23975 0.16812 0.11715LI LW 0.01414 0.00251 0.07707 0.42238 0.06243 0.02955HI 0.78200 0.14879 0.98447 0.11576 0.00618 0.95464MI 0.48803 0.47054 0.26774 0.93449 0.01079 0.13347LI 0.00001 0.00000 0.00623 0.02383 0.01079 0.01376HW 0.14121 0.05122 0.07750 0.6833 0.08963 0.19061LW 0.02473 0.00759 0.52332 0.10452 0.01823 0.39736HI + MI 0.44674 0.09157 0.46729 0.35493 0.00001 0.22299Combined 0.00044 0.00000 0.00017 0.17411 0.00000 0.00356
HI, high irradiance; MI, medium irradiance; LI, low irradiance or deep shade; HW, high water; LW, nonwatered (drought). Models that would be rejected at the 5% level on a per-test basis are shown in bold type. However those whose values remained significant after controlling the False Discovery Rate (FDR) at the 5% level, following the Ventura et al. (2004) criteria, are underlined.
New Phytologist (2006) 170: 819–834 www.newphytologist.org © The Authors (2006). Journal compilation © New Phytologist (2006)
Research828
grown under deep shade increased their SLA, but they did notnecessarily have a lower physiological performance, in terms ofnet photosynthetic rate, stomatal conductance or WUE whensubjected to drought, as would be expected from the trade-offhypothesis (Smith & Huston, 1989). By contrast, under similardrought conditions, deep-shaded seedlings were able to achievehigher photosynthetic rate, stomatal conductance, and Nconcentration than seedlings under full light (Fig. 2). Moreover,under drought conditions, seedlings with higher SLA had higherAarea while lower Rarea, indicating a higher positive C balancein these leaves (Table 4). The apparent alleviation of droughtimpact for seedlings growing in shade, demonstrated here underexperimental conditions, could explain the pattern of higherseedling survival under shade of shrubs and trees (facilitationeffect), commonly observed in Mediterranean forests (Castroet al., 2004b; Gómez-Aparicio et al., 2004; Marañón et al., 2004).
Other studies have also found structural and physiologicalevidence supporting the hypothesis of shade as lessening thedrought stress on seedlings of woody species (Holmgren,2000; Prider & Facelli, 2004; Duan et al., 2005). Conversely,plants under high irradiance, when subjected to water stress,suffer a more drastic reduction in net photosynthesis, and canbe more predisposed to photo-inhibition, in comparison withplants in the shade (see References in Holmgren, 2000);although sunflecks can cause severe photoinhibition in shadedleaves (Valladares & Pearcy, 2002). However, Sack & Grubb(2002) and Sack (2004) found that the effect of shade anddrought showed orthogonal impacts (no interactions) on finaldry mass, relative growth rate, and biomass allocation on seed-lings of different species. The authors proposed that seedlingsare able to tolerate both shade and drought by developingplant features conferring reduced demand for light and/orwater (see References in Sack & Grubb, 2002).
By contrast, there are studies showing negative responses tocombined shade and drought conditions for Quercus species.In a controlled experiment, Q. suber seedlings grown in shade wereless efficient in developing physiological mechanisms of watertolerance, in particular, osmotic adjustment and effective controlof water loss (Aranda et al., 2005). This has been found in fieldstudies with other woody species (Valladares & Pearcy, 2002).
These contrasting results indicate that, physiological andstructural mechanisms involved in the integrated responses ofthe tree seedlings to shade and drought strongly depend onplant functional type.
Do species or functional groups (evergreen vs deciduous) respond differently?
Seedlings of the deciduous species here (Q. pyrenaica andQ. canariensis) differed in leaf structure (higher values for leafarea, SLA and N, but lower chlorophyll concentrations) andin physiological activities (higher values of photosynthetic andrespiration rates, stomatal conductance and PNUE) comparedwith seedlings of evergreen oaks (Q. ilex and Q. suber) subjectedto the same conditions of light and water. A similar trend instructural and physiological differences between seedlings,associated with the contrasted leaf habit (deciduous vs evergreen)of adults, has been documented for other Mediterraneanspecies (Villar et al., 1995; Villar & Merino, 2001). Withinthe same genus Quercus, Takashima et al. (2004) found thatthe PNUE in evergreen species was lower than in deciduousones; in evergreen oak seedlings the allocation of N tophotosynthesis was smaller, while that to cell walls was greater,in order to acquire leaf toughness.
In general, leaf traits of seedlings of deciduous species allowthem to achieve a higher relative growth rate than that of
Fig. 5 Alternative multivariate models linking the specific leaf area (SLA), leaf nitrogen content on mass basis (N), net photosynthetic rate on mass basis (A), and stomatal conductance on mass basis (gs). Model D (framed) was the best fitted to the dataset of Quercus seedling responses to water and light treatments.
© The Authors (2006). Journal compilation © New Phytologist (2006) www.newphytologist.org New Phytologist (2006) 170: 819–834
Research 829
seedlings of congeneric, evergreen species (Antunez et al., 2001;Ruiz-Robleto & Villar, 2005).
Which physiological and structural leaf traits are most affected by the combined stress?
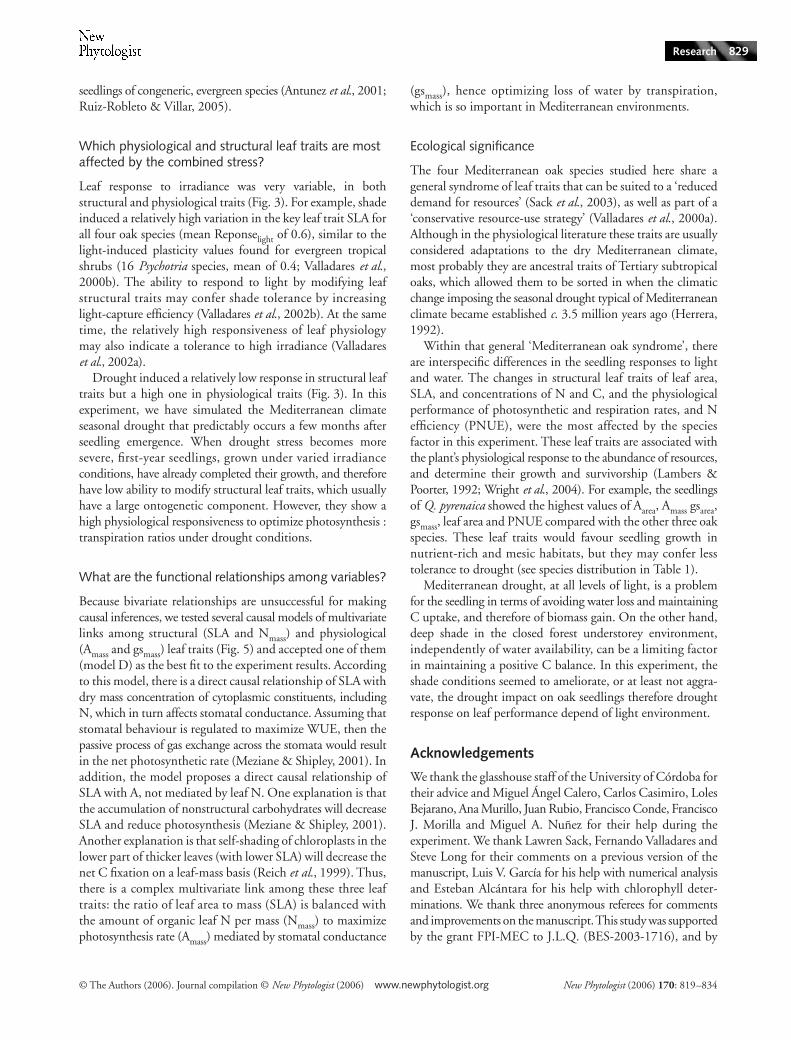
Leaf response to irradiance was very variable, in bothstructural and physiological traits (Fig. 3). For example, shadeinduced a relatively high variation in the key leaf trait SLA forall four oak species (mean Reponselight of 0.6), similar to thelight-induced plasticity values found for evergreen tropicalshrubs (16 Psychotria species, mean of 0.4; Valladares et al.,2000b). The ability to respond to light by modifying leafstructural traits may confer shade tolerance by increasinglight-capture efficiency (Valladares et al., 2002b). At the sametime, the relatively high responsiveness of leaf physiologymay also indicate a tolerance to high irradiance (Valladareset al., 2002a).
Drought induced a relatively low response in structural leaftraits but a high one in physiological traits (Fig. 3). In thisexperiment, we have simulated the Mediterranean climateseasonal drought that predictably occurs a few months afterseedling emergence. When drought stress becomes moresevere, first-year seedlings, grown under varied irradianceconditions, have already completed their growth, and thereforehave low ability to modify structural leaf traits, which usuallyhave a large ontogenetic component. However, they show ahigh physiological responsiveness to optimize photosynthesis :transpiration ratios under drought conditions.
What are the functional relationships among variables?
Because bivariate relationships are unsuccessful for makingcausal inferences, we tested several causal models of multivariatelinks among structural (SLA and Nmass) and physiological(Amass and gsmass) leaf traits (Fig. 5) and accepted one of them(model D) as the best fit to the experiment results. Accordingto this model, there is a direct causal relationship of SLA withdry mass concentration of cytoplasmic constituents, includingN, which in turn affects stomatal conductance. Assuming thatstomatal behaviour is regulated to maximize WUE, then thepassive process of gas exchange across the stomata would resultin the net photosynthetic rate (Meziane & Shipley, 2001). Inaddition, the model proposes a direct causal relationship ofSLA with A, not mediated by leaf N. One explanation is thatthe accumulation of nonstructural carbohydrates will decreaseSLA and reduce photosynthesis (Meziane & Shipley, 2001).Another explanation is that self-shading of chloroplasts in thelower part of thicker leaves (with lower SLA) will decrease thenet C fixation on a leaf-mass basis (Reich et al., 1999). Thus,there is a complex multivariate link among these three leaftraits: the ratio of leaf area to mass (SLA) is balanced withthe amount of organic leaf N per mass (Nmass) to maximizephotosynthesis rate (Amass) mediated by stomatal conductance
(gsmass), hence optimizing loss of water by transpiration,which is so important in Mediterranean environments.
Ecological significance
The four Mediterranean oak species studied here share ageneral syndrome of leaf traits that can be suited to a ‘reduceddemand for resources’ (Sack et al., 2003), as well as part of a‘conservative resource-use strategy’ (Valladares et al., 2000a).Although in the physiological literature these traits are usuallyconsidered adaptations to the dry Mediterranean climate,most probably they are ancestral traits of Tertiary subtropicaloaks, which allowed them to be sorted in when the climaticchange imposing the seasonal drought typical of Mediterraneanclimate became established c. 3.5 million years ago (Herrera,1992).
Within that general ‘Mediterranean oak syndrome’, thereare interspecific differences in the seedling responses to lightand water. The changes in structural leaf traits of leaf area,SLA, and concentrations of N and C, and the physiologicalperformance of photosynthetic and respiration rates, and Nefficiency (PNUE), were the most affected by the speciesfactor in this experiment. These leaf traits are associated withthe plant’s physiological response to the abundance of resources,and determine their growth and survivorship (Lambers &Poorter, 1992; Wright et al., 2004). For example, the seedlingsof Q. pyrenaica showed the highest values of Aarea, Amass gsarea,gsmass, leaf area and PNUE compared with the other three oakspecies. These leaf traits would favour seedling growth innutrient-rich and mesic habitats, but they may confer lesstolerance to drought (see species distribution in Table 1).
Mediterranean drought, at all levels of light, is a problemfor the seedling in terms of avoiding water loss and maintainingC uptake, and therefore of biomass gain. On the other hand,deep shade in the closed forest understorey environment,independently of water availability, can be a limiting factorin maintaining a positive C balance. In this experiment, theshade conditions seemed to ameliorate, or at least not aggra-vate, the drought impact on oak seedlings therefore droughtresponse on leaf performance depend of light environment.
Acknowledgements
We thank the glasshouse staff of the University of Córdoba fortheir advice and Miguel Ángel Calero, Carlos Casimiro, LolesBejarano, Ana Murillo, Juan Rubio, Francisco Conde, FranciscoJ. Morilla and Miguel A. Nuñez for their help during theexperiment. We thank Lawren Sack, Fernando Valladares andSteve Long for their comments on a previous version of themanuscript, Luis V. García for his help with numerical analysisand Esteban Alcántara for his help with chlorophyll deter-minations. We thank three anonymous referees for commentsand improvements on the manuscript. This study was supportedby the grant FPI-MEC to J.L.Q. (BES-2003-1716), and by

New Phytologist (2006) 170: 819–834 www.newphytologist.org © The Authors (2006). Journal compilation © New Phytologist (2006)
Research830
the coordinated Spanish CICYT project HETEROMED(REN2002-04041). This research is part of the REDBOMEnetwork on forest ecology (http://www.ugr.es/∼redbome/).
References
Abrams MD, Mostoller SA. 1995. Gas exchange, leaf structure and nitrogen in contrasting successional tree species growing in open and understory sites during a drought. Tree Physiology 15: 361–370.
Amaral J. 1990. Quercus. In: Castroviejo S, Laínz M, López González G, Montserrat P, Muñoz Garmendia F, Paiva J, Villar L, eds. Flora Iberica, Vol. II. Madrid, Spain: Real Jardín Botánico, CSIC, 15–36.
Antunez I, Retamosa EC, Villar R. 2001. Relative growth rate in phylogenetically related deciduous and evergreen woody species. Oecologia 128: 172–180.
Aranda I, Castro L, Pardos M, Gil L, Pardos JA. 2005. Effects of the interaction between drought and shade on water relations, gas exchange and morphological traits in cork oak Quercus suber L. seedlings. Forest Ecology and Management 210: 117–129.
Canham CD, Berkowitz AR, Kelly VR, Lovett GM, Ollinger SV, Schnurr J. 1996. Biomass allocation and multiple resource limitation in tree seedlings. Canadian Journal of Forest Research 26: 1521–1530.
Castro J, Zamora R, Hódar JA, Gómez JM, Gómez-Aparicio L. 2004a. Benefits of using shrubs as nurse plants for reforestation in Mediterranean mountains: a 4-year study. Restoration Ecology 12: 352–358.
Castro J, Zamora R, Hódar JA, Gómez JM. 2004b. Seedling establishment of a boreal tree species Pinus sylvestris at its southernmost distribution limit: consequences of being in a marginal, Mediterranean habitat. Journal of Ecology 92: 266–277.
Cavender-Bares J, Bazzaz FA. 2000. Changes in drought response strategies with ontogeny in Quercus rubra: implications for scaling from seedlings to mature trees. Oecologia 124: 8–18.
Duan B, Lu Y, Yin C, Junttila O, Li C. 2005. Physiological responses to drought and shade in two contrasting Picea asperata populations. Physiologia Plantarum 124: 476–484.
Field C, Mooney HA. 1986. The photosynthesis–nitrogen relationship in wild plants. In: Givinish TJ, ed. On the economy of plant form and function. Cambridge, UK: Cambridge University Press, 25–55.
García LV. 2004. Escaping the Bonferroni iron claw in ecological studies. Oikos 105: 657–663.
Gómez-Aparicio L, Zamora R, Gómez JM, Hódar JA, Castro J, Baraza E. 2004. Applying plant facilitation to forest restoration in Mediterranean ecosystems: a meta-analysis of the use of shrubs as nurse plants. Ecological Applications 14: 1128–1138.
Gómez-Aparicio L, Valladares F, Zamora R, Quero JL. 2005. Response of tree seedlings to the abiotic heterogeneity generated by nurse shrubs: an experimental approach at different scales. Ecography 28: 757–768.
Herrera CM. 1992. Historical effects and sorting processes as explanations for contemporary ecological patterns: character syndromes in Mediterranean woody plants. American Naturalist 140: 421–446.
Holmgren M. 2000. Combined effects of shade and drought on tulip poplar seedlings: trade-off in tolerance or facilitation? Oikos 90: 67–78.
Kubiske ME, Pregitzer KS. 1996. Effects of elevated CO2 and light availability on the photosynthetic response of trees of contrasting shade tolerance. Tree Physiology 16: 351–358.
Lambers H, Poorter H. 1992. Inherent variation in growth rate between higher plants: a search for physiological causes and ecological consequences. Advances in Ecological Research 23: 187–261.
Marañón T, Zamora R, Villar R, Zavala MA, Quero JL, Pérez-Ramos I, Mendoza I, Castro J. 2004. Regeneration of tree species and restoration under contrasted Mediterranean habitats: field and glasshouse
experiments. International Journal of Ecology and Environmental Sciences 30: 187–196.
Meziane D, Shipley B. 2001. Direct and indirect relation between specific leaf area, leaf nitrogen and leaf gas exchange effects of irradiance and nutrient supply. Annals of Botany 88: 915–917.
Prider JN, Facelli JM. 2004. Interactive effects of drought and shade on three arid zone chenopod shrubs with contrasting distributions in relation to tree canopies. Functional Ecology. 18: 67–76.
Reich PB, Ellsworth DS, Walters MB, Vose JM, Gresham C, Volin JC, Bowman WD. 1999. Generality of leaf trait relationships: a test across six biomes. Ecology 80: 1955–1969.
Reich PB, Walters MB, Ellsworth DS. 1992. Leaf lifespan in relation to leaf, plant and stand characteristics among diverse ecosystems. Ecological Monographs 62: 365–392.
Reich PB, Walters MB, Ellsworth DS. 1997. From tropics to tundra: global convergence in plant functioning. Proceedings of the National Academy of Sciences, USA 94: 13730–13734.
Rey-Benayas JM, Navarro J, Espigares T, Nicolau JM, Zavala MA. 2005. Effects of artificial shading and weed mowing in reforestation of Mediterranean abandoned cropland with contrasting Quercus species. Forest Ecology and Management 212: 302–314.
Ruiz-Robleto J, Villar R. 2005. Relative growth rate and biomass allocation in 10 woody species with different leaf longevity using phylogenetic independent contrasts PICs. Plant Biology 7: 484–494.
Sack L. 2004. Responses of temperate woody seedlings to shade and drought: do trade-offs limit potential niche differentiation? Oikos 107: 110–127.
Sack L, Grubb PJ. 2002. The combined impacts of deep shade and drought on the growth and biomass allocation of shade-tolerant woody seedlings. Oecologia 131: 175–185.
Sack L, Grubb PJ, Marañón T. 2003. The functional morphology of juvenile plants tolerant of strong summer drought in shaded forest understories in southern Spain. Plant Ecology 168: 139–163.
Shipley B. 2000. A new inferential test for path models based on directed acyclic graphs. Structural Equation Modelling 7: 206–218.
Smith T, Huston M. 1989. A theory of the spatial and temporal dynamics of plant communities. Vegetatio 83: 49–69.
Takashima T, Hikosaka K, Hirose T. 2004. Photosynthesis or persistence: nitrogen allocation in leaves of evergreen and deciduous Quercus species. Plant, Cell & Environment 27: 1047–1054.
Thornley JHM. 1976. Mathematical models in plant physiology. New York, NY, USA: Academic Press.
Urbieta IR, Zavala MA, Marañón T. 2004. Distribución y abundancia de alcornoque Quercus suber L. y quejigo Quercus canariensis Willd. y su relación con factores ambientales en la provincia de Cádiz. Revista de la Sociedad Gaditana de Historia Natural 4: 183–189.
Valladares F, Pearcy RW. 2002. Drought can be more critical in the shade than in the sun: a field study of carbon gain and photo-inhibition in a Californian shrub during a dry El Niño year. Plant, Cell & Environment 25: 749–759.
Valladares F, Martínez-Ferri E, Balaguer L, Pérez-Corona E, Manrique E. 2000a. Low leaf-level response to light and nutrients in Mediterranean evergreen oaks: a conservative resource-use strategy? New Phytologist 148: 79–91.
Valladares F, Wright SJW, Lasso E, Kitajima K, Pearcy RW. 2000b. Plastic phenotypic response to light of 16 congeneric shrubs from a Panamanian rainforest. Ecology 81: 1925–1936.
Valladares F, Chico JM, Aranda I, Balaguer L, Dizengremel P, Manrique E, Dreyer E. 2002a. The greater seedling high-light tolerance of Quercus robur and over Fagus sylvatica is linked to a greater physiological plasticity. Trees, Structure and Function 16: 395–403.
Valladares F, Skillman J, Pearcy RW. 2002b. Convergence in light capture efficiencies among tropical forest understory plants with contrasting crown architectures: a case of morphological compensation. American Journal of Botany 89: 1275–1284.

© The Authors (2006). Journal compilation © New Phytologist (2006) www.newphytologist.org New Phytologist (2006) 170: 819–834
Research 831
Ventura V, Paciorek CJ, Risbey JS. 2004. Controlling the proportion of falsely rejected hypotheses when conducting multiple tests with climatological data. Journal of Climate 17: 4343–4356.
Villar R, Held AA, Merino J. 1995. Dark leaf respiration in light and darkness of an evergreen and a deciduous plant-species. Plant Physiology 107: 421–427.
Villar R, Merino J. 2001. Comparison of leaf construction costs in woody species with differing leaf life-spans in contrasting ecosystems. New Phytologist 151: 213–226.
Wright IJ, Reich PB, Westoby M, Ackerly DD, Baruch Z, Bongers F, Cavender-Bares J, Chapin T, Cornelissen JHC, Diemer M, Flexas J, Garnier E, Groom PK, Gulias J, Hikosaka K, Lamont BB, Lee T, Lee W, Lusk C, Midgley JJ, Navas ML, Niinemets U, Oleksyn J, Osada N, Poorter H, Poot P, Prior L, Pyankov VI, Roumet C, Thomas SC, Tjoelker MG, Veneklaas EJ, Villar R. 2004. The worldwide leaf economics spectrum. Nature 428: 821–827.
Zar JH. 1984. Biostatistical analysis, 2nd edn. Englewood Cliffs, NJ, USA: Prentice Hall.
New Phytologist (2006) 170: 819–834 www.newphytologist.org © The Authors (2006). Journal compilation © New Phytologist (2006)
Research832
Appendix 1 Mean ± SE values of structural and physiological leaf traits analysed for Quercus seedlings in different light and water treatments.In general, there were four replicates per treatments, exceptions are indicated in parentheses
Trait
HI MI LI
LW HW LW HW (n = 3) LW HW
Quercus suber (evergreen)
Structural traitsArea 9.2 ± 0.6 10.8 ± 0.6 12.6 ± 0.6 12.1 ± 0.8 8.3 ± 0.5 9.9 ± 0.8SLA 90.32 ± 6.61 101.62 ± 3.38 137.59 ± 3.17 131.01 ± 5.71 246.85 ± 6.84 259.54 ± 4.81Nmass 15.66 ± 1.09 17.21 ± 0.88 15.68 ± 0.67 16.54 ± 0.54 22.13 ± 1.05 26.34 ± 1.92Cmass 480.3 ± 4.2 446.1 ± 5.7 468.9 ± 4.4 455.9 ± 6.7 470.1 ± 3.3 456.7 ± 13.1Narea 1.77 ± 0.19 1.71 ± 0.13 1.15 ± 0.06 1.27 ± 0.06 0.90 ± 0.04 1.02 ± 0.08Carea 5.52 ± 0.58 4.40 ± 0.11 3.43 ± 0.12 3.50 ± 0.11 1.91 ± 0.06 1.76 ± 0.06Chl index 19.2 ± 2.1 26.5 ± 2.9 24.4 ± 0.5 29.1 ± 1.8 24.4 ± 1.9 29.4 ± 2.5
Physiological traitsΦ 0.0274 ± 0.0118 0.0470 ± 0.0029 0.0312 ± 0.009 0.0531 ± 0.003 0.0438 ± 0.0044 0.0450 ± 0.004θ 0.545 ± 0.273 0.931 ± 0.023 0.766 ± 0.124 0.727 ± 0.107 0.927 ± 0.034 0.827 ± 0.089LCP 45.2 ± 1.2 15.1 ± 3.7 27.0 ± 8.0 13.4 ± 1.5 6.5 ± 1.3 10.0 ± 1.7LSP 735.0 ± 155.8 395.2 ± 74.4 337.2 ± 100.4 517.3 ± 129.3 155.1 ± 27.1 227.7 ± 74.0Aarea 0.94 ± 0.25 12.72 ± 0.97 1.08 ± 0.32 10.5 ± 1.80 4.48 ± 0.40 4.29 ± 0.51Rarea 0.56 ± 0.10 0.73 ± 0.19 0.37 ± 0.06 0.69 ± 0.06 0.26 ± 0.04 0.42 ± 0.05gsarea 14.3 ± 4.3 166.0 ± 29.4 11.4 ± 2.3 179.7 ± 20.9 51.6 ± 11.9 56.1 ± 19.6Amass 6.9 ± 1.5 126.8 ± 9.2 14.8 ± 4.2 115.7 ± 13.7 111.1 ± 11.4 121.6 ± 23.7Rmass 4.6 ± 1.1 7.7 ± 2.2 5.1 ± 0.9 8.5 ± 0.6 6.6 ± 1.1 10.7 ± 1.0gsmass 0.10 ± 0.02 1.78 ± 0.42 0.16 ± 0.03 2.07 ± 0.15 1.28 ± 0.31 1.72 ± 0.78WUE 76.6 ± 8.2 80.1 ± 7.0 10.6 ± 2.3 57.8 ± 7.0 96.5 ± 11.8 93.7 ± 13.9PNUE 5.97 ± 1.26 104.68 ± 13.04 13.58 ± 4.20 98.72 ± 13.87 70.89 ± 5.52 67.50 ± 17.00Ci/Ca 0.62 ± 0.03 0.52 ± 0.02 0.49 ± 0.01 0.63 ± 0.04 0.51 ± 0.05 0.53 ± 0.05
Trait
HI MI LI
LW (n = 3) HW LW HW LW HW
Quercus ilex ssp. ballota (evergreen)
Structural traitsArea 7.9 ± 0.8 8.4 ± 0.3 8.6 ± 0.9 8.0 ± 0.3 7.3 ± 1.1 5.5 ± 0.4SLA 61.00 ± 1.27 64.64 ± 8.98 91.68 ± 5.01 86.91 ± 1.35 142.74 ± 6.64 166.74 ± 8.86Nmass 13.65 ± 1.31 16.57 ± 0.33 15.68 ± 1.25 15.74 ± 1.58 23.31 ± 0.42 23.60 ± 2.04Cmass 481.8 ± 1.9 473.8 ± 5.5 477.6 ± 2.1 469.6 ± 5.3 460.4 ± 3.4 462.8 ± 5.3Narea 2.27 ± 0.24 2.72 ± 0.35 1.71 ± 0.11 1.82 ± 0.19 1.65 ± 0.08 1.45 ± 0.13Carea 7.98 ± 0.16 7.88 ± 1.13 5.26 ± 0.29 5.42 ± 0.07 3.25 ± 0.17 2.84 ± 0.17Chl index 35.6 ± 3.0 34.5 ± 2.7 32.2 ± 1.9 36.2 ± 4.2 39.7 ± 3.8 32.5 ± 2.6
Physiological traitsΦ 0.0163 ± 0.0051 0.0470 ± 0.0081 0.0413 ± 0.0033 0.0524 ± 0.0054 0.0502 ± 0.0025 0.0404 ± 0.0018θ 0.805 ± 0.157 0.892 ± 0.065 0.906 ± 0.053 0.874 ± 0.053 0.801 ± 0.049 0.896 ± 0.025LCP 24.3 ± 1.90 27.2 ± 2.9 19.0 ± 4.5 15.1 ± 4.1 6.4 ± 1.2 14.6 ± 4.0LSP 325.0 ± 65.1 508.0 ± 122.0 158.8 ± 41.4 497.3 ± 99.0 294.7 ± 36.2 233.3 ± 33Aarea 1.98 ± 0.25 9.39 ± 1.50 3.56 ± 1.33 9.23 ± 1.15 6.10 ± 0.65 4.43 ± 0.27Rarea 0.46 ± 0.18 1.20 ± 0.26 0.76 ± 0.17 0.79 ± 0.19 0.31 ± 0.05 0.57 ± 0.15gsarea 25.7 ± 4.3 170.1 ± 12.3 38.4 ± 15.5 152.2 ± 8.4 85.8 ± 8.8 61.8 ± 13.5Amass 12.7 ± 1.9 59.4 ± 9.2 30.7 ± 10.4 80.5 ± 10.7 87.5 ± 11.2 81.0 ± 16.2Rmass 2.9 ± 1.2 8.1 ± 2.8 7.1 ± 1.9 6.8 ± 1.6 4.5 ± 0.7 8.9 ± 2.6gsmass 0.16 ± 0.03 1.03 ± 0.15 0.33 ± 0.12 1.3 ± 0.08 1.22 ± 0.14 1.19 ± 0.33WUE 86.8 ± 18.1 58.2 ± 10.0 89.6 ± 7.7 67.1 ± 3.9 71.9 ± 4.6 83.7 ± 14.0PNUE 14.01 ± 3.55 49.63 ± 6.80 28.83 ± 10.71 74.49 ± 13.75 52.70 ± 6.62 47.53 ± 8.7Ci/Ca 0.56 ± 0.08 0.64 ± 0.05 0.54 ± 0.04 0.60 ± 0.02 0.60 ± 0.02 0.56 ± 0.06
© The Authors (2006). Journal compilation © New Phytologist (2006) www.newphytologist.org New Phytologist (2006) 170: 819–834
Research 833
Trait
HI MI LI
LW (n = 3) HW (n = 3) LW HW (n = 3) LW (n = 3) HW
Quercus canariensis (deciduous)
Structural traitsArea 11.2 ± 0.6 9.5 ± 0.8 12.6 ± 1.8 13.6 ± 5.4 11.7 ± 0.5 9.1 ± 1.2SLA 127.81 ± 13.07 111.57 ± 11.98 154.83 ± 9.98 145.76 ± 5.69 339.72 ± 23.48 281.32 ± 8.23Nmass 16.57 ± 3.37 25.26 ± 4.95 18.38 ± 1.90 21.91 ± 1.56 29.08 ± 3.92 24.60 ± 1.66Cmass 451.4 ± 7.6 445.9 ± 11.4 451.4 ± 2.4 443.12 ± 7.14 445.1 ± 5.3 436.8 ± 9.1Narea 1.34 ± 0.4 2.24 ± 0.2 1.18 ± 0.07 1.50 ± 0.05 0.85 ± 0.05 0.88 ± 0.08Carea 3.58 ± 0.43 4.03 ± 0.33 2.9 ± 0.21 3.04 ± 0.07 1.32 ± 0.07 1.59 ± 0.09Chl index 16.5 ± 0.9 30.1 ± 2.2 25.6 ± 1.4 28.0 ± 1.4 24.1 ± 1.4 24.2 ± 3.9
Physiological traitsΦ 0.0342 ± 0.0104 0.0436 ± 0.0025 0.0325 ± 0.0048 0.0466 ± 0.032 0.0478 ± 0.0020 0.0448 ± 0.0062θ 0.308 ± 0.308 0.744 ± 0.144 0.927 ± 0.029 0.760 ± 0.105 0.929 ± 0.036 0.896 ± 0.027LCP 29.7 ± 4.6 20.5 ± 4.2 16.4 ± 4.3 16.0 ± 1.8 6.6 ± 1.5 9.1 ± 4.1LSP 651.8 ± 256.3 619.7 ± 129.5 240.5 ± 49.2 430.4 ± 0.1 167.03 ± 47.7 222.9 ± 38.3Aarea 3.71 ± 2.58 10.54 ± 1.86 5.14 ± 0.74 7.45 ± 1.75 4.85 ± 0.77 5.08 ± 0.43Rarea 0.77 ± 0.28 0.84 ± 0.10 0.43 ± 0.06 0.63 ± 0.02 0.31 ± 0.07 0.33 ± 0.09gsarea 41.7 ± 22.4 174.3 ± 21.0 46.5 ± 11.4 125.4 ± 54.3 64.1 ± 16.0 66.8 ± 5.2Amass 60.8 ± 40.9 96.1 ± 3.1 79.6 ± 13.0 105.0 ± 34.4 155.0 ± 25.0 143.7 ± 8.8Rmass 11.1 ± 4.2 10.7 ± 2.9 6.8 ± 1.3 9.0 ± 0.2 11.8 ± 3.7 9.1 ± 2.9gsmass 0.59 ± 0.39 1.71 ± 0.18 0.73 ± 0.21 1.78 ± 0.94 1.97 ± 0.48 1.89 ± 0.09WUE 68.8 ± 16.2 60.6 ± 2.8 105.5 ± 13.9 69.3 ± 13.2 78.8 ± 7.0 78.4 ± 3.0PNUE 46.22 ± 25.18 55.08 ± 9.05 60.35 ± 5.43 65.66 ± 17.49 76.17 ± 10.65 81.93 ± 6.22Ci/Ca 0.64 ± 0.09 0.62 ± 0.02 0.46 ± 0.06 0.60 ± 0.04 0.59 ± 0.03 0.59 ± 0.01
Trait
HI MI LI
LW HW LW HW LW HW (n = 3)
Quercus pyrenaica (deciduous)
Structural traitsArea 13.0 ± 2.2 16.5 ± 2.4 20.1 ± 2.2 18.3 ± 1.8 12.1 ± 1.5 14.0 ± 2.5SLA 117.54 ± 4.69 123.63 ± 7.04 160.11 ± 8.96 158.63 ± 3.10 281.52 ± 29.14 255.15 ± 6.29Nmass 17.75 ± 1.20 22.54 ± 0.96 17.71 ± 0.81 22.85 ± 1.25 25.95 ± 2.93 22.92 ± 0.25Cmass 429.2 ± 11.4 439.7 ± 6.3 433.8 ± 0.9 437.2 ± 11.1 438.2 ± 6.8 440.6 ± 9.8Narea 1.52 ± 0.07 1.85 ± 0.12 1.10 ± 0.07 1.44 ± 0.08 0.92 ± 0.02 0.92 ± 0.02Carea 3.68 ± 0.19 3.61 ± 0.20 2.69 ± 0.17 2.76 ± 0.03 1.63 ± 0.14 1.76 ± 0.10Chl index 19.2 ± 2.9 24.3 ± 1.7 23.0 ± 1.6 31.4 ± 1.5 29.0 ± 3.5 25.4 ± 3.4
Physiological traitsΦ 0.0372 ± 0.008 0.0523 ± 0.0007 0.0310 ± 0.0047 0.0529 ± 0.0039 0.0451 ± 0.0059 0.0643 ± 0.0092θ 0.980 ± 0.011 0.824 ± 0.057 0.974 ± 0.023 0.906 ± 0.026 0.797 ± 0.097 0.615 ± 0.069LCP 19.7 ± 1.9 23.4 ± 3.6 11.6 ± 4.3 17.9 ± 6.7 9.6 ± 3.1 14.5 ± 7.0LSP 293.8 ± 93.3 621.8 ± 54.7 153.2 ± 53.2 434.1 ± 21.8 294.1 ± 53.7 378.4 ± 46.6Aarea 4.69 ± 2.04 15.22 ± 1.27 4.00 ± 1.35 13.76 ± 0.22 5.51 ± 0.62 5.36 ± 0.80Rarea 0.55 ± 0.03 1.19 ± 0.17 0.32 ± 0.10 0.85 ± 0.24 0.38 ± 0.06 0.85 ± 0.38gsarea 52.7 ± 29.3 293.9 ± 10.7 34.6 ± 18.0 274.8 ± 33.4 86.1 ± 7.7 101.2 ± 11.2Amass 57.8 ± 26.8 187.2 ± 17.8 65.3 ± 23.8 234.1 ± 18.2 163.2 ± 24.8 135.6 ± 16.6Rmass 6.6 ± 0.6 14.7 ± 2.1 5.3 ± 2.0 14.1 ± 4.5 11.3 ± 1.4 22.0 ± 10.3gsmass 0.67 ± 0.40 3.67 ± 0.34 0.58 ± 0.32 4.49 ± 0.44 2.53 ± 0.35 2.56 ± 0.23WUE 108.0 ± 8.6 52.0 ± 5.0 147.2 ± 17.7 52.2 ± 4.7 63.8 ± 3.8 56.4 ± 4.8PNUE 43.87 ± 18.12 115.63 ± 7.07 61.15 ± 26.96 143.31 ± 5.42 87.20 ± 9.58 87.99 ± 15.83Ci/Ca 0.45 ± 0.04 0.62 ± 0.03 0.31 ± 0.06 0.63 ± 0.02 0.65 ± 0.02 0.68 ± 0.03
Light treatments: HI, high irradiance, MI, medium irradiance; LI, low irradiance. Water treatments: LW, low water; HW, high water.Φ, Quantum yield (no units); θ, curvature (no units); Area, leaf area (cm2); Aarea, photosynthetic rate per area (µmol CO2 m
–2 s−1); Amass, photosynthetic rate per mass (nmol CO2 g
−1 s−1); Carea, carbon content per area (g C m–2); Cmass, carbon concentration (mg g−1); Chl index, chlorophyll index (no units); Ci/Ca, ratio internal vs external CO2 concentration; gsarea, stomatal conductance per area (mmol H2O m–2 s−1); gsmass, stomatal conductance per mass (mmol H2O g−1 s−1); LCP, light compensation point (µmol photons m–2 s−1); LSP, light saturation point (µmol photons m–2 s−1); Narea, nitrogen content per area (g N m–2); Nmass, nitrogen concentration (mg g−1); Rarea, respiration rate per area (µmol CO2 m
–2 s−1); Rmass, respiration rate per mass (nmol CO2 g−1 s−1); PNUE, photosynthetic nitrogen-use efficiency (µmol CO2 (mol N)–1 s−1); SLA,
specific leaf area (cm2 g−1); WUE, water-use efficiency (µmol CO2 (mmol H2O)−1).
Appendix 1 Continued

New Phytologist (2006) 170: 819–834 www.newphytologist.org © The Authors (2006). Journal compilation © New Phytologist (2006)
Research834
About New Phytologist
• New Phytologist is owned by a non-profit-making charitable trust dedicated to the promotion of plant science, facilitating projectsfrom symposia to open access for our Tansley reviews. Complete information is available at www.newphytologist.org.
• Regular papers, Letters, Research reviews, Rapid reports and both Modelling/Theory and Methods papers are encouraged.We are committed to rapid processing, from online submission through to publication ‘as-ready’ via OnlineEarly – the 2004 averagesubmission to decision time was just 30 days. Online-only colour is free, and essential print colour costs will be met if necessary.We also provide 25 offprints as well as a PDF for each article.
• For online summaries and ToC alerts, go to the website and click on ‘Journal online’. You can take out a personal subscription tothe journal for a fraction of the institutional price. Rates start at £109 in Europe/$202 in the USA & Canada for the online edition(click on ‘Subscribe’ at the website).
• If you have any questions, do get in touch with Central Office ([email protected]; tel +44 1524 594691) or, for a localcontact in North America, the US Office ([email protected]; tel +1 865 576 5261).
Copyright © 2022 FDOKUMEN