
Trends in total precipitation and magnitude–frequency of extreme precipitation in Iran, 1969–2009
Upload
khangminh22Category
view
1download
0
ADVANCES IN ATMOSPHERIC SCIENCES, VOL. 23, NO. 4, 2006, 531–542
Inter-Comparison of 10-year Precipitation
Simulated by Several RCMs for Asia
FENG Jinming∗ (¾<²) and FU Congbin (Î�R)
START Regional Center for Temperate East Asia and
Key Laboratory of Regional Climate-Environmental for Temperate East Asia,
Institute of Atmospheric Physics, Chinese Academy of Sciences, Beijing 100029
(Received 7 November 2005; revised 5 January 2006)
ABSTRACT
In phase II of the Regional Climate Model Inter-comparison Project (RMIP) for Asia, the regionalclimate has been simulated for July 1988 through December 1998 by five regional climate models and oneglobal variable resolution model. Comparison of the 10-year simulated precipitation with the observationswas carried out. The results show that most models have the capacity to reproduce the basic spatialpattern of precipitation for Asia, and the main rainbelt can be reproduced by most models, but thereare distinctions in the location and the intensity. Most models overestimate the precipitation over mostcontinental regions. Interannual variability of the precipitation can also be basically simulated, whiledifferences exist between various models and the observations. The biases in the stream field are importantreasons behind the simulation errors of the Regional Climate Models (RCMs). The cumulus scheme andland surface process have large influences on the precipitation simulation. Generally, the Grell cumulusscheme produces more precipitation than the Kuo scheme.
Key words: RMIP, regional climate model, interannual variation, rainbelt, cumulus scheme, land surface
process
doi: 10.1007/s00376-006-0531-2
1. Introduction
Currently, global climate models are extensivelyapplied to the study of climate change. However, dueto their low spatial resolution, it is hard to demon-strate regional climate characteristics associated withcomplicated terrain and land surface conditions. Re-gional climate models (RCMs), on the other hand,can well describe the terrain and the surface char-acteristics, on which detailed land surface processescould be considered. Consequently, RCMs can de-scribe more detailed characteristics of the tempera-ture, rainfall distribution and soil humidity variationthan global models can. To develop high resolutionRCMs is becoming one of the main approaches in in-vestigating regional climate formation and the varia-tion mechanism, especially under the background ofglobal warming. RCMs were originally developed andapplied in the simulation of regional climate by Dick-inson et al. (1989) and Giorgi (1990). And henceforth,their application and development become more and
more widespread (Giorgi and Mearns, 1991; Giorgi etal., 1993a, b; Pal et al., 2004). Some of the studieson the simulation of the regional climate with RCMshave been done in the United States of America, Eu-rope and East Asia, etc. (Giorgi, 1991; Giorgi andMarinucci, 1991; Lee and Kim, 1992; Christensen etal., 1997; Kato et al., 1999, 2001; and Suh, 2000).In China, such research began in the 1990s, in whichmost works were focused on case studies and sensi-tivity experiments, and most simulations with RCMswere carried out for precipitation processes in east-ern China (Liu and Ding, 1995; Lu and Ding, 1997;Luo and Zhao, 1997; Gong and Li, 1997; Fu et al.,1998; Chen and Fu, 2000; Shi et al., 2001; Gaoet al., 2001; Zheng and Qian, 2002). The integra-tion period of such simulation experiments was oftenshort, of several months or seasons, in which mostof the studies were limited to case simulations ex-cept a few were comparative simulations using differ-ent RCMs (Zhao and Luo, 1997; Wang and Zhang,1999). In order to study and develop climate mod-
*E-mail: [email protected]
532 INTER-COMPARISON OF 10-YEAR PRECIPITATION SIMULATED BY RCMs VOL. 23
els to a new level, some international organizationsand Euro-American nations have already organizedseveral global and regional model inter-comparisonprojects. For instance, well known projects include theAtmospheric Model Inter-comparison Project (AMIP)(Gates, 1992; Wang and Zhu, 1997; Wang, 1997), Cou-pled Model Inter-comparison Project (CMIP), Euro-pean Regional Model Inter-comparison Project andAmerican Regional Model Inter-comparison Project(PIRCS) (Takle et al., 1999; Leung, 1999; Luo et al.,2002).
East Asia is a typical monsoon zone with a par-ticular geographic environment and very large climatevariability on seasonal, interannual, decadal, and evencenturial timescales (Fu and Zeng, 1998). In or-der to understand the performance of RCMs in sim-ulating Asian climate, especially that of East Asia,the Regional Climate Model Inter-comparison Project(RMIP) for Asia was launched by the START RegionalCenter for Temperate East Asia in 2000. This projectincludes three phases to be implemented. In phase I,ten models participate in the project RMIP to sim-ulate the regional climate in Asia. They are modelsfrom China, the USA, Australia, Korea, and Japan.An 18-month simulation from April 1997 to Septem-ber 1998 was performed over the domain that containsmost of East Asia and Central Asia. The objective inphase I is to examine the performance of the ten mod-els in simulating the seasonal cycle of the East Asianmonsoon climate and extreme climate events. The re-sults have shown that most of the RCMs can basicallyreproduce the spatial distribution and the annual vari-ation of the mean, maximum, and minimum temper-ature and precipitation in the domain. For example,the area and duration of the severe drought in the hotsummer of 1997 over northern East Asia can be sim-ulated. As for the two flood disasters that occurredin the valleys of the Changjiang-Huaihe and SonghuaRivers during summer 1998, the simulation abilities ofthe models were very different (Fu et al., 2004, 2005).
In phase II of RMIP, six models participate in a10-year simulation of Asian climate. The objective ofphase II is to systemically assess the statistical prop-erties and capacities of the models in simulating Asianmonsoon climate, including the mean fields and vari-ability of meteorological elements. As precipitationis one of the main elements in climate research, it is,thus, very important to study and simulate the precip-itation during the Asian monsoon season with RCMs.Therefore, in this paper, we will simulate and com-pare the monsoon precipitation from different modeloutputs according to the RMIP phase II requirements
so as to analyze the simulation capacity of the RCMs.
2. Models
There are six participant models in phase IIof RMIP, of which five are RCMs and one is aglobal variable-resolution model. The RCMs in-clude: RIEMS (Regional Integrated EnvironmentalModel System), developed by the START RegionalCenter for Temperate East Asia (Fu et al., 2000;Xiong et al., 2003); NJU RCM, based on MM5v3and improved by the Department of Atmospheric Sci-ences, Nanjing University, China (Tang, 2004); MRIJSM BAIM, a Japanese Spectral Model developed bythe Meteorological Research Institute/Japan Meteo-rological Atmospheric (MRI/JMA) (Mabuchi et al.,2002); RegCM2b, based on RegCM2, improved by theDepartment of Atmospheric Science, Central ResearchInstitute of Electric Power Industry (CRIEPI), Japan(Kato et al., 2001); SNU RCM, based on MM5v3, im-proved by the Atmospheric Sciences Program, Schoolof Earth and Environmental Sciences, Seoul NationalUniversity (SNU), Korea (Lee and Kang, 1999). AndCSIRO CCAM is a global variable resolution model,developed by the Commonwealth Scientific and In-dustrial Research Organization (CSIRO) AtmosphericResearch, Australia (McGregor, 1996; McGregor andKatzfey, 1998). Table 1 shows the basic informationand physical processes of the six models.
3. Numerical experiments
3.1 Experiment design
In phase II of RMIP, the experiment domain is thesame as phase I, which contains a large part of theAsian continent, western Pacific, Bay of Bengal andthe South China Sea (Fig. 1). The Lambert confor-mal conic projection is adopted, in which the two truelatitudes are 15◦N and 55◦N. The center of the do-main is at 35◦N, 105◦E. The horizontal resolution ofthe models is 60 km, with a 151×111 grid in the east-west and north-south directions. The simulation pe-riod is from July 1988 to December 1998. The drivingfields come from NCEP-II (National Centers for Envi-ronmental Prediction) reanalysis data, with a 15-gridbuffer zone. The NCAR (National Center for Atmo-spheric Research) terrain data are used in the modelintegration with a horizontal resolution of 0.5◦ × 0.5◦,in addition to satellite land surface data supplied byNASA. The same driving field, topography, land sur-face vegetation, simulation domain and horizontal res-olution ensure the comparability of the simulation re-sults.

NO. 4 FENG AND FU 533
Table 1. The basic information and physical processes of the models.
RIEMS NJU MM5 RegCM2b MRI (JSM BAIM) SNU RCM CSIRO CCAM
Leader Fu Congbin Su Bingkai H. Kato Y. Sato D. K. Lee J. L. McGregor
Country China China Japan Japan Korea Australia
Vertical levels σ-17 levels σ-16 levels σ-14 levels σ-23 levels σ-23 levels σ-18 levels
Dynamic process hydrostatic non- hydrostatic hydrostatic non- CCAM
hydrostatic hydrostatic
Lateral boundary ER ER ER ER+Spectral ER Far-field
condition coupling nudging
Convective Kuo-Anthes Grell Kuo-Anthes Moist convective Grell Arakawa-
scheme adjustment Gordon
Land surface BATS LSM LSM BAIM LSM Kowalczyk
Planetary boundary layer Holtslag MRF Holtslag Yamada Level 2 MRF Louis-Holtslag
scheme Louis scheme
Longwave radiation CCM3 CCM2 CCM3 Sugi CCM2 GFDL
scheme
Shortwave radiation CCM3+aerosol CCM2 CCM3 Lacis and Hansen CCM2 GFDL
scheme
References Fu et al., 2000; Tang, Kato et al., Mabuchi Lee and Kang, McGregor, 1996;
Xiong et al., 2004 2001 et al., 2002 1999 McGregor and
2003 Katzfey, 1998
Note: ER refers to exponential relaxation; BATS: Biosphere-Atmosphere Transfer Scheme; LSM: Land surface Model;
BAIM: Biosphere-Atmosphere Interaction Model; MRF: Medium Range Forecast; CCM: Community Climate Model;
GFDL: Geophysical Fluid Dynamics Laboratory
60°E 75°E 90°E 105°E 120°E 135°E 150°E
10°N
15°N
20°N
25°N
30°N
35°N
40°N
45°N 1
23
4A
B
56
78
C
60°E 75°E 90°E 105°E 120°E 135°E 150°E
10°N
15°N
20°N
25°N
30°N
35°N
40°N
45°N 1
23
4A
B
56
78
C
Fig. 1. Simulation domain and sub-regions for RMIP. 1.Far East of Russia; 2. Northeast China and Mongolia; 3.Northwest China; 4. North China; 5. Japanese Islands;6. Korean Peninsula; 7. Southeast China; 8. Indian Sub-continent; 9. China; 10. Continental part of domain; A.Tibetan Plateau; B. Bay of Bengal; C. Changjiang-Huaihevalley.
3.2 Observed data for model validation
The data of the observation stations in the domainare used for comparison. At the same time, in the ar-eas where observation stations are scarce, other gridanalysis data are added.
There are a total of 903 stations whose monthlyprecipitation observations are available, in which 640stations are located in China, 155 in Japan, 68 in Ko-rea and 40 in India. The data sets we used are partlysupplied by the scientists who participate in RMIP orare collected through regional collaboration. The con-tinental area in the simulated domain is divided into8 sub-regions in the following analysis (Fig. 1). Owingto very few observations and poor simulation resultsover the Tibetan Plateau (region A) and Bay of Bengal(region B), these will be excluded from our statistics.In the analysis, region 9 represents China except forregion A and region B mentioned above. Region 10represents the entire continental region in the simu-lated domain, excluding region A and B, as well. Inaddition, region C represents the Changjiang-Huaihevalley.
Since in some areas, observation stations are verysparse and not plentiful enough for model validation,several kinds of grid datasets are used for validation,including Xie and Arkin (Xie and Arkin, 1997) andCRU (Climatic Research Unit, University of East An-glia) precipitation on global grids.
4. Simulation results of precipitation
The simulation period is from July 1988 to Decem-ber 1998. To exclude the spin-up period and for the
534 INTER-COMPARISON OF 10-YEAR PRECIPITATION SIMULATED BY RCMs VOL. 23
1
Inter-Comparison of 10-year Precipitation Simulated by
Several RCMs for Asia Feng Jingming (冯锦明) Fu Congbin (符淙斌)
60°E 75°E 90°E 105°E 120°E 135°E 150°E
10°N
15°N
20°N
25°N
30°N
35°N
40°N
45°N 1
23
45
6
78A
B C
Fig.1. Simulation domain and sub-regions for RMIP
1.Far East of Russia 2.Northeast China and Mongolia 3.Northwest China 4.North China 5.Japanese Islands 6.Korean Peninsula 7. Southeast China 8.Indian Subcontinent 9.China 10.Continental part of domain A. Tibetan Plateau B. Bay of Bengal C. Changjiang-Huaihe Valley
60°E 75°E 90°E 105°E 120°E 135°E 150°E
10°N
15°N
20°N
25°N
30°N
35°N
40°N
45°N
0 50 100 300 600 900 1200 1500 1800 2100 2400
60°E 75°E 90°E 105°E 120°E 135°E 150°E
10°N
15°N
20°N
25°N
30°N
35°N
40°N
45°N
0 50 100 300 600 900 1200 1500 1800 2100 2400
60°E 75°E 90°E 105°E 120°E 135°E 150°E
10°N
15°N
20°N
25°N
30°N
35°N
40°N
45°N
0 50 100 300 600 900 1200 1500 1800 2100 2400
60°E 75°E 90°E 105°E 120°E 135°E 150°E
10°N
15°N
20°N
25°N
30°N
35°N
40°N
45°N
0 50 100 300 600 900 1200 1500 1800 2100 2400
Fig.2. The spatial distribution of 10-year mean summer precipitation (mm) (a) Observation; (b) RIEMS; (c) SNU; (d) MRI
(a) (b)
(c) (d)
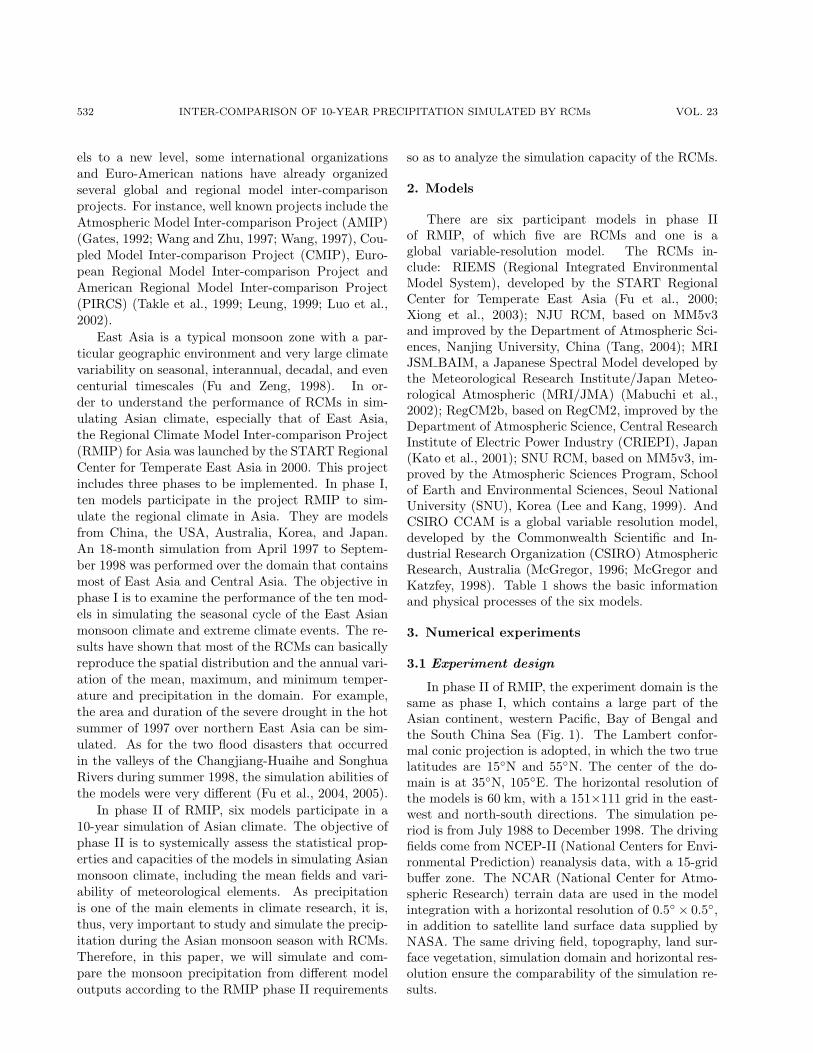
Fig. 2. The spatial distribution of 10-year mean summer precipitation (mm) (a) Observation; (b) RIEMS;(c) SNU; (d) MRI.
convenience of statistical analysis, we compare the pre-cipitation simulation from December 1988 to Novem-ber 1998, i.e. ten whole years from the first winter tothe last fall.
4.1 Spatial distribution pattern and seasonalvariation
It is important to simulate the spatial distributionof precipitation and the location of the major rain-belt in the climate simulation. Because of the strongmonsoon, the precipitation mainly occurs in the sum-mer over East Asia. The vapor of East Asian summermonsoon precipitation is brought by the strong airflowfrom the sea. The south Bay of Bengal is the impor-tant vapor source of the Changjiang-Huaihe valley andthe South China Sea.
In summer, because of the eruptions of the Southand East Asia monsoons, the precipitation signifi-cantly increases over India, the Bay of Bengal and EastAsia. Figure 2 illustrates the spatial distribution of 10-year mean summer precipitation. Here, summer pre-cipitation means the total precipitation for the threemonths of June, July and August. Considering thelength of the paper, only the observations and threemodels’ simulations are shown in the figures.
According to the observations, there are three cen-ters of strong precipitation along the Changjiang-Huaihe valley and the intensity of precipitation reaches
600–900 mm. In the Bay of Bengal, the precipitationreaches 2400 mm. Models can basically reproduce thespatial pattern of the precipitation, viz., more rain-fall in the south and southeast and less rainfall in thenorthwest of East Asia. Most models markedly overes-timate the precipitation in western China. The mainrainbelt, especially over the Changjiang-Huaihe val-ley of China, is simulated by almost all of the mod-els, but there are differences between the simulationsand the observations in the location and the magni-tude. RIEMS and SNU overestimate the precipita-tion in most areas, and MRI underestimates it. As awhole, the distribution of precipitation simulated byNJU MM5 (figure omitted) is similar with SNU be-cause they use the same dynamical frame and physicalprocess parameterization scheme (from Table 1). Theland surface process is different and the other main pa-rameterization schemes are the same between RIEMSand RegCM2b, but the simulated precipitations havelarge distinctions. RIEMS overestimates precipita-tion in most areas while RegCM2b underestimates it.RIEMS and RegCM2b both underestimate the pre-cipitation over the ocean. In addition, CSIRO CCAMsignificantly overestimates the precipitation in the do-main. Therefore, except for MRI and RegCM2b, theprecipitation simulated by the other models is morethan the observations in continental East Asian, espe-cially to the north of the Tibetan Plateau. SNU sim-

NO. 4 FENG AND FU 535
2
60°E 75°E 90°E 105°E 120°E 135°E 150°E
10°N
15°N
20°N
25°N
30°N
35°N
40°N
45°N
−100 −50 −20 20 50 100 200 60°E 75°E 90°E 105°E 120°E 135°E 150°E
10°N
15°N
20°N
25°N
30°N
35°N
40°N
45°N
−100 −50 −20 20 50 100 200
60°E 75°E 90°E 105°E 120°E 135°E 150°E
10°N
15°N
20°N
25°N
30°N
35°N
40°N
45°N
−100 −50 −20 20 50 100 200 Fig.3. Bias of summer precipitation with respect to the observation(%)
(a) NCEP-II; (b) RIEMS; (c)SNU
1 2 3 4 5 6 7 8 9 10−200
−100
0
100
200
300
400
Region
Bia
s of
Pre
cipi
tatio
n(%
)
1 2 3 4 5 6 7 8 9 10−200
−100
0
100
200
300
400
Region
Bia
s of
Pre
cipi
tatio
n(%
)
2b2b Fig.4. Bias of simulated precipitation in the sub-regions
(a) winter; (b) summer
Month
Pre
cipi
tatio
n(m
m)
1 2 3 4 5 6 7 8 9 10 11 120
50
100
150
200
Fig.5. Seasonal variation of precipitation on the continent
(a)
(b) (c)
2b2b
Fig. 3. Bias of summer precipitation with respect to the observation (%) (a) NCEP-II; (b) RIEMS; (c)SNU.
ulates the precipitation relatively better than the othermodels.
In areas of steep topography and some small is-lands, many models reproduce numerical point storms(NPSs). This is maybe caused by the process of terraingradient (Leung et al., 1999). To the south east of theTibetan Plateau, most models simulate a pseudo cen-ter of strong precipitation, but this is different from anumerical point storm. It may be concerned with theterrain of a large area. Generally, a numerical pointstorm represents strong precipitation from several gridpoints, but the area of strong precipitation to the southeast of the Tibetan Plateau is large, which is beyondseveral grid points.
Compared to other seasons (figure omitted), thespatial distribution of simulated precipitation in thesummertime is not better than that in winter. Mostmodels overestimate the winter and summer precipi-tation in most areas. The large-scale precipitation isdominant in winter, but the convective precipitation isdominant in summer. Many factors make the regionalclimate simulation in summer more complicated thanthat in winter.
Of the six models, RIEMS and RegCM2b use thecumulus parameterization scheme of Kuo-Anthes, but
NJU MM5 and SNU RCM use Grell. Consideringthe present and previous research results, the cumulusparameterization scheme has a large influence on theprecipitation simulation, and the Grell scheme gener-ally produces more precipitation than the Kuo-Anthesscheme (Giorgi et al., 1993; Liu, et al., 1996). The fur-ther experiments by RIEMS and the results in phaseI of RMIP for Asia can also prove this point (Fu etal., 2005). For the land surface process, RIEMS usesBATS, but RegCM2b, NJU MM5 and SNU RCM alluse LSM. Except for the different land surface pro-cesses, the main parameterizationschemes of RIEMSand RegCM2b are same, but RIEMS produces moreprecipitation than RegCM2b. In addition, the resultsin phase I of RMIP for Asia also show that the RCMswith different land surface processes produce differentprecipitation amounts.
In the experiments of the 10-year simulation, thedriving fields come from the NCEP-II reanalysis data,but these reanalysis data have some biases. Figure 3shows the spatial distribution of bias percentage of thesummer precipitation in the NCEP-II data and simu-lation. Here, the bias percentage means that relativeto the observed precipitation. The spatial distributionof the NCEP-II bias has some similarities with the re-
536 INTER-COMPARISON OF 10-YEAR PRECIPITATION SIMULATED BY RCMs VOL. 23
2
60°E 75°E 90°E 105°E 120°E 135°E 150°E
10°N
15°N
20°N
25°N
30°N
35°N
40°N
45°N
−100 −50 −20 20 50 100 200 60°E 75°E 90°E 105°E 120°E 135°E 150°E
10°N
15°N
20°N
25°N
30°N
35°N
40°N
45°N
−100 −50 −20 20 50 100 200
60°E 75°E 90°E 105°E 120°E 135°E 150°E
10°N
15°N
20°N
25°N
30°N
35°N
40°N
45°N
−100 −50 −20 20 50 100 200 Fig.3. Bias of summer precipitation with respect to the observation(%)
(a) NCEP-II; (b) RIEMS; (c)SNU
1 2 3 4 5 6 7 8 9 10−200
−100
0
100
200
300
400
Region
Bia
s of P
reci
pita
tion(%
)
1 2 3 4 5 6 7 8 9 10−200
−100
0
100
200
300
400
Region
Bia
s o
f P
reci
pita
tion(%
)
2b2b Fig.4. Bias of simulated precipitation in the sub-regions
(a) winter; (b) summer
Month
Pre
cipi
tatio
n(m
m)
1 2 3 4 5 6 7 8 9 10 11 120
50
100
150
200
Fig.5. Seasonal variation of precipitation on the continent
(a)
(b) (c)
2b2b
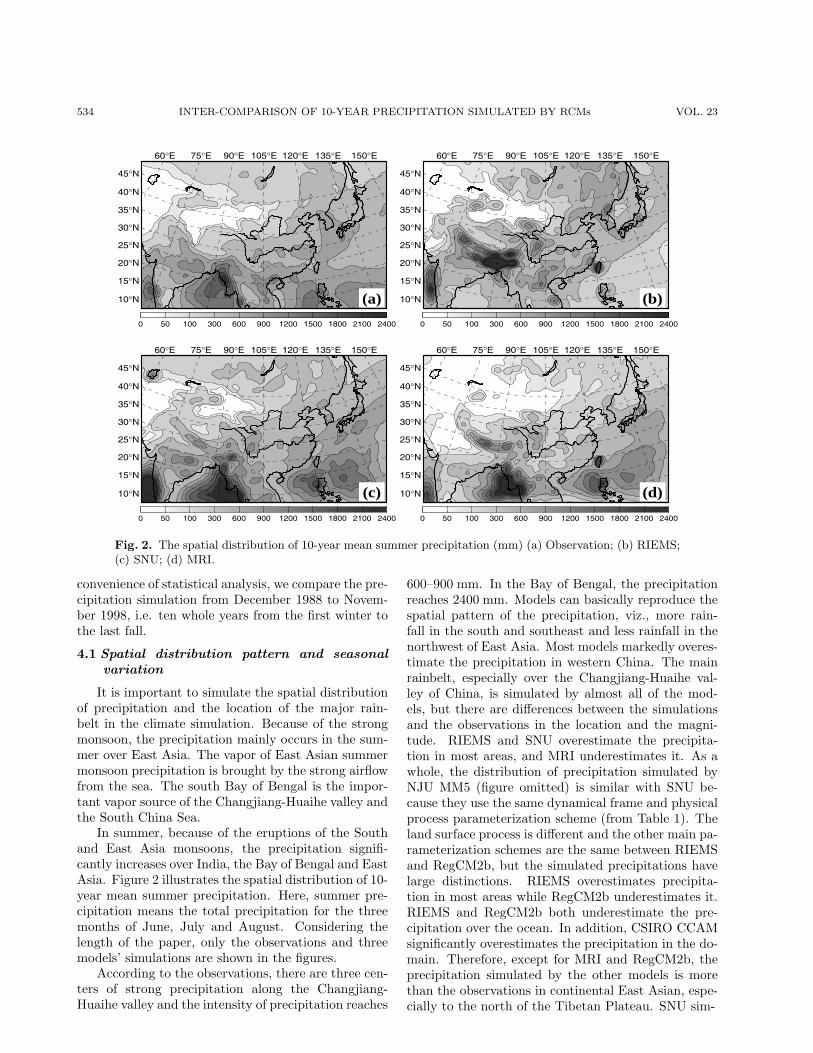
Fig. 4. Bias of simulated precipitation in the sub-regions. (a) winter; (b) summer.
sults of most models over the continental region, suchas the positive bias over most areas of Mongolia andthe southwest of China, and the negative bias over thenorth of India, etc. Because of the few observation sta-tions in Northwest China and the Tibetan Plateau, theobserved data used to validate the models come fromthe CRU precipitation data, so a larger bias may ex-ist. Hence, maybe the biases of the large-scale forcingfields and the deficiency of the validation data are oneof the possible reasons for the biases of the simulation.
The simulated precipitation bias in every sub-region is statistically computed and shown in Fig. 4.Figures 4a and 4b respectively denote the bias percent-age of the 10-year mean winter and summer precipita-tion, in which Ensemble means the bias percentage ofthe arithmetical average result of the five RCMs. Inmost of the regions, especially in the northern regions,the precipitation simulated by most of the models islarger than the observations, while the precipitationproduced by MRI is less than the observations in mostof the regions, except for a few regions. The bias per-centage is largest in Northwest China. In North China,the simulation by most models has a large bias in allseasons except for summer. In the entire continentalarea, the bias percentage is relatively smaller than that
in the other sub-regions. Compared with the othermodels, CSIRO CCAM and RIEMS have more posi-tive biases. Precipitation in the Asian monsoon regionmainly occurs in the summertime, so the actual ob-served summer precipitation is very large. Althoughthe simulation bias in summer is very large, the biaspercentage is smaller than that in winter.
In total, most models reproduce more precipitationthan the observations in northwestern China and lessin India; the model simulations usually are better inJapan and Korea than in other areas.
According to Table 2, the bias of the continen-tal average annual precipitation of the different mod-els varies between −30.9% and 35.4% (equivalent to−210¨240 mm). The previous research results showthat the bias of precipitation simulated by GCMs is3–784 mm (Zhao et al., 1998). So the bias of RCMs ismuch smaller than that of GCMs.
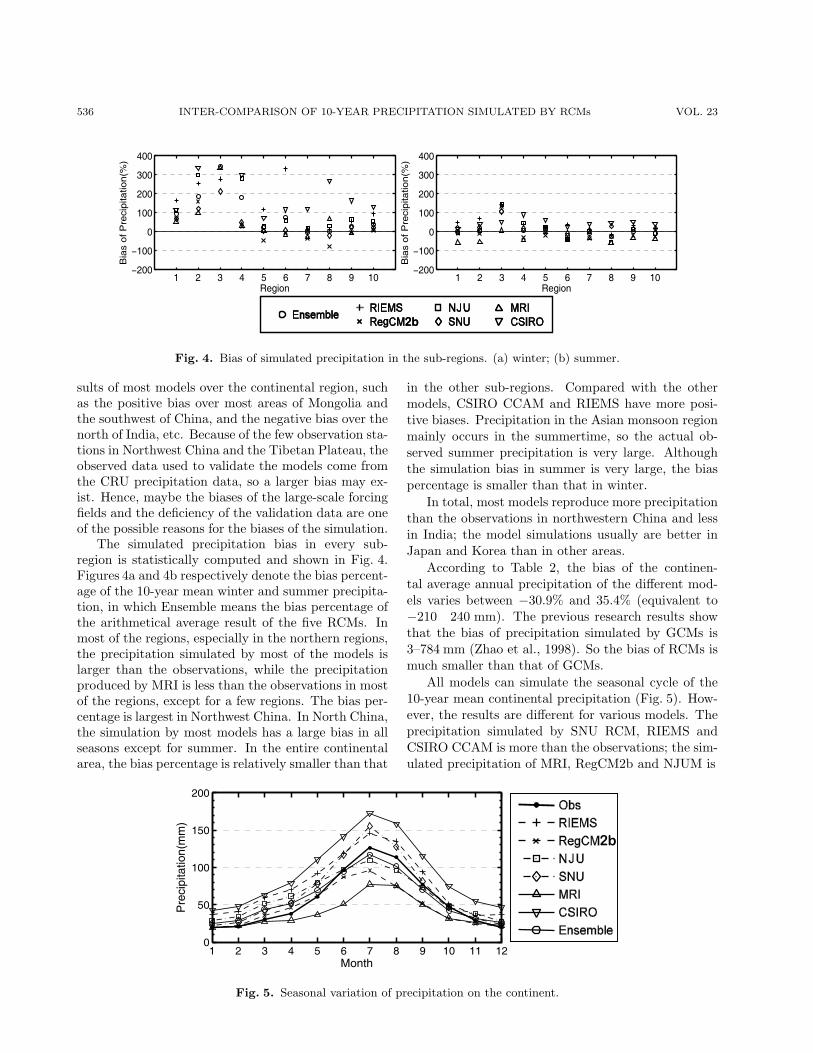
All models can simulate the seasonal cycle of the10-year mean continental precipitation (Fig. 5). How-ever, the results are different for various models. Theprecipitation simulated by SNU RCM, RIEMS andCSIRO CCAM is more than the observations; the sim-ulated precipitation of MRI, RegCM2b and NJUM is
2
60°E 75°E 90°E 105°E 120°E 135°E 150°E
10°N
15°N
20°N
25°N
30°N
35°N
40°N
45°N
−100 −50 −20 20 50 100 200
60°E 75°E 90°E 105°E 120°E 135°E 150°E
10°N
15°N
20°N
25°N
30°N
35°N
40°N
45°N
−100 −50 −20 20 50 100 200
60°E 75°E 90°E 105°E 120°E 135°E 150°E
10°N
15°N
20°N
25°N
30°N
35°N
40°N
45°N
−100 −50 −20 20 50 100 200 Fig.3. Bias of summer precipitation with respect to the observation(%)
(a) NCEP-II; (b) RIEMS; (c)SNU
1 2 3 4 5 6 7 8 9 10-200
-100
0
100
200
300
400
Region
Bia
s of
Pre
cipi
tatio
n(%
)
1 2 3 4 5 6 7 8 9 10-200
-100
0
100
200
300
400
Region
Bia
s of
Pre
cipi
tatio
n(%
)
2b2b Fig.4. Bias of simulated precipitation in the sub-regions
(a) winter; (b) summer
Month
Pre
cipi
tatio
n(m
m)
1 2 3 4 5 6 7 8 9 10 11 120
50
100
150
200
Fig.5. Seasonal variation of precipitation on the continent
(a)
(b) (c)
2b2b
删除的内容: 2
删除的内容: in Fig. 5. Seasonal variation of precipitation on the continent.

NO. 4 FENG AND FU 537
Table 2. The bias of 10-year mean annual precipitation on the continent (%).
Ensemble RIEMS RegCM2b NJU SNU MRI CSIRO
Bias 3.5 35.4 −15.5 9.8 18.6 −30.9 63.2
3
60°E 75°E 90°E 105°E 120°E 135°E 150°E
10°N
15°N
20°N
25°N
30°N
35°N
40°N
45°N
20m s−1
60°E 75°E 90°E 105°E 120°E 135°E 150°E
10°N
15°N
20°N
25°N
30°N
35°N
40°N
45°N
20m s−1
60°E 75°E 90°E 105°E 120°E 135°E 150°E
10°N
15°N
20°N
25°N
30°N
35°N
40°N
45°N
20m s−1
60°E 75°E 90°E 105°E 120°E 135°E 150°E
10°N
15°N
20°N
25°N
30°N
35°N
40°N
45°N
20m s−1
Fig.6. 850 hPa summer wind fields (a) NCEP-II; (b) RIEMS; (c) SNU; (d) MRI
60°E 75°E 90°E 105°E 120°E 135°E 150°E
10°N
15°N
20°N
25°N
30°N
35°N
40°N
45°N
0.2
0.2 0.2
0.2
0.2
0.2
0.2
0.4
0.4
0.4
0.4
0.4
0.40.4
0.4 0.4
0.4
0.4
0.4 0.4
0.4
0.4
0.4
0.4
0.4
0.60.6
0.6
0.6
0.6
0.6
0.6
0.6
0.6
0.6
0.6
0.6
0.6
0.6
0.6
0.6
0.8
0.8
0.8
0.8
0.8
0.8
1
1
1
1
1
1
1
11
1.2
1.2
1.2
1.4
1.6
60°E 75°E 90°E 105°E 120°E 135°E 150°E
10°N
15°N
20°N
25°N
30°N
35°N
40°N
45°N
0.4
0.4
0.4
0.4
0.4
0.4
0.4
0.4
0.4
0.4
0.4
0.4
0.4
0.4
0.4
0.4
0.4
0.6
0.6
0.6
0.6
0.6
0.6
0.6
0.6
0.6
0.6
0.60.60.6
0.6
0.6
0.6
0.8
0.8
0.8
0.8
0.8
0.8
1
1
1
1
1
11
1.2
1.2
1.2
1.2
1.4
1.4
1.4
1.41.41.
6
1.6
1.61.6
60°E 75°E 90°E 105°E 120°E 135°E 150°E
10°N
15°N
20°N
25°N
30°N
35°N
40°N
45°N
0.4
0.4
0.4
0.4
0.4
0.4
0.4
0.4
0.4
0.4
0.4
0.4
0.6 0.6 0.6
0.6
0.6
0.6
0.6
0.6
0.6
0.6
0.60.6
0.6
0.6
0.6
0.6
0.6
0.6
0.6
0.6
0.8
0.8 0.8
0.8
0.8
0.8
1
1
1
1
1 1
1.2
1.4
1.6
60°E 75°E 90°E 105°E 120°E 135°E 150°E
10°N
15°N
20°N
25°N
30°N
35°N
40°N
45°N
0.4
0.4
0.4
0.4
0.4
0.6
0.6
0.6
0.6
0.6
0.6
0.6
0.6
0.6
0.6
0.6
0.6
0.6
0.6
0.60.6
0.6
0.6
0.6
0.6
0.6
0.6
0.6
0.6
0.6
0.6
0.6
0.6
0.8
0.8
0.8 0.8
0.8
0.8
0.8
0.8
0.8
0.8
0.80.8
0.8
0.8
0.8
0.8
0.8
0.8
0.8
0.8
0.80.8
0.8
1
1
1
1 1
1
1
1
1
1
1
1
1
11
1
1
1.2
1.2
1.2
1.2
1.2
1.4
1.4
1.4
1.6
1.6
1.6
Fig.7. Interannual variability of July precipitation (The shaded areas mean that the difference between the simulation and the observations is not significant)
(a) Observations; (b) RIEMS; (c) SNU; (d) MRI
(a) (b)
(c) (d)
(a) (b)
(c) (d)
Fig. 6. 850-hPa summer wind fields. (a) NCEP-II; (b) RIEMS; (c) SNU; (d) MRI.
larger in the wintertime and less in the summertimethan the observations. In addition, the ensemble resultof the RCMs is closer to the observations than that ofany single model.
Figure 6 shows the 850 hPa summer wind fields ofthe 10-year mean NCEP-II data and simulations. Insummer, the southeastern and southwestern monsoonsprevail in the East Asian continent. The strong sum-mer monsoon transports the abundant vapor north-wardly from the Bay of Bengal and West Pacific,thereby generating a large amount of precipitation inSouth China, Changjiang-Huaihe and later in NorthChina. For the summer monsoon current located tothe south of 30◦N, it is underestimated by MRI com-pared to the NCEP-II data. So the precipitation sim-ulated by MRI is much smaller in summer, while itis greater in the other models. The summer monsooncurrent simulated by RIEMS is much stronger and theregion of strong monsoon current is extended further
northward. This is the main reason that RIEMS sim-ulates much more precipitation in the summer. Thesummer monsoon current simulated by SNU is close toNCEP-II, and the bias of the simulated precipitationis smaller relatively. Hence, the biases of the monsooncurrent are important reasons for the simulation errorsof RCMs.
4.2 The spatial distribution of interannual vari-ability and the interannaul variation of re-gional average
Climate variability is a quantitative index of cli-mate change. Standard deviation (SD) can be used todenote the variability of climate variables. Since pre-cipitation is a cumulative climate variable, in order tostudy the capacity of the models in simulating the in-terannual variability of precipitation, the ratio of theprecipitation SD to the 10-year mean is used to descri-

538 INTER-COMPARISON OF 10-YEAR PRECIPITATION SIMULATED BY RCMs VOL. 23
3
60°E 75°E 90°E 105°E 120°E 135°E 150°E
10°N
15°N
20°N
25°N
30°N
35°N
40°N
45°N
20m s−1
60°E 75°E 90°E 105°E 120°E 135°E 150°E
10°N
15°N
20°N
25°N
30°N
35°N
40°N
45°N
20m s−1
60°E 75°E 90°E 105°E 120°E 135°E 150°E
10°N
15°N
20°N
25°N
30°N
35°N
40°N
45°N
20m s−1
60°E 75°E 90°E 105°E 120°E 135°E 150°E
10°N
15°N
20°N
25°N
30°N
35°N
40°N
45°N
20m s−1
Fig.6. 850 hPa summer wind fields (a) NCEP-II; (b) RIEMS; (c) SNU; (d) MRI
60°E 75°E 90°E 105°E 120°E 135°E 150°E
10°N
15°N
20°N
25°N
30°N
35°N
40°N
45°N
0.2
0.2 0.2
0.2
0.2
0.2
0.2
0.4
0.4
0.4
0.4
0.4
0.40.4
0.4 0.4
0.4
0.4
0.4 0.4
0.4
0.4
0.4
0.4
0.4
0.60.6
0.6
0.6
0.6
0.6
0.6
0.6
0.6
0.6
0.6
0.6
0.6
0.6
0.6
0.6
0.8
0.8
0.8
0.8
0.8
0.8
1
1
1
1
1
1
1
11
1.2
1.2
1.2
1.4
1.6
60°E 75°E 90°E 105°E 120°E 135°E 150°E
10°N
15°N
20°N
25°N
30°N
35°N
40°N
45°N
0.4
0.4
0.4
0.4
0.4
0.4
0.4
0.4
0.4
0.4
0.4
0.4
0.4
0.4
0.4
0.4
0.4
0.6
0.6
0.6
0.6
0.6
0.6
0.6
0.6
0.6
0.6
0.60.60.6
0.6
0.6
0.6
0.8
0.8
0.8
0.80.8
0.8
1
1
1
1
1
11
1.2
1.2
1.2
1.2
1.4
1.4
1.4
1.41.41.
6
1.6
1.61.6
60°E 75°E 90°E 105°E 120°E 135°E 150°E
10°N
15°N
20°N
25°N
30°N
35°N
40°N
45°N
0.4
0.4
0.4
0.4
0.4
0.4
0.4
0.4
0.4
0.4
0.4
0.4
0.6 0.6 0.6
0.6
0.6
0.6
0.6
0.6
0.6
0.6
0.6
0.6
0.6
0.6
0.6
0.6
0.6
0.6
0.6
0.6
0.8
0.8 0.8
0.8
0.8
0.8
1
1
1
1
1 1
1.2
1.4
1.6
60°E 75°E 90°E 105°E 120°E 135°E 150°E
10°N
15°N
20°N
25°N
30°N
35°N
40°N
45°N 0.4
0.4
0.4
0.4
0.4
0.6
0.6
0.6
0.6
0.6
0.6
0.6
0.6
0.6
0.6
0.6
0.6
0.6
0.6
0.60.6
0.6
0.6
0.6
0.6
0.6
0.6
0.6
0.6
0.6
0.6
0.6
0.6
0.8
0.80.8 0.8
0.8
0.8
0.8
0.8
0.8
0.8
0.80.8
0.8
0.8
0.8
0.8
0.8
0.8
0.8
0.8
0.80.8
0.8
1
1
1
1 1
1
1
11
1
1
1
1
11
1
1
1.2
1.2
1.2
1.2
1.2
1.4
1.4
1.4
1.6
1.6
1.6
Fig.7. Interannual variability of July precipitation (The shaded areas mean that the difference between the simulation and the observations is not significant)
(a) Observations; (b) RIEMS; (c) SNU; (d) MRI
(a) (b)
(c) (d)
(a) (b)
(c) (d)
Fig. 7. Interannual variability of July precipitation (The shaded areas mean that the difference between the
simulation and the observations is not significant). (a) Observations; (b) RIEMS; (c) SNU; (d) MRI.
4
Year
Anom
aly
of P
reci
pita
tion(%
)
1989 1990 1991 1992 1993 1994 1995 1996 1997 1998−30
−20
−10
0
10
20
30
Year
Anom
aly
of P
reci
pita
tion(%
)
1989 1990 1991 1992 1993 1994 1995 1996 1997 1998−30
−20
−10
0
10
20
2b2b Fig.8. Interannual variation of precipitation on the continent
(a) winter; (b) summer
APR MAY JUN JUL AUG SEP OCT
25°N
30°N
35°N
40°N
45°N
APR MAY JUN JUL AUG SEP OCT
25°N
30°N
35°N
40°N
45°N
2
4
6
8
10
12
14
16
APR MAY JUN JUL AUG SEP OCT
25°N
30°N
35°N
40°N
45°N
APR MAY JUN JUL AUG SEP OCT
25°N
30°N
35°N
40°N
45°N
2
4
6
8
10
12
14
16
APR MAY JUN JUL AUG SEP OCT
25°N
30°N
35°N
40°N
45°N
APR MAY JUN JUL AUG SEP OCT
25°N
30°N
35°N
40°N
45°N
2
4
6
8
10
12
14
16
DateAPR MAY JUN JUL AUG SEP OCT
25°N
30°N
35°N
40°N
45°N
DateAPR MAY JUN JUL AUG SEP OCT
25°N
30°N
35°N
40°N
45°N
2
4
6
8
10
12
14
16
Fig.9. Seasonal shift of 10-year mean rainbelt over eastern China(mm d-1)
(a) Observation; (b) Ensemble; (c) RIEMS; (d) RegCM2b; (e) NJUM; (f) SNU RCM; (g) MRI; (h) CSIRO CCAM
(b)(a)
(a)
(c)
(e)
(g) (h)
(f)
(d)
(b)
Fig. 8. Interannual variation of precipitation on the continent. (a) winter; (b) summer.
be the interannual variability of the precipitation. Fig-ure 7 shows the spatial distribution of interannual vari-ability of July precipitation. The shaded areas in thefigure mean that the difference of the interannual vari-ability between the simulation and the observations isnot statistically significant. Here, an F -test for a sig-nificance level of 0.05 is used to perform the statisticalsignificance test.
Most models can reasonably simulate the spatialdistribution and magnitude of the interannual vari-ability of the precipitation. Over most areas, the dif-ference between the simulation and the observationsis not significant, i.e., models can better simulate theinterannual variability of precipitation. In northernChina, i.e., in the Talimu basin of Xinjiang and InnerMongolia, the interannual variability of the precipita-

NO. 4 FENG AND FU 539
4
Year
Ano
mal
y of
Pre
cipi
tatio
n(%
)
1989 1990 1991 1992 1993 1994 1995 1996 1997 1998−30
−20
−10
0
10
20
30
Year
Ano
mal
y of
Pre
cipi
tatio
n(%
)
1989 1990 1991 1992 1993 1994 1995 1996 1997 1998−30
−20
−10
0
10
20
Fig.8. Interannual variation of precipitation in the continent
(a) winter; (b) summer
APR MAY JUN JUL AUG SEP OCT
25°N
30°N
35°N
40°N
45°N
APR MAY JUN JUL AUG SEP OCT
25°N
30°N
35°N
40°N
45°N
2
4
6
8
10
12
14
16
APR MAY JUN JUL AUG SEP OCT
25°N
30°N
35°N
40°N
45°N
APR MAY JUN JUL AUG SEP OCT
25°N
30°N
35°N
40°N
45°N
2
4
6
8
10
12
14
16
APR MAY JUN JUL AUG SEP OCT
25°N
30°N
35°N
40°N
45°N
APR MAY JUN JUL AUG SEP OCT
25°N
30°N
35°N
40°N
45°N
2
4
6
8
10
12
14
16
DateAPR MAY JUN JUL AUG SEP OCT
25°N
30°N
35°N
40°N
45°N
DateAPR MAY JUN JUL AUG SEP OCT
25°N
30°N
35°N
40°N
45°N
2
4
6
8
10
12
14
16
Fig.9. Seasonal shift of 10-year mean rainbelt over eastern China(mm d-1)
(a) Observation; (b) Ensemble; (c) RIEMS; (d) RegCM2b; (e) NJUM; (f) SNU RCM; (g) MRI; (h) CSIRO CCAM
(b)(a)
(a)
(c)
(e)
(g) (h)
(f)
(d)
(b)
Fig. 9. Seasonal shift of the 10-year mean rainbelt over eastern China (mm d−1). (a) Observation; (b) Ensemble;
(c) RIEMS; (d) RegCM2b; (e) NJUM; (f) SNU RCM; (g) MRI; (h) CSIRO CCAM.
tion is larger than in other areas. Except forRegCM2b, all the models can basically simulate thisspatial pattern. In addition, the models can also sim-ulate the center of the larger precipitation variabilitynear Pakistan. The interannual variability of the Julyprecipitation simulated by the models is larger thanthe observations in the western Pacific.
Most of the models can reproduce the interan-nual variation of winter and summer precipitation inthe continental region, but there is a large differenceamong the models (Fig. 8). Considering the continen-tal region and all sub-regions, the interannual variationof the precipitation simulated in winter is better thanthat in summer. The results of the models CSIRO
CCAM and MRI are not as good as the other models.
4.3 Shift of major rainbelt
The seasonal shift of the monsoon rainbelt is one ofthe main climatic characteristics in the east of China,which determines the basic pattern of the regional pre-cipitation distribution during China’s rainy season.
Figure 9 shows the seasonal shift of the 10-yearmean rainbelt for eastern China. The longitudinalrange selected for averaging the precipitation is 110◦–120◦E. The lateral abscissa represents the date. Theensemble represents the results of the arithmetical av-erage of five RCMs. The observations show that theintensive precipitation emerges on the last several daysof April, and the rainbelt is at about 23◦N from early
540 INTER-COMPARISON OF 10-YEAR PRECIPITATION SIMULATED BY RCMs VOL. 23
May till early June. Then it shifts northward to 28◦–32◦N and then remains over the Changjiang-Huaihevalley during early June throughout mid July. It shiftsnorthward again at the end of July and reaches NorthChina. In mid August, the rainbelt begins to retreatsouthward and returns back to southern China at theend of August or the beginning of September.
The intensity and evolution of the rainbelt can bewell simulated by the models NJUM and SNU RCM.They can simulate the northward shift but fail to showthe southward retreat. The intensity of the rainbeltsimulated by RegCM2b and MRI is much weaker thanthe observations, and therefore, many main character-istics of the rainbelts have not yet been simulated. Therainbelt simulated by RIEMS over the Changjiang-Huaihe valley is much stronger than the observationsand its northward jump stage is simulated earlier thanits observation, but the southward retreat is simulatedwell. In addition, the rainbelt simulated by CSIROCCAM is much stronger than the observations. Ingeneral, the location of the North China rainbelt sim-ulated by the six models is situated further north thanthe observations. Besides, the ensemble results of theRCMs are relatively closer to the observations thanmost of the models
5. Conclusions
Five different RCMs and a global variable resolu-tion model are used to simulate a 10-year regional cli-mate of Asia in the phase II of RMIP. In this paper,the simulated precipitation is adopted in comparingand analyzing the differences between simulations andthe observations. The main results are briefly con-cluded as follows:
(1) Most models can simulate the basic spatial pat-tern of precipitation, but the location and intensity ofthe rainbelt center have differences from the observa-tions. Most models overestimate the precipitation inmost continental regions. The seasonal variation ofprecipitation can be simulated, but there are large dif-ferences in the regional precipitation among the mod-els.
(2) The biases of the stream fields are importantreasons behind the simulation errors of RCMs. Also,the deviation of the large-scale driving fields may beone reason for the simulation biases. The cumulus pa-rameterization scheme and land surface process havea large influence on the precipitation simulation. Thegrell scheme generally produces more precipitationthan the Kuo-Anthes scheme.
(3) Most models can reproduce the spatial distri-bution of the interannual variability of precipitation.
Most models can basically simulate the trend of the in-terannual variation of precipitation, but there are largedifferences in the magnitude of precipitation amongthe models.
(4) The models can reasonably simulate the evo-lution of the main rainbelt in the east of China, viz.,the major rainbelt shifting northward and retreatingsouthward during the rainy season in China, althoughlarge differences exist among the models.
Acknowledgments. This project was supported
by the RMIP for Asia from the Asia-Pacific Network for
Global Change Research (APN) and the National Key
Program for Developing Basic Sciences (2006CB400500).
Thanks go to all participants for their efforts in conduct-
ing the model simulations and data collection.
REFERENCES
Chen Ming, and Fu Congbin, 2000: A nest procedure be-tween regional and global climate model and its ap-plication in long term climate simulations. Chinese J.Atmos. Sci., 24(2), 253–262. (in Chinese)
Christensen, J. H., B. Machenhauer, R. G. Jones, C. Schar,P. M. Ruti, M. Castro, and G. Visconti, 1997: Valida-tion of present-day regional climate simulations overEurope: LAM simulations with observed boundaryconditions. Climate Dyn., 13, 489–506.
Dickinson, R. E., R. M. Errico, F. Giogi, and G. T. Bates,1989: A regional climate model for the western UnitedStates. Climate Change, 15, 383–422.
Fu Congbin, Wei Helin, and Chen Ming, 1998: Simulationof the evolution of summer monsoon rainbelts overeastern China from regional climate model. ChineseJ. Atmos. Sci., 22(4), 522–534. (in Chinese)
Fu Congbin, Wang Shuyu, Xiong Zhe, and Feng Jinming,2004: Progress Report on Regional Climate ModelIntercomparison Project for Asia. Climatic and Envi-ronmental Research, 9(2), 225–239. (in Chinese)
Fu Congbin, Wei Heilin, and Qian Yun, 2000: Documen-tation on a Regional Integrated Environment ModelSystem (RIEMS version 1). TEACOM Science Re-port No.1, START Regional Committee for Temper-ate East Asia, Beijing, China, 1–26.
Fu Congbin, and Zeng Zhaomei, 1998: MonsoonµThehighest rate of precipitation changes observed fromglobal data. Chinese Science Bulletin, 43, 662–666.
Fu, C. B., and Coauthors, 2005: Regional Climate ModelIntercomparison Project for Asia. Bull. Amer. Me-teor. Soc., 86, 257–266.
Gao Xuejie, Zhao Zongci, Ding Yihui, Huang Ronghui, andF. Giorgi, 2001: Climate change due to greenhouseeffects in China as simulated by a regional climatemodel. Adv. Atmos. Sci., 18(6), 1224–1230.
Gates, W. L., 1992: AMIP :The Atmospheric ModelIntercomparison Project. Bull. Amer. Meteor. Soc.,73(12), 1962–1970.
NO. 4 FENG AND FU 541
Giorgi, F., 1990: Simulation of regional climate using a lim-ited area model nested in a general circulation model.J. Climate, 3, 941–963.
Giorgi, F., 1991: Sensitivity of simulated summertime pre-cipitation over the western United States to differ-ent physics parameterizations. Mon. Wea. Rev., 119,2870–2888.
Giorgi, F., and L. Mearns, 1991: Approaches to the simu-lation of regional climate change. Rev. Geophys., 29,191–216.
Giorgi, F., and M. R. Marinucci, 1991: Validation of a re-gional atmospheric model over Europe: Sensitivity ofwintertime and summertime simulations to selectedphysics parameterizations and lower boundary condi-tions. Quart. J. Roy. Meteor. Soc., 117(502), 1171–1206.
Giorgi, F., G. T. Bates, and M. R. Marinucci, 1993a:Development of a second-generation regional climatemodel (RegCM2). Part I: Boundary-layer and radia-tive transfer processes. Mon. Wea. Rev., 121, 2794–2812.
Giorgi, F., M. R. Marinucci, and G. T. Bates, 1993b:Development of a second-generation regional climatemodel (RegCM2). Part II: Convective processes andassimilation of lateral boundary conditions. Mon.Wea. Rev., 121(10), 2814–2832.
Gong Wei, and Li Weiliang, 1997: Simulation of severestorm rainfall event in 1991 over Changjiang-HuaiheRiver valley with a Chinese regional climate model.Quarterly Journal of Applied Meteorology, 8(3), 325–334. (in Chinese)
Kato, H., K. Nishizawa, H. Hirakuchi, S. Kadokura,N. Oshima, and F. Giorgi, 2001: Performance ofRegCM2.5/NCAR-CSM nested system for the simu-lation of climate change in East Asia caused by globalwarming. J. Meteor. Soc. Japan, 79, 99–121.
Kato, H., H. Hirakuchi, K. Nishizawa, and F. Giorgi, 1999:Performance of the NCAR RegCM in the simulationsof June and January climates over eastern Asia andthe high-resolution effect of the model. J. Geophys.Res., 104, 6455–6476.
Lee, D. K., and H. S. Kang, 1999: Coupling ofthe NCAR/LSM into the MM5 and its applica-tion for the East Asian summer monsoon. Preprints,Ninth PSU/NCAR Mesoscale Model Users, Work-shop, Boulder, CO, NCAR, 198–201.
Lee, D. K., and M. S. Suh, 2000: Ten-year East Asiansummer monsoon simulation using a regional climatemodel (RegCM2). J. Geophys. Res., 105, 29565–29577.
Lee, D. K., and Y. Kim, 1992: Variability of East Asiansummer monsoon during the period of 1980–1989.Journal of Korean Meteorological Sociatg, 28(3), 315–331.
Leung, L. R., S. J. Ghan, Z. C. Zhao, Y. Luo, W. C. Wang,and H. L. Wei, 1999: Intercomparison of regional cli-mate simulation of the 1991 summer monsoon in east-ern Asia. J. Geophys. Res., 104, 425–454.
Liu Yongqian, and Ding Yihui, 1995: A review of the studyon simulation of regional climate. Quarterly Journalof Applied Meteorology, 6(2), 228–239. (in Chinese)
Liu Yongqian, Ding Yihui, and Zhao Zongci, 1996: A Re-gional Climate Simulation of the High Precipitationover the Changjiang-Huaihe Valley in 1991. ModelStudy on the Short-term Climate Prediction in China,China Meteorological Press, Beijing, 106–120. (in Chi-nese)
Lu Er, and Ding Yihui, 1997: Nature of precipitation andactivity of cumulus convection during the 1991 Meiyuseason. Acta Meteorologica Sinica, 55(3), 318–534. (inChinese)
Luo Yong, and Zhao Zongci, 1997: Numerical simulationof East Asian regional climate with NCAR RegCM2.Quarterly Journal of Applied Meteorology, 9(Suppl.),124–133. (in Chinese)
Luo Yong, Wang Shaowu, Dang Hongyan, and ZhaoZongci, 2002: Recent advances in climate models andmodel intercomparison projects. Advance in EarthSciences, 17(3), 372–377. (in Chinese)
Mabuchi, K., Y. Sato, and H. Kida, 2002: Verification ofthe climatic features of a regional climate model withBAIM. J. Meteor. Soc. Japan, 80, 621–644.
McGregor, J. L., 1996: Semi-Lagrangian advection onconformal-cubic grids. Mon. Wea. Rev., 124, 1311–1322.
McGregor, L. J., and J. J. Katzfey, 1998: Simulat-ing typhoon recurvature with a variable resolutionconformal-cubic model. Research Activities in Atmo-spheric and Oceanic Modeling, WMO/TD-No. 942,3.19–3.20.
Pal, J. S., F. Giorgi, and Bi Xunqiang, 2004: Consis-tency of recent European summer precipitation trendsand extremes with future regional climate projections.Geophys. Res. Lett., 31(13), L13202(1–4).
Shi Xueli, Ding Yihui, and Liu Yiming, 2001: Simulationexperiments of summer rainbelt in China with theregional climate model. Climatic and EnvironmentalResearch, 6(2), 249–254. (in Chinese)
Takle, E. S., and Coauthors, 1999: Project to IntercompareRegional Climate Simulations (PIRCS): Descriptionand initial results J. Geophys. Res., 104, 443–462.
Tang Jianping, Su Bingka, Zhao Ming, and Zhao Dehing,2004: Long term climate change numerical simula-tion in east Asia. Acta Meterological Sinica, 62(6).752–763. (in Chinese)
Wang Shiyu, and Zhang Yaocun, 1999: Simulation of re-gional climate over eastern China with different re-gional climate models. Plateau Meteorology, 18(1),28–38. (in Chinese)
Wang Shaowu, and Zhu Jinhong, 1997: AtmosphericModel Intercomparison Project (AMIP). QuarterlyJournal of Applied Meteorology, 8(Suppl.), 92–99. (inChinese)
Wang Huijun, 1997: The advance of the AtmosphericModel Intercomparison Project (AMIP). Chinese J.Atmos. Sci., 21(5), 633–637. (in Chinese)

542 INTER-COMPARISON OF 10-YEAR PRECIPITATION SIMULATED BY RCMs VOL. 23
Xie, P., and P. A. Arkin, 1997: Global precipitation: A 17-year monthly analysis based on gauge observations,satellite estimates, and numerical model output. Bull.Amer. Meteor. Soc., 78, 2539–2558.
Xiong Zhe, Wang Shuyu, Zeng Zhaomei, and Fu Cong-bin, 2003: Analysis of simulated heavy rain over theYangtze River valley during 11–30 June 1998 usingRIEMS. Adv. Atmos. Sci., 20, 815–824.
Zhao Zongci, and Luo Yong, 1997: Simulations of summermonsoon over East Asia: Inter-comparisons of threeregional climate models. Quarterly Journal of AppliedMeteorology, 8(Suppl.), 116–123. (in Chinese)
Zheng Yiqun, and Qian Yongfu, 2002: Effects of ini-tial/lateral boundary conditions on regional climatesimulations. Chinese J. Atmos. Sci., 26(6), 794–806.(in Chinese)
Retraction:
ZHOU Libo, ZOU Han, and GAO Yongqi, 2006: Middle-High Latitude N2O Distributions Related to the ArcticVortex Breakup. Adv. Atmos. Sci., 23(2), 215–223.
Editorial Statement
WU Guoxiong, WANG Huijun, and Da-Lin ZHANGCo-Chief Editors
At the request of Dr. Hideharu AKIYOSHI of the National Institute for Environmental Studies (NIES) ofJapan and with the apology of Dr. ZHOU Libo for his misconduct, we hereby announce that the paper of“Middle-High Latitude N2O Distributions Related to the Arctic Vortex Breakup”, authored by ZHOU Libo,ZOU Han, and GAO Yongqi, be retracted from Volume 23, No. 2, March 2006 of Advances in AtmosphericSciences (AAS) on page number 215–223. This paper will not be considered as a published paper in AAS,and it will not appear in any future reference or record. In fact, this paper should not have been submittedfor consideration for publication in AAS, because it was based on the scientific ideas and research previouslyconducted by Dr. Hideharu AKIYOSHI and his group at NIES.
AAS has long carried out strict policies to protect the right of original intellectual property and uphold thehighest ethical standard. According to AAS’ policy (see Wu et al., 2004), we decide that AAS will refuse toaccept any submission from the first author of the above-mentioned paper, Dr. ZHOU Libo, for a period ofthree years (i.e., May 2006–April 2009) as a punishment for his misconduct.
It is our expectation that all co-authors can attest the originality and scientific integrity of their schol-arly paper before signing their names at the time of submitting it to AAS. Following common practices ofmany international journals, all the co-authors of the paper shall share the associated responsibility and bedisciplined according to established rules and procedures of AAS, when any misconduct, such as fabrication,multi-submissions, falsification, plagiarism, or other serious deviation from accepted practices, can be deter-mined. Therefore, we would like to advise all the authors to take the above issue seriously when signing theirnames.
Reference
Wu Guoxiong, Wang Huijun, and D.-L. Zhang, 2004: Editorial statement—Action and policy. Adv. Atmos.Sci., 21(3), 382.
Copyright © 2022 FDOKUMEN