Integrative ecotoxicological assessment of sediment in Portmán Bay (southeast Spain)
12
See discussions, stats, and author profiles for this publication at: https://www.researchgate.net/publication/26679596 Integrative ecotoxicological assessment of sediment in Portman Bay (southeast Spain) Article in Ecotoxicology and Environmental Safety · August 2009 DOI: 10.1016/j.ecoenv.2008.12.001 · Source: PubMed CITATIONS 25 READS 98 6 authors, including: Some of the authors of this publication are also working on these related projects: Tolerance to HEAT stress induced by climate change in the seaGRASS Posidonia oceanica View project Assessment of the bioavailability of metals in sediments acidified by infusion using CO2 bivalves (Crassostrea brasiliana) View project Augusto Cesar Universidade Federal de São Paulo 60 PUBLICATIONS 787 CITATIONS SEE PROFILE Arnaldo Marín University of Murcia 132 PUBLICATIONS 1,830 CITATIONS SEE PROFILE Lázaro Marín-Guirao Stazione Zoologica Anton Dohrn di Napoli 71 PUBLICATIONS 996 CITATIONS SEE PROFILE Javier Lloret Marine Biological Laboratory 46 PUBLICATIONS 634 CITATIONS SEE PROFILE All content following this page was uploaded by Lázaro Marín-Guirao on 03 December 2016. The user has requested enhancement of the downloaded file. All in-text references underlined in blue are added to the original document and are linked to publications on ResearchGate, letting you access and read them immediately.
Transcript of Integrative ecotoxicological assessment of sediment in Portmán Bay (southeast Spain)

Seediscussions,stats,andauthorprofilesforthispublicationat:https://www.researchgate.net/publication/26679596
IntegrativeecotoxicologicalassessmentofsedimentinPortmanBay(southeastSpain)
ArticleinEcotoxicologyandEnvironmentalSafety·August2009
DOI:10.1016/j.ecoenv.2008.12.001·Source:PubMed
CITATIONS
25
READS
98
6authors,including:
Someoftheauthorsofthispublicationarealsoworkingontheserelatedprojects:
TolerancetoHEATstressinducedbyclimatechangeintheseaGRASSPosidoniaoceanicaView
project
AssessmentofthebioavailabilityofmetalsinsedimentsacidifiedbyinfusionusingCO2bivalves
(Crassostreabrasiliana)Viewproject
AugustoCesar
UniversidadeFederaldeSãoPaulo
60PUBLICATIONS787CITATIONS
SEEPROFILE
ArnaldoMarín
UniversityofMurcia
132PUBLICATIONS1,830CITATIONS
SEEPROFILE
LázaroMarín-Guirao
StazioneZoologicaAntonDohrndiNapoli
71PUBLICATIONS996CITATIONS
SEEPROFILE
JavierLloret
MarineBiologicalLaboratory
46PUBLICATIONS634CITATIONS
SEEPROFILE
AllcontentfollowingthispagewasuploadedbyLázaroMarín-Guiraoon03December2016.
Theuserhasrequestedenhancementofthedownloadedfile.Allin-textreferencesunderlinedinblueareaddedtotheoriginaldocument
andarelinkedtopublicationsonResearchGate,lettingyouaccessandreadthemimmediately.
This article appeared in a journal published by Elsevier. The attachedcopy is furnished to the author for internal non-commercial researchand education use, including for instruction at the authors institution
and sharing with colleagues.
Other uses, including reproduction and distribution, or selling orlicensing copies, or posting to personal, institutional or third party
websites are prohibited.
In most cases authors are permitted to post their version of thearticle (e.g. in Word or Tex form) to their personal website orinstitutional repository. Authors requiring further information
regarding Elsevier’s archiving and manuscript policies areencouraged to visit:
http://www.elsevier.com/copyright

Author's personal copy
Review
Integrative ecotoxicological assessment of sediment in Portman Bay(southeast Spain)
Augusto Cesar a,b,�, Arnaldo Marın b, Lazaro Marin-Guirao b, Ruben Vita b, Javier Lloret b,Tomas Angel Del Valls c
a Departamento de Ecotoxicologia, Universidade Santa Cecılia, Rua Oswaldo Cruz 266, Santos, Sao Paulo 11045-907, Brazilb Departamento de Ecologıa e Hidrologıa, Facultad de Biologıa, Universidad de Murcia, 30100 Murcia, Spainc Catedra UNESCO/UNITWIN/WiCop, Departamento de Quımica Fısica, Facultad de Ciencias del Mar y Ambientales, Universidad de Cadiz, CP 11510 Puerto Real, Cadiz, Spain
a r t i c l e i n f o
Article history:
Received 5 December 2007
Received in revised form
25 November 2008
Accepted 2 December 2008Available online 16 July 2009
Keywords:
Metal contamination
Sediment toxicity tests
Benthic index
Weight of evidence
Integrative assessment
a b s t r a c t
Portman Bay, southeast Spain, contains the most seriously metal-contaminated sediments of the
Mediterranean Sea. From 1958 to 1991, approximately 50 million tons of mine tailings were dumped
into the bay, completely filling up the bay and dispersing over an extensive area of the continental
platform and continental slope. The objective of our study was to characterize the nature and extent of
metal contamination and the responses of natural communities to it and to assess the toxicity of the
sediment deposits 10 years after mining had ceased. We studied the physical and chemical
characteristics of the sediments and toxicity (of the porewater and sediment–water interface) using
two sea urchin species (Arbacia lixula and Paracentrotus lividus). Metal bioavailability and patterns of
macroinvertebrate community composition along the contamination gradient were also studied.
Univariate and multivariate analyses showed positive correlation between the sediment metal
concentrations associated to the all biological effects (sea urchins toxicity tests and benthic indices).
The effects of sediment contamination on the benthic community structure are visible among sampling
stations.
& 2008 Elsevier Inc. All rights reserved.
Contents
1. Introduction . . . . . . . . . . . . . . . . . . . . . . . . . . . . . . . . . . . . . . . . . . . . . . . . . . . . . . . . . . . . . . . . . . . . . . . . . . . . . . . . . . . . . . . . . . . . . . . . . . . . . 1833
2. Materials and methods . . . . . . . . . . . . . . . . . . . . . . . . . . . . . . . . . . . . . . . . . . . . . . . . . . . . . . . . . . . . . . . . . . . . . . . . . . . . . . . . . . . . . . . . . . . . 1833
2.1. Sample collection and field measurements . . . . . . . . . . . . . . . . . . . . . . . . . . . . . . . . . . . . . . . . . . . . . . . . . . . . . . . . . . . . . . . . . . . . . . . 1833
2.2. Sediment chemical and physical analysis . . . . . . . . . . . . . . . . . . . . . . . . . . . . . . . . . . . . . . . . . . . . . . . . . . . . . . . . . . . . . . . . . . . . . . . . . 1834
2.3. Toxicity testing. . . . . . . . . . . . . . . . . . . . . . . . . . . . . . . . . . . . . . . . . . . . . . . . . . . . . . . . . . . . . . . . . . . . . . . . . . . . . . . . . . . . . . . . . . . . . . 1835
2.4. Benthic community analysis . . . . . . . . . . . . . . . . . . . . . . . . . . . . . . . . . . . . . . . . . . . . . . . . . . . . . . . . . . . . . . . . . . . . . . . . . . . . . . . . . . . 1835
2.5. Statistical analysis . . . . . . . . . . . . . . . . . . . . . . . . . . . . . . . . . . . . . . . . . . . . . . . . . . . . . . . . . . . . . . . . . . . . . . . . . . . . . . . . . . . . . . . . . . . 1835
2.6. Multivariate analysis approach . . . . . . . . . . . . . . . . . . . . . . . . . . . . . . . . . . . . . . . . . . . . . . . . . . . . . . . . . . . . . . . . . . . . . . . . . . . . . . . . . 1835
3. Results . . . . . . . . . . . . . . . . . . . . . . . . . . . . . . . . . . . . . . . . . . . . . . . . . . . . . . . . . . . . . . . . . . . . . . . . . . . . . . . . . . . . . . . . . . . . . . . . . . . . . . . . . 1835
3.1. Sediment chemical and physical analysis . . . . . . . . . . . . . . . . . . . . . . . . . . . . . . . . . . . . . . . . . . . . . . . . . . . . . . . . . . . . . . . . . . . . . . . . . 1835
3.2. Toxicity testing. . . . . . . . . . . . . . . . . . . . . . . . . . . . . . . . . . . . . . . . . . . . . . . . . . . . . . . . . . . . . . . . . . . . . . . . . . . . . . . . . . . . . . . . . . . . . . 1836
3.3. Benthic community analysis . . . . . . . . . . . . . . . . . . . . . . . . . . . . . . . . . . . . . . . . . . . . . . . . . . . . . . . . . . . . . . . . . . . . . . . . . . . . . . . . . . . 1837
3.4. Multivariate approach . . . . . . . . . . . . . . . . . . . . . . . . . . . . . . . . . . . . . . . . . . . . . . . . . . . . . . . . . . . . . . . . . . . . . . . . . . . . . . . . . . . . . . . . 1837
4. Discussion . . . . . . . . . . . . . . . . . . . . . . . . . . . . . . . . . . . . . . . . . . . . . . . . . . . . . . . . . . . . . . . . . . . . . . . . . . . . . . . . . . . . . . . . . . . . . . . . . . . . . . 1839
5. Conclusions . . . . . . . . . . . . . . . . . . . . . . . . . . . . . . . . . . . . . . . . . . . . . . . . . . . . . . . . . . . . . . . . . . . . . . . . . . . . . . . . . . . . . . . . . . . . . . . . . . . . . 1840
Acknowledgments . . . . . . . . . . . . . . . . . . . . . . . . . . . . . . . . . . . . . . . . . . . . . . . . . . . . . . . . . . . . . . . . . . . . . . . . . . . . . . . . . . . . . . . . . . . . . . . . 1840
References . . . . . . . . . . . . . . . . . . . . . . . . . . . . . . . . . . . . . . . . . . . . . . . . . . . . . . . . . . . . . . . . . . . . . . . . . . . . . . . . . . . . . . . . . . . . . . . . . . . . . . 1841
ARTICLE IN PRESS
Contents lists available at ScienceDirect
journal homepage: www.elsevier.com/locate/ecoenv
Ecotoxicology and Environmental Safety
0147-6513/$ - see front matter & 2008 Elsevier Inc. All rights reserved.
doi:10.1016/j.ecoenv.2008.12.001
� Corresponding author at: Departamento de Ecotoxicologia, Universidade Santa Cecılia, Rua Oswaldo Cruz 266, Santos, Sao Paulo 11045-907, Brazil.
Fax: +5513 32345297.
E-mail address: [email protected] (A. Cesar).
Ecotoxicology and Environmental Safety 72 (2009) 1832–1841

Author's personal copy
1. Introduction
The mining of metals in the area of Portman (Murcia, southeastSpain) has a long history. The name Portman is derived from theLatin ‘‘Portus Magnus’’, because it was a natural harbor fromwhich lead was embarked for use throughout the Roman Empire.The surrounding mountains, which are rich in metals, containnumerous old Roman lead mines. The bay itself is a metal-polluted area, where benthic communities have experiencedcenturies of impairment from the drainage and sedimentationassociated with mining activities and their abandonment. From1958 to 1991, the Penarroya mine pumped 3–10,000 ton of tailingsper day, first directly into the bay and later, when the bay wasfilled up through an emissary of more than 2 km length. In total,approximately 50 million tons of mine tailing were dumped intoPortman Bay during this period. In the extraction process 2 m3 ofwater were used per ton of mineral and a ton of sodium cyanide,some 10 ton of sulfuric acid, and also, copper sulfate were usedeach day. All this material was poured into the sea includingthe remains of metals known to be toxic, such as cadmium,copper, lead, and zinc. After filling up the bay, the mining wastesdispersed over an extensive area of the continental platform andthe active disposal area extended beyond the continental shelfthrough a submarine canyon. The spatial distribution of metalcontamination (Cd, Pb, and Zn) in the water column andsediments was characterized during the 1980s (Rey and Del Rıo,1983; Perez and Puente, 1989; De Leon et al., 1984). However, thetoxicity of these sediments and the interactive effects on benthiccommunities have not been addressed by previous studies.
We have selected two different toxicity tests, the sediment–water interface and the porewater toxicity tests, since they utilizedifferent matrices and therefore present different ecologicalsignificance due to the different route of exposure that organismsare exposed to contaminants. Echinoderm embryo-larval devel-opment tests have been widely used to characterize a variety oftoxicants, including liquid and solid phase protocols (Hunt et al.,2001). The assessment of sediment quality generally involves anevaluation of solid phase sediments, although porewater is alsoimportant, because it represents a major route of exposure tobenthic organisms and substantially influences the bioavailabilityof contaminants (Whiteman et al., 1996; Long et al., 2003).
We evaluated the structure of communities with univariatemeasures (Shannon–Wiener diversity, Margalef’s richness,Pielou’s evenness, RBI and EBI indices) and multivariate analyses(Multidimensional Scaling). The multi-metric RBI (relative benthicindex) and EBI (exploratory benthic index) use a simple scoringsystem for benthic community metrics to assess benthic commu-nity health and to infer environmental quality of benthic habitatsin Portman in a state previous to the project of restoration of theBay. The EBI index was adapted in this study to evaluate ecologicaldegradation of benthic communities and to identify concentra-tions of chemicals that are associated with biological impactsthrough multivariate analysis.
In the present work we studied the physical and chemicalcharacteristics of the sediments, the effect of the porewaterand sediment–water interface on marine invertebrates, metalbioavailability, and patterns of macroinvertebrate communitycomposition along the contamination gradient to evaluate thestatus and trends of environmental conditions in Portman Bayecosystems. The goals of this study were: (a) to determineconcentration of metals in sediment and relationships betweencontamination and biological effects; (b) to adapt and developbenthic index to evaluate effects of metal contamination; (c) tointegrate chemical, toxicological, and ecological data to asses thesediment quality, aiming to categorize sampling stations forfuture investigation and management.
The use of weigh-of-evidence (WOE) approach, improves thecharacterization of ‘gray areas’ of pollution and helps in thedetermination of the bioavailability of metals, besides being ofgreat importance and usefulness of the integrative studies of thesediment quality assessment, before and after the application ofmanagement strategies.
2. Materials and methods
2.1. Sample collection and field measurements
Samples were collected synoptically along a spatial gradient at the same depth
(10–20 m) in March 2002. The spatial sampling design followed previous studies
(September and December 1999, October 2000) (Cesar, et al., 2004). Sampling
stations were selected at regular distances (8 km approximately) between the old
mine discharge and Cabo de Palos (West–East; Fig. 1), while the reference station
ARTICLE IN PRESS
N
3 Km
Fig. 1. (A) Map of the study area and (B) location of sediment sampling stations, IF—Isla del Fraile; PG—Punta Galera (old emission point); PN—Punta Negra; CN—Cabo
Negrete; CM—Canto de la Manceba; PL—Punta de la Loma Larga, and PE—Punta Espada.
A. Cesar et al. / Ecotoxicology and Environmental Safety 72 (2009) 1832–1841 1833
Author's personal copy
was located on Fraile Island, approximately 60 km to the south of the old emission
point, but is also affected by historical mining activity. The control station was
select in the opposite extreme of the spatial gradient near the Cabo Palos (Punta
Espada) at 20 km from the old emission point. Replicate samples (n ¼ 4) were
collected from all points (n ¼ 7) along the contamination gradient on a spatial
scale (kilometers) considered appropriate for examining differences along the
gradient.
SCUBA divers collected, capped, and sealed intact sediment cores carefully
underwater and retained in the polyethylene tubes (10:15 cm diameter/height)
throughout storage (4 1C in the dark). Sediment samples were divided into
subsamples for the chemical analyses and toxicity testing to maximize the
potential for data integration. Only the top 5 cm of the superficial sediment was
used for subsamples. Sediments were stored for no longer than 7 days, prior to
toxicity testing. Approximately 100 ml of porewater was extracted from each liter
of sediment sampled by centrifugation (2500g) for 10 min at 4 1C. The supernatant
was decanted and the process was repeated to remove any remaining particles. We
kept porewater extracts for no longer than 24 h prior to toxicity testing. The control
and dilution water used in the experiments consisted of natural seawater collected
in unpolluted areas (where the sea urchins were also collected) and filtered
through a GFC Watmans filter. Laboratory subsampling took place under strictly
anaerobic conditions for acid-volatile sulfide and simultaneously extract metals
(SEM-AVS), and were stored frozen (�20 1C) to prevent sulfide oxidation.
Four replicate samples were collected by SCUBA divers from each sampling
station for benthic analysis using a 0.04 m2 metal hand grab and sieved through a
500mm mesh. The macroinvertebrates retained on the screen were fixed with 4%
buffered formalin, and later washed and transferred to 70% isopropyl alcohol prior
to sorting and identifying the macrofauna. The individual taxa of each sieved
sample was identified and enumerated in the laboratory by stereoscope
microscopy to assess species richness and abundance. All the organisms were
sorted and identified to the lowest possible taxon level and their abundance was
counted.
Field measurements (station coordinates and depth) were made and
sediment–water interface variables (temperature, salinity, OD, pH, Eh) were
measured to compare with the limits of tolerance of the species test at the time of
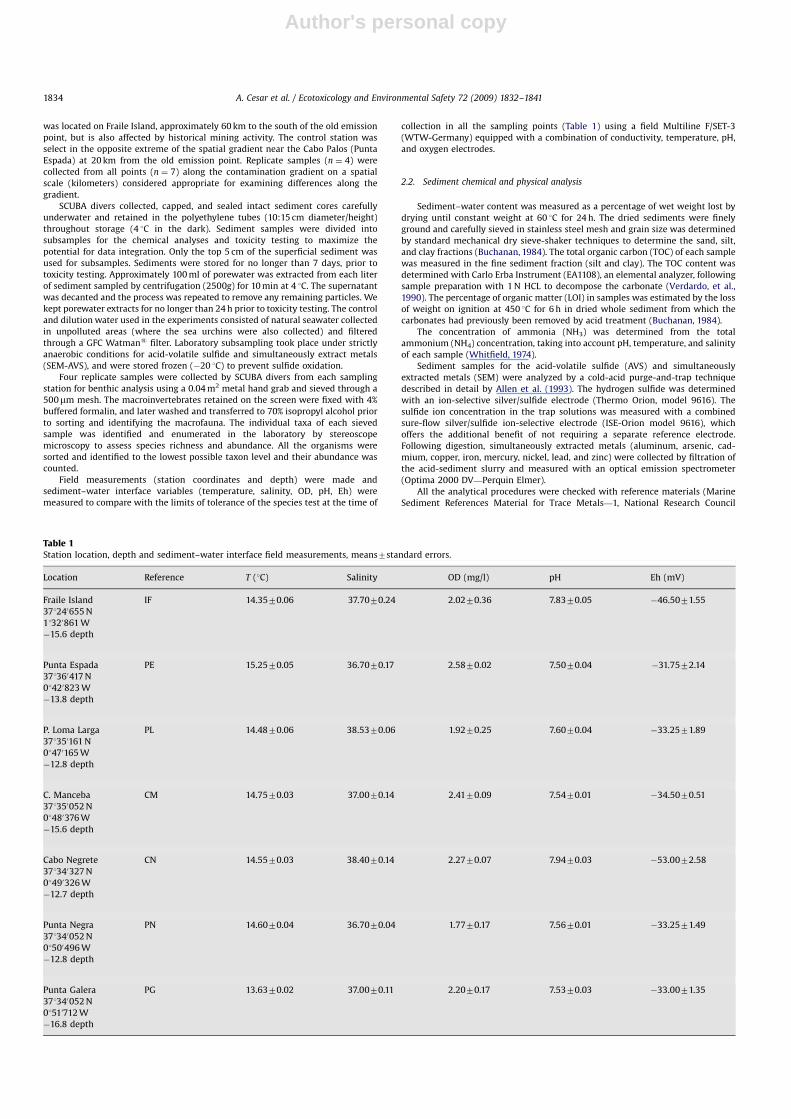
collection in all the sampling points (Table 1) using a field Multiline F/SET-3
(WTW-Germany) equipped with a combination of conductivity, temperature, pH,
and oxygen electrodes.
2.2. Sediment chemical and physical analysis
Sediment–water content was measured as a percentage of wet weight lost by
drying until constant weight at 60 1C for 24 h. The dried sediments were finely
ground and carefully sieved in stainless steel mesh and grain size was determined
by standard mechanical dry sieve-shaker techniques to determine the sand, silt,
and clay fractions (Buchanan, 1984). The total organic carbon (TOC) of each sample
was measured in the fine sediment fraction (silt and clay). The TOC content was
determined with Carlo Erba Instrument (EA1108), an elemental analyzer, following
sample preparation with 1 N HCL to decompose the carbonate (Verdardo, et al.,
1990). The percentage of organic matter (LOI) in samples was estimated by the loss
of weight on ignition at 450 1C for 6 h in dried whole sediment from which the
carbonates had previously been removed by acid treatment (Buchanan, 1984).
The concentration of ammonia (NH3) was determined from the total
ammonium (NH4) concentration, taking into account pH, temperature, and salinity
of each sample (Whitfield, 1974).
Sediment samples for the acid-volatile sulfide (AVS) and simultaneously
extracted metals (SEM) were analyzed by a cold-acid purge-and-trap technique
described in detail by Allen et al. (1993). The hydrogen sulfide was determined
with an ion-selective silver/sulfide electrode (Thermo Orion, model 9616). The
sulfide ion concentration in the trap solutions was measured with a combined
sure-flow silver/sulfide ion-selective electrode (ISE-Orion model 9616), which
offers the additional benefit of not requiring a separate reference electrode.
Following digestion, simultaneously extracted metals (aluminum, arsenic, cad-
mium, copper, iron, mercury, nickel, lead, and zinc) were collected by filtration of
the acid-sediment slurry and measured with an optical emission spectrometer
(Optima 2000 DV—Perquin Elmer).
All the analytical procedures were checked with reference materials (Marine
Sediment References Material for Trace Metals—1, National Research Council
ARTICLE IN PRESS
Table 1Station location, depth and sediment–water interface field measurements, means7standard errors.
Location Reference T (1C) Salinity OD (mg/l) pH Eh (mV)
Fraile Island IF 14.3570.06 37.7070.24 2.0270.36 7.8370.05 �46.5071.55
371240655 N
11320861 W
�15.6 depth
Punta Espada PE 15.2570.05 36.7070.17 2.5870.02 7.5070.04 �31.7572.14
371360417 N
01420823 W
�13.8 depth
P. Loma Larga PL 14.4870.06 38.5370.06 1.9270.25 7.6070.04 �33.2571.89
371350161 N
01470165 W
�12.8 depth
C. Manceba CM 14.7570.03 37.0070.14 2.4170.09 7.5470.01 �34.5070.51
371350052 N
01480376 W
�15.6 depth
Cabo Negrete CN 14.5570.03 38.4070.14 2.2770.07 7.9470.03 �53.0072.58
371340327 N
01490326 W
�12.7 depth
Punta Negra PN 14.6070.04 36.7070.04 1.7770.17 7.5670.01 �33.2571.49
371340052 N
01500496 W
�12.8 depth
Punta Galera PG 13.6370.02 37.0070.11 2.2070.17 7.5370.03 �33.0071.35
371340052 N
01510712 W
�16.8 depth
A. Cesar et al. / Ecotoxicology and Environmental Safety 72 (2009) 1832–18411834
Author's personal copy
(NRC), Certified Reference Material, 277 BCR, and Council National of Researches
Canada, 277 BCR, for heavy metals) and allow agreement with certified values
higher than 90%.
2.3. Toxicity testing
Sediment toxicity tests were performed to evaluate whether metals were
bioavailable to standard test organisms. The toxicity of the sediment porewater
(PW) and sediment–water interface (SWI) was determined using embryo-larval
development tests with two sea urchin species, Arbacia lixula and Paracentrotus
lividus, following the procedures previously described (Cesar et al., 2002, 2004)
and according to the accepted guidelines (Environment Canada, 1992; USEPA,
1995; CETESB, 1999; CEDEX-Spain, 2001; ABNT, 2006). For SWI system, 2 ml of the
surface of an intact sediment core were introduced carefully through a syringe
(5 ml) with a cut tip, and 8 ml of dilution seawater (1 sediment/4 water) was
introduced carefully to minimize resuspension. New sterilized syringes were used
for each sample and a circular mesh (100mm) was placed and carefully fixed by a
plastic ring to avoid displacement on the sediment–water interface and test tubes
were allowed to stabilize for 24 h. The duration of subchronic tests was 28 h for P.
lividus and 38 h for A. lixula, counting the number of normally developed pluteus
embryos at the end of the test. After this period the number of normally developed
pluteus larvae was counted and the percentage of abnormalities was determined
by direct observation of 100 randomly selected individuals per vial under an
inverted microscope. The sea urchins used in this study were obtained by SCUBA
divers in the Fraile Island (IF).
2.4. Benthic community analysis
The macroinvertebrate taxonomic data was quantified using the relative
benthic index adapted to Mediterranean fauna, developed by Anderson et al.
(1998, 2001) and the exploratory benthic index, a new index calculated for this
study which integrated different ecological community parameters, but is based
on the same methodology. The original RBI was based on six categories, including
total number of species (1/6), number of crustacean species (1/6), number of
mollusk species (1/6), number of crustacean individuals (1/6), and the presence or
absence of species indicative of sediment quality and metal pollution (2/6). The EBI
was based on eight categories, including the total number of species (1/8), the
number of crustacean species (1/8), number of mollusk species (1/8), number of
polychaetes families (1/8), total number of individuals (1/8), and presence or
absence of pollution-sensitive and pollution-indicative species (2/8), and integrat-
ing the three ecological indices of diversity, Shannon–Wiener, Pielou, and Margalef
(1/8). The pollution-sensitive and pollution-indicative species were extracted from
a global analysis of all samples collected in the area of study through a previous
SIMPER analysis. Pollution-sensitive species were found in control stations where
anthropogenic and other severe disturbances do not play a major role in
structuring communities, while the pollution-indicative species are common in
stressed stations and are not found in unpolluted points (Hunt et al., 2001).
Each parameter value (one sixth in the RBI and one eighth in the EBI of the
total indices) for each sample was the percentile at which data from that sample fit
into the total range for that parameter over all samples from the Portman Bay data
set. For the two sixths (RBI) and two eighths (EBI) of the indices represented by
positive and negative indicator species, the parameter value was weighted toward
presence or absence of key indicator species, with abundance given additional
incremental weight by transforming the abundance of each indicator species to its
double square root to compress the range of values. For each sample, the
transformed abundances of the negative indicator species were summed and
subtracted from the sum of the transformed abundances of the positive indicator
species, and this value was converted to a percentile of the total range for all sites.
The overall indices for each site was calculated by adding the values for the six
(RBI) and eight (EBI) parameters together and standardizing each sum to the total
range of the sums for all stations, resulting in a range of values from 0.00 (most
impacted) to 1.00 (least impacted). The threshold value for a degraded benthic
community was set at 0.30 since 0.00–0.30 was considered indicative of a
degraded benthic community, 0.31–0.60 was considered transitional, and
0.61–1.00 was considered undegraded.
These indices are based on toxicology and natural history, taking into account
the responses of marine benthic communities to anthropogenic and natural
disturbances, and were developed for particular areas by selecting different
indicator species (Anderson et al., 1998). The selection of indicator species must
be based on known responses to anthropogenic and other disturbances and
related natural history, such as life history traits and abundance patterns along
environmental gradients and between study stations (Anderson et al., 1998).
Accordingly, the selection of indicator species along an environmental gradient or
between stations can bias the results obtained with the RBI and EBI, since species
are selected in relation to their presence–abundance in both extremes of the
gradient or in polluted–undisturbed stations. In this sense, before selecting a
species as being positive/sensitive or negative/tolerant, we must be sure that this
same species has previously been cited as indicator in the same type of pollution.
2.5. Statistical analysis
Toxicity data were checked for normality and homoscedasticity assumptions
with Shapiro–Wilk’s and Bartlett’s tests, respectively. Larval development data
were arcsine square root transformed prior to statistical analysis. Differences were
evaluated with a parametric analysis of variance (ANOVA), followed by Tukey’s
test. These analysis were carried out with the statistical package Toxstats V.3.5.
The Newman–Keuls test was also applied to compare the means of normally
developed larvae obtained in the sea urchin toxicity tests.
Univariate measures included the Shannon–Wiener diversity indices calcu-
lated using natural logarithms (H0), species richness (Margalef’s d), evenness
(Pielou’s J), total abundance (A), and abundance of taxa (S). The significance of
differences between points was tested using one-way ANOVA.
Community structure (presence or absence of pollution-sensitive and pollu-
tion-indicative species) was examined by multidimensional scaling (MDS), using
the PRIMER-E (Plymouth Routines in Multivariate Ecological Research, v6) (Clark
and Warwick, 2001; Clark and Gorley, 2006) suite of computer programs
developed at the Plymouth Marine Laboratory, UK. Ranked lower triangular
similarity matrices were constructed using a range of data transformations, the
Bray–Curtis similarity measure and group-average sorting. Abundance data were
fourth-root transformed in order to reduce contributions to similarity by abundant
species, and thereby increasing the importance of the less-abundant species in the
analysis (Clark and Green, 1988). The species contributing to dissimilarities
between stations were investigated using the similarities percentages procedure
(SIMPER) (Clark and Ainsworth, 1993; Somerfield, et al., 1994).
2.6. Multivariate analysis approach
The relationship amongst variables was assessed by using a multivariate
analysis approach by means of a factor analysis. Principal component analysis
(PCA) was used as an extraction procedure. It was based on the geochemical
characteristics of the sediments (TOC, %OM, %fines, Al, As, Fe, Hg, Ni, Pb, Zn, and
SEM/AVS), results of toxicity bioassays (abnormal development of sea urchin
exposed to sediment PW and SWI), and the benthic indices (RBI and EBI). The
concentrations of Cd and Cu were not included in the PCA, because the values were
shown low and in most of the cases under the detection limit. The analysis was
conducted on the matrix (varimax normalized rotation) and included any principal
component axis that accounted for more than 10% of the total variance. A
component loading cutoff of 0.40 was used in selecting variables for inclusion in
factors. Tabachnic and Fidell (1996) suggested that a cutoff of at least 0.32 be used
and that component loading of greater than 0.45 be considered fair or better. The
variables were autoscaled (standardized) so as to be treated with equal
importance.
To confirm these relationships between chemical contamination and biological
effects, the Spearman rank correlation coefficients (rho) were calculated. PCA and
correlation analysis were carried out by means of the statistical packages
STATISTICA software tool (Stat Soft, Inc., 2001, version 6).
3. Results
3.1. Sediment chemical and physical analysis
Total organic carbon and organic matter decreased along acontamination gradient (Table 2). Most of the gradient samplesdid not exceed the acid-volatile sulfide values measured in controland reference stations (PE and IF).
The metal concentrations in sediments showed a stronggradient despite the cessation of mining activity in Portman Bayapproximately 20 years ago. Sediment concentrations of metals,including Zn, Al, Pb, and Fe, were low in the control and referencestations and progressively increased towards the emission point(PG), where the highest levels were recorded. These metals werefound in high concentrations near the emission point and werestatistically associated with the toxicity of sea urchin larvae andbenthic community structures (Tables 2 and 4). Sediment metalconcentrations off the Portman coast, PN and PG stations locatedon both sides of Portman Bay presented the highest metalconcentrations, decreasing as the distance from the bay increased(PG4PN4CM4CN4PL4PE). Only IF and PL stations presented anegative molar difference between the SEM and the AVS analyzed,the rest of the stations showed a positive difference. In PN and PG
ARTICLE IN PRESS
A. Cesar et al. / Ecotoxicology and Environmental Safety 72 (2009) 1832–1841 1835

Author's personal copy
statio
ns
this
po
sitive
diffe
rence
wa
sh
igh
(41
5m
mo
l/gd
ryse
d.),
wh
ichin
dica
tes
the
po
ssible
bio
ava
ilab
ilityo
fm
eta
ls.T
he
fie
ldm
ea
sure
me
nts
of
the
sed
ime
nt–
wa
terin
terfa
cev
aria
ble
s(te
mp
era
ture
,sa
linity,
OD
,p
H,
Eh
)w
erem
ea
sure
dto
com
pa
rew
ithth
elim
itso
fto
lera
nce
of
the
spe
cies
test
at
the
time
of
colle
ction
(Ta
ble
1).
Th
ese
va
riab
les
we
refo
un
din
side
the
limits
of
tole
ran
cefo
rsp
ecie
su
sed
inth
eto
xicity
tests
an
dd
ifferen
ces
were
no
td
ete
cted
am
on
gth
ere
sults
ob
tain
ed
infi
eld
an
din
lab
ora
tory,
exce
pt
for
OD
tha
tw
as
infe
rior
toth
efi
eld
.
3.2
.To
xicitytestin
g
Th
ep
erce
nta
ge
of
no
rma
llyd
ev
elo
pe
dla
rva
ein
PW
an
dth
eS
WI
tests
were
rep
orte
din
Fig.
2.
Th
ere
sults
ind
icate
da
dv
erse
effe
ctsin
SW
Ia
nd
PW
tests
insta
tion
sP
G,
PN
,C
N,
CM
,a
nd
PL,
wh
ichsh
ow
ed
statistica
ld
ifferen
ces
from
the
con
trol
statio
n(po
0.0
01,o
ne
-way
AN
OV
A,p
ost
ho
cT
uk
ey
test).H
ow
ev
er,sta
tion
PE
wa
sn
ot
sign
ifica
ntly
diffe
rent
from
IFa
nd
can
also
be
ARTIC
LEIN
PRESS
Table 2Physico-chemical measurements of grain size, un-ionized ammonia, total organic carbon (TOC), organic matter (LOI), simultaneously extracted metals (SEM), concentration of acid-volatile sulfides (AVS), total SEM (Cd/Cu/Ni/Pb/
Zn), and AVS molar ratio (AVS-SEM) in sediments of all samples, means7sd.
Sampling
points
Ammonium NH3
(mg/l)
Fines (%) TOC (%) LOI (%) Metals (mg/kg dry sed.) SEMc AVS (mmol/g
dry sed)
SEM-AVSd
PWa SWIb Al As Cd Cu Fe Hg Ni Pb Zn
IF 0.00570 0.00270 1.1770.14 0.1270.01 1.9170.14 3.1870.04 0.2470.01 od.l. od.l. 18.1370.91 od.l. od.l. 0.0370 0.0170 0.0470 0.3270.01 �0.2870.01
PE 0.00470 0.00370 0.4170.11 0.1270.01 0.7370.04 0.5670.03 0.0670.01 od.l. od.l. 7.8970.23 od.l. od.l. 0.0470 0.0870 0.1270 0.0170 0.1170.01
PL 0.00670 0.00370 0.7270.07 0.2970.01 0.7470.01 1.4770.01 0.2370.01 od.l. od.l. 13.7970.53 od.l. od.l. 0.0870 0.2170 0.2970.01 0.2970.07 �0.00570.06
CM 0.00570 0.00470 2.9871.05 1.4870.08 2.2870.05 3.8870.29 0.2870.01 od.l. od.l. 49.9373.86 od.l. 0.0270.01 0.3070.01 1.1770.09 1.4970.09 0.3170.03 1.1870.22
CN 0.00770 0.00470 0.2370.17 0.5870.01 1.3870.08 1.3470.06 0.1970.01 od.l. od.l. 16.2070.92 od.l. 0.0570.01 0.2070.01 0.3470.01 0.5970.03 0.2570.04 0.3470.03
PN 0.00670 0.00470 4.3272.74 16.6770.27 5.1670.41 13.6270.32 0.5470.01 od.l. od.l. 197.6373.93 od.l. 0.0670.01 3.1470.10 13.4770.22 16.6770.53 0.2870.04 16.3970.53
PG 0.00470.1 0.00270 4.1970.11 18.3271.66 6.2270.25 11.8771.30 0.2770.06 od.l. 0.0170 165.95722.17 0.0170 od.l. 2.9870.15 15.3471.53 18.3371.66 0.3270.16 18.0173.02
od.l.—below detection limits.a PW—porewater.b SWI—sediment–water interface.c SEM—Cd/Cu/Ni/Pb/Zn (mmol/g dry sed.).d SEM-AVS—Cd/Cu/Ni/Pb/Zn (mmol/g dry sed.).
Sam
pling pointsIF
Normally Developed Larvae (%)
0 20 40 60 80
100
A. lixula
P. lividus
Sam
pling Points
IF
Normally Developed Larvae (%)
0 20 40 60 80
100A
. lixulaP
. lividus
PE
PL
CM
CN
PN
PG
PE
PL
CM
CN
PN
PG
Fig
.2
.C
om
pa
rison
of
me
an
pe
rcen
tag
eo
fn
orm
ally
de
ve
lop
ed
larv
ae
(7sd
)o
fA
.
lixula
an
dP.
livid
us
at
the
diffe
ren
tsa
mp
ling
po
ints:
(A)
po
rewate
rte
stsa
nd
(B)
sed
ime
nt–
wa
ter
inte
rface
tests.
A.
Cesa
ret
al.
/E
coto
xicolo
gy
an
dE
nv
iron
men
tal
Safety
72
(20
09
)18
32
–18
411
83
6
Author's personal copy
considered as a reference station (p40.05, one-way ANOVA, post
hoc Tukey test). Toxicity tests with PW and SWI presented asimilar pattern of response although the percentage of normallydeveloped larvae were lower in the first one. Results of theanalysis of variance and post hoc tests pointed to significantdifferences in the percentage of normally developed larvae amongthe samples in both PW and SWI tests (ANOVA, post hoc Tukeytest, po0.001, Table 5).
For both treatments, the concentrations of un-ionized ammo-nium (NH3) were low. Evidently, the highest concentration of NH3
was found in PW, but below the effect threshold for the usedspecies (Table 2).
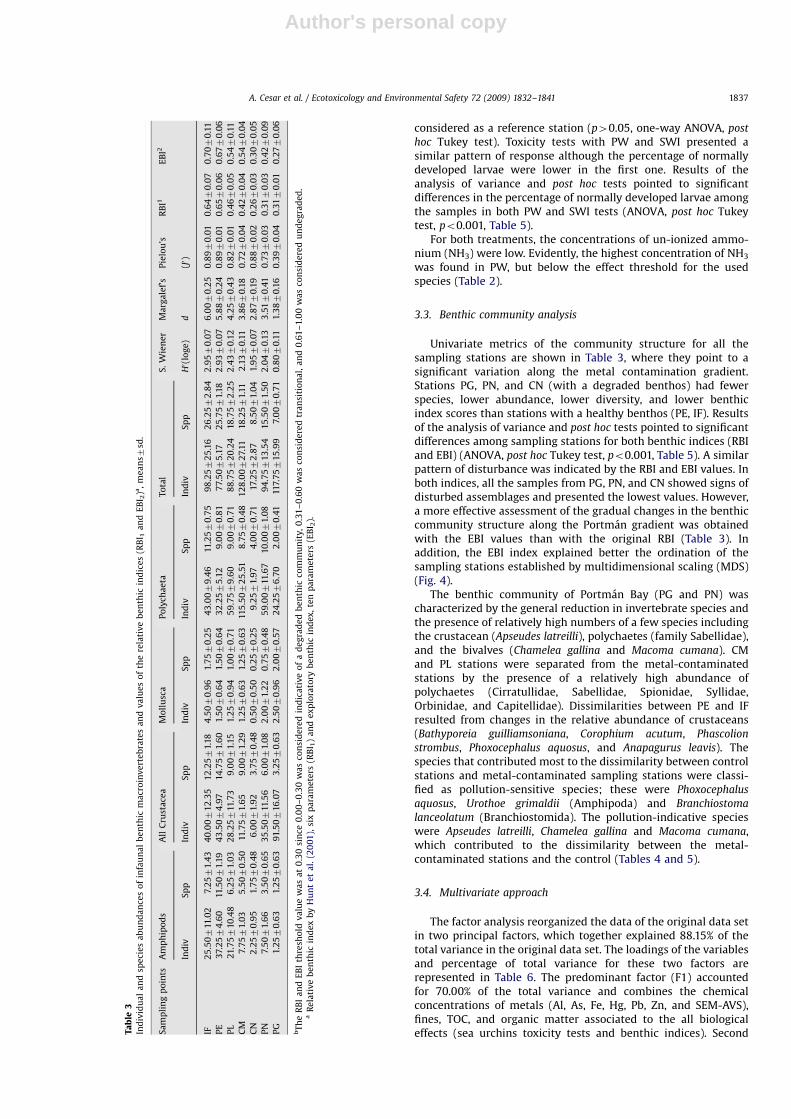
3.3. Benthic community analysis
Univariate metrics of the community structure for all thesampling stations are shown in Table 3, where they point to asignificant variation along the metal contamination gradient.Stations PG, PN, and CN (with a degraded benthos) had fewerspecies, lower abundance, lower diversity, and lower benthicindex scores than stations with a healthy benthos (PE, IF). Resultsof the analysis of variance and post hoc tests pointed to significantdifferences among sampling stations for both benthic indices (RBIand EBI) (ANOVA, post hoc Tukey test, po0.001, Table 5). A similarpattern of disturbance was indicated by the RBI and EBI values. Inboth indices, all the samples from PG, PN, and CN showed signs ofdisturbed assemblages and presented the lowest values. However,a more effective assessment of the gradual changes in the benthiccommunity structure along the Portman gradient was obtainedwith the EBI values than with the original RBI (Table 3). Inaddition, the EBI index explained better the ordination of thesampling stations established by multidimensional scaling (MDS)(Fig. 4).
The benthic community of Portman Bay (PG and PN) wascharacterized by the general reduction in invertebrate species andthe presence of relatively high numbers of a few species includingthe crustacean (Apseudes latreilli), polychaetes (family Sabellidae),and the bivalves (Chamelea gallina and Macoma cumana). CMand PL stations were separated from the metal-contaminatedstations by the presence of a relatively high abundance ofpolychaetes (Cirratullidae, Sabellidae, Spionidae, Syllidae,Orbinidae, and Capitellidae). Dissimilarities between PE and IFresulted from changes in the relative abundance of crustaceans(Bathyporeia guilliamsoniana, Corophium acutum, Phascolion
strombus, Phoxocephalus aquosus, and Anapagurus leavis). Thespecies that contributed most to the dissimilarity between controlstations and metal-contaminated sampling stations were classi-fied as pollution-sensitive species; these were Phoxocephalus
aquosus, Urothoe grimaldii (Amphipoda) and Branchiostoma
lanceolatum (Branchiostomida). The pollution-indicative specieswere Apseudes latreilli, Chamelea gallina and Macoma cumana,which contributed to the dissimilarity between the metal-contaminated stations and the control (Tables 4 and 5).
3.4. Multivariate approach
The factor analysis reorganized the data of the original data setin two principal factors, which together explained 88.15% of thetotal variance in the original data set. The loadings of the variablesand percentage of total variance for these two factors arerepresented in Table 6. The predominant factor (F1) accountedfor 70.00% of the total variance and combines the chemicalconcentrations of metals (Al, As, Fe, Hg, Pb, Zn, and SEM-AVS),fines, TOC, and organic matter associated to the all biologicaleffects (sea urchins toxicity tests and benthic indices). Second
ARTICLE IN PRESS
Ta
ble
3In
div
idu
al
an
dsp
eci
es
ab
un
da
nce
so
fin
fau
na
lb
en
thic
ma
cro
inv
ert
eb
rate
sa
nd
va
lue
so
fth
ere
lati
ve
be
nth
icin
dic
es
(RB
I 1a
nd
EB
I 2)a
,m
ea
ns7
sd.
Sa
mp
lin
gp
oin
tsA
mp
hip
od
sA
llC
rust
ace
aM
oll
usc
aP
oly
cha
eta
To
tal
S.
Wie
ne
rM
arg
ale
f’s
Pie
lou
’sR
BI1
EB
I2
Ind
ivS
pp
Ind
ivS
pp
Ind
ivS
pp
Ind
ivS
pp
Ind
ivS
pp
H0 (
log
e)
d(J0 )
IF2
5.5
07
11.0
27.
257
1.4
34
0.0
07
12
.35
12
.257
1.1
84
.507
0.9
61.
757
0.2
54
3.0
07
9.4
611
.257
0.7
59
8.2
57
25
.16
26
.257
2.8
42
.957
0.0
76
.007
0.2
50
.897
0.0
10
.647
0.0
70
.707
0.1
1
PE
37.
257
4.6
011
.507
1.1
94
3.5
07
4.9
71
4.7
57
1.6
01.
507
0.6
41.
507
0.6
43
2.2
57
5.1
29
.007
0.8
17
7.5
07
5.1
72
5.7
57
1.1
82
.937
0.0
75
.887
0.2
40
.897
0.0
10
.657
0.0
60
.677
0.0
6
PL
21.
757
10
.48
6.2
57
1.0
32
8.2
57
11.7
39
.007
1.1
51.
257
0.9
41.
007
0.7
15
9.7
57
9.6
09
.007
0.7
18
8.7
57
20
.24
18
.757
2.2
52
.437
0.1
24
.257
0.4
30
.827
0.0
10
.467
0.0
50
.547
0.1
1
CM
7.7
57
1.0
35
.507
0.5
011
.757
1.6
59
.007
1 .2
91.
257
0.6
31.
257
0.6
311
5.5
07
25
.51
8.7
57
0.4
81
28
.007
27.
111
8.2
57
1.11
2.1
37
0.1
13
.867
0.1
80
.727
0.0
40
.427
0.0
40
.547
0.0
4
CN
2.2
57
0.9
51.
757
0.4
86
.007
1.9
23
.757
0.4
80
.507
0.5
00
.257
0.2
59
.257
1.9
74
.007
0.7
117
.257
2.8
78
.507
1.0
41.
957
0.0
72
.877
0.1
90
.887
0.0
20
.267
0.0
30
.307
0.0
5
PN
7.5
07
1.6
63
.507
0.6
53
5.5
07
11.5
66
.007
1.0
82
.007
1.2
20
.757
0.4
85
9.0
07
11.6
71
0.0
07
1.0
89
4.7
57
13
.54
15
.507
1.5
02
.047
0.1
33
.517
0.4
10
.737
0.0
30
.317
0.0
30
.427
0.0
9
PG
1.2
57
0.6
31.
257
0.6
39
1.5
07
16
.07
3.2
57
0.6
32
.507
0.9
62
.007
0.5
72
4.2
57
6.7
02
.007
0.4
111
7.7
57
15
.99
7.0
07
0.7
10
.807
0.1
11.
387
0.1
60
.397
0.0
40
.317
0.0
10
.277
0.0
6
bT
he
RB
Ia
nd
EB
Ith
resh
old
va
lue
wa
sa
t0
.30
sin
ce0
.00
–0
.30
wa
sco
nsi
de
red
ind
ica
tiv
eo
fa
de
gra
de
db
en
thic
com
mu
nit
y,
0.3
1–
0.6
0w
as
con
sid
ere
dtr
an
siti
on
al,
an
d0
.61
–1.
00
wa
sco
nsi
de
red
un
de
gra
de
d.
aR
ela
tiv
eb
en
thic
ind
exb
yH
un
te
ta
l.(2
00
1),
six
pa
ram
ete
rs(R
BI 1
)a
nd
exp
lora
tory
be
nth
icin
dex
,te
np
ara
me
ters
(EB
I 2).
A. Cesar et al. / Ecotoxicology and Environmental Safety 72 (2009) 1832–1841 1837

Author's personal copy
factor (F2) represented 18.14% of the variance and combines thechemical concentrations of metals (As and Ni) and fines correlatedto the all biological effects. The representation of estimated factor
scores from each station is represented in Fig. 3. Factor 1 scoreswere negative for stations IF, PE, PL, CM, and CN. On the otherhand, the positive scores of factor 2 that were measured atstations CM, CN, and PN, confirmed that the two factors wererelated to the association of biological effect with metalsconcentrations. These factors indicate environmental degradationcaused by the related metals, since toxicity (sea urchins tests) iscorrelated in both factors, in addition to in situ alterations (RBI andEBI) (Fig. 4).
Spearman rank correlations between SWI and PW toxicity testsand bulk chemical concentrations were examined in the two seaurchin species. In the PW toxicity tests with A. lixula and P. lividus,the analysis showed highly significant positive correlationsbetween abnormally developed larvae and zinc, lead, iron, andSEM-AVS concentrations (Table 4). For its part, Spearman rankcorrelations indicated significant negative correlations betweenthe benthic community structure (as represented by the RBI andEBI indices) and several metals (Zn, Al, Pb, Fe). In addition, there
ARTICLE IN PRESS
Table 4Spearman rank correlation coefficients for selected chemicals significantly correlated with sea urchin (Arbacia lixula and Paracentrotus lividus), normal development (PW
n ¼ 28/SWI n ¼ 28)a, RBI (n ¼ 28), and EBI (n ¼ 28). Chemicals identified by principal components analysis (PCA) as covarying with inhibited sea urchin development or
degraded benthos are denoted by ‘‘S’’ ( ¼ significant-component loading X0.40)b.
Chemical Arbacia lixula Paracentrotus lividus Relative benthic index (RBI) Exploratory benthic index (EBI)
PW SWI PW SWI Spearm PCA Spearm PCA
Spearm PCA Spearm PCA Spearm PCA Spearm PCA
Al 0.478** S 0.686*** S 0.552** S 0.670*** S �0.688*** S �0.521** S
Fe 0.774*** S 0.812*** S 0.781*** S 0.752*** S �0.720*** S �0.663*** S
Pb 0.782*** S 0.905*** S 0.844*** S 0.911*** S �0.793*** S �0.612*** S
Ni 0.561** S 0.510** S 0.587*** S 0.387* S �0.277 �0.504** S
Zn 0.817*** S 0.920*** S 0.880*** S 0.910*** S �0.795*** S �0.617*** S
NH3 0.318 0.208 0.307 0.176 �0.180 �0.118
Fines 0.287 0.444* S 0.276 0.480** S �0.550** S �0.429** S
LOI 0.458* S 0.725*** S 0.587*** S 0.751*** S �0.706*** S �0.597*** S
TOC 0.254 0.287 0.272 0.320 �0.159 �0.290
AVS 0.114 0.175 0.082 0.200 �0.237 �0.001
SEMc 0.797*** S 0.904*** S 0.854*** S 0.910*** S �0.758*** S �0.619*** S
SEM-AVS 0.650*** S 0.700*** S 0.718*** S 0.689*** S �0.591*** S �0.617*** S
a PW ¼ pore water; SWI ¼ sediment–water interface.b Indicates significance at pp0.05*; indicates significance at pp0.01**; indicates significance at pp0.001***.c SEM (Cd/Cu/Ni/Pb/Zn).
Table 5Analyses of variances and post hoc test for toxicity tests and relative benthic index.
Variables Univariant measures F p-level Post hoc test Tukey HSD
Benthic RBI 12.5583 *** IF PE PL CM CN PN PG
Index EBI 17.0134 *** IF PE PL CM CN PN PG
Toxicity A. lixula (PW) 676.451 *** IF PE PL CM CN PN PG
Tests A. lixula (SWI) 410.292 *** IF PE PL CM CN PN PG
P. lividus (PW) 325.814 *** IF PE PL CM CN PN PG
P. lividus (SWI) 320.624 *** IF PE PL CM CN PN PG
***po0,001.
Table 6Sorted rotated factor loadings (pattern) of the original 17 variables and percentage
of total variance for two principal factors.
Variable Factor loadings principal components marked
loadings are 40.4
F1 F2
A. lixula (PW) 0.356310 0.891831A. lixula (SWI) 0.611704 0.784946P. lividus (PW) 0.366612 0.893788P. lividus (PW) 0.718389 0.659636RBI �0.321346 �0.910823EBI �0.581360 �0.681004Fines (%) �0.689289 0.694675TOC 0.653864 0.716911LOI 0.919018 0.342341
Al 0.932088 0.307204
As 0.862845 0.368814
Fe 0.432841 0.580471Hg 0.848928 0.419319Ni 0.766481 0.076453
Pb �0.080625 0.870510Zn 0.881927 0.392856
SEM-AVS 0.926777 0.328999
Variance (%) 70.00299 18.14706
Only loadings greater than 0.40 are shown in bold format.
Sampling pointsIF
Fact
or s
core
s
-3
-2
-1
0
1
2
3F 2F 1
PE PL CM CN PN PG
Fig. 3. Estimated factor scores from each of five sampling stations to the centroid
of cases for the original data. The factor scores quantify to the prevalence of every
component for each station and are used to confirm the factor description.
A. Cesar et al. / Ecotoxicology and Environmental Safety 72 (2009) 1832–18411838

Author's personal copy
were significant negative correlations between RBI and EBI values,and organic matter and AVS-SEM (Table 4).
4. Discussion
Historically, the Sierra of Cartagena-Portman (Murcia,southeast Spain) was exploited to extract pyrite and lead sulfide.During the 20th century, the mineral laundries used floatingtechniques to extract metal, producing great quantities of miningwastes. These muddy wastes were discharged into the bay,producing a high degree of sediment metal contamination. Intotal, approximately 50 million tons of mine tailings were dumpedinto the ocean, including metals known to be toxic, such ascadmium, copper, lead, and zinc (Marin-Guirao et al., 2005). Thebay has received mining effluents during three decades whichresulted in the fulfilling of the bay with mining wastes andtherefore the loss of its natural coastal line and conditions. Sinceall mining activities ceased in the beginning of the 1990s and thesurrounding areas possess high ecological values, there exits agreat interest in restoring the bay during the last few years. Therestoration plan has recently been approved and the works willstart at the end of 2007. As a first step in the restoration programit is necessary to assess the contamination of the bay and for suchpurposes it has been argued that the best way must be a weight-of-evidence approach (Burton et al., 2002; Chapman et al., 2002;Riba et al., 2004a, b; Cesar et al., 2007) where complementaryenvironmental tools must be integrated in a correct manner. Thedevelopment of this approach may serve also for environmentalmonitoring during the different restoration stages.
The chemical analysis of the contaminants present in asediments sample is one of the first approaches employedhistorically for pollution assessment. In this sense, our resultsindicate that sediments from the Portman Bay are heavily pollutedby metals; metal concentrations decrease as the distance to thebay increases. According to the classification proposed by Longet al. (1995), PG and PN stations were highly polluted by Zn andPb, whereas the rest of the stations were classified as less pollutedby the four metals, except CM station, which was classified asmoderately polluted by Pb.
There is a considerable uncertainty regarding the concentra-tion of metals that may pose significant ecological risks due tometal bioavailability as it is determined by the concentration of
acid-volatile substances formed in anoxic conditions (Ankley,1996). In marine sediments, sulfides can be responsible for metalbioavailability in pore and overlying water (USEPA, 1995) andaffect the distribution of benthic invertebrates. The determinationof acid-volatile sulfides (AVS) is widely used as a measure toreduce sulfur species in sediments. Di Toro et al. (1992) proposedthat if the SEM/AVS ratio is less than 1, there will be no toxic effectfrom Cd, Cu, Hg, Ni, Pb, or Zn. Short-term sediment bioassaysshowed that the molar ratio of AVS/SEM determines the activitiesof at least some metals in porewater (Di Toro et al., 1990; Ankleyet al., 1991). Metal activities were reduced to very low levels atratios o1, because of the high stability of the metal sulfide.Toxicity and bioaccumulation were correlated with porewatermetal activities in the toxicity tests (Luoma and Fisher, 1997).
Sediment toxicity tests are widely used and accepted environ-mental tools to assess the toxicity of the metal content as well asthe bioavailability of contaminants in marine sediments. They aretechnically well developed (USEPA, 1994; ASTM, 1997) and arewidely accepted as useful tools for a wide variety of research andregulatory purposes (Swartz, 1989; Luoma and Ho, 1993; Burton,1991). For example, they are used to determine the sedimenttoxicity of single chemicals and mixtures, chemical bioavailability,the potential adverse effects of dredged material on benthicmarine organisms, and the magnitude and spatial and temporaldistribution of pollution impacts in the field (Ferraro and Cole,2002). Ecotoxicological monitoring requires simple, rapid andsensitive methods which can be used to measure the potentialrisk of sediment metal concentrations and their toxicity in marineinvertebrates. Predicting the bioavailability and toxicity of metalsin aquatic sediments is a critical component in the developmentof sediment quality criteria. The exposure of developing seaurchin embryos to the interface between sediment and water(SWI) provides a more ecologically relevant bioassay for thisspecies (Anderson et al., 1998), and the results of the laboratorytoxicity tests could be considered predictive of ecological changeon a station-by-station basis because these are subchronic toxicitytests and may reflect chronic impacts in individual stations. Thetoxicity test employing sea urchin embryos identified as toxic thesediments from the Portman Bay. As observed with the chemicalanalysis the toxicity also decreased with the distance from thebay. Both PW and SWI tests presented a similar pattern of toxicityalong the studied gradient. Furthermore, the toxicity results are inaccordance with the assumption that toxicity does not exist inthose sediments where the molar concentration of sulfides ishigher than the molar concentration of divalent metals.
Benthic faunal communities, as living components of thesediments, represents the integrate response of the biologicaleffects of pollutants content in a sediment sample. The classicaldescriptive parameters (Margalef richness, Shannon–Wienerdiversity, Pielou evenness, and Simpson dominance) showed aprogressive variation in benthic communities along the metalcontamination gradient of the Portman coast. Those stations witha degraded benthos (PG, PN, and CN) had fewer species, lowerabundance, lower diversity, and lower benthic index scores thanstations with a healthy benthos (PE and PL). The development ofquantitative indices of benthic community health as indicators ofenvironmental quality of estuarine and coastal water is a criticaltask for management of coastal ecosystems. The present study hasevaluated a multi-metric benthic index known as relative benthicindex, which is used in USA regional water quality controls(Anderson et al., 1998, 2001; Hunt et al., 2001) and exploratorybenthic index a new index that introduces other descriptiveparameters of the fauna in an integrated way. This latter indexwas advantageous for quantifying and estimating the cumulativeeffects of multiple stressors on benthic biota between the low-and high-impact zones. The index scores calculated for each
ARTICLE IN PRESS
PE-1 PE-2
PE-3
PE-4
Stress: 0.12
PLL-1PLL-2
PLL-3
PLL-4
CM-1
CM-2CM-3
CM-4
CN-1
CN-2 CN-3
CN-4PN-1
PN-2
PN-3
PN-4
PG-1PG-2
PG-3PG-4
IF-1IF-2
IF-3
IF-4
Fig. 4. Multidimensional scaling ordinations for fourth root transformed total
fauna abundance (stress ¼ 0.12) in sampling stations.
A. Cesar et al. / Ecotoxicology and Environmental Safety 72 (2009) 1832–1841 1839

Author's personal copy
station provided a good and practical overall discriminationcapacity.
The metrics, pollution-indicative and pollution-sensitive spe-cies, were established from SIMPER analysis. Thus, the speciesindicators of sediment quality and metal pollution were selectedfor their contribution to the dissimilarity between the control andthe polluted zones. There is evidence that in areas of high metalconcentration, the effects of metals may be ameliorated by thedevelopment of tolerance mechanisms in some species and theevolution of tolerant strains in others (Grant et al., 1989). Our datasuggest that the Tanaidacea Apseudes latreilli, the Sabellidaepolychaetes of the Family and the bivalves Chamelea gallina andMacoma cumana can tolerate the whole range of metal concentra-tions found in Portman Bay. The Tanaidacea Apseudes latreilli iscommon in Portman Bay and also in metal-polluted areas of thenearby Mar Menor, a hypersaline lagoon. This euryhaline specieinhabits streams close to deserts that transport mining wastesfrom the mountains of Portman area. The crustaceans Bathyporeia
guilliamisoniana, Coropium acutum, Phoxocephalus aquosus, andAnapagurus leaves, were absent from the metal-polluted samplingstations (PG, PN, and CN), suggesting that they were incapable ofadapting to such extreme levels of metals. The sampling stationsused in the present study may be classified using EBI scores withvalues at or above 5 used as the breaking point between ‘‘control’’and ‘‘degraded’’ sites. The multi-metric EBI index showed asensitivity and resolution for distinguishing differences in habitatquality.
Analyses of variances and post hoc test for toxicity tests andrelative benthic index indicates that the communities of thenearest stations to the poured of mine sterile (PN, PG and CN) theyare negatively affected and present different populations from theothers studied stations. Since the plan of restoration of the bay iscentered in self-hardly affecting to the stations located in the bay(PN and PG), the others stations (except impacted CN) will serveas reference during and after the restoration and they will allowthe comparison to evaluate the evolution and the success of therestoration process. CN that will not be restored and that iscontained as one of the impacted stations can be used as positivecontrol during the restoration process.
Since the restoration program is proposed to remove a hugevolume of sediments that fulfill the bay, it is important to takeinto account the importance of sediment resuspension in themetal liberation, and therefore to incorporate appropriate techni-ques which must reduce the sediment resuspension or mitigatethe effects of the metal liberation. In this context, it is necessary toincorporate environmental tools such as water toxicity tests to beapplied in the environmental monitoring during the restorationoperations to assure that the metals content in sediments are notreleased to the water column, and consequently affecting theenvironmental quality in the surrounding areas. Furthermore,since the present sediments in the bay showed high toxicity,evidenced through the sea urchin embryo-larval test here applied,it is important to incorporate sediment toxicity test not onlyduring the restoration operations, but also later, in order to ensurethat the restoration was successful.
In the present study we demonstrated that mine wastes arespread at least 7300 m along the Mediterranean coast of Murcia.The multivariate analysis and the benthic indices have shown thatcommunity structure changes along this metal pollution gradient.The marine sediments of Portman Bay continue to show hightoxicity due to the high metal concentrations they contain and anysediment resuspension in this toxic hot spot of the MediterraneanSea must be treated with caution. Sediment quality values need tobe a develop to help protect public health and the environment(DelValls and Chapman, 1998; DelValls et al., 1998). The sedimentquality triad (SQT) tools were used in this study, and the
combination of analytical chemistry, toxicity tests and benthiccommunity structure, proved to be useful in providing a fullpicture of the extent of metal pollution along the coast of Murcia.
This was the first sediment quality assessment along theMediterranean coast of Murcia using the weight-of-evidenceapproach. Other sediment assessments were carried out in thisarea, but only focusing on sediment chemistry and such resultswere not published and are not available. The use of three lines ofevidence, i.e. sediment physical–chemical characteristics, sedi-ment toxicity, and benthic community analysis, integrated bymultivariate analysis, was useful to assess the quality of thesediments of Portman Bay, giving an insight about the bioavail-ability of contaminants as well as in situ alterations. Suchinformation is valuable to support dredged material managementin this area.
Portman Bay represents the hottest spot of metal contamina-tion in the whole Mediterranean basin. This study has specialimportance for this ecosystem because of its fragile nature and thehigh amounts of metals it receives. The use of the WOE approach,integrating sediment toxicity, sediment chemical concentration,and infaunal community structure data was fundamental todetermine the extent and the environmental significance ofsediment contamination in Portman Bay and consequently tosupport the management actions which has been taking place inthis ecosystem.
5. Conclusions
Univariate and multivariate analyses showed positive correla-tion between the sediment metal concentrations associated to theall biological effects (sea urchins toxicity tests and benthicindices). The multi-metric EBI index showed a sensitivity andresolution for distinguishing differences in habitat quality.
Analyses of variances and post hoc test for toxicity tests andbenthic index indicates that the communities of the neareststations to the poured of mine sterile (PN, PG, and CN) are alteredand present different populations from the rest of the stations.
The ordination of environmental sediment data by PCAsuggested that metals (Zn, Pb, and Fe), fines, TOC, and LOI wereassociated with biological effects along the contaminationgradient. In addition, Spearman rank correlations indicatedsignificant negative correlations between benthic communitystructure and the metals, Zn, Pb, Al, and LOI.
The use of the WOE approach, integrating sediment toxicity,sediment chemical concentration, and infaunal communitystructure data was fundamental to determine the extent and theenvironmental significance of metal sediment contamination andconsequently to support the management actions which has beentaking place in this ecosystem. This study provided a good insightabout the bioavailability of contaminants as well as in situ
alterations in this valuable estuarine ecosystem.
Acknowledgments
We are grateful to the anonymous referee for his usefulcomments and constructive suggestions. The first author thanksMUTIS-AECI (Agencia Espanola de Cooperacion Internacional) ofthe Spanish Government and CAPES/MEC-Brazil (BEX-3238/06-7)for the doctoral and postdoctoral scholarships. The work waspartially funded by the Brazilian–Spanish joint project (CAPES-Brazil #099/06 and MEC-Spain PHB 2005-0100-PC).
The authors declare that this study was conducted inaccordance with the national and institutional guidelines for theprotection of human subjects and animal welfare.
ARTICLE IN PRESS
A. Cesar et al. / Ecotoxicology and Environmental Safety 72 (2009) 1832–18411840

Author's personal copy
References
Allen, H.E., Gongmin, F., Deng, B., 1993. Analysis of acid-volatile-sulfide (AVS) andsimultaneously extracted metals (SEM) for estimation of potential toxicity inaquatic sediments. Environ. Toxicol. Chem. 12, 1441–1453.
American Society for Testing and Materials, 1997. Standard guide for conducting10-day static sediment toxicity tests with marine and estuarine amphipods.E1367-92. In: Annual Book of ASTM Standards, vol. 11.05. Philadelphia, PA,pp. 731–756.
Anderson, B.S., Hunt, J.W., Phillips, B.M., Fairey, R., Roberts, C.A., Oakden, J.M.,Puckett, H.M., Stephenson, M., Tjeerdema, R.S., Long, E.R., Wilson, C.J., Lyons,J.M., 1998. Chemistry, toxicity and benthic community conditions in selectedsediments of the Los Angeles Region. Final Report. State Water ResourcesControl Board, Sacramento, CA, USA.
Anderson, B.S., Hunt, J.W., Phillips, B.M., Fairey, R., Roberts, C.A., Oakden, J.M.,Puckett, H.M., Stephenson, M., Tjeerdema, R.S., Long, E.R., Wilson, C.J., Lyons,J.M., 2001. Sediment quality in Los Angeles Harbor, USA: a triad assessment.Environ. Toxicol. Chem. 20, 359–370.
Ankley, G.T., Phipps, G.L., Leonard, E.N., Benoit, D.A., Mattson, V.R., Kosian, P.A.,Cotter, A.M., Dierkes, J.R., Hansen, D.J., Mahoney, J.D., 1991. Acid-volatile sulfideas a factor mediating cadmium and nikel bioavailability in contaminatedsediments. Environ. Toxicol. Chem. 10, 1299–1307.
Ankley, G.T., 1996. Evaluation of metal/acid-volatile sulfide relationships in theprediction of metal bioaccumulation by benthic macroinvertebrates. Environ.Toxicol. Chem. 15, 2138–2146.
Associac- ao Brasileira de Normas Tecnicas, 2006. Ecotoxicologia aquatica—
Toxicidade cronica de curta durac- ao—Metodo de ensaio com ouric-o do mar(Echinodermata: Echinoidea), NBR 15350.
Buchanan, J.B., 1984. Sediment analysis. In: Holme, N.A., Mcintyre, A.D. (Eds.),Methods for the Study of Marine Benthos. Blackwell Scientific Publications,Oxford, pp. 41–65.
Burton Jr., G.A., 1991. Assessing the toxicity of freshwater sediments. Environ.Toxicol. Chem. 10, 1585–1627.
Burton Jr., G.A., Batley, G.E., Chapman, P.M., Forbes, V.E., Smith, E.P., Reynoldson, T.,Schlekat, C.E., den Besten, P.J., Bailer, A.J., Green, A.S., Dwyer, R.L.A., 2002.Weight-of-evidence framework for assessing sediment (or other) contamina-tion: improving certainty in the decision-making process. Hum. Ecol. RiskAssess. 8 (7), 1675–1696.
Cesar, A., Marın, A., Marın-Guirao, L., Vita, R., 2002. Sensitivity of Mediterraneanamphipods and sea urchins to reference toxicants. Cienc. Mar. 12, 407–417.
Cesar, A., Marın, A., Marın-Guirao, L., Vita, R., 2004. Amphipod and sea urchin teststo assess the toxicity of Mediterranean sediments: the case of Portman Bay. Sci.Mar. 68 (1), 205–213.
Cesar, A., Choueri, R.B., Riba, I., Moralles-Caselles, C., Pereira, C.D.S., Santos, A.R.,Abessa, D.M.S., Delvalls, T.A., 2007. Comparative sediment quality assessmentin different littoral ecosystems from Spain (Gulf of Cadiz) and Brazil (Santosand Sao Vicente estuarine system). Environ. Int. 33, 429–435.
CETESB, 1999. Metodo de ensaio: Agua do mar-Teste de toxicidade cronica de curtadurac- ao com Lytechinus variegatus, Lamark,1816 (Echinodermata: Echinoidea).Cia. de Tecnologia de Saneamento Ambiental do Estado de Sao Paulo, Brasil,L5.250.
CEDEX, 1994. DelValls, T.A., Casado-Martinez, M.C., Riba, I., Martın-Dıaz, M.L.,Forja, J.M., Garcıa-Luque, E., Gomez-Parra, A., 2001. Investigacion conjuntasobre la viabilidad de utilizar ensayos ecotoxicologicos para la evaluacion de lacalidad ambiental del material de dragado. Technical Report OT/060/01. Centrode Estudios y Experimentacion de Obras Publicas, Cadiz, Spain.
Clark, K.R., Ainsworth, M., 1993. A method of linking multivariate communitystructure to environmental variables. Mar. Ecol. Prog. Ser. 92, 205–219.
Clark, K.R., Green, R.H., 1988. Statistical design and analysis for a biological effectsstudy. Mar. Ecol. Prog. Ser. 46, 213–226.
Clark, K.R., Warwick, R.M., 2001. Change in Marine Communities: An Approach toStatistical Analysis and Interpretation, second ed. Plymouth Marine Laboratory,UK.
Clark, K.R., Gorley, R.N., 2006. PRIMER v6: User Manual/Tutorial. Plymouth, UnitedKingdom.
Chapman, P.M., McDonald, B.G., Lawrence, G.S., 2002. Weight-of-evidence issuesand frameworks for sediment quality (and other) assessments. Hum. Ecol. Risk.Assess. 8, 1489–1515.
De Leon, A.R., Mas, J., Guerrero, J., Jornet, A., 1984. Monitoring of heavy metalsin superficial sediment and some marine organisms from the westernMediterranean coast. VIIes Journees Etud. Pollutions, Lucerne, CIESM,321–326.
DelValls, T.A., Chapman, P.M., 1998. The use of multivariate analysis to link thesediment quality triad components to site-specific sediment quality values in
the Gulf of Cadiz (Spain) and in San Francisco Bay (USA). Cien. Mar. 24,313–336.
DelValls, T.A., Forja, J.M., Gonzalez-Mazo, E., Gomez-Parra, A., 1998. Determiningcontamination sources in marine sediments using multivariate analysis. Trac-Trend. Anal. Chem. 17, 181–192.
Di Toro, D.M., Mahony, J.D., Hansen, D.J., Scott, K.J., Hicks, M.B., Mayr, S.M.,Redmond, M.S., 1990. Toxicity of cadmium in sediments: the role of acidvolatile sulfide. Environ. Toxicol. Chem. 9, 1487–1502.
Di Toro, D.M., Mahony, J.D., Hansen, D.J., Scott, K.J., Carlson, A.R., Ankley, G.T., 1992.Acid volatile sulfide predicts the acute toxicity of cadmium and nikel insediments. Environ. Sci. Technol. 26, 96–101.
Environment Canada, 1992. Biological test method: Fertilization assay usingechinoids (sea urchins and sand dollars), amended November 1997. EPS 1/RM/27. North Vancouver, BC.
Ferraro, S.P., Cole, F.A., 2002. A field validation of two sediment-amphipod toxicitytests. Environ. Toxicol. Chem. 21, 1423–1437.
Grant, A., Hately, J.G., Jones, N.V., 1989. Mapping the ecological impact of heavymetals in the estuarine polychaete Nereis diversicolor using inherited metaltolerance. Mar. Pollut. Bull. 20, 235–238.
Hunt, J.W., Anderson, B.S., Phillips, B.M., Tjeerdema, R.S., Taberski, K.M., Wilson,C.J., Puckett, H.M., Stephenson, M., Fairey, R., Oakden, J., 2001. A large-scalecategorization of sites in San Francisco Bay, USA, based on the sediment qualitytriad, toxicity identification evaluations, and gradient studies. Environ. Toxicol.Chem. 20, 1252–1265.
Long, E.R., MacDonald, D.D., Smith, S.L., Calder, F.D., 1995. Incidence of adversebiological effects within ranges of chemical concentrations in marine andestuarine sediments. Environ. Manage. 19, 81–97.
Long, E.R., Carr, R.S., Montagua, P.A., 2003. Porewater toxicity tests: Values as acomponent of sediment quality triad assessments. In: Carr, R.S., Nipper, M.(Eds.), Porewater Toxicity Testing: Biological, Chemical, and EcologicalConsiderations. SETAC Press, Pensacola, FL, pp. 163–200.
Luoma, S.N., Ho, K.T., 1993. Appropriate uses of marine and estuarine sedimentbioassays. In: Calow, P. (Ed.), Handbook of Ecotoxicology. Blackweel Scientific,Oxford, pp. 193–226.
Luoma, S.N., Fisher, N., 1997. Uncertainties in assessing contaminant exposure fromsediments. In: Ingersoll, C.G., Dillon, T., Biddinger, G.R. (Eds.), Ecological RiskAssessment of Contaminated Sediments, first ed. SETAC Press, Pensacola, FL,USA, pp. 211–237.
Marin-Guirao, L., Cesar, A., Marın, A., Vita, R., 2005. Establishing the ecologicalquality status of soft-bottom mining-impacted coastal water bodies in thescope of the Water Framework Directive. Mar. Pollut. Bull. 50, 374–387.
Perez, J.G., Puente, C.R., 1989. Estudio de la contaminacion marina entre Cabo dePalos y Cabo Tinoso (SE-Espana). Concentraciones de cadmio, plomo y cinc ensedimentos superficiales. Informes Tecnicos Instituto Espanol de Oceanografıa.MAPA.
Rey, J., Del Rıo, V.D., 1983. La plataforma continental Mediterranea, entre cabo dePalos y cabo Tinoso: morfologıa y estudios sısmicos de la coberturasedimentarıa. Informes Tecnicos Instituto Espanol de Oceanografıa.
Riba, I., Forja, J.M., Gomez-Parra, A., DelValls, T.A., 2004a. Sediment quality inlittoral regions of the Gulf of Cadiz: a triad approach to address the influence ofmining activities. Environ. Pollut. 132, 341–353.
Riba, I., Casado-Martınez, M.C., Forja, J.M., DelValls, T.A., 2004b. Sediment qualityin Atlantic Coast of Spain. Environ. Toxicol. Chem. 23 (2), 271–282.
Somerfield, P.J., Gee, J.M., Warwicck, R.M., 1994. Soft sediment meiofaunalcommunity structure in relation to a long-term heavy metal gradient in theFal estuary system. Mar. Ecol. Prog. Ser. 105, 79–88.
Swartz, R.C., 1989. Marine sediment toxicity tests. In: Contaminated MarineSediments—Assessment and Remediation. National Academy Press, Washing-ton, DC, pp. 115–129.
Tabachnic, B.G., Fidell, L.S., 1996. Using Multivariate Statistics. Harper Collins,College Publishers, New York, NY, USA.
US Environmental Protection Agency, 1994. Methods for assessing the toxicity ofsediment-associated contaminants with estuarine and marine amphipods.EPA/600/-94/025, Narragansett, RI 02882.
US Environmental Protection Agency, 1995. Short-term methods for estimating thechronic toxicity of effluents and receiving waters to west coast marine andestuarine organisms. EPA/600/R-95-136, Cincinnati, OH.
Verdardo, D.J., Forelich, P.N., Mc Intyre, A., 1990. Determination of organic carbonand nitrogen in marine sediments using the Carlo Erba NA-1500 analyzer.Deep-Sea Res. 37, 157–165.
Whitfield, M., 1974. The hydrolysis of ammonia ions in sea water—a theoreticalstudy. J. Mar. Biol. Assoc. UK 54, 565–580.
Whiteman, F.M., Ankley, G.T., Kahl, M.D., Rau, D.M., Bacer, M.D., 1996. Evaluation ofinterstitial water as route of exposure for ammonia in sediment tests withbenthic macroinvertebrates. Environ. Toxicol. Chem. 15, 794–801.
ARTICLE IN PRESS
A. Cesar et al. / Ecotoxicology and Environmental Safety 72 (2009) 1832–1841 1841