Integrating Graphing Calculators and Probeware Into Science Methods Courses: Impacts on Preservice...
20
Jl. of Computers in Math ematics and Science Teaching (2008) 27(2), 163-182 Integrating Graphing Calculators and Probeware Into Science Methods Courses: Impacts on Preservice Elementary Teachers’ Confidence and Perspectives on Technology for Learning and Teaching IRINA LYUBLINSKAYA College of Staten Island USA [email protected] GEORGE ZHOU University of Windsor Canada [email protected] Graphing calculators and data collection technology was in- tegrated in an undergraduate science methods classes for pre- service elementary school teachers. The study investigated whether preservice teachers’ knowledge and comfort with the use of graphing calculator technology and their perspectives in the use of graphing calculator technology were influenced by integration of this technology in the methods course over a period of one semester. Towards this end a survey was ad- ministered to all class participants at the beginning and at the end of the semester. The survey addressed preservice teach- ers’ confidence level with the calculator-based technology, at- titudes towards using this technology for their own learning, and the attitudes towards using it as a teaching tool. In addi- tion, preservice teachers completed several open-ended reflec- tions throughout the semester that provided qualitative data. The results of this study suggest that the preservice teachers view the graphing calculator as a productivity tool while they view data collection devices as a teaching tool. More expo- sure to technology produces more influence on preservice teachers’ perspectives and attitudes, but not necessarily their
Transcript of Integrating Graphing Calculators and Probeware Into Science Methods Courses: Impacts on Preservice...
Jl. of Computers in MathComputers in MathComput ematics and Science Teachingematics and Science Teachingemat (2008) 27(2), 163-182
Integrating Graphing Calculators and Probeware Into Science Methods Courses: Impacts on Preservice
Elementary Teachers’ Confi dence and Perspectives on Technology for Learning and Teaching
IRINA LYUBLINSKAYACollege of Staten Island
GEORGE ZHOUUniversity of Windsor
Graphing calculators and data collection technology was in-tegrated in an undergraduate science methods classes for pre-service elementary school teachers. The study investigated whether preservice teachers’ knowledge and comfort with the use of graphing calculator technology and their perspectives in the use of graphing calculator technology were infl uenced by integration of this technology in the methods course over a period of one semester. Towards this end a survey was ad-ministered to all class participants at the beginning and at the end of the semester. The survey addressed preservice teach-ers’ confi dence level with the calculator-based technology, at-titudes towards using this technology for their own learning, and the attitudes towards using it as a teaching tool. In addi-tion, preservice teachers completed several open-ended refl ec-tions throughout the semester that provided qualitative data. The results of this study suggest that the preservice teachers view the graphing calculator as a productivity tool while they view data collection devices as a teaching tool. More expo-sure to technology produces more infl uence on preservice teachers’ perspectives and attitudes, but not necessarily their

164 Lyublinskaya and Zhou
confi dence. Confi dence and perspective are somewhat inde-pendent of each other.
Over the last two decades, the integration of various educational tech-nologies into teaching and learning has become an important topic in educa-tion. Many governmental agencies have set up relevant curriculum standards to direct the implementation of educational technology. A number of non-governmental organizations such as the Society for Information Technology and Teacher Education have been founded to promote research and practice in the use of technology in teacher education. Today’s teachers are therefore expected to become profi cient in integrating educational technology into their teaching.
Graphing calculators have been widely used in mathematics teaching in the past decade. Studies have demonstrated that the use of graphing calcula-tors increased students’ computational and procedural skills in mathematics learning (Harskamp, Suhre, & van Struen, 2000; Hong, Toham, & Kiernan, 2000). However, past studies have provided a mixed picture regarding the infl uence of graphing calculators on students’ deeper conceptual understand-ing of mathematics (Hong et al., 2000; Ruthven, 1990; Thompson & Senk, 2001). Researchers have argued that for cases in which graphing calculators failed to improve students’ conceptual understanding of mathematics, fail-ures stemmed from the pedagogy that was employed (Kastberg & Leatham, 2005). In these cases, the calculators were often used as an add-on to tradi-tional teaching rather than in a more integrated way (Kastberg & Leatham).
The development of data collection probes in the past decade has brought graphing calculator technology into science classrooms. With more than 50 types of probes available on the market today, students can collect a variety of data ranging from temperature and voltage to respiration rate and EKG over a time period. Data collected with Calculator-Based Labo-ratory (CBL™) interface and probes are automatically transferred to the graphing calculator for analysis. Thus the calculator-based technology can be used to create an inquiry-based learning environment, where students are involved in collecting real time data, generating hypotheses, analyzing data, and drawing conclusions (Lyublinskaya, 2003a, 2003b). These stu-dent-centered activities increase students’ understanding of the concepts and methods of science (Cortes-Figueroa & Moore, 1999; Niess, 2001; Stager, 2000). Therefore, science teachers should have profi ciency in using calcula-tor technology in teaching. To develop teachers’ competency in technology, teacher preparation programs must lead in the implementation of technol-ogy (Browning & Klespis, 2000; Garofalo, Drier, Harper, Timmerman, &
Integrating Graphing Calculators and Probeware Into Science Methods 165
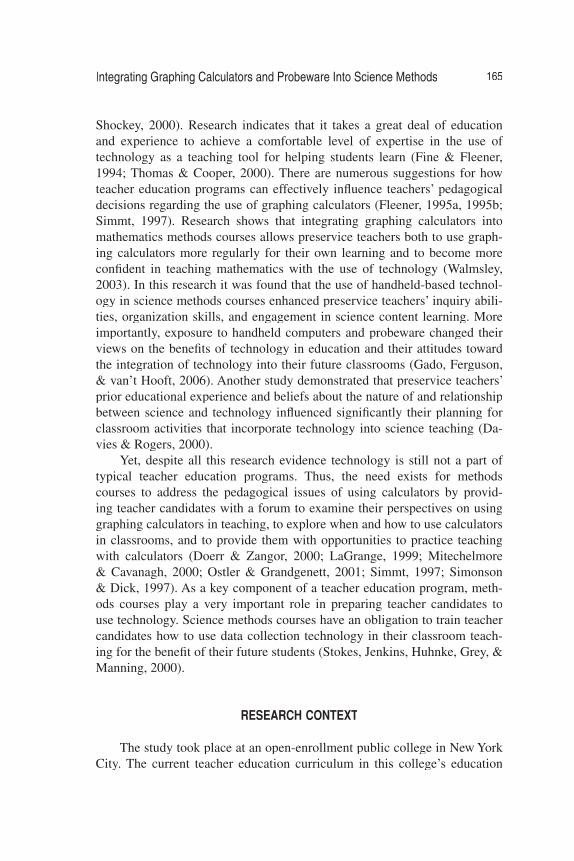
Shockey, 2000). Research indicates that it takes a great deal of education and experience to achieve a comfortable level of expertise in the use of technology as a teaching tool for helping students learn (Fine & Fleener, 1994; Thomas & Cooper, 2000). There are numerous suggestions for how teacher education programs can effectively infl uence teachers’ pedagogical decisions regarding the use of graphing calculators (Fleener, 1995a, 1995b; Simmt, 1997). Research shows that integrating graphing calculators into mathematics methods courses allows preservice teachers both to use graph-ing calculators more regularly for their own learning and to become more confi dent in teaching mathematics with the use of technology (Walmsley, 2003). In this research it was found that the use of handheld-based technol-ogy in science methods courses enhanced preservice teachers’ inquiry abili-ties, organization skills, and engagement in science content learning. More importantly, exposure to handheld computers and probeware changed their views on the benefi ts of technology in education and their attitudes toward the integration of technology into their future classrooms (Gado, Ferguson, & van’t Hooft, 2006). Another study demonstrated that preservice teachers’ prior educational experience and beliefs about the nature of and relationship between science and technology infl uenced signifi cantly their planning for classroom activities that incorporate technology into science teaching (Da-vies & Rogers, 2000).
Yet, despite all this research evidence technology is still not a part of typical teacher education programs. Thus, the need exists for methods courses to address the pedagogical issues of using calculators by provid-ing teacher candidates with a forum to examine their perspectives on using graphing calculators in teaching, to explore when and how to use calculators in classrooms, and to provide them with opportunities to practice teaching with calculators (Doerr & Zangor, 2000; LaGrange, 1999; Mitechelmore & Cavanagh, 2000; Ostler & Grandgenett, 2001; Simmt, 1997; Simonson & Dick, 1997). As a key component of a teacher education program, meth-ods courses play a very important role in preparing teacher candidates to use technology. Science methods courses have an obligation to train teacher candidates how to use data collection technology in their classroom teach-ing for the benefi t of their future students (Stokes, Jenkins, Huhnke, Grey, & Manning, 2000).
RESEARCH CONTEXT
The study took place at an open-enrollment public college in New York City. The current teacher education curriculum in this college’s education
166 Lyublinskaya and Zhou
department employs mainly computers and educational software. However, since graphing calculators and calculator based probeware have already been adopted by the New York City Department of Education for school teaching, the authors, who are instructors of science methods courses, felt the neces-sity of including graphing calculator technologies in method courses as cur-riculum content and as a teaching tool.
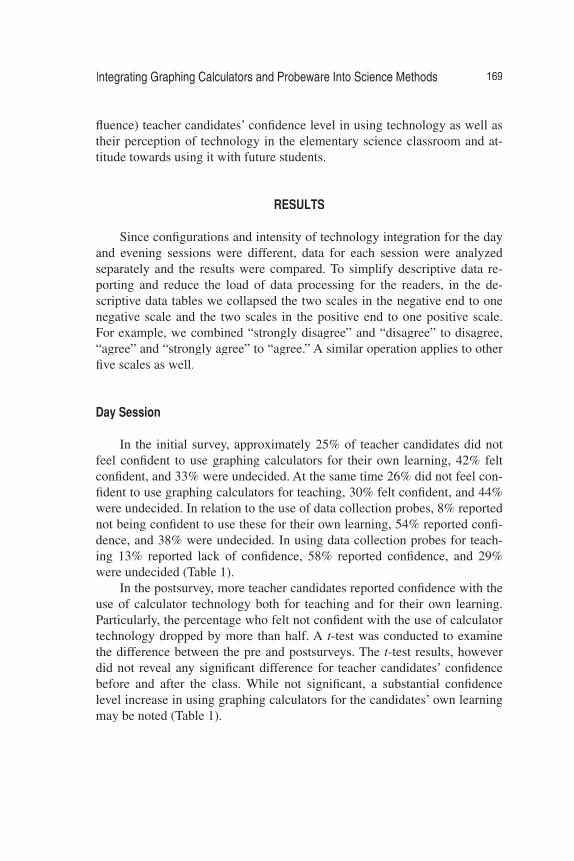
TI-84 Plus Silver Graphing calculators, Vernier LabPro®, and Vernier EasyLink® data interfaces, and Vernier probes (Figure 1) were integrat-ed into two sessions of the science methods course for elementary school teachers during the spring semester of 2006.
Figure 1. Graphing calculator based data collection technology: (a) Vernier pH probe connected to the TI-84 SE calculator by way of LabPro® inter-face; (b) Vernier Voltage probe connected to the TI-84 SE calculator by way of Vernier EasyLink® interface; (c) Vernier EasyTemp® probe connected directly to the TI-84 SE calculator.
The two sessions, day and evening, had different confi gurations, were taught by different instructors, and therefore involved technology different-ly. The day session spent fi ve weeks at the college to concentrate on learning theories and ten weeks at schools for teaching practice. The class met 100 minutes weekly for the fi rst fi ve weeks. Students were engaged in learning and teaching with graphing calculator technology through two projects in two out of fi ve classes that were held at the college. The purpose of the fi rst project was to discover how pH in the soil affects the growth of grass. Stu-dents worked in groups and used graphing calculators, data interfaces, and pH probes to compare the pH values of two soil samples with conditions for
Integrating Graphing Calculators and Probeware Into Science Methods 167
the grass growth. The purpose of the second project: How Do Mittens Keep Your Hands Warm? was to address a common children’s misconception that mittens generate heat (Yeo & Zadnik, 2001). This project was conducted through a discovery-based activity using temperature probes with graphing calculators.
The evening session met at the college 14 times during the semester for 3 hours weekly. The calculator-based technologies were introduced to the students throughout the semester. In addition to the two projects used in the day session, seven more calculator-based activities were developed and inte-grated into the class. The soil study activity was modifi ed into crime scene investigation, where students were asked to identify the soil by three char-acteristics, pH, appearance, and absorbency, in order to identify a suspect. Additional activities focused on core curriculum topics in physical, earth and space sciences, and incorporated use of gas pressure, temperature, light, force, voltage, and motion sensors. All these activities exposed students to a variety of data collection instruments that could be used in the elementary science classroom as well as to help them to refresh science concepts they learned in their science classes.
PURPOSE AND RESEARCH QUESTIONS
The purpose of integrating calculator-based technology into science methods courses was to model strategies for integrating this technology into learning and teaching, with the intention of changing preservice teach-ers’ attitudes towards the use of technology in their future classrooms. The following research questions guided the study: whether preservice teach-ers’ knowledge and comfort with the use of graphing calculator technology and preservice teachers’ perspectives of using graphing calculator technol-ogy were infl uenced by the integration of this technology into the methods course?
PARTICIPANTS
The day session had 25 students. All students in the day session were females. Approximately 91% were in their 20s and 9% in their 30s. They were all enrolled in the undergraduate teacher education program. Approxi-mately 29% hold an associate degree, 8% had a baccalaureate degree, and 63% had only a high school diploma. Seventy-one percent (71%) of the stu-
168 Lyublinskaya and Zhou
dents had never taught before taking the course, while 8% reported one year teaching experience, and 21% had taught two, three, or four years. Sixty-two percent (62%) did not have a graphing calculator at home, and 38% did.
The evening session had 13 students. All students in the evening ses-sion were females. Approximately 77% were in their twenties and 23% were over 40. They were all enrolled in the undergraduate teacher education pro-gram. Approximately 62% held an associate degree, 0% had a baccalaureate degree, and 38% had only a high school diploma. Seventy percent (70%) of the students had never taught before taking the course and 30% had taught for two or more years. Forty-six percent (46%) did not have a graphing cal-culator at home and 54% did.
Compared with the day session, the evening session students were old-er, had more college education, and probably more prior experience with graphing calculators (more calculator ownership at home).
METHODOLOGY
A mixed method combining quantitative and qualitative investigation was used. One time pre- and postsurvey was used to assess preservice teach-ers’ attitudes (confi dence level, importance, and interest) towards calcula-tor-based technology. In the fi rst part of the survey teacher candidates were asked to rate the extent to which they agree or disagree with statements re-fl ecting their confi dence in using graphing calculators and probeware that uses a 5-point Likert scale. The second part of the survey dealt with atti-tudes towards the use of graphing calculators and probeware for preservice teachers’ own learning; and the third part dealt with the attitudes towards us-ing this technology as a teaching tool in the future classroom. In the last two parts of the survey preservice teachers were offered several pairs of opposite adjectives, such as boring-interesting. For each pair they were given a con-tinuous scale with the choice of fi ve marks on the scale, where 1 represented the fi rst adjective, such as boring, and 5 represented the other adjective, such as interesting. Participants were asked to choose a mark on the scale that was the best descriptor of their attitudes.
This survey was administered to all preservice teachers in both sections at the beginning of the semester before calculator-based technology was in-troduced and at the end of the semester. Qualitative data were collected in the form of open refl ections to illustrate or clarify results from quantitative data and to provide a deeper understanding of how the use of educational technology in the classroom during the semester infl uenced (or failed to in-
Integrating Graphing Calculators and Probeware Into Science Methods 169
fl uence) teacher candidates’ confi dence level in using technology as well as their perception of technology in the elementary science classroom and at-titude towards using it with future students.
RESULTS
Since confi gurations and intensity of technology integration for the day and evening sessions were different, data for each session were analyzed separately and the results were compared. To simplify descriptive data re-porting and reduce the load of data processing for the readers, in the de-scriptive data tables we collapsed the two scales in the negative end to one negative scale and the two scales in the positive end to one positive scale. For example, we combined “strongly disagree” and “disagree” to disagree, “agree” and “strongly agree” to “agree.” A similar operation applies to other fi ve scales as well.
Day Session
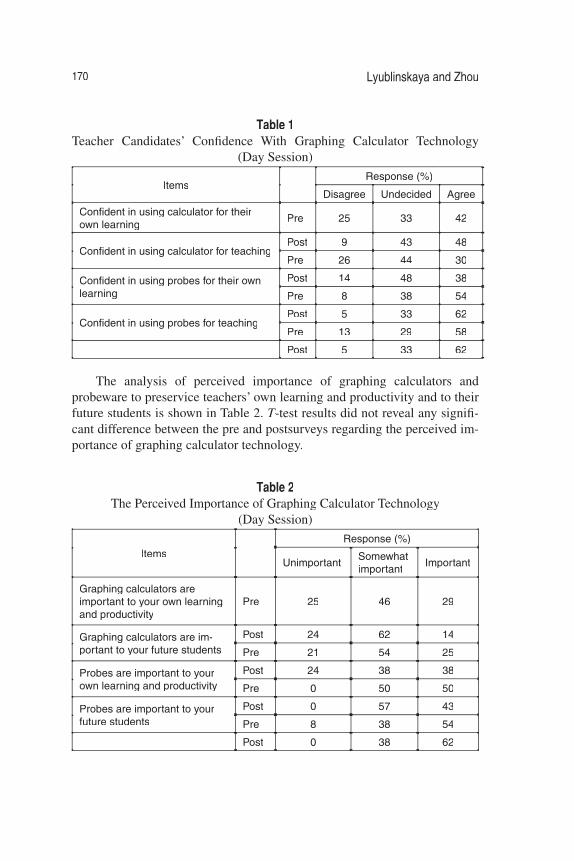
In the initial survey, approximately 25% of teacher candidates did not feel confi dent to use graphing calculators for their own learning, 42% felt confi dent, and 33% were undecided. At the same time 26% did not feel con-fi dent to use graphing calculators for teaching, 30% felt confi dent, and 44% were undecided. In relation to the use of data collection probes, 8% reported not being confi dent to use these for their own learning, 54% reported confi -dence, and 38% were undecided. In using data collection probes for teach-ing 13% reported lack of confi dence, 58% reported confi dence, and 29% were undecided (Table 1).
In the postsurvey, more teacher candidates reported confi dence with the use of calculator technology both for teaching and for their own learning. Particularly, the percentage who felt not confi dent with the use of calculator technology dropped by more than half. A t-test was conducted to examine the difference between the pre and postsurveys. The t-test results, however did not reveal any signifi cant difference for teacher candidates’ confi dence before and after the class. While not signifi cant, a substantial confi dence level increase in using graphing calculators for the candidates’ own learning may be noted (Table 1).
170 Lyublinskaya and Zhou
Table 1Teacher Candidates’ Confi dence With Graphing Calculator Technology
(Day Session)
ItemsResponse (%)
Disagree Undecided Agree
Confi dent in using calculator for their own learning
Pre 25 33 42
Confi dent in using calculator for teachingPost 9 43 48
Pre 26 44 30
Confi dent in using probes for their own learning
Post 14 48 38
Pre 8 38 54
Confi dent in using probes for teachingPost 5 33 62
Pre 13 29 58
Post 5 33 62
The analysis of perceived importance of graphing calculators and probeware to preservice teachers’ own learning and productivity and to their future students is shown in Table 2. T-test results did not reveal any signifi -T-test results did not reveal any signifi -Tcant difference between the pre and postsurveys regarding the perceived im-portance of graphing calculator technology.
Table 2The Perceived Importance of Graphing Calculator Technology
(Day Session)
ItemsResponse (%)
UnimportantSomewhat important
Important
Graphing calculators are important to your own learning and productivity
Pre 25 46 29
Graphing calculators are im-portant to your future students
Post 24 62 14
Pre 21 54 25
Probes are important to your own learning and productivity
Post 24 38 38
Pre 0 50 50
Probes are important to your future students
Post 0 57 43
Pre 8 38 54
Post 0 38 62
Integrating Graphing Calculators and Probeware Into Science Methods 171
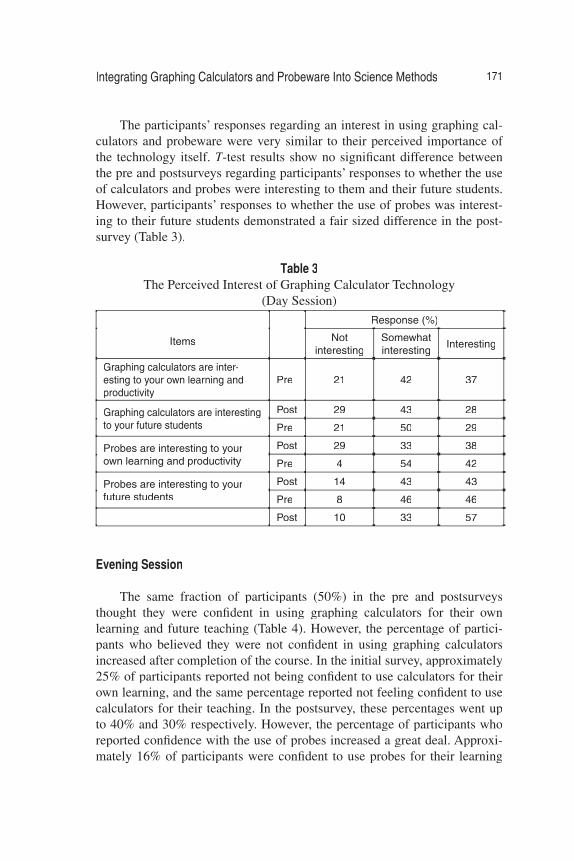
The participants’ responses regarding an interest in using graphing cal-culators and probeware were very similar to their perceived importance of the technology itself. T-test results show no signifi cant difference between T-test results show no signifi cant difference between Tthe pre and postsurveys regarding participants’ responses to whether the use of calculators and probes were interesting to them and their future students. However, participants’ responses to whether the use of probes was interest-ing to their future students demonstrated a fair sized difference in the post-survey (Table 3).
Table 3The Perceived Interest of Graphing Calculator Technology
(Day Session)
Items
Response (%)
Not interesting
Somewhat interesting
Interesting
Graphing calculators are inter-esting to your own learning and productivity
Pre 21 42 37
Graphing calculators are interesting to your future students
Post 29 43 28
Pre 21 50 29
Probes are interesting to your own learning and productivity
Post 29 33 38
Pre 4 54 42
Probes are interesting to your future students
Post 14 43 43
Pre 8 46 46
Post 10 33 57
Evening Session
The same fraction of participants (50%) in the pre and postsurveys thought they were confi dent in using graphing calculators for their own learning and future teaching (Table 4). However, the percentage of partici-pants who believed they were not confi dent in using graphing calculators increased after completion of the course. In the initial survey, approximately 25% of participants reported not being confi dent to use calculators for their own learning, and the same percentage reported not feeling confi dent to use calculators for their teaching. In the postsurvey, these percentages went up to 40% and 30% respectively. However, the percentage of participants who reported confi dence with the use of probes increased a great deal. Approxi-mately 16% of participants were confi dent to use probes for their learning
172 Lyublinskaya and Zhou
and 25% for their teaching at the beginning of the course. These two per-centages both went up to 60% after the completing of the course. However, t-test results did not reveal any signifi cant difference between pre and post-surveys regarding participants’ confi dence in the use of graphing calculators and probes.
Table 4Teacher Candidates’ Confi dence With Graphing Calculator Technology
(Evening Session)
ItemsResponse (%)
Disagree Undecided Agree
Confi dent in using calculator for their own learning
Pre 25 25 50
Confi dent in using calculator for teach-ing
Post 40 10 50
Pre 25 25 50
Confi dent in using probes for their own learning
Post 30 20 50
Pre 42 42 16
Confi dent in using probes for teachingPost 30 10 60
Pre 33 42 25
Post 20 20 60
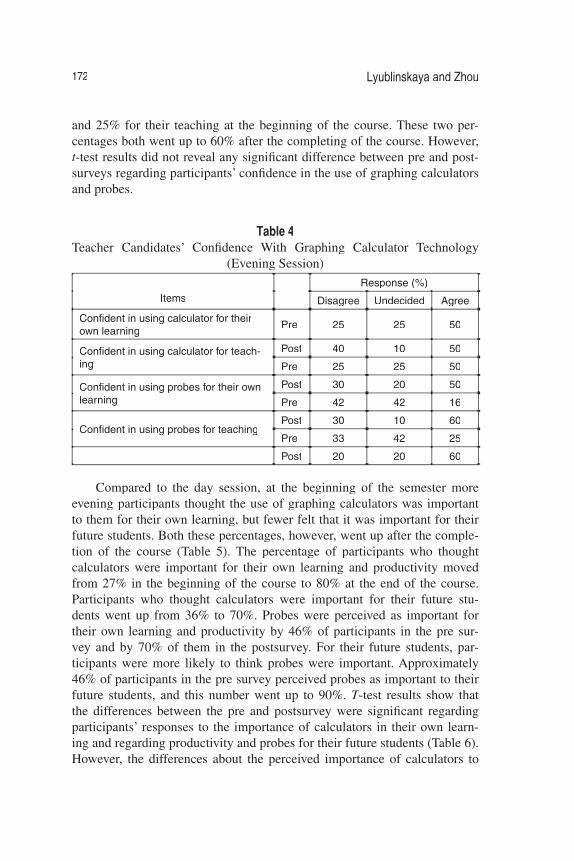
Compared to the day session, at the beginning of the semester more evening participants thought the use of graphing calculators was important to them for their own learning, but fewer felt that it was important for their future students. Both these percentages, however, went up after the comple-tion of the course (Table 5). The percentage of participants who thought calculators were important for their own learning and productivity moved from 27% in the beginning of the course to 80% at the end of the course. Participants who thought calculators were important for their future stu-dents went up from 36% to 70%. Probes were perceived as important for their own learning and productivity by 46% of participants in the pre sur-vey and by 70% of them in the postsurvey. For their future students, par-ticipants were more likely to think probes were important. Approximately 46% of participants in the pre survey perceived probes as important to their future students, and this number went up to 90%. T-test results show that T-test results show that Tthe differences between the pre and postsurvey were signifi cant regarding participants’ responses to the importance of calculators in their own learn-ing and regarding productivity and probes for their future students (Table 6). However, the differences about the perceived importance of calculators to
Integrating Graphing Calculators and Probeware Into Science Methods 173
their future students and probes for their own learning and productivity were found not signifi cant.
Table 5The Perceived Importance of Graphing Calculator Technology
(Evening Session)
ItemsResponse (%)
UnimportantSomewhat important
Important
Graphing calculators are impor-tant to your own learning and productivity
Pre 36 37 27
Graphing calculators are impor-tant to your future students
Post 20 0 80
Pre 18 46 36
Probes are important to your own learning and productivity
Post 20 10 70
Pre 18 36 46
Probes are important to your future students
Post 0 30 70
Pre 20 20 60
Post 0 10 90
Table 6T-test Results on the Importance of Calculator Technology T-test Results on the Importance of Calculator Technology T
(Evening Session)
Mean Standards deviation
T p
Graphing calculators are important to your own learning and produc-tivity
Pre 3.09 0.5393.214 0.005
Post 4.10 0.876
Probes are important to your future students
Pre 3.50 0.9722.905 0.009
Post 4.60 0.699
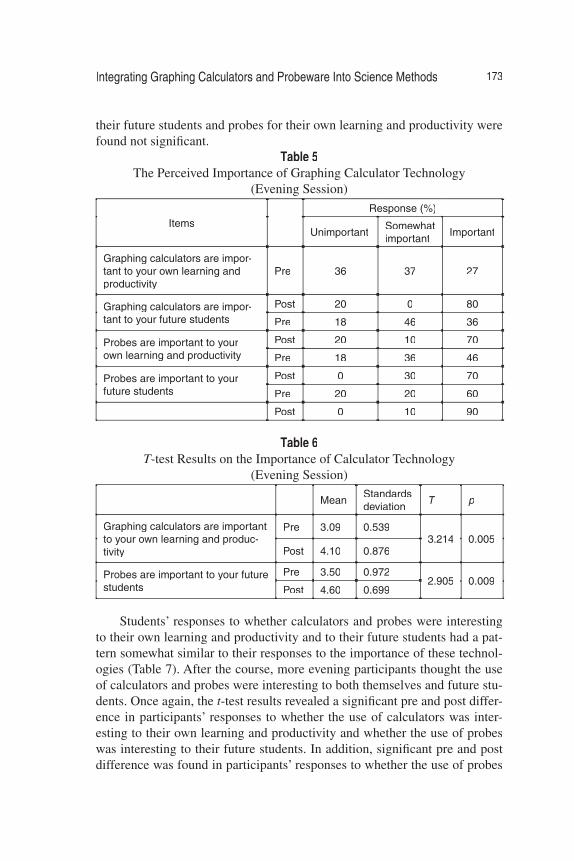
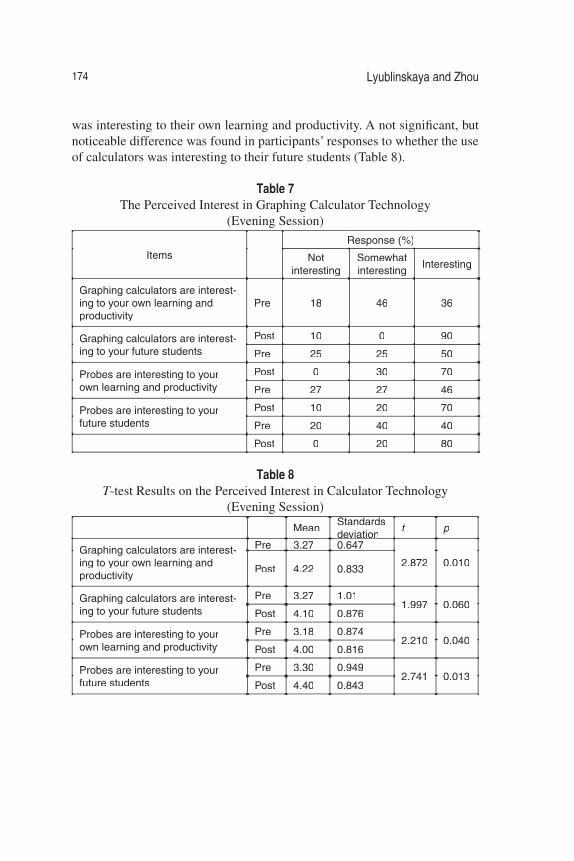
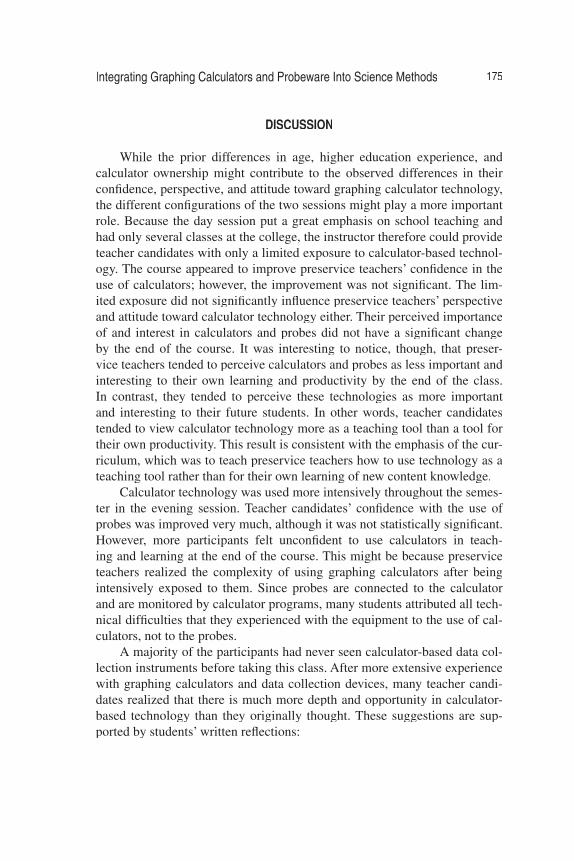
Students’ responses to whether calculators and probes were interesting to their own learning and productivity and to their future students had a pat-tern somewhat similar to their responses to the importance of these technol-ogies (Table 7). After the course, more evening participants thought the use of calculators and probes were interesting to both themselves and future stu-dents. Once again, the t-test results revealed a signifi cant pre and post differ-ence in participants’ responses to whether the use of calculators was inter-esting to their own learning and productivity and whether the use of probes was interesting to their future students. In addition, signifi cant pre and post difference was found in participants’ responses to whether the use of probes
174 Lyublinskaya and Zhou
was interesting to their own learning and productivity. A not signifi cant, but noticeable difference was found in participants’ responses to whether the use of calculators was interesting to their future students (Table 8).
Table 7The Perceived Interest in Graphing Calculator Technology
(Evening Session)
ItemsResponse (%)
Not interesting
Somewhat interesting
Interesting
Graphing calculators are interest-ing to your own learning and productivity
Pre 18 46 36
Graphing calculators are interest-ing to your future students
Post 10 0 90
Pre 25 25 50
Probes are interesting to your own learning and productivity
Post 0 30 70
Pre 27 27 46
Probes are interesting to your future students
Post 10 20 70
Pre 20 40 40
Post 0 20 80
Table 8T-test Results on the Perceived Interest in Calculator Technology T-test Results on the Perceived Interest in Calculator Technology T
(Evening Session)
Mean Standards deviationdeviation
t p
Graphing calculators are interest-ing to your own learning and productivity
Pre 3.27 0.647
2.872 0.010Post 4.22 0.833
Graphing calculators are interest-ing to your future students
Pre 3.27 1.011.997 0.060
Post 4.10 0.876
Probes are interesting to your own learning and productivity
Pre 3.18 0.8742.210 0.040
Post 4.00 0.816
Probes are interesting to your future students
Pre 3.30 0.9492.741 0.013
Post 4.40 0.843
Integrating Graphing Calculators and Probeware Into Science Methods 175
DISCUSSION
While the prior differences in age, higher education experience, and calculator ownership might contribute to the observed differences in their confi dence, perspective, and attitude toward graphing calculator technology, the different confi gurations of the two sessions might play a more important role. Because the day session put a great emphasis on school teaching and had only several classes at the college, the instructor therefore could provide teacher candidates with only a limited exposure to calculator-based technol-ogy. The course appeared to improve preservice teachers’ confi dence in the use of calculators; however, the improvement was not signifi cant. The lim-ited exposure did not signifi cantly infl uence preservice teachers’ perspective and attitude toward calculator technology either. Their perceived importance of and interest in calculators and probes did not have a signifi cant change by the end of the course. It was interesting to notice, though, that preser-vice teachers tended to perceive calculators and probes as less important and interesting to their own learning and productivity by the end of the class. In contrast, they tended to perceive these technologies as more important and interesting to their future students. In other words, teacher candidates tended to view calculator technology more as a teaching tool than a tool for their own productivity. This result is consistent with the emphasis of the cur-riculum, which was to teach preservice teachers how to use technology as a teaching tool rather than for their own learning of new content knowledge.
Calculator technology was used more intensively throughout the semes-ter in the evening session. Teacher candidates’ confi dence with the use of probes was improved very much, although it was not statistically signifi cant. However, more participants felt unconfi dent to use calculators in teach-ing and learning at the end of the course. This might be because preservice teachers realized the complexity of using graphing calculators after being intensively exposed to them. Since probes are connected to the calculator and are monitored by calculator programs, many students attributed all tech-nical diffi culties that they experienced with the equipment to the use of cal-culators, not to the probes.
A majority of the participants had never seen calculator-based data col-lection instruments before taking this class. After more extensive experience with graphing calculators and data collection devices, many teacher candi-dates realized that there is much more depth and opportunity in calculator-based technology than they originally thought. These suggestions are sup-ported by students’ written refl ections:
176 Lyublinskaya and Zhou
I never realized a calculator could do more than my math home-work. Calculators are great to use in elementary classrooms espe-cially for science.
I have never had the opportunity to utilize calculator-based technology either in the classroom teaching students or in my own learning experiences in school. As a result of using this technology with CSI No Dumping Soil Study I feel that this technology provides students with a means to further their understanding of concepts, engages student in learning and provides valuable data/information to analyze and share. This technology is essential in the science classroom in the elementary school.
Compared with the day session, the evening session had a higher per-centage of participants who perceived calculator technology as important and interesting to their own learning and productivity and to their future stu-dents. The intensive exposure to calculator technology in this session might again provide an explanation. Participants had a variety of opportunities to better see the correlation between their own learning and use of technology. Some of them expressed the importance of technology for their own learn-ing. “By doing experiments in the class I now understand…science concepts and will therefore be able to share better my knowledge with students.”
Some of the participants initially had strong reservations against use of calculators in classrooms. The use of calculators in class changed their per-ception.
I always thought that calculator-based technology was good but if a student relied on a calculator too much they would become lazy. Now I feel that calculator-based technology should be used a lot with kids in the classroom because I think it will help them under-stand the topic better.
Overall, all preservice teachers in the evening class felt that the experience they had with technology would defi nitely affect the way they plan to teach in the future:
I defi nitely have more technology skills after taking this class…I would integrate a graphing calculator into my classroom with assistance from a science teacher.I feel that I will be able to do more engaging lessons with my students to help them learn more.

Integrating Graphing Calculators and Probeware Into Science Methods 177
Fine and Fleener (1994) found that the mentions of pros and cons of calculator use and the brief demonstration lesson plan given in mathemaics methods courses left preservice teachers with at best a superfi cial under-standing of technology; however, they appeared inadequately prepared to employ calculators in classrooms of their own. The present study confi rmed the importance of extensive exposure in the use of technology. Even in the evening session, some teacher candidates still did not feel confi dent enough to use calculator technology in their teaching after completing the course.
I agree that I have a bit more technology skills, but not enough to be confi dent in implementing technology in a class setting.
After taking this class, I think I’ve more technology skills to use technology in teaching, but I’ll need more time to practice with all the technology devices. It’s because although we did many interesting activities with technology, I didn’t have enough time to know & practice more … graphing calculator & and the devices we can connect to graphing calculators.
In the evening session, a signifi cant improvement took place between the pre and postsurveys on participants’ perceptions of calculators and probes as important to their own learning and productivity, and of probes as important to their future students. However, there was no signifi cant change in participants’ perceived importance of calculators to their future students even though the pre and postsurveys difference is quite large. It seems that participants tended to view calculators more as a tool for their own learning while they viewed probes more as a teaching tool. This is consistent with the emphasis in the curriculum on the use of data collection probes in devel-opment of technology-based science activities in class.
CONCLUSION
This study leads us to conclude that perspectives and attitudes of pre-service teachers strongly depend on the intensity and length of experience they have with use of graphing calculators and calculator based data col-lection devices. More experience and practice provides preservice teachers with better understanding of the benefi ts of this type of technology for their future students as well as for their own learning. Before they have had inten-sive experience with graphing calculators, some teacher candidates tend to
178 Lyublinskaya and Zhou
underestimate the level of sophistication required to develop teaching ma-terials for the use of technology. Their confi dence level is high at the begin-ning; but with more exposure it can go down, when they realize that they do need to learn more about technology and that they have to keep up with it.
A majority of participants in both sessions had prior knowledge of graphing calculators, but did not have any knowledge of data collection devices. They had experience with graphing calculators in their previous coursework and perceived it as an important tool for their own learning. The probes were used to illustrate science concepts; and, since this was not a science course but a methods course, probes were not perceived as tools for learning, but only as tools for teaching. If teacher candidates were exposed to these instruments in the science content courses, the situation could have been different.
Our study found that participants’ confi dence in the use of technology is somewhat independent of their perspective. In other words, people can perceive technology as very useful, but they are not confi dent enough to use it. The integration of calculator-based technology into methods courses can change preservice teachers’ perspectives on the use of technology in teach-ing and learning, but it is not enough to improve their confi dence in using it. The only way to build preservice teachers’ confi dence level is to provide them with the opportunities to use these technologies in general education and content courses. If teacher candidates come to the methods classes with content and technology skills, education courses could better prepare them for the appropriate use of technology in teaching different disciplines.
References
Browning, C. A., & Klespis, M. L. (2000). A reaction to Garofalo, Drier, Harper, Timmerman, and Shockey. Contemporary Issues in Technology and Teacher Education, 1(2), 226-228.
Cortes-Figueroa, J. E., & Moore, D. A. (1999). Using CBL technology and a graph-ing calculator to teach the kinetics of consecutive fi rst-order reactions. Journal of Chemical Education, 76(5), 635-638.
Davies, D., & Rogers, M. (2000). Preservice primary teachers’ planning for sci-ence and technology activities: Infl uences and constraints. Research in Sci-ence & Technological Education, 18(2), 215-225.
Doerr, H. M., & Zangor, R. (2000). Creating meaning for and with the graphing calculator. Educational Studies in Mathematics, 41(2), 143-163.
Fine, A. E., & Fleener, M. L. (1994). Calculators as instructional tools: Percep-tions of three preservice teachers. Journal of Computers in Mathematics and Science Teaching, 13(1), 83-100.
Integrating Graphing Calculators and Probeware Into Science Methods 179
Fleener, M. J. (1995a). The relationship between experience and philosophical orientation: A comparison of preservice and practicing teachers’ beliefs about calculators. Journal of Computers in Mathematics and Science Teach-ing, 14(3), 359-376.
Fleener, M. J. (1995b). A survey of mathematics teachers’ attitudes about cal-culators: The impact of philosophical orientation. Journal of Computers in Mathematics and Science Teaching, 14(4), 481-498.
Gado, I., Ferguson, R., & van’t Hooft, M. (2006). Using handheld-computers and probeware in a science methods course: Preservice teachers’ attitudes and self-effi cacy. Journal of Technology and Teacher Education, 14(3), 501-529.
Garofalo, J., Drier, H. S., Harper, S., Timmerman, M. A., & Shockey, T. (2000). Promoting appropriate use of technology in mathematics teacher prepara-tion. Contemporary Issues in Technology and Teacher Education, 1(1), 66-88.
Harskamp, E. G., Suhre, C. J. M., & van Struen, A. (2000). The graphics cal-culator and students’ solution strategies. Mathematics Education Research Journal, 12(1), 37-52.
Hong, Y., Toham, M., & Kiernan, C. (2000). Supercalculators and university en-trance calculus examinations. Mathematics Education Research Journal, 12(3), 321-326.
Kastberg, S., & Leatham, K. (2005). Research on graphing calculators at the secondary level: Implications for mathematics teacher education. Contem-porary Issues in Technology and Teacher Education, 5(1), 25-37.
LaGrange, J.-B. (1999). Complex calculators in the classroom: Theoretical and practical refl ections on teaching precalculus. International Journal of Com-puters for Mathematical Learning, 4(1), 51-81.
Lyublinskaya, I. (2003a) Connecting mathematics with science: Experiments for precalculus. Emeryville, CA: Key Curriculum Press.
Lyublinskaya, I. (2003b) Connecting mathematics and science: Experiments for calculus. Emeryville, CA: Key Curriculum Press.
Mitchelmore, M., & Cavanagh, M. (2000). Students’ diffi culties in operating a graphics calculator. Mathematics Education Research Journal, 12(3), 254-268.
Niess, M. (2001). A model for integrating technology in preservice science and mathematics content-specifi c teacher preparation. School Science and Math-ematics, 101(2), 102-109.
Ostler, E., & Grandgenett, N. (2001). Examining pedagogical trends within a graphing calculator environment: An analysis of preservice teacher percep-tions. Proceedings of the Society for Information Technology and Teacher Edu-cation International Conference 2001 (pp. 1385-1386). Norfolk, VA: Associa-tion for the Advancement of Computing in Education.
Ruthven, K. (1990). The infl uence of graphic calculator use on translation from graphic to symbolic forms. Educational Studies in Mathematics, 21(5), 431-450.
180 Lyublinskaya and Zhou
Simmt, E. (1997). Graphing calculators in high school mathematics. Journal of Computers in Mathematics and Science Teaching, 16(2-3), 269-289.
Simonson, L. M., & Dick, T. P. (1997). Teachers’ perceptions of the impact of graphing calculators in the mathematics classroom. Journal of Computers in Mathematics and Science Teaching, 16(2-3), 239-268.
Stager, G. (2000). Portable probeware: Science education’s next frontier. Cur-riculum Administrator, 36(3), 32-36.
Stokes, D., Jenkins, C., Huhnke, L., Grey, G., & Manning, C. (2000). Math and science curriculum revision: A collaborative approach to improving preser-vice teachers’ use of technology knowledge and instructional skills. Pro-ceedings of the World Conference on Educational Multimedia, Hypermedia, and Telecommunications 2000 (p. 1832). Norfolk, VA: Association for the Advancement of Computing in Education.
Thomas, J. A., & Cooper, S. B. (2000). Teaching technology: A new opportunity for pioneers in teacher education. Journal of Computing in Teacher Educa-tion, 17(1), 13-19.
Thompson, D. R., & Senk, S. L. (2001). The effects of curriculum on achieve-ment in second-year algebra: The example of the University of Chicago school mathematics project. Journal for Research in Mathematics Educa-tion, 32(1), 58-84.
Walmsley, A. L. E. (2003). Integrating calculator technology in an elementary and middle school preservice teacher program: A personal journey. Contem-porary Issues in Technology and Teacher Education, 3(2), 116-127.
Yeo, S., & Zadnik, M. (2001). Introductory thermal concept evaluation: Assess-ing students’ understanding. The Physics Teacher, 39(8), 495-504.
Note
The purchase of equipment was made possible by a grant from the Col-lege of Staten Island Center for Excellence in Learning Technologies. The study was funded by the CUNY Discovery Institute at the College of Staten Island under a US Department of Education Teacher Quality Enhancement Partnership grant.
Appendix
The following questions were used in open-ended written refl ections at the beginning of the semester in both sections before students were exposed to TI technology and data collection:
1. Refection on technology knowledge

Integrating Graphing Calculators and Probeware Into Science Methods 181
a. Do you have the technology skills for you to use technol-ogy in teaching?
b. Where did you get these skills from? (e.g. teach yourself, workshop, learn from colleagues)
c. If you are teaching at a school, does your school have technology available for teachers to use in teaching?
d. If your school has technology equipment, has this equip-ment being used in teaching? Why or why not?
2. Refl ection on pedagogical knowledge of using technology in teach-ing
a. What kind of teaching skills or pedagogical knowledge do you think you need in order to effectively integrate technology with teaching?
b. Do you have those skills or knowledge?c. Where did you learn those skills or knowledge?
3. Refl ection on your attitude toward the use of technology in teach-ing
a. What role should technology play in school teaching and learning?
b. What are the advantages and challenges of using technol-ogy in teaching and learning?
c. Any other related issues.4. Use a short paragraph to describe an example that technology can
be used in teaching and learning. If you have never used technol-ogy in teaching, just think about one.
The following questions were asked of students in the evening session upon completion of the fi rst two projects:
1. Please refl ect on activities • How Do Mittens Keep Your Hands Warm?• CSI No Dumping Soil StudyThe refl ection should focus on the changes you may have in terms of the way you look at calculator-based technology. It can be about any one of the topics, such as the issues of using calculator-based technology in elementary school, the way to use this technology in elementary school; the role this technology should play in teaching science, etc. It all depends on what topic you want to elaborate.
2. Can calculator-based technology be used to help students with dis-abilities to learn science? Provide your thoughts, pros and cons.
182 Lyublinskaya and Zhou
The following questions were asked at the end of the semester in both sections:
1. Do you think you have more technology skills to use technology in teaching after you had this class?
2. What kind of teaching skills or pedagogical knowledge do you think you learned in this class that you need in order to effectively integrate technology with teaching?
3. Refl ection on your current attitude toward the use of technology in teaching
a. What role should technology play in school teaching and learning?
b. What are the advantages and challenges of using technol-ogy in teaching and learning?