Integrated environmental assessment of biodiesel production from soybean in Brazil
16
Integrated environmental assessment of biodiesel production from soybean in Brazil Ota ´vio Cavalett * , Enrique Ortega Laboratory of Ecological Engineering, Food Engineering School, State University of Campinas (UNICAMP), Caixa Postal 6121, CEP 13083-862, Campinas, SP, Brazil article info Article history: Available online 11 September 2009 Keywords: Emergy accounting Embodied energy Material flow accounting Biodiesel abstract This paper presents the results of an environmental impact assessment of biodiesel production from soybean in Brazil. In order to achieve this objective, environmental impact indicators provided by Emergy Accounting (EA), Embodied Energy Analysis (EEA) and Material Flow Accounting (MFA) were used. The results showed that for one liter of biodiesel 8.8 kg of topsoil are lost in erosion, besides the cost of 0.2 kg of fertilizers, about 5.2 m 2 of crop area, 7.33 kg of abiotic materials, 9.0 tons of water and 0.66 kg of air and about 0.86 kg of CO 2 were released. About 0.27 kg of crude oil equivalent is required as inputs to produce one liter of biodiesel, which means an energy return of 2.48 J of biodiesel per Joule of fossil fuel invested. The transformity of biodiesel (3.90E þ 05 seJ J 1 ) is higher than those calculated for fossil fuels as other biofuels, indicating a higher demand for direct and indirect environmental support. Similarly, the biodiesel emergy yield ratio (1.62) indicates that a very low net emergy is delivered to consumers, compared to alternatives. Obtained results show that when crop production and industrial conversion to fuel are supported by fossil fuels in the form of chemicals, goods, and process energy, the fraction of fuel that can actually be considered renewable is very low (around 31%). Ó 2009 Elsevier Ltd. All rights reserved. 1. Introduction The use of biofuels has been an increasingly important topic in worldwide discussions on energy resources. In the last decade they have gained wide acceptance among policy makers, scientists, environmentalists, agricultural entrepreneurs and the general public. Usually they are presented as a suitable option for energy supply, considering that if they are adequately supported, they could replace a portion of fossil fuels. The main reasons often presented to promote biodiesel production are: (a) It is a clean or ‘‘green’’ energy produced from renewable natural sources and, therefore, could supply a virtually infinite amount of energy for an infinite period of time; (b) It is often stated that biodiesel, by replacing oil products, would result in the reduction of greenhouse gases’ emissions. It is supposed that the carbon emitted by bio- diesel in the combustion phase is the one absorbed by the plant during its growth through photosynthesis, resulting in a carbon neutral budget; (c) Finally, biodiesel production is presented by the press to be a strategy for rural development. However, when seeking an alternative source of energy, one must evaluate the whole production chain to correctly evaluate potential environmental benefits and disadvantages. If one takes a closer look at the complete biofuels production processes, the benefits are not so clear. In fact, biofuel production requires the use of fossil fuel energy, in the form of fertilizers, agrochemicals, machinery for both agricultural and industrial phases, as well as for transportation of raw materials, inputs and distribution of biofuel for final use. Moreover, depending on the biomass used, biofuels processing could require huge amounts of fossil fuels. The advan- tages in terms of reduction of greenhouse effect and national fossil fuel energy dependency are put into a different perspective, if one takes into account the entire picture and not only the end-of-pipe emissions. In order to do that, many different social and environ- mental factors should be taken into proper account, in addition to the energy yield, the carbon budget and the economic cost. There are several studies in the literature that evaluate one or other environmental aspect of biofuels production [1–6]. However it is necessary to make a comprehensive evaluation to explore different aspects of this debate, underlining the advantages and disadvan- tages of biomass cultivation to produce energy [7,8]. In order to obtain such a wider overview on the environ- mental impacts of the biodiesel production process in Brazil, a comprehensive assessment based on the parallel use of different evaluation methods was carried out. Soybean is the most important feedstock used to produce biodiesel in Brazil, where approximately 90% of biodiesel is produced from * Corresponding author. Tel.: þ55 19 35214058; fax: þ55 19 35211513. E-mail address: [email protected] (O. Cavalett). Contents lists available at ScienceDirect Journal of Cleaner Production journal homepage: www.elsevier.com/locate/jclepro 0959-6526/$ – see front matter Ó 2009 Elsevier Ltd. All rights reserved. doi:10.1016/j.jclepro.2009.09.008 Journal of Cleaner Production 18 (2010) 55–70
-
Upload
independent -
Category
Documents
-
view
4 -
download
0
Transcript of Integrated environmental assessment of biodiesel production from soybean in Brazil

lable at ScienceDirect
Journal of Cleaner Production 18 (2010) 55–70
Contents lists avai
Journal of Cleaner Production
journal homepage: www.elsevier .com/locate/ jc lepro
Integrated environmental assessment of biodiesel productionfrom soybean in Brazil
Otavio Cavalett*, Enrique OrtegaLaboratory of Ecological Engineering, Food Engineering School, State University of Campinas (UNICAMP), Caixa Postal 6121, CEP 13083-862, Campinas, SP, Brazil
a r t i c l e i n f o
Article history:Available online 11 September 2009
Keywords:Emergy accountingEmbodied energyMaterial flow accountingBiodiesel
* Corresponding author. Tel.: þ55 19 35214058; faxE-mail address: [email protected] (O. Cavalett
0959-6526/$ – see front matter � 2009 Elsevier Ltd.doi:10.1016/j.jclepro.2009.09.008
a b s t r a c t
This paper presents the results of an environmental impact assessment of biodiesel production fromsoybean in Brazil. In order to achieve this objective, environmental impact indicators provided byEmergy Accounting (EA), Embodied Energy Analysis (EEA) and Material Flow Accounting (MFA) wereused. The results showed that for one liter of biodiesel 8.8 kg of topsoil are lost in erosion, besides thecost of 0.2 kg of fertilizers, about 5.2 m2 of crop area, 7.33 kg of abiotic materials, 9.0 tons of water and0.66 kg of air and about 0.86 kg of CO2 were released. About 0.27 kg of crude oil equivalent is required asinputs to produce one liter of biodiesel, which means an energy return of 2.48 J of biodiesel per Joule offossil fuel invested. The transformity of biodiesel (3.90Eþ 05 seJ J�1) is higher than those calculated forfossil fuels as other biofuels, indicating a higher demand for direct and indirect environmental support.Similarly, the biodiesel emergy yield ratio (1.62) indicates that a very low net emergy is delivered toconsumers, compared to alternatives. Obtained results show that when crop production and industrialconversion to fuel are supported by fossil fuels in the form of chemicals, goods, and process energy, thefraction of fuel that can actually be considered renewable is very low (around 31%).
� 2009 Elsevier Ltd. All rights reserved.
1. Introduction
The use of biofuels has been an increasingly important topic inworldwide discussions on energy resources. In the last decade theyhave gained wide acceptance among policy makers, scientists,environmentalists, agricultural entrepreneurs and the generalpublic. Usually they are presented as a suitable option for energysupply, considering that if they are adequately supported, theycould replace a portion of fossil fuels. The main reasons oftenpresented to promote biodiesel production are: (a) It is a clean or‘‘green’’ energy produced from renewable natural sources and,therefore, could supply a virtually infinite amount of energy for aninfinite period of time; (b) It is often stated that biodiesel, byreplacing oil products, would result in the reduction of greenhousegases’ emissions. It is supposed that the carbon emitted by bio-diesel in the combustion phase is the one absorbed by the plantduring its growth through photosynthesis, resulting in a carbonneutral budget; (c) Finally, biodiesel production is presented by thepress to be a strategy for rural development.
However, when seeking an alternative source of energy, onemust evaluate the whole production chain to correctly evaluate
: þ55 19 35211513.).
All rights reserved.
potential environmental benefits and disadvantages. If one takesa closer look at the complete biofuels production processes, thebenefits are not so clear. In fact, biofuel production requires the useof fossil fuel energy, in the form of fertilizers, agrochemicals,machinery for both agricultural and industrial phases, as well as fortransportation of raw materials, inputs and distribution of biofuelfor final use. Moreover, depending on the biomass used, biofuelsprocessing could require huge amounts of fossil fuels. The advan-tages in terms of reduction of greenhouse effect and national fossilfuel energy dependency are put into a different perspective, if onetakes into account the entire picture and not only the end-of-pipeemissions. In order to do that, many different social and environ-mental factors should be taken into proper account, in addition tothe energy yield, the carbon budget and the economic cost. Thereare several studies in the literature that evaluate one or otherenvironmental aspect of biofuels production [1–6]. However it isnecessary to make a comprehensive evaluation to explore differentaspects of this debate, underlining the advantages and disadvan-tages of biomass cultivation to produce energy [7,8].
In order to obtain such a wider overview on the environ-mental impacts of the biodiesel production process in Brazil,a comprehensive assessment based on the parallel use ofdifferent evaluation methods was carried out. Soybean is themost important feedstock used to produce biodiesel in Brazil,where approximately 90% of biodiesel is produced from

O. Cavalett, E. Ortega / Journal of Cleaner Production 18 (2010) 55–7056
soybeans [9]. In this context, the objective of this study was todiscuss global environmental impacts due to use of resources forbiodiesel production from soybean in Brazil. Three environ-mental assessment methods proposed by Ulgiati et al. [10] wereadopted for the assessment: (a) Emergy Accounting (EA), (b)Embodied Energy Analysis (EEA) and (c) Material FlowAccounting (MFA). These three approaches were chosen due totheir larger space and time scale, while other methods are moreprocess-oriented, such as Exergy Analysis (also suggested byUlgiati et al. [10]) did not seem to be suitable for the goals of thepresent investigation.
2. Material and methods
The three approaches (EA, EEA, MFA) selected for the assess-ment, are believed to be effective in evaluating the environmentalperformance of biodiesel (both as a final product and as a process)from the supply-side perspective. They are able to reveal importantaspects of sustainability and they have different scientificperspectives and system boundaries; the importance of naturalresources are weighted differently by the three methods, whichadds complementarity of viewpoints to our evaluation. A moredetailed outline of the individual assessment methods is providedin the following paragraphs.
2.1. Material flow accounting
The Material Flow Accounting method [10–12] evaluates theenvironmental disturbance associated with the withdrawal ordiversion of material flows of resources from their naturalecosystem pathways. In this method, appropriate Material IntensityFactors (MIF) (kg unit�1) are multiplied by each input, respectively,accounting for the total amount of abiotic matter, water and airmatter that is directly or indirectly required in order to provide thatvery same input to the system. The resulting material intensities ofthe individual inputs are then separately summed and assigned tothe system’s output as a quantitative measure of its cumulativeenvironmental burden, intended as material resource withdrawaland depletion.
2.2. Embodied energy analysis
The Embodied Energy Analysis method [10,13,14] deals with thegross energy requirement of the analyzed system. The method
Fig. 1. Systems diagram of a biodiesel
accounts for the amount of commercial energy that is requireddirectly and indirectly by the process for making a good or a service[14]. EEA was applied according to the IFIAS conventions, which weredesigned for quantifying the availability and use of stocks of fossilfuels (i.e. fossil and fossil-equivalent energy). Commercial energy isrecognized in this analysis as all kinds of energies that requiretechnological processing and that are sold at market price due to theprocessing needed (cost of labor and services) such as fossil fuels,nuclear and electricity. Electricity from the grid (including hydro andwind, if any) should therefore, be regarded as commercial, while freeenvironmental services and direct renewables are not. Therefore, asthe EEA of a product is concerned with the depletion of fossil energy,all the forms of material and energy that do not require the use ofcommercial resources to make them available are not accounted. Forinstance, resources provided for free by the environment such asrain, topsoil, spring water, human labor and economic services arenot accounted by embodied energy analysis.
In this method, all the material and energy inputs to theanalyzed system are multiplied by appropriate oil equivalentfactors (kg oil unit�1); the cumulative embodied energy require-ment of the system’s output is then computed as the sum of theindividual oil equivalents of the input flows, which can be con-verted to energy units by multiplying by the standard calorificvalue of oil fuel (4.18Eþ07 J kg�1
oil fuel). The CO2 emissions can beroughly estimated by multiplying the embodied energy used by thestoichiometric CO2 emissions of oil fuel (w3.2 kg CO2 kg�1
oil fuel).
2.3. Emergy accounting
The Emergy Accounting method [10,15,16] looks at the envi-ronmental performance of the system on the global scale, takinginto account all the free environmental inputs such as sunlight,wind, rain, as well as the indirect environmental supportembodied in human labor and services, which are not usuallyincluded in traditional embodied energy analyses. The EmergyAccounting methodology uses the solar energy embodied in thesystem’s inputs as the measurement base. Emergy is defined asthe total amount of solar energy that was directly or indirectlyrequired to make a given product or to support a given flow, and ismeasured in solar equivalent Joules (seJ). The amount of emergythat was originally required to provide one unit of each input isreferred to as its specific emergy (seJ unit�1) or transformity(seJ J�1). The renewability (%REN) is the percentage of renewableemergy used by the system. The Emergy Yield Ratio (EYR) is the
production process from soybean.

Table 1Mass flows in the biodiesel production process.
(continued on next page)

Table 1 (continued)
a References for Material Intensity Factors (MIF): [a] By definition; [b] After Ulgiati [8].; [c] Wurbs et al. [19]; [d] Calculated in this work. These values are calculated with thesum of the cumulative mass used up divided by the product output. e.g. The MIF abiotic for soybean in the field (Note #21) is: 1.31Eþ04/2.83Eþ03¼ 4.62; [e] Hinterberger andStiller [11].(*) No Significant mass associated to this item within the local scale of investigation.
O. Cavalett, E. Ortega / Journal of Cleaner Production 18 (2010) 55–7058
ratio of total emergy inflow to the emergy invested by the outsideeconomy. The Emergy Loading Ratio (ELR) is the ratio of importedand locally nonrenewable emergy to the locally renewable one. Atthe core of an emergy evaluation of a given production system orprocess is a mass and energy flow inventory in which the flowsare adjusted for energy quality using conversion factors (trans-formity, specific emergy, emdollar). Odum [15] and Brown andUlgiati [16] provide a detailed explanation of the emergyaccounting procedures for a variety of systems as well as a carefuldiscussion of the meaning of emergy indicators.
2.4. Soybean biodiesel production system
Fig. 1 presents the system diagram of a biodiesel productionprocess, showing the relations between input (natural and
commercial) resources and the final product, accounting for all thematerial and energy flows involved in soybean biodiesel produc-tion process. The biodiesel production stages considered in thisassessment were: the soybean agricultural production; transport toindustry; the crushing process to produce soy oil and soy meal;trans-esterification of the soy oil to produce biodiesel and biodieseltransport to the final consumer.
The Appendix section provides footnotes describing in detailsthe energy and material flows of the soybean agricultural cultiva-tion, transport, extraction and conversion of soy oil into biodiesel,with calculation procedures and references for the inputs (e.g.diesel fuels, fertilizers, field operations, machinery) used in eachprocessing phase.
Data used in the calculations were collected from field work andfrom scientific literature (see references for data collection in the

Table 2Energy flows in the biodiesel production process.
Note Description of flow Units Amount of inputunit ha�1 year�1
Oil equivalent per unit kgoil unit�1
Ref. for oilequivalenta
Global oil demand kgoil equiv
Global energydemand (J)
Global CO2 emissions(kg CO2)
Agricultural stageRenewable inputs1 Sunlight J b
2 Rain water kg b
3 Deep heat J b
4 N2 fixed fromatmosphere
kg b
Nonrenewable inputs5 Loss of topsoil kg 1.70Eþ 04 [vi] 2.30Eþ 026 Limestone kg 3.75Eþ 02 0.15 [iii] 5.64Eþ 01 2.36Eþ 09 1.80Eþ 027 Herbicides kg 4.80Eþ 00 2.17 [i] 1.04Eþ 01 4.37Eþ 08 3.32Eþ 018 Insecticides and
pesticideskg 3.20Eþ 00 1.27 [i] 4.05Eþ 00 1.70Eþ 08 1.29Eþ 01
9 Seeds kg 6.90Eþ 01 0.09 [iv] 6.21Eþ 00 2.60Eþ 08 1.98Eþ 0110 Nitrogen in fertilizer kg 0.00Eþ 00 1.77 [i] 0.00Eþ 00 0.00Eþ 00 0.00Eþ 0011 Phosphorus in fertilizer kg 3.38Eþ 01 0.31 [i] 1.05Eþ 01 4.39Eþ 08 3.34Eþ 0112 Potash in fertilizer kg 6.54Eþ 01 0.22 [i] 1.41Eþ 01 5.88Eþ 08 4.48Eþ 0113 Diesel kg 5.46Eþ 01 1.10 [i] 6.00Eþ 01 2.51Eþ 09 1.91Eþ 0214 Electricity J 1.22Eþ 08 6.97E� 08 [i] 8.53Eþ 00 3.57Eþ 08 2.72Eþ 0115 Steel for agricultural
machinerykg 2.50Eþ 01 1.65 [i] 4.12Eþ 01 1.73Eþ 09 1.31Eþ 02
16 Farm buildings USD b
17 Local labor yrs b
18 Extra labor yrs b
19 Externalities USD b
20 Annual services USD b
Products and by-products of agricultural phase21 Soybean produced kg 2.83Eþ 03 0.07 [iv] 2.11Eþ 02 8.85Eþ 09 9.03Eþ 02
Soybean produced J 6.40Eþ 10
Soybean transportRaw material inputs21 Soybean kg 2.83Eþ 03 0.07 [iv] 2.11Eþ 02 8.85Eþ 09 9.03Eþ 02Nonrenewable inputs22 Steel for transp.
machinerykg 1.98Eþ 00 1.65 [i] 3.27Eþ 00 1.37Eþ 08 1.04Eþ 01
23 Diesel for transport kg 4.25Eþ 00 1.10 [i] 4.67Eþ 00 1.95Eþ 08 1.49Eþ 0124 Labor yrs b
25 Annual services USD b
Products and by-products of transport phase26 Soybean transported kg 2.83Eþ 03 0.08 [iv] 2.19Eþ 02 9.18Eþ 09 9.28Eþ 02
Crushing processRaw material inputs26 Soybean kg 2.83Eþ 03 0.08 [iv] 2.19Eþ 02 9.18Eþ 09 9.28Eþ 02Nonrenewable inputs27 Steel for machinery kg 2.84E� 01 1.65 [i] 4.68E� 01 1.96Eþ 07 1.49Eþ 0028 Cement in plant
constructionkg 2.76E� 01 0.07 [i] 1.98E� 02 8.28Eþ 05 6.30E� 02
29 Iron in plantconstruction
kg 1.13E� 02 0.02 [iii] 1.78E� 04 7.45Eþ 03 5.67E� 04
30 Diesel kg 5.07Eþ 01 1.10 [i] 5.57Eþ 01 2.33Eþ 09 1.77Eþ 0231 Electricity J 3.05Eþ 08 6.97E� 08 [i] 2.12Eþ 01 8.89Eþ 08 6.76Eþ 0132 Water kg 2.04Eþ 03 1.43E� 04 [v] 2.91E� 01 1.22Eþ 07 9.28E� 0133 Hexane kg 3.40Eþ 00 n.a.34 Labor yrs b
35 Annual capital cost andservices
USD b
Products and by-products of crushing phaseTotal 2.97Eþ 02 1.24Eþ 10 1.18Eþ 03
36 Row soy oil kg 5.10Eþ 02 0.21 [iv] 1.06Eþ 02 4.42Eþ 09 4.18Eþ 02Soy meal kg 2.30Eþ 03 0.08 [iv] 1.87Eþ 02 7.84Eþ 09 7.41Eþ 02Lecithin (gross) kg 1.98Eþ 01 0.21 [iv] 4.11Eþ 00 1.72Eþ 08 1.63Eþ 01
Biodiesel productionRaw materials input36 Row soy oil kg 5.10Eþ 02 2.07E� 01 [iv] 1.06Eþ 02 4.42Eþ 09 4.18Eþ 02Nonrenewable inputs37 Steel for machinery kg 1.17Eþ 00 1.65 [i] 1.93Eþ 00 8.08Eþ 07 6.15Eþ 0038 Cement in plant
constructionkg 3.39E� 01 0.07 [i] 2.43E� 02 1.02Eþ 06 7.74E� 02
39 Iron in plantconstruction
kg 7.04E� 03 0.02 [iii] 1.11E� 04 4.64Eþ 03 3.53E� 04
40 Diesel kg 2.74Eþ 01 1.10 [i] 3.01Eþ 01 1.26Eþ 09 9.57Eþ 01
(continued on next page)
O. Cavalett, E. Ortega / Journal of Cleaner Production 18 (2010) 55–70 59

Table 2 (continued )
Note Description of flow Units Amount of inputunit ha�1 year�1
Oil equivalent per unit kgoil unit�1
Ref. for oilequivalenta
Global oil demand kgoil equiv
Global energydemand (J)
Global CO2 emissions(kg CO2)
41 Methanol kg 7.53Eþ 01 0.60 [vi] 4.52Eþ 01 1.89Eþ 09 1.44Eþ 0242 Catalyst kg 5.44Eþ 00 n.a.43 Electricity J 1.62Eþ 06 7.17E� 08 [i] 1.16E� 01 4.85Eþ 06 3.69E� 0144 Water kg 2.60Eþ 02 1.43E� 04 [v] 3.72E� 02 1.56Eþ 06 1.19E� 0145 Labor yrs b
46 Annual capital cost andservices
USD b
Products and by-products of biodiesel production47 Biodiesel kg 5.99Eþ 02 0.31 [iv] 1.83Eþ 02 7.66Eþ 09 6.65Eþ 02
Glycerin kg 4.42Eþ 01Soap stock kg 2.72Eþ 01
Biodiesel transportRaw material inputs47 Biodiesel kg 5.99Eþ 02 0.29 [iv] 1.83Eþ 02 7.66Eþ 09 6.65Eþ 02Nonrenewable inputs48 Steel for transp.
machinerykg 4.20E� 01 1.65 [i] 6.92E� 01 2.90Eþ 07 2.20Eþ 00
49 Diesel for transport kg 8.99E� 01 1.10 [i] 9.89E� 01 4.14Eþ 07 3.15Eþ 0050 Labor yrs b
51 Annual services USD b
Products and by-products of transport phase52 Biodiesel kg 5.99Eþ 02 0.31 [iv] 1.85Eþ 02 7.73Eþ 09 6.70Eþ 02
n.a.¼Not available.a References for oil equivalent per unit: [i] Biondi et al. [20]; [ii] By definition; [iii] Boustead and Hancock [21]; [iv] This work; [v] Smil [22]; [vi] After Ulgiati [8].b No energy is associated to this item within the scale of investigation.
O. Cavalett, E. Ortega / Journal of Cleaner Production 18 (2010) 55–7060
Appendix section) as representative of the soybean production andprocessing stages in Brazil, taking into consideration the mostimportant management practices that are currently used in Brazil.In summary, it pertains to conventional non-tillage managementwith use of fertilizers and agrochemicals. In this survey, differenceswere considered in the input use, according to the productionmodels adopted in the Southern and Northern regions, such asinsolation, precipitation, field yield and use of fertilizers, limestoneand agrochemicals, among others.
3. Results and discussion
Tables 1–3 show the material, energy and emergy flows for thebiodiesel production process, respectively. Table 4 showsa summary of results of the three methods applied. The availableset of indicators offer a way to evaluate the process sequentially(the agricultural step first, and then the industrial step).
The total demand of matter, embodied energy and emergy forthe biodiesel production phases are reported in Fig. 2. This figureshows that agriculture is the most important phase as far asmaterial and emergy demand are concerned. Embodied energyanalysis is also very important in the agricultural phase, howeversoy oil trans-esterification uses a high amount of resources whichshould not be disregarded. Results indicate that agriculture is thestage that uses the largest amount of input flows. Such a findingcalls for careful reorganization of cropping activities aimed atdecreasing the amount of nonrenewable materials used in theprocess. Our findings reflect the situation of modern industrializedagriculture, mainly consisting of monocultures, being the majorcause of exploitation of nonrenewable resources. In the lastcentury, the use of industrial resources in soybean crops increasedsharply, so that production is now strongly dependent on chemicalinputs and high technology to ensure high crops yields. Most ofthese resources are directly or indirectly dependent upon the globalavailability of the fossil fuels and other minerals, both non-renewable resources. The excess and inadequate use of theseresources, while ensuring the crop yield in the short-term
perspective, also increases soybean production costs and generateshigh pressure on the environment as quantitatively shown by theindicators calculated in this study. This indicates that to producebiodiesel from soy oil is not an environmentally-friendly processand is not the best way to use such a feedstock.
Fig. 3 compares the relative importance of different types ofinput flows according to the three methods used to evaluate thebiodiesel production process. This figure underscores the specialimportance of the emergy analysis because it also accounts for freeenvironmental flows and human labor and services on the sameaccounting basis. On the other hand, the embodied energy methodfocuses on the commercial energy flows and the material flowaccounting assigns more importance to the material flows. It showsthe importance of use more than one approach of analysis.
Table 1 shows that some material flows required for biodieselproduction are remarkably high on the global scale. For instance,about 8.88 kg of topsoil eroded, 0.2 kg of fertilizers and 7.33 kg ofabiotic materials are needed per liter of biodiesel produced. Also, asexpected, higher unit material, energy, land and labor demands arecalculated for biodiesel than for soybean, due to further processingstages. Table 1 shows that soil loss is the most important contri-bution to the abiotic factor with around 80% of the total abioticresources used for biodiesel production. Rain is the most importantcontribution to the water factor (almost 100%). Excluding rain,other important contributions to the water factor are soil loss,limestone and steel used in different process phases. Methanol isthe most important contribution to the air factor with around 65%of the total abiotic resources used.
About 0.86 kg of CO2 is released per liter of biodiesel produced.This figure translates into a release of 30.7 g CO2 per MJ delivered.Commercial diesel production and use would release about 100 gCO2 per MJ delivered [8]. Therefore, to use biodiesel instead ofpetroleum-based diesel would release 69.3% lower CO2 emissionaccording to our calculations. However, it is important to note thatsoybean biodiesel results showed that such a product is not totallyclimate neutral due to the inputs used in the production processes.Moreover, some authors claim that the production of commonly

Table 3Emergy flows in the biodiesel production process.
Note Description of flow Units Amount ha�1 yr�1 Specific emergy seJ unit�1 Ref. for specific emergya Emergy seJ ha�1 yr�1
Agricultural phaseRenewable inputs1 Sunlight J 5.10Eþ 10 1.00Eþ 00 [a] 5.10Eþ 102 Rain water J 5.25Eþ 10 3.06Eþ 04 [b] 1.61Eþ 153 Deep heat J 3.00Eþ 10 1.01Eþ 04 [c] 3.04Eþ 144 N2 fixed from atmosphere kg 6.00Eþ 01 6.38Eþ 12 [d] 3.83Eþ 14Nonrenewable inputs5 Loss of topsoil J 4.61Eþ 09 1.24Eþ 05 [b] 5.72Eþ 146 Limestone J 2.29Eþ 08 2.72Eþ 06 [b] 6.23Eþ 147 Herbicides kg 4.80Eþ 00 2.48Eþ 13 [b] 1.19Eþ 148 Insecticides and pesticides kg 3.20Eþ 00 2.48Eþ 13 [b] 7.94Eþ 139 Seeds kg 6.90Eþ 01 2.73Eþ 12 [e] 1.88Eþ 1410 Nitrogen in fertilizer kg 0.00Eþ 00 6.38Eþ 12 [d] 0.00Eþ 0011 Phosphorus in fertilizer kg 3.38Eþ 01 6.55Eþ 12 [b] 2.21Eþ 1412 Potash in fertilizer kg 6.54Eþ 01 2.92Eþ 12 [b] 1.91Eþ 1413 Diesel J 2.43Eþ 09 1.11Eþ 05 [b] 2.68Eþ 1414 Electricity J 1.22Eþ 08 2.77Eþ 05 [c] 3.39Eþ 1315 Steel for machinery kg 2.50Eþ 01 1.13Eþ 13 [b] 2.83Eþ 1416 Farm buildings USD 4.74Eþ 01 3.70Eþ 12 [h] 1.75Eþ 1417 Local labor yrs 2.60E� 03 1.07Eþ 16 [b] 2.79Eþ 1318 Extra labor yrs 2.60E� 03 1.07Eþ 16 [b] 2.79Eþ 1319 Externalities USD 3.45Eþ 02 3.70Eþ 12 [h] 1.28Eþ 1520 Annual services USD 1.50Eþ 01 3.70Eþ 12 [h] 5.56Eþ 13Products and by-products of agricultural phase21 Soybean produced kg 2.83Eþ 03 2.27.Eþ 12 [e] 6.44Eþ 15
J 6.40Eþ 10 1.01.Eþ 05 [e] 6.44Eþ 15
Soybean transportNonrenewable inputs22 Steel for machinery kg 1.98Eþ 00 1.13Eþ 13 [b] 2.24Eþ 1323 Diesel J 1.89Eþ 08 1.11Eþ 05 [b] 2.09Eþ 1324 Labor yrs 5.16E� 04 1.07Eþ 16 [b] 5.53Eþ 1225 Annual services USD 2.33Eþ 00 3.70Eþ 12 [h] 8.62Eþ 12Products and by-products of transport phase26 Soybean transported kg 2.83Eþ 03 2.29.Eþ 12 [e] 6.49Eþ 15
J 6.40Eþ 10 1.01.Eþ 05 [e] 6.49Eþ 15
Crushing processNonrenewable inputs27 Steel for machinery kg 2.84E� 01 1.13Eþ 13 [b] 3.21Eþ 1228 Cement in plant construction kg 2.76E� 01 3.47Eþ 12 [b] 9.57Eþ 1129 Iron in plant construction kg 1.13E� 02 1.13Eþ 13 [b] 1.28Eþ 1130 Diesel J 2.25Eþ 09 1.11Eþ 05 [b] 2.49Eþ 1431 Electricity J 3.05Eþ 08 2.77Eþ 05 [c] 8.45Eþ 1332 Process and cooling water J 1.01Eþ 07 4.28Eþ 05 [f] 4.31Eþ 1233 Hexane kg 3.40Eþ 00 6.08Eþ 12 [c] 2.06Eþ 1334 Labor yrs 2.97E� 04 1.07Eþ 16 [b] 3.18Eþ 1235 Annual services USD 2.97Eþ 00 3.70Eþ 12 [h] 1.10Eþ 13Products and by-products of crushing phase36 Oil kg 5.10Eþ 02 1.35.Eþ 13 [e] 6.87Eþ 15
J 2.02Eþ 10 3.40.Eþ 05 [e] 6.87Eþ 1536 Meal kg 2.30Eþ 03 2.98.Eþ 12 [e] 6.87Eþ 15
J 3.58Eþ 10 1.92.Eþ 05 [e] 6.87Eþ 1536 Lecithin (gross) kg 1.98Eþ 01 3.47.Eþ 14 [e] 6.87Eþ 15
J 7.85Eþ 08 8.75.Eþ 06 [e] 6.87Eþ 15
Biodiesel productionNonrenewable inputs37 Steel for machinery kg 1.17Eþ 00 1.13Eþ 13 [b] 1.32Eþ 1338 Cement in plant construction kg 3.39E� 01 3.47Eþ 12 [b] 1.18Eþ 1239 Iron in plant construction kg 7.04E� 03 1.13Eþ 13 [b] 7.95Eþ 1040 Diesel J 1.22Eþ 09 1.11Eþ 05 [b] 1.35Eþ 1441 Methanol J 1.53Eþ 09 1.89Eþ 05 [g] 2.89Eþ 1442 Catalyst kg 5.44Eþ 00 2.48Eþ 13 [b] 1.35Eþ 1443 Electricity J 1.62Eþ 06 2.77Eþ 05 [c] 4.49Eþ 1144 Water J 1.29Eþ 06 4.28Eþ 05 [i] 5.51Eþ 1145 Labor yrs 1.80E� 04 1.07Eþ 16 [b] 1.93Eþ 1246 Annual services USD 4.32Eþ 00 3.70Eþ 12 [h] 1.60Eþ 13Products and by-products of biodiesel production47 Biodiesel kg 5.99Eþ 02 1.24.Eþ 13 [e] 7.46Eþ 15
J 1.92Eþ 10 3.89.Eþ 05 [e] 7.46Eþ 15Glycerin kg 4.42Eþ 01Soap stock kg 2.72Eþ 01
Biodiesel transport
(continued on next page)
O. Cavalett, E. Ortega / Journal of Cleaner Production 18 (2010) 55–70 61

Table 3 (continued )
Note Description of flow Units Amount ha�1 yr�1 Specific emergy seJ unit�1 Ref. for specific emergya Emergy seJ ha�1 yr�1
Nonrenewable inputs48 Steel for machinery kg 4.20E� 01 1.13Eþ 13 [b] 4.74Eþ 1249 Diesel J 4.00Eþ 07 1.11Eþ 05 [b] 4.42Eþ 1250 Labor yrs 1.09E� 04 1.07Eþ 16 [b] 1.17Eþ 1251 Annual services USD 4.93E� 01 3.70Eþ 12 [h] 1.83Eþ 12Products and by-products of transport phase52 Biodiesel transported kg 5.99Eþ 02 1.25.Eþ 13 [e] 7.48Eþ 15
J 1.92Eþ 10 3.90.Eþ 05 [e] 7.48Eþ 15
a References for Specific Emergy: [a] Definition; [b] Brown and Ulgiati [16] [c] Odum [15]; [d] Ortega et al. [23]; [e] This study; [f] Bastianoni et al. [24]; [g] After Ulgiati [8];[h] Coelho et al. [25]; [i] Bastianoni and Marchettini [26].
Table 4Summary of matter, fossil energy and emergy indicators in soybean and biodieselproduction.
Indicator Soybean Biodiesel Unita
InputSoil eroded 6.00 8.88 kg FU�1
Oil equivalent demand 0.07 0.27 kg FU�1
Gross fertilizers demand 0.139 0.206 kg FU�1
Pesticides demand 0.003 0.004 kg FU�1
Material intensity, abioticfactor
4.62 7.33 kg FU�1
Material intensity, waterfactor
6060 8957 kg FU�1
Material intensity, air factor 0.04 0.66 kg FU�1
Total material input(including water)
6065 8975 kg FU�1
Labor demand 0.005 0.01 hr FU�1
Land demand 3.53 5.22 m2 FU�1
OutputTotal product 2.83Eþ 03 5.99Eþ 02 kg ha�1 yr�1
Net energy yield 55181 11450 MJ ha�1 yr�1
CO2 released 0.238 0.864 kg CO2 FU�1
Industrial wastewaterreleased
– 1.264 l FU�1
Energy Output/Input 7.24 2.48Emergy indicatorsTransformity 1.01Eþ 05 3.90Eþ 05 seJ J�1
Renewability 35.6% 30.7% %Emergy yield ratio 1.80 1.62Environmental loading ratio 1.81 2.26
a Functional Unit (FU) for soybean is 1 kg and for biodiesel is 1 l.
O. Cavalett, E. Ortega / Journal of Cleaner Production 18 (2010) 55–7062
used biofuels can contribute as much or more to global warming byconsidering the nitrous oxide emissions than cooling by fossil fuelsavings [33].
Another important issue is the allocation of input flows to theproducts in the EEA and MFA. Results are strongly affected by theallocation procedure choice and this is a very significant calcula-tion step. If co-products are accepted by the market, than anallocation mechanism can be used. If they are not, then all materialand energy consumption must be allocated to the main product,because all the other products should be considered wastes. Theresults presented in Tables 1, 2 and 4 were obtained using energyallocation factors for the intermediate products of the crushingprocess phase. From this phase ahead only costs allocated to rawsoy oil are accounted for as costs for the final product (biodiesel).This means that approximately 36% of the total material andenergy used in the production, transport and crushing phaseswere allocated to the soy oil. The largest part of the resources(around 64%) were allocated to soy meal because this co-producthas good market value as livestock feed in Brazil, the U.S. andEurope. This shows that even with a favorable allocation proce-dure, the environmental impacts of the biodiesel from soybeanstill are remarkably high. For example, if we consider no allocationto the soy meal in the crushing phase the releasing of CO2 forbiodiesel production is about two times higher, 62.4 g CO2 per MJdelivered. On the other hand no allocation was made for energyand material for glycerin produced as co-product in the trans-esterification process because this is considered a non-desirableproduct for biodiesel production process. Furthermore, consid-ering the increasing biofuels production, the overproduction ofglycerin as a co-product will not find a good market value and canbe considered to be an industrial waste, therefore, there is noreason to allocate materials and energy to produce waste.
Table 2 shows that agricultural and soy oil trans-esterificationphases have the highest importance in the embodied fossil energyanalysis, accounting for 41% and 42%, respectively, of the totalenergy inputs. The most important individual contributions weremethanol (24.5%) and diesel fuel (16.3%) used in the trans-esteri-fication phase, followed by diesel fuel used in the biodieselproduction processes.
The Energy Return on Investment (EROI) is the amount ofenergy output divided by the energy invested by the economicsystem. They are calculated on the global scale and offer an inter-esting overall energy cost evaluation of the biodiesel production.About 0.07 kg of crude oil equivalent is needed to produce one kg ofsoybean, which translates into an energy return of about 7.24 J ofsoybean per Joule of fossil fuel invested. Instead, 0.27 kg of oilequivalent is globally required per liter of biodiesel produced, equalto an energy return of 2.48 J of biodiesel per Joule of fossil fuelinvested. This value is higher than those calculated by Venturi andVenturi [17] (0.7–1.6) for biodiesel from soybean; by Janulis [18](1.04–1.59) for biodiesel from rapeseed; and by Giampietro andUlgiati [7] (0.98–1.21) for biodiesel from sunflower. However, thevalue obtained is lower than that calculated by Sheehan et al. [1]
(3.2) for biodiesel from soybean. These great differences in theliterature values may refer to different climate conditions, cropyields, inputs utilized, management practices, and allocationprocedures. From the embodied energy perspective it is possible torealize that biodiesel uses a large amount of fossil fuel energy in theagricultural and industrial conversion stages. In some cases fromthe literature, the fossil fuel energy used for biodiesel productionovercomes the energy available in the biodiesel delivered, whichmakes biofuels net releasers of greenhouse gases. Fossil fuelspresent much better energy return, between 10–15 and 1. Windenergy also presents very good energy returns, around 8–1 [8].The lower net energy yield for biodiesel suggests that convertingsoy oil into a fuel may not be the most appropriate use for thisproduct. The soybean biodiesel EROI calculated (2.48) easilytranslates into a Net-to-Gross Energy Ratio (NGER) of 0.60 (calcu-lated: NGER¼ 1�1/EROI). This means that it is necessary to produce1.68 l (calculated: 1/NGER) of biodiesel to deliver one liter of netbiodiesel to the society, an important prerequisite if we foreseea biodiesel production process that is independent for fossil fuelinputs (a portion of biodiesel produced is feedback to support itsproduction system). This would make demands upon productionresources (e.g. land, materials, water) about 68% larger than thosecalculated in Table 2. Biodiesel production relies mainly on the largeuse of fossil fuels, especially in the soybean production phase(Fig. 2). Whether fossil fuels are used to enhance the productivity of

wolFlairetaM
00+E00.030+E00.130+E00.230+E00.330+E00.430+E00.5
II.psnartkcurTleseidoiBgnihsurhCI.psnartkcurTerutlucirgA
kg
/h
a/y
citoibAretaW
riA
ygrenE
00+E00.090+E00.190+E00.290+E00.390+E00.4
II.psnartkcurTleseidoiBgnihsurhCI.psnartkcurTerutlucirgA
J/h
a/yr
ygremE
00+E00.051+E00.251+E00.451+E00.651+E00.8
II.psnartkcurTleseidoiBgnihsurhCI.psnartkcurTerutlucirgA
seJ/h
a/yr
desaeleR2OC
00+E00.010+E00.520+E00.120+E05.120+E00.220+E05.220+E00.3
II.psnartkcurTleseidoiBgnihsurhCI.psnartkcurTerutlucirgA
kg
C
O2/h
a/yr
Fig. 2. Total demand of matter, embodied energy and emergy for the soybean biodiesel production phases.
O. Cavalett, E. Ortega / Journal of Cleaner Production 18 (2010) 55–70 63
the cropped area or a fraction of the biodiesel produced is rein-vested, thus creating an amplification loop for land, water, andlabor, we cannot escape the reality, that producing a high value, lowentropy, vegetable oil requires a very large resource investment perunit, given the low efficiency of photosynthetic processes.
The Emergy method can properly account for and quantify therenewability of biodiesel since it includes not only inputs andservices from the economy, but also resources from nature, usuallynot considered in conventional energy evaluations. Table 3 showsthat renewable resources used in the agricultural phase account foronly 30.7% of the total resources used by the biodiesel productionprocesses. Rain is the main renewable input used. The great amountof non-renewable resources used by the production process
AygremE
00+E00.041+E00.551+E00.151+E05.151+E00.251+E05.251+E00.351+E05.3
yticirtcelEsleuFswolf.rivnE
seJ/h
a/yr
wolFlairetaM
00+E00.020+E00.530+E00.130+E05.130+E00.230+E05.2
yticirtcelEsleuFswolf.rivnE
kg
/h
a/yr
renEdeidobmE
00+E00.080+E00.590+E00.190+E05.190+E00.290+E05.290+E00.390+E05.3
yticirtcelEsleuFswolf.rivnE
J/h
a/yr
Fig. 3. Comparison of the relative importance of input
indicates the strong dependency from economic resources and,therefore, its vulnerability to the input’s market prices and to theavailability of fossil fuels. The main non-renewable resources usedfrom the economy are limestone (8.3%), topsoil loss by erosion(7.65%) and fertilizers (5.5%). Additional services that correspond totaxes and negative externalities produced by the productionsystem accounted for 17.1% of the all resources used to producebiodiesel. The agricultural phase is responsible by the highest partof resources used (86.9%) flowed by the trans-esterification (7.9%)and the crushing (5.1%) phases.
The transformity of 1.01Eþ05 seJ J�1 is calculated for soybean assuch, in the field. Biodiesel is produced in the industrial phase, witha transformity of 3.90Eþ05 seJ J�1. Transformities significantly
sisylan
secivreS&robaLsdooGyrenihcaM
gnitnuoccA
secivreS&robaLsdooGyrenihcaM
citoibAretaW
riA
sisylanAyg
secivreS&robaLsdooGyrenihcaM
flows according to the evaluation method applied.

O. Cavalett, E. Ortega / Journal of Cleaner Production 18 (2010) 55–7064
increase from soybean to biodiesel due to the flows of emergysupporting the industrial steps. Emergy indicators presented inTable 3 show higher environmental loading of the whole biodieselprocess compared to the agricultural step alone. Transformity canbe used to compare different production systems generating thesame product, helping to choose the better alternative. In order tocompare the biodiesel transformity obtained in this work with theliterature values it is necessary to exclude the contribution ofadditional services (taxes and negative externalities) because thetransformities values selected from the literature were calculatedwithout considering these inputs. Excluding additional services,the transformity of biodiesel from soybean calculated in this workis 3.18Eþ05 seJ J�1. This value is higher than those obtained byOdum [15] for fossil fuels (coal: 6.70Eþ04 seJ J�1; natural gas:8.04Eþ04 seJ J�1; oil: 9.05Eþ04 seJ J�1; gasoline and diesel:1.11Eþ05 seJ J�1) and for other biofuels evaluated by Giampietroand Ulgiati [7] (Ethanol from sugarcane: 1.86Eþ 05–3.15Eþ05 seJ J�1; Biodiesel from sunflower: 2.31Eþ05 seJ J�1) andBastianoni et al. [3] (Sunflower oil: 2.78Eþ05 seJ J�1) indicating thatsoybean biodiesel presents larger demand for resources andtherefore, a lower ability to convert resources into products thanother energy sources considered in the literature. In summary, wemight state that the natural processes producing fossil fuels havebeen globally more efficient than the human-driven process ofsoybean cropping for biodiesel.
From the point of view of renewability of resources, the non-renewable percentage of the emergy flow to the biodieselproduction system is about 69%. This means that the biodiesel fromsoybean is less than one third renewable. However, such a result isstill better than fossil fuels that are considered as totally non-renewable resources. The Environmental Loading Ratio shows thatthe non-renewable emergy is 2.26 times higher than renewableemergy for the soybean biodiesel. If we want to have a moresustainable process to produce biodiesel from vegetable oil, it isfundamental to find other procedures that allow increasing thesystem’s renewability.
The emergy yield ratio (EYR) is a measure of the ability of theproduct to contribute with net emergy to the economic system byamplifying the resource investment. Biodiesel EYR is only 1.46, whileit ranges from 3 to 7 for fossil fuels [15]. Therefore, based on theseemergy accounting results, the investigated case of biodiesel fromsoybean does not easily compete with non-renewable energyresources. However, the biodiesel EYR can be increased by reducingthe use of non-renewable resources by the system, mainly on theagricultural stage, which uses the major part of resources (Fig. 2).The usual soybean agricultural production methods in Brazil are
Appendix 1. Footnotes for Tables 1–3.
Agricultural phase1 Sun
Insolation 1.67E
Albedo 15%
Conversion 3.60EInsolation energy 5.10ECropped area 1.00EEnergy (J/yr)¼ (land area) (insolation)Insolation energy 5.10E
2 RainPrecipitation (Brazilian average 9 samples) 1.72ECropped area 1.00EDensity of water 1.00EMass of rain 1.72EFraction of water that is evapotranspired 6.20EMass of rain evapotranspired 1.06E
characterized by intensive use of herbicides, fertilizers, agrochemicals,and agricultural machinery.
4. Conclusion
Results showed that in spite of a possible contribution to reducethe CO2 emissions, soybean biodiesel is not a viable alternativetaking into consideration materials, energy and emergy assess-ments performed in this study. The direct pollution (fertilizers,agrochemicals, pesticides) and other environmental impacts (soilloss, energy, material, water and land use) related to the net energydelivered to society as biodiesel indicate that soybean biodieselproduces a high pressure on the environment. The emergyaccounting method showed quantitatively that biodiesel fromsoybean cannot be considered a totally renewable energy source.The soybean biodiesel production is strongly dependent on the useof non-renewable resources in the agricultural production, trans-port and industrial processing stages. When crop production andindustrial conversion to fuel are supported by fossil fuels in theform of chemicals, goods, and process energy, the fraction of thefuel that is actually renewable is very low (around 30%). The bio-diesel transformity is higher than those calculated for fossil fuelsand for other biofuels indicating that biodiesel from soybeanpresents higher demand upon resources and therefore, a lowerlarge-scale ability to convert resources into products than otherenergy sources selected from the literature.
The future of biodiesel is very likely to be linked to the ability ofclustering biodiesel production with other agro industrial activitiesat an appropriate scale and mode of production to take advantageof the potential supply of valuable co-products. The agricultureproduction is the most important phase because it uses the largestamount of resources. Because of that the agricultural phase requiresmore attention from decision-makers for public policies towarda more sustainable soybean biodiesel production system. If thebiodiesel production systems are not carefully designed accordingto a diversified small-scale perspective, the intensive exploitationof land and fossil fuel use for biodiesel production are more likely togenerate environmental and social damages than to becomea renewable energy source to society.
Acknowledgment
The authors wish to acknowledge the financial support of Capes.We are also grateful to Consuelo Pereira for the many ideas offeredduring the preparation of this paper.
þ 03 W-h/m2/yr http://eosweb.larc.nasa.gov/cgi-bin/sse/sse.cgihttp://eosweb.larc.nasa.gov/cgi-bin/sse/sse.cgi
þ 03 J/Whþ 06 J/m2/yrþ 04 m2/ha
þ 10 J/ha/yr
þ 03 mm/yr or L/m2/yr www.inmet.gov.brþ 04 m2/haþ 00 kg/lþ 07 kg/ha/yr� 01 www.inmet.gov.brþ 07 kg/ha/yr
Free energy of water¼ (Evapotranspired water)(Gibbs free energy of water)Gibbs free energy of water 4.94Eþ 03 J/kg [15]Energy of rain 5.25Eþ 10 J/ha/yr
3 Deep heatHeat flow through earth crust contributing touplift replacing erosion.Average heat flow per area 3.00Eþ 06 J/m2/yr [15]Land area 1.00Eþ 04 m2/haEnergy (J/yr)¼ (land area)(heat flow per area) 3.00Eþ 10 J/yr
4 Nitrogen fixed from atmospherekg of N fixed from atmosphere 6.00Eþ 01 kg of N/ha/yr
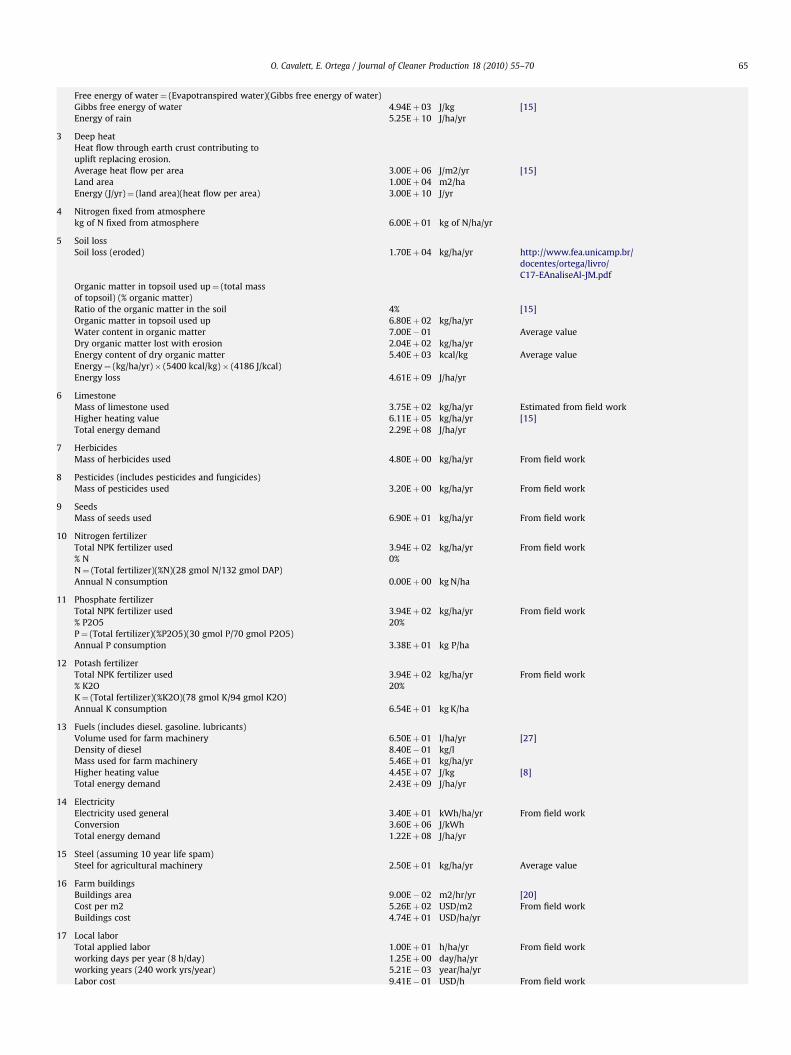
5 Soil lossSoil loss (eroded) 1.70Eþ 04 kg/ha/yr http://www.fea.unicamp.br/
docentes/ortega/livro/C17-EAnaliseAl-JM.pdf
Organic matter in topsoil used up¼ (total massof topsoil) (% organic matter)Ratio of the organic matter in the soil 4% [15]Organic matter in topsoil used up 6.80Eþ 02 kg/ha/yrWater content in organic matter 7.00E� 01 Average valueDry organic matter lost with erosion 2.04Eþ 02 kg/ha/yrEnergy content of dry organic matter 5.40Eþ 03 kcal/kg Average valueEnergy¼ (kg/ha/yr)� (5400 kcal/kg)� (4186 J/kcal)Energy loss 4.61Eþ 09 J/ha/yr
6 LimestoneMass of limestone used 3.75Eþ 02 kg/ha/yr Estimated from field workHigher heating value 6.11Eþ 05 kg/ha/yr [15]Total energy demand 2.29Eþ 08 J/ha/yr
7 HerbicidesMass of herbicides used 4.80Eþ 00 kg/ha/yr From field work
8 Pesticides (includes pesticides and fungicides)Mass of pesticides used 3.20Eþ 00 kg/ha/yr From field work
9 SeedsMass of seeds used 6.90Eþ 01 kg/ha/yr From field work
10 Nitrogen fertilizerTotal NPK fertilizer used 3.94Eþ 02 kg/ha/yr From field work% N 0%N¼ (Total fertilizer)(%N)(28 gmol N/132 gmol DAP)Annual N consumption 0.00Eþ 00 kg N/ha
11 Phosphate fertilizerTotal NPK fertilizer used 3.94Eþ 02 kg/ha/yr From field work% P2O5 20%P¼ (Total fertilizer)(%P2O5)(30 gmol P/70 gmol P2O5)Annual P consumption 3.38Eþ 01 kg P/ha
12 Potash fertilizerTotal NPK fertilizer used 3.94Eþ 02 kg/ha/yr From field work% K2O 20%K¼ (Total fertilizer)(%K2O)(78 gmol K/94 gmol K2O)Annual K consumption 6.54Eþ 01 kg K/ha
13 Fuels (includes diesel. gasoline. lubricants)Volume used for farm machinery 6.50Eþ 01 l/ha/yr [27]Density of diesel 8.40E� 01 kg/lMass used for farm machinery 5.46Eþ 01 kg/ha/yrHigher heating value 4.45Eþ 07 J/kg [8]Total energy demand 2.43Eþ 09 J/ha/yr
14 ElectricityElectricity used general 3.40Eþ 01 kWh/ha/yr From field workConversion 3.60Eþ 06 J/kWhTotal energy demand 1.22Eþ 08 J/ha/yr
15 Steel (assuming 10 year life spam)Steel for agricultural machinery 2.50Eþ 01 kg/ha/yr Average value
16 Farm buildingsBuildings area 9.00E� 02 m2/hr/yr [20]Cost per m2 5.26Eþ 02 USD/m2 From field workBuildings cost 4.74Eþ 01 USD/ha/yr
17 Local laborTotal applied labor 1.00Eþ 01 h/ha/yr From field workworking days per year (8 h/day) 1.25Eþ 00 day/ha/yrworking years (240 work yrs/year) 5.21E� 03 year/ha/yrLabor cost 9.41E� 01 USD/h From field work
O. Cavalett, E. Ortega / Journal of Cleaner Production 18 (2010) 55–70 65
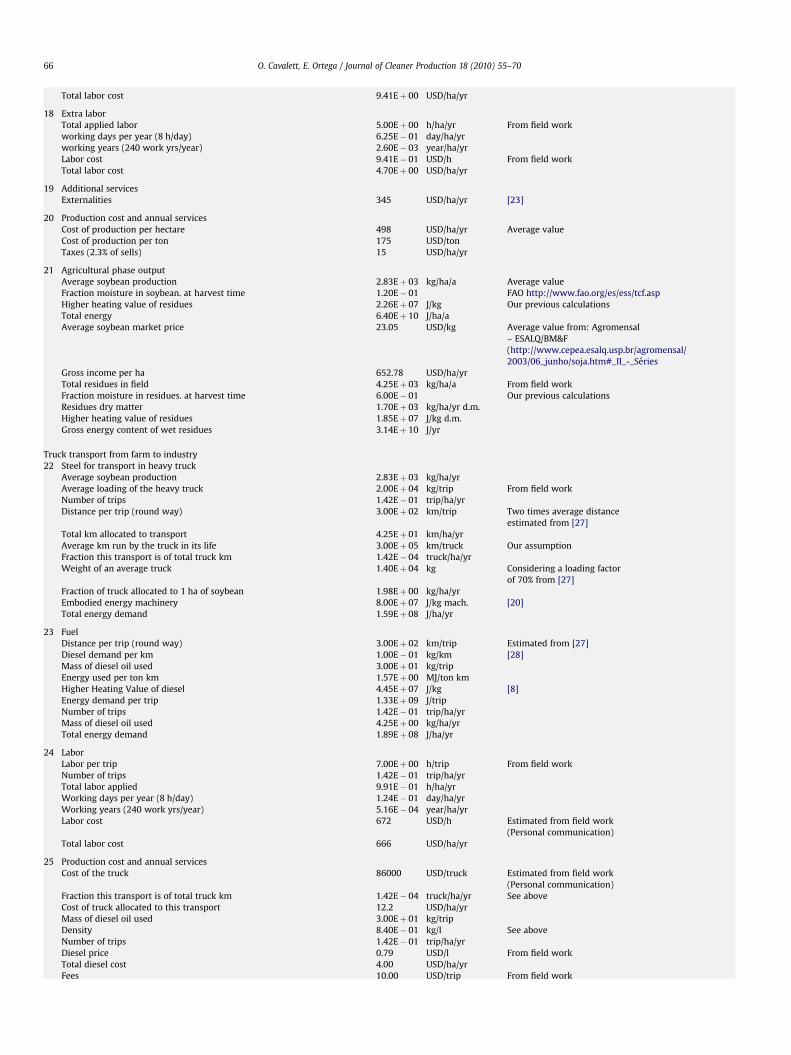
Total labor cost 9.41Eþ 00 USD/ha/yr
18 Extra laborTotal applied labor 5.00Eþ 00 h/ha/yr From field workworking days per year (8 h/day) 6.25E� 01 day/ha/yrworking years (240 work yrs/year) 2.60E� 03 year/ha/yrLabor cost 9.41E� 01 USD/h From field workTotal labor cost 4.70Eþ 00 USD/ha/yr
19 Additional servicesExternalities 345 USD/ha/yr [23]
20 Production cost and annual servicesCost of production per hectare 498 USD/ha/yr Average valueCost of production per ton 175 USD/tonTaxes (2.3% of sells) 15 USD/ha/yr
21 Agricultural phase outputAverage soybean production 2.83Eþ 03 kg/ha/a Average valueFraction moisture in soybean. at harvest time 1.20E� 01 FAO http://www.fao.org/es/ess/tcf.aspHigher heating value of residues 2.26Eþ 07 J/kg Our previous calculationsTotal energy 6.40Eþ 10 J/ha/aAverage soybean market price 23.05 USD/kg Average value from: Agromensal
– ESALQ/BM&F(http://www.cepea.esalq.usp.br/agromensal/2003/06_junho/soja.htm#_II_-_Series
Gross income per ha 652.78 USD/ha/yrTotal residues in field 4.25Eþ 03 kg/ha/a From field workFraction moisture in residues. at harvest time 6.00E� 01 Our previous calculationsResidues dry matter 1.70Eþ 03 kg/ha/yr d.m.Higher heating value of residues 1.85Eþ 07 J/kg d.m.Gross energy content of wet residues 3.14Eþ 10 J/yr
Truck transport from farm to industry22 Steel for transport in heavy truck
Average soybean production 2.83Eþ 03 kg/ha/yrAverage loading of the heavy truck 2.00Eþ 04 kg/trip From field workNumber of trips 1.42E� 01 trip/ha/yrDistance per trip (round way) 3.00Eþ 02 km/trip Two times average distance
estimated from [27]Total km allocated to transport 4.25Eþ 01 km/ha/yrAverage km run by the truck in its life 3.00Eþ 05 km/truck Our assumptionFraction this transport is of total truck km 1.42E� 04 truck/ha/yrWeight of an average truck 1.40Eþ 04 kg Considering a loading factor
of 70% from [27]Fraction of truck allocated to 1 ha of soybean 1.98Eþ 00 kg/ha/yrEmbodied energy machinery 8.00Eþ 07 J/kg mach. [20]Total energy demand 1.59Eþ 08 J/ha/yr
23 FuelDistance per trip (round way) 3.00Eþ 02 km/trip Estimated from [27]Diesel demand per km 1.00E� 01 kg/km [28]Mass of diesel oil used 3.00Eþ 01 kg/tripEnergy used per ton km 1.57Eþ 00 MJ/ton kmHigher Heating Value of diesel 4.45Eþ 07 J/kg [8]Energy demand per trip 1.33Eþ 09 J/tripNumber of trips 1.42E� 01 trip/ha/yrMass of diesel oil used 4.25Eþ 00 kg/ha/yrTotal energy demand 1.89Eþ 08 J/ha/yr
24 LaborLabor per trip 7.00Eþ 00 h/trip From field workNumber of trips 1.42E� 01 trip/ha/yrTotal labor applied 9.91E� 01 h/ha/yrWorking days per year (8 h/day) 1.24E� 01 day/ha/yrWorking years (240 work yrs/year) 5.16E� 04 year/ha/yrLabor cost 672 USD/h Estimated from field work
(Personal communication)Total labor cost 666 USD/ha/yr
25 Production cost and annual servicesCost of the truck 86000 USD/truck Estimated from field work
(Personal communication)Fraction this transport is of total truck km 1.42E� 04 truck/ha/yr See aboveCost of truck allocated to this transport 12.2 USD/ha/yrMass of diesel oil used 3.00Eþ 01 kg/tripDensity 8.40E� 01 kg/l See aboveNumber of trips 1.42E� 01 trip/ha/yrDiesel price 0.79 USD/l From field workTotal diesel cost 4.00 USD/ha/yrFees 10.00 USD/trip From field work
O. Cavalett, E. Ortega / Journal of Cleaner Production 18 (2010) 55–7066

Number of trips 1.42E� 01 trip/ha/yrTotal fees cost 1.42 USD/ha/yrLabor 6.66 USD/ha/yr From field workTotal transport cost per ha 24.25 USD/ha/yrTaxes (35% of labor cost) 2.33 USD/ha/yr
26 Products and by-products of transport phaseSoybean transported 2.83Eþ 03 kg See above
Crushing process phase27 Steel for plant machinery
Mass allocated per kg soybean processed per year 1.00E� 04 kg/kg [29]Average soybean production 2.83Eþ 03 kg/ha/yrTotal allocated per year 2.84E� 01 kg/ha/yr
28 Cement in plant constructionConstructed area 3.00Eþ 03 m2 [29]Perimeter of the constructed area 2.19Eþ 02 mHeight of the wall 3.00Eþ 00 m Our assumptionWalls area 6.57Eþ 02 m2Total constructed area¼ (Floor area)þ (Walls area)Total constructed area 3.66Eþ 03 m2Mean thickness of cement 2.00E� 01 m Our assumptionVolume of cement 7.31Eþ 02 m3Density of cement 2.40Eþ 03 kg/m3 (McGraw-Hill Encyclopedia of
Science and Technology) http://hypertextbook.com/facts/1999/KatrinaJones.shtml
Mass of cement 1.76Eþ 06 kgLife spam 3.00Eþ 01 yearsMass of cement per year 5.85Eþ 04 kg/yrAnnual soybean processing capacity of the plant 6.00Eþ 08 kgTotal cement allocated per kg soybean 9.74E� 05 kg/kgAverage soybean production 2.83Eþ 03 kg/ha/yrTotal allocated per year 2.76E� 01 kg/ha/yr
29 Iron in plant constructionIron reinforcement in concrete (floor and wall) 3.50Eþ 01 kg/m3 [30]Volume of cement 7.31Eþ 02 m3 See aboveMass of iron in floor and wall 2.56Eþ 04 kg
Iron sheet in roof. 1.25 mm thick 1.00Eþ 01 kg/m2 [30]Roof area 3.00Eþ 03 m2Mass of iron in roof 3.00Eþ 04 kgTotal mass of iron 5.56Eþ 04 kgLife spam 3.00Eþ 01 yearsMass of iron per year 1.85Eþ 03 kg/yrAnnual soybean processing capacity of the plant 6.00Eþ 08 kgTotal iron allocated per kg soybean 3.09E� 06 kg/kgAverage soybean production 3.66Eþ 03 kg/ha/yrTotal allocated per year 1.13E� 02 kg/ha/yr
30 FuelTotal diesel needed per kg soybean 1.79E� 02 kg/kg [29]Average soybean production 2.83Eþ 03 kg/ha/yrMass of diesel used 5.07Eþ 01 kg/ha/yrHigher Heating Value of diesel 4.45Eþ 07 J/kg [8]Total per ha per year 2.25Eþ 09 J/ha/yr
31 ElectricityEnergy used per kg of soybean 2.99E� 02 kWh/kg [29]Average soybean production 2.83Eþ 03 kg/ha/yrTotal per ha per year 8.47Eþ 01 kWh/ha/yrConversion 3.60Eþ 06 J/kWhTotal energy demand 3.05Eþ 08 J/ha/yr
32 WaterWater demand per kg of soybean 7.19E� 04 m3/kg [29]Conversion 1.00Eþ 03 kg/m3Average soybean production 2.83Eþ 03 kg/ha/yrTotal water demand 2.04Eþ 03 kg/ha/yrFree energy of water¼ (Evapotranspired water)(Gibbs free energy of water)Gibbs free energy of water 4.94Eþ 03 J/kgEnergy of water 1.01Eþ 07 J/ha/yr
33 HexaneHexane demand per ton of soybean 1.20E� 03 kg/kg [29]Hexane demand per kg of soybean 1.20Eþ 00 kg/tonAverage soybean production 2.83Eþ 03 kg/ha/yrTotal per ha per year 3.40Eþ 00 kg/ha/yrHigher Heating Value of hexane 4.48Eþ 07 J/kg http://www.chrismanual.com/H/HXA.
pdf#search¼ %22hexane%20j%2Fkg%22Total energy demand 1.52Eþ 08 J/ha/yr
O. Cavalett, E. Ortega / Journal of Cleaner Production 18 (2010) 55–70 67

34 LaborTotal applied labor per kg of soybean 2.01E� 04 h/kg [29]Average soybean production 2.83Eþ 03 kg/ha/yrTotal per ha per year 5.70E� 01 h/ha/yrworking days per year (8 h/day) 7.13E� 02 day/ha/yrworking years (240 work day/year) 2.97E� 04 year/ha/yr
35 Production cost and annual servicesBuildings and equipments per kg of soy 0.06 USD/kg [29]Average life spam 3.00Eþ 01 yearsBuildings and equipments 0.002 USD/kgOperation costs per kg of soy 0.014 USD/kg [29]Labor cost 0.003 USD/kg [29]Total cost 0.016 USD/kgAverage soybean production 2.83Eþ 03 kg/ha/yrTotal per ha per year 46.5 USD/ha/yrTaxes (35% of labor cost) 2.97 USD/ha/yr
36 Crushing phase outputAverage soybean production 2.83Eþ 03 kg/ha/yrFraction of meal (þhulls) 81.30% FAO http://www.fao.org/es/ess/tcf.aspMass of meal 2.30Eþ 03 kg/ha/yrHigher Heating Value of soy flour 1.55Eþ 07 J/kg [31]Total energy 3.58Eþ 10 J/ha/yrFraction of oil 18.00% FAO (16–20%) http://www.fao.org/es/ess/tcf.aspMass of oil 5.10Eþ 02 kg/ha/yrHigher Heating Value of soy oil 3.96Eþ 07 J/kg [31]Total energy 2.02Eþ 10 J/ha/yrFraction of lecithin gross 0.70% FAO http://www.fao.org/es/ess/tcf.aspMass of lecithin gross 1.98Eþ 01 kg/ha/yrHigher Heating Value of lecithin 3.96Eþ 07 J/kg Estimated from [31]Total energy 7.85Eþ 08 J/ha/yr
Biodiesel conversion37 Steel for plant machinery
Total steel allocated per kg soy oil per year 2.30E� 03 kg/kg oil [32]Soy oil processed 5.10Eþ 02 kg/ha/yrTotal allocated per year 1.17Eþ 00 kg/ha/yr
38 Cement in plant constructionConstructed area 4.18Eþ 02 m2 [32]Perimeter of the constructed area 8.18Eþ 01 mHeight of the wall 1.22Eþ 01 m Our assumptionWalls area 9.97Eþ 02 m2Total constructed area¼ (Floor area)þ (Walls area)Total constructed area 1.42Eþ 03 m2Mean thickness of cement 2.00E� 01 m Our assumptionVolume of cement 2.83Eþ 02 m3Density of cement 2.40Eþ 03 kg/m3 (McGraw-Hill Encyclopedia of Science and Technology)
http://hypertextbook.com/facts/1999/KatrinaJones.shtmlMass of cement 6.79Eþ 05 kgLife spam 3.00Eþ 01 yearsMass of cement per year 2.26Eþ 04 kg/yrSoy oil capacity of the biodiesel plant 3.40Eþ 07 kg/yrTotal cement allocated per kg soy oil 6.66E� 04 kg/kg oilSoy oil processed 5.10Eþ 02 kg/ha/yrTotal allocated per year 3.39E� 01 kg/ha/yr
39 Iron in plant constructionIron reinforcement in concrete (floor and wall) 3.50Eþ 01 kg/m3 [30]Volume of cement 2.83Eþ 02 m3 (See above)Mass of iron in floor and wall 9.91Eþ 03 kgIron sheet in roof. 1.25 mm thick 1.00Eþ 01 kg/m2 [30]Roof area 4.18Eþ 02 m2Mass of iron in roof 4.18Eþ 03 kgTotal mass of iron 1.41Eþ 04 kgLife spam 3.00Eþ 01 yrMass of iron per year 4.70Eþ 02 kg/yrSoy oil capacity of the biodiesel plant 3.40Eþ 07 kg/yrTotal iron allocated per kg soy oil 1.38E� 05 kg/kg of oilSoy oil processed 5.10Eþ 02 kg/ha/yrTotal allocated per year 7.04E� 03 kg/ha/yr
40 FuelTotal diesel needed per kg soy oil processed 5.37E� 02 kg/kg oil [32]Soy oil processed 5.10Eþ 02 kg/ha/yrMass of diesel used 2.74Eþ 01 kg/ha/yrHigher Heating Value of diesel 4.45Eþ 07 J/kg [8]Total allocated per year 1.22Eþ 09 J/ha/yr
41 Methanol
O. Cavalett, E. Ortega / Journal of Cleaner Production 18 (2010) 55–7068
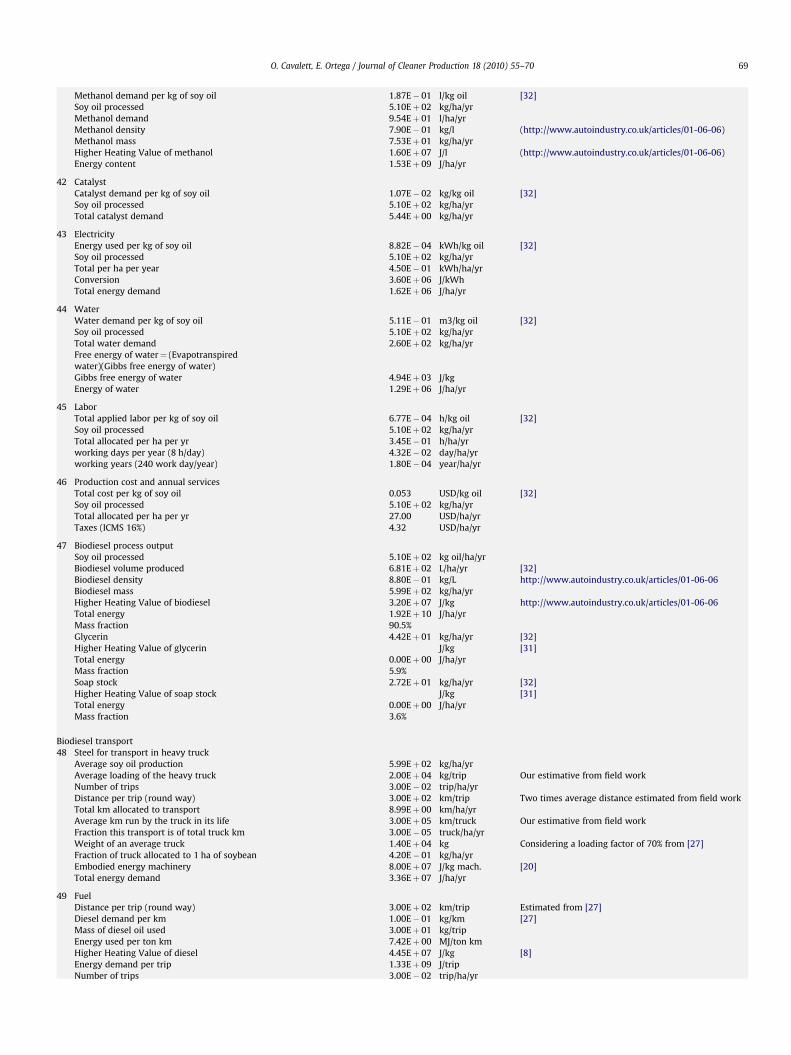
Methanol demand per kg of soy oil 1.87E� 01 l/kg oil [32]Soy oil processed 5.10Eþ 02 kg/ha/yrMethanol demand 9.54Eþ 01 l/ha/yrMethanol density 7.90E� 01 kg/l (http://www.autoindustry.co.uk/articles/01-06-06)Methanol mass 7.53Eþ 01 kg/ha/yrHigher Heating Value of methanol 1.60Eþ 07 J/l (http://www.autoindustry.co.uk/articles/01-06-06)Energy content 1.53Eþ 09 J/ha/yr
42 CatalystCatalyst demand per kg of soy oil 1.07E� 02 kg/kg oil [32]Soy oil processed 5.10Eþ 02 kg/ha/yrTotal catalyst demand 5.44Eþ 00 kg/ha/yr
43 ElectricityEnergy used per kg of soy oil 8.82E� 04 kWh/kg oil [32]Soy oil processed 5.10Eþ 02 kg/ha/yrTotal per ha per year 4.50E� 01 kWh/ha/yrConversion 3.60Eþ 06 J/kWhTotal energy demand 1.62Eþ 06 J/ha/yr
44 WaterWater demand per kg of soy oil 5.11E� 01 m3/kg oil [32]Soy oil processed 5.10Eþ 02 kg/ha/yrTotal water demand 2.60Eþ 02 kg/ha/yrFree energy of water¼ (Evapotranspiredwater)(Gibbs free energy of water)Gibbs free energy of water 4.94Eþ 03 J/kgEnergy of water 1.29Eþ 06 J/ha/yr
45 LaborTotal applied labor per kg of soy oil 6.77E� 04 h/kg oil [32]Soy oil processed 5.10Eþ 02 kg/ha/yrTotal allocated per ha per yr 3.45E� 01 h/ha/yrworking days per year (8 h/day) 4.32E� 02 day/ha/yrworking years (240 work day/year) 1.80E� 04 year/ha/yr
46 Production cost and annual servicesTotal cost per kg of soy oil 0.053 USD/kg oil [32]Soy oil processed 5.10Eþ 02 kg/ha/yrTotal allocated per ha per yr 27.00 USD/ha/yrTaxes (ICMS 16%) 4.32 USD/ha/yr
47 Biodiesel process outputSoy oil processed 5.10Eþ 02 kg oil/ha/yrBiodiesel volume produced 6.81Eþ 02 L/ha/yr [32]Biodiesel density 8.80E� 01 kg/L http://www.autoindustry.co.uk/articles/01-06-06Biodiesel mass 5.99Eþ 02 kg/ha/yrHigher Heating Value of biodiesel 3.20Eþ 07 J/kg http://www.autoindustry.co.uk/articles/01-06-06Total energy 1.92Eþ 10 J/ha/yrMass fraction 90.5%Glycerin 4.42Eþ 01 kg/ha/yr [32]Higher Heating Value of glycerin J/kg [31]Total energy 0.00Eþ 00 J/ha/yrMass fraction 5.9%Soap stock 2.72Eþ 01 kg/ha/yr [32]Higher Heating Value of soap stock J/kg [31]Total energy 0.00Eþ 00 J/ha/yrMass fraction 3.6%
Biodiesel transport48 Steel for transport in heavy truck
Average soy oil production 5.99Eþ 02 kg/ha/yrAverage loading of the heavy truck 2.00Eþ 04 kg/trip Our estimative from field workNumber of trips 3.00E� 02 trip/ha/yrDistance per trip (round way) 3.00Eþ 02 km/trip Two times average distance estimated from field workTotal km allocated to transport 8.99Eþ 00 km/ha/yrAverage km run by the truck in its life 3.00Eþ 05 km/truck Our estimative from field workFraction this transport is of total truck km 3.00E� 05 truck/ha/yrWeight of an average truck 1.40Eþ 04 kg Considering a loading factor of 70% from [27]Fraction of truck allocated to 1 ha of soybean 4.20E� 01 kg/ha/yrEmbodied energy machinery 8.00Eþ 07 J/kg mach. [20]Total energy demand 3.36Eþ 07 J/ha/yr
49 FuelDistance per trip (round way) 3.00Eþ 02 km/trip Estimated from [27]Diesel demand per km 1.00E� 01 kg/km [27]Mass of diesel oil used 3.00Eþ 01 kg/tripEnergy used per ton km 7.42Eþ 00 MJ/ton kmHigher Heating Value of diesel 4.45Eþ 07 J/kg [8]Energy demand per trip 1.33Eþ 09 J/tripNumber of trips 3.00E� 02 trip/ha/yr
O. Cavalett, E. Ortega / Journal of Cleaner Production 18 (2010) 55–70 69

Mass of diesel oil used 8.99E� 01 kg/ha/yrTotal energy demand 4.00Eþ 07 J/ha/yr
50 LaborLabor per trip 7.00Eþ 00 h/trip Our estimative from field workNumber of trips 3.00E� 02 trip/ha/yrTotal labor applied 2.10E� 01 h/ha/yrWorking days per year (8 h/day) 2.62E� 02 day/ha/yrWorking years (240 work yrs/year) 1.09E� 04 year/ha/yrLabor cost 6.72 USD/h Estimated from field workTotal labor cost 1.41 USD/ha/yr
51 Production cost and annual servicesCost of the truck 86000 USD/truck Estimated from field workFraction this transport is of total truck km 3.00E� 05 truck/ha/yrCost of truck allocated to this transport 2.58 USD/ha/yrMass of diesel oil used 3.00Eþ 01 kg/tripDensity 8.40E� 01 kg/l See aboveNumber of trips 3.00E� 02 trip/ha/yrDiesel price 0.79 USD/l Estimated from field workTotal diesel cost 0.85 USD/ha/yrFees 1000 USD/trip Our estimative from field workNumber of trips 3.00E� 02 trip/ha/yrTotal fees cost 0.30 USD/ha/yrLabor 1.41 USD/ha/yrTotal transport cost per ha 5.13 USD/ha/yrTaxes (35% of labor cost) 0.49 USD/ha/yr
52 Products and by-products of transport phaseBiodiesel transported 5.99Eþ 02 kg See above
1.92Eþ 10 J
O. Cavalett, E. Ortega / Journal of Cleaner Production 18 (2010) 55–7070
References
[1] Sheehan J, Camobreco V, Duffield J, Graboski M, Shapouri H. Life cycleinventory of biodiesel and petroleum diesel for use in an urban bus. Colorado:United States Department of Agriculture and United States Department ofEnergy (USDA AND U.S. DOE); 1998.
[2] Oliveira MED, Vaughan BE, Rykiel Jr EJ. Ethanol as fuel: energy, carbon dioxidebalances, and ecological footprint. BioScience 2005;55(7):593–602.
[3] Bastianoni S, Coppola F, Tiezzi E, Colacevich A, Borghini F, Focardi S. Biofuelpotential production from the Orbetello lagoon macroalgae: a comparisonwith sunflower feedstock. Biomass and Bioenergy 2008;32(7):619–28.
[4] Harding KG, Dennis JS, von Blottnitz H, Harisson STL. A life-cycle comparisonbetween inorganic and biological catalysis for the production of biodiesel.Journal of Cleaner Production 2008;16(13):1368–78.
[5] Kim S, Dale BE. Life cycle assessment of various cropping systems utilized forproducing biofuels: bioethanol and biodiesel. Biomass and Bioenergy2005;29:426–39.
[6] West TO, Marland G. A synthesis of carbon sequestration, carbon emissions,and net carbon flux in agriculture: comparing tillage practices in the UnitedStates. Agriculture, Ecosystems and Environment 2002;91:217–32.
[7] Giampietro M, Ulgiati S. Integrated assessment of large-scale biofuels. CriticalReviews in Plant Sciences 2005;24:1–20.
[8] Ulgiati SA. Comprehensive energy and economic assessment of biofuels: when‘‘green’’ is not enough. Critical Reviews in Plant Sciences 2001;20(1):71–106.
[9] Assis WFT, Zucarelli MC. Despoluindo Incertezas: impactos territoriais daexpansao de agrocombustıveis e perspectivas para uma produçao sustentavel.Brazil: Editora e Grafica O Lutador; 2007.
[10] Ulgiati S, Raugei M, Bargigli S. Overcoming the inadequacy of single-criterionapproaches to life cycle assessment. Ecological Modelling 2006;190:432–42.
[11] Hinterberger F, Stiller H. Energy and material flows. In: Proceedings of the FirstInternational Workshop Advances in Energy Studies. Energy Flows in Ecologyand Economy: Roma, Italy, 1998: p. 275–86.
[12] Bargigli S, Raugei M, Ulgiati S. Mass flow analysis and mass-based indicators.In: Handbook of ecological indicators for assessment of ecosystem health. CRCPress; 2004.
[13] Slesser M. Energy in the economy. London: Macmillan; 1978.[14] Herendeen R. Embodied energy, embodied everything..now what?. In:
Ulgiati S, Brown MT, Giampietro M, Herendeen RA, Mayumi K, editors.Proceedings of the International Workshop Advances in Energy Studies; 1998.p. 13–48. Porto Venere, Italy.
[15] Odum HT. Environmental accounting: emergy and environmental decisionmaking. New York, NY, USA: Wiley; 1996.
[16] Brown MT, Ulgiati S. Emergy analysis and environmental accounting. In:Encyclopedia of energy, 2; 2004. 329–354.
[17] Venturi P, Venturi G. Analysis of energy comparison for crops in Europeanagricultural systems. Biomass and Bioenergy 2003;25:235–55.
[18] Janulis P. Reduction of energy consumption in biodiesel fuel life cycle.Renewable Energy 2004;29(6):861–71.
[19] Wurbs J, Nickel R, Rohn H, Liedtke C. Der Werkstoff Glas. Materialintensitatvon Behalterglas und Flachglas. Die 0,33 l Verpackung aus Aluminium,Weißblech und Glas, Materialintensitatsanalysen von Grund-, Werk- undBaustoffen (5), Wuppertal Papers Nr. 64, 1996.
[20] Biondi P, Panaro V, Pellizzi G. Le richieste di energia del sistema agricoloitaliano. In: CNR, Consiglio Nazionale delle Ricerche, Progetto FinalizzatoEnergetica, Sottoprogetto Biomasse, editors. Agricoltura; 1989. Roma, Italia:Report LB-20.
[21] Boustead I, Hancock GF. Handbook of industrial energy analysis. England: EllisHorwood Limited; 1979.
[22] Smil V. General energetics. New York: John Wiley & Sons; 1991.[23] Ortega E, Cavalett O, Bonifacio R, Watanabe M. Brazilian Soybean Production:
emergy analysis with an expanded scope. Bulletin of Science, Technology &Society 2005;25(4):323–34.
[24] Bastianoni S, Marchettini N, Panzieri M, Tiezzi E. Sustainability assessment ofa farm in the Chianti area (Italy). Journal of Cleaner Production 2001;9:365–73.
[25] Coelho O, Ortega E, Comar V. Balanço de Emergia do Brasil (Dados de 1996,1989 e 1981). See also:. In: Ortega E, editor. Engenharia Ecologica e AgriculturaSustentavel http://www.fea.unicamp.br/docentes/ortega/livro/index.htm;2003.
[26] Bastianoni S, Marchettini N. The problem of co-production in environmentalaccounting by emergy analysis. Ecological Modelling 2000;129:187–93.
[27] Cederberg C, Flysjo A. Environmental assessment of future pig farmingsystems. Report from the Swedish institute for food and biotechnology, 2004.
[28] CORINAIR. Road Transport report. See also: http://reports.eea.europa.eu/EMEPCORINAIR4/en/page016.html; 2002.
[29] Dorsa R. Tecnologia de Processamento de Oleos e Gorduras Vegetais, 3rdedition, 2000.
[30] Bjorklund J, Geber U, Rydberg T. Emergy analysis of municipal wastewatertreatment and generation of electricityby digestion of sewage sludge.Resources Conservation and Recycling 2001;31:293–316.
[31] Domalski ES, Jobe Jr TL, Milne TA. Thermodynamic data for biomass conver-sion and waste incineration. Report from the Solar technical Informationprogram, USA, 1986.
[32] Fortenbery TR. Biodiesel feasibility study: an evaluation of biodiesel feasibilityin Wisconsin. Agricultural & Applied Economics 2005. Staff paper series.
[33] Crutzen PJ, Mosier AR, Smith KA, Winiwarter W. N2O release from agro-biofuelproduction negates global warming reduction by replacing fossil fuels.Atmospheric Chemistry and Physics Discussion 2007;7:11191–205.