
Insight into coordination of dilead unit by molecules of 4-thiazolidinone-2-thione: Structural and...
10
This article appeared in a journal published by Elsevier. The attached copy is furnished to the author for internal non-commercial research and education use, including for instruction at the authors institution and sharing with colleagues. Other uses, including reproduction and distribution, or selling or licensing copies, or posting to personal, institutional or third party websites are prohibited. In most cases authors are permitted to post their version of the article (e.g. in Word or Tex form) to their personal website or institutional repository. Authors requiring further information regarding Elsevier’s archiving and manuscript policies are encouraged to visit: http://www.elsevier.com/copyright
-
Upload
jagiellonian -
Category
Documents
-
view
1 -
download
0
Transcript of Insight into coordination of dilead unit by molecules of 4-thiazolidinone-2-thione: Structural and...

This article appeared in a journal published by Elsevier. The attachedcopy is furnished to the author for internal non-commercial researchand education use, including for instruction at the authors institution
and sharing with colleagues.
Other uses, including reproduction and distribution, or selling orlicensing copies, or posting to personal, institutional or third party
websites are prohibited.
In most cases authors are permitted to post their version of thearticle (e.g. in Word or Tex form) to their personal website orinstitutional repository. Authors requiring further information
regarding Elsevier’s archiving and manuscript policies areencouraged to visit:
http://www.elsevier.com/copyright
Author's personal copy
Insight into coordination of dilead unit by molecules of 4-thiazolidinone-2-thione:Structural and computational studies
Katarzyna M. Marzec a, Bartlomiej Gawel b, Krzysztof K. Zborowski b, Wieslaw Lasocha b,Leonard M. Proniewicz b,⇑, Kamilla Malek a,b,⇑a Jagiellonian Centre for Experimental Therapeutics, Jagiellonian University, Bobrzynskiego 14, 30-348 Krakow, Polandb Faculty of Chemistry, Jagiellonian University, Ingardena 3, 30-060 Krakow, Poland
a r t i c l e i n f o
Article history:Received 9 May 2011Received in revised form 13 July 2011Accepted 20 July 2011Available online 28 July 2011
Keywords:Pb–PbRhodaninePowder diffractionDFTIR/Raman spectra
a b s t r a c t
The reaction of Pb2+ ions with 4-thiazolidinone-2-thione (Hrd) yields to coordination of the uncommondilead unit (Pb2
2+) by the N-deprotonated molecule of the ligand. The powder structure determination ofthe complex reveals an almost planar dimeric structure with the {N,S} coordination mode. The intermo-lecular distance of the Pb–Pb moiety (3.51(4) Å) is lower than the van der Waals parameter suggestingthe formation of a bond. The structure in the solid state and DFT calculations of molecular orbitals andthe presence of a bond critical point between the lead atoms clearly demonstrate the existence of a singlebond within the Pb–Pb unit formed by the 6p orbital electrons. The lone pairs of the 6s orbitals do notparticipate in bonding with the ligand atoms and are likely bisdirected. FT-IR and FT-Raman spectra con-firm the molecular structure since all the modes of the NH group disappear in the spectra of the complex,while the stretching mode of the C@S bond shifts to lower values, as would be expected for this coordi-nation fashion.
� 2011 Elsevier B.V. All rights reserved.
1. Introduction
Coordination of lead cations is of considerable interest becauseof their neurotoxic action in living organisms by binding to thethiol and/or phosphate groups in DNA, proteins, and cell mem-branes [1,2]. Lead ions are also accumulated in the oxygen-richsites of bones, where they replace calcium ions [3]. Therefore, thereis a need to design a chelating agent that can react with lead ionsselectively and efficiently. Although, some molecular structureswith the divalent lead ions coordinated to N, S, and O atoms arewidely known [4], examples of this cation interacting with a mol-ecule containing all of these atoms have not been reported so far.Presently, we describe a new example of such coordination with2-sulfanylidene-1,3-thiazolidin-4-one (rhodanine, Hrd) – a simplemolecule that belongs to the sulfur-containing N,O-heterocycles.The presence of the thioamide and keto groups yields to a strongability of the molecule to bind metal ions. And this feature is usedin the application of rhodanine as an antimicrobial and antibacte-rial agent in pharmacology [5,6], and in industry as a binding re-
agent of Au3+, Pd2+, Pt4+, and Hg2+ [7–9]. In our previous work[10] we reported the molecular structure of the rhodanine complexwith Ag+ ions. Here, the coordination occurs due to the N-deproto-nation of the ligand (Rd) and the binding of metal ions via thenitrogen and the exocyclic sulfur atoms, whereas the exocyclicoxygen atom remains non-bonded.
Generally, the heterocyclic ligands with the C(@S)–NH– moietytend to coordinate through the thiolate group, forming a strongM–S bond and a secondary M–N bond. On the other hand, the or-ganic compounds with the C(@O)–NH– group occasionally create,apart from the M–N bonding, the M–O bond [11–13]. Among manycomplexes of rhodanine derivatives, some of them show the M–Sbonding only (complexes with Pd2+, Cd2+ and Zn2+ ions) [14–16]with bond lengths varying in the wide range of 1.641–2.605 Å.However, there have also been known coordination modes throughN, S, and O atoms simultaneously as has been found for complexeswith Pd2+, Au3+ and Tl3+ ions [17,18]. Therefore, it has been claimedthat the coordination fashion of this class of organic compoundsadopts geometries of various nuclearities with great structuralcomplexity that can be modulated by the nature of the metal ionas well as a substituent attached to the heterocyclic ring [19].
The coordination compounds of the Pb2+ ion exhibit rich diversegeometries for which the presence and the activity of the 6s lonepair of electrons is highly responsible [4,20]. In the majority ofcomplexes, this lone pair is stereochemically active (the hemidi-rected lone pair) and the ligand-to-metal bonds are distributed
0020-1693/$ - see front matter � 2011 Elsevier B.V. All rights reserved.doi:10.1016/j.ica.2011.07.030
⇑ Corresponding authors at: Faculty of Chemistry, Jagiellonian University, Ingar-dena 3, 30-060 Krakow, Poland (K. Malek). Tel.: +48 12 663 2064; fax: +48 12 6340515 (K. Malek), tel.: +48 12 663 2288; fax: +48 12 634 0515 (L.M. Proniewicz).
E-mail addresses: [email protected] (L.M. Proniewicz), [email protected] (K. Malek).
Inorganica Chimica Acta 376 (2011) 581–589
Contents lists available at SciVerse ScienceDirect
Inorganica Chimica Acta
journal homepage: www.elsevier .com/locate / ica

Author's personal copy
unevenly, throughout only part of the globe around the metal cen-ter. For the complexes with the holodirected (stereochemicallyinactive but binding active) lone pair, the ligand-to-metal bondsare located around the metal ion whereas the bisdirected lone pairis splinted on both sides of the equatorial plane of a complex. Usu-ally, the bonding limit and the angular distribution of ligands areused in classification of the lead coordination. Recently, crystallo-graphic studies have shown that complexes with the Pb–N, Pb–S,and Pb–O bonds arranged in the hemidirected geometry possessa coordination number from 2 to 5 [4]. Furthermore, these studieshave revealed that none of these atoms in the ligand structure ispreferable as the most probable site of coordination. It is suggestedonly that for complexes with the coordination number of 4 and 5,the primary lead–ligand bonding exists with the S and O atoms,respectively. The nature of the Pb–S and Pb–O bonding, explainedon the basis of DFT for PbO and PbS [21], is chemically dependenton the stereochemically active lone pair of the lead cation. The Pb–O bonding is formed due to coupling of the unfilled 6p orbitals ofPb with the antibonding combination of the Pb 6s and the O 2porbitals. That results in the net asymmetry of electron densityaround Pb2+. However, this kind of orbital coupling cannot appearbetween lead and sulfur atoms because of the higher energy of theS 3p orbitals than those of the oxygen atom, and therefore themore stable and symmetrical distribution of electron densityaround Pb2+ is observed for the PbS bond. Apart from the lead–ligand interactions, the Pb containing compounds also exhibit thedilead contacts. This specific attraction, which overcomes the Cou-lombic Pb2+–Pb2+ repulsion, is possible due to the presence of therelativistically contracted 6s and 6p orbitals of the lead atom.And they result in an enhanced electronegativity of the metal cat-ion and formation of the stable, relatively inert outer lone pair ofelectrons (the inert-pair effect) [22–24]. On the other hand, theunusual oxidation state of +1 of Pb has been very rarely observed[25], and its chemistry has not been widely discussed [26]. The for-mation of the covalent Pb1+–Pb1+ entity with a bond length of3.04 Å has been found in the butterfly-like complex with phosp-hazenide. The bent geometry around the Pb–Pb dimer suggeststhe involvement of the 6p electrons in bonding, while the 6s elec-tron lone pairs are stereochemically active.
As part of our investigation into the coordination ability of rho-danine, we have studied its complex with lead ions spectroscopi-cally and structurally. The experimental support for the existenceof the lead complex of the ligand was gained from the Fouriertransform normal Raman (FT-Raman), infrared (FT-IR) spectra aswell as from the secondary ion mass spectrometry (TOF-SIMS).These results are consistent with structure determined from X-ray powder diffraction. Insight into the molecular structure ofthe complex and its vibrational features is additionally providedby DFT calculations.
2. Experimental
2.1. Synthesis of Pb–Rd complex
Hrd, the ligand was bought in POCh SA (powder form, orange,p.a. purity) and used without further purification. Solutions of(CH3COO)2Pb � 3H2O in methanol were mixed with a solution ofHrd in the methanol in 1:2 or 1:1 mol ratios. After mixing, pH ofsolutions decreased from 8 (for the Hrd solution) to 5. The mix-tures were stirred for 30 min at room temperature. The yellow de-posit was filtered out, transferred to the 4� distillated water andstirred another 30 min to eliminate impurities. The color of the sol-ids changed from yellow to dark pink. The UV–Vis spectra of the fil-trate indicated the presence of rhodanine (252 and 296 nm) andlead(II) acetate (208 nm) only. No other bands were observed.
These spectra were recorded on an Evolution 60 spectrophotome-ter with a resolution of 1 nm in a region of 190–1100 nm in aquartz cell of 1 cm. The powder was filtered out and rinsed withwater. Then, the solids were dried out at room temperature, whichyielded a pink powder suitable for the powder diffraction struc-tural analysis. The same method of synthesis was employed byusing water as a solvent. FT-MIR spectra of all complexes wereidentical, which indicates the same molecular structure of the leadcomplexes. The synthesized complex is insoluble in water, metha-nol, ethanol, acetone, DMSO, and DMF. Elemental analysis showedthat M:L is 1:1, regardless of the M:L molar ratio used initially.Anal. Calc. for C3H2NOS2Pb (339.39): C, 10.62; H, 0.59; N, 4.13%.Found: C, 11.06, H, 0.83, N, 3.88%. This molar ratio was confirmedalso by AAS.
2.2. Vibrational spectra
For FT-Raman measurements, a few milligrams of solids of Hrdand its lead complex were measured on metal discs directly. Fivehundred and twelve scans were collected (with a resolution of4 cm�1) for Hrd and its complex, respectively. Spectra were re-corded on a FT-Raman Spectrometer Nicolet NXR 9650 equippedwith a Nd:YAG laser, emitting at 1064 nm, and a germanium detec-tor cooled with liquid nitrogen. The output power of the laser was300 mW for both samples. Fourier transform mid-infrared (FT-MIR,256 scans) and Fourier transform far-infrared (FT-FIR, 512 scans)spectra were run in KBr pellets and low molecular weight polyeth-ylene discs, respectively. Resolution was 4 cm�1 (MIR) and 2 cm�1
(FIR). FT-IR spectra were measured on Bruker (IFS 48) and Bio-Rad(FTS 60 V) spectrometers in the mid and far IR regions, respec-tively. Frequency accuracy is estimated as ±1 cm�1.
2.3. Powder diffraction
The X-ray pattern was collected on a Philips X’Pert Pro diffrac-tometer with a Bragg–Brentano geometry using Cu Ka radiation(k = 1.54178 Å), from 3.5� to 90� 2h angle, at 298 K. The obtainedpowder pattern was indexed using the PROSZKI package [27].The diffraction pattern also contained a few undefined peaks,which may indicate impurities in the sample. However, the lowconcentration of these impurities did not affect our analysis. Acomplete model was found by the global optimization methodusing the program FOX [28]. The Rietveld refinement of the struc-ture was carried out by using the JANA2000 software [29], and wasconverged to satisfactory agreement factors (Rp = 9.58%,Rwp = 5.56%). However, in order to obtain a chemically reasonablecrystal structure rigid body refinement was necessary. The March– Dollase function was used for preferred orientation correction[30].
2.4. TOF-SIMS measurements
The TOF-SIMS IV (ION-TOF GmbH, Germany) instrument wasused in the recording of mass spectra of the solid sample of Pb–Rd. The conditions of measurement were as follows: beam of Bi3
+
primary ions with acceleration of 20 eV and beam current of0.5 pA. The mass spectrum was collected from a surface of100 lm � 100 lm.
2.5. Computational details
Density functional calculations were carried out for geometryoptimization, simulation of electronic structure and vibrationalspectra. These calculations were performed with the GAUSSIAN 03program package [31]. Calculations of molecular structures of thecomplex were carried out by using the LanL2DZ basis set [32] at
582 K.M. Marzec et al. / Inorganica Chimica Acta 376 (2011) 581–589

Author's personal copy
the DFT/B3LYP level of theory [33,34]. No imaginary wavenumberswere obtained. Theoretical Raman intensities (IR) were obtainedfrom GAUSSIAN Raman scattering activities (S) according to theexpression: IR
i ¼ 10�12ðm0 � miÞ4m�1i Si, where m0 is the excitation
wavenumber (9398.5 cm�1 for Nd:YAG laser) and mi is the wave-number of the normal mode calculated by DFT [35], assumingthe Boltzmann factor equal 1. The computed IR and Raman spectrawere not scaled. To provide the unequivocal assignment of thesespectra, the potential energy distribution was performed accordingto the Pullay and Foragasi internal coordinates [36,37]. The elec-tronic structure of the Pb–Rd complex was studied using the GAPT(Generalized Atomic Polar Tensors) [38], the NBO (Natural BondOrbitals) [39,40], and the AIM (Atoms in Molecules) [41,42]methods.
3. Results and discussion
3.1. Molecular structure of the complex in the solid state
The TOF-SIMS spectrum for the Pb complex of rhodanine isshown in Fig. S1 (Supplementary information). The detected masspeaks exhibit presence of the following molecular ions:C3H2NOS2
206Pb+, C3H2NOS2207Pb+ and C3H2NOS2
208Pb+. They sug-gest a strong interaction between the deprotonated ligand andthe lead ion in molar ratio M:L = 1:1 which is consistent with theother analytical results (see Section 2). This could imply the mono-meric form of the synthesized complex, however, the dimetallicspecies with the Pb–Pb bond cannot be excluded completely dueto its very low photo- and thermo-stability (20 kcal/mol) [43].The found molar ratio (1:1) also indicates a reduction of oxidationstate of Pb from +2 to +1. As described in the literature, this processis very complex and its mechanism is still a matter of discussion inthe lead chemistry [44 and therein]. Notwithstanding, two hypoth-eses may be made about a probable reducing agent. Use of meth-anol as a solvent can cause reduction of Pb2+ because thereduction potential of methanol is slightly more positive than thatof the Pb2+/Pb+ couple, however, this transformation is usuallyphotocatalysed [44]. The fingerprint region of IR spectra showedthat the structure of the complex was the same, regardless of thesolvent (water, methanol) used during the synthesis. Thus, thishypothesis can be excluded. On the other hand, the thiol contain-ing compounds act as reductants in reactions with metal ions[47]. Here, the keto-thione tautomer of Hrd might be transformedinto the keto-thiol form upon dissolution in methanol, and thenthe presence of the lead(II) ions leads to oxidation of Hrd by thedeprotonation of the SH group with the simultaneous formationof Pb+ ions. It is highly probable that, as mentioned in previousstudies [45,46], the oxidation of rhodanine by the lead ion leadsto the formation of a rhodanine radical and further formation ofdisulfides. As mentioned in Section 2, absorption spectrum of thefirst filtrate indicated the presence of rhodanine and lead(II) ace-tate only. In turn, a deposit obtained due to evaporation of metha-nol of the first filtrate was investigated by IR and Raman. Thecomparison of IR spectra of the reactants used in synthesis ofPb–Rd and the deposit (Fig. S2, Supplementary information) showsthe presence of acetate ions and a species that might be derivedfrom HRd (no bands characteristic for Pb–Rd are observed). The ab-sence of bands of the NH and C@O groups (discussed in Section 3.3)and the appearance of bands at 1646 and 1506 cm�1 may indicatethe formation of the C@N bond within the ring and a significantelongation of the exocyclic C–O group. On the other hand, them(CH2) mode above 2900 cm�1 indicates that a molecular fragmentaround the CH2 group remains unchanged. Dimerization throughthe S–S bond is suggested by disappearance of m(C@S) at ca.1070 cm�1. The m(S–S) mode is not usually observed in IR on the
contrary to Raman but Raman spectrum of the filtrate showedstrong fluorescent background only.
The molar ratio 1:1 should be also considered in terms of +2charge of Pb but this structure requires the presence of a counter-ion balancing the overall charge of the complex. The powder dif-fraction analysis revealed the presence of undefined peaks thatcould have resulted from additional anions in the structure. How-ever, they are not acetate ions from the Pb salt used. The other an-ion could be a small ion like OH�, but its presence was excludeddue to the lack of IR bands in the region of �3400 cm�1 originatingfrom the stretching modes of OH. Similarly, change of a tautomericform of the ligand was precluded based on Raman spectrum of thecomplex. This will be discussed later on. Therefore, we base ourmodeling on a complex with a ratio of M:L = 1:1 and a Pb+ ion.
The full insight into the molecular structure of the title complexwas given by the diffractional studies. The determined structuremodel is shown in Fig. 1. The feature of the Pb–Rd complex’s crys-tal structure is a packing of the planar dimers formed by two leadatoms and two rhodanine molecules within the three-dimensionalframework (Fig. 1C), giving an orthorhombic unit cell (Fig. 1B)(a = 23.8182(8) Å, b = 8.3239(3) Å, c = 6.1121(3) Å) in the spacegroup Iba2. The observed and calculated X-ray powder diffractionpatterns as well as the difference profile of the Rietveld refinementof the title compound is shown in (Fig. S3 in Supplementaryinformation).
The rhodanine molecules coordinate lead atoms by the nitrogen(Pb–N: 2.42(5) Å) and sulfur (Pb–S: 3.02(4) Å) atoms. The distancesfound here are consistent with sums of van der Waals radii forpairs of N and Pb (3.55 Å [48]), and S and Pb (3.80 Å [49]). The aver-age value of the Pb–N distance found for various complexesreaches the value of 2.53 Å, however values below this are oftencorrelated with the presence of the stereochemically active lonepair of Pb2+ in the complex [49]. On the other hand, bond lengthsbetween Pb and S atoms in lead-thiolate complexes vary in thewide range of 2.55–3.82 Å [49–51], thus the found Pb–S bondingof Pb–Rd belongs to the relatively strong interatomic interactions.The coordination mode through the oxygen atom is excluded dueto the found length of the Pb–O bond (3.49(5) Å) that is typicalfor lead complexes with the nonbonded oxygen atom [4]. In addi-tion the diffraction pattern reveals that the molecule contains aPb–Pb unit with an interatomic distance of 3.51(4) Å. The two mol-ecules of Rd are allocated around the Pb–Pb species in the nearlyflat trans configuration. The deviation of the structure from planar-ity is 19�. Thus the coordination mode of Pb–Rd can be presentedas a slightly bent, dimeric {N,S} chelation of the Pb2
2+ species.The planar dimers stack along the c axis with the rhodanine moie-ties in the adjacent molecules. The interplanar distance betweenthe overlapping rhodanine rings within pairs of dimers is 3.204 Å(Pb–Pb interdimer distance is 3.992 Å), indicating close interac-tions between neighboring units of the Pb–Rd complex (Fig. 1A).Such close contact between the heterocyclic rings presumably con-tributes effectively to the planarity of the dimers. Furthermore, thePb and S atoms located in the adjacent planes of the dimers arebrought quite close to one another, 3.32 Å. This could additionallyindicate a relatively strong interaction between the dimers alongthe c axis leading to the polymeric-like nature of the Pb–Rd com-plex. Some details of such an interaction will be discussed in thenext section.
The pronounced feature of the title complex is the presence ofthe Pb2
2+ unit. An examination of the Pb–Pb distance in this com-pound implies bonding between Pb+ ions if the corresponding vander Waals parameter is 4.04 Å [52]. Generally, bond lengths of thedilead(II) species vary in the wide range, from 2.84 to 3.76 Å, andare found mainly in organometallic compounds and clusters[48,49,53–56]. On the other hand, the Pb–Pb interatomic distanceof 3.49 Å is observed in the metallic lead [57]. Such a variety is
K.M. Marzec et al. / Inorganica Chimica Acta 376 (2011) 581–589 583

Author's personal copy
connected with the fact that the Pb–Pb bonding is very sensitive tothe bulkiness, electron-withdrawing and electron-releasing powerof chelating atoms as well as functional groups present in a com-pound. This bonding in diplumbanes and diplumbenes revealsthe significant covalent character, but the Pb–Pb interaction inclusters (minimum four Pb atoms) is described as an intermediatebetween ionic, metallic and covalent bonding [58]. A short Pb–Pbdistance of 3.89 Å has been found in bis(pyrrolidinecarbodithio-ato)lead(II) and a weak or partial metal interaction between leadatoms in this complex has been proposed in the work [59]. As men-tioned above, the Pb–Pb bond of 3.51 Å is found in the complexpresented here and is longer than reported by Winkler et al.(3.05 Å) for dimeric lead(I) species [25] but shorter than in [59].Therefore, interatomic contact between Pb atoms in Pb–Rd shouldbe considered. Moreover, arrangement of the ligand moleculesaround the Pb2
2+ species in Pb–Rd is different from that complexof Winkler, suggesting a distinct distribution of Pb valence elec-trons. Keeping in mind the relationship between the lone pair func-tionality and coordination geometry proposed for the divalent leadcompounds, the comparison of the molecular structures of bothcomplexes shows that the hemidirected character of the lone pairresults in the identifiable void in Pb+–phosphazenide, whereas theeven charge distribution around the Pb ion is rather observed inPb–Rd (the holo- or bisdirected lone pair). On the other hand,one could imply that just a weak interaction between Pb atomsmight exist in Pb–Rd without any bonding character. However,as it will be discussed later on, the NBO and AIM calculations forthis complex suggest the presence of the r-bonding within thePb2
2+ moiety.Since, the oxidation state of metal ions and the {S,N} coordina-
tion mode is the same for the complex of rhodanine with lead andsilver ions [10], we compared their structural parameters to have aview of the metal impact. The interatomic M–N, M–S, and M–O dis-tances for both complexes are comparable, in spite of the differentionic radii of metal cations. However, an effect of the cation on the
ligand geometry upon complexation is stronger in the case of Ag+
than Pb+. Inspection of the ring bond lengths of the sole rhodanine[60] and those of the lead complex (Table 1) reveals that changes ofthese values vary in the range of 0.01–0.08 Å (0.04–0.2 Å for Ag–Rd). In Pb–Rd, C5–S7 bond distance (atomic numbering in Fig. 2)only decreases in comparison to the rhodanine molecule (by0.07 Å) and indicates an amount of single bond character, contraryto the equivalent bond in Ag–Rd. On the other hand, the neighbor-ing bond (S7–C9) lengthens considerably by 0.08 Å showing an ex-change of electron density around the endocyclic C–S–C moiety. Asimilar change has been observed for Ag–Rd, however, the electrondensity in this fragment of the ligand is strongly shifted towardsC5–S7. Geometry around the first binding site, the nitrogen atom,alternates through an elongation of both C–N bonds by 0.02 Å thatimplies the even electron distribution in this part of the ligand dueto the N-deprotonation and coordination of lead atoms. Binding ofPb+ ions by the exocyclic sulfur atom causes lengthening of C@S(by 0.02 Å) but this bond does not become a typical single one likein the coordination of silver ions. Similar behavior is found for theC@O bond.
Fig. 1. Crystallographic structure of Pb–Rd: (A) the inter-planar dimers; (B) packing in the unit cell; and (C) the in-plane dimer.
Table 1The experimental bond lengths of rhodanine and its lead complex.
Bonda Hrd exptl.b Pb–Rd exptl.c
C11–C9 1.51 1.52(8)C5–S7 1.82 1.75(8)C9–S7 1.74 1.82(7)C5–N3 1.37 1.38(8)C11–N3 1.38 1.39(7)C5@S13 1.64 1.66(7)C11@O15 1.23 1.24(8)
a Atomic numbering in Fig. 2.b [60].c This work.
584 K.M. Marzec et al. / Inorganica Chimica Acta 376 (2011) 581–589
Author's personal copy
3.2. DFT modeling of the Pb–Rd complex
We attempted to address the question of interaction betweenlead atoms and rhodanine by using the DFT computational method.First it was necessary to generate the completely optimized molec-ular geometry at the B3LYP/LanL2DZ level of theory. This approachhas been used in many theoretical studies on the various coordina-tion systems and has led to relatively proper results [10,61,62]. Tosimplify calculations, the dimeric structure (C2 symmetry point,singlet state) defined in the diffractional studies was used hereas a model (c.f. Fig. 2). All vibrational frequencies for this modelwere real and allowed simulating of IR and Raman spectra dis-cussed later on. Calculation of the same structure but in the tripletstate showed that its energy is higher than this for the singlet stateby 17.1 kcal/mol and is characterized by one imaginary frequency.On the other hand, calculation of the same structure with the +2charge of Pb led to a separation of the subunits in the dimer duringthe optimization process. This can imply instability of the molecu-lar structure with Pb2+–Pb2+ moiety. We also performed calcula-tions of many molecular structures with different spatialarrangements and M:L ratio. The most important, neutral struc-tures with M:L = 1:1 and 1:2 are presented in Fig. S4 (Supplemen-tary materials). However, these theoretical results did notsignificantly improve the chemical picture of the molecule.
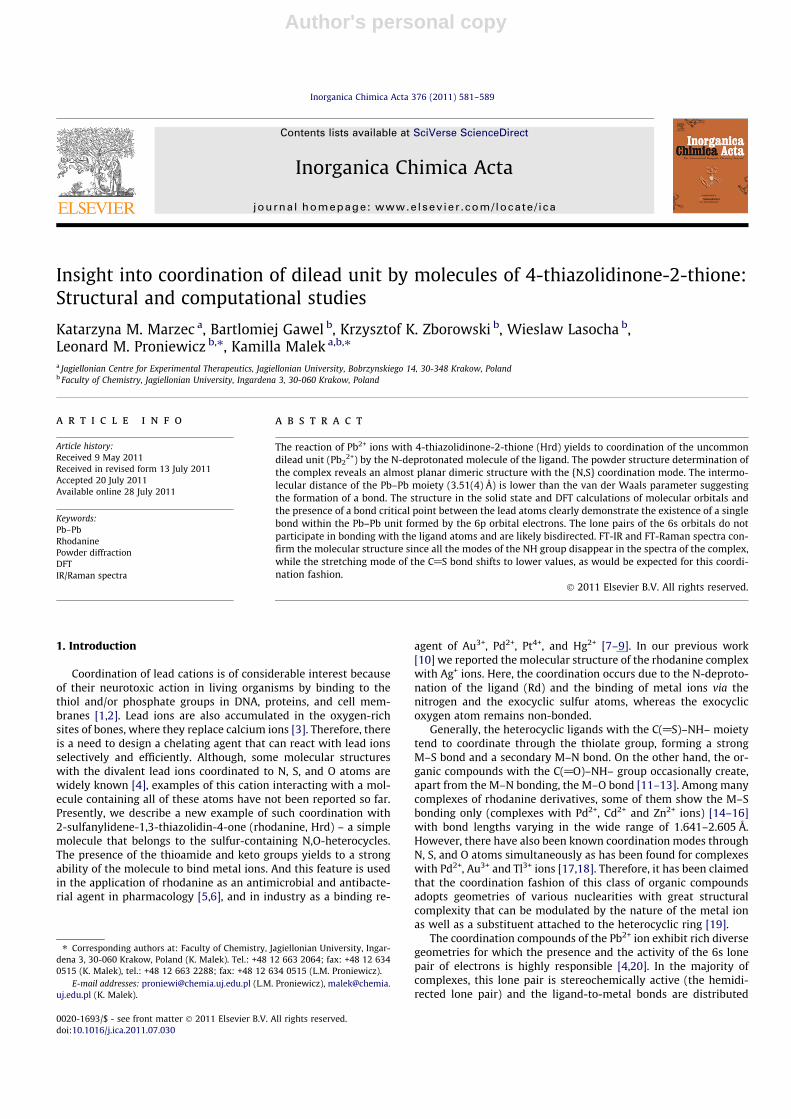
The calculated geometrical parameters of the employed modelare shown in Fig. 2 and can be compared with the correspondingexperimental values summarized in Table 1. The agreement be-tween experimental and calculated values is fairly satisfactory,which suggests that our model is able to reproduce key structuralparameters.
A detailed analysis of electronic structures in terms of NaturalBond Orbitals (NBO) shows a bonding nature between lead cationsand the ligand. In this scheme, the molecular-wave function is rep-resented as an orthonormal set of Lewis-type lone pair and bond-ing orbitals, with small corrections being made via occupancy ofnon-Lewis-type antibonding and Rydberg orbitals [39]. The mainquestion we are going to answer in this paragraph concerns thepresence and/or absence of a direct lead–lead bond and electronicdistribution on the liganding atoms. Our calculation reveals thatthe bonding molecular orbital between two lead atoms consistsof the equal contribution of 2 �e from 6p orbitals [50%Pb1 (1.7%s + 98.3% p) + 50%Pb2 (1.7% s + 98.3% p)], suggesting the formationof the purely covalent r bonding. This is also confirmed in theframe of the AIM method by the presence of the bond critical pointbetween lead atoms (electron density at the bond criticalpoint = 0.0228, its Laplacian = �0.0019, energy density = �0.0031,ellipticity = 0.0245). Moreover, NBO shows that the remaining va-lence electrons of lead atoms, i.e. from the 6s orbital, exist as lonepairs (96.7% s + 3.3% p). This completely agrees with the physicalintuition. However, bearing in mind that calculations are limitedby their assumptions, we propose at least that a strong interactionbetween Pb+–Pb+ must exist. The visual inspection of topology of
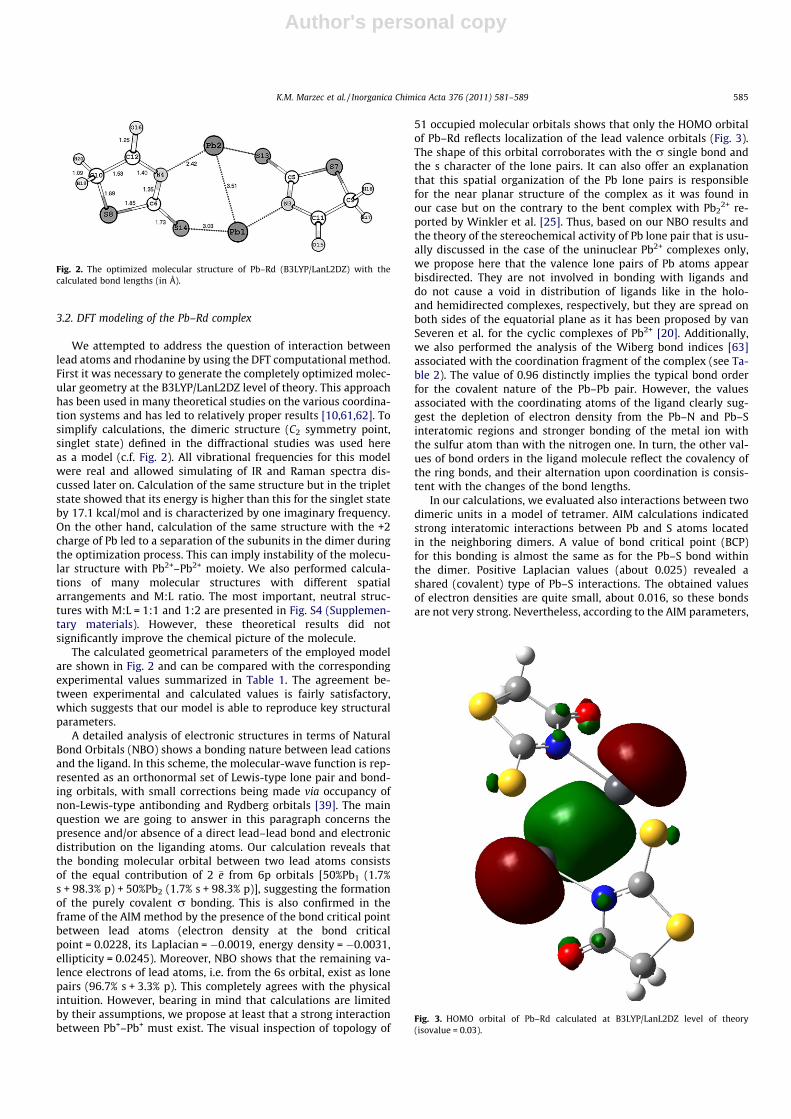
51 occupied molecular orbitals shows that only the HOMO orbitalof Pb–Rd reflects localization of the lead valence orbitals (Fig. 3).The shape of this orbital corroborates with the r single bond andthe s character of the lone pairs. It can also offer an explanationthat this spatial organization of the Pb lone pairs is responsiblefor the near planar structure of the complex as it was found inour case but on the contrary to the bent complex with Pb2
2+ re-ported by Winkler et al. [25]. Thus, based on our NBO results andthe theory of the stereochemical activity of Pb lone pair that is usu-ally discussed in the case of the uninuclear Pb2+ complexes only,we propose here that the valence lone pairs of Pb atoms appearbisdirected. They are not involved in bonding with ligands anddo not cause a void in distribution of ligands like in the holo-and hemidirected complexes, respectively, but they are spread onboth sides of the equatorial plane as it has been proposed by vanSeveren et al. for the cyclic complexes of Pb2+ [20]. Additionally,we also performed the analysis of the Wiberg bond indices [63]associated with the coordination fragment of the complex (see Ta-ble 2). The value of 0.96 distinctly implies the typical bond orderfor the covalent nature of the Pb–Pb pair. However, the valuesassociated with the coordinating atoms of the ligand clearly sug-gest the depletion of electron density from the Pb–N and Pb–Sinteratomic regions and stronger bonding of the metal ion withthe sulfur atom than with the nitrogen one. In turn, the other val-ues of bond orders in the ligand molecule reflect the covalency ofthe ring bonds, and their alternation upon coordination is consis-tent with the changes of the bond lengths.
In our calculations, we evaluated also interactions between twodimeric units in a model of tetramer. AIM calculations indicatedstrong interatomic interactions between Pb and S atoms locatedin the neighboring dimers. A value of bond critical point (BCP)for this bonding is almost the same as for the Pb–S bond withinthe dimer. Positive Laplacian values (about 0.025) revealed ashared (covalent) type of Pb–S interactions. The obtained valuesof electron densities are quite small, about 0.016, so these bondsare not very strong. Nevertheless, according to the AIM parameters,
Fig. 2. The optimized molecular structure of Pb–Rd (B3LYP/LanL2DZ) with thecalculated bond lengths (in Å).
Fig. 3. HOMO orbital of Pb–Rd calculated at B3LYP/LanL2DZ level of theory(isovalue = 0.03).
K.M. Marzec et al. / Inorganica Chimica Acta 376 (2011) 581–589 585
Author's personal copy
Pb–S bonding can be responsible for existing forces between di-mers, leading to formation of polymeric chains in the Pb–Rd com-plex. Additionally, DFT calculations showed that stabilizationenergy between pair of dimers is about 20 kJ/mol in comparisonto the dimeric species.
We also examined changes of electron distribution upon coordi-nation of the dilead moiety by using two approaches of the atomiccharges calculations, i.e. Natural Population Analysis (NPA) andGeneralized Atomic Polar Tensors (GAPT) (c.f. Table 3). Generally,both methods showed relatively similar electron distribution inthe deprotonated ligand as well as in the complex, except for theendocyclic sulfur atom (S7), for which NPA and GAPT predictedopposite signs of atomic charge. Therefore, to assess which of themethods gives the proper description of electron distribution inthe rhodanine compounds, we calculated differences in charges be-tween atoms of the exocyclic C@O and C@S groups in Rd thatshould reflect polarization of these bonds. According to NPA thesevalues are 1.3 and 0.3 a.u. for C@O and C@S, respectively, whereasGAPT predicted 1.7 and 2.1 a.u., respectively. It seems that the NPAresults agree with the intuitive expectations if we consider electro-negativity of O and S atoms. However, with these results in mindwe attempt now to discuss variation of atomic charges after com-plexation of Pb2
2+ obtained by both methods of population analy-sis. The analysis of these results revealed that both lead ionsaccept electron density from the ligand molecules which can bean indirect indication of localization of the Pb electrons withinthe dilead moiety and bonding with the ligand through electrondonation from the neighboring atoms of Rd. NPA and GAPT showeda decrease of electron density in the exocyclic S atom suggestinginteraction with the metal ion, whereas outflow of negative chargeinto the N atom is surprisingly predicted by GAPT only. The NPAmethod showed that the largest depletion of negative charge fol-lows mainly from both sulfur atoms into direction of the Pb andN atoms. While, according to the GAPT approach, donors of elec-
tron density are, in succession, the O, N, the exo-, and endocyclicS atoms. Then, this negative charge is accumulated mainly on theC atoms attached to N atom and the dilead species. Keeping inmind that the NBO bond orders shown above suggested the lowelectron density within the Pb–N and Pb–S bonds, it seems thatthe GAPT computation only confirms this observation. However,various studies of the partial charges in simple molecules [64and references therein] showed that there is no single computa-tional procedure can be regarded as completely reliable. Neverthe-less, the calculated values may still be useful in investigationsconcerning interatomic interactions and chemical reactivity.
3.3. Vibrational analysis
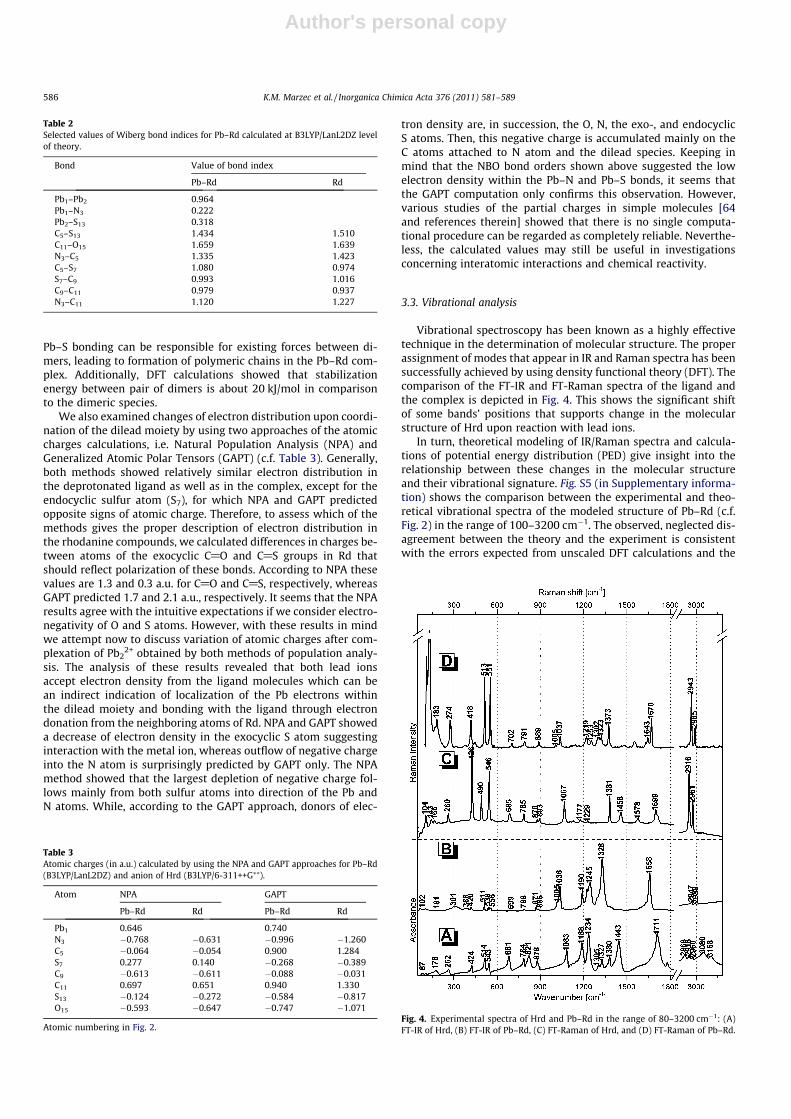
Vibrational spectroscopy has been known as a highly effectivetechnique in the determination of molecular structure. The properassignment of modes that appear in IR and Raman spectra has beensuccessfully achieved by using density functional theory (DFT). Thecomparison of the FT-IR and FT-Raman spectra of the ligand andthe complex is depicted in Fig. 4. This shows the significant shiftof some bands’ positions that supports change in the molecularstructure of Hrd upon reaction with lead ions.
In turn, theoretical modeling of IR/Raman spectra and calcula-tions of potential energy distribution (PED) give insight into therelationship between these changes in the molecular structureand their vibrational signature. Fig. S5 (in Supplementary informa-tion) shows the comparison between the experimental and theo-retical vibrational spectra of the modeled structure of Pb–Rd (c.f.Fig. 2) in the range of 100–3200 cm�1. The observed, neglected dis-agreement between the theory and the experiment is consistentwith the errors expected from unscaled DFT calculations and the
Table 2Selected values of Wiberg bond indices for Pb–Rd calculated at B3LYP/LanL2DZ levelof theory.
Bond Value of bond index
Pb–Rd Rd
Pb1–Pb2 0.964Pb1–N3 0.222Pb2–S13 0.318C5–S13 1.434 1.510C11–O15 1.659 1.639N3–C5 1.335 1.423C5–S7 1.080 0.974S7–C9 0.993 1.016C9–C11 0.979 0.937N3–C11 1.120 1.227
Table 3Atomic charges (in a.u.) calculated by using the NPA and GAPT approaches for Pb–Rd(B3LYP/LanL2DZ) and anion of Hrd (B3LYP/6-311++G⁄⁄).
Atom NPA GAPT
Pb–Rd Rd Pb–Rd Rd
Pb1 0.646 0.740N3 �0.768 �0.631 �0.996 �1.260C5 �0.064 �0.054 0.900 1.284S7 0.277 0.140 �0.268 �0.389C9 �0.613 �0.611 �0.088 �0.031C11 0.697 0.651 0.940 1.330S13 �0.124 �0.272 �0.584 �0.817O15 �0.593 �0.647 �0.747 �1.071
Atomic numbering in Fig. 2.Fig. 4. Experimental spectra of Hrd and Pb–Rd in the range of 80–3200 cm�1: (A)FT-IR of Hrd, (B) FT-IR of Pb–Rd, (C) FT-Raman of Hrd, and (D) FT-Raman of Pb–Rd.
586 K.M. Marzec et al. / Inorganica Chimica Acta 376 (2011) 581–589

Author's personal copy
neglect of anharmonicity, and also due to differences between thepowder molecular structure and the applied model. Despite this, itcan be seen that there is a general agreement regarding bandintensities, as well as their wavenumbers, between the experimen-tal and calculated spectra. The detailed assignment of the experi-mental bands with PED of modes for the model is collected inTable 4. Definitions of the internal coordinations are given in TableS1 in Supplementary information.
The IR and Raman spectra of Hrd (Fig. 4A and C) exhibit bandsoriginating from the vibrations of the NH group [x(NH)(821 cm�1, IR), q(NH) (1443/1458 cm�1, IR/Raman), m(NH) (3168,3080 cm�1, IR)] that disappear in the spectra of the complex(Fig. 4B and D). This indicates deprotonation of the imino groupwhich is consistent with the structure found in the solid state.The removal of the imino-hydrogen can result in formation of atautomeric form of the ligand different than the energetically pre-ferred keto-thione found for the sole Hrd [10]. However, the vibra-tional spectra of Pb–Rd exclude this transformation. There are nocharacteristic bands that can be attributed to modes of the enol[e.g. m(OH) in 3400–3600 cm�1 in IR] and thiol groups [e.g. m(SH)in 2500–2600 cm�1 in Raman]. Furthermore, this is also confirmedby the presence of the two intensive Raman bands in the high-wavenumber region above 2900 cm�1 that are assigned to thestretching modes of the methylene not methylidyne group. In turn,
the presence of these bands as well as the absence of the stretchingmode of the C@C bond also exclude formation of polyrhodaninedue to coordination of metal ions as is suggested in the literature[65]. The lack of IR bands in the region above 3200 cm�1 indicatesthe absence of OH groups that can originate from hydroxide ions.The presence of acetate ions is also excluded, because IR spectrumdoes not exhibit the most pronounced absorption of CH3COO� inthe region of 1520–1580 cm�1. Moreover, the observed bands inboth vibrational spectra result from shifting bands of Hrd due tocoordination rather than from the presence of new species formedduring synthesis.
One can also notice (c.f. Table 4) that some equivalent bands inIR and Raman exhibit different wavenumbers which might suggestC2h point symmetry. However, the structure model obtained fromX-ray powder diffraction data does not reveal it, whereas optimiza-tion of such a structure in the DFT calculations failed. Therefore, weassumed that the molecular symmetry is similar to the one withthe center of inversion, and hence the separated in and out-of-phase modes are observed in Raman and IR spectra, respectively.Among many bands observed in the spectra, we focus only onthose that can be correlated with the coordination site, thoughthe changes in the structural geometry of such a small moleculecause shifts of almost all bands comparing spectra of Hrd andPb–Rd. One of these wavenumbers changes concerns the stretching
Table 4The harmonic wavenumbers (wav., in cm�1) with IR (IIR, in km/mol) and Raman (IRS, in relative units) intensities and potential energy distribution (PED, % higher than 10%)calculated for the model structure of Pb–Rd, and experimental IR and Raman wavenumbers (IR, RS, in cm�1).
IR RS B3LYP/LanL2DZ
Wav. IIR IRS PED
102vw 110vs 102 1.8 230.1 �mN3Pb1(16), mN4Pb2(16), bPb2Pb1(11), bPb1Pb2(11)125vw 128 21.5 27.4 2s1/R5(32), 1s1/R5(32), 2s2/R5(12), 1s2/R5(12)
129vs 130 12.6 73.8 1s1/R5(34), 2s1/R5(34), 1s2/R5(12), 2s2/R5(12)154vw 154w,sh 143 65.8 48.2 mN3Pb1(34), mN4Pb2(34)
146 6.9 315.9 �mN4Pb2(35), mN3Pb1(35)181vw 189 0.8 3.3 xN3Pb1(17), xN4Pb2(17), 2s2/R5(14), 1s2/R5(14), bPb1Pb2(11), bPb2Pb1(11)
183m 198 0.2 69.2 �xN4Pb2(17), xN3Pb1(17), 1s2/R5(12), 2s2/R5(12), �bPb2Pb1(11), bPb1Pb2(11)301w,br 274m 262 0.9 516.8 qC5S13(33), qC6S14(33)
268 4.3 26.7 �qC6S14(32), qC5S13(32)420w 418m 387 1.1 86.0 mS14Pb1(13), mS13Pb2(13)
390 11.8 54.4 �mS13Pb2(12), mS14Pb1(12)511m 513s 489 31.6 68.9 qC11O15(12), qC12O16(12)
489 5.3 624.2 �qC12O16(12), qC11O15(12)556w 551s 527 3.6 276.6 2b2/R5(21), 1b2/R5(21)
528 13.0 50.5 �1b2/R5(19), 2b2/R5(19)702w 663 0.0 160.1 mS8C6(20), mS7C5(20)
665 19.5 23.8 �mS7C5(20), mS8C6(20)788w 791w 742 3.4 69.5 mC9S7(28), mC10S8(28), 2b1/R5(10), 1b1/R5(10)
743 15.2 41.2 �mC10S8(28), mC9S7(28), 1b1/R5(10), 2b1/R5(10)871m 889w 884 1.4 33.1 mC11C9(23), mC12C10(23)
884 8.4 41.7 �mC12C10(23), mC11C9(23)1005m,sh
1036s1005vw1037m
979 544.0 30.1 mS13C5(20), mS14C6(20), 2b1/R5(16), 1b1/R5(16)983 14.0 65.2 �mS14C6(21), mS13C5(21), 1b1/R5(16), 2b1/R5(16)
1144w 1144 0.1 21.5 �sC9H17H18(43), sC10H20H19(43)1190s 1223s,sh 1219m 1211 609.1 20.3 mC11N3(21), mC12N4(21), mC11C9(13), mC12C10(13)
1213 68.7 95.5 �mC12N4(21), mC11N3(21), �mC12C10(13), mC11C9(13)1245s 1253w 1264 12.1 125.7 xC10H20H19(42), xC9H17H18(42)
1264 22.0 0.2 �xC9H17H18(43), xC10H20H19(43)1300m,sh 1328vs 1302m
1323m1354 275.5 61.1 mC6N4(37), mC5N3(37)1367 341.4 165.5 �mC5N3(37), mC6N4(37)
1373m 1467 0.9 142.4 dC10H20H19(49), dC9H17H18(49)1467 26.7 55.8 �dC9H17H18(49), dC10H20H19(49)
1658vs 1670m 1641 129.5 354.9 mO15C11(40), mO16C12(40)1642 211.0 84.2 �mO16C12(40), mO15C11(40)
2947w 2943vs 3114 3.9 294.4 ms,C9H17 + ms,C9H18(50), ms,C10H19 + ms,C10H20(50)3114 4.2 33.8 �(ms,C9H17 + ms,C9H18)(50), ms,C10H19 + ms,C10H20(50)
2988w 2985s 3189 0.3 35.5 mas,C9H17 + ms,C9H18(50), mas,C10H19 + ms,C10H20(50)3189 0.1 79.0 �(mas,C9H17 + ms,C9H18)(50), mas,C10H19 + ms,C10H20(50)
See the atomic numbering in Fig. 2.m – Stretching, d – scissoring, q – rocking, x – wagging, b – in-plane bending, s – out-of-plane bending, R5 – 5-membered ring, s – symmetric, as – asymmetric, ‘‘+’’ – in-plane-phase vibration; ‘‘–’’ – out-of-phase vibration; vs – very strong, s – strong, m – medium, w – weak, vw – very weak, br – broad, sh – shoulder.
K.M. Marzec et al. / Inorganica Chimica Acta 376 (2011) 581–589 587

Author's personal copy
mode of the C@O group that is red-shifted by 29 cm�1 in Ramanand 53 cm�1 in IR (the differences in the values of shifts in IRand Raman result also from reflection of the centrosymmetricstructure of Hrd in its IR and Raman spectra). Generally, it has beenobserved up to now [10,11,18,47] that due to reaction with metalions this mode of the non-bonded carbonyl group can be shifted by10–30 cm�1, while the direct coordination of the metal ion by theoxygen atom causes a shift of 70–100 cm�1. However, the changeof wavenumber of m(C@O) observed here suggests that eventhough this external group is not involved in bonding with metalion, it can be disturbed by the elongation of the C@O bond and alsoby the interdimeric interactions. The band attributed to m(C@S)(40% PED) appears at 1035 cm�1 in both spectra of Pb–Rd and isshifted to lower wavenumbers by 47 (IR) and 32 cm�1 (Raman)in keeping with the role of the S as donor atom, while the stretch-ing mode of the endocyclic C–S bond is observed at 681 and ca.700 cm�1 in the IR spectra of Hrd and Pb–Rd, respectively. Thisred shift of m(C@S) is consistent with the lengthening of the C@Sbond due to coordination.
The most pronounced IR band originating from the isolated m(C–N–C) mode (1328 cm�1, PED: 74%) is practically unaltered by thedeprotonation and coordination processes, although its intensityincreases significantly in comparison with IR of Hrd. This has alsobeen observed for a thallium complex of a rhodanine derivativewith similar coordination fashion [18], but on the contrary to thecomplex of Rd with Ag(I) [10]. In the last case, this mode shiftsup to 1378 cm�1 in the IR spectrum of Ag–Rd. However, this differ-ence collaborates with a change of the C–N bonds’ lengths by 0.09and 0.01 Å in Ag–Rd and Pb–Rd, respectively. The significant mod-ification of the ligand structure after coordination of Ag+ results inthe bigger shifts of the vibrational modes in respect to Pb–Rd.
The low-frequency region of the vibrational spectra, between150 and 450 cm�1, is usually of a particular interest due to thepresence of the metal–ligand bands. Our PED analysis revealed thata band at 154 cm�1 (IR, vw; Raman, s) can be assigned to m(Pb–N)(PED: 70%), while the bending mode of this bond (x(Pb–N), PED:34% PED) contributes to the strong Raman band at 183 cm�1. Onthe other hand, the Pb–S stretching vibration with the relativelylow contribution of 26% appears as weak IR and medium Ramanbands at ca. 418 cm�1. Unfortunately, DFT modeling showed thatthe stretching mode of the Pb–Pb bond should appear below80 cm�1, thus beyond the range of the experimental spectra col-lected here.
4. Conclusion
The N,S,O-heterocyclic compound studied here exhibits coordi-nation of lead ions through N and S atoms that is the most commonconfiguration among complexes with this metal ion. Interestingly,the reaction between Pb2+ and Rd causes a reduction of the oxida-tion state of the metal, and consequently the formation of the rareunit of Pb2
2+ chelated by two anions of rhodanine. Elemental anal-ysis, AAS, and MS clearly indicate M:L = 1:1, while powder diffrac-tion and IR/Raman spectra exclude the presence of an additionalanion except L�. Thus, this indirectly suggests a change of oxida-tion state of lead ions. Furthermore, support for metal–metal inter-action in our compound comes from the molecular orbitalcalculation of the dimeric species that suggested the presence ofthe typical r bond formed by the two p electrons. The locationof the lone pairs of lead atoms is likely responsible for planarityof the dimeric species. In our case, this lone pair is directed towardneither atoms of Rd nor an axial position but it is placed in theequatorial plane. This result is a compromise between an efficientuse of space in the solid space packing and the proposed activity ofthe lead lone pairs.
In addition, the tentative examination of the vibrational spectraclearly shows the most pronounced structural features of the com-plex, i.e. deprotonation of the ligand and coordination through theN and S atoms. However, it is misleading as it suggests involve-ment of the carboxyl group in chelation of the Pb ion. Therefore,this analysis must be supported by the quantum chemical model-ing of IR and Raman that undoubtedly predicts shifts of the bandsupon complexation.
On the other hand, the comparison of molecular structures ofthe rhodanine complexes with Ag+ [10] and Pb2
2+ suggests that thisligand is involved mainly in coordination through the S and depro-tonated N atoms. However, the chemical nature of the metal atomstrongly affects the arrangement of the ligand around the metal,and then the crystal packing. Ag–Rd forms a polymeric chain struc-ture twisted in a helical design without contact between the ligandmolecules, while two dimers of Pb–Rd are stacked and separatedby a distance of only 3.2 Å.
Acknowledgments
This work was supported by The European Union from the re-sources of the European Regional Development Fund under theInnovative Economy Programme (Grant coordinated by JCET-UJ,No. POIG.01.01.02-00-069/09). The authors thank the AcademicComputer Center Cyfronet in Krakow (Poland) for granted com-puter time.
Appendix A. Supplementary material
CCDC 802067 contains the supplementary crystallographic datafor the crystal structure of the lead complex of Rd. These data canbe obtained free of charge from The Cambridge CrystallographicData Centre via www.ccdc.cam.ac.uk/data_request/cif. Supplemen-tary data associated with this article can be found, in the onlineversion, at doi:10.1016/j.ica.2011.07.030.
References
[1] H. Sigel, B.E. Fischer, E. Farkas, Inorg. Chem. 22 (1983) 925.[2] K. Abu-Dari, F.E. Hahn, K.N. Raymond, J. Am. Chem. Soc. 112 (1990) 1519.[3] C.S. Fullmer, Environ. Res. 54 (1991) 159.[4] L. Shimoni-Livny, J.P. Glusker, C.W. Bock, Inorg. Chem. 37 (1998) 1853.[5] C.G. Bonde, N.J. Gaikwad, Bioorg. Med. Chem. 12 (2004) 2151.[6] M.G. Orchard, J.C. Neuss, C.M.S. Galley, A. Carr, D.W. Porter, P. Smith, D.I.C.
Scopes, D. Haydon, K. Vousden, C.R. Stubberfield, K. Young, M. Page, Bioorg.Med. Chem. Lett. 14 (2004) 3975.
[7] P. Liu, Q.S. Pu, Q.Y. Sun, Z.X. Su, J. Anal. Chem. 366 (2000) 816.[8] D.W. Fuerstenau, R. Herrera-Urbina, D.W. McGlashan, Int. J. Miner. Process. 58
(2000) 15.[9] N. Pourreza, S. Rastegarzadeh, Talanta 62 (2004) 87.
[10] K.M. Marzec, B. Gaweł, W. Lasocha, L.M. Proniewicz, K. Malek, J. RamanSpectrosc. 41 (2010) 543.
[11] J.S. Casas, E.E. Castellano, A. Macias, N. Playá, A. Sánchez, J. Sordo, J.M. Varela,E.M. Vázquez-López, Polyhedron 20 (2001) 1845.
[12] M.V. Castaño, H. Calvo, A. Sánchez, J.S. Casas, J. Sordo, Y.P. Mascarenhas, C. deO.P. Santos, J. Organomet. Chem. 417 (1991) 327.
[13] J.M. Varela, A. Macías, J.S. Casas, J. Sordo, J. Organomet. Chem. 450 (1993) 41.[14] M. Kubiak, T. Głowiak, Acta Crystallogr., Sect. B 38 (1982) 2031.[15] M. Kubiak, T. Głowiak, Acta Crystallogr., Sect. C 41 (1985) 1580.[16] M. Kubiak, T. Głowiak, Acta Crystallogr., Sect. C 43 (1987) 641.[17] E. Tang, G. Yang, J. Yin, Spectrochim. Acta, Part A 59 (2003) 651.[18] J.C. Casas, E.E. Castellano, A. Macfas, N. Playá, A. Sánchez, J. Sordo, J.M. Varela, J.
Zukerman-Schpector, Inorg. Chim. Acta 238 (1995) 129.[19] E.S. Raper, Coor. Chem. Rev. 6 (1985) 165.[20] M.C. van Severen, J.P. Piquemal, O. Parisel, Chem. Phys. Lett. 478 (2009) 17.[21] A. Walsh, G. Watson, J. Solid State Chem. 178 (2005) 1422.[22] L.A. Bengtsson, R. Hoffman, J. Am. Chem. Soc. 115 (1993) 2666.[23] D. Michael, P. Mingos, J. Organomet. Chem. 689 (2004) 4420.[24] L. Pu, B. Twamly, P.P. Power, J. Am. Soc. 122 (2000) 3524.[25] A. Winkler, W. Bauer, F.W. Heinemann, V. Garcia-Montalvo, M. Moll, J.
Ellermann, Eur. J. Inorg. Chem. 4 (1998) 437.[26] P.P. Power, J. Chem. Soc., Dalton Trans. (1998) 2939.[27] W. Lasocha, K. Lewinski, J. Appl. Crystallogr. 27 (1994) 437.[28] V. Favre-Nicolin, R. Cerny, J. Appl. Crystallogr. 35 (2002) 734.
588 K.M. Marzec et al. / Inorganica Chimica Acta 376 (2011) 581–589

Author's personal copy
[29] V. Petricek, M. Dusek, L. Palatinus, Jana2000, The Crystallographic ComputingSystem, Institute of Physics, Praha, 2000.
[30] L. Hao, R.J. Lachicotte, H.J. Gysling, R. Eisenberg, Inorg. Chem. 38 (1999) 4616.[31] GAUSSIAN 03, Revision C.02, M.J. Frisch, G.W. Trucks, H.B. Schlegel, G.E. Scuseria,
M.A. Robb, J.R. Cheeseman, J.A. Montgomery Jr., T. Vreven, K.N. Kudin, J.C.Burant, J.M. Millam, S.S. Iyengar, J. Tomasi, V. Barone, B. Mennucci, M. Cossi, G.Scalmani, N. Rega, G.A. Petersson, H. Nakatsuji, M. Hada, M. Ehara, K. Toyota, R.Fukuda, J. Hasegawa, M. Ishida, T. Nakajima, Y. Honda, O. Kitao, H. Nakai, M.Klene, X. Li, J.E. Knox, H.P. Hratchian, J.B. Cross, V. Bakken, C. Adamo, J.Jaramillo, R. Gomperts, R.E. Stratmann, O. Yazyev, A.J. Austin, R. Cammi, C.Pomelli, J.W. Ochterski, P.Y. Ayala, K. Morokuma, G.A. Voth, P. Salvador, J.J.Dannenberg, V.G. Zakrzewski, S. Dapprich, A.D. Daniels, M.C. Strain, O. Farkas,D.K. Malick, A.D. Rabuck, K. Raghavachari, J.B. Foresman, J.V. Ortiz, Q. Cui, A.G.Baboul, S. Clifford, J. Cioslowski, B.B. Stefanov, G. Liu, A. Liashenko, P. Piskorz, I.Komaromi, R.L. Martin, D.J. Fox, T. Keith, M.A. Al-Laham, C.Y. Peng, A.Nanayakkara, M. Challacombe, P.M.W. Gill, B. Johnson, W. Chen, M.W. Wong,C. Gonzalez, J.A. Pople, GAUSSIAN, Inc., Wallingford CT, 2004.
[32] P.J. Hay, W.R. Wadt, J. Chem. Phys. 82 (1985) 299.[33] C. Lee, W. Yang, R.G. Parr, Phys. Rev. B37 (1988) 785.[34] A.D. Becke, J. Chem. Phys. 98 (1993) 5648.[35] D. Michalska, R. Wysokinski, Chem. Phys. Lett. 403 (2005) 211.[36] G. Fogarasi, X. Zhou, P.W. Taylor, P. Pulay, J. Am. Chem. Soc. 114 (1992) 8191.[37] J.M.L. Martin, C. Van Alsenoy, Gar2ped, University of Antwerp, 1995.[38] J. Cioslowski, J. Am. Chem. Soc. 111 (1989) 8333.[39] J.P. Foster, F. Weinhold, J. Am. Chem. Soc. 102 (1980) 7211.[40] E.D. Glendening, A.E. Reed, J.E. Carpenter, F. Weinhold, NBO Version 3.1[41] R.F.W. Bader, Atoms in Molecules: A Quantum Theory, Clarendon Press,
Oxford, 1990.[42] F.W. Biegler-König, R.F.W. Bader, T.H. Tang, J. Comput. Chem. 3 (1982)
317.[43] G.J.M. Van der Kerk, Ind. Eng. Chem. 58 (1966) 29.
[44] L. Murruni, F. Conde, G. Leyva, M.I. Litter, Appl. Catal. B: Environ. 84 (2008)563.
[45] A.R. Roy, B.C. Singh, P.L. Nayak, M.K. Rout, J. Inorg. Nucl. Chem. 40 (4) (1978)749.
[46] S. Pattnaik, B.C. Singh, P.L. Nayak, Proc. Indian Acad. Sci. 81A (1) (1975) 15.[47] V.V. Budanov, Russ. J. Coord. Chem. 28 (2002) 294.[48] J.S. Casas, E.E. Castellano, J. Ellena, M.S. Garcia-Tansende, A. Sanchez, J. Sordo,
A. Tauceda, A.V. Rodriguez, Polyhedron 26 (2007) 4228.[49] V. Lozan, B. Kersting, Eur. J. Inorg. Chem. 3 (2005) 504.[50] P.K. Bharadwaj, B.W. Arbuckle, W.K. Musker, Inorg. Chim. Acta 142 (1988)
243.[51] M.-L. Chan, M. Rossi, Inorg. Chem. 36 (1997) 3609.[52] G. Trinquier, R. Hoffman, J. Phys. Chem. 88 (1984) 6696.[53] K. Klinkhammer, Polyhedron 21 (2001) 587.[54] K.W. Klinkhammer, T.F. Fässler, H. Grützmacher, Angew. Chem., Int. Ed. 37
(1998) 124.[55] S. Hino, M. Olmstead, A.D. Phillips, R.J. Wright, P.P. Power, Inorg. Chem. 43
(2004) 7346.[56] M. Stürmann, W. Saak, H. Marsmann, M. Weidenbruch, Angew. Chem., Int. Ed.
38 (1999) 187.[57] L. Pu, B. Twamly, P.P. Power, J. Am. Chem. Soc. 122 (2000) 3524.[58] C. Belin, M. Tillard-Charbonnel, Coord. Chem. Rev. 178 (1998) 529.[59] F. Caruso, M.-L. Chan, M. Rossi, Inorg. Chem. 36 (1997) 3609.[60] D. Van der Helm, A.E. Lessor, L.L. Merritt, Acta Crystallogr. 15 (1962) 1227.[61] K. Malek, M. Vala, J. Swiatek-Kozlowska, L.M. Proniewicz, New J. Chem. 28
(2004) 477.[62] R. Ponec, G. Lendvay, M.R. Sundberg, J. Phys. Chem. A 112 (2008) 9936.[63] K.A. Wiberg, Tetrahedron 24 (1968) 1083.[64] F. Martin, H. Zipse, J. Comput. Chem. 26 (2005) 97.[65] H. Kong, J. Jang, Biomacromolecules 9 (2008) 2677.
K.M. Marzec et al. / Inorganica Chimica Acta 376 (2011) 581–589 589