Inner City Food Deserts: Case Study of Lynchburg, Virginia
24
INNER CITY FOOD DESERTS: CASE STUDY OF LYNCHBURG, VA Virginia Economic Journal, Volume 16, 2011, pp. 41-64. John Abell, Lucas Brady, Isabelle Dom, Ludovic Lemaitre, Mareeha Niaz, Louise Searle, and Reid Winkler Randolph College Lynchburg, Virginia [email protected] INTRODUCTION “Food deserts” are found in inner-city areas where residents, typically of a lower socioeconomic status, have limited access to affordable, healthy food. Among the consequences of living in a food desert are poor nutrition, diabetes, and obesity. One typically associates food deserts with major cities, yet the downtown of Lynchburg, Virginia, a city of only 74,000 people, appears to share many of the same characteristics. This research is a test of the hypothesis that downtown Lynchburg is a food desert and, as well, a pharmaceutical desert. Researchers examined bus routes available from downtown neighborhoods to grocery stores and pharmacies as well as demographic information on downtown Lynchburg. Price and availability data were then hand- collected by the researchers from food stores available to downtown residents (all convenience stores) and compared to data collected from area grocery stores. Our results suggest that downtown Lynchburg is indeed a food and pharmaceutical desert. Recommendations based on our findings: Lynchburg would benefit from a community-friendly grocery store and an expanded (four seasons) farmers market. This project is the result of a Spring 2011 class assignment in The Economics of Food and Sustainability course at Randolph College, Lynchburg, VA. BACKGROUND AND DESCRIPTION OF THE PROJECT Lynchburg, situated in central Virginia, was once the home of a vibrant downtown, teeming with activity. A perusal of past city directories reveals a community alive with numerous shops, restaurants, wholesale food markets, grocery stores 1 , and pharmacies all centrally located in the vicinity of Main Street. For decades, though, beginning in the early 1960s, there was a steady exodus to the suburbs, slowly stripping the city of much of its hustle and bustle. The inhabitants of neighborhoods in and around the downtown area for years lived in a place mostly void of the walking-distance convenience once typical of cities. In recent years, though, there have been numerous signs of life, with a handful of locally-owned restaurants opening up, conversions of old warehouses into loft apartments, and a recognition that the city’s long-standing farmer’s market is 1 We use the designations supermarket and grocery store interchangeably in this analysis.
-
Upload
randolphcollege -
Category
Documents
-
view
3 -
download
0
Transcript of Inner City Food Deserts: Case Study of Lynchburg, Virginia

INNER CITY FOOD DESERTS: CASE STUDY OF LYNCHBURG, VA
Virginia Economic Journal, Volume 16, 2011, pp. 41-64.
John Abell, Lucas Brady, Isabelle Dom, Ludovic Lemaitre,
Mareeha Niaz, Louise Searle, and Reid Winkler
Randolph College
Lynchburg, Virginia
INTRODUCTION
“Food deserts” are found in inner-city areas where residents, typically of a lower
socioeconomic status, have limited access to affordable, healthy food. Among the consequences
of living in a food desert are poor nutrition, diabetes, and obesity. One typically associates food
deserts with major cities, yet the downtown of Lynchburg, Virginia, a city of only 74,000 people,
appears to share many of the same characteristics. This research is a test of the hypothesis that
downtown Lynchburg is a food desert and, as well, a pharmaceutical desert. Researchers examined
bus routes available from downtown neighborhoods to grocery stores and pharmacies as well as
demographic information on downtown Lynchburg. Price and availability data were then hand-
collected by the researchers from food stores available to downtown residents (all convenience
stores) and compared to data collected from area grocery stores. Our results suggest that
downtown Lynchburg is indeed a food and pharmaceutical desert. Recommendations based on our
findings: Lynchburg would benefit from a community-friendly grocery store and an expanded
(four seasons) farmers market. This project is the result of a Spring 2011 class assignment in The
Economics of Food and Sustainability course at Randolph College, Lynchburg, VA.
BACKGROUND AND DESCRIPTION OF THE PROJECT
Lynchburg, situated in central Virginia, was once the home of a vibrant downtown,
teeming with activity. A perusal of past city directories reveals a community alive with numerous
shops, restaurants, wholesale food markets, grocery stores1, and pharmacies all centrally located in
the vicinity of Main Street. For decades, though, beginning in the early 1960s, there was a steady
exodus to the suburbs, slowly stripping the city of much of its hustle and bustle. The inhabitants of
neighborhoods in and around the downtown area for years lived in a place mostly void of the
walking-distance convenience once typical of cities. In recent years, though, there have been
numerous signs of life, with a handful of locally-owned restaurants opening up, conversions of old
warehouses into loft apartments, and a recognition that the city’s long-standing farmer’s market is
1 We use the designations supermarket and grocery store interchangeably in this analysis.

Abell, Brady, Dom, Lemaitre, Niaz, Searle, and Winkler 42
a source of civic pride and an engine of economic growth and development, luring suburbanites
back into the city center. Grocery stores and pharmacies, unfortunately, have not participated in
this trend.
According to the USDA Economic Research Service there is a tendency in many poor
central cities for there to be low access to “reasonably priced, high quality food” (Kantor 2001). A
study by the University of Connecticut Food Marketing Policy Center found 30 percent fewer
supermarkets in poor areas than in affluent ones (Prevention Institute). Cities finding themselves
in such circumstances are often referred to in the literature as having food deserts (Cook 2006,
Winne 2008). Such findings provided the motivation for our Randolph College economics course,
The Economics of Food and Sustainability, to focus our classroom conversations on the broad
topic of food availability and vulnerability (as well as pharmaceutical availability), and whether
such problems that one normally associates with major cities were also problems for our own city
of Lynchburg. The analysis that follows is the result of a semester-long course project whereby we
tested the hypothesis that Lynchburg is a food and pharmaceutical desert.
As will be discussed in detail later, Lynchburg seems to share many of the same
demographic characteristics of major cities that have food deserts. It has relatively high rates of
poverty, unemployment, and obesity. Hunger also appears to be a problem. At the national level
hunger reached a 14-year high in 2009, with approximately 35 million US households not having
secure access to food. By spring 2011, the number of Americans relying on food stamps had
grown to 45.8 million, an increase of 70 percent in just four years (DeParle, September 16, 2009,
Stuart 2009, p. xix, Geewax, August 28, 2011). In the Lynchburg region a new hunger-fighting
group, BackPacks for Kids’ Sake, has estimated that every weekend 18,000 children will not have
enough food to eat (Trent, December 3, 2010).
While our primary focus was on the food desert of inner city Lynchburg, we were also
concerned with inner city access to pharmacy services. Interestingly, very little is said in the
literature about the lack of pharmaceutical access in inner cities. A Google search of the
expression “pharmacy desert” yields not a single result (other than ads for individual pharmacies).
On the contrary, there is some evidence that where a food desert exists, pharmacies are attempting
to fill the gap by adding food selections to their shelves (PCAN, 2011). In Lynchburg, however,
the last downtown pharmacy closed in 2008, so this stop-gap measure is not an option. While it is
beyond the scope of our research design to assess pharmacy pricing, we do provide findings for
over-the-counter medicines and health supplies for both convenience stores and grocery stores.
The methodology for this study was atypical for the field of economics: our class
conducted a number of field visits to inner city convenience stores and the grocery stores closest to
the downtown area to collect data directly on items like food prices and shelf allocation
percentages. The report covers the following: the concept of food deserts, Lynchburg history and
demographics, methodology, results, conclusion, suggestions, and policy implications.
FOOD DESERT
For the purpose of this paper, the term “food desert” is denoted by a specific set of
societal characteristics. The 2008 U.S. Farm Bill, which was passed by the United States Congress
on June 18, 2008, defines a food desert as “an area in the United States with limited access to
affordable and nutritious food, particularly such an area composed of predominately lower-income
neighborhoods and communities” (110th Congress, 2008, p. 1031). This paper identifies food
deserts as an expanded version of the above definition. Specifically, a food desert exists in an
urban area where residents receive lower incomes, encounter restricted access to affordable and
nutritious food, and typically do not own a vehicle or face difficulties in attaining transportation.
Apparently, this problem is widespread. According to a 2009 Department of Agriculture report,

Inner City Food Deserts: Case Study of Lynchburg, VA
43
there are 11.5 million Americans living in low-income areas located at least a mile from the
nearest supermarket (Bittman, April 7, 2011). In his book, Closing the Food Gap, author and food
expert Mark Winne (2008) illustrates how food deserts originate.
A food desert emerges when all or nearly all supermarkets within an urban neighborhood
close or relocate as a result of socioeconomic factors. These factors may include urban sprawl or
population shifts to suburban areas and the subsequent business decision made by supermarkets to
follow these potential customers to suburbs (this same phenomenon can apply to drug stores,
resulting in pharmacy deserts). This trend commonly occurs because supermarkets perceive
relatively greater profit margins and higher levels of safety in suburban areas compared to inner
cities. For example, Winne explains that Hartford, Connecticut boasted a total of thirteen chain
supermarkets in 1968; however, following civil unrest in that year, a population migration to
nearby suburban areas transpired and the city was left with six supermarkets in 1979. By 1986,
only two supermarkets remained (Winne, 2008, pp. 86-87). He deduces that the supermarket
managers “followed their more affluent shoppers to the suburbs” where they could benefit from
lower costs and larger, more efficient stores compared to urban locations (Winne, 2008, pp. 87-
88).
Winne also highlights the food desert of the Rochester, New York neighborhood of
Upper Falls in 1990. At that time, it was the third poorest of Rochester’s thirty-five
neighborhoods, half of its residents did not own a car, public transportation was cumbersome, and
multiple store closings left community members with a single small supermarket (Winne, 2008,
pp. 97-98). Understandably, this pattern of supermarket closure and repositioning has not come
without consequences for citizens in these communities. For instance, a 1983 study of forty-four
food stores in Hartford discovered that inner city supermarkets were 14 percent to 37 percent more
expensive than similar suburban supermarkets (Winne, 2008, p. 89).
As Winne notes, low income residents within these urban food deserts are often forced to
either allocate a greater proportion of their income on food or eat less (Winne, 2008, p. 89).
Christopher Cook’s Diet for a Dead Planet provides further evidence that in fact, inner city
residents pay a higher price for their food due to the absence of quality grocery stores. A 1997 by
the USDA suggests that prices in supermarkets are approximately 10 percent lower than those of
convenience stores in rural areas and inner cities where poor populations are highly concentrated
(Cook, 2006, p. 23). Another study (1996) conducted by California Food Policy Advocates
determined that residents in two low-income communities in San Francisco faced 42 percent and
64 percent higher prices respectively for identical food items when shopping at corner stores
compared to discount supermarkets in the surrounding area (Cook, 2006, p. 23).
In order to fill the void left by supermarkets, countless convenience stores and mini-
marts have sprouted up in cities across the nation in the attempt to satisfy the urban demand for
food. Because these stores are significantly smaller in scale compared to supermarkets, they are
unable to utilize economies of scale through bulk purchases of food items from wholesale food
retailers. However, in many cases, these stores are the only option for urban residents who lack
suitable transportation necessary to make food purchases in distant supermarkets. As a result,
these corner markets often operate as “mini-monopolies” in the communities where they are
located. For these convenience stores then, the combination of a lack of economies of scale and
the relative market control that comes with being a local monopoly has the potential to result in
higher retail prices than would otherwise be the case. The expansion of corner markets and similar stores in food deserts has also generated
detrimental health effects within communities across the country. In Hartford in the late 1980s, for example, Winne explains that when supermarkets were replaced by fast food restaurants and corner markets, the city’s residents “went from being underfed to being overfed in a matter of ten years” (Winne, 2008, p. 111).2 He elaborates that while these establishments may have solved the
2 Our analysis does not focus on fast food restaurants in downtown Lynchburg for the

Abell, Brady, Dom, Lemaitre, Niaz, Searle, and Winkler 44
community’s short term problem of procuring an adequate caloric intake, the preponderance of non-nutritious foods in these stores has served to produce more grievous health-related matters such as heart disease, diabetes, and obesity (Winne, 2008, p.111). This dilemma is exceedingly relevant in today’s society given that approximately “61 percent of Americans are obese or overweight” and that the annual medical costs of health issues associated with weight gain in the United States are estimated at “between $98 billion and $117 billion” (Winne, 2008, p. 113). As Cook notes, “not only do the poor pay more at the corner store, they also get less nutrition for their dollar” (Cook, 2006, p. 23).
There are a variety of options communities can pursue in order to address the issues associated with food deserts. For example, community gardens can be utilized in inner city areas to provide residents with an alternative source of food. Winne writes that “in addition to supplying low-income residents with healthier and more nutritious food” community gardens also effectively function by “reducing the amount of vacant and unproductive land, improving the public image of troubled neighborhoods, increasing the amount of neighborhood green space, developing pride and self-sufficiency among inner-city residents who grow their own food, and providing jobs for youths and adults” (Winne, 2008, p. 56). He also recognizes that community gardens have thrived in troubled areas such as Hartford, New Orleans, and Los Angeles (Winne, 2008, pp. 58-66). Similarly, Community Supported Agriculture programs (CSAs) provide consumers the opportunity to invest in and purchase directly from farmers. This can be of benefit to urban areas both because they establish a solid bond between producer and consumer and because they allow farmers to reap greater profits by avoiding middlemen (Winne, 2008, p. 138).
Farmers’ markets are another promising avenue for supplying inner city residents with nutritious foods. This is especially true in instances where city governments support low-income citizens with financial aid such as the Women, Infants and Children (WIC) Farmers’ Market Nutrition Program (FMNP). Cook reveals that since its launch in 1992, the WIC farmers market coupon program has “provided millions of welfare mothers with fresh fruits and vegetables and boosted earnings for thousands of farmers” (Cook, 2006, p. 256). According to the Food & Nutrition Service of the USDA, in fiscal year 2009, 2.2 million WIC participants received FMNP benefits. In 2009, 17,543 farmers, 3,635 farmers' markets and 2,662 roadside stands were authorized to accept FMNP coupons, resulting in over $20 million in revenue to farmers. For 2010, $20 million was appropriated by Congress for the FMNP. Individual states also provide grants to this program, but unfortunately, since 2009, Virginia has not participated in the FMNP (Food & Nutrition Service, WIC).
Winne points out that a similar program for low income seniors, the Seniors Farmers’ Market Nutrition Program (SFMNP), was established toward the end of the Clinton administration (Winne, 2008, p. 155). According to the Food & Nutrition Service of the USDA, in 2009, locally produced fruits, vegetables, honey, and herbs were made available to 809,711 low-income seniors from 18,714 farmers at 3,684 farmers' markets as well as 3,061 roadside stands and 159 CSAs. The program has a budget of $20.6 million. Unlike the FMNP, Virginia does participate in the SFMNP (Food & Nutrition Service, Seniors).
LYNCHBURG First settled in 1757, the “City of Seven Hills” has a 225 year formal history beginning
with a 1786 ordinance allowing John Lynch the right to establish a town named Lynchburg. Four years earlier, in 1783, the community had already established a marketplace on Water Street (now Ninth Street), which has operated continuously ever since. The market, now known as the Community (or Farmers) Market has played an important role in the development of downtown
simple reason that none of the national chains are located there. They are no closer to downtown
than the nearest grocery stores.
Inner City Food Deserts: Case Study of Lynchburg, VA
45
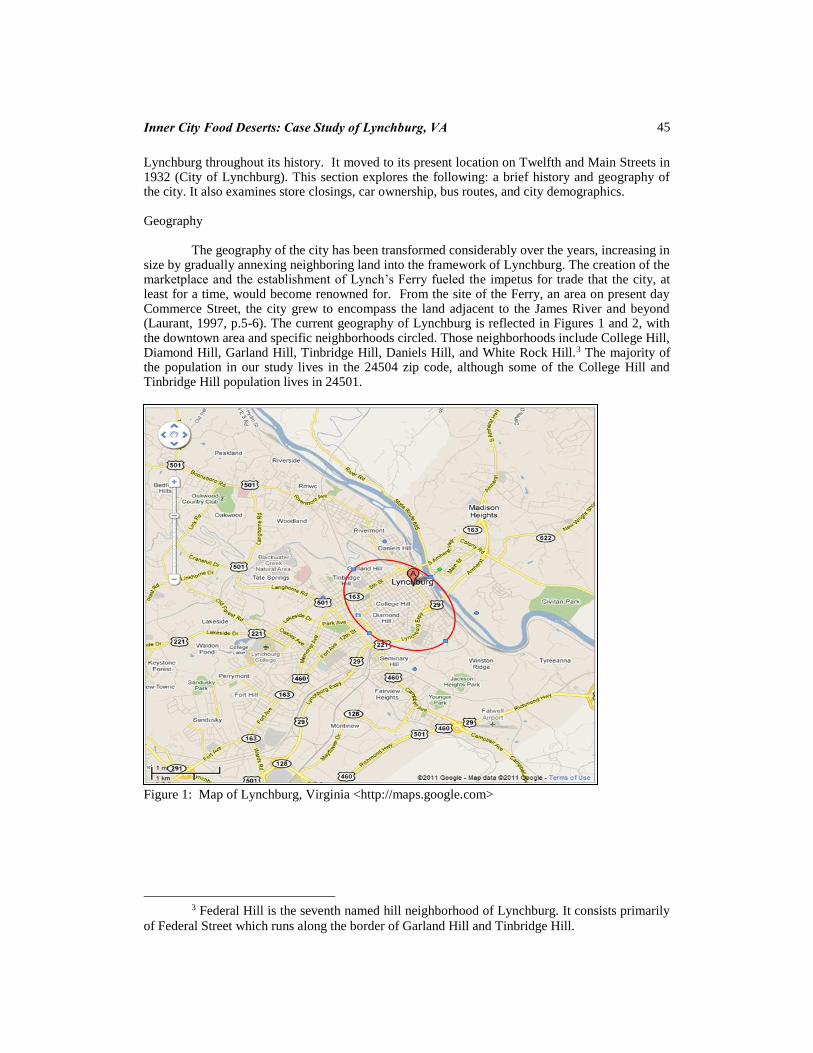
Lynchburg throughout its history. It moved to its present location on Twelfth and Main Streets in 1932 (City of Lynchburg). This section explores the following: a brief history and geography of the city. It also examines store closings, car ownership, bus routes, and city demographics.
Geography
The geography of the city has been transformed considerably over the years, increasing in size by gradually annexing neighboring land into the framework of Lynchburg. The creation of the marketplace and the establishment of Lynch’s Ferry fueled the impetus for trade that the city, at least for a time, would become renowned for. From the site of the Ferry, an area on present day Commerce Street, the city grew to encompass the land adjacent to the James River and beyond (Laurant, 1997, p.5-6). The current geography of Lynchburg is reflected in Figures 1 and 2, with the downtown area and specific neighborhoods circled. Those neighborhoods include College Hill, Diamond Hill, Garland Hill, Tinbridge Hill, Daniels Hill, and White Rock Hill.3 The majority of the population in our study lives in the 24504 zip code, although some of the College Hill and Tinbridge Hill population lives in 24501.
Figure 1: Map of Lynchburg, Virginia <http://maps.google.com>
3 Federal Hill is the seventh named hill neighborhood of Lynchburg. It consists primarily
of Federal Street which runs along the border of Garland Hill and Tinbridge Hill.

Abell, Brady, Dom, Lemaitre, Niaz, Searle, and Winkler 46
Figure 2: Map of Lynchburg, Virginia <http://maps.google.com>
Downtown Lynchburg
As Lynchburg has grown in area and population since its founding, centers of commerce in
the city have also shifted. In the past, Main Street served as the shopping epicenter for Lynchburg,
until several events came together to shift shopping away from the downtown area. Lynchburg
residents followed the national trend of suburbanization by moving away from the congestion of
the city center. This trend was fueled by the 1976 annexation of land that doubled the city’s area
and contributed to the abandonment of downtown as the central city shopping district (Chambers,
1981, p. 474).
The construction of the Lynchburg Expressway circumvented the congested U.S. Highway
29 and in several ways became “the new Main Street of greater Lynchburg” (Chambers, 1981, p.
479). Prior to the 1976 annexation, the development of a new shopping center in 1960, Pittman
Plaza, had already begun to challenge the central, downtown business area and its dominance
(Chambers, 1981, p. 479). This center with its spacious parking and new retail establishments
attracted waves of shoppers from the downtown customer base. The lethal blow, though, to
downtown’s saliency as a shopping center would come with the July 1980 opening of the fifty
million dollar River Ridge Mall (Chambers, 1981, p. 479). The irony is that a majority of the
customers who had so eagerly embraced Pittman’s Plaza now turned to the new mall, despite
renovation and a new name: “The Plaza” (Laurant, 1997, p. 162).
Business follows its market audience. Grocery stores and convenience stores are no
exception to this rule, and those stores that for so long had served the downtown population left
for the suburbs and the hopes of greater profits. Prior to 1961 downtown Lynchburg was served by
three national grocery stores: Anderson Piggly Wiggly (1307 Main Street), Kroger (1112 Main

Inner City Food Deserts: Case Study of Lynchburg, VA
47
Street), and A&P (400 12th Street). They closed in 1966, 1968, and 1973, respectively, leaving the
area with no other grocery stores, and with only convenience stores to fill the gap. A similar trend of closings occurred with pharmacies in the downtown area. The
downtown area has supported as many as four pharmacies over the years. In 1967 the city directory indicated the presence of the following pharmacies: Pattersons (1020 Main Street), Strothers (1117-1125 Jefferson Street), Jackson (821 Main Street), and CVS-Revco (904 main Street). They closed in 1968, 1972, 1992, and 2008 respectively. Currently, no full service pharmacy serves the downtown area. The only nearby access to health-related products lies in the over-the-counter health supply options of convenience stores. Just recently though, a pharmacy associated with The Johnson (community) Health Center on Federal Street has begun offering service to health center clients only, with hopes of expanding its operation in the future (personal communication with Charlotte Lester of Lynchburg Parks and Recreation).
The absence of groceries and pharmacies is apparently a source of frustration for downtown residents according to research conducted by Denise Sewell in 2008. In conversations with College Hill focus groups, Sewell, a Randolph-Macon Woman’s College student conducting senior honors research on neighborhood development, heard over and over again from the citizen groups the expressed need for a neighborhood grocery store. “Many of the respondents feel that a grocery store downtown would be a perfect solution to this problem,” Sewell indicated (2008, p. 39).
The relocation of grocery stores and pharmacies to the suburbs would not necessarily be a critical problem for most downtown residents if they owned a car. For many of the neighborhoods we examined, the nearest grocery store was as close as a mile and a half. Many citizens drive that far or longer on a regular basis for their shopping needs. Without a car though, that relatively short distance can become quite problematic; one is thus dependent upon the mercy of friends or relatives or the public bus system. While the inner city bus routes appear to be laid out such that most residents are never more than a block or two away, even a two block walk with arms full of groceries can be challenging. And in some neighborhoods, such as Daniels Hill and White Rock Hill, where certain sections of the neighborhoods extend well beyond the bus routes, there can be many home locations where the residents face as much as a four tenths of a mile walk to the nearest bus stop (Google Maps). Under such circumstances, the decision making process of when and how often to shop requires great care.
Table I: Lynchburg Car Ownership by Zip Code
* Source: Eddie Wheeler, Commissioner of the Revenue, Lynchburg, VA (455-3870). Data based on personal property taxes as of 2011. ** Source: US Census (American Fact Finder), based on 2000 census. 2010 Census zip code data is not available yet. www.census.gov
Table I presents car ownership in Lynchburg broken down by zip code. As noted, a
significant portion of the downtown area lies in the 24504 zip code. As the table indicates, car
ownership per capita ranges from only 44 percent in the 24504 zip code to 67 percent in the 24503
zip code. Also, it is worth noting that the 24504 zip code encompasses a geographic area larger
than just the downtown area. A mostly rural population (and those more likely to own a car) to the
Zip
code
# of registered personal use
vehicles*
Population (2000 census)**
Percent with
car:
24501 14,611 25,327 58%
24502 18,939 32,656 58%
24503 11,893 17,633 67%
24504 4,275 9,630 44%

Abell, Brady, Dom, Lemaitre, Niaz, Searle, and Winkler 48
south-east of downtown Lynchburg is also within zip code 24504; their inclusion tends to magnify
the car-ownership percentage. If the downtown area could be examined in isolation, it is likely that
car ownership would be even less than the 44 percent reported.
For most downtown residents, the closest grocery shopping is at a collection of three stores
along Memorial Avenue beginning at The Plaza and traveling southwest. Exceptions are the
Daniels Hill and White Rock Hill neighborhoods. The nearest full service pharmacy is on Tate
Springs Road. Distances range from as short as a mile and a half to nearly four miles. The
following analysis compares car vs. bus travel to The Plaza from two different downtown
locations.
Consider the following central downtown location in the College Hill area: 11th Street
between Clay and Madison Streets. By car, the route to The Plaza bus transfer point, where there
is easy access to grocery shopping is nearly two miles and is estimated to take seven minutes (one-
way), plus the cost of gas for the nearly four total miles traveled. The second option would be to
take the Greater Lynchburg Transit Company (GLTC) bus; the bus route is approximately the
same distance and is estimated to take 14 minutes, with up to 21 stops at a cost of $1.50 each way.
It also involves a half block walk to the nearest bus stop. At The Plaza, there is a grocery store
within immediate walking distance from the bus stop. Shopping at the other two nearby grocery
stores would require a bus transfer and a one minute ride, or a ten minute walk. The buses run on
the hour, and thus careful time management is required for each shopping trip.
Not all neighborhoods are equally well served, however. The White Rock Hill
neighborhood, for example, highlights a complicated situation for neighborhood shoppers in that
the nearest grocery store and pharmacy at the intersection of Florida Avenue and Campbell
Avenue are approximately two miles and at most six minutes away by car (depending on one’s
location within the neighborhood), yet city buses do not travel directly there from the northern
sections of White Rock Hill. To take a bus to the Florida Avenue and Campbell Avenue shopping
center would necessitate an unnecessarily long trip of at least 36 minutes, up to 55 stops, and a bus
transfer, each way. The next best solution for most White Rock Hill residents is to take a bus to
the Plaza transfer station. From the intersection of Franklin and Vine Street, located in the heart of
the neighborhood, to The Plaza, the (one-way) bus trip is 14 minutes, with as many as 27 stops
along the way, preceded by a five minute walk (.2 miles) to reach the nearest bus stop. While
better than trying to travel by bus to the Campbell Avenue and Florida Avenue shopping, it is still
a distant second best alternative to being able to drive straight there in a car.
Pharmacy access can be even more difficult for downtown residents. From the same 11th
Street address mentioned earlier, the nearest pharmacy is just over two miles and seven minutes by
car, but by bus it is 28 minutes, including a transfer and as many as 35 stops (Google Maps).
Demographics
Beyond the most obvious of the symptoms of a food desert—lack of access to healthy
and affordable food—there are other insidious characteristics that appear to also fit Lynchburg.
These include poverty, unemployment, hunger, and obesity (Cook 2006, Winne 2008). Census
data bring evidence to bear on the first of these indicators; for 2009 (the most recent data
available) Lynchburg’s poverty rate at 20.7 percent is nearly double that of the state of Virginia,
10.6 percent4 (US Census). American Community Survey census tract data for the city of
Lynchburg suggests that the poverty is not distributed equally. For the four downtown census
tracts (5,6,11,12), the median reported household income (for the period 2005-2009) averaged
only $14,857. For all the other tracts in the city, the median income averaged $42,864. Median
4 Nationally, the poverty rate reached 15.1% in 2010 with 46.2 million people below the
poverty threshold (Tavernise, September 13, 2011).

Inner City Food Deserts: Case Study of Lynchburg, VA
49
household income ranged from only $11,458 in the heart of downtown (Tract 5: Main, Church,
Court, Clay Streets) to $76,855 in the suburban Boonsboro area (Tract 1) (US Census). Some of
that poverty may also be connected to a city unemployment rate that, by current national standards
appears quite good, but, at 6.8 percent (July 2011) is well above the state average of 6.1 percent
(July 2011), and well above its own average of 4.2 percent for the seven years prior to the start of
the recession in 2008 (US Labor Department).
As noted earlier, food insecurity is on the rise in the US with 45.8 million Americans
relying on food stamps (in May 2011). This is nearly 15 percent of the population and represents a
two year increase of 34 percent (Ellis, August 4, 2011). One tends to think of other locations, like
the Mississippi Delta or inner city Detroit, as places of hunger, but stories seem to abound of
hunger here in the Lynchburg area. In addition to the BackPacks for Kids’ Sake study of
childhood hunger mentioned earlier, according to the Blue Ridge Area Food Bank, hunger strikes
one in ten people in the Lynchburg region, with 40% of the affected being children. “In 2006, the
Lynchburg Area Food Bank distributed about 10,500 pounds of food each month. Now, it
distributes about 17,500 pounds monthly” (Nance, April 4, 2011). A more recent study by the
Blue Ridge Area Food Bank indicates that “22% of children in Lynchburg under the age of 18 are
at risk for hunger” (Compton, August 25, 2011).
Table II provides evidence from a Gallup-Healthways survey on the problem of obesity,
indicating that Lynchburg has an obesity rate of 33 percent, placing the city into the ranks of the
top-ten most obese cities in the country (Mendes 2010). Table III reports the Gallup-Healthways
Healthy Behaviors Index (HBI) that identifies Lynchburg as the third worst in the country in terms
of healthy behaviors among the top ten obese metro areas in the nation (Mendes 2010). In sum,
Lynchburg would seem to have the same demographics that identify other cities as being food
deserts.
Table II: 10 Most Obese Metro Areas
Region
% Obese
NATIONAL AVERAGE 26.5
Montgomery, AL 34.6
Stockton, CA 34.6
Visalia/Porterville, CA 34.1
York/Hanover, PA 34.0
Flint, MI 33.9
McAllen/Edinburg/Mission, TX 33.7
Lynchburg, VA 33.6
Bakersfield, CA 33.0
Huntington/Ashland, WV/KY/OH 33.0
Kingsport/Bristol, TN/VA 32.9
Source: Gallup-Healthways Well-Being Index

Abell, Brady, Dom, Lemaitre, Niaz, Searle, and Winkler 50
Table III: Healthy Behaviors in the 10 Most Obese Metro Areas
In order by worst to best Healthy Behavior Index rank
Region
HBI
Rank
% Ate
healthy
yesterday
% Eat
fruits and
vegetables
frequently
% Exercise
frequently*
%
Smoke
NATIONAL AVERAGE 66.5 56.8 49.9 21.1
Flint, MI 177 62.3 56.4 44.3 29.5
Stockton, CA 171 68.9 54.8 51 25.3
Lynchburg, VA 158 65.5 56.8 46.1 31.7
Huntington/Ashland, WV/KY/OH 140 66.2 60.2 47.7 27.3
McAllen/Edinburg/Mission, TX 118 74.1 45.7 45.8 16.1
Bakersfield, CA 113 66.7 53.1 48.4 21.2
York/Hanover, PA 85 68.1 59.0 47.8 21.8
Kingsport/Bristol, TN/VA 69 70.1 62.2 48.5 25.9
Montgomery, AL 66 63.3 52.7 43.3 18.3
Visalia/Porterville, CA 52 70.7 56.6 49.2 15.7
* Exercise for 30 minutes at least 3 days per week.
Source: Gallup-Healthways Well-Being Index
METHODOLOGY
In order to test the hypothesis that downtown Lynchburg is a food desert, with
correspondingly higher food prices and lower quality nutrition, we drew upon the research of Cook (2006) and Winne (2008). Google Maps helped us to identify eight convenience stores located in the downtown neighborhoods identified in Figure 2. Of the eight, two offered such a limited range of product offerings as to not be comparable to the rest, and one store declined our request to visit; our analysis, therefore, centered on the five remaining convenience stores. In the case of grocery stores, our analysis focused on the aforementioned three stores located along Memorial Avenue near The Plaza that were the closest to the majority of the downtown neighborhoods.
Knowing that we would find a much smaller range of food items at the convenience stores (than at the grocery stores), we allowed the selections at the convenience stores to form the basis of our overall data inventory. If, at the grocery stores, there were numerous variations of a particular product, we recorded the least expensive option. We collected data from both food and non-food items in the following categories: fresh produce; canned foods (meats, vegetables, and fruits); dry foods (pasta, rice, beans); cooking supplies; dairy, eggs, and meat; toiletries and paper products; and over-the-counter health supplies. Each student was responsible for one or two of the categories. Since our ultimate concern was with food vulnerability and access to food necessities, we did not collect data on the price of soft drinks and alcoholic beverages, which were offered in abundance in the convenience stores. We took note not only of price, but of how much space each store allocated to various food categories (to be discussed in detail below).
We put our price data on a per-weight or per-unit basis in order to allow for easier comparisons of non-identical, yet similar products (e.g., potted meat, tomato paste, or fruit cocktail) across stores. Individual prices (per weight or unit) were first averaged across the two different store categories (convenience vs. grocery). For example, we calculated the average price of Spam (on a per pound basis) at both convenience stores and grocery stores. Next, these

Inner City Food Deserts: Case Study of Lynchburg, VA
51
averaged prices of individual goods (at each type of store) were further averaged across the above-mentioned categories (fresh produce, canned foods, and so on). For example we generated an un-weighted average price per pound of canned foods at both convenience and grocery stores. Final price comparisons between convenience stores and grocery stores are expressed as ratios. For example, Spam, cost on average $5.98 per pound at convenience stores and $2.81 per pound at grocery stores. The resulting price ratio of 2.13 indicates that Spam costs on average 113 percent more at convenience stores than at grocery stores. The same interpretation applies to the broad categories such as “all canned foods” or “all fresh produce”, etc. For the category, toiletries and paper products, aggregation into a single price measure was not possible. Therefore, each individual product is reported separately and the price comparisons are reported in the appendix.
We also looked at the percent of store space devoted to various categories. Those categories included: food, junk food, soft drinks, beer/wine, and non-food. We had to make a number of normative assumptions as to what products fit into each of those categories. Junk food included foods commonly described in public conversation as being sugary, fatty, and otherwise unhealthy; items like cookies, crackers, candy bars, ice cream, gum, etc. It is quite possible that products that we categorized as foods (ex: cereal, frozen foods) fall into the junk food category. However, we decided that it was beyond the scope of our analysis to delve into the controversy of factors like macro vs. micro nutrients. By Michael Pollan’s (In Defense of Food, 2008) definition, for example, very little of what appears in a grocery store outside of the produce aisle would be categorized as food. To avoid this controversy, we kept our analysis as streamlined as possible. For example, if a product was located on the cereal aisle, it fell into our food category. If it was located on the cookies and crackers or ice cream aisles, it was categorized as junk food.
The analysis of store space percentages required further normative decision-making. Products in both convenience stores and grocery stores are presented in a variety of manners: aisle shelves, coolers (both tall and low-standing), free-standing displays, and open-bins. Each store, of course, is unique in its presentation. This necessitated converting the percentages of all items into a common unit of measure. For both convenience and grocery stores, everything was converted into an aisle shelf equivalent measure.
In testing the hypothesis that downtown Lynchburg is a pharmacy desert, we did not attempt to analyze prescription drug prices; only over-the-counter general health supplies. We used the same methodology, as well as the same stores, as described previously for food products.
Since over-the-counter health supplies come in many forms, ranging from pills, syrups, gels, and one-time-use objects, instead of a price per weight or unit, we converted each product into a price per dosage (or, in the case of some products; per usage), with dosages coming from manufactures’ instructions. Then the price of every product was divided by the number of doses in the product to yield an average price per dose. With this common factor, the most frequent over-the-counter health supplies were averaged for the five convenience stores and the three grocery stores, thus providing final points of comparison.
RESULTS
Based on the data collection procedures described above, this section presents our
findings in the following two categories across downtown Lynchburg’s convenience stores and
nearby grocery stores: 1) Prices and 2) Store space percentages allotted to food and other
categories.
As noted earlier, we allowed the selections at the convenience stores to determine what
products we collected data on in the grocery stores. Not surprisingly perhaps, at the convenience
stores, as their name suggests, the predominant (and most convenient) manner in which food was
offered for sale was in cans. As will be noted later, there was very little in the way of fresh foods
at the convenience stores. Our first category, therefore, is Canned Foods, presented in Table IV
below.

Abell, Brady, Dom, Lemaitre, Niaz, Searle, and Winkler 52
Table IV: Canned Food Prices per Pound
Product
Convenience
Stores
Grocery
Stores
Ratio:
Convenience/
Grocery
Spam 5.98 2.81 2.13
Treet 3.76 1.95 1.93
Potted Meat 4.17 2.17 1.92
Vienna Sausage 3.63 1.67 2.17
Chili W Beans 2.16 1.45 1.49
Canned Tuna 4.90 2.53 1.94
Corned Beef Hash 2.65 1.91 1.39
Canned Sloppy Joe 2.28 1.38 1.65
Black-eyed peas 1.55 0.81 1.91
Corn 2.04 0.78 2.62
Fruit Cocktail 2.62 1.13 2.32
Green Beans 1.99 0.78 2.55
Peaches 2.95 1.69 1.75
Pears 2.96 1.32 2.24
Pineapples 2.30 1.77 1.3
Sweet Potatoes 1.40 0.93 1.51
Tomato Paste 2.88 1.79 1.61
Tomato Sauce 1.57 0.69 2.28
Tomatoes Whole 1.06 0.70 1.51
Average 2.78 1.49
Our results indicate that the average canned good costs 87 percent more (2.78/1.49 =
1.87) per pound in a convenience store than its counterpart in a grocery store. The purchase, for
example, of a $3.63 can of Vienna Sausage at a convenience store (compared to $1.67 at a grocery
store) may not seem excessive if undertaken only occasionally. However, the accumulated effect
of multiple purchases over the course of weeks or months could become substantial. The 87
percent figure is an average, of course, with canned corn at one extreme costing 163 percent more,
and canned pineapple at the other extreme costing only 30 percent more. In the above table, there
are no goods that are more expensive in grocery stores than in convenience stores.
Items located in the “Fresh Produce” category are presented below in Table V. In every
case except tomatoes, grocery stores offered cheaper prices per pound of fresh produce. The data
indicate that fresh produce cost 53 percent more (1.53/1.00 = 1.53) on average in a convenience
store than a grocery store. Also worth noting are the availabilities of these products in
convenience stores. Apples and tomatoes were identified in only one convenience store, while
bananas, potatoes, and onions were found in only two of the five convenience stores. One
convenience store had no fresh produce at all. When asked about this, the store manager
commented that there was no demand for it by his customers. Given the importance of fresh

Inner City Food Deserts: Case Study of Lynchburg, VA
53
produce to a nutritious diet, the observations about fresh produce are probably the most
disconcerting; to think that across five convenience stores, we found only a handful of apples,
bananas, onions, potatoes, and tomatoes, not even enough collectively to fill a shopping basket.
Table V: Produce Prices per Pound
Product
Convenience
Stores
Grocery
Stores
Ratio: Convenience/
Grocery
Apples 2.70 1.16 2.33
Bananas 1.14 0.58 1.97
Onions 1.25 0.88 1.42
Potatoes 1.05 0.79 1.33
Tomatoes 1.50 1.59 0.94
Average 1.53 1.00
When considering the ingredients necessary to prepare a home-cooked meal, we grouped
products into the following separate categories a) Pasta/Grain Items and b) Baking Items. Table VI
presents the “Pasta/Grain” category.
Table VI: Pasta/Grain Prices per Pound
Product
Convenience
Stores
Grocery
Stores
Ratio:
Convenience/Grocery
Pasta Sauce 2.49 0.87 2.86
Elbow Macaroni 2.24 1.07 2.09
Spaghetti 2.22 1.20 1.85
Pinto Beans 1.47 0.98 1.5
White Bread 1.65 0.85 1.94
Whole Wheat Bread 2.28 2.22 1.03
Rice 1.63 0.67 2.43
Average 2.00 1.12
The results indicate that pasta and grain products, on average, cost 78 percent more
(2.00/1.12 = 1.78) in convenience stores than in grocery stores. We found the bread selection and
pricing to be noteworthy. Most convenience stores offered only “name brand” breads, whereas
grocery stores offered both name brands and less expensive generic or store labeled breads. For
the most part, convenience store shelves were full of white bread. A typical display had only a
single loaf of whole wheat bread. Interestingly, that single loaf of whole wheat bread was marked
up by only 3 percent relative to grocery stores, while white bread was marked up by 94 percent.
The baking items category, presented below in Table VII, included sugar, flour, iodized
salt, vegetable oil, and baking soda.

Abell, Brady, Dom, Lemaitre, Niaz, Searle, and Winkler 54
Table VII: Baking Goods Prices per Pound
Product
Convenience Stores
Grocery Stores
Ratio: Convenience/Grocery
Granulated Sugar 0.93 0.58 1.6
Flour 1.02 0.42 2.43
Iodized Salt 0.60 0.27 2.22
Vegetable Oil 1.87 0.93 2.01
Baking Soda 1.09 0.69 1.58
Average 1.10 0.58
Once again, each of these items is more expensive in convenience stores than in grocery
stores, with the average baking item costing an average 91 percent more (1.10/1.65 = 1.91) in a convenience store. The final food category, “Dairy, Eggs, and Meat”, is found below in Table VIII. Every item in the “Dairy, Eggs, and Meat” category costs more in a convenience store than a grocery store, with shoppers facing prices that are 78 percent more (2.94/1.65 = 1.78) per pound on average. While there is some debate as to the relative healthiness of whole vs. skim milk, we note that two of the five convenience stores did not carry skim milk. Table VIII: Dairy, Eggs and Meat Prices per Pound (except as noted)
Product
Convenience Stores
Grocery Stores
Ratio: Convenience/Grocery
Bologna 3.37 1.83 1.84
Hot dogs 2.07 1.3 1.59
Bacon 4.88 3.25 1.5
Processed cheese slices 4.42 1.88 2.35
Eggs (per egg) 0.18 0.13 1.38
Margarine 2.19 0.76 2.88
Cheese 6.4 4.03 1.59
Whole milk (per fl. oz.) 0.04 0.02 2
Average 2.94 1.65
To better understand the options available to consumers in convenience stores and grocery stores, Table IX below illustrates the amount of space that different types of stores allocate to different types of foods and other products.
The results of the analysis of store spacing allocations are as revealing as the results of the price comparisons. Presumably, when one thinks of grocery stores and convenience food marts, one is thinking about food. In fact, the above data indicates that just over 50 percent of grocery store spacing was devoted to food. For convenience stores, however, this percentage was not quite 16 percent. Instead of food items, the convenience stores were heavily stocked with soft drinks and beer or wine, 38 percent and 18 percent respectively. For the grocery stores, these percentages were only 9 percent and 4 percent, respectively. Junk food represented 22 percent of store space at the convenience stores, but only 13 percent of grocery store space. Finally, nonfood

Inner City Food Deserts: Case Study of Lynchburg, VA
55
items (paper products, batteries, etc.) represented 7 percent of store space in convenience stores and 24 percent of space in grocery stores. Table IX: Store Space Allocations
Store Space* Convenience
Stores Grocery Stores
Food 15.52 50.70
Non-Food 6.90 24.00
Beer/Wine 17.50 4.00
Soft Drinks 38.33 8.90
Junk Food 21.75 12.80
Total 100.00 100.40
* Each number is expressed as a percent of total store space
Note: Total percentage numbers do not add evenly to 100 due to rounding error
If one were to lump together the following three categories: junk food, soft drinks, and beer and wine, our results indicate that these “big three” accounted for nearly 78 percent of the store space in convenience stores. They visually dominate the entirety of every store, with floor to ceiling coolers, cases of beer stacked high in the aisles, cans of Pringles reaching for the ceilings, and endless colorful advertisements. Store space dedicated to the same “big three” in the grocery stores accounted for only a combined 26 percent.
Table X: Over-the-counter (OTC) Health Supplies Prices per Dose
Product
Convenience
Stores
Grocery
Stores
Ratio:
Convenience/Grocery
Cold & Allergy Tablets 0.788 0.31 2.542
Stomach Relief Syrup 0.733 0.461 1.59
Antibiotic Ointment 1.096 0.541 2.026
Band-Aids 0.058 0.037 1.568
Epsom Salt 0.037 0.019 1.947
Pain Reliever Tablets 0.667 0.179 3.726
Hydrogen Peroxide 0.012 0.012 1
Aspirin 0.661 0.056 11.804
Milk of Magnesia 0.764 0.528 1.447
Night Time Cold Syrup 1.363 0.782 1.743
Condoms 1.167 1.004 1.162
Tampons 0.376 0.258 1.457
Average 0.643 0.349
Finally, the results for over-the-counter (OTC) health supplies are presented in Table X
above. The data illustrate that on average, OTC products at convenience stores cost consumers 84
percent more (0.643/0.349 = 1.84) than in grocery stores. There are some serious extremes among

Abell, Brady, Dom, Lemaitre, Niaz, Searle, and Winkler 56
the individual items. While condoms are marked up by only 16 percent at convenience stores
relative to grocery stores, aspirin (on a per dosage basis) is marked up a rather sizeable 1080
percent.
The table in the appendix contains a price comparison of toiletries and paper products. In
all cases but one, convenience store prices were greater than grocery store prices.
CONCLUSIONS, SUGGESTIONS, POLICY IMPLICATIONS
Recall that a food (or pharmaceutical) desert is an area—most often associated with
urban settings—where citizens lack access to healthy, affordable food (or pharmaceuticals). Our
research on this issue for downtown Lynchburg, Virginia found the following results: 1) Food and
over-the-counter health products cost on average between 50 percent and 90 percent more in
convenience stores than in grocery stores, 2) store spacing in convenience stores was heavily
weighted toward junk food, soda, and beer and wine rather than food, 3) a poorer population lives
close to convenience stores but too far from grocery stores (or pharmacies) to be able to walk, and
4) the same poorer population owns far fewer cars per individual than the city’s average. The
entirety of the collected data suggests that citizens residing in downtown Lynchburg do indeed
live in a food and pharmaceutical desert. This evidence highlights a problem that started 60 years
ago when the supermarket and pharmaceutical chains present in the downtown area during the first
half of the 20th century began moving to the suburbs.
The findings of this paper shed light on additional, related issues in downtown
Lynchburg. As Gallup data indicate, Lynchburg is one of the cities in the United States with the
highest levels of obesity. This revelation apparently caught everyone by surprise, from the area’s
youth to the business community. Lynchburg’s mayor Joan Foster is working with her Mayor’s
Youth Council to tackle the problem of obesity, and the initiatives, such as an anti-obesity walk,
called Lighten-up Lynchburg are all student driven (Petska, 2010b). Lynchburg’s Business
Magazine has “weighed in” on the topic of obesity. According to Rebecah Hunt, R.N., clinical
administrator for cardiovascular wellness and prevention with Centra Health, there are three
reasons: “inactivity, poor dietary habits and supersized portions” (Walker, June 2010). According
to Cook (2006) and Winne (2008), lack of access to affordable, healthy food is another possible
factor explaining higher than normal obesity rates. Another issue that surfaces after analyzing the
collected data is the fact that poorer people in the city become trapped in a cycle of poverty
because they are forced to pay extra money for transportation or a premium price for their food
whether it is healthy or not, whereas wealthier citizens have access to relatively more affordable
and healthy foods.
We also wish to comment on the decision by the Greater Lynchburg Transit Company
(GLTC) to move its main transfer station from The Plaza shopping center to Kemper Street, across
the street from Lynchburg’s Amtrak train station and Greyhound bus facilities. The project should
be completed by 2013, assuming adequate funding (Petska, 2010a). Today, many downtown
residents rely on the GLTC bus system for access to food and other necessities. Moreover, The
Plaza bus transfer location in particular, provides them relatively easy access to three nearby
grocery stores, and to healthier, more affordable food than would otherwise be the case without
such access. If not planned well, i.e., with access to grocery stores in mind, this impending change
in transfer location might result in serious challenges for downtown residents and add more time
and inconvenience to their already long bus commutes in search of affordable food.
As noted earlier, College Hill residents expressed their frustration over the lack of a
grocery store in the downtown area in focus group conversations with Denise Sewell (2008). They
made it clear to her that the addition of a grocery store would represent an improvement in their
assessment of neighborhood satisfaction. According to Rebecca Flournoy (2006), “grocery stores,

Inner City Food Deserts: Case Study of Lynchburg, VA
57
along with other types of retail and services like banks, pharmacies and restaurants, are essential
components of livable and well-functioning communities and can enhance their broader economic
and social health.” This certainly makes sense in light of our own findings. The addition of at least
one grocery store (with associated pharmacy) in the Lynchburg downtown area seems to be a
logical solution to address the city’s food and pharmaceutical desert.
As Rebecca Flournoy suggests, a grocery store serving the downtown area could be a
welcome addition to the community. However, for those concerned about our nation’s health
problems and the carbon footprint of our approach to food and agriculture, the national-chain
grocery store model, as currently configured, does not necessarily represent a long-term
sustainable approach to food delivery. As Christopher Cook puts it in Diet for a Dead Planet,
“placing a Wal-Mart or Kroger on every inner-city corner” is not the answer to the issue of food
deserts and related public health problems like hunger, obesity, and diabetes (2006, p. 24). Many
physicians, medical researchers, and food writers advocate a whole foods diet as the path to better
health outcomes. See, for example, Ornish (2000), Barnard (2004), Campbell (2006), Esselstyn
(2008), and Pollan (2007, 2008). Grocery stores shelves, however, according to many, appear to
be stocked with significantly more processed and convenience foods than whole foods. In fact,
estimates of the percentage of processed foods in grocery stores range as high as 90 percent. US
Labor Department research suggests that of every consumer dollar spent on “food at home” 36
percent was spent on a category they label “other foods” which includes sugars, sweets, fats, oils,
miscellaneous foods, non-alcoholic beverages, and prepared foods. For a discussion of all this,
see Pollan (2007), Commerce (2008), Hernandez (2011), Labelwatch.com, and SixWise.
Stuart (2009) and Bloom (2010) suggest that grocery stores—in part, because of their
powerful positions in the food supply chain—are major contributors to extensive food waste and
thus contributors to global warming. In the US alone, we “squander between a quarter and a half
of all food produced” (Bloom, p. xi). Bill McKibben (2007, p. 64) reminds us that commercially
prepared foods travel a long way to appear in our grocery, convenience and fast food stores; 1500
miles on average, thus making significant contributions to the overall carbon footprint. Finally,
Anna Lappé (2010) reports the results from three studies, each suggesting significant greenhouse
gas contributions from grocery stores: a) a US Department of Energy study indicates that open-air
cooling cases typical in grocery and convenience stores “emit more greenhouse gases per square
foot of floor space than any other type of commercial building” (p. 34). b) The UK’s
Environmental Investigation Agency “found that supermarkets were the country’s largest source
of hydroflourocarbons (HFCs), greenhouse gases that are as much as ten thousand times more
potent than carbon dioxide” (p. 34). c) According to the Intergovernmental Panel on Climate
Change (IPCC), globally supermarkets contribute a quarter of all greenhouse emissions and the
IPCC predicts a tripling of such emissions from 2002 to 2015 unless there is a change in practices
(p. 34).
Are there alternatives to the national-chain grocery store model that don’t completely
give up on the idea of the brick and mortar stores? Flournoy (ibid.) suggests that there are, and that
they can be good neighbors as well, especially in communities that at one time existed in food
deserts. She indicates a number of places—Harlem, West Fresno, southeast San Francisco, and
Philadelphia—where government stimulus money or tax credits, combined with support from
community and business leaders, health organizations, economic development groups, and
grocery associations, all worked together to provide high quality, affordable grocery shopping to
formerly distressed communities. In the case of southeast San Francisco, criteria were developed
that allowed stores to be defined as “good” neighbors:
including devoting at least 10 percent of inventory to fresh produce and an
additional 10 to 20 percent of inventory to other healthy foods, accepting food
stamps, limiting tobacco and alcohol promotion and adhering to environmental
Abell, Brady, Dom, Lemaitre, Niaz, Searle, and Winkler 58
and health standards. Stores that agree to comply with these criteria would
receive technical assistance and training, energy efficiency upgrades, marketing
assistance and grants to make initial purchases of healthy foods and to test how
the items sell.
Nutrition education was also part of the overall approach. The inclusion of local food sourcing to
this list would help to address, in part, many of the environmental concerns expressed earlier and
also allow for multiplier effects to benefit the local community.
Michael Pollan (2008, 2009) offers a vision for the revitalization of local economies that
incorporate Flournoy’s ideas, along with local food sourcing: four seasons farmers markets. Such
markets are year-round, indoor markets. Pike Place Market in Seattle and Reading Terminal
Market in Philadelphia are well-known examples. The funding could arise from state or local
private/public partnerships as Flournoy suggests, or, they could come from federal funding as
Pollan suggests. He recommends USDA grants to help “rebuild local distribution networks in
order to minimize the amount of energy used to move produce within local food sheds.” If done
right, a comprehensive approach embodying elements of Flournoy’s and Pollan’s ideas might help
to overcome the problem that Hernandez (2011, July 17) points out whereby “supermarkets in
underprivileged areas often offer fewer, lower-quality and more expensive healthful food options
than stores in better-off neighborhoods.” Such an approach offers hope that food accessibility can
coexist with healthy nutritional outcomes. The year-round market idea also embodies something
that Lynchburg already does particularly well with its own farmers market. More on this in a
moment. Given Lynchburg’s recent successes with public/private partnering in the revitalization
of its downtown area, as the city weighs its options for addressing inner-city food vulnerability
and accessibility, the Flournoy/Pollan suggestions provide a framework for addressing its food
desert problem.
There are additional solutions that can augment or enhance a community friendly grocery
store. Winne (2008) has suggested the following ideas, discussed in detail earlier: farmers’
markets (which may or may not be four seasons), community gardens, and Community-Supported
Agriculture (CSA) programs, each of which has a much smaller environmental footprint than
conventional grocery stores. Lynchburg has successful examples of all three approaches. Farmers
markets are one of the oldest methods of providing food directly from farmer to consumer.
According to the USDA, farmers markets are one of the fastest growing segments of the US food
system. In mid-2011 there were 7175 farmers markets operating in the US; an increase of 17
percent just since 2010 (USDA). There are community gardening success stories all across the
country. According to the American Community Gardening Association, there are approximately
18,000 community gardens in the US and Canada (ACGA). For a concise discussion of
Community Supported Agriculture (CSA) programs, along with some examples from around the
country, see Biodynamic Farming and Gardening Association. The USDA does not have a
database of CSAs, however LocalHarvest has a grassroots directory of over 4000 CSAs across the
country (LocalHarvest).
In addition to its farmers market, Lynchburg is currently served by a handful of CSAs,
most notably, Horse and Buggy Produce, Frog Bottom Farm CSA, and Our Father’s Farm. Other
small farmers are starting to experiment with subscription sales of local farm products. Lynchburg
Grows, a local community garden that employs at-risk local youth and special needs individuals
holds great promise as an incubator for urban farming ideas. It has also recently begun to sell CSA
subscriptions. Also, the Tinbridge Hill neighborhood has an impressive community garden
operated on a volunteer basis whose produce is available to citizens in need.
Winne (ibid.) suggests that innovative solutions such as these will not be successful on a
widespread scale without a serious change in public policy, and that a change in public policy will
not occur without significant input from the public. Here is how he puts it:

Inner City Food Deserts: Case Study of Lynchburg, VA
59
When it comes to hunger, food insecurity, nutrition, or agriculture, I can say
with categorical certainty that not a single significant social or economic gain
has been made in the past fifty years without the instigation and participation of
an active and vociferous body of citizens. Innovation and change do not occur
spontaneously in major centers of political power without the incendiary spark
of the populists’ voice (p. 149).
The recent inclusion of the Lynchburg Community (Farmers) Market on a City Council list of
budget line items that could be eliminated in favor of other budgetary priorities reminds us of how
fragile and uncertain our access to humane, healthy, local, and sustainable foods is, and how
important citizen activism is to ensure such access (Petska March 15, 2011).5
We conclude with a closer look at Lynchburg’s farmers market, viewing it as a core
element in a long run solution to our community’s food needs. While farmers markets are
growing by leaps and bounds across the country, not all cities have one yet. Lynchburg is
fortunate to have one that has been continuously operated ever since 1783, making it the third
oldest in the U.S. It is well organized and situated in the heart of downtown and therefore at a
reasonable distance from many low-income downtown neighborhoods. As a city-commissioned
study by the Project for Public Spaces (PPS) (2004) puts it, the market is the “de facto town square
of Lynchburg” (p. 12). Yes, the market has an operating budget deficit, the study acknowledges,
but it should not be thought of as a “pure loss” because of the fact that the market is a “job creator,
vital social institution, and a catalyst for downtown activity and investment that is beginning to
show handsome dividends. It is the anchor for what is becoming one of the most valuable real
estate districts in the city” (p. 22).
In fact, the PPS study suggests that the market should be expanded into what might
become a market district, encompassing even more blocks of the downtown area following the
Pike Place Market model. We agree with that recommendation and suggest further that the market
could be expanded in other ways that would make it more accessible to low-income residents. We
mentioned previously the two low income farmers market programs: The Women, Infants and
Children Farmers’ Market Nutrition Program (FMNP) and the Seniors Farmers’ Market Nutrition
Program (SFMNP). As noted, payment by the target groups is accepted at farmers markets
throughout the country, but this is not yet the case here in Lynchburg. Since Virginia is apparently
not, at the moment, participating in the FMNP program, further efforts are required to get the state
(and ultimately the farmers market) on board. Virginia is participating in the SFMNP program,
though, and thus it would seem that the market should be able to coordinate with the state to make
it such that low income seniors could purchase food from the market through this program.
Beyond these two programs, we recommend exploring the feasibility of allowing the use of food
stamps (Supplemental Nutrition Assistance Program) at the farmers’ market to help low income
families gain access to healthy and fresh local food. We recognize that there are costs and
logistical hurdles—especially in the area of payment systems—to be overcome for this approach
and as well for participation in the FMNP and SFMNP programs. See for example Zezima (July
19, 2009). With assistance from non-profit organizations, however, wireless payment terminals are
appearing at farmers markets around the country. “It opens up the market to a whole new clientele,
and it allows the recipients better access to better foods and fresh foods,” said Jane Aiudi, director
of the market and production development division of the Maine Agriculture Department
(Zezima).
5 The Lynchburg City Council voted on April 26, 2011 to maintain funding for the
approaching fiscal year for the Community Market.

Abell, Brady, Dom, Lemaitre, Niaz, Searle, and Winkler 60
In conclusion, while Lynchburg appears to suffer from many of the same food and
pharmacy desert problems of larger cities, there are solutions at hand. The city clearly would
benefit from a downtown community-friendly grocery store (with associated pharmacy) in
conjunction with an expanded farmers market along the lines of the four seasons market model. As
long as either approach utilizes local farmers and local resources and keeps the needs of local
citizens in mind, then we see them as making long-run contributions to the community’s food and
public health needs
REFERENCES
110th Congress. (2008, May 22). H.R. 6124. Retrieved March 12, 2011, from United States
Department of Agriculture: http://www.usda.gov/documents/Bill_6124.pdf
American Community Gardening Association website. Retrieved September 7, 2011 from
http://www.communitygarden.org/
Barnard, N. (2004). Breaking the food seduction. New York: St. Martins Press.Biodynamic
Farming and Gardening Association. Community Supported Agriculture: An Introduction
to CSA. Retrieved September 7, 2011 from http://www.biodynamics.com/csa.html
Bittman, M. (April 7, 2011). Cities, soda taxes, obesity, and more. NYTimes.com. Retrieved
September 7, 2011 from http://bittman.blogs.nytimes.com/2011/04/07/cities-soda-taxes-
obesity-and-more/
Campbell, C. (2006). The China study. Dallas, Texas: BenBella Books
Chambers, S. A. (1981). Lynchburg an architectural history. United States: The University Press
of Virginia.
City of Lynchburg. History of the market. http://www.lynchburgva.gov/Index.aspx?page=3456
Commerce Dept. US. (2008). US Department of Commerce industry report; Food manufacturing
NAICS 311. Retrieved September 7, 2011 from http://trade.gov/td/ocg/report08_
processedfoods.pdf
Compton, R. (2011, August 25). 22% of Lynchburg’s kids at risk for hunger. ABC 13, WSET-TV,
Lynchburg, VA. Retrieved August 30, 2011 from http://www.wset.com/story/15334836/
advocates-promote-early-childhood-education
Cook, C. D. (2006). Diet for a dead planet. New York: The New Press.
DeParle, J. (2009, September 16). Hunger in U.S. at 14-year high. The New York Times. Retrieved
March 19, 2012 from http://www.nytimes.com/2009/11/17/us/17hunger.html
Ellis, B. (2011, August 4). Food stamp use rises to record 45.8 million. CNNMoney.com.
Retrieved September 20, 2011 from http://money.cnn.com/2011/08/04/pf/food_
stamps_record_high/index.htm
Esselstyn, C. (2008). Prevent and reverse heart disease. New York: Penguin Group.

Inner City Food Deserts: Case Study of Lynchburg, VA
61
Flournoy, R. (Fall 2006). Healthy foods, strong communities. NIH (National Housing Institute).
Issue #147. Retrieved September 7, 2011 from http://www.nhi.org/online/issues/
147/healthyfoods.html
Food & Nutrition Service of the USDA. Senior Farmers Market Nutrition Program. Retrieved
April 1, 2011 from http://www.fns.usda.gov/wic/SeniorFMNP/SeniorFMNPoverview.
htm
Food & Nutrition Service of the USDA. WIC Farmers Market Nutrition Program. Retrieved April
1, 2011 from http://www.fns.usda.gov/wic/fmnp/fmnpfaqs.htm
Geewax, M. (2011). More Americans hungry for food stamps. NPR.org. Posted August 28, 2011.
Retrieved August 29, 2011 from http://www.npr.org/2011/08/28/139968385/slow-
growth-economy-spikes-food-stamp-reliance
Google Maps. http://maps.google.com/maps?hl=en&tab=w
Hernandez, D. (2011, July 17). Access to grocers doesn’t improve diets, study finds. Los Angeles
Times. Retrieved September 12, 2011 from http://articles.latimes.com/2011/jul/17/health/
la-he-food-deserts-20110712
Kantor, Linda Scott. (2001, January - April). “Community food security programs improve food
access”. Food Review. USDA Economic Research Service.
Labelwatch.com. Processed foods. Retrieved September 7, 2011 from http://www.
labelwatch.com/info.php?mid=1051001
Lappé, A. (2010). Diet for a hot planet. New York: Bloomsbury.
Laurant, D. (1997). A city unto itself. Lynchburg: Darrel Laurant & The News and Advance.
LocalHarvest website. Retrieved September 7, 2011 from http://www.localharvest.org/
csa/
Lynchburg, Virginia City Directory: various issues.
McKibben, B. (2007). Deep economy. New York: Holt Paperback.
Mendes, E. (2010, March 2). What America’s most obese metro areas have in common. Gallup.
Retrieved March 12, 2011 from http://www.gallup.com/poll/126242/america-obese-
metro-areas-common.aspx
Nance, J. (April 4, 2011). More in Central Virginia stretch dollars to feed families. Lynchburg
News & Advance.com. Retrieved April 4, 2011 from
http://www2.newsadvance.com/news/2011/apr/03/more-central-virginia-stretch-dollars-
feed-familie-ar-944957/
Ornish, D. (2000). Eat more, weigh less. New York: Harper Paperbacks

Abell, Brady, Dom, Lemaitre, Niaz, Searle, and Winkler 62
Patel, R. (November 2010). 5 things you didn’t know about supermarkets: Foreign Policy.
Retrieved December 31, 2010 from http://www.foreignpolicy.com/articles/2010/
10/11/supermarkets
Petska, A. (2010a, February 4). GLTC favors Kemper Street site for transfer station. The News &
Advance. Retrieved March 15, 2011, from http://www2.newsadvance.com/news/
2010/feb/04/gltc_favors_kemper_street_site_for_transfer_statio-ar-213217/
Petska, A. (2010b, October 31). Mayor’s youth council wants Lynchburg to lighten up. The News
& Advance. Retrieved March 15, 2011, from http://www2.newsadvance.com/
news/2010/oct/31/mayors-youth-council-wants-lynchburg-lighten-ar-618693/
Petska. A. (2011, March 15). Paid parking, Community market among city’s considered cuts.
Lynchburg News & Advance.com. Retrieved April 5, 2011 from http://
www2.newsadvance.com/news/2011/mar/15/paid-parking-community-market-among-
citys-consider-ar-908270/
Pharmacy Choice and Access Now (PCAN). (2011, April 25). An oasis in the food desert.
Retrieved August 29, 2011 from http://www.rxchoiceandaccess.com/blog/2011/04/an-
oasis-in-the-food-desert/
Pollan, M. (2007). The omnivore’s dilemma. New York: Penguin Press.
Pollan, M. (2007, April 22). You are what you grow. NYTimes.com. Retrieved September 7, 2011
from http://www.nytimes.com/2007/04/22/magazine/22wwlnlede.t.html?pagewanted=1
Pollan, M. (October 12, 2008). Farmer in chief. NYTimes.com. Retrieved September 17, 2011
from http://michaelpollan.com/articles-archive/farmer-in-chief/
Pollan, M. (2008). In defense of food: An eater’s manifesto. New York: Penguin Press.
Pollan, M. (2009, March 21). Local economies. Speech at the Georgia Organics Conference.
Retrieved September 16, 2021 from http://www.mnn.com/food/healthy-eating/
videos/michael-pollan-local-economies
Prevention Institute. (2002). Super market access in low-income communities. Nutrition Policy
Profiles. Retrieved March 18, 2011, from http://www.preventioninstitute.org/
component/jlibrary/article/id-202/127.html
Project for Public Spaces. (2004). Lynchburg community market: issues and opportunities. A
report prepared for the City of Lynchburg. Available as an active link in
http://www.lynchburgva.gov/Index.aspx?page=3456
Sewell, D. (2008). Neighborhood development in College Hill: an analysis of composition,
change, and satisfaction in a low-income Lynchburg community. Randolph College
honors paper.
Schlosser, E. (2002). Fast food nation. New York: Perennial books.
Inner City Food Deserts: Case Study of Lynchburg, VA
63
SixWise.com. All the health risks of processed foods—in just a few quick convenient bites.
Retrieved September 7, 2011 from http://www.sixwise.com/newsletters/05/10/19/all-the-
health-risks-of-processed-foods----in-just-a-few-quick-convenient-bites.htm
Stuart, T. (2009). Waste. New York: W.W. Norton & Co.
Tavernise, S. (2011, September 13). Soaring poverty rate casts spot light on ‘lost decade’.
NYTimes.com. Retrieved September 21, 2011 from http://www.nytimes.com/
2011/09/14/us/14census.html?pagewanted=all
Trent, A. (2010, December 3). Groups fill backpacks to fight childhood hunger. The News &
Advance. Retrieved March 24, 2011 from http://www2.newsadvance.com/news/
2010/dec/03/groups-fill-backpacks-fight-childhood-hunger-ar-693760/
United States Census. (2000). Lynchburg City, Virginia. American Fact Finder. Retrieved March
20, 2011 www.census.gov
United States Census Bureau. (2008). Lynchburg City, Virginia. State & County QuickFacts.
Retrieved March 20, 2011 from http://quickfacts.census.gov/qfd/states/51/51680.html
United States Census Bureau. American Community Survey. www.census.gov.
United States Department of Agriculture (USDA) Agricultural Marketing Service. Farmers
markets and local foods marketing. Retrieved September 7, 2011 from
http://www.ams.usda.gov/AMSv1.0/farmersmarkets
US Department of Labor. Bureau of labor Statistics. Economy at a glance. Retrieved April 4, 2011
from http://www.bls.gov/eag/eag.va_lynchburg_msa.htm and http://www.bls.gov/
eag/eag.va.htm
Walker, Jan. (2010, June). Fighting the trend: How to reduce our obesity rate. Lynchburg’s
Business Magazine. Retrieved April 5, 2011 from http://www. lynchburgbusinessmag.
com/mag/healthcare/fighting-the-trend-how-to-reduce-our-obesity-rate/
Wheeler, E. (2011, March 20). Commissioner of the Revenue. Lynchburg, Virginia
.
Winne, M. (2008). Closing the Food Gap: Resetting the Table in the Land of Plenty. Boston:
Beacon Press
Zezima, K. (July 19, 2009). Food stamps, now paperless, are getting easier to use at farmers’
markets. NYTimes.com. Retrieved April 3, 2011 from http://www.nytimes.com/
2009/07/20/us/20market.html

Abell, Brady, Dom, Lemaitre, Niaz, Searle, and Winkler 64
APPENDIX
Table: Raw Data for Toiletries and Paper Products
Product
Unit of
measure
Average Price
convenience store
Average Price
grocery store
shampoo* ounce 0.13 0.08
lotion ounce 0.13 0.22
deodorant ounce 1.7 1.23
shaving cream ounce 0.19 0.13
toothpaste ounce 0.84 0.45
paper towels sheet 0.04 0.02
toilet paper sheet 0.004 0.001
tissues sheet 0.04 0.016
mouthwash Ml 0.02 0.007
diapers diaper 0.3 0.24
toothbrush one 3.09 1.49
*one observation