Infrastructure in Africa: The Record
57
AFRICAN DEVELOPMENT BANK ECONOMIC RESEARCH PAPERS NO. 46 Infrastructure in Africa: The Record By Afeikhena Jerome University of Ibadan, Nigeria The views and interpretations in this paper are those of the author and not necessarily those of the African Development Bank
-
Upload
independent -
Category
Documents
-
view
5 -
download
0
Transcript of Infrastructure in Africa: The Record

AFRICAN DEVELOPMENT BANK
ECONOMIC RESEARCH PAPERS
NO. 46
T
Infrastructure in Africa: The Record
By
Afeikhena Jerome University of Ibadan, Nigeria
he views and interpretations in this paper are those of the author and not necessarily those of the African Development Bank

INFRASTRUCTURE IN AFRICA: THE RECORD1
1. Introduction In recent years, there has been a resurgence of interest in infrastructure development and
policy reform in developing economies, with much of the debate centering on efficiency
of use and an increased role for private sector participation in the provision of
infrastructure (Jimenez, 1995; Mody, 1996; Kerf and Smith, 1996; and World Bank,
1994). The apparent interest emanates principally from the growing realization that human
and physical infrastructure are critical elements for economic growth and poverty
reduction. Infrastructure plays a pointed, often decisive-role in determining the overall
productivity and development of a country's economy, as well as the quality of life of its
citizens.
A broader source of interest, however, derives from the generally poor
performance of state-owned monopolies, combined with the rapid globalization of the
world economies, which has brought into sharp focus the economic costs of inadequate
infrastructure and prompted a growing number of developing countries to seek new
initiates in promoting competition, private entry and foreign interest in the provision of
infrastructure.
The term ‘infrastructure’ was coined during the Second World War by military
strategists to indicate wide-ranging elements of war logistics. Thereafter, development
economists began to use the term interchangeably with ‘overhead capital’ considered to
include:
those services without which primary, secondary and tertiary production activities cannot function. In its widest sense, it includes all public services from law and order through education and public health to transportation, communication, power and water supply as well as such agricultural overhead capital as irrigation and drainage systems (Hirschman, 1958: 83).
There is no consensus in the literature on a common definition of infrastructure. What
remains indisputable, however, is that is that they share some common characteristics
which have hitherto been used to justify state involvement in their provision and
1 A Background paper prepared for the African Development Report 1999.
1

financing. These characteristics include scale economies in production, consumption
externalities and non-excludability. They are equally not generally tradeable.
Broadly defined, infrastructure refers to all basic inputs into and requirements for
the proper functioning of the economy. They are usually grouped into two. The first
category is social infrastructure, such as education and health which facilitate the supply
of skilled and healthy personnel to manage and operate other resources. They also
enhance the economic, political and social empowerment of the populace, with the
attendant positive effects on poverty alleviation and efficient use of national resources.
The second category is often referred to as economic infrastructure. Mody (1997) defines
this category of infrastructure as the facilities that provide society with the services
necessary to conduct daily life and to engage in productive activities. These include
power, transportation, telecommunications, water, sanitation and safe water disposal,
among other things. This report is devoted to the study of the complementary physical
infrastructure, comprising telecommunications, power, transport (roads, railways, ports
and airports), water supply, and sewerage.
Infrastructure has a pervasive influence on the whole economy.
Telecommunications, electricity and water are used in the production process of virtually
every sector of an economy, while transportation is necessary for the distribution of
commodities. The quantity and quality of these services are therefore an important
determinant of private sector productivity and output. In fact, there is a strong association
between the availability of certain infrastructure -telecommunications (in particular),
power, surfaced roads and safe water - and per capita GDP2. The relationship involves
2See World Bank (1994), Chapter 1.
2

both the supply side, in terms of the contribution of infrastructure to the generation of
higher GDP, and the demand side, as higher incomes in turn generate higher demands for
infrastructure services. Infrastructure thus makes an important contribution to expanding
output.
Africa trails the rest of the world, both in the extent and quality of infrastructure.
Notwithstanding the large amount of scarce economic resources absorbed in the
development of infrastructure in Africa, there is clear evidence that the provision of
infrastructure has been much below standard both in terms of quantity and quality in
relative and absolute terms. Infrastructure bottlenecks continue to exist, particularly in the
management of current stock.
Traditionally, infrastructure services have been viewed as public goods and the
primary responsibilities for their provision have been entrusted to the government-owned
`natural monopolies'. Consequently, these sectors have become inextricably entangled
with the public sector that dominated it. While the performance of government-owned
providers of infrastructure, vary from one country to another, their overall performance in
Africa has been very poor. The sector is characterized by operational inefficiency, lack
of technological dynamism and poor service to consumers. In addition to their
inadequacy, the provision of infrastructural services in most African countries is
characterized by high prices compared with per capita incomes and long waiting time
(several years in some countries) between the time of application for services and actual
connection.
The cost of waste, in terms of forgone economic growth and lost opportunities for
poverty reduction and environmental improvements, are unimaginably high. Poor
3
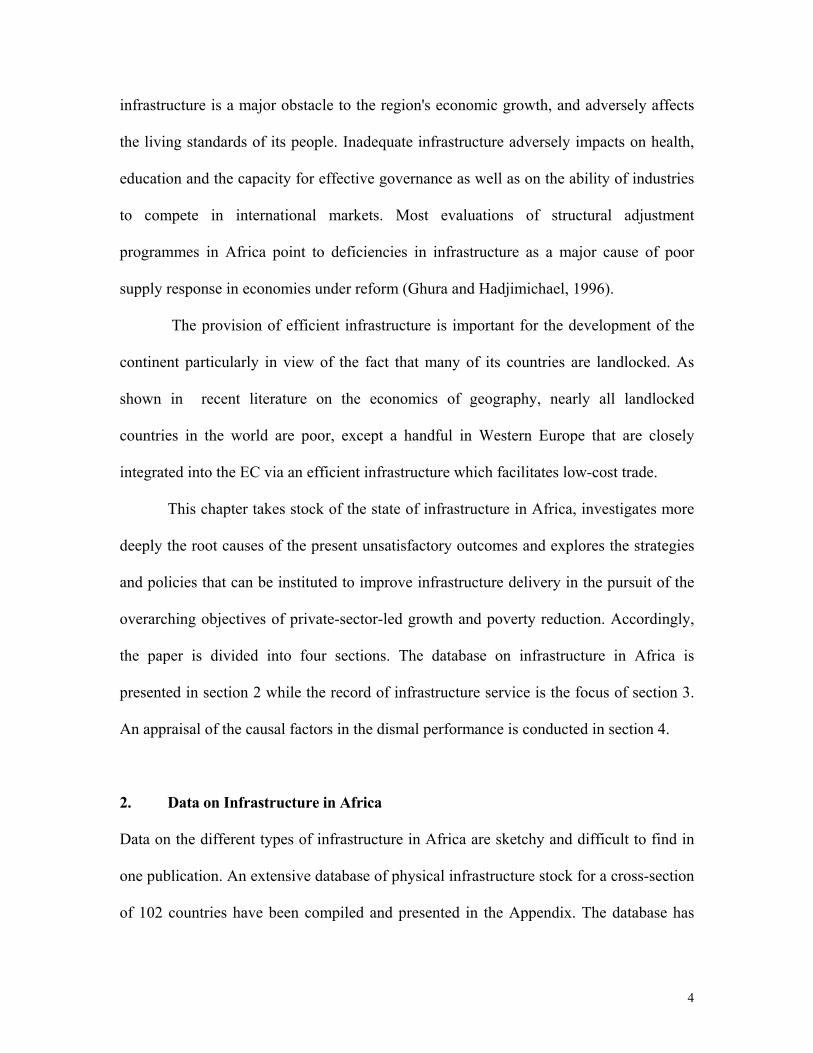
infrastructure is a major obstacle to the region's economic growth, and adversely affects
the living standards of its people. Inadequate infrastructure adversely impacts on health,
education and the capacity for effective governance as well as on the ability of industries
to compete in international markets. Most evaluations of structural adjustment
programmes in Africa point to deficiencies in infrastructure as a major cause of poor
supply response in economies under reform (Ghura and Hadjimichael, 1996).
The provision of efficient infrastructure is important for the development of the
continent particularly in view of the fact that many of its countries are landlocked. As
shown in recent literature on the economics of geography, nearly all landlocked
countries in the world are poor, except a handful in Western Europe that are closely
integrated into the EC via an efficient infrastructure which facilitates low-cost trade.
This chapter takes stock of the state of infrastructure in Africa, investigates more
deeply the root causes of the present unsatisfactory outcomes and explores the strategies
and policies that can be instituted to improve infrastructure delivery in the pursuit of the
overarching objectives of private-sector-led growth and poverty reduction. Accordingly,
the paper is divided into four sections. The database on infrastructure in Africa is
presented in section 2 while the record of infrastructure service is the focus of section 3.
An appraisal of the causal factors in the dismal performance is conducted in section 4.
2. Data on Infrastructure in Africa
Data on the different types of infrastructure in Africa are sketchy and difficult to find in
one publication. An extensive database of physical infrastructure stock for a cross-section
of 102 countries have been compiled and presented in the Appendix. The database has
4

been compiled for 53 African countries by region according to ADB classification. To
allow for comparison, similar data is presented for 17 countries in Latin America, 8
countries in South East Asia and 24 OECD countries. The database comprises six
measures:
. Population, GNP per capita and percentage of population with access to safe
water and sanitation;
. Kilometres of paved roads;
. Kilometres of railway lines;
. Statistics on the power sector;
. Telecommunication statistics; and
. Information technology.
Apart from physical stocks, the database also provides some measures of the quality of
infrastructure.
White It is imperative to sound a note of caution on these global statistics given their
comparative basis, it should be noted, however, that the data provides a rough, albeit, useful
basis for analyzing the development of infrastructure on a comparative global and regional
basis. The data reveals a strong association between infrastructure capacity and level of
development. Countries with lower income level are associated with lower levels of
infrastructure capacity and service provision. It should be borne in mind that the
performance of most African countries in all the indicators is quite dismal.
3. The Record of Infrastructure in Africa
It is crucial to examine in greater details the situation in the major infrastructure sub-
sectors with a view to highlighting the peculiarities of each sub-sector. For each type of
infrastructure , the section examines the state of the available networks, tariffs charged,
5

supply and demand patterns, service quality; industry bottlenecks, and environmental
consideration.
3.1 Telecommunications
Telecommunications infrastructure lies at the heart of the information economy.
Countries lacking modern telecommunications system cannot compete effectively in the
global economy. The telecommunications industry in Africa has made limited
progress despite concerted efforts and programs aimed at modernizing and expanding the
sub-sector.
3.1.1 Networks
Despite the giant strides which a number of African countries have taken in reforming the
telecommunications sub-sector in recent years, telecommunication coverage in Africa is
amongst the lowest in the world. There are more telephones in Brazil than the whole of
Africa. While Brazil has 15,105.9 main telephone lines, Africa has only 13, 695.1 main
telephone lines. Africa accounts for only two per cent of telephone main telephone lines
globally as shown in chart 1. Low network densities, long waiting
6

Chart 1: Main telephone lines
Africa2%
America32%
Asia28%
Europe36%
Oceania2%
Source : International Telecommunication Union.
times for access to services, and clear willingness of some users to pay for access to the
service illustrate the significant shortage of telecommunications services in the region.
The most common measure of telecommunications access is teledensity or the
number of main telephone lines per 100 inhabitants. In 1996, teledensity varied from 0.08 in
Democratic Republic of Congo to 34.01 in Reunion. Africa averages 1.85 compared to
30.38 in the Americas, 6.02 in Asia, 30.60 in Europe and 40.39 in Oceania.
There are substantial differences among the African sub-regions, with four countries
currently in the forefront; namely, Reunion 34.01, Seychellis 19.51, Mauritius 16.21 and
South Africa 10.2 . The laggards are sub -Saharan African countries with an average
teledensity of 0.52. As many as 34 countries in Africa still have a teledensity of less than
1. These differences among countries are associated in part with variations in per capita
GDP.3 In part, GDP per capita may serve as an indicator of the extent of a country's rural
population, which tended to receive fewer infrastructure services than urban areas did. It
7

may also reflect the affordability of services. However, a nation’s teledensity is usually
quoted as an average thus masking regional variability. For example, the distribution of
telephone networks in South Africa presents striking internal contrasts. The average
teledensity in South Africa is 10.05, but on a provisional level, this ranges between 22 in
Gauteng (the region around Johannesburg and Pretoria) and 2 in the Northern pronvince.
The distribution of telecommunications services is biased in most African countries
in favour of the urban areas, which account for over 80 per cent of the services, while the
rural areas, where over 80 per cent of the population reside, enjoy 20 per cent of the service.
About 72.9 per cent of telecommunications mainlines were in urban areas in 1995
compared to 27.1 per cent in rural areas. Two countries, however, had most of their
telephone mainlines located in rural areas. These are Sao-Tome and Principe (87.0 per
cent) and Central African Rep. (57.0 per cent).
In terms of quality, networks are burdened with a high percentage of outmoded
equipment and high fault rates. The information on faults per main lines, a standard
measure of service quality, indicates that the average faults per 100 main lines for the
region in 1996 was 78.1 compared with an average rate of 8.9 for America, 19.9 for
Europe, 43.7 for Asia and 47.8 for Oceania. The recorded fault rates in the region,
however, range widely- from 1.0 (Eritrea) to 937.5(Guinea).
The most effective route to increasing service quality is the installation of digital
exchanges. African countries are striving to modernize their systems - albeit at great cost
- in order to remain plugged into the global network. Many telecommunications
authorities in Africa, especially in those countries undergoing reforms are installing
3See Internal Telecommunication Union/OECD (1994a).
8

digital technologies and costly equipment in order to become competitive. In the absence
of local manufactures, African countries are dependent on industries outside the region for
the purchase of telecommunications equipment and spare parts. Such imports are generally
made on a non- selective basis of ‘ready-made' packages with little room for adaptation to
local needs through local enterprise and know-how. Consequently, telecommunications
services in Africa do not have the usual multiplier effects (via research and development,
local manufacturing, services and employment) as they do in other regions of the world.
Table 1: Comparative Statistics on Telecommunications Indicators in Africa and the Rest of
the World (1996)
Main telephone lines Total
Per 100 Inhabitants
Main Lines Per Employee
Satisfied demand (%) 1996
Waiting time Years
Fault per 100 Main Lines per year
Africa 13,695.1 1.85 54 80.2 3.5 78.5 America 237,481.6 30.38 183 98.8 0.3 8.9 Asia 206,647.2 6.02 111 93.6 0.7 43.7 Europe 274,232.1 43.60 147 93.4 2.4 19.9 Oceania 11,605.7 40.39 121 99.9 - 47.8 World 520,198.1 12.88 96 94.9 1.0 22.3 Source: International Telecommunication Union
9

3.1.2 Supply and Demand Patterns
0
20
40
60
80
100
120
140
160
180
200
Afric
a
Amer
ica
Asia
Euro
pe
Oce
ania
Wor
ld
Chart 2: Comparative Telecommunications Statistics for Africa and the rest of the World
Per 100 inhabitant
Main lines per employee
Satisfied demand (%) 1996
Fault per 100 machines peryear
Source: International Telecommunication Union.
Large waiting lists are evident in several African countries, but the demand for
telephone connections is in all likelihood considerably higher. A sizable latent demand
lies concealed since prospective users do not even register on waiting lists until there is a
realistic chance of receiving a telephone connection. The overall average expected
waiting time for services in Africa for 1996 was 3.5 years, the highest in the world,
compared with 0.3 in America, 0.7 in Asia and 2.4 in Europe as shown in chart 3. Ten
countries recorded a waiting time greater than 10 years. These are Algeria, Eritrea,
Ethiopia, Gambia, Malawi, Mozambique, Sao Tome & Principe, Sierra Leone and
Tanzania. With such long waiting times in African economies, there may well be a
10

significant number of discouraged potential subscribers who have not yet joined the
queue for services.
Development of cellular networks in African economies provides one example of
customers' willingness to pay for quick access to reliable services. This willingness is
particularly true of businesses and high-income households. While the cellular network
penetration rates are still comparatively small, (7.9 per cent of total telephone subscribers
in 1996 ranging between 1.1 in Kenya and 18.3 in South Africa), the growth rates in the
number of subscribers are considerable in some countries. This level of demand has been
achieved despite the fact that charges for cellular services
Chart 3: Waiting time for Connection to a Phone (years)
0 0.5 1 1.5 2 2.5 3 3.5 4
Oceania
America
Asia
World
Europe
Africa
Source : International Telecommunication Union.
11

are substantially above those for fixed services in the region and those for cellular
services in the EU. Surveys of business users in the region confirm this willingness to pay
for quick access to reliable telecommunications services.4
The introduction of competition has been most notable in mobile cellular and
other value-added services, with almost half of the Africa countries allowing more than
one provider in these areas. In the majority of markets where cellular mobile services are
now provided, private capital has been introduced in the form of joint ventures with state-
owned enterprises or stand-alone private ventures
3.1.3 TARIFFS
The structure of tariffs falls relatively heavily on businesses and more lightly on
households, but the overall level remains low in most countries. In several African
countries, there is no clear practice of pricing services, hence rough and ready norms for
billing are adopted. Call waiting and forwarding for residential customers remains largely
the domain of dominant local providers.
While detailed data on long-distance and international tariffs are not available,
average monthly subscription and installation charges for households and businesses
provide some indication of tariff levels and structures. Table 2 presents average monthly
subscription charges and connection rates for both household and business consumers by
regions in the world. A comparison across these regions reveals that telecommunications
4
See International Telecommunications Union (1994b).
12

tariff in Africa is the lowest in the world relative to both the global average and other
regions in the world. The relatively low levels of tariffs in much of the region limit the
extent to which internal cash flows and private finance can be raised for new investments.
Most countries, characterized by underinvestment and low network growth, are unlikely
to break out without reform of the tariff structure. As a rule, those countries at more
advanced stages of development have adjusted tariff structures to allow for more
balanced charges between households and businesses and have raised the overall level of
tariffs. The need for investment in this sector to expand capacity and improve service
quality is substantial. The necessary expansion in networks will not be achieved without
recourse to private finance. However, unlocking this finance will require a commercial
approach to telecommunications and credible reform of tariff structures.
Table 2:
Telephone Tariffs in Africa and Other Regions in 1996 (US$)
Residential
Connection
Monthly
Sub
Business
Connection
Monthly .
Sub
Local Call
Amount As a
% of
Per Capita
GDP
Africa 95 6.4 120 6.8 0.10 19.3
America 165 7.8 205 16.8 0.07 2.8
Asia 160 6.7 245 11.7 0.04 8.3
13

Europe 187 8.0 301 11.1 0.11 1.4
Oceania 67 9.2 89 15.1 0.12 5.1
World 144 7.3 208 11.6 0.08 8.6
Source: International Telecommunication Union
14
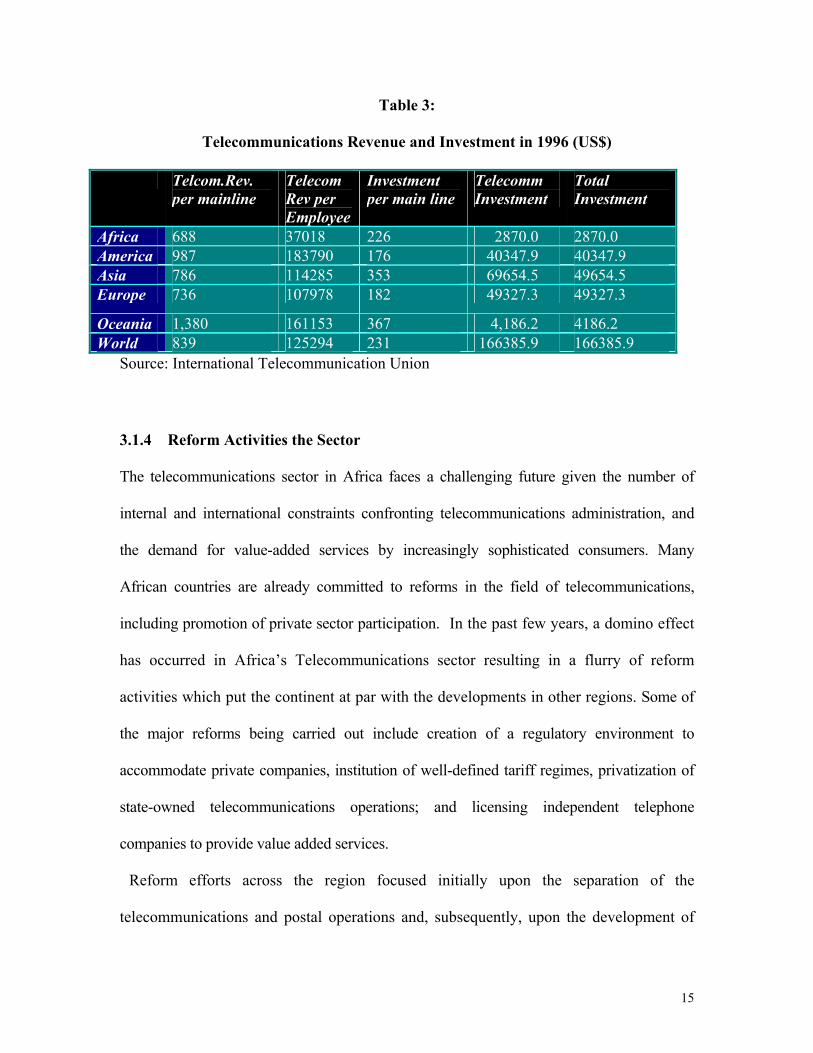
Table 3:
Telecommunications Revenue and Investment in 1996 (US$)
Telcom.Rev. per mainline
Telecom Rev per Employee
Investment per main line
Telecomm Investment
Total Investment
Africa 688 37018 226 2870.0 2870.0 America 987 183790 176 40347.9 40347.9 Asia 786 114285 353 69654.5 49654.5 Europe 736 107978 182 49327.3 49327.3
Oceania 1,380 161153 367 4,186.2 4186.2 World 839 125294 231 166385.9 166385.9
Source: International Telecommunication Union
3.1.4 Reform Activities the Sector
The telecommunications sector in Africa faces a challenging future given the number of
internal and international constraints confronting telecommunications administration, and
the demand for value-added services by increasingly sophisticated consumers. Many
African countries are already committed to reforms in the field of telecommunications,
including promotion of private sector participation. In the past few years, a domino effect
has occurred in Africa’s Telecommunications sector resulting in a flurry of reform
activities which put the continent at par with the developments in other regions. Some of
the major reforms being carried out include creation of a regulatory environment to
accommodate private companies, institution of well-defined tariff regimes, privatization of
state-owned telecommunications operations; and licensing independent telephone
companies to provide value added services.
Reform efforts across the region focused initially upon the separation of the
telecommunications and postal operations and, subsequently, upon the development of
15

separate regulatory agencies. By 1998, 27 countries in Africa had separated their postal
and telecommunications operations, and 30 countries had corporatized the primary
operator.
In the regulatory sphere, 18 countries across Africa had undertaken the
establishment of a separate regulatory agency by 1998. However, most
telecommunications regulatory agencies so far created in Africa have limited powers -the
sector ministry retain the authority to issue directives to the regulator, appoint the heads
of the agency, and control the agency’s funding. In Uganda, for example, the ministry in
charge of telecommunications is also responsible for tariff approval and the establishment
of licence fees, while in Namibia, the operator is responsible for numbering, tariffs and
interconnection rates. In many instances, the establishment of the regulatory agency has
occurred in tandem with the privatisation process. In other countries, the introduction of
a regulator has occurred prior to the initiation of liberalization and privatisation plans,
such as in Botswana, Mauritius, Nigeria, Tanzania and Zambia.
Privatisation of state-owned national carriers in Africa began in 1989 with the sale
of the majority of shares in Guinea-Telecom in Guinea-Bissau, and STP/CST of Sao
Tome and Principe in the same year. Between 1989 and 1997, close to 25 per cent
partially privatised their state-owned telecommunications operator. In addition, six more
countries have initiated, or announced, plan to sell equity stake in their state-owned
telecommunication operator to private investors. However, competition in nation-wide
basic services is allowed in just two markets, Ghana and Uganda, where second national
operator licenses have been issued.
16

The cumulative effect of these reforms is a substantial increase in
telecommunications infrastructure. In 1996, Africa recorded its highest annual growth
rate of 10 per cent in telephone main lines. The highest growth rates were recorded by
Botswana, the Gambia, Cape Verde and Mauritius. North African countries, however,
recorded marginal decline.
3.2 Internet Access Internet is today one of the most dynamic telecommunication markets in Africa in spite of
the fact that the region remains behind the rest of the world in informatics and information
technology, accounting for less than 1 per cent of global spending in the sub-sector.
Table 4: Privatization of African PTOs, 1996-97
Date Sold
Company Country % Sold
Price (US$m)
Price per Line (US$)
Note
Mar-96 Sotelgui Guinea 60% 45 6909 Sale to Telekom Malaysia
Dec-96 Ghana Telecom
Ghana 30% 38 1626 Sale to G-COM Ltd. Consortium headed by Telekom Malaysia
Jan-97 Cl-Telecom
Cote d'Ivoire
51% 210 3172 Sale to FCR (France Telcom subsidiary) for FF1.05 billion
Mar-97 Telkom South Africa
30% 1261 987 Sale to Thintnana consortium (SBC (USA) (60%) and Telekom Malaysia (40%) for R5.58 billion
Jul-97 Sonatel Senegal 33% 90 2840 Sale to FCR (France Telecom subsidiary) for FF650 million
17

Total/Average 1,644 1,170 Source: International Telecommunication Union
18

Table 5: Comparative Internet Statistics for Africa and the Rest of the World, 1996
Internet Host Host per
10,000 inhab
Total Users Estimated
PCs
Estimated
PCs per 100
Inhab
Africa 106,675 1.44 684,445 2,985 0.64
America 10,881,849 139.18 24,434,982 113,093 15.87
Asia 1,042,738 3.04 9,209,732 36,608 1.26
Europe 3,621,752 45.67 13,455,435 72,864 9.56
Oceania 599,744 208.71 2,304,748 6,650 30.31
World 16,252,756 28.14 50,089,342 234,200 4.65
Source: International Telecommunication Union
19

0
2000
4000
6000
8000
10000
12000
14000
Africa Asia Europe Oceania
Chart 4: Comparative Internet Statistics for Africa and the rest of the World (Thousands)
Internet hostTotal UsersEstimated PC's
Source: International Telecommunication Union.
Over the past five years, the number of African countries with access to the internet has
risen dramatically. It was first introduced to Africa through a range of initiatives by national,
20

international and non-governmental organizations, Internet is now clearly becoming a
commercial undertaking with increasing private investment. Most of the countries (47 of the
54 nations) in the region have developed some form of Internet access in capital cities, either
through local dialup, store and forward e-mail with a gateway to the internet, or through a
full leased-line service. About 44 countries and territories have achieved full Internet public
access services at least in capital cities. There are only five countries- Comoros, the
Republic of Congo, Eritrea, Libya and Somalia that do not have plans for full internet
assess.
3.2.1 Network
The key indicators of internet development are: (1) the number of host computers, (2) the
number of internet service providers (ISPs) and (3) the number of users.
a. Internet host computers: In 1997, there were 129,326 internet host computers in
Africa, of which 122,025 were in South Africa, 3,310 in North Africa and 3, 991 in Sub-
Saharan Africa. The density of internet hosts was 28.16 hosts per 10,000 people in South
Africa, 0.25 in North Africa and 0.07 in Sub-Saharan Africa. The average for Africa was
1.70.
b. Internet Service Providers (ISPs): About half of the countries in Africa allow
competition and have more than one ISP. Of the 300 or so ISPs in the region, around 200
21

offer full internet services. South Africa has the highest concentration of ISPs with nearly 80
service providers.
c. Internet Users: In 1997, there were 896,120 Internet users on the continent of Africa,
in addition to 800,000 in South Africa. This is equivalent to approximately six users for each
host computer. The number of users averages about one user per 5,000 people (excluding
south Africa with a rate of one to 65 people), compared to a global figure of one internet
user per 45 people; or one per 6 in Europe and North America.
3.2.2 Tariffs
The high price of internet connections and personal computer (PCs) relative to income is a
major inhibiting factor to a wider use of internet in Africa.. Estimated PCs per 100
inhabitants in 1996 was just 0.66 compared with 15.87 in America, 9.56 in Europe and
30.31 in Oceania. Considering the lower incomes of most African countries, it is unrealistic
to expect widespread Internet usage on the continent. As the internet market in Africa
becomes increasingly liberalized, and market forces take firmer root, prices will be driven
lower owing to increasing competition among ISPs, the privatisation of state-owned
telecommunications corporations, and the liberalization of domestic telephone markets.
3.2.3 Bottlenecks
Internet use in Africa is limited. The basic obstacles in the path of rapid Internet growth are
the lack of telecommunication infrastructure, and the relatively high hardware and
transmission costs. Although many countries have taken major steps to improve their
22

infrastructure, great variation still remains between regions and countries; rural areas, where
70-80 per cent of the population resides, are largely uncovered by telephone service.
International internet bandwidth is lacking because international leased lines are costly and
crowded, and peering between ISPs is limited. Proposals, such as the Africa One and SAFE-
2 undersea fibre-optic cables, or wireless technologies including WLL, VSAT, HF radio and
GMPCS systems, or stratospheric Helium supported balloons promise to extend internet
services to both urban and rural areas. Hardware is much more expensive in Africarelative
to many other parts of the world due to high import tariffs and little price competition.
An increasing number of countries are allowing internet service provider (ISP)
competition, even though more than ten countries still hold monopoly control. PTOs have
assumed a monopoly position especially in countries where the Public Telecommunications
Operator (PTO) established the international internet backbone with some exceptions, such
as South Africa, Mozambique and Zambia. Foreign internet service providers are
increasingly entering into Africa and are expected to gain market share from the local
companies. Open entry for ISPs, however, is not enough to ensure rapid Internet growth. An
appropriate, “Internet-friendly” regulatory framework is also important to achieve effective
entry, survival and growth of ISPs. High license fees, for example, can limit the entry of
ISPs.
23

Table 6: Selected African PTOs Providing Internet Service
Country PTO URL
Benin OPT www.opt.bj
Botswana BTC www.btc.bw
Burkina Faso ONATEL www.onatel.bf
Cameroon Intelcam www.camnet.cm
Cape Verde Cabo Verde Telecom www.cvtelecom.cv
Centre Afri. Rep. SOCATEL www.socatel.intnet.cf
Chad OPT www.tit.td
Djibouti STID www.intnet.dj
Ethiopia ETA www.telecom.net.et
Guinea SOTELGUI kassa.leland-gn.org
Madagascar TELECOM MALAGASY www.telma.net
Mali SOTELMA www.sotelma.ml
Mauritania OPT www.opt.mr
24

Morocco ONPT www.onpt.net.ma
Mozambique TDM www.tdm.mz
Niger STIN www.intnet.ne
Senegal SONATEL www.sonatel.senet.net
South Africa Telkom www.telkom.co.za
Togo Togo Telecom www.togotel.net.tg
Zambia ZAMTEL www.zamtel.zm Souce: International Telecommunication Union
25

3.3 Transport
Transport constitutes an important sector for the enhancement of economic growth and the
socio-economic integration of the African region, particularly the promotion of intra- and
extra-African trade. However, despite the efforts made in the past five decades to develop
the transport sector in Africa, it has remained inadequate and ineffective. The general lack of
repairs and maintenance in infrastructure has led to further deterioration in the sector in
recent years, and has, as well, increased the magnitude of its operational problems and costs.
The environmental implications of transport policies and projects also received low priority.
However, despite the difficult environment of high operating costs and low capacity
utilization, the various sub-sectors of transport have shown some remarkable resilience.
3.3.1 Roads
In Africa, road transport is the most widely used means of transportation. The fragmentary
nature of the railway system and the limitations imposed on the scope of inland water
transport by geographical factors are such that the transport of people and goods by rail and
inland waterways has to be supplemented usually by road transport over long distances.
3.3.1.1 Road Network
An accurate assessment of the development of the road networks in African
countries is made difficult by the lack of reliable statistical information and the compelling
necessity to employ, for analytical purposes, surrogate indicators, such as aggregate lengths,
classified according to operating conditions, instead of such standard indices as ton-
kilometre or passenger/ kilometre.
26

Chart 5: Paved Roads as Percentage of Total Road Network by Region (1996)
0 10 20 30 40 50 60 70
Central Africa
West Africa
South Africa
East Africa
North Africa
Africa
Africa had approximately 311,184 kilometers of paved roads in 1991 (see Table A2), with
half of them in poor conditions. Chart 4 indicates that only 24.2 percent of total road
network in Africa were paved in 1996 albeit with considerable regional diversity. 57.4
percent of the roads in North Africa were paved compared to 25 percent in South Africa and
10.2 percent in Central Africa. Road densities per km2 are generally much lower than those
of Asia and Latin America. Road construction and maintenance standards vary greatly in
Africa: few countries are able to construct and maintain trunk-road systems to stipulated
requirements and standards according to volume and weight of traffic. Road building has
traditionally been given more priority than road maintenance in most African countries, with
scant attention to the imperatives of recurrent costs and road management once a road has
been constructed. Besides, as the road networks expands, the institutional and financial
27

burden has tended to increase much more rapidly than the national budget could cater for,
especially in times of socio-economic crisis.
Another important dimension to the quality of infrastructure is maintenance and
renewal. Lack of maintenance has left over 50 per cent of the paved roads in poor
conditions. Over 80 per cent of the unpaved main roads in Africa would be considered just
fair. The case of rural feeder roads is even worse; up to 85 per cent are estimated to be
currently in poor conditions.
The constructing of international road networks on a sub-regional basis in Africa has
received much greater attention. However, a real regional African road system does not as
yet exist; what exists, instead, is a large number of separate national road networks that are
ineffectively coordinated, and are at best a series of ad hoc inter-country road links and
connection.
3.3.1.2 Demand and Supply Pattern
National road networks in Africa have not kept pace with the growing demand: kilometre
lengths are limited and their standards of construction often low. The existence of
inadequate and poorly maintained rural and feeder roads connecting villages and farming
areas with each other, and to market centres is a major gap in rural transport in most
countries. And few cities have been able to keep pace with road network needs. As
agriculture and industry expand, and as national and subregional economies develop,
existing road networks will require tremendous extensions and improvements in quality. In
particular, road links between nations will have to be strengthened to meet large scale
demand for intra-and inter-subregional goods traffic; all of this require heavy capital
investment and expenditure on roads in many African countries.
28

.
3.3.2 Rail
Railways in Africa are fragmented, and can hardly be described as a system since the
railways run from the interior to sea ports, a reflection of their antecedent as a transport
system designed for external trade purposes.
3.3.2.1 Available Network
The aggregate network of African railways is estimated at 73,000 route kilometres, of which
South Africa alone accounts for some 22,500 km. Eleven countries namely; Burundi,
Central Africa Republic, Chad, Cape Verde, Comoros, Djibouti, Mauritius, Seychelles,
Somalia, the Gambia, Guinea Bissau and Libya have no railway system. With the exception
of North Africa, railways in Africa generally have a low level of traffic. Most of the lines are
of light rail, and are unsuited for fast and heavy traffic. Moreover, there is general
deterioration due to maintenance problems.
The national railway networks in Africa are mostly independent of each other and,
with the exception of Eastern and Southern African railways, unconnected among
themselves. All the networks in Africa were built at the end of the nineteenth century or the
beginning of the twentieth century, with different technical characters, gauges, couplings,
brake systems, buffers, etc. The only exceptions are, Tazara, the Trans-Gabonese, the Trans-
Cameroonian and the mining lines. The 1.067 m gauge predominates, especially in sub-
Saharan Africa, whereas the 1.435 m gauge accounts for 76.1 per cent of the total
kilometrage in North Africa.. Upgrading existing railway lines would involve major
investments in track realignment, resignalling, safety systems and rolling stock..
29

3.3.2.2 Demand and Supply pattern
Almost all the railways in Africa enjoyed monopoly or near-monopoly status at
inception, especially for long- and medium- distance transport of goods and peoples. With
the spectacular development of road transport and to a lesser extent, air transport, in the
1970s, railways have, however, faced increased competition in the transport market, to
which they have not always been able to positively respond and adapt.
3.3.2.3 Tariffs
Railway tariff has stagnated or declined in recent years, and measures of operational
efficiency have shown little improvement. For example, locomotive availability remained
generally low at around 50 percent, although both Uganda and Zimbabwe have improved
performance in response to restructuring plans. Most railway authorities in Africa have not
pursued sustainable tariff policies. Being public or semi-public enterprises, they were not
always profit-oriented or cost- conscious in their operation, limiting their ability to maintain
the existing networks, let alone upgrade or expand them. Whenever they made profits, they
were required to pass them to the users in the form of reduced tariff rates. The tariff basis
was the same throughout the network, varying only with distance.
Freight rates by rail in Africa are on average about twice as high as those in Asia and
one and half times those in Latin America. But, at the same time, rail operations run at a
deficit. A number of reform programs are under way. These include increased managerial
autonomy and sub-contracting more services to the private sector. Some have sub-
contracted part, or all, track maintenance to the private sector (Cameroon, Gabon, Nigeria
30

and Senegal) and Senegal has also sub-contracted cleaning of rolling stick, maintenance of
wagons, catering and parcels traffic. The broadest private sector initiative involves re-
unifying the railways of Cote d' Ivoire and Burkina Faso, with a view to operating them
under a concession agreement with the private sector.
3.3.3 Airports
Air transport network in Africa is still relatively underdeveloped. All countries in the region
have at least one international airport as well as several smaller ones. Few of them are
capable of handling large amount of traffic. Less than 50 per cent of the 5,304 potential air
links among the countries in the region are actually operational or being actively exploited at
present. The countries with the highest number of airports are Egypt (17 airports) and
Nigeria (15 Airports). Most of the airports lack modern equipment and infrastructure. They
are characterized by deteriorating runways, and obsolete traffic control equipment. Much of
the infrastructure required for ancillary activities, such as customs and immigration, air
cargo, catering, baggage handing and connecting surface transportation, is lacking compared
with market needs. For example, operational and safety shortcoming that plague Nigeria’s
international airports have given them the reputation of being among the worst in the World.
Almost every African country own at least one airline although some of them are
being privatized in recent times. However, Air Afrique is a regional airline, jointly owned
by ten countries. The privatized airlines include Kenya Airways incidentally the first
airline to be privatized in Africa, Royal Air Maroc and Air Tunisia both of which are
partially privatized. Nigeria, however, adopted the liberalisation of the domestic aviation
31

industry resulting in the licencing of 22 private carriers, of which 14 offer scheduled
passenger service, 7 carry cargo and the balance provide charter fights.
Only Cote d’ Ivoire is currently actively reforming its airports with the ceding of the
management of Abidjan’s international airport to a French international consortium, Aeria,
which has pledged to spend CFA 14 billion upgrading the airport.
3.3.3.1 Tariffs
The airlines in Africa suffer from high operational costs compared with their counterparts
world-wide, including other developing regions; they lack proper maintenance facilities
locally and their tariffs are generally uncompetitive in the absence of subsidies. With the
growth of mega-airlines in many regions of the world, the African airlines, being mostly
small and poorly equipped, are unable to compete in the international market. And the only
hope for survival for most of them lies in mergers with bigger and more competitive
carriers.
3.3.3.3 Demand and Supply Pattern
Air services are restricted by low demand in several countries. Apart from Air Mauritius
which accounted for about 50 per cent of total persenger traffic in 1997, the share of African
airlines in international traffic is very low, owing in part to a reputation of poor services and
reliability. For example, the share of Air Egypt in international traffic is only 25 per cent at
most, despite fare reductions in recent times.
32

3.3.4 Sea Ports
Maritime transport is extremely important to African countries due to the nature of its
operations, and the high proportion of traded goods transported by sea. However, the poor
quality of port services and infrastructure in Africa, and the low level of trade volumes are
some of the major limitations on the growth of this sub-sector. Port productivity is, on
average, about a third of international norm due to poor management, excessive
bureaucracy, and inadequate as well as unreliable of equipment. Delays in clearing goods
are frequently a problem. Most ports are in need of modern, better managed facilities to
serve traffic for which sea transport has a significant cost advantage over surface transport,
such as dry and liquid bulk cargoes or containerized cargo. The port of Mombassa, for
instance, has only two cranes one of which is frequently out of order. The main port of
Ghana was recently rehabilitated and expanded but suffers from mostly human
inefficiencies. Manufacturers habitually post employees in the port for several days on end
to make sure that the goods move in and out of the port on time. There is generally a need
for upgrading of existing ports in Africa.
Less than two per cent of the African merchant fleet capacity are container ships; the
majority being conventional cargo ships. The shipping lines that principally service long-
distance sea routes consider most of Africa's coastal traffic as mere subsidiary to their
traditional overseas activities.
3.3.4.2 Tariff
Ocean freight charges in Africa are competitive. The impression that ocean freight charges
from Africa are prohibitively high is not supported by the facts. Empirical evidence
33

provided by Biggs, et al. (1994) and presented in Table 7 on freight and port charges from
five African countries to the port of New York/Newark and a comparison with similar
charges from Sri Lanka and Bangladesh, two countries in East Asia, indicate that freight
charges generally reflect their relative distances to the port of destination and appear to give
West African countries a slight competitive advantage. However, port charges in the
principal ports in Africa are higher than the comparable charges in the two Asian ports.
Consequently, when freight and port charges are added up, the costs of transportation from
some ports in Africa may actually be higher than from those ports in East Asia. Interviews
with a number of large shipping agents indicate that the frequency of sailing from the
principal African ports to New York/Newark is also not a constraining element.
34

Table 7: Shipping Costs from Selected Ports to New York/Newark for a 40 Foot Container filled with Garments
Country Zimbabwe Kenya Cote d'Ivoire
Senegal Ghana
Sri Lanka
Bangladesh
Port Durban Mombassa
Abidjan
Dakar Accra Colombo
Chittagong
Costs Ocean Freight to NY/Newark (USS$)
3,360 4,600 4,380 4,330 4,580 5,190 5,120
Port Charges (USS$)
2,060 2,044 1,580 1,411 578 276 333
Total (USS$) 5,420 6,644 5,960 5,741 5,158 5,466 5,543
Time Duration of Sailing (Days)
38 35 15 17 20 32 37
Overland Transportation (Days)
5-10 1-2 n.a n.a n.a n.a n.a
Total Transport Time (Days)
43-48 36-37 15 17 20 32 37
Source: Biggs, et al (1994).
. 3.4 Electricity
3.4.1 Available Network
Total electricity generation in 1994 was 350,000 Gigawatt-hours. The generation mix is
dominated by fossil fuel generating plants which account for 81 percent of total
electricity generation, with hydro accounting for just 15 per cent. A small fraction of
available hydro resources is utilized in Africa, with 64.4 percent of the exploitable hydro
capacity located in East and Southern Africa, 34.2 percent in West Africa and 1.2
percent in North Africa. This is mainly due to shortfalls in water-flow associated with
35

climate change in some countries, low demand in countries endowed with immense
hydro resources, and potential transmission losses associated with long distance
transmission from countries endowed with immense hydro resources to energy deficient
countries and regions. Oil-based generation is more uniformly distributed in Africa while
coal-based generation feature prominently in the southern African countries of South
Africa, Zimbabwe, Botswana, and Mozambique; and in Morocco in North Africa and
Niger in West Africa. Gas fuelled plants are of increasing importance in Algeria, Nigeria
Tunisia. Nuclear and geothermal plants are relatively unimportant at 2.7 and 0.1 per cent
respectively. Kenya remains the only country exploiting its geothermal resources, though
progress in this direction remains lack-lustre.
In terms of regional distribution, North Africa accounts for about one third of
Africa's electricity production based largely on burning oil supported by coal and natural
gas. West Africa's share of 9 per cent is based on a mixture of hydro, oil and gas. Central
Africa's share of 4 per cent is dominated by hydro and East Africa's share of 3 per cent
consists of s mixture of oil and hydro. Southern Africa produces the largest share of
Africa's electricity production-about-55 per cent which is dominated by hydro and coal-
burning generating plants.
The region's generation, transmission and distribution systems tend to be old and
inefficient, resulting in often substantial losses of generated energy, as much as 40
percent in the case of Uganda. These system losses have further limited the amount of
energy available for production and consumption. Furthermore, in many countries
consumers have experienced frequent power outages as well as voltage fluctuations,
which damage electronic equipment and motors. This unreliability has forced many
36

enterprises in the region to buy and install their own generators, thus raising their
overhead costs.
Self-provision of electricity is common across the region. In Uganda, most large customers
maintain stand-by diesel generators.5 In Guinea, between 1983-1992 the private sector
installed for its own use some 70 MW of power generation, and in 1993 produced some 109
GWH of electricity, almost as much as the national electric utility6
3.4.2 Demand and Supply Pattern
Africa’s state-owned energy sector in the early 1990s typifies some of the worst failings of
the African public monopoly model. While deficiencies in the public enterprises model are
hardly unique to Africa, its weak administrative capacity and legacy of political instability
exacerbate the problem.
Countries in the region have one state-owned company performing the four separable
activities of generation, transmission, distribution and supply. Only a few countries, such as
Ghana, have separate companies responsible for generation and transmission, and
distribution. Private sector participation in the power sector, although not legally
prohibited, is negligible in most countries in the region. Available data on the structures of
power sectors in the region and the policies of different governments suggest that the
pattern of vertically integrated monopoly enterprises with little or no autonomy from
government to operate in a commercial manner is typical of Africa. For example, the utility
SONEL in Cameroon is approximately 93 percent state-owned, with a board of directors
5ESMAP (1995b)
6World Bank (1995b)
37

appointed by the government’ UEB in Uganda handles generation, transmission and
distribution, and also regulates itself; and NEPA in Nigeria is a state monopoly, and
government controls all procurements and foreign exchange transactions. Almost all
countries in the region have opted for an electric utility industry that is an arm of
government and generally vertically integrated.
Table 8 presents two performance indicators for selected countries in the region:
transmission and distribution losses and rate of return on net fixed asset. Countries perform
differently according to these indicators. Uganda has, for instance, transmission and
distribution losses of 38 percent and zero rate of return on net fixed asset, while Ghana has
lower transmission and distribution losses (17.8 percent) and a higher rate of return on net
fixed asset (6 per cent) than Uganda. Such differences are also observed when countries in
the region are compared with some countries in other regions of the world (Table 8).
Comparing the performance of the power sectors in most of these SSA countries with that
of Chile, a developing country which has reformed its power sector, the latter outperforms
most of the former (at least according to the two indicators that we cite in Table 8). (The
only exception is South Africa1).
Most of these countries have rates of return on net fixed asset and debt service
coverage that are very low. For instance Nigeria, Sierra Leone and Guinea obtained
negative returns in the range of minus 6.2 to 16 percent (Gutierrez 1996). On the issue of
reliability, data for power systems in Africa are extremely limited; moreover, supply is
widely considered to be low in several African countries. Alternatively, electric utility
industry reforms in Chile and Argentina, which led to significant increases in plant
38

availability factors, have reduced the number, length and frequency of outages as compared
to their previous experiences (Gutierrez 1996).
39
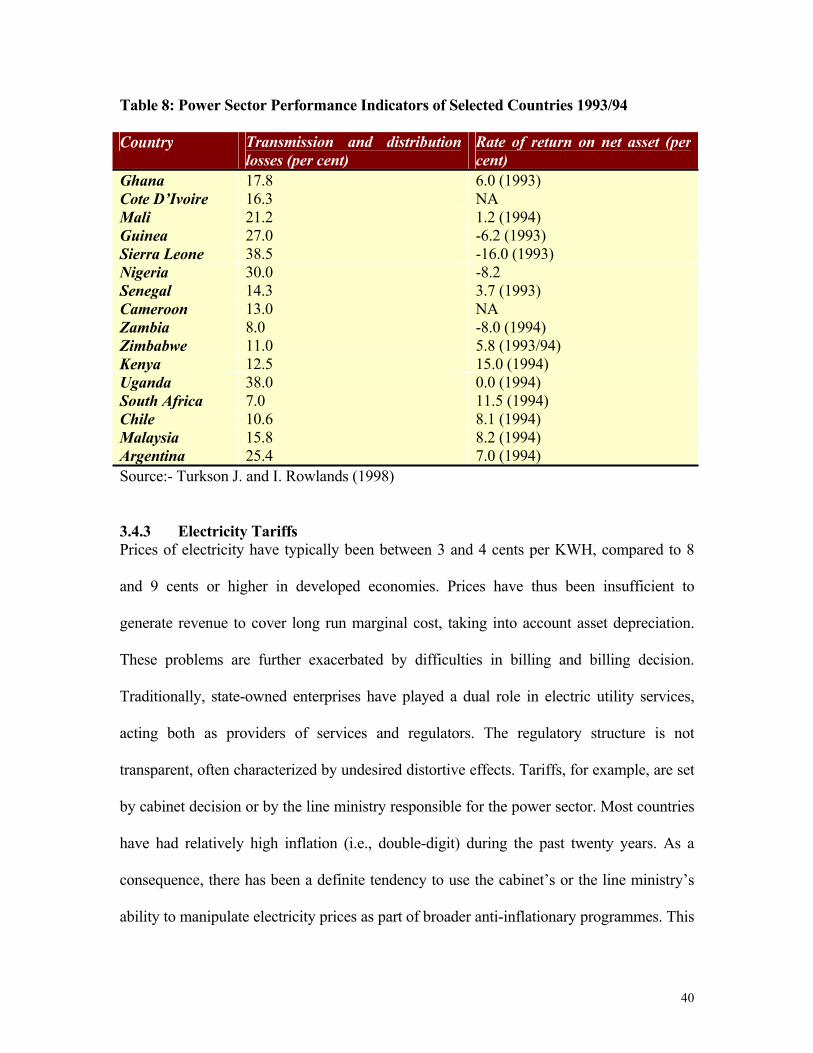
Table 8: Power Sector Performance Indicators of Selected Countries 1993/94
Country Transmission and distribution losses (per cent)
Rate of return on net asset (per cent)
Ghana 17.8 6.0 (1993) Cote D’Ivoire 16.3 NA Mali 21.2 1.2 (1994) Guinea 27.0 -6.2 (1993) Sierra Leone 38.5 -16.0 (1993) Nigeria 30.0 -8.2 Senegal 14.3 3.7 (1993) Cameroon 13.0 NA Zambia 8.0 -8.0 (1994) Zimbabwe 11.0 5.8 (1993/94) Kenya 12.5 15.0 (1994) Uganda 38.0 0.0 (1994) South Africa 7.0 11.5 (1994) Chile 10.6 8.1 (1994) Malaysia 15.8 8.2 (1994) Argentina 25.4 7.0 (1994) Source:- Turkson J. and I. Rowlands (1998) 3.4.3 Electricity Tariffs Prices of electricity have typically been between 3 and 4 cents per KWH, compared to 8
and 9 cents or higher in developed economies. Prices have thus been insufficient to
generate revenue to cover long run marginal cost, taking into account asset depreciation.
These problems are further exacerbated by difficulties in billing and billing decision.
Traditionally, state-owned enterprises have played a dual role in electric utility services,
acting both as providers of services and regulators. The regulatory structure is not
transparent, often characterized by undesired distortive effects. Tariffs, for example, are set
by cabinet decision or by the line ministry responsible for the power sector. Most countries
have had relatively high inflation (i.e., double-digit) during the past twenty years. As a
consequence, there has been a definite tendency to use the cabinet’s or the line ministry’s
ability to manipulate electricity prices as part of broader anti-inflationary programmes. This
40

suggest that real electricity prices have actually fallen drastically n those countries in the
region with high inflation.
3.5 Water and Waste Management
Africa made some progress during the International Drinking Water Supply and Sanitation
Decade (1980-90). The number of persons served in urban and rural areas rose from 110
million in 1980 to 230 million in 1990 (114 million of the later being in urban areas). But
this was overshadowed by rapid population growth, resulting in more urban residents being
without adequate water supplies in 1990 that in 1980. Water supply and treatment are also
deficient in the region. In 1995, only 60.1 and 40.24 percent of the region's urban and rural
population respectively had access to safe water, albeit with substantial variation in
different countries the range was 18 and 18 percent in Central African Republic and 95 and
100 percent for urban and rural areas respectively in Mauritius. Chart 5 presents a
comparative analysis of the percentage of population with access to safe water for Africa
and other regions. Most of the water pipe networks are old and urgently require repair and
replacement.
Source: Adapted from World Bank (1998).
41

0
20
40
60
80
100
Africa South East Asia
LatinAmerica
OECDCountries
Chart 6: Percentage of Population with Access to Safe Water (1995)
UrbanRural
Africa’s performance in terms of access to sanitation is equally deplorable. In 1995, only
36.6 per cent of the population had access to sanitation compare to 51 per cent in South
East Asia, 64.1 percent in Latin America and 96.7 OECD countries (see Table A1).
However, why Mauritius attained 100 per cent access, the comparative figures for Zambia,
Congo Republic and Lesotho are 23, 9 and 6 per cent respectively
A few urban water utilities have been restructured (Conakry, Abidjan, Banjul, for
instance). They have moved from being government departments operating with little
commercial autonomy and no accountability to commercially run public agencies or to fully
or partially privatized firms. Experience has shown that delivery of water to the poorest
segments of the population becomes both cheaper and more reliable through such reforms
but this transition is still in its early stages.
3.5.2 Tariffs
Except in very few countries, water and waste-water sectors rely on governments for a
substantial part of funding requirements, especially for capital investment. Charges are thus
42

kept low to convey benefits to households. Table 9 presents the median price of water for
several African countries in 1993. The figures compare favourably with the median price of
$0.54 in Asia Pacific but low compared to $2.24 in industralized economies. As with other
infrastructure sectors, the balance between household and industrial water tariffs tends to fall
more heavily on industry. Currently, the price of water does not reflect its scarcity, resulting
in wasteful use of water.
43

Table 9: Accessibility to Water and Tariff Rates in Selected African Cities
Access to Portable Water
Consumption of Water
Median Price of Water
City < 200m 1/pers/day 1993 US$/M 3 Abidjan 61.70% 111.00 $0.35 Addis Ababa 76.60% 27.00 $0.44 Bamako 53.00% 50.00 $0.14 Cairo 97.9% 360.00 $0.04 Conakry 75.00% 50.00 $0.50 Dakar 92.00% 69.00 $0.50 Nairobi 93.00% 69.00
$0.20
Tunis 96.30% 70.00 $1.49 Yaounde 85.30% 60.60 $1.00 All figures are for 1996, except stated otherwise Source: UNCHS Global Urban Indicators Database [Urban bias]
3.6. War Affected Countries
Many devastating conflicts have persisted in several African countries ( Ethiopia,
Namibia, Uganda, Angola and Mozambique) while pernicious internal struggle continue to
plague others (Liberia, Somalia, Sudan and Sierra Leone). The damage inflicted on the
social capital and economic potential of these countries have been horrific. The impact of
warfare on physical infrastructure has been enormous, exercebating the already precarious
situation. While war ravaged, infrastructure stocks including roads and bridges were often
the primary targets. Existing infrastructure stocks were often severely depleted. For
example, in Uganda, the transport infrastructure suffered greatly from neglect during the
troubled period between 1971 and 1986. The international airport at Entebbe was
extensively damaged during the conflict with Tanzania in 1979-80. The railway system
was not left out as many sectors of tract, apart from the rolling stock, were in serious need
of remedial work by 1986. This has been the trend in many war ravaged economies.
44
3.7. Landlocked Countries and Infrastructure
Africa has a considerable number of landlocked countries, incidentally among the poorest
countries in the world. The current state of infrastructure provision in these countries is
demonstrably poor relative to other African countries, thus constituting impediments to the growth
potentials of these economies. Countries like Malawi, Uganda, Zimbabwe and Zambia rely on
neigbouring countries to ensure reliable delivery. Transportation problems are compounded for
landlocked countries by problems in intermodal transportation. In many cases, railway system
differ among countries, schedules are not coordinated, and even in transport by road, goods tend to
be delayed by customs control. It takes a typical Ugandan business man, three and half months
from the time of shipment departure from Europe until arrival Kampala, three times what will be
needed under comparable conditions elsewhere in the world (Donaldson, et. al. 1997).
3.8 Infrastructure and the Environment
Infrastructure development in Africa has largely proceeded with minimal consideration for
environmental standards and quality. This has been a major factor in the severe degradation of the
environment in the form of industrial pollution. In any case, environmental issues have not been
given serious policy considerations in Africa’s development agenda. Environmental awareness has
only become perceptible in recent years since the Earth Summit in Rio de Janeiro in Brazil in June
1992. The concept of sustainable infrastructure development has become relevant in Africa.
Creating a sustainable infrastructure economy based on efficient resource use should be given
greater consideration. The environmental problems within urban areas often termed the ‘brown
agenda’ is more immediate in Africa. The issues involve include the lack of safe water supply and
sanitation, inadequate solid and harzadious waste management, emissions from cars etc. The need
45

arises to introduce environmental sound practices in the management of existing infrastructure in
Africa.
4. Causal Factors in the Inadequate Provision and Delivery of Infrastructure Services in Africa.
A pertinent question is what led to the present unsatisfactory outcomes? In spite
of the recognition that each infrastructure sector has its own peculiar problems, there are
common weaknesses in most African countries. An extensive inquiry is beyond the scope
of this paper, but it suffices to focus on several general reasons affecting infrastructure
delivery in Africa.
While political and economic instability, low per capita incomes and often
challenging geographic conditions have significantly constrained the development of
Africa's infrastructure, there is abundant evidence that the protracted crisis in the sector is
due mainly to past and current policy choices. A major explanatory factor is the prevalence
of a regime of price controls that for a long time had little consideration for commercial
objectives including cost recovery. Prices amount, on average, to just above a third of
supply costs and are half as much as those in industrial countries. The pricing regime is
characterized by administered prices that are in many cases appreciably below what is
required to operate, maintain and rehabilitate facilities, and consequently entail large
efficiency losses and social costs. Too often, controlled prices often imposed on state
infrastructure monopolies, prices that are unresponsive to changing market conditions,
encourage uneconomic investment of resources targeted at meeting the inefficient and
unsustainable growth in the demand for infrastructure services. It is evident that prices
that are below economic costs and what is needed to finance infrastructure development
46

and maintenance expenditure in the face of escalating cost conditions in the industry are
unlikely to restrain excessive demand and minimize uneconomic investment of resources.
With negative or at best low positive financial and social rates of return to infrastructure
investment associated with low product prices, it is not surprising that supply shortages
persisted in the sector. In response to these shortages, many businesses and households
have resorted to self-provision, often at high cost. For example, according to a 1988 study of
179 Nigerian manufacturers, 92 percent of forms surveyed owned electricity generators, and
44 percent had boreholes to assure their own private water supply. In the face of chronically
unreliable public services, many also had acquired radio equipment for communications (37
percent of firms) and vehicles to transport personnel (37 percent) and freight (63 percent).
For firms with 50 or more employees that could practice economies of scale, the extra costs
of private power generator amounted to some 10 percent of the total machinery and
equipment budget; for smaller firms, the burden was as high as 25 percent.7 Substantial self-
provision of infrastructure is also the norm for low income consumers, relief from the failure
of public providers often comes through the informal sector. The best known examples are
private water vendors who use trucks or smaller receptacles to haul water either for
distribution at central locations or to individual dwellings. In some places, private vendors
served 90 percent of households, and in several places purchases of private water amounted
to more than 30 percent of household income.
A fairly robust analysis of incremental reserves that would arise from moderate and
achievable increase in financial returns through pricing reforms in Africa’s infrastructure,
albeit dated, indicates that the net benefit on resource mobilized would amount to about one
fifth and one third of public revenues as shown in Table 11 (Anderson,1989). Furthermore,
7Lee and Anas (1992)
47

such reforms apart from being easy to administer would entail negligible ‘deadweight’ or
efficiency losses.
Table 11: Incremental Reserves from Pricing Reforms in Africa’s Infrastructure
Sector Current contribution Potential Contribution as Percentage to Public Revenue of Public Revenue Overall Incremental Effect
Electricity small or negative 5 – 10 per cent 5 – 10 per cent
Water small or negative 2 – 5 per cent 2 – 5 per cent
Telecoms varies but marginal 5 – 10 per cent 5 – 10 per cent
Roads 10 – 15 per cent 10 – 25 per cent 5 – 10 per cent
Source: Anderson (1987).
Apart from administered prices, several demand and supply-related factors, some
of them interwined, have had a profound negative impact on infrastructure development
in Africa. As in most other developing countries, governments in the region have
assumed responsibility for almost all of these infrastructure services through state owned
enterprises created precisely in order to make socially productive investments so as to
eliminate impediments to the overall economic development. Almost without exception,
the provision of infrastructure in Africa is the exclusive responsibility of the government.
Government own, operate and finance nearly all infrastructure. Thus, the record of success
and failure in infrastructure is largely a story of government's performance. However, these
enterprises have established a poor reputation across Africa. Besides trying to provide a
particular service to an acceptable quality, they are also expected to pursue a variety of
48

“social” goals, including the creation of employment and the subsidization of prices to
consumers, ostensibly with the view to providing broad and affordable access to the
poorer parts of society. These objectives have in reality imposed a variety of costs on the
enterprises as a major employment mechanism has resulted in significantly bloated
workforces. Similarly, the prevalence of widespread input and output subsidies creates
significant wedges between product prices and costs and in the process confront these
enterprises with soft budget constraints and dysfunctional government interference in
sector activities and enterprise management functions that encourage gross inefficiency in
production, distorted demand patterns and investment choices, induced endemic and
expensive delays and cost overruns that encouraged widespread corruption in
infrastructure construction and equipment and material purchases and minimized the
market responsiveness of the sector to changing demand and supply conditions through
excessive regulations. The subsidization of services in reality often allows the more
affluent citizens to benefit disproportionately from artificially low prices by providing
them with better access to these services. In Lusaka, Zambia, for instance, only 28% of
the households in the poorest fifth of the population have access to electricity, compared
to 70% in the richest segment. Similarly, it has been estimated that the poorest fifth of the
population in Tanzania receives only about 10 per cent of the government subsidy for
water, whereas the richest fifth receives about 40 percent. At the same time, these
subsidization polices have invariably translated into smaller revenues. Public utilities
have thus often found themselves in the difficult financial position of not being able to
cover their operating expenses. It has not been possible in many cases to maintain existing
facilities adequately, and new investments have consistently had to be postponed. At the
same time, most governments have suffered from chronic budget deficits, which have kept
them from filling the financial gap. In the end, countries have been left with inadequate
infrastructural facilities, while the responsible enterprises, not motivated by commercial
objectives, have had little incentive to improve their performance significantly. The
Nigerian experience provides considerable support for the distortionary effects and the
disincentives associated with excessive political interference in investment decision,
pricing policy, plant location, equipment choice and employment structure resulting in
higher costs and low earning ability of public infrastructure.
49

Economic theory justifies an important role for government intervention in efficient and
equitable infrastructure use and provision. The arguments rest on several “traditional”
notions of market failure, such as: externalities in consumption and production; scale
economies; non-excludability; information problems about benefits alleviation. But
infrastructure services are diverse and each exhibits these characteristics to varying
degrees. Policies often fail when they do not make such distinctions within infrastructure.
There are several reasons why public provision of infrastructure services have not had the
desirable impact in Africa.
First, under a public sector dominated regime, investments in infrastructure are
often misallocate for various reasons. For example, most of the selected projects are not
based on the articulated needs of the society. Hence, there is no informed prioritisation of
project selection or implementation. Hence, projects of lowest priority could be preferred
to those of topmost priority in terms of the real needs of the society at a given point in
time. Another dimension relates to the obsession with new projects. In this regard, there
is usually excessive concentration of resources on new structures and little or no
allocation to maintenance of infrastructural facilities. Interestingly, however,
infrastructure is the easiest prey for speeding cuts during periods of fiscal crisis, while
priority is given to consumption-promoting expenditure and projects of short term benefit
to the economy. Many on-going infrastructural projects are usually abandoned, only to be
revived, if at all, at very exorbitant costs later on. Another major source of
disenchantment with this policy stance relates to the quality of services. The delivery of
high quality services is usually hampered by technical inefficiency and outright waste.
Inadequate maintenance leads to erratic service supply and distribution, while the low
productivity of such facilities results in very high unit operating costs which are often
times passed on to the consumers. The useful life of affected facilities are also shortened.
The world Bank (1994b), observed that low-income communities are not offered suitable
transport and sanitation options that provide services they value and can afford. Rather,
premature investments in capacity especially in water supply, railways, power and
irrigation have often absorbed resources that could otherwise have been devoted to
maintenance, modernisation or improvements in service quality. More significantly,
because infrastructure investments are immobile and serve local markets, excess capacity
50

cannot serve other markets and it remains under-used. And in some cases, large public
projects have been overambitious, placing a costly burden on the economy. Also
important is the twin problem of waste and inefficiency, that seems to claim a large share
of resources that could be used for infrastructural services delivery.
The nature of public decision process with multiple, nebulously defined and often
conflicting objectives which place less emphasis on nor provide adequate incentives for
efficiency of operations is at the root of this problem. Arising therefrom, investment
decisions and tariff policies are often driven primarily by political considerations. Many
infrastructure projects in Africa should never have been embarked upon. Decisions to
proceed with new projects are sometimes taken at the political level. It is not uncommon
for the political element, for reason of prestige or with unjustified claims insist on an
overdesigned capacity. Even within the state-owned enterprises, management is often
appointed more on the basis of political loyalty than competence, and staffing profiles are
more often dictated by political demands rather than felt needs. Costing and pricing
decisions are also guided less by economic but more by political considerations. It is
against this background that agitation have mounted for private sector involvement in the
provision of infrastructure. This, it is hoped, would enhance the preference for economic
considerations and demand-driven decisions process. Greater emphasis will be placed
upon efficiency with its attendant positive effects on economic growth, enhance standard
of living and poverty alleviation. The reduced pressure on government revenue will also
facilitate internal and external equilibria and stimulate foreign investment. Overall,
permission for private provision of infrastructure will suggest to international and
national investors, or development institutions government’s commitment to sound fiscal
management, efficiency and substantial role for the private sector (Kerf and Smith,
1996).
Table 11: Private Infrastructure Projects Worldwide, 1985 – 1995. Number of projects Region Total With project costs Cost US$ billion East Asia/Pacific 223 165 185.6 OECD Europe 252 145 156.6 Latin America 233 168 58.5 USA/Canada 290 219 31.1 South Asia 27 13 6.3
51

Middle East/N. Africa 13 7 4.7 C&E Europe 38 18 3.5 Former Soviet Union 30 14 2.5
Africa 64 7 1.2 Total 1,170 756 450.0 Source: World Bank Infrastructure Project Database and FIAS, World Bank Group.
Redefining public-private sector interface in the provision of infrastructure services
has become an important though controversial policy issue in the search for a more viable
infrastructure sector in Africa. This is particularly vital since the efficiency, productivity
and reliability of infrastructure provision impacts on the efficiency of domestic production
and investment as well as the international competitiveness of the economy. A crucial
variable is also the role of foreign capital. Foreign private involvement in Africa’s
infrastructure has been quite limited as shown in Table 11 which presents private
infrastructure projects word-wide between 1985 and 1995. A cursory examination of the
table indicates that only sixty-four projects were recorded for Africa in the ten year period,
compared to 223 for East Asia/Pacific and 252 for OECD countries. The project sum at
$1.2 billion (less than 1 per cent) is equally deplorable and the reasons are not farfetched.
The region is yet to broaden its investment base beyond energy and mining which remain
the prime attractions. Africa has the unenviable reputation of having uncompetitive product
markets, thin capital markets, perceived high risks as well as legal, procedural and
regulatory impediments. Public enterprises in infrastructure have a lower net worth and are
less attractive to foreign buyers, except perhaps in telecommunications. African
governments until recently resist selling to foreigners. Investors are reluctant to take an
equity position in infrastructure because governments have established consistent pricing
and other macroeconomic policies which continue to undermine infrastructure. Even in
countries where the sector is open to private participation, there is often the problem of
the inability of regulatory and legal institutions to provide credible commitments to create
opportunities for potential investors to cover their investment costs and make profit
including the risk-adjusted opportunity cost of capital. Macroeconomic and political
52

instability as well as legal restrictions on foreign capital discourage the flow of direct
investment to this sector. Investors are wary of internal political volatility and the
uncertainty of obtaining the enforcement of contracts.
53

References
Ahmed, R., (1996) A Critique of The World Development Report 1994: Infrastructure For Development, International Monetary and Financial Issues for the 1990s. (Washington, D. C.: International Food Policy Research Institute). Alexander, I., and C. Mayer, (1997) Creating Incentives for Private Infrastructure Companies to Become More Efficient, World Bank Policy Research Working Paper 1736. Ariyo, A. and T. A. Jerome (1999), “Privatization In Africa: An Appraisal”, World Development, Vol. xx, No.1 (forthcoming) Biggs, T. (1994) Africa Can Compete! Export Opportunities and Challenges for Garments and Home Products in the U.S. Market. World Bank Discussion Papers. Africa Technical Department Series 242. Baumol, W.J. and K.S. Lee (1991). "Contestable Markets, Trade and Development." The World Bank Research Observer. Vol. 6 No. 1 pp. 1-17. Baumol, W. J., J. C. Panzar and R. D. Willig. (1988). Contestable Markets and the Theory of Industry Structure. San Diego California: Harcourt Brace Jovanovich Brook, C. and J. Penelope, (1996). The Guinea Water Lease – Five Years On. The World Bank. Public Policy for the Private Sector. Note No. 78 (1997). Getting the Private Sector Involved in Water – What to Do in the Poorest of Countries. The World Bank. Public Policy for the Private Sector. Note No. 102. Commander, S and T. Killick (1988) ."Privatization in Developing Countries: A survey of the Issues." In P. Cook and C. Kirkpatrick (Eds.) Privatization in Less Developed Countries, N.Y. St. Martins Press. Donaldson, D. J., F. Sader and D. Wagle (1997) Foreign Direct Investment in Infrastructure. The Challenge of Southern and Eastern Africa. Foreign Investment Advisory Service, Occasional Paper 9, The World Bank, Washington D.C. Eggertsson, T.(1990). Economic Behaviour and Institutions. Cambridge Surveys of Economic Literature. Cambridge. Europe Bank for Reconstruction and Development (nd). Infrastructure for Transition. Furubotn, E. and S. Pejovich (1972). "Property Rights and Economic Theory: A Survey of Recent Literature."Journal of Economic Literature. Vol 10, No.4 December. pp. 1137-1162.
54

Guislain, P. (1997) The Privatization Challenge – A Strategic, Legal and Institutional Analysis of International Experience. World Bank Regional and Sectoral Studies. Guislain, P. et al. (1996). Getting Connected – Private Participation in Infrastructure in the Middle East and North Africa. The World Bank Group. Gutierrez. L. E. (1996) “How do Sub-Saharan African Utilities Compare?” in proceedings of symposium on Power Sector Reform and Efficiency Improvements in Sub-Saharan Africa ESMAP, Report No. 182/96, June. Hirshman, A. (1958) Strategies of Economic Development, New Haven, CT: Yale University Press. International Telecommunication Union. (1998) African Telecommunication Indicators. ITU, Geneva. International Telecommunication Union (1998). World Telecommunication Development Report. ITU, Geneva. International Telecommunication Union (1998). General Trends in Telecommunication Reform. Africa Vol. I&II. ITU Geneva. Iwayemi, A. (1998), Economic Perspectives on Infrastructure Deficiencies in Nigeria, Mimeo. Jensen, C. M. and M. H. Meckling (1976). "The Theory of the Firm, Managerial Behaviour, Agency Costs and Ownership Structure." Journal of Financial Economics, Vol. 3, pp. 305-60. Jerome, A. (1997) Public Enterprise Reform in Nigeria: Evidence from the Telecommunications Industry. Final Report Presented To African Economic Research Consortium, Nairobi, Kenya. Jimenez, E. ( 1995) Human and Physical Infrastructure: Public Investment and Pricing Policies in Developing Countries, Chap. 43 in Behrman, J and T. N. Srinivasan [Eds] Handbook of Development Economics, Vol 111B, Elsevier. Turkson J. and I. Rowlands (1998). “Power Sector Reform: Lessons for Sub-Saharan Africa” Conference Proceedings on Experimenting with Freer Market : Lessons from the Last Ten Years and Prospects for the Future, International Association for Energy Economics, May 13 – 16 Quebec, Canada. Pp 289 – 98. Kerf,M. and Smith,W. (1996) Privatising Africa's Infrastructure: Promise and Challenge. World Bank Technical Paper No.337, African Region Series. The World Bank, Washington,D.C.
55

Kohli, H, Mody and Michael Walton. (1997) “Making The Next Big Leap: Systemic Reform for Private Infrastructure in East Asia in Choices for Efficient Private Provision of infrastructure in East Asia (eds) The World Bank Washington, D.C. Lee, K.S. and A. Anas ."Manufacturers' Responses to Infrastructure Deficiencies in Nigeria: Private Alternatives and Policy Options." Chapter 11 in Chibber, A. and S. Fischer (eds.) Economic Reform in Sub-Saharan Africa pp. 106-121. Liebenstein H. (1966). "Allocative efficiency vs. X-efficiency." American Economic Review. 56, 392-415. Millward, R. (1988). "Measured Sources of Inefficiency in the Performance of Public and Private Enterprises in LDC." Ch.6 in P. Cook and C. Kirkpatrick (eds.) Privatization in Less Developed Countries. N.Y. St. Martins Press. Mody, A. (1997), Infrastructure Delivery through Central Guidance" in Mody, Assokha (ed), Infrastructure strategies in East Asian. The untold story. EDI increasing Resources Series. The World Bank. Washington D.C. Nellis, J. R. (1988). Public Enterprise in Sub-Saharan Africa. World Bank Discussion Paper No.1 The World Bank Washington D.C. Ross, S. (1973). "The Economic Theory of Agency: The Principal Problem." American Economic Review. Vol 63 pp. 134-139. Swarrop, V. (1996), "The Public Finance of Infrastructure: Issues and Options", in Mody Asokha (ed), Infrastructure Delivery: Private Initiative and the Public Good. EDI Development Studies The World Bank, Washington D.C. United Nations Economic Commission for Africa (1995) Economic and Social Survey for Africa : !994-1995, ECA Addis Ababa. Van de Walle, N (1989). "Privatization in Developing Countries. A Review of the Issues." World Development. Special Issue. Vol. 17 No. 5 pp. 601-615. World Bank (1994), World Development Report, Infrastructure for Development. (London Oxford University Press). World Bank (1998), World Development Report 1998/99, Knowledge for Development (London Oxford University Press). World Bank (1998), World Development Indicators, The World Bank Washington D.C.
56