Infrastructure and SSLC Result Analysis for the year 2019-20
39
2019-20 PÀ£ÁðlPÀ ¸ÀPÁðgÀ ¥ÁæxÀ«ÄPÀ ªÀÄvÀÄÛ ¥ËæqsÀ±Á¯Á ²PÀët E¯ÁSÉ Infrastructure and SSLC Result Analysis for the year 2019-20 - Hassan District
-
Upload
khangminh22 -
Category
Documents
-
view
1 -
download
0
Transcript of Infrastructure and SSLC Result Analysis for the year 2019-20

2019-20
PÀ£ÁðlPÀ ¸ÀPÁðgÀ
¥ÁæxÀ«ÄPÀ ªÀÄvÀÄÛ ¥ËæqsÀ±Á¯Á ²PÀët E¯ÁSÉ
Infrastructure and SSLC Result
Analysis for the
year 2019-20 - Hassan District

Rur
alU
rban
Tota
lRur
alU
rban
1-D
epar
tmen
t of
Edu
catio
n19
023
1725
2074
819
052
3456
4-Pv
t. A
ided
9810
019
811
3215
97
5-Pv
t. U
naid
ed18
1712
4830
6547
4569
86
Oth
er M
anag
emen
ts(O
ther
than
1,4
and
5)
9739
136
900
378
Tota
l21
035
3112
2414
725
829
1241
7
Boys
Girl
sTo
tal
Boys
Girl
s
1-D
epar
tmen
t of
Edu
catio
n11
2130
411
9854
423
1987
966
1290
7148
57
4-Pv
t. A
ided
1867
7217
8804
3655
8120
2632
1909
18
5-Pv
t. U
naid
ed13
9302
511
2260
125
1566
868
3984
5463
66
Oth
er M
anag
emen
ts(O
ther
than
1,4
and
5)
2254
320
726
4327
065
786
7300
6
Tota
l27
2364
425
2067
552
4439
816
1369
22E
+06
Sanc
tione
dW
orki
ngVa
canc
ySa
nctio
ned
Wor
king
1-D
epar
tmen
t of
Edu
catio
n42
021
3788
641
3513
6284
1173
94
4-Pv
t. A
ided
649
558
9119
382
1585
5
5-Pv
t. U
naid
ed15
276
1429
498
216
3588
1477
83
Oth
er M
anag
emen
ts(O
ther
than
1,4
and
5)
577
444
133
1308
210
115
Tota
l58
523
5318
253
4133
2336
2911
47
Infr
astr
uctu
re fa
cili�
es a
vaila
ble
in D
epar
tmen
t of e
duca
�on
Scho
ols
Cate
gory
Scho
ols
Ow
n
Build
ing
Rent
free
Rent
ed
No
Build
in
g
Low
er P
rimar
y20
748
2055
611
359
15
Upp
er P
rimar
y22
508
2227
912
590
14
Hig
h Sc
hool
s47
2746
6051
79
Tota
l47
983
4749
528
915
638
Man
agem
ent
Low
er P
rimar
yU
pper
Prim
ary
Scho
ol C
ount
Man
agem
ent
Low
er P
rimar
yU
pper
Prim
ary
Enro
lmen
t Cou
ntM
anag
emen
t1-
5th
Stan
dard
6-8t
h S
tand
ard
Teac
hers
Cou
nt
Tota
lRur
alU
rban
Tota
l
2250
839
0382
447
27
2729
2280
1489
3769
1173
125
1949
3074
49
1278
838
358
1196
3824
695
4076
0117
141
Tota
lBo
ysG
irls
Tota
l
1376
151
3125
0831
8278
6307
87
3935
5226
0399
2429
2750
3327
1230
359
3730
0630
6978
6799
87
1387
9343
611
5005
893
671
3138
855
9895
2491
8241
1907
772
Vaca
ncy
Sanc
tione
dW
orki
ngVa
canc
y
1889
039
913
3426
056
53
3527
3009
224
817
5275
1580
514
553
1410
844
5
2967
681
400
281
4118
985
239
7358
511
654
Boy
s To
ilet
Girl
s To
ilet
cwsn
Toi
let
Ele
ctric
ityP
lay
Gro
und
Laib
ary
Cou
mpo
und
Wal
lD
rinki
ng
Wat
erC
ompu
ters
2070
320
712
848
2033
376
3918
574
1779
420
727
1810
2248
522
492
3313
2239
712
475
2099
920
918
2250
471
81
4724
4724
466
4707
3822
4481
4185
4726
3179
4791
247
928
4627
4743
723
936
4405
442
897
4795
712
170
Hig
h Sc
hool
s
Hig
h Sc
hool
s
9-10
Sta
ndar
d
±Á¯
ÉUÁV
£Áª
ÀÅ-¤Ãª
ÀÅS
ch
oo
l N
urt
uri
ng
Pro
gra
m

Introduction
As per Kothari Commission's 1964-66 statement “The destiny of India is being shaped in her
classrooms”, education has been reason for overall growth of all the children studying in Primary and
Higher schools in the state of Karnataka. National Assessment Survey (NAS) exam of 2017 has
researched on the students learning levels stating that there is a decline in passing rate of students from
lower to higher grade. For this, lack of basic facilities, willpower and other reasons are possible.
To assess the learning level of students, SSLC result of 2019-20 has been analyzed. The result has been
analyzed at district wise, block wise, school wise, subjects wise, medium wise, school management
wise, urban/rural area wise, This analysis will help to understand that at which stage duties were not
rendered satisfactorily. So that supervision ofcers can visit the needy schools and give guidance to
improve upcoming 2020-21 SSLC result. This result can be improved only if, everyone from state
level ofcers to class teachers deliver their duties in a time frame.
2019-20 SATS data has been collected through software. This data has been analyzed, and every
government Primary and High schools are classied as A, B, C and D, based on the infrastructure
facilities available in the school.
It is the Department's responsibility to ensure every school in Karnataka has necessary basic facilities.
ThroughJalJeevan Mission programs, Local Municipality, Gram Panchayat, Civic organizations,
Donors, CSR, PPP and other Adoption Programs, the basic facilities in government schools can be
improved.
In this manual, analysis report for bothSSLC result and infrastructure facility of one district, one block
and one school has been analyzed. By using the following link h�p://122.170.12.200/SatsInfraAnalysis/
every High Schools SSLC result and infrastructure ranking of every school can be obtained.
The aim of this analysis is to improve basic facilities of Government schools and SSLC result for the
year 2020-21. For this, all the ofcers from state level to every teacher at school level are engaged in
this improvement process. In this direction, we all have to work as one unit to move all the schools in
Karnataka to Grade “A'. I hope that you will be the real reason for student's better performance in
improving their learning level and thus they have a bright future.
V.Anbukkumar.,I.A.S.
Commissioner for Public Instruction
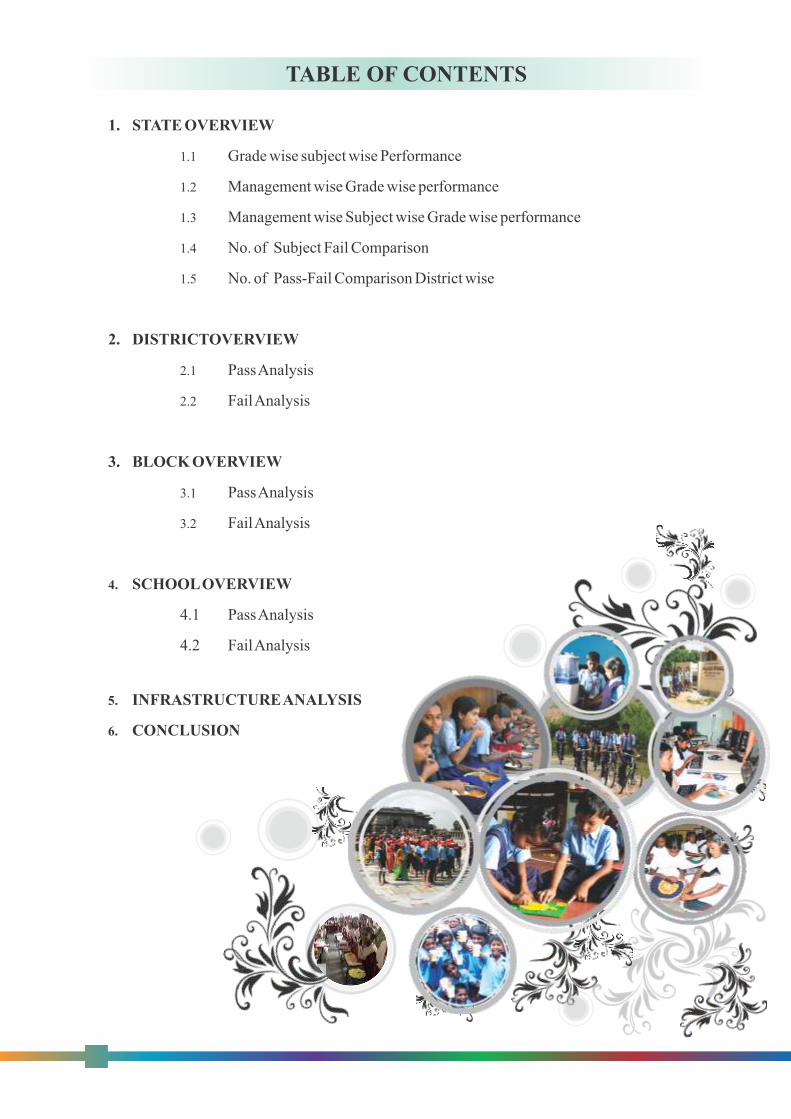
TABLE OF CONTENTS
1. STATE OVERVIEW
1.1 Grade wise subject wise Performance
1.2 Management wise Grade wise performance
1.3 Management wise Subject wise Grade wise performance
1.4 No. of Subject Fail Comparison
1.5 No. of Pass-Fail Comparison District wise
2. DISTRICTOVERVIEW
2.1 Pass Analysis
2.2 Fail Analysis
3. BLOCK OVERVIEW
3.1 Pass Analysis
3.2 Fail Analysis
4. SCHOOL OVERVIEW
4.1 Pass Analysis
4.2 Fail Analysis
5. INFRASTRUCTURE ANALYSIS
6. CONCLUSION

1
Chapter – 1
State Overview
The overall state pass percentage is around 71% and the pass percentage of rural is more than
the pass percentage of urban area. Interestingly pass percentage of English medium students
are 50% more than Kannada medium students. The pass percentage includes Regular fresh,
Repeaters and also Private Candidates. Around 60% students are studying in Kannada medium
schools and remaining 40% students are from English and other medium.
Figure 1.1 Pass and Fail Performance
http://122.170.12.200/SatsInfraAnalysis/
587505
241594
State Pass and Fail in Nos
Pass Fail
70.9
29.1
State Pass and Fail in %
Pass Fail
73.3
67.8
Rural and Urban Pass in %
Rural Pass Urban Pass
26.7
32.2
Rural and Urban Fail in %
Rural Fail Urban Fail
48.59
51.41
Male and Female Pass in %
Male Pass Female Pass
65.5
81.3
56.1
Pass % in Kan, Eng & Oth Medium
Kan Eng Oth

2
Tab
le 1
.1 :
Sta
te o
verv
iew
Sl.
No
P
aram
eter
s
Tota
l
Pas
s S
tats
Fail
Sta
ts
Tota
l
Mal
e
Fem
ale
To
tal
M
ale
Fe
mal
e
%
To
tal
Mal
e Fe
mal
e
%
1
Pas
s-Fa
il
8291
17
4362
07
3929
09
5875
05
2854
95
3020
10 70
.9 24
1594
1506
97 90
896
29.1
2
Rur
al
4578
41
2467
72
2110
69
3356
33
1684
60
1671
73 73
.3 12
2199
7830
5 43
894
26.7
3
Urb
an
3712
76
1894
35
1818
40
2518
72
1170
35
1348
37 67
.8 11
9395
7239
2 47
002
32.2
4
Kan
nada
Med
ium
4882
20
2616
05
2266
15
3195
45
1562
44
1633
01 65
.5 16
8659
1053
48 63
311
34.6
5
Eng
lish
Med
ium
3040
61
1605
68
1434
92
2472
96
1233
32
1239
64 81
.3
5676
4 37
235
1952
8 18
.7
6
Oth
er M
ediu
m
36
836
14
034
22
802
20
664
59
19
1474
5
56.1
16
171
81
14 80
57 43
.9
7
Gov
t.
3229
25
1625
51
1603
74
2177
41
1000
70
1176
71 67
.4 10
5177
6247
6 42
701
32.6
8
Aid
ed
2223
27
1146
16
1077
10
1479
27
6884
9
7907
8 66
.5
7439
3 45
761
2863
1 33
.5
9
Una
ided
28
3865
15
9040
12
4825
22
1837
11
6576
10
5261
78.2
62
024
4246
0 19
564
21.9
10
Lan
guag
e-1
-
-
-
7567
90
3858
13
3709
76
-
7231
4
5038
2
2193
2
29.9
11
Lan
guag
e-2
-
-
-
6876
39
3451
58
3424
80
-
1414
62
9103
6
5042
6
58.6
12
Lan
guag
e-3
-
-
-
7549
75
3885
11
3664
63
-
7412
7
4768
2
2644
5
30.7
13
Mat
hem
atic
s
-
-
-
6721
89
3362
53
3359
36
-
1564
13
9961
8
5679
4
64.7
14
Sci
ence
-
-
-
6780
51
3402
30
3378
21
-
1505
51
9564
1
5490
9
62.3
15
Soc
ial-
Sci
ence
-
-
-
7376
75
3777
22
3599
52
-
9142
6
5847
1
3295
5
37.8
Sou
rce
: KS
EE
B-2
019-
20

3
Table 1.2: Grade wise subject wise performance
Source : KSEEB-2019-20
Figure 1.2 Grade wise subject wise performance
18
.69
14
.52
24
.25
4.1
7
3.7
16
.11
18
.51
13
.1
16
.29
8.3
1
6.5
6
16
.84
16
.26
14
.06
14
.75
15
.66
11
.43
16
.79
16
.38
15
.97
13
.81
22
.04
18
.55
16
.41
12
.97
17
.83
13
.03
24
.44 25
.87
15
.37
10
.51
18
.12
10
.86
22
.36
28
.29
12
.39
1 S T L A N G U A G E 2 N D L A N G U A G E 3 R D L A N G U A G E M A T H E M A T I C S S C I E N C E S O C I A L - S C I E N C E
PER
FOR
MA
NA
NC
E IN
%
Grade and Subject wise Performanance
A+ A B+ B C+ C
Subject A+ A B+ B C+ C
1st Language 18.7 18.5 16.3 16.4 13 10.5
2nd Language 14.5 13.1 14.1 16 17.8 18.1
3rd Language 24.3 16.3 14.8 13.8 13 10.9
Mathematics 4.17 8.31 15.7 22 24.4 22.4
Science 3.7 6.56 11.4 18.6 25.9 28.3
Social-Science 16.1 16.8 16.8 16.4 15.4 12.4

4
Table 1.3: Management wise Grade wise performance
Source : KSEEB-2019-20
Figure 1.3 Management wise Grade wise performance
3.37 3.43
11.63
15.1213.72
23.3424.75 24.83
25.89
28.6129.85
22.9922.46 23.08
13.79
5.68 5.06
2.35
Govt Aided Private
Perf
orm
anan
ce in
%
Management and Grade wise performanance
A+ A B+ B C+ C
Management A+ A B+ B C+ C
Govt 3.37 15.12 24.75 28.61 22.46 5.68
Aided 3.43 13.72 24.83 29.85 23.08 5.06
Private 11.63 23.34 25.89 22.99 13.79 2.35

5
Table 1.4: Management wise Subject wise Grade wise performance
Subject Management A+ A B+ B C+ C
1st Language Govt 18.12 17.59 15.67 16.37 13.42 11.47
Aided 15.76 17.89 16.58 17.16 13.92 11.62
Private 21.56 19.98 16.68 15.81 11.74 8.6
2nd Language Govt 7.88 10.16 13.67 17.55 21 23.15
Aided 7.01 10.07 13.69 18.12 21.76 22.44
Private 26.51 18.19 14.72 12.86 11.87 10
3rd Language Govt 18.35 15.52 15.38 15.03 14.85 13.35
Aided 18.34 15.26 15.18 15.38 15.34 13.32
Private 35.04 17.88 13.75 11.32 9.35 6.34
Mathematics Govt 2.15 6.31 14.18 22.07 26.36 25.86
Aided 2.25 5.91 13.63 22.09 26.67 25.99
Private 7.64 7.64 18.67 21.97 20.84 16.11
Science Govt 1.67 4.49 9.89 18.44 27.54 32
Aided 2.05 4.54 9.7 18.09 27.31 32.2
Private 6.99 10.15 14.25 18.98 23.09 21.66
Social-Science Govt 12.87 15.59 16.67 17.29 16.69 14.27
Aided 12.17 15.63 16.95 17.39 17.21 14.39
Private 22.53 19.08 16.8 14.73 12.57 8.88
Source : KSEEB-2019-20

6
Table 1.5: District wise Students Appeared, Passed and Failed status
Sl.No. District Name Exam appeared Students passed Students failed
Total Male Female Total Male Female % Total Male Female %
Total 829117 436207 392909 587505 285495 302010 70.86 241594 150697 90896 29.14
1 YADGIR 16793 9795 6998 8303 4424 3879 49.44 8490 5371 3119 50.56
2 HAVERI 21165 10389 10776 11231 4392 6839 53.06 9933 5996 3937 46.93
3 GADAG 14038 7157 6881 7928 3431 4497 56.48 6104 3722 2382 43.48
4 RAICHUR 29092 15952 13140 17421 8708 8713 59.88 11669 7242 4427 40.11
5 BENGALURU SOUTH 64136 33152 30984 38664 17780 20884 60.28 25472 15372 10100 39.72
6
BELAGAVI
33025
17500
15525
20020
9208
10812
60.62 13005
8292
4713
39.38
7
CHIKKODI
39816
21521
18295
25034
12025
13009
62.87 14782
9496
5286
37.13
8
BAGALKOTE
30214
15941
14273
19375
9243
10132
64.13 10836
6696
4140
35.86
9
BIDAR
26107
13870
12237
16977
8425
8552
65.03 9130
5445
3685
34.97
10
VIJAYAPURA
35374
19951
15423
23051
12052
10999
65.16 12318
7894
4424
34.82
11
DHARWAD
27242
14182
13060
17773
7987
9786
65.24 9469
6195
3274
34.76
12
KALABURGI
42634
23813
18821
28333
14677
13656
66.46 14301
9136
5165
33.54
13
KOPPAL
21378
11340
10038
14703
7403
7300
68.78 6675
3937
2738
31.22
14
MYSORE
38429
19762
18667
27221
12805
14416
70.83
11208
6957
4251
29.17
15
CHIKKAMAGALURU
12829
6458
6371
9239
4366
4873
72.02
3590
2092
1498
27.98
16
BENGALURU NORTH
48087
24925
23161
35534
17264
18270
73.9
12553
7661
4891
26.1
17
SHIVAMOGGA
23571
11859
11712
17418
8122
9296
73.9
6153
3737
2416
26.1
18
MANGALURU
30358
15980
14378
23017
10989
12028
75.82
7341
4991
2350
24.18
19
BELLARI
39945
21448
18497
30433
15536
14897
76.19
9512
5912
3600
23.81
20
DAVANAGERE
21292
10632
10660
16472
7681
8791
77.36
4820
2951
1869
22.64
21
TUMKUR
22779
12544
10235
17651
9282
8369
77.49
5128
3262
1866
22.51
22
KODAGU
6915
3418
3497
5359
2469
2890
77.5
1556
949
607
22.5
23
SIRSI
10095
5061
5034
7966
3711
4255
78.91
2129
1350
779
21.09
24
UTTARA KANNADA
9424
4823
4601
7685
3713
3972
81.55
1739
1110
629
18.45
25
RAMNAGARA
12948
6723
6225
10713
5305
5408
82.74
2235
1418
817
17.26
26
CHAMARAJANAGAR
11499
5900
5599
9554
4659
4895
83.09
1945
1241
704
16.91
27
HASSAN
20424
10216
10208
16982
8110
8872
83.15
3442
2106
1336
16.85
28
UDUPI
13941
7283
6658
11749
5745
6004
84.28
2192
1538
654
15.72
29
MADHUGIRI
12882
6709
6173
10940
5538
5402
84.92
1942
1171
771
15.08
30
CHITRADURGA
21451
11092
10359
18446
9208
9238
85.99
3005
1884
1121
14.01
31
MANDYA
20832
10803
10029
17971
8952
9019
86.27
2860
1850
1010
13.73
32
BENGALURU RURAL
12965
6667
6298
11369
5667
5702
87.69
1596
1000
596
12.31
33
KOLAR
20514
10494
10020
18003
8968
9035
87.76
2511
1526
985
12.24
34
CHIKKABALLAPUR
16923
8847
8076
14970
7650
7320
88.46
1953
1197
756
11.54
Source : KSEEB-2019-20

7
Department has adopted six subjects as per the SSLC syllabus which are Langage1, Language2,
Language3, Mathematics, Science and Social Science. Graph shows subject wise failing
percentage.
Table 1.6: Subject and Gender wise Failed
No. of
Subject
Total Male Female
Count % Count % Count %
1 63713 26.37 37117 24.63 26596 29.26
2 58223 24.1 35159 23.33 23063 25.37
3 43867 18.16 27289 18.11 16578 18.24
4 29316 12.13 19123 12.69 10193 11.21
5 21499 8.9 14967 9.93 6532 7.19
6 24970 10.34 17040 11.31 7930 8.72
Source : KSEEB-2019
Figure 1.4 Subject and Gender wise Failed
26
.37
24
.63
29
.26
24
.1
23
.33
25
.37
18
.16
18
.11
18
.24
12
.13
12
.69
11
.21
8.9 9
.93
7.1
910
.34
11
.31
8.7
2
% % %
T O T A L M A L E F E M A L E
FAIL
IN P
ERC
ENTA
GE
Sub ject and Gender wise Fai led
1 2 3 4 5 6

8
Chapter – 2
Hassan District Overview
SL.Parameters
Total Pass Stats Fail Stats
No. Total Male Female Total Male Female % Total Male Female %
1 Pass-Fail 19256 9381 9875 16648 7880 8768 86.45617 2608 1501 1107 13.54383
2 Rural 12296 6163 6133 10836 5285 5551 88.12622 1460 878 582 11.87378
3 Urban 6960 3218 3742 5812 2595 3217 83.50575 1148 623 525 16.49425
4Kannada Medium 10699 5233 5466 8748 4131 4617 0.817647 1951 1102 849 18.23535
5English Mediun 8521 4134 4387 7875 3743 4132 92.41873 646 391 255 7.58127
6Other
Medium 36 14 22 25 6 19 69.44444 11 8 3 30.55556
7 Govt. 9114 4254 4860 7795 3544 4251 85.52776 1319 710 609 14.47224
8 Aided 5204 2531 2673 4232 1954 2278 81.32206 972 577 395 18.67794
9 Unaided 4938 2596 2342 4621 2382 2239 93.5804 317 214 103 6.419603
10 Language-1 NULL NULL NULL 18710 9039 9671 NULL 546 342 204 20.93558
11 Language-2 NULL NULL NULL 17649 8397 9252 NULL 1607 984 623 61.6181
12 Language-3 NULL NULL NULL 18445 8922 9523 NULL 811 459 352 31.09663
13 Mathematics NULL NULL NULL 17817 8592 9225 NULL 1423 776 647 54.56288
14 Science NULL NULL NULL 17502 8393 9109 NULL 1738 975 763 66.6411
15Social-Science NULL NULL NULL 18160 8778 9382 NULL 1096 603 493 42.02454
LevelTotal Appeared Pass Stats Fail Stats
Total Male Female Total Male Female % Total Male Female %
State 745040 376264 368776 562760 268716 294044 75.53 182273 107542 74731 24.46
District 19256 9381 9875 16648 7880 8768 86.46 2608 1501 1107 13.54
2.1 Pass Analysis
Table 2.1: District overview
Hassan district stands 8 th place out of 34 educational districts in the state with respect to
pass percentage.
Table 2.2: Students Appeared, Passed and Failed Comparison with State

9
GRAPH 2.1
829117
19256
2.32
436207
9381
2.15
392909
9875
2.51
N O .
N O .
%
ST
AT
ED
IST
RIC
T
GENDER WISE
STUDENTS APPEARED
Total Male Female
GRAPH 2.2
75.53
47.75
75.5386.46
47.33
86.46
Total Male Female
Pass
Perc
enta
ge
PASS PERCENTAGE WITH STATE
STATE DISTRICT
Figure 2.1 Students Appeared of State and District
Figure 2.2 Pass Percentage of State and District

Gender Rural Urban
State District State District
Total 77.26 88.13 73.33 83.51
Male 73.39 85.75 68.72 80.64
Female 81.45 90.51 77.68 85.97
10
Gender
Govt. School
Aided School
Unaided School
State District State District State District
Total 72.94 85.53 70.66 81.32 82.09 93.58
Male 68.86 83.31 65.19 77.2 78.16 91.76
Female 76.65 87.47 76 85.22 86.81 95.6
GRAPH 2.3
77.26
88.13
73.33
83.51
73.39
85.75
68.72
80.64
81.45
90.51
77.68
85.97
State
District
State
District
Ru
ral
Urb
an
Area and Gender wise Pass Performance
Female Male Total
Table 2.3: Gender and Area wise pass percentage
Figure 2.3 Gender and Area wise Pass Performance
Table 2.4: Management wise pass percentage

11
Gender
Kannada Medium
English Medium Others Medium
State District State District State District
Total 70.46 81.76 85.14 92.42 59.82 69.44
Male 65.92 78.94 81.74 90.54 46.75 42.86
Female 75.22 84.47 88.74 94.19 66.62 86.36
Gender Tamil Medium Telugu Medium Urdu Medium Marati Medium
State District State District State District State District
Total 57.14 0 64.42 0 59.91 69.44 59.75 0
Male 48.39 0 64.22 0 42.88 42.86 50.94 0
Female 64.79 0 64.65 0 66.27 86.36 67.74 0
GRAPH 2.4
72.94
85.53
70.66
81.32
82.09
93.58
68.86
83.31
65.19
77.2
78.16
91.76
76.65
87.47
76
85.22
86.81
95.6
State
District
State
District
State
District
Go
vtA
ided
U
nai
ded
Management wise Pass Performance
Total Male Female
Figure 2.4 Management wise Pass Performance
Table 2.5: Medium wise pass percentage
Table 2.6: Medium wise pass percentage for other mediums
12
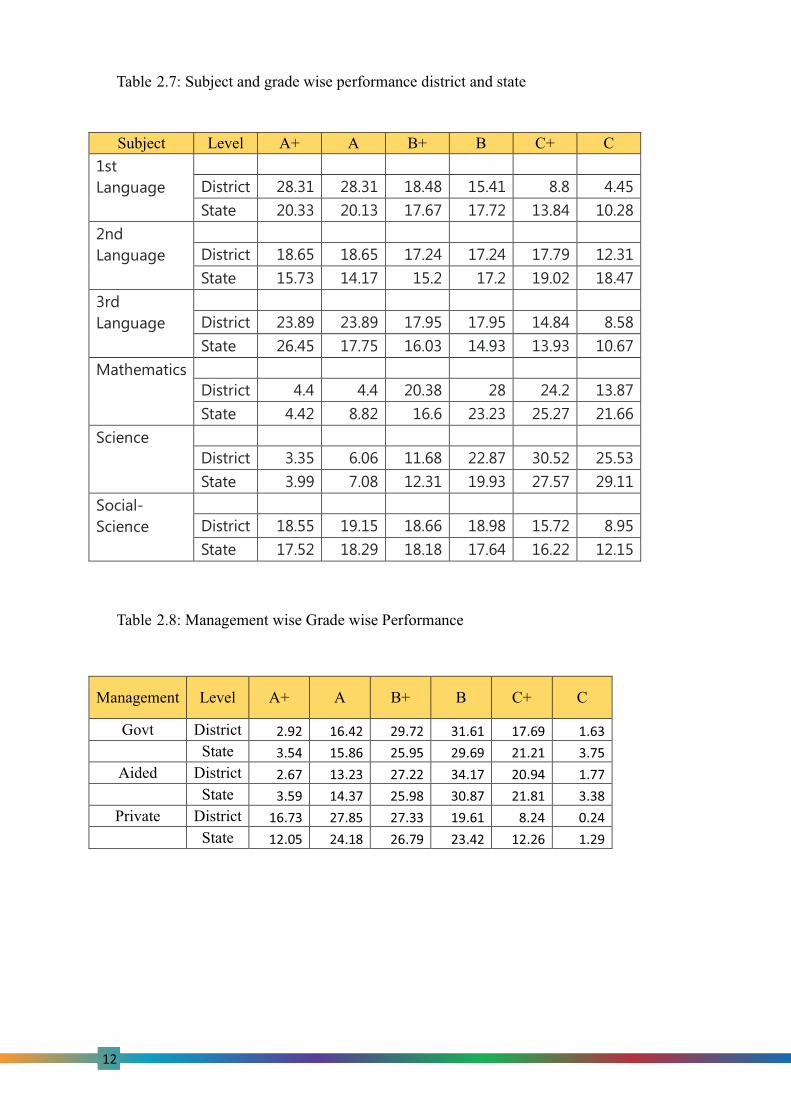
Management Level A+ A B+ B C+ C
Govt District 2.92 16.42 29.72 31.61 17.69 1.63
State 3.54 15.86 25.95 29.69 21.21 3.75
Aided District 2.67 13.23 27.22 34.17 20.94 1.77
State 3.59 14.37 25.98 30.87 21.81 3.38
Private District 16.73 27.85 27.33 19.61 8.24 0.24
State 12.05 24.18 26.79 23.42 12.26 1.29
Table 2.7: Subject and grade wise performance district and state
Table 2.8: Management wise Grade wise Performance
Subject Level A+ A B+ B C+ C
1st
Language
District 28.31 28.31 18.48 15.41 8.8 4.45
State 20.33 20.13 17.67 17.72 13.84 10.28
2nd
Language
District 18.65 18.65 17.24 17.24 17.79 12.31
State 15.73 14.17 15.2 17.2 19.02 18.47
3rd
Language
District 23.89 23.89 17.95 17.95 14.84 8.58
State 26.45 17.75 16.03 14.93 13.93 10.67
Mathematics
District 4.4 4.4 20.38 28 24.2 13.87
State 4.42 8.82 16.6 23.23 25.27 21.66
Science
District 3.35 6.06 11.68 22.87 30.52 25.53
State 3.99 7.08 12.31 19.93 27.57 29.11
Social-
Science
District 18.55 19.15 18.66 18.98 15.72 8.95
State 17.52 18.29 18.18 17.64 16.22 12.15

13
Sl. No.Block Name
Total No. Of
Students
Total Male
Total Female
Total Pass
Pass Male
Pass Female
Pass % Total Fail
Fail Male
Fail Female
Fail %
Total 19256 9381 9875 16648 7880 8768 86.46 2608 1501 1107 13.54
1 HASSAN 4924 2380 2544 4096 1909 2187 83.18 828 471 357 16.82
2 ARASIKERE 3226 1589 1637 2817 1370 1447 87.32 409 219 190 12.68
3 ARAKALAGUDU 2150 996 1154 1808 811 997 84.09 342 185 157 15.91
4 BELUR 1861 900 961 1543 700 843 82.91 318 200 118 17.09
5 CHENNARAYAPATTANA 2908 1420 1488 2603 1231 1372 89.51 305 189 116 10.49
6 HOLENARSIPURA 2097 1044 1053 1845 907 938 87.98 252 137 115 12.02
7 ALUR 949 490 459 857 428 429 90.31 92 62 30 9.69
8 SAKALESHPURA 1141 562 579 1079 524 555 94.57 62 38 24 5.43
Subject Management A+ A B+ B C+ C
1st Language Govt 26.69 25.53 18.55 15.3 9.21 4.71
Aided 20.89 23.46 21.05 18.57 10.4 5.63
Private 38.93 23.86 15.71 12.35 6.39 2.76
2nd Language
Govt 11.41 13.48 18.22 21.13 21 14.54
Aided 9.55 12.72 16.25 20.52 22.93 17.93
Private 39.74 22.42 16.51 10.61 7.38 3.14
3rd Language
Govt 17.52 17.89 19.81 18.35 16.65 9.58
Aided 15.28 16.24 18.31 19.37 18.57 12.12
Private 43.95 19.39 14.27 11.12 7.84 3.23
Mathematics Govt 2.08 7.52 20.05 29.41 25.78 15.17
Aided 2.09 5.91 17.16 28.74 28.89 17.21
Private 10.78 15.25 24.14 24.77 16.79 8.28
Science Govt 1.37 3.81 10.2 23.91 32.08 28.62
Aided 1.09 3.64 10.14 23.47 33.5 28.16
Private 9.02 12.36 15.79 20.44 24.85 17.54
Social Science
Govt 15.76 18.8 19.07 19.62 16.49 10.25
Aided 12.81 17.74 19.87 20.74 19 9.84
Private 29.32 21.18 17.92 14.83 11.03 5.72
Table 2.9: Management wise Subject Grade wise Performance
Table 2.10: Block wise students appeared, passed and failed details

Sl. No.Block Name
Total No. Of
Students
Total Male
Total Female
Total Pass
Pass Male
Pass Female
Pass % Total Fail
Fail Male
Fail Female
Fail %
Total 19256 9381 9875 16648 7880 8768 86.46 2608 1501 1107 13.54
1 HASSAN 4924 2380 2544 4096 1909 2187 83.18 828 471 357 16.82
2 ARASIKERE 3226 1589 1637 2817 1370 1447 87.32 409 219 190 12.68
3 ARAKALAGUDU 2150 996 1154 1808 811 997 84.09 342 185 157 15.91
4 BELUR 1861 900 961 1543 700 843 82.91 318 200 118 17.09
5 CHENNARAYAPATTANA 2908 1420 1488 2603 1231 1372 89.51 305 189 116 10.49
6 HOLENARSIPURA 2097 1044 1053 1845 907 938 87.98 252 137 115 12.02
7 ALUR 949 490 459 857 428 429 90.31 92 62 30 9.69
8 SAKALESHPURA 1141 562 579 1079 524 555 94.57 62 38 24 5.43
Gender
State District
No. No. %
Total 745040 19256 2.58
Male 376264 9381 2.49
Female 368776 9875 2.68
14
Subject Total Male Female
State District State District State District
Language-1 27.3 20.94 30.74 22.78 22.35 18.43
Language-2 60.49 61.62 62.97 65.56 56.91 56.28
Language-3 29.22 31.1 29.72 30.58 28.51 31.8
Mathematics 60.96 54.56 61.88 51.7 59.65 58.45
Science 63.74 66.64 65.3 64.96 61.49 68.93
Social-Science 36.76 42.02 37.49 40.17 35.72 44.53
2.2 Fail Analysis
Table 2.11: Students Appeared of District and State
Table 2.12: Fail Percentage
Table 2.13: Subject wise Students Fail
thHassan stands 27 place in the state with respect to fail percentage.

Gender
Govt. Aided Unaided
State District State District State District
Total 27.06 14.47 29.33 18.68 17.91 6.42
Male 31.14 16.69 34.80 22.80 21.84 8.24
Female 23.35 12.53 24.00 14.78 13.19 4.40
Gender Rural Urban
State District State District
Total 22.74 11.87 26.67 16.49
Male 26.61 14.25 31.27 19.36
Female 18.55 9.49 22.32 14.03
Gender Kannada Medium
English Medium Others Medium
State District State District State District
Total 29.54 18.24 14.85 7.58 40.18 30.56
Male 34.08 21.06 18.26 9.46 53.25 57.14
Female 24.78 15.53 11.26 5.81 33.38 13.64
15
State District State District State District
% Count % % Count % % Count %
1 24.84 579 22.2 22.6 352 23.45 28.06 227 20.51
2 25.37 688 26.38 24.69 374 24.92 26.34 314 28.36
3 20.17 593 22.74 20.55 345 22.98 19.62 248 22.4
4 13.27 401 15.38 14.23 231 15.39 11.88 170 15.36
5 8.8 199 7.63 10.03 114 7.59 7.02 85 7.68
6 7.56 148 5.67 7.9 85 5.66 7.07 63 5.69
Table 2.14: Medium wise Students Fail
Table 2.15: Area wise students failed percentage
Table 2.16: Management wise and Gender wise failed percentage
Table 2.17: No. of subject wise failed percentage

16
Chapter - 3
Sl. Parameters
Total Pass Statistics Fail Statistics
No Total Male Female Total Male Female % Total Male Female %
1 Pass-Fail 949 490 459 857 428 429 90.31 92 62 30 9.69
2 Rural 851 455 396 789 410 379 92.71 62 45 17 7.29
3 Urban 98 35 63 68 18 50 69.39 30 17 13 30.61
4Kannada Medium 598 298 300 528 252 276 0.88 70 46 24 11.71
5 English Medium 351 192 159 329 176 153 93.73 22 16 6 6.27
6 Other Medium 0 0 0 0 0 0 0 0 0
7 Govt. 545 264 281 503 238 265 92.29 42 26 16 7.71
8 Aided 129 82 47 116 69 47 89.92 13 13 0 10.08
9 Unaided. 275 144 131 238 121 117 86.55 37 23 14 13.45
10 Language-1 NULL NULL NULL 930 476 454 NULL 19 14 5 20.65
11 Language-2 NULL NULL NULL 894 452 442 NULL 55 38 17 59.78
12 Language-3 NULL NULL NULL 921 475 446 NULL 28 15 13 30.43
13 Mathema�cs NULL NULL NULL 886 448 438 NULL 63 42 21 68.48
14 Science NULL NULL NULL 890 454 436 NULL 59 36 23 64.13
15 Social-Science NULL NULL NULL 911 464 447 NULL 38 26 12 41.30
Total Appeared Pass Stats Fail Stats
Total Male Female Total Male Female % Total Male Female %
District 19256 9381 9875 16648 7880 8768 86.46 2608 1501 1107 13.54
Block 949 490 459 857 428 429 90.31 92 62 30 9.69
Level
3.1 Pass Analysis
Table 3.1: Block over view
Alur Block Overview
Table 3.2: Students Appeared, Passed and Failed Comparison with District
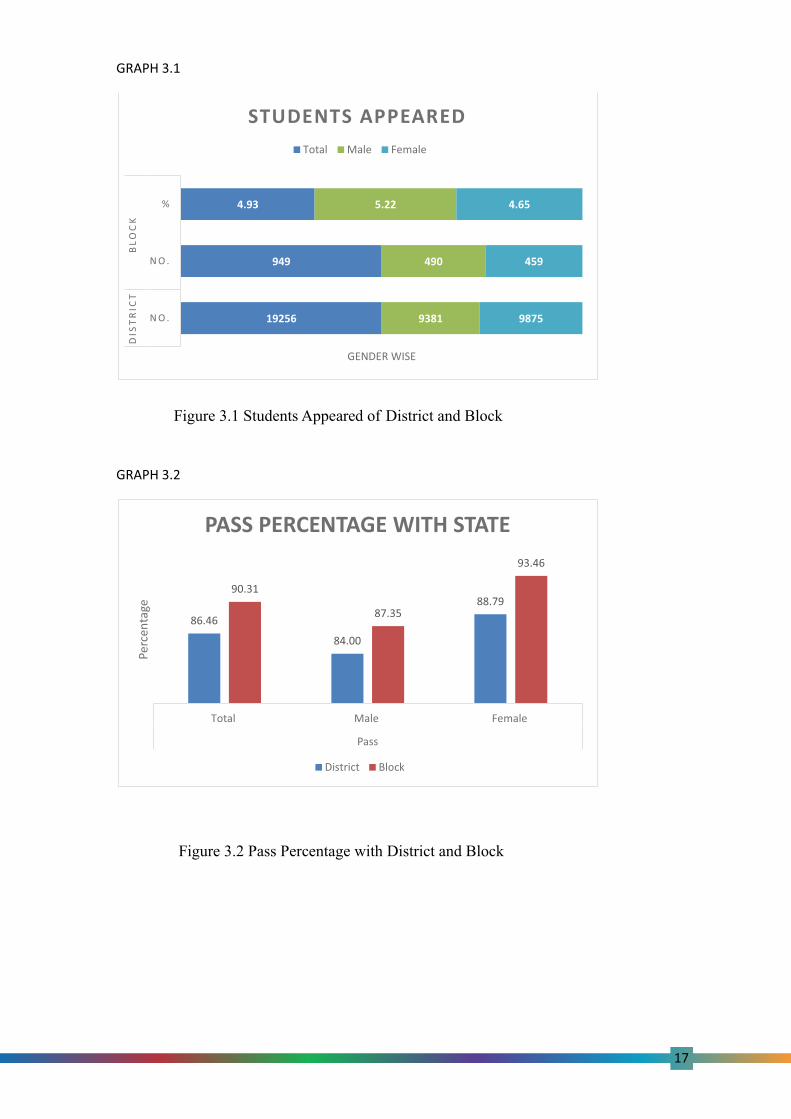
ndAlur Block stands 2 place in the district with respect to the pass percentage
17
GRAPH 3.2
86.46
84.00
88.7990.31
87.35
93.46
Total Male Female
Pass
Perc
enta
ge
PASS PERCENTAGE WITH STATE
District Block
GRAPH 3.1
19256
949
4.93
9381
490
5.22
9875
459
4.65
N O .
N O .
%
DIS
TR
ICT
BL
OC
K
GENDER WISE
STUDENTS APPEARED
Total Male Female
Figure 3.1 Students Appeared of District and Block
Figure 3.2 Pass Percentage with District and Block

Gender Tamil Medium Telugu Medium Urdu Medium Marati Medium
District Block District Block District Block District Block
Total 0 0 0 0 69.44 0 0 0
Male 0 0 0 0 42.86 0 0 0
Female 0 0 0 0 86.36 0 0 0
18
Gender
Rural Urban
District Block District Block
Total 88.13 92.71 83.51 69.39
Male 85.75 90.11 80.64 51.43
Female 90.51 95.71 85.97 79.37
Gender Govt. School Aided School Unaided School
District Block District Block District Block
Total 85.53 92.29 81.32 89.92 93.58 86.55
Male 83.31 90.15 77.2 84.15 91.76 84.03
Female 87.47 94.31 85.22 100 95.6 89.31
Gender Kannada Medium
English Medium Others Medium
District Block District Block District Block
Total 81.76 88.29 92.42 93.73 69.44 0
Male 78.94 84.56 90.54 91.67 42.86 0
Female 84.47 92 94.19 96.23 86.36 0
Table 3.3: Gender and Area wise pass percentage
Table 3.4: Gender and Management wise pass percentage
Table 3.5: Medium wise pass percentage
Table 3.6: Medium wise pass percentage comparison for other mediums

19
Subject Level A+ A B+ B C+ C
1st Language Block 29.57 23.66 19.68 13.76 8.82 4.52
District 28.31 24.54 18.48 15.41 8.8 4.45
2nd Language
Block 21.59 15.77 19.24 18.12 15.32 9.73
District 18.65 15.72 17.24 18.1 17.79 12.31
3rd Language
Block 21.82 18.78 18.68 18.46 14.88 7.17
District 23.89 17.85 17.95 16.71 14.84 8.58
Mathematics Block 1.02 6.09 19.3 29.68 26.41 17.49
District 4.4 9.15 20.38 28 24.2 13.87
Science Block 2.36 6.29 12.47 23.71 31.46 23.71
District 3.35 6.06 11.68 22.87 30.52 25.53
Social-Science
Block 18.44 17.56 17.34 16.79 19.65 10.21
District 18.55 19.15 18.98 18.66 15.72 8.95
Management Level A+ A B+ B C+ C
Govt Block 4.17 18.69 26.04 32.41 15.31 3.38
District 2.92 16.42 29.72 31.61 17.69 1.63
Aided Block 0.86 7.76 27.59 32.76 29.31 1.72
District 2.67 13.23 27.22 34.17 20.94 1.77
Private Block 10.08 27.31 28.15 23.11 10.92 0.42
District 16.73 27.85 27.33 19.61 8.24 0.24
Table 3.7: Subject and Grade wise performance with District and Block
Table 3.8: Management wise Grade wise performance

20
Subject Management A+ A B+ B C+ C
1st Language Govt 29.48 25 19.96 12.31 8.96 4.29
Aided 13.49 26.19 24.6 19.05 11.9 4.76
Private 37.31 19.78 16.79 14.18 7.09 4.85
2nd Language
Govt 16.31 15.36 20.35 20.35 17.08 10.17
Aided 5.93 15.25 21.19 21.19 22.03 14.41
Private 39.61 16.86 16.08 12.16 8.63 6.67
3rd Language
Govt 20.86 19.36 18.8 17.48 13.91 9.21
Aided 5.6 16.8 21.6 23.2 27.2 5.6
Private 31.44 18.56 17.05 18.18 10.98 3.79
Mathematics Govt 0.76 4.59 18.16 31.93 27.15 17.4
Aided 0 4.13 12.4 27.27 33.88 22.31
Private 2.07 10.33 25.21 26.03 21.07 15.29
Science Govt 2.69 5.95 14.01 24.76 32.44 20.15
Aided 0 4.1 12.3 20.49 27.05 36.07
Private 2.83 8.1 9.31 23.08 31.58 25.1
Social Science
Govt 17.18 15.84 16.79 19.08 20.61 10.5
Aided 7.2 18.4 16 16.8 28.8 12.8
Private 26.34 20.61 19.08 12.21 13.36 8.4
Table 3.9: Management wise Subject wise Grade wise performance

Gender
District Block
No. % No. %
Total 2608 13.54 92 9.69
Male 1501 16 62 12.65
Female 1107 11.21 30 6.54
Gender
District Block
No. No. %
Total 19256 949 4.93
Male 9381 490 5.22
Female 9875 459 4.65
21
Subject
Total Male Female
District Block District Block District Block
Language-1 20.94 20.65 22.78 22.58 18.43 16.67
Language-2 61.62 59.78 65.56 61.29 56.28 56.67
Language-3 31.1 30.43 30.58 24.19 31.8 43.33
Mathematics 54.56 68.48 51.7 67.74 58.45 70
Science 66.64 64.13 64.96 58.06 68.93 76.67
Social-Science 42.02 41.3 40.17 41.94 44.53 40
Gender
Kannada Medium English Medium Others Medium
District Block District Block District Block
Total 18.24 11.71 7.58 6.27 30.56 0
Male 21.06 15.44 9.46 8.33 57.14 0
Female 15.53 8 5.81 3.77 13.64 0
3.2 Fail Analysis
Table 3.10: Students Appeared of District and Block
Table 3.11: Fail percentage
Table 3.12: Subject wise fail percentage
Table 3.13: Medium wise fail percentage
thAlur Block stands 7 position in the district with respect to fail percentage.

22
No. of Subject
Total Male Female
District Block District Block District Block
% Count % % Count % % Count %
1 22.2 16 17.39 23.45 14 22.58 20.51 2 6.67
2 26.38 24 26.09 24.92 15 24.19 28.36 9 30
3 22.74 24 26.09 22.98 16 25.81 22.4 8 26.67
4 15.38 19 20.65 15.39 10 16.13 15.36 9 30
5 7.63 4 4.35 7.59 3 4.84 7.68 1 3.33
6 5.67 5 5.43 5.66 4 6.45 5.69 1 3.33
Gender
Rural Urban
District Block District Block
Total 11.87 7.29 16.49 30.61
Male 14.25 9.89 19.36 48.57
Female 9.49 4.29 14.03 20.63
Gender
Govt. Aided Unaided
District Block District Block District Block
Total 14.47 7.71 18.68 10.08 6.42 13.45
Male 16.69 9.85 22.8 15.85 8.24 15.97
Female 12.53 5.69 14.78 0 4.4 10.69
Table 3.14: Area wise fail percentage
Table 3.15: Management wise fail percentage
Table 3.16: No. of Subject wise fail percentage

23
Chapter – 4
School Name: B S N H ENGLISH MEDIUM RESIDENTIAL HIGH SCHOOL
Address: NANDINI BADAVANE, RAYARAKOPPALU, ALURU TQ, HASSAN DIST
Area: Rural
Management: Unaided
Sl
Parameters
Total Pass Statistics Fail Statistics
No Total Male Female Total Male Female % Total Male Female %
1 Pass-Fail 32 11 21 30 11 19 93.75 2 0 2 6.25
2
Kannada Medium 0 0 0 0 0 0 0 0 0
3 English Medium 32 11 21 30 11 19 93.75 2 0 2 6.25
4 Other Medium 0 0 0 0 0 0 0 0 0
5 Language-1 NULL NULL NULL 31 11 20 NULL 1 0 1 50
6 Language-2 NULL NULL NULL 32 11 21 NULL 0 0 0 0
7 Language-3 NULL NULL NULL 31 11 20 NULL 1 0 1 50
8 Mathema�cs NULL NULL NULL 32 11 21 NULL 0 0 0 0
9 Science NULL NULL NULL 32 11 21 NULL 0 0 0 0
10 Social-Science NULL NULL NULL 30 11 19 NULL 2 0 2 100
Table 4.1: Parameter wise statistics of school
School Overview

24
Chapter – 5
Infrastructure Analysis
Table 5.1: Primary school grading criteria
Sec No Description Criteria Total
Marks Remarks
Sec
2 1,6,7,8
School
Building
School with Own land, building, sufcient
class rooms=3, With Minor repair=2, with
Major repair =1, No building=0
3
4 Boundary
Wall
If Pucca concrete full compound=3, If
fencing=2, Partial =1, No compound=0 3
10, 11,
12 Toilet
If sufcient functional toilets with water
facility separately for Boys and Girls=3, If Not
sufcient functional toilets with water facility
separately for Boys and Girls=2, If not
sufcient functional toilets with water facility
and no separately for Boys and Girls=1, No
toilet=9
3
17,19 Drinking
water
Pure and sufcient tap water available in the
premises=3, If only tap water available in the
premises=2, other than tap water=1, No
water=0
3
23 Electricity
availability
Yes, with functional=2, Yes but not
functional=1, No electricity=0 2
28 Play Ground Yes=1, No=0 1
33
Kitchen and
Kitchen
garden
Yes=1, No=0 1
41 Library Yes=1, No=0 1
17
Source: SATS-2019

25
Table 5.2: Upper primary school criteria
Sec No Description Criteria Total
Marks Remarks
Sec
2 1,6,7,8 School Building
School with Own land, building, sufcient
class rooms=3, With Minor repair=2, with
Major repair =1, No building=0
3
4 Boundary Wall If Pucca concrete full compound=3, If
fencing=2, Partial =1, No compound=0 3
10, 11,
12 Toilet
If sufcient functional toilets with water
facility separately for Boys and Girls=3, If
Not sufcient functional toilets with water
facility separately for Boys and Girls=2, If not
sufcient functional toilets with water facility
and no separately for Boys and Girls=1, No
toilet=9
3
17,19 Drinking water
Pure and sufcient tap water available in the
premises=3, If only tap water available in the
premises=2, other than tap water=1, No
water=0
3
23 Electricity
availability
Yes, with functional=2, Yes but not
functional=1, No electricity=0 2
28 Play Ground Yes=1, No=0 1
33 Kitchen and
Kitchen garden Yes=1, No=0 1
41 Library Yes=1, No=0 1
60,61
IT facility
available for
teaching
learning process
Computer with IT facility=2, only computer1 2
56 CAL Lab Yes=1, No=0 1
20
Source: SATS-2019

26
Table 5.3: High school criteria
Sec No Description Criteria Total
Marks Remarks
Sec
2 1,6,7,8
School
Building
School with Own land, building, sufcient
class rooms=3, With Minor repair=2, with
Major repair =1, No building=0
3
4 Boundary
Wall
If Pucca concrete full compound=3, If
fencing=2, Partial =1, No compound=0 3
10, 11,
12 Toilet
If sufcient functional toilets with water
facility separately for Boys and Girls=3, If Not
sufcient functional toilets with water facility
separately for Boys and Girls=2, If not
sufcient functional toilets with water facility
and no separately for Boys and Girls=1, No
toilet=9
3
17,19 Drinking
water
Pure and sufcient tap water available in the
premises=3, If only tap water available in the
premises=2, other than tap water=1, No
water=0
3
23 Electricity
availability
Yes, with functional=2, Yes but not
functional=1, No electricity=0 2
28 Play Ground Yes=1, No=0 1
33
Kitchen and
Kitchen
garden
Yes=1, No=0 1
40 Integrated
Science lab Yes=1, No=0 1
41 Library Yes=1, No=0 1
60,61
IT facility
available for
teaching
learning
process
Computer with IT facility=2, only computer1 2 HPS and
Sec
57, 74 ICT Lab Yes=1, No=0 1 Sec
21
Source: SATS-2019
27
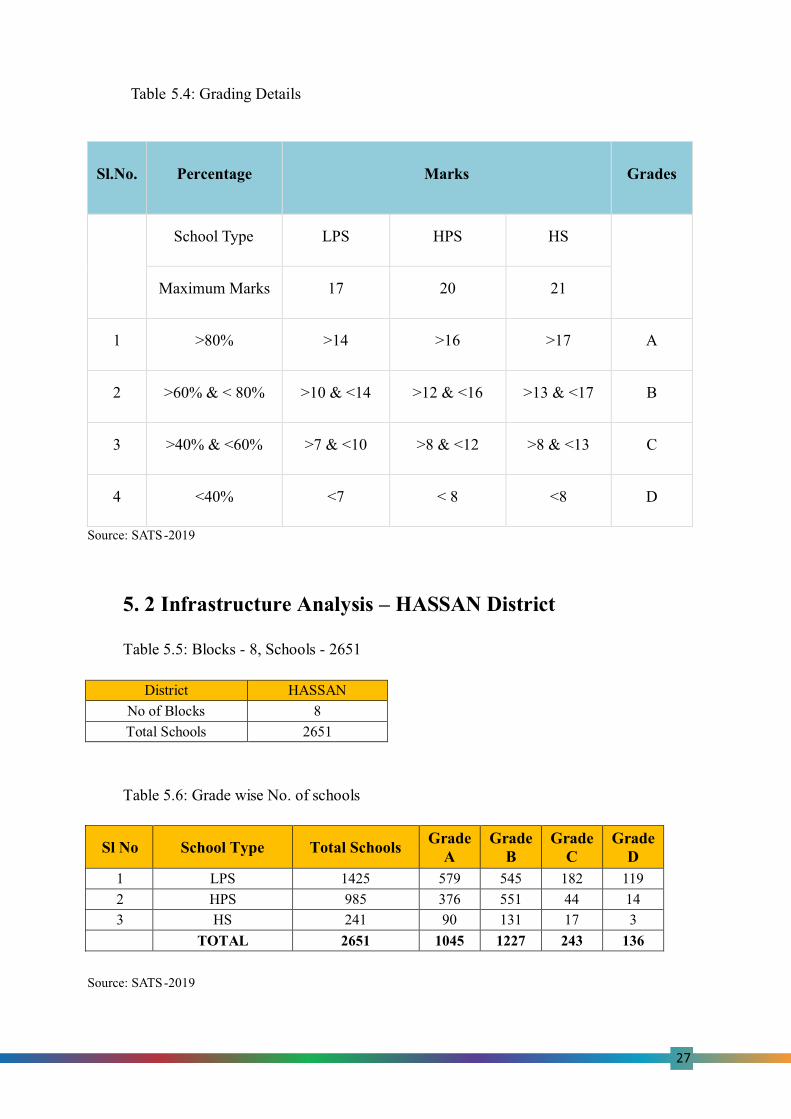
Table 5.4: Grading Details
Sl.No. Percentage Marks Grades
School Type LPS HPS HS
Maximum Marks 17 20 21
1 >80% >14 >16 >17 A
2 >60% & < 80% >10 & <14 >12 & <16 >13 & <17 B
3 >40% & <60% >7 & <10 >8 & <12 >8 & <13 C
4 <40% <7 < 8 <8 D
Source: SATS-2019
Source: SATS-2019
5. 2 Infrastructure Analysis – HASSAN District
Table 5.5: Blocks - 8, Schools - 2651
District HASSAN
No of Blocks 8
Total Schools 2651
Table 5.6: Grade wise No. of schools
Sl No School Type Total Schools Grade
A Grade
B Grade
C Grade
D
1 LPS 1425 579 545 182 119
2 HPS 985 376 551 44 14
3 HS 241 90 131 17 3
TOTAL 2651 1045 1227 243 136
28
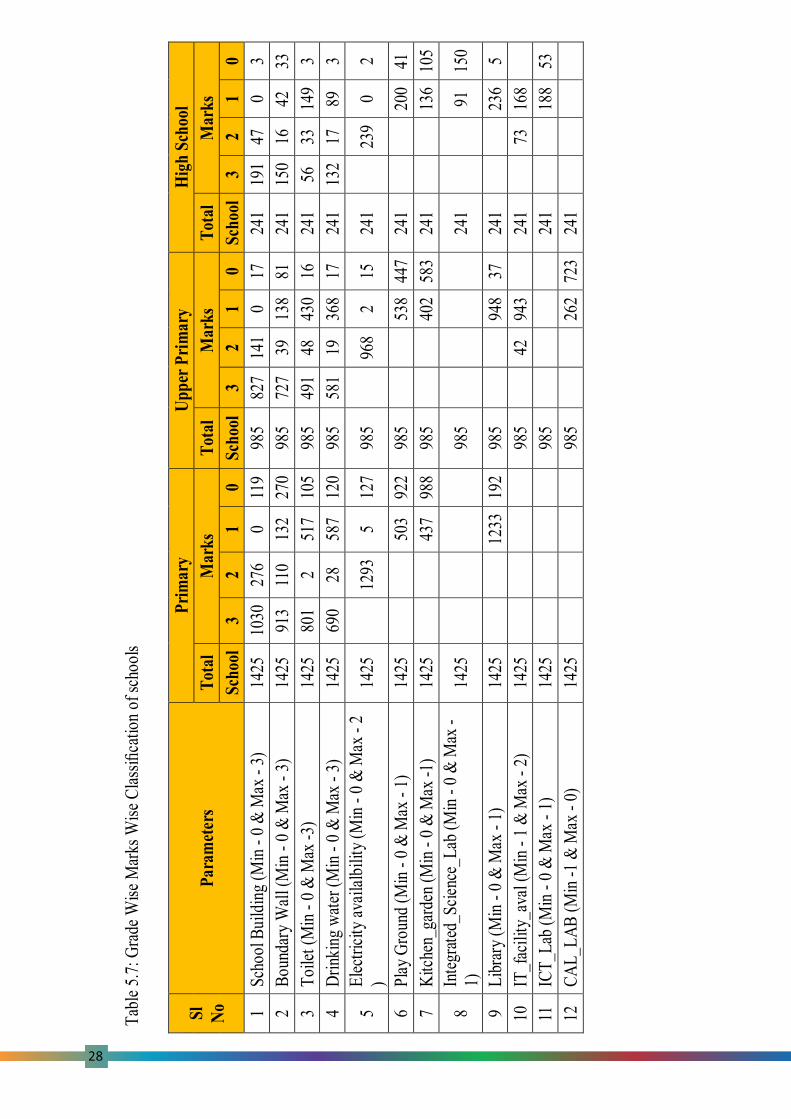
Tab
le 5
.7: G
rade
Wis
e M
arks
Wis
e C
lass
ica
tion
of s
choo
ls
Sl
No
Par
amet
ers
Pri
mar
y
Upp
er P
rim
ary
Hig
h Sc
hool
Tot
al
Mar
ks
Tot
al
Mar
ks
Tot
al
Mar
ks
Scho
ol
3
2
1
0
Scho
ol
3
2
1
0
Scho
ol
3
2
1
0
1
Scho
ol B
uild
ing
(Min
-
0 &
Max
-
3)
1425
1030
276
0
119
985
827
141
0
17
241
191
47
0
3
2
Bou
ndar
y W
all (
Min
-
0 &
Max
-
3)
1425
913
110
132
270
985
727
39
138
81
241
150
16
42
33
3
Toi
let (
Min
-
0 &
Max
-3)
1425
801
2
517
105
985
491
48
430
16
241
56
33
149
3 4
Dri
nkin
g w
ater
(Min
-
0 &
Max
-
3)
1425
690
28
587
120
985
581
19
368
17
241
132
17
89
3 5
Ele
ctric
ity a
vaila
lbili
ty (
Min
-
0 &
Max
-
2 )
1425
1293
5
127
985
968
2
15
241
239
0
2 6
Play
Gro
und
(Min
-
0 &
Max
-
1)
1425
503
922
985
538
447
241
200
41
7
Kitc
hen_
gard
en (
Min
-
0 &
Max
-1)
1425
437
988
985
402
583
241
136
105
8
Inte
grat
ed_S
cien
ce_L
ab (
Min
-
0 &
Max
- 1)
1425
985
241
91
150
9 L
ibra
ry (
Min
- 0
& M
ax -
1) 14
25
12
33
192
985
948
37
241
236
5 10
IT_f
acili
ty_a
val (
Min
- 1
& M
ax -
2) 14
25
98
5
42
943
24
1
73
168
11
ICT
_Lab
(M
in -
0 &
Max
- 1)
1425
985
241
188
53
12 C
AL
_LA
B (
Min
-1
& M
ax -
0) 14
25
98
5
26
2 72
3 24
1

29
Tab
le 5
.8: G
rade
Wis
e Sc
hool
Cou
nts
Sl
N o
Blo
ck N
ame
Pri
mar
y
Upp
er P
rim
ary
Hig
h Sc
hool
Tot
al
Scho
ols
Gra
de A
Gra
de B
Gra
de C
Gra
de D
Tot
al
Scho
ols
Gra
de A
Gra
de B
Gra
de C
Gra
de D
Tot
al
Scho
ols
Gra
de A
Gra
de B
Gra
de C
Gra
de D
1
AL
UR
109
38
39
11
21
60
20
37
1
2
18
7
10
1
0
2
AR
AK
AL
AG
UD
U
201
68
81
24
28
116
33
74
6
3
27
8
18
1
0
3
AR
ASI
KE
RE
228
41
124
57
6
185
46
120
18
1
33
7
24
2
0
4 B
EL
UR
178
89 56
18 15
116
54
56
4
2
22
10
10
1
1
5
CH
AN
NA
RA
YA
PA
TN
A 23
1 11
0 80
18 23
163
88
70
3
2
41
19
21
1
0
6 H
ASS
AN
235
82 10
2
39 12
152
56
86
9
1
43
22
19
2
0
7 H
OL
EN
AR
ASI
PUR
A 14
9 11
0 31
7
1
110
55
52
2
1
39
14
20
5
0
8 SA
KA
LE
SHA
PUR
A 94
41 32
8
13 83
24
56
1
2
18
3
9
4
2
T
OT
AL
1425
579
545
18
2
119
98
5
376
55
1
44
14
241
90
13
1
17
3

30
5.3 Infrastructure Analysis –
Block Level
Table 5.9: No. of Schools
District Name
HASSAN
Block Name
ALUR
Total Schools
187
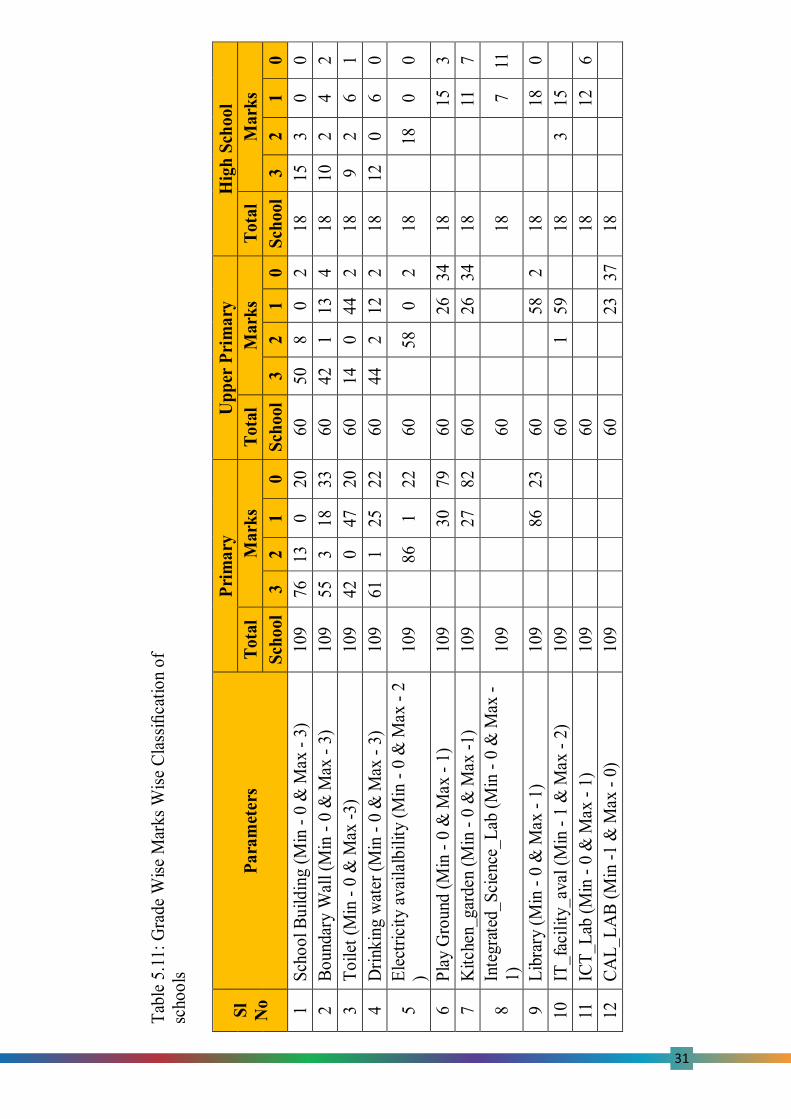
Table 5.10: Grade wise school count
Sl No School Type Total
Schools Grade
A Grade
B Grade
C Grade
D
1 LPS 109 38 39 11 21
2 HPS 60 20 37 1 2
3 HS 18 7 10 1 0
TOTAL 187 65 86 13 23
31
Tab
le 5
.11:
Gra
de W
ise
Mar
ks W
ise
Cla
ssi
cati
on o
f sc
hool
s
S
l N
o
Par
amet
ers
Pri
mar
y
Up
per
Pri
mar
y
Hig
h S
choo
l
T
otal
Mar
ks
Tot
al
Mar
ks
Tot
al
Mar
ks
S
choo
l
3
2
1
0
Sch
ool
3
2
1
0
Sch
ool
3
2
1
0
1 Sch
ool B
uild
ing
(Min
- 0 &
Max
- 3)
10
9 76
13
0 20
60 50
8
0
2
18
15
3
0
0
2 Bou
ndar
y W
all (
Min
- 0 &
Max
- 3)
10
9 55
3
18 33
60 42
1
13
4
18
10
2
4
2
3 Toi
let
(Min
-
0 &
Max
-3)
10
9 42
0
47 20
60 14
0
44
2
18
9
2
6
1
4 D
rink
ing
wat
er (
Min
- 0 &
Max
- 3)
10
9 61
1
25 22
60 44
2
12
2
18
12
0
6
0
5 Ele
ctri
city
ava
ilal
bilit
y (M
in -
0 &
Max
- 2
)
10
9
86 1
22 60
58
0
2
18
18
0
0
6 Pla
y G
roun
d (M
in -
0
& M
ax -
1)
109
30 79
60
26
34
18
15
3
7 K
itch
en_g
arde
n (M
in -
0 &
Max
-1)
10
9
27
82 60
26
34
18
11
7
8 In
tegr
ated
_Sci
ence
_Lab
(M
in -
0 &
Max
-
1)
109
60
18
7
11
9 Lib
rary
(M
in -
0
& M
ax -
1)
109
86 23
60
58
2
18
18
0
10 IT
_fac
ilit
y_av
al (
Min
- 1 &
Max
- 2)
10
9
60
1
59
18
3
15
11 IC
T_L
ab (
Min
-
0 &
Max
- 1)
10
9
60
18
12
6
12 CA
L_L
AB
(M
in -
1 &
Max
- 0)
109
60
23
37
18

32
5.4 Infrastructure Analysis – School Level
Table 5.12: School details
School ID 29230106104
School Name GOVT JUNIOR COLLEGE KANATHUR
District HASSAN
Block Name ALUR
Cluster Name 199-SAKALESHAPURA (SC)
MLA Constituency 199-SAKALESHAPURA (SC)
Panchayat Name KANATHUR
Village Name KANATHUR -292301061
Table 5.13: Students details
Total Students Boys Girls
103 59 44
Table 5.14: Facility available in school
Facility Type Status Nos
Drinking Water Available
Total Toilets Available 1-Male, 1-Female
Sufcient Toilets Not Available
Shortage of Toilets Not Available
Water facility available in Toilets
Not Available
Electricity Available
Playground Not Available
Kitchen & Kitchen Garden Available
Library Available
Desktop Computers Available
Laptop Available
Tablets Not Available
Teaching Device Not Available
ICT Lab Available
Integrated Science Lab Not Available

33
Table 5.15: Parameters wise marks obtained
Paramaeters Min Max Marks Scored
School Building 0 3 3
Boundary Wall 0 3 3
Toilet 0 3 1
Drinking water 0 3 3
Electricity availalbility 0 2 2
Play Ground 0 1 0
Kitchen and Kitchen garden 0 1 1
Library 0 1 1
IT Facility Availability 1 2 1
Integrated Science LAB 0 1 0
ICT LAB 0 1 1
Total 0 21 16
Boys
District Total
12
93
13
34
57
15
41
71
01-Department of Educa�on
9058
181319
04-Pvt. Aided0
44
104
05-Pvt. Unaided
311
9895
06-Other M
anagement
03
30
01-Department of Educa�on
178114
273446
04-Pvt. Aided0
212
202
05-Pvt. Unaided
223
132265
06-Other M
anagement
07
60
01-Department of Educa�on
198184
334888
04-Pvt. Aided0
739
352
05-Pvt. Unaided
636
214048
06-Other M
anagement
17
721
01-Department of Educa�on
152113
222965
04-Pvt. Aided0
816
334
05-Pvt. Unaided
325
172112
06-Other M
anagement
25
585
01-Department of Educa�on
200160
413355
04-Pvt. Aided0
613
435
05-Pvt. Unaided
251
253985
06-Other M
anagement
16
633
01-Department of Educa�on
220150
433876
04-Pvt. Aided0
1931
904
05-Pvt. Unaided
885
469136
06-Other M
anagement
07
7313
01-Department of Educa�on
148111
393181
04-Pvt. Aided0
16
84
05-Pvt. Unaided
418
102264
06-Other M
anagement
08
80
01-Department of Educa�on
7380
181863
04-Pvt. Aided0
29
202
05-Pvt. Unaided
218
121504
06-Other M
anagement
05
50
HASSAN
HOLEN
ARASIPURA
SAKALESHAPURA
ALUR
ARAKALAGU
DU
ARASIKERE
BELUR
CHANN
ARAYAPATNA
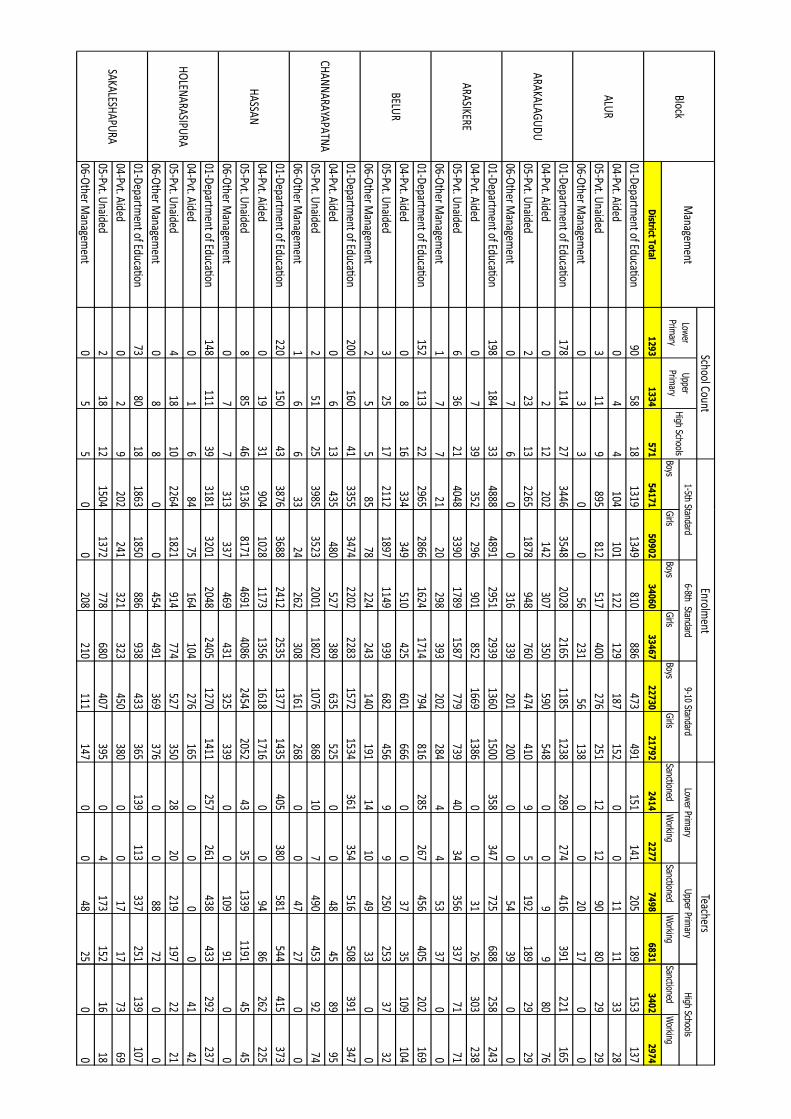
Managem
ent
School Count
Lower
Primary
Upper
Primary
High Schools
Block1-5th Standard
Girls
BoysG
irlsBoys
Girls
SanctionedW
orkingSanctioned
Working
50
90
23
40
60
33
46
72
27
30
21
79
22
41
42
27
77
49
86
83
1
1349810
886473
491151
141205
189
101122
129187
1520
011
11
812517
400276
25112
1290
80
056
23156
1380
020
17
35482028
21651185
1238289
274416
391
142307
350590
5480
09
9
1878948
760474
4109
5192
189
0316
339201
2000
054
39
48912951
29391360
1500358
347725
688
296901
8521669
13860
031
26
33901789
1587779
73940
34356
337
20298
393202
2844
453
37
28661624
1714794
816285
267456
405
349510
425601
6660
037
35
18971149
939682
4569
9250
253
78224
243140
19114
1049
33
34742202
22831572
1534361
354516
508
480527
389635
5250
048
45
35232001
18021076
86810
7490
453
24262
308161
2680
047
27
36882412
25351377
1435405
380581
544
10281173
13561618
17160
094
86
81714691
40862454
205243
351339
1191
337469
431325
3390
0109
91
32012048
24051270
1411257
261438
433
75164
104276
1650
00
0
1821914
774527
35028
20219
197
0454
491369
3760
088
72
1850886
938433
365139
113337
251
241321
323450
3800
017
17
1372778
680407
3950
4173
152
0208
210111
1470
048
25
Enrolment
Teachers6-8th Standard
9-10 StandardLow
er Primary
Upper Prim
ary
SanctionedW
orking
34
02
29
74
153137
3328
2929
00
221165
8076
2929
00
258243
303238
7171
00
202169
109104
3732
00
391347
8995
9274
00
415373
262225
4545
00
292237
4142
2221
00
139107
7369
1618
00
High Schools
PÀ£ÁðlPÀ ¸ÀPÁðgÀ
¥ÁæxÀ«ÄPÀ ªÀÄvÀÄÛ ¥ËæqsÀ±Á¯Á ²PÀët E¯ÁSÉ
Infrastructure and SSLC Result
Analysis for the
year 2019-20 - Hassan District