Infrared reflectance spectroscopy as an analytical technique for the study of residues on stone...
8
Infrared reflectance spectroscopy as an analytical technique for the study of residues on stone tools: potential and challenges Linda C. Prinsloo a, * , Lyn Wadley b, c , Marlize Lombard d a Physics Department, University of Pretoria, Private Bag X20, Hatfield 0028, South Africa b School of Geography, Archaeology and Environmental Studies, University of the Witwatersrand, Private Bag 3, WITS 2050, South Africa c Evolutionary Studies Institute, Centre of Excellence, Palaeosciences, University of the Witwatersrand, Private Bag 3, WITS 2050, South Africa d Department of Anthropology and Development Studies, University of Johannesburg, PO Box 524, Auckland Park Campus, Johannesburg 2006, South Africa article info Article history: Received 5 August 2013 Received in revised form 2 October 2013 Accepted 8 October 2013 Keywords: FTIR reflectance spectroscopy Stone tools Animal residues abstract FTIR (Fourier transform infrared) spectroscopy is a non-destructive analytical method that has been used successfully to analyse both inorganic and organic archaeological material. Using a microscope attach- ment has the additional benefit of analysing very small spots (diameter 100 mm) directly on an artefact without sample preparation or destruction. It is therefore a suitable method to study residues on pre- historic stone tools. However, using a microscope without an ATR (attenuated total reflection) micro- scope objective, results in a combination of reflection and transmission/absorbance FTIR spectra, which is not always as easy to interpret as directly measured transmission/absorbance spectra. In order to improve the interpretation of spectra recorded on archaeological samples, the method was tested with replicated Middle Stone Age stone points used during hunting and butchery experiments on parts of a blue wildebeest (Connochaetes taurinus) published in 2004 (Lombard et al., 2004). In this case, the residues on the tools were known and post-depositional contamination was eliminated. Additional samples of the organic materials, and the minerals from which the tools were made were also available. Therefore, we could assess the viability of FTIR reflectance spectra for distinguishing between bone, fat and protein residues. Ó 2013 Elsevier Ltd. All rights reserved. 1. Introduction Detecting, identifying and interpreting micro-residues on Mid- dle Stone Age or Middle Palaeolithic stone tools is never an easy or straight-forward exercise. Non-destructive micro-residue analysis on archaeological stone tools is mostly done using high-power, re- flected light microscopes (e.g., Hardy and Moncel, 2011; Langejans, 2012; Lombard, 2011). Blind test results attest to the general reli- ability of the identification of micro-residue types left on stone tools as a result of their use and/or hafting using reflected light micro- scopy (Hardy and Garufi, 1998; Lombard and Wadley, 2007; Monnier et al., 2012; Wadley et al., 2004). To increase the depend- ability of interpretations, concomitant support for the identification of such residues should be sought. For example, the repetitive clustering of attendant residues, such as the combination of fat, blood, bone, and animal tissue on a tool portion provides a far more secure interpretation of an animal residue type than any single residue (Wadley and Lombard, 2007). This approach is particularly relevant to archaeological contexts where some residues may be partially degraded and where the potential of ancient, post- depositional or post-excavation contaminants is high (Langejans, 2011). In some cases the removal and destruction of ancient residues on stone tools for specific morphological or biochemical analysis are warranted. Yet, it is our contention that e depending on the quality and certainty of results, age of the material, sample size and research question e non-destructive analyses remain one of the most responsible, contextual and informative approaches. Destructive processes are often focused on extracting only certain residue types, for example starch grains (e.g., Li et al., 2013), or animal proteins (e.g., Högberg et al., 2009), paying little attention to other residues, and destroying or disturbing their in situ context on the tool (although the work of Högberg et al. (2009) is exemplary in its integration of usewear and residue analysis). Also, despite the increased sensitivity of biochemical techniques, useful results from ancient material are seldom guaranteed. This is so because: a) the biochemistry of the micro-remains might have changed over time as a result of diagenesis, fossilization or soil chemistry, b) there is * Corresponding author. E-mail addresses: [email protected], [email protected] (L.C. Prinsloo), [email protected] (L. Wadley), [email protected] (M. Lombard). Contents lists available at ScienceDirect Journal of Archaeological Science journal homepage: http://www.elsevier.com/locate/jas 0305-4403/$ e see front matter Ó 2013 Elsevier Ltd. All rights reserved. http://dx.doi.org/10.1016/j.jas.2013.10.011 Journal of Archaeological Science 41 (2014) 732e739
-
Upload
johannesburg -
Category
Documents
-
view
1 -
download
0
Transcript of Infrared reflectance spectroscopy as an analytical technique for the study of residues on stone...
lable at ScienceDirect
Journal of Archaeological Science 41 (2014) 732e739
Contents lists avai
Journal of Archaeological Science
journal homepage: http: / /www.elsevier .com/locate/ jas
Infrared reflectance spectroscopy as an analytical technique for thestudy of residues on stone tools: potential and challenges
Linda C. Prinsloo a,*, Lyn Wadley b,c, Marlize Lombard d
a Physics Department, University of Pretoria, Private Bag X20, Hatfield 0028, South Africab School of Geography, Archaeology and Environmental Studies, University of the Witwatersrand, Private Bag 3, WITS 2050, South Africac Evolutionary Studies Institute, Centre of Excellence, Palaeosciences, University of the Witwatersrand, Private Bag 3, WITS 2050, South AfricadDepartment of Anthropology and Development Studies, University of Johannesburg, PO Box 524, Auckland Park Campus, Johannesburg 2006, South Africa
a r t i c l e i n f o
Article history:Received 5 August 2013Received in revised form2 October 2013Accepted 8 October 2013
Keywords:FTIR reflectance spectroscopyStone toolsAnimal residues
* Corresponding author.E-mail addresses: [email protected], prinslooli
[email protected] (L. Wadley), [email protected]
0305-4403/$ e see front matter � 2013 Elsevier Ltd.http://dx.doi.org/10.1016/j.jas.2013.10.011
a b s t r a c t
FTIR (Fourier transform infrared) spectroscopy is a non-destructive analytical method that has been usedsuccessfully to analyse both inorganic and organic archaeological material. Using a microscope attach-ment has the additional benefit of analysing very small spots (diameter 100 mm) directly on an artefactwithout sample preparation or destruction. It is therefore a suitable method to study residues on pre-historic stone tools. However, using a microscope without an ATR (attenuated total reflection) micro-scope objective, results in a combination of reflection and transmission/absorbance FTIR spectra, which isnot always as easy to interpret as directly measured transmission/absorbance spectra. In order toimprove the interpretation of spectra recorded on archaeological samples, the method was tested withreplicated Middle Stone Age stone points used during hunting and butchery experiments on parts of ablue wildebeest (Connochaetes taurinus) published in 2004 (Lombard et al., 2004). In this case, theresidues on the tools were known and post-depositional contamination was eliminated. Additionalsamples of the organic materials, and the minerals from which the tools were made were also available.Therefore, we could assess the viability of FTIR reflectance spectra for distinguishing between bone, fatand protein residues.
� 2013 Elsevier Ltd. All rights reserved.
1. Introduction
Detecting, identifying and interpreting micro-residues on Mid-dle Stone Age or Middle Palaeolithic stone tools is never an easy orstraight-forward exercise. Non-destructive micro-residue analysison archaeological stone tools is mostly done using high-power, re-flected light microscopes (e.g., Hardy and Moncel, 2011; Langejans,2012; Lombard, 2011). Blind test results attest to the general reli-ability of the identification ofmicro-residue types left on stone toolsas a result of their use and/or hafting using reflected light micro-scopy (Hardy and Garufi, 1998; Lombard and Wadley, 2007;Monnier et al., 2012; Wadley et al., 2004). To increase the depend-ability of interpretations, concomitant support for the identificationof such residues should be sought. For example, the repetitiveclustering of attendant residues, such as the combination of fat,blood, bone, and animal tissue on a tool portion provides a far moresecure interpretation of an animal residue type than any single
[email protected] (L.C. Prinsloo),(M. Lombard).
All rights reserved.
residue (Wadley and Lombard, 2007). This approach is particularlyrelevant to archaeological contexts where some residues may bepartially degraded and where the potential of ancient, post-depositional or post-excavation contaminants is high (Langejans,2011).
In some cases the removal and destruction of ancient residueson stone tools for specific morphological or biochemical analysisare warranted. Yet, it is our contention that e depending on thequality and certainty of results, age of the material, sample size andresearch question e non-destructive analyses remain one of themost responsible, contextual and informative approaches.Destructive processes are often focused on extracting only certainresidue types, for example starch grains (e.g., Li et al., 2013), oranimal proteins (e.g., Högberg et al., 2009), paying little attention toother residues, and destroying or disturbing their in situ context onthe tool (although the work of Högberg et al. (2009) is exemplary inits integration of usewear and residue analysis). Also, despite theincreased sensitivity of biochemical techniques, useful results fromancient material are seldom guaranteed. This is so because: a) thebiochemistry of the micro-remains might have changed over timeas a result of diagenesis, fossilization or soil chemistry, b) there is
L.C. Prinsloo et al. / Journal of Archaeological Science 41 (2014) 732e739 733
too little left for successful analysis, or c) the micro-residues are too‘messy’ or contaminated (from use or from post-depositional/curational conditions) to provide conclusive biochemical results.
Thus far, the best biochemical results for very old material (forexample 60.5 � 1.9 ka from Diepkloof) are obtained when macro-scopic residues (relatively large quantities) are available fordestructive analysis, and when there is a specific question at hand,for example, identifying the ingredients in adhesives (e.g.,Cârciumara et al., 2012; Charrié-Duhaut et al., 2013). Yet,weknowoffew ‘trouble-free’ biochemical results relating to very old stone toolswith animal residues such as bone, fat, animal tissue or collagen.With this initial paper we investigate the potential of detectinganimal residues on stone tools in a non-destructive way, applyingFTIR (Fourier transform infrared) spectroscopy to replicated stonepoints used for hunting and carcass processing, and we highlightpotential archaeological applications, methodological improve-ments needed, and some difficulties associated with the technique.
FTIR spectroscopy has been used to analyse both inorganic andorganic archaeological material (Cârciumara et al., 2012; Cotte et al.,2005;Mizzoni andCesaro, 2007;Thompsonet al., 2013;Yaroshevichet al., 2013). A benefit of this technique is that inorganic and organicphases can be analyzed simultaneously and a microscope attach-ment has the additional advantage of analyzing very small areasdirectly on an artefact without sample preparation or destruction.Infrared spectroscopy is also not hindered by fluorescence in thesame way as Raman spectroscopy during the recording of spectraassociated with organic materials (Prinsloo et al., 2013). Therefore,depending on biochemical preservation, FTIR spectroscopy is anideal method to study micro-residues on prehistoric tools.
Preferably, an attenuated total reflection (ATR) microscopeobjective should be used to measure spectra directly in trans-mission or absorbance mode, but we have found that it is verydifficult to record spectra on the uneven surfaces of the stone tools.It is evenmore difficult if the spot of interest is on the edge of a tool.Breakages can occur on the tool edge due to uneven pressureapplied by the ATR objective on rough surfaces. However, using amicroscope in reflectance mode results in a combination ofreflection and transmission/absorbance FTIR spectra, which is notalways as easy to interpret as directly measured transmission/absorbance spectra.
Recently it has been shown that FTIR specular reflectancespectra can be used to distinguish between minerals and for im-aging material properties of bone specimens (Acerbo et al., 2012;Nicholson et al., 2012; Ostrooumov, 2009). In the identification ofgemstones the technique is gaining ground, and has been in use forquite some time for remote sensing of minerals (e.g., Hainschwangand Notari, 2008; Clark, 1999). In the field of heritage studies,where non-invasive techniques are imperative, FTIR reflectancespectroscopy was also found to be useful in the study of pigmentsand binders in spite of the difficulties in interpreting reflectancespectra (Buti et al., 2013; Lojewski et al., 2011; Miliani et al., 2012;Rosi et al., 2011; Unger et al., 2013).
Using experimental material, we attempt to establish whetherreflection-based FTIR micro-spectroscopy can be used to study use-related animal residues adhering to stone tools. In contrast to
Table 1Summary of samples used in this study.
Point no. Minerals used Haft material
108 Medium-grained quartzite Commercial dowel109 Medium-grained mudstone Combretum erythrophyllum207 Fine-grained quartzite Commercial dowel214 Fine-grained chert Tapiphyllum parvifolium219 Fine-grained hornfels Commercial dowel311 Fine-grained hornfels Canthium inerme
genuine archaeological samples, the residues on the tools areknown and reference material is readily available. Furthermore,post-depositional contamination is absent as the samples are only10 years old and have been stored in sterile conditions. Therefore,we are able to assess the viability of FTIR reflectance spectra fordistinguishing between bone, fat and protein residues.
2. Materials and methods
2.1. Stone tool points
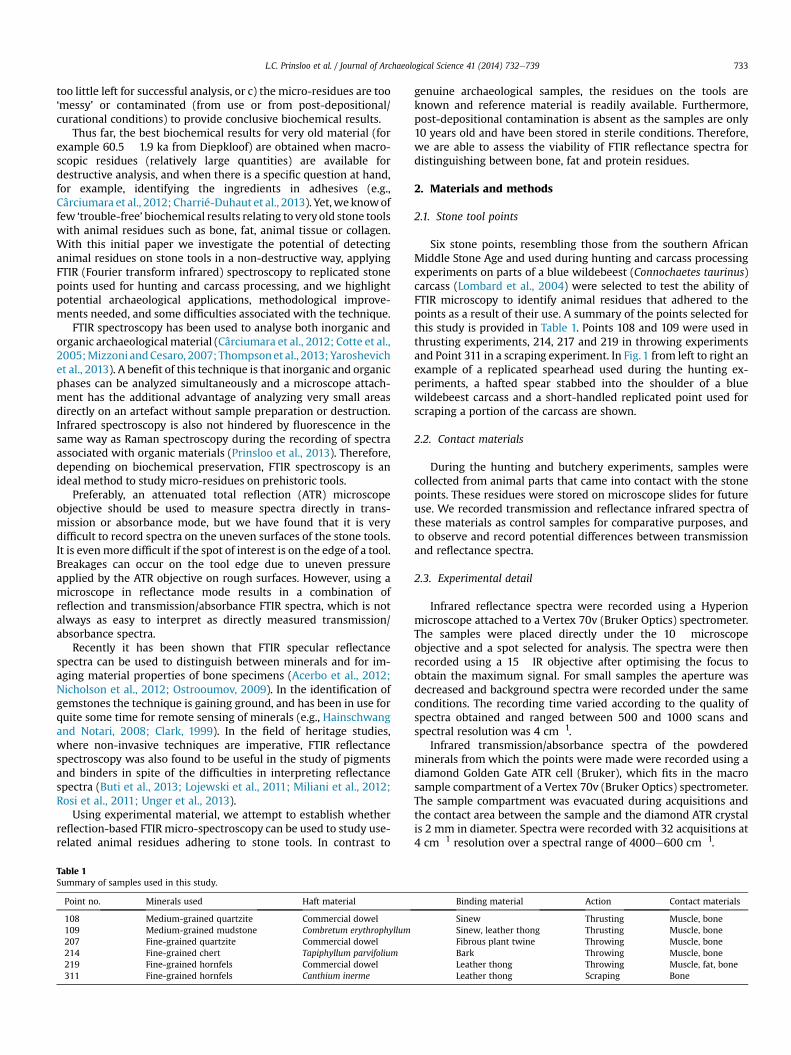
Six stone points, resembling those from the southern AfricanMiddle Stone Age and used during hunting and carcass processingexperiments on parts of a blue wildebeest (Connochaetes taurinus)carcass (Lombard et al., 2004) were selected to test the ability ofFTIR microscopy to identify animal residues that adhered to thepoints as a result of their use. A summary of the points selected forthis study is provided in Table 1. Points 108 and 109 were used inthrusting experiments, 214, 217 and 219 in throwing experimentsand Point 311 in a scraping experiment. In Fig. 1 from left to right anexample of a replicated spearhead used during the hunting ex-periments, a hafted spear stabbed into the shoulder of a bluewildebeest carcass and a short-handled replicated point used forscraping a portion of the carcass are shown.
2.2. Contact materials
During the hunting and butchery experiments, samples werecollected from animal parts that came into contact with the stonepoints. These residues were stored on microscope slides for futureuse. We recorded transmission and reflectance infrared spectra ofthese materials as control samples for comparative purposes, andto observe and record potential differences between transmissionand reflectance spectra.
2.3. Experimental detail
Infrared reflectance spectra were recorded using a Hyperionmicroscope attached to a Vertex 70v (Bruker Optics) spectrometer.The samples were placed directly under the 10� microscopeobjective and a spot selected for analysis. The spectra were thenrecorded using a 15� IR objective after optimising the focus toobtain the maximum signal. For small samples the aperture wasdecreased and background spectra were recorded under the sameconditions. The recording time varied according to the quality ofspectra obtained and ranged between 500 and 1000 scans andspectral resolution was 4 cm�1.
Infrared transmission/absorbance spectra of the powderedminerals from which the points were made were recorded using adiamond Golden Gate ATR cell (Bruker), which fits in the macrosample compartment of a Vertex 70v (Bruker Optics) spectrometer.The sample compartment was evacuated during acquisitions andthe contact area between the sample and the diamond ATR crystalis 2 mm in diameter. Spectra were recorded with 32 acquisitions at4 cm�1 resolution over a spectral range of 4000e600 cm�1.
Binding material Action Contact materials
Sinew Thrusting Muscle, boneSinew, leather thong Thrusting Muscle, boneFibrous plant twine Throwing Muscle, boneBark Throwing Muscle, boneLeather thong Throwing Muscle, fat, boneLeather thong Scraping Bone
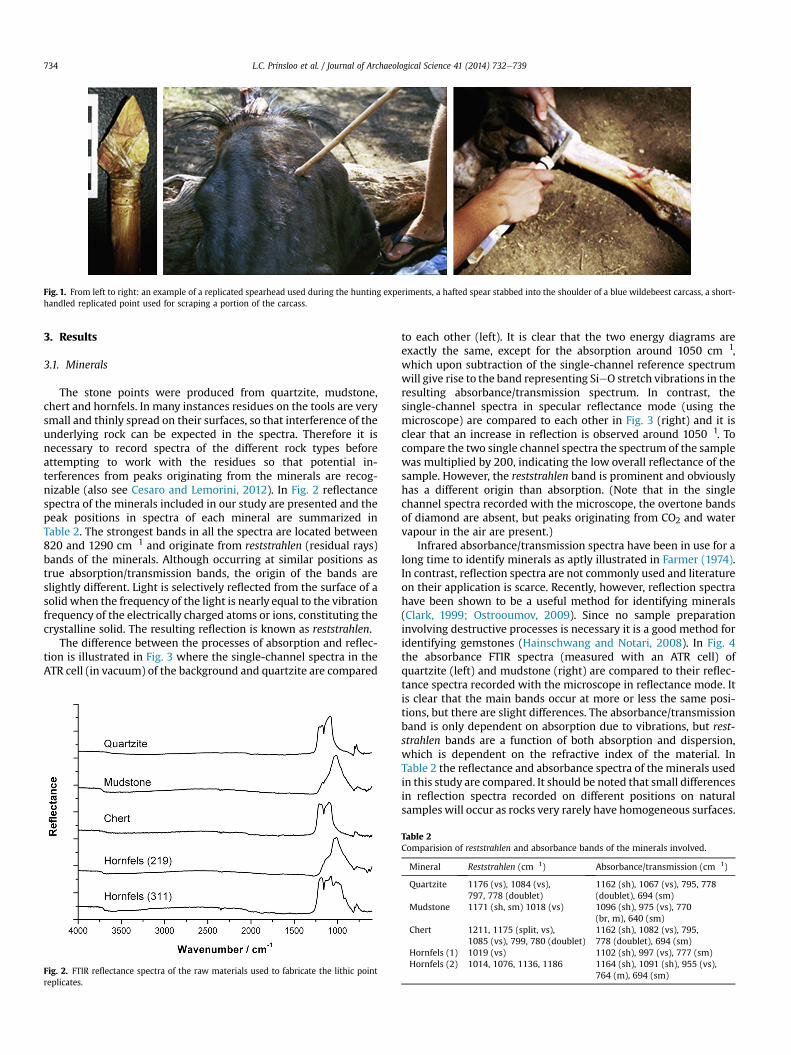
Fig. 1. From left to right: an example of a replicated spearhead used during the hunting experiments, a hafted spear stabbed into the shoulder of a blue wildebeest carcass, a short-handled replicated point used for scraping a portion of the carcass.
L.C. Prinsloo et al. / Journal of Archaeological Science 41 (2014) 732e739734
3. Results
3.1. Minerals
The stone points were produced from quartzite, mudstone,chert and hornfels. In many instances residues on the tools are verysmall and thinly spread on their surfaces, so that interference of theunderlying rock can be expected in the spectra. Therefore it isnecessary to record spectra of the different rock types beforeattempting to work with the residues so that potential in-terferences from peaks originating from the minerals are recog-nizable (also see Cesaro and Lemorini, 2012). In Fig. 2 reflectancespectra of the minerals included in our study are presented and thepeak positions in spectra of each mineral are summarized inTable 2. The strongest bands in all the spectra are located between820 and 1290 cm�1 and originate from reststrahlen (residual rays)bands of the minerals. Although occurring at similar positions astrue absorption/transmission bands, the origin of the bands areslightly different. Light is selectively reflected from the surface of asolid when the frequency of the light is nearly equal to the vibrationfrequency of the electrically charged atoms or ions, constituting thecrystalline solid. The resulting reflection is known as reststrahlen.
The difference between the processes of absorption and reflec-tion is illustrated in Fig. 3 where the single-channel spectra in theATR cell (in vacuum) of the background and quartzite are compared
Fig. 2. FTIR reflectance spectra of the raw materials used to fabricate the lithic pointreplicates.
to each other (left). It is clear that the two energy diagrams areexactly the same, except for the absorption around 1050 cm�1,which upon subtraction of the single-channel reference spectrumwill give rise to the band representing SieO stretch vibrations in theresulting absorbance/transmission spectrum. In contrast, thesingle-channel spectra in specular reflectance mode (using themicroscope) are compared to each other in Fig. 3 (right) and it isclear that an increase in reflection is observed around 1050�1. Tocompare the two single channel spectra the spectrum of the samplewas multiplied by 200, indicating the low overall reflectance of thesample. However, the reststrahlen band is prominent and obviouslyhas a different origin than absorption. (Note that in the singlechannel spectra recorded with the microscope, the overtone bandsof diamond are absent, but peaks originating from CO2 and watervapour in the air are present.)
Infrared absorbance/transmission spectra have been in use for along time to identify minerals as aptly illustrated in Farmer (1974).In contrast, reflection spectra are not commonly used and literatureon their application is scarce. Recently, however, reflection spectrahave been shown to be a useful method for identifying minerals(Clark, 1999; Ostrooumov, 2009). Since no sample preparationinvolving destructive processes is necessary it is a good method foridentifying gemstones (Hainschwang and Notari, 2008). In Fig. 4the absorbance FTIR spectra (measured with an ATR cell) ofquartzite (left) and mudstone (right) are compared to their reflec-tance spectra recorded with the microscope in reflectance mode. Itis clear that the main bands occur at more or less the same posi-tions, but there are slight differences. The absorbance/transmissionband is only dependent on absorption due to vibrations, but rest-strahlen bands are a function of both absorption and dispersion,which is dependent on the refractive index of the material. InTable 2 the reflectance and absorbance spectra of the minerals usedin this study are compared. It should be noted that small differencesin reflection spectra recorded on different positions on naturalsamples will occur as rocks very rarely have homogeneous surfaces.
Table 2Comparision of reststrahlen and absorbance bands of the minerals involved.
Mineral Reststrahlen (cm�1) Absorbance/transmission (cm�1)
Quartzite 1176 (vs), 1084 (vs),797, 778 (doublet)
1162 (sh), 1067 (vs), 795, 778(doublet), 694 (sm)
Mudstone 1171 (sh, sm) 1018 (vs) 1096 (sh), 975 (vs), 770(br, m), 640 (sm)
Chert 1211, 1175 (split, vs),1085 (vs), 799, 780 (doublet)
1162 (sh), 1082 (vs), 795,778 (doublet), 694 (sm)
Hornfels (1) 1019 (vs) 1102 (sh), 997 (vs), 777 (sm)Hornfels (2) 1014, 1076, 1136, 1186 1164 (sh), 1091 (sh), 955 (vs),
764 (m), 694 (sm)
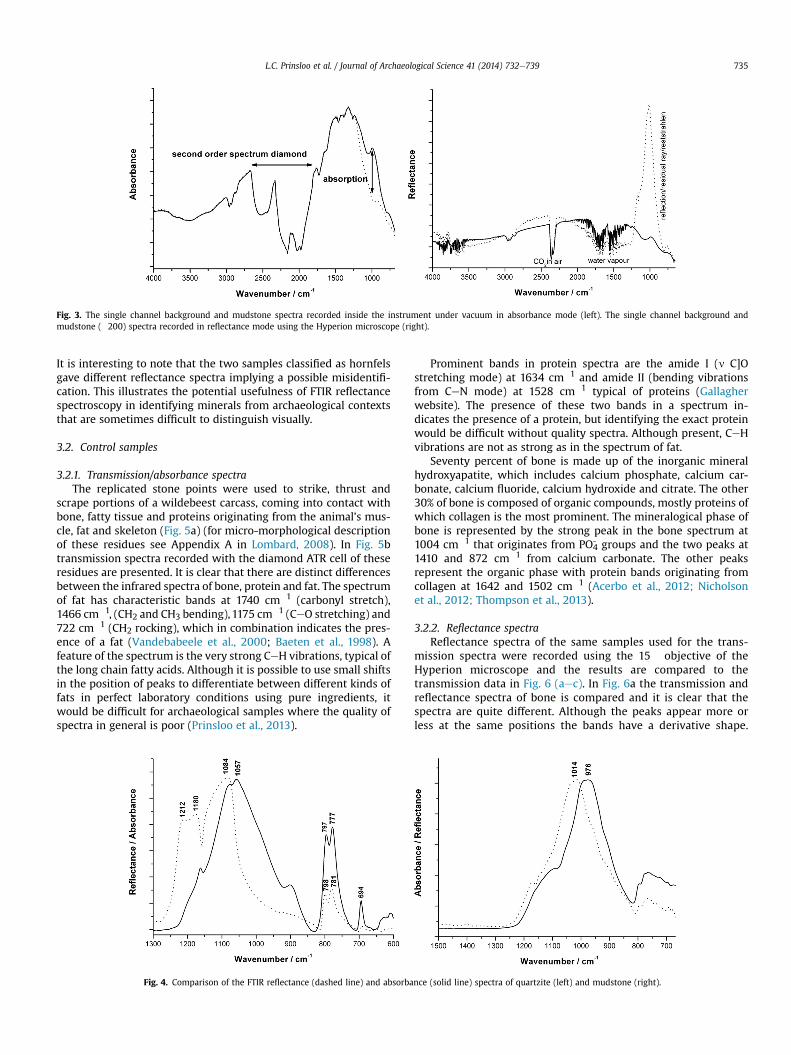
Fig. 3. The single channel background and mudstone spectra recorded inside the instrument under vacuum in absorbance mode (left). The single channel background andmudstone (�200) spectra recorded in reflectance mode using the Hyperion microscope (right).
L.C. Prinsloo et al. / Journal of Archaeological Science 41 (2014) 732e739 735
It is interesting to note that the two samples classified as hornfelsgave different reflectance spectra implying a possible misidentifi-cation. This illustrates the potential usefulness of FTIR reflectancespectroscopy in identifying minerals from archaeological contextsthat are sometimes difficult to distinguish visually.
3.2. Control samples
3.2.1. Transmission/absorbance spectraThe replicated stone points were used to strike, thrust and
scrape portions of a wildebeest carcass, coming into contact withbone, fatty tissue and proteins originating from the animal’s mus-cle, fat and skeleton (Fig. 5a) (for micro-morphological descriptionof these residues see Appendix A in Lombard, 2008). In Fig. 5btransmission spectra recorded with the diamond ATR cell of theseresidues are presented. It is clear that there are distinct differencesbetween the infrared spectra of bone, protein and fat. The spectrumof fat has characteristic bands at 1740 cm�1 (carbonyl stretch),1466 cm�1, (CH2 and CH3 bending),1175 cm�1 (CeO stretching) and722 cm�1 (CH2 rocking), which in combination indicates the pres-ence of a fat (Vandebabeele et al., 2000; Baeten et al., 1998). Afeature of the spectrum is the very strong CeH vibrations, typical ofthe long chain fatty acids. Although it is possible to use small shiftsin the position of peaks to differentiate between different kinds offats in perfect laboratory conditions using pure ingredients, itwould be difficult for archaeological samples where the quality ofspectra in general is poor (Prinsloo et al., 2013).
Fig. 4. Comparison of the FTIR reflectance (dashed line) and absorba
Prominent bands in protein spectra are the amide I (n C]Ostretching mode) at 1634 cm�1 and amide II (bending vibrationsfrom CeN mode) at 1528 cm�1 typical of proteins (Gallagherwebsite). The presence of these two bands in a spectrum in-dicates the presence of a protein, but identifying the exact proteinwould be difficult without quality spectra. Although present, CeHvibrations are not as strong as in the spectrum of fat.
Seventy percent of bone is made up of the inorganic mineralhydroxyapatite, which includes calcium phosphate, calcium car-bonate, calcium fluoride, calcium hydroxide and citrate. The other30% of bone is composed of organic compounds, mostly proteins ofwhich collagen is the most prominent. The mineralogical phase ofbone is represented by the strong peak in the bone spectrum at1004 cm�1 that originates from PO4
- groups and the two peaks at1410 and 872 cm�1 from calcium carbonate. The other peaksrepresent the organic phase with protein bands originating fromcollagen at 1642 and 1502 cm�1 (Acerbo et al., 2012; Nicholsonet al., 2012; Thompson et al., 2013).
3.2.2. Reflectance spectraReflectance spectra of the same samples used for the trans-
mission spectra were recorded using the 15� objective of theHyperion microscope and the results are compared to thetransmission data in Fig. 6 (aec). In Fig. 6a the transmission andreflectance spectra of bone is compared and it is clear that thespectra are quite different. Although the peaks appear more orless at the same positions the bands have a derivative shape.
nce (solid line) spectra of quartzite (left) and mudstone (right).
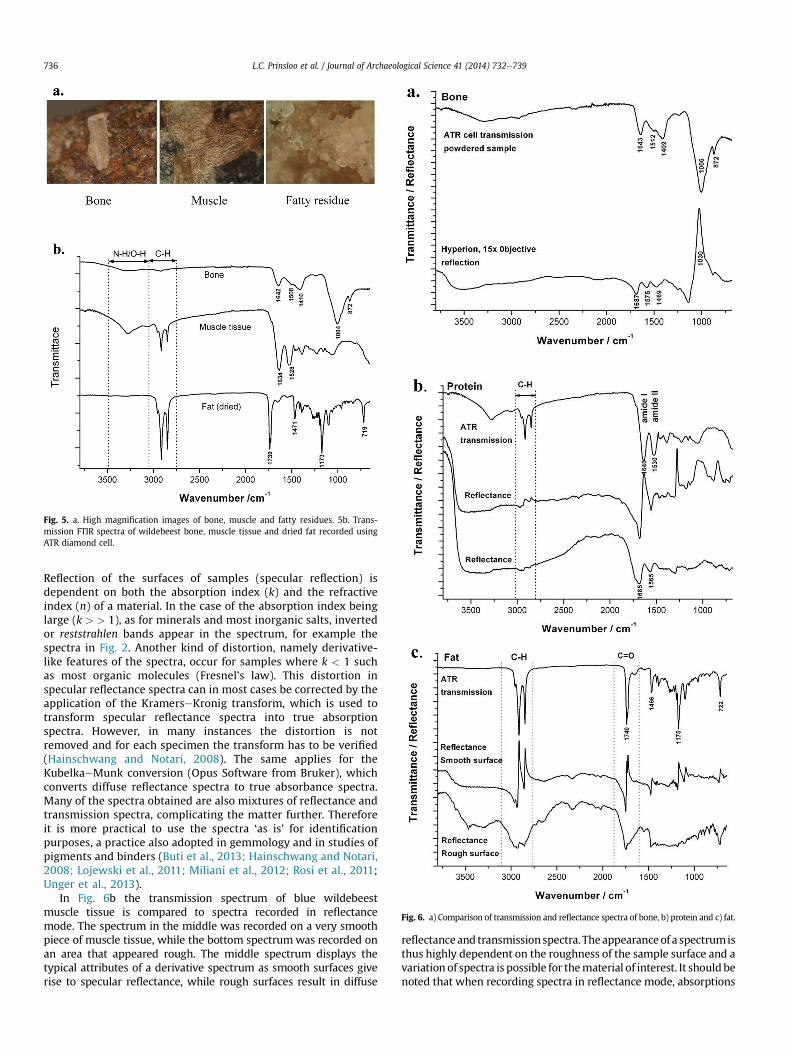
Fig. 5. a. High magnification images of bone, muscle and fatty residues. 5b. Trans-mission FTIR spectra of wildebeest bone, muscle tissue and dried fat recorded usingATR diamond cell.
Fig. 6. a) Comparison of transmission and reflectance spectra of bone, b) protein and c) fat.
L.C. Prinsloo et al. / Journal of Archaeological Science 41 (2014) 732e739736
Reflection of the surfaces of samples (specular reflection) isdependent on both the absorption index (k) and the refractiveindex (n) of a material. In the case of the absorption index beinglarge (k > > 1), as for minerals and most inorganic salts, invertedor reststrahlen bands appear in the spectrum, for example thespectra in Fig. 2. Another kind of distortion, namely derivative-like features of the spectra, occur for samples where k < 1 suchas most organic molecules (Fresnel’s law). This distortion inspecular reflectance spectra can in most cases be corrected by theapplication of the KramerseKronig transform, which is used totransform specular reflectance spectra into true absorptionspectra. However, in many instances the distortion is notremoved and for each specimen the transform has to be verified(Hainschwang and Notari, 2008). The same applies for theKubelkaeMunk conversion (Opus Software from Bruker), whichconverts diffuse reflectance spectra to true absorbance spectra.Many of the spectra obtained are also mixtures of reflectance andtransmission spectra, complicating the matter further. Thereforeit is more practical to use the spectra ‘as is’ for identificationpurposes, a practice also adopted in gemmology and in studies ofpigments and binders (Buti et al., 2013; Hainschwang and Notari,2008; Lojewski et al., 2011; Miliani et al., 2012; Rosi et al., 2011;Unger et al., 2013).
In Fig. 6b the transmission spectrum of blue wildebeestmuscle tissue is compared to spectra recorded in reflectancemode. The spectrum in the middle was recorded on a very smoothpiece of muscle tissue, while the bottom spectrumwas recorded onan area that appeared rough. The middle spectrum displays thetypical attributes of a derivative spectrum as smooth surfaces giverise to specular reflectance, while rough surfaces result in diffuse
reflectanceand transmissionspectra. Theappearanceof a spectrumisthus highly dependent on the roughness of the sample surface and avariation of spectra is possible for thematerial of interest. It should benoted that when recording spectra in reflectance mode, absorptions
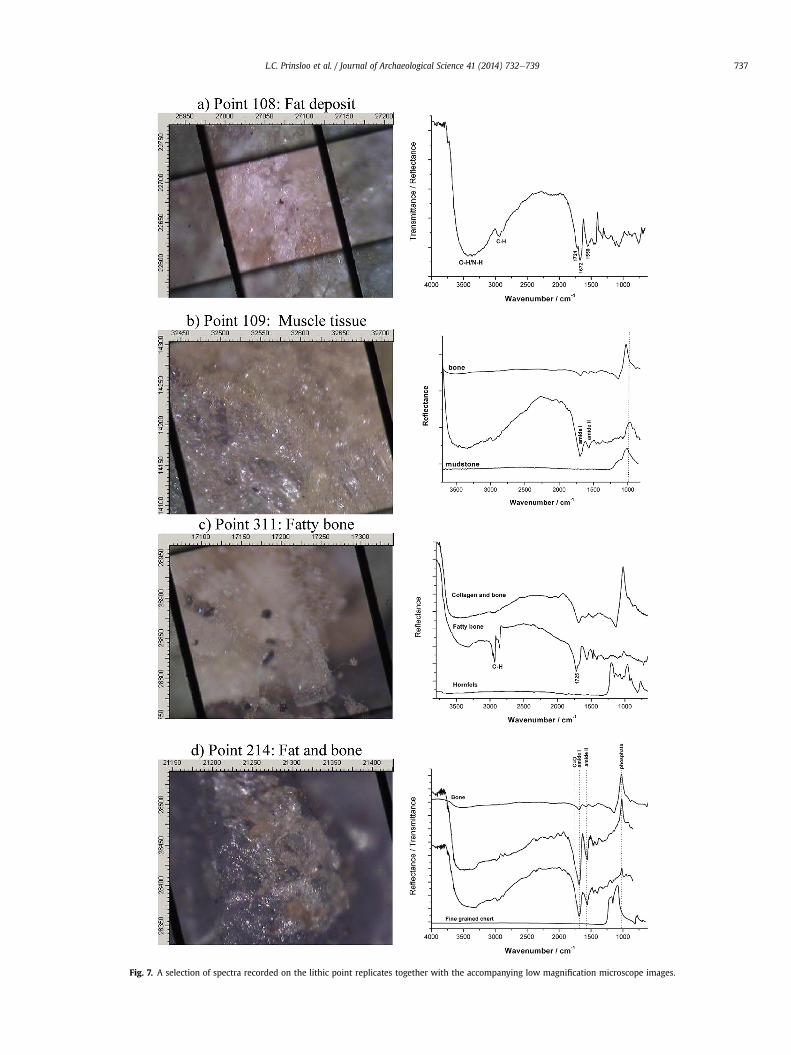
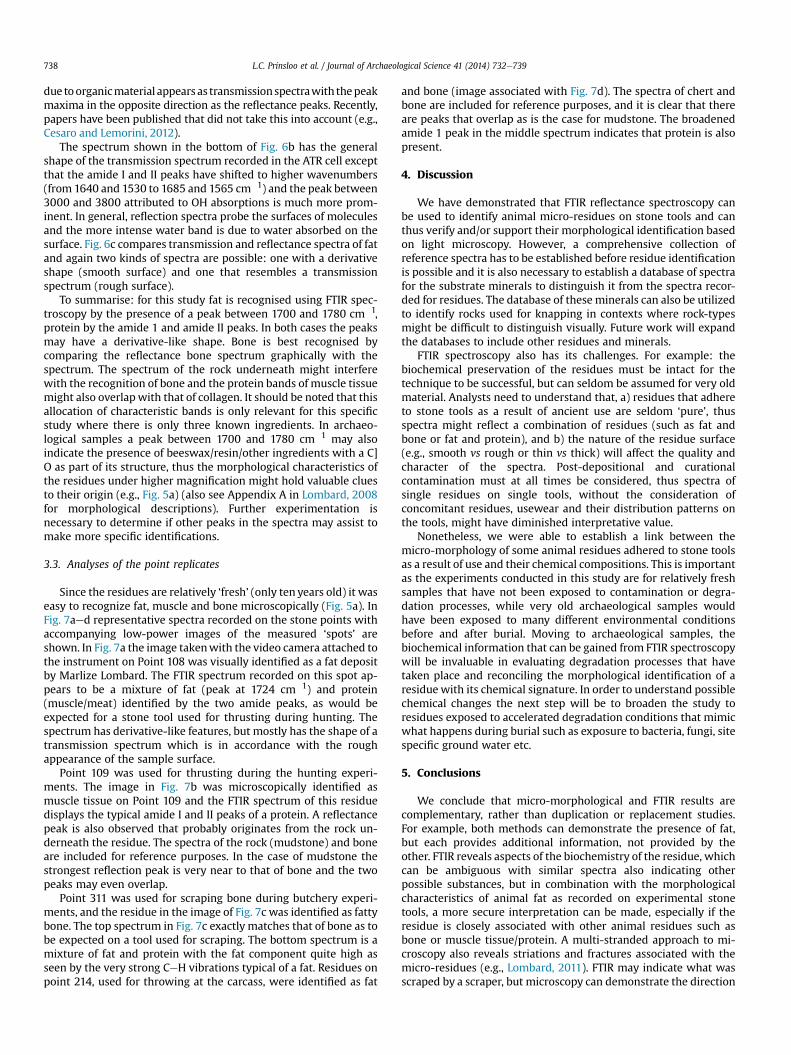
Fig. 7. A selection of spectra recorded on the lithic point replicates together with the accompanying low magnification microscope images.
L.C. Prinsloo et al. / Journal of Archaeological Science 41 (2014) 732e739 737
L.C. Prinsloo et al. / Journal of Archaeological Science 41 (2014) 732e739738
due toorganicmaterial appears as transmissionspectrawith thepeakmaxima in the opposite direction as the reflectance peaks. Recently,papers have been published that did not take this into account (e.g.,Cesaro and Lemorini, 2012).
The spectrum shown in the bottom of Fig. 6b has the generalshape of the transmission spectrum recorded in the ATR cell exceptthat the amide I and II peaks have shifted to higher wavenumbers(from 1640 and 1530 to 1685 and 1565 cm�1) and the peak between3000 and 3800 attributed to OH absorptions is much more prom-inent. In general, reflection spectra probe the surfaces of moleculesand the more intense water band is due to water absorbed on thesurface. Fig. 6c compares transmission and reflectance spectra of fatand again two kinds of spectra are possible: one with a derivativeshape (smooth surface) and one that resembles a transmissionspectrum (rough surface).
To summarise: for this study fat is recognised using FTIR spec-troscopy by the presence of a peak between 1700 and 1780 cm�1,protein by the amide 1 and amide II peaks. In both cases the peaksmay have a derivative-like shape. Bone is best recognised bycomparing the reflectance bone spectrum graphically with thespectrum. The spectrum of the rock underneath might interferewith the recognition of bone and the protein bands of muscle tissuemight also overlapwith that of collagen. It should be noted that thisallocation of characteristic bands is only relevant for this specificstudy where there is only three known ingredients. In archaeo-logical samples a peak between 1700 and 1780 cm�1 may alsoindicate the presence of beeswax/resin/other ingredients with a C]O as part of its structure, thus the morphological characteristics ofthe residues under higher magnification might hold valuable cluesto their origin (e.g., Fig. 5a) (also see Appendix A in Lombard, 2008for morphological descriptions). Further experimentation isnecessary to determine if other peaks in the spectra may assist tomake more specific identifications.
3.3. Analyses of the point replicates
Since the residues are relatively ‘fresh’ (only ten years old) it waseasy to recognize fat, muscle and bone microscopically (Fig. 5a). InFig. 7aed representative spectra recorded on the stone points withaccompanying low-power images of the measured ‘spots’ areshown. In Fig. 7a the image takenwith the video camera attached tothe instrument on Point 108 was visually identified as a fat depositby Marlize Lombard. The FTIR spectrum recorded on this spot ap-pears to be a mixture of fat (peak at 1724 cm�1) and protein(muscle/meat) identified by the two amide peaks, as would beexpected for a stone tool used for thrusting during hunting. Thespectrum has derivative-like features, but mostly has the shape of atransmission spectrum which is in accordance with the roughappearance of the sample surface.
Point 109 was used for thrusting during the hunting experi-ments. The image in Fig. 7b was microscopically identified asmuscle tissue on Point 109 and the FTIR spectrum of this residuedisplays the typical amide I and II peaks of a protein. A reflectancepeak is also observed that probably originates from the rock un-derneath the residue. The spectra of the rock (mudstone) and boneare included for reference purposes. In the case of mudstone thestrongest reflection peak is very near to that of bone and the twopeaks may even overlap.
Point 311 was used for scraping bone during butchery experi-ments, and the residue in the image of Fig. 7c was identified as fattybone. The top spectrum in Fig. 7c exactly matches that of bone as tobe expected on a tool used for scraping. The bottom spectrum is amixture of fat and protein with the fat component quite high asseen by the very strong CeH vibrations typical of a fat. Residues onpoint 214, used for throwing at the carcass, were identified as fat
and bone (image associated with Fig. 7d). The spectra of chert andbone are included for reference purposes, and it is clear that thereare peaks that overlap as is the case for mudstone. The broadenedamide 1 peak in the middle spectrum indicates that protein is alsopresent.
4. Discussion
We have demonstrated that FTIR reflectance spectroscopy canbe used to identify animal micro-residues on stone tools and canthus verify and/or support their morphological identification basedon light microscopy. However, a comprehensive collection ofreference spectra has to be established before residue identificationis possible and it is also necessary to establish a database of spectrafor the substrate minerals to distinguish it from the spectra recor-ded for residues. The database of these minerals can also be utilizedto identify rocks used for knapping in contexts where rock-typesmight be difficult to distinguish visually. Future work will expandthe databases to include other residues and minerals.
FTIR spectroscopy also has its challenges. For example: thebiochemical preservation of the residues must be intact for thetechnique to be successful, but can seldom be assumed for very oldmaterial. Analysts need to understand that, a) residues that adhereto stone tools as a result of ancient use are seldom ‘pure’, thusspectra might reflect a combination of residues (such as fat andbone or fat and protein), and b) the nature of the residue surface(e.g., smooth vs rough or thin vs thick) will affect the quality andcharacter of the spectra. Post-depositional and curationalcontamination must at all times be considered, thus spectra ofsingle residues on single tools, without the consideration ofconcomitant residues, usewear and their distribution patterns onthe tools, might have diminished interpretative value.
Nonetheless, we were able to establish a link between themicro-morphology of some animal residues adhered to stone toolsas a result of use and their chemical compositions. This is importantas the experiments conducted in this study are for relatively freshsamples that have not been exposed to contamination or degra-dation processes, while very old archaeological samples wouldhave been exposed to many different environmental conditionsbefore and after burial. Moving to archaeological samples, thebiochemical information that can be gained from FTIR spectroscopywill be invaluable in evaluating degradation processes that havetaken place and reconciling the morphological identification of aresidue with its chemical signature. In order to understand possiblechemical changes the next step will be to broaden the study toresidues exposed to accelerated degradation conditions that mimicwhat happens during burial such as exposure to bacteria, fungi, sitespecific ground water etc.
5. Conclusions
We conclude that micro-morphological and FTIR results arecomplementary, rather than duplication or replacement studies.For example, both methods can demonstrate the presence of fat,but each provides additional information, not provided by theother. FTIR reveals aspects of the biochemistry of the residue, whichcan be ambiguous with similar spectra also indicating otherpossible substances, but in combination with the morphologicalcharacteristics of animal fat as recorded on experimental stonetools, a more secure interpretation can be made, especially if theresidue is closely associated with other animal residues such asbone or muscle tissue/protein. A multi-stranded approach to mi-croscopy also reveals striations and fractures associated with themicro-residues (e.g., Lombard, 2011). FTIR may indicate what wasscraped by a scraper, but microscopy can demonstrate the direction
L.C. Prinsloo et al. / Journal of Archaeological Science 41 (2014) 732e739 739
of the movement across the bone. FTIR also provides informationon the mineralogy of the underlying rocks, which use-trace mi-croscopy cannot.
Thus, we propose that, ultimately, the combination of methodscanprovide a rich history of stone artefactswithout having to destroyor disturb aspects of the history. We are hopeful that with furtherexperimentation and thoroughly designed research questions FTIRspectroscopy can make a considerable contribution towards under-standing biochemical degradation processes of residues.
Acknowledgements
The authors wish to thank the NRF, and the Universities ofPretoria, the Witwatersrand and Johannesburg for their financialsupport. Results and inferences are, however, those of the authorsand not the funding or supporting institutions.
References
Acerbo, A.S., Lawrence Carr, G., Judex, S., Miller, L.M., 2012. Imaging the materialproperties of bone specimens using reflection-based infrared microscopy. Anal.Chem. 84 (8), 3607e3613. http://dx.doi.org/10.1021/ac203375.
Buti, D., Rosi, F., Brunetti, B.G., Miliani, C., 2013. In-situ identification of copper-based green pigments on paintings and manuscripts by reflection FTIR. Anal.Bioanal. Chem. 405, 2699e2711. http://dx.doi.org/10.1007/s00216-013-6707-6.
Baeten, V., Hourant, P., Morales, M.T., Aparicio, R., 1998. Oil and fat classification byFT-Raman Spectroscopy. J. Agric. Food Chem. 46, 2638e2646.
Cârciumara, M., Ion, R., Nitu, E., Stef�anescu, R., 2012. New evidence of adhesive ashafting material on Middle and Upper Palaeolithic artefacts from Gura Cheii-Râsnov Cave (Romania). J. Archaeol. Sci. 39, 1942e1950. http://dx.doi.org/10.1016/j.jas.2012.02.016.
Cesaro, N.C., Lemorini, C., 2012. The function of prehistoric lithic tools: a combinedstudy of use-wear analysis and FTIR microspectroscopy, Spectrochim. Acta AMol. Biomol. Spectrosc. 86, 299e304. http://dx.doi.org/10.1016/j.saa.2011.10.040.
Charrié-Duhaut, A., Porraz, G., Cartwright, C.R., Igreja, M., Connan, J., Poggenpoel, C.,Texier, P.-J., 2013. First molecular identification of a hafting adhesive in the LateHowiesons Poort at Diepkloof Rock Shelter (Western Cape, South Africa).J. Archaeol. Sci. 40, 3506e3518. http://dx.doi.org/10.1016/j.jas.2012.12.026.
Clark, R.N., 1999. Chapter 1: spectroscopy of rocks and minerals, and principles ofspectroscopy. In: Rencz, A.N. (Ed.), Manual of Remote Sensing, Remote Sensingfor the Earth Sciences, vol. 3. John Wiley and Sons, New York, pp. 3e58. http://speclab.cr.usgs.gov.
Cotte, M., Dumas, P., Richard, G., Breniaux, R., Walter, P., 2005. New insight onancient cosmetic preparation by synchrotron-based infrared microscopy. Anal.Chim. Acta 553 (1e2), 105e110. http://dx.doi.org/10.1016/j.aca.2005.07.067.
Farmer, V.C. (Ed.), 1974. The Infrared Spectra of Minerals. Mineralogical Society,London, England.
Gallagher, W., FTIR Analysis of Protein Structure. http://www.chem.uwec.edu/Chem455_S05/Pages/Manuals/FTIR_of_proteins.pdf.
Hainschwang, T., Notari, F., 2008. Specular reflectance infrared spectroscopy e areview and update of a little exploited method for gem identification.J. Gemmol. 31 (1e2), 23e29.
Hardy, B.L., Garufi, G.T., 1998. Identification of woodworking on stone tools throughresidue and use-wear analyses: experimental results. J. Archaeol. Sci. 25, 177e184.
Hardy, B.L., Moncel, H.-M., 2011. Neanderthal use of fish, mammals, birds, starchyplants and wood 125e250,000 years ago. PLoS ONE 6 (8), e23768. http://dx.doi.org/10.1371/journal.pone.0023768. DOI: 10.1006/jasc.1997.0234.
Högberg, A., Puseman, K., Yost, C., 2009. Integration of use-wear with protein res-idue analysis: a study of tool use and function in the south ScandinavianEarly Neolithic. J. Archaeol. Sci. 36, 1725e1737. http://dx.doi.org/10.1016/j.jas.2009.03.030.
Langejans, G.H.J., 2011. Discerning use-related micro-residues on tools: testing themulti-stranded approach for archaeological studies. J. Archaeol. Sci. 38, 985e1000. http://dx.doi.org/10.1016/j.jas.2010.11.013.
Langejans, G.H.J., 2012. Middle Stone Age pièces esquillées from Sibudu Cave, SouthAfrica: an initial micro-residue study. J. Archaeol. Sci. 39, 1694e1704. http://dx.doi.org/10.1016/j.jas.2011.12.036.
Li, M., Yang, X., Ge, Q., Ren, X., Wan, Z., 2013. Starch grains analysis of stone knivesfrom changning site, Qinghai Province, Northwest China. J. Archaeol. Sci. 40,1667e1672. http://dx.doi.org/10.1016/j.jas.2012.11.018.
Lojewski, T., Bagniuk, J., Kolodziej, A., Lojewska, A., 2011. Reflective and photo-acoustic infrared spectroscopic techniques in assessment of binding media inpaintings. Appl. Phys. A 105, 753e761. http://dx.doi.org/10.1007/s00339-011-6512-z.
Lombard, M., 2008. Finding resolution for the Howiesons Poort through the mi-croscope: micro-residue analysis of segments from Sibudu Cave, South Africa.J. Archaeol. Sci. 35, 26e41.
Lombard, M., 2011. Quartz-tipped arrows older than 60 ka: further use-traceevidence from Sibudu, KwaZulu-Natal, South Africa. J. Archaeol. Sci. 38, 1918e1930. http://dx.doi.org/10.1016/j.jas.2011.04.001.
Lombard, M., Wadley, L., 2007. The morphological identification of micro-residueson stone tools using light microscopy: progress and difficulties based onblind tests. J. Archaeol. Sci. 34, 155e165. http://dx.doi.org/10.1016/j.jas.2006.04.008.
Lombard, M., Parsons, I., van der Ryst, M.M., 2004. Middle Stone Age lithic pointexperimentation for macro-fracture and residue analyses: the process andpreliminary results with reference to Sibudu Cave points. S. Afr. J. Sci. 100,159e166.
Miliani, C., Rosi, F., Daveri, A., Brunetti, B.G., 2012. Reflection infrared spectroscopyfor the non-invasive in situ study of artists’ pigments. Appl. Phys. A 106, 295e307. http://dx.doi.org/10.1007/s00339-011-6708-2.
Mizzoni, F., Cesaro, S.N., 2007. Study of the organic residue from a 2600-year oldEtruscan plumpekanne. Spectrochim. Acta A Mol. Biomol. Spectrosc. 68 (2),377e381. http://dx.doi.org/10.1016/j.saa.2006.12.005.
Monnier, G.F., Ladwig, J.L., Porter, S.T., 2012. Swept under the rug: the problem ofunacknowledged ambiguity in lithic residue identification. J. Archaeol. Sci. 39,3284e3300. http://dx.doi.org/10.1016/j.jas.2012.05.010.
Nicholson, C.L., Firth, E.C., Waterland, M.R., Jones, G., Ganesh, S., Stewart, R.B., 2012.Innovative approach to investigating the microstructure of calcified tissuesusing specular reflectance Fourier transform-infrared microspectroscopy anddiscriminant analysis. Anal. Chem. 84, 3369e3375. http://dx.doi.org/10.1021/ac300123r.
Ostrooumov, M., 2009. Infrared reflection spectrometry analysis as a non-destructive method of characterising minerals and stone materials ingeoarchaeological and archaeometric applications. Geoarchaeol. Int. J. 24 (5),619e637. http://dx.doi.org/10.1002/gea.20277.
Prinsloo, L.C., Tournié, A., Colomban, Ph, Paris, C., Bassett, S.T., 2013. In search of theoptimum Raman/IR signatures of potential ingredients used in San/Bushmanrock art paint. J. Archeol. Sci. 40, 1981e1990. http://dx.doi.org/10.1016/j.jas.2013.02.010.
Rosi, F., Federici, A., Brunette, B.G., Sgamellotti, A., Clememti, S., Miliani, C., 2011.Multivariate chemical mapping of pigments and binders in easel paintingcross-sections by micro IR reflection spectroscopy. Anal. Bioanal. Chem. 399,3133e3145. http://dx.doi.org/10.1007/s00216-010-4239-x.
Thompson, T.J.U., Islam, M., Bonniere, M., 2013. A new statistical approach fordetermining the crystallinity of heat-altered bone mineral from FTIR spectra.J. Archaeol. Sci. 40, 416e422. http://dx.doi.org/10.1016/j.jas.2012.07.008.
Unger, M., Mattson, E., Schmidt-Patterson, C., Alavi, Z., Carson, D., Hirschmugl, C.J.,2013. Synchrotron-based multiple-beam FTIR chemical imaging of a multi-layered polymer in transmission and reflection: towards cultural heritage ap-plications. Appl. Phys. A 111, 135e145. http://dx.doi.org/10.1007/s00339-012-7481-6.
Vandebabeele, P., Wehling, B., Moens, L., Edwards, H., De Reu, M., Van Hooydonk, G.,2000. Analysis with micro-Raman spectroscopy of natural organic bindingmedia and varnishes in art. Anal. Chim. Acta 407, 261e274.
Wadley, L., Lombard, M., 2007. Small things in perspective: the contribution of ourblind tests to micro-residue studies on archaeological stone tools. J. Archaeol.Sci. 34, 1001e1010. http://dx.doi.org/10.1016/j.jas.2006.09.016.
Wadley, L., Lombard, M., Williamson, B., 2004. The first residue analysis blind tests:results and lessons learnt. J. Archaeol. Sci. 31, 1491e1501. http://dx.doi.org/10.1016/j.jas.2004.03.010.
Yaroshevich, A., Nadel, D., Tsatskin, A., 2013. Composite projectiles and haftingtechnologies at Ohalo II (23 ka, Israel): analyses of impact fractures, morpho-metric characteristics and adhesive remains on microlithic tools. J. Archaeol. Sci.40, 4009e4023. http://dx.doi.org/10.1016/j.jas.2013.05.017.