Influencia del estado en vitaminas liposolubles en
206
UNIVERSIDAD POLITÉCNICA DE MADRID FACULTAD DE CIENCIAS DE LA ACTIVIDAD FÍSICA Y DEL DEPORTE (INEF) “Influencia del estado en vitaminas liposolubles en parámetros de salud y condición física en adolescentes europeos”. “Influence of liposoluble vitamin status on health parameter and physical fitness in European adolescents”. TESIS DOCTORAL CON MENCION EUROPEA EUROPEAN PhD THESIS JARA VALTUEÑA SANTAMARÍA Licenciada en Ciencias de la Actividad Fisica y del Deporte 2012
-
Upload
khangminh22 -
Category
Documents
-
view
3 -
download
0
Transcript of Influencia del estado en vitaminas liposolubles en

UNIVERSIDAD POLITÉCNICA DE MADRID
FACULTAD DE CIENCIAS DE LA ACTIVIDAD FÍSICA Y DEL DEPORTE (INEF)
“Influencia del estado en vitaminas liposolubles en
parámetros de salud y condición física en adolescentes europeos”.
“Influence of liposoluble vitamin status on health
parameter and physical fitness in European adolescents”.
TESIS DOCTORAL CON MENCION EUROPEA
EUROPEAN PhD THESIS
JARA VALTUEÑA SANTAMARÍA
Licenciada en Ciencias de la Actividad Fisica y del Deporte
2012

Valtueña J, 2012
II

European PhD Thesis
III
DEPARTAMENTO DE SALUD Y RENDIMIENTO HUMANO
FACULTAD DE CIENCIAS DE LA ACTIVIDAD FÍSICA Y DEL DEPORTE
“Influencia del estado en vitaminas liposolubles en parámetros de salud y condición física en adolescentes europeos”. “Influence of liposoluble vitamin status on health parameter and physical fitness in European adolescents”.
Jara Valtueña Santamaría
Licenciada en Ciencias de la Actividad Fisica y del Deporte
2012
DIRECTORES DE TESIS Marcela Gonzalez-Gross Ms Sc, PhD Farmacia Prof. Titular de Universidad Universidad Politécnica de Madrid
Christina Breidenassel PhD Human Nutrition MS, Associated Professor Institut für Ernährungs- und Lebensmittelwissenschaften Humanernährung, Rheinische Friedrich-Wilhelms. Universität Bonn, Germany.
THESIS SUPERVISOR HELENA
Giuseppe Maiani Ms Sc, PhD Biología Research Director. Department of Nutrition National Institute for Research on Food and Nutrition, Rome, Italy

Valtueña J, 2012
IV

European PhD Thesis
V
TRIBUNAL DE LA TESIS
Tribunal nombrado por el Mgfco. y Excmo. Sr. Rector de la Universidad Politécnica
de Madrid, el día ____________________________________________________________
Presidente D._____________________________________________________________
Vocal D. ________________________________________________________________
Vocal D. ________________________________________________________________
Vocal D. ________________________________________________________________
Secretario D. _____________________________________________________________
Realizado el acto de defensa y lectura de Tesis el día, ____________________________
en _____________________________________________________________________
Calificación: _____________________________________________________________
EL PRESIDENTE LOS VOCALES
EL SECRETARIO

Valtueña J, 2012
VI

European PhD Thesis
VII
A toda mi maravillosa gran familia
A tutta la mia meravigliosa grande famiglia To my whole wonderful big family

Valtueña J, 2012
VIII

European PhD Thesis
IX
Prof. Dra. María Marcela GONZÁLEZ GROSS Titular de Universidad
--- Departamento de Salud y Rendimiento Humano
Facultad de Ciencias de la Actividad Física y del Deporte Universidad Politécnica de Madrid
MARCELA GONZÁLEZ GROSS, PROFESORA TITULAR DE LA UNIVERSIDAD POLITÉCNICA DE MADRID, FACULTAD DE CIENCIAS DE LA ACTIVIDAD FÍSICA Y DEL DEPORTE –INEF CERTIFICA: Que la Tesis Doctoral titulada “Influencia del estado en vitaminas liposolubles en parámetros de salud y condición física en adolescentes europeos” que presenta Dña. JARA VALTUEÑA SANTAMARÍA al superior juicio del Tribunal que designe la Universidad Politécnica de Madrid, ha sido realizada bajo mi dirección durante los años 2007-2012, siendo expresión de la capacidad técnica e interpretativa de su autora en condiciones tan aventajadas que le hacen merecedor del Título de Doctor con mención Europea, siempre y cuando así lo considere el citado Tribunal.
Fdo. Mª Marcela González Gross
En Madrid, 12 de enero de 2012

Valtueña J, 2012
X

European PhD Thesis
XI
Dr.Christina Breidenassel Rheinische Friedrich-Wilhelms
Universität Bonn, Germany.
CHRISTINA BREIDENASSEL, ASSOCIATED PROFESSOR OF NUTRITION AND FOOD SCIENCES DEPARTMENT IN THE UNIVERSITY OF BONN, GERMANY. CERTIFICA: That the Doctoral Thesis entitled “Influence of liposoluble vitamin status on health parameter and physical fitness in European adolescents” presented by JARA VALTUEÑA SANTAMARÍA has been done under my tutelage from 2007 to 2012. This Doctoral Thesis proves that the PhD candidate has gained expertise through the process in both the field work as well as reporting data in a scientific manner. Therefore, I firmly believe that Jara Valtueña Santamaría is an excellent candidate for a PhD award.
Fdo. Christina Breidenassel
En Madrid, 12 de enero de 2012

Valtueña J, 2012
XII

European PhD Thesis
XIII
List of Contents
List of Tables ................................................................................................................. XV
List of Figures............................................................................................................. XVII
List of Abbreviations ....................................................................................................XIX
Granted Research Projects......................................................................................... XXIII
RESUMEN .......................................................................................................................1
ABSTRACT .....................................................................................................................3
1 INTRODUCTION ...............................................................................................5
1.1 Liposoluble Vitamins..........................................................................................6
1.2 Liposoluble vitamins and the 21th century obesity problem. ...........................11
2 AIM OF THE THESIS......................................................................................15
3 GENERAL METHODOLOGY .......................................................................17
3.1 The HELENA project – study design ...............................................................17
3.2 Materials ...........................................................................................................20
3.3 Biochemical analyses........................................................................................22
3.4 Genetic analysis ................................................................................................26
3.5 Stability .............................................................................................................27
3.6 Seasonality ........................................................................................................28
3.7 Latitude .............................................................................................................28
3.8 Assessment of body composition and maturity ................................................28
3.9 Assessment of calcium and vitamin intake.......................................................30
3.10 Assessment of physical activity ........................................................................31
3.11 Assessment of physical fitness .........................................................................31
3.12 Assessment of socioeconomic status (SES)......................................................34
3.13 Evaluation and statistics....................................................................................34
4 RESULTS AND DISCUSSION ........................................................................35
4.1 CHAPTER 1: Retinol, β-carotene, α-tocopherol and vitamin D status in
European adolescents; regional differences and variability. A review.............35
4.2 CHAPTER 2: Vitamin A, E and β-carotene status in European adolescents. ..49
4.3 CHAPTER 3: Vitamin D status in European adolescents. ...............................59
4.4 CHAPTER 4: Determinants of vitamin D status in European adolescents. .....71
4.5 CHAPTER 5: The relation between physical fitness and body composition
with vitamin D status in European adolescents ................................................86

Valtueña J, 2012
XIV
4.6 CHAPTER 6: Vitamin D status and physical activity interact to improve bone
mass in adolescents. ..........................................................................................99
5 GENERAL DISCUSSION ..............................................................................111
5.1 Vitamin status in European adolescents .........................................................112
5.2 The importance of other non-communicable factors on vitamin D status and
their relationship .............................................................................................114
5.3 The importance of communicable factors on vitamin D status and their
relationship......................................................................................................115
5.4 The identified need of adequate reference values for adolescents..................121
6 CONCLUSIONS ..............................................................................................123
6.1 General conclusion .........................................................................................124
APPENDIX 1 ................................................................................................................135
HELENA STUDY GROUP ..........................................................................................171
ACKNOWLEDGMENTS.............................................................................................175
SUMMARIZED CV......................................................................................................179

European PhD Thesis
XV
List of Tables
Table 1: List of used laboratory material and facilities ..................................................20
Table 2: List of used chemicals ......................................................................................21
Table 3: List of used devices ..........................................................................................22
Table 4: Studies on the nutritional status of fat-soluble vitamins in adolescents ...........43
Table 5: Studies on Vitamin D status in European adolescents......................................44
Table 6: Studies on retinol status in European adolescents ............................................45
Table 7: Studies on β-carotene status in European adolescents......................................46
Table 8: Studies on α- tocopherol status in European adolescents .................................47
Table 9: Characteristics of the HELENA study population by sex ................................55
Table 10: Percentile distributions for retinol, β-carotene and α-tocopherol of male European adolescents..................................................................................................... 55
Table 11: Percentile distributions for retinol, β-carotene and α-tocopherol of female European adolescents ......................................................................................................55
Table 12: Retinol Percentile distributions of European adolescents by age groups.......56
Table 13: ß-carotene percentile distributions of European adolescents by age groups ..56
Table 14: α-tocopherol percentile distributions of European adolescents by age groups56
Table 15: Descriptive characteristics of participants for vitamin D status. ....................67
Table 16: 25(OH)D concentrations by age and gender in European adolescents.......................................................................................................................67
Table 17: 25(OH)D concentrations by BMI in European adolescents. ..........................68
Table 18: Mean 25(OH)D concentrations in the HELENA cities. ................................68
Table 19: Characteristics of the study sample stratified by 25(OH)D concentrations ...81
Table 20: Pearson correlations between 25(OH)D concentration and body composition, dietary intake, muscular strength, cardiovascular fitness and socioeconomic status. .....82
Table 21: Results of the final ANCOVA model to assess the contribution of determinants on 25(OH)D concentrations as dependent variable. ..................................83
Table 22: Descriptive characteristics of the studied sample...........................................93
Table 23: Pearson correlations between the 25(OH)D concentration and body composition and muscular and cardiovascular fitness ....................................................93
Table 24: Stepwise multiple regression model for 25(OH)D as dependent variable stratified by gender. .........................................................................................................94
Table 25: Characteristics of the study sample stratified by 25(OH)D concentrations .107
Table 26: Stepwise multiple regression model to assess the effect of vitamin D on BMC by PA groups. ................................................................................................................108

Valtueña J, 2012
XVI

European PhD Thesis
XVII
List of Figures Figure 1: Vitamin D metabolism................................................................................... 10
Figure 2: Diagram pf the thesis chapters....................................................................... 13
Figure 3: Participating centres in the HELENA study. ................................................. 18
Figure 4: Vitamin D measurement ................................................................................ 24
Figure 5: Example for a chromatogram of HELENA plasma sample........................... 25
Figure 6: Smoothed centile curves of retinol, ß-carotene, α-tocopherol concentrations57
Figure 7: 25(OH)D status classification........................................................................ 69
Figure 8: Smoothed centile curves of 25(OH)D concentrations (nmol/L).................... 69
Figure 9: Mean 25(OH)D concentrations (nmol/L) by season...................................... 84
Figure 10: Mean 25(OH)D concentrations (nmol/L) by latitude .................................. 84
Figure 11: 25(OH)D concentrations according to body composition ........................... 95
Figure 12: 25(OH)D concentrations according to physical fitness ............................... 96
Figure 13: 25(OH)D concentrations according to BMI and fitness score..................... 97
Figure 14: Interaction between vitamin D status and PA on BMC............................ 109
Figure 15: Interaction between 25(OH)D and physical fitness on BMC ................... 109
Figure 16: Scatter plot of the interaction between total BMC and 25(OH)D
concentrations by PA groups........................................................................................ 110
Figure 17: Scatter plot of the interaction between total BMC and 25(OH)D
concentrations by fitness score groups. ........................................................................ 110

Valtueña J, 2012
XVIII

European PhD Thesis
XIX
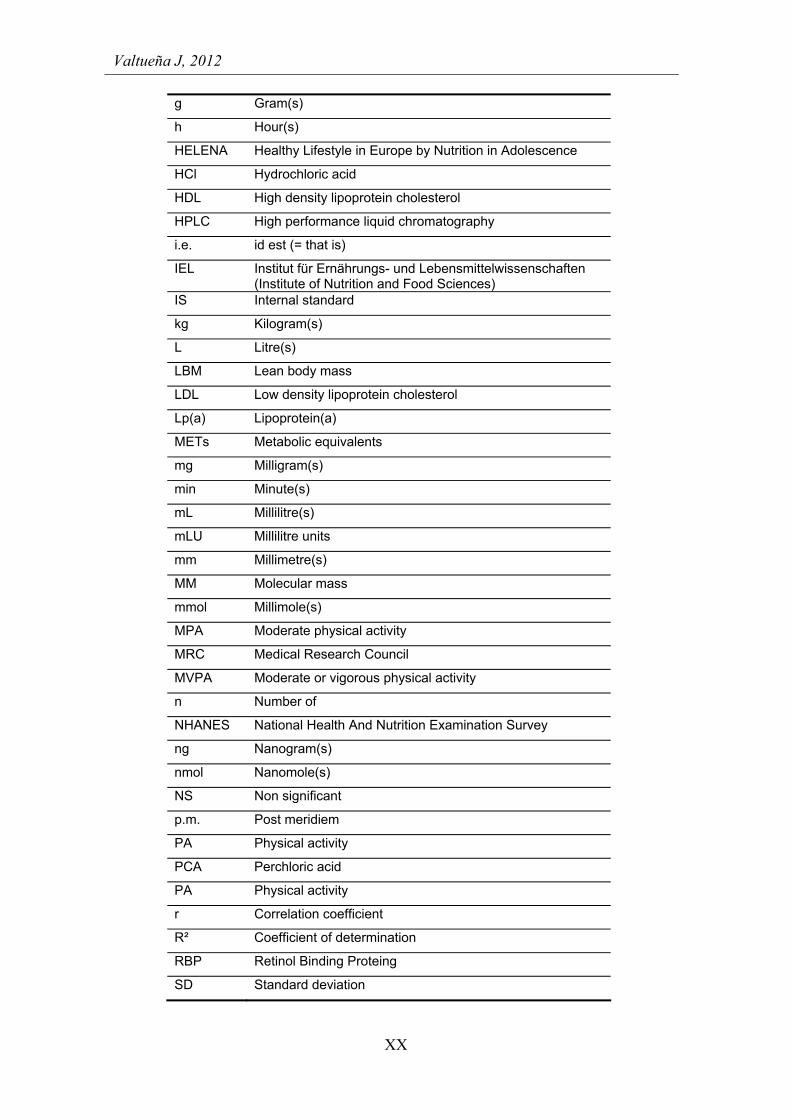
List of Abbreviations
ABF Abdominal body fat
a.m. ante meridiem (= in the morning)
ANCOVA Analysis of Covariance
ANOVA Analysis of variance
Apo A-1 Apolipoprotein A-1
Apo B Apolipoprotein B
approx. approximately
AVENA Alimentación y Valoración del Estado Nutricional de los Adolescentes
BF Body fat
BIA Bioelectrical impedance analysis
BMC Bone mineral content
BMD Bone mineral density
BMI Body mass index
cm Centimetre(s)
COMS Crossover multi-centre study
CSS Cross-sectional study
CV Coefficient of variation
CVD Cardiovascular disease
CVF Cardiovascular fitness
dL Decilitre(s)
DRI Dietary reference intake
DXA Dual energy X-ray absorptiometer
e.g. Exempli gratia
EAR Estimated average requirements
EFFECTS Evaluación Funcional y Fisiológica del Ejercicio. Ciencia y Tecnología de la Salud
ELISA Enzyme-Linked InmunoSorbent Assay
et al. et alii (= and others)
EUROFIT Council of Europe Committee for the Development of Sport. Test Battery
EU European Union
EYHS European Youth Heart Study
FAO Food and Agriculture Organization
FFM Fat free mass
FFMI Fat free mass index
FM Fat mass
FMI Fat mass index
Valtueña J, 2012
XX
g Gram(s)
h Hour(s)
HELENA Healthy Lifestyle in Europe by Nutrition in Adolescence
HCl Hydrochloric acid
HDL High density lipoprotein cholesterol
HPLC High performance liquid chromatography
i.e. id est (= that is)
IEL Institut für Ernährungs- und Lebensmittelwissenschaften (Institute of Nutrition and Food Sciences)
IS Internal standard
kg Kilogram(s)
L Litre(s)
LBM Lean body mass
LDL Low density lipoprotein cholesterol
Lp(a) Lipoprotein(a)
METs Metabolic equivalents
mg Milligram(s)
min Minute(s)
mL Millilitre(s)
mLU Millilitre units
mm Millimetre(s)
MM Molecular mass
mmol Millimole(s)
MPA Moderate physical activity
MRC Medical Research Council
MVPA Moderate or vigorous physical activity
n Number of
NHANES National Health And Nutrition Examination Survey
ng Nanogram(s)
nmol Nanomole(s)
NS Non significant
p.m. Post meridiem
PA Physical activity
PCA Perchloric acid
PA Physical activity
r Correlation coefficient
R² Coefficient of determination
RBP Retinol Binding Proteing
SD Standard deviation

European PhD Thesis
XXI
SPSS Statistical Package for Social Sciences
SIG Significant
SLJ Standing long jump
TC Total cholesterol
TG Triglycerides
TMB Tetramethylbenzidine
UK United Kingdom
US United States
UV Ultra violet
VDBP Vitamin D Binding Protein
VO2max Maximal oxygen consumption
vs versus
VPA Vigorous physical activity
WBF Whole body fat
WHO World Health Organization
WP Work Packages
α alpha
% Percentage
% BF Percentage body fat
4x10m SRT
4 x 10 meters shuttle run test
20m-SRT 20 meters shuttle run test
® Registered Trademark
°C Degrees Celsius
µL Microlitre(s)
µmol Micromole(s)

Valtueña J, 2012
XXII

European PhD Thesis
XXIII
Granted Research Projects The present PhD thesis is primarily based on data from the HELENA study;
The Healthy Lifestyle in Europe by Nutrition in Adolescence Cross sectional study
(HELENA study) 2005-2008. The HELENA study is an EU-funded project conducted in 1089
adolescents aged 12.5-17.5 years from 10 different European cities. The HELENA study aimed
to provide a broad picture of the nutritional status and lifestyle of the European adolescents,
including objectively assessed physical activity and a range of health-related fitness tests. Web
site available: www.helenastudy.com
Coordinator: Luis Moreno
Responsible for physical fitness assessment: Manuel Castillo /Michael Sjöström
Responsible for the blood sampling procedure and analysis: Marcela Gonzalez-Gross
Implication of the PhD candidate: participation in all workshops related to the HELENA
project, being part of the group in charge of the laboratory assessments. The PhD candidate was
also involved in part of the field work in Rome, Bonn, Zaragoza and Madrid. Finally, the PhD
candidate has been working on the data analysis and writing of scientific papers.
GRANTS AND FUNDING
Jara Valtueña Santamaría is financially supported by the Universidad Politécnica de Madrid
(CH/018/2008). (PIF; Personal Investigador en Formación).
Grants from the Univeridad Politécnica de Madrid to realize internships abroad.
.National Institute for Research on Food and Nutrition (INRAN). Rome, Italy (3 months). 2009.
.National Institute for Research on Food and Nutrition (INRAN). Rome, Italy.(3 months). 2010.
.Faculty of Medicine. University of Gent. Gent, Belgium. (3 months). 2011.
Moreover, this thesis would not have been possible without the following Spanish and European
funds:
The HELENA study takes place with financial support of the European Community Sixt RTD
Framework Programme (Contract FOOD-CT-2005-007034). Additional support from the
Spanish Ministry of Education (AGL2007-29784-E/ALI; AP-2005-3827), from the Spanish
Ministry of Health: Maternal, Child Health and Development Network (number RD08/0072)
and from Cognis Gmbh Abbott, Axis-Shield.
Funds from the Science-FEDER to the EFFECTS-262 research group, School of Medicine,
University of Granada, (Spain) (Acciones Complementarias DEP2007-29933-E).

Valtueña J, 2012
XXIV

European PhD Thesis
1
RESUMEN La adolescencia es un período de crecimiento y desarrollo crítico e importante para la
adquisición de hábitos saludables, en los que tanto la alimentación como la actividad
fíica tienen un papel destacado. Junto con el primer año de vida, los requerimientos de
energía y nutrientes son mayores que en cualquier otro periodo. Dentro de la nutrición,
las vitaminas se ven involucradas en múltiples procesos celulares y tisulares, y sus
deficiencias se vinculan a enfermedades crónicas degenerativas en la edad adulta como
las cardiovasculares, cáncer, diabetes y osteoporosis, pero cuyos factores de riesgo se
establecen a edades más tempranas. Las concentraciones sanguíneas de vitaminas están
influenciadas en gran medida por la ingesta dietética, pero existen otros factores del
individuo, entre los que cabe citar la composición corporal, la actividad física y
condición física que, junto a la genética, podrían desempeñar un papel crucial.
La presente memoria de Tesis Doctoral tiene como objetivo analizar el estado en
vitaminas liposolubles y su relación con diversos factores de salud, entre los que
destacan la composción corporal, hábitos dietéticos, actividad física y condición física
en adolescentes Europeos. El trabajo está basado en los datos del estudio HELENA
(“Healthy Lifestyle in Europe by Nutrition in Adolescence”). Se han analizado un total
de 1089 adolescentes procedentes de diez ciudades en nueve paises europeos.
Los principales resultados de este trabajo indican; a) La existencia de un estado
deficiente en vitaminas liposolubles en adolescentes Europeos, especialmente de
vitamina D, que alcanza valores del 80%. b) La estación del año, la latitud, el índice de
masa corporal, la condición física, la ingesta de calcio dietético, los suplementos
vitamínicos y la edad son las variables más relacionadas con el estado de vitamina D. c)
A su vez, la capacidad cardiorrespiratoria puede predecir los niveles de vitamina D en
los chicos, mientras que la fuerza muscular y masa magra parecen influir en los niveles
de vitamina D en las chicas. La grasa corporal y el índice de masa corporal se
correlaccionan negativamente con los niveles de vitamina D, especialmente en chicos.
d) Un estado de vitamina D óptimo provoca una mejora de la masa ósea sólo cuando se
tiene un nivel adecuado de actividad física. e) Se identifica la necesidad de establecer un
consenso sobre los rangos aceptables y puntos de corte para las concentraciones
sanguíneas de estas vitaminas en este grupo de población, ya que los actuales están
extrapolados de la población adulta.

Valtueña J, 2012
2
¿Qué se sabe en este ámbito? ¿Qué añade esta Tesis Doctoral?
Existe falta de datos y consenso metodológico
acerca del estado en vitaminas liposolubles en
adolescentes europeos.
Por otra parte no hay valores de referencia
específicamente desarrollados sobre las
concentraciones sanguíneas de vitaminas
liposolubles en adolescentes.
Ofrecer, por primera vez, datos comparables
sobre el estado en vitaminas liposolubles en
adolescentes europeos estratificados por sexo,
edad y peso. De esta manera, se puede
contribuir al establecimiento de los valores de
referencia en este grupo de población.
La deficiencia subclínica de vitaminas podría
ser un problema de salud no identificado en
niños y adolescentes en Europa por la falta de
chequeos rutinarios. Esta deficiencia podría
contribuir a los factores de riesgo de
enfermedades crónicas degenerativas.
Casi el 80% de los adolescentes estudiados en
Europa presentan insuficiencia de vitamina D
[concentración de 25(OH)D <75 nmol/l]. Por
el contrario, no existe tal problema de
deficiencia en vitamina A (retinol y beta-
caroteno), ni en vitamina E (α-tocoferol).
Aparte de los efectos conocidos de la estación
del año o la dieta sobre el estado de
vitamina D, otros factores, todavía no bien
conocidos, pueden influir en su estado
durante el periodo de la adolescencia.
La latitud, la condición física, la edad, la
ingesta de calcio y los suplementos, aparte de
la estación del año, parecen tener una alta
influencia sobre los niveles de vitamina D en
los adolescentes europeos.
Varios estudios han encontrado una
asociación positiva y directa entre la vitamina
D y el contenido mineral óseo. Sin embargo,
esta relación puede verse influida por otros
factores como la actividad física o condición
física todavía no estudiados en profundidad.
Las concentraciones sanguíneas de vitamina
D y la actividad física interactúan para
determinar el contenido mineral óseo. Un
buen nivel de actividad física maximiza el
efecto positivo de la vitamina D sobre el
hueso. De la misma forma, solo cuando se
presentan los niveles óptimos de vitamina D,
la actividad física favorece la formación ósea.
Además de en el metabolismo óseo, la
vitamina D juega un papel importante sobre
otros tejidos y órganos. El tejido muscular y la
composición corporal se encuentran entre los
órganos diana de vitamina D recientemente
identificados pero no concretamente
definidos.
La capacidad cardiorespiratoria puede
predecir las concentraciones sanguíneas de
25(OH)D en los chicos, mientras que la fuerza
muscular lo puede hacer en chicas. Una mayor
masa grasa en chicos y una menor masa libre
de grasa chicas se relaciona con una
hipovitaminosis D.

European PhD Thesis
3
ABSTRACT Adolescence is a critical period of physiological growth and development as well as for
the acquisition of healthy behaviors where both diet and physical activity play a major
role. Apart from the first year of life, both energy and nutrient requirements are greatest
during adolescence and the way to spend this energy by movement is also crucial.
Vitamins are specifically involved in multiple cellular and tissue processes, and there is
increasing evidence that deficiencies at these early ages could contribute to risk factors
of chronic diseases like cardiovascular and cerebrovascular disease, cancer, diabetes and
osteoporosis in adulthood, regardless data are scarce for younger ages. Vitamin
concentrations are largely influenced by diet but other individual factors like body
composition, physical activity or fitness together with genetics could play also an
important role.
The current thesis analyzes the liposoluble vitamin status in European adolescents and
their relation with several health related factors, like body composción, dietary intake,
physical activity and fitness. The work is based on data from the HELENA
study ("Healthy Lifestyle in Europe by Nutrition in Adolescence"), for which a total of
1089 adolescents from ten different cities, in nine European countries were recruited.
The main outcomes of this thesis are: a) There is a high liposoluble vitamin deficiency
prevalence in European adolescents, specifically for vitamin D, which is presenting
almost 80% of the adolescents. b) Season, latitude, BMI, fitness, dietary calcium intake,
supplements intake and age are highly related to 25(OH)D concentrations found in
European adolescents. c) Cardiorespiratory fitness may predict 25(OH)D concentrations
in male adolescents, whereas upper limbs muscular strength and FFM may predict
25(OH)D concentrations in young females. Fat mass and BMI are inversely related to
25(OH)D concentrations, especially in males. d) The effect of 25(OH)D concentrations
on bone mineral content in adolescents depends on physical activity levels. e) There is a
need to establish a consensus on acceptable ranges and cut-offs of blood concentrations
of these vitamins during adolescence, as currently they are extrapolated from adults.

Valtueña J, 2012
4
What is already known on this topic? What does this PhD Thesis add?
There is a lack of data and consensus on
methodological approaches regarding
liposoluble vitamin status in European
adolescents.
Moreover, there are no specifically reference
values for blood liposoluble vitamin levels in
adolescents.
To provide, for the first time, comparable data
about liposoluble vitamin status in European
adolescents according to sex, age and weight
status, that can contribute to establishing
reference values in this population group.
Vitamin deficiency, at least on a subclinical
level, could be an unrecognized health
problem in children and adolescents in Europe
because they are not routinely screened for in
these population groups. Deficiency stages at
these early ages could contribute to risk
factors.
Almost 80% of the studied adolescents in
Europe were at vitamin D insufficiency
[25(OH)D concentrations <75 nmol/l). On the
contrary, there is no vitamin deficiency
problem for vitamin A (retinol and beta-
carotene), nor for vitamin E (α-tocopherol).
Apart from the known effect of seasonality or
diet on vitamin D status, several other factors
can influence vitamin D status during
adolescence period, but there are not well
understood yet.
Latitude, physical fitness, age, calcium intake
and supplementation, apart from season, seem
to highly influence vitamin D levels in
European adolescents.
Several studies have found a positive and
direct association between vitamin D and
bone mineral content. However, the
relationship between vitamin D and bone
mineral content with the interaction of other
mediating factors such as physical activity or
fitness is complex and not yet well
understood.
Vitamin D and physical activity interact to
determine bone mineral content. A high level
of physical activity is needed to have a
positive effect of vitamin D on bone mineral
content. In the same way, physical activity
has a positive influence on bone mineral
content in individuals with high vitamin D
levels.
Apart for bone metabolism, vitamin D plays
an important role in maintaining
cardiovascular health, strengthening the
immune system or protecting against certain
cancers, among others. Moreover, muscle and
adipose tissue are among the non-traditional
vitamin D target organs.
Cardiorespiratory fitness may predict
25(OH)D concentrations in male adolescents,
whereas upper limbs muscular strength may
predict 25(OH)D concentrations in young
females. High fat mass in males and low fat
free mass in females is related to
hypovitaminosis D.

European PhD Thesis
5
1 INTRODUCTION Adolescence is a critical period of growth and development as well as for the
acquisition of healthy behaviors [110, 147, 161]. Appropriate nutrition during this
period is a basic requirement to express genetic potential. Together with physical
activity, nutrition influences later adult and elderly health outcomes, including risk
factors for chronic diseases [7, 165, 178, 219]. Nutritional status may interfere with
physical and intellectual performance in adolescents with positive or negative
consequences on body composition [137]. An adequate nutrition includes an adequate
vitamin intake. Vitamins are specifically involved in multiple cellular and tissue
processes [119], and there is increasing evidence that links deficiencies with chronic
diseases like cardiovascular and cerebrovascular disease, cancer, diabetes and
osteoporosis in adulthood [24, 49, 86, 119, 169, 172], regardless data are scarce for
younger ages. But deficiency stages at these early ages could contribute to risk factors
for the above-mentioned diseases [24], beside other already described implications in
childhood like higher risk for osteomalacia by vitamin D deficiency [25], impaired
cognitive function and concentration problems [8], hyperactivity [61], immune system
impairment [24, 59] and possibly even could interfere in athletic performance [12, 77,
104]. Some studies have reported that stunted children had lower fitness performance
compared with non-stunted ones [17, 173] and others reported that poor low vitamin D
status was related with worse fitness performance in children and adolescents [70, 175].
Body composition and physical fitness are frequently evaluated in adolescents [155,
174] and they has been recently revealed as a powerful marker for actual (youth) and
future (adult) health [157].
Vitamin deficiency, at least on a subclinical level, could be an unrecognized health
problem in children and adolescents in Europe because they are not routinely screened
for these population groups. However, especially adolescents are considered as a risk
group for malnutrition because of their increasing needs in nutrients and energy intake
for an adequate growth and development [119]. There are very few previous published
studies on nutritional vitamin status in European adolescents and data are not available
for all countries, especially in the eastern part of Europe. Moreover, the percentage of
representative studies is low and in some countries the sample size is not representative
at all of the general population and further researches on vitamin status and its related
health factors are needed. Vitamin concentrations could be largely determined by

Valtueña J, 2012
6
several environmental factors [10] but others like genetics could also play an important
role [10].
When applied for the HELENA project, we recognized this scientific gap and included
the evaluation (dietary intake and blood concentration) of those vitamins which could be
at risk in European adolescents.
To analyze and describe the vitamin status in European adolescents must be the first and
necessary step to go deeper into the understanding of how communicable and non-
communicable factors as body composition, physical activity, physical fitness, diet,
genetics or socioeconomic status influence vitamin status in youth.
The current thesis will deal specifically with the analysed liposoluble vitamins (A,D,E
and provitamin Beta-carotene).
1.1 Liposoluble Vitamins
Vitamins are micronutrients not synthesised normally by the human body and should be
provided by the diet, except for vitamin D. For this thesis the liposoluble vitamins A, E,
D and provitamin β-carotene were analyzed. Vitamin A and E are important
antioxidants in the human body [145] and might help to prevent heart disease and
cancer [146]. Current lifestyle of adolescents with a low intake of fruits and vegetables
[125, 217] could create a pro-oxidant situation with serious long-term consequences.
High oxidative stress and free radical levels are involved in the development of
cardiovascular diseases and other undesirable metabolic situations in adulthood [145,
217], but risk factors are already established during childhood and adolescence [223].
Vitamin A plays a role in a variety of functions throughout the body. Retinol is its
active form and can be oxidized to retinal (retinaldehyde) and then retinaldehyde can be
oxidized to retinoic acid. In addition to helping the eyes adjust to light changes, vitamin
A plays an important role in bone growth, tooth development, reproduction, cell
division and gene expression. Also, the skin, eyes and mucous membranes of mouth,
nose, throat and lungs depend on vitamin A to remain moist [67].
In adults, the World Health Organization (WHO) defines a deficiency of vitamin A
through plasma retinol values [216]. Concentrations lower than 10 μg/dL (0.35 μmol/L)
indicate a deficiency and values between 10 and 20 μg/dL (0.7 μmol/L) are referred to
as incipient deficiency [21].

European PhD Thesis
7
One of the earliest and specific manifestations of vitamin A deficiency is impaired
vision, particularly in reduced light. Persistent deficiency gives rise to a series of
changes, the most devastating of which occur in the eyes. This is followed by the build-
up of keratin debris in small opaque plaques (Bitot's spots) and, eventually, erosion of
the roughened corneal surface with softening and destruction of the cornea
(keratomalacia) and total blindness. Other changes include impaired immunity
(increased risk of ear infections, urinary tract infections, Meningococcal disease),
hyperkeratosis (white lumps at hair follicles), keratosis pilaris and squamous metaplasia
of the epithelium lining the upper respiratory passages and urinary bladder to a
keratinized epithelium. With relations to dentistry, a deficiency in Vitamin A leads to
enamel hypoplasia [55].
Beta-carotene, can potentially yield vitamin A and are thus referred to as provitamin A
carotenoid. Beta-carotene is the most abundant and most efficient provitamin A in our
foods. It plays an important role in human body mainly as antioxidant. Antioxidants
protect cells from damage caused by substances called free radicals. Free radicals can
damage lipids in cell membranes as well as the genetic material in cells, and the
resulting damage may lead to the development of cancer. Beta- carotene plasma levels
are considered as a good indicator for fruit and vegetable consumption. Low levels are
correlating with a higher risk of chronic diseases like cardiovascular or cancer, caused
by oxidation [66]. Although plasma values above 0.3 μmol/L are considered as
acceptable in adults, β-carotene plasma levels above 0.5 μmol/L seem to have the best
preventing effects [21, 66].
Vitamin E refers to a family of closely related compounds, the four tocopherols
() and the four tocotrienols ().Vitamin E has many biological functions.
The antioxidant function is considered to be the most important function of vitamin E
and is the one it is best known for. As it is fat-soluble, it is incorporated into cell
membranes, which protects them from oxidative damage. However, there are other
functions that have also been recognized to be of importance. α-Tocopherol has a
regulatory effect on enzymatic activities. Vitamin E may influence cell signalling,
platelet aggregation and even vasodilation, and these actions may be independent of
their antioxidant activity. To determine the nutritional status of vitamin E the level of
serum α-tocopherol is normally used [21]. According to D-A-CH the normal

Valtueña J, 2012
8
α-tocopherol serum concentration for adults is between 12 and 46 μmol/L [62], but for
adolescents there are no explicit values. Although the limit value for an adequate
nutritional status is defined between 10-16 μmol/L [199], the guide value for primary
prevention of cardiovascular disease and cancer is higher than 30 μmol/L [62].
The major symptoms of vitamin E deficiency are of neurological nature, but the basis
for this clinical symptom is not understood [123].
Vitamin D is a group of fat-soluble secosteroids. In humans, vitamin D is unique both
because it functions as a prohormone and because the body can synthesize it when sun
exposure is adequate. Vitamin D status was assessed by means of serum or plasma
25-hydroxycholecalciferol [25(OH)D], which is the main circulating vitamin D
metabolite, representing not only the consumed amount through diet and supplements
but also the subcutaneous synthesis [144, 187, 222]. The most widely known vitamin D
actions are related with intestinal calcium absorption, serum calcium and phosphorus
homeostasis and bone mineral accretion/mobilization[97]. In the last 10 years, however,
with the discovery of vitamin D receptors in multiple tissue types the recognition has
come that the role of vitamin D extends beyond the musculoskeletal system [103]
The non-classic actions of vitamin D can be categorized into three general effects:
regulation of hormone secretion, regulation of immune function, and regulation of
cellular proliferation and differentiation. But vitamin D also produces beneficial effects
on extraskeletal tissues. Adequate vitamin D is important for proper muscle functioning
and is believed to stimulate muscle cell proliferation and growth [37]. Controversial
evidence suggests it may help prevent type 1 diabetes mellitus, hypertension, and many
common types of cancer [100]. One of the most important applications of vitamin D
assessment in adolescence is the determination of abnormal serum concentrations of
calcium for bone health. Even vitamin D reference values for deficiency have been set
at 27.5 nmol/L in children [68], there is still a lack of consensus on the deficient and
sufficient 25(OH)D concentration in adolescents.
Moderately low levels of vitamin D may have adverse effects on calcium homeostasis
leading to bone loss, even without symptoms of osteomalacia [124, 187, 196].
Inadequate vitamin D levels have been related to other diseases such as diabetes,
multiple sclerosis and cancer [77, 196]. Moreover, low vitamin D concentrations seem
to be significantly associated with all-cause mortality [80]. It seems to be an inverse
relation between 25(OH)D serum concentrations and cardiovascular diseases, some

European PhD Thesis
9
components of the metabolic syndrome and physical fitness [58]. Moreover, vitamin D
is essential for a vast number of physiologic processes, and as such, adequate
concentrations are necessary for advantageous optimal health.
Vitamin D metabolism
The complexity of vitamin D metabolism makes it difficult to identify causes of vitamin
D insufficiency which may be caused by various determinants and it’s not clearly
understood during adolescence yet. Vitamin D is a commonly used collective term for a
family of closely related seco-steroids. Upon exposure to sunlight, 7-dehydro-
cholesterol, located deep in the actively growing layers of the epidermis, undergoes
photolytic cleavage of the “B” ring to yield pre-vitamin D3 which is isomerised to
vitamin D3 (cholecalciferol). Vitamin D3 and vitamin D2 (ergocalciferol) may also be
obtained by dietary supplementation or from a limited number of foods like fish or dairy
products. Vitamin D2 is metabolised in a similar way to vitamin D3. Vitamin D is
stored in adipose tissue and enters the circulation bound to vitamin D binding protein
(VDBP) and albumin. In the liver, vitamin D is hydroxylated to give 25-
hydroxycolecalciferol D [25(OH)D] which also circulates as a complex with VDBP. A
small proportion of the 25(OH)D is further hydroxylated in the kidney, under direct
regulation OF parathyroid hormone and ionised calcium levels, to form the biologically-
active calcitropic hormone 1,25-dihydroxycolecalciferol D [1,25(OH)2D]. Further
hydroxylation and metabolism of vitamin D produces compounds that are water soluble
and readily excreted. Hepatic vitamin D 25-hydroxylase activity is not tightly regulated,
and changes in cutaneous production of vitamin D3, or ingestion of vitamin D (D3 or
D2), will result in changes in circulating levels of 25(OH)D [153]. Under optimal
conditions, humans may synthesize 90% of their vitamin D requirements [103]. This
25(OH)D serum or plasma concentration is considered to be the most reliable measure
of overall vitamin D status and thus can be used to determine whether a patient is
vitamin D sufficient [187, 222]. Assessment of vitamin D status may be required in
adolescents due to its relationship with health [24].
Figure 1 presents a schematic overview of the vitamin D metabolism and its influencing
factors in humans.

Valtueña J, 2012
10
Figure 1: Vitamin D metabolism Cutaneous production of vitamin D and its metabolism and regulation for calcium homeostasis and cellular growth. 7-Dehydrocholesterol or provitamin D3 (proD3) in the skin absorbs solar UV-B radiation and is converted to previtamin D3 (preD3). D3 undergoes thermally induced (ΔH) transformation to vitamin D3. Vitamin D from the diet or from the skin is metabolized in the liver by the vitamin D-25-hydroxylase to 25(OH)D3 [25(OH)D3]. 25(OH)D3 is converted in the kidney by the 25(OH)D3-1α-hydroxylase to 1,25-dihydroxyvitamin D3 [1,25(OH)2D3]. A variety of factors, including serum phosphorus (PO4) and parathyroid hormone (PTH), regulate the renal production of 1,25(OH)2D3. 1,25(OH)2D regulates calcium metabolism through its interaction with its major target tissues, the bone and the intestine. Modified of [98].

European PhD Thesis
11
1.2 Liposoluble vitamins and the 21th century obesity problem.
Obesity is one of the greatest public health challenges of the 21st century. Its prevalence
has tripled in many countries in the European Region since the 1980s, and the numbers
of those affected continue to rise at an alarming rate, especially among children and
adolescents [216]. Obesity, expressed as excess body fat, seem to have an adverse effect
on liposoluble vitamin status [15, 162, 218]. It is important to consider that there seem
to be several influencing factors which could explain the variation the vitamin status of
adolescents and this vitamin status could affect different health parameters. Body
composition is one of the components highly related with nutrient intake and vitamin
deficiency has been linked with obesity [5]. Current lifestyle of adolescents with a low
intake of fruits and vegetables [125, 217] and a low physical activity and physical
fitness level, could create a pro-oxidant situation with serious long-term consequences.
Previous studies observed decreased antioxidant vitamin status in obese children [5, 64,
145]. Among many other factors, antioxidant vitamins related with oxidative stress,
have been reported to play an important role in the development of atherosclerosis and
other pathologies [146]. The negative correlation between plasma insulin levels and
vitamin E concentrations suggested that decreased antioxidant levels and reduced
antioxidant capacity might be a characteristic feature in obese children with metabolic
syndrome [145]. The concentrations of the most important fat-soluble antioxidant
vitamins α-tocopherol, ß-carotene and plasma total antioxidant status concentrations are
significantly lower in obese children with metabolic syndrome, than in those without .
Vitamin D status seems to worsen with increasing BMI in children [77, 179].
Obese individuals only synthesize half the amount of vitamin D synthesized by non-
obese individuals in response to sun exposure [176]. As a result, there is a reduction in
serum 25(OH)D concentrations and is assumed to be due to enhanced sequestration of
vitamin D in the fat tissue [134]. Despite of these evidences it is not clearly known
whether this relationship applies to growing children and adolescents. Some studies
observed negative correlations regarding vitamin D and adiposity [49, 193], but in
contrast, other studies did not find any associations of BMI and/or fat mass with
25(OH)D levels in the paediatric population [111, 214]. These controversial results lead
to consider that the use of BMI has some limitations in children and adolescents [212].
Body composition changes during growth and changes in BMI in childhood and
adolescence may be related to changes in lean body mass, as well as body fat mass [141,

Valtueña J, 2012
12
213]. Lean body mass and percentage of body fat seem more appropriate to assess body
composition than BMI in this population group [212, 213].
Despite of the important role of vitamin status during puberty and adolescence and the
relationship with other health parameters, currently blood levels for the definition of
vitamin deficiency or optimal status in adolescents are extrapolated from adults. This
may be not adequate because vitamin requirements during adolescence depend on the
process of sexual maturation, rapid increasing height and weight, among other factors.
Neither the determinants of vitamin D status in European adolescents are not clearly
known nor the relationship applies to growing children and adolescents, regarding to
several non-communicable (i.e. gender, age, and sexual maturity) and communicable
(i.e. physical activity, physical fitness, body composition, dietary intakes) parameters.
An overview of the chapters this thesis deals with is presented in figure 2. There is a
state of the art starting point with a review of liposoluble vitamin status (A, E and D) in
European adolescents previous to HELENA (chapter 1). Data from the HELENA study
of these vitamins will be described in chapters 2 and 3. Due to the obtained results
further analyses will be focused on vitamin D and its relationship with some health
parameters. In Chapters 4 to 6, several factors will be analyzed which could influence
vitamin D status and explain the variation of the low vitamin D status found in the
HELENA study population. As possible modificators of vitamin D, maturity status,
season, latitude, body composition, physical activity, physical fitness, dietary intake,
genetics, or socioeconomic status will be taken into account [4, 6, 18, 73]. In the same
way, vitamin D status will be analyzed in relation to body composition, physical activity
and physical fitness performance in chapter 5 [13, 55, 57]. Finally, due to that
adolescence is a period of massive growing and bone development, the effects and
implications of physical activity, fitness and vitamin D on bone mass will be analyzed
in chapter 6.

European PhD Thesis
13
Figure 2: Description/Diagram of the relationship between the main concepts studied in this thesis and the different chapters (from 1 to 6).

Valtueña J, 2012
14

European PhD Thesis
15
2 AIM OF THE THESIS General aim
The main objective of the thesis is to analyse reliable and comparable data of a
representative sample of European adolescents, concerning: vitamin D and liposoluble
vitamins as retinol, α-tocopherol, and provitamin ß-carotene, in relation to body
composition, physical activity and fitness patterns, dietary intake, socioeconomic status,
and variations of the nucleotide sequence in selected genes. This will contribute to a
better comprehension of current vitamin health status, body composition and lifestyle in
European adolescents.
Specific aims
The following research aspects will be considered:
- To study the state of the art of 25(OH)vitamin D, retinol, α-tocopherol and
provitamin β-carotene blood concentrations in European adolescents previous to
the HELENA study (Chapter 1)
- To analyse the status of 25(OH)vitamin D, retinol, α-tocopherol and provitamin
β-carotene in European adolescents of the HELENA study sample. (Chapters 2
and 3).
- To identify adolescents at risk of vitamin deficiency.
- To describe regional, seasonal, genetic, age and gender differences and
similarities on vitamin status across Europe in relation to nutrition and lifestyle.
- To assess and establish the determinants of vitamin D status in European
adolescents analyzing several health communicable and non-communicable
factors like body composition, physical activity, physical fitness, calcium and
vitamin D intake, supplements intake, socioeconomic factors and genetics
(chapter 4).
- To analyse the influence of physical fitness and body composition on vitamin D
status in European adolescents (Chaper 5).
- To assess the influence of vitamin D status on bone mass in adolescents. And its
relationship with physical activity and physical fitness, calcium and vitamin D
intake. (Chapter 6)

Valtueña J, 2012
16

European PhD Thesis
17
3 GENERAL METHODOLOGY
3.1 The HELENA project – study design
The “Healthy Lifestyle in Europe by Nutrition in Adolescence” (Acronym: HELENA;
contract number: 007034) Study is a European multi-centre study supported within the
6th Framework Program (FP6-2003-Food-2-A, FOOD-CT-2005-007034) under the
coordination of Prof. Luis A. Moreno Aznar (Universidad de Zaragoza). In order to
organize the work efficiently 14 Work Packages (WP) were introduced dealing with
specific topics and research fields. All work presented in this thesis was part of the
HELENA cross-sectional study (CSS), specifically WP 9 (Haematological,
biochemical, and immunologic data). Data of WP 7 (PA and physical fitness), WP 8
(body composition), WP 6 (dietary intake), WP 5 (socioeconomic status) and WP 10
(genetics) were used as well.
3.1.1 The HELENA-CSS – study design and subject recruitment
Within the CSS, an adolescent group was assessed for food and nutrient intake, nutrition
knowledge, PA and fitness, body composition, vitamin and mineral status, lipid and
blood profile, and genetic variability. Therefore, methods were developed and
harmonized in cooperation with all partners in order to obtain comparable data within
the study centres. Subjects with an age range of 12.5-17.49 years were recruited in ten
cities across Europe. Subject recruitment was done by one research group or institute
within the ten participating centres (see figure 3).
Ghent University; Ghent (Belgium)
Harokopio University; Athens (Greece)
Istituto Nazionale di Ricerca per gli Alimenti e la Nutrizione; Rome (Italy)
Karolinska Institutet; Stockholm (Sweden)
Medical University of Vienna; Vienna (Austria)
Research Institute of Child Nutrition Dortmund; Dortmund (Germany)
Universidad de Zaragoza; Zaragoza (Spain)
Université de Lille 2; Lille (France)
University of Crete School of Medicine; Heraklion (Greece)
University of Pécs; Pécs (Hungary)

Valtueña J, 2012
18
Figure 3: Participating centres in the HELENA study.
Selection of cities was based on two criteria: cities more than 100.000 inhabitants
located in separated geographical points in Europe and presence of an active research
group assuring sufficient expertise and resources to successfully perform
epidemiological studies. Within the study, Stockholm (Sweden) represented Northern
Europe; Athens, Heraklion (Greece), Rome (Italy) and Zaragoza (Spain) representing
Southern Europe; Pécs Hungary) to Eastern Europe; Gent (Belgium), Lille (France)
Western Europe, and Dortmund (Germany), Vienna (Austria) representing Central
Europe.
Reliable and objective data concerning age and gender were obtained by analysing
complete school classes. A total of 1089 adolescents were assessed for this study thesis;
the size of the sample was calculated according to stratified random sampling with
proportional affixation to the size of the strata (SEX and AGE) and minimum variance
(Neyman). A confidence level of 95% and the 0.3 error in the worst of situations for
the parameter body mass index (BMI) in the more general case of the study was chosen.
On the city level, diversity of the sample with respect to cultural and socio-economic

European PhD Thesis
19
aspects was achieved by performing a random proportional distribution of all schools
taking into account the site of the school (district/zone of the city) and the type of school
(public or private). Each partner was asked to include 150 male and female subjects per
protocol, respectively. Blood sampling was performed in one third of the recruited
adolescents (choice of whole classes representing the desired age of the subjects). The
school and class random selection procedure, including the subset of classes for blood
sampling, has been done centrally by one partner (Gent) for all study centres. In case a
selected school denied its participation, a school with comparable characteristics from a
reserve list was taken. The complete description of the design and implementation of the
study has been described elsewhere [148].
Ethical issues
The study has been performed following the ethical guidelines of the Declaration of
Helsinki 1964 (revision of Edinburgh 2000), Convention of Oviedo (1997), the Good
Clinical Practice, and the legislation about clinical research in humans in Spain and the
other countries. Informed written consent was obtained from subjects and parents or
guardians. Complete description of ethical issues and good clinical practice within the
HELENA-CSS has been described elsewhere [14].
Individual exclusion criteria were not being able to speak the local language and
simultaneous participation in another clinical trial. All protocols and informed consents
for this study were reviewed and approved by an Ethics Review Committee in each
country according to the Declaration of Helsinki and International Conferences on
Harmonization for Good Clinical Practice. Quality control was assured throughout the
whole project as described by Beghin et al. [14].
3.1.2 Medical examination and blood sampling
Prior to the study day participants were asked to abstain from eating and drinking later
than 8 p.m. At the study day a medical doctor visited the school classes and asked all
participants for medical history and acute diseases. A blood sampling questionnaire was
used to assess fasting status, acute infections, allergies, smoking, vitamin and mineral
supplements, and medication (Medical data and all information were recorded in a case
report form for each participant (Appendix 1).

Valtueña J, 2012
20
3.1.3 Sample pre-treatment and transport
Fasting blood sampling generally took place between 8-10 am. Approximately 30 mL of
blood were collected from an antecubital vein in serum, lithium heparin, and EDTA
tubes (Sarstedt AG & Co., Nümbrecht, Germany) for assessing the different biomarkers
and blood parameters, including liposoluble vitamins 25(OH)D, α-tocopherol, retinol,
and ß-carotene as well as lipids and lipoproteins for the present thesis. After blood
sampling a breakfast was offered for all participants. Sample treatment and transport
were tested in a pilot study to assure optimal sampling as described in detail previously
[73]. After blood donation, blood samples were clotted at room temperature for at least
30 minutes followed by a centrifugation (3500 rpm for 15 min). After field work was
done, all samples of one city were shipped on dry ice to the central laboratory (IEL) at
the University of Bonn (Germany) and stored at -80°C until analysis [74]. Aliquots for
routine lipid parameters were sent to the IEL, stored in a refrigerator at 4-7°C overnight
and analysed within 24 hours after blood collection in the University Hospital in Bonn.
3.2 Materials
The following parts summarize all materials used for the clinical analysis [25(OH)D, α-
tocopherol, retinol, and ß-carotene]. More precisely, Table shows the used laboratory
materials and facilities, whereas
Table presents the used chemicals. Table includes an overview of all devices used for
this work.
Table 1: List of used laboratory material and facilities
Product Specification Manufacturer
Calliper Holtain, Crosswell, United Kingdom (UK)
Centrifuge Heraeus Megafuge 1.0R
Thermo-Electron. Corporation, Waltham, USA
Crushed ice
Eppendorf pipettes Eppendorf Research®, 10-100µL, 100-1,000µL
Eppendorf, Hamburg, Germany
Laboratory scale 1 2200 P Soehnle, Nassau, Germany

European PhD Thesis
21
Laboratory scale Research
R 160 P Sartorius, Göttingen, Germany
Medical gloves Flexam, Latex, REF 88471
Cardinalhealth, Illinois, USA
Monovette® serum-gel 01.1602.001 Sarstedt, Nümbrecht, Germany
Monovettes® K-EDTA 05.1167.001 Sarstedt, Nümbrecht, Germany
Monovettes® lithium-heparin
05.1553.001 Sarstedt, Nümbrecht, Germany
Multifly® 85.1638.005 Sarstedt, Nümbrecht, Germany
Multipette®plus 4981 000.019 Eppendorf, Hamburg, Germany
Pipette tips For 10-100 µL, 100-1,000 µL pipettes
Eppendorf, Hamburg, Germany
Reaction tubes Safe-lock tubes, 1.5mL
Eppendorf, Hamburg, Germany
Reaction tubes Tubes with screw-cap, 1.5mL
Eppendorf, Hamburg, Germany
Transportable centrifuge Various by the cities
Vials for HPLC analyses Macherey-Nagel, Düren, Germany
Vortex Vortex-Genie® Zimmermann Laborausrüster, Cologne, Germany
Table 2: List of used chemicals
Product Manufacturer
Aqua bidest, H2O Self made
Vitamin D Sigma Aldrich, Deisenhofen, Germany
Retinol Sigma Aldrich, Deisenhofen, Germany
Dipotassiumhydrogenphosphate, K2HPO4
Carl Roth, Karlsruhe, Germany
ß-carotene Sigma Aldrich, Deisenhofen, Germany
α-tocopherol Sigma Aldrich, Deisenhofen, Germany
Perchloric acid (PCA) 70% Carl Roth, Karlsruhe, Germany
Phosphoric acid, H3PO4, 70% Carl Roth, Karlsruhe, Germany

Valtueña J, 2012
22
Sodium hydroxide, NaOH Carl Roth, Karlsruhe, Germany
Sodiumdisulfite, Na2S2O5 Carl Roth, Karlsruhe, Germany
Isopropyl Carl Roth, Karlsruhe, Germany
Hexane Carl Roth, Karlsruhe, Germany
Butylated hydroxytoluene (BHT) Carl Roth, Karlsruhe, Germany
Table 3: List of used devices
Product Manufacturer
Autosampler Spark Holland Triathlon
AxSYM® Analyzer Abbot Diagnostics S.A., Spain
Column oven S 4010 Column Thermo Controller
Dual energy X-ray absorptiometer (DXA)
QDR-Explorer, Hologic Corp., Software version 12.4, Waltham, MA, USA
High performance liquid chromatography (HPLC) column
Nucleosil 100-5 CN 250x4,0 mm Macherey & Nagel, Germany
HPLC detector RF-551 Dual UV detector, Kontron, Germany
HPLC pump S 1100 Solvent delivery system, Sykam, Fürstenfeldbruck, Germany
3.3 Biochemical analyses
3.3.1 25(OH)Vitamin D
Plasma 25(OH)D was analysed by ELISA using EDTA plasma.
The measurements were done using a 25(OH)D a kit (OCTEIA 25-Hydroxy Vitamin D)
from Immunodiagnostic System (Germany) and measured with a SunriseTM Photometer
by TECAN (Germany) at the central laboratory of the Institut für Ernährungs- und
Lebensmittelwissenschaften (IEL) from the University of Bonn. The IDS OCTEIA
25(OH)D kit is an enzyme immunoassay intended for the quantitative determination of
25(OH)D and other hydroxylated metabolites in human serum or plasma. Results are
used in conjunction with other clinical and laboratory data to assist the clinician in the
assessment of vitamin D sufficiency.
All chemicals were provided with the kit: 25-D biotin solution a lyophilised buffer
containing 25(OH)D labelled with biotin. Enzym conjugate a phosphate buffered saline

European PhD Thesis
23
containing avidin linked to horseradish peroxidase. Substrate solution, an aqueous
formulation of tetramethylbenzidine (TMB) and hydrogen peroxide.
Sample preparation
Calibrator, control or sample (25µL) was mixed with 1 mL of biotin solution to all
tubes. An aliquot of 200 µL of this mixture was transferred to the cell of microtiter plate
and incubated at 18 – 25°C for 2 hours. Then decanted the contents of the wells by
inverting sharply and washed 3 times with 250 µl of wash solution (phosphate buffered
saline). After that, 200 µl of enzyme conjugate was added and incubated again at room
temperature for 30 minutes. Washed once more 3 times with 250 µl of wash solution
and incubated with 200 µl substrate solution (aqueous formulation of
tetramethylbenzidine [TMB] and hydrogen peroxide) at room temperature for 30
minutes. After this last incubation time the reaction was stopped with 100 µl of stop
solution (0.5 mmol/L Hydrochloric acid) and measured the absorbance at 450 nm
(reference 650 nm) within 30 min of adding the stop solution.
The sensitivity of this method is 5 nmol/L 25(OH)D and the variation is below 6 %. The
mean recovery of 25-OH-Vitamin D3 is 101% using this method. The samples were
stable over 72 hours at room temperature (Lisser et al., Clin Chem 27, 1981). An
overview of the procedure is shown in figure 4.

Valtueña J, 2012
24
Figure 4: Procedure summary of Vitamin D measurement using a 25(OH)D3 ELISA kit (OCTEIA 25-
Hydroxy Vitamin D) from Immunodiagnostic System (Germany)
3.3.2 Retinol, α-tocopherol and ß-carotene determination
Methods
Retinol, α-tocopherol and ß-carotene were analysed by RP-HPLC in serum at the central
laboratory (IEL) from the University of Bonn. The vacutainer was centrifuged for 15
min at 3500.
Materials
Standards (α-tocopherol, retinol, beta-carotene), hexane and isopropanol were obtained
from Sigma Aldrich (Germany) and had all HPLC-grade.
Sample preparation
For protein precipitation, 200 µl of serum sample was mixed with 200 µl ethanol for 2
minutes. Then, 200 µl n-hexane was added and mixed again for 2 minutes and
centrifuged at 3500g for 3 minutes. The standards were prepared with 200 µl 0.9%
NaCl and add 200 µl retinol standard (1,1 µg/mL), 100 µl α-tocopherol standard
(20µg/mL), 250 µl ß-carotene standard (550 ng/mL) and 50 µl ethanol and well mixed

European PhD Thesis
25
for 2 minutes and then prepared like the samples with 200 µl n-hexane. Apocarotinal
was used as internal standard 50 µl of the supernatant of sample and standard was used
for the determination on HPLC.
The variation of the method is below 3% for all the vitamins.
The samples were stable over 24 hours at room temperature (CV: Vitamin E: 4.6%,
Vitamin A: 3.2%)
Chromatographic Conditions
The HPLC system (Sykam Gilching Germany) consisted of an S 1100 Solvent delivery
system, HPLC controller, an autoinjector Triathlon® (Spark, Emmen, Netherland) with
a 30 µL loop and a dual UV-Vis detector (Kontron, Germany).
Separation was carried out on a Nucleosil 100-5 CN 250x4,0 mm (Macherey&Nagel,
Germany) and with an isocratic mobile phase. The mobile phase consisted of 98.5 %
hexane, 1.5% isopropyl and 0.01% butylated hydroxytoluene (BHT) (98.5/1.5/0.01
wt/wt/wt). The flow rate was 2 mL/min and the UV wavelength for detection was 292
nm for retinol, α-tocopherol and apocarotinal and 450 nm for ß-carotene (see figure 5).
Before the analysis the mobile phase was filtered and degassed with helium. The
samples were stored for the analyses in the autoinjector at 4°C.
Figure 5: Example for a chromatogram of HELENA plasma sample of α-tocopherol (15.9 µg/mL) and
retinol (0.8 µg/mL) using RP-HPLC with UV detection (wavelength for detection 292 nm, isocratic
mobile phase [98.5 % hexane, 1.5% isopropyl and 0.01% butylated hydroxytoluene).
3.3.3 Blood lipids assessment
Serum TG, TC, HDL and LDL were measured enzymatically on the Dimension RxL
clinical chemistry system (Dade Behring, Schwalbach, Germany) using the
BE BE
1.9
93
T
oc
op
he
rol
#1
3.4
83
R
eti
no
l #
2
0
250
500
750
1000
Mill
ivo
lts
0.00 1.00 2.00 3.00 4.00 5.00 6.00 7.00 8.00 9.00 10.
Minutes

Valtueña J, 2012
26
manufacturer’s reagents and instructions. Apolipoprotein A-1 and B concentrations
were measured in an immunochemical reaction with a BN II analyzer (Dade Behring,
Schwalbach, Germany) according to the manufacturer’s instructions. The proteins
contained in the serum sample form immune complexes with specific antibodies. These
complexes scatter a light beam when passed through the sample. The intensity of the
scattered light is proportional to the concentration of the relevant protein in the sample.
The result is evaluated by comparison with a standard of known concentration. Serum
Lp(a) was measured by means of particle-enhanced immunonephelometry using the BN
II analyzer (Dade Behring).
The intraassay coefficient of variation of the TG, TC, HDL, LDL, apo A-1, apo B, and
Lp(a) assay was 1.9%, 1.3%, 3.3%, 2.7%, 2.7%, 2.1%, and 3.9%, while the interassay
coefficient was 2.2%, 1.8%, 3.9%, 3.6%, 3.4%, 3.2%, and 4.3%.
3.4 Genetic analysis
For genetic vitamin D markers (VDR genotype in its polymorphism (rs1544410) blood
for desoxyribonucleic acid (DNA) isolation was collected in EDTA tubes, stored at IEL
and sent to the Genomic Analysis Laboratory at the Institut Pasteur de Lille in France.
DNA was extracted from white blood cells with the Puregene kit (QIAGEN,
Courtaboeuf, France) and stored at -80°C.
DNA was extracted from white blood cells with the Puregene kit (QIAGEN,
Courtaboeuf, France). The SNP for vitamin D at chromosomes 7 and 12 was genotyped
by Illumina (Eindhoven, Netherlands) with Golden Gate assay with 100% success rate.
The genotype distribution of the polymorphism respects the Hardy-Weinberg
equilibrium (P=0.17) in the sample.
In the following the principle of the GoldenGate assay is explained. The DNA sample
used in this assay is activated for binding to paramagnetic particles. Assay
oligonucleotides, hybridization buffer, and paramagnetic particles are then combined
with the activated DNA in the hybridization step two. Three oligonucleotides are
designed for each SNP locus. Two oligos are specific to each allele of the SNP site,
called the allele-specific oligos (ASO). A third oligo that hybridizes several bases
downstream from the SNP site is the locus-specific oligo (LSO). All three
oligonucleotide sequences contain regions of genomic complementarity and universal

European PhD Thesis
27
polymerase chain reaction (PCR) primer sites. The LSO also contains a unique address
sequence that targets a particular bead type. During the primer hybridization process,
the assay oligonucleotides hybridize to the genomic DNA sample bound to
paramagnetic particles. Because hybridization occurs prior to any amplification steps,
no amplification bias can be introduced into the assay. Following hybridization, several
wash steps are performed to remove excess and mis-hybridized oligonucleotides.
Extension of the appropriate ASO and ligation of the extended product to the LSO joins
information about the genotype present at the SNP site to the address sequence on the
LSO. These joined, full-length products provide a template for PCR using universal
PCR primers P1, P2, and P3. Universal PCR primers P1 and P2 are Cy3- and Cy5-
labeled. After downstream-processing the single-stranded, dye-labeled DNAs are
hybridized to their complement bead type through their unique address sequences.
Hybridization of the GoldenGate assay products onto the Array Matrix or BeadChip
allows for the separation of the assay products in solution, onto a solid surface for
individual SNP genotype readout. After hybridization, the BeadArray Reader is used to
analyze a fluorescence signal on the Sentrix Array Matrix or BeadChip, which is in turn
analyzed using software for automated genotype clustering and calling.
3.5 Stability
During the pilot study, to guarantee the stability of routine biochemistry analyses in
fresh serum samples, three samples with high, mean and low baseline values were tested
over different points in time during 24 hours after blood extraction. The results of the
stability tests carried out of each biochemical parameter were measured at the central
laboratory of the University Hospital in Bonn. No changes in fresh serum samples were
observed over a time span of 24 hours either at high or low baseline levels [74].
To test the stability of vitamins, blood was collected from six volunteers (29±3years,
five females), immediately centrifuged and aliquoted. Plasma aliquots were stored at
room temperature or under cooled conditions over 24 hours. All samples were
repeatedly analyzed over 24 hours at the laboratory in Bonn. No significant differences
were observed during the 24 hours of storage at room temperature [74].
Valtueña J, 2012
28
3.6 Seasonality
A variable was computed by re-coding the original variable “Blood drawing date” into
“Seasonality”, as follows: Winter (1; January through March), Spring (2; April through
June), Summer (3; July through September) and Autumn (4, October through
December), as it was performed in previous studies [175]. As blood drawing was
performed during the academic year, the final variable was composed by 3 groups:
winter, spring and autumn.
3.7 Latitude
The latitude was also taken into account as a confouder in the analyses. The latitude of
each city was obtained from http://maps.google.es/. Latitudes of the involved cities
were: Stockholm (59º33´ N), Athens (37º98´ N), Heraklion (35º33´ N), Rome (41º 89´
N), Zaragoza (41º66´ N), Pecs (46º07´ N), Ghent (51º06´ N), Lille (50º63´ N),
Dortmund (51º51´ N) and Vienna (48º21´ N). To make use of this data, latitudes were
added to the database as numeric variables with two decimals (i.e. Stockholm = 59.55).
3.8 Assessment of body composition and maturity
Complete description of anthropometric measures is described by Nagy et al 2008
[152].
Weight was measured in underwear and without shoes with an electronic scale (Type
SECA 861) to the nearest 0.1 kg, and height was measured barefoot in the Frankfort
plane with a telescopic height measuring instrument (Type SECA 225) to the nearest 0.1
cm. Body mass index was calculated as body weight (without shoes) divided by the
square of height in meters.
A set of skinfold thicknesses (biceps, triceps, subscapular, suprailiac, thigh) and
circumferences (relaxed arm, flexed upper arm, waist, hip, upper thigh) were measured
three consecutive times on the left side of the body, with a Holtain caliper (to the
nearest 0.2 mm) and with a non-elastic tape (Seca 200) to the nearest 0.1 cm,
respectively, according to Lohman’s anthropometric standardization reference manual
[53].
Body composition was measured in the whole HELENA sample by BIA (BIA 101
AKERN SRL). Standard instructions for BIA measurements were followed; The
European PhD Thesis
29
intraobserver technical errors of measurement (TEMs) were between 0.12 and 2.9 mm
for skinfold thicknesses. Intraobserver reliability for skinfold thicknesses was >69%.
The intraobserver TEMs for skinfold thicknesses were <1; for BIA resistance TEMs
were <0.1 Ώ and <0.2 Ώ for reactance. Intraobserver reliability values were >95%, 99%
and 97% for skinfold thicknesses, BIA resistance and reactance. Interobserver TEMs for
skinfold thicknesses ranged from 1 to 2 mm; for BIA they were 1.16 and 1.26 Ώ for
resistance and reactance. Interobserver reliability for skinfold thicknesses, BIA
resistance and reactance were >90% [52].
For Tanner Stage, a physical examination was performed by a physician aiming to
classify the adolescents into one of the five stages of pubertal maturity defined by
Tanner and Whitehouse [200]. Corresponding to the development of gonads/breasts and
pubic hair, adolescents were graduated into five categories of maturity ranging from
stage I prepubertal state (absence of development) and stage II the initial, overt
development of each characteristic that marks the transition into puberty. Stages III and
IV mark the progress in maturation, stage V indicates the adult (mature) state. If the
grade of maturity differed between both observations the higher grade was chosen
[200].
Further, adolescents were classified into four BMI categories (thinness, normal weight,
overweight, and obese) according to age and gender specific cut-offs developed by Cole
et al. [39, 40].
In the subsample of Zaragoza, body composition was additionally measured by Dual-
energy X-ray absorptiometry (DXA). Body mass, lean mass, fat mass and bone mass
were assessed using the pediatric version of the software of the DXA (Hologic Explorer
scanner, using a pediatric version of the software QDR-Explorer, Hologic Corp.,
Software version 12.4, Bedford, MA, USA). DXA equipment was calibrated using a
lumbar spine phantom as recommended by the manufacturer. Subjects were scanned in
supine position and the scans were performed at high resolution. Fat mass (g), total area
(cm2) and BMC (g) were calculated from total and regional analyses of the total body
scan. BMD (g • cm–2) was calculated using the formula BMD = BMC • area–2. Two
additional examinations were conducted to estimate bone mass at the lumbar spine, and
hip. The regional analysis was performed as described elsewhere [32]
We have previously examined the test-retest (with repositioning) precision error for
regional analysis of the complete body scan, using coefficients of variation (CV) in 49

Valtueña J, 2012
30
adolescents. The CV was: BMC =2.3%, BMD =1.3%, bone area =2.6% and fat-free
lean mass =1.9%. [79]
3.9 Assessment of calcium and vitamin intake
Mean daily calcium and vitamin intake was estimated from two non-consecutive 24-
hour recalls using the HELENA-DIAT (Dietary Assessment Tool) software [207]. This
24-h recall assessment tool is based on six meal occasions referring to the day before
the interview. The adolescents completed the questionnaire during school time, after
dieticians/researchers instructed them on how to fill in this 24-h recall as accurately as
possible. The participants were allowed to ask questions and assistance and after
completion, the recall was checked for completeness. Every participant was asked to fill
in the HELENA-DIAT on arbitrary days, twice in a time-span of 2 weeks. Since the
questionnaire was filled in during school time, no data could be collected about the
dietary intake on Fridays and Saturdays. A validation study by Vereecken et al. [207]
indicated that the YANA-C, a former version of the HELENA-DIAT, showed good
agreement with an interviewer-administered YANA-C. The HELENA-DIAT tool has
been indicated as a good method to collect detailed dietary information from
adolescents and was received well by the study participants [206]. Furthermore, a
repeated 24-h recall was selected as the most suitable method to get population means
and distributions by the European Consumption Survey Method (EFCOSUM) project
[30]. To calculate energy and nutrient intake, data of the HELENA-DIAT was linked to
the German Food Code and Nutrient Data Base (BLS (Bundeslebensmittelschlüssel),
version II.3.1, 2005).
The usual dietary intake of nutrients and foods, also including episodically consumed
foods, was estimated by the Multiple Source Method (MSM)
(https://nugo.dife.de/msm/) [90]. The MSM calculates dietary intake for individuals first
and then constructs the population distribution based on the individual data. With this
method dietary data was corrected for between and within person variability.
Under-reporters were excluded from all analysis. Basal metabolic rate (BMR) was
calculated from age-specific FAO/WHO/UNU equations [63]. Underreporting was
considered when the ratio of energy intake (EI) over the estimated basal metabolic rate
(BMRest) was lower than 0.96 as proposed by Black et al [27].

European PhD Thesis
31
3.10 Assessment of physical activity
A uni-axial accelerometer (Actigraph MTI, model GT1M, Manufacturing Technology
Inc., Fort Walton Beach, FL, USA) was used to assess PA. Adolescents were instructed
to place the monitor underneath the clothing, at their lower back, using an elastic waist
band and to wear it for seven consecutive days. They were also instructed to wear the
accelerometer during all time when they were awake and only to remove it during
water-based activities. At least three days of recording with a minimum of eight hours
registration per day was set as an inclusion criterion. In this study, the time-sampling
interval was set at 15 seconds. A measure of total volume of activity was expressed as
the sum of recorded counts per epoch divided by the total daily registered time
expressed in minutes. The time engaged in moderate PA and vigorous PA was
calculated and presented as the average time per day during the complete registration.
The time engaged at moderate PA [3-6 metabolic equivalents (METs)] was calculated
based upon a blanket cut-off of 2000 counts per minute which is approximately
equivalent to an intensity of a brisk walk (4.5 km/h). The time engaged in vigorous PA
(>6 METs) was calculated based upon a blanket cut-off of 4000 counts per minute.
Also, the time spent in at least moderate intensity level (>3 METs) was calculated as the
sum of time spent in moderate and vigorous physical activity (MVPA, min/day) [56].
Each minute over the specific cut-off was summed up in the corresponding intensity
level group. Time spent in light and low PA was defined as the sum of time per day in
which counts per minute were <2000 and <100, respectively. Within this study, the sum
of minutes spent in low, moderate, and vigorous PA was used and is hereafter called
total PA. Subjects were divided as non-active (<60 min moderate and vigorous PA/day)
and active (≥60 min moderate and vigorous PA/day) according to the recent guidelines
launched for children and adolescents [197].
3.11 Assessment of physical fitness
The health-related physical fitness components that is, flexibility, muscular strength,
speed/agility and aerobic capacity (hereafter called cardiorespiratory fitness), were
assessed by the physical fitness tests described below. The scientific rationale for the

Valtueña J, 2012
32
selection of all of these tests has been published earlier [184] and the complete
methodology is described by Ortega et al [155]
1. Back-saver sit and reach test (flexibility assessment): a standard box with a
small bar, which has to be pushed by the participant, was used to perform the
test. The adolescent bends his/her trunk and reaches forward as far as possible
from a seated position, with one leg straight and the other bent at the knee. The
test is performed once again with the opposite leg. The farthest position of the
bar reached by each leg was scored in centimetres and the average of the
distances reached by both legs was used in the analysis.
2. Handgrip test (maximum handgrip strength assessment): a hand dynamometer
with adjustable grip was used (TKK 5101 Grip D; Takey, Tokyo, Japan). The
participant squeezes gradually and continuously for at least 2 s, performing the
test with the right and left hands in turn, using the optimal grip span. The
handgrip span was adjusted according to hand size using the equation that we
have developed specifically for adolescents [183]. The maximum score in
kilograms for each hand was recorded. The average of the scores achieved in
both handgrip tests was used in the analysis.
3. Standing broad jump test (lower limb explosive strength assessment): from a
starting position immediately behind a line, standing with feet approximately
shoulder’s width apart, the adolescent jumps as far as possible with feet together.
The result was recorded in centimetres. A non-slip hard surface, chalk and a tape
measure were used to perform the test.
4. The Bosco protocol is composed of three different jumps: (4.1) Squat jump
(lower limb explosive strength assessment): the adolescent performs a vertical
jump without rebound movements starting from a half-squat position, keeping
both knees bent at 901, the trunk straight and both hands on hips. Previous
counter movements are not allowed. (4.2) Counter movement jump (lower limb
explosive strength and elastic component assessment): in a standing position,
with legs straight and both hands on hips, the adolescent performs a vertical
jump with an earlier fast counter movement. (4.3) Abalakov jump (lower limb
explosive strength, elastic component and intermuscular coordination capacity
assessment): the Abalakov jump is similar to the counter movement jump, but
now the adolescent is allowed to freely coordinate the arms and trunk

European PhD Thesis
33
movements to reach the maximum height. The jump height is recorded in
centimetres. The Infrared Platform ERGO JUMP PlusF BOSCO SYSTEM
(Byomedic, SCP, Barcelona, Spain) was used for the jump assessment.
5. Bent arm hang test (upper limb endurance strength assessment): the adolescent
hangs from a bar for as long as possible, with the arms bent at 90 degrees. The
palms face forward and the chin must be over the bar’s plane. The time spent in
this position, to the nearest tenth of a second, is recorded. A cylindrical
horizontal bar and a stopwatch were used to perform the test.
6. 4x10m shuttle run test (speed of movement, agility and coordination
assessment): two parallel lines are drawn on the floor 10m apart. The adolescent
runs as fast as possible from the starting line to the other line and returns to the
starting line, crossing each line with both feet every time. This is performed
twice, covering a distance of 40m (4x10 m). Every time the adolescent crosses
any of the lines, he/she should pick up (the first time) or exchange (second and
third time) a sponge that has earlier been placed behind the lines. The stopwatch
is stopped when the adolescent crosses the end line with one foot. The time
taken to complete the test is recorded to the nearest tenth of a second. A slip-
proof floor, four cones, a stopwatch and three sponges were used to perform the
test.
7. 20-m shuttle run test (cardiorespiratory fitness assessment): the adolescents
perform the test as described by Léger et al [129]. Participants are required to
run between two lines 20m apart, while keeping pace with audio signals emitted
from a pre-recorded CD. The initial speed is 8.5kmh-1, which is increased by
0.5kmh-1 min-1 (1 min equals one stage). Participants are instructed to run in a
straight line, to pivot on completing a shuttle, and to pace themselves in
accordance with the audio signals. The test is finished when the participant fails
to reach the end lines concurrent with the audio signals on two consecutive
occasions. Otherwise, the test ends when the participant stops because of fatigue.
All measurements were carried out under standardized conditions on an indoor
rubberfloored gymnasium. The participants were encouraged to keep running as
long as possible throughout the course of the test. The last completed stage or
half-stage at which the participant drops out was scored. A gymnasium or space
large enough to mark out a 20m track, a 20m tape measure, a CD player and a
CD with the audio signals recorded were used to perform the test. All the tests

Valtueña J, 2012
34
were performed twice and the best score was retained, except for the bent arm
hang and the 20-m shuttle run tests, which were performed only once.
Léger equation was used to estimate the maximum oxygen consumption
(VO2max) from 20m shuttle run test [130].
3.12 Assessment of socioeconomic status (SES)
The objective of the self-reported socioeconomic questionnaire was to categorize
children according to SES and to be able to analyze relationships between SES and
nutritional and clinical data. The complete description of the self-reported
socioeconomic questionnaire has been described elsewhere [109]. The Family
Affluence Scale (FAS) is based on the concept of material conditions in the family to
base the selection of items. Currie et al. [47] chose a set of items which reflected family
expenditure and consumption that were relevant to family circumstances. Possessing
these items was considered to reflect affluence and their lack, on the other hand,
material deprivation. FAS was used in the present study as an index of socioeconomic
status [46], which includes 4 questions answered by the adolescent: Do you have your
own bedroom?; How many cars are there in your family?; How many PCs are there in
your home?; Do you have internet access at home? We defined low, medium and high
socioeconomic status based on the final score obtained from the four questions. That is,
we give a numerical value to each possible answer in the four questions. Then we
summed the final score from all the questions being ranged from 0 to 8. Finally, we
grouped these scores in three levels: low (from 0 to 2), medium (from 3 to 5) and high
(from 6 to 8).
3.13 Evaluation and statistics
All data analyses were performed by using Statistical Package for Social Sciences
(SPSS) versions 15.0 to 18.0 for Windows (SPSS Inc., Chicago, Illinois, USA). A
weighing factor was introduced to adequate the final sample to the theoretical sample by
age and gender. Descriptive statistics are shown as mean ± standard deviation (SD)
unless otherwise stated. We considered P-values <0.05 as statistically significant. The
detailed description of statistic procedure is presented in each chapter.

European PhD Thesis
35
4 RESULTS AND DISCUSSION
4.1 CHAPTER 1: RETINOL, Β-CAROTENE, Α-TOCOPHEROL AND
VITAMIN D STATUS IN EUROPEAN ADOLESCENTS; REGIONAL
DIFFERENCES AND VARIABILITY. A REVIEW.
4.1.1 Summary
Currently, blood levels to define vitamin deficiency or optimal status in adolescents are
extrapolated from adults. This may be not adequate as vitamin requirements during
adolescence depend on the process of sexual maturation, rapid increasing height and
weight, among other factors. In order to establish the state of the art, Medline database
(www.ncvi.nlm.nih.gov) was searched for studies published in Europe between 1981
and 2010 related to liposoluble vitamin status in adolescents. A comparison of the
vitamin status published in the reviewed articles was difficult due to the lack of studies,
lack of consensus on cut-off levels indicating deficiency and optimal vitamin levels and
the different age-ranges used. In spite of that, deficiency prevalence varied for vitamin
D (13-72%), vitamin A (3%), E (25%) and β-carotene (14-19%). Additional factors
were considered as possible determinants. We conclude that it is necessary to establish a
consensus on acceptable ranges and cut-offs of these vitamins during adolescence.
Representative data are still missing; therefore, there is a high need to get deeper into
the investigation on liposoluble vitamins in this population group.
4.1.2 Introduction
Vitamin deficiency, at least on a subclinical level, could be an unrecognized health
problem in children and adolescents in Europe because they are not routinely screened
for in these population groups. Especially adolescents are considered as a risk group for
malnutrition because of their increasing needs in nutrients and energy intake for an
adequate growth and development varying with age [172]. Additionally to that, the risk
for malnutrition is enhanced because although the access to high quality food and
nutrition is continuously improving in European countries [180], dietary patterns and
food choices are not optimal and not according to recommended guidelines [172].
Vitamins are specifically involved in multiple cellular and tissue processes [119], and
there is increasing evidence that links deficiencies with chronic diseases like

Valtueña J, 2012
36
cardiovascular and cerebrovascular disease, cancer, diabetes and osteoporosis in
adulthood [24, 49, 86, 101, 119, 168, 172, 180], though data are scarce for younger
ages. But deficiency stages at these early ages could contribute to risk factors [24, 61,
168, 180, 188], beside other already described implications like higher risk for
osteomalacia [24, 25], impaired cognitive function and concentration problems [8],
hyperactivity [61] and immune system impairment [24, 59]. For identifying deficiency
stages, reference values are currently extrapolated from adult data for most vitamins
[68].
As already mentioned, little information exists on the vitamin status of representative
populations in European countries, particularly for Eastern Europe. Lambert et al.
published a review on the contribution of essential nutrients and nutritional status of
European adolescents, but vitamins were barely mentioned [125]. Complementary to
that review, we published a review on B vitamin status in European adolescents some
years ago [4]. The aim of the present review is to get more information about the
existing data to give a better overview on fat soluble vitamin (A, E, D and provitamin β-
carotene) status in European adolescents, with a specific focus on blood levels,
reference values and assessment methods.
4.1.3 Material and methods
Those studies which evaluated blood fat soluble vitamin levels in European adolescents
were included in this review. The database Medline (www.ncvi.nlm.nih.gov) was used
for searching studies published between 1981 and 2010. Terms like “European
adolescents”, “liposoluble or fat soluble vitamins”, “vitamin status and values”,
“antioxidants”, names of European countries and technical terms of the different
liposoluble vitamins as well as combinations out of these terms were entered in the data
base for the search. In addition, references of relevant articles were also used to get
further information. Because the adolescence period goes from childhood to adulthood,
age ranges vary in different articles and data for a broader age-range had to be included
(from 9 to 18 years).

European PhD Thesis
37
4.1.4 Results
A total of 17 articles including around 4503 subjects from different European countries
were found focused on the assessment of liposoluble vitamins in adolescents, from
North (Finland, Sweden, Ireland, Poland and Denmark), East (Yugoslavia, Austria and
Hungary), West (France and Great Britain) and South (Italy and Greece) Europe.
Analysing the number of subjects, only three studies included a sample size of less than
50 persons. Two studies analysed a population between 50-100, seven between 100 and
500 and four studies between 500 and 1000 subjects (Table 4).
Vitamin D status in European adolescents.
The main sources of vitamin D are subcutaneous skin synthesis under the influence of
ultraviolet light (290-315 nm) and food [187]. Vitamin D deficiency has been identified
as a common problem in Europe [131, 160, 187]. Due to the geographical situation of
our continent, located at high latitude of 40º N in Madrid (Spain) and 60º N in Oslo
(Norway), the skin synthesis of vitamin D may not compensate a low nutritional intake.
Moreover, vitamin D intake in Europe is in general low (≤2-3 mg/d) [160]. In all the
reviewed studies vitamin D status was assessed by means of serum
25-hydroxycholecalciferol [25(OH)D], which is the main circulating vitamin D
metabolite, representing not only the consumed amount through diet and supplements
but also the subcutaneous synthesis [144, 187, 222]. One of the most important
applications of vitamin D assessment in adolescence is the determination of abnormal
serum concentrations of calcium for bone health. Moderately low levels of vitamin D
may have adverse effects on calcium homeostasis leading to bone loss, even without
symptoms of osteomalacia [124, 187, 196]. Some studies report a positive association
between serum [25(OH)D] and bone mineral content in adolescents[44, 132].
Inadequate vitamin D levels have been related to other diseases such as diabetes,
multiple sclerosis and cancer [77, 196].
Even vitamin D reference values for deficiency have been set at 27.5 nmol/L in children
[68], there is still a lack of consensus on the deficient and sufficient 25(OH)D
concentration, that varies from 20 nmol/L to 100 nmol/L in studies. A proposed scale
for the adult population defined hypovitaminosis D as 25(OH)D concentrations below
100 nmol/L, insufficient vitamin D at concentrations of 25(OH)D below 50 nmol/L and
a vitamin D deficiency when values are below 25 nmol/L[142]. The German, Swiss and
Austrian Nutrition societies (D-A-CH) also agree to the latter data, that serum 25(OH)D

Valtueña J, 2012
38
levels between 20 to 25 nmol/L present a suboptimal state [62, 68]. There is a consensus
that serum 25(OH)D concentrations below 10 nmol/L lead to risk of rickets,
osteomalacia, increase in cardiovascular and cancer risk factors among others [22, 24,
35, 115, 124, 136].
Several factors can influence vitamin D status. Regional differences can be appreciated
throughout Europe (Table 5). The highest values for vitamin D were found in French
teenagers [87], the lowest values were found in an Austrian study [118]. Depending on
the cut offs used (varying from 15 nmol/L to 25 nmol/l), vitamin D deficiency ranged
from 13 to 72% due to geographical differences.
Seasonal differences have been studied by several authors [6, 84, 86, 131]. In both
French and Austrian children significant differences in serum concentrations between
summer and winter were found, showing higher concentrations in summer [84, 86]. The
prevalence of suboptimal vitamin D status was 5% lower in summer due to more
adequate sun exposure in Finnish children [131].
The influence of age and Tanner stage on vitamin D status was analyzed in several
studies with a significant decrease in concentrations of 25(OH)D levels with increasing
age in both sexes (p <0.05) [84, 118], although in British children aged 15 and above
some slight increases were observed. Contrary to that, Bonofiglio et al. found a
significant higher concentration of 25(OH)D in Italian postmenarcheal girls compared
to premenarcheal ones (p<0.01) [28]. This could be due to the higher concentrations of
vitamin D binding protein caused by the increase of estrogens levels.
The influence of body composition on vitamin D levels was studied by Smotkin-
Tangorra et al. [193], who found an inverse correlation between 25(OH)D levels and
body mass index (BMI). Regarding supplementation, Guillemant et al. [85] and
Lehtonen-Veromaa et al. [131] observed a significant effect on 25(OH)D serum levels
(p=0.000) in French and Finnish children (Table 5).
A, E and provitamin β-carotene vitamin status in European adolescents.
Vitamin E and the provitamin β-carotene have an important role as antioxidants in the
human body [145]. Current lifestyle of adolescents with a low intake of fruits and
vegetables [125, 217] could create a pro-oxidant situation with serious long-term
consequences. Also vitamin A during adolescence is critical due to its role in cell
growth, vision and tissue development. High oxidative stress and free radical levels are

European PhD Thesis
39
involved in the development of cardiovascular disease and other undesirable metabolic
situations in adulthood [145, 217], but risk factors are already established during
childhood and adolescence [3].
Little is known about the reference blood levels of these vitamins during adolescence
[93]. In adults, the World Health Organization (WHO) defines a deficiency of vitamin
A through plasma retinol values [216]. Concentrations lower than 10 μg/dL (0.35
μmol/L) indicate a deficiency and values between 10 and 20 μg/dL (0.7 μmol/L) are
referred to as incipient deficiency [21].
Beta-carotene plasma levels are considered as a good indicator for fruit and vegetable
consumption, with great importance because of its antioxidant power. Low levels are
correlating with a higher risk of chronic diseases [66]. Although plasma values above
0.3 μmol/L are considered as acceptable in adults, β-carotene plasma levels above 0.5
μmol/L seem to have the best preventing effects [21] [66]. To determine the nutritional
status of vitamin E the level of serum α-tocopherol is normally used [21]. A strong
correlation between total blood fat (triglycerides), cholesterol and α-tocopherol
concentration in plasma has been found [139].
According to D-A-CH the normal α-tocopherol serum concentration for adults is
between 12 and 46 μmol/L [62], but for adolescents there are no explicit values.
Although the limit value for an adequate nutritional status is defined between 10-16
μmol/L [199], the guide value for primary prevention of cardiovascular disease and
cancer is higher than 30 μmol/L [62].
Data on vitamin A, E and β-carotene serum levels from existing European studies are
presented in tables 6-8. Deficiency states vary between less than 3% for vitamin A [31,
59, 61, 94], 25% for ß-carotene and 14-19% for α-tocopherol [59, 61, 94].
Gender seems to have no influence on serum blood levels. Regarding age, differences
have been observed. In several studies, vitamin A and Retinol Binding Protein (RBP)
levels increased according to age until puberty, where they reached adult levels [55, 84,
94, 139]. Plasma β-carotene and α-tocopherol levels seemed to be more stable through
the age span in French children and adolescents [55, 94, 139]. In British children,
ß-carotene levels increased with age in both sexes (p<0.01) [84]. And Winklhofer-Roob
et al. [217] found that age was a significant predictor of plasma α-tocopherol
concentration in Swiss subjects aged 0.4 to 38.7 years. Assessing vitamins by pubertal
development, a positive correlation was found with vitamin A (p<0.001), and a negative

Valtueña J, 2012
40
correlation with β-carotene and α-tocopherol serum levels with increasing Tanner stage
(p<0.05) [92].
Differences in vitamin status have also been observed in relationship to BMI. In the
study by Marktl et al. [140], obese adolescents presented higher vitamin A levels than
normal-weighted. In the study by Molnar et al. [145], over-weighted adolescents with
metabolic syndrome presented lower values of α-tocopherol and β-carotene than normal
weighted ones (p<0.01). However, in over-weighted adolescents without metabolic
syndrome, only β-carotene concentrations were significantly lower compared to normal-
weighted ones.
The effect of smoking on antioxidant status was studied in Britain by Crawley et al. [45]
showing that teenage smokers had a lower intake of antioxidant nutrients, fruits,
vegetables and cereals, being particularly significant among girls, but no blood levels
were reported. An opposite effect was found among vegetarian subjects that presented
higher levels of vitamin A, α-tocopherol and β-carotene than omnivore ones (p<0.001)
[120].
In the same way as for vitamin D, seasonal differences have been observed in plasma
α-tocopherol, cholesterol and retinol concentrations higher in winter than in the other
seasons [217]. In regard to regional differences increased α-tocopherol values were
observed in South Europe [89].
Relationship between the different vitamins has also been studied. Serum retinol had a
positive correlation with β-carotene and α-tocopherol levels [84, 138, 139] and the latter
with cholesterol [93, 138, 139]. Drott et al. on the contrary found an inverse relationship
between vitamin A and vitamin E serum concentrations[55].
The influence of socioeconomic status has been studied by Marktl et al. [140]. Higher
β-carotene and vitamin E serum concentrations were found in children of central Europe
whose parents had a high socioeconomic background.
4.1.5 General discussion
There are very few published studies on nutritional vitamin status in European
adolescents and data are not available for all countries, especially in the eastern part of
Europe. Moreover, the percentage of representative studies is low and in some countries
the sample is not representative at all of the general population. A comparison of the
vitamin status published in the reviewed articles is difficult due to the lack of consensus

European PhD Thesis
41
on cut-off levels indicating deficiency and optimal vitamin levels and the different age-
ranges used. Also, the way of presenting the results is not uniform, using the mean ±
standard deviation (SD) or the largest median plus 5 and 95 percentiles. Its variation is
also due to the variety of laboratory methods, lack of standard reference preparations
and calibration materials, and shortages of these issues [22, 35, 118, 135].
Regarding the existing data on liposoluble vitamin status of the European adolescents
reviewed, a general hypovitaminosis problem was found for vitamin D and β-carotene
in both genders. However, one study carried out in the US by Yetley et al. concluded
that males have higher vitamin D intakes and 25(OH)D concentrations than females
[220].
There seem to be several factors that influence liposoluble vitamin status; age, season,
BMI, smoking or socioeconomic status should be taken into account in future vitamin
studies as possible modificators of vitamin status in adolescents. Vitamin D decreases
according to age. In the before mentioned US study, hypovitaminosis D (<27.5 nmol/L)
was observed in 1% of infants and children aged <11 years, 5% of adolescents aged 12–
19 years, and 6% of adults aged <20 years [189]. Serum α-tocopherol was found to
increase slightly with age [189].
Several studies agree that vitamin D status exhibits a seasonal variation with higher
values during the summer period [44, 86, 131, 196]. Both serum 25(OH) D
concentration [116, 188, 201] and biomarkers of bone turnover [190], positively
correlate with bone mineral content. PTH concentrations tend to increase during winter
[121] being associated with bone absorption [24, 25], that is related with bone mineral
content.
Current research also suggests that obese adolescents present states of malnutrition
[150]. This means that, despite an excess of body fat, certain nutrients may be at risk
[77]. An inverse relation between antioxidant vitamins and vitamin D with BMI has
been observed [133, 193].
Regarding health costs, Grant et al. suggested for Western countries of Europe that the
increase in the mean serum 25(OH)D levels up to 40 ng/mL would have a positive
impact on the reduction of direct and indirect economic burden of disease. For 2007, the
reduction was estimated at €187,000 million/year [81].
Due to the low 25(OH)D concentrations, especially during winter months, some
researchers emphasize to improve vitamin D intake through supplements [191]. The
fortification of food with vitamin D is not common in Europe, without any regulation in

Valtueña J, 2012
42
some countries, with the exception of some Scandinavian countries. Vitamin D is
considered a pharmacological agent for children when the dose is higher than the levels
recommended by the Nordic countries of 5 mg/d (200 IU/d) and till now the data about
the influence of vitamin D supplementation or fortified foods in children and
adolescents is scarce [202]. On the contrary, seasonal vitamin A intake is not so
important. The recommendations in some countries like Ireland, Italy and the United
Kingdom are lower than the average for all age ranges in men and women, without any
significant deficiencies in these countries respect those with higher recommendations
(DACH countries and Romania).
Also other behavioural and health aspects should be taken into account in future studies
regarding vitamin status in adolescents. The lower intakes of antioxidant nutrients,
fruits, vegetables and cereals by the teenage smokers in comparison with non smokers
already mentioned agree with those found by Jain et al. [112] who observed an
increased oxidative stress and a compromised antioxidant defence system in smokers.
Lenders et al. [133] found that concentrations of 25(OH)D were directly correlated with
physical activity levels (P<0.05).
4.1.6 Conclusions
Currently, there are no reference values for blood vitamin levels in adolescents.
Analysing the available existing data on nutritional status in European adolescents, the
comparability of them implies many difficulties due to the lack of data and reference
values as well as the lack of consensus on methodological approaches. The importance
of transnational studies in order to standardize the procedures and methodologies and
the way to express the results to enable comparison should be highlighted.

European PhD Thesis
43
Table 4: Studies on the nutritional status of fat-soluble vitamins in adolescents
Subjects
Country Year Author Age (years) Gender Nº of subjects
Vitamins Additional parameters
North Finland 1997 Lehtonen-Veromaa et al
(1999)[132] 9-15 ♀ 191 D
Sweden N.D. Drott et al (1993)[55] 12-13,13-14, 14-15,15-16
♂,♀ 35 A,E RBP
Irland, Finland,
Poland, Denmark 2002/03 Andersen R et al (2005)[6] 12-13 ♀ 199 D
East Yugoslavia N.D. Buzina et al.(1982)[31] 12-15 201 A,
Slovaquia N.D. Krajcovicova et al.
(1997)[120] 11-14 ♂,♀ 58 A,E, ß-C
Hungary N.D. Molnar et al.(2004)[145] 13-16 ♂,♀ 48 A,E ß-C
Austria 1991 Koenig and Elmadfa (2000)[118].ASNS
10-12,13-14,15-19 ♂,♀
980 D
Austria 1991 Elmadfa et al.
(1994)[59].ASNS 10-12,13-14,
15-18 ♂,♀
N.D. A,E,K
Austria N.D Marktl et al(1982)[140] 11-12 ♂,♀ 797 A,E West France N.D. Guillemant et al. (2001)[87] 13-16 ♂ 54 D
France 1988 Hercberg et al. (1993)[94] 10-14,14-18 ♂,♀ 108 A,E ß-C, VitE/Chol France 1988/89 Herbeth et al. (1991)[93] 10-15 ♂,♀ 509 A,E ß-C
France 1985/6 Malvy et al (1993)[138] 12-13,14-16 ♂,♀
211 A,E RBC ;ß-C, VitE/Chol
France 1985/86 Malvy et al. (1989)[139] 9-12,12-14,14-16 ♂,♀ 251 A,E ß-C, VitE/Chol Great Britain 1997 Gregory et al. (2000)[84] 11-14,15-18 ♂,♀ 656 D,A,E ß-C, VitE/Chol
South Greece N.D. Hassapidou et al. (1996)[89] 13-14 ♂,♀ 20 E Italy N.D. Bonofiglio et al. (1999)[28] 11-16 ♀ 185 D
N.D. Not documented ß-C:ß- carotene ASNS: Austrian Study on Nutritional Status of Schoolchildren

Valtueña J, 2012
44
Table 5: Studies of vitamin D status in European adolescents
Age (years) 9 10 11 12 13 14 15 16 17 18 19
Authors Lehtonen-
Veromaa et al[132] Finland
♀(1) 1 33,9 ± 13,9 nmol/l ♀(2) 1 62,9 ± 15,0 nmol/l (summer)
♀(3) 1 33,7 ± 11,4 nmol/l
Guillemant et al. [87] France
♂(1) 1 71,6 ± 19,9 nmol/l (summer)
♂(2) 1 20,4 ± 6,9 nmol/l (winter)
♂(3) 1 52,4 ± 16,3 nmol/l (summer)
♂(4) 1 21,4 ± 6,1 nmol/l (winter)
Koenig and Elmadfa et
al.[118] Austria
9,9 ± 6,1 nmol/l
9,2 ± 6,9 nmol/l
11,2 ± 8,1 nmol/l
Gregory et al.[84]
Great Britain
♂ 56,7 ± 24,05 nmol/l ♀ 54,4 ± 23,52 nmol/l
♂ 56,7 ± 24,05 nmol/l ♀ 54,4 ± 23,52 nmol/l
Bonofiglio et al.[28] Italy
♀ 17,9 ± 1,1 ng/ml2 ♀ 44,75 ± 2,75 nmol/l2 + 3
♀ 23,2 ± 0,7 ng/ml4 ♀ 58 ± 1,75 nmol/l4 + 3
Andersen R et al [6]
North of Europe
♀ 29.4 (20.3,38.3) nmol/l
Serum concentrations of 25(OH)D Mean ± SD o Mean (interquartils) 1 blood extraction number 2 premenarcheal group 3 1 nmol/l = 0,4 ng/ml 4 postmenarcheal group

European PhD Thesis
45
Table 6: Studies of retinol status in European adolescents.
Age (years)
Authors 9 10 11 12 13 14 15 16 17 18
Drott et al.[55] Sweden
429 μg/l (211-599) 1 1,5 μmol/l
(0,74-2,10) 4
924 μg/l (255-1463) 1 3,23 μmol/l (0,89-5,12) 4
670 μg/l (343-1112) 1 2,34 μmol/l (1,20-3,90) 4
576 μg/l (410-805) 1 2,01 μmol/l (1,43-2,81) 4
Buzina et al.[31] Yugoslavia
♂: 34,5 ± 8,8 μg/dl2 1,21 ± 0,31 μmol/l4
Krajcovicova et al.[120]
Slovaquia
Vegetarians: 1,91 ± 0,02 μmol/l2 Omnivores: 1,54 ± 0,07 μmol/l2
Normal-weighted: 1,87 ± 0,51 μmol/l2 Molnar et al.[145] Hungary Obese: 1,8 ± 0,51 μmol/l2
Hercberg et al.[94] France
♂: 1,32 μmol/l (0,73/1,98) 3 ♀: 1,37 μmol/l (0,95/1,89) 3
♂: 1,56 μmol/l (1,16/2,30) 3 ♀: 1,6 μmol/l (1,27/2,59) 3
Malvy et al.[139] France
40,3 ± 9,4 μg/dl2 1,41 ± 0,33 μmol/l4
43,7 ± 9,8 μg/dl2 1,53 ± 0,34 μmol/l4
51,7 ± 12,2 μg/dl2 1,81 ± 0,43 μmol/l4
Malvy et al.[138] France
♂: 44,30 μg/dl (28,4-66,4) 1 1,55 μmol/l (1,0-2,32) 4
♀: 42,15 μg/dl (21,8-64,0) 1 1,47 μmol/l (0,76-2,24) 4
♂: 51,50 μg/dl (25,4-88,7) 1 1,80 μmol/l (0,9-3,10) 4
♀: 45,90 μg/dl (33,1-83,2) 1 1,60 μmol/l (1,16-2,90) 4
Elmadfa et al.[59] Austria
31,6 ± 7,2 μg/dl2
1,10 ± 0,25 μmol/l4 33,5 ± 6,3 μg/dl2
1,17 ± 0,22 μmol/l4 38,6 ± 10,2 μg/dl2
1,35 ± 0,36 μmol/l4
Marktl et al[140] Austria
♂: 156 ± 27,9 UI/dl2 1,62 ± 0,30 μmol/l4 + 5 ♀: 158 ± 26,3 UI/dl2
1,66 ± 0,27 μmol/l4 + 5
Gregory et al.[84] Great Britain
♂: 1,27 ± 0,27 μmol/l2 ♀: 1,37 ± 0,285 μmol/l2
♂: 1,53 ± 0,392 μmol/l2 ♀: 1,51 ± 0,389 μmol/l2
Retinol Plasmatic concentrations 1 Median (Range) 2 Mean ± SD 3 Mean (Percentil 5/Percentil 95) 4 1 μmol/l = 28,6 μg/dl 5 1 UI = 0,3 μg

Valtueña J, 2012
46
Table 7: Studies of β-carotene status in European adolescents.
Age (years)
Authors 9 10 11 12 13 14 15 16 17 18
Krajcovicova et al.[120]
Slovaquia
Vegetarian: 0,46 ± 0,03 μmol/l2 Omnivores: 0,26 ± 0,02 μmol/l2
Normal-weighted: 0,4 ± 0,304 μmol/l2 Molnar et al.[145] Hungary Obese: 0,26 ± 0,112 μmol/l2
Hercberg et al.[94] France
♂: 0,64 μmol/l (0,22/1,79) 3 ♀: 0,58 μmol/l (0,17/1,44) 3
♂: 0,60 μmol/l (0,25/1,85) 3 ♀: 0,60 μmol/l (0,18/2,65) 3
Malvy et al.[139] France
499 ± 276 μg/l2 0,93 ± 0,46 μmol/l4
626 ± 388 μg/l2 1,17 ± 0,72 μmol/l4
525 ± 304 μg/l2 0,98 ± 0,57 μmol/l4
Malvy et al.[138] France
♂: 480 μg/l (135-1250) 1 0,89 μmol/l (0,25-2,33) 4 ♀: 527 μg/l (153-1405) 1 0,98 μmol/l (0,29-2,62) 4
♂: 487 μg/l (335-1465) 1 0,91 μmol/l (0,62-2,73) 4 ♀: 442 μg/l (210-1310) 1 0,82 μmol/l (0,39-2,44) 4
Elmadfa et al[59] Austria
33,2 ± 18,6 μg/dl2
0,62 ± 0,35 μmol/l4 33,7 ± 20,8 μg/dl2
0,63 ± 0,39 μmol/l4 40,8 ± 29,6 μg/dl2
0,76 ± 0,55 μmol/l4
Marktl et al.[140] Austria
♂: 32,2 ± 21,9 μg/dl2 0,60 ± 0,41 μmol/l4 ♀: 25,3 ± 21,6 μg/dl2 0,47 ± 0,40 μmol/l4
Gregory et al.[84] Great Britain
♂: 0,297 ± 0,2108 μmol/l2 ♀: 0,272 ± 0,2370 μmol/l2
♂: 0,249 ± 0,1781 μmol/l2 ♀: 0,257 ± 0,1580 μmol/l2
β-carotene plasmatic concentrations 1 Median (Range) 2 Mean ± SD 3 Mean (Percentil 5/Percentil 95) 4 1 μmol/l = 536 μg/l

European PhD Thesis
47
Table 8: Studies of α- tocopherol status in European adolescents.
Age (years)
Authors 9 10 11 12 13 14 15 16 17 18
Drott et al.[55] Sweden
9,1 mg/l (3,2-13,2) 1
21,16 μmol/l (7,4-30,7) 4
6,1 mg/l (2,9-9,7) 1
14,9 μmol/l (6,7-22,5) 4
8,2 mg/l (3,0-13,2) 1
19,07 μmol/l (7,0-30,7) 4
7,5 mg/l (5,3-10,2) 1
17,44 μmol/l (12,3-23,7) 4
Krajcovicova et al.[120]
Slovaquia
Vegetarians: 29,17 ± 0,96 μmol/l2 Omnivores: 22,94 ± 0,62 μmol/l2
Normal-weighted: 29,17 ± 0,96 μmol/l2 Molnar et al.[145] Hungary Obese: 17,1 ± 4,65 μmol/l2
Hercberg et al[94] France
♂: 18,3 μmol/l (13,4/24,1) 3 ♀: 20,5 μmol/l (14,7/25,9) 3
♂: 18,3 μmol/l (13,4/24,1) 3 ♀: 20,5 μmol/l (14,7/25,9) 3
Malvy et al.[139] France
10,0 ± 2,0 mg/l2 23,25 ± 4,65 μmol/l4
9,7 ± 2,5 mg/l2 22,65 ± 5,81 μmol/l4
10,0 ± 2,1 mg/l2 23,72 ± 4,88 μmol/l4
Malvy et al.[138] France
♂: 8,30 mg/l (6,8-13,1) 1 19,30 μmol/l (15,81-30,46) 4 ♀: 8,9 mg/l (1,1-12,2) 1
20,7 μmol/l (2,56-28,37) 4
♂: 9,10 mg/l (5,8-15,7) 1 21,16 μmol/l (13,49-36,51) 4 ♀: 9,40 mg/l (3,7-13,7) 1
21,86 μmol/l (8,6-31,86) 4
Elmadfa et al[59] Austria
0,88 ± 0,21 mg/dl2
20,46 ± 4,88 μmol/l4 0,85 ± 0,19 mg/dl2
19,77 ± 18,37 μmol/l4 0,89 ± 0,20 mg/dl2 20,7 ± 4,65 μmol/l4
Marktl et al.[140] Austria
♂: 1,17 ± 0,23 mg/dl2 27,21 ± 5,35 μmol/l4 ♀: 1,07 ± 0,22 mg/dl2 24,88 ± 5,12 μmol/l4
Gregory et al.[84] Great Britain
♂: 19,7 ± 4,02 μmol/l2 ♀: 20,5 ± 3,48 μmol/l2
♂: 19,2 ± 3,97μmol/l2 ♀: 19,8 ± 3,97 μmol/l2
Hassapidou et al.[89] Greece
0,79 mg/l (0,7-1,02) 1
18,37 μmol/l (16,28-23,27) 4
α- tocopherol serum concentrations 1 Median (Range) 2 Mean ± SD 3 Mean (Percentil 5/Percentil 95) 4 1 μmol/l = 0,43 mg/l

Valtueña J, 2012
48

European PhD Thesis
49
4.2 CHAPTER 2: VITAMIN A, E AND BETA-CAROTENE STATUS IN
EUROPEAN ADOLESCENTS.
4.2.1 Abstract
Introduction: An adequate nutritional status of antioxidant vitamins (vitamins A, E) and
ß-carotene is essential especially during childhood and adolescence, because of their
important role in cell growth and development. Currently, there are no physiological
reference values for blood concentration of these vitamins and ß-carotene of apparently
healthy in European adolescents.
Aim: To obtain reliable and comparable data of antioxidant vitamins and ß-carotene a
cross-sectional study, within HELENA (Healthy Lifestyle in Europe by Nutrition in
Adolescence), was conducted in a representative sample of adolescents from ten
European cities.
Methods: From a subsample of 1,054 adolescents (males= 501) of the HELENA Cross
Sectional Study with an age range of 12.5 to 17.49 years fasting blood samples were
taken and analysed for vitamins A, E, and ß-carotene status. As specific reference
values for adolescents are missing, percentile distribution by age and sex is given.
Results: Mean concentrations were the following: Retinol: 356.4 107.9 ng/mL; α-
tocopherol: 9.9 2.1 μg/mL; ß-carotene: 245.6 169.6 ng/mL. Females showed higher
α-tocopherol values compared with males and 17-year old boys had higher retinol levels
than the same aged girls (p<0.05). Retinol serum concentrations increased significantly
according to age in both gender, but girls had also significant increasing ß-carotene
levels by age.
Conclusions: For the first time, concentrations of antioxidant vitamins and pro-vitamin
ß-carotene have been obtained in a representative sample of apparently healthy
European adolescents. Data can contribute to the establishment of reference ranges in
adolescents.

Valtueña J, 2012
50
4.2.2 Introduction
Research in the last years has increased the physiological importance of liposoble
antioxidant vitamins A, E and the pro-vitamin ß-carotene and shown that the biological
activities are much broader than expected in former times [20]. In fact, they are
specifically involved in multiple cellular and tissue processes [119] that go beyond the
antioxidant function [145]. Vitamin A (retinol) is an essential nutrient needed in small
amounts by humans for the normal functioning of the visual system; growth and
development; and maintenance of epithelial cellular integrity, immune function, and
reproduction [67]. These dietary needs for vitamin A are normally provided for as
preformed retinol (mainly as retinyl ester) and provitamin A carotenoids i.e. β-carotene
[67]. Beta-carotene is getting more and more importance because of its high antioxidant
power [66]. Vitamin E is the major lipid-soluble antioxidant in the cell antioxidant
defence system and is exclusively obtained from the diet. As a chain-reaction breaking
antioxidant Vitamin E prevents the propagation of lipid-peroxidation especially of
PUFAs (polyunsaturated fatty acids) and other components of cell membranes and low-
density lipoproteins (LDL) from oxidation by free radicals [66].
There is increasing evidence linking antioxidant vitamins and ß-carotene with chronic
diseases like cardiovascular and cerebrovascular disease, cancer, and diabetes in
adulthood [119, 172, 180]. High oxidative stress and free radical levels are involved in
the development of cardiovascular disease and other undesirable metabolic situations in
adulthood [145, 217], but as research has also shown in the last decade, risk factors are
already established during childhood and adolescence [3]. Assuming that beside the
increasing needs in nutrients and energy for an adequate growth and development [147,
172], having an adequate vitamin status could have an additional health effect. But little
is known about the reference blood levels of these vitamins during adolescence [93].
There is a general consensus in the literature that these values are missing for the
adolescent population [119, 149, 156, 158] As we reviewed recently [204], studies
performed on European adolescents specifically dealing with the above-mentioned
vitamins and ß-carotene are scarce and in several cases performed more than 10 or 15
years ago [93, 94, 139, 140]. One of the main aims of the HELENA-Study (Healthy
Lifestyle in Europe by Nutrition in Adolescence) was to provide, for the first time,
reliable data about micronutrient status in European adolescents [66, 67, 125].

European PhD Thesis
51
The main objective of the current study is to obtain reliable and comparable data of a
representative sample of European adolescents, concerning the assessment of vitamin A,
C, E and ß-carotene status in adolescents and to analyse vitamin plasma concentrations
by sex and age and to contribute to percentile distribution for clinical use as reference
values are missing for the adolescent population [51, 148].
4.2.3 Subjects and Methods
A description of the study design and implementation is given in the general
methodology. Further the statistical analysis is described.
Statistical analysis
Statistical analyses were performed using the SPSS statistical software package (version
17.0, SPSS Inc., Chicago, IL, U.S.A.). To assess the influence of age, adolescents were
stratified into 4 gender-specific age groups ranging from 12.5-13.99, 14-14.99,
15-15.99, and 16-17.49 y, respectively. All the analyses conducted on the HELENA
data are adjusted by a weighing factor to balance the sample according to the theoretical
sample in order to ensure true representation of each of the stratified groups.
Descriptive statistics were performed and values are shown as mean standard
deviation (SD) and percentiles. The differences between genders, sex, age-groups,
Tanner stage and BMI groups were analysed using one-way ANOVA. The Bonferroni
post-hoc test was used for sub-group analysis.
To provide percentile values for European adolescents, we analysed vitamin A, C, α-
tocopherol, and ß-carotene data by maximum penalised likelihood using the LMS
statistical method for boys and girls separately [41, 42]. We derived smoothed centile
charts using the LMS method. This estimates the measurement centiles in terms of three
age–sex-specific cubic spline curves: the L curve (Box– Cox power to remove
skewness), M curve (median) and S curve (coefficient of variation). For the construction
of the percentile curves, data were imported into the LmsChartMaker software (V. 2.3;
by Tim Cole and Huiqi Pan) and the L, M and S curves estimated.

Valtueña J, 2012
52
4.2.4 Results
Subjects characteristics and mean retinol, ß-carotene and α-tocopherol concentrations
for the total sample and by sex are shown on Table 9. Girls had significantly higher α–
tocopherol (p ≤ 0.001) plasma values than boys. The vitamin deficiency found was <1%
for retinol, <25% for beta-carotene and <5% for α-tocopherol.
Retinol concentrations increased with age in both gender (p ≤ 0.001), but only girls had
also higher ß-carotene levels when they are getting older (p = 0.033). Alfa-tocopherol
concentrations were significantly higher in girls aged 16 years compared to 13 year old
girls (p = 0.006).
Comparing results by gender and age groups significant differences were observed for
retinol, α-tocopherol concentrations. Females showed in general significantly higher α-
tocopherol values compared with males (p <0.001, data not shown). But males had a
higher retinol status in the oldest age group compared to girls (p = 0.018). Percentile
distribution for each vitamin presented by age groups is shown on Tables 10-14. Figure
6 shows smoothed centile curves (P5, P25, P50, P75, P95) for retinol, α-tocopherol, and
ß-carotene by sex and age.
4.2.5 Discussion
The scientific knowledge about antioxidant vitamin status in adolescents in both
developed and developing countries is scarce. In the review by Lambert et al. [125]
about the nutritional status of European adolescents antioxidant vitamins were barely
mentioned. In the more recent review performed by our research group, we confirmed
the scarcity of available data [18]. Only few studies about antioxidant vitamins status in
adolescents have been carried out in the last decade in some European countries, but
comparison of the data is not always possible due to the use of different methods, age
group categories and reduced number of subjects [204]. As there are no representative
data on the metabolic and biochemical status of healthy adolescents, reference values
are missing for many blood parameters. Often, reference values for adults have been
used to establish limits for vitamin levels in adolescents [119, 172].
In order to be able to define these reference values, data must be analysed by both age
and gender. It is more than reasonable to suppose that growth and development will

European PhD Thesis
53
have an influence on blood concentrations. In fact, several smaller studies have dealt
with this issue.
According to the studies, deficiency states vary between less than 3% for vitamin A [31,
59, 61, 94], 25% for ß-carotene and 14-19% for α-tocopherol [59, 61, 94]. Our results
are in agreement, with less than 1% for retinol defieicnty; less than 25% for beta-
carotene deficiency and less than 5% for α-tocopherol deficiency. In the same way as in
our HELENA data and confirmed by the LMS percentile curves (Figure 6), retinol
concentrations increased with age in both genders in all analysed studies [55, 83, 94,
139]. Plasma β-carotene levels seemed to be more stable through the age span in several
studies performed on French adolescents [55, 94, 139]. On the contrary, in British
adolescents, ß-carotene concentrations increased with age in both sexes (p<0.01)[84]. In
our study, only in girls an increase of ß-carotene concentrations with age was observed
(p < 0.05). Alfa-tocopherol concentrations remained stable with increasing age in
French [55, 94, 139], 34] and British [84]adolescents, whereas age was found to be a
significant predictor of plasma α-tocopherol concentrations in Swiss subjects aged 0.4
to 38.7 years [11]. In this last study, the big age-range of the analysed subjects could
have influenced the results. In our study, only in females a trend to increasing α-
tocopherol levels can be observed (Figure 6).
In relationship to gender, in the 509 French adolescents studied by Herbeth et al. [93],
boys had significant higher retinol concentrations than girls (p < 0.001) similar to what
we observed for the highest age group. Gender differences for ß-carotene and α-
tocopherol were measured in an Austrian study. Boys had significant higher
concentrations than girls (p < 0.001) [140]. These findings are contrary to ours, as we
observed significantly higher α-tocopherol concentrations in girls than in boys (p <
0.001), but no differences in ß-carotene levels.
In conclusion, the present chapter provides data on the distribution of retinol, α-
tocopherol, ß-carotene, and vitamin C concentrations in European adolescents.
Differences by gender were observed, females showing higher vitamin C and α-
tocopherol values compared with males but males had higher retinol values compared to
females. Retinol serum concentrations increased significantly according to age. The
HELENA percentile distribution is in agreement with data coming from smaller studies
and could be used as reference values to characterise vitamin status of European
adolescents.

Valtueña J, 2012
54

European PhD Thesis
55
Table 9: Characteristics of the HELENA study population of adolescents by sex1
1n = 933 (male = 444, female =489), 2n = 942 (male = 449, female = 493)
Table 10: Percentile distributions for retinol (ng/mL), beta-carotene (ng/mL), and α-tocopherol (µg/mL) of male European adolescents.
Retinol
(ng/mL) ß-carotene (ng/mL)
α-tocopherol (µg/mL)
n 444 449 444 2.5 196.70 54.74 6.00 5 216.03 71.06 6.34 10 243.10 90.01 7.03 25 285.56 131.36 7.97 50 353.72 192.47 9.39 75 417.18 275.44 10.76 95 550.71 578.49 13.06
Percentile
97.5 629.50 707.21 13.92
Table 11: Percentile distributions for retinol (ng/mL), beta-carotene (ng/mL), and α-tocopherol (µg/mL) of female European adolescents.
Retinol
(ng/mL) ß-carotene (ng/mL)
α-tocopherol (µg/mL)
n 488 493 488 2.5 194.07 71.17 6.49 5 210.85 80.52 7.10 10 236.90 100.29 7.76 25 277.02 148.37 8.74 50 326.94 215.56 9.98 75 405.59 311.60 11.58 95 566.76 600.25 14.30
Percentile
97.5 622.61 712.57 15.16
total male female p 1053 501 553 age (y) 14.9 ± 1.2 14.9 ± 1.3 14.9 ± 1.2 NS height (cm) 165.9 ± 9.4 170.3 ± 9.8 161.9 ± 7.0 0.001 weight (kg) 59.3 ± 12.7 62.6 ± 14.2 56.2 ± 10.2 0.001 BMI (kg/m2) 21.4 ± 3.7 21.5 ± 4.0 21.4 ±3.4 NS Tanner stage (%) Stages I/II/III/IV/V
1/6/19/44/32 1/7/18/43/31 0/4/20/44/32 NS
Retinol (ng/mL)1 356.4 ± 107.9 362.6 ± 104.3 350.7 ± 110.8 NS ß-carotene (ng/mL)2 245.6 ±169.6 236.5 ± 180.3 254.0 ± 159.1 NS α-Tocopherol (µg/mL)1 9.9 ± 2.1 9.5 ± 2.0 10.3 ± 2.1 0.001

Valtueña J, 2012
56
Table 12: Percentile distributions for retinol (ng/mL) of apparently healthy European adolescents presented by age groups
Retinol (ng/Ml
male
Age groups N P 2.5 P 5 P 10 P 25 P 50 P 75 P 95 P 97.5 12.5-13.99 112 145.2 188.1 203.8 251.4 310.4 366.7 461.0 496.6 14.0-14.99 110 197.4 222.8 242.8 277.4 331.0 392.6 520.4 610.9 15.0-15.99 118 218.9 235.5 262.3 307.4 371.0 416.3 550.4 611.4 16.0-17.49 104 223.1 281.9 285.5 335.0 423.4 491.0 679.8 692.6 female n P 2.5 P 5 P 10 P 25 P 50 P 75 P 95 P 97.5 12.5-13.99 129 189.3 200.9 224.8 270.7 309.3 361.6 484.2 589.8 14.0-14.99 125 174.3 202.8 220.8 274.2 314.2 403.8 525.6 601.3 15.0-15.99 130 195.6 211.7 238.0 278.4 333.2 421.7 558.2 629.5 16.0-17.49 113 200.5 237.5 254.7 288.4 351.8 449.3 666.1 785.8
Table 13: Percentile distributions for ß-carotene (ng/mL) of European adolescents presented by age groups
ß-carotene (ng/mL)
male
Age groups n P 2.5 P 5 P 10 P 25 P 50 P 75 P 95 P 97.5 12.5-13.99 111 44.2 69.6 91.2 128.5 205.7 296.8 529.2 879.3 14.0-14.99 116 51.5 62.3 89.2 134.2 185.5 262.6 601.8 714.3 15.0-15.99 118 46.9 64.2 84.2 116.1 181.3 251.8 574.1 615.1 16.0-17.49 104 72.9 84.8 99.4 156.1 204.9 288.5 638.6 980.9 female n P 2.5 P 5 P 10 P 25 P 50 P 75 P 95 P 97.5 12.5-13.99 121 57.3 72.0 90.1 132.2 197.9 299.7 579.7 728.9 14.0-14.99 126 73.7 80.5 98.4 161.7 235.0 314.3 615.1 704.8 15.0-15.99 132 67.3 72.3 101.7 142.3 191.1 294.2 512.5 534.7 16.0-17.49 114 74.9 88.7 105.9 159.5 234.2 346.6 721.9 957.2
Table 14: Percentile distributions for α-tocopherol (µg/mL) of European adolescents presented by age groups.
α-tocopherol (µg/mL)
male
Age groups n P 2.5 P 5 P 10 P 25 P 50 P 75 P 95 P 97.5 12.5-13.99 112 5.8 6.1 6.6 8.0 9.3 10.6 13.2 14.2 14.0-14.99 110 6.6 6.9 7.3 8.2 9.4 10.5 12.8 14.1 15.0-15.99 118 5.3 6.1 7.1 7.9 9.6 11.1 13.4 14.5 16.0-17.49 104 6.2 6.6 7.1 7.9 9.4 10.4 12.6 13.3 female n P 2.5 P 5 P 10 P 25 P 50 P 75 P 95 P 97.5 12.5-13.99 120 6.2 6.7 7.6 8.7 9.5 11.0 13.8 15.4 14.0-14.99 126 6.2 7.0 7.7 8.8 10.1 11.3 14.2 15.0 15.0-15.99 130 6.9 7.8 8.2 9.0 10.7 11.8 14.2 15.4 16.0-17.49 113 6.4 7.2 7.7 8.6 9.9 12.0 14.8 15.5

European PhD Thesis
57
Figure 6: Smoothed (LMS method) centile curves (from the bottom to the top: P5, P25, P50, P75, P95) of retinol, ß-carotene and α-tocopherol in European adolescents.
Retinol
100
200
300
400
500
600
700
800
12 13 14 15 16 17 18100
200
300
400
500
600
700
800
12 13 14 15 16 17 18
0
100
200
300
400
500
600
700
800
900
12 13 14 15 16 17 180
100
200
300
400
500
600
700
800
900
12 13 14 15 16 17 18
5.0
7.5
10.0
12.5
15.0
12 13 14 15 16 17 185.0
7.5
10.0
12.5
15.0
12 13 14 15 16 17 18
Ret
inol
(ng
/mL
) ß-
caro
tene
(ng
/mL
) α-
toco
pher
ol (
µg/
mL
)
ß-carotene
α-tocopherol
Ages (years)
Males Females

Valtueña J, 2012
58

European PhD Thesis
59
4.3 CHAPTER 3: VITAMIN D STATUS IN EUROPEAN ADOLESCENTS.
4.3.1 Abstract
An adequate vitamin D status is essential during childhood and adolescence, for its
important role in cell growth, skeletal structure and development. Its benefits also
reduce the risk of conditions such as cardiovascular disease, osteoporosis, diabetes
mellitus, infections and autoimmune disease. As comparable data on the European level
are lacking, assessment of vitamin D concentrations was included in the “Healthy
Lifestyle in Europe by Nutrition in Adolescence” (HELENA) study. Fasting blood
samples were obtained from a subsample of 1006 adolescents (470 males; 46.8%) with
an age range of 12.5 to 17.5 years, selected in the ten HELENA cities in the nine
different European countries participating in this cross sectional study, and analysed for
25-hydroxycholecalciferol [25(OH)D] by ELISA using EDTA plasma. As specific
reference values for adolescents are missing, percentile distribution was computed by
age and sex. Median 25(OH)D levels for the whole population were 57.1 nmol/l, 5th
percentile 24.3 nmol/l, 95th percentile 99.05 nmol/l. Vitamin D status was classified into
four groups according to international guidelines (sufficiency/optimal levels ≥75nmol/l;
insufficiency 50-75 nmol/l; deficiency 27.5-49.99 nmol/l and severe deficiency <27.5
nmol/l). Almost 80% of the sample had suboptimal levels (39% had insufficient, 27%
deficient and 15% severely deficient levels). Vitamin D concentrations increased with
age (p<0.01) and tended to decrease according to BMI. Geographical differences were
also identified. Our results indicate that vitamin D deficiency is a highly prevalent
condition in European adolescents and should be a matter of concern for public health
authorities.

Valtueña J, 2012
60
4.3.2 Introduction
Adolescents are considered as a risk group for malnutrition because of their increasing
needs in nutrients and energy for adequate growth and development which vary with
age [147, 160, 172]. Specifically different levels of vitamin D deficiency at these early
ages, could be considered a risk factor for osteomalacia [24, 25, 188], impaired
cognitive function and concentration problems [8], hyperactivity [60] and immune
system deficiency [24]. Inadequate vitamin D levels have also been related to other
diseases such as diabetes, multiple sclerosis and cancer [180, 196, 198]. One of the most
important applications of vitamin D assessment in adolescence is related with bone
health [178] and reaching an optimal peak bone mass in adulthood [44, 124]. The main
sources of vitamin D are food intake and subcutaneous skin synthesis, under the
influence of ultraviolet light (290-315 nm) exposure. However, due to the geographical
situation of our continent vitamin D synthesis may not compensate for a low nutritional
intake [187]. Subclinical vitamin D deficiency could remain undetected as it is not
routinely screened for in these population groups. The main circulating vitamin D
metabolite, 25-hydroxycholecalciferol [25(OH)D], has been proposed as the best
indicator of vitamin D status, because it represents not only the amount consumed
through diet and supplements but also the subcutaneous synthesis [68, 144, 187, 222].
Scientific knowledge about vitamin D status in the period of adolescence in both
developed and developing countries is still scarce. Several studies on vitamin D in
European adolescents have been carried out in the last decade, but only a few have used
a significant number of subjects. As we recently reviewed [204], comparison of the data
is not always possible due to the use of different age-ranges, different methods, different
ways of presenting them in the different studies and a lack of consensus on cut off
levels. Proposed deficient and sufficient 25(OH)D vitamin concentrations vary from 20
nmol/l to 100 nmol/l depending on the studies [6, 84, 87]. While there are no universally
accepted blood 25(OH)D thresholds to define adequacy in adolescents, the following set
has been proposed; concentrations of 25(OH)D below 75 nmol/l as insufficient,
concentrations below 50 nmol/l as deficient and severe vitamin D deficiency when
values are below 27.5 nmol/l [181]. The proposed reference value for suficiency in
children (>75 nmol/l) has been extrapolated from adult data [68].

European PhD Thesis
61
One of the main aims of the HELENA (Healthy Lifestyle in Europe by Nutrition in
Adolescence) study was to provide, for the first time, comparable data about
micronutrient status in European adolescents [148]. The main objective of the current
study was to describe vitamin D status in adolescents and to analyse vitamin plasma
concentrations by sex, age and weight status, thus contributing to establishing reference
values which are not available for the adolescent population [28, 125].
4.3.3 Subjects and Methods
A description of the study design and implementation is given in the general
methodology. Further the statistical analysis is described.
Statistical analysis
25(OH)D showed a normal histogram distribution. Descriptive statistics were performed
and values are shown as mean, standard deviation, percentile, median, minimum and
maximum. For this study, vitamin D status was classified into four groups (vitamin D
sufficiency/optimal levels ≥75nmol/l; insufficiency 50-75 nmol/l; deficiency 27.5-49.99
nmol/l and severe deficiency <27.5 nmol/l) following international guidelines [26, 68,
106]. The differences between sex, age-groups, and BMI groups were analysed using
one-way ANOVA. All the analyses were adjusted by a weighting factor to balance the
sample according to the age and sex distribution of the theoretical sample, in order to
guarantee representation of each of the stratified groups.
To provide percentile value curves for European adolescents, we analysed vitamin D
data by maximum penalised likelihood using the LMS statistical method for boys and
girls separately [41, 42]. We derived smoothed centile charts using the LMS method.
This estimates the measurement centiles in terms of three age–sex-specific cubic spline
curves: the L curve (Box–Cox power to remove skewness), M curve (median) and S
curve (coefficient of variation). For the construction of the percentile curves, data were
imported into the LmsChartMaker software (V. 2.3; by Tim Cole and Huiqi Pan) and
the L, M and S curves estimated. All the rest of the data have been analysed using SPSS
version 18.0.

Valtueña J, 2012
62
4.3.4 Results
Descriptive characteristics and mean vitamin D concentrations of the study sample by
sex and age are shown in Tables 15 and 16. Girls had slightly higher mean
concentrations than boys. Prevalence rates of vitamin D status according to the above-
mentioned sufficient-deficient classification are shown in Figure 7. Considering the cut-
off set for adults at 75 nmol/l, almost 80% of the sample was below the optimal levels.
A slightly higher percentage of females (22.2%) had sufficient 25(OH)D concentrations
compared to males (15.1%). Regarding 25(OH)D deficiency (<27.5 nmol/l), an equal
and high proportion of males and females revealed this status (15%).
There is a tendency of increasing 25(OH)D concentrations with increasing age for the
whole group (p<0.001), which is only significant in girls when the sample is split by sex
(p<0.05). Percentile distribution by age and sex for the whole sample is shown in Table
16. 25(OH)D sufficiency (>75 nmol/l) is reached at lower percentiles with increasing
age. That means that at increasing ages there are fewer subjects with insufficient
25(OH)D levels. Regarding deficiency, the 5th percentile of 25(OH)D in both males and
females, is close to the level of <27.5 nmol/l for all ages.
Figure 8 shows smoothed centile curves (P5, P25, P50, P75, P95) for 25(OH)D levels
studied by age and sex. Concentrations were similar in boys and girls, although in boys,
first a decrease and after the age of 14 an increase is observed. In girls, the curves seem
to indicate that the decrease comes before the age of 13, because at age 13 a slightly
progressive increase with age with a similar slope to that of the boys was observed. In
both boys and girls, the trend to higher 25(OH)D levels is seen for those at P75 and P95,
whereas at the other lower levels there is a trend to stability.
When analysing the data according to BMI, a non-significant and progressive decrease
of 25(OH)D concentrations with increasing BMI is observed, the lowest levels being
observed in obese adolescents (equivalent to BMI>30) (Table 17). The highest mean
levels were for boys in the underweight group and for girls in the optimal weight group
(66.6+28.9 and 61.1+23.5, respectively). Most of the adolescents had optimal weight
status (BMI 20-25)

European PhD Thesis
63
Table 18 shows 25(OH)D levels by study centre, for the whole group split by sex. The
highest levels were obtained in Rome, Athens, Vienna and Zaragoza, and the lowest
levels were found in Dortmund, Heraklion and Ghent for the whole group, where the
sampling procedure went on for most of the academic year. In none of the cities were
mean levels above the proposed cut-off of 75 nmol/l. Girls had higher mean levels in all
cities except for Athens, Pecs and Lille. Deficient levels (< 50 nmol/l) were highest in
Dortmund (62.9% of the population) and Ghent (53.3%), and lowest in Athens (25.7%)
and Rome (26.4%) (data not shown).
4.3.5 Discussion
Since the publication of the results of the SENECA study [205], where unexpectedly
only 3.5% of the analysed European elderly presented optimum 25(OH)D levels (> 60
nmol/l), public health authorities are concerned about the wide spread 25(OH)D
deficiency in the European population. To the best of our knowledge, the data obtained
in the framework of the HELENA study are the first to aim at establishing descriptive
25(OH)D status in adolescents at a European level. According to the IOM report 2011,
vitamin D intake for bone health should correspond to a serum 25(OH)D level of at
least 20 ng/ml (50 nmol/l)[181]. Our results showed that almost 40% of the subjects had
deficient levels lower than 50 nmol/l, 15% with levels below 27.5 nmol/l. None of the
subjects had levels under 10 nmol/l, which according to the literature elevates the risk
for osteomalacia and rickets [22, 35, 44]. The HELENA percentile distribution is in
agreement with data coming from other studies [85, 96, 131, 204, 220]. When analysing
the percentile distribution of 25(OH)D we observed that the 5th percentile of 25(OH)D
in both males and females, stratified by age, is close to the level of <27.5 nmol/l for all
ages. A general hypovitaminosis problem in adolescence varying from 13% to 72% has
already been postulated in studies performed in several European countries [85, 96, 131,
204], the USA and Canada [54, 182, 215, 220]. In a recent study published by Dong et
al. [54], the overall prevalence of vitamin D insufficiency and deficiency in US children
and adolescents was 56.4% and 28.8%, respectively. All together, the high levels of
vitamin D deficiency found in the present and other studies should be treated with
caution. Regarding our percentile distribution, the median value of a 25(OH)D
concentration in our European adolescents is close to 60 nmol/l, much lower than the
optimal levels proposed of 75 nmol/l. Following Lanham-New et al[126], any
discussion of an 'optimal' serum 25(OH)D concentration needs to define 'optimal' with
Valtueña J, 2012
64
care since it is important to consider the normal distribution of requirements and the
vitamin D needs for a wide range of outcomes. In addition, in the Rank Forum on
Vitamin D it was also discussed some uncertainty about the strength of evidence for the
need to aim for substantially higher concentrations (25(OH)D concentrations>75
nmol/l) [126].
Analysing vitamin D status by age, we have observed a steady increase in 25(OH)D
concentrations with increasing age but which is only significant in girls. This is not in
line with other published data. Koenig and Elmadfa [118] found a decrease in 25(OH)D
serum concentrations in Austrian adolescents up to 14 years of age and a slow increase
between the ages of 15 to 19. Similar findings were observed by Gregory et al [84], with
a significant reduction in 25(OH)D serum concentrations according to increasing age in
adolescence. Dong et al [54]concluded in their study that plasma 25(OH)D levels were
not associated with age (P=0.460). On the contrary, Bonofiglio et al. [28] found higher
25(OH)D serum concentrations in postmenarcheal girls when compared with
premenarcheal girls. These higher concentrations were explained as an increase in the
binding protein of vitamin D due to higher oestrogen levels caused by menarche. This
could also be the explanation for the differences observed in the centile curves in Figure
8, as Tanner stages differ and girls are on average 2 years in advance within the
maturation process. In the US study by Yetley et al [220] deficiency percentage also
increased with increasing age (1% for infants and children aged <11 years, 5% for
adolescents aged 12–19 y, and 6% for adults aged <20 years).
Several reports have observed a relationship between BMI and vitamin D
concentrations [194]. An inverse, but not significant, relationship between 25(OH)D
and BMI was found in the HELENA sample (Table 17). In the literature there are
discrepancies regarding this issue. While several studies reported a significant and
inverse relationship [54, 133, 193], others did not find any associations of BMI and/or
fat mass with 25- hydroxyvitamin D levels in the paediatric population [111, 214]. This
may be attributed, in part, to BMI-based categorization of obesity and the variations
associated with growth and development. There are also studies reporting that obesity is
associated with decreased bioavailability of dietary and cutaneously synthesised vitamin
D. This may be secondary to the sequestration of vitamin D into a larger pool of adipose
tissue [103].

European PhD Thesis
65
As we have reviewed recently [204], both geographical and seasonal differences can be
appreciated throughout Europe when analysing independent studies. Due to the complex
methodology and the multiple objectives of the HELENA study, no specific calendar
for vitamin D sampling could be established, which would have contributed to getting a
more in-depth appreciation of these aspects. Although not assessed in the study, dietary
vitamin D intake and personal UV exposure habits may partly explain geographical
differences in vitamin D status. Nevertheless, our data go in the same direction as those
published by others countries [85, 96, 131, 204], as the highest concentrations were
observed in Rome, Athens and Zaragoza, and the lowest concentrations in Dortmund,
Gent and Lille (Table 18). The low mean concentrations observed in Heraklion could be
due to seasonal influences. Because of local logistics, blood sampling in Heraklion was
performed only in February and March, two winter months, while in the other centres,
with the exception of Athens, blood sampling was distributed throughout the school
year (see Annex). The low concentrations obtained in Heraklion could indicate a risk
during the winter months even in the Mediterranean countries. This is in accordance
with some researchers who have already emphasized the need to supplement vitamin D
due to the low 25(OH)D concentrations [170, 191], especially during winter months.
The high mean concentrations observed in Vienna need further analysis which is out of
the scope of this article. All in all, the detected geographical differences make it difficult
to give common recommendations to improve vitamin D status in adolescents at the
European level.
Increasing mean 25(OH)D blood levels up to 40 ng/mL would have a positive impact on
reducing the direct and indirect economic burden of disease [81].
Apart from the above-mentioned limitation, the HELENA study has several strengths.
The sampling procedure and the strict standardisation of the field work among the
countries involved in the study avoided to a great extent the kind of confounding bias
due to inconsistent protocols and different laboratory methods which makes comparing
results from isolated studies difficult. The main contribution of the present data is, for
the first time, to give a global overview of adolescent vitamin D status in Europe. In the
absence of reference values and specific cut-off points for this age group, percentile
distribution as presented can be used in clinics and further research. It is important to
remember that current blood concentrations of vitamins in the adolescent population do
not necessary mean that these concentrations are the most adequate ones from the

Valtueña J, 2012
66
biological point of view. For a future study, serum parathyroid hormone (PTH)
concentrations should be included as in children and adolescents, the relationship
between serum 25(OH)D and PTH is less clear [95]. Due to the complex and enormous
amount of variables analysed in the HELENA project, PTH could not be assessed.
Considering the cut-offs used, deficiencies have been observed. Apart from an
insufficiency, this could indicate that vitamin D concentrations in adolescents may be
different from those of adults, making it necessary to establish general cut-offs for this
micronutrient concentration in blood for the adolescence period.
In conclusion, our data give descriptive information about vitamin D status in European
adolescents. Age, gender and weight status seem to have an influence on blood
concentrations and should be taken into account. Our results, with the limitations
described above, indicate that vitamin D deficiency is a highly prevalent condition in
European adolescents and needs to be addressed by public health authorities.

European PhD Thesis
67
Table 15: Descriptive Characteristics of Participants.
Data are shown as mean and SD, unless otherwise indicated.
Table 16: 25(OH)D concentrations by age and gender in European adolescents (nmol/l).
N Mean SD P2.5 P5 P10 P25 P50 P75 P90 P95 P97.5 Total
(n=1006) 1006 58.8 23.1 20.9 24.9 31.6 43.5 57.0 71.3 87.8 99.1 112.9
Males (n= 470)
470 57.4 22.7 21.6 24.3 32 42.6 56.0 69.1 86.7 96.4 107.4
Age 13 124 56.9 22.8 24.2 27.0 32.5 41.8 55.8 66.6 78.3 101.5 132.0
Age 14 124 55.6 20.6 22.5 24.9 31.7 42.3 53.5 65.9 81.9 91.2 96.4
Age 15 122 58.3 21.3 20.7 24.4 33.6 44.8 56.2 71.3 89.0 94.9 102.0
Age 16 99 59.3 26.5 20.4 22.6 24.9 43.0 59.6 70.8 92.3 107.6 121.9
Females (n=536)
536 60.0 23.4 20.9 25.5 31.0 44.8 57.9 74.3 88.7 103.0 115.9
Age 13 133 52.1* 19.2 17.0 20.9 25.6 40.6 50.8 64.0 78.0 85.8 96.8 Age 14 140 62.5* 22.3 20.9 27.8 33.6 49.1 62.0 77.9 90.2 99.2 111.3 Age 15 143 59.6* 20.8 21.3 26.0 36.2 46.6 56.8 71.5 90.2 97.2 106.0
Age 16 120 66.2* 28.9 25.6 26.9 27.4 46.4 61.8 80.3 109.3 120.8 133.5
*significant differences; p<0.05 between 13y group and the ages of 14,15,16.
- Four age groups: 13 y: Age between 12.5-13.99 y 14 y: Age between 14-14.99 y 15 y: Age between 15-15.99 y 16 y: Age between 16-17.49 y
ALL=1006 MALE=470 FEMALE=536 Mean SD Mean SD Mean SD Age (years) 14.9 1.2 14.9 1.2 14.9 1.2 Sexual maturation: Tanner Stages I/II/III/IV/V (%)
0/5/19/44/37 2/6/19/42/31 0/4/19/45/32
Height (cm) 165.8 9.3 170.2 9.7 161.9 7.0 Weight (kg) 59.0 12.3 62.1 13.7 56.2 10.2 BMI (kg/m2) 21.4 3.6 21.3 3.8 21.4 3.4 25(OH)D (nmol/L) 58.8 23.1 57.4 22.7 60.0 23.4

Valtueña J, 2012
68
Table 17: 25(OH)D concentrations by BMI (kg/m2) in European adolescents (nmol/l).
BMI (kg/m2) N Mean DS Minimum Maximum
Low 58 61.1 26.9 13.7 140.0 Optimal 728 59.3 23.7 12.1 174.0 Overweight 167 56.9 20.3 11.4 120.8
All=1006
Obese 52 55.3 18.4 23.8 111.3
Low 26 66.6 28.9 20.7 138.1 Optimal 331 57.1 23.7 12.2 174.0 Overweight 82 57.0 17.1 21.3 97.9
Males=470
Obese 31 54.8 16.4 26.4 101.5
Low 32 56.8 24.9 13.8 140.0 Optimal 397 61.1 23.5 12.1 160.8 Overweight 86 56.8 23.0 11.4 120.8 Obese 21 56.1 21.4 23.8 111.3
Females=536
Ns differences BMI category calculated using polynomial from T. Cole[41, 42]. Four BMI groups: 1. Low [<18.5 in adults] 2. Optimal [18.5 - 25 in adults] 3. Overweight [25-30 in adults] 4. Obese [>30 in adults]
Table 18: Mean 25(OH)D concentrations (nmol/L) in the HELENA cities.
All male female
Mean ±SD
Mean SD Min Max Mean SD Min Max
Roma in Italy
70.0±19.3 67.7 17.5 37.2 116.3 71.8 20.5 25.6 111.3
Athens in Greece
68.2±20.8 70.4 21.2 28.1 137.8 66.5 20.5 21.2 123.9
Vienna in Austria
63.7±31.7 58.2 31.0 15.1 173.9 67.2 31.9 17.6 137.3
Zaragoza in Spain
62.9±19.2 62.9 22.2 24.4 149.8 62.9 16.4 34.3 93.9
Stockholm in Sweden
58.7±23.1 52.4 20.1 21.2 131.9 64.6 24.3 12.1 140.0
Pecs in Hungary 57.8±20.0 60.9 22.6 24.2 138.0 55.6 17.8 25.5 119.8
Lille in France 54.9±24.5 60.2 27.1 12.4 139.6 51.1 21.9 11.4 90.2
Gent in Belgium
52.3±22.8 49.9 22.6 12.2 103.2 54.7 22.9 15.2 105.9
Heraklion in Crete
51.3±13.4 51.9 12.4 25.1 88.4 50.7 14.4 14.4 84.3
Dortmund in Germany
49.3±21.8 48.1 17.7 21.6 98.1 51.0 27.1 13.2 160.7

European PhD Thesis
69
Figure 7: 25(OH)D status classification
Figure 8: Smoothed (LMS method) centile curves (from the bottom to the top: P5, P25, P50, P75, P95) of 25(OH)D plasma concentrations (nmol/L) in males and females.

Valtueña J, 2012
70
Annex. Blood sampling calendar: number of subjects (age range) per city, during the sampling period
Month City
Oct/06 Nov/06 Dec/06 Jan/07 Feb/07 Mar/07 Apr/07 May/ 07 Jun/07 Oct/07
Athens 88 (12.6-16.9 y)
37 (13.1-15.4 y)
Crete 23 (13.1-14.5 y)
69 (12.6-15.9 y)
Dortmund 57 (12.5-17.3
y)
30 (12.8-16.8 y)
32 (14.2-16.7 y)
Gent 29 (14.8-16.1
y)
16 (13.9-14.9 y)
20 (13.3-15.9 y)
13 (16.4-17.4 y)
15 (15.3-16.2 y)
22 (14.4-16.5 y)
Lille 25 (12.5-13.4 y)
19 (13.2-14.6 y)
15 (14.3-15.1 y)
35 (12.9-15.9 y)
Pecs 3 (14.8-16.8 y)
56 (12.6-17.3 y)
Rome 17 (12.6-16.6 y)
14 (16.1-17.3 y)
45 (14.3-17.1 y)
9 (14.3-17.4 y)
19 (13.7-17.1 y)
Stockholm 18 (16.4-16.9 y)
40 (14.0-16.7
y)
38 (13.2-14.1 y)
33 (12.6-13.3 y)
Vienna 41 (13.7-17.3 y)
20 (14.2-16.9 y)
16 (15.8-17.0 y)
43 (14.7-17.0 y)
Zaragoza 19 (12.5-14.6 y)
15 (14.9-17.1 y)
38 (13.9-15.8 y)
37 (13.4-15.2 y)
15 (12.6-16.4 y)

European PhD Thesis
71
4.4 CHAPTER 4: DETERMINANTS OF VITAMIN D STATUS IN EUROPEAN
ADOLESCENTS.
4.4.1 Abstract
Low 25-hydroxyvitamin D concentrations in adolescents have been identified in
Europe, and could have negative consequences on future health. Therefore, it seems
necessary to analyse several influencing factors more in depth. Such thorough analyses
will also help optimizing vitamin D status across Europe. The objective was to identify
the main determinants of vitamin D status in European adolescents, considering latitude,
season, body composition, genetics, diet, socioeconomic status, physical activity and
physical fitness. From a subsample of 1006 adolescents (470 males; 46.8%) of the
HELENA Cross Sectional Study with an age range of 12.5 to 17.49 years, fasting blood
samples were taken and analysed for vitamin D status. Anthropometric measures,
genetics and biomarkers, socioeconomic status, dietary intake, physical activity and
fitness were also assessed. The highest influence on the variability of 25(OH)D
concentrations comes from season, latitude and supplementation (all p<0.01). Muscular
strength, age and calcium intake also showed significantly influence on 25(OH)D
concentrations for the whole sample (p<0.05). Cardiorespiratory fitness is close to
significance (p=0.070). Highest 25(OH)D levels were obtained in autumn (66.3+25.0
nmol/l), followed by spring (63.9+25.0 nmol/l), and both presented significant
differences with winter levels (46.9+18.0 nmol/l) (all p<0.001). Season, latitude, age,
fitness, calcium intake and supplementation were highly related to 25(OH)D
concentrations found in European adolescents.

Valtueña J, 2012
72
4.4.2 Introduction
Low 25-hydroxyvitamin D [25(OH)D] concentrations in adolescents have been
identified in Europe, with the possible negative consequences for their future health [76,
77, 131, 160, 187]. In a previous report of the HELENA study, 80 % of the adolescents
have been found to be at insufficiency states, by examining hypovitaminosis D (<75
nmol/L) according to the current recommendations [68, 76, 102]. The complexity of
vitamin D metabolism makes it difficult to identify causes of vitamin D insufficiency
that may be due to various determinants not yet clearly understood during adolescence.
Vitamin D status is largely determined by environmental factors [10] such as diet,
physical activity (PA), physical fitness, geographical location, seasonality or
socioeconomic status [107]. Genetics, body composition [107] and age could also play
an important role [10]. In addition, adolescents are considered a risk group according to
the increased needs in nutrients and energy intake to assure an adequate growth and
development [147, 172].
It is known that apart from the diet, casual exposure to sunlight is thought to provide
most of the vitamin D requirements of the human population. Due to the geographical
situation of our continent, located at high latitude, the skin synthesis of vitamin D may
not compensate a low nutritional intake [160], what could be responsible for some
vitamin D status differences between northern and southern Europe. There is also
scientific evidence demonstrating the considerable contrast in skin production of
vitamin D between sites of different latitude and that low vitamin D status is more likely
to develop in locations where solar U.V. levels are low most of the year [117].
Due to sun exposure, seasonality and the time spent in outdoor activities, physical
activity or physical fitness have also to be considered when analyzing determinants of
vitamin D status during adolescence. According to the literature, seasonality shows an
important influence on vitamin D status [44, 85, 204], but inconsistent relationships
have been found between physical activity levels and vitamin D concentrations [16,
186], with only few studies considering adolescents [54]. The association of
cardiorespiratory and muscular physical fitness with 25(OH)D levels, especially
muscular strength, also remains to be addressed for adolescents. Obesity, expressed as
excess body fat, has an adverse effect on vitamin D status but this is stated mostly in

European PhD Thesis
73
adults [15, 162, 218]. Moreover, obese individuals only synthesize half the amount of
vitamin D produced by nonobese individuals in response to sun exposure [176]. Despite
of these evidences it is not clearly known whether this relationship applies to growing
children and adolescents, and how low 25(OH)D concentrations are associated with
body composition. In the same way, socioeconomic factors seem to influence
adolescents’ behaviour patterns and should be included regarding vitamin D status [50].
Due to the previously mentioned high prevalence of low 25(OH)D concentrations in
European adolescents, it seems necessary to go deeper into this vitamin and its related
factors that are not further and completely analyzed in our continent. The present paper
aims to determine possible environmental, personal and genetic factors that influence
and could explain the variation of 25(OH)D concentrations in European adolescents in
order to contribute to optimizing vitamin D status across our continent.
4.4.3 Subjects and Methods
A description of the study design and implementation is given in the general
methodology.
Statistical analysis
All the variables showed a normal distribution and the residuals showed a satisfactory
pattern. Descriptive values are shown as mean + standard deviation, unless otherwise
stated. Independent samples T-test was used to analyze differences of 25(OH)D
concentrations between genders. Pearson´s correlation coefficients were computed
between 25(OH)D concentrations and determinant variables. The differences for all the
variables according to vitamin D status were analysed using one-way ANOVA.
General lineal model (GLM) was conducted to examine the independent associations on
25(OH)D concentrations of gender, age, Tanner stage, season, latitude, BMI z-score, fat
mass, FFM, FMI, FFMI, genetics, calcium intake, vitamin D intake, PA, fitness test and
socioeconomic status. Four ANCOVA models, by grouping variables firstly to avoid
interference among variables, were performed to quantify the effects of the variables on
25(OH)D concentrations by steps. Each model was created introducing cluster
variables; (1) latitude, season, age, BMI z-score and Tanner stage; (2) genetics, calcium
intake, vitamin D intake, supplement intake (3); percentage fat mass, fat free mass, FMI,
FFMI; (4) PA, physical fitness tests and socioeconomic status. Only those variables for

Valtueña J, 2012
74
each model which presented association with vitamin D status were introduced in the
final model (table 21). Two additional models were computed when splitting the sample
by gender. The differences in 25(OH)D concentrations according to season and also to
centre were shown as mean and SD in the figures.
All the data have been analysed using SPSS version 18.0. (SPSS, v. 18.0 for
WINDOWS; SPSS Inc., Chicago, IL, USA). Statistical significance was set at p<0.05.
4.4.4 Results
Table 19 is showing descriptive characteristics of the sample comparing between four
25(OH)D concentrations groups. Significant differences have been observed between
sufficient and insufficient vitamin D groups for FFM index (p<0.05), agility test with
4x10sr (p<0.05) and socioeconomic status (p<0.01). When splitted by gender, new
differences appeared in males for body fat mass (p<0.05), FM index (p<0.05), standing
broad jump and cardiorrespiratory fitness (both p<0.01). While in females, age
(p<0.01), height (p<0.001), FFM (p<0.05), handgrip strength (p<0.001) and flexibility
(p<0.05) showed significance by 25(OH)D groups.
Pearson´s correlation coefficients for the variables involved in this study are shown in
table 20. Only age (r=0.102, p<0.01), cardiorrespiratory fitness (r=0.075, p<0.05) and
flexibility (r=0.069, p<0.05) are significantly correlated with 25(OH)D concentrations.
Table 21 shows results from the ANCOVA final model for the whole sample. It shows
that the highest influence on the variability of 25(OH)D concentrations comes from
season, latitude and supplementation (all p<0.01). Muscular strength, age and calcium
intake also showed significant influence on 25(OH)D concentrations for the whole
sample (p<0.05). Cardiorespiratory fitness is near to significance (p=0.070). Significant
results also appeared for BMI but only in males when splitting the sample by gender.
Figure 9 shows the differences in 25(OH)D concentrations according to season. Highest
concentrations were obtained in autumn (66.3+25.0 nmol/l), followed by spring
(63.9+25.0 nmol/l), and both presented significant differences with winter
concentrations (46.9+18.0 nmol/l) (all p<0.001).
Figure 10 shows the differences in 25(OH)D concentrations according to centre
(latitude). Highest concentrations were obtained in southern cities of Europe as Rome

European PhD Thesis
75
(70.0+20.0 nmol/l), Athens (68.2+20.7 nmol/l), Zaragoza (62.9+19.2 nmol/l) and also
Vienna (63.7+31.7 nmol/l). These centres presented significant differences with the
lowest levels found in Dortmund (49.3+21.8 nmol/l ), Heraklion (51.3+13.4 nmol/l) and
Ghent (52.3+22.8 nmol/l) (p<0.01). In none of the cities mean levels were above the
proposed cut-off for sufficiency of 75 nmol/l.
4.4.5 Discussion
In the last few years, vitamin D is recognized to have an important role for health that
goes beyond bone metabolism [101, 164]. In Europe, not many existing studies have
comparable data about vitamin D status in adolescents. Once high prevalence rates of
insufficiency have been found in the previous report of the HELENA study [76], with
almost 80% of the adolescents at this state, it was found necessary to identify possible
related factors influencing the variation of 25(OH)D concentration that are not deeply
and completely analyzed in our continent. To the best of our knowledge, the present
study is the first aiming to investigate a large amount of determinants that could be
related to low vitamin D status in European adolescents.
The results from the present study show that season, latitude, age, muscular strength,
calcium intake and supplementation are most explaining the variance of 25(OH)D
concentrations in adolescents. Cardiorespiratory fitness is also related to vitamin D
status but in a minor way. No significant contributions on vitamin D status appeared for
gender, Tanner stage, BMI, FFMI, FMI, vitamin D intake, genetics or PA when
analysing the sample as a whole, but BMI shows significant results in males when
splitting the sample by gender (data not shown). Our results are in agreement with other
studies; Dong et al [54] also found low vitamin D status in the EEUU, being related to
various lifestyle factors with no contributions by gender, maturation stage nor height. In
their study physical activity and cardiovascular fitness were also positively correlated
with 25(OH)D concentrations. Bener et al. [18] concluded that apart from diet, the lack
of exposure to sunlight, outdoor activities under the sun and physical activity are the
main associated factors for vitamin D deficiency in the young population of Qatar.
Arguelles et al [10] in China, showed by means of a multivariate model that included
gender, age, season and physical activity with vitamin D status that male gender,
summer season, and high physical activity significantly increased 25(OH)D
concentrations. In a recent study of Absoud et al [2], they found that season, physical

Valtueña J, 2012
76
exercise, and obesity influenced vitamin D status, with no effect of gender on vitamin D
status.
Regarding our results more in detail, both geographical and seasonal differences
explained most of the variance of the 25(OH)D concentrations, confirming the results
published from independent studies throughout Europe [96, 131, 160, 204]. It is known
that apart from diet, casual exposure to sunlight is thought to provide most of the
vitamin D requirements of the the human population [160]. Due to the geographical
situation of our continent, and specifically of northern countries, there is no UV
radiation of the appropriate wavelength, especially during winter time [127]. Skin
synthesis of vitamin D may not compensate a low nutritional intake, creating possibly
some vitamin D status differences between the north and the south. In our study, highest
levels were obtained in southern cities of Europe, excluding Heraklion, as Rome,
Athens, Zaragoza (but also in Vienna). Lowest levels were obtained in higher latitudes
as Dortmund or Ghent, in agreement with other studies [96, 131, 160]. Low mean
concentrations have been also observed in Heraklion and could be due to seasonal
influences. Because of local logistics, blood sampling in Heraklion was performed only
in February and March, two winter months, while in the other centres, with the
exception of Athens, blood sampling was distributed throughout the school year.
Regarding to seasonality, highest values of 25(OH)D concentrations were obtained in
Autumn, after the summer’s sunny days. Also spring presents increasing 25(OH)D
concentrations. On the contrary, winter was the season that showed significantly lower
25(OH)D concentrations when comparing with the other seasons. These findings are in
line with the literature, where seasonality was already shown to be an important factor
influencing vitamin D status [44, 85, 204], with higher concentrations found in the
sunny months [84, 86, 131]. Nevertheless, the comparison between studies in Europe is
difficult because of the lack of standardization between sampling and methods [204].
Body composition has been also investigated to have an effect on vitamin D status but
stated mostly in adults [15, 72, 77, 162, 179, 218]. Current research has observed an
inverse relation between vitamin D and BMI [5, 133, 193]. This reduction in 25(OH)D
concentrations with increasing BMI is assumed to be due to enhanced sequestration of
vitamin D in fat [134]. In the study carried out by Dong et al [54] it was concluded that
vitamin D status was also influenced by adiposity. Other researches did not find any
European PhD Thesis
77
associations of BMI and/or fat mass with 25(OH)D concentrations in paediatric
populations [111, 214]. In agreement, our results of the influence of BMI z-score on
25(OH)D concentrations are not significant, although a progressive decrease of
25(OH)D concentrations with increasing BMI was observed. However, significant
results have been found in males when splitting the sample by gender (data not shown).
The contradictions found in the literature indicated that these is a need of a deeper
investigation on the relationship between body composition and 25(OH)D
concentrations.
Significant contribution of age but no contribution of Tanner stage on 25(OH)D
concentrations has been observed in our study, in agreement with others [18, 28, 54]. In
our previous HELENA study a tendency of increasing 25(OH)D concentrations with
increasing age for the whole group was observed, but remaining only significant in girls
when splitting the sample by gender [75]. Other studies revealed significant decrease in
concentrations of 25(OH)D levels with increasing age in both genders (p <0.05) [84,
118, 204], although in British children aged 15 and above some slight increases were
observed [84]. Bonofiglio et al. found significantly higher 25(OH)D concentration in
Italian girls at higher maturation status (p<0.01), possibly attributed to the higher
concentrations of vitamin D-binding protein caused by the increase of estrogens levels
[28].
To the best our knowledge, this is the first study to examine the genetic influence, with
polymorphism (rs1544410), on 25(OH)D concentrations among European adolescents.
Our results did not show a significant polymorphism contribution on vitamin D levels in
European adolescents. Previous European studies in adults have estimated around 30-
45% heritability in vitamin D level [108, 192]. These studies demonstrate that, in adults,
vitamin D nutrient levels are fractionally under some genetic control. Non- European
studies have found a genetic influence on vitamin D in adolescents. One study among
Chinese adolescents concluded that there was a strong genetic influence on 25(OH)D
concentrations in males only [10].
Non-communicable factors as diet, PA, physical fitness or socioeconomic status should
be taken into account regarding vitamin D status in adolescents. Our study shows that
physical fitness, mainly for muscular strength, highly contributed to explain 25(OH)D
variability, in agreement with other studies [69, 105, 210]. Nevertheless, PA did not

Valtueña J, 2012
78
show a significant relationship with 25(OH)D concentrations. The observation of many
studies performed in children provides compelling evidence that vitamin D is indeed,
together with testosterone, the other steroid hormone that is important for muscle
function and strength [23, 57, 105]. At the same time, we found that cardiovascular
fitness and flexibility showed the highest correlation with 25(OH)D concentrations.
Dong et al [54], also reported significant positive associations between 25(OH)D
concentrations and cardiovascular physical fitness in American adolescents. The
majority of the studies only assess PA but not physical fitness and no study has been
found analyzing European adolescents. Bener et al [18], in Qatar, stated that most of
the vitamin D-deficient children had no physical activity (60.6%) and no exposure to
sunlight (57.5%). In America, Lenders et al. [133] found direct correlations between
25(OH)D concentrations and physical activity levels (P<0.05). This relationship should
be deeper investigated in Europe.
Socioeconomic status could be another factor playing a role in vitamin D status
interactions and has been included in our study. Our results showed a non-significant
relationship between socioeconomic status and 25(OH)D concentrations. Data are
missing in other studies. Regarding to diet, calcium intake has a significant contribution
on vitamin D status. Higher levels are obtained for the sufficiency 25(OH)D
concentrations group. According to the literature, abnormal calcium metabolism has
been associated with weight gain [221], and a high calcium intake is believed to prevent
obesity, linked at the same time with vitamin D deficiency [91]. Regarding vitamin D
intake, controversial results have been found. Our study showed that vitamin D intake is
not a significant contributor to vitamin D status. In agreement, recently, Absoud et al [2]
concluded that dietary vitamin D intake had no effect on vitamin D status. But on the
contrary, Bener et al [18] stated that vitamin D intake is one of the main associated
factors for vitamin D deficiency in the young population of Qatar. The low
concentrations obtained in some countries including Heraklion, could indicate a
25(OH)D deficient risk during the winter months even in the Mediterranean countries.
Supplementation should be then reconsidered. In our study, supplementation appeared
as a strong determinant of vitamin D status. Supporting our positive results, Guillemant
et al [85, 131] and Lehtonen-Veromaa et al [85, 131] observed a significant effect of
supplementation on 25(OH)D serum levels (p=0.000) in French and Finnish children
[85, 131]. This is in agreement with some researchers who have already emphasized the

European PhD Thesis
79
need to supplement vitamin D due to the low 25(OH)D concentrations, especially
during winter months [191, 202] but till now the data about the influence of vitamin D
supplementation or fortified foods in children and adolescents is scarce [202].
The HELENA study has several strengths. The sampling procedure and the strict
standardization of the field work among the countries involved in the study avoided to a
great extent the kind of confounding bias due to inconsistent protocols and different
laboratory methods which makes comparing results from isolated studies difficult. The
main contribution of the present data is, for the first time, to give a global overview of
which variables could determine the variation of vitamin D status in adolescents in
Europe due to the lower levels previously found in our population [76]. The majority of
the studies only assess PA but not fitness in relation to vitamin D, and it is an additional
strength point of our work. Our study presents also some limitations. Dietary intake
data for Heraklion and Pecs were not available and makes it difficult to know exactly
the causes for the low 25(OH)D concentrations found in these centers.
In conclusion, season, latitude, physical fitness, age, calcium intake and
supplementation seem to influence the 25(OH)D concentrations in European
adolescents. Due to controversial results found among some determinants as body
composition, genetics or dietary intake, further studies should be required in analysing
deeper those influences. In the absence of reference values and specific cut-off points
for this age group, determinant parameters which influence vitamin D concentrations
should be also taken into account for further research.

Valtueña J, 2012
80

European PhD Thesis
81
Table 19: Characteristics of the total study sample stratified by 25(OH)D concentrations (nmol/l).
All n=1006 25(OH)D
(<27,5 nmol/L) n=79
25(OH)D (<50 nmol/L)
n=299
25(OH)D (50-74,9 nmol/L)
n=422
25(OH)D (>75 nmol/l)
n=206 Mean SD Mean SD Mean SD Mean SD Mean SD
P-value
Age(yr) 14.7 1.1 14.8 1.2 14.5 1.1 14.6 1.1 14.9 1.1 NS
Tanner stage (I,II,III,IV,V)%
1/5/19/44/31 3/2/13/58/24 0/6/20/43/31 1/5/20/45/29 1/4/18/39/38 NS
Body composition
Height (cm) 165.4 9.3 164.0 10.0 165.3 9.6 165.7 9.0 165.5 9.3 NS
BMI z-score 0.5 1.1 0.4 1.0 0.5 1.2 0.5 1.1 0.3 1.0 NS
Body fat % 23.5 9.4 23.2 9.3 23.1 9.6 24.1 9.4 23.1 9.0 NS
FFM (kg) 44.1 8.0 43.2 7.8 44.3 8.5 44.3 7.9 43.9 7.8 NS
FM index(kg/m2) 5.3 3.0 5.1 2.9 5.2 3.1 5.5 3.1 5.0 2.6 NS
FFM index(kg/m2) 16.8 1.8 16.7 1.7 16.9 1.9 16.9 1.8 16.5 1.5 <0,05
Biochemical markers
25(OH)D (nmol/L) 58.3 22.7 22.0 4.6 41.3 5.9 61.4 6.9 92.3 17.4 <0,001
Genetic markers
SNP on rs1544410 polymorphism (11,12,22)% 16/48/36 14/54/32 15/51/34 16/47/37 18/44/38
NS
Dietary intake
Calcium intake (mg/d ) 855.7 515.7 806.0 532.9 845.0 461.1 868.5 494.5 864.2 592.6 NS
Vitamin D intake(µg/d) 2.1 1.0 2.1 0.9 2.0 0.8 2.1 1.0 2.2 1.2 NS
Supplements (yes/no)% 11/89 5/95 9/91 13/87 13/87 <0.05
Activity
PA (min) 59.2 24.5 58.3 23.6 59.4 26.8 60.4 24.2 56.9 22.0 NS
Physical fitness tests
Hand grip strength (kg) 30.2 8.7 29.9 9.9 30.2 8.9 30.5 8.3 29.9 8.7 NS
SBJump (cm) 161.8 34.5 160.8 38.2 160.9 35.2 161.6 32.1 163.7 37.2 NS
20m sr (stage) 4.8 2.8 4.9 3.0 4.6 2.7 4.8 2.7 5.1 2.9 NS
4*10 sr (secs) 12.2 1.3 12.4 1.6 12.2 1.3 12.2 1.2 12.2 1.3 <0,05
Flexibility (cm) 22.4 8.1 21.3 7.7 21.7 7.6 22.9 8.3 22.7 8.4 NS
Socioeconomic status
FAS Scale 4.5 1.8 4.3 1.9 4.3 1.9 4.4 1.8 4.9 1.8 <0.01
Normally distributed variables are showed as mean ± SD (ANOVA). *significant at level set at p<0.05. Four 25(OH)D groups by concentrations:
- 25(OH)D severe deficiency (<27.5 nmol/L) - 25(OH)D deficiency (<50 nmol/L) - 25(OH)D insufficiency (50-74.9 nmol/L) - 25(OH)D (>75 nmol/l)
BMI: Body mass index (kg/m2);FFM: Fat free mass (Kg); Fat mass index (kg/m2); FFM index: Fat free mass index(kg/m2);PA: physical activity unless at moderate intensity (min); 20m sr (secs):cardiorrespiratory fitness. SBJump: Standing broad jump (cm).4x10 sr:4*10 meter Shuttle run (s).FAS: Family Affluence Scale Genetics: SNP on chromosone 7-1; 1= wild type allele/ 2= mutant type allele

Valtueña J, 2012
82
Table 20: Pearson coefficient correlations between the 25(OH)D concentration and body composition, dietary intake, muscular strength, cardiovascular fitness and socioeconomic status.
25(OH)D concentrations (nmol/l)
Age(yr) 0.102**
Body composition
Height (cm) 0.035
BMI z-score -0.048
Body fat % -0.007
FFM (kg) 0.009
FM index(kg/m2) -0-019
FFM index(kg/m2) -0-058
Dietary intake
Calcium intake ( mg/d ) -0.020
Vitamin D intake ( µg/d ) 0.019
Activity
Sleep (h) -0.054
Inactive (min) 0.021
PA (min) -0.002
Physical fitness tests
Handgrip strength (kg) -0.007
SBJump (cm) 0.034
20m sr (stage) 0.075*
4*10 sr (secs) -0.043
Flexibility (cm) 0.069*
Socioeconomic status
FAS Scale 0.065
** Correlation is significant at the 0.01 level (2-tailed). * Correlation is significant at the 0.05 level (2-tailed).
BMI: Body mass index (kg/m2);FFM: Fat free mass (Kg);FM index: Fat mass index (kg/m2); FFM index: Fat free mass index (kg/m2); PA: physical activity unless at moderate intensity (min); 20m sr (secs):cardiorrespiratory fitness. SBJump: Standing broad jump (cm).4x10 sr:4*10 meter Shuttle run (s. FAS: Family Affluence Scale

European PhD Thesis
83
Table 21: Results of the final ANCOVA model to assess the contribution of determinants on 25(OH)D concentrations as dependent variable.
F-factor p-value
Seasonality Latitude (º)
26.19 5.20
<0.001* <0.001*
Age (yr) 4.28 0.039*
Handgrip strength (kg) 5.56 0.019*
20msr (stage) 3.30 0.070
Calcium intake (mg/d) 3.96 0.047*
Supplements intake 7.52 0.006*
R2 = 0.266 (Adjusted R2 = 0.239) *Significant at level set at p<0.05 20msr (stage): 20 meters shuttle run (Cardiorespiratory fitness).

Valtueña J, 2012
84
Figure 9: Mean 25(OH)D concentrations (nmol/L) by seasons during the academic year (autumn, winter and spring).
Winter Spring Autumm
Season
45
50
55
60
65
70
25(O
H)D
co
nce
ntr
atio
ns
(n
mo
l/L)
*
**
*p<0.001 significant differences between winter and spring for 25(OH)D concentrations **p<0.001 significant differences between winter and autumm for 25(OH)D concentrations Figure 10: Mean 25(OH)D concentrations (nmol/L) by centres at different latitudes.
Hera
klio
n 3
5º3
3'
Ath
ens 3
7º9
8'
Zara
goza 4
1º6
6'
Rom
e 4
1º8
9'
Pe
cs 4
6º0
7'
Vie
nna 4
8º2
1'
Lill
e 5
0º6
3'
Gent 5
1º0
6'
Dort
mu
nd 5
1º5
1'
Sto
ckholm
59º3
3'
Latitudesº (Centre)
45
50
55
60
65
70
75
25(O
H)D
co
ncen
tra
tio
ns
(n
mo
l/L
)
*
*
*
** **
***
*p<0.01 significant differences between centres with highest 25(OH)D concentrations (Rome, Athens, Vienna and Zaragoza) and centres with lowest 25(OH)D concentrations. **p<0.01 significant differences between Lille and Pecs respect to Athens and Rome for 25(OH)D concentrations ***p<0.01 significant differences between Stockholm respect to Rome 25(OH)D concentrations.

European PhD Thesis
85

Valtueña J, 2012
86
4.5 CHAPTER 5: THE RELATION BETWEEN PHYSICAL FITNESS AND
BODY COMPOSITION WITH VITAMIN D STATUS IN EUROPEAN
ADOLESCENTS
4.5.1 Abstract
Body composition and fitness have been previously identified as determinants of
vitamin D status in European adolescents. Vitamin D deficiency has also been related to
loss of muscle mass and increased adiposity but it is not clearly known whether this
relationship applies to growing children and adolescents. The purpose of the present
study is to determine the association of body composition, muscular strength and
cardiorespiratory fitness with 25(OH)D levels in healthy European adolescents. Serum
25(OH)D concentrations, body composition and physical fitness were obtained in 1006
European adolescents (470 males), aged 12.5-17.5 yr, within the framework of the
HELENA study. Stepwise regression analysis was performed using 25(OH)D as
dependent variable controlling by age, seasonality and latitude, using SPSS v 18.0.
For males, linear regression of 25(OH)D, suggested that (1) VO2max and (2) BMI z-
score, (B=0.189;p<0.01, B=-0.124;p<0.05, respectively) independently influenced
25(OH)D concentrations after controlling by seasonality, latitude and age. In the same
way, for females, handgrip strength (B= 0.168; p<0.01) independently influenced
25(OH)D concentrations also after controlling by the same factors. Those subjects at
lower body mass index and high fitness score presented significant higher 25(OH)D
concentrations than those at lower fitness score in the other BMI groups (p<0.05).
Cardiorespiratory fitness may predict 25(OH)D concentrations in male adolescents,
whereas upper limbs muscular strength may predict 25(OH)D concentrations in young
females. As such, higher BMI and fat mass in males are related to hypovitaminosis D.

European PhD Thesis
87
4.5.2 Introduction
The knowledge of the role of vitamin D status in general health has increased in the last
few years. Our understanding of the importance of this micronutrient for the prevention
of other types of illness and disease apart from bone metabolism is now gaining more
importance. Vitamin D plays also an important role in strengthening the immune
system, maintaining cardiovascular health, protecting against certain cancers, and
possibly even enhancing athletic performance [12, 77, 104]. In the last 10 years,
however, with the discovery of vitamin D receptors in multiple tissue types the
recognition has come that the role of vitamin D extends beyond the musculoskeletal
system [103]. Muscle and adipose tissue are among the first nontraditional vitamin D
target organs identified [12, 88]. Numerous studies have reported a correlation between
vitamin D and body composition and muscle function, directly related to physical
fitness [70, 77, 179]. Vitamin D is believed to stimulate muscle cell proliferation and
growth [37]. Its deficiency has been known to cause muscle weakness, hypotonia, and
prolonged time to peak muscle contraction, as well as prolonged time to muscle
relaxation [166]. In relation to muscular strength, type II fibers recruited in fast and
strong movements are also affected by vitamin D deficiency [166]. In addition to its
effect on skeletal muscles, vitamin D also plays an important role in the functioning of
the cardiovascular system smooth muscle [9]. But the direction in the relationship of
vitamin D status and muscle mass is not determined yet. A higher vitamin D status
could be caused by increased muscle mass and outdoor sun exposure [12] or a higher
vitamin D status could lead to an increase in muscle mass [37]. Obesity, expressed as
excess body fat, has also an adverse effect on vitamin D status but this has been
analysed mostly in adults [15, 162, 218]. Moreover, obese individuals only produce half
the amount of vitamin D synthesize by nonobese individuals in response to sun
exposure [176]. Despite of these evidences it is not clearly known whether this
relationship applies to growing children and adolescents, and how low 25(OH)D is
associated with body composition and fitness, especially cardiorespiratory fitness. In
adolescents, complications from vitamin D insufficiency are often late-onset rather than
immediate, given that the majority of teenagers with vitamin D insufficiency are
completely asymptomatic, and this fact complicates diagnosis [77].
Earlier studies reported a high prevalence of vitamin D deficiency in adolescents in
Europe [76, 204]. At the same time, and for the same sample, body composition and

Valtueña J, 2012
88
fitness have been proposed as a determinant factor for vitamin D deficiency [203, 214],
but a better understanding of this relationship is needed in this population group. All the
contributions to identify any factors that may be associated with low vitamin D status
may help to assess the risk of vitamin D deficiency and its negative consequences for
health.
Therefore, the purpose of the present study is to determine the association of body
composition, muscular and cardiorespiratory fitness with 25(OH)D levels in healthy
European adolescents.
4.5.3 Subjects and Methods
A description of the study design and implementation is given in the general
methodology.
Statistical analysis
The Predictive Analytics SoftWare (PASW) version 18.0 (SPSS Inc., Chicago, IL,
USA) was used to analyse the data. Statistical significance was set at p<0.05.
An index for Fat mass (FM) and Fat free mass (FFM) was created (FMI and FFMI)
dividing the mass of each one by the square of the height. Subjects were classified in
tertiles according to their body composition, males and females separately.
All the variables showed a normal distribution and the residuals showed a satisfactory
pattern. Descriptive values are shown as mean + standard deviation, unless otherwise
stated. Independent samples T-test was used to analyze differences of 25(OH)D
between sexes. Pearson´s correlation coefficients were computed between 25(OH)D
concentrations and body composition and fitness tests.
Stepwise multivariate linear regression was conducted to examine the independent
associations of body composition (BMI z-score, FMI, FFMI) and physical fitness tests
(muscular strength and cardiorrespiratory fitness) on 25(OH)D concentrations by sex.
Each model always retained age, seasonality and latitude as confounders (Model 0), and
all body composition and fitness tests were entered together into a stepwise regression
model.
The differences in 25(OH)D concentrations according to body composition and fitness
tests by tertiles groups are shown as mean and standard error in the figures, controlling
by age, season and latitude.

European PhD Thesis
89
4.5.4 Results
Table 22 includes descriptive characteristics of the sample splitted by sex. Males
presented significantly higher FFMI and physical fitness performance than girls
(p<0.001). On the contrary, females had significantly higher FMI compared to males
(p<0.001). The mean values of 25(OH)D concentrations were under the optimal levels
for both males and females (57.44+22.67 and 59.99+23.40 nmol/l, respectively).
Pearson´s correlation coefficients for the variables involved in this study are shown on
table 23. In males, cardiorespiratory fitness for VO2max (r=0.108) significantly and
positively correlate with 25(OH)D concentrations (both p<0.05). In females, handgrip
strength (r=0.116) significantly and positively correlate with 25(OH)D concentrations
together with age (r=0.181), height (r=0.120), (all p<0.01).
Table 24 shows stepwise multivariate linear regression stratified by gender. For males,
linear regression of 25(OH)D, suggested that (1) VO2max, and (2) BMI z-score,
(B=0.189;p<0.01, B=-0.124;p<0.05, respectively) independently influenced 25(OH)D
concentrations after controlling for seasonality, latitude and age. In the same way, for
females, only handgrip strength (B= 0.168; p<0.01) independently influenced 25(OH)D
concentrations also after controlling for the same factors.
Figure 11 shows 25(OH)D concentrations according to body composition adjusted for
age, seasonality and latitude. In males, significant results have been shown for FFMI,
with increasing higher 25(OH)D concentrations according to decreasing FFMI (p<0.01).
Lower 25(OH)D concentrations were obtained in obese subjects (for both BMI and
FMI) respect to the other groups (not significant). In females, no significantly
differences have been observed for body composition, but contrary to males, there
seems to exist a tendency of increasing 25(OH)D concentrations according to increasing
BMI, FMI and FFMI.
Figure 12 shows 25(OH)D concentrations according to muscular strength and
cardiorespiratory fitness adjusted for age, seasonality and latitude. In males,
significantly differences for 25(OH)D concentrations are observed for lower muscular
limbs strength. Higher 25(OH)D concentrations were found in percentile 3 of standing
broad jump (p<0.05). On the contrary, although no significant differences have been
observed for females, higher 25(OH)D concentrations were shown for the high score
fitness group comparing with the low score fitness one (60.36+1.77 and 56.90+2.28

Valtueña J, 2012
90
nmol/l, respectively). A tendency also exists for lower muscular limbs strength with
highest concentrations obtained for those subjects in the high percentile group.
Figure 13 shows 25(OH)D concentrations according to BMI and fitness score for the
whole sample adjusted for age, seasonality and latitude. Those subjects at lower BMI
and high fitness score presented significantly higher 25(OH)D concentrations than those
at lower fitness score and than the other BMI groups (p<0.05). The interaction between
fitness and body composition has a significant positive effect on 25(OH)D
concentrations.
4.5.5 Discussion
Reviewing the literature, there is now evidence which suggests that mild vitamin D
deficiency may result in high rates of bone remodelling and a lower bone mass accretion
in children and adolescents [77]. But apart from bone health, vitamin D insufficiency is
starting to be related to other health-related modified factors which are among the non-
skeletal benefits of vitamin D [77, 104]. High prevalence rates of 80% of insufficiency
have been clearly identified in Europe among adolescents [76]. As previously
investigated, body composition and fitness seemed to have an important contribution in
influencing adolescent 25(OH)D concentrations [203], but their interaction and
relationship is not clearly understood. Therefore, it has been considered important to go
deeper into this relationship in order to develop health strategies for achieving optimal
vitamin D status in growing children and adolescents.
Our main results reveal that VO2max and BMI independently influence 25(OH)D
concentrations in males, after controlling by seasonality, latitude and age. VO2 max
significantly and positive correlates with 25(OH)D concentrations while 25(OH)D
concentrations increase with decreasing BMI. In the same way, upper limbs muscle
strength together with handgrip strength and lean body mass independently influenced
25(OH)D concentrations in females. Highest 25(OH)D concentrations were obtained for
those subjects at higher handgrip strength and lean body mass levels .
Regarding body composition, several studies assessing vitamin D status in children and
adolescents focused mainly on BMI rather than on fat mass or lean body mass,
observing that vitamin D status declines as BMI increases in children [77, 179]. This is
in the line with our results but only for males for which BMI seems to influence
negatively 25(OH)D concentrations. In the same direction, Alemzadeh et al. [5],

European PhD Thesis
91
identified that hypovitaminosis D and vitamin D deficient groups had higher BMI and
fat mass than vitamin D sufficient group [5]. In Europe Smotkin-Tangorra et al. [193]
also found an inverse correlation between 25(OH)D levels and BMI [193]. This
reduction in 25(OH)D concentrations with increased adiposity is assumed to be due to
enhanced sequestration of vitamin D in fat [134]. Cheng et al. [49] reported that the
prevalence of vitamin D deficiency was threefold higher in those with high adiposity
[49]. On the contrary, our results for females showed an increase in 25(OH)D
concentrations according to BMI increase. In agreement, Foo et al. [70] found that BMI
was significantly but positively correlated with plasma 25(OH)D concentration in
Chinese girls adolescents [70]. In contrast, other studies did not find any associations of
BMI and/or fat mass with 25(OH)D levels in the paediatric population [111, 214].
These controversial results lead to consider that the use of BMI has some limitations in
children and adolescents [212]. Lean body mass and percentage of body fat seem more
appropriate to assess body composition than BMI in this population group [212, 213].
Body composition changes during growth and changes in BMI in childhood and
adolescence may be related to changes in lean body mass , as well as fat mass [141,
213]. Our results reveal than lean mass positively correlates with 25(OH)D
concentrations in females while percentage of body fat mass increases with decreasing
25(OH)D concentrations but only in males. In the same direction, other authors reported
that vitamin D insufficiency is associated with increased body fat mass [122, 218]. Also
Dong et al. [54] found a significant inverse correlation between 25(OH)D
concentrations and adiposity, including percentage of body fat in American adolescents
[54]. An increase in lean body mass produces an increase in 25(OH)D concentrations
but only in females. In agreement with our results, Foo et al. [70] observed that lean
body mass was positively associated with vitamin D status, but they did not found any
association between vitamin D status and body adiposity [70].
The direction in the relationship of vitamin D status and lean body mass is not
determined yet. A higher vitamin D status could be caused by increased lean body mass
with exercise outdoors or an increase in lean body mass may cause higher vitamin D
status [12, 37]. Fitness and the out-of-door training may play an important role on it.
Our results reveals that not only lean body mass but also upper limb strength positively
correlates with 25(OH)D concentrations but only in females. On the contrary,
cardiorespiratory fitness positive correlates with 25(OH)D concentrations in males.
These results together with those in the regression model suggest that physical fitness

Valtueña J, 2012
92
highly influences 25(OH)D concentrations in adolescents. Cardiorespiratory fitness may
have an influence on 25(OH)D concentrations in males, whereas muscular strength
could determine 25(OH)D concentrations in females.
In the same way, Racinais et al. [175], found in adolescents from Qatar that the severely
vitamin D deficient group had lower aerobic fitness than the moderately deficient group,
although the cohort tested was asymptomatic. In the same way, a positive relationship
between vitamin D and muscle power was recently observed in the UK with
asymptomatic adolescents girls [210]. In the above mentioned study by Foo et al. [69],
adolescent girls with adequate vitamin D status had significantly higher muscle strength
compared with those with poor vitamin D status [69].
Our data reinforce the observation made by Stewart et al. [195], along with many other
studies in children, providing compelling evidence that vitamin D is indeed, together
with testosterone, the other steroid hormone that is important for muscle function and
strength [195].
Our results show that vitamin D status seems to compromise not only muscle strength
but also cardiovascular fitness. This is one of the first papers dealing with objectively
measured physical fitness tests rather than with PA questionnaires. These findings are a
great of interest in relationship to the cardiovascular system for public health. The
presence of abundant vitamin D receptors in myocardial tissue and vasculature and the
observation that hypertension may be ameliorated with vitamin D suggest a greater role
for vitamin D in the cardiovascular system than expected [224]. Our results found that
25(OH)D concentrations positive correlates with VO2 max and consequently with
higher cardiovascular performance. Several studies show that 1,25-dihidroxivitamin-D
increases active stress generation in arteries, therefore affecting blood pressure [19,
143]. Zittermann et al. [224] demonstrated an association between low vitamin D status,
exercise intolerance, and heart failure severity.
In conclusion, cardiorrespiratory fitness may predict 25(OH)D concentrations in male
adolescents, whereas upper limbs muscular strength may predict 25(OH)D
concentrations in young females. In a similar way, higher fat mass in males while lower
fat free mass in females is related to hypovitaminosis D.

European PhD Thesis
93
Table 22: Descriptive characteristics of the studied sample.
All (n=1006) Male n=470 Female n=536
Mean SD Mean SD Mean SD
Age (yr) 14.87 1.19 14.85 1.21 14.88 1.17
Height (cm) 165.77 9.33 170.15 9.71 161.93 7.01
Weight (kg) 58.99 12.33 62.14 13.69 56.23 10.24
BMI (kg/m2) 21.37 3.57 21.33 3.76 21.40 3.39
BMI z-score 0.47 1.09 0.57 1.13 0.38 1.05
Body fat percentage (%) 23.49 9.35 19.97 10.73 26.33 6.87
FM index(kg/m2) 5.27 2.99 4.59 3.44 5.82 2.44
FFM index(kg/m2) 16.80 1.78 17.84 1.80 15.89 1.15
Handgrip (kg) 30.61 8.80 36.06 9.22 25.93 4.86
Standing broad jump (cm) 162.74 34.86 183.98 32.43 144.51 25.23
VO2max léger (ml/kg/min) 40.13 7.85 44.44 7.72 36.07 5.43
Vitamin D (nmol/L) 58.80 23.08 57.44 22.67 59.99 23.40
BMI. Body Mass Index (kg/m2); FMIndex, Fat mass index (kg/m2); FFM index: Fat free mass index(kg/m2); Normally distributed variables are showed as mean ± SD (ANOVA).
Table 23: Pearson coefficient correlations between the 25(OH)D concentration and body composition and muscular and cardiovascular fitness
25(OH)D (nmol/l)
Males Females
Age (yr) 0.011 0.181**
Height (cm) 0.021 0.120**
Weight (kg) -0.057 0.068
BMI (kg/m2) -0.082 0.013
BMI Z-score -0.88 -0.002
Body fat percentage -0.058 0.024
FM index(kg/m2) -0.064 0.014
FFM index(kg/m2) -0.088 0.040
Handgrip (kg) -0.029 0.116**
Standing broad jump(cm) 0.077 0.085
VO2max léger (ml/kg/min) 0.108* 0.022
** Correlation is significant at the 0.01 level (2-tailed).
* Correlation is significant at the 0.05 level (2-tailed).
BMI: Body mass index (kg/m2); PA: physical activity (min); 20m shuttle run: Cardiorespiratory.fitness

Valtueña J, 2012
94
Table 24: Stepwise multiple regression model for 25(OH)D (nmol/L) as dependent variable stratified by gender.
25(OH)D concentrations (nmol/l)
Males N=342 Females N=390
β Partial Corr.
p-value
R2 Β Partial Corr.
p-value
R2
Model 1 0.231 Model 1 0.203 VO2max (ml/kg/min)
0.189 0.174 0.002 Handgrip (kg)
0.168 0.157 0.002
Model 2 0.243 VO2max (ml/kg/min)
0.158 0.143 0.009
BMI z-score -0.124 -0.124 0.024
Age, centre, seasonality, latitude. (Model 0) were additionally entered as covariates in all the models. All body composition and fitness parameter were entered together into a stepwise regression model. BMI: Body mass index (kg/m2); VO2max (ml/kg/min)
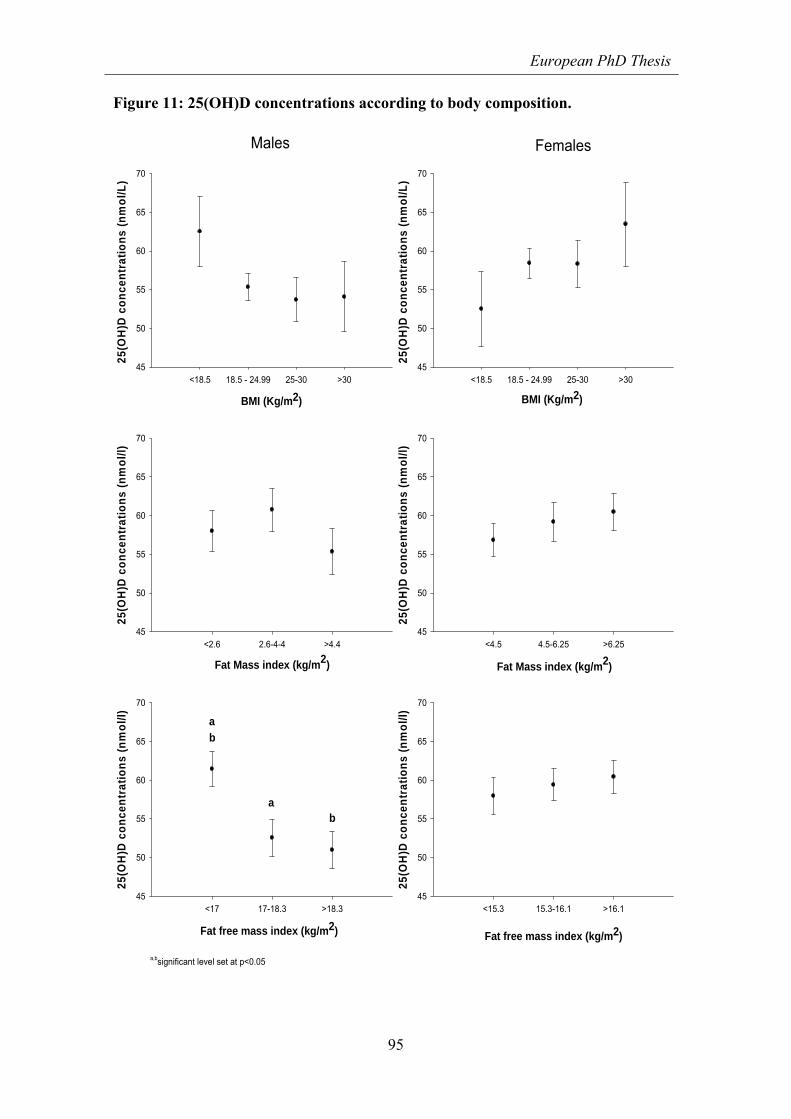
European PhD Thesis
95
Figure 11: 25(OH)D concentrations according to body composition.
BMI (Kg/m2)
<18.5 18.5 - 24.99 25-30 >30
25(O
H)D
co
nce
ntr
atio
ns
(nm
ol/
L)
45
50
55
60
65
70
BMI (Kg/m2)
<18.5 18.5 - 24.99 25-30 >30
25(O
H)D
co
nce
ntr
atio
ns
(nm
ol/
L)
45
50
55
60
65
70
Males Females
Fat Mass index (kg/m2)
<2.6 2.6-4-4 >4.4
25(O
H)D
co
nce
ntr
ati
on
s (n
mo
l/l)
45
50
55
60
65
70
Fat Mass index (kg/m2)
<4.5 4.5-6.25 >6.25
25(O
H)D
co
nce
ntr
ati
on
s (n
mo
l/l)
45
50
55
60
65
70
a,bsignificant level set at p<0.05
Fat free mass index (kg/m2)
<17 17-18.3 >18.3
25(O
H)D
co
nce
ntr
atio
ns
(nm
ol/
l)
45
50
55
60
65
70
Fat free mass index (kg/m2)
<15.3 15.3-16.1 >16.1
25(O
H)D
co
nce
ntr
atio
ns
(nm
ol/
l)
45
50
55
60
65
70
ba
ab

Valtueña J, 2012
96
Figure 12: 25(OH)D concentrations according to physical fitness.
Handgrip strength (kg)
<31 31-40 >40
25(O
H)D
co
nce
ntr
atio
ns
(nm
ol/
l)
45
50
55
60
65
70
Handgrip strength (kg)
<23 23-27 >2725
(OH
)D c
on
cen
trat
ion
s (n
mo
l/l)
45
50
55
60
65
70
VO2 max (ml/kg/min)
<40 40-48 >47
25(O
H)D
co
nce
ntr
atio
ns
(nm
ol/
l)
45
50
55
60
65
70
VO2 max (ml/kg/min)
<33 33-38 >38
25(O
H)D
co
nce
ntr
atio
ns
(nm
ol/
l)
45
50
55
60
65
70
Standing broad jump (cm)
<132 132-156 >156
25(O
H)D
co
nce
ntr
atio
ns
(nm
ol/
l)
45
50
55
60
65
70
Standing broad jump (cm)
<172 172-200 >200
25(O
H)D
co
nce
ntr
atio
ns
(nm
ol/
l)
45
50
55
60
65
70 a
b
a,bsignificant level set at p<0.05
Males Females
ba

European PhD Thesis
97
Figure 13: 25(OH)D concentrations according to BMI and fitness score for the whole sample.
BMI lower too low
[<18.5 in adults]
Optimal BMI [18.5 - 25 in
adults]
Overweight [25-30 in adults]
Obese [>30 in adults]
45,00
50,00
55,00
60,00
65,00
70,00
75,00
25(O
H)D
co
nce
ntr
atio
ns
(nm
ol/l
)
FITNESS SCORE
Low fitness
High fitness

Valtueña J, 2012
98

European PhD Thesis
99
4.6 CHAPTER 6: VITAMIN D STATUS AND PHYSICAL ACTIVITY
INTERACT TO IMPROVE BONE MASS IN ADOLESCENTS.
4.6.1 Summary
The effects of suboptimal 25 hydroxycholecalciferol [25(OH)D] concentrations on bone
mineral content (BMC) in adolescents are still unclear. The main aim of this study was
to evaluate the influence of 25(OH)D on BMC in adolescents, considering the effect of
body composition, sex, age, Tanner stage, season, calcium and vitamin D intakes,
physical fitness and physical activity (PA). Serum 25(OH)D concentrations,
anthropometric measurements, DEXA measurements, calcium and vitamin D intakes,
PA and physical fitness were obtained in 100 Spanish adolescents (47 males), aged
12.5-17.5 year, within the framework of the HELENA study. Relations were examined
using ANCOVA and regression analyses including BMC as dependent variable. Linear
regression of BMC, suggested that 25(OH)D concentrations independently influenced
total and legs BMC after controlling for age, sex, lean mass, seasonality and calcium
intake (B=0.328;p<0.05 and B=0.221;p<0.05, respectively) in physically active group,
No significant influence of 25(OH)D concentrations on BMC was observed in the
inactive group. Significant effect was shown between the interaction of 25(OH)D and
physical activity (PA) on BMC for total body and legs (both p<0.05). Vitamin D and
PA may interact to determine BMC. 25(OH)D sufficiency levels improve bone mass
only in active adolescents or PA has a positive influence on BMC in individuals with
replete vitamin D levels.

Valtueña J, 2012
100
4.6.2 Introduction
Osteoporosis is a disease characterized by decreased bone mass and deterioration of
bone tissue [65] and its increasing worldwide annual incidence of fractures estimated to
be 9 million [114]. The risk for osteoporosis later in life can be reduced by maximizing
peak bone mass and optimizing bone geometry during growth, as 60% of osteoporosis
cases in adult life are related to low bone mineral content (BMC) acquired in
adolescence[11]. Prevention of osteoporosis should begin in childhood given that young
people reach maximum bone mineral density (BMD) following completion of pubertal
development [178]. Approximately, 20% of the variation in peak bone mass is
explained by lifestyle related factors including nutrition, calcium and vitamin D intakes
and weight-bearing exercise [48, 65, 208].
Adolescence therefore is a critical period for skeleton growth and development,
requesting specific dietary and exercise needs. Vitamin D regulates calcium
homeostasis and bone mineral metabolism through its endocrine function and its
noncalciotropic effects, such as cellular differentiation and replication in many organs
via its paracrine and autocrine role [99]. Implications of vitamin D insufficiency are
often late-onset rather than immediate, and the majority of teenagers with vitamin D
insufficiency are completely asymptomatic [77]. Vitamin D insufficiency may
compromise calcium absorption and, ultimately, bone accrual with the consequent
impact on future bone health [36]. 25-hydroxycholecalciferol [25(OH)D] is the main
circulating vitamin D metabolite, representing its subcutaneous synthesis and the
amount consumed through diet and supplements [222] . Levels of 25(OH)D believed to
represent ‘sufficiency’ in adolescents are still controversial [75, 204]. For this reason
general cut-offs of 25(OH)D levels based on current evidence are used to define
‘optimal’ levels(>75 nmol/l) and insufficiency(<75 nmol/l) [68]. According to the
literature, levels <10 nmol/l elevate the risk for osteomalacia and rickets [44].
Several studies have found a positive and direct association between 25(OH)D and
BMC [44, 99]. However, the relationship between 25(OH)D and BMC with the
interaction of other mediating factors is complex not yet well understood. Several
variables influence BMC, such as seasonality, body composition, calcium and
supplements intake, physical activity (PA) and fitness, among others and should be
considered. For example, the benefits of adequate PA and physical fitness on health are
evident [208] as well as their relationship to bone mass [79]. Weight-bearing exercise

European PhD Thesis
101
[34] and intense PA [78] have gained attention in the last few years for preventing
osteoporosis. The skeletal system may be most responsive to the stimulus of weight-
bearing exercise during adolescence [34].
Therefore, the main aim of this study was to evaluate the influence of 25(OH)D on
BMC considering the potential confounding effect of body composition, calcium and
vitamin D intake, PA, and physical fitness in adolescents.
4.6.3 Materials and methods
A description of the study design and implementation is given in the general
methodology.
Statistical analysis
The Predictive Analytics SoftWare (PASW) version 18.0 (SPSS Inc., Chicago, IL,
USA) was used to analyse the data. Statistical significance was set at p<0.05.
Examined variables showed a normal distribution and their residuals showed a
satisfactory pattern. Descriptive values are shown as mean + standard deviation, unless
otherwise stated. Differences between sexes was not observed in the 25(OH)D levels.
Independent samples T-test was used to analyze differences between 25(OH)D groups
(<or> 75 nmol/l). Pearson correlation coefficients were calculated among 25(OH)D,
PA, fitness, dietary intake and bone-related variables (data not shown). Two stepwise
multivariate linear regression, models were conducted to examine the independent
associations of vitamin D, PA and physical fitness on BMC including calcium intake.
Each model retained age, sex, lean mass and seasonally as confounders (Model 0).
Regression to examine the influence of vitamin D on BMC was firstly performed by PA
levels. A second regression model was applied by fitness score levels (2 groups).
One-way analysis of covariance (ANCOVA) was performed to analyze the influence of
the interaction between vitamin D status and PA [25(OH)D*PA] on bone mass and it is
represented as a figure. The dichotomies variables of 25(OH)D and PA were entered as
fixed factors [25(OH)D*PA], bone mass related variables were entered as dependent
variables and Tanner stage, age, height, total lean mass (total, upper or lower limbs lean
mass depending on the dependent variable), calcium intake, and the physical fitness
tests results were included as covariates. The same analysis was performed to analyze
the influence of the interaction between 25(OH)D and physical fitness

Valtueña J, 2012
102
[25(OH)D*physical fitness] on bone mass. Fitness score was entered as a fixed factor
instead of PA, which was included as a covariate instead of fitness tests. Scatter plots
were finally computed to show the influence of 25(OH)D on BMC depending on PA or
fitness levels.
4.6.4 Results
Table 25 shows descriptive characteristics of the study sample by 25(OH)D groups.
Although not statistically significant, adolescents with 25(OH)D insufficiency had
lower total BMC than those with 25(OH)D sufficiency (p=0.300). Adolescents with
25(OH)D sufficiency had better performance in most fitness tests than those with
25(OH)D insufficiency, being significant for standing broad jump (p<0.05).
25(OH)D concentrations did not show significantly correlations with BMC. On the
contrary, lean mass (r=0.871), height (r=0.815), calcium intake (r=0.357) and all fitness
tests were strongly and positively correlated with total BMC, especially handgrip
strength and standing broad jump (r=0.671 and 0.519, respectively; all p<0.01). PA was
also correlated with total BMC (r=0.238; p<0.05). Vitamin D intake did not show any
influence on 25(OH)D or BMC. (Data not shown)
Table 26 shows stepwise multivariate linear regression stratified by PA levels. For the
active group, linear regression of BMC, suggested that 25(OH)D concentrations
independently influenced total, subtotal and lower limbs BMC after controlling by age,
sex, lean mass, seasonality and calcium intake (B=0.328;p<0.05, B=0.242;p<0.05 and
B=0.221;p<0.05, respectively). Additional analyses were performed in upper limbs,
lumbar spine and total hip and no significant differences were found (data not shown).
No significant influence of 25(OH)D concentrations on BMC has been observed for
inactive group. On the same way, when applying the regression stratifying it by fitness
score levels, 25(OH)D no influence on BMC was found after controlling by the same
factors (data not shown).
Figure 14 presents the influence of the interaction between vitamin D status and PA
[25(OH)D*PA] on BMC after controlling for previous bone mass-confounded
variables. A significant effect was shown between 25(OH)D*PA and BMC for total and
legs (both p<0.05). Active adolescents with sufficient 25(OH)D had higher total BMC
than those with insufficiency levels (p=0.057). No significant effect of 25(OH)D on
BMC was observed in the inactive group.

European PhD Thesis
103
Figure 15 shows the influence of the interaction between 25(OH)D and physical fitness
[25(OH)D*physical fitness] on BMC after controlling for bone mass-confounded. No
significant associations were observed between [25(OH)D*physical fitness] and total,
upper and lower limbs BMC.
A scatter plot showing the effect of 25(OH)D concentrations on total BMC by PA
groups is shown on figure 16. A linear tendency of increasing BMC with increasing
vitamin D status in the active group was observed (r=0.008). The same results were
observed when splitting the sample by fitness score groups (figure 17). A linear
tendency of increasing BMC with increasing vitamin D status was observed in the high
fitness score group (r=0.036).
4.6.5 Discussion
To the best of author’s knowledge, the current study is one of the fews which is
exhaustively addressing the influence of 25(OH)D on BMC in adolescents, considering
at the same time a wide range of potential influential factors on bone mass during
adolescence. Vitamin D insufficiency has now reached epidemic proportions [75, 204].
None of the participants in our study had levels of 25(OH)D below 10 nmol/l, which
according to the literature elevates the risk for osteomalacia and rickets [44] (data not
shown).
Although no significant correlation has been found between 25(OH)D concentrations
and BMC, our results indicated that adolescents with low 25(OH)D presented a
tendency of having lower BMC to those with high 25(OH)D (Table 26). Other studies
have found a positive significant relationship between vitamin D status and bone mass
in healthy adolescents [132, 159], but not all the factors included in our study were
taking into account. Moreover, the majority of studies examining the relationship of
vitamin D status and bone mass focused on postmenopausal and elderly women, in
which low vitamin D status is associated with bone loss and increased risk of
osteoporotic fractures [128]. In adolescents, it is still unclear whether vitamin D status
has a significant influence on bone mass growth since evidence is still scarce and
contradicting. Furthermore, bone mass and its mineral content have been related to a
number of factors such as genetics, sex, demographic factors and lifestyle) [48, 65, 82,
208]. However, the interaction between these variables is complex during this rapid
growth period and not well understood [185].

Valtueña J, 2012
104
The findings of the present study suggest a significant and positive influence of
[25(OH)D*PA] on total and lower limbs BMC, after controlling for body composition,
Tanner stage, age, sex, season and calcium intake. Similarly, results stratified by PA
levels showed that 25(OH)D concentrations independently influenced total and lower
body BMC but only in the active group. Active adolescents with sufficient 25(OH)D
presented higher BMC than those with insufficient levels. On the contrary no clear
effect was found on 25(OH)D for BMC in the inactive group. The relationship between
PA and BMC has been previously identified in several studies [78, 79, 209], and the
results of correlation analysis are in line with this data (data not shown). It should be
noted that only few of the previously reported studies included vitamin D and some
were conducted in adult population [43, 69]. Constantini et al (2010) found that PA was
positively associated with BMD also in adolescents with vitamin D deficiency[43]. Foo
et al (2009) concluded that adolescent girls with adequate vitamin D status had higher
size-adjusted BMC for the total, distal forearm, and proximal forearm than those with
poorer vitamin D status after also controlling for body composition and PA [69]. Okuno
et al. [154] evaluated the effects of a combination of 25(OH)D levels and exercise on
physical fitness, in ederly and reported that subjects with low 25(OH)D levels (under
47.5 nmol/l) did not improve their physical fitness, had an inferior functional capacity,
and were at increased risk of falls . This may be attributed in part to a lower rate of bone
remodelling with adequate vitamin D status [43]. Our results also suggest that vitamin
D status seems to contribute to improve BMC when activity levels are adequate for
bone deposition. But the direction in the relationship of vitamin D status and PA is not
determined yet. On one hand, it seems that increased sun exposure from PA leads to
25(OH)D sufficient levels contributing to improved bone mass only on active
individuals [12]. But on the other hand, previous optimal vitamin D status could leads to
improve the effect of PA on BMC [33]. Vitamin D myopathy is associated with fatigue
induction and nonparticipation in physical education or organized sports, contributing to
low mechanical bone stimulus for bone-mass gain [167].
Our results showed that physical fitness has the highest influence on BMC, together
with lean mass and Tanner stage. The strongest correlation with BMC was observed for
those physical fitness tests focused on muscular strength, mainly hand grip strength and
standing broad jump (data not shown). Several studies reported a positive effect of
physical fitness on BMC [34, 209], but only few addressed the relationship including
vitamin D levels [69]. Fitness levels did not have an effect on the relationship between

European PhD Thesis
105
25(OH)D and BMC . Nevertheless, a tendency exists in the high fitness adolescents
group to have higher BMC with sufficient 25(OH)D than with insufficient 25(OH)D
levels, but not significant. Physical fitness seems to have a direct influence on BMC, but
vitamin D status could compromises muscle strength [33] and influences physical
fitness performance, contributing for BMC. Significant differences for lower limbs
muscular strength were observed between by 25(OH)D groups. Those optimal
concentrations had better lower limbs muscular strength that those with lower25 (OH)D
levels. In agreement with our findings, Foo et al (2009) found that adolescent girls with
adequate vitamin D status had significantly muscle strength and as a consequence
higher bone mass compared to those with poor vitamin D status [69].
The main strength of this chapter and there is an interest for the scientific knowledge
was the inclusion of both PA and physical fitness together with vitamin D status in
examining the relation to bone mass. In most of the studies only PA was included. The
use of PA and fitness as fixed factors together with 25(OH)D concentrations contribute
to a better understanding of BMC interactions. The use of potential confounders such as
Tanner stage, age, sex, season, height, total lean mass, arm lean mass (for the upper
limbs), leg lean mass (for lower limbs), calcium intake, PA and fitness tests are also
strengths of our study. It is known that apart from the diet, casual exposure to sunlight is
thought to provide most of the vitamin D requirements of the human population [44].
Season was already shown to be an important factor influencing vitamin D status [44,
204], with higher concentrations found in summer [204]. In further studies, PTH
assessment should be included but due to the complex methodology and the multiple
objectives of the HELENA study, it was no possible to examine this further.
In conclusion, the results of the present study indicate that vitamin D and PA might
interact to determine BMC in two possible directions; 25(OH)D sufficiency levels
improve bone mass only in active adolescents or PA has a positive influence on BMC in
individuals with replete vitamin D levels. This study provides an inside of in the
interactions between vitamin D, bone mass and a number of bone mass development
determinants. Further longitudinal studies in children and adolescents addressing similar
aspects are required.

Valtueña J, 2012
106

European PhD Thesis
107
Table 25: Characteristics of the total study sample and stratified by 25(OH) D concentrations (nmol/l).
TOTAL n=100
Vitamin D Insufficiency (<75 nmol/l) n=73
Vitamin D Sufficiency (≥75 nmol/l) n=27
Mean SD Mean SD Mean SD
Age (years) 14.81 0.99 14.85 1.04 14.69 0.80
Tanner Stages I/II/III/IV/V (%) 0/0/9/17/74 0/0/9/19/72 0/0/10/11/79
Height (cm) 165.61 9.22 165.14 9.32 166.88 8.99
Weight (kg) 57.41 11.09 56.48 10.66 59.91 12.04
BMI (kg/m2) 20.90 2.88 20.72 2.77 21.65 3.09
Lean mass (kg) 39.99 8.67 39.51 8.61 41.27 8.87
Total BMC (g) 2013.37 452.74 1983.77 433.10 2093.21 501.81
Subtotal BMC (g) 1557.62 408.77 1534.32 393.57 1620.76 499.72
Lower limbs BMC(g) 392.84 108.12 387.01 104.01 408.55 119.16
Upper limbs BMC(g) 117.49 30.22 115.23 27.99 123.58 35.40
Total lumbar Spine BMC (g) 51.66 14.09 51.22 13.76 52.85 15.16
Total Hip BMC (g) 32.61 11.67 32.17 10.64 33.86 14.40
Vitamin D intake (µg/d) (n=50) 2.45 1.85 2.28 1.58 2.80 2.32
Calcium intake (mg) 779.33 338.39 746.67 341.33 871.17 318.66
PA (min) 55.47 23.89 54.00 23.96 59.64 23.71
Hand grip strength (kg) 26.97 7.86 26.48 7.71 28.19 8.23
Standing broad jump (cm) 160.01 32.75 154.73* 31.67 173.32* 32.19
4*10 meter Shuttle run (s) 11.67 0.94 11.77 0.91 11.39 0.99
30 m speed (s) (n=71) 5.34 0.58 5.30 0.56 5.52 0.66
25(OH)D (nmol/L) 63.63 18.92 54.89* 11.73 87.21* 13.75
Inter‐groups differences by T‐test * p<0.05. BMI: Body mass index (kg/m
2) BMC: Bone mineral content (g) PA: physical activity (min)

Valtueña J, 2012
108
Table 26: Stepwise multiple regression model to assess the effect of vitamin D on BMC by PA groups.
Age. sex, lean mass and seasonality.(Model 0) were additionally entered as covariates in all the models. Calcium intake and categorical vitamin D status has been entered together into a stepwise regression model.
Total BMC (g) Subtotal BMC (g) Lower limbs BMC (g)
N=100
1. Inactive 1. Inactive 1. Inactive
No variables entered in the model No variables entered in the model No variables entered in the model
2. Active 2. Active 2. Active
β Partial Corr.
p-value
R2 β Partial Corr.
p-value
R2 β Partial Corr.
p-value R2
Model 1 0.948 Model 1 0.926 Model 1 0.978
Vitamin D 0.328 0.662 0.026 Vitamin D 0.242 0.606 0.048 Vitamin D 0.232 0.669 0.024
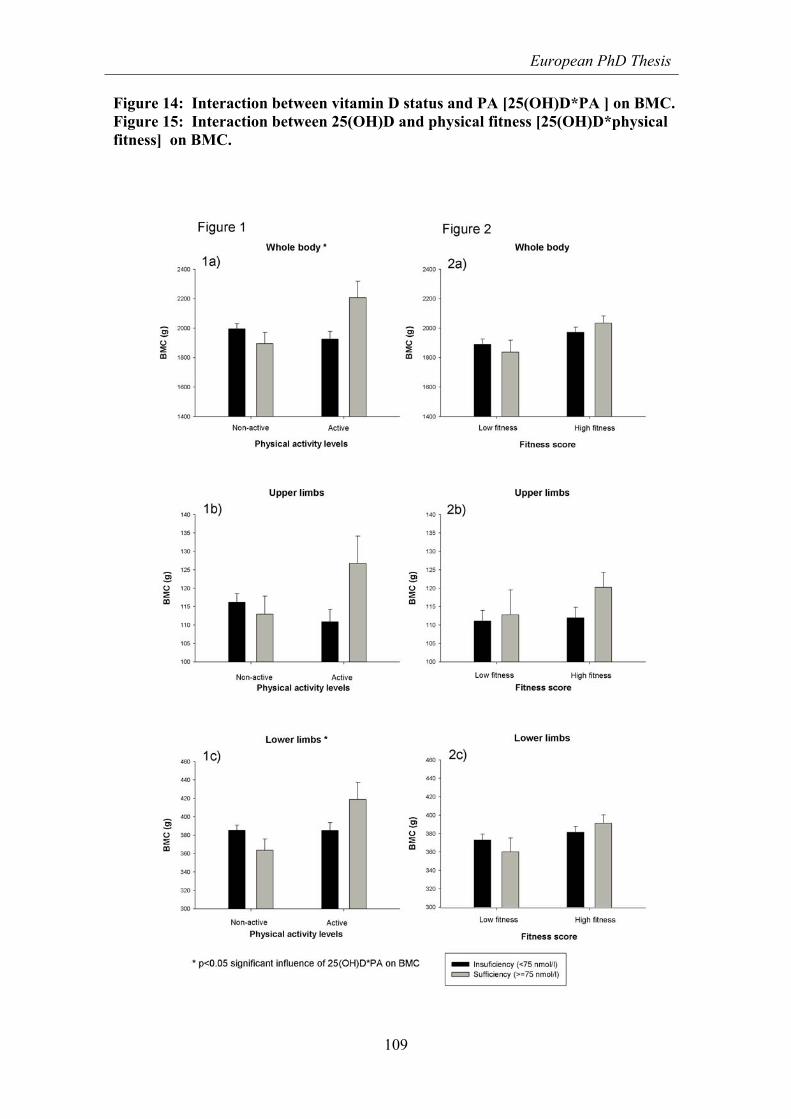
European PhD Thesis
109
Figure 14: Interaction between vitamin D status and PA [25(OH)D*PA ] on BMC. Figure 15: Interaction between 25(OH)D and physical fitness [25(OH)D*physical fitness] on BMC.

Valtueña J, 2012
110
Figure 16: Scatter plot of the interaction between total BMC and 25(OH)D concentrations by PA groups.
1000 1500 2000 2500 3000 3500 4000
Total BMC (g)
20
30
40
50
60
70
80
90
100
110
120
25(O
H)D
co
nce
ntr
atio
ns
(nm
ol/L
)
PA groups
Inactive
Active
R Sq Linear = 3,591E-4
R Sq Linear = 0,008
for active
for Inactive
Controlling for bone mass-confounder variables. Figure 17: Scatter plot of the interaction between total BMC and 25(OH)D concentrations by fitness score groups.
1000 1500 2000 2500 3000 3500 4000
Total BMC (g)
20
30
40
50
60
70
80
90
100
110
120
25(O
H)D
co
nce
ntr
atio
ns
(nm
ol/L
)
FITNESS SCORE
Low fitness
High fitness
R Sq Linear = 0,004
R Sq Linear = 0,036
for high fitness
for low fitness
Controlling for bone mass-confounder variables.

European PhD Thesis
111
5 GENERAL DISCUSSION This thesis aims at analysing liposoluble vitamin (A, E and D) status of adolescents
across Europe and the associations with several non-communicable (i.e. gender, age,
and sexual maturity) and communicable (i.e. physical activity, physical fitness, body
composition, dietary intakes) parameters with a specific forms on vitamin D. Within this
part of the thesis, the discussion will summarize the results analysed in the chapters.
Differences between chapters will not be made. Finally, the discussion about reference
values will be reconsidered due to the lack of reference values for vitamins in
adolescents.
The HELENA study as a whole is the first study that provides data on various markers
for the assessment of health and nutritional status measured in one representative
sample of European adolescents. A pilot study was done to check if standard operating
procedures were adopted by all research partners and, subsequently, to guarantee a high
level of quality. However, the present work is confined mainly to liposoluble vitamins,
but going deeper on vitamin D, its blood status in European adolescents and its
associations, more in detail, with physical activity, physical fitness, body composition
and bone health among a huge list of possible related determinants. The present work
has several strengths. The sampling procedure and the strict standardisation of the field
work among the countries involved in the study avoided to a great extent the kind of
confounding bias due to inconsistent protocols and different laboratory methods which
makes comparing results from isolated studies difficult. Analysis of gender, age,
maturity, genotype, body composition, dietary intake, supplement use, physical activity
and fitness were assessed simultaneously and centralized in a common database.
Despite the known relationship between liposoluble vitamins with these factors most of
these factors are frequently analysed independently, especially in adolescence period.
This approach might lead to misleading results. Moreover, the data presented in the
current thesis give, for the first time, a global overview of which variables could
determine the variation of vitamin D status in adolescents in Europe due to the lower
levels previously found. The majority of the studies only assess PA but not fitness, and
this is an additional strength point of our work. In this thesis, both blood vitamin
concentrations and dietary intake are included, that are widely presumed to be a more
precise mirror. Further strength is the inclusion of a large number of adolescents. The

Valtueña J, 2012
112
post hoc power analyses for our significant results showed that with a probability of
>90% the effects in our sample could be found in the adolescent population. In addition,
our sample is based on a multinational European population covering different regions
of Europe.
5.1 Vitamin status in European adolescents
Previous to HELENA, few studies had been published regarding vitamin status in
European adolescents [4, 125]. Data were not available for all countries, especially for
the Eastern part of Europe. Moreover, the percentage of representative studies was low
and for some countries, the sample was not representative at all for the general
population. Analysing the existing previous data on liposoluble vitamin status of
European adolescents, a general hypovitaminosis problem was found which varied
depending on the vitamin [31, 59-61, 87, 94, 118, 131, 160].
The most prevalent deficiency observed was for vitamin D. Depending on the cut offs
used to define insufficiency (varying from 50 nmol/L to 75 nmol/l), vitamin D
insufficiency was presented in up to 72% of the studied adolescents [87, 118, 131, 160].
On the contrary, deficiency states varied between less than 3% for vitamin A, 25% for
ß-carotene, and 14-19% for α-tocopherol [31, 60, 61, 94]. In agreement with this
previous review, our results showed that almost 80% of the study sample were at
vitamin D insufficiency (<75 nmol/l), with a mean close to 60 nmol/l, much lower than
the optimal levels proposed of 75 nmol/l. On the contrary and in agreement with
previous studies [31, 59, 61, 94], not a general vitamin deficiency was found for vitamin
A (<1% for retinol and <25% for beta-carotene), nor for vitamin E (<5% for
α-tocopherol).
5.1.1 Gender
Trying to get deeper into the understanding of the gender effect on liposoluble vitamin
status, we observed a gender influence on vitamin A and E status, but not on vitamin D
or beta-carotene status. In our study, boys had significantly higher retinol concentrations
than girls, whereas girls had significant higher alfa-tocopherol concentrations than boys.
Gender differences for beta-carotene and α-tocopherol were measured in an Austrian
study [140]. Contrary to our results, boys had significant better status in both parameters
than girls.

European PhD Thesis
113
Girls had significant higher α-tocopherol concentrations than boys, but no differences in
ß-carotene levels were found, in agreement with the study of Hercberg et al [94]. Our
results regarding vitamin D are in agreement with other studies in which gender had no
effect on vitamin D status [2, 54]. That is one of the reasons why in some chapters of
this thesis regarding vitamin D, the HELENA sample has been taken as a whole without
making gender differences. Analyzing tendencies, girls had slightly higher mean
vitamin D concentrations than boys. Chapter 2 shows the prevalence rates of vitamin D
status according to the above-mentioned sufficient-deficient classification. Considering
the cut-off set for adults at 75 nmol/l, almost 80% of the sample was below the optimal
levels. A slightly higher percentage of females (22.2%) had sufficient 25(OH)D
concentrations compared to males (15.1%). Regarding to 25(OH)D deficiency (<27.5
nmol/l), equal and high proportion of males and females has been found at this state
(15%).
5.1.2 Age and Tanner status
Age has a major influence on vitamin D and vitamin A status. Our results reveal an
increase in vitamin D, retinol and ß-carotene concentrations according to age. In several
studies, vitamin A and Retinol Binding Protein (RBP) levels increased according to age
and Tanner stage until puberty, where they reached adult levels [55, 84, 94, 138]. Other
studies show that plasma β-carotene and α-tocopherol levels seemed to be more stable
through the age span in French children and adolescents [55, 84, 94, 138]. But on the
contrary, Winklhofer-Roob et al. [217] found that age was a significant predictor of
plasma α-tocopherol concentration in Swiss subjects aged 0.4 to 38.7 years.
The influence of age and Tanner stage on vitamin D status was analyzed in several
studies. Significant contribution of age on 25(OH)D concentrations has been observed
in our study. On the contrary, Tanner stage did not show any significant contribution to
25(OH)D concentrations which is in line with other studies [54]. A tendency of
increasing 25(OH)D concentrations with increasing age for the whole group was
observed, but remaining only significant in girls when splitting the sample by sex. At
the same time, 25(OH)D sufficiency (>75 nmol/l) is reached at lower percentiles with
increasing age. That means that with increasing age there are fewer subjects at
insufficient 25(OH)D levels. In agreement with our results, Bonofiglio et al. found a
significant higher concentration of 25(OH)D in Italian postmenarche girls compared to
premenarche ones (p<0.01) [28], possibly attributed to the higher concentrations of

Valtueña J, 2012
114
vitamin D-binding protein caused by the increase of estrogens levels [28]. Other studies
revealed a significant decrease in 25(OH)D concentrations with increasing age in both
sexes (p <0.05) [84, 118, 204], although in British children aged 15 and above some
slight increases were observed [84].
Due to that general hipovitaminosis problem was only found for vitamin D, it was
decided to analyse this vitamin more in depth, trying to understand vitamin D deficient
causes and its relation with behaviour and health risks in European adolescents.
5.2 The importance of other non-communicable factors on vitamin D status and
their relationship
5.2.1 Latitude; Geographical situation
Due to the geographical situation of our continent, and more precisely in northern
countries, there may be not enough UV radiation of the appropriate wavelength for
vitamin D skin synthesis, especially during winter time [127]. The skin synthesis of
vitamin D may not compensate a low nutritional intake, creating possibly some vitamin
D status differences between the North and the South. Although the HELENA project
has not been designed to make differences between countries but to take the sample as a
whole, the high variability found on 25(OH)D concentrations has lead to a deep analysis
on vitamin D determinants taking regional differences and latitude into account. Our
results show an important contribution of latitude on 25(OH)D concentrations. Highest
levels were obtained in southern cities of Europe as Rome, Athens and Zaragoza.
Lowest levels were obtained in higher latitudes as Dortmund and Ghent. This is in
agreement with other studies [96, 131, 160]. The comparison between studies is difficult
because of the lack of standardization between methods [204] and because this is the
first study assessing a represent-active sample of European adolescents on vitamin D
status. Surprisingly, concentrations were high in Vienna and low in Herackion. This is
discussed in the next section,
5.2.2 Season
Our Ancova analysis and regression models revealed a huge contribution from season
on 25(OH)D concentrations in the analysed sample. It is known that apart from the diet,
casual exposure to sunlight is thought to provide most of the vitamin D requirements of
the human population [160]. Regular and modest sunlight exposure could naturally

European PhD Thesis
115
stimulate vitamin D skin photosynthesis. Hence, sun exposure of 10-15 minutes, 3 times
a week, during the spring, summer and fall, over face and arms is sufficient to maintain
adequate vitamin D status. Our study shows highest values of 25(OH)D concentrations
obtained in Autumn, after the summer’s sunny days. Also spring presents increasing
25(OH)D concentrations. On the contrary, winter was the season that significantly
showed lower 25(OH)D concentrations when comparing with the others. According to
the literature, seasonality shows an important influence on vitamin D status [44, 85,
204], with the higher concentrations found in summer [84, 86, 131]. This could partly
explain the low and high concentrations observed in adolescents from Heraklion and
Vienna respectively. .
5.2.3 Genetics
To the best of our knowledge, this is the first study to examine the genetic influence on
25(OH)D concentrations among European adolescents. Our results did not show a
significant contribution of selected polymorfisms (rs1544410) on vitamin D levels in
European adolescents. Some European studies have estimated a heritability around 30-
45% of vitamin D levels [108, 192], but this estimation was done for adults. These
studies demonstrate that, in adults, 25(OH)D concentrations are fractionally under some
genetic control. Non-European studies have been found to determinate genetic vitamin
D influence in adolescents. One study made in Chinese adolescents concluded that there
was a strong genetic influence on 25(OH)D levels in males only [10].
5.3 The importance of communicable factors on vitamin D status and their
relationship
5.3.1 Physical activity and physical fitness
Our primarily results showed that muscular strength mainly contributed to explain
25(OH)D concentrations variability, but also cardiovascular fitness in a minor way.
Nevertheless physical activity did not show a significant relationship with 25(OH)D
concentrations. According to other studies, muscular strength has been also strongly
positively related to 25(OH)D concentrations [69, 105, 210]. Many studies in children
provided compelling evidence that vitamin D is indeed, together with testosterone, the
other steroid hormone that is important for muscle function and strength [23, 57, 105].

Valtueña J, 2012
116
At the same time, we found that cardiovascular fitness and flexibility showed the
highest correlation with 25(OH)D concentrations. Dong et al., also reported significant
positive associations between 25(OH)D levels and cardiovascular physical fitness.
Muscular strength has been strongly related to 25(OH)D concentrations. Physical
activity did not show significant relationships with 25(OH)D concentrations [54].
Contrary to that, Lenders et al. found that concentrations of 25(OH)D were directly
correlated with physical activity levels (P<0.05)[133]. The majority of the studies only
assess PA but not fitness, but it is important to consider that outdoor exercise, that
influences sunlight vitamin D expression, could contribute to fitness improvement.
Bener et al. stated that most of the vitamin D-deficient children had no physical activity
(60.6%) and no exposure to sunlight (57.5%) [18].
Going deeper into the relationship between fitness and vitamin D we have observed that
physical fitness highly influences 25(OH)D concentrations in adolescents.
Cardiorespiratory fitness may have an influence on 25(OH)D concentrations in males,
whereas muscular strength could determine 25(OH)D concentrations in females, after
controlling by seasonality, latitude and age. Highest 25(OH)D concentrations were
obtained for those subjects at higher cardiorespiratory fitness and muscular strength.
In agreement with findings, Racinais et al., found that the severe deficient vitamin D
group had lower aerobic fitness than the deficient group, although the cohort tested was
asymptomatic [175]. In the same way, a positive relationship between vitamin D and
muscle power was recently observed in the UK with asymptomatic adolescents girls
[210]. Foo et al. in china found that adolescent girls with adequate vitamin D status had
significantly higher muscle strength compared with those with poor vitamin D status
[69].
Our results found that 25(OH)D levels positive correlates with VO2 max and its
consequence higher cardiovascular performance. Several studies show that 1,25-
dihidroxivitamin-D increases active stress generation in arteries, therefore affecting
blood pressure [19, 143]. Zittermann et al [224] demonstrated an association between
low vitamin D status, exercise intolerance, and heart failure severity [224].
As presented before, vitamin D status seems to compromise not only muscle strength
but also cardiovascular fitness. These findings are a great of interest for public health.
The presence of abundant vitamin D receptors in myocardial tissue and vasculature and
the observation that hypertension may be ameliorated with vitamin D suggest a greater
role for vitamin D in the cardiovascular system than expected [224].

European PhD Thesis
117
5.3.2 Body composition
Among all the analyzed body composition variables, BMI initially showed the highest
influence on the variation of 25(OH)D concentrations when analyzing vitamin D
determinants for the whole sample (chapter 4). A progressive tendency decrease of
25(OH)D concentrations with increasing BMI was observed, with the lowest levels
showed in obese adolescents (equivalent to BMI>30) [76]. Current research has also
observed an inverse relation between vitamin D with BMI [5, 111, 133, 193]. This
reduction in serum 25(OH)D with increased BMI is assumed to be due to enhanced
sequestration of vitamin D in fat [134], but fat mass should be also considered. Dong et
al. made the same observations that vitamin D status was also influenced by adiposity
[54]. In contrast, other studies did not find any associations of BMI and/or fat mass with
25(OH)D levels in the paediatric population [54, 141]. This makes it necessary to go
deeper into the investigation on the relationship between body composition and
25(OH)D concentrations.
Analyzing body composition influence on vitamin D, BMI independently influenced
25(OH)D concentrations in males, after controlling by seasonality, latitude and age.
25(OH)D concentrations increased with decreasing BMI. In the same way, lean body
mass independently and positively influenced 25(OH)D concentrations in females.
When comparing with other studies, we observed that the majority of them assess
vitamin D status in children and adolescents focused mainly on BMI rather than on fat
mass or lean body mass [77, 179]. As state above, controversial results with BMI lead to
consider lean mass and percentage of fat mass in children and adolescents to be better
markers to assess obesity [212] and to establish relations with vitamin D status. Body
composition changes during growth and changes in BMI in childhood and adolescence
may be related to changes in lean body mass, as in fat mass [141, 213]. Our results
reveal that lean mass positively correlates with 25(OH)D concentrations in females
while fat mass percentage increased with decreasing 25(OH)D concentrations but only
in males. In the same direction, other authors reported that vitamin D insufficiency is
associated with increased body fat mass [122, 218]. Also Dong et al. found a significant
inverse correlations between 25(OH)D concentrations and adiposity, including
percentage of body fat in American adolescents [54]. On the contrary, lean body mass
increases correlate with an increase in 25(OH)D concentrations but only in females. In
agreement with our results, Foo et al. [70] found that lean body mass was positively

Valtueña J, 2012
118
associated with vitamin D status, and they did not found any association between
vitamin D status and body adiposity.
The direction of the relationship of vitamin D status and lean body mass is not
determined yet. A higher vitamin D status could be caused by increased lean body mass
or a higher vitamin D status could lead to an increase in lean body mass. Therefore, it is
necessary to go deeper into this relationship in future studies.
5.3.3 Dietary and supplements intake
Another important point of this thesis is to take not only biomarkers but also dietary
intake for vitamin D, calcium and supplements into account. Dietary vitamin D intake
seems not to be an important significant contributor on vitamin D status. Recently,
Absoud et al. agreed that dietary vitamin D intake had no effect on 25(OH)D
concentrations [2]. On the other hand, we observed that calcium and supplements intake
contributed to explain 25(OH)D variability. A study in adults combining
supplementation of vitamin D 400-800 IU plus calcium reduced overall risk fracture by
8% (HR 0.92), and hip fracture risk by 16% (HR 0.84). Contrarily, vitamin D alone had
no effect on fracture risk as compared to placebo [1]. Calcium seems to play an
important role on vitamin D status. According to the literature, abnormal calcium
metabolism has been associated with weight gain [221], and a high calcium intake is
believed to prevent obesity [91]. Supporting our positive supplement results, Guillemant
et al. and Lehtonen-Veromaa et al. observed a significant effect of supplementation on
25(OH)D serum levels in French and Finnish children [85, 131]. Due to the low
25(OH)D concentrations, especially during winter months, some researchers emphasize
to improve vitamin D intake through supplements [202] but till now the data about the
influence of vitamin D supplementation or fortified foods in children and adolescents is
scarce [202]. Due to that, the recommendations should be aim at getting the optimal
blood concentrations, and these are not well known in young population where the
optimal intake is difficult to establish.
5.3.4 Socioeconomic status
Socioeconomic status refers to occupational level but also to income and educational
level of parents or guardians [13, 163]. The use of this information in studies focused on
children and adolescents seems to have several conceptual and methodological
difficulties. Thereby, a new measure called “Family Affluence Scale” (FAS) was

European PhD Thesis
119
developed and started to be used in young populations-based studies [46].
Socioeconomic status seems to influence several health-related outcomes such as birth
weight, height, metabolic syndrome, malnutrition and obesity in young and adult people
[13, 113], and vitamins could be affected. Furthermore, several studies reported that low
socioeconomic status in childhood may lead to higher morbidity, including CVD, later
in life [29, 171]. Regarding the relationship between vitamin D status and
socioeconomic status in young people, the literature is scarce. Whereas if consider the
relationship between vitamin D status and physical activity mainly outdoors activities or
body composition, we can find some studies regarding socioeconomic status, but results
are contradictory. Concerning the association between socioeconomic status and
fatness, several studies showed that children in the most deprived families or low social
class had significant higher risk of obesity [151, 163, 211]. Consequently, large
population studies like HELENA analysing adolescents from different countries are
useful to provide an overall picture of the relationships between vitamin D and
socioeconomic status regarding physical activity, physical fitness and body composition
in young people. In relation to physical activity, some reported that young people from
the low socioeconomic status group performed better in muscular and CRF [71], others
observed that adolescents with higher socioeconomic status had higher CRF than those
with lower socioeconomic status [177]. A longitudinal study observed that persistently
high socioeconomic status was associated with increases in activity and fitness from
childhood to adulthood [38].
5.3.5 Bone mass
Viewing the literature, there is now evidence suggesting that mild vitamin D deficiency
may result in high rates of bone remodelling and a lower bone mass accretion in
children and adolescents affecting bone health [77]. In adolescents, it is still not clear
whether vitamin D status has a significant influence on bone mass growth since
evidence is still scarce and contradicting. Some studies have found a positive
relationship between vitamin D status and bone mass in healthy adolescents [132, 159].
But this may have been related to other variables like individual anthropometric
differences or lifestyle rather than to vitamin D status. Our results would indicate that
adolescents with low 25(OH)D concentrations presented a tendency of having lower
BMC than those with high 25(OH)D concentrations. When analyzing the relationship
between vitamin D and bone mass, controlling by other factors as body composition,

Valtueña J, 2012
120
Tanner stage, age, calcium intake, PA and physical fitness tests the relationship between
vitamin D and BMC appears to be dependent on PA levels. Active adolescents with
sufficient 25(OH)D have higher BMC than those with insufficiency levels. Similarly,
results stratified by PA levels showed that 25(OH)D concentrations independently
influenced total and lower body BMC but only in the active group. That means that both
PA and vitamin D status contribute to improve bone mass in adolescents. The
relationship between PA and BMC has been previously identified in several studies [78,
79, 209], but it should be noted that only few of the previously reported studies included
vitamin D and some were conducted in adult population [43, 69]. Following our results,
Constantini et al. [43] found that PA was positively associated with BMD also in
participants with vitamin D deficiency. Foo et al. concluded that adolescent girls with
adequate vitamin D status had higher size-adjusted BMC for the total body, distal
forearm, and proximal forearm than those with poorer vitamin D status after controlling
also for body composition and PA [69]. This may be attributed in part to a lower rate of
bone remodelling with adequate vitamin D status [43]. But the direction in the
relationship of vitamin D status and PA is not determined yet. On one hand, it seems
that increased sun exposure from PA leads to 25(OH)D sufficient levels contributing to
improved bone mass only on active individuals [12]. But on the other hand, previous
optimal vitamin D status could lead to improve the effect of PA on BMC [33].
Physical fitness showed the highest influence on BMC, independently of vitamin D, but
a tendency exists in the high fitness adolescents group to have higher BMC with
sufficient 25(OH)D concentrations than with insufficient 25(OH)D levels. Several
studies reported a positive effect of physical fitness on BMC [34, 209], but only few
addressed the relationship including vitamin D levels [69]. Our results showed that
physical fitness seems to have a direct influence on BMC, but vitamin D status could
compromise muscle strength [33] and influence physical fitness performance,
contributing for BMC. According to the literature, vitamin D myopathy is associated
with fatigue induction and nonparticipation in physical education or organized sports,
contributing to low mechanical bone stimulus for bone-mass gain [167]. Significant
differences for lower limbs muscular strength were observed between by 25(OH)D
groups. Those with optimal concentrations had better lower limbs muscular strength that
those with lower 25(OH)D levels. In agreement with our findings, Foo et al. found that
adolescent girls with adequate vitamin D status had significantly higher muscle strength

European PhD Thesis
121
and as a consequence higher bone mass compared to those with poor vitamin D status
[69].
Our results showed that vitamin D status interact mainly with PA but also with fitness to
contribute to improve BMC. And due to this enough and strong scientific evidence
showing that exercise is positively associated with the development of lean mass and
therefore, the increase bone mass apart from other health parameters during childhood
and adolescence, the promotion of PA and sports is necessary, not only at school but
also extra-curricular sports practice
5.4 The identified need of adequate reference values for adolescents
The discussion about reference vitamin blood values for a healthy adolescent population
and its application for vitamin screening and prevention strategies is ongoing and the
question which percentiles/cut-offs should be used is not answered sufficiently yet.
Even vitamin D reference values for deficiency have been set at 27.5 nmol/L in children
[68], there is still a lack of consensus on the deficient and sufficient 25(OH)D
concentration, that varies from 20 nmol/L to 100 nmol/L in studies. Moreover, it is still
debatable how to develop reliable vitamin reference blood values for adolescents.
However, within the HELENA study design it was not feasible to create reference
values per se. But, the presented vitamin A, E, and D concentrations and are proposed to
be used as physiological normal values of apparently healthy European adolescents. The
percentile curves presented in chapters 2 and 3 are more adapted to age-specific
differences during adolescence. Chapter 2 shows smoothed centile curves (P5, P25,
P50, P75, P95) for retinol, α-tocopherol and beta carotene levels studied by age and sex.
Our results reveal an increase in retinol and ß-carotene concentrations according to age.
On the contrary, α-tocopherol levels seemed to be more stable although significantly
different observed in girls. Chapter 3 shows smoothed centile curves (P5, P25, P50,
P75, P95) for 25(OH)D levels studied by age and sex. Concentrations were similar in
boys and girls, although in boys, first a decrease and after the age of 14 an increase is
observed. In girls, the curves seem to indicate that the decrease was before the age of
13, because at age 13 a slightly progressive increase with age with a similar slope than
in boys was observed. In both boys and girls, the trend to higher 25(OH)D levels is for
those in P75 and P95, whereas in the other levels there is a trend to stability within low
25(OH)D levels.
Valtueña J, 2012
122
They may be applied as some kind of reference data to compare the data with other
adolescent vitamin concentrations, for instance, for the diagnosis of altered vitamin
profiles of diseased subjects or the monitoring of therapeutic interventions.
Additionally, as subclinical vitamin deficiency is more prevalent than expected, blood
concentration values of the presented vitamins could be used in the clinical setting.
A few limitations of the present study deserve comment. Because of the cross-sectional
design, the temporal relationships are unknown; anything can be stated about causality
of the relationships. For a future study, serum parathyroid hormone (PTH)
concentrations should be included as in children and adolescents, the relationship
between serum 25(OH)D and PTH is less clear [95]. Due to the complex and enormous
amount of variables analysed in the HELENA project, PTH could not be assessed.
Some strengths of the HELENA Study should also be stated here and previously little
mentioned at the beginning of the discussion. The HELENA Study is the first European
multicentre, cross-sectional study realizing a standardized methodology to cover and
connect a wide range of different research fields which deal with the health and fitness
status of adolescents. This includes as main aspects: (a) dietary, nutrition and eating
attitudes, (b) physical activity and fitness, (c) body composition, (d) haematology,
nutrition physiology and immunonutrition, and (e) genetics. In light of this background,
understandably, this thesis just covers a small part of the HELENA Study. Further, the
reliability of the data as well as the quality of the project are the consequence of
harmonized and standardized methods and materials, centralized sample recruitment,
central biochemical analyses, database management, the performance of a work shop
for the field workers to learn and harmonize the different methods, and the high quality
of researchers, including a pilot study to assure an optimal study performance. The
research made for this thesis, is one of the first dealing with objective physical activity
and physical fitness test rather than with PA questionnaires regarding vitamin status. In
the same way, not only PA but also physical fitness has been included. Additionally, the
use of such as potential confounders like Tanner stage, age, height, body composition,
dietary intake, genetics, socioeconomic status, PA and fitness tests are also strengths of
the thesis.

European PhD Thesis
123
6 CONCLUSIONS
1- Currently, there are no reference values for blood vitamin levels in adolescents.
Percentile curves presented in this thesis can be used as physiological normal
values in the clinical setting.
2- Reviewing the literature, not a general vitamin deficiency was found neither for
Retinol (<3), ß-carotene (<19%), nor for α-tocopherol (25%). On the contrary
vitamin D obtained the highest deficiency risk in our continent (around 75%).
3- No high prevalence rates were found for Retinol (<1%), ß-carotene (<30%) nor
for α-tocopherol (<5%) in HELENA study sample. While high prevalence rates
of insufficiency vitamin D have been found, with almost 80% of the adolescents
at this state. Vitamin D deficiency is a highly prevalent condition in European
adolescents and needs to be addressed by public health authorities.
4- Gender differences are observed for Retinol and α-tocopherol status, but not for
vitamin D nor beta-carotene concentrations. Age has a major influence on
vitamin D and vitamin A status. There is an increase in 25(OH)D, retinol and ß-
carotene concentrations according to age.
5- Season, latitude, age, BMI, physical fitness, calcium and supplements intake
were highly related to 25(OH)D concentrations and could explain the variation
found in European adolescents for vitamin D.
6- Cardiorespiratory fitness may predict 25(OH)D concentrations in male
adolescents, whereas upper limbs muscular strength may predict 25(OH)D
concentrations in young females. As such, higher fat mass in males while lower
fat free mass in females could lead to hypovitaminosis D.
7- Vitamin D and physical activity interact to improve BMC in two possible
directions; 25(OH)D sufficiency levels improve bone mass only in active
adolescents. Physical activity has a positive influence on BMC only in
individuals with replete vitamin D levels.

Valtueña J, 2012
124
6.1 General conclusion
To the best of our knowledge, the presented data in the current thesis are the first ones
which aim establishing descriptive liposoluble vitamin status in adolescents at a
European level going deeper into the determinants of vitamin D and its health-related
parameters.
The high amount of vitamin D insufficiency in the study population found could
indicate that vitamin D concentrations in adolescents may be different from those of
adults, making it necessary to establish general cut-offs for this micronutrient
concentration in blood for the adolescence period.
At the same time, body composition, physical activity and physical fitness may play a
crucial role to increase 25(OH)D concentrations with its positive health outcomes.
Adolescents could be at risk of vitamin D deficiency and these low 25(OH)D
concentrations may be considered as a marker of poor health in adolescents. Vitamin D
supplementation should be considered for the paediatric population by European health
authorities.

European PhD Thesis
125
References 1. Abrahamsen B, Masud T, Avenell A, et al. 2010. Patient level pooled analysis of 68 500 patients
from seven major vitamin D fracture trials in US and Europe. BMJ; 340: b5463. 2. Absoud M CC, Lim MJ, Wassmer E, Shaw N. 2011. Prevalence and predictors of vitamin d
insufficiency in children: a great britain population based study. PLoS One. ; 6(7): e22179. 3. Aeberli I, Molinari L, Spinas G, et al. 2006. Dietary intakes of fat and antioxidant vitamins are
predictors of subclinical inflammation in overweight Swiss children. Am J Clin Nutr; 84(4): 748-55.
4. Al-Tahan J, Gonzalez-Gross M, and Pietrzik K. 2006. B-vitamin status and intake in European adolescents. A review of the literature. Nutr Hosp; 21(4): 452-65.
5. Alemzadeh R, Kichler J, Babar G, et al. 2008. Hypovitaminosis D in obese children and adolescents: relationship with adiposity, insulin sensitivity, ethnicity, and season. Metabolism; 57(2): 183-91.
6. Andersen R, Molgaard C, Skovgaard LT, et al. 2005. Teenage girls and elderly women living in northern Europe have low winter vitamin D status. Eur J of Clin Nutr; 59(4): 533-541.
7. Anderson LN, Cotterchio M, Kirsh VA, et al. 2011. Ultraviolet sunlight exposure during adolescence and adulthood and breast cancer risk: a population-based case-control study among Ontario women. Am J Epidemiol; 174(3): 293-304.
8. Annweiler C, Allali G, Allain P, et al. 2009. Vitamin D and cognitive performance in adults: a systematic review. Eur J Neurol; 16(10): 1083-9.
9. Ardestani A, Parker B, Mathur S, et al. 2011. Relation of vitamin D level to maximal oxygen uptake in adults. Am J Cardiol; 107(8): 1246-9.
10. Arguelles LM, Langman CB, Ariza AJ, et al. 2009. Heritability and environmental factors affecting vitamin D status in rural Chinese adolescent twins. J Clin Endocrinol Metab; 94(9): 3273-81.
11. Baroncelli GI, Bertelloni S, Sodini F, et al. 2005. Osteoporosis in children and adolescents: etiology and management. Paediatr Drugs; 7(5): 295-323.
12. Bartoszewska M, Kamboj M, and Patel DR. 2010. Vitamin D, muscle function, and exercise performance. Pediatr Clin North Am; 57(3): 849-61.
13. Batty GD and Leon DA. 2002. Socio-economic position and coronary heart disease risk factors in children and young people - Evidence from UK epidemiological studies. Eur J Public Health; 12(4): 263-272.
14. Beghin L, Castera M, Manios Y, et al. 2008. Quality assurance of ethical issues and regulatory aspects relating to good clinical practices in the HELENA Cross-Sectional Study. Int J Obes (Lond); 32 Suppl 5: S12-8.
15. Bell NH, Epstein S, Greene A, et al. 1985. Evidence for alteration of the vitamin D-endocrine system in obese subjects. J Clin Invest; 76(1): 370-3.
16. Bell NH, Godsen RN, Henry DP, et al. 1988. The effects of muscle-building exercise on vitamin D and mineral metabolism. J Bone Miner Res; 3(4): 369-73.
17. Benefice E, Fouere T, and Malina RM. 1999. Early nutritional history and motor performance of Senegalese children, 4-6 years of age. Ann Hum Biol; 26(5): 443-55.
18. Bener A, Al-Ali M, and Hoffmann GF. 2009. Vitamin D deficiency in healthy children in a sunny country: associated factors. Int J Food Sci Nutr; 60 Suppl 5: 60-70.
19. Bian K, Ishibashi K, and Bukoski RD. 1996. 1,25(OH)2D3 modulates intracellular Ca2+ and force generation in resistance arteries. Am J Physiol; 270(1 Pt 2): H230-7.
20. Biesalski H-K, Bischoff SC, and Puchstein C, 2010 Ernährungsmedizin: Nach dem Curriculum Ernährungsmedizin der Bundesärztekammer und der DGE 4. vollst. überarb. u. erw. Aufl. ed., Stuttgart: Thieme.
21. Biesalski H.K FP, Kasper H, Kluthe R, Pölert W, Puchstein C et al., 2004 Ernährungsmedizin, ed. U.F.V. Jena: Elsevier GmbH. München.
22. Binkley N, Krueger D, Cowgill CS, et al. 2004. Assay variation confounds the diagnosis of hypovitaminosis D: a call for standardization. J Clin Endocrinol Metab; 89(7): 3152-7.
23. Birge SJ and Haddad JG. 1975. 25-Hydroxycholecalciferol Stimulation of Muscle Metabolism. J Clin Invest; 56(5): 1100-1107.
24. Bischoff-Ferrari H. Health effects of vitamin D. Dermatol Ther; 23(1): 23-30. 25. Bischoff-Ferrari HA, Dietrich T, Orav EJ, et al. 2004. Positive association between 25-hydroxy,
vitamin D levels and bone mineral density: A population-based study of younger and older adults. Am J Med; 116(9): 634-639.

Valtueña J, 2012
126
26. Bischoff-Ferrari HA, Giovannucci E, Willett WC, et al. 2006. Estimation of optimal serum concentrations of 25-hydroxyvitamin D for multiple health outcomes. Am J Clin Nutr; 84(1): 18-28.
27. Black AE. 2000. Critical evaluation of energy intake using the Goldberg cut-off for energy intake : basal metabolic rate. A practical guide to its calculation, use and limitations. Int J Obes (Lond); 24(9): 1119-1130.
28. Bonofiglio D, Maggiolini M, Marsico S, et al. 1999. Critical years and stages of puberty for radial bone mass apposition during adolescence. Horm Metab Res; 31(8): 478-482.
29. Brunner E, Shipley MJ, Blane D, et al. 1999. When does cardiovascular risk start? Past and present socioeconomic circumstances and risk factors in adulthood. Eur J Clin Nutr; 53(12): 757-764.
30. Brussaard JH, Lowik MRH, Steingrimsdottir L, et al. 2002. A European food consumption survey method - conclusions and recommendations. Eur J Clin Nutr; 56: S89-S94.
31. Buzina R, Grgic Z, Jusic M, et al. 1982. Nutritional status and physical working capacity. Hum Nutr Clin Nutr; 36(6): 429-38.
32. Calbet JA, Dorado C, Diaz-Herrera P, et al. 2001. High femoral bone mineral content and density in male football (soccer) players. Med Sci Sports Exerc; 33(10): 1682-7.
33. Calbet JA, Moysi JS, Dorado C, et al. 1998. Bone mineral content and density in professional tennis players. Calcif Tissue Int; 62(6): 491-6.
34. Calbet JAL, Vicente-Rodriguez G, Jimenez-Ramirez J, et al. 2003. Enhanced bone mass and physical fitness in prepubescent footballers. Bone; 33(5): 853-859.
35. Carter GD, Carter CR, Gunter E, et al. 2004. Measurement of vitamin D metabolites: an international perspective on methodology and clinical interpretation. J Steroid Biochem Mol Biol; 89-90(1-5): 467-471.
36. Cashman KD. 2002. Calcium intake, calcium bioavailability and bone health. Br J Nutr; 87: S169-S177.
37. Ceglia L. 2009. Vitamin D and its role in skeletal muscle. Curr Opin Clin Nutr Metab Care; 12(6): 628-33.
38. Cleland VJ, Ball K, Magnussen C, et al. 2009. Socioeconomic Position and the Tracking of Physical Activity and Cardiorespiratory Fitness From Childhood to Adulthood. Am J Epidemiol; 170(9): 1069-1077.
39. Cole TJ, Bellizzi MC, Flegal KM, et al. 2000. Establishing a standard definition for child overweight and obesity worldwide: international survey. BMJ; 320(7244): 1240-3.
40. Cole TJ, Freeman JV, and Preece MA. 1995. Body mass index reference curves for the UK, 1990. Arch Dis Child; 73(1): 25-9.
41. Cole TJ, Freeman JV, and Preece MA. 1998. British 1990 growth reference centiles for weight, height, body mass index and head circumference fitted by maximum penalized likelihood. Stat Med; 17(4): 407-29.
42. Cole TJ and Green PJ. 1992. Smoothing reference centile curves: the LMS method and penalized likelihood. Stat Med; 11(10): 1305-19.
43. Constantini NW, Dubnov-Raz G, Chodick G, et al. Physical activity and bone mineral density in adolescents with vitamin D deficiency. Med Sci Sports Exerc; 42(4): 646-50.
44. Cranney A, Weiler HA, O'Donnell S, et al. 2008. Summary of evidence-based review on vitamin D efficacy and safety in relation to bone health. Am J Clin Nutr; 88(2): 513S-519S.
45. Crawley HF and While D. 1995. The diet and body weight of British teenage smokers at 16-17 years. Eur J Clin Nutr; 49(12): 904-914.
46. Currie C, Molcho M, Boyce W, et al. 2008. Researching health inequalities in adolescents: the development of the Health Behaviour in School-Aged Children (HBSC) family affluence scale. Soc Sci Med; 66(6): 1429-36.
47. Currie CE, Elton RA, Todd J, et al. 1997. Indicators of socioeconomic status for adolescents: the WHO Health Behaviour in School-aged Children Survey. Health Educ Res; 12(3): 385-97.
48. Chan GM. 1991. Dietary Calcium and Bone-Mineral Status of Children and Adolescents. Am J Dis Child; 145(6): 631-634.
49. Cheng S, Massaro JM, Fox CS, et al. 2010. Adiposity, cardiometabolic risk, and vitamin D status: the Framingham Heart Study. Diabetes; 59(1): 242-8.
50. De Cocker K, Ottevaere C, Sjostrom M, et al. Self-reported physical activity in European adolescents: results from the HELENA (Healthy Lifestyle in Europe by Nutrition in Adolescence) study. Public Health Nutr; 14(2): 246-54.

European PhD Thesis
127
51. De Henauw S, Gottrand F, De Bourdeaudhuij I, et al. 2007. Nutritional status and lifestyles of adolescents in a public health perspective. The HELENA Project - Healthy Lifestyle in Europe by Nutrition in Adolescence. J Publ Health; 15: 10.
52. Demura S, Yamaji S, Goshi F, et al. 2001. The influence of posture change on measurements of relative body fat in the bioimpedance analysis method. J Physiol Anthropol Appl Human Sci; 20(1): 29-35.
53. Dettwyler KA. 1993. Anthropometric Standardization Reference Manual, Abridged Edition - Lohman,Tg, Roche,Af, Martorell,R. Am J Phys Anthropol 92(2): 239-241.
54. Dong Y, Pollock N, Stallmann-Jorgensen IS, et al. 2010. Low 25-hydroxyvitamin D levels in adolescents: race, season, adiposity, physical activity, and fitness. Pediatrics; 125(6): 1104-11.
55. Drott P, Meurling S, and Gebre-Medhin M. 1993. Interactions of vitamins A and E and retinol-binding protein in healthy Swedish children--evidence of thresholds of essentiality and toxicity. Scand J Clin Lab Invest; 53(3): 275-80.
56. Ekelund U, Anderssen SA, Froberg K, et al. 2007. Independent associations of physical activity and cardiorespiratory fitness with metabolic risk factors in children: the European youth heart study. Diabetologia; 50(9): 1832-40.
57. El-Hajj Fuleihan G, Nabulsi M, Tamim H, et al. 2006. Effect of vitamin D replacement on musculoskeletal parameters in school children: a randomized controlled trial. J Clin Endocrinol Metab; 91(2): 405-12.
58. Elamin MB, Abu Elnour NO, Elamin KB, et al. Vitamin D and cardiovascular outcomes: a systematic review and meta-analysis. J Clin Endocrinol Metab; 96(7): 1931-42.
59. Elmadfa I, Bartens C, Jakob E, et al. 1994. Nutritional status and the immune system: fat-soluble vitamins and other nutrients. Bibl Nutr Dieta, (51): 136-41.
60. Elmadfa I and Freisling H. 2009. Nutritional status in Europe: methods and results. Nutr Rev; 67 Suppl 1: S130-4.
61. Elmadfa I, Godina-Zarfl B, Dichtl M, et al. 1994. The Austrian Study on Nutritional Status of 6- to 18-year-old pupils. Bibl Nutr Dieta, (51): 62-7.
62. Ernährung DGf, 2000;1 Referenzwerte für die Nährstoffzufuhr, ed. F.U.B. GmbH. 63. FAO/WHO/ONU, 1985 Energy and protein requirements. Technical report series (WHO); 724.
Genova. 64. Farkas K, Sarman B, Molnar J, et al. 1998. Antioxidant vitamin A status in IDDM and
hyperlipidaemia. Diabetologia; 41: A349-A349. 65. Ferrari SL. 2005. Osteoporosis: A complex disorder of aging with multiple genetic and
environmental determinants. World Rev Nutr Diet; 95: 35-51. 66. FNB and IOM, 2000 Dietary Reference Intakes for Vitamin C, Vitamin E, Selenium, and
Carotenoids. Ed.National Academy Press. Washington, DC. 67. FNB and IOM, 2001 Dietary Reference Intakes for Vitamin A, Vitamin K, Arsenic, Boron,
Chromium, Copper, Iodine, Iron, Manganese, Molybdenum, Nickel, Silicon, Vanadium, and Zinc. Ed.National Academy Press. Washington, DC.
68. FNB and IOM. 2011. Dietary reference intakes for calcium, phosphorus, magnesium, vitamin D and fluoride. Ed.National Academy Press. Washington, DC
69. Foo LH, Zhang Q, Zhu K, et al. 2009. Low vitamin D status has an adverse influence on bone mass, bone turnover, and muscle strength in Chinese adolescent girls. J Nutr; 139(5): 1002-7.
70. Foo LH, Zhang Q, Zhu K, et al. 2009. Relationship between vitamin D status, body composition and physical exercise of adolescent girls in Beijing. Osteoporos Int; 20(3): 417-25.
71. Freitas D, Maia J, Beunen G, et al. 2007. Socio-economic status, growth, physical activity and fitness: The Madeira Growth Study. Ann Hum Biol 34(1): 107-122.
72. Gilbert-Diamond D, Baylin A, Mora-Plazas M, et al. Vitamin D deficiency and anthropometric indicators of adiposity in school-age children: a prospective study. Am J Clin Nutr; 92(6): 1446-51.
73. Gonzalez-Gross M, Breidenassel C, Gomez-Martinez S, et al. 2008. Sampling and processing of fresh blood samples within a European multicenter nutritional study: evaluation of biomarker stability during transport and storage. Int J Obes (Lond); 32 Suppl 5: S66-75.
74. Gonzalez-Gross M, Breidenassel C, Gomez S, et al. 2008. Sampling and processing of fresh blood samples within a European multicenter nutritional study: evaluation of biomarker stability during transport and storage. Int J Obes; 32: S66-S75.
75. Gonzalez-Gross M, Valtuena J, Breidenassel C, et al. 2011. Vitamin D status among adolescents in Europe: the Healthy Lifestyle in Europe by Nutrition in Adolescence study. Br J Nutr; 17: 1-10.

Valtueña J, 2012
128
76. González-Gross M, Valtueña J, Breidenassel C, et al. 2011. Vitamin D status among adolescents in Europe. The HELENA study. . Br J Nutr In press.
77. Gordon CM, DePeter KC, Feldman HA, et al. 2004. Prevalence of vitamin D deficiency among healthy adolescents. Arch Pediatr Adolesc Med; 158(6): 531-7.
78. Gracia-Marco L, Moreno LA, Ortega FB, et al. 2011. Levels of Physical Activity That Predict Optimal Bone Mass in Adolescents The HELENA Study. Am J Prev Med; 40(6): 599-607.
79. Gracia-Marco L V-RG, Casajus JA, Molnar D, Castillo MJ, Moreno LA 2011. Effect of fitness and physical activity on bone mass in adolescents: the HELENA Study. . Eur J Appl Physiol in press.
80. Grant WB. 2011. An estimate of the global reduction in mortality rates through doubling vitamin D levels. Eur J Clin Nutr; 65(9): 1016-26.
81. Grant WB, Cross HS, Garland CF, et al. 2009. Estimated benefit of increased vitamin D status in reducing the economic burden of disease in western Europe. Prog Biophys Mol Biol; 99(2-3): 104-13.
82. Greene DA, Naughton GA, Briody JN, et al. 2005. Bone strength index in adolescent girls: does physical activity make a difference? Br J Sports Med 39(9): 622-627.
83. Gregory J, Lowe S, Bates C, et al., 2000 National Diet and Nutrition Survey: young people aged 4-18 years. Volume 1: Report of the diet and nutrition survey. London.
84. Gregory JR LS, Bates CJ, Prentice A, Jackson LV, Smithers G, Wenlock R, Farron H. , ed. National Diet and Nutrition Survey: young people aged 4 to 18 years. . Report of the diet and nutrition survey. 2000, HMSO.London.
85. Guillemant J, Allemandou A, Peres G, et al. 2000. Wintertime vitamin D deficiency in male adolescents: Response to vitamin D3 supplements. J Bone Miner Res; 15: S450-S450.
86. Guillemant J, Le HT, Maria A, et al. 2001. Wintertime vitamin D deficiency in male adolescents: Effect on parathyroid function and response to vitamin D-3 supplements. Osteoporos Int; 12(10): 875-879.
87. Guillemant J, Taupin P, Le HT, et al. 1999. Vitamin D status during puberty in French healthy male adolescents. Osteoporos Int; 10(3): 222-5.
88. Hamilton B. Vitamin D and human skeletal muscle. Scand J Med Sci Sports; 20(2): 182-90. 89. Hassapidou M, Kafatos A, and Manoukas G. 1996. Dietary vitamin E intake and plasma
tocopherol levels of a group of adolescents from Spili, Crete. Int J Food Sci Nutr; 47(5): 365-368.
90. Haubrock J, Nothlings U, Volatier JL, et al. 2011. Estimating Usual Food Intake Distributions by Using the Multiple Source Method in the EPIC-Potsdam Calibration Study. J Nutr; 141(5): 914-920.
91. Heaney RP, Davies KM, and Barger-Lux MJ. 2002. Calcium and weight: Clinical studies. J Am Coll Nutr; 21(2): 152s-155s.
92. Herbeth B, Chavance M, Musse N, et al. 1990. Determinants of plasma retinol, beta-carotene, and alpha-tocopherol. Am J Epidemiol; 132(2): 394-6.
93. Herbeth B, Spyckerelle Y, and Deschamps JP. 1991. Determinants of plasma retinol, beta-carotene, and alpha-tocopherol during adolescence. Am J Clin Nutr; 54(5): 884-9.
94. Hercberg S, Preziosi P, Galan P, et al. 1994. Vitamin status of a healthy French population: dietary intakes and biochemical markers. Int J Vitam Nutr Res; 64(3): 220-32.
95. Hill KM, McCabe GP, McCabe LD, et al. 2010. An inflection point of serum 25-hydroxyvitamin D for maximal suppression of parathyroid hormone is not evident from multi-site pooled data in children and adolescents. J Nutr; 140(11): 1983-8.
96. Hill TR, Cotter AA, Mitchell S, et al. 2008. Vitamin D status and its determinants in adolescents from the Northern Ireland Young Hearts 2000 cohort. Br J Nutr; 99(5): 1061-7.
97. Holick MF. 1996. Vitamin D and bone health. J Nutr; 126(4 Suppl): 1159S-64S. 98. Holick MF. 1998. Vitamin D requirements for humans of all ages: New increased requirements
for women and men 50 years and older. Osteoporos Int; 8: S24-S29. 99. Holick MF. 2004. Sunlight and vitamin D for bone health and prevention of autoimmune
diseases, cancers, and cardiovascular disease. Am J Clin Nutr; 80(6 Suppl): 1678S-88S. 100. Holick MF. 2004. Vitamin D: importance in the prevention of cancers, type 1 diabetes, heart
disease, and osteoporosis. Am J Clin Nutr; 79(3): 362-71. 101. Holick MF. 2005. The vitamin D epidemic and its health consequences. J Nutr; 135(11): 2739S-
48S. 102. Holick MF. 2007. Optimal vitamin D status for the prevention and treatment of osteoporosis.
Drugs Aging; 24(12): 1017-29. 103. Holick MF. 2007. Vitamin D deficiency. N Engl J Med; 357(3): 266-81.

European PhD Thesis
129
104. Holick MF. 2008. The vitamin D deficiency pandemic and consequences for nonskeletal health: mechanisms of action. Mol Aspects Med; 29(6): 361-8.
105. Holick MF. 2009. Vitamin D: the other steroid hormone for muscle function and strength. Menopause; 16(6): 1077-8.
106. Holick MF, Malabanan A, and Veronikis IE. 1998. Redefining vitamin D insufficiency. Lancet; 351(9105): 805-806.
107. Huh SY and Gordon CM. 2008. Vitamin D deficiency in children and adolescents: epidemiology, impact and treatment. Rev Endocr Metab Disord; 9(2): 161-70.
108. Hunter D, De Lange M, Snieder H, et al. 2001. Genetic contribution to bone metabolism, calcium excretion, and vitamin D and parathyroid hormone regulation. J Bone Miner Res; 16(2): 371-378.
109. Iliescu C, Beghin L, Maes L, et al. 2008. Socioeconomic questionnaire and clinical assessment in the HELENA Cross-Sectional Study: methodology. Int J Obes (Lond); 32 Suppl 5: S19-25.
110. Jackson MH, Reddick KB, and Dubes RG. 1995. Self-concept correlates between at-risk and not-at-risk ninth-grade students. Psychol Rep; 76(2): 683-7.
111. Jago R, Harrell JS, McMurray RG, et al. 2006. Prevalence of abnormal lipid and blood pressure values among an ethnically diverse population of eighth-grade adolescents and screening implications. Pediatrics; 117(6): 2065-2073.
112. Jain A, Agrawal BK, Varma M, et al. 2009. Antioxidant status and smoking habits: relationship with diet. Singapore Med J; 50(6): 624-627.
113. Janssen I, Boyce WF, Simpson K, et al. 2006. Influence of individual- and area-level measures of socioeconomic status on obesity, unhealthy eating, and physical inactivity in Canadian adolescents. Am J Clin Nutr; 83(1): 139-45.
114. Johnell O and Kanis JA. 2006. An estimate of the worldwide prevalence and disability associated with osteoporotic fractures. Osteoporos Int; 17(12): 1726-1733.
115. Jones J, Carter GD, Carter R, et al. 2004. How accurate are assays for 25-hydroxyvitamin D? Data from the international vitamin D external quality assessment scheme. Clin Chem; 50(11): 2195-2197.
116. Juttmann JR, Visser TJ, Buurman C, et al. 1981. Seasonal fluctuations in serum concentrations of vitamin D metabolites in normal subjects. Br Med J (Clin Res Ed); 282(6273): 1349-52.
117. Kimlin MG, Downs NJ, and Parisi AV. 2003. Comparison of human facial UV exposure at high and low latitudes and the potential impact on dermal vitamin D production. Photochem Photobiol Sci; 2(4): 370-5.
118. Koenig J and Elmadfa I. 2000. Status of calcium and vitamin D of different population groups in Austria. Int J Vitam Nutr Res; 70(5): 214-220.
119. Koletzko B, de la Gueronniere V, Toschke AM, et al. 2004. Nutrition in children and adolescents in Europe: what is the scientific basis? Introduction. Br J Nutr; 92(Suppl 2): S67-73.
120. Krajcovicová-Kudlácková M SR, Béderová A,Grancicová E,Magálová T. 1997. Influence of vegetarian and mixed nutrition on selected haematological and biochemical parameters in children. . Nahrung 41(5): 4.
121. Krall EA, Sahyoun N, Tannenbaum S, et al. 1989. Effect of Vitamin-D Intake on Seasonal-Variations in Parathyroid-Hormone Secretion in Postmenopausal Women. N Engl J Med; 321(26): 1777-1783.
122. Kremer R, Campbell PP, Reinhardt T, et al. 2009. Vitamin D status and its relationship to body fat, final height, and peak bone mass in young women. J Clin Endocrinol Metab; 94(1): 67-73.
123. Krinsky NI. 2003. Human requirements for fat-soluble vitamins, and other things concerning these nutrients. Mol Aspects Med; 24(6): 317-24.
124. Lamberg-Allardt CJ and Viljakainen HT. 2008. 25-Hydroxyvitamin D and functional outcomes in adolescents. Am J Clin Nutr; 88(2): 534S-536S.
125. Lambert J, Agostoni C, Elmadfa I, et al. 2004. Dietary intake and nutritional status of children and adolescents in Europe. Br J Nutr; 92 Suppl 2: S147-211.
126. Lanham-New SA, Buttriss JL, Miles LM, et al. Proceedings of the Rank Forum on Vitamin D. Br J Nutr; 105(1): 144-56.
127. Lanham-New SA TR, More J, Brooke-Wavell K, Hunking P & Medici E. 2007. Importance of vitamin D, calcium and exercise to bone health with specific reference to children and adolescents. . Nutr Bull 32: 364-377.
128. LeBoff MS, Kohlmeier L, Hurwitz S, et al. 1999. Occult vitamin D deficiency in postmenopausal US women with acute hip fracture. JAMA; 281(16): 1505-11.
129. Leger L, Lambert J, Goulet A, et al. 1984. [Aerobic capacity of 6 to 17-year-old Quebecois--20 meter shuttle run test with 1 minute stages]. Can J Appl Sport Sci; 9(2): 64-9.

Valtueña J, 2012
130
130. Leger LA, Mercier D, Gadoury C, et al. 1988. The multistage 20 metre shuttle run test for aerobic fitness. J Sports Sci; 6(2): 93-101.
131. Lehtonen-Veromaa M, Mottonen T, Irjala K, et al. 1999. Vitamin D intake is low and hypovitaminosis D common in healthy 9- to 15-year-old Finnish girls. Eur J Clin Nutr; 53(9): 746-51.
132. Lehtonen-Veromaa MK MT, Nuotio IO, Irjala KM, Leino AE, Viikari JS. . 2002. Vitamin D and attainment of peak bone mass among peripubertal Finnish girls: a 3-y prospective study. . Am J Clin Nutr. ; 76(6): 8.
133. Lenders CM, Feldman HA, Von Scheven E, et al. 2009. Relation of body fat indexes to vitamin D status and deficiency among obese adolescents. Am J Clin Nutr; 90(3): 459-67.
134. Liel Y, Ulmer E, Shary J, et al. 1988. Low Circulating Vitamin-D in Obesity. Calcif Tissue Int; 43(4): 199-201.
135. Lips P. Worldwide status of vitamin D nutrition. J Steroid Biochem Mol Biol; 121(1-2): 297-300.
136. Lips P, Chapuy MC, Dawson-Hughes B, et al. 1999. An international comparison of serum 25-hydroxyvitamin D measurements. Osteoporos Int; 9(5): 394-7.
137. Lukaski HC. 2004. Vitamin and mineral status: effects on physical performance. Nutrition; 20(7-8): 632-44.
138. Malvy DJ, Burtschy B, Dostalova L, et al. 1993. Serum retinol, beta-carotene, alpha-tocopherol and cholesterol in healthy French children. Int J Epidemiol; 22(2): 237-46.
139. Malvy JM, Mourey MS, Carlier C, et al. 1989. Retinol, beta-carotene and alpha-tocopherol status in a French population of healthy children. Int J Vitam Nutr Res; 59(1): 29-34.
140. Marktl W, Rudas B, and Brubacher G. 1982. The vitamin status of Viennese school children aged 11-12 years. Int J Vitam Nutr Res; 52(2): 198-206.
141. Maynard LM, Wisemandle W, Roche AF, et al. 2001. Childhood body composition in relation to body mass index. Pediatrics; 107(2): 344-50.
142. McKenna MJ and Freaney R. 1998. Secondary hyperparathyroidism in the elderly: Means to defining hypovitaminosis D. Osteoporos Int; 8: S3-S6.
143. Merke J, Hofmann W, Goldschmidt D, et al. 1987. Demonstration of 1,25(OH)2 vitamin D3 receptors and actions in vascular smooth muscle cells in vitro. Calcif Tissue Int; 41(2): 112-4.
144. Millen AE and Bodnar LM. 2008. Vitamin D assessment in population-based studies: a review of the issues. Am J Clin Nutr; 87(4): 1102S-5S.
145. Molnar D, Decsi T, and Koletzko B. 2004. Reduced antioxidant status in obese children with multimetabolic syndrome. Int J Obes Relat Metab Disord; 28(10): 1197-202.
146. Monsen ER. 2000. Dietary Reference intakes for the antioxidant nutrients: Vitamin C, vitamin E, selenium, and carotenoids (vol 100, pg 638, 2000). J Am Diet Assoc 100(9): 1008-1009.
147. Moreno L. 2008. Adolescence.In: Koletzko B.(editor) Pediatric Nutrition in Practice. Karger: Basel
148. Moreno LA, De Henauw S, Gonzalez-Gross M, et al. 2008. Design and implementation of the Healthy Lifestyle in Europe by Nutrition in Adolescence Cross-Sectional Study. Int J Obes (Lond); 32 Suppl 5: S4-11.
149. Moreno LA, Joyanes M, Mesana MI, et al. 2003. Harmonization of anthropometric measurements for a multicenter nutrition survey in Spanish adolescents. Nutrition; 19(6): 481-6.
150. Moreno LA, Mesana MI, Fleta J, et al. 2005. Overweight, obesity and body fat composition in Spanish adolescents - The AVENA study. Ann Nutr Metab 49(2): 71-76.
151. Moreno LA, Tomas C, Gonzalez-Gross M, et al. 2004. Micro-environmental and socio-demographic determinants of childhood obesity. Int J Obes (Lond) 28: S16-S20.
152. Nagy E, Vicente-Rodriguez G, Manios Y, et al. 2008. Harmonization process and reliability assessment of anthropometric measurements in a multicenter study in adolescents. Int J Obes (Lond); 32 Suppl 5: S58-65.
153. Norman AW, Nemere I, Zhou LX, et al. 1992. 1,25(OH)2-vitamin D3, a steroid hormone that produces biologic effects via both genomic and nongenomic pathways. J Steroid Biochem Mol Biol; 41(3-8): 231-40.
154. Okuno J, Tomura S, Yabushita N, et al. Effects of serum 25-hydroxyvitamin D(3) levels on physical fitness in community-dwelling frail women. Arch Gerontol Geriatr; 50(2): 121-6.
155. Ortega FB, Artero EG, Ruiz JR, et al. 2008. Reliability of health-related physical fitness tests in European adolescents. The HELENA Study. Int J Obes (Lond); 32 Suppl 5: S49-57.
156. Ortega FB, Ruiz JR, Castillo MJ, et al. 2005. Low Level of Physical Fitness in Spanish Adolescents. Relevance for Future Cardiovascular Health (AVENA Study). Rev Esp Cardiol; 58(8): 898-909.

European PhD Thesis
131
157. Ortega FB, Ruiz JR, Castillo MJ, et al. 2008. Physical fitness in childhood and adolescence: a powerful marker of health. Int J Obes (Lond); 32(1): 1-11.
158. Ortega RM, Mena MC, Faci M, et al. 2001. Vitamin status in different groups of the Spanish population: a meta-analysis of national studies performed between 1990 and 1999. Public Health Nutr; 4(6A): 1325-9.
159. Outila TA, Karkkainen MU, and Lamberg-Allardt CJ. 2001. Vitamin D status affects serum parathyroid hormone concentrations during winter in female adolescents: associations with forearm bone mineral density. Am J Clin Nutr; 74(2): 206-10.
160. Ovesen L, Andersen R, and Jakobsen J. 2003. Geographical differences in vitamin D status, with particular reference to European countries. Proc Nutr Soc; 62(4): 813-21.
161. Paluska SA and Schwenk TL. 2000. Physical activity and mental health: current concepts. Sports Med; 29(3): 167-80.
162. Parikh SJ, Edelman M, Uwaifo GI, et al. 2004. The relationship between obesity and serum 1,25-dihydroxy vitamin D concentrations in healthy adults. J Clin Endocrinol Metab; 89(3): 1196-9.
163. Parizkova J. 2008. Impact of education on food behaviour, body composition and physical fitness in children. Br J Nutr; 99: S26-S32.
164. Parker J, Hashmi O, Dutton D, et al. Levels of vitamin D and cardiometabolic disorders: systematic review and meta-analysis. Maturitas; 65(3): 225-36.
165. Perez-Lopez FR, Chedraui P, and Fernandez-Alonso AM. 2011. Vitamin D and aging: beyond calcium and bone metabolism. Maturitas; 69(1): 27-36.
166. Pfeifer M, Begerow B, and Minne HW. 2002. Vitamin D and muscle function. Osteoporos Int; 13(3): 187-94.
167. Pfeifer M, Begerow B, Minne HW, et al. 2009. Effects of a long-term vitamin D and calcium supplementation on falls and parameters of muscle function in community-dwelling older individuals. Osteoporos Int; 20(2): 315-22.
168. Pilz S, Dobnig H, Winklhofer-Roob B, et al. 2008. Low serum levels of 25-hydroxyvitamin D predict fatal cancer in patients referred to coronary angiography. Cancer Epidemiol Biomarkers Prev; 17(5): 1228-33.
169. Pilz S, Tomaschitz A, Drechsler C, et al. Vitamin D deficiency and myocardial diseases. Mol Nutr Food Res; 54(8): 1103-13.
170. Pilz S, Tomaschitz A, Drechsler C, et al. Vitamin D supplementation: a promising approach for the prevention and treatment of strokes. Curr Drug Targets; 12(1): 88-96.
171. Power C, Graham H, Due P, et al. 2005. The contribution of childhood and adult socioeconomic position to adult obesity and smoking behaviour: an international comparison. Int J Epidemiol; 34(2): 335-44.
172. Prentice A, Branca F, Decsi T, et al. 2004. Energy and nutrient dietary reference values for children in Europe: methodological approaches and current nutritional recommendations. Br J Nutr; 92 Suppl 2: S83-146.
173. Prista A, Maia JA, Damasceno A, et al. 2003. Anthropometric indicators of nutritional status: implications for fitness, activity, and health in school-age children and adolescents from Maputo, Mozambique. Am J Clin Nutr; 77(4): 952-9.
174. Przeweda R and Dobosz J. 2003. Growth and physical fitness of Polish youths in two successive decades. J Sports Med Phys Fitness; 43(4): 465-74.
175. Racinais S, Hamilton B, Li CK, et al. 2010. Vitamin D and physical fitness in Qatari girls. Arch Dis Child; 95(10): 854-5.
176. Rachez C and Freedman LP. 2000. Mechanisms of gene regulation by vitamin D(3) receptor: a network of coactivator interactions. Gene; 246(1-2): 9-21.
177. Reilly JJ, Mutunga M, Gallagher AM, et al. 2006. Socioeconomic differences in risk factors for obesity in adolescents in Northern Ireland. Int J Pediatr Obes; 1(2): 114-119.
178. Rizzoli R, Bianchi ML, Garabedian M, et al. 2010. Maximizing bone mineral mass gain during growth for the prevention of fractures in the adolescents and the elderly. Bone; 46(2): 294-305.
179. Rockell JE, Green TJ, Skeaff CM, et al. 2005. Season and ethnicity are determinants of serum 25-hydroxyvitamin D concentrations in New Zealand children aged 5-14 y. J Nutr; 135(11): 2602-8.
180. Rolland-Cachera MF, Bellisle F, and Deheeger M. 2000. Nutritional status and food intake in adolescents living in Western Europe. Eur J Clin Nutr; 54 Suppl 1: S41-6.
181. Ross AC, Manson JE, Abrams SA, et al. 2011. The 2011 Report on Dietary Reference Intakes for Calcium and Vitamin D from the Institute of Medicine: What Clinicians Need to Know. J Clin Endocrinol Metab; 96(1): 53-58.

Valtueña J, 2012
132
182. Rovner AJ and O'Brien KO. 2008. Hypovitaminosis D among healthy children in the United States - A review of the current evidence. Arch Pediatr Adolesc Med; 162(6): 513-519.
183. Ruiz JR, Espana-Romero V, Ortega FB, et al. 2006. Hand span influences optimal grip span in male and female teenagers. J Hand Surg Am; 31(8): 1367-72.
184. Ruiz JR OF, Gutierrez A, Meusel D, Sjöström M, Castillo MJ. . 2006. Health-related fitness assessment in childhood and adolescence: a European approach based on the AVENA, EYHS and HELENA studies. J Public Health 14: 8.
185. Saggese G, Baroncelli GI, and Bertelloni S. 2002. Puberty and bone development. Best Pract Res Clin Endocrinol Metab; 16(1): 53-64.
186. Scragg R and Camargo CA, Jr. 2008. Frequency of leisure-time physical activity and serum 25-hydroxyvitamin D levels in the US population: results from the Third National Health and Nutrition Examination Survey. Am J Epidemiol; 168(6): 577-86; discussion 587-91.
187. Scharla SH. 1998. Prevalence of subclinical vitamin D deficiency in different European countries. Osteoporos Int; 8 Suppl 2: S7-12.
188. Scharla SH, ScheidtNave C, Leidig G, et al. 1996. Lower serum 25-hydroxyvitamin D is associated with increased bone resorption markers and lower bone density at the proximal femur in normal females: A population-based study. Exp Clin Endocrinol Diabetes; 104(3): 289-292.
189. Schrijver J. 1991. Biochemical markers for micronutrient status and their interpretation, in modern lifestyles, lower energy intake and micronutrient status. Springer-Verlag.
190. Seibel MJ, Woitge HW, Scheidt-Nave C, et al. 1998. Seasonal variation of biochemical indexes of bone turnover: Results of a population-based study. J Clin Endocrinol Metab; 83(1): 68-75.
191. Serra-Majem L. 2001. Vitamin and mineral intakes in European children. Is food fortification needed? Public Health Nutr; 4(1A): 7.
192. Shea MK, Benjamin EJ, Dupuis J, et al. 2009. Genetic and non-genetic correlates of vitamins K and D. Eur J Clin Nutr; 63(4): 458-464.
193. Smotkin-Tangorra M, Purushothaman R, Gupta A, et al. 2007. Prevalence of vitamin D insufficiency in obese children and adolescents. J Pediatr Endocrinol Metab; 20(7): 817-23.
194. Souberbielle JC, Friedlander G, Kahan A, et al. 2006. Evaluating vitamin D status. Implications for preventing and managing osteoporosis and other chronic diseases. Joint Bone Spine; 73(3): 249-253.
195. Stewart JW, Alekel DL, Ritland LM, et al. 2009. Serum 25-hydroxyvitamin D is related to indicators of overall physical fitness in healthy postmenopausal women. Menopause; 16(6): 1093-1101.
196. Stoffman N and Gordon CM. 2009. Vitamin D and adolescents: what do we know? Curr Opin Pediatr; 21(4): 465-71.
197. Strong WB, Malina RM, Blimkie CJ, et al. 2005. Evidence based physical activity for school-age youth. J Pediatr; 146(6): 732-7.
198. Summerbell CD, Waters E, Edmunds LD, et al. 2005. Interventions for preventing obesity in children. Cochrane Database Syst Rev; 20(3): CD001871.
199. Tanner JM. 1981. Growth and maturation during adolescence. Nutr Rev; 39(2): 43-55. 200. Tanner JM and Whitehouse RH. 1976. Clinical longitudinal standards for height, weight, height
velocity, weight velocity, and stages of puberty. Arch Dis Child; 51(3): 170-9. 201. Tjellesen L and Christiansen C. 1983. Vitamin-D Metabolites in Normal Subjects during One
Year - a Longitudinal-Study. Scand J Clin Lab Invest; 43(1): 85-89. 202. Tylavsky FA, Cheng SL, Lyytikainen A, et al. 2006. Strategies to improve vitamin D status in
northern European children: Exploring the merits of vitamin D fortification and supplementation. J Nutr; 136(4): 1130-1134.
203. Valtueña J. 2011. 25-Hydroxyvitamin D levels of European adolescents are highly influenced by latitude, muscular strength, calcium intake and supplementation apart from season. The HELENA study. In press.
204. Valtueña J, Breidenassel C, Folle J, et al. 2011. Retinol, beta-carotene, alpha-tocopherol and vitamin D status in European adolescents; regional differences an variability: A review. Nutr Hosp; 26(2): 280-8.
205. Van der Wielen PJ dGL, van StaverenWA et al 1995. Serum vitamin D concentrations among elderly people in Europe. Lancet; 346: 4.
206. Vereecken CA, Covents M, Matthys C, et al. 2005. Young adolescents' nutrition assessment on computer (YANA-C). J Bone Miner Metab; 59(5): 658-667.

European PhD Thesis
133
207. Vereecken CA, Covents M, Sichert-Hellert W, et al. 2008. Development and evaluation of a self-administered computerized 24-h dietary recall method for adolescents in Europe. Int J Obes (Lond); 32 Suppl 5: S26-34.
208. Vicente-Rodriguez G, Ezquerra J, Mesana MI, et al. 2008. Independent and combined effect of nutrition and exercise on bone mass development. J Bone Miner Metab; 26(5): 416-424.
209. Vicente-Rodriguez G, Urzanqui A, Mesana MI, et al. 2008. Physical fitness effect on bone mass is mediated by the independent association between lean mass and bone mass through adolescence: a cross-sectional study. J Bone Miner Metab; 26(3): 288-94.
210. Ward KA, Das G, Berry JL, et al. 2009. Vitamin D status and muscle function in post-menarchal adolescent girls. J Clin Endocrinol Metab; 94(2): 559-63.
211. Wardle J and Shrewsbury V. 2008. Socioeconomic status and adiposity in childhood: A systematic review of cross-sectional studies 1990-2005. Obesity; 16(2): 275-284.
212. Wells JC. 2000. A Hattori chart analysis of body mass index in infants and children. Int J Obes Relat Metab Disord; 24(3): 325-9.
213. Wells JC, Coward WA, Cole TJ, et al. 2002. The contribution of fat and fat-free tissue to body mass index in contemporary children and the reference child. Int J Obes Relat Metab Disord; 26(10): 1323-8.
214. Weng FL, Shults J, Leonard MB, et al. 2007. Risk factors for low serum 25-hydroxyvitamin D concentrations in otherwise healthy children and adolescents. Am J Clin Nutr; 86(1): 150-8.
215. Whiting SJ, Langlois KA, Vatanparast H, et al. 2011. The vitamin D status of Canadians relative to the 2011 Dietary Reference Intakes: an examination in children and adults with and without supplement use. Am J Clin Nutr; 94(1): 128-135.
216. WHO, 1997 Obesity, preventing and managing the global epidemic: Report of the WHO consultation of obesity. In: Report of the WHO consultation of obesity. Ed. W.H. Organisation. Geneva.
217. Winklhofer-Roob BM, van't Hof MA, and Shmerling DH. 1997. Reference values for plasma concentrations of vitamin E and A and carotenoids in a Swiss population from infancy to adulthood, adjusted for seasonal influences. Clin Chem; 43(1): 146-53.
218. Wortsman J, Matsuoka LY, Chen TC, et al. 2000. Decreased bioavailability of vitamin D in obesity. Am J Clin Nutr; 72(3): 690-3.
219. Yang X, Telama R, Viikari J, et al. 2006. Risk of obesity in relation to physical activity tracking from youth to adulthood. Med Sci Sports Exerc; 38(5): 919-25.
220. Yetley EA. 2008. Assessing the vitamin D status of the US population. Am J Clin Nutr; 88(2): 558S-564S.
221. Zemel MB. 2002. Regulation of adiposity and obesity risk by dietary calcium: Mechanisms and implications. J Am Coll Nutr; 21(2): 146s-151s.
222. Zerwekh JE. 2008. Blood biomarkers of vitamin D status. Am J Clin Nutr; 87(4): 1087S-91S. 223. Zimmermann MB, Aeberli I, Molinari L, et al. 2006. Dietary intakes of fat and antioxidant
vitamins are predictors of subclinical inflammation in overweight Swiss children. Am J Clin Nutr; 84(4): 748-755.
224. Zittermann A. 2006. Vitamin D and disease prevention with special reference to cardiovascular disease. Prog Biophys Mol Biol; 92(1): 39-48.

Valtueña J, 2012
134

European PhD Thesis
135
APPENDIX 1
Healthy Lifestyle in Europe by Nutrition in Adolescence in 13-16 years
Adolescents across Europe.
Cross-sectional study (HELENA-CSS) and Pilot Study.
CASE
REPORT
FORM
Subject number : H2
Subjects initials : first name/second name /family name

Valtueña J, 2012
136
GENERAL INSTRUCTIONS FOR THE INVESTIGATOR General Instructions for the Investigator (see SOP of the CRF) When completing this CRF, please - Use a ballpoint, fine-tip pen (permanent ink), black or blue. - Make sure that all entries are clear and legible, preferably in block letters. - Use English and specific medical terminology. - Make corrections by drawing a single line through the incorrect item, which must remain legible, and
write the correct data next to it. - Do not use correction fluids or any other method of erasure! - Date and initial for all corrections and changes. - Tick closed boxes and circles Do not use - abbreviations and acronyms Subject Initials : first name-middle-family/last name (ex) Jean Marcel DUPONT J M D - If, there is no second name, put a “-“ - Subject initials must remain consistent throughout the CRF. - Enrolment Code - Subjects will be assigned an enrolment code number at inclusion : study code Helena CSS – H1 - city
number (see Appendix) -number of study inclusion
Subject number: H2 Number of centre Number of school Number of the class Number of subject
Exemple H2 0 4 0 1 0 5 1 0 Missing Data - If some information has been impossible to obtain, please strike out the field/box and explain briefly
next to the field/box why the information is missing. Historical dates - If a historical date, or part of a historical date, has been impossible to obtain, please fill in as much as
is known and strike out the remaining field(s) Sic - Indicate data which are unusual or unexpected but still correct by noting ‘Sic’ next to that data. Sic
can be understood as ‘so is correct.’

European PhD Thesis
137
SELECTION OF SUBJECTS Inclusion Criteria Yes No
Male and female subjects aged 13 – 16 2 years
Schooling in one of the participating cities
Informed consent form signed by the parents and/or the legal representative. Exclusion Criteria Subject participating simultaneously in another research trial
Subject number :
Date of consent : 2 0 0 day month year
Visit Date : 2 0 0 day month year
Name and signature of the investigator :

Valtueña J, 2012
138
PHYSICAL EXAMINATION 1) Date of Birth : 1 9 day month year
2) Sex : Male (1) Female (2) 3) Medical personal history (including traumatic accidents): None (0)
Or Medical diagnosis (see coding annex): (1)
Year of diagnosis /or intervention
Past medical or surgical history (coding)
1 / 2 / 3 / 4 / 5 / 6 / 7 / 8 /
4) Current treatment (medication or supplements) Has the subject taken any treatment for more than 7 days during the last 30 days ? Yes (1) No (0)

European PhD Thesis
139
If yes, please specify when and what was taken):
During of medication
Start date (dd/mm/year)
End date (dd/mm/year)
On going
What Medication
(INNs)
CODE (see appendix IV)
1 / / / / /
2 / / / / /
3 / / / / /
4 / / / / /
5 / / / / /
6 / / / / /
7 / / / / /
8 / / / / /
Has the subject taken any treatment in the last 24 hours? (except when on going is ticked)
Yes (1) No (0) Fever (>38°C) during the last 24 hours Yes (1) No (0) 5) Allergy Has patient any allergy? Yes (1) No (0) If yes, please indicate which type of allergen? Pollen Dust Food Animal Other:
If Other, please specify (one letter per case)
Which is/are the clinical signs ?
Atopic dermatitis Urticaria Allergic rhinitis Asthma Other
If Other, please specify (one capital letter per case)

Valtueña J, 2012
140
6) Clinical examination of following items and tick the appropriate box :
Normal Abnormal If abnormal findings, specify
a) General condition (1) (0)
…………………………… b) Abdominal palpation (1) (0)
…………………………… c) Pulmonary auscultation (1) (0)
…………………………... d) Cardiac auscultation (1) (0)
…………………………... e) Other abnormalities if detected
(one capital letter per case)
7) Pubertal status (see appendix I)
Girls a) breast b) pilosity 1 2 3 4 5 1 2 3 4 5
Boys a) gonade b) pilosity 1 2 3 4 5 1 2 3 4 5
Only for girls, if adaptable Have you already your menses?
Yes (1) No (0)

European PhD Thesis
141
Age of menarchy: Months Year
Date of last menstruation : dd mm Year Daily oral contraception ? Yes (1) No (0)
Or Patch contraception? Yes (1) No (0)
CLINICAL PARAMETERS 8) Anthropometry
a) Height : cm b) Weight : kg
9) Bio-impedancemetry :
measurement
Resistance
Reactance
o % of Body Density by Bop Pod (optional):
measurement
,

Valtueña J, 2012
142
10) SKIN FOLD THICKNESS
1st measurement 2nd measurement 3nd measurementa) Bicipital (mm)
b) Tricipital (mm)
c) Sub-scapular (mm)
d) Suprailiac (mm)
e) Thigh (mm)
f) Calf (mm)
11) CIRCUMFERENCES
1st measurement 2nd measurement 3nd measurementa) Arm (mm)
b) Biceps (mm)
c) Waist (mm)
d) Hip (mm)
e) Proximal thigh (mm)
12) VITAL SIGNS
a) Blood pressure (mmHg) :
Systolic 1 Diastolic 1 Systolic 2 Diastolic 2
b) Heart Rate ( beats/min) : 13) Do the subject participate to accelerometry assessment ? Yes (1) No
, , ,
, , ,
,
,
, ,
,
, , ,
,
,
,
,
,
, , ,
, ,
, , ,
, , ,
, , ,
European PhD Thesis
143
BLOOD SAMPLES Laboratory Assessments, blood Yes No Subject allocated to a blood samples class?
Yes No Blood samples have been collected (including specific questionnary?) Sample Date / /
dd mm Year
Did the adolescent have fever/cold the day of blood samples?
Please fill the appropriate Laboratory request form HELENA-CSS

Valtueña J, 2012
144
STUDY TERMINATION Has the subject completed all exams and questionnaires of the study? Yes No If no, please specify:
Essential for each subject:
Yes No
1. Inclusion criteria
2. Weight and height
3. Informed consent signed
Optional (each subject must complete at least 75% of the following, i.e. 12 measurements)
1. Clinical examination (validity assessed by the Medical Doctor)
Yes No
2. Anthropometric measurements (all the measurements)
Yes No
3. BIA
Yes No

European PhD Thesis
145
4. General Questionnary for adolescents Self European Socio-economic Status (not fully blank)
Yes No
5. Nutrition Knowledge (NKT-C)(75% of the questions responded)
Yes No
6. Eating Behaviour (EWI-C) (75% of the questions responded)
Yes No
7. YANA-C (2 days)
Yes No
8. Food choice and preference (75% of the questions responded)
Yes No
9. Determinants of Healthy Eating (HE) + Determinants of physical activity (PA)
Yes No
10. Physical Activity (PAQ) Yes No
11. Questionnary for parents (QP) (75% of the questions responded)
Yes No

Valtueña J, 2012
146
12. Blood Sampling (including questionnaire)
Yes No
13. Accelerometry assessment (minimum criteria defined into the protocol)
Yes No
14. Physical fitness tests
Yes No
Main reason (only one) for premature discontinuation Withdrawal of the subject Adverse event Please make sure that AE form is completely filled Subject lost of follow-up Other Please specify...................................... Name and signature of the person checking the CRF Date and signature / / Name of the investigator: ………………………………… Date and signature / /

European PhD Thesis
147
Healthy Lifestyle in Europe by Nutrition in Adolescence in 13-16 years
adolescents across Europe.
Cross-sectional study (HELENA-CSS) and Pilot Study.
BLOOD SAMPLING
QUESTIONNAIRE
From UL2/Bonn November 2005
Subject number: H 1 Number of centre Number of school Number of class Number of subject
Subjects initials: first name/second name /family name
Evaluation date: Day Month Year
Please ask the adolescent before taking the blood samples and tick the appropriate box
to answer each question.

Valtueña J, 2012
148
1. Has the adolescent fasted for at least 10 hours?
Yes (1) No (0) Please specify what time he had his last meal, snack or drink (other than water): hh mm 2. Did the adolescent come to school by motorised transport (car, bus, …)? Yes (1) No (0)
Or walking? Yes (1) No (0) 3. Did the adolescent have a common cold or other infectious disease during the last week? Yes (1) No (0)
If yes, please specify type of disease (one letter per case) Answer will be coded (Coding instructions will be provided) by investigator before electronic data capture.
If yes, please indicate for how long: days
4. Did the adolescent have any symptoms of allergy during the last week? Examples of symptoms: Red itchy, watery eyes or sneezing/congestion/runny nose or urticaria or abdominal pain or asthma or other. Yes (1) No (0)
If yes, please indicate for how long: days
If yes, please indicate which kind of allergy? Pollen Dust Food allergens Animals Others:

European PhD Thesis
149
for others, please specify : one letter per case Answer will be coded (Coding instructions will be provided) by investigator before electronic data capture
5. Did the adolescent take any medication during the last month? Yes (1) No (0) If yes, please specify when, what was taken and doses (table): Duration (days) Name of the medication Quantity per day
1
2
3
4
5
6. Did the adolescent take any supplement (vitamin/minerals) during the last month? Yes (1) No (0) If yes, please specify when, what was taken and doses (table): Duration (days) Name of the supplement Dose per day
1
2
3
4
5
7. Has the adolescent been vaccinated during the last two weeks? Yes (1) No (0)

Valtueña J, 2012
150
If yes, please specify when and what vaccine:
Date of vaccination: dd mm year Type: one letter per case Answer will be coded (Coding instructions will be provided) by investigator before electronic data capture
8. (Only for girls) Is the girl menstruating at the moment? Yes (1) No (0)
Please specify first day of last menstruation:
Date: dd mm year
9. Has there been any complications during the blood extraction? Yes (1) No (0) If yes, specify the problem:
one letter per case Answer will be coded (Coding instructions will be provided) by investigator before electronic data capture
And fill an adverse event form in the Case Report Form !!!!
END OF THE BSQ

European PhD Thesis
151
Healthy Lifestyle in Europe by Nutrition in Adolescence in 13-16 years
adolescents across Europe.
Cross-sectional study (HELENA-CSS)
MANUAL FOR BLOOD SAMPLING
WP9
Bonn, September 2006

Valtueña J, 2012
152
CHANGES SINCE THE PILOT STUDY
Since the end of the Pilot study we had to change some aspects. We are sorry for that,
but now we think we simplified some parts of the manual. We already included the
changes in the general manual below, so that you just have to follow the instructions.
But for a better understanding, here we pointed out all changes:
A.) First of all, we changed the amount of the haematology tube:
EDTA 1.2 ml (old) EDTA 2.7 ml (new)
B.) Next, we removed 2 tubes:
CITRATE 3 ml and HEPARIN 4.5 ml
C.) We added another SERUM FOR GEL tube, and changed the amount of the tubes
from 9 mL to 7.5 mL
Serum 9 ml (old) 2 x Serum 7.5 ml (new)
D.) We had to add another Eppendorf (GREEN cap) for 1 ml whole EDTA blood. You
have to cool it together with the other Eppendorfs (Red, Blue, Yellow).
Green Eppi: 1 mL whole blood
E.) The Eppendorf with the BLUE cap contains only 400 µl (instead of 500 µl)
metaphosphoric solution and only 400 µl plasma (instead of 500 µl).
F.) The Eppendorf with the Red cap contains only 400 µl (instead of 500 µl) EDTA
whole blood and we already pipetted 400 µl Cytochex in it.
G.) There are bio-bottles with two sizes. The volume is 2.5 L or 3 L. But there is no
difference for the transport or handling, you can use them equally.
H.) Empty tubes (Heparin tube, Serum tubes): We don’t need them anymore. You don’t
have to send them to Bonn, they are waste like the needles.
I.) Transport:
The non-cooled transport contains only two (instead of three) bio-bottles.
(reason is the missing empty tubes.)
The cooled transport contains a bio-bottle with four (instead of three) plastic
bags [see point D].
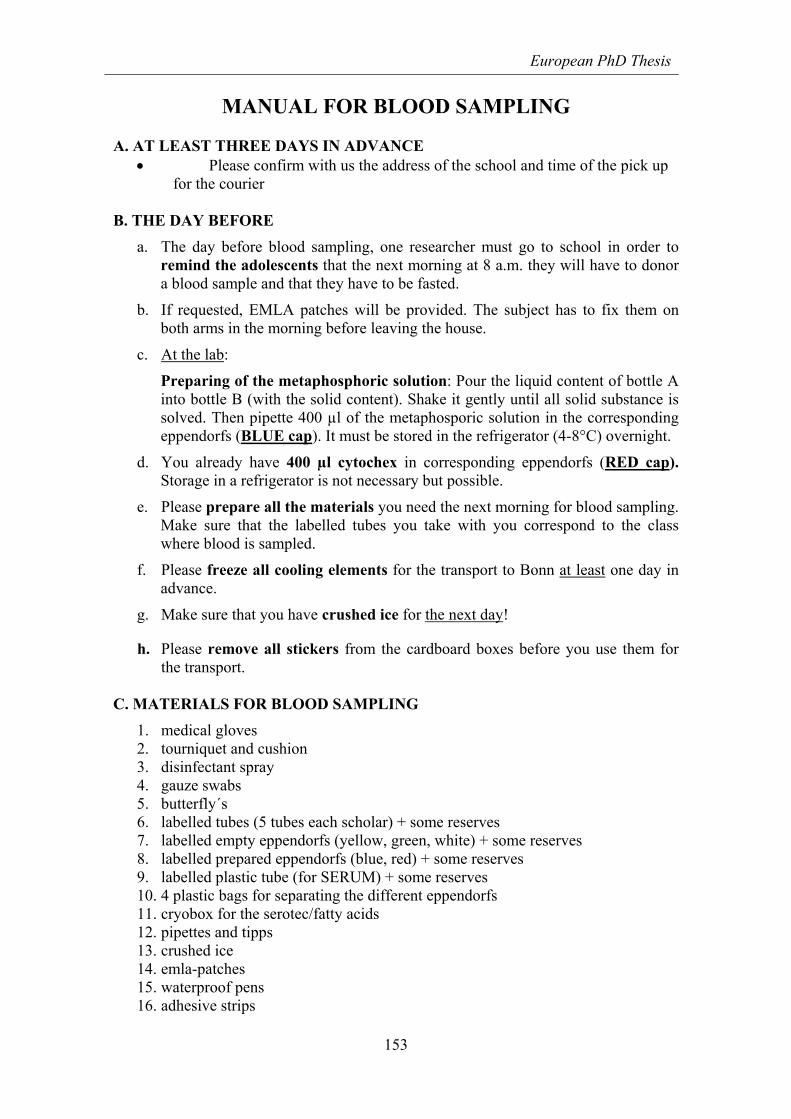
European PhD Thesis
153
MANUAL FOR BLOOD SAMPLING A. AT LEAST THREE DAYS IN ADVANCE
Please confirm with us the address of the school and time of the pick up for the courier
B. THE DAY BEFORE
a. The day before blood sampling, one researcher must go to school in order to remind the adolescents that the next morning at 8 a.m. they will have to donor a blood sample and that they have to be fasted.
b. If requested, EMLA patches will be provided. The subject has to fix them on both arms in the morning before leaving the house.
c. At the lab:
Preparing of the metaphosphoric solution: Pour the liquid content of bottle A into bottle B (with the solid content). Shake it gently until all solid substance is solved. Then pipette 400 µl of the metaphosporic solution in the corresponding eppendorfs (BLUE cap). It must be stored in the refrigerator (4-8°C) overnight.
d. You already have 400 µl cytochex in corresponding eppendorfs (RED cap). Storage in a refrigerator is not necessary but possible.
e. Please prepare all the materials you need the next morning for blood sampling. Make sure that the labelled tubes you take with you correspond to the class where blood is sampled.
f. Please freeze all cooling elements for the transport to Bonn at least one day in advance.
g. Make sure that you have crushed ice for the next day!
h. Please remove all stickers from the cardboard boxes before you use them for the transport.
C. MATERIALS FOR BLOOD SAMPLING
1. medical gloves 2. tourniquet and cushion 3. disinfectant spray 4. gauze swabs 5. butterfly´s 6. labelled tubes (5 tubes each scholar) + some reserves 7. labelled empty eppendorfs (yellow, green, white) + some reserves 8. labelled prepared eppendorfs (blue, red) + some reserves 9. labelled plastic tube (for SERUM) + some reserves 10. 4 plastic bags for separating the different eppendorfs 11. cryobox for the serotec/fatty acids 12. pipettes and tipps 13. crushed ice 14. emla-patches 15. waterproof pens 16. adhesive strips

Valtueña J, 2012
154
17. small waste container 18. yellow waste bin for contaminated waste (used butterfly´s...) 19. transportable centrifuge 20. transport boxes, shipping address, all label elements and tape for the transport 21. telephone number of the Bonn group 22. cooling elements 23. blood sampling questionnaires and fax of traceability for Bonn
D. PERSONS FOR BLOOD MANAGEMENT
For the blood drawing day, you need at least:
a. 1 medical doctor/nurse for the blood drawing itself
b. 1 person for the tube shaking, tube/rack handling and centrifugations (this work is connected to the doctor, with 2 doctors you need 2 persons)
c. 1 person for blood separation and pipetting
d. 1 person as interviewer for the BSQ/breakfast
E. PREVIOUS CONDITIONS
All the subjects must fulfil the following conditions:
a. The subjects participating in the blood sampling must have signed the informed written consent (and their parents).
b. 10/12 h fasted. The last food should be eaten at 8 p.m. the day before blood sampling. During the fasting period, only water intake is permitted.
F. ANALYTICAL CONDITIONS
1. Blood samples must be taken between 8 and 10 a.m.
2. Before taking the blood sample, the subject must answer the “Blood sampling questionnaire” and take it with him/her to the doctor. Please make sure that you get a very specific answer to these topics included in the BSQ:
a. Having or not practiced vigorous exercise 24 h before blood sampling.
b. Following or not their normal diet (Remember special holidays).
c. Suffering or not from any acute infectious diseases during the last week.
d. Suffering or not from any allergic symptoms (red itchy, watery eyes or sneezing/ congestion/ runny nose) during the last week.
e. Consuming or not any medication during the fasting period (exception made for those strictly necessary, for example, insulin).
3. Before blood sampling, the subject should rest (sitting) about 5 minutes and take off the EMLA patches.
4. Blood samples must be taken while the subject is sitting.
5. All researchers, including the person who is going to take the blood sample, must wear gloves.

European PhD Thesis
155
6. Please make sure before starting that the labelled tubes correspond to the subject whose blood is going to be taken.
7. Blood should be taken using the Sarstedt® system provided by the Bonn group.
8. The total amount of blood will be around 25 ml.
9. The tubes should be filled-in in the following order:
a. EDTA 2.7 ml b. SERUM 7.5 ml c. SERUM 7.5 ml d. HEPARIN 2.6 ml e. EDTA 4 ml
10. PLEASE NOTE THAT ALL THE TUBES MUST BE FULL!!
11. The tubes should be managed in the following way:
a. EDTA 2.7 ml (turn it up and down carefully three times, then place it in the rack)
b. SERUM tube 7.5 ml (turn it up and down carefully three times, then place it in the rack)
c. SERUM tube 7.5 ml (turn it up and down carefully three times, then place it in the rack)
d. HEPARIN 2.6 ml (BLUE labelled) (turn it up and down carefully 3 times, place it immediately on ice!)
e. EDTA 4 ml (turn it up and down carefully three times, then place it directly into a bio bottle)
12. Once the subject has finished, put at first a gauze swab and tell him/her to press on the arm for 2 minutes if required replace it with a plaster.
13. The subject should leave the room and be told where the breakfast is going to be served.
14. For the following, please make sure that the labelled eppis correspond to the subject.
Further blood handling:
1. From the EDTA 2.7 ml tube:
take 0.4 ml with the micropipette and put it in the eppendorf already filled-in with 0.4 ml of cytochex (RED cap). Close properly and mix carefully.
take another 1 ml with the micropipette and put it in the eppendorf (GREEN cap). Close properly.
Close the EDTA 2.7 ml tube and send the remaining blood to the local lab for the hemogram.

Valtueña J, 2012
156
2. Once there are enough serum tubes, centrifuge them at room temperature for 10 minutes at 3500 rpm (aprox. 2500 x g). (we will send each centre the centrifugation speed to there corresponding centrifuge)
After centrifugation, put 1 mL of serum in the corresponding eppendorf (WHITE) for the serotec and put it in the cryobox.
Then fill another eppi (WHITE) with 1 ml of serum for the fatty acid determination and put it in the same cryobox. These eppendorfs have to be frozen locally as soon as possible.
Decant the rest of both serum tubes into the corresponding plastic tube. Close properly. Throw away the empty SERUM tubes with the remaining RBC!
3. Once there are enough HEPARIN 2.6 ml tubes, centrifuge them at room temperature for 10 minutes at 3500 rpm (aprox. 2500 x g).
After centrifugation take 400 µl of the supernatant and put it in the eppendorf already filled with 400 µl of metaphosphoric solution (BLUE cap). Close the eppi properly and mix carefully.
Decant the rest of the plasma into the corresponding eppendorf (or pipette it) (YELLOW cap). Throw away the empty HEPARIN tube with the RBC!
4. Please put as soon as possible all eppendorfs (BLUE, GREEN, RED, YELLOW) in the corresponding plastic bags.
5. For the cooling: Collect all plastic bags with the coloured eppis and place them in the bio-bottle. Then put the bio-bottle in the Styrofoam box and place the cooling elements around (Details see below at point 32 “COOLING”).
6. The EDTA 4 ml tube will be packed in one bio-bottle (may be directly after blood drawing) and sent to Bonn without further manipulation.
7. Once finished, you must have (for each subject):
a. EDTA 4 ml tube
b. EDTA 2.7 ml tube containing 1.3 ml of whole blood
c. 1 eppendorf (RED cap) containing 0.4 ml of EDTA blood mixed with 0.4 ml cytochex
d. 1 eppendorf (BLUE cap) containing 0.4 ml heparin plasma mixed with 0.4 ml metaphosphoric solution
e. 1 eppendorf (YELLOW cap) containing the rest of heparin plasma (aprox. 1 ml)
f. 1 eppendorf (GREEN cap) containing 1 ml of EDTA blood.
g. 1 eppendorf (WHITE cap) containing 1 ml serum for the local serotec
h. 1 eppendorf (WHITE cap) containing 1 ml serum for the fatty acid determination
i. 1 plastic tube containing the rest of serum (aprox. 6 ml)
8. All tubes must be sent to Bonn, with the exception of number b, g and h.

European PhD Thesis
157
9. Take all the EDTA 2.7 ml tubes containing 1.3 ml to the local lab for the hemogram/haematology. Once you have the results, make a copy and send the copy to Bonn. (See shipping address Bonn or per fax +49-228-733217). Keep the original with all the other documents.
Try to get back the EDTA 2.7 ml tube from the local lab after analysing the blood! Then freeze it together with the cryobox (serotec/fatty acids).
10. Take the cryobox with all the eppendorfs containing 1 ml of serum to your local lab and freeze them at –20°/-80° C. These will be sent to Bonn once all together after the study.
11. For the rest of the tubes, please proceed in the following way:
COOLING:
j. Take one Bio-bottle and place the adsorbing paper (from the inside of the bottle) on the ground. Put the four plastic bags inside.
k. Close the Bio-bottle and put it back into the original box.
l. Then place this box into the styrofoam transport box. Take the cooling elements out of the freezer and place them around and on top of the Bio-bottle box.
m. Close the Styrofoam transport box and put it into its cardboard box for transportation.
Please be sure that everything is properly closed.
Tubes:
a. Take another Bio-bottle (with adsorbing paper inside) and fill in all EDTA 4 ml tubes.
b. Take another Bio-bottle (with adsorbing paper inside) and fill in all plastic tubes with SERUM.

Valtueña J, 2012
158
c. Put the closed Bio-bottles into the original Bio-bottle cartons and then into the second larger cardboard box.
NOTE: It is not important that exactly all tubes for the non-cooled transport are in the corresponding Bio-bottle as long as every tube will be sent to Bonn.
PLEASE BE SURE THAT EVERYTHING IS PROPERLY CLOSED.

European PhD Thesis
159
Transport:
1. Just put the shipping address and the UN 3373 sticker on each cardboard box.
Please be sure that you removed all old stickers from the cardboard boxes before you use them for the transport.
2. Fill out the way bill and the exemption letter.
3. The courier (GO!) will come at the agreed time to take the two cardboard boxes (one box for the cooled transport, one for the non-cooled transport) directly from the schools.
4. If you have problems with the courier please call us we have to organize it from Bonn, also if it seems a little bit complicated.
Shipping address Bonn:
Christina Breidenassel
IEL-Ernährungsphysiologie
Rheinische Friedrichs-Wilhelms Universität
Endenicher Allee 11-13
D-53115 Bonn
GERMANY
Office Bonn: +49 228 733767
Fax Bonn: +49 228 733217

Valtueña J, 2012
160

European PhD Thesis
161
ACTIVIDAD FÍSICA
Querido estudiante, Las siguientes preguntas son sobre las actividades físicas (andando moderada o vigorosa) que hiciste ininterrumpidamente al menos durante 10 minutos en los últimos 7 días. Por favor, no incluyas aquellas actividades que duraron menos de 10 minutos. Los últimos 7 días significa 5 días de colegio y 2 de fin de semana. Las preguntas se dividen en 4 grupos y preguntan sobre:
Actividad física que hiciste durante el tiempo que estabas en el colegio,
actividad física que hiciste en casa o alrededor de ella como tareas domesticas o tareas en el jardín,
actividad física que hiciste para ir y volver de algún sitio, actividad física que hiciste durante tu tiempo libre (jugando,
haciendo deporte, bailando, entrenando y/o compitiendo).
MUHAS GRACIAS POR TU COLABORACIÓN

Valtueña J, 2012
162
Parte 1: ACTIVIDAD FÍSICA EN EL COLEGIO La parte 1 es sobre la actividad física que has hecho en los últimos 7 días durante las horas de colegio (clases y recreos). El transporte o forma de ir al colegio NO se incluye aquí.
A. Durante las clases de Educación Física ¿Cuántas clases (horas de clase) de educación física has tenido en los últimos 7 días?
ninguna 1 clase 2clases 3 clases 4 clases otro, exactamente... clases
¿En TOTAL, cuánto tiempo empleaste durante las clases de educación física en realizar actividad física como practicar algún deporte, correr bailar, jugar… Haz la suma de toda la semana, pero cuenta solo las ocasiones en que participaste activamente al menos 10 minutos ininterrumpidamente? ___horas ___minutos de actividad física durante los últimos 7 días.
B. Durante los recreos
Durante los últimos 7 días, cuántos días hiciste las siguientes actividades, en los recreos, durante al menos 10 minutos ininterrumpidamente… No lo incluyas si duró menos de 10 minutos.
... caminar
¿Cuánto tiempo empleas en caminar uno de esos días durante el recreo?
___horas ___minutos por día
nunca 1 día 2 días 3 días 4 días 5 días
... Actividad física VIGOROSA, que conlleva un gran esfuerzo físico y te hace respirar mucho más fuerte de lo normal, como correr…
¿Cuánto tiempo empleas en actividades físicas vigorosas uno de esos días durante el recreo? ___horas ___minutos por día
nunca 1 día 2 días 3 días 4 días 5 días
... Actividad física MODERADA, que conlleva un moderado esfuerzo físico y te hace respirar un poco más fuerte de lo normal, como bailar…
¿Cuánto tiempo empleas en actividades físicas moderadas uno de esos días durante el recreo?
___horas ___minutos por día
nada 1 día 2 días 3 días 4 días 5 días
Parte 2: TAREAS DOMESTICAS Y DEL JARDÍN
Esta segunda parte es sobre la actividad física que hiciste en los últimos 7 días en casa o en el jardín. Durante los últimos 7 días, cuantos hiciste en casa o en el jardín al menos 10 minutos ininterrumpidos de actividad física que supusiera un esfuerzo al menos moderado que te hiciera respirar algo o mucho mas fuerte de lo normal, como mover cargas pesadas, fregar suelos, barrer… No incluyas actividades de menos de 10 minutos de duración.
¿Cuánto tiempo dedicas normalmente a estas actividades en casa o en el jardín uno de estos días?
___horas ___minutos por día
nada 1 día 2 días 3 días 4 días 5 días 6 días 7 días

European PhD Thesis
163
Parte 3: TRANSPORTE Y ACTIVIDAD FISICA Estas preguntas son sobre como te desplazaste de un lugar a otro, incluyendo lugares como el colegio, las tiendas, los cines, etc. durante los últimos 7 días. Durante los últimos 7 días, cuantos viajaste al menos 10 minutos ininterrumpidamente... No incluyas actividades que duraran menos de 10 minutos ininterrumpidos. ... EN UN VEHICULO A MOTOR como tren, coche, autobús, moto, metro,…?
¿Cuánto tiempo empleas normalmente en viajar en vehículos a motor uno de estos días?
___horas ___minutos por día
nada 1 día 2 días 3 días 4 días 5 días 6 días 7 días
... EN BICICLETA?
¿Cuánto tiempo empleas uno de esos días en ir en bicicleta de un lugar a otro?
___horas ___minutos por día
nada 1 día 2 días 3 días 4 días 5 días 6 días 7 días
... ANDANDO?
¿Cuánto tiempo empleas normalmente uno de esos días en ir andando de un lugar a otro?
___horas ___minutos por día
nada 1 día 2 días 3 días 4 días 5 días 6 días 7 días
Parte 4: ACTIVIDAD FÍSICA DURANTE EL TIEMPO DE OCIO, DEPORTE Y TIEMPO
LIBRE Esta sección es sobre toda la actividad física que has hecho en los últimos 7 días, únicamente respecto al tiempo de ocio, de práctica deportiva, entrenamiento o placer. Por favor, no incluyas actividades que ya has mencionado.
Durante los últimos 7 días, cuántos hiciste una de las siguientes actividades por al menos 10 minutos sin parar, durante tu tiempo libre…
No incluyas actividades que duraran menos de 10 minutos ininterrumpidos.
... CAMINAR
¿Cuánto tiempo empleas normalmente uno de esos días en caminar en tu tiempo libre?
___horas ___minutos por día
nada 1 día 2 días 3 días 4 días 5 días 6 días 7 días
... Actividad física VIGOROSA, que conlleva un gran esfuerzo físico y te hace respirar mucho más fuerte de lo normal, como ejercicio aeróbico, correr, andar en bici o nadar rápido…
¿Cuánto tiempo empleas normalmente uno de esos días en actividad física vigorosa en tu
tiempo libre? ___horas ___minutos por día
nada 1 día 2 días 3 días 4 días 5 días 6 días 7 días
... Actividad física MODERADA, que conlleva un moderado esfuerzo físico y te hace respirar un poco más fuerte de lo normal, como bailar, nadar o montar en bicicleta despacio …
¿Cuánto tiempo empleas normalmente uno de esos días en actividad física moderada en tu tiempo libre? ___horas ___minutos por día
nada 1 día 2 días 3 días 4 días 5 días 6 días 7 días

Valtueña J, 2012
164
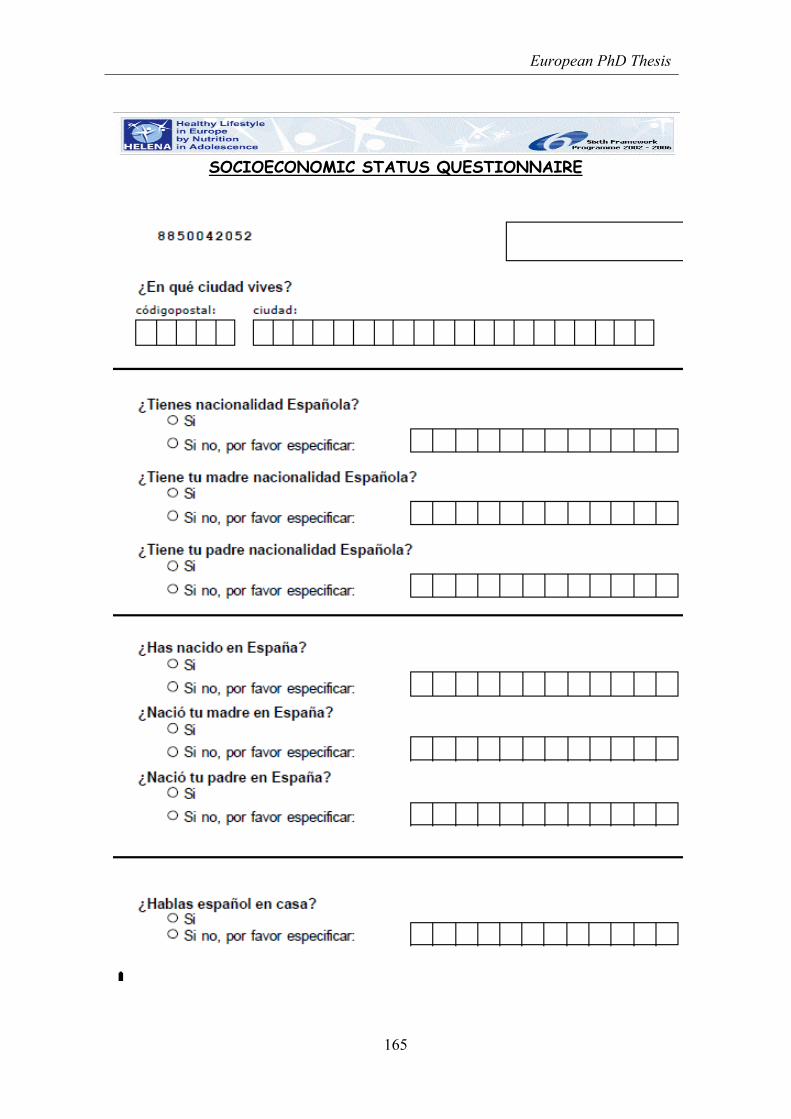
European PhD Thesis
165
SOCIOECONOMIC STATUS QUESTIONNAIRE

Valtueña J, 2012
166

European PhD Thesis
167

Valtueña J, 2012
168

European PhD Thesis
169

Valtueña J, 2012
170

European PhD Thesis
171
HELENA STUDY GROUP Co-ordinator: Luis A. Moreno
Core Group members: Luis A. Moreno, Fréderic Gottrand, Stefaan De Henauw,
Marcela González-Gross, Chantal Gilbert.
Steering Committee: Anthony Kafatos (President), Luis A. Moreno, Christian Libersa,
Stefaan De Henauw, Jackie Sáchez, Fréderic Gottrand, Mathilde Kesting, Michael
Sjostrom, Dénes Molnár, Marcela González-Gross, Jean Dallongeville, Chantal Gilbert,
Gunnar Hall, Lea Maes, Luca Scalfi.
Project Manager: Pilar Meléndez
1. Universidad de Zaragoza (Spain): Luis A. Moreno, Jesús Fleta, José A. Casajús,
Gerardo Rodríguez, Concepción Tomás, María I. Mesana, Germán Vicente-Rodríguez,
Adoración Villarroya, Carlos M. Gil, Ignacio Ara, Juan Revenga, Carmen Lachen, Juan
Fernández Alvira, Gloria Bueno, Aurora Lázaro, Olga Bueno, Juan F. León, Jesús Mª
Garagorri, Manuel Bueno, Juan Pablo Rey López, Iris Iglesia, Paula Velasco, Silvia
Bel.
2. Consejo Superior de Investigaciones Científicas (Spain): Ascensión Marcos, Julia
Wärnberg, Esther Nova, Sonia Gómez, Esperanza Ligia Díaz, Javier Romeo, Ana
Veses, Mari Angeles Puertollano, Belén Zapatera, Tamara Pozo.
3. Université de Lille 2 (France) : Laurent Beghin, Christian Libersa, Frédéric
Gottrand, Catalina Iliescu, Juliana Von Berlepsch.
4. Research Institute of Child Nutrition Dortmund, Rheinische Friedrich-
Wilhelms-Universität Bonn (Germany): Mathilde Kersting, Wolfgang Sichert-
Hellert, Ellen Koeppen.
5. Pécsi Tudományegyetem (University of Pécs) (Hungary): Dénes Molnar, Eva
Erhardt, Katalin Csernus, Katalin Török, Szilvia Bokor, Mrs. Angster, Enikö Nagy,
Orsolya Kovács, Judit Repásy.
6. University of Crete School of Medicine (Greece): Anthony Kafatos, Caroline
Codrington, María Plada, Angeliki Papadaki, Katerina Sarri, Anna Viskadourou,
Christos Hatzis, Michael Kiriakakis, George Tsibinos, Constantine Vardavas Manolis
Sbokos, Eva Protoyeraki, Maria Fasoulaki.
7. Institut für Ernährungs- und Lebensmittelwissenschaften –
Ernährungphysiologie. Rheinische Friedrich Wilhelms Universität (Germany):

Valtueña J, 2012
172
Peter Stehle, Klaus Pietrzik, Marcela González-Gross, Christina Breidenassel, Andre
Spinneker, Jasmin Benser, Miriam Segoviano, Anke Berchtold, Christine Bierschbach,
Erika Blatzheim, Adelheid Schuch, Petra Pickert.
8. University of Granada (Spain): Manuel J. Castillo, Ángel Gutiérrez, Francisco B.
Ortega, Jonatan R Ruiz, Enrique G. Artero, Vanesa España-Romero, David Jiménez-
Pavón, Palma Chillón.
9. Istituto Nazionale di Ricerca per gli Alimenti e la Nutrizione (Italy): Davide
Arcella, Elena Azzini, Emma Barrison, Noemi Bevilacqua, Pasquale Buonocore,
Giovina Catasta, Laura Censi, Donatella Ciarapica, Paola D’Acapito, Marika Ferrari,
Myriam Galfo, Cinzia Le Donne, Catherine Leclercq, Giuseppe Maiani, Beatrice
Mauro, Lorenza Mistura, Antonella Pasquali, Raffaela Piccinelli, Angela Polito,
Raffaella Spada, Stefania Sette, Maria Zaccaria.
10. University of Napoli "Federico II" Dept of Food Science (Italy): Luca Scalfi,
Paola Vitaglione, Concetta Montagnese.
11. Ghent University (Belgium): Ilse De Bourdeaudhuij, Stefaan De Henauw, Tineke
De Vriendt, Lea Maes, Christophe Matthys, Carine Vereecken, Mieke de Maeyer,
Charlene Ottevaere, Inge Huybrechts.
12. Medical University of Vienna (Austria): Kurt Widhalm, Katharina Phillipp,
Sabine Dietrich, Birgit Kubelka Marion Boriss-Riedl.
13. Harokopio University (Greece): Yannis Manios, Eva Grammatikaki, Zoi
Bouloubasi, Tina Louisa Cook, Sofia Eleutheriou, Orsalia Consta, George Moschonis,
Ioanna Katsaroli, George Kraniou, Stalo Papoutsou, Despoina Keke, Ioanna Petraki,
Elena Bellou, Sofia Tanagra, Kostalenia Kallianoti, Dionysia Argyropoulou, Katerina
Kondaki, Stamatoula Tsikrika, Christos Karaiskos.
14. Institut Pasteur de Lille (France) : Jean Dallongeville, Aline Meirhaeghe.
15. Karolinska Institutet (Sweden) : Michael Sjöstrom, Patrick Bergman, María
Hagströmer, Lena Hallström, Mårten Hallberg, Eric Poortvliet, Julia Wärnberg, Nico
Rizzo, Linda Beckman, Anita Hurtig Wennlöf, Emma Patterson, Lydia Kwak, Lars
Cernerud, Per Tillgren, Stefaan Sörensen.
16. Asociación de Investigación de la Industria Agroalimentaria (Spain): Jackie
Sánchez-Molero, Elena Picó, Maite Navarro, Blanca Viadel, José Enrique Carreres,
Gema Merino, Rosa Sanjuán, María Lorente, María José Sánchez, Sara Castelló.
17. Campden & Chorleywood Food Research Association (United Kingdom):
Chantal Gilbert, Sarah Thomas, Elaine Allchurch, Peter Burguess.

European PhD Thesis
173
18. SIK - Institutet foer Livsmedel och Bioteknik (Sweden): Gunnar Hall, Annika
Astrom, Anna Sverkén, Agneta Broberg.
19. Meurice Recherche & Development asbl (Belgium) : Annick Masson, Claire
Lehoux, Pascal Brabant, Philippe Pate, Laurence Fontaine.
20. Campden & Chorleywood Food Development Institute (Hungary): Andras
Sebok, Tunde Kuti, Adrienn Hegyi.
21. Productos Aditivos SA (Spain): Cristina Maldonado, Ana Llorente.
22. Cárnicas Serrano SL (Spain): Emilio García.
23. Cederroth International AB (Sweden): Holger von Fircks, Marianne Lilja
Hallberg, Maria Messerer.
24. Lantmännen Food R&D (Sweden): Mats Larsson, Helena Fredriksson, Viola
Adamsson, Ingmar Börjesson.
25. European Food Information Council (Belgium): Laura Fernández, Laura Smillie,
Josephine Wills.
26. Universidad Politécnica de Madrid (Spain): Marcela González-Gross, Jara
Valtueña, David Jiménez-Pavón, Ulrike Albers, Raquel Pedrero, Agustín Meléndez,
Pedro J. Benito, Juan José Gómez Lorente, David Cañada, Alejandro Urzanqui, Juan
Carlos Ortiz, Francisco Fuentes, Rosa María Torres, Paloma Navarro.

Valtueña J, 2012
174

European PhD Thesis
175
ACKNOWLEDGMENTS No es nada fácil plasmar en tan solo unas líneas tantos años de vida y a todas las
personas que han formado parte de ellos. Cada uno de vosotros, que sin decir nombres
ya os dais por aludidos, sois y habeis sido parte de mi vida y os debo gran parte de ella.
Espero que sigamos caminando juntos y estar a vuestro lado para todo lo que necesiteis.
Nada hubiese sido posible sin el cariño y el apoyo de mucha gente, empezando por mis
padres, mi hermano y mi familia, a los que les debo tanto. Gracias por ser uno solo, por
volcaros constantemente en nuestra educación, por poder contar enormemente con
vuestro apoyo, por compartir nuestras alegrías, llantos y emociones. Gracias papás por
vuestro cariño diario, por transmitirme los valores de la humildad, el sacrificio, la
sinceridad, la honestidad y por haberme permitido ser algo cabezona. Gracias hermano
oso por cuidarme siempre, por no dejarme nunca sola, por todos los momentos de risas
y situaciones que nos han sacado los colores, por el deporte, la música, el estudio, por
dar la cara siempre por mi, incluso cuando se me van las notas con la flauta...
A toda mi familia por estar siempre unida y mostrarme siempre su cariño, tíos, tías,
primos, primas, a los peques, Martita, Julia, Dani, a los abuelos que ya se fueron pero
que siempre están presentes, y a la cabeza de todos nosotros, la super abuelita Pilar y la
tía, ¡las jefas! que siempre nos han guiado, y su gran cocina nos mantiene todavía más
unidos. Gracias a todos vosotros por los años de mi vida inolvidables que me habéis
hecho pasar, los veranos en villa Cidones, los juegos, los baños, las risas, los sorteos
navideños con nuestras grandes voces cantarinas…
A Fabio por su gran apoyo y tener la asombrosa capacidad de haberme aguantado en
este duro proceso. Por enseñarme y recordarme que si te caes, te levantas sin mirar
atrás, siempre hacia delante.
Mi más sincero y cariñoso agradecimiento a Marcela González-Gross, sin la que no
hubiese sido posible no solo este trabajo, sino también otras tantas metas y logros.
Gracias por darme la oportunidad de entrar en este gran proyecto, por haber confiado
constantemente en mí, por todos los momentos compartidos tanto a nivel profesional
como personal, por tu entera disposición, dedicación y apoyo a mi formación. Gracias
por enseñarme a afrontar las adversidades, a madurar y por ayudarme a crecer como
persona. Espero continuar aprendiendo siempre.

Valtueña J, 2012
176
Agradecer enormemente a la Universidad Politécnica de Madrid por su continuo apoyo
a mi formación y en especial a la que ha sido como mi segunda casa los últimos años de
mi vida, a la Facultad de Ciencias de la Actividad Física y del Deporte y a todo su
personal que me ha ayudado, alegrado y facilitado mi día a día, junto a mis compañeros
y amigos que habeis ido pasando por mi vida a lo largo de este periodo dejando una
huella imborrable. Silvi, Jose, Carol, Estefi, Lucía, Nacho, Celia y cia, fueron unos años
inolvidables en los que pararse a pensar el “¿Qué me pongo hoy?” era cosa de otros. Mi
Mery guapa, ¡ay que iba a hacer yo sin ti!. Gracias a todos por los increíbles momentos
pasados y los que nos quedan por pasar. Agradecer de corazón a todo el equipo ImFINE
de la Facultad con los que he compartido innumerables experiencias y colaboro
diariamente aportándome tantas cosas positivas: Paloma, David, Rosa, Alejandro,
Raquel, Juanjo, Ulrike, Paco, Juan Carlos, Beatriz, Olga, Thábata, Agustín, Gonzálo…
A mis amigos, a cada uno de vosotros, por todo lo vivido, a los que haceis que me sienta
más cerca de nuestra querida tierra Soriana, y a los que amenizaron y amenizais mis
días en Madrid, muchos ya repartidos por el mundo, por todo lo que hemos recorrido
juntos, por no dejar nunca de estar ahí e ir creciendo juntos día a día. Anita, Leti, Sarita,
Dana, Itzi, Lucía, recompensaré en breve todos los planes que no hemos podido hacer
por mi culpa. Larita, ¡ay Lari Lari! toda una vida juntas llena de recuerdos…te pillo en
Australia, y ahora ¿quién prepara los mojitos de la celebración? ¡Te espero en nuestra
rotonda y camino Valonsadero a por el torrenillo!. Sari, todavía nos queda mucho por
recorrer juntas. Aleix, ¡por fin voy a tener tiempo para darte un buen corte de pelo!
¡Franchu! No me he olvidado de ti aunque haya estado muy atareada. Laura, Blanca,
Tamara, Elena, Silvia, Sorkun, Jose, Sara, Irene, Sergio, Carol, Marta… sois muchos
más, nombrar a cada uno sería misión imposible y quiero englobaros a todos, por ello a
todos vosotros, todos los demás amigos que formaís parte de mi vida, millones de
gracias por estar siempre ahí.
A mi codirectora de tesis, Christina Breidenassel, por tu amistad, ayuda, disposición y
dedicación siempre tan cercana al igual que todo el grupo de Bonn, que me integrasteis
y ayudasteis en mis primeros pasos en este gran proyecto. Agradecer también a
Giuseppe Maiani, por sus enseñanzas y oportunidades brindadas en el INRAN, que
junto a Marika Ferrari me hicisteis aprender tanto y os preocupasteis tanto por mi.

European PhD Thesis
177
A Luis Moreno no solo porque sin el no hubiese sido posible este gran proyecto, sino
por su sacrificio y constante entrega a la familia HELENA, por la ayuda ofrecida y por
su entera disposición en todo momento, así como agradecer enormemente a Manuel
Castillo por sus constantes ánimos, positividad y maravillosa forma de ver la vida.
Al grupo de Zaragoza, en especial a Luis Gracia, por tu ayuda y todos los momentos
divertidos, aunque te dejaras escapar aquel pato en el canal de Amsterdam… menos mal
que estaba ahí Pablo para rescatarlo. Agradecer igualmente al grupo de Granada al
completo, en especial a David y Magda, por tantas cosas juntos a raíz de este proyecto,
por vuestras constantes enseñanzas y charlas compartidas.
A nuestros vecinos y amigos Italianos. Fuisteis mi primera verdadera casa fuera de
España, me enseñasteis vuestro idioma con paciencia integrándome como una más en
vuestras vidas. Fueron unos meses inolvidables y lo mejor son los amigos que me llevé
de esa experiencia, grazie mille davvero a tutti! Vi voglio bene!
Al grupo de Gante liderado por Stefaan De Henauw, por abrirme las puertas, por vuestra
ayuda y por permitirme vivir una gran experiencia. Muy en especial agradecer a Inge
Huybrecht, que además de ser una pieza clave en el proyecto HELENA, por ser una
persona excelente y maravillosa con la que he compartido tantos momentos. Thank you
very much Inge for your help and for your great welcome into your life, I will never
forget our big talks! Gracias a todos los amigos que dejé allí y en otros puntos del
mundo. Siempre recordaré la tranquilidad que se respira, los paseos en bici, las
barbacoas y la ayuda que me brindasteis en todo momento.
A todas aquellas personas que han hecho posible la realización del proyecto HELENA y
se han visto involucrados en un duro y largo proceso, desde la obtención de datos,
pasando por el análisis de laboratorio y creación de bases de datos entre otras muchas
labores, en especial a todo el equipo de la Universidad Politécnica de Madrid, de la
Universidad de Bonn en Alemania, y a los equipos de las Universidades de Granada y
Zaragoza.
A Laura Barrios por su asesoramiento en el análisis estadístico de los datos.
A Christel Bierschbach, Adelheid Schuch, Anke Berchtold, Petra Pickert, Anke
Carstensen, por su contribución al trabajo de laboratorio.

Valtueña J, 2012
178

European PhD Thesis
179
SUMMARIZED CV/ CURRÍCULUM VITAE ABREVIADO Formación
Licenciada en Ciencias de la Actividad Física y del Deporte. Universidad Politécnica de Madrid.2007.
Diplomada en Nutrición Humana y Dietética. Universidad Complutense de Madrid.2010 Master oficial de postgrado en Investigación en Ciencias Actividad Física y Deporte. Universidad
Politécnica de Madrid. 2009. Seleccionada para el 18th Seminar of the European Nutrition Leadership Platform (ENLP). Abril
2012. Luxemburgo. CAP (Curso de adaptación pedagógica). Universidad Politécnica de Madrid. 2007. Entrenadora Nacional de atletismo. Real federación española de atletismo. 2008. Titulada Masaje aplicado a la Actividad física y Deporte. Universidad Politécnica de Madrid. 2006.
Actividad académica Estancias en centros extranjeros:
Facultad de Medicina. Departamento de Nutrición, salud pública y epidemiología. Gante. (Bélgica). 3 meses.(2011)
Istituto Nazionale di ricerca per gli alimenti e la nutrizione (INRAN). Roma (Italia). 3 meses. (2010). Istituto Nazionale di ricerca per gli alimenti e la nutrizione (INRAN). Roma (Italia). 3 meses. (2009). Instituto de Nutrición. Universidad de Bonn. Institut fuer Ernaehrungswissenschaft. Rheinische
Friedrich. Wilhelms Universitaet. Bonn (Alemania). 3 meses (2008) Docencia y ponencias:
Docencia oficial en la Universidad Politécnica de Madrid en la Facultad de Ciencias de la Actividad física y del Deporte. Asignaturas: Nutrición y ayudas ergogénicas en el deporte, Fisiología del esfuerzo y del deporte. 12 Créditos (120 h). 2010-2012.
Profesora de la asignatura de Fisiología del ejercicio. Curso de entrenadores auxiliares de natación. Real Federación Española de Natación. Madrid 2006.
Conferencia: The guide healthy lifestyle pyramid. Congreso dietistas portugueses. Lisboa. Octubre 2011.
Conferencia: Nutrición, Salud y Actividad Física en los niños. Mesa Redonda "Nutrición, Salud y Actividad Física en los niños" enmarcada en el ciclo de conferencias de la Escuela de Adultos. Colegio Estudiantes Las Tablas, Madrid. enero 2011.
Ponencia: Are Spanish women more sedentary than men?. 5th World Conference on Women and Sport. Sydney. Mayo 2010.
Ponencia: Being woman is not a key element to have a sedentary lifestyle. 5th World Conference on Women and Sport. Sydney. Mayo 2010.
Ponencia: Diferencias actuales en el estado de las vitaminas liposolubles según IMC en adolescentes europeos. The helena study. II Congreso de la FESNAD. Barcelona. Marzo 2010
Ponencia: Influence of physical activity, physical fitness and vitamin D status on bone mass in adolescents. 14TH European Meeting on Fat-Soluble Vitamins. Postdam (Alemania). Octubre 2009
Conferencia: The healthy lifestyle pyramid for children and adolescents. International Symposium of physical exercise and health in special populations. Fundación Empresa-Universidad de Zaragoza. Huesca. Octubre 2008.
Conferencia: “Beneficios de la actividad física a nivel cardiovascular y otros”. III Jornadas formativas para especialistas monitores en autocuidado de la salud (CEACCU). Madrid. Julio 2008
Ponencia: Liposoluble vitamins in the HELENA study. HELENA symposium: Promoting a healthy European Lifestyle through exercise and nutrition in adolescence. Facultad de Medicina, Universidad de Granada. Granada. Abril 2008.

Valtueña J, 2012
180
Participación en proyectos de investigación
Healthy Lifestyle in Europe by Nutrition in Adolescence. (HELENA). Financiado por la Unión Europea (FP6-2003-Food-2-A, FOOD-CT-2005-007034) 2004 - 2008. http://www.helenastudy.com
Red de investigación en ejercicio físico y salud para poblaciones especiales (EXERNET)”. Proyecto Nacional Coordinado. http://www.spanishexernet.com/.
Alimentación y Valoración del Estado Nutricional de los Adolescentes españoles (AVENA). Fondo de Investigaciones Sanitarias. Ministerio de Sanidad y Consumo. Ref.00/0015-3. www.estudioavena.com
Desarrollo de la pirámide de vida saludable y su guía. P0611001003. Fundación Coca Cola. 2006-2011.
HEALTH(A)WARE: An experienced-based learning and teaching approach for physical and health education. 128737-CP-1-2006-1-DE-Comenius-C21. Programa Sócrates- Comenius. Comunidad Europea. 2006-2009
HELLP I/II/III: Health as a lifelong learning process. DE-2008-ERA-MOBIP-ZuV-29975-3-24/DE-2009-ERA-MOBIP-ZuV-29975-1-28/DE-2010-ERA-MOBIP-ZuV-29975-1-28. Programa Erasmus. Comunidad Europea. 2008-2011.
Programas de Nutrición y Actividad Física para el Tratamiento de la Obesidad (PRONAF). DEP2008-06354-C04-01. Ministerio de Ciencia e Innovación. Enero 2009-Diciembre 2011
Efecto de la bebida de rehidratación sobre los niveles de homocisteina tras un esfuerzo submáximo de duración media. P061100509 (bis). Powerade Coca Cola España. 2010
La deficiencia de vitamina B12 como factor de riesgo en enfermedades neurodegenerativas. Estudio longitudinal de la evolución del estado de B12 durante un año. P061100509. Axis-Shield Diagnostics Ltd. 2006-2009.
Optimized complementary feeding recommendations and in-home fortification in two regions of Tajikistan (Khatlon and Gorno-Badakhshan). A pilot project for the WHO/UNICEF Complementary Feeding Initiative. 2008-2010.
Estudio Multi-céntrico para la Evaluación de los Niveles de Condición Física y su relación con Estilos de Vida Saludables en población mayor española no institucionalizada. Ministerio de Asuntos Sociales y Trabajo e IMSERSO. 2008-09.
Publicaciones científicas
Valtueña J, Gracia-Marco L, Vicente-Rodríguez G, González-Gross M, Huybrechts I, Rey-
López J.P. Mouratidou T, Sioen I, Mesana M.I., Díaz Martínez A.E.,.Widhalm K, Moreno L.A. on behalf of the HELENA Study Group. Vitamin D status and physical activity interact to improve bone mineral content in adolescents. The HELENA study Osteoporos Int. 2012 Jan 12. [Epub ahead of print]
González-Gross M*, Valtueña J*, Breidenassel C, Moreno LA, De Henauw S, Kersting M, Widhalm K, Gottrand F, Azzini E, Kafatos A, Manios M, Molnar D, Ferrari M, Stehle P. Vitamin D status in European adolescents. The HELENA study. Br J Nutr 2011. 17:1-10.
Valtueña J, Breidenassel C, Folle K, González-Gross M. Retinol, beta-carotene, alpha-tocopherol and vitamin D status in European adolescents; regional differences and variability. A review. Nutr Hosp. 2011;26(2):278-286
Moreno LA, Valtueña J, Pérez F, González-Gross M. Health effects related with low vitamin D concentrations. Beyond bone metabolism. Ann Nut Metab DOI: 332070
Breidenassel C, Valtueña J, González-Gross M, Al-Tahan J, Spinneker A, Segoviano-Rosenblum M, Moreno LA, De Henauw S, Pietrzik K, Widhalm K, Molnar D, Maiani G, Stehle P. “Antioxidant Vitamin Status A, E, C, and Beta-Carotene) in European Adolescents. The HELENA Study”. Int J Vitam Nutr Res. 2011 Jul;81(4):245-55.
Jiménez-Pavón D, Ortega FB, Valtueña J, Castro-Piñero J, Gómez-Martínez S, Zaccaria M, Gottrand F, Molnár D, Sjöström M, González-Gross M, Castillo MJ, Moreno LA, Ruiz JR.Muscular strength and markers of insulin resistance in European adolescents: the HELENA Study. Eur J Appl Physiol. 2011 Nov 4. [Epub ahead of print]
Gracia-Marco, L; Ortega, FB; Jiménez-Pavón, D; Rodríguez, G; Valtueña, J; Díaz-Martínez, AE; González-Gross, M; Castillo, MJ; Vicente-Rodriguez, G. and Moreno, LA. Contribution of

European PhD Thesis
181
bone turnover markers to bone mass in pubertal boys and girls. J Pediatr Endocrinol Metabol. [Epub ahead of print].
Maroto B, Valtueña J, Albers U, Benito PJ, González-Gross M. Effects of exercise on Homocysteine levels. Biomédica. 2011 (in press)
González-Gross M, Benser J, Albers U, Breidenassel C, Spinneker A, Bokor S, Meirhaeghe A, Segoviano M, Valtueña J, Dallongeville J, Moreno LA, Stehle P , Pietrzik K, on behalf of the HELENA Study Group. “B-Vitamins and homocysteine in European adolescents: Status quo and development of reference values. The HELENA study”. Nutrition Research 2011 (in press).
Martinez-Gomez D, Ortega FB, Ruiz JR, Vicente-Rodriguez G, Veiga OL, Widhalm K, Manios Y, Béghin L, Valtueña J, Kafatos A, Molnar D, Moreno LA, Marcos A, Castillo MJ, Sjöström M; on behalf of the HELENA study group. Excessive sedentary time and low cardiorespiratory fitness in European adolescents: the HELENA study.Arch Dis Child. 2011;96(3):240-246.
Gracia-Marco L, Vicente-Rodríguez G, Valtueña J, Rey-López JP, Díaz Martínez AE, Mesana MI, Widhalm K, Ruiz JR, González-Gross M, Castillo MJ, Moreno LA; HELENA Study Group. Bone mass and bone metabolism markers during adolescence: The HELENA Study. Horm Res Paediatr. 2010;74(5):339-50.
Solaas K, Legry V, Retterstol K, Berg PR, Holven KB, Ferrières J, Amouyel P, Lien S, Romeo J, Valtueña J, Widhalm K, Ruiz JR, Dallongeville J, Tonstad S, Rootwelt H, Halvorsen B, Nenseter MS, Birkeland KI, Thorsby PM, Meirhaeghe A, Nebb HI. Suggestive evidence of associations between liver X receptor β polymorphisms with type 2 diabetes mellitus and obesity in three cohort studies: HUNT2 (Norway), MONICA (France) and HELENA (Europe). BMC Med Genet. 2010 Oct 12;11:144.
Pigeyre M, Bokor S, Romon M, Gottrand F, Gilbert CC, Valtueña J, Gómez-Martínez S, Moreno LA, Amouyel P, Dallongeville J, Meirhaeghe A; HELENA Study group. Influence of maternal educational level on the association between the rs3809508 neuromedin B gene polymorphism and the risk of obesity in the HELENA study.
Int J Obes (Lond). 2010 Mar;34(3):478-86. De Cocker K, Ottevaere C, Sjöström M, Moreno LA, Wärnberg J, Valtueña J, Manios Y,
Dietrich S, Mauro B, Artero EG, Molnár D, Hagströmer M, Ruiz JR, Sarri K, Kafatos A, Gottrand F, De Henauw S, Maes L, De Bourdeaudhuij I; HELENA Study Group.Self-reported physical activity in European adolescents: results from the HELENA (Healthy Lifestyle in Europe by Nutrition in Adolescence) study. Public Health Nutr. 2011;14(2):246-54.
Gracia-Marco L, Vicente-Rodríguez G, Valtueña J, Rey-López J P, Díaz Martínez A E,Mesana M I, González-Gross M, Moreno L A. Bone metabolism markers in Spanish adolescents. The HELENA Study Trauma Fund MAPFRE (2009) Vol 21 nº 1:33-38
Chillón P, Ortega FB, Ruiz JR, Pérez IJ, Martín-Matillas M, Valtueña J, Gómez-Martínez S, Redondo C, Rey-López JP, Castillo MJ, Tercedor P, Delgado M. Socio-economic factors and active commuting to school in urban Spanish adolescents: the AVENA study. Eur J Public Health. 2009 19(5):470-6.
González-Gross M, Gómez-Lorente JJ, Valtueña J, Ortiz JC y Meléndez A. The «healthy lifestyle guide pyramid» for children and adolescents. Nutr Hosp. 2008;23: 159-168
Valtueña, J., Gonzalez-Gross, M., Sola, R. Estatus en hierro en jugadores de futbol y baloncesto de la categoría junior (Iron status in junior football and basketball players). Int J Sport Sci 2006; 4: 57-68.
Libros, capítulos de libros, monografías e informes
González-Gross M, Maroto B, Valtueña J, Fuentes F. Ejercicio y función cognitiva. En: ejercicio físico y salud en poblaciones especiales: Exernet. CSD 2011 (in press)
González-Gross M, Cañada D, Valtueña J, Albers U, Benito PJ. Physical Activity and Health Education in European Schools. ISBN: 978-84-96398-32-0. Madrid (Spain), 2009
González-Gross M, Gómez Lorente JJ, Valtueña J, Carlos Ortiz J, Fuentes F, Meléndez A.. The healthy lifestyle pyramid for children and adolescents. Practical guide. Practical guide for a healthy lifestyle. ISBN 13-978-84-96398-40-. Madrid (Spain), 2010
González-Gross M, Valtueña J. Actividad física y reducción de factores de riesgo de enfermedades crónico-degenerativos. En: Redondo Figuero C, González-Gross M, Moreno

Valtueña J, 2012
182
LA, García-Fuentes M, eds. Actividad física, deporte, ejercicio y salud en niños y adolescentes. Editorial Everest. ISBN 97-8844 4102597. 2010. pp155-162.
Redondo Figuero C, Pedrero R, Valtueña J. Recomendaciones sobre Actividad Física en pediatría práctica (o en consulta de pediatría) En: Redondo Figuero C, González-Gross M, Moreno LA, García-Fuentes M, eds. Actividad física, deporte, ejercicio y salud en niños y adolescentes. Editorial Everest. ISBN 97-8844-4102597. 2010. pp .
Incorporación de la perspectiva de género al programa institucional de calidad de la Facultad de Ciencias de la Actividad Física y del Deporte-INEF con motivo de la implantación del Grado en Ciencias del Deporte” Nº proyecto IE 09111561 Memoria final
M. Adrianopoli, L. Mistura, M. Ferrari, J. Valtueña and G. Maiani. Optimized complementary feeding recommendations and in-home fortification in two regions of Tajikistan (Khatlon and Gorno-Badakhshan). A pilot project for the WHO/UNICEF Complementary Feeding Initiative October 2009- WHO Report. Third Follow up Interim Report.
Premios recibidos
Premio al rendimiento académico. Mejor expediente académico de la Licenciatura en Ciencias de la Actividad física y del deporte por la Universidad Politécnica de Madrid. (Promoción 2002-2007)
Premio al rendimiento académico. Mejor expediente académico del primer ciclo de la licenciatura Ciencias de la Actividad física y del deporte por la Universidad Politécnica de Madrid. (Enero, 2005)
Premio “APROVECHAMIENTO ACADÉMICO EXCELENTE” de la Consejería de Educación de la Comunidad de Madrid. (5 años; 2002-2007).
Premio al proyecto HELENA; mejor proyecto europeo de difusión de los proyectos europeos en investigación de nutrición y salud. Communication Star 2011.
Comunicaciones y eventos
La doctoranda ha participado como autor y coautor en más de 30 congresos internacionales y nacionales.
La doctoranda ha sido miembro del comité organizador en varios simposios de carácter internacional.