JTF-160 winds down Looking ahead to filing taxes 24th MEU ...

ARTICLE IN PRESS
Continental Shelf Research 29 (2009) 785–795
Contents lists available at ScienceDirect
Continental Shelf Research
0278-43
doi:10.1
� Corr
E-m
journal homepage: www.elsevier.com/locate/csr
Influences of upwelling and downwelling winds on red tide bloom dynamicsin Monterey Bay, California
John P. Ryan a,�, Andrew M. Fischer a, Raphael M. Kudela b, James F.R. Gower c, Stephanie A. King c,Roman Marin IIIa, Francisco P. Chavez a
a Monterey Bay Aquarium Research Institute, 7700 Sandholdt Road, Moss Landing, CA 95039 USAb University of California, Santa Cruz, Ocean Sciences and Institute for Marine Sciences, 1156 High Street, Santa Cruz, CA 95064, USAc Institute of Ocean Sciences, P.O. Box 6000, Sidney, B.C., Canada V8L 4B2
a r t i c l e i n f o
Article history:
Received 4 May 2008
Received in revised form
16 November 2008
Accepted 26 November 2008Available online 7 December 2008
Keywords:
Coastal upwelling
Winds
Phytoplankton
Red tides
Cochlodinium fulvescens
43/$ - see front matter & 2009 Elsevier Ltd. A
016/j.csr.2008.11.006
esponding author. Tel.: +18317751978; fax:
ail address: [email protected] (J.P. Ryan).
a b s t r a c t
It has recently been shown that inner shelf waters of NE Monterey Bay, California function as an
‘‘extreme bloom incubator’’, frequently developing dense ‘‘red tide’’ blooms that can rapidly spread.
Located within the California Current upwelling system, this open bay is strongly influenced by
oceanographic dynamics resulting from cycles of upwelling favorable winds and their relaxation and/or
reversal. Different wind forcing causes influx of different water types that originate outside the bay:
cold nutrient-rich waters during upwelling and warm nutrient-poor waters during relaxation. In this
study, we examine how the bay’s bloom incubation area can interact with highly variable circulation to
cause red tide spreading, dispersal and retention. This examination of processes is supported by
satellite, airborne and in situ observations of a major dinoflagellate bloom during August and September
of 2004. Remote sensing of high spatial, temporal and spectral resolution shows that the bloom
originated in the NE bay, where it was highly concentrated in a narrow band along a thermal front.
Upwelling circulation rapidly spread part of the bloom, mixing cool waters of an upwelling filament
with warm bloom source waters as they spread. Vertical migration of the dinoflagellate populations was
mapped by autonomous underwater vehicle surveys through the spreading bloom. Following bloom
expansion, a two-day wind reversal forced intrusion of warm offshore waters that dispersed much of
the bloom. Upwelling winds then resumed, and the bloom was further dispersed by an influx of cold
water. Throughout these oceanographic responses to changing winds, an intense bloom persisted in
sheltered waters of the NE bay, where extreme blooms are most frequent and intense. Microscopic
examination of surface phytoplankton samples from the central bay showed that spreading of the
bloom from the NE bay and mixing with regional water masses resulted in significantly increased
abundance of dinoflagellates and decreased abundance of diatoms. Similar dinoflagellate bloom
incubation sites are indicated in other areas of the California Current system and other coastal
upwelling systems. Through frequent bloom development and along-coast transports, relatively small
incubation sites may significantly influence larger regions of the coastal marine ecosystems in which
they reside.
& 2009 Elsevier Ltd. All rights reserved.
1. Introduction
1.1. Environmental setting
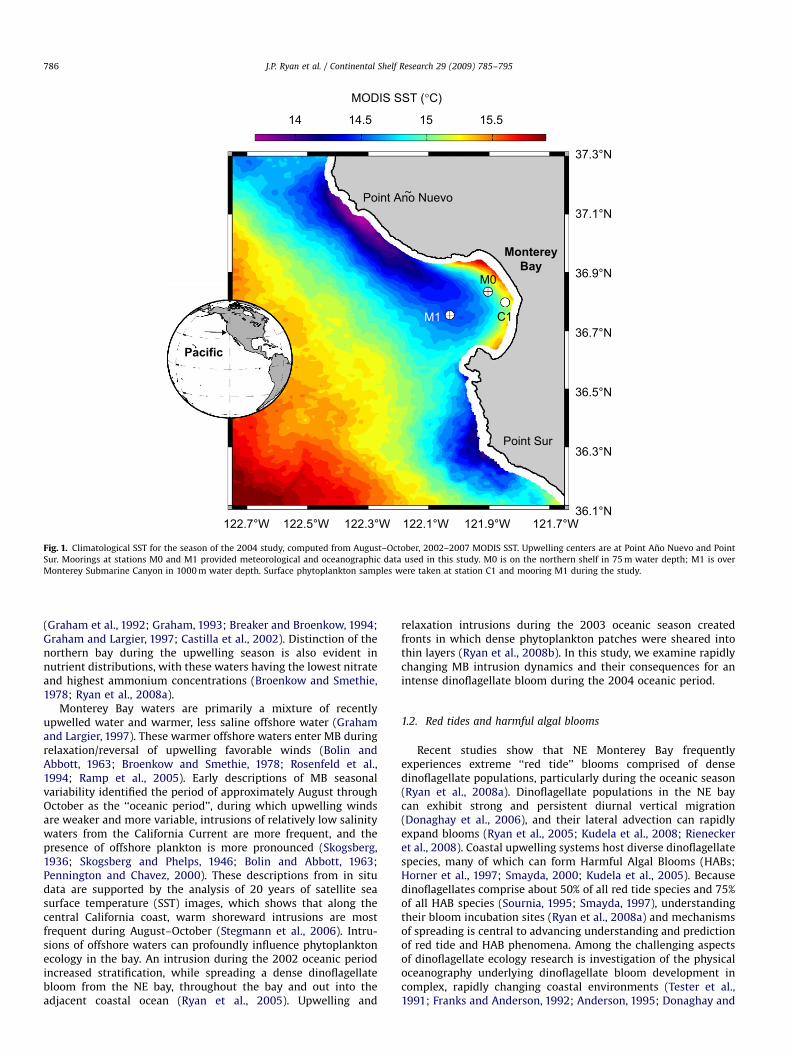
The central California Current System (CCS) is highly produc-tive due to wind-driven upwelling of nutrient-rich water (Reidet al., 1958; Ryther, 1969; Barber and Smith, 1981). Monterey Bay(MB), California, the largest open bay along the west coast of theUS (Fig. 1), lies in the central CCS. Climatological conditions in
ll rights reserved.
+18317751620.
outer Monterey Bay show upwelling and associated highproductivity between approximately March and November(Pennington and Chavez, 2000). Under upwelling favorable(northwesterly) winds, cold filaments are generated at Point AnoNuevo, north of the bay, and at Point Sur, south of the bay (Fig. 1),and their advection into MB is a major source of cold, nutrient-rich waters (Broenkow and Smethie, 1978; Breaker and Broenkow,1994; Rosenfeld et al., 1994). Cold filaments originating from theAno Nuevo upwelling typically flow southward across the baymouth and bifurcate, such that some water flows offshore andsome into the bay (Rosenfeld et al., 1994). This upwellingcirculation creates what has been termed an ‘‘upwellingshadow’’, in which residence time and stratification are enhanced
ARTICLE IN PRESS
MODIS SST (°C)
14 14.5 15 15.5
37.3°N
Point Ano Nuevo
Pacific
Point Sur
M0
C1M1
MontereyBay
37.1°N
36.9°N
36.7°N
36.5°N
36.3°N
36.1°N122.7°W 122.5°W 122.3°W 122.1°W 121.9°W 121.7°W
~
Fig. 1. Climatological SST for the season of the 2004 study, computed from August–October, 2002–2007 MODIS SST. Upwelling centers are at Point Ano Nuevo and Point
Sur. Moorings at stations M0 and M1 provided meteorological and oceanographic data used in this study. M0 is on the northern shelf in 75 m water depth; M1 is over
Monterey Submarine Canyon in 1000 m water depth. Surface phytoplankton samples were taken at station C1 and mooring M1 during the study.
J.P. Ryan et al. / Continental Shelf Research 29 (2009) 785–795786
(Graham et al., 1992; Graham, 1993; Breaker and Broenkow, 1994;Graham and Largier, 1997; Castilla et al., 2002). Distinction of thenorthern bay during the upwelling season is also evident innutrient distributions, with these waters having the lowest nitrateand highest ammonium concentrations (Broenkow and Smethie,1978; Ryan et al., 2008a).
Monterey Bay waters are primarily a mixture of recentlyupwelled water and warmer, less saline offshore water (Grahamand Largier, 1997). These warmer offshore waters enter MB duringrelaxation/reversal of upwelling favorable winds (Bolin andAbbott, 1963; Broenkow and Smethie, 1978; Rosenfeld et al.,1994; Ramp et al., 2005). Early descriptions of MB seasonalvariability identified the period of approximately August throughOctober as the ‘‘oceanic period’’, during which upwelling windsare weaker and more variable, intrusions of relatively low salinitywaters from the California Current are more frequent, and thepresence of offshore plankton is more pronounced (Skogsberg,1936; Skogsberg and Phelps, 1946; Bolin and Abbott, 1963;Pennington and Chavez, 2000). These descriptions from in situdata are supported by the analysis of 20 years of satellite seasurface temperature (SST) images, which shows that along thecentral California coast, warm shoreward intrusions are mostfrequent during August–October (Stegmann et al., 2006). Intru-sions of offshore waters can profoundly influence phytoplanktonecology in the bay. An intrusion during the 2002 oceanic periodincreased stratification, while spreading a dense dinoflagellatebloom from the NE bay, throughout the bay and out into theadjacent coastal ocean (Ryan et al., 2005). Upwelling and
relaxation intrusions during the 2003 oceanic season createdfronts in which dense phytoplankton patches were sheared intothin layers (Ryan et al., 2008b). In this study, we examine rapidlychanging MB intrusion dynamics and their consequences for anintense dinoflagellate bloom during the 2004 oceanic period.
1.2. Red tides and harmful algal blooms
Recent studies show that NE Monterey Bay frequentlyexperiences extreme ‘‘red tide’’ blooms comprised of densedinoflagellate populations, particularly during the oceanic season(Ryan et al., 2008a). Dinoflagellate populations in the NE baycan exhibit strong and persistent diurnal vertical migration(Donaghay et al., 2006), and their lateral advection can rapidlyexpand blooms (Ryan et al., 2005; Kudela et al., 2008; Rieneckeret al., 2008). Coastal upwelling systems host diverse dinoflagellatespecies, many of which can form Harmful Algal Blooms (HABs;Horner et al., 1997; Smayda, 2000; Kudela et al., 2005). Becausedinoflagellates comprise about 50% of all red tide species and 75%of all HAB species (Sournia, 1995; Smayda, 1997), understandingtheir bloom incubation sites (Ryan et al., 2008a) and mechanismsof spreading is central to advancing understanding and predictionof red tide and HAB phenomena. Among the challenging aspectsof dinoflagellate ecology research is investigation of the physicaloceanography underlying dinoflagellate bloom development incomplex, rapidly changing coastal environments (Tester et al.,1991; Franks and Anderson, 1992; Anderson, 1995; Donaghay and

ARTICLE IN PRESS
J.P. Ryan et al. / Continental Shelf Research 29 (2009) 785–795 787
Osborn, 1997; Smayda, 2002; Ryan et al., 2005; Pitcher andNelson, 2006; Fawcett et al., 2007).
1.3. Research objectives
The primary objective of this study is to illustrate howresponses of ocean circulation to characteristic variability in windforcing can influence the dynamics of intense dinoflagellateblooms in Monterey Bay, California. Clearer understanding ofimportant processes in one region will support comparativeapproaches to understanding blooms across different coastalupwelling regions having similar atmosphere–ocean couplingand ecosystem structure. Our approach is an integration ofintensive multi-scale, multidisciplinary observations.
2. Methods
2.1. Satellite remote sensing
Data from two satellite sensors were used in this study. Onewas the Moderate Resolution Imaging Spectroradiometer (MODIS)on the Aqua satellite. From the MODIS image data we producedtrue color, chlorophyll fluorescence line height (FLH), chlorophyllconcentration and sea surface temperature images. We processedMODIS data from Level 1A using the SeaDAS software, applyingcalibrations for ocean remote sensing developed by the MODISOcean Biology Processing Group. The true color images use the645 nm (red), 555 nm (green) and 469 nm (blue) bands, havingspatial resolutions of 250, 500 and 500 m, respectively, withapplication of a basic atmospheric scattering correction. For theatmospheric correction required to derive products (FLH, chlor-ophyll and SST), we computed true 250 m aerosol retrievals usingthe 859 nm band and a fixed aerosol model (Franz et al., 2006).Resulting image data were mapped to a cylindrical projection. Thetrue resolution of FLH, chlorophyll and SST images are at best�1 km at nadir; bilinear interpolation was used to generate 500 mresolution images. The MODIS chlorophyll algorithm consistentlyfailed where the bloom was most intense, but the FLH algorithm(Letelier and Abbott, 1996) provided consistent coverage of thebay, including the most intense regions of the red tide bloom.Further, the FLH patterns closely matched the patterns of reddishcoloration evident in the MODIS true color images. Therefore, wepresent true color, FLH and SST imagery to describe bloom
400 450 500 550
0
0.002
0.004
0.006
0.008
0.01
0.012
Wave
Rrs
(sr-1
)
13 µg l-1
52 µg l-1
Fig. 2. Methods to quantify bloom intensity from multi-spectral remote sensing. The
marked by triangles for MODIS chlorophyll fluorescence line height (FLH), MERIS maxi
(BI). Shown for each sensor are only the three bands covering the spectral range of c
quantification algorithms. Band widths differ between bands on the same sensor, and
measurements in Monterey Bay on September 21–22, 2006, using a Satlantic Profiler I
chlorophyll concentrations. Gray lines illustrate the linear baseline algorithm method o
evolution. The second source was full-resolution (300 m) datafrom the Medium Resolution Imaging Spectrometer (MERIS).Specifically, we used the Maximum Chlorophyll Index (MCI), aparticularly effective indicator of intense phytoplankton blooms(Gower et al., 2005).
2.2. Airborne remote sensing
Airborne remote sensing of Monterey Bay was acquired duringthe early stages of bloom expansion. The Airborne Visible/InfraredImaging Spectrometer (AVIRIS) (Asner and Green, 2001) and theMODIS Airborne Simulator (MAS) (King et al., 1996) were flown ona NASA ER-2 high-altitude (20 km) aircraft on August 26th, 2004.Pixel size of the AVIRIS (MAS) images was �17 (34) m. AVIRISswath width at this altitude was 11 km, requiring overlappingswaths to fully image the bay. The northern bay was imaged bytwo parallel swaths acquired in �27 min. The MAS swath width(37 km) permitted imaging most of the bay during each overpass.AVIRIS imagery was atmospherically corrected using an algorithmdeveloped for hyperspectral remote sensing (Gao et al., 2000).Having contiguous 10 nm bands, AVIRIS enabled imaging of bloomintensity by the detection of spectral shifts in the ocean surfacereflectance peak near 700 nm that are associated with intenseblooms (Gower et al., 2005; Schalles, 2006; Dierssen et al., 2006).Ocean color and thermal imagery were derived from MAS data.SST was computed from the at-sensor radiance using the MAS11.03 micron channel and the emissivity function in the ENviron-ment for Visualizing Images (ENVI) software. The resultingSST images were calibrated with concurrent SST data from themoorings (Fig. 1). We computed a bloom index (BI), similar tothe MCI index of MERIS, from MAS at-sensor radiance data(next section).
2.3. Multi-spectral remote sensing algorithms
All multi-spectral ocean color algorithms used in this studyquantify bloom intensity from upwelling radiance in the red–nearinfrared (NIR) region of the spectrum. The peak in this region ofthe spectrum can occur between �685 and 710 nm, depending onthe concentration and type of phytoplankton and other particulateand dissolved constituents, and it shifts to longer wavelengthswith increasing bloom intensity (Gower et al., 2005; Schalles,2006; Dierssen et al., 2006). The methods of deriving bloomimagery are illustrated in Fig. 2. Centers of the radiance
MODIS
MERIS
MAS
600 650 700 750 800
length (nm)
centers of sensor measurement bands used in the remote sensing algorithms are
mum chlorophyll index (MCI), and MODIS Airborne Simulator (MAS) bloom index
hlorophyll fluorescence and bloom red/NIR reflectance, i.e. those used for bloom
between the multi-spectral sensors. The two reflectance spectra are from in situ
I. Note that the peak near 700 nm rises and shifts to longer wavelengths at higher
f quantifying peaks (Section 2.3).

ARTICLE IN PRESS
8/10 8/15 8/20 8/25 8/30 9/4 9/9 9/14
33
33.2
33.4
33.6
Sa
linity (
psu
)
0
10
20
30
40
Ch
loro
ph
yll
(µg
L-1
)
-5
0
5
8/24
Win
d (
m s
-1)
8/25 8/26 8/27 8/28 8/29 8/30 8/31 9/1 9/2 9/3 9/4 9/5
Fig. 3. Moored observations of oceanographic and meteorological variability in Monterey Bay during the study. (a) Chlorophyll and water mass changes measured at
mooring M0. Shown are chlorophyll at 2 m, and the average of salinity measured at 3.5, 10 and 20 m. The hourly time series were 33 h low-pass filtered to exclude diurnal
and tidal signals. (b) 33 h low-pass filtered winds at mooring M1 during the bloom expansion and dispersion period. The times of MODIS images presented in Fig. 4 are
marked by diamonds and vertical lines.
J.P. Ryan et al. / Continental Shelf Research 29 (2009) 785–795788
measurement bands used for each sensor (triangles) are shown,relative to reflectance spectra measured in phytoplankton-dominated waters of Monterey Bay. Bloom intensity was quanti-fied as the amount that upwelling radiance in the center bandexceeded a linear baseline derived from radiance measured in theadjacent bands. Linear baseline and peak line height are shown forthe MAS bands applied to the spectrum from the higherchlorophyll waters (Fig. 2). The linear baseline method is wellestablished for both MODIS (Letelier and Abbott, 1996) and MERIS(Gower et al., 2005). The primary difference is that the MODISfluorescence line height (FLH) center band at 673–683 nm isplaced to measure algal chlorophyll fluorescence emission,whereas the MERIS maximum chlorophyll index center band at709 nm is placed to measure strong reflectance in the NIR causedby extremely dense surface accumulations of phytoplankton.Because the airborne MAS sensor does not have a chlorophyllfluorescence band, but does have a band centered in the NIR, thealgorithm results in an ‘‘extreme bloom’’ characterization similarto MERIS MCI.
2.4. Moorings
Two moorings, one at the mouth of Monterey Bay (M1) and theother in northern shelf waters (M0) monitored oceanographic andatmospheric variation (Fig. 1). Observations from these mooringspresented in this study include winds at M1, water velocity atboth moorings, and salinity and chlorophyll fluorescence at M0.Surface wind speed and direction were measured by a RM Youngmodel 05103 wind monitor. Temperature and salinity weremeasured by Sea-Bird microcat conductivity, temperature, depth(CTD) sensors at 3.5, 10, 20, 40 and 60 m. Chlorophyll fluorescenceat 2 m was measured by a WetLabs backscattering and fluores-cence sensor, and sensor readings were calibrated using extractedchlorophyll measurements of water samples taken next to thesensor regularly during the study period. Water velocities at M0
and M1 were measured by RD Instruments Workhorse acousticDoppler current profiler (ADCP) instruments. Because shallowcirculation transported the bloom, we examined only velocityabove 20 m at both locations. The shallowest ADCP velocitymeasurements at M0 (M1) are at 10 (20) m.
2.5. Autonomous underwater vehicle
The MBARI autonomous underwater vehicle (AUV) Dorado wasdeployed during the period of bloom expansion, surveyingrepeatedly across the northern shelf region of bloom advection.The speed of the AUV during surveys was �1.5 m s�1, and thevehicle pitch through a sawtooth sampling pattern was 301. Thesesampling attributes provided synoptic high-resolution sectionsthrough shelf waters. The AUV was equipped with a sensor suitefor measuring physical, chemical and optical properties. Wepresent observations from four sensors: a Sea-Bird SBE 25 CTDthat measured temperature and conductivity, a Paroscientific8CB/4000-I pressure sensor, a HOBI Labs HS-2 sensor thatmeasured optical backscattering at two wavelengths and chlor-ophyll fluorescence, and an in situ ultraviolet spectrophotometer(ISUS) sensor that measured nitrate concentrations (Johnson andColetti, 2002).
2.6. Phytoplankton
As part of a long-term monitoring program, surface phyto-plankton samples have been collected approximately every threeweeks, since 1989 at stations C1 and M1 (Fig. 1). Enumerationwas done on glutaraldehyde-preserved samples of surfacewater filtered onto Poretics, polycarbonate, 0.2mm pore size,25-mm-diameter membranes. Prepared slides were analyzedunder epifluorescence microscopy using a Zeiss Axiophotmicroscope, and phytoplankton were identified to functionalgroup at a minimum and to species for the more abundant

ARTICLE IN PRESS
a August 25
b August 27
c August 31
d September 1
31
2
3
e September 3
3
25 cm s−1
(mW cm–2 µm–1 sr–1) (mW cm–2 µm–1 sr–1)
0.01 0.04 0.08
MODIS SST (°C)
14 16 18 0 0.1 0.2
MODIS FLH
MODIS True Color
MERIS MCI
Fig. 4. Description of bloom development from satellite remote sensing. Images are true-color, sea surface temperature (SST), and fluorescence line height (FLH) from the
MODIS satellite sensor, and the maximum chlorophyll index (MCI) from the MERIS satellite sensor. Vectors represent ADCP-measured velocity at 20 m depth at mooring M1,
and in the depth range 10–20 m at mooring M0, averaged over the 25 h period preceding each image. The base of each vector is at the mooring location; a reference vector of
25 cm s�1 is shown in (a). Numbers in (d) and (e) identify features described in the text. Image times are shown relative to the mooring observations in Fig. 3.
J.P. Ryan et al. / Continental Shelf Research 29 (2009) 785–795 789
organisms. Biomass estimates (carbon per liter) were computedfor dinoflagellates and diatoms. Cell volume estimates weremade from the measurements of cell density (counts), dimensionsand shape, using equivalent standard geometric shapes.
Conversion to carbon used equations of Eppley et al. (1970):[log10 C ¼ 0.94 log10 volume–0.6] for dinoflagellates and[log10 C ¼ 0.76 log10 volume–0.29] for diatoms (Buck et al., 1996,2005).

ARTICLE IN PRESS
J.P. Ryan et al. / Continental Shelf Research 29 (2009) 785–795790
3. Results
3.1. Bloom period overview
The dinoflagellate bloom that is the focus of this study causedthe strongest bio-optical signal measured at mooring M0 (locationin Fig. 1) during 2004. Near-surface chlorophyll concentrationsincreased by a factor of 3–4 at this location during late Augustthrough early September (Fig. 3a). This increase in biomassoccurred in two peaks within a 12 day period. Between the twopeaks, the rapid decline and rise in chlorophyll concentrationscorresponded with a similar pattern in salinity, with an approxi-mately 1 day lag (salinity leading). Through this period of rapidchanges in chlorophyll and salinity, winds varied from upwellingfavorable (equatorward, 8/24–8/28), into a strong wind relaxa-tion/reversal (poleward, 8/28–8/30), and back to upwellingfavorable (8/31–9/5). As remote sensing and in situ observationsshow, this wind forcing had profound influences on the develop-ment of a major dinoflagellate bloom. This bloom will beexamined through three phases: expansion, dispersion andretention.
3.2. Bloom expansion
Extreme bloom conditions were observed by two satellitesensors in NE Monterey Bay on August 25th, 2004 (Fig. 4a). Theexceptionally high MERIS MCI signal of this bloom patch representsintense near-surface chlorophyll concentrations. Model studiesindicate that an MCI value of 2 corresponds with surface chlorophyllconcentrations of �400mg L�1 (unpublished results using modeldescribed in Gower et al. (2005)). Although this bloom patch wasnot directly sampled, extracted surface chlorophyll concentrationsexceeding 500mg L�1 have been repeatedly measured in dinofla-
25 cm s–1
36.6°
36.7°
36.8°
36.9°
37.0°
37.1°
122.3°W 122.1°W 121.9°W
SST (°C)
14 15 16 17
Fig. 5. High-resolution airborne remote sensing of physical and bio-optical conditions on
measured velocity at 20 m depth at mooring M1, and in the depth range 10–20 m at m
each vector is at the mooring location; a reference vector of 25 cm s�1 is shown. (b) MAS
far red–near infrared, measured concurrently by AVIRIS. The white lines show transect
gellate blooms in this area of the bay (Ryan et al., 2008a), and valuesexceeding 1000mg L�1 were measured in one bloom (Kudela,unpublished data). The MODIS true color image shows brownishdiscoloration of surface waters in the bloom region (Fig. 4a).Recently upwelled water offshore of the bloom patch is evident asthe cool SST patch in the outer northern bay (Fig. 4a). At that time,southern Monterey Bay exhibited low FLH.
The strong bloom was still present in the NE bay on August27th, as indicated by the reddish brown color of surface watersand high FLH (Fig. 4b). The major change over this two-day periodwas the appearance of reddish brown waters with high FLH in thesouthern bay. Outer bay currents (Fig. 4a and b) were of sufficientmagnitude to have transported bloom waters from the northern tothe southern bay, a maximum distance of �25 km, during the twodays. The satellite images of August 27th (Fig. 4b) coincided with aperiod of gradually decreasing salinity and rapidly increasingchlorophyll concentrations at mooring M0 (Fig. 3a), consistentwith advection of a salinity gradient and bloom waters past themooring.
Although no clear satellite imagery of Monterey Bay wasacquired on August 26th, during a critical stage of the bloomexpansion (Fig. 4a and b), airborne remote sensing and AUVsurveys on this day observed structure and transport of the bloom(Fig. 5). High-resolution SST more clearly showed the upwellingfilament extending across the mouth of the bay from the north,and the sharp SST front of �2 1C between the upwelling filamentand warm waters of the northern bay (Fig. 5a). The SST patternand mooring currents (black vectors) show a cyclonic circulationover the northern bay that brought cool waters into the bay. Thebloom index, which accentuates extreme bloom conditionsshowed the highest bloom signal in the NE bay (Fig. 5b), wherethe bloom had been observed by satellite sensors on the previousand following days (Fig. 4a and b). The band of highest BI wasalong a thermal front (Fig. 5). By August 26th, some of the most
N
N
N
N
N
N
P
F
122.3°W 122.1°W 121.9°W
BI (mW cm–2 µm–1 sr–1)
0.1 0.2 0.3 0.4 0.5
692 nm701 nm711 nm
August 26th, 2004, during bloom expansion. (a) MAS SST; vectors represent ADCP-
ooring M0, averaged over the 25 h period preceding image acquisition. The base of
bloom index (BI); inset shows the peak reflectance wavelengths of the bloom in the
s made by the AUV on August 26th (see Fig. 7).

ARTICLE IN PRESS
2
1
–122 –121.9 –121.8
36.86
36.96
SS
T (
°C)
14
15
16
17
18
BI (m
W c
m–2 µm
–1 s
r–1)
0.1
0.2
0.3
0.4
August 26, 12:09 August 26, 13:21
Fig. 6. Illustration of bloom advection and water mass mixing from high-temporal-resolution airborne remote sensing. MAS SST and bloom index (BI) images were taken
�1 h apart on August 26th. Arrows serve as fixed spatial references. The sequence illustrates movement of bloom waters northward nearshore (arrow 1) and southward
offshore along the flank of the upwelling filament (arrow 2). The white contour is the 16.25 1C isotherm. The gray lines show transects made by the AUV on August 26th (see
Fig. 7).
J.P. Ryan et al. / Continental Shelf Research 29 (2009) 785–795 791
intense bloom was advected seaward and southward (label P inFig. 5b). This patch was connected to the bloom source region by athin filament of enhanced BI (label F in Fig. 5b). The inshore bloompatch was in the warmest waters of the bay, the offshore patchwas also in warm waters, and warm filaments extended betweenthe patches (Fig. 5a and b). These patterns indicate that some ofthe warm bloom waters of the NE bay were transported offshoreand entrained southward along the flank of the upwellingfilament.
AVIRIS hyperspectral imaging showed that much of theadvecting bloom exhibited a spectral peak in bands centered at701 or 711 nm (inset of Fig. 5b). Chlorophyll concentrations andremote sensing reflectance spectra measured in situ during adifferent bloom (Fig. 2) showed spectra peaking at 700 nm inwaters having chlorophyll concentrations exceeding 50mg L�1.Thus the regions of the bloom exhibiting a spectral peak in the711 nm band likely contained chlorophyll concentrations signifi-cantly higher than 50mg L�1, as indicated by the very high MCIcorresponding to �400mg L�1 (Fig. 4a).
In addition to the most concentrated patches, moderate BIvalues (0.15–0.2) were evident over much of the northern bay andextending into the southern bay (Fig. 5b). This pattern isconsistent with southward advection of bloom waters andmixing with the upwelling filament that was flowing into thebay (Fig. 5). Airborne images of the bay acquired 1 h apartillustrate mixing of the advected bloom with recently upwelledwaters (Fig. 6). During this brief period, the nearshore bloompatch and the warmest waters moved northward and onshore(arrow 1 in Fig. 6a–d). Concurrently, the warm bloom patchadjacent to the upwelling filament moved southward (arrow 2).This further defines the cyclonic flow in the northern bay. Thechanges in SST around the offshore patch indicate that strongmixing occurred between the warm waters flowing seaward fromthe inner bay and the cool, recently upwelled waters (arrow 2 inFig. 6a and c).
The AUV surveys across the northern bay on August 26thmapped the transported bloom. The daytime survey was west ofthe nighttime survey and traversed the zone of strong lateralmixing between the advecting bloom and the upwelled filament;it did not intersect the strongest bloom patch (Fig. 5). The highest
chlorophyll concentrations were in frontal zone (Fig. 7a and b),where the bloom was entrained into the upwelling filamentcirculation (Fig. 5), and relatively high chlorophyll levels were inthe warm waters at the northern end of the AUV survey (Fig. 7aand b). The phytoplankton were concentrated in low-nitratewaters of the upper 5 m (Fig. 7a and c). Southward transport ofwaters from the NE bay is evident as the expanded domain ofshallow, warm water between the day and night transects (Fig. 7band e). During the nighttime survey, the bloom was below thewarm surface layer (Fig. 7d and e). Non-photosynthetic quenchingof fluorescence would result in the opposite pattern, with reduced(enhanced) fluorescence at the surface during daytime (night-time). Further, optical backscatter exhibited the same pattern aschlorophyll (not shown). This change in the vertical distribution ofphytoplankton, with downward displacement of the population atnight into colder, more nutrient-rich water (Fig. 7), is consistentwith the migratory behavior of dinoflagellates, which can swiminto the nutricline during the night for nutrient uptake (Cullen andHorrigan, 1981; Heaney and Eppley, 1981; Donaghay et al., 2006).
3.3. Bloom dispersion
By August 31st, the distribution of the bloom had changedsignificantly. Following the August 28–30 wind reversal (Fig. 3b),flow into the bay from the south brought relatively chlorophyll-poor waters, which flushed and mixed with bloom waters innearly the entire southern bay, extended into the northern bay,and forced bloom waters out of the northern bay (Fig. 4c). Thepatches of high FLH still exhibited a reddish brown color (Fig. 4c).Northward flow continued through September 1st, bringingcool waters from the Point Sur upwelling into the southern bay(Label 1 in the SST image of Fig. 4d). Subtidal flow at bothmoorings was onshore and northward (vectors in Fig. 4d). Weakupwelling had resumed the previous day (Fig. 3b), and SSTindicated flow of cool, recently upwelled waters into the northernbay (label 2 in Fig. 4d). These flows further dispersed the bloom. Abloom patch flushed from the bay is identified by label 3 in Fig. 4d.By September 3rd, subtidal flow at the moorings remainedonshore and turned southward at M0, and flow of cold, upwelled

ARTICLE IN PRESS
De
pth
(m
)
5
10
15
20
25
5
10
15
20
25
Ch
loro
ph
yll
(µg
L–1)
0
5
10
15
De
pth
(m
)
5
10
15
20
25
5
10
15
20
25
Te
mp
era
ture
(°C
)
12
14
16
De
pth
(m
)
Latitude (°N)
36.8 36.85 36.9
5
10
15
20
25
Latitude (°N)
36.8 36.85 36.9
5
10
15
20
25
Nitra
te (
µM)
0
5
10
15
Fig. 7. Observation of bloom transport made by autonomous underwater vehicle (AUV) on August 26th, 2004. AUV transect locations are shown in Figs. 5 and 6. The
western survey was occupied between 10:40 and 13:03 PST (a–c); the eastern survey was occupied between 21:02 and 23:03 PST (d–f). Both AUV surveys progressed from
onshore to offshore, sampling between 2 m and near-bottom; only the depth range 2–25 m is shown. Each section included 30 profiles. The white contours in all panels are
the 8.5mg L�1 chlorophyll contour.
Table 1Statistics of phytoplankton biomass for autotrophic dinoflagellates and diatoms at
time-series stations C1 and M1 (summed) during the dinoflagellate red tide bloom
period.
17th August 8th September
Dinoflagellate biomass (mg C L�1) 556 1667
Diatom biomass (mg C L�1) 246 34
Dinoflagellate/diatom biomass ratio 2 49
Station locations are shown in Fig. 1. See methods for description of biomass
estimates.
J.P. Ryan et al. / Continental Shelf Research 29 (2009) 785–795792
waters into northern bay further dispersed the bloom (Fig. 4e).Outside the bay, the upwelling filament flowed offshore, char-acteristic of the bifurcated flow of upwelling filaments (Rosenfeldet al., 1994). The bloom patch flushed from the bay advectedsouthward and was reduced in magnitude (label 3 in Fig. 4e).Observations from mooring M0 showed the hydrographic and bio-optical changes associated with the flushing and mixing. Chlor-ophyll concentrations and salinity dropped precipitously on August31st–September 1st when the lower salinity, chlorophyll-pooroffshore waters arrived at the mooring site (Fig. 3a).
3.4. Bloom retention
While most of the bay exhibited relatively low FLH, followingbloom dispersion and the return of upwelling, an intense bloompatch was retained in nearshore waters of the NE bay. This patchappeared ruddy brown in the MODIS true color image andexhibited high FLH and MCI (Fig. 4e).
3.5. Phytoplankton community changes
Previous studies have examined dinoflagellate species data fromnorthern bay samples during summer and fall of 2004 and foundthat Cochlodinium fulvescens, Akashiwo sanguinea, and Ceratium spp.dominated (Curtiss et al., 2008; Kudela et al., 2008). Here, wepresent previously unreported dinoflagellate and diatom data fromthe central bay (stations C1 and M1, Fig. 1) that are relevant tounderstanding influences of the dinoflagellate bloom dynamics(Table 1). Samples were acquired on August 17th, preceding bloom
expansion, and September 8th, following bloom dispersion. Dino-flagellates dominated phytoplankton biomass on August 17th by afactor of 2. Following bloom expansion and dispersion, dinoflagel-late dominance increased to a factor of 49. The same dinoflagellatespecies noted in previous studies from other sampling locationsduring summer and fall of 2004 also dominated dinoflagellatepopulations observed at stations C1 and M1, during this study.Pseudo-nitzschia species dominated diatom biomass on August 17th,and their absence in samples from September 8th accounted for thesharp decrease in diatom biomass.
4. Discussion
4.1. The upwelling shadow
The ‘‘upwelling shadow’’ in northern Monterey Bay is ofparticular relevance to the observed bloom dynamics. Upwelling

ARTICLE IN PRESS
J.P. Ryan et al. / Continental Shelf Research 29 (2009) 785–795 793
shadows strongly influence patterns of water mass distributions,fronts and circulation, thereby determining distributions ofnutrients and plankton (Graham and Largier, 1997; Castilla et al.,2002; Narvaez et al., 2004). One influence is the cycloniccirculation that develops within northern MB during upwelling.This circulation entrained part of the NE bay bloom and rapidlyspread the bloom. Another influence of the upwelling shadow isretention. Retention was evident during two phases of the bloom.The first phase was bloom expansion. Despite the strong cyclonicflow transporting part of the bloom seaward and southward, alarge patch of the bloom remained in the NE corner of the bay.This is the same area where drifter studies have indicated a strongretention zone (Ryan et al., 2008a). The second phase of retentionoccurred when much of the bay was flushed by two water masses:offshore waters followed by recently upwelled waters. Data fromtwo satellite sensors on September 3rd confirmed that bloomwaters were retained in the northernmost upwelling shadow,while the bloom was dispersed/mixed throughout most of the restof the bay by the water mass influxes. The NE bay thus functionednot only as the source region for the expanding bloom, but also asa refuge from dispersion. A similar rapidly expanding bloomduring the 2002 oceanic season started in the same NE area ofMonterey Bay (Ryan et al., 2005), where average ‘‘extreme bloom’’intensity is greatest (Ryan et al., 2008a). However, dynamics ofbloom advection were quite different between the two studies. In2002, the bloom was spread by an anticyclonic circulation thatdeveloped following flushing of the bay by offshore waters. In2004, the bloom was spread by a cyclonic circulation thatdeveloped with upwelling.
4.2. Bloom transport and fertilization
The SST changes observed within the advecting bloom indicatesignificant mixing of bloom waters with recently upwelled waters.Thus, the bloom was not only transported by upwelling circula-tion, but also presumably fertilized by recently upwelled waters.High-resolution remote sensing indicated that cross-frontalmixing extended along much of the front, including the north-ernmost region, where it is dominated by buoyancy, and thesouthern portion dominated by shear (Graham and Largier, 1997).High-resolution SST showed that lateral mixing was stronger inthe central and southern bay, i.e. along the southern, shear-dominated portion of the front and where influx of recentlyupwelled waters into the bay was greatest. The more diffusebloom patterns in the central and southern bay, shown by MAS BI,were consistent with relatively strong cross-frontal and cross-shelf mixing.
4.3. Biological–physical interactions
Dinoflagellate blooms in NE Monterey Bay can form extremelydense populations aggregated near the surface. The great intensityof blooms in this region is related not only to favorable growthconditions for dinoflagellates, but also to concentration ofpopulations by biological–physical interactions (Ryan et al.,2005, 2008a). A key physical process is convergent surface flow.Dinoflagellate populations transported into convergent frontalzones can be concentrated if their upward swimming is sufficientto overcome downwelling in the convergence (Ryther, 1955;Franks, 1997; Stumpf et al., 2008). In the present study, as thebloom was being transported, it was highly concentrated along athermal front. The frontal zone extended across the intrudingupwelled waters into the warmest bay waters containing thebloom. The inshore part of the intrusion flowed towards the
bloom and northern shore, which may have caused convergencein the bloom area. Thus, the same physics that caused stirring ofregional water masses and spreading of the bloom probablygenerated the front in which the bloom was highly concentrated.Bloom concentration, in turn, may have intensified the front. Thespatial coincidence of the most intense bloom patch with thewarmest waters indicates that the bloom may have intensifiedshallow light absorption and heating, a process that can besignificant in coastal waters (Dugdale et al., 1987; Cahill et al.,2008).
Interaction between the ecophysiological characteristics ofbloom populations (Smayda, 1997) and the physics of bloomtransport are also evident in this study. Cochlodinium fulvescens,
Ceratium spp., and Akashiwo sanguinea dominated this bloom, andthese phytoplankton have consistently dominated dinoflagellateblooms observed in this region in recent years (Ryan et al., 2005;Kudela et al., 2008; Curtiss et al., 2008; Rienecker et al., 2008).These phytoplankton are of the ‘‘mixing-drift’’ type (Smayda,2000, 2002), which are adapted to dynamic and rapidly changingconditions forced by variability in coastal upwelling, includingthe high velocity zones of fronts, entrainment by coastal currentsand responses to wind relaxation. The intensification of dino-flagellate dominance in central Monterey Bay following bloomexpansion, dispersion and mixing indicates that the speciescomprising the bloom were successfully adapted to energeticenvironmental variability, as is characteristic of mixing-driftphytoplankton.
4.4. Other coastal upwelling regions
The Global Ecology and Oceanography of Harmful Algal Blooms(GEOHAB) program espouses a comparative approach to studyingHAB ecology, in which natural events are compared andcontrasted within and between regions to elucidate commonforcing mechanisms as well as regionally distinct influences(GEOHAB, 2005; Anderson et al., 2005; Kudela et al., 2008). Thereis growing evidence of bloom incubation in sheltered regions ofcoastal upwelling systems, including northern San Luis ObispoBay, California (M. Moline, personal communication), Lisbon Bay,Portugal (Moita et al., 2006), Paracas Bay, Peru (Kahru et al., 2004)and St. Helena Bay, South Africa (Pitcher and Nelson, 2006;Fawcett et al., 2007). Of these locations, perhaps the mostthoroughly characterized is St. Helena Bay. Common character-istics of Monterey Bay and St. Helena Bay include: (1) upwellingflows separate from the coast and extend across mouth of bay,creating distinct zones and sharp frontal boundaries; (2) retentioninshore of the upwelling plumes favor stratification and develop-ment of dinoflagellate blooms, and retention is evident duringboth upwelling and relaxation; (3) intensity of the dinoflagellateblooms is strongly influenced by physical concentration mechan-isms. In Monterey Bay, drifter and model studies indicate thatstrong nearshore poleward currents develop within and adjacentto the bay during wind relaxation/reversal (unpublished results),suggesting a potential similarity to St. Helena Bay, however, noneof the limited Monterey Bay drifter observations were madeduring red tide bloom periods. Due to limited observations,definitive differences between the dinoflagellate ecology ofthese systems are less certain. One apparent difference is thatwhile red tide is primarily a relaxation-period phenomenonin St. Helena Bay, the present study shows that red tide canpersist in Monterey Bay through upwelling and relaxation.Another apparent difference is that while blooms are transportedpoleward and retained within St. Helena Bay during relaxation,our study shows significant bloom flushing from Monterey Bayduring relaxation.

ARTICLE IN PRESS
J.P. Ryan et al. / Continental Shelf Research 29 (2009) 785–795794
5. Conclusions
Coastal areas having conditions that generate frequent intenseblooms, such as northern Monterey Bay, may disproportionatelyinfluence the greater coastal marine ecosystems in which theyreside. Subject to rapid changes in circulation that result fromsynoptic weather patterns, such ‘‘bloom incubators’’ may serve asseed sources to adjacent coastal environments. Identification ofparticularly active bloom sites and understanding of coastaltransport patterns are prerequisite for determining where in situmonitoring resources are most needed. Emergent coastal oceanobserving systems are essential to advance this challengingresearch area that has significant implications for ecosystem andhuman health.
Acknowledgments
This research was supported by the David and Lucile PackardFoundation and by NASA Grant NAG5-12692 and is part of theGEOHAB Harmful Algal Blooms in Upwelling Systems CoreResearch Project. We thank MBARI AUV operations for acquisitionof the AUV data, and the MBARI Observatory Support Groupfor mooring support. M0 mooring data were provided by theCenter for Integrated Marine Technology under NOAA awardNA160C2936. MODIS Level 1 data were provided by the Level 1and Atmosphere Archive and Distribution System (LAADS), andour MODIS data processing was enabled by the NASA MODISOcean Biology Processing Group and the NASA SeaDAS softwaredevelopment team. We thank the AVIRIS and MAS sensor teams,Dryden Flight Research Center and the ER-2 pilots for the airborneremote sensing used in this study. We thank K. Buck for assistancewith the phytoplankton data. Comments from three anonymousreviewers helped to improve the original manuscript.
References
Anderson, D.M., 1995. Toxic red tides and harmful algal blooms: a practicalchallenge in coastal oceanography. Reviews of Geophysics 33 (suppl.),1189–1200.
Anderson, D.M., Pitcher, G.C., Estrada, M., 2005. The comparative systems approachto HAB research. Oceanography 18, 148–157.
Asner, G.P., Green, R.O., 2001. Imaging spectroscopy measures desertification inUnited States and Argentina. EOS 82 (49), 601–606.
Barber, R.T., Smith, R.L., 1981. Coastal upwelling ecosystems. In: Longhurst, A.R.(Ed.), Analysis of Marine Ecosystems. Academic, New York, pp. 31–68.
Bolin, R.L., Abbott, D.P., 1963. Studies on the marine climate and phytoplankton ofthe central coastal area of California, 1954–1960. California CooperativeOceanic Fisheries Investigations 9, 23–45.
Breaker, L.C., Broenkow, W.W., 1994. The circulation of Monterey Bay and relatedprocesses. Oceanography and Marine Biology: An Annual Review 32, 1–64.
Broenkow, W.W., Smethie, W.M., 1978. Surface circulation and replacement ofwater in Monterey Bay. Estuarine and Coastal Marine Science 6, 583–603.
Buck, K.R., Chavez, F.P., Campbell, L., 1996. Basin-wide distributions of living carboncomponents and the inverted trophic pyramid of the central gyre of the NorthAtlantic Ocean, summer 1993. Aquatic Microbial Ecology 10, 283–298.
Buck, K.R., Marin III, R., Chavez, F.P., 2005. Heterotrophic dinoflagellate fecal pelletproduction: grazing of large, chain-forming diatoms during upwelling eventsin Monterey Bay, California. Aquatic Microbial Ecology 40, 293–298.
Cahill, B., Schofield, O., Chant, R., Wilkin, J., Hunter, E., Glenn, S., Bissett, P., 2008.Dynamics of turbid buoyant plumes and the feedbacks on near-shorebiogeochemistry and physics. submitted to Geophysical Research Letters 35,L10605.
Castilla, J.C., Lagos, N.A., Guinez, R., Largier, J.L., 2002. Embayments and nearshoreretention of plankton; the Antofagasta Bay and other examples. In: Castilla, J.C.,Largier, J.L. (Eds.), The Oceanography and Ecology of the Nearshore and Bays inChile. Proceedings of the International Symposium on Linkages and Dynamicsof Coastal Systems: Open Coasts and Embayments, Santiago Chile, 2002.Ediciones Universidad Catolica de Chile, Santiago, pp. 179–203.
Cullen, J.J., Horrigan, S.G., 1981. Effects of nitrate on the diurnal vertical migration,carbon-to-nitrogen ratio, and the photosynthetic capacity of the dinoflagellateGymnodinium splendens. Marine Biology 62, 81–89.
Curtiss, C.C., Langlois, G.W., Busse, L.B., Mazzillo, F., Silver, M.W., 2008. Theemergence of Cochlodinium along the California Coast (USA). Harmful Algae 7,337–346.
Dierssen, H.M., Kudela, R.M., Ryan, J.P., Zimmerman, R.C., 2006. Red and blacktides: quantitative analysis of water-leaving radiance and perceived color forphytoplankton, colored dissolved organic matter, and suspended sediments.Limnology and Oceanography 51 (6), 2646–2659.
Donaghay, P.L., Osborn, T.R., 1997. Toward a theory of biological–physical control ofharmful algal bloom dynamics and impacts. Limnology and Oceanography 42,1283–1296.
Donaghay, P.L., Sullivan, J.M., Rines, J.E., Graff, J., Hanson, A.K., Holliday, D.V., 2006.The importance of swimming behavior in controlling the formation. EOS 87(36) (suppl.).
Dugdale, R.C., Wilkerson, F.P., Barber, R.T., Blasco, D., Packard, T.T., 1987. Changes innutrients, pH, light penetration and heat budget by migrating photosyntheticorganisms. Oceanol. Acta, Proceedings of the International Symposium onEquatorial Vertical Motion, Paris, 6-10 May 1985, pp. 103–107.
Eppley, R.W., Reid, F.M.H., Strickland, J.D.H., 1970. Estimates of phytoplankton cropsize, growth rates and primary production. Bulletin of the Scripps Institution ofOceanography 17, 33–42.
Fawcett, A., Pitcher, G., Bernard, S., Cembella, A., Kudela, R., 2007. Contrasting windpatterns and toxigenic phytoplankton in the southern Benguela upwellingsystem. Marine Ecology Progress Series 348, 19–31.
Franks, P.J.S., 1997. Spatial patterns in dense algal blooms. Limnology andOceanography 42, 1297–1305.
Franks, P.J.S., Anderson, D.M., 1992. Alongshore transport of a toxic phytoplanktonbloom in a buoyancy current: Alexandrium tamarense in the Gulf of Maine.Marine Biology 112, 153–164.
Franz, B.A., Werdell, P.J., Meister, G., Kwiatkowska, E.J., Bailey, S.W., Ahmad, Z.,McClain, C.R., 2006. MODIS Land Bands for Ocean Remote Sensing Applica-tions. In: Proceedings of the Ocean Optics XVIII, Montreal, Canada, 9–13October 2006.
Gao, B.C., Montes, M.J., Ahmad, Z., Davis, C.O., 2000. Atmospheric correctionalgorithm for hyperspectral remote sensing of ocean color from space. AppliedOptics 39, 887–896.
GEOHAB, 2005. Global Ecology and Oceanography of Harmful Algal Blooms,GEOHAB Core Research Project: HABs in Upwelling Systems. In: Pitcher, G.,Moita, T., Trainer, V., Kudela, R., Figueiras, P., Probyn, T. (Eds.), SCOR and IOC,Paris and Baltimore, p. 82.
Gower, J., King, S., Borstad, G., Brown, L., 2005. Detection of intense planktonblooms using the 709 nm band of the MERIS imaging spectrometer. Interna-tional Journal of Remote Sensing 26, 2005–2012.
Graham, W.M., 1993. Spatio-temporal scale assessment of an ‘upwelling shadow’in northern Monterey Bay, California. Estuaries 16, 83–91.
Graham, W.M., Largier, J.L., 1997. Upwelling shadows as nearshore retention sites:the example of northern Monterey Bay. Continental Shelf Research 17,509–532.
Graham, W.M., Field, J.G., Potts, D.C., 1992. Persistent ‘upwelling shadows’ and theirinfluence on zooplankton distributions. Marine Biology 114, 561–570.
Heaney, S.I., Eppley, R.W., 1981. Light, temperature and nitrogen as interactingfactors affecting diel vertical migrations of dinoflagellates in culture. Journal ofPlankton Research 3 (2), 331–344.
Horner, R.A., Garrison, D.L., Plumley, F.G., 1997. Harmful algal blooms and redtide problems on the US West coast. Limnology and Oceanography 42,1076–1088.
Johnson, K.S., Coletti, L.J., 2002. In situ ultraviolet spectrophotometry for high-resolution and long-term monitoring of nitrate, bromide and bisulfide in theocean. Deep-Sea Research I 49, 1291–1305.
Kahru, M., Mitchell, B.G., Diaz, A., Miura, M., 2004. MODIS detects a devastatingalgal bloom in Paracas Bay, Peru. EOS, Transactions AGU 85, 465–472.
King, M.D., Menzel, W.P., Grant, P.S., Myers, J.S., Arnold, G.T., Platnick, S.E., Gumley,L.E., Tsay, S.C., Moeller, C.C., Fitzgerald, M., Brown, K.S., Osterwisch, F.G., 1996.Airborne scanning spectrometer for remote sensing of cloud, aerosol, watervapor and surface properties. Journal of Atmospheric and Oceanic Technology13, 777–794.
Kudela, R., Pitcher, G., Probyn, T., Figueiras, F., Moita, T., Trainer, V., 2005. Harmfulalgal blooms in coastal upwelling systems. Oceanography 18, 184–197.
Kudela, R.M., Ryan, J.P., Blakely, M.D., Lane, J.Q., Peterson, T.D., 2008. Linking thephysiology and ecology of Cochlodinium to better understand harmful algalbloom events: a comparative approach. Harmful Algae 7, 278–292.
Letelier, R.M., Abbott, M.R., 1996. An analysis of chlorophyll fluorescencealgorithms for the moderate resolution imaging spectrometer (MODIS).Remote Sensing and Environment 58, 215–223.
Moita, M.T., Palma, S., Oliviera, P.B., Vidal, T., Silva, A., Vilarinho, M.G., 2006. Thereturn of Gymnodinium catenatum after 10 years: bloom initiation andtransport of the Portuguese coast. In: Proceedings of the Twelfth InternationalCongress on Harmful Algae, PO.06–14, September 2006, Copenhagen.
Narvaez, D.A., Poulin, E., Leiva, G., Hernandez, E., Castilla, J.C., Navarrette, S.A.,2004. Seasonal and spatial variation of nearshore hydrographic conditions incentral Chile. Continental Shelf Research 24, 279–292.
Pennington, J.T., Chavez, F.P., 2000. Seasonal fluctuations of temperature, salinity,nitrate, chlorophyll and primary production at station H3/M1 over 1989–1996in Monterey Bay, California. Deep-Sea Research II 47, 947–973.
Pitcher, G.C., Nelson, G., 2006. Characteristics of the surface boundary layerimportant to the development of red tide on the southern Namaqua shelfof the Benguela upwelling system. Limnology and Oceanography 51,2660–2674.
Ramp, S.R., Paduan, J.D., Shulman, I., Kindle, J., Bahr, F.L., Chavez, F.P.,2005. Observations of upwelling and relaxation events in the northern
ARTICLE IN PRESS
J.P. Ryan et al. / Continental Shelf Research 29 (2009) 785–795 795
Monterey Bay during August 2000. Journal of Geophysical Research 110,C07013.
Reid, J.L., Roden, G.I., Wyllie, J.G., 1958. Studies of the California Current System.California Cooperative Oceanic Fisheries Investigations, Progress Report, 1stJuly 1956–1st January 1958, pp. 27–56.
Rienecker, E.R., Ryan, J.P., Marin III, R., Blum, M., Dietz, C., Chavez, F.P., 2008.Synoptic mapping of the phytoplankton size distribution, with applications tothe ecology of red tides and harmful algal blooms. Limnology andOceanography: Methods 6, 153–161.
Rosenfeld, L.K., Schwing, F.B., Garfield, N., Tracy, D.E., 1994. Bifurcated flow from anupwelling center: a cold water source for Monterey Bay. Continental ShelfResearch 14, 931–964.
Ryan, J.P., Dierssen, H.M., Kudela, R.M., Scholin, C.A., Johnson, K.S., Sullivan, J.M.,Fischer, A.M., Rienecker, E.V., McEnaney, P.R., Chavez, F.P., 2005. Coastal oceanphysics and red tides: an example from Monterey Bay, California. Oceano-graphy 18, 246–255.
Ryan, J.P., Gower, J.F.R., King, S.A., Bissett, W.P., Fischer, A.M., Kudela, R.M., Kolber,Z., Mazzillo, F., Rienecker, E.R., Chavez, F.P., 2008a. A coastal ocean extremebloom incubator. Geophysical Research Letters 35, L12602.
Ryan, J.P., McManus, M.A., Paduan, J.D., Chavez, F.P., 2008b. Phytoplankton thinlayers caused by shear in frontal zones of a coastal upwelling system. MarineEcology Progress Series 354, 21–34.
Ryther, J.H., 1955. Ecology of autotrophic marine dinoflagellates with reference tored water conditions. In: Johnson, F.H. (Ed.), The Luminescence of BiologicalSystems. AAAS, Washington, pp. 387–414.
Ryther, J.H., 1969. Photosynthesis and fish production in the sea. Science 166,72–76.
Schalles, J.F., 2006. Optical remote sensing techniques to estimate phytoplanktonchlorophyll a concentration in coastal waters with varying suspended matter
and CDOM concentrations. In: Richardson, L.L., LeDrew, E.F. (Eds.), RemoteSensing of Aquatic Coastal Ecosystem Processes: Science and ManagementApplication. Springer, Berlin (Chapter 3).
Skogsberg, T., 1936. Hydrography of Monterey Bay, California. Thermal conditions,1929–1933. Transactions of the American Philosophical Society 90, 350–386.
Skogsberg, T., Phelps, A., 1946. Hydrography of Monterey Bay, California. Thermalconditions, Part II 1934–1937. Proceedings of the American PhilosophicalSociety 90, 350–386.
Smayda, T.J., 1997. Harmful algal blooms: their ecophysiology and generalrelevance to phytoplankton blooms in the sea. Limnology and Oceanography42, 1137–1153.
Smayda, T.J., 2000. Ecological features of harmful algal blooms in coastal upwellingsystems. South African Journal of Marine Science 22, 219–253.
Smayda, T.J., 2002. Turbulence, watermass stratification and harmful algal blooms:an alternative view and frontal zones as pelagic seed banks. Harmful Algae 1,95–112.
Sournia, A., 1995. Red-tide and toxic marine phytoplankton of the world ocean: aninquiry into biodiversity. In: Lassus, P., Arzul, G., Erard-Le Denn, E., Gentien, P.,Marcaillou-LeBaut, C. (Eds.), Harmful Marine Algal Blooms. Lavoisier, Paris,pp. 103–112.
Stegmann, P.M., Foley, D.G., King, C., Schwing, F.B., Price, H., Bograd, S.J., Palacios,D.M., 2006. Integrating enhanced satellite data maps into coastal management.EOS 87 (14), 137.
Stumpf, R.P., Litaker, R.W., Lanerolle, L., Tester, P.A., 2008. Hydrodynamicaccumulation of Karenia off the west coast of Florida. Continental ShelfResearch 28, 189–213.
Tester, P.A., Stumpf, R.P., Vukovich, F.M., Folwer, P.K., Turner, J.T., 1991. An expatriatered tide bloom: transport, distribution, and persistence. Limnology andOceanography 36, 1053–1061.
Copyright © 2022 FDOKUMEN