Influence of nitrogen and duration of weed interference on corn growth and development
11
546 • Weed Science 51, July–August 2003 Weed Science, 51:546–556. 2003 Influence of nitrogen and duration of weed interference on corn growth and development Sean P. Evans University of Nebraska, Lincoln, NE 68583. Current address: University of Illinois, Macomb Extension Center, Macomb, IL 61455 Stevan Z. Knezevic Corresponding author. Haskell Agricultural Laboratory, University of Nebraska, 57905 866 Road, Concord, NE 68728-2828; [email protected] John L. Lindquist Department of Agronomy and Horticulture, University of Nebraska, Lincoln, NE 68583-0817 Charles A. Shapiro Haskell Agricultural Laboratory, University of Nebraska, 57905 866 Road, Concord, NE 68728- 2828 An improved understanding of the effects of nitrogen (N) on crop–weed interactions is needed for the development of integrated weed management systems where re- sponsible use of N fertilizers is considered. Field experiments conducted in 1999 and 2000 at two locations in eastern Nebraska quantify the effects of N and in- creasing duration of weed interference on corn growth and development. A naturally occurring population of weeds was allowed to compete with the corn crop for in- creasing lengths of time and at three rates of N application (0, 60, and 120 kg N ha 21 ). Weed interference and withholding applied N increased the time to 50% silking by an average of 3.9 and 2.9 d, respectively. Regardless of treatments, relative growth rates of corn leaf area and biomass were maximized between the V1 and V2 growth stages of corn and increased linearly with N rate but were affected to a lesser extent by weed presence. The improvement in early season corn growth with addi- tion of N resulted in greater leaf area, biomass, and height, which improved the competitive ability of corn against weeds. Reductions in maximum corn leaf area and height due to weed interference usually began earlier and were more extensive at reduced rates of N. Partitioning of biomass to reproductive structures increased with N during reproductive stages, likely contributing to greater harvest indices at the end of the season. Results from this study indicate that the effects of N fertil- ization on early-season crop growth provided a competitive advantage for corn rel- ative to weeds, thereby increasing the length of time that weeds could compete with a crop before removal was required, but further research is needed to identify mech- anisms regarding improved crop tolerance to weeds. Nomenclature: Corn, Zea mays L. ‘DK589RR’. Key words: Critical time of weed removal, duration of weed interference, growth analysis, growth curves, light competition, N competition, resource acquisition. The competitive relationship between plant species is highly dependent on many factors including the supply and availability of nutrients. Therefore, the manipulation of soil fertility is a potential tool for integrated weed management (Di Tomaso 1995). Of all nutrients, plant response to ni- trogen (N) fertilizer is the most widely observed, and it is suggested that the manipulation of soil N supply offers the most promise in the short term as a means by which crop– weed competitive outcomes can be influenced (Walker and Buchanan 1982). Competition for light has been identified as the primary cause of crop yield loss in many crop–weed associations (King and Purcell 1997; Kropff et al. 1987; Lindquist and Mortensen 1999; Munger et al. 1987). However, above- ground plant performance is often mediated by below- ground nutrient acquisition, and vice versa (Casper and Jackson 1997). Therefore, the availability of nutrients such as N can influence the timeliness and extent of early season competition from weeds (Weaver et al. 1992). Contrasting outcomes regarding the effects of N supply and corn–weed competition have been presented in the lit- erature. In a greenhouse study, Teyker et al. (1991) reported greater N uptake for redroot pigweed (Amaranthus retroflexus L.) than corn when the addition of N was elevated, sug- gesting that redroot pigweed interference in corn may be greater at higher levels of N. Others also have postulated that weeds may be more competitive when fertility is en- hanced with N addition because of the superior uptake ef- ficiency of many weed species (Di Tomaso 1995; Sibuga and Bandeen 1980). However, evidence also suggests a positive effect of N fertilization on corn competitive ability under field conditions. For example, Nieto and Staniforth (1961) reported that the reduction in corn yield because of inter- ference from foxtails (Setaria spp.) was relatively greater at low vs. high N levels. Tollenaar et al. (1994) reported that interference from mixed weeds emerging shortly after corn reduced corn biomass, harvest index, and final grain yield to a greater extent at low vs. high levels of soil N. More recently, Evans et al. (2002) showed that reduced rates of N resulted in an earlier beginning of the critical period for weed control (CPWC) in corn. To identify the mechanisms underlying crop–weed com- petition for N, it is important to quantify the interactive effects of weed interference and N on crop growth param- eters and determine how changes in those attributes affect yield. The outcomes of weed interference that are most often associated with crop yield reductions include (1) reduced amount and duration of green leaf area (Hall et al. 1992; Knezevic et al. 1994; Van Acker et al. 1993) and (2) reduced crop height or increased height differential between the crop and weeds (Fellows and Roeth 1992; Teasdale 1998). How- ever, little attention has been directed toward identifying causal mechanisms for those outcomes. It is likely that com- petitive outcomes are related to both early-season growth
-
Upload
un-lincoln -
Category
Documents
-
view
0 -
download
0
Transcript of Influence of nitrogen and duration of weed interference on corn growth and development
546 • Weed Science 51, July–August 2003
Weed Science, 51:546–556. 2003
Influence of nitrogen and duration of weed interference oncorn growth and development
Sean P. EvansUniversity of Nebraska, Lincoln, NE 68583.Current address: University of Illinois, MacombExtension Center, Macomb, IL 61455
Stevan Z. KnezevicCorresponding author. Haskell AgriculturalLaboratory, University of Nebraska, 57905 866Road, Concord, NE 68728-2828;[email protected]
John L. LindquistDepartment of Agronomy and Horticulture,University of Nebraska, Lincoln, NE 68583-0817
Charles A. ShapiroHaskell Agricultural Laboratory, University ofNebraska, 57905 866 Road, Concord, NE 68728-2828
An improved understanding of the effects of nitrogen (N) on crop–weed interactionsis needed for the development of integrated weed management systems where re-sponsible use of N fertilizers is considered. Field experiments conducted in 1999and 2000 at two locations in eastern Nebraska quantify the effects of N and in-creasing duration of weed interference on corn growth and development. A naturallyoccurring population of weeds was allowed to compete with the corn crop for in-creasing lengths of time and at three rates of N application (0, 60, and 120 kg Nha21). Weed interference and withholding applied N increased the time to 50%silking by an average of 3.9 and 2.9 d, respectively. Regardless of treatments, relativegrowth rates of corn leaf area and biomass were maximized between the V1 and V2growth stages of corn and increased linearly with N rate but were affected to a lesserextent by weed presence. The improvement in early season corn growth with addi-tion of N resulted in greater leaf area, biomass, and height, which improved thecompetitive ability of corn against weeds. Reductions in maximum corn leaf areaand height due to weed interference usually began earlier and were more extensiveat reduced rates of N. Partitioning of biomass to reproductive structures increasedwith N during reproductive stages, likely contributing to greater harvest indices atthe end of the season. Results from this study indicate that the effects of N fertil-ization on early-season crop growth provided a competitive advantage for corn rel-ative to weeds, thereby increasing the length of time that weeds could compete witha crop before removal was required, but further research is needed to identify mech-anisms regarding improved crop tolerance to weeds.
Nomenclature: Corn, Zea mays L. ‘DK589RR’.
Key words: Critical time of weed removal, duration of weed interference, growthanalysis, growth curves, light competition, N competition, resource acquisition.
The competitive relationship between plant species ishighly dependent on many factors including the supply andavailability of nutrients. Therefore, the manipulation of soilfertility is a potential tool for integrated weed management(Di Tomaso 1995). Of all nutrients, plant response to ni-trogen (N) fertilizer is the most widely observed, and it issuggested that the manipulation of soil N supply offers themost promise in the short term as a means by which crop–weed competitive outcomes can be influenced (Walker andBuchanan 1982).
Competition for light has been identified as the primarycause of crop yield loss in many crop–weed associations(King and Purcell 1997; Kropff et al. 1987; Lindquist andMortensen 1999; Munger et al. 1987). However, above-ground plant performance is often mediated by below-ground nutrient acquisition, and vice versa (Casper andJackson 1997). Therefore, the availability of nutrients suchas N can influence the timeliness and extent of early seasoncompetition from weeds (Weaver et al. 1992).
Contrasting outcomes regarding the effects of N supplyand corn–weed competition have been presented in the lit-erature. In a greenhouse study, Teyker et al. (1991) reportedgreater N uptake for redroot pigweed (Amaranthus retroflexusL.) than corn when the addition of N was elevated, sug-gesting that redroot pigweed interference in corn may begreater at higher levels of N. Others also have postulatedthat weeds may be more competitive when fertility is en-
hanced with N addition because of the superior uptake ef-ficiency of many weed species (Di Tomaso 1995; Sibuga andBandeen 1980). However, evidence also suggests a positiveeffect of N fertilization on corn competitive ability underfield conditions. For example, Nieto and Staniforth (1961)reported that the reduction in corn yield because of inter-ference from foxtails (Setaria spp.) was relatively greater atlow vs. high N levels. Tollenaar et al. (1994) reported thatinterference from mixed weeds emerging shortly after cornreduced corn biomass, harvest index, and final grain yieldto a greater extent at low vs. high levels of soil N. Morerecently, Evans et al. (2002) showed that reduced rates ofN resulted in an earlier beginning of the critical period forweed control (CPWC) in corn.
To identify the mechanisms underlying crop–weed com-petition for N, it is important to quantify the interactiveeffects of weed interference and N on crop growth param-eters and determine how changes in those attributes affectyield. The outcomes of weed interference that are most oftenassociated with crop yield reductions include (1) reducedamount and duration of green leaf area (Hall et al. 1992;Knezevic et al. 1994; Van Acker et al. 1993) and (2) reducedcrop height or increased height differential between the cropand weeds (Fellows and Roeth 1992; Teasdale 1998). How-ever, little attention has been directed toward identifyingcausal mechanisms for those outcomes. It is likely that com-petitive outcomes are related to both early-season growth
Evans et al.: Influence of nitrogen and weeds on corn • 547
efficiency (Davis and Liebman 2001) and leaf area devel-opment (Potter and Jones 1977). In addition, Rajcan andSwanton (2001) suggest that detection of neighboring weedsby the crop early in the season can induce lasting physio-logical changes before the onset of competition. The objec-tive of this study was to quantify the effects of duration ofweed interference on corn growth and development param-eters under varying rates of N application.
Materials and Methods
Site Description
This experiment was part of a larger study designed toidentify the CPWC with varying rates of N application(Evans et al. 2002). Field experiments were conducted in1999 and 2000 at two locations in eastern Nebraska, theUniversity of Nebraska Agricultural Research and Develop-ment Center (ARDC) near Mead, and the Haskell Agricul-tural Laboratory (HAL) near Concord. Experimental siteswere located in different fields for the second year of thestudy. Soil types were a Sharpsburg silty clay loam, 0 to 2%slope, (fine, montmorillonitic, mesic Typic Argiudolls), witha mean pH of 6.6 and mean soil organic matter content of2.8% with inclusions of a Butler silty clay loam, 0 to 2%slope (fine, montmorillonitic, mesic Abruptic Argiaquaolls)for both years at ARDC; and a Kennebec silty clay loam, 0to 2% slope, (fine-silty, mixed, mesic Cumulic Hapludolls)mean pH of 6.5 and mean soil organic matter content of3.9% for both years at HAL.
Naturally occurring weed populations were used in eachexperiment and sites were selected on the basis of the his-torical presence of weeds typical of corn production in east-ern Nebraska. Weed species in order of dominance (dryweight basis) were velvetleaf (Abutilon theophrasti Medicus),common waterhemp (Amaranthus rudis Sauer), and greenfoxtail [Setaria viridis (L.) Beauv.] at HAL in 1999; Penn-sylvania smartweed (Polygonum pensylvanicum L.), velvetleaf,and common waterhemp at ARDC in 1999; velvetleaf,green foxtail, and common waterhemp at HAL in 2000;and velvetleaf, common waterhemp, and yellow foxtail [Se-taria pumila (Poir.) Roem & Schult.] at ARDC in 2000.Total weed densities measured at corn silking averaged 168,364, 150, and 80 plants m22 for the 1999 HAL, 1999ARDC, 2000 HAL, and 2000 ARDC sites, respectively.Observable weed emergence was noted 2 d after crop emer-gence at HAL in 1999, 4 d before crop emergence at theARDC in 1999, 4 d after crop emergence at HAL in 2000,and 5 d after crop emergence at the ARDC in 2000.
Experimental Design and Field Procedures
The experiments were established using a factorial ar-rangement of treatments in a split-plot randomized com-plete block design replicated four times. The main-plot fac-tor consisted of three N application rates. Seven durationsof weed interference comprised levels of the split-plot factor.Split-plots consisted of six corn rows, 12.2 m in length witha 0.76-m row spacing. Primary tillage consisted of fall chiselplowing at the ARDC and spring disking at HAL. Fertilizerapplications reflected the University of Nebraska recommen-dations for corn on the basis of soil samples collected fromeach site a few weeks before crop planting (Hergert et al.
1995). The three N application rates selected were 0, 60,and 120 kg N ha21. The 120 kg N ha21 rate representedapplied N that would meet or slightly exceed the recom-mended rate on the basis of a grain yield goal of 8 Mg ha21
with adjustments for residual nitrate-N and organic mattercontent (Hergert et al. 1995). Triple superphosphate fertil-izer was broadcast at a rate equivalent to 45 kg P2O5 ha21
in each year at the ARDC site 2 wk before planting. Ureawas uniformly broadcast within 10 d before planting usinga ground-driven fertilizer spreader1. Immediately after ap-plication, one or more secondary tillage operations were per-formed to incorporate fertilizer and prepare the seedbed forplanting. A glyphosate-resistant corn hybrid ‘DekalbDK589RR’2 was planted on May 25 and May 13 in 1999and on May 11 and May 2 in 2000 at the HAL and ARDCsites, respectively. Final plant populations were similar be-tween locations within a given year, averaging 60,000 plantsha21 in 1999 and 52,000 plants ha21 in 2000.
Increasing durations of weed interference were establishedby delaying weed removal time (RT) to V3, V6, V9, V15,and R1. In addition, season-long weed-free and season-longweedy controls were included to give a total of seven du-rations of crop–weed interference. Each RT was based onaverage crop growth stage according to Ritchie et al. (1997)and was assessed every 5 d in the season-long weedy con-trols.
For RT treatments before the V15 crop developmentalstage, weed control was achieved by commercially formu-lated glyphosate2 applied once postemergence at a rate of1.1 kg ai ha21 plus 3.2 kg ha21 ammonium sulfate. Weedsnot severely injured within 6 d after treatment were removedby hand. For RTs at V15 and R1, weed control was achievedby hand weeding. Regardless of the initial method of weedcontrol, maintenance of a weed-free condition was accom-plished with periodic hand weeding.
Crop MeasurementsDestructive corn plant harvests were made 2 d before each
RT and at crop maturity (Table 1). An additional harvestwas made at HAL in both years during the grain fill period.Successive harvest areas were separated from one another bya minimum of 1 m of undisturbed vegetation. Harvests wereexcluded from a 2-m portion of both the front and rear ofeach split-plot experimental unit to minimize neighborhoodeffects. In 1999, all corn plants within a 1-m section ofeither the second or fourth row of each split-plot were cutat the soil surface and removed, providing a sample size ofapproximately five plants. Because of lower populations in2000, five plants were harvested from each split-plot exper-imental unit regardless of the length of row. Growth stagesand heights of individual corn plants were recorded at thetime of each harvest. Before tassel emergence, height wasmeasured to the tip of the newest leaf emerging from thewhorl. After tassel emergence, height was measured to thetop of the tassel. Individual plants were clipped at the soilsurface, and divided into leaf, stem, and reproductive com-ponents (when present). Reproductive components consist-ed of the entire ear shoot (i.e., husks, shank, cob, kernels,and silks) and the tassel. Leaves were separated from thestem by cutting the lamina at the ligule. Newly emergedleaves were cut just above the youngest visible collar. Leafarea of leaves was measured with an area meter3 during all

548 • Weed Science 51, July–August 2003
TABLE 1. Dates of destructive corn harvests by average corn growth stage at the University of Nebraska Haskell Agricultural Laboratory(HAL) near Concord, NE, and the Agricultural Research and Development Center (ARDC) near Mead, NE, in 1999 and 2000. Growingdegree days (GDD) accumulated from the time of crop emergence to the time of each harvest are given in parentheses.
Corn growthstage at harvesta
Harvest date
HAL
1999 2000
ARDC
1999b 2000
V3V6V9V15R1R4 or R5R61
June 13 (144)June 25 (255)July 08 (400)July 22 (575)August 11 (830)September 07 (1,140)October 07 (1,320)
June 05 (113)June 20 (271)June 29 (360)July 13 (570)July 27 (730)August 18 (1,000)September 15 (1,310)
June 07 (150)June 16 (250)June 29 (390)July 15 (595)July 28 (800)—October 05 (1,475)
May 22 (117)June 06 (239)June 14 (350)July 06 (600)July 18 (775)—September 06 (1,430)
a Average growth stage as determined from the weed-free controls.b Dashed lines indicate data not collected.
harvests except those conducted after corn silking. Senescingand dead leaves comprised , 10% ‘‘green’’ surface area wereexcluded from leaf area measurements. The newest leaves ofcorn were left furled as they were passed through the leafarea meter. All components were bagged separately (deadand green leaves combined together) and dried at 70 C toa constant moisture content. The average height of the weedcanopy also was measured.
At crop maturity, two samples were taken from each split-plot. The first subsample consisted of individual corn plantstaken using the same methodology of previous harvests. Earsfrom this subsample were dried at 70 C to a constant mois-ture content and shelled by hand. The second subsampleconsisted of hand-harvested corn ears taken from a 4-mlength of two adjacent rows within each split-plot to deter-mine grain yield. Grain was shelled mechanically and driedat 70 C to a constant moisture content.
Growth Curves and Statistical Analyses
Functional plant growth curves (Hunt 1982) were devel-oped using regression models fit to corn biomass and leafarea data collected at each sampling date similar to the ap-proach of Davis and Liebman (2001). All growth curveswere constructed using thermal time as the independent var-iable. Thermal time correlates more closely with tempera-ture-dependent biological processes than with calendar days(Russelle et al. 1984) and was calculated in terms of airgrowing degree days (GDD) as suggested by Gilmore andRogers (1958) using a base temperature of 10 C and a tem-perature optimum of 30 C. Regression analysis and subse-quent maximization of all growth curves was achieved usingPROC NLIN in SAS4.
Biomass growth curves were fit to at least seven datapoints, each being the mean of 16 to 22 plants (e.g., fourto five plants per replicate times four replicates). Similarly,leaf area growth curves consisted of six data points. Valuesof plant biomass and leaf area were loge-transformed tomaintain homogeneity of variances between sampling dates.In constructing plant growth curves, apparent leaf area andaboveground biomass at emergence were assumed to beequal among treatments and reflected average values report-ed by Lindquist and Mortensen (1999).
Asymptotic crop biomass accumulation was expressedwith the Gompertz equation (Hunt 1982) (Equation 1):
ln(W ) 5 ln(W ) exp(2 q exp[2 kT ])max [1]
where ln(W ) is loge-transformed biomass (i.e., sum of leaf,stem, and reproductive tissues) per plant in units of mgplant21 (all plant weights converted to milligrams so as toensure positive values after the loge-transformation),ln(W )max is maximum loge-transformed shoot biomass perplant in mg plant21, T is the time from crop emergence inGDD in units of C. The coefficients q and k are constants.
Green leaf area (A) of corn increases in a sigmoidal fash-ion over time, reaching a maximum near tasseling beforedeclining (Bennett et al. 1989). The relationship is well ap-proximated with a third-order polynomial (Equation 2):
2 3ln(A) 5 a 1 bT 1 cT 1 dT [2]
where ln(A) is loge-transformed leaf area per plant in unitsof cm2 and T is the time from crop emergence in GDD.The coefficients a, b, c, and d are constants.
Relative growth rates of biomass (RGRW) and leaf area(RGRA) are measures of the efficiency of production. Effi-ciency in biomass production in itself is not a good indicatorof relative competitive ability (Roush and Radosevich 1985)but can be used early in the season when plants are of rel-atively equal size to predict differences in absolute growth.Relative growth rate curves for biomass and leaf area aregiven by the first derivatives of Equations 1 and 2 withrespect to T, respectively, to obtain Equations 3 and 4:
RGRW 5 abk exp(2kT 2 b exp[2kT ]) [3]2RGRA 5 b 1 2cT 1 3dT [4]
Maximal leaf area (Amax) and relative growth rates(RGRWmax and RGRAmax) as well as the time at whichthose values were attained (Tmax) were calculated for eachsplit-plot with the maximization of Equations 1, 3, and 4,respectively. Relative maximal leaf area (RAmax) was calcu-lated by expressing Amax of each experimental unit as a per-cent of the Amax calculated for the corresponding weed-freecontrol within the same N main plot.
Crop height throughout the growing season was describedfor each split-plot experimental unit with a three-parameterlogistic equation (Christensen 1995) (Equation 5):
H 5 H /(1 1 exp[q 2 zT])max [5]
where H is crop height, Hmax is the maximum attainableheight and q and z are constants. Because the logistic function

Evans et al.: Influence of nitrogen and weeds on corn • 549
FIGURE 1. Corn maximal relative growth rate of (a) biomass (RGRWmax)and (b) leaf area (RGRAmax) as a function of N rate. Data points for eachlocation are the N main-effect means averaged across all weed removaltimings. The equations for the fitted regression equations are RGRWmax 518.85 1 0.0206N, n 5 28, r2 5 0.65; and RGRAmax 5 188.46 10.2563N, n 5 28, r2 5 0.78.
is symmetric about its point of inflection, the ratio q/z definesthe point in time at which one half of the maximum heightis attained (Ratkowsky 1990), serving as an indicator of therate of height growth.
Other growth parameters, i.e., harvest index (HI) (Equa-tion 6), partitioning coefficients of aboveground biomass(PCo) (Equation 7), and specific leaf area (SLA) (Equation8), were calculated as suggested by Hunt (1990), respec-tively:
HI 5 W /W [6]grain
PC 5 DW /DW [7]o component
SLA 5 A/W [8]leaf
where W is the total dry weight of the shoot (i.e., S leaf,stem, reproductive), Wgrain is the weight of grain produced,PCo is the partitioning coefficient of the specific plant com-ponent, D indicates the change in a plant biomass betweentwo successive sampling dates, A is leaf area per plant, andWleaf is the weight of those leaves. In this study, the parti-tioning coefficients were determined for leaf (PCleaf), stem(PCstem), and reproductive (PCrep) components but not forroots.
The effect of years, locations, N rates (N), RTs, and theirinteractions on the growth parameters listed above were test-ed for significance by analysis of variance (ANOVA) usingPROC MIXED in SAS (Littell et al. 1996). If interactionsinvolving sites or years and either of the treatment factorswere significant (P , 0.05), data were further analyzed bysite–year. If the N by RT interaction was not significant,further analysis was conducted using main effect treatmentleast-squares means.
When possible, linear or nonlinear least-squares regressionmodels were used to quantify the effects of treatments onvariables computed from raw data. Otherwise, least-squarestreatment means were compared using paired t tests (0.05level) at each plant sampling time. The growth parametersWmax, Amax, RGRWmax, RGRAmax, and Tmax, were expressedas linear functions (Y 5 a 1 bX ) of N rate using the AXUMt5.0 data analysis package5. Slopes were compared with zerousing a t test (0.05 level). Nonlinear regression was used torelate corn RAmax, HI, and Hmax to duration of weed inter-ference. Best-fit nonlinear models were determined by com-parison of the residual mean square error (RMSE) betweensimilar nonlinear models. The model with the lowest RMSEwas chosen because it provided the best fit to the experimen-tal data. A four-parameter logistic equation (Ratkowsky1990) was used to quantify the decline in RAmax, HI, andHmax with increasing duration of weed interference usingPROC NLMIXED in SAS (Equation 9):
Y 5 c 1 (m 2 c)/(1 1 exp[2 a 1 bD]) [9]where Y is either RAmax, HI, or Hmax, D is the duration ofweed interference after crop emergence in GDD, c is thelower asymptote, m is the upper asymptote; and a and b areconstants. The significance of N effects was evaluated bycomparing model coefficients among N rates using a pair-wise t test (0.05 level) (Knezevic et al. 2002).
Results and DiscussionPhenological Development
Time to 50% silking and maturity of corn were delayedby both season-long weed interference and withholding N
(data not shown). At the 0 kg N ha21 rate, lengths of timeto silking and maturity were delayed an average of 2.9 and1.8 d when compared with the average of the 60 kg N ha21
and 120 kg N ha21 rates, respectively. Season-long weedinterference had a greater effect by delaying both silking andmaturity by an average of 3.9 and 4.3 d, respectively, re-gardless of N rate when compared with the respective weed-free control. Delay in crop development is primarily attri-buted to reduced rates of leaf appearance (data not shown).
Relative Growth RatesFor all site–years the N by RT interactions for both
RGRWmax and RGRAmax of corn were not significant (P .0.05); therefore, only main effect means were used in thesubsequent regression analysis. Both RGRWmax and RGRA-max increased linearly with N addition even though valuesdiffered somewhat between site years (Figure 1). For ex-ample, values of RGRWmax ranged from 17.1 6 0.41 to19.5 6 0.41 mg g21 GDD21 for the 0 kg N ha21 rate, and20.8 6 0.41 to 21.4 6 0.47 mg g21 GDD21 for the 120kg N ha21 rate (Figure 1a). Values of RGRAmax ranged from

550 • Weed Science 51, July–August 2003
TABLE 2. Equations for corn maximal per plant biomass (Wmax) and leaf area (Amax) as a function of N application rate for three durationsof weed competition: season-long weed-free (wf ), season-long weedy (wdy), and weedy to V9 (V9) at the University of Nebraska HaskellAgricultural Laboratory (HAL) near Concord, NE, and the Agricultural Research and Development Center (ARDC) near Mead, NE, in1999 and 2000. P values are the probabilities that the slopes are significantly greater than zero.
Parameter Site Year Competition level Equation P value r2
Wmax HAL
ARDC
HAL
ARDC
1999
1999
2000
2000
wfV9wdywfV9wdywfV9wdywfV9wdy
Wmax 5 193 1 0.4500NWmax 5 155 1 0.4917NWmax 5 100 1 0.2583NWmax 5 285 1 0.5417NWmax 5 158 1 0.8667NWmax 5 112 1 0.2583NWmax 5 289 1 0.2917NWmax 5 256 1 0.0333NWmax 5 164 1 0.2570NWmax 5 235 1 0.6167NWmax 5 178 1 0.2643NWmax 5 143 1 0.4667N
0.01360.01700.12860.18510.05640.21650.41980.45470.24360.02980.26430.1041
0.990.970.960.920.990.890.620.570.860.990.840.97
Amax HAL
ARDC
HAL
ARDC
1999
1999
2000
2000
wfV9wdywfV9wdywfV9wdywfV9wdy
Amax 5 0.5588 1 0.00138NAmax 5 0.4240 1 0.00173NAmax 5 0.3727 1 0.00114NAmax 5 0.6294 1 0.00073NAmax 5 0.3901 1 0.00119NAmax 5 0.2736 1 0.00114NAmax 5 0.6294 1 0.00044NAmax 5 0.4760 1 0.00085NAmax 5 0.3893 1 0.00092NAmax 5 0.5599 1 0.00117NAmax 5 0.4190 1 0.00127NAmax 5 0.3492 1 0.00128N
0.04620.01200.02810.21270.01140.01360.22890.05840.02640.04560.04550.0266
0.990.990.990.890.990.970.880.990.970.990.940.96
181 6 3 to 192 6 2 cm2 m22 GDD21 for the 0 kg N ha21
rate, and 195 6 2 to 223 6 2 cm2 m22 GDD21 for the120 kg N ha21 rate (Figure 1b). For all site–years, Tmax, orthe time of RGRWmax and RGRAmax, did not vary witheither N or RT (P . 0.05) and occurred at approximately35 and 40 GDD after emergence, respectively, or the V1 toV2 corn growth stages (data not shown). The presence ofweeds was associated with reduced values of RGRWmax andRGRAmax, indicating that the physiology of corn changedin response to the presence of weeds even though compe-tition for resources was likely not occurring. Rajcan andSwanton (2001) proposed that physiological changes causedby changes in light quality might be induced by neighboringweeds, regardless of whether or not those weeds are com-peting with the crop for resources. However, a posteriorianalysis of each site–year revealed that the trend was non-significant (P . 0.05) for three out of four of the site–years(data not shown), indicating that N addition had a moreimmediate effect on early season crop growth than did thepresence of weeds.
Maximum Biomass and Leaf Area
An overall ANOVA indicated significant site by N(year)(P , 0.0001) and site by RT(year) (P , 0.001) treatmentinteractions for both Wmax and Amax. Therefore, data werefurther analyzed by site–year. Despite a positive correlationof Wmax and Amax with N, slopes did not always differ fromzero (Table 2), indicating only a slight response to N. How-ever, within N rates, a longer duration of weed interferencewas associated with lower values of both Wmax and Amax forcorn. For example, at the 0 kg N ha21 rate for the HAL1999 site, estimated values of maximal per plant biomass
were 193, 155, and 100 g plant21 for the season-long weed-free, weedy to V9, and season-long weedy treatments, re-spectively. Estimated maximal per plant leaf area at the samesite were 0.5588, 0.4240, and 0.3727 m2 plant21 for theseason-long weed-free, weedy to V9 and season-long weedytreatments, respectively. Estimates of Wmax and Amax for oth-er N rates and site–years can be obtained from the solutionof the linear regression equations.
Because of the infrequency of harvests during the grain-fill period, adequate evaluation of physical losses was notpossible. Therefore, values of Tmax were not estimated forbiomass, but generally coincided with physiological maturityfor all site–years and treatments (data not shown). Nitrogenrate had little influence on Tmax for leaf area in 1999 atHAL (P 5 0.34) and ARDC (P 5 0.70) and occurred at688 6 4 and 674 6 15 GDD, respectively, when averagedacross RTs. Whereas Tmax declined from 712 6 9 to 6406 9 GDD between the 0 to 120 kg N ha21 rates, respec-tively, at the 2000 HAL site (P , 0.0001), Tmax increasedwith N rate from 650 6 5 to 688 6 5 GDD, respectively,at the 2000 ARDC site (P 5 0.0038). Explanation for thedisparity of N effect on Tmax of leaf area in this study is notclear but is most likely due to environmental differencesbetween sites. Alternatively, season-long weed interferencereduced Tmax by an average of 20 GDD, which is equivalentto 1.3 d when the mean daily temperature is 25 C. A slightdecrease in Tmax of leaf area in the weedy condition is prob-ably due to an earlier onset of corn leaf senescence due toweed competition.
Eik and Hanway (1966) reported a high positive linearcorrelation between leaf area of corn at silking and finalgrain yield. The relationship between relative grain yield and
Evans et al.: Influence of nitrogen and weeds on corn • 551
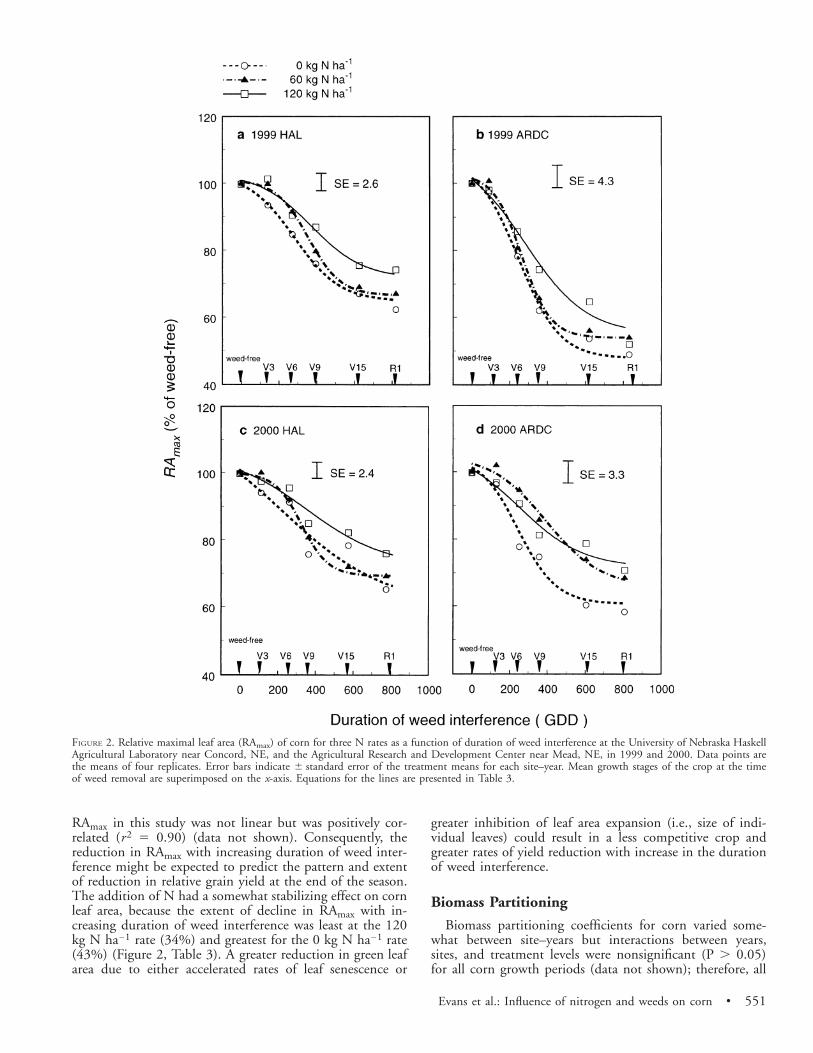
FIGURE 2. Relative maximal leaf area (RAmax) of corn for three N rates as a function of duration of weed interference at the University of Nebraska HaskellAgricultural Laboratory near Concord, NE, and the Agricultural Research and Development Center near Mead, NE, in 1999 and 2000. Data points arethe means of four replicates. Error bars indicate 6 standard error of the treatment means for each site–year. Mean growth stages of the crop at the timeof weed removal are superimposed on the x-axis. Equations for the lines are presented in Table 3.
RAmax in this study was not linear but was positively cor-related (r2 5 0.90) (data not shown). Consequently, thereduction in RAmax with increasing duration of weed inter-ference might be expected to predict the pattern and extentof reduction in relative grain yield at the end of the season.The addition of N had a somewhat stabilizing effect on cornleaf area, because the extent of decline in RAmax with in-creasing duration of weed interference was least at the 120kg N ha21 rate (34%) and greatest for the 0 kg N ha21 rate(43%) (Figure 2, Table 3). A greater reduction in green leafarea due to either accelerated rates of leaf senescence or
greater inhibition of leaf area expansion (i.e., size of indi-vidual leaves) could result in a less competitive crop andgreater rates of yield reduction with increase in the durationof weed interference.
Biomass Partitioning
Biomass partitioning coefficients for corn varied some-what between site–years but interactions between years,sites, and treatment levels were nonsignificant (P . 0.05)for all corn growth periods (data not shown); therefore, all

552 • Weed Science 51, July–August 2003
TABLE 3. Equations for relative maximal leaf area (RAmax) as a function of the duration of weed interference (D) by N application rateat the University of Nebraska Haskell Agricultural Laboratory (HAL) near Concord, NE, and the Agricultural Research and DevelopmentCenter (ARDC) near Mead, NE, in 1999 and 2000.
Site Year N-rate Equation RMSEa
kg N ha21
HAL
ARDC
HAL
ARDC
1999
1999
2000
2000
060
1200
60120
060
1200
60120
RAmax 5 65 1 (103 2 65)/(1 1 exp(22.3034 1 0.00822D))RAmax 5 62 1 (101 2 62)/(1 1 exp(24.1233 1 0.01162D))RAmax 5 65 1 (103 2 65)/(1 1 exp(22.6464 1 0.00715D))RAmax 5 48 1 (107 2 48)/(1 1 exp(22.2977 1 0.00926D))RAmax 5 54 1 (103 2 54)/(1 1 exp(23.4705 1 0.01316D))RAmax 5 55 1 (109 2 55)/(1 1 exp(21.7606 1 0.00620D))RAmax 5 60 1 (117 2 60)/(1 1 exp(20.8202 1 0.00365D))RAmax 5 69 1 (102 2 69)/(1 1 exp(24.5543 1 0.01397D))RAmax 5 72 1 (106 2 72)/(1 1 exp(21.6841 1 0.00475D))RAmax 5 61 1 (104 2 61)/(1 1 exp(22.4067 1 0.00980D))RAmax 5 66 1 (105 2 66)/(1 1 exp(22.6830 1 0.00681D))RAmax 5 72 1 (107 2 72)/(1 1 exp(21.5205 1 0.00595D))
18.1318.1318.1349.5149.5149.5117.7817.7817.7839.4239.4239.42
a Abbreviation: RMSE, residual mean square error.
TABLE 4. Biomass partition coefficients (PCo) of weedy and weed-free corn (6 SE) for three rates of N application during three periodsof corn growth. Values are means of data collected at the University of Nebraska Haskell Agricultural Laboratory (HAL) near Concord,NE, and the Agricultural Research and Development Center (ARDC) near Mead, NE, in 1999 and 2000.
N rate
Corn biomass partition coefficients (PCo)a
V6 to V9
PCleafb PCstem
b PCrep
V9 to V15
PCleaf PCstem PCrep
V15 to R1
PCleaf PCstem PCrep
kg N ha21
Season-long weedy corn0
60120
0.65 a0.62 bc0.61 c
0.35 c0.39 a0.38 ab
0.00 a0.00 a0.00 a
0.40 a0.33 b0.33 b
0.51 c0.67 b0.67 b
0.01 a0.02 a0.01 a
0.15 a0.12 ab0.14 a
0.59 a0.50 b0.49 b
0.26 d0.38 bc0.37 c
Season-long weed-free corn0
60120
0.65 a0.63 b0.63 b
0.35 c0.37 b0.37 b
0.00 a0.00 a0.00 a
0.33 b0.30 c0.31 bc
0.67 b0.68 ab0.69 a
0.02 a0.02 a0.04 b
0.11 bc0.09 c0.09 c
0.47 b0.40 c0.39 c
0.42 b0.51 a0.52 a
SE 0.01 0.01 0.00 a 0.01 0.01 0.01 0.01 0.04 0.05
a Means within a column followed by different letters are significantly different from one another based on a t test at the 0.05 level.b PCleaf and PCrep are the partitioning coefficients for leaf and reproductive parts, respectively.
experimental data were pooled. Biomass partitioning of cornwas influenced by N rate and duration of weed interferenceand varied with the period of crop growth (Table 4). Earlyin the season (V6 to V9), more biomass was partitioned toleaves when no N was applied as indicated by slightly greatervalues for PCleaf. In competition with weeds, corn parti-tioned 65, 62, and 61% of new biomass to leaves (PCleaf 50.65, 0.62, and 0.61) at the 0, 60, and 120 kg N ha21 rates,respectively. In the weed-free condition, corn partitioned 65,63, and 63% of new biomass to leaves at the 0, 60, and120 kg N ha21 rates, respectively. However, the increase inleaf partitioning was accompanied by a decline in SLA (datanot shown), indicating thinner, less compact leaves at the 0kg N ha21 rate than for either the 60 or 120 kg N ha21
rates. The presence of weeds affected biomass partitioningto a lesser extent at this time than later times, even thougha wider range of values for PCleaf were observed under weedyconditions (0.61 to 0.65) than under weed-free conditions(0.63 to 0.65).
During both the V9 to V15 and V15 to R1 periods ofgrowth, partitioning of biomass to reproductive organs was
substantially greater for both the 60 and 120 kg N ha21
rates when compared with the 0 kg N ha21 rate regardlessof whether or not weeds were present (Table 4). Both weedinterference and withholding N resulted in greater values ofPCstem and leaves during the V15 to R1 growth period asindicated by lower values for PCrep at the 0 kg N ha21 rate.In competition with weeds, corn partitioned 26, 38, and37% of new biomass to reproductive structures (PCrep 50.26, 0.38, and 0.37) at the 0, 60, and 120 kg N ha21 rates,respectively. In a weed-free condition, corn partitioned 42,51, and 52% of new biomass to reproductive structures, forthe 0, 60, and 120 kg N ha21 rates, respectively.
The differences in biomass partitioning quantified in thisstudy are partially explained by the effect of treatments onthe rate of crop development as discussed above. However,normalizing biomass partition coefficients to account fordifferences in developmental rate accounted for less thanhalf of the variability particularly during the V15 to R1growth period (data not shown). Moreover, quantifying bio-mass partitioning can be complicated by potential dry mat-ter losses caused by premature leaf senescence (Wolfe et al.

Evans et al.: Influence of nitrogen and weeds on corn • 553
FIGURE 3. Mean harvest index (HI) as a function of the mean duration of weed interference for corn without N (0 kg N ha21) and with N (60 and 120kg N ha21) fertilizer. Data are averages from experiments at the University of Nebraska Haskell Agricultural Laboratory near Concord, NE, and theAgricultural Research and Development Center near Mead, NE, in 1999 and 2000. Error bars indicate 6 standard error of the treatment means and meangrowth stages at the time of weed removal are superimposed on the x-axis. The equations of the fitted regression lines are: HI 5 0.38 1 0.10/(1 1 exp[23.54 1 0.0066D]), n 5 12, r2 5 0.73 without N fertilizer; and HI 5 0.46 1 0.04/(1 1 exp[2 4.76 1 0.0051D]), n 5 24, r2 5 0.89 with N fertilizer.
1988), stem breakage, or remobilization of stored assimilates(Genter et al. 1970). The magnitude of those effects maydepend on environmental factors, especially water availabil-ity. Interactions involving such factors were not investigatedin this study and should be considered in future experi-ments.
Assuming an equal length of the grain-fill period, reducedpartitioning to reproductive organs should result in a de-tectable reduction in the HI at crop maturity. Averagedacross site–years, HI was enhanced by N addition (averageof 60 and 120 kg N ha21 rates) regardless of the durationof weed interference (Figure 3). Differences in HI were moresubstantial with increasing duration of weed interferencewith a maximum reduction in HI of 7.0% (of the weed-free control) when N was applied compared with 12.6%when no N was applied. These results indicate that HI wasmore sensitive to increasing duration of weed interferencewhen N fertilizer was not applied, corroborating the find-ings reported by Tollenaar et al. (1994).
Height Growth
Maximum height (Hmax) of corn was influenced by Nrate and duration of weed interference similarly for all site–years as indicated by nonsignificant interactions involvingsites and years (P . 0.05) (data not shown). Therefore, datawere pooled, and in all cases, differences in Hmax betweenthe 60 and 120 kg N ha21 rates were minor. However, cornplants were the shortest and were affected to a greater extentby weed interference when no N was applied (Figure 4).Reductions in height due to season-long weed interferencewere 14 6 4, 10 6 4, and 8 6 4% of the season-long weed-free controls for the 0, 60, and 120 kg N ha21 rates, re-spectively.
The application of N not only promoted greater growthin height but also hastened the rate at which Hmax wasattained as indicated by the quotient q/z (refer to Equation5). Depending on the site–year, the time required for thecrop to reach one half of its maximum height ranged from485 6 6 to 549 6 5 GDD for the 0 kg N ha21 rate, and448 6 6 and 493 6 5 GDD for the 120 kg N ha21 rate(Table 5). A greater value of Hmax indicates more rapid rateof height growth and combined with greater Hmax predis-poses a plant to be a better potential competitor with weeds.
In addition, the average height of the weed canopy ap-proached but never exceeded that of the crop in any of theexperiments (data not shown). The height differential be-tween the crop and weeds in the season-long weedy plotswas always positive and rarely differed between N rates, in-dicating that both weeds and corn responded to N similarly.Therefore, the differential in crop–weed height was likelynot a large factor in determining the increase in corn tol-erance to weeds when N was applied. However, differentresults may have been observed if the weed canopy was tallerthan the crop.
Final Grain Yields
Grain yields were variable across site–years and were likelyaffected by differences in amounts and periodicity of pre-cipitation received during anthesis and the grain-fill period(Table 6). Total rainfall amounts during July and Augustwere 6.2, 13.5, 8.6, and 7.7 cm for the 1999 HAL, 1999ARDC, 2000 HAL, and 2000 ARDC site–years, respec-tively. Consequently, the greatest weed-free yields were ob-served at the 1999 ARDC site, whereas the lowest yieldswere measured at the 1999 HAL site. Weed density and

554 • Weed Science 51, July–August 2003
FIGURE 4. Corn maximal height (Hmax) as a function of the mean duration of weed interference for three N rates. Data are presented as means of sitesand years from experiments conducted at the University of Nebraska Haskell Agricultural Laboratory near Concord, NE, and the Agricultural Researchand Development Center near Mead, NE, in 1999 and 2000. Error bars indicate 6 standard error of the treatment means and mean growth stages ofcorn at the time of weed removal are superimposed on the x-axis. The equations of the fitted regression lines are: Hmax 5 214 1 35/(1 1 exp[2 5.06811 0.0155D]), n 5 12, r2 5 0.97 for the 0 kg N ha21 rate; Hmax 5 233 1 25/(1 1 exp[2 7.1184 1 0.0241D]), n 5 12, r2 5 0.98 for the 60 kg Nha21 rate; and Hmax 5 262 1 22/(1 1 exp[2 8.4172 1 0.0251D]), n 5 12, r2 5 0.95 for the 120 kg N ha21 rate.
TABLE 5. Estimated time in growing degree days (GDD) for cornto reach 50% maximum height (T1/2max)(6 SE) in 1999 and 2000at the University of Nebraska Haskell Agricultural Laboratory(HAL) near Concord, NE, and the Agricultural Research and De-velopment Center (ARDC) near Mead, NE.
N rate
Time to 50% maximum height (T1/2max)
HAL
1999 2000
ARDC
1999 2000
kg N ha21 GDD
060
120
549505493
492465468
485453448
501469470
SE 5 4 6 4
timeliness of emergence determined the extent of yield re-duction due to weed interference.
Despite the fact that grain yield did not always respondto N addition, the critical timing of weed removal (CTWR)or corn growth stage when weed removal resulted in nogreater than a 5% yield loss, occurred earliest for the 0 kgN ha21 rate (V2). Addition of 60 kg N ha21 delayed theCTWR to the V4 growth stage, and with 120 kg N ha21,weed removal did not have to occur until the V6 growthstage (Table 6). Therefore, the effect of N addition on corngrowth parameters ultimately conditioned a more competi-tive crop.
In this study, an attempt was made to improve the un-derstanding of the effects N supply has on corn–weed in-terference relationships by identifying a number of corngrowth parameters that are differentially affected by N level.Results suggest that addition of N improved early seasoncorn growth, which improved the competitive ability of corn
against weeds. Practical benefit is delayed timing of weedcontrol, which is important in farming operation.
Although this study tried to use growth analysis to iden-tify the potential causes for differential crop losses due toweed interference, the mechanisms of crop–weed competi-tion were not defined. We suggest that a gross investigationof aboveground physical and morphological changes linkedto yield loss is likely not sufficient to identify causal com-petitive mechanisms for differential response to N. The sup-ply of N likely affects other processes including the dynam-ics of biomass partitioning and the architecture and mor-phology of the root system (Durieux et al. 1994; Granatoand Raper 1989; Mackay and Barber 1986), which werenot investigated in this study. It is logical to hypothesizethat changes in root system architecture and morphologycan influence plant growth by improving the ability of acrop to acquire water and essential nutrients during periodsof intense crop–weed interference or periods when yield ishighly vulnerable. Enhanced resource acquisition could in-crease the size and longevity of green leaves, thereby increas-ing the size and longevity of the leaf area available for lightinterception (Wolfe et al. 1988).
Although early-season relative growth rates of corn dueto weed interference were little affected by the presence ofweeds, the findings of this study neither corroborate nornegate the theory proposed by Rajcan and Swanton (2001).However, further studies are required to verify such specu-lations and quantify the effects of N and weed interferenceat a physiological level. Information from such investigationswould likely lead to an improved understanding of complexmechanisms of crop–weed interaction.
Sources of Materials1 Barber Engineering Ltd., 1404 N Regal Street, Spokane, WA
99202-3697.

Evans et al.: Influence of nitrogen and weeds on corn • 555
TABLE 6. Grain yields for corn (dry weights) grown in weed-free (wf ) and weedy (wdy) conditions for three N application rates alongwith the average critical timing of weed removal (CTWRa) at the University of Nebraska Haskell Agricultural Laboratory (HAL) nearConcord, NE, and the Agricultural Research and Development Center (ARDC) near Mead, NE, in 1999 and 2000.
N rate
Corn grain yieldsb
HAL
1999
wf wdy
2000
wf wdy
ARDC
1999
wf wdy
2000
wf wdy CTWR
kg N ha21 Mg ha21
060
120
5.24 a5.59 a5.77 a
2.10 a2.34 a3.70 b
6.44 a6.93 a6.71 a
3.20 a3.85 ab4.36 b
8.72 a10.83 b10.85 b
2.36 a3.87 ab3.89 b
6.23 a7.47 b8.07 b
2.25 a4.00 b4.38 b
V2V4V6
SE 0.32 0.32 0.33 0.33 0.62 0.62 0.42 0.42
a The CTWR is defined as the growth stage of corn at which time weed removal is required to avoid a loss in yield of .5% of the weed-free control.b Means within a column followed by a different letter are significantly different from one another based on a t test at the 0.05 level.
2 Monsanto Inc., 800 North Lindbergh Boulevard, St. Louis,MO 63167.
3 LI-3100, LI-COR, Inc., 4421 Superior Street, Lincoln, NE68504.
4 SAS version 8.0, Statistical Analysis Systems Institute, SASCampus Drive, Cary, NC 27512.
5 AXUM version 5.0, Technical graphics and data analysis, MathSoft Engineering and Education, Inc., 101 Main Street Cambridge,MA 02142-1521.
AcknowledgmentsThe authors thank Mary Guerra, Will Corcoran, and Ray Bren-
tlinger for assisting with plot maintenance and treatment imple-mentation. Thanks to Lisa Lunz, Mike Mainz, Christie McCoy,Nathan Haahr, Darren Barker, Aaron Waltz, Mike Burton, andKari Hilgenfeld for assisting in the collection of the experimentaldata. Gratitude is extended to E. Blankenship for assistance in thestatistical analysis and to many anonymous reviewers for their valu-able comments. Published as University of Nebraska AgriculturalResearch Division Journal Series No. 13889.
Literature CitedBennett, J. M., L.S.M. Mutti, P.S.C. Rao, and J. W. Jones. 1989. Interactive
effects of N and water stresses on biomass accumulation, N uptake,and seed yield of maize. Field Crops Res. 19:297–311.
Casper, B. and R. B. Jackson. 1997. Plant competition underground. Ann.Rev. Ecol. Syst. 28:545–570.
Christensen, S. 1995. Weed suppression ability of spring barley varieties.Weed Res. 35:241–247.
Davis, A. S. and M. Liebman. 2001. Nitrogen source influences wild mus-tard growth and competitive effect on sweet corn. Weed Sci. 49:558–566.
Di Tomaso, J. 1995. Approaches for improving crop competitivenessthrough the manipulation of fertilization strategies. Weed Sci. 43:491–497.
Durieux R. P., E. J. Kamprath, W. A. Jackson, and R. H. Moll. 1994. Rootdistribution of corn: the effect of N fertilization. Agron. J. 86:958–962.
Eik, K. and J. J. Hanway. 1966. Leaf area in relation to the yield of graincorn. Agron. J. 58:16–20.
Evans, S. P., S. Z. Knezevic, J. L. Lindquist, C. A. Shapiro, and E. E.Blankenship. 2003. Nitrogen application influences the critical periodfor weed control in corn. Weed Sci. 51:408–417.
Fellows, G. M. and F. W. Roeth. 1992. Shattercane (Sorghum bicolor) in-terference in soybean (Glycine max). Weed Sci. 40:68–73.
Genter, C. F., G. D. Jones, and M. T. Carter. 1970. Dry matter accumu-lation and depletion in leaves, stems, and ears of maturing maize.Agron. J. 62:535–537.
Gilmore, E. C. and R. S. Rogers. 1958. Heat units as a method of mea-suring maturity in corn. Agron. J. 50:611–615.
Granato, T. C. and D. Raper. 1989. Proliferation of maize roots in responseto localized supply of nitrate. J. Exp. Bot. 40:263–275.
Hall, M. R., C. J. Swanton, and G. W. Anderson. 1992. The critical periodof weed control in grain corn (Zea mays). Weed Sci. 40:441–447.
Hergert, G. W., R. B. Ferguson, and C. A. Shapiro. 1995. Fertilizer sug-gestions for corn. Lincoln, NE: University of Nebraska CooperativeExtension Publication Number G74-174-A, 4 p.
Hunt, R. 1982. Plant Growth Curves: The Functional Approach to GrowthAnalysis. London: Edward Arnold. pp. 51–54, 128–135.
Hunt, R. 1990. Basic Growth Analysis: Plant Growth Analysis for Begin-ners. London: Unwin Hyman. pp. 35–72.
King, C. A. and L. C. Purcell. 1997. Interference between hemp sesbania(Sesbania exaltata) and soybean (Glycine max) in response to irrigationand N. Weed Sci. 45:91–97.
Knezevic, S. Z., S. P. Evans, E. E. Blankenship, R. C. Van Acker, and J.L. Lindquist. 2002. Critical period for weed control: the concept anddata analysis. Weed Sci. 50:773–786.
Knezevic, S. Z., S. F. Weise, and C. J. Swanton. 1994. Interference ofredroot pigweed (Amaranthus retroflexus) in corn (Zea mays). Weed Sci.42:568–573.
Kropff, M., W. Joenje, L. Bastiaans, B. Habekotte, H. van Oene, and R.Werner. 1987. Competition between a sugar beet crop and popula-tions of Chenopodium album L. and Stellaria media L. Neth. J. Agric.Sci. 35:525–528.
Lindquist, J. L. and D. A. Mortensen. 1999. Ecophysiological characteris-tics of four maize hybrids and Abutilon theophrasti. Weed Res. 39:271–285.
Littell, R. C., G. A. Milliken, W. W. Stroup, and R. D. Wolfinger. 1996.SASt System for Mixed Models. Cary, NC: Statistical Analysis SystemsInstitute. 633 p.
Mackay, A. D. and S. A. Barber. 1986. Effect of N on root growth of twocorn genotypes in the field. Agron. J. 78:699–703.
Munger, P. H., J. M. Chandler, J. T. Cothren, and F. M. Hons. 1987.Soybean (Glycine max)-velvetleaf (Abutilon theophrasti) interspecificcompetition. Weed Sci. 35:647–653.
Nieto, J. and D. W. Staniforth. 1961. Corn-foxtail competition under var-ious production conditions. Agron. J. 53:1–5.
Potter, J. R. and J. W. Jones. 1977. Leaf area partitioning as an importantfactor in growth. Plant Physiol. 59:10–14.
Rajcan, I. and C. J. Swanton. 2001. Understanding maize-weed competi-tion: resource competition, light quality, and the whole plant. FieldCrops Res. 71:139–150.
Ratkowsky, D. D. 1990. Handbook of nonlinear regression models. NewYork: Marcel Dekker. pp. 123–147.
Ritchie, W. S., J. J. Hanway, and G. O. Benson. 1997. How a corn plantdevelops. Special Report No. 48. (Revised). Ames, IA: Iowa State Uni-versity of Sciences and Technology, Cooperative Extension Service. 21 p.
Roush, M. L. and S. R. Radosevich. 1985. Relationships between growthand the competitiveness of weeds. J. Appl. Ecol. 22:895–905.
Russelle, M. P., W. W. Wilhelm, R. A. Olson, and J. F. Power. 1984.Growth analysis based on degree days. Crop Sci. 24:28–32.
Sibuga, K. P. and J. D. Bandeen. 1980. Effects of various densities of greenfoxtail (Setaria viridis L. Beav.) and lambsquarters (Chenopodium al-bum) on N uptake and yields of corn. E. Afric. Agric. For. J. 45:214–221.

556 • Weed Science 51, July–August 2003
Teasdale, J. R. 1998. Influence of corn (Zea mays) population and rowspacing on corn and velvetleaf (Abutilon theophrasti) yield. Weed Sci.46:447–453.
Teyker, R. H., H. D. Hoelzer, and R. A. Liebl. 1991. Maize and pigweedresponse to N supply and form. Plant Soil 135:287–292.
Tollenaar, M., S. P. Nissanka, A. Aguilera, S. F. Weise, and C. J. Swanton.1994. Effect of weed interference and soil N on four maize hybrids.Agron. J. 86:596–601.
Van Acker, R. C., S. F. Weise, and C. J. Swanton. 1993. Influence ofinterference from a mixed weed species stand of soybean [Glycine max(L.) Merr.] growth. Can. J. Plant Sci. 73:1293–1304.
Walker, R. H. and G. A. Buchanan. 1982. Crop manipulation in integratedweed management systems. Weed Sci. 30(Suppl. 1):17–24.
Weaver, S. E., M. J. Kropff, and R. W. Groeneveld. 1992. Use of eco-physiological models for crop–weed interference: the critical period ofweed interference. Weed Sci. 40:302–307.
Wolfe, D. W., D. W. Henderson, T. C. Hsiao, and A. Alvino. 1988. In-teractive water and N effects on senescence of maize II. Photosynthesisdecline and longevity of individual leaves. Agron. J. 80:865–870.
Received February 5, 2002, and approved October 25, 2002.