Inferring social nature of conversations from words: Experiments on a corpus of everyday telephone...
16
Available online at www.sciencedirect.com Computer Speech and Language 28 (2014) 224–239 Inferring social nature of conversations from words: Experiments on a corpus of everyday telephone conversations Anthony Stark a , Izhak Shafran a,∗ , Jeffrey Kaye b a Center for Spoken Language Understanding, Oregon Health & Science University (OHSU), Portland, OR, United States b Oregon Center for Aging & Technology, Oregon Health & Science University (OHSU), Portland, OR, United States Received 22 August 2012; received in revised form 27 May 2013; accepted 19 June 2013 Available online 9 July 2013 Abstract Language is being increasingly harnessed to not only create natural human–machine interfaces but also to infer social behaviors and interactions. In the same vein, we investigate a novel spoken language task, of inferring social relationships in two-party conversations: whether the two parties are related as family, strangers or are involved in business transactions. For our study, we created a corpus of all incoming and outgoing calls from a few homes over the span of a year. On this unique naturalistic corpus of everyday telephone conversations, which is unlike Switchboard or any other public domain corpora, we demonstrate that standard natural language processing techniques can achieve accuracies of about 88%, 82%, 74% and 80% in differentiating business from personal calls, family from non-family calls, familiar from unfamiliar calls and family from other personal calls respectively. Through a series of experiments with our classifiers, we characterize the properties of telephone conversations and find: (a) that 30 words of openings (beginnings) are sufficient to predict business from personal calls, which could potentially be exploited in designing context sensitive interfaces in smart phones; (b) our corpus-based analysis does not support Schegloff and Sack’s manual analysis of exemplars in which they conclude that pre-closings differ significantly between business and personal calls – closing fared no better than a random segment; and (c) the distribution of different types of calls are stable over durations as short as 1–2 months. In summary, our results show that social relationships can be inferred automatically in two-party conversations with sufficient accuracy to support practical applications. © 2013 Elsevier Ltd. All rights reserved. Keywords: Conversation telephone speech; Social networks; Social relationships 1. Introduction and motivation Increasingly language is being exploited to gain insights into human behavior and social interactions. Speech and natural language processing has been applied, for example, to infer opinions from spoken utterances and text (Camelin et al., 2010; O’Connor et al., 2010), social dominance and stance from dialogues (Worgan and Moore, 2011; Walker et al., 2012), speaker’s emotion from speech (Mower et al., 2011), links between evolution of language and sexual selection (Briscoe, 2008), summary from dialogues (Zhang et al., 2010), social interaction style from conversations This paper has been recommended for acceptance by E. Briscoe. ∗ Corresponding author. Tel.: +1 5037481158. E-mail addresses: [email protected] (A. Stark), [email protected] (I. Shafran), [email protected] (J. Kaye). 0885-2308/$ – see front matter © 2013 Elsevier Ltd. All rights reserved. http://dx.doi.org/10.1016/j.csl.2013.06.003
-
Upload
independent -
Category
Documents
-
view
0 -
download
0
Transcript of Inferring social nature of conversations from words: Experiments on a corpus of everyday telephone...

Available online at www.sciencedirect.com
Computer Speech and Language 28 (2014) 224–239
Inferring social nature of conversations from words: Experiments ona corpus of everyday telephone conversations�
Anthony Stark a, Izhak Shafran a,∗, Jeffrey Kaye b
a Center for Spoken Language Understanding, Oregon Health & Science University (OHSU), Portland, OR, United Statesb Oregon Center for Aging & Technology, Oregon Health & Science University (OHSU), Portland, OR, United States
Received 22 August 2012; received in revised form 27 May 2013; accepted 19 June 2013Available online 9 July 2013
Abstract
Language is being increasingly harnessed to not only create natural human–machine interfaces but also to infer social behaviorsand interactions. In the same vein, we investigate a novel spoken language task, of inferring social relationships in two-partyconversations: whether the two parties are related as family, strangers or are involved in business transactions. For our study, wecreated a corpus of all incoming and outgoing calls from a few homes over the span of a year. On this unique naturalistic corpus ofeveryday telephone conversations, which is unlike Switchboard or any other public domain corpora, we demonstrate that standardnatural language processing techniques can achieve accuracies of about 88%, 82%, 74% and 80% in differentiating business frompersonal calls, family from non-family calls, familiar from unfamiliar calls and family from other personal calls respectively. Througha series of experiments with our classifiers, we characterize the properties of telephone conversations and find: (a) that 30 wordsof openings (beginnings) are sufficient to predict business from personal calls, which could potentially be exploited in designingcontext sensitive interfaces in smart phones; (b) our corpus-based analysis does not support Schegloff and Sack’s manual analysisof exemplars in which they conclude that pre-closings differ significantly between business and personal calls – closing fared nobetter than a random segment; and (c) the distribution of different types of calls are stable over durations as short as 1–2 months. Insummary, our results show that social relationships can be inferred automatically in two-party conversations with sufficient accuracyto support practical applications.© 2013 Elsevier Ltd. All rights reserved.
Keywords: Conversation telephone speech; Social networks; Social relationships
1. Introduction and motivation
Increasingly language is being exploited to gain insights into human behavior and social interactions. Speech andnatural language processing has been applied, for example, to infer opinions from spoken utterances and text (Camelinet al., 2010; O’Connor et al., 2010), social dominance and stance from dialogues (Worgan and Moore, 2011; Walker
et al., 2012), speaker’s emotion from speech (Mower et al., 2011), links between evolution of language and sexualselection (Briscoe, 2008), summary from dialogues (Zhang et al., 2010), social interaction style from conversations� This paper has been recommended for acceptance by E. Briscoe.∗ Corresponding author. Tel.: +1 5037481158.
E-mail addresses: [email protected] (A. Stark), [email protected] (I. Shafran), [email protected] (J. Kaye).
0885-2308/$ – see front matter © 2013 Elsevier Ltd. All rights reserved.http://dx.doi.org/10.1016/j.csl.2013.06.003

(c
eqlfttc
cwatwcacto
2
cbcP8cv
OBtifi
ccoo
wrtauwt
A. Stark et al. / Computer Speech and Language 28 (2014) 224–239 225
Jurafsky et al., 2009), and sexual interaction styles – friendly, flirtatious, awkward, and assertive – in speed-datingonversations (Ranganath et al., 2012).
In the same vein, this paper examines the task of inferring social relationships between conversants engaged inveryday conversations, a task that has not been examined in the literature before. This task is motivated by the need touantify social interactions with one’s social relationships – broadly referred to as social engagement in epidemiologicaliterature – in older adults. Social engagement has been known to influence risk for cognitive decline and depressionor more than a decade now (Bassuk et al., 1999; Fabrigoule et al., 1995; Glass et al., 2006). However, further studieso probe this link have been stymied by the lack of objective and automated methods for measuring it. In additiono studying the task, we demonstrate the feasibility of characterizing social engagement from everyday telephoneonversations using spoken language processing techniques.
The task of classifying social relationships has not been performed before mostly due to the lack of a naturalisticollection of everyday conversations. Public corpora like Switchboard and Fisher do not capture everyday conversationsith different types of social relationships. In this paper (Section 2), we describe our corpus that was collected fromfew homes of older adults. To facilitate the data collection, subjects were assured that the data will not be manually
ranscribed. This precludes labeling all the conversations with types of social relationships by a listener. Instead, weere able to have our subjects self-identify a few numbers. With these limitations, we describe our experiments on
lassifying relationships using standard natural language processing techniques and report results in Section 4. Inddition, to the self-identified relationships, we were able to utilize reverse listing to label a larger number of businessalls. For a deeper analysis, we focused on this larger data set to characterize our classifier and differences in nature ofhese calls. Our observations are reported and discussed in Section 6. Finally, we conclude our paper by summarizingur key contributions, which we hope will stimulate further research on this topic in the community.
. A corpus of everyday telephone conversations
Given our larger motivation to study social relationships in the context of studying aging, we collected telephoneonversations from 10 volunteers, 79 years or older, over a period of approximately 12 months. The study was approvedy the Institutional Review Board at Oregon Health & Science University. All participants signed written informedonsent. Subjects were all native English speakers with no hearing or speaking impairment, recruited from the greaterortland area in Oregon, USA. Two pairs of the volunteers were married, hence our collection consisted of calls fromhouseholds. Audio was captured directly from the phone line with a small, external USB recording device, that was
onnected to a data collection computer. The recording software also logged information about call direction (incomings. outgoing), time of call, duration, DTMF tones and caller ID when available.
As mentioned before, privacy-concerns precluded us from manually transcribing or annotating the conversations.perating within this constraint, we obtained reference labels by asking our subjects to self-identify their relationships.ased on the advice of our clinical study coordinators, who felt comfortable requesting such information from not more
han 20 numbers, we shortlisted ten most frequent and ten longest calls for each household. Subjects were asked todentify their relationship with the speakers at these numbers as immediate family, near relatives, close friends, casualriends, strangers and business. Though no further obligations were presented to the subject, providing additionalnformation on speakers not already identified was encouraged.
This corpus is unlike publicly available corpora such as the Switchboard corpus (Godfrey et al., 1992), whichontains elicited conversations between unfamiliar speakers, discussing a topic from a pre-determined list (e.g. music,rime, and air pollution). In contrast, the conversations in our corpus are completely natural, covering a wide rangef topics, conversational partners and types of interactions. Moreover, our corpus is comprehensive and includes allutgoing/incoming calls from their homes.
Our corpus consists of 12,067 digitized land-line telephone conversations. In this work, we discard conversationsith less than 30 automatically transcribed words. This is done primarily to get rid of spurious and/or noisy recordings
elated to device failure as well as incorrectly dialed telephone numbers. Moreover, short conversations are less likelyo provide enough social context to be useful. This resulted in about 8,558 conversations, of which 2728 were identified
s residential conversations and 1095 were identified as business conversations using reverse listings. This left 4395nlabeled records, for which the reverse listing was either inconclusive or for which the phone number informationas missing and/or improperly recorded. Apart from labeling conversations as business or residential, we also labelledhem with 3 other binary labels. The labels supplied by subjects to the 20 telephone numbers were grouped into family

226 A. Stark et al. / Computer Speech and Language 28 (2014) 224–239
1.5 2 2.5 3 3.5 40
0.2
0.4
0.6
0.8
LOG10 [word count]
Est
imat
ed p
roba
bilit
y
Global durationRes. call durationBiz. call duration
1.5 2 2.5 3 3.5 4 4.50
0.2
0.4
0.6
0.8
1
LOG10 [word count]
Est
imat
ed p
roba
bilit
y
FamilyNot family
1.5 2 2.5 3 3.5 4 4.50
0.2
0.4
0.6
0.8
1
LOG10 [word count]
Est
imat
ed p
roba
bilit
y
FamiliarNot familiar
Fig. 1. Distribution of durations of conversations with business vs. residential, family vs. non-family, and familiar vs. non-familiar numbers.
Mon Tue Wed Thu Fri Sat Sun0
0.05
0.1
0.15
0.2
0.25
0.3
Day
Pro
babi
lity
of c
all
Biz.Res.
4 5 6 7 8 9 10 11 12 13 14 15 16 17 18 19 20 21 22 230
0.05
0.1
0.15
0.2
0.25
0.3
Hour
Pro
babi
lity
of c
all
Biz.Res.
Fig. 2. Distribution of conversations by hour of the day and the day of the week, averaged over 8 homes, with one standard deviation error bars.
vs. non-family as well as family vs. residential non-family. We also created familiar vs. non-familiar labels. Here callerIDs appearing 5 or more times in the record are considered familiar. While these methods allowed us to label only afraction of the calls in our data, their purpose was to build classifiers and then infer the labels for the rest of the data.
One might intuit that surface features such as time and duration of the conversation might help distinguish at least thebusiness calls from residential calls. We find that these simplistic features are not particularly useful. The conversationsin our corpus vary in duration from 10 to 10,000 words and the distribution of several classes overlap considerably, asshown in Fig. 1. There was a slightly higher proportion of calls to/from residences among the very short (<100 words)and very long (>1000 words) conversations. Calls to/from a family members were slightly longer on average, as werethose between a familiar contact. However, the differences are not sufficient to effectively discriminate the two classesfrom duration alone.
Figs. 1 and 2 show the distributions for call initiation along the residential/business axis. Obvious differences manifeston the office hours (8 am to 5 pm) boundary, though again, they are inadequate for classification. This is likely due to thefact that increasingly business is conducted through call centers with extended hours of operations. These observationswere subsequently verified in experiments reported in Section 4. Moreover, the distribution of the distribution of thesesuperficial features are less separable between friends, family and other types of social relationships. In short, we needto exploit the content.
3. Automatic speech recognition
Conversations in our corpus were automatically transcribed using an ASR system. Our ASR system is structuredafter IBM’s conversation telephony system which was among the top performing systems in the evaluation of speechrecognition technology for telephony by National Institute of Standards and Technology (Soltau et al., 2005). Theacoustic models were trained on about 2000 h of telephone speech from Switchboard and Fisher corpora (Godfreyet al., 1992). The system has a vocabulary of 47K and uses a trigram language model with about 10M n-grams, estimatedfrom a mix of transcripts and web-harvested data. Decoding is performed in three stages using speaker-independentmodels, vocal-tract normalized models and speaker-adapted models. The three sets of models are similar in complexitywith 4000 clustered pentaphone states and 150K Gaussians with diagonal covariances. Our system does not includediscriminative training and performs at word error rate of about 24% on NIST RT Dev04. Even though our ASR systemwas trained on a publicly available corpus of telephony speech, our corpus differs from the training data in its diversity
of content and speaking style as noted earlier. Unfortunately, we cannot report accuracy on a more representativesample, as privacy constraints preclude listening to the telephone conversations.
A. Stark et al. / Computer Speech and Language 28 (2014) 224–239 227
Table 1Number of conversations belonging to each binary category.
Class Res. Biz. Family Not family Familiar Not familiar
Res. 2675 0 1151 1523 2230 445Biz. 0 1093 0 1093 526 567Family 1151 0 1151 0 1115 36Not family 1524 1093 0 7240 2016 5224Familiar 2230 526 1115 2016 3131 0Not familiar 445 567 36 5224 0 5260
T
4
taldtw
r
••••
fTbscwda
TN
H
12345678
T
otal 2675 1093 1151 7240 3131 5260
. Classification experiments
In this section we examine the utility of using the automatically generated transcripts for classifying social rela-ionships. For these experiments, we utilized the subset of data for which we had labels. Recall that phone numbersssociated with family and friends were only identified during an exit interview for a small subset of the data. Thiseaves the labeling for the majority of the corpus incomplete. Even residential vs. business labels are often missingue to missing or improperly recorded DTMF or caller ID. Furthermore, we expect to use a classifier to reflect therue nature of the conversations and expect to employ the classifier subsequently for correcting the errors, for examplehen personal conversations occur on business lines and vice versa.Aside from differentiating personal calls from business calls, we investigate classification of different types of social
elationships. These tasks are presented as the following binary classification problems:
Task 1: residential vs. business.Task 2: family vs. non-family.Task 3: familiar vs. unfamiliar.Task 4: family vs. other residential.
The categories are not all mutually exclusive and a given conversation can have multiple contextual labels (i.e.,amiliar and business). The number of conversations in each category are tabulated in Table 1 and from each home inable 2. Since the class labels are considerably skewed between the four tasks, for ease of comparing the results wealanced the class labels. Note, later, in Section 6, we also report classification results on the skewed distributions tohow the performance on a real-world application. Empirically, we found that dropping data from the more numerouslasses had little impact on classification performance. We revisit the unbanlanced nature of our classes in Section 5,
here we report performance on actual skewed distributions. From the balanced partitions, we randomly select 85% ofata to be used in 30-fold cross-validated training. The remaining 15% is used as a verification set to report recognitionccuracies. Since we are concerned with the accuracy that can be achieved within the framework of our application forable 2umber of total records selected from each home.
ome Res. Biz. Family Not family Familiar Not familiar Res. not family
12 32 2 102 44 382 16230 399 45 201 653 356 394160 180 183 166 487 469 164
15 21 1 76 46 266 3086 61 43 146 220 401 143
372 147 506 130 952 210 26587 178 65 208 284 663 143
131 75 306 122 445 384 28
otal 1093 1093 1151 1151 3131 3131 1183

228 A. Stark et al. / Computer Speech and Language 28 (2014) 224–239
Table 3Accuracy on evaluation data of binary classifications of four types of interactions; (1): residential vs. business, (2): family vs. non-family, (3):familiar vs. non-familiar, and (4): family vs. other residential.
Features Task 1 Task 2 Task 3 Task 4
Unigram 87.2 76.6 72.9 78.0Unigram (linear) 86.6 76.9 70.0 76.9Bigram 85.1 77.8 73.5 77.2Trigram 83.2 74.0 71.4 76.3
Surface 69.6 72.0 62.1 75.7
Unigram + surface 86.9 81.2 74.4 77.2studying aging, where it is feasible to obtain limited set of self-identified labels, we have not partitioned the trainingand test data to avoid calls from the same home appearing in both partitions. Also, our larger goal is to stratify the callsaccording to the social relationship irrespective of the telephone numbers, so we disregarded the telephone numberswhile partitioning the data. We estimated optimal classifiers using support vector machine (SVM), as implemented inlibSVM (Chang and Lin, 2011), whose parameters were tuned using cross-validation data. Our experiments showedthat removal of stop words, the ten most numerous words in the corpus, was beneficial. Similarly, SVM with radialbasis function as kernels, were better than linear classifier. So, they were adopted in all reported results.
4.1. n-Gram features
As in other similar classification tasks, we extracted n-gram counts as features from each conversation. In ourexperiments we found that inverse document frequency features reduced the variance in cross-validation performance.Here, document refers to a single phone conversation. To control sparsity, we use only those n-gram tokens appearingin 10 or more conversations. This gives 7.6K out of 25K total unigrams, 42K of 720K bigrams and 31K of 2.3Mtrigrams.
The results in Table 3 show that significant and exploitable differences exist for each of the classes investigated.For the majority of our experiments we achieved over 70% classification accuracy; an encouraging result given thatfeatures were extracted from erroneous ASR transcripts. The unigram vector with radial basis function (RBF) kernelperformed the best, yielding 87.2% accuracy on the residential vs. business classification task. Differentiating withrespect to the familiarity of the caller proved to be the most difficult task. This could perhaps be due to the exceptionsto the 5 call threshold, for example, between old friends with whom subjects speak infrequently.
Compared to the unigram, we observed varying levels of performance loss with higher order n-gram features, bothduring cross-validation as well as verification. This is similar to observations on other similar tasks. This may be dueto higher sparsity or increased effect of ASR errors on them. When only the surface features such as duration of thecalls were extracted, the performance was significantly poorer in all tasks. When surface features were augmented tounigrams, we found small improvements to the family vs. other and familiar vs. non-familiar tasks. These comparisonsare useful in planning future experiments, while weighing the trade-off between surface features which can be extractedeasily without any privacy concerns and the utility of recording the conversations.
4.2. Feature reduction
Feature reduction via unigram agglomeration can potentially induce more robust features – lessening impact ofinherent unigram sparsity, as well as ASR transcription error. We investigated three lower dimensionality feature sets:1) stemmed words, 2) tags from a hand-crafted dictionary from social psychology, and 3) latent semantic analysisfeatures.
Word stemming is used to map families of words down to a morphological base (e.g. jump, jumps, jumped, jumping
→ jump). Stemming is employed in many natural language processing applications where the morphological variantsof words are viewed as a source of noise on top of the more important content-conveying word stem. We use animplementation of the Porter stemmer for our experiments (van Rijsbergen et al., 1980). While the stemmer does miss
A. Stark et al. / Computer Speech and Language 28 (2014) 224–239 229
Table 4Effect of agglomerating unigrams using different methods on the four tasks; (1): residential vs business, (2): family vs. non-family, (3): familiar vsnon-familiar, and (4): family vs. other residential.
Features Task 1 Task 2 Task 3 Task 4
Unigram 87.2 76.6 72.9 78.0
Unigram-stem 87.8 76.0 74.3 76.0LIWC 77.1 74.6 64.8 69.1
LSA-1000 86.3 76.6 72.9 62.1LSA-500 87.8 76.6 73.8 63.4LSA-250 86.9 76.7 73.9 64.6LL
mp
atkactai
p(a
fdat
4
rtwv
assr
cddw
SA-100 83.9 77.3 70.5 66.0SA-10 79.9 74.7 71.1 70.9
any mappings (e.g. geese, goose) it results in a reduction of the dictionary down to approximately 5k stemmed wordsost-pruning.
We investigate feature reduction with a hand-crafted dictionary of salient words, called LIWC or Linguistic Inquirynd Word Count, employed in a number of social psychology studies (Pennebaker et al., 2001). This dictionary attemptso group words into 64 categories such as pronouns, activity words, positive emotion and health using prior linguisticnowledge. The words in each conversations were mapped to these categories and each conversation was representeds a 64-dimension feature vector. The categories have significant overlap and a given word can map to zero or moreategories. The clear benefit of LIWC is that the word categories have very clear and pre-labeled meanings. However,he categories do not take into account the context of the words. Moreover, since the categories are not defined underny sort of mathematical criteria, there are no guarantees the resultant feature will possess any useful discriminativenformation.
As an alternative data-driven feature reduction method, we investigated Latent Semantic Analysis (LSA), an unsu-ervised projection. LSA outputs a weighted combination of unigram frequencies obtained via matrix decompositionLandauer et al., 1998), and as such the projected features are not easy to interpret. The K most dominant projectionsre used for the LSA features.
Results reported in Table 4, show that the agglomerating features improves performance marginally over unigrameatures for three tasks. Stemming gives the best performance for two of the four tasks. Relying on hand-crafted LIWCegrades the performance substantially in all tasks. Unsupervised feature reduction using latent semantic analysis helpsll tasks, except distinguishing family from other residential relationships, for which unigrams with no reduction giveshe best results.
.3. Syntactic features
Part of speech (POS) tags are often used to characterize syntactic structures in written language and are often toobust to typical ASR errors (e.g., misrecognized names are often still tagged as nouns). We examine them here in ordero quantify their relative compatibility with erroneous ASR transcripts. The ASR transcripts (including stop words)ere tagged using the Stanford tagger (Toutanova and Manning, 2000). Using a tag set of 36 categories, various featureectors were then built.
As evident from results reported in Table 5, relying on POS features alone sacrifices performance. For each task,pproximately 10% absolute performance was lost. Though not as discriminative as the lexical unigrams, this resultuggests that POS features are very useful. This is significant in applications were privacy requirements do not allowtoring information that reveals content. Furthermore, previous work has shown that POS features can be extractedeliably even when ASR performance degrades significantly.
POS features may complement unigram features and to test this we encoded them in two ways. Depending onontext, a word can be associated with different tags. This was coded using features consisting of word-POS tuples,
enoted by × sign in the table. Alternatively, POS features can be augmented as additional features to unigrams,enoted by +sign. The POS information benefited the classification of family from other residential calls, the only taskhich stubbornly refused to show any gains from the three feature reduction methods in Table 4.
230 A. Stark et al. / Computer Speech and Language 28 (2014) 224–239
Table 5Comparison of POS features in isolation and in combination with unigrams on the four tasks; (1): residential vs business, (2): family vs non-family,(3): familiar vs non-familiar, and (4): family vs. other residential.
Features Task 1 Task 2 Task 3 Task 4
Unigram 87.2 76.6 72.9 78.0
POS-unigram 78.4 66.8 59.8 67.1POS-bigram 77.7 70.8 63.9 70.5Unigram × POS 84.2 76.3 72.5 79.8Unigram + POS 86.9 76.0 72.6 77.5
Table 6Comparison of feature selection using point-wise mutual information with unigrams on the four tasks; (1): residential vs. business, (2): family vs.non-family, (3): familiar vs. non-familiar, and (4): family vs. other residential.
Features Task 1 Task 2 Task 3 Task 4
Unigram 87.2 76.6 72.9 78.0
MI-5K 87.8 77.5 72.6 77.5MI-1K 86.6 78.6 73.2 76.0MI-500 84.5 78.3 73.5 76.6
MI-250 85.1 77.2 72.8 76.64.4. Supervised feature selection
From the previous subsections, we have seen that agglomerating unigrams failed to yield any significant increasein robustness. Because of this, we now test the sensitivity of the unigram feature to reduction via supervised featureselection. In contrast to using prior linguistic knowledge to reduce features, supervised feature selection can optimizedesirable cost functions. Moreover, supervised feature selection methods can help identify salient features that, forexample, signal personal vs. business conversations. The most obvious feature selection strategy is to rank the featuresaccording to mutual information and prune those with low scores. For this purpose, we estimate point-wise mutualinformation between lexical features and class labels. For each classification task, we compute the mutual informationfor each word within the training data. Words with the lowest mutual information are truncated first.
Table 6 shows the results for supervised truncation to 5000, 1000, 500 and 250 unigrams. Further reduction provedimpractical due to sparsity and appearance of empty feature vectors. It is immediately apparent that the unigramsare robust to different levels of pruning. Three of the classifiers show benefit from pruning. Further, we examinedthe top 30 most salient words according to point-wise mutual information for distinguishing business from personalcall, where the words are easy to interpret. The words, shown in Table 7, are remarkably indicative of the classes.While presence of Bob may be influenced by its relevance for a particular household, subsequent results in Section 6.1
confirms that the classifiers generalize across homes. Personal calls are signaled by reference to social relationships,social activities and such, while business calls are associated with words used in formal settings and customer service.Table 7Words selected using point-wise mutual information for tasks (1): business/residential label, (2): family/non-family, (3): familiar/non-familiar and(4): family/other residential.
Task 1 Task2 Task3 Task4
Dinner, customer, quality,hello, representative, thank,red, enjoy, goodness, scared,cute, purposes, grand,o’clock, press, pictures, body,girls, monitored, downstairs
Few, glad, already, computer,killed, eat, weekend, guy,dad, moved, hair, awhile,worked, email, mom, often,heard, went, loved, spend
Friday o’clock, morning,tomorrow, leave, early, left,until, trying, feel, enough,she’s, ready, yesterday, big,him, after, high, definitely,house
Bob, taught, weekend, talks,brought, apart, hope, his,cheat, mom, hair, computer,loved, grandma, glad, went,thanksgiving, choice, killed,weather

A. Stark et al. / Computer Speech and Language 28 (2014) 224–239 231
Table 8Comparison of unsupervised LDA topic features with unigrams on the four tasks; (1): residential vs. business, (2): family vs. non-family, (3): familiarvs. non-familiar, and (4): family vs. other residential.
Features Task 1 Task 2 Task 3 Task 4
Unigram 87.2 76.6 72.9 78.0
LDA-50 83.5 72.5 63.3 70.8LDA-30 85.8 71.7 63.4 69.9LDA-10 81.4 74.0 65.6 73.7LDA-2 77.4 69.9 58.0 67.9
Table 9Per-topic word distribution learned using unsupervised clustering with LDA.
Topic 1 Topic 2
Invalid, helpline, eligibility, transactions, promotional,representative, mastercard, touchtone, activation,nominating, receiver, voicemail, digit, representatives,Chrysler, ballots, staggering, refills, resented, classics,mr
Adorable, aeroplanes, Arlene, Astoria, baked, biscuits, bitches, blisters,bluegrass, bracelet, brains, bushes, calorie, casinos, Charlene, cheeses,chit, Chris, clam, clientele, cock, cookie, copying, crab, Davenport,debating, dementia, dictionary, dime, Disneyland, eek, Eileen, fascinated,
We
4
dLh
dwptmβ
iCt
fatrm
Tapw
etro, represented, administer, transfers, reselling,ecommendations, explanation, floral, exclusive, submit
follies, fry, gained
e saw negligible performance degradation given a 1000 word dictionary, and modest performance loss was observedven with a reduction down to 250 words.
.5. Unsupervised feature selection using latent Dirichlet allocation model
Unsupervised clustering and feature selection can make use of data for which we have no labels. In our case, unlabeledata amounts to about 50% of our corpus. Motivated by this consideration, we examined unsupervised clustering usingatent Dirichlet Allocation or LDA (Blei et al., 2003). Unlike LSA, LDA creates topics with associated vocabulary,ence the new features can more readily be interpreted like in other feature selection techniques.
LDA models a document as a bag of words and generates a document by: (a) sampling a topic distribution θ for theocument using a per-document Dirichlet topic distribution with a hyper-parameter α, (b) sampling a topic z for eachord in the document using a multinomial distribution using the topic mixture θ, and (c) sampling the word from aer-topic multinomial word distribution with a hyper-parameter β (Blei et al., 2003). The number of topics is assumedo be given. The per-document topic distribution and the per-topic word distribution can be automatically estimated to
aximize the likelihood of training data. The sparsity of these two distributions can be controlled by tweaking α and; lower values increase sparsity.
For our experiments, we estimated a maximum likelihood K-topic LDA model from the 8.3K training set. Exper-mentally, we found best cross-validation results were obtained when α and β were set to 0.01 and 0.1 respectively.onversations were represented by a K-dimensional feature vector corresponding to the log-topic-distribution under
he estimated model, and SVM classifiers were trained on them.From the results of the LDA experiments in Table 8 for different numbers of topics, we find that the unsupervised
eatures do not improve performance over unigrams. They are effective in differentiating business from personal calls,chieving an accuracy of 85.84% with mere 30 topics – giving it a significant advantage over LSA of similar size. Whenhe number of clusters are reduced to two, the LDA model still separates the business and residential conversations withelatively high accuracy. This suggests the LDA model was able to approximately learn our classes in an unsupervisedanner.Indeed, when peering into words which constituted the topics, a business vs. personal trend did seem to emerge.
able 9 lists words strongly associated with the two topics and clearly the unsupervised clustering appears to haveutomatically differentiated the business-oriented calls from the rest. On closer examination, we found that most of therobability was distributed in a limited number of words in the business-oriented topic. On the contrary, the probabilityas more widely distributed among words in the other cluster, reflecting the diversity of content in personal calls.

232 A. Stark et al. / Computer Speech and Language 28 (2014) 224–239
Table 10Performance, area under the curve (AUC), on evaluation data for the four classification tasks; (1): rsidential vs. business, (2): family vs. non-family,(3): familiar vs. non-familiar, and (4): family vs. other residential.
Features Task 1 Task 2 Task 3 Task 4
Surface 0.80 0.79 0.66 0.81Unigram 0.94 0.87 0.82 0.88
In summary, we find that the unigram features are effective in characterizing the four types of distinctions in socialinteractions. The best accuracy in classifying business calls from personal calls (87.8%) was achieved with stemmedunigrams or 500 dimension LSA projection of unigrams. Unigrams with surface features gave the best performanceof 81.2 and 74.4 for classifying family vs. non-family and familiar vs. non-familiar respectively. However, most of theinformation is contained in the unigrams and the additional contributions of surface features are very small. Tuplesof unigrams and POS were most effective (79.8%) in distinguishing family from other residential calls. When thereis no overlap of conversations from the same phone number between test and train, the unigrams perform at 83.6%,73.0%, 70.0% and 70.2% for the four tasks in the order reported in Table 3 and the trends appear to be consistent forexperiments that were repeated, namely, with feature selection using mutual information.
5. Performance on actual skewed class distributions
All of the above results were evaluated on balanced class distributions so that the difficulty of the task and differentfeatures can be easily compared across tasks. In realistic applications, the distributions of calls belonging to differenttypes of relationships are considerably skewed. This was gauged by evaluating our classifiers on the available data notutilized in training them. The results are reported in Table 10 in terms of area under the curve (AUC).
For comparison, we include the performance with only the surface features, which can be extracted without recordingany speech. Clearly, the classifier based on the content and unigram features provides considerable improvement overthe surface features in all cases. These classification results were achieved with bag of words model of conversations,which implies that privacy concerns in future studies may be addressed by transcribing the data near the source andpossibly encoding the data using an encrypted dictionary.
6. Error analysis
Having examined both supervised and unsupervised feature reduction and feature selection strategies, we now turnour attention to understanding the types of errors incurred by automatic classification in our corpus and the natureof these calls. As mentioned earlier, we have a much larger corpus of labeled data on distinguishing business frompersonal calls, and so we largely restrict our analysis to this task. For these experiments, we rely on simple lexicalunigram features to avoid the need for empirically optimizing over additional feature selection or reduction parameters.
6.1. How does classification accuracy vary across homes?
The number of conversations that each residence contributed to training and test sets varied considerably, as shown inTable 1. To rule out the possibility that the average accuracy was not dominated by one or two homes, we computed theperformance on held-out data for each home separately. Results, reported in Table 11, show that clear discrimination wasachieved for each home. Encouragingly, homes 4 and 8 achieved very high classification scores despite cumulativelycontributing less than 4% of the training corpus. Thus, our classifier appears to generalize across all homes.
6.2. How does accuracy vary with conversation length?
Classification accuracy is expected to improve with the length of conversations as longer conversations providemore evidence. In order to understand how quickly the accuracy degrades for shorter conversations, we stratifiedthe conversations into 5 groups according to percentile length. The lengths were measured in terms of automaticallyrecognized words. The performance for each group in the held-out set is reported in Table 12. As expected, the accuracy

A. Stark et al. / Computer Speech and Language 28 (2014) 224–239 233
Table 11Classification accuracy on evaluation data observed for each of the eight homes.
Home Records Accuracy
1 8 87.52 103 84.53 42 81.04 6 100.05 27 77.06 74 94.67 25 88.08 43 90.7
Table 12Classification accuracy on 5 groups of conversations with different lengths. The split column gives the label distribution for the correspondingquintile.
Word Counts Split Accuracy
Percentile Counts Res/Biz
0–20 30–87 62.1/37.9 75.820–40 88–167 48.5/51.5 83.340–60 168–295 39.4/60.6 90.960–80 296–740 40.9/59.1 93.98
ic
6
BebTpd2bsr
0–100 741+ 59.4/40.6 93.8
ncreases with length. Interestingly, performance appears to plateau at about 200–300 words. That is, about 2 min ofonversation is sufficient to classify conversations with the highest performance.
.3. How consistent is the classification across conversations from the same telephone number?
Our corpus contains multiple conversations between the same conversants with as many as 300 in certain cases.y and large, we expect the type of conversation between same individuals to be consistent across all instances. Toxamine the consistency of the automatic classifier, we computed the average classification rate across all conversationsetween each pair of coversants. Then, plotted the number of conversants in each bin of accuracy, as shown in Fig. 3.he majority of phone numbers are consistently classified correctly. Out of 125 conversants, 50 were recognizederfectly. At the other end of the spectrum, 5 conversants were consistently inaccurate (0-5% accuracy). Given theistribution of accuracies in Fig. 3, these conversants are somewhat anomalous. On investigating further, we found thatwere reference label errors – businesses mislabeled because of a residential address. The remaining 3 were legitimateusiness numbers consistently misclassified as personal calls. One of them, for example, belonged to a lighting goods
tore with 65 calls. While the errors may certainly indicate deficiencies of the classifier, these conversations we cannotule out that the conversations are not social in nature.0 10 20 30 40 50 60 70 80 90 1000
20
40
60
Num
ber
of te
leph
one
cont
acts
Classification accuracy (%)
Fig. 3. Histogram of classification accuracy of conversations from a given telephone number.

234 A. Stark et al. / Computer Speech and Language 28 (2014) 224–239
Table 13Classification accuracy for 5 groups of conversations with different SVM confidence or scores. The split column gives the label distribution for thecorresponding quintile.
SVM Margin Split Accuracy
Percentile Range Res/Biz
0–20 0–0.345 47.7/52.3 61.520–40 0.345-0.74 55.2/44.8 80.640–60 0.74-1.06 65.2/34.9 97.060–80 1.06-1.48 51.5/48.5 98.580–100 1.48+ 29.7/70.3 100.0
0 0.2 0.4 0.6 0.8 10
0.2
0.4
0.6
0.8
1
False positive rate
Tru
e po
sitiv
e ra
te
Fig. 4. Receiver operator characteristic curve for the business classifier.
6.4. Can SVM score serve as a confidence measure?
For downstream processing, the ability to trade-off precision for recall is extremely useful. One way to achieve aflexible operating point is to treat the SVM score as a confidence measure and threshold it as appropriate. We utilizethe absolute value of SVM score, the distance from the separating hyperplane, as a confidence measure. Ideally, a highconfidence should correspond to high accuracy. To examine this correlation in detail, we divide the conversations inthe held-out set into 5 groups based on their confidence and compute the average accuracy for each group separately,as reported in Table 13.
Here, results show clear correlation between classifier confidence and accuracy. The high correlation betweenconfidence level and accuracy allows us to achieve an arbitrary precision, by selectively ignoring ‘hard to classify’examples. Fig. 4 shows accuracy at different levels of confidence-based pruning, with an area under the curve of 0.94.As an aside, both classes appear to have balanced distribution on both sides of the boundary with the possible exceptionof 80–100 percentile which has a disproportionate percentage (70%) of business calls. Further investigation revealedthat many of these conversations correspond to automated customer service calls, calls which tended to have a verylimited and thus recognizable vocabularies.
7. Nature of everyday telephone conversations
Sociologists like Harvey Sacks and Emanuel Schegloff have analyzed everyday telephone conversations for morethan a decade. Their analyses were limited to a narrow domains and a few hundred examples, handicapped by theunavailability of a naturalistic corpus and reliance on manual transcripts. Free from both these constraints, our corpusaffords an opportunity to probe the nature of everyday conversations using more data, both in number and diversity,and automated transcripts. We examine a few properties of conversations that are easily amenable for computational
corpus-based analysis.
A. Stark et al. / Computer Speech and Language 28 (2014) 224–239 235
30 50 100 250 500 10000
5
10
15
20
25
30
Number of words in segment
Res
/ bi
z cl
assi
ficat
ion
erro
r (%
)
Word segment from startWord segment from endRandom word sample
Fo
7
itbt(tom
UtprTCTaot
7
dpif
ca
ig. 5. Comparison of classification accuracy in predicting the type of conversation from openings, closings and random segments. Error bars arene standard deviation.
.1. Openings and closings
Schegloff and Sacks assert openings (beginnings) and closings (ends) of telephone conversations have certaindentifiable structures (Sacks et al., 1974). For example, the structure of openings facilitates establishing identity ofhe conversants and the purpose of their call (Schegloff, 1968). In the context of closing, they developed the idea thaty using topically empty objects – they call pre-closings – such as ‘well’, ‘okay’, and ‘so’, conversants may pass theirurn to allow the other party to start a new topic or mention any unmentioned mentionables before conversation endsSchegloff and Sacks, 1973). They characterize two types of calls in the context of pre-closings. First, ‘monotopical’ orask-oriented business calls, where closing is performed as soon as the topic is closed. Second, calls where the numberf topics are not so predefined, and where pre-closings are utilized as floor-offering-exchanges. These pre-closingsay be captured by unigrams from the endings and may help characterize personal calls.Given the above assertions, we expect openings and closings to be informative about the type of conversations.
sing our classifier, we compare the accuracy of predicting the type from openings, closings and random segments ofhe conversations. For different lengths of the three types of segments, the observed performance of the classifier islotted in Fig. 5. The results for the random segment were computed by averaging over 100 trials. Several importantesults are immediately apparent. Openings possess much higher utility than closings – at least, for the unigram feature.his is consistent with general intuition that the opening exchange is expected to clarify the nature and topic of the call.losings of the automatic transcripts were found to be only as informative as random segments from the conversations.hus, our observations do not support the pre-closing (Schegloff and Sacks, 1973). Perhaps, these pre-closings needdditional contextual information to be useful indicators. A less intuitive finding is the fact that increasing the lengthf the opening segment does not improve its performance. We find that a 30-word segment from the opening appearso be sufficient to achieve high classification accuracy (87.20%).
.2. Inherent ambiguity in short conversations
At first glance, the results from the previous section appear to contradict the observation in Table 12 that accuracyegrades as conversations become shorter. This seems to suggest short conversations suffer poor recognition due toroperties beyond a simple sparsity effect. To test this, we investigated the differences in short and long conversationsn greater detail. We again separate calls into quintile groups based on word counts. However, we now calculate all
eatures from a 30-word opening – eliminating effects directly related to duration of conversations.The results in Table 14 show that the ability to predict the type of conversation does not degrade when longonversations are truncated. In comparison to Table 12, there is a surprisingly small performance loss due to thertificial truncation. These observations suggest that the long and short conversations are inherently different in nature,
236 A. Stark et al. / Computer Speech and Language 28 (2014) 224–239
Table 14Classification accuracy when the conversations are truncated to 30-words of openings, illustrating that the originally longer conversations are stilleasier to classify than originally shorter one.
Original length (# Words) Split Accuracy
Percentile Range Res/Biz
0–20 30–87 62.1/37.9 78.620–40 88–167 48.5/51.5 82.840–60 168–295 39.4/60.6 91.460–80 296–740 40.9/59.1 87.8
80–100 741+ 59.4/40.6 93.4at least in their openings. One potential reason could be that individuals are more careful in enunciating the reasonsfor calling if an extended phone conversation is anticipated.
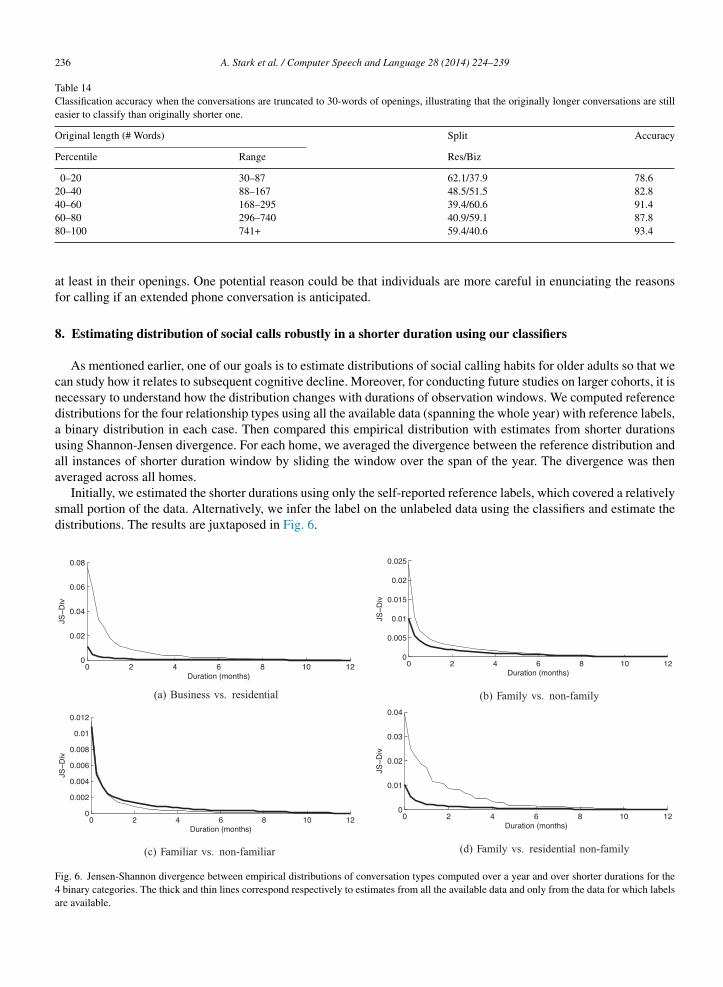
8. Estimating distribution of social calls robustly in a shorter duration using our classifiers
As mentioned earlier, one of our goals is to estimate distributions of social calling habits for older adults so that wecan study how it relates to subsequent cognitive decline. Moreover, for conducting future studies on larger cohorts, it isnecessary to understand how the distribution changes with durations of observation windows. We computed referencedistributions for the four relationship types using all the available data (spanning the whole year) with reference labels,a binary distribution in each case. Then compared this empirical distribution with estimates from shorter durationsusing Shannon-Jensen divergence. For each home, we averaged the divergence between the reference distribution andall instances of shorter duration window by sliding the window over the span of the year. The divergence was thenaveraged across all homes.
Initially, we estimated the shorter durations using only the self-reported reference labels, which covered a relativelysmall portion of the data. Alternatively, we infer the label on the unlabeled data using the classifiers and estimate thedistributions. The results are juxtaposed in Fig. 6.
0 2 4 6 8 10 120
0.02
0.04
0.06
0.08
JS−
Div
Duration (months)
(a) Business vs. residential
0 2 4 6 8 10 120
0.005
0.01
0.015
0.02
0.025
JS−
Div
Duration (months)
(b) Family vs. non-family
0 2 4 6 8 10 120
0.002
0.004
0.006
0.008
0.01
0.012
JS−
Div
Duration (months)
(c) Familiar vs. non-familiar
0 2 4 6 8 10 120
0.01
0.02
0.03
0.04
JS−
Div
Duration (months)
(d) Family vs. residential non-family
Fig. 6. Jensen-Shannon divergence between empirical distributions of conversation types computed over a year and over shorter durations for the4 binary categories. The thick and thin lines correspond respectively to estimates from all the available data and only from the data for which labelsare available.

rgsrFtaa
9
ht7f
saawtaO0
fieth
fleulrrrcaw
erocatt
A. Stark et al. / Computer Speech and Language 28 (2014) 224–239 237
When we use only the reference labels, the distribution diverges substantially when the observation window iseduced to under 6.5 months. Using all the available calls with estimated labels significantly improves the diver-ence over shorter durations. The distribution of familiar and non-familiar did not benefit from the unlabelled dataince the coverage for the two classes are already high. For the other three cases, the unlabelled data effectivelyeduces the observation duration required to estimate the distributions with a given divergence of true distribution.or example, in the case of business vs. residential, distribution estimated from observation of 1 month with all
he data has the same divergence (0.025) as that using 5 months with only the reference labels. This demonstratesn additional utility of our classifiers in the context of understanding social calling habits or engagement of olderdults.
. Conclusions and discussion
This paper has several contributions. Firstly, the paper examines a novel task in spoken language processing thatas not been attempted before, the task of classifying social relationships between two conversants. We demonstratehat standard natural language processing techniques can, on balanced test sets, achieve accuracies of about 88%, 81%,4% and 80% in classifying business from residential calls, family from non-family, familiar from non-familiar andamily from other residential calls respectively.
Note, since we are concerned with the accuracy that can be achieved within the framework of our application fortudying aging, where it is feasible to obtain limited set of self-identified labels, we have not partitioned the trainingnd test data to avoid calls from the same home appearing in both partitions. Also, our larger goal is to stratify the callsccording to the social relationship irrespective of the telephone numbers, so we disregarded the telephone numbershile partitioning the data. When there is no overlap of conversations from the same phone number between test and
rain, the unigrams perform at 83.6%, 73.0%, 70.0% and 70.2%, respectively in the same order of tasks and the trendsppear to be consistent for experiments that were repeated, namely, with feature selection using mutual information.n realistic skewed distribution of telephone calls, our classifiers achieve an AUC performance of about 0.94, 0.87,.81 and 0.88, respectively in the same order of tasks.
We find that the lexical features or words were significantly more useful in differentiating relationships than surfaceeatures. The above mentioned performances were achieved with bag-of-words features or unigrams. This implies thatn future studies when privacy is a concern that precludes recording the audio, automatic speech recognizers can bemployed at the source and the conversations can be encoded into fixed length vectors. Remarkably, only 30 words athe beginning of the conversations provided most information about the nature of the conversations. Both these resultsas potential applications in designing context-sensitive user interface in smartphones.
We investigated several strategies for feature reduction and feature selection. Stemming was found to be help-ul in classifying family from non-family and familiar from non-familiar. Unsupervised feature reduction usingatent semantic analysis gave consistent performance gains over unigram features in all the four classification tasks,xcept family vs. other residential calls. This task benefited from feature tuples consisting of part-of-speech tags andnigrams. Unsupervised topic modeling using latent Dirichlet allocation did not improve performance over base-ine, however the classifiers performed remarkably well fewer parameters in comparison to other forms of featureeduction or feature selection. Remarkably, when the number of unsupervised topics is limited to two, they natu-ally partition the data into business vs. personal calls, with an accuracy of about 77.4%, well above chance. Theesulting per topic word distribution shows that probability is spread relatively uniformly across words when thealls are of personal nature. This captures the intuitive notion that the personal calls may digress to many topicsnd contain a larger variety of words than business calls, where probability was found to concentrated in fewerords.Our corpus of naturalistic telephone conversations affords us an opportunity to characterize a few properties of
verday conversations using computational corpus-based analysis. Comparison of different segments of conversationseveal that conversants clarify the nature of the call right at the outset, as expected. This is in contrast with endingsr other random segments of the conversations. This is similar to observations by Schegloff and Sacks. However, our
lassifiers, learned from unigrams, do not seem to find pre-closings, that is, topical empty words such as ‘okay’, ‘well’,nd ’so’, in the endings that characterize more open-ended personal calls than ‘monotopical’ business calls. Perhaps,his may be because our unigram features do not capture the context necessary to utilize them. Though we did findhat shorter conversations were harder to classify, this appears to be a result of inherent ambiguity in such calls rather
238 A. Stark et al. / Computer Speech and Language 28 (2014) 224–239
than sparseness problems. Using our classifiers, we are able to utilize calls with missing information and estimatethe distribution of social calls with fewer months of observations, 1 month instead of 5 months, which is helpful indesigning future studies on social relationships.
Obvious extensions to this work includes separating speakers, extracting social interaction cues from dialoguestructures (Worgan and Moore, 2011), detecting affect and emotional support (Camelin et al., 2010; Shafran and Mohri,2005), extracting conversational topics and summaries (Zhang et al., 2010), and even romantic interests (Ranganathet al., 2012). Essentially, we have demonstrated the feasibility of assessing social engagement in older adults throughtheir telephone conversations. Since our work largely utilizes words, not acoustics, our analysis of everyday interactionsis relevant for future work on social engagement using other mediums of communication such as cell phone, email orInternet-based social networking, media more relevant to younger population. We hope our results will inspire moreresearch on inferring social relationships and quantifying engagement objectively for clinical trials that are targetedtoward improving social and emotional well-being.
Acknowledgements
This research was supported in part by NIH Grants 1K25AG033723, P30 AG008017, 5R01AG027481, and P30AG024978, as well as by NSF Grants 1027834, 0964102, and 0905095. Any opinions, findings, conclusions orrecommendations expressed in this publication are those of the authors and do not necessarily reflect the viewsof the NIH. We thank Nicole Larimer for help in collecting the data, Maider Lehr for testing the data collectiondevices and Katherine Wild for early discussions on this project. We are grateful to Brian Kingsbury and his col-leagues for providing us access to IBM’s attila software tools. We thank the reviewers for their comments andsuggestions.
References
Bassuk, S.S., Glass, T.A., Berkman, L.F., 1999. Social disengagement and incident cognitive decline in community-dwelling elderly persons. Annalsof Internal Medicine 131 (3), 165–173.
Blei, D.M., Ng, A.Y., Jordan, M.I., 2003 March. Latent dirichlet allocation. Journal of Machine Learning Research 3, 993–1022.Briscoe, T., 2008. Language learning, power laws, and sexual selection. Mind and Society 7, 65–76.Camelin, N., Bechet, F., Damnati, G., De Mori, R., 2010 Feb. Detection and interpretation of opinion expressions in spoken surveys. IEEE Transactions
on Audio Speechand Language Processing 18 (2), 369–381.Chang, C.-C., Lin, C.-J., 2011. Libsvm: a library for support vector machines. ACM Transactions on Intelligent Systems and Technology, 2.Fabrigoule, C., Letenneur, L., Dartigues, J.F., Zarrouk, M., Commenges, D., Barberger-Gateau, P., 1995. Social and leisure activities and risk of
dementia: a prospective longitudinal study. Journal of the American Geriatrics Society 43 (5), 485–490.Glass, T.A., De Leon, C.F.M., Bassuk, S.S., Berkman, L.F., 2006. Social engagement and depressive symptoms in late life: longitudinal findings.
Journal of Aging and Health 18 (4), 604–628.Godfrey, J., Holliman, E., McDaniel, J., 1992. SWITCHBOARD: Telephone speech corpus for research and development. In: IEEE International
Conference on Acoustics, Speech, and Signal Processing, pp. 517–520.Jurafsky, D., Ranganath, R., McFarland, D., 2009 June. Extracting social meaning: Identifying interactional style in spoken conversation. In:
Proceedings of Human Language Technologies: The 2009 Annual Conference of the North American Chapter of the Association for Computa-tional Linguistics, Association for Computational Linguistics, Boulder, CO, pp. 638–646.
Landauer, T.K., Foltz, P.W., Laham, D., 1998. Introduction to latent semantic analysis. Discourse Processes, 259–284.Mower, E., Mataric, M., Narayanan, S., 2011 July. A framework for automatic human emotion classification using emotion profiles. IEEE Transactions
on Audio Speech and Language Processing 19 (5), 1057–1070.O’Connor, B., Balasubramanyan, R., Routledge, B., Smith, N., 2010. From tweets to polls: linking text sentiment to public opinion time series. In:
International AAAI Conference on Weblogs and Social Media.Pennebaker, J.W., Francis, M.E., Booth, R.J., 2001. Linguistic Inquiry and Word Count. Lawerence Erlbaum Associates, Mahwah, NJ.Ranganath, R., Jurafsky, D., McFarland, D.A., 2012. Detecting friendly, flirtatious, awkward, and assertive speech in speed-dates. Computer Speech
and Language.Sacks, H., Schegloff, E.A., Jefferson, G., 1974. A simplest systematics for the organization of turn-taking for conversation language. Language 50
(41), 696–735.Schegloff, E.A., 1968. Sequencing in conversational openings. American Anthropologist 70 (6), 1075–1095.
Schegloff, E.A., Sacks, H., 1973. Opening up closings. Semiotica 8, 289–327.Shafran, I., Mohri, M., 2005. A comparison of classifiers for detecting emotions from speech. In: IEEE ICASSP, vol. 1, pp. 341–344.Soltau, H., Kingsbury, B., Mangu, L., Povey, D., Saon, G., Zweig, G., 2005. The IBM 2004 conversational telephony system for rich transcription.In: IEEE International Conference on Acoustics, Speech, and Signal Processing, Vol. 1, pp. 205–208.

T
v
WWZ
A. Stark et al. / Computer Speech and Language 28 (2014) 224–239 239
outanova, K., Manning, C.D., 2000. Enriching the knowledge sources used in a maximum entropy part-of-speech tagger. In: Joint SIGDATConference on Empirical Methods in Natural Language Processing and Very Large Corpora, pp. 63–70.
an Rijsbergen, C., Robertson, S., Porter, M., 1980. New Models in Probabilistic Information Retrieval. British Library Research and DevelopmentReport.
alker, M.A., Anand, P., Abbott, R., Grant, R., 2012. Stance classification using dialogic properties of persuasion. In: HLT-NAACL, pp. 592–596.organ, S.F., Moore, R.K., 2011. Towards the detection of social dominance in dialogue. Speech Communication 53 (910), 1104–1114.
hang, J., Chan, R., Fung, P., 2010. Extractive speech summarization using shallow rhetorical structure modeling. IEEE Transactions on AudioSpeech and Language Processing 18 (August (6)), 1147–1157.