INDUSTRY OVERVIEW - :: HKEX :: HKEXnews ::
10
Unless otherwise indicated, the information and statistics contained in this section have been derived from various official and government publications, publicly available market research sources and from the market research report prepared by CIC, which was commissioned by us. We believe that the sources of such information are appropriate, and we have taken reasonable care in extracting and reproducing such information. We have no reason to believe that such information is false or misleading in any material respect or that any fact has been omitted that would render such information false or misleading in any material respect. We, the Joint Sponsors, the [REDACTED], the [REDACTED], the [REDACTED], the [REDACTED] or any other party involved in the [REDACTED] or any of our or their respective directors, officers, representatives, affiliates or advisors (excluding CIC in respect of the CIC Report and the information therein) have no independently verified the information and have made no representation as to the accuracy and completeness thereof. The relevant information and statistics may not be consistent with other information and statistics compiled within or outside the PRC by third parties. As a result, you are advised not to place undue reliance on such information. SOURCE OF INFORMATION This section includes information from the CIC Report, a report commissioned by us, as we believe such information imparts a greater understanding of the industry in which we operate to potential [REDACTED]. CIC is a consulting firm founded in Hong Kong, and has an industry expert network database and provides professional industry consulting across multiple industries. We have agreed to pay a total of RMB886,000 in fees to CIC for the preparation of the report, which we believe to be consistent with market rates. We are of the view that the payment of such fee does not impair the fairness of the conclusions drawn in the CIC Report. Figures and statistics provided in this document and attributed to CIC or the CIC Report have been extracted from the CIC Report and published with the consent of CIC. In preparing the CIC Report, CIC conducted both primary and secondary research through various resources. Primary research involved interviewing key industry experts and leading industry participants. Secondary research involved analyzing data from various publicly available data sources. CIC also assumed that (1) China’s overall social, economic and political environment are expected to remain stable during the forecast period, (2) China’s economic and industrial development is likely to maintain a steady growth trend over the next decade, (3) relevant market drivers are expected to continue to drive the growth of the relevant markets in the forecast period, such as the raising consciousness of improving personal appearance, changes in lifestyles and consumption habits, and (4) there is no extreme force majeure event or new industry regulation which would affect the market dramatically or fundamentally. DIRECTORS’ CONFIRMATION After making reasonable inquiries, our Directors confirm that to the best of their knowledge, there has been no adverse change in the market information presented in the CIC Report since the date of the report which may disqualify, contradict or have an impact on the information in this document. THE DENTAL CARE SERVICES MARKETS IN CHINA AND THE U.S. Overview The U.S. dental care services market, in terms of service revenue, increased from US$118.9 billion in 2015 to US$133.2 billion in 2020 at a CAGR of 2.3%, and is expected reach US$163.6 billion in 2030 at a CAGR of 2.1% from 2020 to 2030, according to the CIC Report. By comparison, China’s dental care services market, in terms of service revenue, increased from US$13.2 billion in 2015 to US$26.2 billion in 2020 at a CAGR of 14.8%, and is expected to reach US$75.2 billion in 2030 at a CAGR of 11.1% from 2020 to 2030, according to the same source. INDUSTRY OVERVIEW – 80 – THIS DOCUMENT IS IN DRAFT FORM, INCOMPLETE AND SUBJECT TO CHANGE AND THAT THE INFORMATION MUST BE READ IN CONJUNCTION WITH THE SECTION HEADED “WARNING” ON THE COVER OF THIS DOCUMENT.
-
Upload
khangminh22 -
Category
Documents
-
view
0 -
download
0
Transcript of INDUSTRY OVERVIEW - :: HKEX :: HKEXnews ::
Unless otherwise indicated, the information and statistics contained in this section have beenderived from various official and government publications, publicly available market researchsources and from the market research report prepared by CIC, which was commissioned by us. Webelieve that the sources of such information are appropriate, and we have taken reasonable care inextracting and reproducing such information. We have no reason to believe that such information isfalse or misleading in any material respect or that any fact has been omitted that would render suchinformation false or misleading in any material respect. We, the Joint Sponsors, the [REDACTED],the [REDACTED], the [REDACTED], the [REDACTED] or any other party involved in the[REDACTED] or any of our or their respective directors, officers, representatives, affiliates oradvisors (excluding CIC in respect of the CIC Report and the information therein) have noindependently verified the information and have made no representation as to the accuracy andcompleteness thereof. The relevant information and statistics may not be consistent with otherinformation and statistics compiled within or outside the PRC by third parties. As a result, you areadvised not to place undue reliance on such information.
SOURCE OF INFORMATION
This section includes information from the CIC Report, a report commissioned by us, as we believesuch information imparts a greater understanding of the industry in which we operate to potential[REDACTED]. CIC is a consulting firm founded in Hong Kong, and has an industry expert networkdatabase and provides professional industry consulting across multiple industries. We have agreed to paya total of RMB886,000 in fees to CIC for the preparation of the report, which we believe to be consistentwith market rates. We are of the view that the payment of such fee does not impair the fairness of theconclusions drawn in the CIC Report. Figures and statistics provided in this document and attributed toCIC or the CIC Report have been extracted from the CIC Report and published with the consent of CIC.
In preparing the CIC Report, CIC conducted both primary and secondary research through variousresources. Primary research involved interviewing key industry experts and leading industry participants.Secondary research involved analyzing data from various publicly available data sources. CIC alsoassumed that (1) China’s overall social, economic and political environment are expected to remain stableduring the forecast period, (2) China’s economic and industrial development is likely to maintain a steadygrowth trend over the next decade, (3) relevant market drivers are expected to continue to drive the growthof the relevant markets in the forecast period, such as the raising consciousness of improving personalappearance, changes in lifestyles and consumption habits, and (4) there is no extreme force majeure eventor new industry regulation which would affect the market dramatically or fundamentally.
DIRECTORS’ CONFIRMATION
After making reasonable inquiries, our Directors confirm that to the best of their knowledge, therehas been no adverse change in the market information presented in the CIC Report since the date of thereport which may disqualify, contradict or have an impact on the information in this document.
THE DENTAL CARE SERVICES MARKETS IN CHINA AND THE U.S.
Overview
The U.S. dental care services market, in terms of service revenue, increased from US$118.9 billionin 2015 to US$133.2 billion in 2020 at a CAGR of 2.3%, and is expected reach US$163.6 billion in 2030at a CAGR of 2.1% from 2020 to 2030, according to the CIC Report. By comparison, China’s dental careservices market, in terms of service revenue, increased from US$13.2 billion in 2015 to US$26.2 billionin 2020 at a CAGR of 14.8%, and is expected to reach US$75.2 billion in 2030 at a CAGR of 11.1% from2020 to 2030, according to the same source.
INDUSTRY OVERVIEW
– 80 –
THIS DOCUMENT IS IN DRAFT FORM, INCOMPLETE AND SUBJECT TO CHANGE AND THAT THE INFORMATION MUST BE READIN CONJUNCTION WITH THE SECTION HEADED “WARNING” ON THE COVER OF THIS DOCUMENT.

The U.S. and China’s dental care services market size, 2015-2030E
2015 2016 2017 2018 2019 2020 2021E 2022E 2023E 2024E 2025E 2026E 2027E 2028E 2029E 2030E
13.2 15.5 18.1 21.2 24.6 26.2 29.2 32.6 36.2 40.3 44.9 49.9 55.4 61.5 68.0 75.2
118.9 124.4 126.9 130.0 133.1 133.2 136.1 139.0 141.9 144.8 147.8 150.8 153.9 157.1 160.3 163.6
USD in billions
The U.S.The PRC 14.8%
2.3% 2.1%11.1%
CAGR 15-20 20-30E
Sources: the American Dental Association; annual reports of listed companies; China Health Statistics Yearbook; the CIC Report
China’s dental care services market comprises dental prosthetics and aesthetics market, orthodonticsmarket, and other dental services market (including dental preventive and other general dental diagnosisand treatment services). Among which, the dental prosthetics and aesthetics market and the orthodonticsmarket are the two driving subsets that are expected to account for 45.7% and 39.4% of China’s dental careservices market in 2030, respectively. As the growth rates of China’s orthodontics market and dentalprosthetics and aesthetics market are expected to gradually stabilize between 2020 and 2030 following arapid growth between 2015 and 2020, China’s overall dental care services market is expected to grow ata relatively lower CAGR from 2020 to 2030 accordingly.
Comparative Analysis of Dental Care Services Markets in China and the U.S.According to the CIC Report, the gap between the U.S. and China’s dental care services markets is
expected to narrow in the future. While the U.S. dental care services market was 9.0 times larger thanChina’s dental care services market in 2015 in terms of service revenue, the gap narrowed to 5.1 times in2020 and is expected to further narrow to 2.2 times in 2030. In terms of per visit expense for dental careservices, in 2015, U.S. citizens spent US$695.9 per visit, which was about 7.4 times more than the per visitexpense by Chinese citizens. The gap narrowed to 5.0 times in 2020, and is expected to narrow to 2.8 timesin 2030, which indicates a great potential for customer value and China’s dental care services market.
OVERVIEW OF THE ORTHODONTICS MARKETIntroduction of Malocclusion and Orthodontics
According to the World Health Organization, malocclusion refers to a set of dental deviations,including crowding, spacing, and protrusion, which may adversely affect the quality of life. There arethree main categories of malocclusion. Class I malocclusion usually comes with problems like spacing,crowding, and over or under eruption. Class II malocclusion includes retrognathism, overjet and overbite.Class III malocclusion includes prognathism, anterior crossbite, negative overjet and underbite. Class IIand III malocclusion are more complicated and harder to treat than Class I malocclusion.
Orthodontics is a specialty of dentistry that deals with the diagnosis, prevention and correction ofmalocclusion. Orthodontic treatment applies constant, gentle force in a specific direction on the teeth tomove them into better positions.
Comparative Analysis of Major Orthodontic Treatment MethodsThere are two major methods of orthodontic treatment, namely the traditional orthodontics treatment
method and the clear aligner treatment method. The traditional method uses metal braces, lingual braces,ceramic braces, and other visible aligners. The clear aligner treatment method, as the advanced treatmentmethod, uses custom manufactured, removable, clear aligners. After conducting dental diagnosis, dentalprofessionals usually determine the appropriate type of orthodontic treatment for a specific patient basedon the patient’s malocclusion condition, the severity of the issue, the expected treatment results, and thepatient’s preferences.
The traditional orthodontic treatment method has long been the major therapy for malocclusion.However, it has various limitations, including (1) unattractive appearance due to noticeable braces, (2) oraldiscomfort due to the design and material of traditional braces, (3) poor oral hygiene due to non-removablebraces, (4) high technique requirements for dental professionals which generally require post-graduateprofessional training in orthodontics, and (5) frequent and lengthy subsequent visits due to the necessityof adjusting, repairing or replacing the arch wires.
INDUSTRY OVERVIEW
– 81 –
THIS DOCUMENT IS IN DRAFT FORM, INCOMPLETE AND SUBJECT TO CHANGE AND THAT THE INFORMATION MUST BE READIN CONJUNCTION WITH THE SECTION HEADED “WARNING” ON THE COVER OF THIS DOCUMENT.
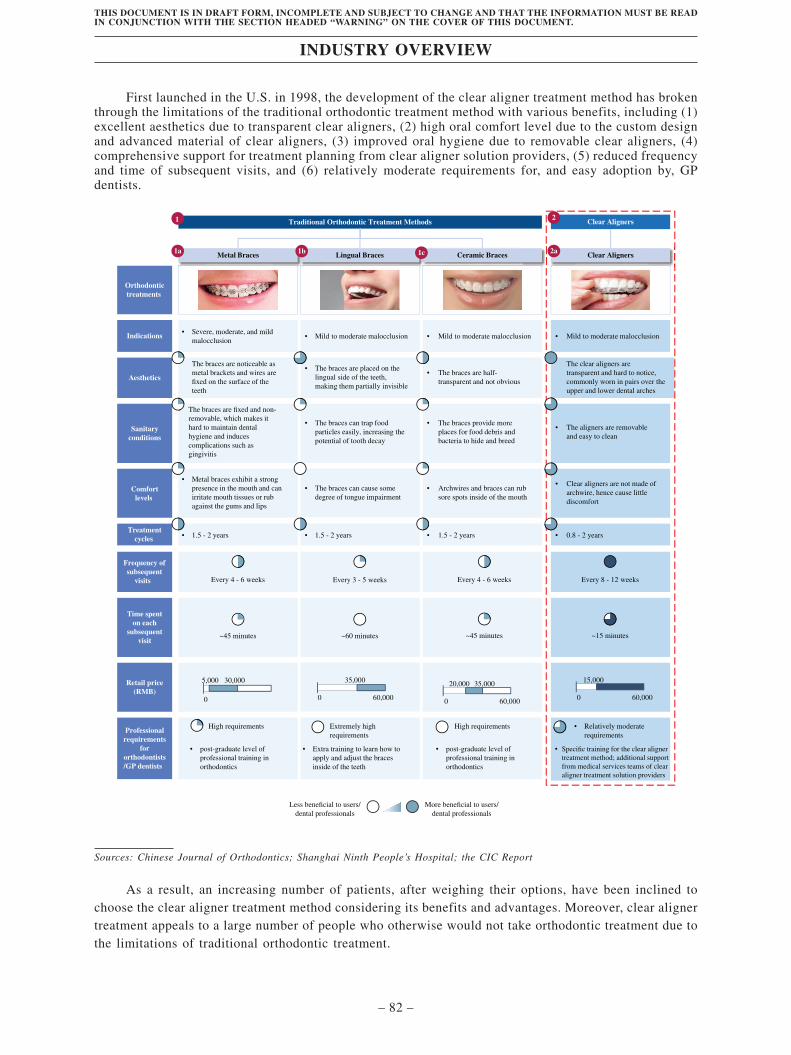
First launched in the U.S. in 1998, the development of the clear aligner treatment method has brokenthrough the limitations of the traditional orthodontic treatment method with various benefits, including (1)excellent aesthetics due to transparent clear aligners, (2) high oral comfort level due to the custom designand advanced material of clear aligners, (3) improved oral hygiene due to removable clear aligners, (4)comprehensive support for treatment planning from clear aligner solution providers, (5) reduced frequencyand time of subsequent visits, and (6) relatively moderate requirements for, and easy adoption by, GPdentists.
• The braces are half-transparent and not obvious
• The braces provide moreplaces for food debris andbacteria to hide and breed
• Archwires and braces can rubsore spots inside of the mouth
• 1.5 - 2 years
• Mild to moderate malocclusion
• The braces are placed on thelingual side of the teeth,making them partially invisible
• The braces can trap foodparticles easily, increasing thepotential of tooth decay
• The braces can cause somedegree of tongue impairment
• 1.5 - 2 years
• Mild to moderate malocclusion
Orthodontictreatments
The clear aligners aretransparent and hard to notice,commonly worn in pairs over theupper and lower dental arches
• The aligners are removableand easy to clean
Aesthetics
Sanitaryconditions
Comfortlevels
• Clear aligners are not made ofarchwire, hence cause littlediscomfort
• 0.8 - 2 years
• Mild to moderate malocclusionIndications
Clear Aligners
Traditional Orthodontic Treatment Methods Clear Aligners21
The braces are noticeable asmetal brackets and wires arefixed on the surface of theteeth
• The braces are fixed and non-removable, which makes ithard to maintain dentalhygiene and inducescomplications such asgingivitis
• Metal braces exhibit a strongpresence in the mouth and canirritate mouth tissues or rubagainst the gums and lips
• 1.5 - 2 years
• Severe, moderate, and mildmalocclusion
Metal Braces1a Ceramic BracesLingual Braces1b 2a1c
Treatmentcycles
Frequency ofsubsequent
visits
Time spenton each
subsequentvisit
Retail price(RMB)
Professionalrequirements
fororthodontists/GP dentists
Every 4 - 6 weeks Every 3 - 5 weeks Every 4 - 6 weeks Every 8 - 12 weeks
~45 minutes ~60 minutes ~45 minutes ~15 minutes
0
5,000 30,000
0 60,000
35,000
0 60,000
20,000 35,000
0 60,000
15,000
• High requirements
• post-graduate level ofprofessional training inorthodontics
• Extra training to learn how toapply and adjust the bracesinside of the teeth
• Extremely highrequirements
• High requirements
• post-graduate level ofprofessional training inorthodontics
• Relatively moderaterequirements
• Specific training for the clear alignertreatment method; additional supportfrom medical services teams of clearaligner treatment solution providers
More beneficial to users/dental professionals
Less beneficial to users/dental professionals
Sources: Chinese Journal of Orthodontics; Shanghai Ninth People’s Hospital; the CIC Report
As a result, an increasing number of patients, after weighing their options, have been inclined tochoose the clear aligner treatment method considering its benefits and advantages. Moreover, clear alignertreatment appeals to a large number of people who otherwise would not take orthodontic treatment due tothe limitations of traditional orthodontic treatment.
INDUSTRY OVERVIEW
– 82 –
THIS DOCUMENT IS IN DRAFT FORM, INCOMPLETE AND SUBJECT TO CHANGE AND THAT THE INFORMATION MUST BE READIN CONJUNCTION WITH THE SECTION HEADED “WARNING” ON THE COVER OF THIS DOCUMENT.
The Global Orthodontics Market and China’s Orthodontics Market
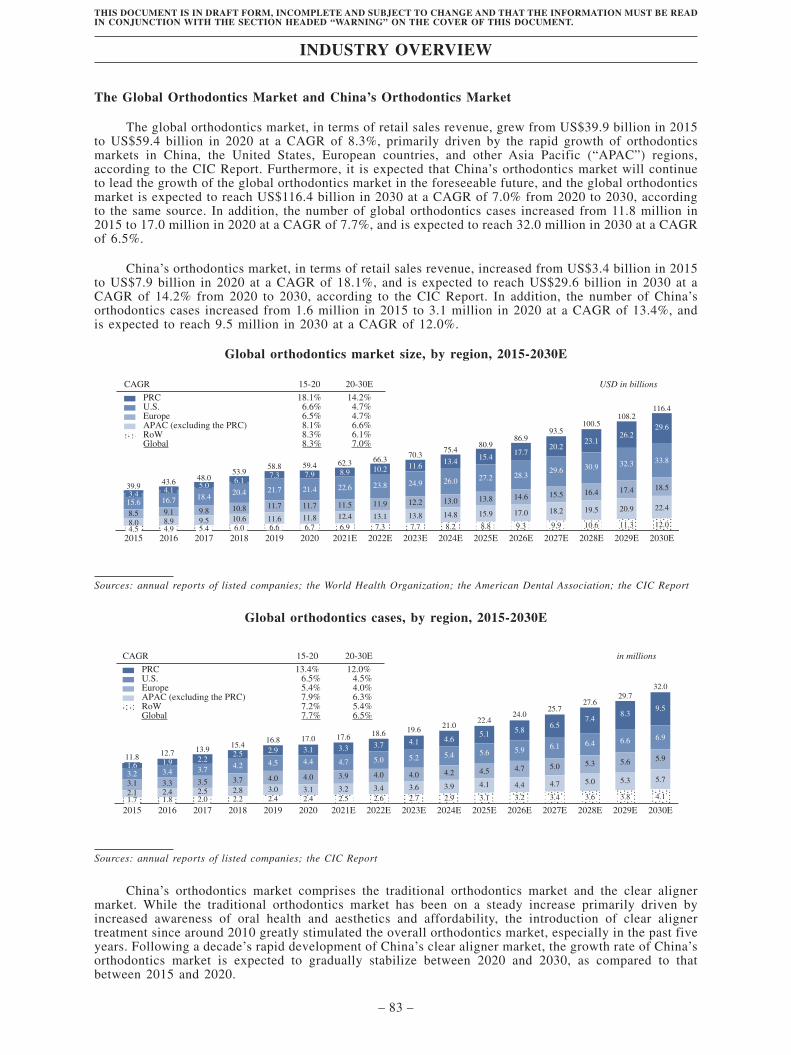
The global orthodontics market, in terms of retail sales revenue, grew from US$39.9 billion in 2015to US$59.4 billion in 2020 at a CAGR of 8.3%, primarily driven by the rapid growth of orthodonticsmarkets in China, the United States, European countries, and other Asia Pacific (“APAC”) regions,according to the CIC Report. Furthermore, it is expected that China’s orthodontics market will continueto lead the growth of the global orthodontics market in the foreseeable future, and the global orthodonticsmarket is expected to reach US$116.4 billion in 2030 at a CAGR of 7.0% from 2020 to 2030, accordingto the same source. In addition, the number of global orthodontics cases increased from 11.8 million in2015 to 17.0 million in 2020 at a CAGR of 7.7%, and is expected to reach 32.0 million in 2030 at a CAGRof 6.5%.
China’s orthodontics market, in terms of retail sales revenue, increased from US$3.4 billion in 2015to US$7.9 billion in 2020 at a CAGR of 18.1%, and is expected to reach US$29.6 billion in 2030 at aCAGR of 14.2% from 2020 to 2030, according to the CIC Report. In addition, the number of China’sorthodontics cases increased from 1.6 million in 2015 to 3.1 million in 2020 at a CAGR of 13.4%, andis expected to reach 9.5 million in 2030 at a CAGR of 12.0%.
Global orthodontics market size, by region, 2015-2030E
2015 2016 2017 2018 2019 2020 2021E 2022E 2023E 2024E 2025E 2026E 2027E 2028E 2029E 2030E4.5 4.9 5.4 6.0 6.6 6.7 6.9 7.3 7.7 8.2 8.8 9.3 9.9 10.6 12.011.3
3.4 4.15.0
6.17.3 7.9 8.9 10.2 11.6
13.415.4
17.720.2
23.1
29.626.2
8.0 8.9 9.5 10.6 11.6 11.8 12.4 13.1 13.8 14.8 15.9 17.0 18.2 19.5 20.9 22.49.1 9.8 10.8 11.7 11.7 11.5 11.9 12.2 13.0 13.8 14.6 15.5 16.4 17.4 18.5
16.7 18.4 20.4 21.7 21.4 22.6 23.8 24.9 26.0 27.2 28.329.6 30.9 32.3 33.8
43.6 48.053.9
58.8 59.4 62.3 66.370.3
75.480.9
86.993.5
100.5108.2
116.4
8.515.6
39.9
USD in billionsCAGR
PRCU.S.EuropeAPAC (excluding the PRC)RoWGlobal
15-20 20-30E
18.1% 14.2%6.6% 4.7%6.5% 4.7%8.1% 6.6%8.3% 6.1%8.3% 7.0%
Sources: annual reports of listed companies; the World Health Organization; the American Dental Association; the CIC Report
Global orthodontics cases, by region, 2015-2030E
2015 2016 2017 2018 2019 2020 2021E 2022E 2023E 2024E 2025E 2026E 2027E 2028E 2029E 2030E1.7 1.8 2.0 2.2 2.4 2.4 2.5 2.6 2.7 2.9 3.1 3.2 3.4 3.6 4.13.8
1.6 1.9 2.22.5 2.9 3.1 3.3 3.7 4.1 4.6
5.1 5.86.5
7.49.5
8.3
2.1 2.4 2.5 2.8 3.0 3.1 3.2 3.4 3.6 3.9 4.1 4.4 4.7 5.0 5.3 5.73.3 3.5 3.7 4.0 4.0 3.9 4.0 4.0 4.2 4.5 4.7 5.0 5.3 5.6 5.9
3.4 3.7 4.2 4.5 4.4 4.7 5.0 5.2 5.4 5.6 5.9 6.1 6.4 6.6 6.9
12.7 13.915.4
16.8 17.0 17.6 18.6 19.6 21.022.4
24.025.7
27.629.7
32.0
3.13.2
11.8
in millionsCAGR
PRCU.S.EuropeAPAC (excluding the PRC)RoWGlobal
15-20 20-30E
13.4% 12.0%6.5% 4.5%5.4% 4.0%7.9% 6.3%7.2% 5.4%7.7% 6.5%
Sources: annual reports of listed companies; the CIC Report
China’s orthodontics market comprises the traditional orthodontics market and the clear alignermarket. While the traditional orthodontics market has been on a steady increase primarily driven byincreased awareness of oral health and aesthetics and affordability, the introduction of clear alignertreatment since around 2010 greatly stimulated the overall orthodontics market, especially in the past fiveyears. Following a decade’s rapid development of China’s clear aligner market, the growth rate of China’sorthodontics market is expected to gradually stabilize between 2020 and 2030, as compared to thatbetween 2015 and 2020.
INDUSTRY OVERVIEW
– 83 –
THIS DOCUMENT IS IN DRAFT FORM, INCOMPLETE AND SUBJECT TO CHANGE AND THAT THE INFORMATION MUST BE READIN CONJUNCTION WITH THE SECTION HEADED “WARNING” ON THE COVER OF THIS DOCUMENT.

Key Drivers of China’s Orthodontics Market
The development of China’s orthodontics market is primarily driven by the following factors.
• Growing affluence. With the increase in disposable income, an increasing number of Chineseconsumers are able to afford the out-of-pocket bills relating to orthodontics treatment.Moreover, as a result of the increase in spending power, Chinese consumers are willing tospend more on dental care services, including orthodontics treatment.
• Heightened awareness of dental health and aesthetics. Chinese consumers are more consciousof the importance of dental health and aesthetics, as they increasingly relate such to theirself-confidence and social status. As a result, they are motivated to seek orthodontic treatmentto improve their appearances.
• Increasing number of orthodontic treatment providers. The number of medical institutionsproviding orthodontic treatment in China, including general hospitals, dental hospitals andclinics, has increased in recent years, primarily driven by favorable government policies. Inaddition, the vibrant orthodontic market and lowering difficulty of orthodontic treatmentpractice have attracted a number of GP dentists to obtain orthodontist certificates. As a result,the number of orthodontic treatment providers increases in China, which improves theaccessibility of orthodontic treatment services.
CHINA’S CLEAR ALIGNER MARKET
Overview of China’s Clear Aligner Market
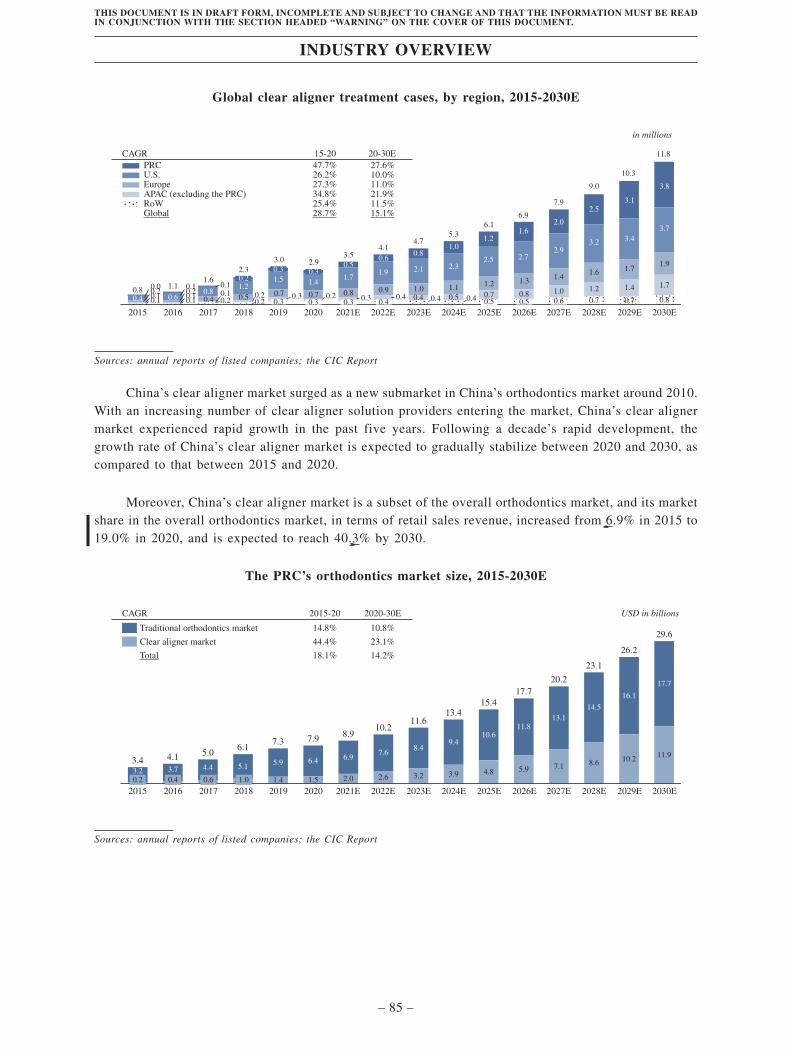
The global clear aligner market, in terms of retail sales revenue, increased from US$4.0 billion in2015 to US$12.2 billion in 2020 at a CAGR of 25.3%, and is expected to reach US$46.2 billion in 2030at a CAGR of 14.2% from 2020 to 2030. The growth of the global clear aligner market is mainly drivenby the development of the clear aligner market in developing countries, such as China. In addition, thenumber of global orthodontics cases addressed by clear aligners increased from 0.8 million in 2015 to 2.9million in 2020 at a CAGR of 28.7%, and is expected to reach 11.8 million in 2030 at a CAGR of 15.1%.
China’s clear aligner market has become the second largest market in the world in 2019. The marketsize, in terms of retail sales revenue, increased from US$0.2 billion in 2015 to US$1.5 billion in 2020 ata CAGR of 44.4%, and is expected to reach US$11.9 billion by 2030 at a CAGR of 23.1% from 2020 to2030. By contrast, the growth of the clear aligner markets in the U.S. and Europe is expected to decelerateto a CAGR of 10.4% and 11.0% from 2020 to 2030, respectively. In addition, the number of China’sorthodontics cases addressed by clear aligners increased from 47,800 in 2015 to 335,500 in 2020 at aCAGR of 47.7%, and is expected to reach 3.8 million in 2030 at a CAGR of 27.6%.
Global clear aligner market, by region, 2015-2030E
2015 2016 2017 2018 2019 2020 2021E 2022E 2023E 2024E 2025E 2026E 2027E 2028E 2029E 2030E
1.5 1.1 1.4 1.3 1.5 1.71.01.10.80.80.50.6
0.50.31.00.4
0.40.20.80.2
1.9 2.3 2.6 2.8 3.1 3.83.5
5.31.0
1.4 1.56.2
2.63.2
3.94.8
5.97.1
8.610.2
11.9
2.3 2.8 3.9 2.3 2.9 3.22.7 2.3 2.9 3.5 4.2 5.1 6.1 7.25.07.2
10.412.9 12.2
6.6
3.7 4.1 4.5 5.0 5.4 5.9 6.5 7.1 7.7
5.77.5
2.0 8.4 9.210.0 11.0
12.013.0
14.215.4
14.717.0
19.522.1
25.028.4
32.136.3
41.0
46.2
4.0
USD in billionsCAGR
PRCU.S.EuropeAPAC (excluding the PRC)RoWGlobal
15-20 20-30E
44.4% 23.1%20.3% 10.4%27.3% 11.0%34.8% 21.9%25.4% 11.5%25.3% 14.2%
1.3 1.5 1.9 2.1
Sources: annual reports of listed companies; the World Health Organization; the American Dental Association; the CIC Report
INDUSTRY OVERVIEW
– 84 –
THIS DOCUMENT IS IN DRAFT FORM, INCOMPLETE AND SUBJECT TO CHANGE AND THAT THE INFORMATION MUST BE READIN CONJUNCTION WITH THE SECTION HEADED “WARNING” ON THE COVER OF THIS DOCUMENT.
Global clear aligner treatment cases, by region, 2015-2030E
2015 2016 2017 2018 2019 2020 2021E 2022E 2023E 2024E 2025E 2026E 2027E 2028E 2029E 2030E0.10.10.20.0
0.10.10.20.1
0.2 0.51.1 1.2 1.3 1.4
1.6 1.71.9
0.7 0.8 1.0 1.2 1.4 1.7
0.41.00.8 0.9
0.20.30.2 0.7 0.7
1.5 1.41.7
0.50.6
1.9 2.1 2.32.5 2.7
2.93.2 3.4
3.7
1.01.2
1.62.0
2.53.1
3.8
0.8
0.4 0.50.10.1
0.8 1.11.6
2.33.0 2.9
3.54.1
4.75.3
6.16.9
7.9
9.0
10.3
11.8
0.4 0.60.8
1.20.2
in millions
PRCU.S.EuropeAPAC (excluding the PRC)RoW
CAGR
Global
15-2047.7%26.2%27.3%34.8%25.4%28.7%
27.6%10.0%11.0%21.9%11.5%15.1%
20-30E
0.3 0.3 0.3 0.4 0.5 0.5 0.6 0.7 0.7 0.80.2 0.3 0.4 0.4 0.4
0.3 0.3
Sources: annual reports of listed companies; the CIC Report
China’s clear aligner market surged as a new submarket in China’s orthodontics market around 2010.With an increasing number of clear aligner solution providers entering the market, China’s clear alignermarket experienced rapid growth in the past five years. Following a decade’s rapid development, thegrowth rate of China’s clear aligner market is expected to gradually stabilize between 2020 and 2030, ascompared to that between 2015 and 2020.
Moreover, China’s clear aligner market is a subset of the overall orthodontics market, and its marketshare in the overall orthodontics market, in terms of retail sales revenue, increased from 6.9% in 2015 to19.0% in 2020, and is expected to reach 40.3% by 2030.
The PRC’s orthodontics market size, 2015-2030E
Traditional orthodontics market
CAGR 2015-20
14.8% 10.8%
2020-30E
Clear aligner market 44.4% 23.1%
Total 18.1% 14.2%
0.2 0.4 0.6 1.0 1.4 1.5 2.0 2.6 3.2 3.93.2 3.7 4.4 5.1 5.9 6.4 6.97.6
8.49.4
10.611.8
13.114.5
16.1
17.7
4.8 5.9 7.1 8.6 10.2 11.9
2015
3.4 4.1 5.06.1
7.3 7.9 8.910.2
11.613.4
15.417.7
20.2
23.1
26.2
29.6
2016 2017 2018 2019 2020 2021E 2022E 2023E 2024E 2025E 2026E 2027E 2028E 2029E 2030E
USD in billions
Sources: annual reports of listed companies; the CIC Report
INDUSTRY OVERVIEW
– 85 –
THIS DOCUMENT IS IN DRAFT FORM, INCOMPLETE AND SUBJECT TO CHANGE AND THAT THE INFORMATION MUST BE READIN CONJUNCTION WITH THE SECTION HEADED “WARNING” ON THE COVER OF THIS DOCUMENT.
Comparative Analysis of Clear Aligner Markets in China and the U.S.
China has a higher prevalence rate of complicated malocclusion cases than the U.S.
Class II and III malocclusion cases are considered as complicated malocclusion cases. As a result ofthe differences in facial types, China has a higher prevalence rate of complicated malocclusion cases thanthe U.S. According to the CIC Report, in 2020, the overall prevalence rate of malocclusion in China andthe U.S. reached approximately 74.0% and 73.0%, respectively, whereas the prevalence rate of Class IIand III malocclusion cases in China reached approximately 49.0%, compared to that of 23.0% in the U.S.
China has a smaller population receiving clear aligner treatment compared to that of the U.S., witha high growth potential in user base in the future
China’s clear aligner market is still at a nascent stage. In 2020, China had approximately 1,040million malocclusion cases, much higher than that of approximately 245 million in the United States.However, among the 3.1 million treated malocclusion cases in China in 2020, only 11.0% were addressedwith clear aligners, whereas 31.9% of the 4.4 million treated malocclusion cases in the United States wereaddressed with clear aligners. Such significant disparities indicate a huge underpenetrated clear alignermarket in China.
In particular, in China, approximately 4.5% and 38.9% of the treated malocclusion cases of childrenand teenagers and adults, respectively, were addressed by clear aligners. In comparison, in the U.S.,approximately 16.0% and 64.0% of the treated orthodontics cases of children and teenagers and adults,respectively, were addressed by clear aligners.
China has a huge, unmet demand for both GP dentists and orthodontists compared with the U.S.,which directly affects the supply of clear aligners treatment services
According to the CIC Report, in 2020, there were approximately 158,400 GP dentists and 10,800orthodontists in the U.S., which translated to 47.8 GP dentists and 3.3 orthodontists per 100,000population. In comparison, there were approximately 277,500 GP dentists and 6,100 orthodontists in Chinain 2020, which translated to 19.5 GP dentists and 0.4 orthodontists per 100,000 population. Therefore,there is a great potential for increase in both the absolute and relative number of GP dentists andorthodontists in China, which will in turn increase the amount of clear aligners treatment services that canbe delivered.
The relative shortage of orthodontists in China is primarily due to the stringent requirements fororthodontist candidates in China, including an orthodontics graduate degree and recognition as membersof existing orthodontics authorities such as the Chinese Orthodontics Society or the World Federation ofOrthodontists. Driven by increasing investments in dental care education and growing public awarenessof dental health, it is expected that the number of GP dentists and orthodontists in China will furtherincrease in the future to address the unmet demand.
While self-payment is currently the only payment option for clear aligner treatment in China, it maybe partially covered under certain medical insurance plans in the U.S.
As the medical insurance system is less developed in China, neither traditional orthodonticstreatment nor clear aligner treatment is currently covered under public or private insurance plans, whichsuggests that orthodontics is still regarded as discretionary consumption rather than necessities in China.By contrast, in the U.S. where the medical insurance system is developed and clear aligner treatmentenjoys both longer history and greater acceptance, a growing number of dental plans and other medicalinsurances have begun to cover clear aligners as well, which in return supports the adoption of clearaligner treatment.
INDUSTRY OVERVIEW
– 86 –
THIS DOCUMENT IS IN DRAFT FORM, INCOMPLETE AND SUBJECT TO CHANGE AND THAT THE INFORMATION MUST BE READIN CONJUNCTION WITH THE SECTION HEADED “WARNING” ON THE COVER OF THIS DOCUMENT.
Key Drivers for China’s Clear Aligner Market
The increased popularity of clear aligner treatment in China among potential patients is primarilydriven by the following factors.
• Increased willingness to receive treatment. The treatment rate of malocclusion among adultswas low in the past, primarily due to their concerns about appearance over the course oftraditional orthodontic treatment with visible braces. In contrast, more adults are willing totreat malocclusion with clear aligners as a result of improved aesthetics during treatment. Inaddition, clear aligners provide more comfortable treatment experience compared withtraditional treatment, which relieves another concern for potential patients.
• Expanding addressable indications. Equipped with greater control of teeth movement, clearaligner treatment has been able to address approximately half of all malocclusion indications,according to the CIC Report. Moreover, further technological advancement is likely to promotethe adoption of clear aligner treatment to more complicated indications that are more commonin China, which provides a continuously expanding pool of new target patients.
• Visualization of treatment results through intraoral scanners. As an emerging oral digitaltechnology, intraoral scanners bring immediate visualization of the therapeutic effect, whichallows patients to preview the image of their treatment effect before deciding whether toproceed with orthodontic treatment. As a result, patients who are uncertain about theirtreatment effects are more likely to join. Moreover, the penetration rate of intraoral scannersin China in 2020 was approximately 10.0%, compared to that of approximately 40.0% in theU.S. As the cost of intraoral scanners decreases and more brands become available, thepenetration rate of intraoral scanners is likely to increase, which in turn will promote thedevelopment of China’s clear aligner market.
The increased adoption of clear aligner treatment in China among dental professionals is primarilydriven by the following factors.
• Growing dental professionals base. Traditional orthodontic treatment is generally delivered byqualified orthodontists with a master’s degree in orthodontics or having received post-graduateprofessional training in orthodontics. On the contrary, clear aligner treatment, which requiresrelatively moderate training and features comprehensive medical and technological support byclear aligner solution providers, can be more easily delivered by both orthodontists and GPdentists.
• Stronger incentive to provide clear aligner treatment services. Unlike traditional orthodontics,clear aligner treatment does not require the dentist to bond the bracket or correct arch wires,which reduces the treatment time spent on each visit and increases the number of casesdelivered by a dental professional. In addition, clear aligner solution providers continuouslyintroduce new technologies to facilitate the diagnosis and treatment process and new productswith easier and more time-saving procedures. As a result of the improved efficiency andproductivity, more dental professionals are incentivized to recommend clear aligners overtraditional orthodontics.
Key Development Trends of China’s Clear Aligner Market
According to the CIC Report, the future development of China’s clear aligner market is characterizedby the following market trends.
• Increasing involvement of private medical institutions. Private medical institutions account formore than half of the cases treated with clear aligners serviced by medical institutions in China,primarily because (1) mandatory medical insurance in China does not cover malocclusiontreatment, which reduces patients’ incentives to seek orthodontic treatment in public hospitals;(2) compared with public hospitals in China, private medical service providers are more
INDUSTRY OVERVIEW
– 87 –
THIS DOCUMENT IS IN DRAFT FORM, INCOMPLETE AND SUBJECT TO CHANGE AND THAT THE INFORMATION MUST BE READIN CONJUNCTION WITH THE SECTION HEADED “WARNING” ON THE COVER OF THIS DOCUMENT.
accessible in terms of the flexibility in scheduling appointments; and (3) malocclusion isgenerally not considered as a serious illness and patients have fewer concerns with seekingmalocclusion treatment from private medical service providers. As such, the penetration rate ofprivate medical institutions is expected to continue to increase in the near future.
• Rapid development of domestic clear aligner solution providers and high marketconcentration. According to the CIC Report, domestic clear aligner solution providers willdevelop rapidly and further penetrate China’s clear aligner market in the foreseeable future,benefiting from local governmental support. In addition, China’s clear aligner market, ascurrently dominated by two major players, is expected to remain highly concentrated primarilydue to the high entry barriers to China’s clear aligner industry.
Competitive Landscape for China’s Clear Aligner Treatment Solution Providers
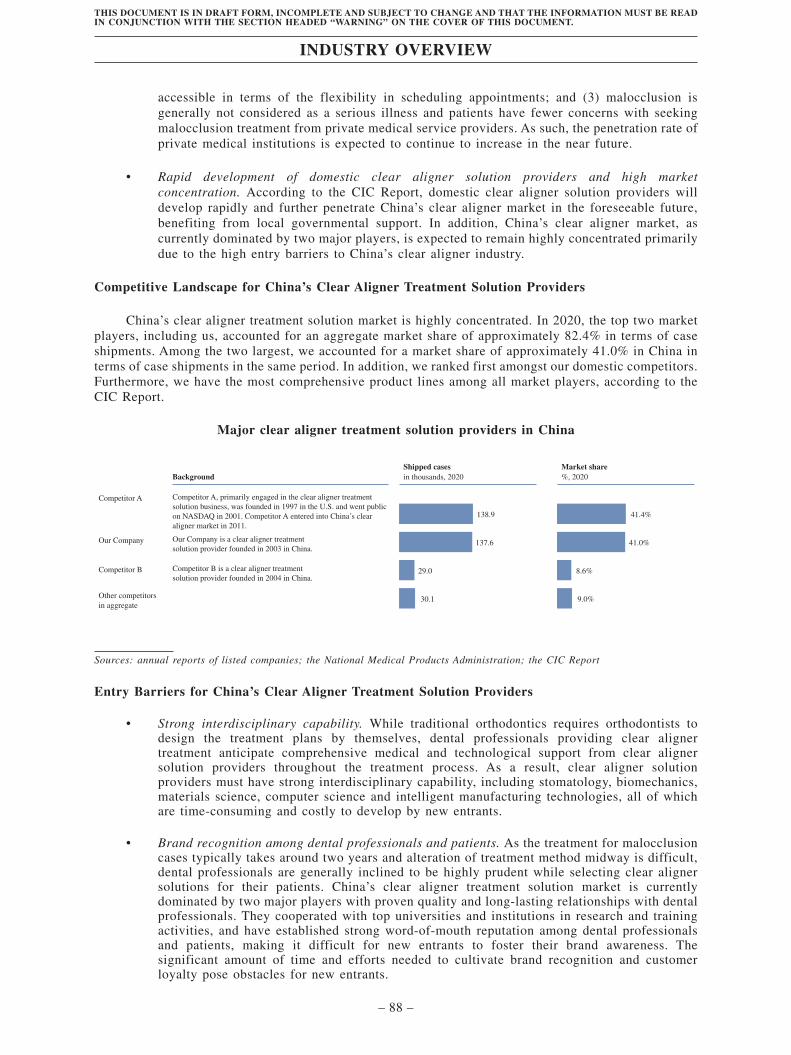
China’s clear aligner treatment solution market is highly concentrated. In 2020, the top two marketplayers, including us, accounted for an aggregate market share of approximately 82.4% in terms of caseshipments. Among the two largest, we accounted for a market share of approximately 41.0% in China interms of case shipments in the same period. In addition, we ranked first amongst our domestic competitors.Furthermore, we have the most comprehensive product lines among all market players, according to theCIC Report.
Major clear aligner treatment solution providers in China
Shipped casesin thousands, 2020Background
Market share%, 2020
138.9 41.4%
Competitor A
137.6 41.0%Our Company
29.0 8.6%Competitor B
30.1 9.0%Other competitors in aggregate
Competitor A, primarily engaged in the clear aligner treatment solution business, was founded in 1997 in the U.S. and went public on NASDAQ in 2001. Competitor A entered into China’s clear aligner market in 2011.
Our Company is a clear aligner treatment solution provider founded in 2003 in China.
Competitor B is a clear aligner treatment solution provider founded in 2004 in China.
Sources: annual reports of listed companies; the National Medical Products Administration; the CIC Report
Entry Barriers for China’s Clear Aligner Treatment Solution Providers
• Strong interdisciplinary capability. While traditional orthodontics requires orthodontists todesign the treatment plans by themselves, dental professionals providing clear alignertreatment anticipate comprehensive medical and technological support from clear alignersolution providers throughout the treatment process. As a result, clear aligner solutionproviders must have strong interdisciplinary capability, including stomatology, biomechanics,materials science, computer science and intelligent manufacturing technologies, all of whichare time-consuming and costly to develop by new entrants.
• Brand recognition among dental professionals and patients. As the treatment for malocclusioncases typically takes around two years and alteration of treatment method midway is difficult,dental professionals are generally inclined to be highly prudent while selecting clear alignersolutions for their patients. China’s clear aligner treatment solution market is currentlydominated by two major players with proven quality and long-lasting relationships with dentalprofessionals. They cooperated with top universities and institutions in research and trainingactivities, and have established strong word-of-mouth reputation among dental professionalsand patients, making it difficult for new entrants to foster their brand awareness. Thesignificant amount of time and efforts needed to cultivate brand recognition and customerloyalty pose obstacles for new entrants.
INDUSTRY OVERVIEW
– 88 –
THIS DOCUMENT IS IN DRAFT FORM, INCOMPLETE AND SUBJECT TO CHANGE AND THAT THE INFORMATION MUST BE READIN CONJUNCTION WITH THE SECTION HEADED “WARNING” ON THE COVER OF THIS DOCUMENT.
• Mass customization capability. Each clear aligner treatment plan generally requires 40 to 60pairs of clear aligners towards completion, depending on the complexity of the malocclusionsituation. Each clear aligner is customized for a specific treatment stage of a specific patient.As a result, clear aligner solution providers must have mass customization capability, such astop-tier clear aligner design personnel, comprehensive digital customization design systems,sufficient number of 3D printers and other clear aligners manufacturing equipment andinfrastructure, which is difficult to assemble for new entrants.
• Diversified product lines. Product diversification for different customer groups is a key successfactor for clear aligner solution providers to satisfy diversified user needs and generate salesfrom multiple product lines. Both of the two major market players have developedcomprehensive product lines that establish a barrier to other players.
Payment Methods by Consumers to Medical Institutions
According to the CIC Report, individual consumers receiving clear aligner treatment usually makethe payment to their hospitals or clinics in a lump sum or make installment payments of varying amountat varying frequency. There are two main kinds of installment payment plans: one is set up by the medicalservice providers (i.e., the hospitals or clinics) in accordance with the treatment cycles, and the other isin essence a collaborative consumption loan provided by a cooperating financial service institution.
HISTORICAL PRICES OF MAJOR RAW MATERIALS
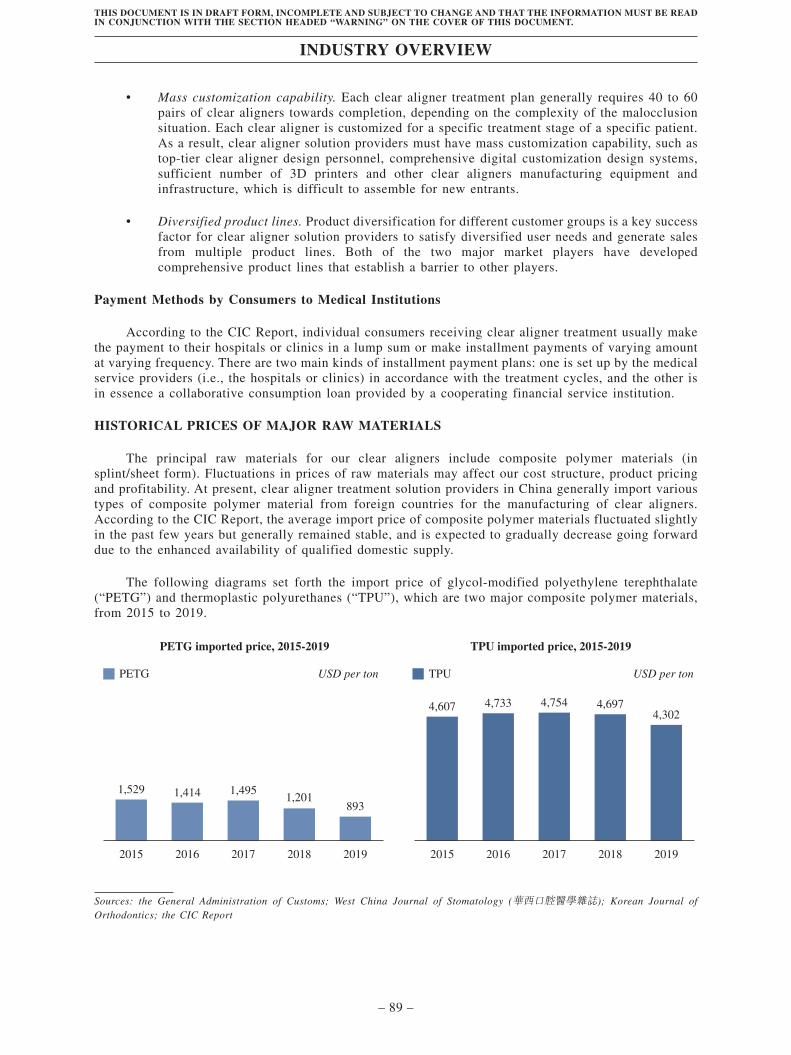
The principal raw materials for our clear aligners include composite polymer materials (insplint/sheet form). Fluctuations in prices of raw materials may affect our cost structure, product pricingand profitability. At present, clear aligner treatment solution providers in China generally import varioustypes of composite polymer material from foreign countries for the manufacturing of clear aligners.According to the CIC Report, the average import price of composite polymer materials fluctuated slightlyin the past few years but generally remained stable, and is expected to gradually decrease going forwarddue to the enhanced availability of qualified domestic supply.
The following diagrams set forth the import price of glycol-modified polyethylene terephthalate(“PETG”) and thermoplastic polyurethanes (“TPU”), which are two major composite polymer materials,from 2015 to 2019.
1,529 1,414 1,4951,201
893
2015 2016 2017 2018 2019
4,607
PETG USD per ton USD per tonTPU
4,733 4,754 4,6974,302
2015 2016 2017 2018 2019
PETG imported price, 2015-2019 TPU imported price, 2015-2019
Sources: the General Administration of Customs; West China Journal of Stomatology (華西口腔醫學雜誌); Korean Journal ofOrthodontics; the CIC Report
INDUSTRY OVERVIEW
– 89 –
THIS DOCUMENT IS IN DRAFT FORM, INCOMPLETE AND SUBJECT TO CHANGE AND THAT THE INFORMATION MUST BE READIN CONJUNCTION WITH THE SECTION HEADED “WARNING” ON THE COVER OF THIS DOCUMENT.