
Listing Document - :: HKEX :: HKEXnews ::
609
-
Upload
khangminh22 -
Category
Documents
-
view
0 -
download
0
Transcript of Listing Document - :: HKEX :: HKEXnews ::


If you are in any doubt about any of the contents of this prospectus, you should obtain independent professional advice.
Chervon Holdings Limited泉峰控股有限公司
(Incorporated in Hong Kong with limited liability)
GLOBAL OFFERING
Number of Offer Shares underthe Global Offering
: 71,916,000 Shares (subject to the Over-allotment Option)
Number of Hong Kong Offer Shares : 7,191,600 Shares (subject to reallocation)Number of International Offer Shares : 64,724,400 Shares (subject to reallocation and
the Over-allotment Option)Maximum Offer Price : HK$43.60 per Offer Share, plus brokerage of
1.0%, SFC transaction levy of 0.0027% andStock Exchange trading fee of 0.005%(payable in full on application in HongKong dollars and subject to refund)
Stock code : 2285
Joint Sponsors, Joint Global Coordinators, Joint Bookrunners and Joint Lead Managers
Other Joint Global Coordinator, Joint Bookrunner and Joint Lead Manager
Other Joint Bookrunners and Joint Lead Managers
Hong Kong Exchanges and Clearing Limited, The Stock Exchange of Hong Kong Limited and Hong Kong Securities Clearing Company Limited take no responsibilityfor the contents of this prospectus, make no representation as to its accuracy or completeness and expressly disclaim any liability whatsoever for any loss howsoeverarising from or in reliance upon the whole or any part of the contents of this prospectus.
A copy of this prospectus, having attached thereto the documents specified in “Documents Delivered to the Registrar of Companies and Documents on Display – 1.Documents Delivered to the Registrar of Companies” in Appendix V to this prospectus, has been registered by the Registrar of Companies in Hong Kong as requiredby Section 38D of the Companies (Winding Up and Miscellaneous Provisions) Ordinance (Chapter 32 of the Laws of Hong Kong). The Securities and Futures Commissionof Hong Kong and the Registrar of Companies in Hong Kong take no responsibility for the contents of this prospectus or any of the other documents referred to above.
The Offer Price is expected to be determined by agreement between the Joint Representatives (for themselves and on behalf of the Hong Kong Underwriters) and ourCompany on or about Wednesday, December 22, 2021 and, in any event, not later than Thursday, December 23, 2021. The Offer Price will be not more than HK$43.60per Offer Share and is currently expected to be not less than HK$37.60 per Offer Share. If, for any reason, the Offer Price is not agreed by Thursday, December 23, 2021(Hong Kong time) among the Joint Representatives (for themselves and on behalf of the Hong Kong Underwriters) and our Company, the Global Offering will not proceedand will lapse.
The Joint Representatives may, with our consent, reduce the number of Offer Shares being offered under the Global Offering and/or the indicative Offer Pricerange below that stated in this prospectus at any time on or prior to the morning of the last day for lodging applications under the Hong Kong Public Offering.In such a case, an announcement will be published on the website of our Company at https://global.chervongroup.com and on the website of the Stock Exchangeat www.hkexnews.hk not later than the morning of the day which is the last day for lodging applications under the Hong Kong Public Offering.
Prior to making an investment decision, prospective investors should consider carefully all of the information set out in this prospectus, including the risk factors setout in the section headed “Risk Factors” in this prospectus. The obligations of the Hong Kong Underwriters under the Hong Kong Underwriting Agreement to subscribefor, and to procure subscribers for, the Hong Kong Offer Shares, are subject to termination by the Joint Representatives if certain events shall occur prior to 8:00 a.m.on Thursday, December 30, 2021 (Hong Kong time). Such grounds are set out in the section headed “Underwriting – Underwriting Arrangements and Expenses – HongKong Public Offering – Grounds for Termination” in this prospectus. It is important that you refer to that section for further details.
The Offer Shares have not been and will not be registered under the U.S. Securities Act or any state securities law in the United States and may not be offered, sold,pledged or transferred within the United States, or to, or for the account or benefit of U.S. persons (as defined in Regulation S) except in transactions exempt from, ornot subject to the registration requirements of the U.S. Securities Act. The Offer Shares are being offered and sold (i) solely to QIBs as defined in Rule 144A pursuantto an exemption from registration under the U.S. Securities Act and (ii) outside the United States in offshore transactions in accordance with Regulation S.
ATTENTION
We have adopted a fully electronic application process for the Hong Kong Public Offering. We will not provide printed copies of this prospectus or printedcopies of any application forms to the public in relation to the Hong Kong Public Offering.
This prospectus is available at the website of the Stock Exchange at www.hkexnews.hk and our website at https://global.chervongroup.com. If you requirea printed copy of this prospectus, you may download and print from the website addresses above.
IMPORTANT
December 17, 2021
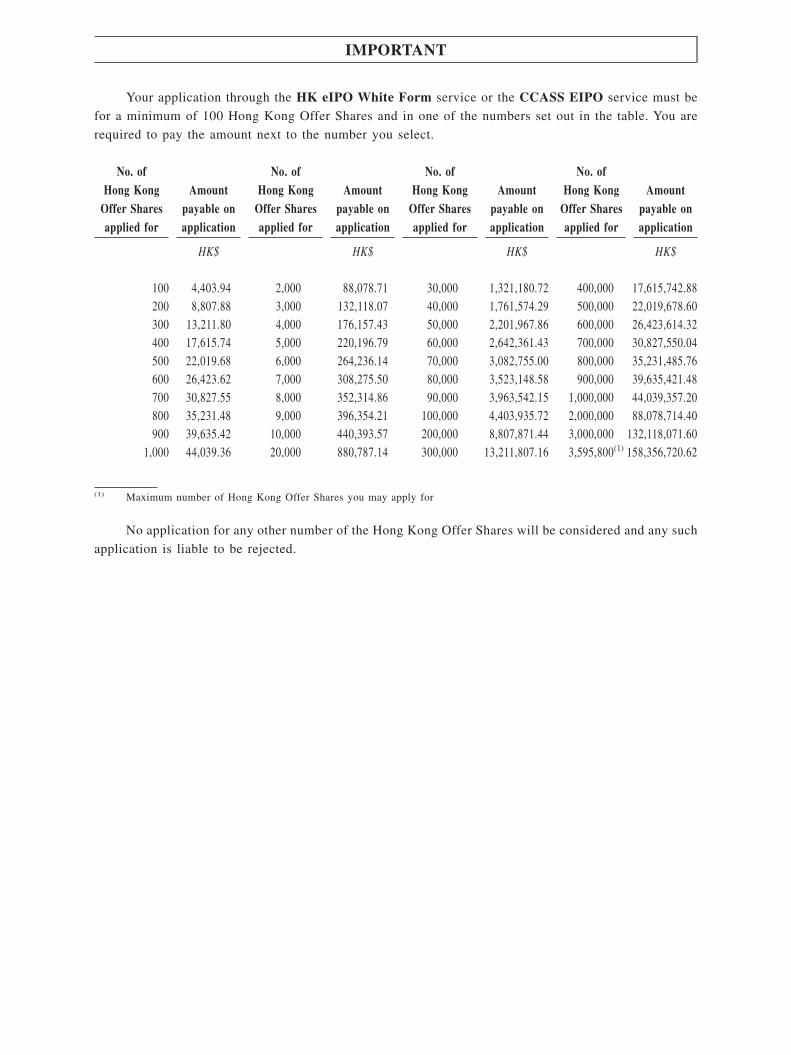
Your application through the HK eIPO White Form service or the CCASS EIPO service must be
for a minimum of 100 Hong Kong Offer Shares and in one of the numbers set out in the table. You are
required to pay the amount next to the number you select.
No. ofHong Kong
Offer Sharesapplied for
Amountpayable onapplication
No. ofHong Kong
Offer Sharesapplied for
Amountpayable onapplication
No. ofHong Kong
Offer Sharesapplied for
Amountpayable onapplication
No. ofHong Kong
Offer Sharesapplied for
Amountpayable onapplication
HK$ HK$ HK$ HK$
100 4,403.94 2,000 88,078.71 30,000 1,321,180.72 400,000 17,615,742.88200 8,807.88 3,000 132,118.07 40,000 1,761,574.29 500,000 22,019,678.60300 13,211.80 4,000 176,157.43 50,000 2,201,967.86 600,000 26,423,614.32400 17,615.74 5,000 220,196.79 60,000 2,642,361.43 700,000 30,827,550.04500 22,019.68 6,000 264,236.14 70,000 3,082,755.00 800,000 35,231,485.76600 26,423.62 7,000 308,275.50 80,000 3,523,148.58 900,000 39,635,421.48700 30,827.55 8,000 352,314.86 90,000 3,963,542.15 1,000,000 44,039,357.20800 35,231.48 9,000 396,354.21 100,000 4,403,935.72 2,000,000 88,078,714.40900 39,635.42 10,000 440,393.57 200,000 8,807,871.44 3,000,000 132,118,071.60
1,000 44,039.36 20,000 880,787.14 300,000 13,211,807.16 3,595,800(1) 158,356,720.62
(1) Maximum number of Hong Kong Offer Shares you may apply for
No application for any other number of the Hong Kong Offer Shares will be considered and any such
application is liable to be rejected.
IMPORTANT

Hong Kong Public Offering commences . . . . . . . . . . . . . . . .9:00 a.m. on Friday, December 17, 2021
Latest time for completing electronic applications underHK eIPO White Form service through one of the below ways:(2)
(1) the IPO App, which can be downloaded bysearching “IPO App” in App Store or Google Play ordownloaded at www.hkeipo.hk/IPOApp orwww.tricorglobal.com/IPOApp
(2) the designated website at www.hkeipo.hk . . . . . . . 11:30 a.m. on Wednesday, December 22, 2021
Application lists open(3) . . . . . . . . . . . . . . . . . . . . . . . .11:45 a.m. on Wednesday, December 22, 2021
Latest time for (a) completing payment for the HK eIPOWhite Form applications by effecting internet bankingtransfer(s) or PPS payment transfer(s) and (b) givingelectronic application instructions to HKSCC(4) . . .12:00 noon on Wednesday, December 22, 2021
Application lists close(3) . . . . . . . . . . . . . . . . . . . . . . .12:00 noon on Wednesday, December 22, 2021
Expected Price Determination Date(5) . . . . . . . . . . . . . . . . . . . . . . . . .Wednesday, December 22, 2021
Announcement of the Offer Price, the level of indicationsof interest in the International Offering, the level ofapplications in the Hong Kong Public Offering and thebasis of allocation of the Hong Kong Offer Sharesto be published on the website of the Stock Exchange atwww.hkexnews.hk and on the website of our Company athttps://global.chervongroup.com(6) on or before(10) . . . . . . . . . . . .Wednesday, December 29, 2021
Results of allocations in the Hong Kong Public Offering(with successful applicants’ identification document numbers,where appropriate) to be available through a variety ofchannels as described in the section headed “How to Applyfor Hong Kong Offer Shares – (D) Publication of Results”in this prospectus(10) . . . . . . . . . . . . . . . . . . . . . . . . . . . . . . . . . . . .Wednesday, December 29, 2021
Results of allocations in the Hong Kong Public Offeringwill be available at the “IPO Results” functionin the IPO App or at www.hkeipo.hk/IPOResult (orwww.tricor.com.hk/ipo/result) with a “search by ID”function from(10) . . . . . . . . . . . . . . . . . . . . . . . . . . . . . . . . . . . . . .Wednesday, December 29, 2021
Despatch/collection of Share certificates or deposit of the
Share certificates into CCASS in respect of wholly or
partially successful applications pursuant to the Hong Kong
Public Offering on or before(7)(9)(10) . . . . . . . . . . . . . . . . . . . . . . . .Wednesday, December 29, 2021
EXPECTED TIMETABLE
– i –

Despatch/collection of refund cheques and HK eIPO White Forme-Auto Refund payment instructions in respect of wholly or partially
successful applications (if applicable) or wholly or partially
unsuccessful applications pursuant to the Hong Kong Public
Offering on or before(8)(9)(10) . . . . . . . . . . . . . . . . . . . . . . . . . . . . .Wednesday, December 29, 2021
Dealings in the Shares on the Stock Exchange expected
to commence(10) . . . . . . . . . . . . . . . . . . . . . . . . . . . .at 9:00 a.m. on Thursday, December 30, 2021
Notes:
(1) All times refer to Hong Kong local time, except as otherwise stated.
(2) You will not be permitted to submit your application under the HK eIPO White Form service through the IPO App or thedesignated website at www.hkeipo.hk after 11:30 a.m. on the last day for submitting applications. If you have alreadysubmitted your application and obtained a payment reference number from the IPO App or the designated website prior to11:30 a.m., you will be permitted to continue the application process (by completing payment of the application monies) until12:00 noon on the last day for submitting applications, when the application lists close.
(3) If there is a tropical cyclone warning signal number 8 or above or a “black” rainstorm warning in force in Hong Kong at anytime between 9:00 a.m. and 12:00 noon on Wednesday, December 22, 2021, the application lists will not open or close on thatday. See the section headed “How to Apply for Hong Kong Offer Shares – (C) Effect of Bad Weather and/or ExtremeConditions on the Opening and Closing of the Application Lists” in this prospectus for more details.
(4) Applicants who apply for Hong Kong Offer Shares by giving electronic application instructions to HKSCC via CCASSshould refer to the section headed “How to Apply for Hong Kong Offer Shares – (A) Application for Hong Kong Offer Shares– 6. Applying Through the CCASS EIPO Service” in this prospectus.
(5) The Price Determination Date is expected to be on or around Wednesday, December 22, 2021 and, in any event, not later thanThursday, December 23, 2021. If, for any reason, the Offer Price is not agreed between the Joint Representatives (forthemselves and on behalf of the Hong Kong Underwriters) and us by Thursday, December 23, 2021, the Global Offering willnot proceed and will lapse.
(6) None of the website or any of the information contained on the website forms part of this prospectus.
(7) Share certificates will only become valid at 8:00 a.m. on the Listing Date provided that the Global Offering has becomeunconditional and the right of termination described in the section headed “Underwriting – Underwriting Arrangements andExpenses – Hong Kong Public Offering – Grounds for Termination” in this prospectus has not been exercised. Investors whotrade Shares prior to the receipt of Share certificates or the Share certificates becoming valid do so at their own risk.
(8) e-Auto Refund payment instructions/refund cheques will be issued in respect of wholly or partially unsuccessful applicationspursuant to the Hong Kong Public Offering and also in respect of wholly or partially successful applications in the event thatthe final Offer Price is less than the price payable per Offer Share on application.
EXPECTED TIMETABLE
– ii –
(9) Applicants who have applied for Hong Kong Offer Shares through CCASS EIPO service should refer to the section headed“How to Apply for Hong Kong Offer Shares – (G) Dispatch/Collection of Share Certificates and Refund Monies – PersonalCollection – (b) If you apply through the CCASS EIPO service” in this prospectus for details.
Applicants who have applied through the HK eIPO White Form service and paid their applications monies through singlebank accounts may have refund monies (if any) despatched to the bank account in the form of e-Auto Refund paymentinstructions. Applicants who have applied through the HK eIPO White Form service and paid their application moniesthrough multiple bank accounts may have refund monies (if any) despatched to the address as specified in their applicationinstructions in the form of refund cheques by ordinary post at their own risk.
Further information is set out in the sections headed “How to Apply for Hong Kong Offer Shares – (F) Refund of ApplicationMonies” and “How to Apply for Hong Kong Offer Shares – (G) Dispatch/Collection of Share Certificates and Refund Monies”in this prospectus.
(10) In case a typhoon warning signal no. 8 or above, a black rainstorm warning signal and/or Extreme Conditions is/are in forcein any days between Friday, December 17, 2021 to Thursday, December 30, 2021, then the day of (i) announcement of resultsof allocations in the Hong Kong Public Offering; (ii) despatch of Share certificates and refund cheques/HK eIPO White Forme-Auto Refund payment instructions; and (iii) dealings in the Shares on the Stock Exchange may be postponed and anannouncement may be made in such event.
The above expected timetable is a summary only. You should refer to the sections headed“Structure of the Global Offering” and “How to Apply for Hong Kong Offer Shares” in this prospectusfor details of the structure of the Global Offering, including the conditions of the Global Offering,and the procedures for application for the Hong Kong Offer Shares.
If the Global Offering does not become unconditional or is terminated in accordance with itsterms, the Global Offering will not proceed. In such case, our Company will make an announcementas soon as practicable thereafter.
EXPECTED TIMETABLE
– iii –

IMPORTANT NOTICE TO INVESTORS
This prospectus is issued by Chervon Holdings Limited solely in connection with the Hong KongPublic Offering and the Hong Kong Offer Shares and does not constitute an offer to sell or asolicitation of an offer to buy any security other than the Hong Kong Offer Shares offered by thisprospectus pursuant to the Hong Kong Public Offering. This prospectus may not be used for thepurpose of, and does not constitute, an offer or invitation in any other jurisdiction or in any othercircumstances. No action has been taken to permit a public offering of the Offer Shares in anyjurisdiction other than Hong Kong and no action has been taken to permit the distribution of thisprospectus in any jurisdiction other than Hong Kong. The distribution of this prospectus and theoffering of the Offer Shares in other jurisdictions are subject to restrictions and may not be madeexcept as permitted under the applicable securities laws of such jurisdictions pursuant to registrationwith or authorization by the relevant securities regulatory authorities or an exemption therefrom.
You should rely only on the information contained in this prospectus to make your investmentdecision. We have not authorized anyone to provide you with information that is different from whatis contained in this prospectus. Any information or representation not made in this prospectus mustnot be relied on by you as having been authorized by us, the Joint Sponsors, the Joint Representatives,the Joint Global Coordinators, the Joint Bookrunners, the Joint Lead Managers and theUnderwriters, any of our or their respective directors or any other person or party involved in theGlobal Offering.
Page
Expected Timetable . . . . . . . . . . . . . . . . . . . . . . . . . . . . . . . . . . . . . . . . . . . . . . . . . . . . . . iContents . . . . . . . . . . . . . . . . . . . . . . . . . . . . . . . . . . . . . . . . . . . . . . . . . . . . . . . . . . . . . . ivSummary . . . . . . . . . . . . . . . . . . . . . . . . . . . . . . . . . . . . . . . . . . . . . . . . . . . . . . . . . . . . . . 1Definitions . . . . . . . . . . . . . . . . . . . . . . . . . . . . . . . . . . . . . . . . . . . . . . . . . . . . . . . . . . . . . 24Glossary of Technical Terms . . . . . . . . . . . . . . . . . . . . . . . . . . . . . . . . . . . . . . . . . . . . . . . 33Forward-looking Statements . . . . . . . . . . . . . . . . . . . . . . . . . . . . . . . . . . . . . . . . . . . . . . . 36Risk Factors . . . . . . . . . . . . . . . . . . . . . . . . . . . . . . . . . . . . . . . . . . . . . . . . . . . . . . . . . . . 38Waivers from Strict Compliance with the Listing Rules . . . . . . . . . . . . . . . . . . . . . . . . . . . 87Information about this Prospectus and the Global Offering . . . . . . . . . . . . . . . . . . . . . . . . 91Directors and Parties Involved in the Global Offering . . . . . . . . . . . . . . . . . . . . . . . . . . . . 95Corporate Information . . . . . . . . . . . . . . . . . . . . . . . . . . . . . . . . . . . . . . . . . . . . . . . . . . . . 100Industry Overview . . . . . . . . . . . . . . . . . . . . . . . . . . . . . . . . . . . . . . . . . . . . . . . . . . . . . . . 102Regulatory Overview . . . . . . . . . . . . . . . . . . . . . . . . . . . . . . . . . . . . . . . . . . . . . . . . . . . . . 120History, Reorganization and Corporate Structure . . . . . . . . . . . . . . . . . . . . . . . . . . . . . . . 153Business . . . . . . . . . . . . . . . . . . . . . . . . . . . . . . . . . . . . . . . . . . . . . . . . . . . . . . . . . . . . . . . 169Relationship with our Controlling Shareholders . . . . . . . . . . . . . . . . . . . . . . . . . . . . . . . . 274Connected Transactions . . . . . . . . . . . . . . . . . . . . . . . . . . . . . . . . . . . . . . . . . . . . . . . . . . . 280Directors and Senior Management . . . . . . . . . . . . . . . . . . . . . . . . . . . . . . . . . . . . . . . . . . . 295Substantial Shareholders . . . . . . . . . . . . . . . . . . . . . . . . . . . . . . . . . . . . . . . . . . . . . . . . . . 309Cornerstone Investors . . . . . . . . . . . . . . . . . . . . . . . . . . . . . . . . . . . . . . . . . . . . . . . . . . . . . 311Share Capital . . . . . . . . . . . . . . . . . . . . . . . . . . . . . . . . . . . . . . . . . . . . . . . . . . . . . . . . . . . 318Financial Information . . . . . . . . . . . . . . . . . . . . . . . . . . . . . . . . . . . . . . . . . . . . . . . . . . . . 319Future Plans and Use of Proceeds . . . . . . . . . . . . . . . . . . . . . . . . . . . . . . . . . . . . . . . . . . . 383Underwriting . . . . . . . . . . . . . . . . . . . . . . . . . . . . . . . . . . . . . . . . . . . . . . . . . . . . . . . . . . . 387Structure of the Global Offering . . . . . . . . . . . . . . . . . . . . . . . . . . . . . . . . . . . . . . . . . . . . 399How to Apply for Hong Kong Offer Shares . . . . . . . . . . . . . . . . . . . . . . . . . . . . . . . . . . . . 409
CONTENTS
– iv –

Page
Appendix I – Accountants’ Report . . . . . . . . . . . . . . . . . . . . . . . . . . . . . . . . . . . I-1Appendix II – Unaudited Pro Forma Financial Information . . . . . . . . . . . . . . . . . II-1Appendix III – Summary of Articles of Association . . . . . . . . . . . . . . . . . . . . . . . . . III-1Appendix IV – Statutory and General Information . . . . . . . . . . . . . . . . . . . . . . . . IV-1Appendix V – Documents Delivered to the Registrar of Companies and
Documents on Display . . . . . . . . . . . . . . . . . . . . . . . . . . . . . . . . V-1
CONTENTS
– v –
This summary aims to give you an overview of the information contained in this prospectus. As
it is a summary, it does not contain all the information that may be important to you and is qualified
in its entirety by, and should be read in conjunction with, the full text of this prospectus. You should
read the whole document before you decide to invest in the Offer Shares. There are risks associated
with any investment. Some of the particular risks in investing in the Offer Shares are set forth in the
section headed “Risk Factors” in this prospectus. You should read that section carefully before you
decide to invest in the Offer Shares.
WHO WE ARE
We are a global provider of power tools and outdoor power equipment (“OPE”). Our focus on
innovation, especially lithium-ion battery system technology, has enabled us to achieve significant scale
and rapid growth. According to the Frost & Sullivan Report, in 2020, we ranked the 13th and accounted
for approximately 1.9% of the combined global power tool and OPE markets by revenue. We also ranked
the 9th and accounted for approximately 1.7% of the global power tool market, and ranked the 10th and
accounted for approximately 2.1% of the global OPE market, in each case by revenue, according to the
same report. In 2020, the global electric power tools market accounted for 74.1% of the global power tools
market, and the global electric OPE market accounted for 18.6% of the global OPE market, according to
the Frost & Sullivan Report. Our global ranking by revenue for electric power tools rose from the 9th in
2018 to the 7th in 2020, and our global ranking by revenue for electric OPE rose quickly from the 7th in
2018 to the 2nd in 2020, according to the same source. From 2018 to 2020, our revenue from power tools
grew by a CAGR of 16.9%, and our revenue from OPE grew by a CAGR of 62.8%. Please refer to the
section headed “Industry Overview” of this document for further descriptions of the methodology and
assumptions used in calculating market shares by revenue.
Our research and development capabilities have enabled us to seize market opportunities amidst a
period of growth and rapid transformation within our industry, particularly with respect to the
lithium-ion/cordless market segment. Our revenue from the lithium-ion battery powered products grew
from US$347.3 million in 2018 to US$827.3 million in 2020, representing a CAGR of 54.3%. According
to the Frost & Sullivan Report, end users have shown increasing preference for lithium-ion battery power
tools and OPE, due to benefits such as enhanced user experience, cost-efficiency and environmental
friendliness, while delivering power and performance that can rival traditional products. According to the
Frost & Sullivan Report, from 2020 to 2025, the global cordless power tool market is projected to grow
at a CAGR of 9.9% and the global cordless OPE market is projected to grow at a CAGR of 9.0%. Having
recognized the transformative impact of lithium-ion batteries and related technologies, we focused on this
industry segment and became one of the first businesses in the world to commercialize lithium-ion battery
power tools in 2006 and high-voltage OPE products in 2014.
SUMMARY
– 1 –

According to the Frost & Sullivan Report, power tools can be broadly defined as the type of toolsthat operate with additional power and mechanism other than purely manual labor. Examples includescrewdrivers, drills, saws, sanders, miter saws and grinders, among others. According to the same source,OPE products can be broadly defined as tools or equipment that are primarily used for lawn, garden or yardmaintenance. Examples include lawn mowers, leaf blowers, snow blowers and trimmers, among others.Please refer to the section headed “Business – Our Products” of this prospectus for further details.
OUR PRODUCTS AND BRANDS
We offer a comprehensive range of products under a portfolio of well-recognized brands, which aretailored to address the diverse needs of our end users around the world. Our power tools target bothindustrial/professional and consumer end users, and our OPE products target both premium andmass-market end users. We currently own five differentiated and well-recognized brands that cover keygeographies and segments, namely EGO, FLEX, SKIL, DEVON and X-TRON. In particular, our EGO brandhas gained strong recognition in the global electric OPE market since its establishment in 2013.
The pictures below illustrate our brands and some of our main products.
Brand Primary products
No. 3 in the global electricOPE market(1)
SUMMARY
– 2 –

Brand Primary products
A premium professionalpower tool brand forindustrial/professionalmarkets with Germanorigin from 1922
A globally recognizedheritage brand from theUnited States dating backto 1924, now providing afull assortment of powertools and OPE products forglobal consumer markets
A high-end, professionalpower tool brand designedfor greater China and otheremerging markets
A robust, durable andaffordable brand for Chinamarket in construction andhome improvementapplications
Note:
(1) EGO ranks No. 3 in the global electric OPE market by revenue in 2020 according to the Frost & Sullivan Report.
Our brand strategy seeks to provide comprehensive coverage and avoid overlap between market
segments, based on different brand positioning, product categories, targeted customers, pricing and
geographic focus. We also conduct annual product roadmap planning and routine new product reviews to
avoid duplication of products across brands. Please refer to the section headed “Business – Our Proprietary
Brands” for further details.
SUMMARY
– 3 –
OUR BUSINESS MODEL
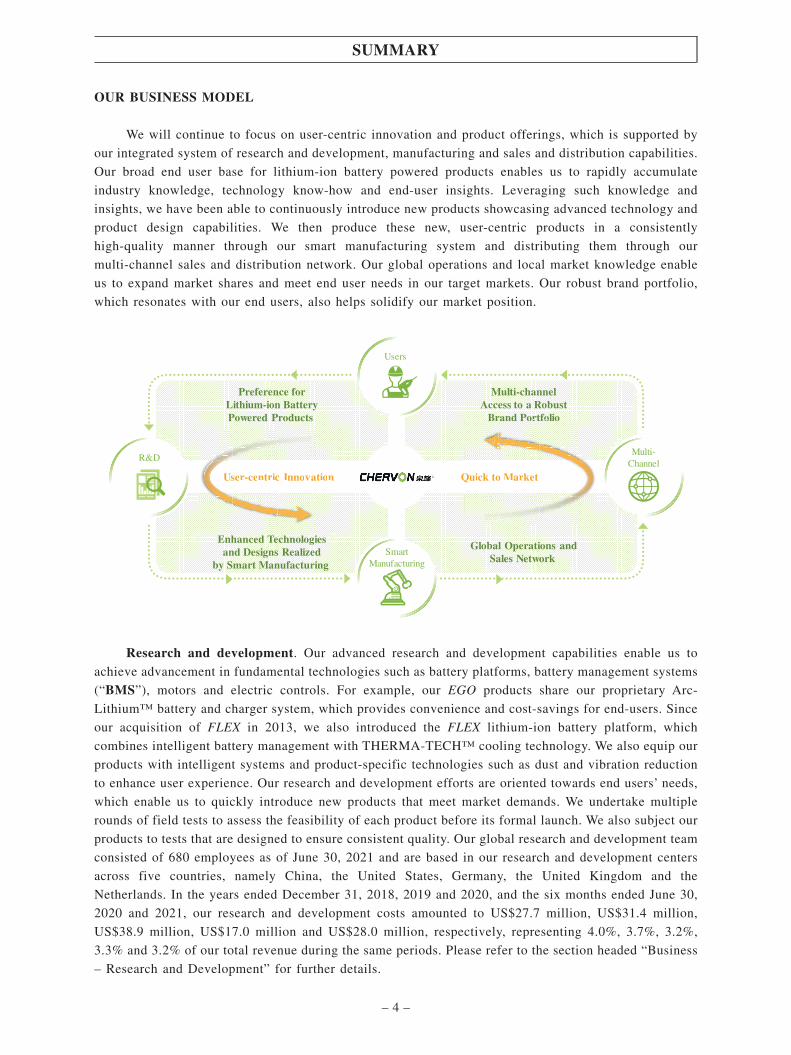
We will continue to focus on user-centric innovation and product offerings, which is supported by
our integrated system of research and development, manufacturing and sales and distribution capabilities.
Our broad end user base for lithium-ion battery powered products enables us to rapidly accumulate
industry knowledge, technology know-how and end-user insights. Leveraging such knowledge and
insights, we have been able to continuously introduce new products showcasing advanced technology and
product design capabilities. We then produce these new, user-centric products in a consistently
high-quality manner through our smart manufacturing system and distributing them through our
multi-channel sales and distribution network. Our global operations and local market knowledge enable
us to expand market shares and meet end user needs in our target markets. Our robust brand portfolio,
which resonates with our end users, also helps solidify our market position.
SmartManufacturing
Multi-Channel
Users
R&D
User-centric Innovation
Enhanced Technologiesand Designs Realized
by Smart Manufacturing
Preference forLithium-ion BatteryPowered Products
Multi-channelAccess to a Robust
Brand Portfolio
Global Operations andSales Network
Quick to Market UseUU r-centric Innovation
BBrraanndd PPoorrttffooff liioo
Quick to Market
Research and development. Our advanced research and development capabilities enable us to
achieve advancement in fundamental technologies such as battery platforms, battery management systems
(“BMS”), motors and electric controls. For example, our EGO products share our proprietary Arc-
Lithium™ battery and charger system, which provides convenience and cost-savings for end-users. Since
our acquisition of FLEX in 2013, we also introduced the FLEX lithium-ion battery platform, which
combines intelligent battery management with THERMA-TECH™ cooling technology. We also equip our
products with intelligent systems and product-specific technologies such as dust and vibration reduction
to enhance user experience. Our research and development efforts are oriented towards end users’ needs,
which enable us to quickly introduce new products that meet market demands. We undertake multiple
rounds of field tests to assess the feasibility of each product before its formal launch. We also subject our
products to tests that are designed to ensure consistent quality. Our global research and development team
consisted of 680 employees as of June 30, 2021 and are based in our research and development centers
across five countries, namely China, the United States, Germany, the United Kingdom and the
Netherlands. In the years ended December 31, 2018, 2019 and 2020, and the six months ended June 30,
2020 and 2021, our research and development costs amounted to US$27.7 million, US$31.4 million,
US$38.9 million, US$17.0 million and US$28.0 million, respectively, representing 4.0%, 3.7%, 3.2%,
3.3% and 3.2% of our total revenue during the same periods. Please refer to the section headed “Business
– Research and Development” for further details.
SUMMARY
– 4 –

Multi-channel sales and distribution. We have established, and will continue to expand, a global
multi-channel sales and distribution network that offers us effective touchpoints for end users across key
markets, including North America, Europe and Asia. We collaborate with leading home centers and mass
market retailers, while also partnering with qualified distributors and local retailers to diversify our sales
channels and promote brand recognition. Retailers are those that purchase products from us and typically
sell them directly to end-users. By contrast, distributors purchase products from us and distribute them to
other third parties, which may consist of other retailers or sub-distributors, who then on-sell the products
to end-users. During the Track Record Period, our products were sold to customers in more than 100
countries and regions. We have achieved substantial penetration of professional distributor networks for
both electric power tools and OPE on a global scale. We have also established online sales channels for
our products by collaborating with e-commerce platforms and operating our own e-stores. In addition, we
design and manufacture products for certain home centers and mass market retailers, such as Lowe’s,
Walmart and Kingfisher, and international tool companies on an original design manufacturing (“ODM”)
basis.
Smart manufacturing. We have focused on building competitive advantages by advancing our
manufacturing technologies and production management capabilities over the past 20 years. We have made
long-term investments in a vertically integrated manufacturing system, which enables us to incorporate
new technologies into core product components such as battery packs, motors and electric control circuits.
With respect to product assembly, we have focused on promoting the application of industrial engineering
and quality control technologies in our assembly lines. Our highly automated, module-based production
lines enable us to fulfill high-mix and low-volume orders by quickly switching among different product
specifications and customer order requirements. With respect to production management, we have
significantly improved the level of automation and transparency in our logistics system by horizontally
integrating our information technology systems. Meanwhile, we leverage our integrated supply chain
management system to source certain raw materials, parts and components from qualified suppliers in
order to maintain high quality standards.
OUR PRODUCTION FACILITIES
As of the Latest Practicable Date, we had production facilities with an annual production capacity
of more than 22 million units, covering an aggregate floor area of approximately 183,000 sq.m. During
the Track Record Period, we operated four production facilities, namely Nanjing, China-based CHERVON
Industrial Park (德朔工業園) and CHERVON Green Power Industrial Park (泉峰新能源工業園), as well as
FLEX Germany Plant and CHERVON Vietnam Plant. The production facilities house 120 production lines
in total and have an aggregate designed annual production capacity of more than 16.8 million units, which
offers us the scale needed to maintain stable supply to our key markets. In 2018, 2019, 2020 and the six
months ended June 30, 2021, the total utilization rates of these production facilities were 96%, 90%, 91%
and 92%, respectively. During the Track Record Period, the designed production capacity at our
production facilities increased primarily due to our investments in purchasing additional machines and
equipment. To meet increasing market demand, we have also converted three leased properties into
production facilities in the third quarter of 2021, which collectively provide additional annual production
capacity of approximately 5.3 million units. For further details, please refer to the section headed
“Business – Production – Existing Production Facilities” in this prospectus.
SUMMARY
– 5 –
PRICING STRATEGIES
We price our products for external sales based on a number of factors, including costs of raw
materials and production, prevailing market conditions and specification of products. Our pricing is also
affected by the global and domestic economic environment, demand for our products and market
competition in the power tool and OPE industries. Our pricing strategy also takes into consideration the
need for maintaining the premium status of our brands and stabilizing the prices of our products
throughout their life cycles.
OUR CUSTOMERS AND SUPPLIERS
Our customers primarily include retailers, distributors, e-commerce platforms and tool companies.
During the Track Record Period, our top customers were primarily retailers with nationwide presence and
ODM customers. In the years ended December 31, 2018, 2019 and 2020, and the six months ended June
30, 2021, revenue from our top five customers accounted for 51.7%, 56.8%, 64.8% and 64.4% of our total
revenue for the respective periods, and revenue from our largest customer in each period during the Track
Record Period accounted for 22.9%, 20.9%, 29.0%, and 39.6% of our total revenue for the respective
periods. As of June 30, 2021, we had maintained business relationships with our five largest customers for
three to more than 15 years.
During the Track Record Period, our top suppliers were primarily providers of battery cells,
electronics parts and components and logistics and warehouse services. In the years ended December 31,
2018, 2019 and 2020, and the six months ended June 30, 2021, purchases from our largest five suppliers
in aggregate accounted for 18.2%, 19.7%, 24.8% and 20.6% of our total purchases for the respective
periods, and purchases from our largest supplier in each period during the Track Record Period accounted
for 10.9%, 11.9%, 16.1% and 12.6% of our total purchases for the respective periods. Our key suppliers
are primarily located in China, Korea, Germany and the United States. As of June 30, 2021, we had
maintained business relationships with our five largest suppliers for five to over ten years. We generally
have the flexibility to seek alternative suppliers for our sourcing needs.
OUR STRENGTHS
We attribute our success to and distinguish ourselves by the following key competitive strengths:
• Leveraging industry transformations, we are a fast-growing provider of power tools and OPE
products.
• We have continuously introduced new products that are grounded in advanced technology and
end-user insights.
• We have a well-recognized brand portfolio, particularly our EGO brand.
• We have established a highly effective multi-channel sales and distribution network with a
growing emphasis on e-commerce channels.
• We have a global team with strategic vision and deep expertise.
SUMMARY
– 6 –

OUR STRATEGIES
We are committed to driving sustainable long-term growth and strengthening our market position inelectric power tool and OPE products through the following strategies:
• Develop and commercialize new products that combine advanced technologies with user-friendly designs;
• Expand our sales and distribution network globally with a growing emphasis on e-commerceplatforms;
• Further enhance market recognition of our brands;
• Continue to expand production capacities and improve operational efficiency; and
• Invest in human capital to enhance marketing and research and development.
SUMMARY OF HISTORICAL FINANCIAL INFORMATION
Consolidated Statements of Profit or Loss
Year Ended December 31,Six months ended
June 30,
2018 2019 2020 2020 2021
US$ % US$ % US$ % US$ % US$ %
(Unaudited)(in thousands, except for percentages and per share data)
Revenue 690,698 100.0 843,578 100.0 1,200,902 100.0 514,359 100.0 868,797 100.0Cost of sales (515,173) (74.6) (588,325) (69.7) (832,190) (69.3) (366,701) (71.3) (617,688) (71.1)
Gross profit 175,525 25.4 255,253 30.3 368,712 30.7 147,658 28.7 251,109 28.9
Other revenue 3,515 0.5 3,838 0.4 5,801 0.5 2,791 0.5 2,081 0.2Other net (loss)/gain (8,192) (1.2) 943 0.1 (3,140) (0.3) (1,647) (0.3) 19,754 2.4Selling anddistribution expenses (100,527) (14.5) (128,083) (15.2) (179,447) (15.0) (73,411) (14.3) (96,418) (11.1)Administrative andother operatingexpenses (45,378) (6.6) (48,932) (5.8) (82,843) (6.9) (25,280) (4.9) (32,614) (3.8)Research anddevelopment costs (27,656) (4.0) (31,356) (3.7) (38,939) (3.2) (16,984) (3.3) (27,967) (3.2)
(Loss)/profit fromoperations (2,713) (0.4) 51,663 6.1 70,144 5.8 33,127 6.4 115,945 13.4
Net finance costs (17,164) (2.5) (19,754) (2.3) (17,357) (1.4) (8,070) (1.5) (7,895) (0.9)Share of profits ofassociates 4,287 0.6 9,206 1.1 6,724 0.6 155 0.0 2,801 0.3Share of profits of ajoint venture 1,176 0.2 1,233 0.1 – – – – – –
(Loss)/profit beforetax (14,414) (2.1) 42,348 5.0 59,511 5.0 25,212 4.9 110,851 12.8
SUMMARY
– 7 –

Year Ended December 31,Six months ended
June 30,
2018 2019 2020 2020 2021
US$ % US$ % US$ % US$ % US$ %
(Unaudited)(in thousands, except for percentages and per share data)
Income taxcredit/(expense) 957 0.1 (6,266) (0.7) (11,123) (1.0) (4,721) (0.9) (19,612) (2.3)
(Loss)/profit for theyear/period (13,457) (2.0) 36,082 4.3 48,388 4.0 20,491 4.0 91,239 10.5
Attributable to:Equity shareholders ofour Company (14,084) (2.1) 33,976 4.0 44,359 3.7 18,062 3.5 86,062 9.9Non-controllinginterest 627 0.1 2,106 0.3 4,029 0.3 2,429 0.5 5,177 0.6
(Loss)/profit for theyear/period (13,457) (2.0) 36,082 4.3 48,388 4.0 20,491 4.0 91,239 10.5
Earnings per shareBasic (US$) (0.04) 0.09 0.11 0.05 0.21Diluted (US$) (0.04) 0.09 0.11 0.05 0.21
Non-HKFRSs Measures
Year ended December 31,Six months
ended June 30,2018 2019 2020 2020 2021
(Unaudited)(In US$ thousands)
(Loss)/profit for the year/period (13,457) 36,082 48,388 20,491 91,239Add:Listing expenses – – 272 – 2,122Equity settled share–based paymentexpenses – – 21,077 – –
Adjusted net (loss)/profit (13,457) 36,082 69,737 20,491 93,361
We derive adjusted net profit from (loss)/profit for the year/period by excluding (i) listing expensesand (ii) equity settled share-based payment expenses.
Year ended December 31,Six months
ended June 30,
2018 2019 2020 2020 2021
Adjusted net (loss)/profit margin (%)(1) (2.0) 4.3 5.8 4.0 10.7
Note:
(1) Equals adjusted net (loss)/profit divided by revenue for the year/period and multiplied by 100%.
SUMMARY
– 8 –

Listing expenses are one-off expenses in relation to the Global Offering. Equity settled share-basedpayment expenses are non-cash and non-operational in nature, and such amount may not directly correlatewith the underlying performance of our business operations. Due to the non-recurring or non-cash natureof the abovementioned items, our management does not track such items as key operating or financialmetrics internally when reviewing our performance since these items do not relate to our daily operation.Therefore, by eliminating the impacts of such items in the calculation of adjusted net profit, this measurecould better reflect our underlying operating performance and could better facilitate the comparison ofoperating performance from year to year.
However, the terms adjusted net profit and adjusted net profit margin are not defined under HKFRSs.Items excluded from adjusted net profit are significant components in understanding and assessing ouroperating and financial performance. In light of the foregoing limitations for this non-HKFRSs measure,when assessing our operating and financial performance, you should not consider adjusted net profit oradjusted net profit margin in isolation or as a substitute for (loss)/profit for the year/period or any otheroperating performance measure that is calculated in accordance with HKFRSs. See the section headed“Financial Information – Non-HKFRSs Measure” in this prospectus.
Our Financial Performance
Our revenue increased from US$690.7 million in the year ended December 31, 2018 to US$1,200.9million in the year ended December 31, 2020, representing a CAGR of 31.9%. Such robust growth wasprimarily due to our ability to (i) continuously introduce new products with a strategic focus onlithium-ion battery powered products, (ii) establish premium brands such as EGO and FLEX, and (iii)build strategic partnerships with leading national retailers, qualified distributors and large e-commerceplatforms, particularly in the North America market. Our revenue increased by 68.9% from US$514.4million for the six months ended June 30, 2020 to US$868.8 million for the same period in 2021. Thesignificant growth in our total revenue during this period was primarily due to increased sales of EGO,FLEX and SKIL products in partnership with our major customers and growth in our ODM business. Oursales volumes and average selling prices have both increased during the Track Record Period. For theyears ended December 31, 2018, 2019 and 2020 and the six months ended June 30, 2020 and 2021, oursales volumes were 12.6 million, 12.7 million, 13.7 million, 5.8 million and 9.3 million, respectively. Forthe same years/periods, our average selling prices were US$54.87, US$66.13, US$87.62, US$88.39 andUS$93.71, respectively. Please refer to the sections headed “Business – Ours Products – RevenueBreakdown” and “Financial Information – Principal Components of Consolidated Statements of Profit orLoss – Revenue” for additional details regarding the breakdowns of revenue, gross profits, gross profitmargins, average selling prices and sales volumes.
In 2018, 2019 and 2020 and the six months ended June 30, 2020 and 2021, our gross profit wasUS$175.5 million, US$255.3 million, US$368.7 million, US$147.7 million and US$251.1 million,respectively.
In the years ended December 31, 2018, 2019 and 2020 and the six months ended June 30, 2020 and2021, our cost of sales amounted to US$515.2 million, US$588.3 million, US$832.2 million, US$366.7million and US$617.7 million, respectively, and represented 74.6%, 69.7%, 69.3%, 71.3% and 71.1% ofour revenue for the same years or periods, respectively. From the year ended December 31, 2018 to theyear ended December 31, 2020, and from the six months ended June 30, 2020 to the same period in 2021,our cost of sales declined as a percentage of revenue due to the rapid increase in sales and economies ofscale.
In the years ended December 31, 2018, 2019 and 2020, and the six months ended June 30, 2020 and2021, our research and development costs amounted to US$27.7 million, US$31.4 million, US$38.9million, US$17.0 million and US$28.0 million, respectively, representing 4.0%, 3.7%, 3.2%, 3.3% and3.2% of our revenue during the same periods.
SUMMARY
– 9 –

In the years ended December 31, 2018, 2019 and 2020, and the six months ended June 30, 2020 and2021, our selling and distribution expenses amounted to US$100.5 million, US$128.1 million, US$179.4million, US$73.4 million and US$96.4 million, respectively, representing 14.5%, 15.2%, 15.0%, 14.3%and 11.1% of our revenue during the same periods.
In the years ended December 31, 2018, 2019 and 2020, and the six months ended June 30, 2020 and2021, our administrative and other operating expenses amounted to US$45.4 million, US$48.9 million,US$82.8 million, US$25.3 million and US$32.6 million, respectively, representing 6.6%, 5.8%, 6.9%,4.9% and 3.8% of our revenue during the same periods.
We incurred a net loss in 2018 primarily due to (i) our increased investments in the Original BrandManufacturing (“OBM”) business, including marketing and research and development spending in 2018and (ii) integration costs associated with our acquisition of the SKIL business. With respect to ourinvestments in the OBM business, for example, we devoted substantial resources into developingSKIL-branded lithium-ion battery powered products, which did not launch in Europe market until thefourth quarter of 2018. Our gross profit margin for 2018 was also lower due to promotion of OBMproducts, particularly EGO, through price reductions in order to quickly gain market share. With respectto the SKIL integration costs, such costs primarily include: (a) replacing certain operational support,logistics and IT systems, (b) investing in additional research and development efforts, (c) increasingproduction capacity and (d) enhancing relevant marketing activities during the transition period.
For further information regarding breakdown of revenue, gross profit, gross profit margin and salesvolume by product categories, business models, brands, geographic regions and sales and distributionchannels, please refer to the sections headed “Business – Our Products – Revenue Breakdown,” “Business– Sales, Marketing and Distribution” and “Financial Information – Principal Components of ConsolidatedStatements of Profit or Loss – Revenue.”
Gross Profit Breakdown
The following table sets forth a breakdown of our gross profit and gross profit margin by productcategory and end-user segment for the years and periods indicated.
Year Ended December 31, Six months ended June 30,
2018 2019 2020 2020 2021
Gross Profit
GrossProfit
Margin Gross Profit
GrossProfit
Margin Gross Profit
GrossProfit
Margin Gross Profit
GrossProfit
Margin Gross Profit
GrossProfit
Margin
US$ % US$ % US$ % US$ % US$ %(Unaudited)
(in thousands, except for percentages)
Power Tools 118,997 24.6 165,565 30.1 192,030 29.1 77,874 27.9 120,445 26.7Industrial/
Professional 57,563 27.3 76,338 31.7 68,613 29.1 33,744 28.0 56,179 26.5Consumer 61,434 22.5 89,226 28.9 123,417 29.0 44,130 27.9 64,266 26.8
OPE 55,266 27.4 88,752 30.8 175,503 32.9 68,997 29.8 130,274 31.5Premium 50,484 28.7 71,308 33.0 155,239 33.8 63,451 30.3 112,606 33.0Mass-market 4,782 18.6 17,444 24.4 20,264 27.2 5,546 25.0 17,668 24.4
Others(1) 1,262 21.3 936 15.8 1,179 19.2 787 19.6 390 10.6
Note:
(1) Others revenue primarily includes sales of our parts and components to a company engaging in a home appliancesbusiness.
SUMMARY
– 10 –

The following table sets forth a breakdown of our gross profit and gross profit margin by OBM andODM business models and brands for the years and periods indicated.
Year ended December 31, Six months ended June 30,
2018 2019 2020 2020 2021
Gross Profit
GrossProfit
Margin Gross Profit
GrossProfit
Margin Gross Profit
GrossProfit
Margin Gross Profit
GrossProfit
Margin Gross Profit
GrossProfit
Margin
US$ % US$ % US$ % US$ % US$ %(Unaudited)
(in thousands, except for percentages)
OBM 122,270 28.3 147,836 31.8 246,403 33.0 100,188 29.8 186,825 31.6ODM 53,255 20.6 107,417 28.4 122,309 26.9 47,470 26.7 64,284 23.2
The following table sets forth a breakdown of our gross profit and gross profit margin bygeographical regions and sales and distribution channels under OBM model for the years and periodsindicated.
Year ended December 31, Six months ended June 30,
2018 2019 2020 2020 2021
GrossProfit
GrossProfit
MarginGrossProfit
GrossProfit
MarginGrossProfit
GrossProfit
MarginGrossProfit
GrossProfit
MarginGrossProfit
GrossProfit
Margin
US$ % US$ % US$ % US$ % US$ %(Unaudited)
(in thousands, except for percentages)
North America 64,300 24.9 87,911 30.7 178,106 32.5 65,670 27.8 137,735 32.5Retailers 57,931 24.4 80,780 30.8 163,416 33.0 61,604 27.8 124,762 33.0Distributors 1,151 19.1 1,502 22.5 2,242 23.2 969 26.2 2,015 21.8Pure-play
e-commerceplatform 5,219 34.2 5,630 31.4 12,447 28.1 3,097 28.5 10,958 29.7
Europe 46,604 37.0 48,205 37.7 49,862 36.7 25,374 38.0 34,398 31.9Retailers 29,229 36.6 32,146 37.8 34,367 37.5 16,180 37.6 14,586 32.9Distributors 16,965 37.5 15,800 37.8 15,252 35.1 9,061 38.7 19,420 31.0Pure-play
e-commerceplatform 410 38.5 259 30.3 243 31.2 133 34.6 393 42.7
China(1) 8,534 21.7 8,841 20.5 13,888 26.8 7,771 25.9 11,098 21.8ROW(2) 2,832 36.0 2,879 37.8 4,547 45.8 1,373 46.1 3,594 45.5
Notes:
(1) In China, we primarily sell our products to distributors. We also offer our products through pure-play e-commerce channels.
(2) In other markets to which we distribute our products, such as Australia and New Zealand, we primarily sell our products toretailers. Our practices may vary in different markets subject to the local conditions.
Please refer to the section headed “Financial Information” of this prospectus for additional details.
SUMMARY
– 11 –
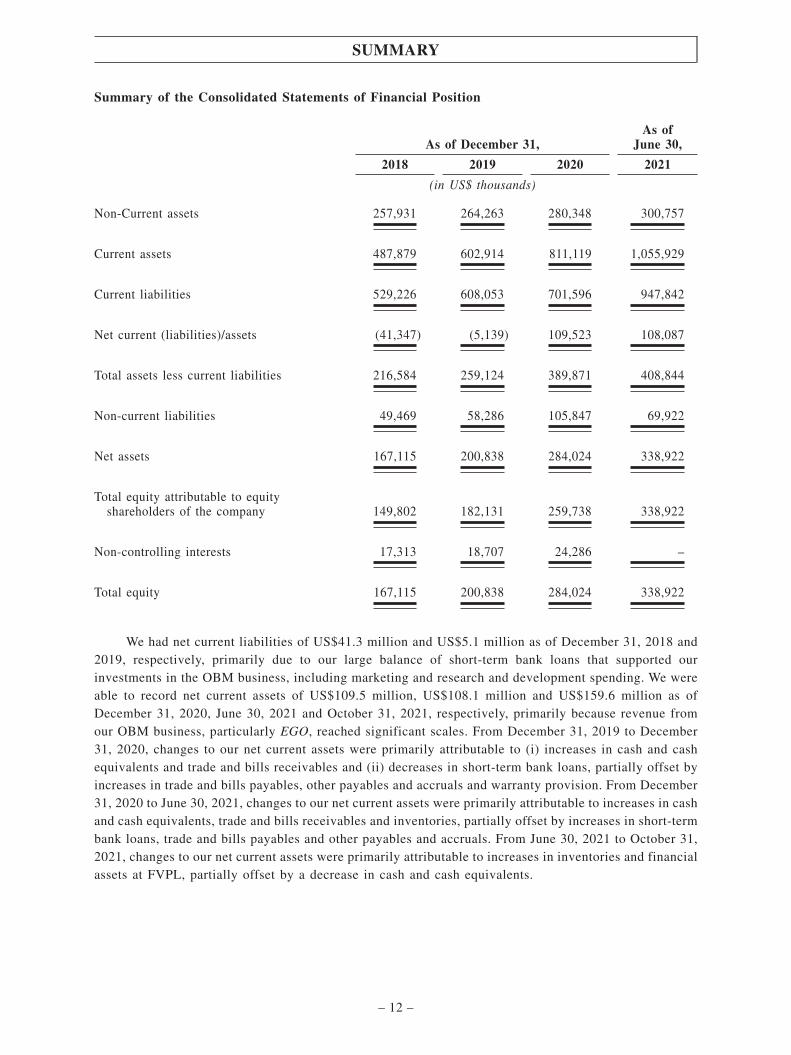
Summary of the Consolidated Statements of Financial Position
As of December 31,As of
June 30,
2018 2019 2020 2021
(in US$ thousands)
Non-Current assets 257,931 264,263 280,348 300,757
Current assets 487,879 602,914 811,119 1,055,929
Current liabilities 529,226 608,053 701,596 947,842
Net current (liabilities)/assets (41,347) (5,139) 109,523 108,087
Total assets less current liabilities 216,584 259,124 389,871 408,844
Non-current liabilities 49,469 58,286 105,847 69,922
Net assets 167,115 200,838 284,024 338,922
Total equity attributable to equityshareholders of the company 149,802 182,131 259,738 338,922
Non-controlling interests 17,313 18,707 24,286 –
Total equity 167,115 200,838 284,024 338,922
We had net current liabilities of US$41.3 million and US$5.1 million as of December 31, 2018 and2019, respectively, primarily due to our large balance of short-term bank loans that supported ourinvestments in the OBM business, including marketing and research and development spending. We wereable to record net current assets of US$109.5 million, US$108.1 million and US$159.6 million as ofDecember 31, 2020, June 30, 2021 and October 31, 2021, respectively, primarily because revenue fromour OBM business, particularly EGO, reached significant scales. From December 31, 2019 to December31, 2020, changes to our net current assets were primarily attributable to (i) increases in cash and cashequivalents and trade and bills receivables and (ii) decreases in short-term bank loans, partially offset byincreases in trade and bills payables, other payables and accruals and warranty provision. From December31, 2020 to June 30, 2021, changes to our net current assets were primarily attributable to increases in cashand cash equivalents, trade and bills receivables and inventories, partially offset by increases in short-termbank loans, trade and bills payables and other payables and accruals. From June 30, 2021 to October 31,2021, changes to our net current assets were primarily attributable to increases in inventories and financialassets at FVPL, partially offset by a decrease in cash and cash equivalents.
SUMMARY
– 12 –
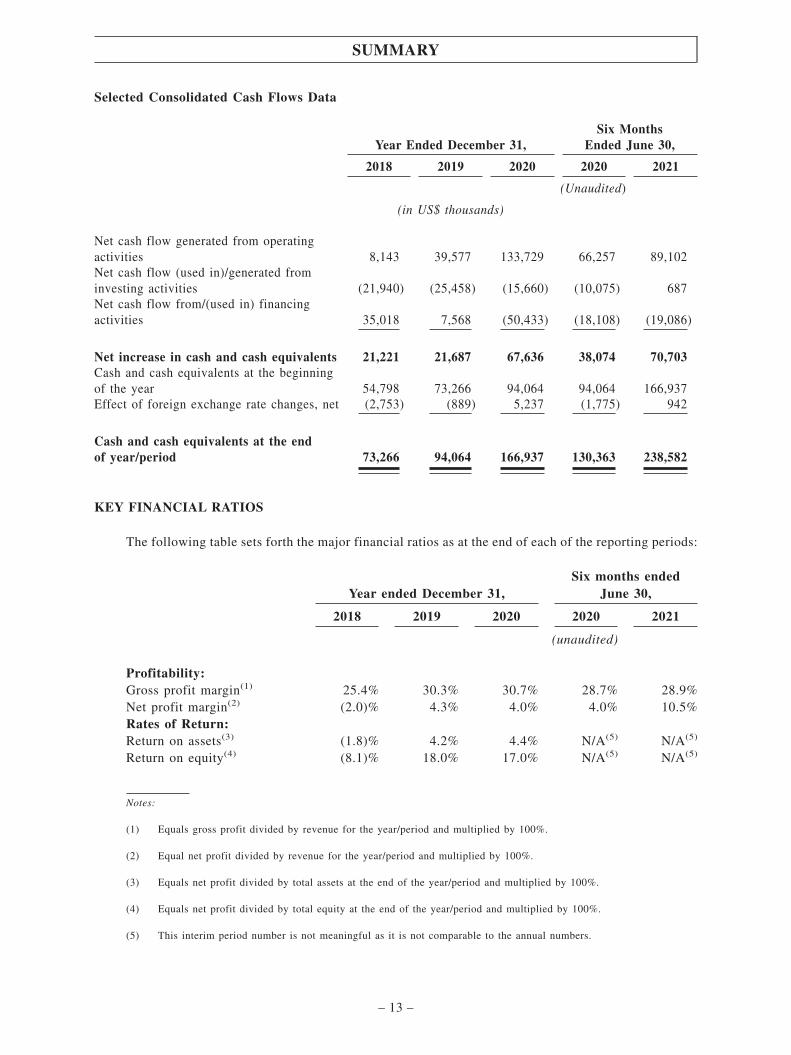
Selected Consolidated Cash Flows Data
Year Ended December 31,Six Months
Ended June 30,
2018 2019 2020 2020 2021
(Unaudited)
(in US$ thousands)
Net cash flow generated from operatingactivities 8,143 39,577 133,729 66,257 89,102Net cash flow (used in)/generated frominvesting activities (21,940) (25,458) (15,660) (10,075) 687Net cash flow from/(used in) financingactivities 35,018 7,568 (50,433) (18,108) (19,086)
Net increase in cash and cash equivalents 21,221 21,687 67,636 38,074 70,703Cash and cash equivalents at the beginningof the year 54,798 73,266 94,064 94,064 166,937Effect of foreign exchange rate changes, net (2,753) (889) 5,237 (1,775) 942
Cash and cash equivalents at the endof year/period 73,266 94,064 166,937 130,363 238,582
KEY FINANCIAL RATIOS
The following table sets forth the major financial ratios as at the end of each of the reporting periods:
Year ended December 31,Six months ended
June 30,
2018 2019 2020 2020 2021
(unaudited)
Profitability:Gross profit margin(1) 25.4% 30.3% 30.7% 28.7% 28.9%Net profit margin(2) (2.0)% 4.3% 4.0% 4.0% 10.5%Rates of Return:Return on assets(3) (1.8)% 4.2% 4.4% N/A(5) N/A(5)
Return on equity(4) (8.1)% 18.0% 17.0% N/A(5) N/A(5)
Notes:
(1) Equals gross profit divided by revenue for the year/period and multiplied by 100%.
(2) Equal net profit divided by revenue for the year/period and multiplied by 100%.
(3) Equals net profit divided by total assets at the end of the year/period and multiplied by 100%.
(4) Equals net profit divided by total equity at the end of the year/period and multiplied by 100%.
(5) This interim period number is not meaningful as it is not comparable to the annual numbers.
SUMMARY
– 13 –
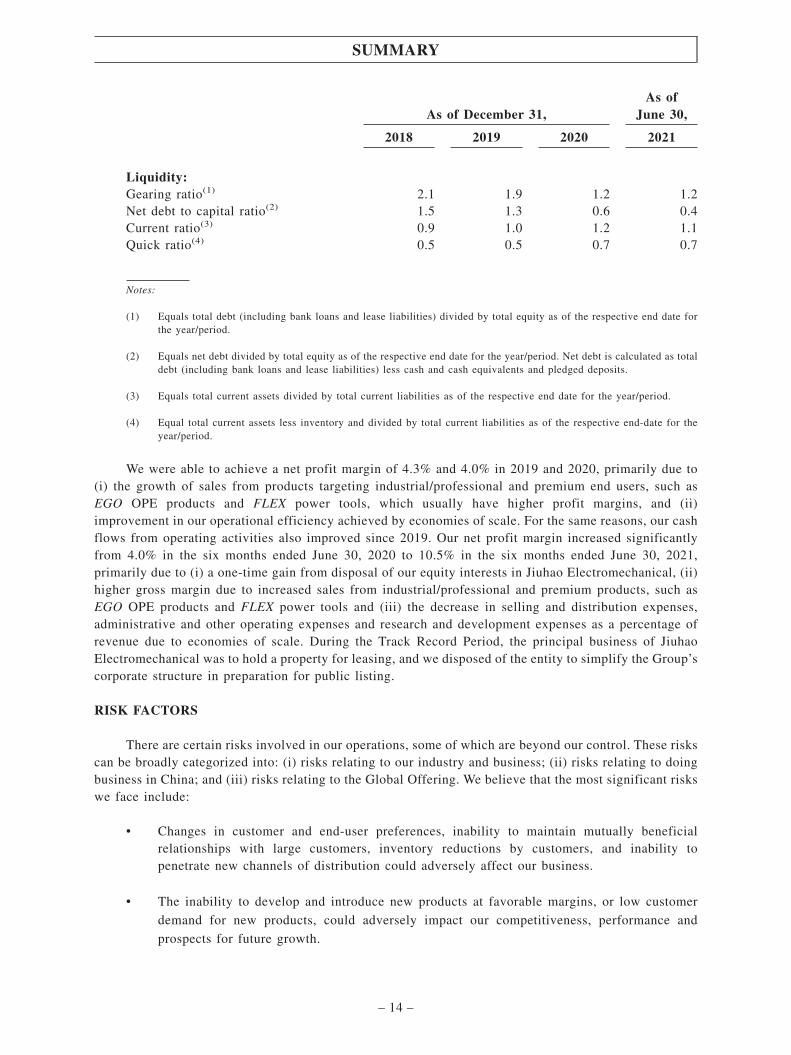
As of December 31,As of
June 30,
2018 2019 2020 2021
Liquidity:Gearing ratio(1) 2.1 1.9 1.2 1.2Net debt to capital ratio(2) 1.5 1.3 0.6 0.4Current ratio(3) 0.9 1.0 1.2 1.1Quick ratio(4) 0.5 0.5 0.7 0.7
Notes:
(1) Equals total debt (including bank loans and lease liabilities) divided by total equity as of the respective end date forthe year/period.
(2) Equals net debt divided by total equity as of the respective end date for the year/period. Net debt is calculated as totaldebt (including bank loans and lease liabilities) less cash and cash equivalents and pledged deposits.
(3) Equals total current assets divided by total current liabilities as of the respective end date for the year/period.
(4) Equal total current assets less inventory and divided by total current liabilities as of the respective end-date for theyear/period.
We were able to achieve a net profit margin of 4.3% and 4.0% in 2019 and 2020, primarily due to(i) the growth of sales from products targeting industrial/professional and premium end users, such asEGO OPE products and FLEX power tools, which usually have higher profit margins, and (ii)improvement in our operational efficiency achieved by economies of scale. For the same reasons, our cashflows from operating activities also improved since 2019. Our net profit margin increased significantlyfrom 4.0% in the six months ended June 30, 2020 to 10.5% in the six months ended June 30, 2021,primarily due to (i) a one-time gain from disposal of our equity interests in Jiuhao Electromechanical, (ii)higher gross margin due to increased sales from industrial/professional and premium products, such asEGO OPE products and FLEX power tools and (iii) the decrease in selling and distribution expenses,administrative and other operating expenses and research and development expenses as a percentage ofrevenue due to economies of scale. During the Track Record Period, the principal business of JiuhaoElectromechanical was to hold a property for leasing, and we disposed of the entity to simplify the Group’scorporate structure in preparation for public listing.
RISK FACTORS
There are certain risks involved in our operations, some of which are beyond our control. These riskscan be broadly categorized into: (i) risks relating to our industry and business; (ii) risks relating to doingbusiness in China; and (iii) risks relating to the Global Offering. We believe that the most significant riskswe face include:
• Changes in customer and end-user preferences, inability to maintain mutually beneficialrelationships with large customers, inventory reductions by customers, and inability topenetrate new channels of distribution could adversely affect our business.
• The inability to develop and introduce new products at favorable margins, or low customer
demand for new products, could adversely impact our competitiveness, performance and
prospects for future growth.
SUMMARY
– 14 –

• We may not be successful in implementing our future business plans and strategies, and if we
are unable to execute them effectively and efficiently, our business, financial conditions,
results of operations and growth prospects may be materially and adversely affected.
• Our historical revenue and profit margin may not be indicative of our future revenue and profit
margin.
• Unfavorable economic and geopolitical conditions in the markets in which we operate, such as
the trade tensions between China and the United States, may adversely affect our sales.
A detailed discussion of all the risk factors involved are set forth in the section headed “Risk
Factors” in this prospectus and you should read the whole section carefully before you decide to invest
in the Offer Shares.
COMPETITION
The power tools and OPE industries are relatively concentrated and highly competitive, and we face
competition in all aspects of our business. We generally compete with other global and domestic leaders
in the power tool and OPE industries. As confirmed by our Industry Consultant, despite the relative
concentration of the industry, there are more than 1,000 market players in the global power tool and OPE
markets. We compete on the basis of what we consider to be the principal competitive factors in our
industry, including our reputation for product quality, emphasis on product innovation and development,
the breadth of our product lines, our well-known brands and our strong customer relationships and
after-sales services. We also experience significant competition for highly skilled personnel, including
management, engineers, designers and product managers, as our growth depends in part on our ability to
retain our existing personnel and recruit highly skilled employees.
According to the Frost & Sullivan Report, the global power tool market is expected to grow at a
CAGR of 5.5% from US$39.2 billion in 2020 to US$51.3 billion by revenue in 2025, and the electric
power tool segment is expected to grow at a CAGR of 5.9% from US$29.1 billion to US$38.6 billion in
2025, in each case by revenue. In 2020, we represented 1.7% of the global power tool market and 2.3%
of the global electric power tool market by revenue. The competitive landscape of global electric power
tool market is relatively concentrated, as the top 10 players accounted for approximately 73.3% of market
shares by revenue in 2020. Set forth below are descriptions and market shares (by revenue) of the top five
market players in the global electric power tool market.
Rank Company Market Share
1 Company A(1) 16.6%
2 Company B(2) 16.0%
3 Company C(3) 14.9%
4 Company D(4) 6.9%
5 Company E(5) 6.3%
SUMMARY
– 15 –
Notes:
(1) Founded in 1985, Company A (Hong Kong Stock Exchange-listed) offers power tools, accessories, hand tools, outdoorpower equipment, and floorcare equipment. Company A maintains a global manufacturing (across Europe, NorthAmerica, China, Mexico and Vietnam) and product development footprint with over 48,000 employees. (Sources: Frost& Sullivan Report; Company A’s annual report and official website.)
(2) Founded in 1886, Company B is a leading Stuttgart, Germany-based, global supplier of technology and servicesfocusing on automobile parts and components, industrial products and construction products. Company B operates fourbusiness sectors: mobility solutions, industrial technology, consumer goods and energy and building technology. As ofDecember 31, 2020, Company B had roughly 395,000 employees and operated in more than 400 locations across 60countries. Company B has manufacturing footprints across Europe, North America and China. (Sources: Frost &Sullivan Report; Company B’s official website.)
(3) Founded in 1843, Company C (NYSE-listed) is a U.S.-based global provider of hand tools, power tools and relatedaccessories, engineered fastening systems and products, services and equipment for oil & gas and infrastructureapplications, commercial electronic security and monitoring systems, healthcare solutions, and automatic doors. As ofJanuary 2, 2021, Company C had approximately 53,100 employees in over 60 countries. Company C has manufacturingfootprints across Europe, North America and Asia. (Sources: Frost & Sullivan Report; Company C’s annual report andofficial website.)
(4) Founded in 1915, Company D (Tokyo Stock Exchange-listed) is a Japan-based global manufacturer of power tools,gardening equipment, and similar products. As of March 31, 2021, Company D had approximately 18,624 employees.Company D has manufacturing footprints across Japan, China, the U.S., the U.K., Germany, Brazil, Romania andThailand. (Sources: Frost & Sullivan Report; Company D’s official website.)
(5) Founded in 1941, Company E is a Schaan, Liechtenstein-based provider of power tools, system solutions, software andservices. Company E’s products cover powder-actuated fastening, drilling and demolition, diamond coring and cutting,measuring, firestop, screw fastening, adhesive and mechanical anchoring, and strut and hanger systems. Company Ehas approximately 30,000 employees in more than 120 countries. Company E has manufacturing footprints acrossEurope, North America, China and India. (Sources: Frost & Sullivan Report; Company E’s official website.)
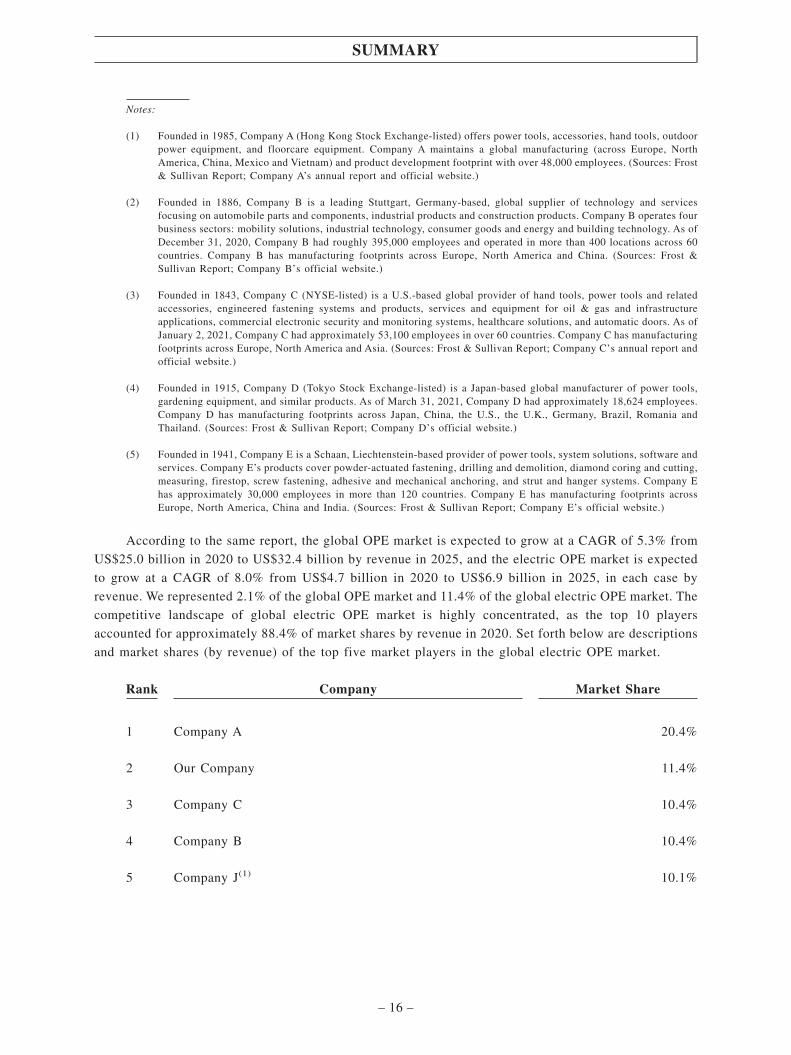
According to the same report, the global OPE market is expected to grow at a CAGR of 5.3% from
US$25.0 billion in 2020 to US$32.4 billion by revenue in 2025, and the electric OPE market is expected
to grow at a CAGR of 8.0% from US$4.7 billion in 2020 to US$6.9 billion in 2025, in each case by
revenue. We represented 2.1% of the global OPE market and 11.4% of the global electric OPE market. The
competitive landscape of global electric OPE market is highly concentrated, as the top 10 players
accounted for approximately 88.4% of market shares by revenue in 2020. Set forth below are descriptions
and market shares (by revenue) of the top five market players in the global electric OPE market.
Rank Company Market Share
1 Company A 20.4%
2 Our Company 11.4%
3 Company C 10.4%
4 Company B 10.4%
5 Company J(1) 10.1%
SUMMARY
– 16 –
Note:
(1) Founded in 2002, Company J is a PRC-based provider of outdoor power equipment for both consumers and landscapingprofessionals. Company J also manufactures private label products, as well as other products as original equipmentmanufacturers. Company J has manufacturing footprints across China and the U.S. (Sources: Frost & Sullivan Report;Company J’s official website.)
Please refer to the section headed “Industry Overview – Competitive Landscape” for further details.
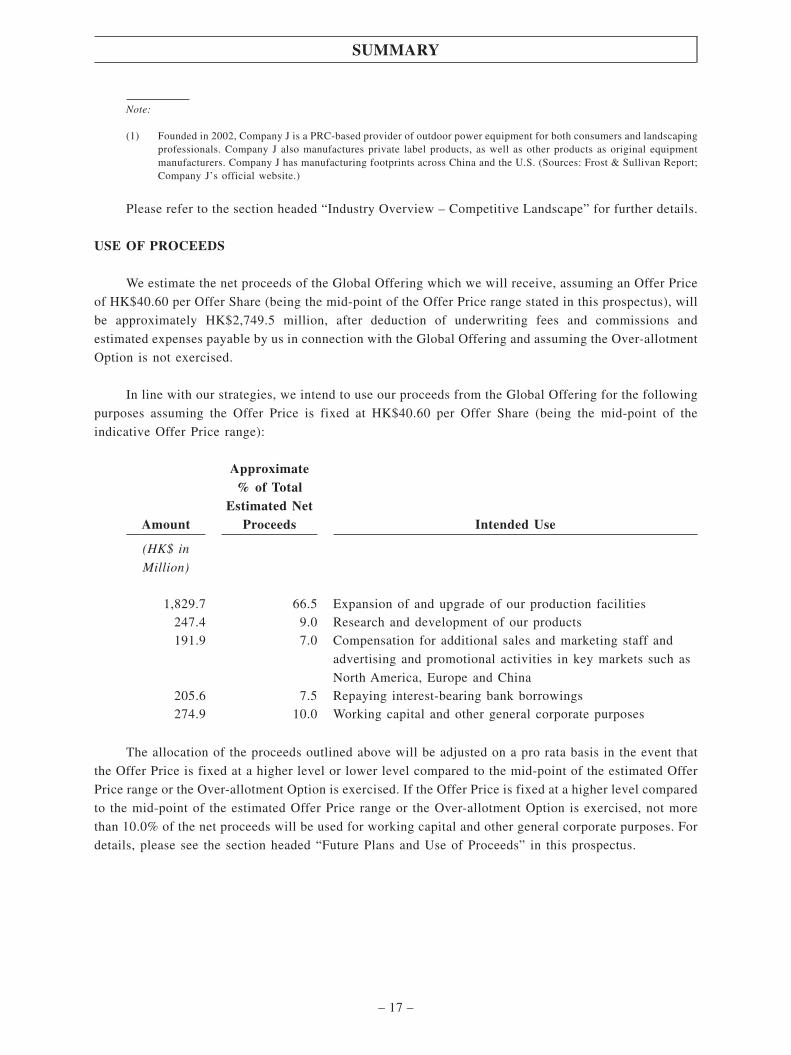
USE OF PROCEEDS
We estimate the net proceeds of the Global Offering which we will receive, assuming an Offer Price
of HK$40.60 per Offer Share (being the mid-point of the Offer Price range stated in this prospectus), will
be approximately HK$2,749.5 million, after deduction of underwriting fees and commissions and
estimated expenses payable by us in connection with the Global Offering and assuming the Over-allotment
Option is not exercised.
In line with our strategies, we intend to use our proceeds from the Global Offering for the following
purposes assuming the Offer Price is fixed at HK$40.60 per Offer Share (being the mid-point of the
indicative Offer Price range):
Amount
Approximate% of Total
Estimated NetProceeds Intended Use
(HK$ in
Million)
1,829.7 66.5 Expansion of and upgrade of our production facilities247.4 9.0 Research and development of our products191.9 7.0 Compensation for additional sales and marketing staff and
advertising and promotional activities in key markets such as
North America, Europe and China205.6 7.5 Repaying interest-bearing bank borrowings274.9 10.0 Working capital and other general corporate purposes
The allocation of the proceeds outlined above will be adjusted on a pro rata basis in the event that
the Offer Price is fixed at a higher level or lower level compared to the mid-point of the estimated Offer
Price range or the Over-allotment Option is exercised. If the Offer Price is fixed at a higher level compared
to the mid-point of the estimated Offer Price range or the Over-allotment Option is exercised, not more
than 10.0% of the net proceeds will be used for working capital and other general corporate purposes. For
details, please see the section headed “Future Plans and Use of Proceeds” in this prospectus.
SUMMARY
– 17 –

PRE-IPO INVESTMENT
Our pre-IPO investor, Nanjing Ruxin Enterprise Management Partnership (Limited Partnership)
(“Nanjing Ruxin”), invested in our Company pursuant to an investment agreement dated January 29,
2021, the consideration under which was fully settled on March 29, 2021. Immediately following
completion of the Global Offering (assuming that the Over-allotment Option is not exercised), Nanjing
Ruxin’s shareholding in our Company will represent approximately 0.81% of the issued share capital of
our Company. For further details, please refer to the section headed “History, Reorganization and
Corporate Structure – Pre-IPO Investment” in this prospectus.
OUR CONTROLLING SHAREHOLDERS
Immediately following the completion of the Global Offering (assuming the Over-allotment Option
is not exercised), Mr. Pan through Panmercy will control an aggregate of 54.3% of the issued share capital
of our Company. Therefore, Mr. Pan and Panmercy will be our Controlling Shareholders.
DIVIDEND POLICY
We have adopted a general annual dividend policy of declaring and paying dividends on an annual
basis of no less than 20% of our total net profit attributable to us for any particular year. Assuming the
Listing occurs in 2021, 2022 will be the first year for which our total net profit attributable to us will be
used for purposes of declaring and paying dividends in accordance with the aforementioned general annual
dividend policy. The declaration of dividends is subject to the discretion of our Directors, and, if
necessary, the approval of our Shareholders. On December 1, 2018, July 1, 2020 and January 31, 2021,
the Board approved certain dividends, and the dividends payable to equity shareholders were US$4.5
million, nil, US$3.7 million and US$15.0 million during the years ended December 31, 2018, 2019 and
2020 and the six months ended June 30, 2021, respectively. As of the Latest Practicable Date, the approved
dividends have been paid. Dividends declared in the past are not indicative of our future dividend policy.
In addition, our Directors may reassess our dividend policy in the future. See the section headed “Financial
Information – Dividend Policy” in this prospectus for more details.
GLOBAL OFFERING STATISTICS
Based on OfferPrice of HK$37.60
per Share
Based on OfferPrice of HK$43.60
per Share
Our Company’s market capitalization upon
completion of the Global Offering(1)
HK$18,026.6 million HK$20,903.2 million
Unaudited pro forma adjusted net tangible assets
per ordinary Share(2)
HK$10.81 HK$11.71
Notes:
(1) The calculation of the market capitalization is based on 479,431,411 Shares expected to be in issue immediately uponcompletion of the Capitalization Issue and the Global Offering (assuming the Over-allotment Option is not exercised).
SUMMARY
– 18 –

(2) The unaudited pro forma adjusted net tangible asset value per Share has been arrived at after adjustments referred to in thesection headed “Unaudited Pro Forma Financial Information” in Appendix II and on the basis of 479,431,411 Shares in issueat the respective Offer Price of HK$37.60 and HK$43.60, assuming that the Shares issued pursuant to the Global Offeringwere issued on June 30, 2021 (assuming the Over-allotment Option is not exercised).
The Shares held by our Controlling Shareholders will be subject to a 12-month lock-up upon Listing,
and the other existing Shareholders will be subject to a six-month lock-up with respect to the Shares they
beneficially own. Please refer to the section headed “Underwriting” for further details.
LISTING EXPENSES
Assuming an Offer Price of HK$40.60 per Share (being the mid-point of the proposed Offer Price
range) and that the Over-allotment Option is not exercised, our total listing expenses are estimated to be
HK$170.3 million, representing approximately 5.8% of the gross proceeds from the Global Offering. The
estimated listing expenses consist of (i) underwriting-related expenses (including underwriting fees and
commissions) of HK$109.5 million, (ii) fees and expenses of legal advisers and accountants of HK$47.8
million and (iii) other fees and expenses of HK$13.0 million. HK$2.1 million and HK$16.5 million have
been recognized as administrative expenses in our consolidated statements of profit or loss for the year
ended December 31, 2020 and six months ended June 30, 2021 and after the Track Record Period,
respectively, and HK$151.7 million is expected to be accounted for as a deduction from equity directly
upon Listing. The listing expenses above are the latest practicable estimate for reference only, and the
actual amounts may differ from this estimate. Our Directors do not expect such expenses to have a material
adverse impact on our financial results in 2021.
IMPACT OF THE COVID-19 PANDEMIC
The outbreak of the coronavirus disease 2019 (“COVID-19”), which was declared a “pandemic” by
the World Health Organization in March 2020, and its continued spread worldwide has introduced
uncertainty and volatility in global markets. The outbreak has resulted in restrictions on travel, public
transport and prolonged closures of workplaces which has had and may continue to have a material adverse
effect on the global economy and may cause interruptions to our business. Furthermore, the COVID-19
pandemic and the resultant restrictions and closures may impact demand, supply and efficient functioning
of markets.
While we have resumed normal business operations, we have experienced certain disruptions in our
operations as a result of the government-imposed suspensions due to the COVID-19 outbreak. In the first
quarter of 2020, a substantial number of our production facilities and offices were closed for certain days.
Specifically, our production facilities in Nanjing were closed for 13 days, and our production facility in
Germany was closed for 12 days. As a result, our production volume has decreased in the first quarter of
2020. Furthermore, the COVID-19 pandemic has affected and may affect future delivery of components
from certain suppliers that suspended production. For example, some of our suppliers were unable to
SUMMARY
– 19 –

deliver sufficient components to us due to the COVID-19 outbreak in the beginning of 2020. By April
2020, these suppliers had resumed their normal delivery of components. The cost and time for
transportation of our products in certain regions of the world also increased as a result of the impact of
the COVID-19 pandemic. Furthermore, our overseas offices in North America and Europe were also
temporarily closed for certain periods from February to April 2020.
In July 2021, a number of positive COVID-19 cases appeared in certain areas of Nanjing, PRC,
where a majority of our production facilities and offices are located, and Yangzhou, PRC, where a number
of our suppliers are located. In July and August of 2021, our production facilities and offices in Nanjing
remained open and we have imposed social distancing, mask-wearing and mandatory virus testing
requirements for our employees. However, for certain weeks in July and August 2021, some of our
employees were subject to temporary stay at home orders and travel restrictions, and one of our main
warehouses suspended operations for 16 days. Some of our suppliers also suspended operations or reduced
production levels during such period. As a result, the outbreak caused delays to our supply chain,
production schedule and product delivery. In addition, due to the impact of the pandemic, our
manufacturing facility in Vietnam suspended operations for 8 days in July and August 2021, and gradually
resumed production since August 2021. In the six months ended June 30, 2021, the designed annual
production capacity of the Vietnam plant accounted for approximately 5% of our aggregate designed
annual production capacity. In the third quarter of 2021, we have converted three leased properties into
production facilities. Given the establishment of additional production facilities, our production capacity
has increased since August 2021. As a result of the impact of the COVID-19 cases in Nanjing and
Yangzhou, PRC and Vietnam, our revenue growth for the third quarter of 2021 has slowed down compared
to prior periods. Our revenue increased by US$41.0 million, or 13.3%, from US$307.2 million for the
three months ended September 30, 2020 to US$348.2 million for the same period in 2021. In comparison,
our revenue increased by 68.9% from US$514.4 million for the six months ended June 30, 2020 to
US$868.8 million for the six months ended June 30, 2021.
We believe that the COVID-19 pandemic has not had a material adverse impact on our results of
operations. Our revenue increased by 42.4% from US$843.6 million in 2019 to US$1,200.9 million in
2020, and by 68.9% from US$514.4 million in the six months ended June 30, 2020 to US$868.8 million
in the same period in 2021. In the years ended December 31, 2018, 2019 and 2020 and the six months
ended June 30, 2021, the utilization rates of our production facilities remained relatively stable at 96%,
90%, 91% and 92%, respectively. Furthermore, we generally did not incur penalties or charges for delays
of product delivery caused by the COVID-19 pandemic, and our customer relationships have remained
stable during the Track Record Period and up to the Latest Practicable Date.
At this point, we cannot accurately predict what effects the COVID-19 pandemic would have on our
business, which will depend on, among other factors, the ultimate geographic spread of the virus, the
duration of the pandemic and the corresponding travel restrictions and business closures imposed by
government authorities. For further details, please refer to the section headed “Risk Factors – Risks
Related to Our Industry and Business – Our business may be affected by the occurrence of contagious
diseases, such as COVID-19” in this prospectus.
IMPACT OF THE U.S.-CHINA TRADE TENSION
Our business is subject to the risk of U.S.-China trade tensions. The ongoing trade dispute between
the PRC and the United States and the increase in tariffs that the United States imposed on PRC imports
have contributed to increased market volatility, weakened consumer confidence and diminished
SUMMARY
– 20 –

expectations for economic growth around the world. In 2018, 2019, 2020 and the six months ended June
30, 2021, 37.1%, 32.5%, 36.7% and 22.8% of our revenue was attributable to sales that were subject to
U.S. tariffs, respectively. The majority of our products sold to the U.S. were List 4 products, and the tariff
rates for almost all of our List 4 products were zero from January 2018 to August 2019. Beginning on
September 1, 2019, the tariff rate for List 4 products was raised to 15%. In January 2020, United States
and PRC signed a phase one trade deal upon which tariffs of 15% that had been imposed on certain List
4 products from September 2019 were reduced to 7.5% and the tariffs to be imposed on the remainder of
List 4 products were delayed indefinitely. The tariffs have remained as of the date of this prospectus which
make Chinese goods more expensive and have led U.S. companies to shift some purchases to other
countries such as Vietnam. A substantial portion of our products exported to the United States and the
materials required for production of our products are considered as “List 4 products” of the Section 301
action undertaken by the United States Trade Representative and are subject to the increased tariffs. In
2018, 2019, 2020 and the six months ended June 30, 2020 and 2021, our duty costs relating to U.S. tariffs
were US$0.6 million, US$8.5 million, US$28.4 million, US$15.5 million and US$7.9 million,
respectively. We cannot assure you that we will be able to fully offset the impact of tariffs on our financial
condition, results of operations or cash flows. Please refer to the section headed “Risk Factors –
Unfavorable economic and geopolitical conditions in the markets in which we operate, such as the trade
tensions between China and the United States, may adversely affect our sales” in this prospectus for
additional details.
Nonetheless, our products do not involve sensitive technologies or functions, and we have no reason
to believe that the U.S. government would impose import restrictions on our products. Furthermore, as we
are a provider of power tools and OPE products, we do not believe that our business would adversely affect
the national interests of the United States, and therefore, we do not expect that the U.S. government would
impose export restrictions on the raw materials or components sourced by us. In the event that the U.S.
government imposes such export restrictions, we believe we will be able to find suitable alternative
suppliers at reasonable costs and in a timely manner. Therefore, the Directors are of the view that the
U.S.-China trade tension are unlikely to impede our ability to carry out our business with customers or
collaboration with partners in North America, or to have a material adverse impact on our operations and
financial performance in the near future. Having regard to the due diligence conducted, nothing has come
to the attention of the Joint Sponsors which would cast doubt on the Director’s view that the U.S.-China
trade tension is not likely to impede the Company’s ability to carry out its business with
customers/collaboration partners in North America or its operations and financial performance in the near
future.
As contingency measures to mitigate the potential impact of intensifying U.S.-China trade tensions,
we will continue to explore expanding sales channels in Europe, China, Australia and other markets. In
addition, we have recently established companies in the United Kingdom and New Zealand in order to
better serve local customers and markets. We may consider expanding the production capacity in our
Vietnam-based facility, and we have also undertaken feasibility studies over establishing additional
factories in North America and Europe. Furthermore, we sought to mitigate the impact of the costs
associated with U.S. tariffs primarily by (i) promoting new products with higher margins that partially
cover the tariff costs, (ii) sharing tariff costs with customers or suppliers, and (iii) raising selling prices
of products subject to tariffs where appropriate, taking into consideration factors such as foreign exchange
rates and raw material prices. We share tariff costs with customers and suppliers only through contractual
terms that are mutually agreed upon with such customers or suppliers. We negotiated with such customers
or suppliers in good faith in relation to the tariff costs. Accordingly, we believe the sharing of tariff costs
with customers or suppliers has not impeded, and we do not expect it to impede, our ability to carry out
SUMMARY
– 21 –

business with our customers or suppliers. However, we cannot provide assurances that these efforts will
be effective or achieve desired outcome. If our contingency measures to mitigate the potential impact of
intensifying U.S.-China trade tensions are not effective or do not achieve desired outcome, our business
operations and financial performance may be materially and adversely affected. Please refer to the section
headed “Risk Factors – We may not be successful in implementing our future business plans and strategies,
and if we are unable to execute them effectively and efficiently, our business, financial conditions, results
of operations and growth prospects may be materially and adversely affected” in this prospectus for
additional details.
NO MATERIAL ADVERSE CHANGE
Our Directors confirm that up to the date of this prospectus, there has been no material adversechange in our financial or trading position or prospects since June 30, 2021, and there is no event sinceJune 30, 2021 which would materially and adversely affect the audited financial information as set out inAppendix I to this prospectus. Please refer to the section headed “Summary – Recent Development” forinformation relating to our operations and financial performance subsequent to the Track Record Period.
RECENT DEVELOPMENTS
Nine months ended September 30, 2021 compared with nine months ended September 30, 2020
Our revenue increased by 48.1% from US$821.5 million for the nine months ended September 30,2020 to US$1,217.0 million for the nine months ended September 30, 2021, primarily due to increasedsales of EGO, FLEX and SKIL products in partnership with our major customers.
Our gross profit increased by 41.3% from US$246.7 million for the nine months ended September30, 2020 to US$348.6 million for the nine months ended September 30, 2021. The gross profit from ourpower tool products increased by 29.0% from US$138.0 million for the nine months ended September 30,2020 to US$178.0 million for the nine months ended September 30, 2021. The gross profit from our OPEproducts increased by 58.0% from US$107.6 million for the nine months ended September 30, 2020 toUS$170.0 million for the nine months ended September 30, 2021.
The financial data of our Group for the nine months ended September 30, 2021 disclosed above arederived from our unaudited interim financial statements for the nine months ended September 30, 2021,which have been prepared under in accordance with the Hong Kong Accounting Standard 34, “InterimFinancial Reporting,” and reviewed by our Reporting Accountants in accordance with Hong KongStandard on Review Engagements 2410, “Review of Interim Financial Information Performed by theIndependent Auditor of the Entity.”
Convertible Bond Purchase
On August 3, 2021, Chervon Auto Precision Technology announced that it has obtained approvalfrom the CSRC to issue public A-share convertible bonds in an aggregate principal amount of RMB620million (US$97.3 million) with a maturity date on the sixth year after the date of issuance. Pursuant to theterms of the convertible bond offering, an existing shareholder of Chervon Auto Precision Technology haspre-emptive rights to subscribe for the convertible bonds in an amount up to the proportional interests ofsuch shareholder in Chervon Auto Precision Technology. As of September 30, 2021, Chervon (China)Investment, which is our wholly-owned subsidiary and owns 23.12% of Chervon Auto PrecisionTechnology, has exercised and paid for such pre-emptive rights to subscribe for RMB118.5 million(US$18.6 million) of the principal amount of the convertible bond. As the convertible bonds may not beconverted for a period of six months from the date of completion, Chervon (China) Investment cannot anddoes not intend to convert such convertible bonds before the completion of the Global Offering. ChervonAuto Precision Technology is owned as to 35.75% by Chervon Precision Technology, which is an indirectsubsidiary of Panmercy. As such, Chervon Auto Precision Technology is an associate of Panmercy andtherefore our connected person under Rule 14A.13(3) of the Listing Rules. Please refer to the sectionheaded “Connected Transactions” of this prospectus for further details.
SUMMARY
– 22 –
Temporary Power Restrictions
In September and October of 2021, certain regions of China experienced power shortages due to
rising coal prices and governmental mandates to reduce carbon emissions, which resulted in delays in
production for manufacturers in the relevant regions. Our production facilities based in Nanjing were
subject to temporary power restrictions imposed by the relevant utilities providers intermittently for
approximately two weeks, from October 5 to 21, 2021. However, such restrictions have not resulted in a
material adverse impact on our volume of production or business operations. We purchased additional
electricity generators and implemented measures to reduce our energy consumption. Such additional
generators produced electricity through diesel fuel. We also used solar power to supplement our electricity
supply. In addition, as we maintained a sufficient inventory of parts and components and the duration of
power restrictions was limited, such restrictions did not have a material adverse impact on our production
and delivery of finished products.
During the period of temporary power restrictions, the relevant utilities providers imposed limits on
their supply of electricity to us, but not on our power usage. In particular, the relevant utilities providers
did not prohibit the use of additional electricity generators. As advised by our PRC Legal Adviser, PRC
law does not prohibit us from obtaining and using electricity generators. Therefore, our action of obtaining
extra power sources by additional in-house electricity generators is legal and does not constitute a
potential circumvention of any legal or regulatory restriction.
In the years ended December 31, 2018, 2019 and 2020 and the nine months ended September 30,
2021, our electricity costs were US$2.5 million, US$2.6 million, US$3.2 million and US$3.1 million,
respectively, representing 0.5%, 0.4%, 0.4% and 0.4% of our cost of sales, respectively. Given the
relatively small contribution of electricity costs to our overall cost structure, our Directors are of the view
that recent adjustments in electricity pricing will not have a material adverse effect on our business
operations and financial condition.
As at the Latest Practicable Date, we had not experienced any material delay in delivery of raw
materials from our suppliers or material delay in product delivery by us to our customers due to the recent
electricity shortage and our business operations and financial condition had not been materially affected
by the recent electricity shortage or increase in electricity prices in the PRC.
In early November 2021, the State Grid Corporation of China, which is China’s primary operator of
power grids nationwide, announced that electricity supplies have returned to normal. We believe the power
shortage and restrictions have not resulted in a material adverse impact on our business operations and
financial performance during the Track Record Period and up to the Latest Practicable Date.
Impact of the COVID-19 Pandemic
Please refer to the section headed “– Impact of COVID-19 on Our Operations” for further details
regarding the impact of recent COVID-19 cases on our operations and financial performance.
SUMMARY
– 23 –

In this prospectus, unless the context otherwise requires, the following terms shall have the
meanings set out below.
“affiliate(s)” with respect to any specified person, any other person, directly orindirectly, controlling or controlled by or under director or indirectcommon control with such specified person
“Articles” or “Articles ofAssociation”
the articles of association of our Company conditionally adoptedon December 8, 2021 with effect from the date on which thisprospectus and GREEN Application Form (together with the otherdocuments required) are submitted to the Registrar of Companiesin Hong Kong and as amended from time to time, a summary ofwhich is set out in Appendix III to this prospectus
“Board” or “Board of Directors” the board of directors of our Company
“business day” any day (other than a Saturday, Sunday or public holiday) on whichbanks in Hong Kong are generally open for business
“BVI” the British Virgin Islands
“CAGR” compound annual growth rate
“CCASS” the Central Clearing and Settlement System established andoperated by HKSCC
“CCASS Clearing Participant” a person admitted to participate in CCASS as a direct participantor a general clearing participant
“CCASS Custodian Participant” a person admitted to participate in CCASS as a custodianparticipant
“CCASS EIPO” the application for the Hong Kong Offer Shares to be issued in thename of HKSCC Nominees and deposited directly into CCASS tobe credited to your or a designated CCASS Participant’s stockaccount through causing HKSCC Nominees to apply on yourbehalf, including by (i) instructing your broker or custodian who isa CCASS Clearing Participant or a CCASS Custodian Participantto give electronic application instructions via CCASS terminals toapply for the Hong Kong Offer Shares on your behalf, or (ii) if youare an existing CCASS Investor Participant, giving electronicapplication instructions through the CCASS Internet System(https://ip.ccass.com) or through the CCASS Phone System (usingthe procedures in HKSCC’s “An Operating Guide for InvestorParticipants” in effect from time to time). HKSCC can also inputelectronic application instructions for CCASS Investor Participantsthrough HKSCC’s Customer Service Center by completing aninput request
DEFINITIONS
– 24 –

“CCASS Investor Participant” a person admitted to participate in CCASS as an investor
participant who may be an individual or joint individuals or a
corporation
“CCASS Participant” a CCASS Clearing Participant, a CCASS Custodian Participant or
a CCASS Investor Participant
“Chervon Auto Precision
Technology”
Nanjing Chervon Auto Precision Technology Co., Ltd. (南京泉峰汽車精密技術股份有限公司), a company established in the PRC
with limited liability on March 19, 2012 whose shares are listed on
the Shanghai Stock Exchange (stock code: 603982.SH) and is held
by Chervon Precision Technology Holdings Company Limited, a
subsidiary of Chervon Global, as to 35.75% and Chervon (China)
Investment as to 23.12%
“Chervon (China) Investment” Chervon (China) Investment Co., Ltd* (泉峰(中國)投資有限公司),
a company established in the PRC with limited liability on August
2, 2016 and a direct wholly-owned subsidiary of our Company
“Chervon (China) Tool Sales” Chervon (China) Tools Sales Co., Ltd.* (泉峰(中國)工具銷售有限公司), a company established in the PRC with limited liability on
June 28, 2010 and an indirect wholly-owned subsidiary of our
Company
“Chervon Global” Chervon Global Holdings Limited, a company incorporated in the
BVI with limited liability on July 30, 2009 and is held by
Panmercy as to 66.72%, Green Hope as to 24.67%, Klamm as to
6.85%, Vision Easy Investments Limited as to 1.14%, Above
Success Developments Limited as to 0.42% and Mr. Francois D
Sicart as to 0.20%
“Chervon HK” Chervon (HK) Limited (泉峰(香港)有限公司), a company
incorporated in Hong Kong with limited liability on November 8,
2010 and a direct wholly-owned subsidiary of our Company
“Chervon International Trading” Nanjing Chervon International Trading Co., Ltd.* (南京泉峰國際貿易有限公司), a company established in the PRC with limited
liability on January 10, 1994, the predecessor of our Group
“Chervon Management Services” Chervon (Nanjing) Management Services Co., Ltd.* (泉峰(南京)管理服務有限公司), a company established in the PRC with limited
liability on February 2, 2021
“Chervon NA” Chervon North America, Inc., a company incorporated in the U.S.
with limited liability on February 25, 2005 and an indirect
wholly-owned subsidiary of our Company
DEFINITIONS
– 25 –

“Chervon Vietnam” Chervon Industry (Vietnam) Company Limited (泉峰實業(越南)有限公司), a company incorporated in Vietnam with limited liability
on January 21, 2020 and an indirect wholly-owned subsidiary of
our Company
“China” or the “PRC” the People’s Republic of China excluding, for the purpose of this
prospectus, Hong Kong, Macau and Taiwan
“Companies Ordinance” the Companies Ordinance (Chapter 622 of the Laws of Hong
Kong), as amended or supplemented from time to time
“Companies (Winding Up and
Miscellaneous Provisions)
Ordinance”
the Companies (Winding Up and Miscellaneous Provisions)
Ordinance (Chapter 32 of the Laws of Hong Kong), as amended or
supplemented from time to time
“Company”, “our Company”, “we”
or “us”
Chervon Holdings Limited, a company incorporated in Hong Kong
with limited liability on February 19, 1999
“connected person(s)” has the meaning given to it under the Hong Kong Listing Rules
“Controlling Shareholder(s)” has the meaning ascribed to it under the Listing Rules and except
where the content requires otherwise, refers to Mr. Pan and
Panmercy
“CSRC” China Securities Regulatory Commission (中國證券監督管理委員會)
“Director(s)” the director(s) of our Company
“EGO Europe” EGO Europe GmbH, a company incorporated in Germany with
limited liability on November 20, 2015 and an indirect wholly-
owned subsidiary of our Company
“Extreme Conditions” extreme conditions caused by a super typhoon as announced by the
government of Hong Kong
“Flex EL” Flex Elektrowerkzeuge GmbH, a company incorporated in
Germany with limited liability on November 27, 1980 and an
indirect wholly-owned subsidiary of our Company
“Frost & Sullivan” Frost & Sullivan (Beijing) Inc., Shanghai Branch Co., the industry
consultant
“Global Offering” the Hong Kong Public Offering and the International Offering
DEFINITIONS
– 26 –
“GREEN Application Form(s)” the application form(s) to be completed by the HK eIPO WhiteForm Service Provider designated by our Company
“Green Hope” Green Hope Limited (翠鴻有限公司), a company incorporated in
Hong Kong with limited liability on June 11, 2007
“Group”, “our Group”, “we”, “our”
or “us”
our Company and our subsidiaries, or where the context so
requires, in respect of the period before our Company became the
holding company of our present subsidiaries, the business operated
by such subsidiaries or their predecessors (as the case may be)
“HK eIPO White Form” the application for Hong Kong Offer Shares to be issued in the
applicant’s own name, submitted through the IPO App or the
designated website at www.hkeipo.hk
“HK eIPO White Form Service
Provider”
the HK eIPO White Form service provider designated by our
Company, as specified in the IPO App and on the designated
website at www.hkeipo.hk
“HK$” Hong Kong dollars, the lawful currency of Hong Kong
“HKFRSs” Hong Kong Financial Reporting Standards, which collectively
include Hong Kong Accounting Standards, amendments and
related interpretations promulgated by the Hong Kong Institute of
Certified Public Accountants
“HKSCC” Hong Kong Securities Clearing Company Limited, a wholly-owned
subsidiary of Hong Kong Exchanges and Clearing Limited
“HKSCC Nominees” HKSCC Nominees Limited, a wholly-owned subsidiary of HKSCC
“Hong Kong” or “HK” the Hong Kong Special Administrative Region of the PRC
“Hong Kong Offer Shares” the 7,191,600 Shares being initially offered for subscription in the
Hong Kong Public Offering, subject to reallocation
“Hong Kong Public Offering” the offer of the Hong Kong Offer Shares for subscription by the
public in Hong Kong
“Hong Kong Underwriters” the underwriters of the Hong Kong Public Offering as set out in the
section headed in “Underwriting – Hong Kong Underwriters” in
this prospectus
DEFINITIONS
– 27 –
“Hong Kong Underwriting
Agreement”
the underwriting agreement dated December 15, 2021, relating to
the Hong Kong Public Offering and entered into by, among others,
the Joint Representatives, the Hong Kong Underwriters and our
Company
“independent third party(ies)” person(s) or company(ies) and their respective ultimate beneficial
owner(s), who/which, to the best of our Directors’ knowledge,
information and belief, having made all reasonable enquiries, is/are
not connected with our Company or our connected persons as
defined under the Listing Rules
“Industry Consultant” Frost & Sullivan
“International Offer Shares” the 64,724,400 Shares being initially offered in the International
Offering together with, where relevant, any additional Shares
which may be issued by our Company pursuant to the exercise of
the Over-allotment Option, subject to reallocation
“International Offering” the offer of the International Offer Shares at the Offer Price outside
the United States in offshore transactions in accordance with
Regulation S and in the United States to QIBs only in reliance on
Rule 144A or any other available exemption from registration
under the U.S. Securities Act, as further described in the section
headed “Structure of the Global Offering” of this prospectus
“International Underwriters” the group of underwriters that is expected to enter into the
International Underwriting Agreement to underwrite the
International Offering
“International Underwriting
Agreement”
the international underwriting agreement relating to the
International Offering, which is expected to be entered into by,
among others, the Joint Representatives, the International
Underwriters and our Company on or about the Price
Determination Date
“IPO App” the mobile application for HK eIPO White Form service which
can be downloaded by searching “IPO App” in App Store or
Google Play or downloaded at www.hkeipo.hk/IPOApp or
www.tricorglobal.com/IPOApp
“Jiuhao Electromechanical” Nanjing Jiuhao Electromechanical Industry Co., Ltd.* (南京玖浩機電實業有限公司), a company established in the PRC with limited
liability on July 12, 2016
“Joint Bookrunners” the joint bookrunners as named in the section headed “Directors
and Parties Involved in the Global Offering” of this prospectus
DEFINITIONS
– 28 –
“Joint Global Coordinators” the joint global coordinators in the section headed “Directors andParties Involved in the Global Offering” of this prospectus
“Joint Lead Managers” the joint lead managers in the section headed “Directors andParties Involved in the Global Offering” of this prospectus
“Joint Representatives” China International Capital Corporation Hong Kong SecuritiesLimited and Citigroup Global Markets Asia Limited
“Joint Sponsors” China International Capital Corporation Hong Kong SecuritiesLimited and Citigroup Global Markets Asia Limited
“Klamm” Klamm Limited (宗谷有限公司), a company incorporated in HongKong with limited liability on May 4, 2007 and wholly owned byMr. Ke Zuqian
“Latest Practicable Date” December 7, 2021 being the latest practicable date prior to theprinting of this prospectus for the purpose of ascertaining certaininformation contained in this prospectus
“Listing” the listing of the Shares on the Main Board of the Stock Exchange
“Listing Committee” the Listing Committee of the Stock Exchange
“Listing Date” the date, expected to be on or about Thursday, December 30, 2021on which the Shares are listed on the Stock Exchange and fromwhich dealings in the Shares are permitted to commence on theStock Exchange
“Listing Rules” the Rules Governing the Listing of Securities on The StockExchange of Hong Kong Limited, as amended or supplementedfrom time to time
“MOFCOM” Ministry of Commerce of the People’s Republic of China (中華人民共和國商務部)
“Mr. Pan” Mr. Pan Longquan (潘龍泉), our principal founder, executiveDirector, Chief Executive Officer, Chairman and our ControllingShareholder
“Nanjing Bovon” Nanjing Bovon Power Tools Co., Ltd.*, (南京搏峰電動工具有限公司), a company established in the PRC with limited liability onJanuary 30, 2007 and an indirect wholly-owned subsidiary of ourCompany, which was deregistered on September 22, 2021
“Nanjing Chervon Industry” Nanjing Chervon Industry Co., Ltd.* (南京德朔實業有限公司), acompany established in the PRC with limited liability onSeptember 26, 1997 and a direct wholly-owned subsidiary of ourCompany
DEFINITIONS
– 29 –
“Offer Price” the final offer price per Offer Share (exclusive of brokerage of1.0%, SFC transaction levy of 0.0027% and Stock Exchangetrading fee of 0.005%) of not more than HK$43.60 and expected tobe not less than HK$37.6
“Offer Shares” the Hong Kong Offer Shares and the International Offer Sharestogether with, where relevant, any additional Shares which may beissued by our Company pursuant to the exercise of the Over-allotment Option
“Over-allotment Option” the option expected to be granted by our Company to theInternational Underwriters, exercisable by the JointRepresentatives (on behalf of the International Underwriters),pursuant to which our Company may be required to allot and issueup to an aggregate of 10,787,400 Shares at the Offer Price to coverover-allocations in the International Offering, if any
“Panmercy” Panmercy Holdings Limited (德潤控股有限公司), a companyincorporated in Hong Kong with limited liability on May 23, 2007and our Controlling Shareholder
“PRC Government” or “State” the central government of the PRC, including all politicalsubdivisions (including provincial, municipal and other regional orlocal government entities) and its organs or, as the contextrequires, any of them
“PRC Legal Adviser” Jia Yuan Law Offices, our legal adviser as to the laws of the PRC
“Price Determination Agreement” the agreement to be entered into by the Joint Representatives (forthemselves and on behalf of the Underwriters) and us on the PriceDetermination Date to record and fix the pricing of the OfferShares
“Price Determination Date” the date, expected to be on or about Wednesday, December 22,2021, on which the Offer Price will be determined and, in anyevent, not later than Thursday, December 23, 2021
“QIB” a qualified institutional buyer within the meaning of Rule 144A
“Regulation S” Regulation S under the U.S. Securities Act
“Reorganization” the reorganization of our Group in preparation for the Listing,details of which are set out in the section headed “History,Reorganization and Corporate Structure – The Reorganization” inthis prospectus
“Reporting Accountants” KPMG, Certified Public Accountants, Hong Kong
DEFINITIONS
– 30 –
“RMB” Renminbi, the lawful currency of the PRC
“Rule 144A” Rule 144A under the U.S. Securities Act
“SAFE” State Administration of Foreign Exchange People’s Republic ofChina (中華人民共和國外匯管理局)
“SAFE Circular No. 37” the “Circular on Relevant Issues Concerning Foreign ExchangeControl on Domestic Residents’ Offshore Investment andFinancing and Roundtrip Investment through Special PurposeVehicles” (《關於境內居民通過特殊目的公司境外投融資及返程投資外匯管理有關問題的通知》) issued by SAFE with effect fromJuly 4, 2014
“SAIC” State Administration of Industry and Commerce of the People’sRepublic of China (中華人民共和國國家工商行政管理總局), nowknown as State Administration of Market Regulation (國家市場監督管理總局)
“SFC” the Securities and Futures Commission of Hong Kong
“SFO” the Securities and Futures Ordinance (Chapter 571 of the Laws ofHong Kong), as amended or supplemented from time to time
“Share Registrar” Tricor Investor Services Limited
“Shareholder(s)” holder(s) of Shares
“Shares” ordinary shares in the share capital of our Company
“Skil B.V.” Skil B.V., a company incorporated in the Netherlands with limitedliability on August 12, 2016 and an indirect wholly-ownedsubsidiary of our Company
“STA” the State Taxation Administration of the PRC (中華人民共和國國家稅務總局)
“Stabilization Manager” China International Capital Corporation Hong Kong SecuritiesLimited
“Stock Borrowing Agreement” the agreement expected to be entered into on or around the PriceDetermination Date between the Stabilization Manager and/or itsaffiliates and Panmercy, pursuant to which the StabilizationManager may, on its own or through its affiliates, requestPanmercy to make available to the Stabilization Manager or itsaffiliates up to a total of 10,787,400 Shares to cover over-allocations in the International Offering
DEFINITIONS
– 31 –
“Stock Exchange” The Stock Exchange of Hong Kong Limited
“Takeovers Code” the Codes on Takeovers and Mergers and Share Buy-backs, asamended, modified and supplemented from time to time
“Track Record Period” the years ended December 31, 2018, 2019 and 2020 and the sixmonths ended June 30, 2021
“UK” the United Kingdom of Great Britain and Northern Ireland
“Underwriters” the Hong Kong Underwriters and the International Underwriters
“Underwriting Agreements” the Hong Kong Underwriting Agreement and the InternationalUnderwriting Agreement
“U.S.” or “United States” the United States of America
“U.S. Securities Act” the United States Securities Act of 1933, as amended from time totime
“%” per cent.
* For identification purposes only
In this prospectus, the terms “associate”, “close associate”, “connected person”, “connected
transaction”, “core connected person”, “controlling shareholder”, “subsidiary” and “substantial
shareholder” shall have the meanings given to such terms in the Listing Rules, unless the context
otherwise requires.
DEFINITIONS
– 32 –
This glossary contains terms used in this prospectus in connection with us. As such, these terms
and their meanings may not correspond to standard industry meanings or usages of these terms.
“AC” alternating current
“AI” artificial intelligence
“APAC” Asia Pacific
“B2B” business to business
“B2B2C” business to business to consumers
“B2C” business to consumers
“BI” business intelligence system
“BMS” battery management system
“CAGR” compound annual growth rate
“CCC” china compulsory certificate
“CE” Conformite Europeenne
“CNAS” China National Accreditation Service for Conformity Assessment
“CNC” computer numerical control
“CRM” customer relationship management system
“CSA” Canadian Standards Association
“CTDP” Client Test Data Program, which is a means for UL to acceptexternally generated data in support of UL Mark certification
“DC” direct current
“ERP” enterprise resource planning system, which supportsmanufacturing, financial accounting, forecast and planning,purchasing, order management, enterprise performancemanagement and human capital management
“ESG” environmental, social and governance
“EHS” environmental, health and safety
GLOSSARY OF TECHNICAL TERMS
– 33 –

“FEFO” first expired, first out
“FIFO” first in, first out
“FMEA” failure modes and effects analysis, which is a systematic, proactivemethod for evaluating a process to identify where and how it mightfail and to assess the relative impact of different failures, in orderto identify the parts of the process that are most in need of change
“FOB” free on board, a trade term which means that the seller bears allcosts and risks up to the point the goods are loaded on board thevessel designated by the buyer in a manner customary at theparticular port. From that point forward, the buyer bears the costsand risks
“FOC” field oriented control
“Frost & Sullivan Report” industry report issued by Frost & Sullivan, our industry consultant,regarding the global power tool and outdoor power equipmentmarkets
“FVPL” fair value through profit or loss
“HKSIR 200” Hong Kong Standard on Investment Circular ReportingEngagements 200 “Accountants’ Reports on Historical FinancialInformation in Investment Circulars”
“IEC” International Electrotechnical Commission
“injection molding” a plastic manufacturing process involving heating andpressurizing, granules of thermoplastics materials such aspolystyrene into a mold, to form into different shape and size ofproducts
“IoT” internet of things which refers to a network of physical objects thatare embedded with sensors, software, and other technologies usedfor connecting and exchanging data with other devices and systemsover the Internet
“IPQC” in-process quality control
“IQC” incoming quality control
“ISO” International Standard Organization
“LCD” liquid crystal display
“LED” light emitting diode, a two-lead semiconductor light source
GLOSSARY OF TECHNICAL TERMS
– 34 –

“LEEDS” Leadership in Energy and Environmental Design
“MES” manufacturing execution system
“OBM” original brand manufacturing
“ODM” original design manufacturing
“OEM” original equipment manufacturing
“OPE” outdoor power equipment
“OPEI” Outdoor Power Equipment Institute
“OQC” outgoing quality control
“PCBA” printed circuit board assembly
“PLM” product lifecycle management
“PTI” Power Tool Institute
“Pure-play e-commerce channel” a sales and distribution channel that consist of pure-playe-commerce platform(s)
“Pure-play e-commerce platform” an e-commerce platform (where consumers shop products andmake payments to sellers electronically) that focuses on onlinechannels and generally does not operate physical stores, which canbe distinguished from retailers that operate both online and offlinechannels
“QMS” quality management system
“ROW” rest of world
“SCM” supply chain management
“sq.m.” square meters
“SMT” surface mount technology
“SRM” supplier relationship management system
“UL” Underwriters’ Laboratories
“WMS” warehouse management system
GLOSSARY OF TECHNICAL TERMS
– 35 –

This prospectus contains certain forward-looking statements and information relating to our
Company and our subsidiaries that are based on the beliefs of our management as well as assumptions
made by and information currently available to our management. When used in this prospectus, the words
“aim”, “anticipate”, “believe”, “consider” “continue”, “could”, “estimate”, “expect”, “going forward”,
“intend”, “may”, “ought to”, “plan”, “potential”, “predict”, “project”, “propose”, “seek”, “should”, “will”,
“would” and the negative of these words and other similar expressions, as they relate to our Group or our
management, are intended to identify forward-looking statements. Such statements reflect the current
views of our management with respect to future events, operations, liquidity and capital resources, some
of which may not materialize or may change. These statements are subject to certain risks, uncertainties
and assumptions, including the other risk factors as described in this prospectus. You are strongly
cautioned that reliance on any forward-looking statements involves known and unknown risks and
uncertainties. The risks and uncertainties facing our company which could affect the accuracy of
forward-looking statements include, but are not limited to, the following:
• our business strategies, plans of operations and our operation and business prospect;
• future developments, trends and conditions in the industry and markets in which we operate or
into which we intend to expand;
• our business and operating strategies and plans to achieve these strategies;
• general economic, political and business conditions in the markets in which we operate;
• changes to the regulatory environment, operating conditions and general outlook in the industry
and geographical markets in which we operate;
• the effects of the global financial markets and economic crisis;
• our financial condition and performance;
• our ability to develop and manage our operations and business;
• our ability to successfully implement our business plans and strategies;
• our ability to control costs and expenses;
• our ability to identify and satisfy user demands and preferences;
• our ability to maintain good relationships with business partners;
• our capital expenditure and funding plans;
• our dividend policy;
• the amount and nature of, and potential for, future development of our business;
• capital market developments;
FORWARD-LOOKING STATEMENTS
– 36 –
• the actions and developments of our competitors;
• change or volatility in interest rates, foreign exchange rates, equity prices, volumes, operations,
margins, risk management and overall market trends; and
• all other risks and uncertainties set out in the section headed “Risk Factors”.
Subject to the requirements of applicable laws, rules and regulations, we do not have any and
undertake no obligation to update or otherwise revise the forward-looking statements in this prospectus,
whether as a result of new information, future events or otherwise. As a result of these and other risks,
uncertainties and assumptions, the forward-looking events and circumstances discussed in this prospectus
might not occur in the way we expect or at all. Accordingly, you should not place undue reliance on any
forward-looking information. All forward-looking statements in this prospectus are qualified by reference
to the cautionary statements in this section.
In this prospectus, statements of or references to our intentions or those of our Directors are made
as of the date of this prospectus. Any such information may change in light of future developments.
FORWARD-LOOKING STATEMENTS
– 37 –

You should carefully consider all of the information set out in this prospectus before making aninvestment in the Shares, including the risks and uncertainties described below in respect of ourbusiness and our industry and the Global Offering. You should pay particular attention to the fact thatwe are a company incorporated in Hong Kong and that a substantial portion of our operations areconducted in China and are governed by a legal and regulatory environment that in some respectsdiffers from what prevails in other countries. Our business could be affected materially and adverselyby any of these risks.
RISKS RELATING TO OUR INDUSTRY AND BUSINESS
Changes in customer and end-user preferences, inability to maintain mutually beneficialrelationships with large customers, inventory reductions by customers and inability to penetrate newchannels of distribution could adversely affect our business.
We have certain significant customers, particularly home centers, major mass market retailers,e-commerce platforms and tool companies. In the six months ended June 30, 2021, our five largestcustomers accounted for 64.4% of our revenue and the largest customer accounted for 39.6% of ourrevenue. The loss or material reduction of business, the lack of success of sales initiatives, or changes incustomer preferences or loyalties, for our products related to any such significant customer could have amaterial adverse impact on our results of operations and cash flows. In addition, our major customers arevolume purchasers whose orders have accounted for a material portion of our sales. This limits our abilityto recover cost increases through higher selling prices and has considerable influence on other aspects ofour operations as well. For example, for business reasons of their own, our key customers may decide toreduce inventory levels of its products, leading to shortages of our products in their stores despite demand.We cannot provide assurances that we will be able to retain any of our key customers or that thesecustomers will place orders with us in the future at the same levels as in the past. We plan ourmanufacturing volumes, inventory levels and transportation logistics largely based on orders with our keycustomers. If our customers change their marketing and inventory plans and purchasing patterns, we maybe unable to react to such changes and fulfill their demands in a timely manner, if at all, and may be forcedto carry significant volumes of unsold inventory. See also “– Failure to accurately forecast demand mayresult in excess or insufficient inventory levels, which could increase our inventory holding costs, causeinventory build-up, lead to channel stuffing, cause us to lose sales opportunities or decrease our profitmargins” below for more details. The trend toward consolidation in the retail sector may also affect ourcustomer relations and our product distribution model. Our customers may choose to partner with otherproviders of power tools or OPE products to supply products under the proprietary brands of theseproviders. Our customers may also choose to discontinue or change the target market of their private labelsfor which we design and manufacture products under the ODM model, or may decide to use other sourcesaltogether for the design and manufacture of products under their private labels.
In addition, the business of our key customers, and therefore their demand for our products, maydecline as a result of a disruption in our business relations or a general worsening of economic conditionsin our customers’ key markets, such as the home improvement, residential construction and infrastructuremarkets. Our customers may experience liquidity fluctuations or a decline in access to credit as a resultof any downturn in these and their other key markets. If any of our key customers terminate their purchaseor supply agreements with us or significantly change, reduce, delay or cancel the products ordered fromus, or if we are unable to collect fully our accounts receivables from a key customer in a timely manneror at all, our sales and cash flows may decline significantly and our business, financial condition andresults of operations may be materially and adversely affected.
RISK FACTORS
– 38 –

The inability to develop and introduce new products at favorable margins, or low customer demandfor new products, could adversely impact our competitiveness, performance and prospects for futuregrowth.
We are committed to innovation and our growth and success depend on our ability to develop andintroduce new products in a timely manner at favorable margins, and to manage product transitions. Rapidinnovation shortens product life-cycles as products are replaced by those more technologically advancedand with a newer product design. Once a new design or technology becomes available, the demand for andprice of products made with older technologies or designs may decline rapidly. Any delay in thedevelopment of reliable products with advanced features may lead to a decline in brand recognition andmarket penetration. The life cycle of our products typically ranges from 3.5 to 5.5 years. Productinnovation and development are thus critical factors in improving margins and enabling net sales growthin all of our product lines. In 2018, 2019 and 2020 and the six months ended June 30, 2020 and 2021, ourrevenue was US$690.7 million, US$843.6 million, US$1,200.9 million, US$514.4 million and US$868.8million, respectively. During the same years and periods, our gross profit margin was 25.4%, 30.3%,30.7%, 28.7% and 28.9%, respectively.
The uncertainties associated with developing and introducing new products, such as fluctuatingmarket demand, cost and the time it takes may impede the successful development and introduction of newproducts on a consistent basis. We develop new products based in part on our market research based onassumptions concerning end-user needs and preferences as well as in reactions to the products beingdeveloped by our competitors. Such assumptions include price points, tool performance, weight andappearance, all of which may not be in line with actual end-user preferences. End-user preferences mayalso change in line with trends in other product markets, for example, how customer demand for betterenvironmental performance is currently partially driving our product development with focus onlithium-ion battery platforms. Furthermore, market acceptance of our new products and the level of salesgenerated from these new products are affected by our key customers’ investment in advertising campaignsand product promotions, any of which may not attract the kind or number of end-users for which theproducts are intended. End-user loyalties may also shift due to factors affecting our key competitors’market position or other circumstances beyond our control. If our assumptions concerning current andfuture customer preferences and the products being developed by our competitors are incorrect or we failto identify and respond to market trends, we may be unable to sell our products at favorable margins, ifat all.
Market acceptance of the new products introduced in recent years and scheduled for introduction in2021 and beyond may not meet sales expectations due to various factors, such as potential failures toaccurately predict market demand, end-user preferences, and evolving industry standards. Introduction ofnew technologies may result in higher costs to us than that of the technologies replaced. That increase incosts, which may continue indefinitely or if and until increased demand and greater availability in thesources of the new technologies drive their costs down, could adversely affect our results of operations.Moreover, the ultimate success and profitability of the new products may depend on our ability to resolvetechnical and technological challenges in a timely and cost-effective manner, and to achievemanufacturing efficiencies. Our investments in productive capacity and commitments to fund advertisingand product promotions in connection with these new products could erode profits if those expectationsare not met. We cannot provide assurances that our research and development efforts will be successfulor that the technologies we choose to invest in will lead to products that are well received by ourcustomers. We may see limited or no returns on our investment in research and development. If we areunsuccessful in developing new products and production processes in the future or if projects arediscontinued for technical, economic, commercial, regulatory or any other reasons, our competitiveposition and operating results will be harmed. The same holds true if other companies develop alternativetechnologies and solutions that meet customer or end-user preferences better than our products.
RISK FACTORS
– 39 –
We may not be successful in implementing our future business plans and strategies, and if we areunable to execute them effectively and efficiently, our business, financial conditions, results ofoperations and growth prospects may be materially and adversely affected.
We strive to achieve sustainable growth and further strengthen our competitiveness in the globalpower tool and OPE industry by implementing our business strategies. See “Business – Our Strategies”for details. Nonetheless, our business plans and strategies are based on assumptions of future events whichmay entail certain risks and are inherently subject to uncertainties. These assumptions may not be correct,which could affect the commercial viability of our business plans and strategies. As such, there can be noassurance that our business plans and strategies will be implemented successfully as scheduled or at all.
If we fail to implement our business plans and strategies effectively and efficiently, we may beunable to expand our operations, manage our growth, take advantage of market opportunities or remaincompetitive in the industry. Furthermore, even if we implement our business plans and strategieseffectively and efficiently, there may be other unexpected events or factors that prevent us from achievingthe desirable and profitable results. Our business, financial conditions, results of operations and growthprospects may be materially and adversely affected if our future business plans and strategies fail toachieve positive results.
For example, in response to the increasing demands, we plan to seek expansions of our productioncapacities in China, and we may undertake further expansion plans based on our future business needs. See“Business – Production Expansion Plans” for further details. However, the success of our future expansionplans depends on a number of factors that are beyond our control, such as the construction progress of thethird-party constructors, changes in local laws and regulations and government policies, the availabilityof low-cost skilled labor and changes in consumer demands. In addition, the integration of new facilitiesinto our existing operation may be subject to unforeseeable delays, which may, among other things,increase our operation costs, strain our production capacity, cause delays in delivery of customer ordersand decrease our production efficiency. Moreover, our expansion plans may increase our operating costs,such as higher staff costs as well as for depreciation for production equipment and facilities, and increaseour cash outflows for operating and investing activities. Accordingly, we may not be able to achieve theexpected expansion of our operations or manage our growth in a timely or cost-effective manner.
Our historical revenue and profit margin may not be indicative of our future revenue and profitmargin.
During the Track Record Period, we had experienced significant growth in our revenue and net profitand achieved relatively stable gross profit margin. Our annual revenue increased by 22.1% from US$690.7million in 2018 to US$843.6 million in 2019, and further by 42.4% to US$1,200.9 million in 2020. Ourrevenue increased by 68.9% from US$514.4 million in the six months ended June 30, 2020 to US$868.8million in the six months ended June 30, 2021. Our net loss was US$13.5 million for the year endedDecember 31, 2018, and our net profit was US$36.1 million, US$48.4 million, US$20.5 million andUS$91.2 million for the years ended December 31, 2019 and 2020 and the six months ended June 30, 2020and 2021 respectively. Our gross profit margin was 25.4%, 30.3%, 30.7%, 28.7% and 28.9% during therespective periods.
Nevertheless, our historical financial information is a mere analysis of our past performance anddoes not have any implication on or may not necessarily reflect our financial performance in the future.Our business and financial prospect will depend on our capability to secure new business opportunities andto control our costs and are subject to certain factors, such as the effects of the COVID-19 pandemic, thatare beyond our control. Gross profit margin of our products may fluctuate case by case due to factors suchas impact of our relationships with our customers, technical complexity in the design and manufacturing
RISK FACTORS
– 40 –

of our products, and delivery schedule required by our customers as well as COVID-19 on end-user needsfor our products. There is no assurance that the revenue or profit margin of our products in the future willremain at a level comparable to those recorded during the Track Record Period. If we fail to secure newbusinesses or control our cost, or fail to maintain our profit margin at a level comparable to that recordedduring the Track Record Period, our financial conditions may be materially and adversely affected.
We have incurred loss in the past, and we may experience loss in the future.
For the year ended December 31, 2018, we incurred a net loss of US$13.5 million, primarily due to
(i) our increased investments in the OBM business, including marketing and research and development
spending in 2018 and (ii) integration costs associated with our acquisition of the SKIL business. With
respect to our investments in the OBM business, for example, we devoted substantial resources into
developing SKIL-branded lithium-ion battery powered products, which did not launch in Europe market
until the fourth quarter of 2018. Our gross profit margin for 2018 was also lower due to promotion of OBM
products, particularly EGO, through price reductions in order to quickly gain market share. With respect
to the SKIL integration costs, such costs primarily include: (a) replacing certain operational support,
logistics and IT systems, (b) investing in additional research and development efforts, (c) increasing
production capacity and (d) enhancing relevant marketing activities during the transition period. Our
future profitability will depend on a variety of factors, including the performance of our business,
competitive landscape, customer and end-user preference, macroeconomic and regulatory environment,
raw material costs, as well as the uncertainties associated with the COVID-19 pandemic. Therefore, our
revenues may not grow at the rate we expect and it may not increase sufficiently to offset the increase in
our costs and expenses. As a result, we may incur losses in the future.
Our net current liabilities may expose us to certain liquidity risks and could restrain our operationalflexibility as well as affect our ability to expand our business.
As of December 31, 2018 and 2019, we recorded net current liabilities of US$41.3 million and
US$5.1 million, respectively. See “Financial Information – Working Capital” for a detailed analysis of our
net current liabilities/assets position.
Net current liabilities may expose us to certain liquidity risks and could constrain our operational
flexibility as well as adversely affect our ability to expand our business. Our future liquidity will primarily
depend on our ability to maintain adequate cash inflows from our operating activities and adequate
external financing, which will be affected by our future operating performance, prevailing economic
conditions, our financial condition and other factors, many of which are beyond our control. If we do not
have sufficient working capital to meet future financial needs, we may need to resort to external funding.
Our inability to obtain additional external funding on a timely basis or on acceptable terms, or at all, may
also force us to abandon our development and expansion plans, and our business, financial condition and
results of operations may be materially and adversely affected.
Our results of operations are affected by seasonal fluctuations.
We are subject to seasonal fluctuations in market demand for our products. Consumer spending on
power tools generally increases during holiday seasons when gift-giving and product promotions are more
common. Consumer spending on OPE products generally increases during springs and falls, which
correspond to increases in gardening needs of end-users. If we are unable to increase our manufacturing
capacity to meet demand, we may lose potential sales and our contract customers may seek other
RISK FACTORS
– 41 –

manufacturing sources to meet their needs. If we are unable to manage our manufacturing capacity during
a seasonal or market-related downturn in demand, we may be unable to control costs. Our inability to react
to changes in seasonal or cyclical demand on a timely basis may have a material adverse effect on our
business, financial condition and results of operations.
We face active global competition and if we do not compete effectively, our business may suffer.
We face active competition and resulting pricing pressures. Our products compete on the basis of,
among other things, our reputation for product quality, emphasis on product innovation and development,
the breadth of our product lines, our well-known brands and our strong customer relationships and
after-sales services. We compete with both larger and smaller companies that offer the same or similar
products and services or that produce different products appropriate for the same uses. According to the
Frost & Sullivan Report, the global electric power tool market and electric OPE market is relatively
concentrated, as the top 10 players accounted for approximately 73.3% and 88.3% of market shares by
revenue in 2020, respectively. To remain profitable and increase our market share, we must maintain a
competitive cost structure, develop new products and services, lead product innovation, respond to
competitor innovations and enhance our existing products in a timely manner. We may not be able to
compete effectively on all of these fronts and with all of our competitors, and the failure to do so could
have a material adverse effect on our sales and profit margins.
We are actively involved in creating a comprehensive product development system. In the event we
are not successful in effectively applying our research and development in areas such as lithium-ion
battery technologies, our future earnings and ability to compete could be materially and adversely
affected.
In addition, we may have to reduce prices on our products and services, or make other concessions,
to stay competitive and increase market share. Price reductions taken by us in response to customer and
competitive pressures, as well as price reductions and promotional actions taken to drive demand that may
not result in anticipated sales levels, could also materially and negatively impact our business. If we are
forced to reduce our prices as a result of competitive pressures in the markets, we may be unable to pass
any increases in the prices of raw materials and components on to our customers or end-users. Such price
reductions taken by us may not generate the anticipated revenues and we may be unable to reduce our total
costs in line with the revenues, which may have a material adverse effect on our business, financial
condition and results of operations.
Our growth strategies depend substantially on our ability to successfully expand into new saleschannels, and to reinforce our market positions in existing markets.
We plan to reinforce our market positions in existing markets such as North America, Europe and
China and explore opportunities for expanding our sales channels, such as online e-commerce platforms.
Please see the section headed “Business – Our Strategies” in this prospectus for more details on our growth
strategies. There can be no assurance that our efforts to reinforce our existing market positions will
continue to be successful.
We conduct our business on a global basis. Expansion into new sales channels in which we have
limited operating experience and brand recognition may present operating and marketing challenges that
are different from those we currently face. These sales channels may have different competitive dynamics,
consumer preferences and discretionary spending patterns. End-users in these sales channels are likely to
RISK FACTORS
– 42 –
be unfamiliar with our brands and products, and we may need to build or increase brand awareness in the
relevant sales channels by increasing our investments in advertising and promotional activities. For these
or other reasons we may not be successful in expanding into new sales channels, which in turn could affect
our growth prospects and our overall profitability.
We may over-expand our sales network, and may not be able to effectively manage any overlap orpotential competition among our different sales channels, such as cross-region sales.
During the Track Record Period, we sold our products through our multi-channel sales network,which covers various offline and online channels. Our success depends highly on our ability to maintainand expand these offline and online sales and distribution network. We may over-expand our salesnetwork, which may result in excessive sales and distribution costs without the anticipated benefits. Wecannot assure you that we can implement effective measures to manage overlap or potential competitionamong our sales channels. As a result, the expansion of our sales network may not lead to proportionateexpansion of our sales revenue. Furthermore, adverse competition and cannibalization, such ascross-region sales in contravention of contractual obligations of distributors, among our sales channelsmay have a negative impact on the stability of our sales network, which may have a material and adverseeffect on our profitability, business, financial condition and results of operations.
In certain instances, our distributors may further enter into agreements with their sub-distributors,and we normally do not enter into distributorship agreements or directly establish relationships with thesub-distributors. Accordingly, we generally have limited control over the sub-distributors and we rely onour distributors to manage and control the sub-distributors. In the event our distributors fail to effectivelymanage their sub-distributors, competition among such sub-distributors may result in cannibalizationwithin our sales channels, which may have an adverse effect on our business, results of operations andfinancial condition.
Our results of operations could be negatively impacted by our ability to obtain raw materials,component parts, freight, energy, labor and sourced finished goods in a timely and cost-effectivemanner and inflationary or deflationary economic conditions.
The key raw materials, parts and components for our operations primarily include battery cells,motor enameled wires, motor stamping, electronic integrated circuits, plastic particles and othercomponents for the manufacturing of power tools and OPE products. Our cost base also reflects significantelements for freight, energy and labor. The prices for these raw materials are subject to price volatilityattributable to a number of factors which may be beyond our control, such as inflation, supplier capacityconstraints, general economic conditions, demand from other industries for the same materials, theavailability of complementary and substitute materials, and local and national regulatory requirements.Any significant increases in our cost of raw materials may increase our cost of sales and negatively affectour profit margin and, more generally, our business, financial condition, results of operations andprospects. In addition, we source large volumes of battery cells and chips from global suppliers, and anysupply shortages may negatively affect our operations.
Most of our raw materials and sourced goods are obtained on a “purchase order” basis; however, inlimited cases where we have supply contracts with fixed prices, we may be required to purchase rawmaterials or sourced goods at above-market prices, which could adversely impact gross margins. Inaddition, in some instances our options for suppliers may be limited due to market shortages for certainraw materials, parts or components such as battery cells or chips during certain time periods. Factorsincluding supply interruptions of production materials resulting from shortages, labor strikes and disputesor supplier insolvencies or other factors, could have a material negative effect on our profitability.
RISK FACTORS
– 43 –
Please refer to the section headed “– The COVID-19 pandemic has led to, and may cause further,
logistical delays in relation to raw materials and finished goods as well as price fluctuations of
transportation costs, which may negatively affect our business and results of operations” in this prospectus
for further details.
Furthermore, if we are unable to mitigate any inflationary increases through various customer pricing
actions and cost reduction initiatives, our profitability may be adversely affected. In the event there is
deflation, we may experience pressure from our customers to reduce prices, and there can be no assurance
that we would be able to reduce our cost base (through negotiations with suppliers or other measures) to
offset any such price concessions which could adversely impact our results of operations and cash flows.
As a result of inflationary or deflationary economic conditions, we believe it is possible that a limited
number of suppliers may either cease operations or require financial assistance from us in order to fulfill
their obligations. In a limited number of circumstances, the magnitude of our purchases of certain items
is of such significance that a change in established supply relationships with suppliers or increase in the
costs of purchased raw materials, component parts or finished goods could result in manufacturing
interruptions, delays, inefficiencies or an inability to market products. Changes in value-added tax rebates
currently available to us could also increase the costs of our manufactured products as well as purchased
products and components and could adversely affect our results.
The prices or availability of raw materials, energy or other production factors vary with market
conditions and may be highly volatile. There can be no assurance that we will be able to fully pass raw
material price increases on to our customers. In September and October of 2021, certain regions of China
experienced power shortages due to rising coal prices and governmental mandates to reduce carbon
emissions, which resulted in delays in production for manufacturers in the relevant regions. Our
production facilities based in Nanjing were subject to temporary power restrictions imposed by relevant
utility providers intermittently for approximately two weeks, from October 5 to 21, 2021; however, such
restrictions have not resulted in a material adverse impact on our volume of production. We purchased
additional electricity generators and implemented measures to reduce our energy consumption. Such
additional generators produced electricity through diesel fuel. We also used solar power to supplement our
electricity supply. In addition, as we maintained a sufficient inventory of parts and components and the
duration of power restrictions was limited, such restrictions did not have a material adverse impact on our
production and delivery of finished products.
During the period of temporary power restrictions, the relevant utilities providers imposed limits on
their supply of electricity to us, but not on our power usage. In particular, the relevant utilities providers
did not prohibit the use of additional in-house electricity generators. As advised by our PRC Legal
Adviser, PRC law does not prohibit us from obtaining and using electricity generators. Therefore, our
action of obtaining extra power sources by additional electricity generators is legal and does not constitute
a potential circumvention of any legal or regulatory restriction.
In the years ended December 31, 2018, 2019 and 2020 and the nine months ended September 30,
2021, our electricity costs were US$2.5 million, US$2.6 million, US$3.2 million and US$3.1 million,
respectively, representing 0.5%, 0.4%, 0.4% and 0.4% of our cost of sales, respectively.
In early November 2021, the State Grid Corporation of China, which is China’s primary operator of
power grids nationwide, announced that electricity supplies have returned to normal. We believe the power
shortage and restrictions have not resulted in a material adverse impact on our business operations and
RISK FACTORS
– 44 –

financial performance during the Track Record Period and up to the Latest Practicable Date. However, in
the event we experience power shortages and restrictions in the future, our business operations and
financial performance could be materially and adversely affected.
If our logistics service providers fail to provide reliable and timely logistics services, our business,financial condition and results of operations may be materially and adversely affected.
We use independent third-party logistics service providers to fulfill and deliver our orders.
Interruptions to or failures in these third parties’ logistics services could prevent the timely or proper
delivery of products to customers, which would harm the businesses we operate. These interruptions or
failures may be due to events that are beyond our control or the control of any of these logistics service
providers, such as inclement weather, natural disasters, accidents, transportation disruptions, including
special or temporary restrictions or closings of facilities or transportation networks due to regulatory or
political reasons, or labor unrest or shortages. These logistics services could also be affected or interrupted
by business disputes, industry consolidation, insolvency or government shut-downs. We may not be able
to find alternative service providers to provide logistics services in a timely and reliable manner, or at all.
Failure to successfully execute our equipment upgrade and capacity expansion plans may have amaterial adverse effect on our business, financial conditions and results of operations.
Our future success will depend, to a large extent, on our ability to increase our production output and
enhance our production efficiency. We have continued to upgrade our current manufacturing equipment,
install additional manufacturing equipment and seek additional manufacturing facilities, such as in China,
to expand our production capacity and enhance our production efficiency. See the section headed
“Business – Production – Production Expansion Plan” in this prospectus for more details. If we fail to
achieve these objectives, we may not be able to attain the desired level of economies of scale in our
operations or reduce our marginal manufacturing costs to the level necessary to maintain our pricing and
other competitive advantages and achieve our business expansion plan.
Our equipment upgrade and capacity expansion have required and will continue to require substantial
capital investment, significant engineering efforts, timely delivery of manufacturing equipment and
dedicated management attention, and are subject to the following risks and uncertainties:
• negative effect on the working capital available to us;
• the need to finance our equipment upgrade and capacity expansion through bank or other
borrowings, which may not be available on commercially reasonable terms or at all;
• increase in depreciation charges associated with our new equipment and interest expenses
associated with our future borrowings for planned upgrade or expansion;
• cost overruns, construction delays, manufacturing equipment problems, including delays in
equipment delivery or delivery of equipment that does not meet our specifications, and other
operating difficulties;
• failure to improve our operational and financial systems and risk monitoring and management
system in line with our upgrade or expansion;
RISK FACTORS
– 45 –

• decrease in the prices of our products, which fail to cover our increased production costs;
• failure to maintain or establish relationships with our existing or prospective customers and
suppliers to match our increased production output;
• the failure of our new equipment to perform as expected and lower our manufacturing cost;
• insufficient management resources to properly oversee and manage our planned capacity
expansion; and
• delay in or denial of government approvals, permits or documents of similar nature necessary
and required for our expansion.
Any of the abovementioned or similar risks or uncertainties could significantly delay or constrain our
ability to execute our equipment upgrade and capacity expansion as planned, which may in turn hinder our
ability to achieve economies of scale and satisfactory utilization rates. As a result, our business, financial
conditions and results of operations may be materially and adversely affected.
We are exposed to market risk from changes in foreign currency exchange rates which couldmaterially and negatively impact our profitability.
We manufacture and sell our products in many countries throughout the world. As a result, there is
exposure to foreign currency risk as we enter into transactions and make investments denominated in
multiple currencies. For example, changes in currency exchange rates may affect the relative prices at
which we and our competitors sell products in the same market and the cost of products and services we
require for our operations. Our predominant exposures are in US dollar, Euro and Renminbi (“RMB”). We
are subject to risks arising from the translation of balance sheets and income statements of our subsidiaries
to US dollars as well as risk arising from the export of products and sales outside the country of
manufacturing. With respect to the effects on translated earnings, if RMB strengthens relative to local
currencies, our earnings could be negatively impacted. The translational and transactional impacts will
vary over time and may be more material in the future. There can be no assurance that we can implement
effective measures to reduce or eliminate our exposure to fluctuations in foreign exchange rates. Our net
foreign exchange gain in 2018 and 2019 was US$2.6 million and US$0.5 million, respectively, and our net
foreign exchange loss in 2020 and the six months ended June 30, 2020 and 2021 was US$11.5 million,
US$0.6 million and US$5.4 million, respectively.
We manufacture and source products from the PRC, Vietnam and Germany for sale or resale in other
regions. To the extent the RMB or Vietnamese Dong appreciate, we may also experience cost increases on
such operations or purchases. We may not be successful at translating to customer pricing or implementing
other actions in an effort to mitigate the related cost increases and thus our profitability may be adversely
impacted.
In addition, we enter into foreign exchange forward contracts with financial institutions to mitigate
exposure to fluctuations in foreign exchange rates. Fluctuations in the foreign exchange rates may lead to
losses resulting from our exposure to foreign exchange forward contracts or similar arrangements. In 2018,
2019 and the six months ended June 30, 2020, we recognized net realized and unrealized losses on
derivative financial instruments of US$10.4 million, US$0.8 million and US$1.5 million, respectively,
RISK FACTORS
– 46 –

which were primarily related to our foreign exchange forward contracts. In 2020 and the six months ended
June 30, 2021, we recognized net realized and unrealized gains on derivative financial instruments of
US$8.2 million and US$3.7 million, respectively, which were primarily related to our foreign exchange
forward contracts.
Our manufacturing operations in the PRC and other countries are subject to increasing costs due toinflation and other changes.
As measured by production capacity, the majority of our manufacturing operations are currently
located at our production facilities in the PRC. Furthermore, many of our important suppliers are located
in the PRC. While the PRC economy has experienced rapid growth, such economic growth can lead to
growth in the money supply and rising inflation. General inflation has also led to an increase in labor,
transportation and commodity costs. In order to control inflation in the past, the PRC government had
imposed controls on bank credits, limits on loans for fixed assets and restrictions on state bank lending
to slow economic growth. If these measures are unsuccessful and commodity, utility and supply costs
increase at a higher rate than our prices, particularly if combined with adverse changes in foreign currency
exchange rates, we may not realize the expected cost efficiencies of locating our manufacturing operations
in the PRC.
Similar economic trends may occur in the other countries in which we have manufacturing facilities,
such as in Vietnam. If we are unable to realize the expected cost efficiencies of locating a large percentage
of our manufacturing and research and development operations in the PRC or in other lower-cost
countries, our business, financial condition and results of operations may be materially and adversely
affected.
Our business depends on third-party suppliers to meet our requirements for high-quality productionand timely delivery of raw materials and components. Significant disruption in their supply orincrease in their prices may materially and negatively affect our business.
Our production activities depend on delivery of raw materials and components in a timely manner
from a number of different suppliers. From time to time, our suppliers may extend lead times and may fail
to deliver raw materials or components required for production as scheduled. Even if only one supplier is
unable to deliver on schedule or the products supplied do not meet our specifications, the entire production
process may be delayed. As a result, we may be unable to fulfill our customers’ orders or may have to
delay the timeline for launching new products, resulting in decreases in sales. As a result of the COVID-19
pandemic, supplies of certain raw materials and components and costs of transportation and delivery
schedules were also adversely affected. For more details, please refer to “– Our business may be affected
by the occurrence of contagious diseases, such as COVID-19” below.
Furthermore, if our suppliers experience financial or other difficulties or if worldwide demand for
the raw materials and components they provide increases significantly, the availability of these raw
materials and components could be limited. It could be difficult, costly and time-consuming to obtain
alternative sources for these raw materials or components, or to change product design to make use of
alternative raw materials and components. Difficulties in transitioning from an existing supplier to a new
supplier could create delays in the availability of raw materials and components which would have a
significant adverse impact on our ability to fulfill orders for our products. If we are unable to obtain a
sufficient supply of raw materials and components, or if we experience any interruption in the supply of
raw materials and components, our product shipments could be reduced or delayed. Any or all such
RISK FACTORS
– 47 –

disruptions in supply may affect our ability to meet scheduled product deliveries, damage our reputation
in the market and cause us to lose market share. See also “– Our results of operations could be negatively
impacted by our ability to obtain raw materials, component parts, freight, energy, labor and sourced
finished goods in a timely and cost-effective manner and inflationary or deflationary economic conditions”
below for more details.
In addition, some of our raw materials and components are specifically designed for use in our
manufacturing and assembly processes. They are generally obtained from a limited number of qualified
suppliers for whom we provide the engineering design and specifications. We cannot provide assurances
that our efforts to control quality will be successful or that in the event we must change suppliers we will
be able to obtain satisfactory alternative sources of supply. We also source a large percentage of our raw
materials and components from suppliers located within the PRC. If our PRC-based suppliers experience
increased costs due to changes in PRC labor laws or other regulations or increases in the PRC commodity
and raw material costs, we may find it difficult and costly to adjust our supply chain to include suppliers
in other countries or regions. If our suppliers fail to satisfy our pricing or quality requirements, we may
be subject to increased raw materials and components costs or lose sales.
The occurrence of any of the above could have a material adverse effect on our business, financial
condition and results of operations.
Unsatisfactory performance of or defects in our products may harm our reputation, lead to productreturns or recalls, subject us to significant product liability litigations and have a material adverseeffect on our business, financial conditions and results of operations.
Our products may contain defects that are not detected until after they are shipped or inspected by
our customers. Our failure to maintain the consistency and quality throughout our production process
could result in substandard quality or performance of our products, and product defects could cause
significant damage to our market reputation and reduce our sales and market share. If we deliver any
defective products, or if there is a perception that our products are of substandard quality, we may incur
substantial costs associated with returns or replacements of our products, our credibility and market
reputation could be harmed and our sales and market share may be adversely affected. Further, we may,
as a result of defective products, encounter additional compliance issues that could subject us to
administrative proceedings and unfavorable results such as production rectification. Such proceedings and
unfavorable results could have a material adverse effect on our business, financial conditions and results
of operations.
In addition, as our customers sell our products to the end consumers in their respective markets, we
are also exposed to potential product liability claims, including class action lawsuits, from end consumers
of our products in the relevant jurisdiction in the event that the use of our products results in any health
or safety issue or damage. Such product liability claims typically range from approximately US$600 to
US$270,000. Although we sell some of our products through our customers, including our distributors, and
therefore have no direct sales to the end consumers, we may nevertheless be liable for defects in our
products as a result of general laws on product liability. During the Track Record Period and up to the
Latest Practicable Date, we did not, due to material product quality issues, (i) receive fines, product recall
orders or other penalties from the PRC Government or other regulatory bodies or (ii) receive any products
return requests or complaints from our customers that have a material adverse effect on our business,
financial conditions and results of operations. For details, see the section headed “Business – Quality
Control Measures – Warranty and After Sales Services” in this prospectus.
RISK FACTORS
– 48 –
We cannot assure you that a product liability claim will not be brought against us in the future or
that we will not see increasing litigation over our products as the regulatory regimes surrounding these
products develop, and we cannot assure you as to the outcome of any legal proceedings. Successful
product liability claims against us could result in substantial amount of damages payable by us. Such
disputes may also bring negative publicity that could severely damage our reputation and affect the
marketability of our products, and could result in substantial costs and diversion of our resources and
management’s attention. All of the above impact would in turn materially and adversely affect our
business, financial conditions and results of operations.
We have purchased product liability insurance for claims of personal injury and property damage
caused by our products. See the section headed ”Business – Insurance” in this prospectus for more details.
However, there can be no assurances that we will be able to maintain our product liability insurance on
acceptable terms, and our insurance limit may not be sufficient to cover any or all of our potential losses
in product liability claims. Significant insurance payouts would result in increases in insurance premiums
payable by us. If we cannot maintain our product liability insurance on reasonable terms or our insurance
does not or cannot sufficiently compensate for the losses we sustain in the event of a lawsuit, our business,
financial conditions and results of operations would be adversely affected.
In the future, we may at various times, voluntarily or involuntarily, initiate a recall if any of our
power tools or OPE products, including any systems or parts sourced from our suppliers, prove to be
defective or noncompliant with applicable laws and regulations. Such recalls, whether voluntary or
involuntary or caused by systems or components engineered or manufactured by us or our suppliers, could
involve significant expenses and could adversely affect our brand image, business and results of
operations.
We generally allow end users to return defective products within certain periods in compliance with
regulatory requirements. Our distributors and retailers may also allow their end customers to replace
products for specific types of defects or quality issues. Excessive product returns may materially and
negatively affect our results of operations.
Our power tools and OPE products make use of lithium-ion battery packs, and lithium-ion batterypacks may catch fire or vent smoke and flame on rare occasions.
The battery packs of our power tools or OPE products and make use of lithium cells. While our
battery packs are built with robust safety features and strong heat management capabilities, there can be
no assurance that our batteries will always function safely. If any safety accident occurs to any of the
battery packs of our power tools or OPE products, we could be subject to lawsuits, product recalls or
redesign efforts, all of which would be time consuming and expensive. Also, negative public perceptions
regarding the suitability of lithium-ion cells for applications to power tools or equipment or any future
incident involving lithium-ion cells, such as a vehicle fire, even if such incident does not involve our
power tools or OPE products, could seriously harm customers’ confidence in our power tools and OPE
products.
Furthermore, we may store high volumes of lithium cells and battery modules and packs at our
facilities. Any mishandling of battery cells and battery packs may cause disruption to the operation of such
facilities. While we have implemented safety procedures related to the handling of the cells, there can be
no assurance that a safety issue or fire related to the cells would not disrupt our operations. Any such
disruptions or issues may harm our brand and business.
RISK FACTORS
– 49 –
We are subject to various regulatory and customer-imposed guidelines and may not be successful inmaintaining an effective quality control system.
We are subject to a variety of laws and regulations in the jurisdictions where our products are sold
and guidelines imposed by our customers relating to production safety, health and environmental
conditions. For example, we are required to comply with specific guidelines based on the product safety
standards and restricted and hazardous materials laws and regulations that are applicable in the
jurisdictions where our products are sold. To comply with them, we need to implement and maintain an
effective quality control system to perform various inspections over the course of our entire manufacturing
process. We cannot assure you that our quality control system will continue to be effective. Any significant
failure or deterioration of our quality control system in respect of, among other things, our production
process and product inspection, may seriously damage our product quality. Decline in product quality will
affect our reputation in the market and among our existing or prospective customers, which may lead to
reduced orders or loss of customers, and will severely harm our business, financial conditions and results
of operations.
If we do not continue to develop and maintain highly recognizable brands, or if we incur excessiveexpenses in this effort without achieving anticipated benefits, our reputation, business, financialcondition and operating results may suffer.
Our ability to compete successfully also depends increasingly on our ability to develop and maintain
highly recognizable brands so that our retailers and other customers will continue to purchase our products
in order to meet end-user demand. Highly recognizable brands allow us to realize economies of scale in
our operations. The development and maintenance of such brands require significant investment in
brand-building and marketing initiatives. While we plan to continue increasing our expenditure for
advertising and other brand-building and marketing initiatives over the long term, the initiatives may not
deliver the anticipated results. Further, the results of such initiatives may not cover the costs of the
increased investment. If we are unsuccessful in promoting our brands or fail to maintain our brand position
among our targeted end-user groups, market perception and end-user acceptance of our brands may erode.
Because our branded products are primarily sold through retailers, distributors and e-commerce platforms,
the marketing of our brands may be part of a centralized marketing campaign conducted by the brand’s
primary sellers, over which we have no control. The failure of one of our brands in our primary market
segment or the poor performance of any marketing campaign could significantly impair our sales of
products under such brand and have a material adverse effect on our business, financial condition and
results of operations.
Our brands are important assets of our businesses and violation of our trademark rights byimitators, or the failure of our licensees or vendors to comply with our product quality,manufacturing requirements, marketing standards or other requirements could negatively impactour reputation, brand and results of operations.
Our trademarks enjoy a reputation for quality and value and are important to our success and
competitive position. Unauthorized use of our trademark rights may not only erode sales of our products,
but may also cause significant damage to our brand name and reputation, interfere with our ability to
effectively represent us to our customers, contractors, suppliers and/or licensees, and increase litigation
costs. Similarly, failure by licensees or vendors to adhere to our standards of quality and other contractual
requirements could result in loss of revenue, increased litigation, and/or damage to our reputation and
RISK FACTORS
– 50 –

business. There can be no assurance that our on-going effort to protect our brand and trademark rights and
ensure compliance with our licensing and vendor agreements will prevent all violations. If our products
are counterfeited or imitated in the market, our reputation and results of operations may be negatively
affected.
Our business depends in part on our ability to protect our intellectual property rights and operatingwithout infringing on the rights of third parties.
We rely on patents, copyrights, contractual rights, trade secret protection rights and other intellectual
property rights to protect our proprietary technologies and products. The rapid technological changes that
characterize the power tools and OPE industry require that we must quickly implement new processes and
components with respect to many of our products. We may in the future have difficulty obtaining patents,
copyrights, registered trademarks and other intellectual property rights, and the patents, copyrights and
registered trademarks we receive may be insufficient to provide us with meaningful protection or
commercial advantage. Furthermore, we cannot provide assurance that any patent, copyright, registered
trademark or other intellectual property right owned by, or licensed to, us will be enforceable or will not
be invalidated, circumvented or otherwise challenged in the countries where we operate. If we are unable
to protect the proprietary technology and intellectual property involved, our market position would be
undermined, and our business, financial condition and results of operations may be materially and
adversely affected.
Our design and technology and manufacturing processes are complex and involve the integration of
many different elements. Our success therefore also depends on operating without infringing the
proprietary rights of others. We may be unaware of the intellectual property rights of competitors or other
third parties or unfamiliar with the laws governing those rights in other countries in which our products
are or may be sold. As the number of patents, copyrights and other intellectual property rights in its
industry increases, we may face more frequent intellectual property infringement claims. We may in the
future receive notices from competitors or other third parties alleging that our products or manufacturing
processes infringe on the intellectual property rights of third parties. If we are unable to defend against
third party claims of infringement, our business, financial condition and results of operations may be
materially and adversely affected.
Our success relies on key executives and senior management, product design and developmentengineers, our sales force and other important staff members.
The success of our efforts to grow our business depends on the contributions and abilities of key
executives, experienced product design and development engineers, our sales force and other personnel,
including the ability of our sales force to adapt to any changes made in the sales organization and achieve
adequate customer coverage. We must therefore continue to recruit, retain and motivate management, sales
and other personnel sufficiently to maintain our current business and support our projected growth. A
shortage of these key employees might jeopardize our ability to implement our growth strategy. If we lose
the services of any of our key executives or senior managers and cannot replace them in a timely manner,
our business, financial condition and results of operations may be materially and adversely affected.
We must recruit engineers with expertise in advanced technologies in order to realize our strategy
to improve our market position by continuing to introduce new products and advanced manufacturing
processes. Our success therefore depends on the continued service of, and our ability to attract, retain and
motivate experienced engineers, especially during periods of rapid growth. Competition for such qualified
RISK FACTORS
– 51 –
personnel is intense. We also face intense competition for our engineering, product development and
industrial design talents in the United States, Germany, the United Kingdom and the Netherlands. We
additionally face competition for such personnel from competitors in our industry. If we are unable to
attract or retain experienced research and development and engineering personnel or skilled labor, and are
unable to replace such personnel as necessary, our business, financial condition and results of operations
may be materially and adversely affected.
Our manufacturing capabilities depend on labor supply and middle management.
We have manufacturing facilities in the PRC, Vietnam and Germany. While our assembly line
requires certain manual workers, our labor costs may increase if the labor supply was to decrease or if the
job availability rate was to increase sharply as a result of a sudden increase in manufacturers in the regions
in which our facilities are located. In addition, new labor laws, employee benefit systems or labor taxes
may be put into place by local governments that affect our labor costs. We therefore cannot provide
assurances that we will be able to hire unskilled labor at the same cost as in the past. If we were unable
to recruit, train and retain qualified personnel or maintain a sufficient workforce, while controlling labor
costs, our business, financial condition and results of operations may be materially and adversely affected.
Consistent product quality is partly a result of middle management supervision, including quality
control supervisors and line supervisors. The availability of skilled middle management capable of
directing the manufacturing of our products and of adapting quickly to the demands of new production
processes used to manufacture new products varies considerably in the regions in which we locate our
manufacturing facilities, including the PRC. In those countries in which competition for middle
management is intense, we may encounter increased costs in recruitment, training and retention. If we are
unable to retain or attract middle management at a reasonable cost, or at all, we may encounter delays or
slowdowns in our manufacturing schedule and deterioration in our product quality. As a result, our
business, financial condition and results of operations may be materially and adversely affected.
We have limited control over our distributors, and we cannot assure you that our distributors willcontinuously operate their distribution business in compliance with relevant laws and regulations ortheir obligations under the applicable distribution agreement.
We have limited control over our distributors and we cannot assure you that our distributors will
continuously operate their distribution business in compliance with relevant laws, regulations or our
distributorship agreements. If our distributors improperly use our technology brands, products or
intellectual property rights, it could damage our reputation and brand image, undermine customers’
confidence in us and reduce their long-term demands for our products, which in turn will cause a material
adverse effect on our business, financial conditions and results of operations. Moreover, as the regulations
and policies governing and regulating our power tool and OPE products vary across different countries and
regions, our distributors may not be able to comply with them in a timely manner, or at all. Additionally,
the distributors largely determine the inventory levels of the stores they operate based on their estimation,
and such inventory levels might not correspond to actual market demands and could lead to under-stocking
or over-stocking in the stores they operate. Therefore, we cannot assure you that there will not be
under-stocking or over-stocking in these stores. Under-stocking can lead to missed sales opportunities,
while over-stocking could result in inventory depreciation and decreased shelf space for products that are
in higher demands. These results could adversely affect our business, financial conditions and results of
operations.
RISK FACTORS
– 52 –

Any divestitures or business discontinuations could adversely affect our results of operations andfinancial condition.
We continue to evaluate the performance and strategic fit of our businesses and products and may
decide to sell or discontinue a business or product based on such an evaluation. A decision to divest or
discontinue a business or product may result in asset impairments, including those related to goodwill and
other intangible assets, and losses upon disposition, both of which could have an adverse effect on our
results of operations and financial condition. In addition, we may encounter difficulty in finding buyers
or executing alternative exit strategies at acceptable prices and terms and in a timely manner. In addition,
prospective buyers may have difficulty obtaining financing. Divestitures and business discontinuations
could involve additional risks, including the following:
• difficulties in the separation of operations, services, products and personnel;
• the diversion of management’s attention from other business concerns;
• the retention of certain current or future liabilities in order to induce a buyer to complete a
divestiture;
• the disruption of our business; and
• the potential loss of key employees.
We may not be successful in managing these or any other significant risks that we may encounter
in divesting or discontinuing a business or exiting product lines, which could have a material adverse
effect on our business.
We have operations in a number of different countries and jurisdictions, including in the PRC, whichare subject to legal, regulatory, operational and other risks inherent in international andcross-border operations.
Our business involves international and cross-border operations, particularly in PRC, the United
States, Germany, the United Kingdom, the Netherlands, Australia and New Zealand. We source our
supplies of raw materials and components primarily from suppliers in the PRC, and we locate our
manufacturing facilities primarily in the PRC, Vietnam and Germany. As a result of our global footprint,
we are subject to legal, regulatory, operational, economic, commercial and other risks associated with
operations in multiple jurisdictions, including:
• fluctuations in foreign currency exchange rates;
• increased costs associated with maintaining the ability to understand local markets and follow
their trends, as well as develop and maintain an effective marketing and distribution presence;
• difficulty in providing efficient customer service and support in markets abroad;
RISK FACTORS
– 53 –

• risks associated with dealing with regulatory regimes, regulatory bodies and government
policies with which we might be unfamiliar, in order to obtain overseas permits, licenses, and
approvals necessary to manufacture or import, market and sell products in or to overseas
jurisdictions;
• adverse changes in international laws and agreements, especially those affecting trade and
investment;
• high costs relating to compliance with the commercial and legal requirements of overseas
markets, including those relating to labor, environmental and industry-specific regulations;
• risks associated with local unions and employment disputes, including allegations of
discrimination, harassment, violation of collective bargaining agreements, wrongful
termination, among others;
• managing widespread operations and enforcing internal policies and procedures such as
compliance with U.S. and foreign anti-bribery and anti-corruption regulations;
• difficulty in obtaining or enforcing intellectual property rights;
• strict foreign exchange controls and cash repatriation restrictions;
• unanticipated changes in prevailing political and economic conditions and regulatory
requirements;
• risks associated with compliance with local tax laws and regulations including but not limited
to timely filing of tax returns, tax payment, and disputes or disagreements with local tax
authorities with respect to matters including but not limited to calculation of tax liabilities and
preferential tax treatments;
• risks associated with disputes with local tax authorities on the judgement of transfer pricing
arising out of our intragroup transactions, which may result in reallocation or adjustment of our
taxable income and a different tax amount payable;
• the instability of governments, including the threat of war, or terrorist attacks;
• sanctions against certain countries or organizations, or prohibitions on certain activities;
• the difficulty of enforcing agreements and protecting assets through legal systems in certain
countries; and
• trade barriers such as export requirements, sanctions, tariffs, licensing, and other restrictions
and expenses.
Our overall success as a global business depends, in part, on our ability to succeed in managing such
risks. The risks and their potential impact on us or our business partners vary from country to country and
are difficult to predict with any degree of accuracy. We may not be able to develop and implement policies
and strategies that address these risks effectively in each location in which we conduct business, and there
RISK FACTORS
– 54 –
can be no assurance that our exposure to such risks, which may become greater as we expand our
international operations, will not adversely affect our reputation, business, results of operations and
financial condition or otherwise divert our resources in handling any lawsuits, legal proceedings or
complaints. Please refer to “– Unfavorable economic and geopolitical conditions in the markets in which
we operate, such as the trade tensions between China and the United States, may adversely affect our
sales.”
In addition, any or all of these risks are also faced by our suppliers, many of which supplyinternationally, and the shipping and warehousing providers that ship our supplies to our manufacturingfacilities and our products to their markets. As a result, even if international or cross-border events occurin regions in which we do not operate, such events may still affect our supply and distribution networksand may have a material adverse effect on our business, financial condition and results of operations.
Our business may be affected by the occurrence of contagious diseases, such as COVID-19.
The outbreak of the coronavirus disease 2019 (“COVID-19”), which was declared a “pandemic” bythe World Health Organization in March 2020, and its continued spread worldwide has introduceduncertainty and volatility in global markets. The outbreak has resulted in restrictions on travel, publictransport and prolonged closures of workplaces which has had and may continue to have a material adverseeffect on the global economy and may cause interruptions to our business. Furthermore, the COVID-19pandemic and the resultant restrictions and closures may impact demand, supply and efficient functioningof markets.
While we have resumed normal business operations, we have experienced certain disruptions in ouroperations as a result of the government-imposed suspensions due to the COVID-19 outbreak. In the firstquarter of 2020, a substantial number of our production facilities and offices were closed for certain days.Specifically, our production facilities in Nanjing were closed for 13 days, and our production facility inGermany was closed for 12 days. As a result, our production volume has decreased in the first quarter of2020. Furthermore, our overseas offices in North America and Europe were also temporarily closed forcertain periods from February to April 2020.
We cannot assure you that, going forward, these factors will not result in further disruptions to ouroperations, supply chains on which our business may rely and the movement of goods across borders andpotentially dampen demand of our products and services. In July 2021, a number of positive COVID-19cases appeared in certain areas of Nanjing, PRC, where a majority of our production facilities and officesare located, and Yangzhou, PRC, where a number of our suppliers are located. In July and August of 2021,our production facilities and offices in Nanjing remained open and we have imposed social distancing,mask-wearing and mandatory virus testing requirements for our employees. However, for certain weeksin July and August 2021, some of our employees have been subject to temporary stay-at-home orders andtravel restrictions, and one of our main warehouses suspended operations for 16 days. In addition, due tothe impact of the pandemic, our manufacturing facility in Vietnam suspended operations for 8 days in Julyand August 2021, and gradually resumed production since August 2021. In the six months ended June 30,2021, the designed annual production capacity of the Vietnam plant accounted for approximately 5% ofour aggregate designed annual production capacity. In the third quarter of 2021, we have converted threeleased properties into production facilities. Given the establishment of the additional production facilities,our production capacity has increased since August 2021. As a result of the impact of the COVID-19 casesin Nanjing and Yangzhou, PRC and Vietnam, we expect our revenue growth for the third quarter of 2021to slow down compared to prior periods. Our revenue increased by US$41.0 million, or 13.3%, from
RISK FACTORS
– 55 –

US$307.2 million for the three months ended September 30, 2020 to US$348.2 million for the same periodin 2021. In comparison, our revenue increased by 68.9% from US$514.4 million for the six months endedJune 30, 2020 to US$868.8 million for the six months ended June 30, 2021.
During the COVID-19 pandemic, our end-users in North America and Europe markets generallyspent more time at home due to stay-at-home orders or social distancing requirements, which we believehave contributed to the growing needs for our power tool and OPE products that target the household needsof consumers such as home repairs and maintenance. However, we cannot assure you that the increasedmarket needs for our products will continue after the COVID-19 pandemic is under effective control,particularly in North America and Europe. Declining market needs for our products may negatively andadversely affect our financial conditions, results of operations or cash flows.
The continued impacts of COVID-19 or any future outbreak of a contagious disease may have anadverse impact on our business, financial condition or results of operations. Please refer to the sectionheaded “– The COVID-19 pandemic has led to, and may cause further, logistical delays in relation to rawmaterials and finished goods as well as price fluctuations of transportation costs, which may negativelyaffect our business and results of operations” in this prospectus for further details.
The COVID-19 pandemic has led to, and may cause further, logistical delays in relation to rawmaterials and finished goods as well as price fluctuations of transportation costs, which maynegatively affect our business and results of operations.
The COVID-19 pandemic has affected and may affect future delivery of raw materials and finishedgoods in our supply chain. For example, some of our suppliers were unable to deliver sufficientcomponents to us due to the COVID-19 outbreak in the beginning of 2020. By April 2020, these suppliershad resumed their normal delivery of components. Furthermore, in July 2021, a number of positiveCOVID-19 cases appeared in certain areas of Nanjing, PRC, where a majority of our production facilitiesand offices are located, and Yangzhou, PRC, where a number of our suppliers are located. For certainweeks in July and August 2021, some of our suppliers also suspended operations or reduced productionlevels during such period. As a result, the outbreak caused delays to our supply chain, production scheduleand product delivery. Due to the impact of the COVID-19 cases in Nanjing and Yangzhou, PRC, amongothers, we expect our revenue growth for the third quarter of 2021 to slow down compared to prior periods.If such logistical delays and interruptions in relation to raw materials and finished goods were to occurin the future, our business and results may be materially and adversely affected.
Furthermore, the cost and time for transportation of our products in certain regions of the world alsoincreased as a result of the impact of the COVID-19 pandemic. Given the sharing of sea freight costsbetween us and our customers and relatively small proportion of sea freight costs relative to our cost ofsales, we believe that the rising shipping costs have not resulted in a material adverse impact on our coststructure or overall financial performance. However, if shipping costs continue to rise in the future dueto the impact of the COVID-19 pandemic, our customers could request us to bear the sea freight costs,which would increase our cost of sales and adversely affect our results of operations. Furthermore, ifdisruptions in international shipping patterns as a result of the COVID-19 pandemic were to continue, ourbusiness and results of operations may be adversely and materially affected.
Please refer to the section headed “– Our business may be affected by the occurrence of contagiousdiseases, such as COVID-19” and “– We may be unable to react in a cost-effective manner to changes inglobal transportation patterns resulting from higher fuel prices or other disruptions in internationalshipping patterns” of the prospectus for further details.
RISK FACTORS
– 56 –
Our business is subject to risks associated with sourcing and manufacturing overseas andinternational operations.
We purchase from different countries and jurisdictions certain finished goods and component parts.Substantially all of our cross-border trade operations are subject to customs requirements and to tariffs andquotas set by governments through mutual agreements, bilateral actions or, in some cases, unilateralaction. In addition, the countries in which our products and materials are manufactured or traded may fromtime to time impose additional quotas, duties, tariffs or other restrictions on our cross-border tradingactivities (including restrictions on manufacturing operations) or adversely modify existing restrictions.Cross-border trading is also subject to unpredictable foreign currency variation which may increase ourcost of goods sold. Adverse changes in these cross-border trading costs and restrictions, or our suppliers’failure to comply with customs regulations or similar laws, could harm our business.
Our operations are also subject to the effects of international trade agreements and regulations suchas the North American Free Trade Agreement, and the activities and regulations of the World TradeOrganization. Trade agreements generally have positive effects on trade liberalization, sourcing flexibilityand cost of goods by reducing or eliminating the duties and/or quotas assessed on products manufacturedin a particular country. However, trade agreements can also impose requirements that adversely affect ourbusiness, such as setting quotas on products that may be imported from a particular country into keymarkets including the U.S. or the European Union, or making it easier for other companies to compete,by eliminating restrictions on products from countries where our competitors source products.
Our ability to purchase products from different countries and jurisdictions in a timely andcost-effective manner may also be affected by conditions at ports or issues that otherwise affecttransportation and warehousing providers, such as port and shipping capacity, labor disputes, severeweather or increased homeland security requirements in the U.S. and other countries. These issues coulddelay cross-border trading of products or require us to locate alternative ports or warehousing providersto avoid disruption to customers. These alternatives may not be available on short notice or could resultin higher transit costs, which could have an adverse impact on our business and financial condition.
We may be unable to react in a cost-effective manner to changes in global transportation patternsresulting from higher fuel prices or other disruptions in international shipping patterns.
We rely on transportation timetables in order to reduce the inventory carrying costs of its finishedgoods and in order to respond quickly to changes in customer demand. We and our suppliers also requirereliable and timely transportation in order to avoid carrying a large inventory of raw materials orhalf-finished components. Timeliness in transportation also affects our manufacturing and assembly linesand the delivery of our products to our customers. Changes in the price of oil have affected componentsof our cost of sales in the past, and the price of oil may increase again. Shipping companies have reactedby passing increased fuel prices to their customers as well as by slowing their shipping times in order tosave fuel. For a large portion of our OBM and ODM business, our customers bear the sea freight costs.In the years ended December 31, 2018, 2019 and 2020 and the six months ended June 30, 2020 and 2021,our sea freight costs were US$10.5 million, US$8.2 million, US$17.2 million, US$10.4 million andUS$12.8 million, respectively, representing 2.0%, 1.4%, 2.1%, 2.8% and 2.1% of our cost of sales in therespective periods. Given the sharing of sea freight costs between us and our customers and relativelysmall proportion of sea freight costs relative to our cost of sales, we believe that the rising shipping costshave not resulted in a material adverse impact on our cost structure or overall financial performance.However, if shipping costs continue to rise in the future, our customers could request us to bear the seafreight costs, which would increase our cost of sales and adversely affect our results of operations.
RISK FACTORS
– 57 –

Trucking companies have also increased their prices and slowed their shipping schedules. Changesin transportation costs and schedules may therefore require us to change the way we organize our supplychain and product distribution plans. In addition, global shipping routes and land transportation routes arevulnerable to the threat of social or political instability and international hostilities, including war, as wellas natural disasters, work stoppages and longshoreman strikes. The cost and time for transportation of ourproducts in certain regions of the world also increased as a result of the impact of the COVID-19pandemic. Please refer to “– Our business may be affected by the occurrence of contagious diseases, suchas COVID-19” and “– The COVID-19 pandemic has led to, and may cause further, logistical delays inrelation to raw materials and finished goods as well as price fluctuations of transportation costs, whichmay negatively affect our business and results of operations” for more details. If our efforts to spread thecosts, manage inventory levels for key products, work around disruptions in transportation routes orotherwise reduce the effects of changes in global transportation patterns are inefficient or costly, ourbusiness, financial condition or results of operations may be materially and adversely affected.
Our success depends on our ability to improve productivity and streamline operations to control orreduce costs.
We are committed to continuous productivity improvement and evaluating opportunities to reducefixed costs, simplify or improve processes, and eliminate excess capacity. For example, in the years endedDecember 31, 2018, 2019 and 2020, and the six months ended June 30, 2020 and 2021, our fixed costs(which consist of employees’ salaries and benefits and depreciation and amortization) amounted toUS$117.4 million, US$124.8 million, US$150.5 million, US$62.3 million and US$91.0 million,respectively, representing 17.0%, 14.8%, 12.5%, 12.1% and 10.5% of our revenue during the sameperiods. We are continuously seeking opportunities to streamline our processes, though there can be noassurance that the savings of these actions will not be mitigated by various factors, including economicweakness, competitive pressures, and decisions to increase costs in areas such as sales promotion orresearch and development above levels that were otherwise assumed. Failure to achieve or delays inachieving projected levels of efficiencies and cost savings from such measures, or unanticipatedinefficiencies resulting from manufacturing and administrative reorganization actions in progress orcontemplated, would adversely affect our results. Our rapid growth has and is expected to continue toplace a strain on our administrative and operational infrastructure, in particular on our internal accountingand financial reporting processes and systems. Over the past years, our expansion has required us toexpand our management personnel numbers and increase the complexity of our management structure.There can be no assurance that the new personnel and management structure will enable us to successfullyexecute our strategy or that we will be able to integrate the new personnel and new structure in a timelymanner and without incurring unexpected costs and inefficiencies. We will continue to require additionalresources to manage relationships with new customers in new geographic areas, as well as other thirdparties, such as contracted suppliers, equipment providers and consultants, as our operations expand. Ourability to manage our operations and growth will require us to continue to improve our operational,financial and management controls and reporting systems and procedures. If we are unable to manage ourgrowth and execute our business strategy effectively, our business, financial condition or results ofoperations may be materially and adversely affected.
RISK FACTORS
– 58 –

Our performance may suffer from business disruptions associated with information technology,system implementations, or catastrophic losses affecting distribution centers and otherinfrastructure.
We rely heavily on computer systems to manage and operate our businesses, and record and processtransactions. Computer systems are important to production planning, customer service and orderfulfillment among other business-critical processes. Consistent and efficient operation of the computerhardware and software systems is imperative to the successful sales and earnings performance of ourvarious businesses in many countries.
Despite our efforts to prevent such situations, our systems may be affected by damages orinterruptions from, among other causes, power outages, computer viruses, or security breaches. Computerhardware and storage equipment that is integral to efficient operations, such as e-mail, telephone and otherfunctionality, is concentrated in certain physical locations in the various continents in which we operate.
We may need to upgrade, convert or integrate our information systems from time to time. There canbe no assurance that expected expense synergies will be achieved or that there will not be delays to theexpected timing of such synergies. It is possible the costs to complete the system conversions may exceedcurrent expectations, and that significant costs may be incurred that will require immediate expenserecognition as opposed to capitalization. The risk of disruption to key operations is increased whencomplex system changes are undertaken. If systems fail to function effectively, or become damaged,operational delays may ensue and we may be forced to make significant expenditures to remedy suchissues. Any significant disruption in our computer operations could have a material adverse impact on ourbusiness and results.
Our operations are significantly dependent on infrastructure which is concentrated in severalgeographic locations, notably our manufacturing facilities and/or offices in the PRC, Germany and theUnited States. If any of these were to experience a catastrophic loss, such as a fire, earthquake, hurricane,or flood, it could disrupt operations, delay production, shipments and revenue and result in large expensesto repair or replace the facility. There can be no assurance that we will be able to maintain such insuranceor other insurance on acceptable terms, if at all, at all times in the future or that claims will not exceed,or fall outside of, our insurance coverage, or our provisions for uninsured or uncovered losses will besufficient to cover out ultimate loss or expenditure. If we incur losses in excess of the insurance coverage,our business, financial condition and results of operations may be materially and adversely affected.
Unforeseen events, including war, terrorism and other international conflicts and public health issues
(such as any prolonged recurrence of avian influenza, SARS, swine flu, COVID-19 or other adverse public
health developments), natural disasters, whether occurring in China or abroad, could disrupt our
operations, disrupt the operations of our suppliers or customers, or result in political or economic
instability. These events could reduce demand for our products and make it difficult or impossible for us
to manufacture our products, deliver products to customers, or to receive materials from suppliers. Please
refer to “– Our business may be affected by the occurrence of contagious diseases, such as COVID-19”
below for more details.
RISK FACTORS
– 59 –

We may not be able to obtain adequate financing on commercially reasonable terms on a timelybasis, or at all, and any debt financing may contain covenants that restrict our business oroperations.
We require significant working capital for our operations and capital expenditures for our expansion.
We expect our total indebtedness will continue to increase as a result of our business expansion. See
“Financial Information – Liquidity and Capital Resources.” Historically, we have generally relied on
capital contributions from shareholders, bank loans and other external financing as well as cash generated
from our operations to fund our operations and expansion. Our ability to obtain adequate external
financing depends on a number of factors, including our financial performance and results of operations,
as well as other factors beyond our control, including the global and PRC economies, interest rates, the
applicable laws, regulations, rules and conditions of the geographical regions where we operate. There can
be no assurance that the cash flow generated by our operations will be sufficient to fund our future
operations and expansion plans, nor can we assure you that we will be able to obtain bank loans and other
external financing on commercially reasonable terms or on a timely basis or at all. If we are unable to
obtain financing in a timely manner, at a reasonable cost, on commercially reasonable terms, or at all, or
business and operations may suffer and the implementation of our expansion plans may be delayed.
In addition, we may obtain bank borrowings with certain financial covenants that restrict our
operations. Failure by us to meet payment obligations or to comply with any affirmative covenants, or
violation on our part of negative covenants, may constitute an event of default on our borrowings. If any
event of default occurs, our financial condition, results of operations and cash flows may be materially and
adversely affected.
Furthermore, if we acquire additional funding as a result of our future acquisitions or expansions,
market changes or other developments, we may issue additional equity securities or securities convertible
into our equity securities, issue debt securities or obtain credit facilities to meet our capital requirements.
Any future sale by us of our equity securities or securities convertible into our equity securities would
dilute our Shareholders’ interests. The incurrence of additional debt would also result in increased debt
servicing obligations and may also result in restrictive covenants limiting our shareholding structure,
business and/or operations.
RISK FACTORS
– 60 –
We are exposed to counterparty risk in our hedging arrangements.
From time to time, we enter into arrangements with financial institutions to mitigate exposure to
fluctuations in currency and interest rates, including foreign currency forward contracts and interest rate
swap agreements. As of December 31, 2018, 2019, 2020 and June 30, 2021, we primarily had the
following foreign exchange forward and option contracts and interest rate swap agreements: (i) US$0.5
million, US$1.0 million, US$5.8 million and US$3.1 million of assets in foreign currency forward and
option contracts and interest rate swap agreements, respectively, and (ii) US$3.6 million, US$1.3 million,
US$0.3 million and US$0.6 million of liabilities in foreign currency forward and option contracts and
interest rate swap agreements, respectively. The failure of one or more counterparties to our hedging
arrangements to fulfill their obligations could adversely affect our results of operations.
We may not achieve optimal results in future acquisitions, investments, partnerships or newbusinesses, or may encounter difficulties in integrating and developing the acquired assets orinvestments successfully.
Our business strategy involves acquisitions, investments, or partnerships in our core businesses or
establishing new businesses. During the Track Record Period, we did not engage in any major acquisitions.
Acquisitions involve a number of risks, including:
• the possibility that the acquired companies will not be successfully integrated or that
anticipated cost savings, synergies, or other benefits will not be realized;
• the acquired businesses will lose market acceptance or profitability;
• the diversion of our management’s attention and other resources;
• the potential for post-transaction disputes;
• the incurrence of unexpected liabilities; and
• the loss of key personnel and clients or customers of acquired companies.
In addition, the success of our long-term growth and repositioning strategy will depend in part on
our ability to:
• identify suitable future acquisition candidates;
• obtain the necessary financing;
• combine operations;
• integrate departments, systems and procedures; and
• obtain cost savings and other efficiencies from the acquisitions.
RISK FACTORS
– 61 –

Failure to effectively integrate or manage future acquisitions may adversely affect our existing
businesses and harm our operational results due to large write-offs, contingent liabilities, substantial
depreciation, adverse tax or other consequences. While we have completed the process of integrating the
businesses and operations of past acquisitions, we cannot ensure that all of the planned synergies will be
realized. In addition, certain of the acquisition agreements by which we acquire brands or businesses
require the former owners to indemnify us against certain liabilities related to the operation of each of their
companies before we acquired it. In these agreements, however, the liability of the former owners is
typically limited, and certain former owners may not be able to meet their indemnification responsibilities.
We cannot provide assurances that these indemnification provisions will fully protect us, and as a result
we may face unexpected liabilities which may have a material adverse effect on our business, financial
condition and results of operations.
Furthermore, any post-acquisition disputes with respect to representations, warranties or other
material terms of the merger, acquisition, investment or partnership agreements may adversely affect our
results of operations and financial condition.
Expansion of our activity in emerging markets may result in risks due to differences in businesspractices and cultures.
Our growth plans include efforts to increase revenue from emerging markets primarily through
organic growth. Local business practices in these regions may not comply with U.S. laws, local laws or
other laws applicable to us. When investigating potential acquisitions, we seek to identify historical
practices of target companies that would create liability or other exposures for us if they were to continue
post-completion or as a successor to the target. Where such practices are discovered, we assess the risk
to determine whether we are prepared to proceed with the transaction. In assessing the risk, we look at,
among other factors, the nature of the violation, the potential liability, including any fines or penalties that
might be incurred, the ability to avoid, minimize or obtain indemnity for the risks, and the likelihood that
we would be able to ensure that any such practices are discontinued following completion of the
acquisition through implementation of our own policies and procedures. Due diligence and risk assessment
are, however, imperfect processes, and it is possible that we will not discover problematic practices until
after completion, or that we will underestimate the risks associated with historical activities. Should that
occur, we may incur fees, fines, penalties, injury to its reputation or other damage that could negatively
impact our earnings.
Changes in taxation on our business may materially and adversely affect our business, financialcondition and results of operations.
Our business and operations are subject to the tax laws and regulations of the countries and markets
in which we are organized and in which we operate. Changes in tax laws, tax regulations or interpretations
of these laws or regulations may have a material adverse effect on our business, financial condition and
results of operations. These changes also could materially reduce the sales of some of our products. For
example, U.S. President Biden’s administration has proposed several changes to federal taxation of
corporations, including multinational corporations, and parts of the proposal are working their way
through the U.S. legislative process. Changes to U.S. federal and state taxation adopted into law after the
date of this prospectus could materially and adversely affect our business. We cannot predict whether any
tax laws or regulations impacting corporate taxes or our products will be enacted, what the specific terms
of any such laws or regulations will be or whether, if at all, any laws or regulations would have a material
adverse effect on our business, financial condition and results of operations.
RISK FACTORS
– 62 –
One of our PRC subsidiaries, Nanjing Chervon Industry, is entitled to preferential tax treatment as
a high and new technology enterprise, which allows us to have a lower tax rate that would not be otherwise
be available to us. We plan to apply for the extension of such preferential tax treatment before expiration.
However, there cannot be any assurance that we will be granted such extension, and, if we are not, it would
result in an increase of our effective income tax rate. The effect of PRC tax concessions obtained as a
result of the preferential tax treatment as a high and new technology enterprise is US$1.1 million, US$1.1
million, US$0.7 million, US$0.1 million and US$2.8 million for 2018, 2019, 2020 and the six months
ended June 30, 2020 and 2021, respectively. To the extent that there are any changes in, or withdrawals
of, any preferential tax treatment applicable to us, or increases in the tax rate, our tax liability would
increase correspondingly.
We may be subject to additional tax liabilities in connection with our transfer pricing arrangements,
which could have adverse impacts on our financial condition. Tax authorities may require us to adjust
income and expenses for local tax purposes by requiring a transfer pricing adjustment. A transfer pricing
adjustment could adversely affect us by increasing our tax liabilities, which could further result in late
payment fees and other penalties or limit our ability to obtain or maintain preferential tax treatments and
other financial incentives.
It is uncertain whether we will be able to recover value-added taxes imposed by the Chinese taxauthority.
As of December 31, 2018, 2019 and 2020 and June 30, 2021, we had value-added tax recoverable
of US$9.3 million, US$6.9 million, US$10.6 million and US$11.3 million, respectively. The amount of
input value-added taxes and output value-added taxes are determined by the applicable value-added tax
rate in effect during the period when the purchases from our suppliers or sales to our customers are made.
While the deductible value-added tax may enable us to reduce future tax payment, our deductible
value-added tax may also pose risk to us as its recoverability is dependent on the then applicable
value-added tax rate in effect.
There is no assurance that the deductible value-added tax can be recovered. If there is a lack of
payment from customers or an adjustment of applicable value-added tax rate in effect, the output
value-added tax may be in shortfall in the future, and we may have to write down the deductible
value-added tax, which may significantly affect our business, financial conditions and results of
operations.
In addition, export sales are exempted under VAT rules and an exporter who incurs VAT on purchase
or manufacture of goods should be able to claim a refund from Chinese tax authorities. However, a
reduction in the VAT export refund rate of some goods may cause exporters to bear part of the VAT they
incurred in conjunction with the exported goods. Efforts by the PRC government to increase tax revenues
could result in revisions to tax laws or their interpretation, which could increase our VAT and various tax
liabilities.
RISK FACTORS
– 63 –
Our failure to continue to successfully avoid, manage, defend, litigate and accrue for claims andlitigation could negatively impact our results of operations or cash flows.
We are exposed to and become involved in various litigation matters arising out of the ordinaryroutine conduct of our business, including, from time to time, actual or threatened litigation relating tosuch items as commercial transactions, product liability, workers compensation, our distributors,intellectual property claims and regulatory actions.
In addition, we are subject to environmental laws in each jurisdiction in which business is conducted.Some of our products incorporate substances that are regulated in some jurisdictions in which we conductmanufacturing operations. We could be subject to liability if we do not comply with these regulations. Inaddition, we may be held responsible for remedial investigations and clean-up costs resulting from thedischarge of hazardous substances into the environment, including sites that have never been owned oroperated by us but at which we have been identified as a potentially responsible party under federal andstate environmental laws and regulations. Changes in environmental and other laws and regulations injurisdictions where we conduct business could adversely affect our operations due to increased costs ofcompliance and potential liability for non-compliance.
We manufacture products and perform various services that create exposure to product andprofessional liability claims and litigation. If such products, systems and services are not properlydesigned, manufactured or delivered, personal injuries, property damage or business interruptions couldresult, which could subject us to claims for damages. The costs associated with defending product liabilityclaims and payment of damages could be substantial. Our reputation could also be adversely affected bysuch claims, whether or not successful. Furthermore, defective products could result in loss of sales or lossof customers and would consequently have a materially adverse effect on our reputation and marketperception which in turn could have a significant adverse effect on our sales and results of operations andour financial position.
Potential damages claimed by customers, delayed deliveries, or our failure to comply with qualityrequirements could negatively affect the market acceptance of our other products and our marketreputation in various market segments. The realization of any of these risks could have a material adverseeffect on our business, financial position and results of operations.
There can be no assurance that we will be able to continue to successfully avoid, manage and defendsuch matters. In addition, given the inherent uncertainties in evaluating certain exposures, actual costs tobe incurred in future periods may vary from our estimates for such contingent liabilities. We cannotprovide assurance that our reserve set aside and/or product liability insurance we purchased withthird-party carriers will be sufficient to cover these or other liabilities and costs. If we are unable to defendourselves against material product liability or warranty claims, its business, financial condition and resultsof operations may be materially and adversely affected.
Our business is subject to certain governmental regulations and approvals.
In order to operate our businesses and in response to our expanded international markets, we arerequired to obtain and comply with various permits, licenses, certificates, consents and other approvalsfrom administrative authorities. For example, our products are required to be certified by governmentauthorities or industry standard-setters in some of the key markets we operate in, such as North America,Europe and Asia. Each approval is dependent on the satisfaction of certain conditions and failure to obtaingovernmental approvals could have an adverse effect on our operations. We are also subject to inspections,examinations, inquiries and audits by governmental authorities as part of the process of maintaining orrenewing our permits, licenses or certificates.
RISK FACTORS
– 64 –

There can be no assurance that we will be able to fulfill the pre-conditions necessary to obtain the
required governmental approvals or that we will be able to adapt to new laws, regulations or policies that
may come into effect from time to time with respect to our operations. There may be delays on the part
of relevant administrative bodies in reviewing our applications and granting approvals.
Our business and platforms generate and process certain consumer and other data, and theimproper use or disclosure of such data could subject us to fines and legal liability and harm ourreputation.
Our business and platforms generate and process certain transaction data, user personal information
and user behavioral data, as well as confidential customer and employee data. We face a variety of risks
inherent in handling data, including:
• protecting the data in and hosted on our systems or platforms;
• addressing concerns related to privacy and sharing, safety, security and other factors; and
• complying with applicable laws, rules and regulations relating to the collection, use, disclosure
or security of personal information, including any requests from regulatory and government
authorities relating to such data.
We are subject to data protection laws and regulations both in the PRC and in other jurisdictions
where our customers, suppliers, platform users and other counterparties are located. The laws, rules and
regulations of other jurisdictions may impose more stringent or conflicting requirements and penalties
than those in China, and compliance with these requirements could require significant resources and costs.
For example, within the European Economic Area and in the United States, data protection legislation is
comprehensive and complex and there has been a recent trend toward more stringent enforcement of
requirements regarding protection and confidentiality of personal data.
Failure or partial failure to comply with data protection rules and regulations could result in
substantial monetary fines. There can be no assurance that measures taken by us to implement the
requirements are sufficient to ensure compliance with applicable data protection laws and regulations.
Even if we believe we will be in compliance with such laws and regulations as a result of these measures,
the competent regulatory authorities may conclude otherwise.
Failure, if any, on our part or on the part of third-parties to adequately safeguard consumer data and
any wrongful use of such information or disclosure to unauthorized persons or entities could subject us
to claims for damages or other liability, fines, a loss of customers and reputational damage, all of which
could have a material adverse effect on our business, results of operations, or financial condition.
We store users’ and customers’ proprietary information, and any theft or security breaches would
expose us to the risk of improper use and disclosure of such information, which would result in litigation
and potential liability. Any systems failure or compromise of our security that results in the release of our
users’ data, or in our or our users’ ability to access such data, could seriously harm our reputation and
brand and, therefore, our business, and impair our ability to attract and retain users. We will continue to
maintain internal procedures and security protections that shield against theft and security breaches. We
have implemented systems and processes intended to secure our information technology systems and
prevent unauthorized access to or loss of sensitive data, including through the use of encryption and
RISK FACTORS
– 65 –
authentication technologies. These security measures may not be sufficient for all eventualities and may
be vulnerable to hacking, employee error, malfeasance, system error, faulty password management or other
irregularities. To help protect users and ourselves, we monitor our services and systems for unusual
activity and may block unauthorized operations under suspicious circumstances, which, among other
things, may result in the delay or loss of user orders, impede user access to our products and services, or
subject us to claims or other legal proceedings against us.
Defects related to certain properties leased by us in China may adversely affect our ability to usesuch properties.
As of the Latest Practicable Date, we lease 11 properties in Nanjing, Hangzhou and Changchun,
PRC, with an aggregate floor area of approximately 133,439 sq.m. used as manufacturing facilities, offices
and warehouses to support our business operations. Lease contracts for these properties have not been
registered as of the Latest Practicable Date primarily due to lack of cooperation from the landlord in
providing title certificate and proof of ownership and registering the lease agreement, which were beyond
our control. As advised by our PRC Legal Adviser, according to the relevant PRC laws and regulations,
we might be ordered to rectify this failure to register by competent authority and if we fail to rectify within
a prescribed period, a penalty of RMB1,000 to RMB10,000 for each lease agreement may be imposed on
us as a result, but the legality and validity of the relevant lease contracts are not affected by the lack of
registration. The maximum potential penalties in connection with the non-registration of our lease
agreements are RMB110,000 (US$17,267.9). While we have not been subject to any penalty or
disciplinary action relating to the failure to register such lease agreement, we cannot assure you that we
will not be subjected to penalties or other disciplinary actions for our past and future non-compliance.
In addition, we were not provided with a valid title certificate in respect of one of our leased
properties, which is used as a temporary warehouse, and we may not be able to enforce the lease agreement
in relation to this property. See the section headed “Business – Properties” in this prospectus for more
details. We may not be able to continue to use such property if the validity of such lease is challenged by
third parties. In such a scenario we will have to relocate to other premises, which could result in additional
costs. As of the Latest Practicable Date, we were not aware of any challenge by third parties or government
authority of such title defect. We cannot assure you that in the future, we may not encounter such
challenges. In addition, in the event of relocation, we may incur additional costs, which could adversely
affect our daily operation and cause an impact on our financial condition.
Our insurance coverage may not be adequate to cover all the risks relating to our business andoperations.
As of the Latest Practicable Date, we had obtained and maintained insurance policies that we believe
are customary for businesses of our size and type and in line with the standard commercial practice in
China. For more details on our insurance policies, see the section headed “Business – Insurance” in this
prospectus. However, there are types of losses we may incur that cannot be insured against or that we
believe are not commercially reasonable to insure such as loss of reputation. If we were held liable for
uninsured losses or amounts and claims for insured losses exceeding the limits of our insurance coverage,
our business, financial conditions and results of operations may be materially and adversely affected.
RISK FACTORS
– 66 –

Failure to accurately forecast demand may result in excess or insufficient inventory levels, whichcould increase our inventory holding costs, cause inventory build-up, lead to channel stuffing, causeus to lose sales opportunities or decrease our profit margins.
Incorrect forecasting of demand in the future could result in us experiencing an excess or a shortage
of inventory. The long lead times between ordering and delivery and the need to commit for seasonal
products a long time in advance make it more difficult to accurately match the demand for such items. If
orders do not match actual demand, we could have higher or lower than anticipated stock levels and this
could lead to higher interest charges or less interest income, price reductions or write downs of slow
moving or excess stock resulting in lower profits.
Our ability to track inventory levels of our customers in certain regions or customer segments is
limited. Our current policy requests home center, mass market and distributor customers to provide us with
regular inventory and sales reports. The purpose of tracking inventory levels is mainly to gather sufficient
information and data regarding the market acceptance of our products so that we can reflect the end-users’
preferences in the design of our products in the next season. The tracking of inventory level also provides
useful information such as the market recognition of our products in a particular region so that we can
realign our marketing strategy if needed. However, the implementation of the policy requires the
cooperation of our customers in accurately and timely reporting and submitting the relevant data to us, and
we may not be able to ensure the accuracy of the data provided by the retail outlets or identify or prevent
any excessive inventory build-up at these retail outlets. If we are unable to track our sales and use the data
to manage inventory and reflect end-user preferences in our product design, we are subject to the risk of
inventory build-up or channel stuffing, and our business, financial condition and results of operations may
be materially and adversely affected.
We are exposed to credit risk on our accounts receivable.
While our outstanding trade receivables are covered by credit insurance and we have procedures to
monitor and limit exposure to credit risk on its trade receivables, there can be no assurance such insurance
coverage or procedures will effectively limit our credit risk and avoid losses, which could have an adverse
effect on our financial condition and operating results. Our customers may also face difficulties in
borrowing or otherwise obtaining the cash to support their own activities. If we or our customers are
unable to borrow or otherwise obtain cash on favorable terms, or at all, our business, financial condition
and results of operations may be materially and adversely affected.
We are uncertain about the recoverability of our deferred tax assets, which may affect our financialposition in the future.
As of June 30, 2021, we had deferred tax assets of US$21.5 million. Deferred tax assets arise from
deductible temporary differences, as well as unused tax losses and unused tax credits. Apart from certain
limited exceptions, all deferred tax assets to the extent that it is probable that future taxable profits will
be available against which the assets can be utilized, are recognized. If we suffer losses in the future, we
may not be able to utilize all of our deferred tax assets, which could affect our financial position in the
future.
RISK FACTORS
– 67 –
The determination of fair value changes of financial assets at fair value through profit or loss isbased on significant unobservable inputs, and therefore inherently involves a certain degree ofuncertainty. Fair value changes of such assets could adversely affect our results of operation andfinancial condition.
As of December 31, 2018, 2019 and 2020 and June 30, 2021, our financial assets at fair value
through profit or loss were US$33.1 million, US$20.9 million, US$11.2 million and US$8.7 million,
respectively. We use unobservable inputs, such as net asset value of underlying investments and expected
return rate, in valuing our financial assets at fair value through profit or loss. Accordingly, such
determination requires us to make significant estimates, which may be subject to material changes, and
therefore inherently involves a certain degree of uncertainty. In addition, fair value changes of financial
assets at fair value through profit or loss could adversely affect our results of operation and financial
condition. Factors beyond our control can significantly influence and cause adverse changes to the
estimates we use and thereby affect the fair value of the relevant financial assets. These factors include,
but are not limited to, general economic condition, changes in market interest rates and stability of the
capital markets. Any of these factors, as well as others, could cause our estimates to vary from actual
results, which could materially and adversely affect our results of operation and financial condition. In
addition, the process for determining whether an impairment of financial asset is other-than-temporary
usually requires complex and subjective judgments, which could subsequently prove to have been wrong.
We face risks relating to our interest in associates.
As of June 30, 2021, we had US$58.3 million of interest in associates. Our interest in associates is
related to Chervon Auto Precision Technology, which primarily engages in manufacturing, research and
development and sales of auto parts. Our associates are accounted for using the equity method in our
consolidated financial statements. In 2018, 2019, 2020 and the six months ended June 30, 2021, we
recognized share of profits of associates of US$4.3 million, US$9.2 million, US$6.7 million and US$2.8
million, respectively. However, there can be no assurance that we will continue to recognize share of
profits of associates in the future. In the event that our associates record losses, our results of operations
could be adversely affected. Furthermore, in the event no dividend is declared by the relevant associates,
we are also subject to liquidity risk related to our interest in associates. As we report the profits and losses
of associates using the equity method, there is no cash flow from the associates to the Group until
dividends are paid, which makes interest in associates not as liquid as certain other types of investments.
While Chervon Auto Precision Technology is a publicly traded company and does not present the same
level of liquidity risk as privately held companies do, we are nonetheless subject to liquidity risk in the
event that we are not able to sell our equity interests due to adverse market conditions. In the future, we
also may acquire interests in associates which are privately held companies that may present risks as
described above, and our results of operations may be materially and adversely affected if these risks
materialize.
We have granted and may continue to grant share-based awards in the future under our shareincentive scheme, which may result in significant share-based payment expenses.
We adopted a share incentive scheme (the “Share Incentive Scheme”) in December 2020 for the
purpose of providing incentives to qualified employees. Pursuant to the Share Incentive Scheme, we
granted certain qualified employees the right to subscribe a total of 11,670,500 ordinary shares of the
Company (the “Share Awards”) in December 2020. The subscription price for the Share Awards was
HK$4.7529 (equivalent to US$0.6096) per share. The Share Awards had no service condition and were
RISK FACTORS
– 68 –

fully vested in December 2020. We recognized US$21.1 million share-based payment expense for 2020.
We may continue to grant equity awards, which we believe is of significant importance to our ability to
attract and retain key personnel and employees. As a result, we may recognize significant share-based
payment expenses in the future, which could have an adverse effect on our financial condition and results
of operations.
Unfavorable economic and geopolitical conditions in the markets in which we operate, such as thetrade tensions between China and the United States, may adversely affect our sales.
Our business is dependent on the strength of the retail, commercial and industrial sectors and general
global economic conditions, particularly within North America, Europe and APAC. A significant
deterioration of global economic conditions, such as a temporary or continued economic slowdown,
recessions or sustained loss of consumer confidence and consumer demand, could trigger a decline
(including decreasing production and reduction of capacity) in industries and markets in which we operate
(which may react with even more volatility than in the case of a downturn of overall global or regional
economic conditions) and therefore have a material adverse effect on our business, results of operations
and financial position. We could also be negatively impacted by economic crises in specific countries or
regions, including the deterioration in the creditworthiness of, or a default by, the issuers of sovereign
debt. Such events could negatively impact our overall liquidity and/or create significant credit risks
relative to our local customers and depository institutions. Our business and prospects depend heavily on
the performance of the home improvement, residential construction and infrastructure construction
markets, particularly in North America and Europe. In 2020, approximately 66.5% and 24.7% of our
revenue was attributed to sales in North America and Europe, respectively. As a result, our profitability
may be materially and adversely affected as a result of the cyclicality of economic conditions in such
major markets. Significant factors that impact the home improvement, residential construction and
infrastructure construction markets include the inventory levels of unsold new and existing homes, general
and regional economic conditions, consumer confidence and credit, terms and availability of mortgage
financing, affordability of homes, interest rates, energy costs and, on a more localized basis, weather
conditions and natural disasters.
Demand for some of our products may decline if the U.S. markets deteriorate or there is any
prolonged downturn in the U.S. markets. For example, if the infrastructure construction market is affected
by such economic conditions, demand for our professional and high-end tools may decline. Demand may
also decline if the home improvement and infrastructure construction markets in Europe or in other regions
where we operate deteriorate. In addition, the general weakness in our major markets in the United States
and Europe, both of which are heavily dependent on business and consumer confidence and credit, may
further erode the credit-worthiness of certain customers resulting in increased write-offs of customer
receivables. If demand for our products in its major markets declines, our business, financial condition and
results of operations may be materially and adversely affected.
RISK FACTORS
– 69 –

In addition, we may be adversely affected by political, geopolitical, economic or socialdevelopments in any of the countries in which we operate. Our operations are also subject to a variety ofother risks and uncertainties related to trading in numerous foreign countries, including political oreconomic upheaval and the imposition of any import, export, investment or currency restrictions,including tariffs and import or export quotas or any restrictions on the repatriation of earnings and capital.The materialization of such risks or uncertainties could have a material adverse effect on our business,results of operations and financial position.
We face particular risks relating to international trade agreements and regulations such as the NorthAmerican Free Trade Agreement and the activities and regulations of the World Trade Organization. Wecannot provide assurances that the reduction or elimination of certain duties or trade quotas implementedby these trade agreements will continue. These trade agreements may also impose additional requirements,such as setting quotas on products that may be imported from a particular country into key markets suchas those of the U.S. or the E.U.. Any increased costs resulting from compliance with these tradeagreements may have a material adverse effect on our business, financial condition and results ofoperations.
The ongoing trade dispute between the PRC and the United States and the increase in tariffs that theUnited States imposed on PRC imports have contributed to increased market volatility, weakenedconsumer confidence and diminished expectations for economic growth around the world. In 2018, 2019,2020 and the six months ended June 30, 2021, 37.1%, 32.5%, 36.7% and 22.8% of our revenue wasattributable to sales that were subject to U.S. tariffs, respectively. The majority of our products sold to theU.S. were List 4 products, and the tariff rates for almost all of our List 4 products were zero from January2018 to August 2019. Beginning on September 1, 2019, the tariff rate for List 4 products was raised to15%. In January 2020, United States and PRC signed a phase one trade deal upon which tariffs of 15%that had been imposed on certain List 4 products from September 2019 were reduced to 7.5% and thetariffs to be imposed on the remainder of List 4 products were delayed indefinitely. The tariffs haveremained as of the date of this prospectus which make Chinese goods more expensive and have led U.S.companies to shift some purchases to other countries such as Vietnam. A substantial portion of ourproducts exported to the United States and the materials required for production of our products areconsidered as “List 4 products” of the Section 301 action undertaken by the United States TradeRepresentative and are subject to the increased tariffs. In 2018, 2019, 2020 and the six months ended June30, 2020 and 2021, our duty costs relating to U.S. tariffs were US$0.6 million, US$8.5 million, US$28.4million, US$15.5 million and US$7.9 million, respectively. We cannot assure you that we will be able tofully offset the impact of tariffs on our financial condition, results of operations or cash flows. In addition,political tensions between PRC and the United States have escalated in recent years due to, among otherthings: (i) the aforementioned trade tensions, (ii) the COVID-19 pandemic, (iii) the PRC National People’sCongress’ passage of Hong Kong national security legislation, (iv) the imposition of U.S. sanctions oncertain Chinese officials from PRC’s central government and the Hong Kong by the U.S. government, andthe imposition of sanctions on certain individuals from the U.S. by the Chinese government, and (v)various executive orders issued by the U.S. government affecting certain Chinese companies. Risingpolitical tensions between PRC and the U.S. could reduce levels of trades, investments, technologicalexchanges and other economic activities between the two major economies, which would have a materialadverse effect on global economic conditions and the stability of global financial markets. The measurestaken by the U.S. and Chinese governments may have the effect of restricting our ability to transact orotherwise do business with entities within or outside of PRC and may cause investors to lose confidencein companies with substantial operations in PRC, including us. If we were unable to conduct our businessas it is currently conducted as a result of such regulatory changes, our business, results of operations andfinancial condition would be materially and adversely affected.
RISK FACTORS
– 70 –

The United Kingdom and the European Union signed the trade deal relating to the withdrawal of theUnited Kingdom from the European Union (“Brexit”) on December 30, 2020 and the United Kingdomcompleted its separation from the European Union with effect from January 1, 2021. While the UnitedKingdom and European Union have reached the trade deal, the long-term effect of Brexit remainsuncertain, and Brexit has created, and may continue to create, negative economic impact and increasevolatility in the global markets. These could include further a fall in the value of the key trading currenciessuch as the Euro and/or greater volatility of markets in general due to the increased uncertainty.
Global economic fluctuations have significant impacts on the global economy and on our business.First, a rise in global trade protectionism will negatively impact the trade-dependent economies in Asia.Second, the interplay of U.S. fiscal and monetary policies, and aggressive quantitative easing programs inJapan and Europe may lead to more volatile global capital flows, which could in turn impact globalgrowth. Third, financial market volatility and increased uncertainty may have a broader global economicimpact that may in turn have a material adverse effect on our business, financial condition and results ofoperations. Inflationary pressures have also started to increase as the rebound in global commodity pricesand weak domestic currencies have led businesses to pass on the increased input costs to consumersthrough higher selling prices. To the extent uncertainty regarding the economic outlook negatively impactsconsumer confidence globally, our business and results of operations could likewise be significantly andadversely affected.
In addition, despite recent stabilization of the sovereign debt of several countries of the Eurozone,not all uncertainties regarding the stability and overall standing of the European Monetary Union havedisappeared. Concerns that the Eurozone sovereign debt crisis could worsen again may lead to thereintroduction of national currencies in one or more Eurozone countries or, in more extremecircumstances, to the dissolution of the Eurozone. The withdrawal or risk of withdrawal of one or morecountries from the Eurozone and/or the entire dissolution or the risk of the entire dissolution of theEurozone could have major negative effects on both existing contractual relations and the fulfillment ofobligations by us and/or our customers, which could have a material adverse effect on our business, resultsof operations and financial position.
We are subject to import and export regulations.
In importing or exporting supplies or finished goods among the different countries in which we dobusiness, we are subject to customs requirements and to tariffs and quotas set by governments throughmutual agreements, bilateral actions or, in some cases, unilateral action (e.g., anti-dumping andcounter-veiling tariffs). Additional quotas, duties, tariffs or other restrictions on imports and exports,including restrictions on manufacturing operations, may be imposed from time to time and compliancemay be costly. Adverse changes in import and export laws and regulations or our failure or the failure ofour suppliers to comply with customs regulations or similar laws may expose us to increased costs anddelay the transportation of our products to market. As a major portion of our sales are made to the NorthAmerica and Europe, our success depends particularly on various US import laws and export control andeconomic sanctions laws, which may affect our transactions with our customers, business partners andother persons, including in certain cases dealings with or between our employees and subsidiaries. We alsohave manufacturing operations located in several countries and are subject to diverse raw material andcomponent import controls and product export controls. In certain countries, economic sanctionsregulations may prohibit the export of certain products, services and technologies, or we may be requiredto obtain an export license prior to the export of the controlled item. Compliance with the various importand export laws that apply to our business can restrict our access to, and increase the cost of obtaining,certain products and at times can interrupt our supply of imported inventory price or exchange controlscould limit our operations in certain countries and make the repatriation of profits difficult.
RISK FACTORS
– 71 –

We are subject to national and local environmental and health and safety directives, laws andregulations.
Our manufacturing operations are subject to numerous national and local environmental, health and
safety directives, laws and regulations, including those pertaining to the storage, handling, treatment,
transportation and disposal of hazardous and toxic materials, the construction and operation of our
facilities and standards relating to the discharge of pollutants to air, soil and water. For example, we must
package and transport our lithium-ion batteries and products containing such batteries in accordance with
relevant international and national laws and regulations. During the Track Record Period and up to the
Latest Practicable Date, we were not subject to any material administrative penalties relating to such laws
and regulations. Nonetheless, if we were found to violate environmental, health and safety laws and
regulations in the future, our business, results of operations and financial condition could be materially
and adversely affected. In addition, risks of substantial costs and liabilities, including those related to the
investigation and remediation of past or present contamination, are inherent in our ongoing operations and
in our ownership or occupation of industrial properties. Claims for damages to property or injury to
persons resulting from environmental, health or safety impacts of our operations or past contamination,
could suspend our operations, result in the imposition of fines, penalties or liens, or give rise to civil or
criminal liability. Compliance with these regulations may also require us to alter our manufacturing
processes and our supply sourcing. In addition, some environmental directives specifically regulate
environmental impacts associated with electrical and electronic equipment, such as the Waste Electrical
and Electronic Equipment (the “WEEE”) directive in the European Union that imposes responsibility on
manufacturers and importers of electrical and electronic equipment for the cost of recycling, treatment and
disposal of such equipment after its useful life. We cannot provide assurances that our policies and
procedures to ensure compliance with these directives will be sufficient. We cannot provide assurances
that we will not incur health and safety or environmental losses beyond the limits, or outside the coverage,
of any insurance or that our provisions for health and safety and environmental remediation or related
costs will be sufficient to cover the ultimate loss or expenditure. Furthermore, over time, environmental
and health and safety laws and regulations and the enforcement thereof may become increasingly stringent
and we may incur material costs associated with compliance with new laws and regulations. Any or all of
the above factors and risks may have a material adverse effect on our business, financial condition and
results of operations.
We may be required to make additional contributions of social insurance fund and/or housingprovident fund and late payments and fines under PRC laws and regulations.
We may be required to make additional contributions of social insurance fund and/or housing
provident fund and late payments and fines under PRC laws and regulations. Under relevant PRC laws and
regulations, we are required to make social insurance fund and housing provident fund contributions for
our employees. During the Track Record Period, we did not make the social insurance fund and housing
provident fund contributions in full for some of our employees of our PRC subsidiaries. As advised by our
PRC Legal Adviser, in respect of the outstanding social insurance contributions, the relevant PRC
authorities may demand us to pay the outstanding social insurance funds within a stipulated deadline and
we may be liable for a late payment fee equal to 0.05% of the outstanding amount for each day of delay;
if we fail to make such payments, we may be liable for a fine of one to three times the amount of the
outstanding contributions. In the years ended December 31, 2018, 2019 and 2020, and the six months
ended June 30, 2021, we estimate that the shortfall amounts of such social insurance contributions were
RMB10.6 million (US$1.7 million), RMB11.6 million (US$1.8 million), RMB12.8 million (US$2.0
million) and RMB7.5 million (US$1.2 million), and the corresponding late payment fees that we may be
RISK FACTORS
– 72 –

liable for are RMB1.9 million (US$0.3 million), RMB2.1 million (US$0.3 million), RMB2.3 million
(US$0.4 million) and RMB0.7 million (US$0.1 million), respectively. This amounts to a total of RMB7.0
million (US$1.1 million) in maximum late payment fees that we may be liable for. If we are ordered to
make such payment by competent government authorities, we will do so within the prescribed time period
and we do not expect to incur fines for the outstanding amounts of social insurance contributions. In
respect of the outstanding housing provident fund contributions, we may be demanded by the relevant PRC
authorities to pay the underpaid amount to the housing provident fund within a prescribed time limit,
failing which we may be subject to the compulsory enforcement by the People’s Court. In the years ended
December 31, 2018, 2019 and 2020, and the six months ended June 30, 2021, we estimate that the shortfall
amounts of such housing funds contributions were RMB3.5 million (US$0.6 million), RMB3.8 million
(US$0.6 million), RMB4.2 million (US$0.7 million) and RMB2.5 million (US$0.4 million), respectively.
If we were ordered to make such payment, we will do so within the prescribed time period, and we do not
expect to incur late payment fees or fines for any outstanding amounts of contributions. Our PRC Legal
Adviser is of the opinion that the risk of us being fined is remote provided that we pay the unpaid amount
for social insurance and housing provident funds in full amount in a timely manner after receiving notices
to rectify such non-compliance from the relevant PRC authorities. As of the Latest Practicable Date, we
had not received any notification from the relevant authorities demanding payment of the outstanding
contributions to the social insurance and the housing provident funds or fine in relation thereto. See the
section headed “Business – Legal Proceedings and Compliance” in this prospectus for details. However,
we cannot assure you that we will not be subject to any order to rectify the non-compliance in the future,
nor can we assure you that there are no, or will not be any, employee complaints regarding payment of
the outstanding amount of the social insurance and housing provident fund contributions against us, or that
we will not receive any claims in respect of the outstanding amount of the social insurance and housing
provident fund contributions under national laws and regulations. In addition, we may incur additional
expenses to comply with such laws and regulations promulgated by the PRC Government or relevant local
authorities.
The enforcement of Chinese Labor Contract Law, Social Insurance Law and other labor relatedregulations may materially affect our business, financial condition and results of operations.
Pursuant to Chinese Labor Contract Law (《中華人民共和國勞動合同法》), effective in January
2008 and amended in December 2012, and its implementation rules that became effective in September
2008, employers are subject to strict requirements in terms of signing labor contracts, minimum wages,
paying remuneration, overtime working hours limitations, determining the term of employees’ probation
and unilaterally terminating labor contracts. In the event that we decide to terminate the employment of
some of our employees or otherwise change our employment or labor practices, the Chinese Labor
Contract Law and its implementation rules may limit our ability to effect those changes in a desirable or
cost-effective manner, which could adversely affect our business and results of operations. In addition, we
experience fluctuations in our labor demand from time to time, and there can be no assurance that we will
be able to recruit sufficient employees to satisfy such demand.
RISK FACTORS
– 73 –
On October 28, 2010, the Standing Committee of the National People’s Congress promulgated
Chinese Social Insurance Law (《中華人民共和國社會保險法》), which became effective on July 1, 2011
and was amended on December 29, 2018. According to the Chinese Social Insurance Law, employees must
participate in pension insurance, work-related injury insurance, medical insurance, unemployment
insurance and maternity insurance and the employers must, together with their employees or separately,
pay the social insurance premiums for such employees.
In addition, under the Regulations on the Administration of Housing Provident Funds (《 住房公積金管理條例》), effective in April 1999 and amended in March 2002 and March 2019, employers are
required to pay housing provident fund for their employees according to the statutory payment base and
payment ratio.
As the interpretation and implementation of the Chinese Labor Contract Law, the Chinese Social
Insurance Law and other labor related regulations are still evolving, we cannot assure you that our
employment practice do not and will not violate labor-related laws and regulations in the PRC, which may
subject us to labor disputes or government investigations. If we are deemed to have violated relevant
labor-related laws and regulations, we could be required to provide additional compensation to our
employees and our business, financial condition and results of operations could be materially and
adversely affected.
Our manufacturing operations are located in several different countries, each with their ownregulatory regime.
Our manufacturing operations are located in several countries, including the PRC, Vietnam and
Germany. We expect that manufacturing in, and sourcing our supplies from the PRC will represent a
substantial portion of our total production capacity. The regulatory regime of the PRC, in particular, differs
from those found in most developed countries, particularly in the level of government involvement.
Although the PRC government has for the past two decades implemented economic reforms that affect the
regulatory regimes applied to manufacturing and other facilities, many of these reforms are experimental
or unprecedented and may have unexpected results affecting our manufacturing operations and supply
sources in the PRC. The PRC government has also expressed an intention to take measures to maintain
economic growth at a sustainable level including certain restrictions on bank loans, any of which may
affect the operating liquidity of our, or our suppliers’, manufacturing and other facilities. In each of the
countries in which we locate our manufacturing or other facilities, we will continue to be exposed to
unexpected changes in regulatory requirements, potentially adverse tax and regulatory consequences,
currency exchange restrictions, tariffs and other trade barriers, political instability and the threat that its
operations or property could be subject to nationalization or expropriation. Any or all of the above factors
and risks may have a material adverse effect on our business, financial condition and results of operations.
We have a large labor force and our labor costs may be increased due to changes in applicable laborlaws.
Our manufacturing and research and development facilities are located in the PRC, Vietnam,
Germany, the United States, the United Kingdom and the Netherlands. The labor laws and protections
given to employees differ in each of the jurisdictions in which we operate and such laws and protections
are subject to change. The trend toward increasing employee protection in each of the countries in which
we locate our manufacturing operations may increase our labor costs. Our direct labor costs amounted to
US$25.3 million, US$30.6 million, US$42.5 million, US$16.2 million and US$33.5 million in the years
RISK FACTORS
– 74 –
ended December 31, 2018, 2019 and 2020 and the six months ended June 30, 2020 and 2021, respectively,
and represented 3.7%, 3.6%, 3.5%, 3.1% and 3.9% of the total cost of sales for the same years or periods,
respectively. With our large work force, we are also exposed to the risk of work stoppages and union and
other potential labor disputes. If such labor disputes are resolved in favor of its employees, we may be
required to change our employment and compensation policies. We also cannot provide assurance that our
present employment policies are or will remain in compliance with all applicable laws and regulations and
that it will not be required to pay associated penalties. If we are exposed to penalties for non-compliance
with applicable labor laws and regulations or if we are unable to maintain our relations with our
employees, our business, financial condition and results of operations may be adversely affected.
RISKS RELATING TO DOING BUSINESS IN CHINA
The economic, political and social conditions in China, as well as government policies, laws andregulations, could affect our business, financial conditions and results of operations.
A substantial portion of our business operations are in China and part of our revenue is derived from
our operations in China. Accordingly, our results of operations and prospects are, to a significant degree,
subject to economic, political and legal developments in China. The economy of China differs from the
economies of most developed countries in many respects, including the extent of government involvement,
its level of development, its growth rate and its control over foreign exchange. China’s economy has been
transitioning from a planned economy to a more market-oriented economy. In recent years, the PRC
Government has implemented measures emphasizing market forces for economic reform, the reduction of
state ownership of productive assets and the establishment of sound corporate governance in business
enterprises. However, a portion of productive assets in China is still owned by the PRC Government. The
PRC Government continues to play a significant role in regulating industrial development. It also
exercises significant control over China’s economic growth through the allocation of resources,
controlling payment of foreign currency-denominated obligations and setting monetary policies.
While the Chinese economy has experienced significant growth in the last few decades, growth has
been uneven across both geographic regions and the various sectors of the economy, growth rates have
begun to decelerate, and growth may not continue. Any severe or prolonged slowdown in the Chinese or
global economy may have a negative impact on our business, financial conditions and results of
operations. Economic conditions in China are sensitive to global economic conditions. The global
macroeconomic environment is facing challenges, including the end of quantitative easing and start of
interest rate hikes by the US Federal Reserve, the economic slowdown in the Eurozone since 2014 and the
withdrawal of the United Kingdom from the EU at the end of January 2020. The Chinese economy has
shown slower growth since 2012 compared to the previous decade and the trend may continue. There have
also been concerns over unrest in North Korea, Ukraine and the Middle East, which have resulted in
volatility in financial and other markets in recent years. The concerns over the trade and economic policies
of the United States government, which have contributed to, among other things, tensions between the
United States and China. In particular, the imposition of tariffs on Chinese products by the United States
may result in a decrease in China’s exports and a slowdown of the Chinese economy, which would in turn
reduce domestic consumption. There have also been concerns about the economic effect of the tensions
in the relationship between China and surrounding Asian countries. Should any of these situations occur,
our business and financial conditions will be negatively impacted. Additionally, continued turbulence in
the international markets may adversely affect our ability to access the capital markets to meet liquidity
needs.
RISK FACTORS
– 75 –

Uncertainties with respect to the PRC legal system could limit the legal protections available to youand us.
Some of our operating subsidiaries are incorporated under and governed by the laws of the PRC. The
PRC legal system is based on written statutes. Prior court decisions may be cited for reference but have
limited precedential value. In 1979, the PRC Government began to promulgate a comprehensive system
of laws and regulations governing economic matters in general, such as foreign investment, corporate
organization and governance, commerce, taxation and trade. As our principal operations are conducted in
China, our operations are materially affected by PRC laws and regulations. However, since the PRC legal
system continues to evolve rapidly, the interpretations of many laws, regulations and rules are not always
uniform and enforcement of these laws, regulations and rules involves uncertainties, which may limit legal
protections available to us. Furthermore, certain important aspects of PRC corporate laws are different
from the corporate laws of common law jurisdictions such as Hong Kong and the United States,
particularly with respect to investor protection, such as shareholder class action suits and measures
protecting non-controlling shareholders; restrictions on directors; disclosure requirements; different rights
of classes of shareholders; general meeting procedures and disbursement of dividends. Our Articles of
Association include provisions in accordance with the Hong Kong Listing Rules. Although such provisions
have been included, we cannot assure you that no discrepancy exists between the protections given to our
investors and those given to investors in companies formed in common law jurisdictions. Intellectual
property rights and confidentiality protections in China may not be as effective as in the United States or
other countries. In addition, we cannot predict the effect of future developments in the PRC legal system,
including the promulgation of new laws, changes to existing laws or the interpretation or enforcement
thereof, or the preemption of local regulations by national laws. These uncertainties could limit the legal
protections available to us and other foreign investors, including you. In addition, any litigation in China
may be protracted and result in substantial costs and diversion of our resources and management attention.
PRC regulations of loans and direct investment by offshore holding companies to PRC entities maydelay or prevent us from using the proceeds of the Global Offering to make loans or additionalcapital contributions to our PRC subsidiaries.
In utilizing the proceeds from the Global Offering or any further offering, as an offshore holding
company of our PRC subsidiaries, we may make loans to our PRC subsidiaries, or we may make additional
capital contributions to our PRC subsidiaries. Any loans provided by us to our PRC subsidiaries are subject
to PRC regulations. For example, loans by us to our PRC subsidiaries in China to finance their activities
cannot exceed statutory limits and must be registered or filed on record. We may also decide to finance
our PRC subsidiaries through capital contributions. These capital contributions must be filed with the local
counterpart of the MOFCOM. We cannot assure you that we will be able to accomplish these government
registrations or filing procedures on a timely basis, if at all, with respect to future loans or capital
contributions by us to our subsidiaries or any of their respective subsidiaries. If we fail to receive such
registrations or approvals or fail to complete such filing procedures, our ability to use the proceeds of the
Global Offering and to capitalize our operations in China may be negatively affected, which could
adversely and materially affect our liquidity and our ability to fund and expand our business.
RISK FACTORS
– 76 –

We rely on dividends paid by our subsidiaries for our cash needs, and any limitation on the abilityof our subsidiaries to make payments to us could have a material adverse effect on our ability toconduct our business.
We conduct a substantial part of our operations through our consolidated subsidiaries incorporated
in China. We rely on dividends paid by these consolidated subsidiaries for our cash needs, including the
funds necessary to pay any dividends and other cash distributions to our Shareholders, to service any debt
we may incur and to pay our operating expenses. The payment of dividends by entities established in
China is subject to limitations. Regulations in China currently permit payment of dividends only out of
accumulated profits as determined in accordance with accounting standards and regulations in China. Each
of our PRC subsidiaries is also required to set aside at least 10% of its after-tax profit based on PRC laws
and regulations each year to its general reserves or statutory capital reserve fund until the aggregate
amount of such reserves reaches 50% of its respective registered capital. Our statutory reserves are not
distributable as loans, advances or cash dividends. We anticipate that in the foreseeable future our PRC
subsidiaries will need to continue to set aside 10% of their respective after-tax profits to their statutory
reserves. Furthermore, if any of our subsidiaries incurs debt on its own behalf in the future, the instruments
governing the debt may restrict its ability to pay dividends or make other distributions to us. Any
limitations on the ability of our subsidiaries to transfer funds to us could materially and adversely limit
our ability to grow, make investments or acquisitions that could be beneficial to our business, pay
dividends and otherwise fund and conduct our business.
In addition, under the Enterprise Income Tax Law of the PRC (《中華人民共和國企業所得稅法》)
(the “EIT Law”), the Regulation on the Implementation of the Enterprise Income Tax Law of the PRC
(《中華人民共和國企業所得稅法實施條例》) (the “EIT Implementation Rules”), the Notice of the State
Administration of Taxation on Negotiated Reduction of Dividends and Interest Rates (《國家稅務總局關於下發協定股息稅率情況一覽表的通知》), or Notice 112, which was issued on January 29, 2008 and
amended on February 29, 2008, the Arrangement between the Mainland of China and Hong Kong Special
Administrative Region on the Avoidance of Double Taxation and Prevention of Fiscal Evasion with
Respect to Taxes on Income (《內地和香港特別行政區關於對所得避免雙重徵稅和防止偷漏稅的安排》)
(the “China-Hong Kong Tax Arrangement”), which became effective on December 8, 2006, and the
Announcement of the State Administration of Taxation on Issues Concerning “Beneficial Owners” in Tax
Treaties (《國家稅務總局關於稅收協定中“受益所有人”有關問題的公告》) (the “Announcement 9”),
which became effective on April 1, 2018, dividends from our PRC subsidiaries paid to us may be subject
to a withholding tax at a rate of 10%, or at a rate of 5% if we are considered as a “beneficial owner” that
is generally engaged in substantial business activities and entitled to treaty benefits under the China-Hong
Kong Tax Arrangement. According to the Announcement 9, the PRC tax authorities must evaluate whether
an applicant qualifies as a “beneficial owner” on a case-by-case basis. The Announcement 9 provides that
tax treaty benefits will be denied to companies without business substance, and a beneficial ownership
analysis will be adopted to determine whether or not to grant the tax treaty benefits. It is unclear whether
Announcement 9 applies to dividends from our PRC subsidiaries paid to us. If, under Announcement 9,
we were not considered the “beneficial owner” of any such dividends, such dividends would, as a result,
be subject to income tax withholding at the rate of 10% rather than the more favorable 5% rate applicable
under the China-Hong Kong Tax Arrangement. In that case, our financial position and results of operations
may be materially and adversely affected.
RISK FACTORS
– 77 –

Dividends payable by us to our foreign investors and gains on the sale of our Shares may becomesubject to withholding taxes under the PRC tax laws.
Under the EIT Law and EIT Implementation Rules, our foreign corporate Shareholders may be
subject to a 10% income tax upon any gains realized from the transfer of their Shares and dividend
distributable to such foreign corporate Shareholder, if such income is regarded as income from “sources
within the PRC.” According to the EIT Implementation Rules, whether income generated from transferring
equity investments is to be regarded as sources within the PRC or from foreign territory shall depend upon
the locations in which the enterprises accepting the equity investment are located. However, it is unclear
whether income received by our Shareholders will be deemed to be income from sources within the PRC
and whether there will be any exemption or reduction in taxation for our foreign corporate Shareholders
due to the promulgation of the EIT Law. If our foreign corporate Shareholders are required to pay PRC
income tax on the transfers of our Shares that they hold or on the gains on the sale of our Shares by them,
the value of our foreign corporate Shareholders’ investments in our Shares may be materially and
adversely affected.
We may be classified as a “resident enterprise” for PRC enterprise income tax purposes and besubject to a tax rate of 25% on our global income.
Pursuant to the EIT Law, which came into effect on January 1. 2008 and was amended on February
24, 2017 and December 29, 2018, an enterprise established outside the PRC whose “de facto management
body” is located in the PRC is considered a “PRC resident enterprise” and will generally be subject to the
uniform enterprise income tax rate, or EIT rate, of 25% on its global income. Under the implementation
rules of the EIT Law, “de facto management body” is defined as the organizational body that effectively
exercises management and control over such aspects as the business operations, personnel, accounting and
properties of the enterprise.
On April 22, 2009, SAT released the Notice Regarding the Determination of Chinese-Controlled
Offshore Incorporated Enterprises as PRC Tax Resident Enterprises on the Basis of De Facto
Management Bodies (《關於境外註冊中資控股企業依據實際管理機構標準認定為居民企業有關問題的通知》) (“Circular 82”), as amended on January 29, 2014, which sets out the standards and procedures for
determining whether the “de facto management body” of an enterprise registered outside of the PRC and
controlled by PRC enterprises or PRC enterprise groups is located within the PRC. Under Circular 82, a
foreign enterprise controlled by a PRC enterprise or PRC enterprise group is considered a PRC resident
enterprise if all of the following apply: (i) the senior management and core management departments in
charge of daily business operations are located mainly within the PRC; (ii) financial and human resources
decisions are subject to determination or approval by persons or bodies in the PRC; (iii) major assets,
accounting books, company seals and minutes and files of board and shareholders’ meetings are located
or kept within the PRC; and (iv) at least half of the enterprise’s directors with voting rights or senior
management reside within the PRC. In addition, Circular 82 also requires that the determination of “de
facto management body” shall be based on the principle that substance is more important than form.
Further to Circular 82, SAT issued the Chinese-Controlled Offshore Incorporated Resident Enterprises
Income Tax Regulation (Trial Implementation) (《境外註冊中資控股居民企業所得稅管理辦法(試行)》)
(“Bulletin 45”), which took effect on September 1, 2011 and amended on June 1, 2015, October 1, 2016
and June 15, 2018, to provide more guidance on the implementation of Circular 82 and clarify the
reporting and filing obligations of such “Chinese controlled offshore incorporated resident enterprises”.
Bulletin 45 provides procedures and administrative details for the determination of resident status and
administration of post-determination matters. Although Circular 82 and Bulletin 45 explicitly provide that
RISK FACTORS
– 78 –

the above standards apply to enterprises which are registered outside of the PRC and controlled by PRC
enterprises or PRC enterprise groups, Circular 82 may reflect SAT’s criteria for determining the tax
residence of foreign enterprises in general. Most of our Directors and senior management are currently
based in the PRC; if we are deemed a PRC resident enterprise, the EIT rate of 25% on our global taxable
income may reduce capital we could otherwise divert to our business operations.
We face uncertainty relating to the Public Announcement on Several Issues Concerning EnterpriseIncome Tax for Indirect Transfer of Assets by Non-Resident Enterprises (《關於非居民企業間接轉讓財產企業所得稅若干問題的公告》) (“SAT Circular No. 7”) issued by the SAT.
On February 3, 2015, the SAT issued the SAT Circular No. 7, which abolished certain provisions in
the Circular on Strengthening the Administration of Enterprise Income Tax on Non-PRC Resident
Enterprises’ Share Transfers (《關於加強非居民企業股權轉讓所得企業所得稅管理的通知》) (“SATCircular No. 698”), previously issued by the SAT on December 10, 2009. SAT Circular No. 7 provides
comprehensive guidelines relating to indirect transfers by a non-PRC resident enterprise of assets
(including equity interests) of a PRC resident enterprise (“PRC Taxable Assets”). For example, SAT
Circular No. 7 specifies that the PRC tax authorities are entitled to reclassify the nature of an indirect
transfer of PRC Taxable Assets, when a non-PRC resident enterprise transfers PRC Taxable Assets
indirectly by disposing of equity interests in an overseas holding company directly or indirectly holding
such PRC Taxable Assets. The PRC tax authorities may disregard the existence of such overseas holding
company and consider the transaction to be a direct transfer of PRC Taxable Assets, if such transfer is
deemed to have been conducted for the purposes of avoiding the enterprise income tax in the PRC and lack
any reasonable commercial purpose. Although SAT Circular No. 7 contains certain exemptions (including
(i) where a non-resident enterprise derives income from the indirect transfer of PRC Taxable Assets by
acquiring and selling shares of a listed overseas holding company which holds such PRC Taxable Assets
on a public market; and (ii) where a non-resident enterprise had directly held and disposed of such PRC
Taxable Assets, and the income from the transfer could be exempted from the enterprise income tax in the
PRC under an applicable tax treaty or arrangement), it remains unclear whether any exemptions under SAT
Circular No. 7 will be applicable to the transfer of our Shares or to any future acquisition by us outside
China involving PRC Taxable Assets, or whether the PRC tax authorities will reclassify such transaction
by applying SAT Circular No. 7. SAT Circular No. 7 may be determined by the tax authorities to be
applicable to our reorganization, if such transaction were determined by the tax authorities to lack
reasonable commercial purpose. As a result, we may be subject to tax under SAT Circular No. 7 and may
be required to expend valuable re-sources to comply with SAT Circular No. 7 or to explain that we and
our non-resident subsidiaries should not be taxed under SAT Circular No. 7, which may have a material
adverse effect on our business, financial conditions, results of operations and growth prospects. October
17, 2017, the SAT issued the Circular on the Source of Deduction of Income Tax for Non-resident
Enterprises (《國家稅務總局關於非居民企業所得稅源泉扣繳有關問題的公告》) (the “SAT Circular No.
37”), which became effective on December 1, 2017 and abolished SAT Circular No. 698 as well as certain
provisions in SAT Circular No. 7. Pursuant to SAT Circular No. 37, where the party responsible to deduct
such income tax did not or was unable to make such deduction, the non-resident enterprise receiving such
income should declare and pay the taxes that should have been deducted to the relevant tax authority. The
taxable gain is calculated as the income from such transfer net of the net book value of equity interest.
RISK FACTORS
– 79 –

We have conducted and completed, and in the future may conduct acquisitions involving changes in
corporate structures, and historically our Shares were transferred by certain then Shareholders to our
current Shareholders. We cannot assure you that the PRC tax authorities will not, at their discretion, adjust
any capital gains and impose tax return filing obligations on us or require us to provide assistance for the
investigation by the PRC tax authorities with respect thereto. Any PRC tax imposed on a transfer of our
Shares or any adjustment of such gains would cause us to incur additional costs and may have a negative
impact on the value of your investment in us.
It may be difficult to effect service of process upon us or our Directors or executive officers whoreside in China or to enforce against them in China any judgments obtained from non-PRC courts.
Most of our Directors and executive officers reside within China, and a substantial part of our assets
and the assets of those persons are located within China. It may not be possible for investors to effect
service of process upon us or those persons inside China or to enforce against us or them in China any
judgments obtained from non-PRC courts unless in accordance with the provisions of the international
treaties concluded or acceded to by the foreign country and the PRC. China does not have treaties
providing for the reciprocal recognition and enforcement of judgments of courts in the United States, the
United Kingdom, Japan or most other western countries. However, judgments rendered by Hong Kong
courts may be recognized and enforced in China if the requirements set forth by the Arrangement on
Reciprocal Recognition and Enforcement of Judgments in Civil and Commercial Matters by the Courts of
the Mainland and of the Hong Kong Special Administrative Region Pursuant to Choice of Court
Agreements between Parties Concerned (《關於內地與香港特別行政區法院相互認可和執行當事人協議管轄的民商事案件判決的安排》) are met. Therefore, recognition and enforcement in China of judgments
of a court in any of these jurisdictions other than Hong Kong in relation to any matter not subject to
binding arbitration provisions may be difficult or impossible.
Fluctuations in the value of the RMB and the PRC Government’s control over foreign currencyconversion may adversely affect our business and results of operations and our ability to remitdividends.
Substantially all our revenue is denominated in US dollar or euro, while a substantial portion of our
expenditures are denominated in RMB, while the net proceeds from the Global Offering and any dividends
we pay on our Shares will be in Hong Kong dollars. Fluctuations in the exchange rates between the RMB
and the Hong Kong dollars, U.S. dollars or euro will affect our financial condition, results of operations
or cash flows. Fluctuations in the exchange rates may also cause us to incur foreign exchange losses and
affect the relative value of any dividend distributed by us.
Movements in RMB exchange rates are affected by, among other things, changes in political and
economic conditions and China’s foreign exchange regime and policy. PBOC regularly intervenes in the
foreign exchange market to limit fluctuations in RMB exchange rates and achieve certain exchange rate
targets and policy goals. In the fourth quarter of 2016, the RMB had depreciated significantly in the
backdrop of a surging U.S. dollars and persistent capital outflows of China. This depreciation halted in
2017, and the RMB appreciated approximately 7% against the U.S. dollars during this one-year period.
Starting from the beginning of 2019, the RMB has depreciated significantly against the U.S. dollars again.
In early August 2019, the PBOC set the RMB’s daily reference rate at RMB7.0039 to US$1.00, the first
time that the exchange rate of RMB to U.S. dollars exceeded 7.0 since 2008. We cannot assure you that
RMB will not appreciate or depreciate significantly in value against Hong Kong dollars, U.S. dollars or
euro in the future.
RISK FACTORS
– 80 –

In addition, conversion and remittance of foreign currencies are subject to PRC foreign exchange
regulations. It cannot be guaranteed that under a certain exchange rate, we shall have sufficient foreign
exchange to meet our foreign exchange needs. Under China’s current foreign exchange control system,
foreign exchange transactions under the current account conducted by us, including the payment of
dividends, do not require advance approval from SAFE, but we are required to present relevant
documentary evidence of such transactions and conduct such transactions at designated foreign exchange
banks within China that have the licenses to carry out foreign exchange business. Foreign exchange
transactions under the capital account, however, must be approved by or registered with SAFE or its local
branch. The PRC Government may also at its discretion restrict access in the future to foreign currencies
for current account transactions. Any insufficiency of foreign exchange may restrict our ability to obtain
sufficient foreign exchange for dividend payments to Shareholders or satisfy any other foreign exchange
obligation. If we fail to obtain approvals from the SAFE to convert RMB into any foreign exchange for
any of the above purposes, our potential offshore capital expenditure plans and even our business, may be
materially and adversely affected.
Failure by our Shareholders or beneficial owners who are PRC residents to make any requiredapplications and filings pursuant to regulations relating to offshore investment activities by PRCresidents may prevent us from being able to distribute profits or inject capital and could expose usand our PRC resident Shareholders to liability under the PRC laws.
The SAFE Circular No. 37 which was promulgated by SAFE and became effective on July 4, 2014,
requires a PRC individual resident (“PRC Resident”) to register with the local SAFE branch before he
or she contributes assets or equity interests in an overseas special purpose vehicle (“Offshore SPV”) that
is directly established or controlled by the PRC Resident for the purpose of conducting investment or
financing. Following the initial registration, the PRC Resident is also required to register with the local
SAFE branch for any major change in respect of the Offshore SPV, including, among other things, any
major change of a PRC Resident shareholder, name or term of operation of the Offshore SPV, or any
increase or reduction of the Offshore SPV’s registered capital, share transfer or swap, merger or division.
We are committed to complying with, and requiring that the Shareholders or beneficial owners subject to
SAFE Circular No. 37 to comply with the relevant registration requirements. However, due to the inherent
uncertainty in the implementation of the regulatory requirements by PRC authorities, such registration
might not be always practically available in all circumstances as prescribed in those regulations. In
addition, we may not fully understand changes to resident statuses of our Shareholders or beneficial
owners who are PRC Residents at all times, and we have limited control over, and cannot compel our
Shareholders or Beneficial owners who are PRC Residents to comply with Circular No. 37 at all times.
In addition, we cannot provide assurance that the Chinese government will interpret the requirements of
SAFE Circular No. 37 in a different manner, or release explicit requirements. Failure to comply with the
registration procedures of SAFE Circular No. 37 may result in penalties and sanctions, including the
imposition of restrictions on the ability of the Offshore SPV’s Chinese subsidiary to distribute dividends
to its overseas parent.
Inflation or deflation in China could negatively affect our profitability and growth.
Economic growth in China has, during certain periods, been accompanied by periods of highinflation, and the PRC Government has implemented various policies from time to time to controlinflation. For example, the PRC Government introduced measures in certain sectors to avoid overheatingof the Chinese economy, including increasing interest rates and capital reserve thresholds at Chinesecommercial banks. The effects of the stimulus measures implemented by the PRC Government since the
RISK FACTORS
– 81 –

global economic crisis that commenced in 2008 and the continued growth in the overall economy sincethen have resulted in sustained inflationary pressures. If these inflationary pressures continue and are notmitigated by PRC Government measures, our cost of sales will likely increase, and our profitability couldbe materially reduced, as there is no assurance that we would be able to pass any cost increases onto ourcustomers. Measures adopted by the PRC Government to control inflation may also slow economicactivity in China, reduce demands for our products and decrease our revenue growth, all of which wouldmaterially and adversely affect our business, financial conditions and results of operations.
On the other hand, our business could also be affected by deflationary pressures. A decline in generalprice levels could negatively impact sales growth, operating margins and earnings if our competitors reactby lowering their retail pricing. As a result, our business, financial conditions and results of operationscould be materially adversely affected.
RISKS RELATING TO THE GLOBAL OFFERING
There has been no prior public market for our Shares and an active trading market may not develop.
Prior to the Global Offering, there has not been a public market for our Shares. An active publicmarket may not develop or be sustained after the Global Offering. The initial Offer Price range for ourShares was the result of, and the Offer Price will be the result of, negotiations among us and the JointRepresentatives on behalf of the Underwriters and may not be indicative of prices that will prevail in thetrading market after the Global Offering.
We have applied to list and deal in our Shares on the Stock Exchange. However, even if approved,being listed on the Stock Exchange does not guarantee that an active trading market for our Shares willdevelop or be sustained. If an active market for our Shares does not develop after the Global Offering, themarket price and liquidity of our Shares may be adversely affected. As a result, you may not be able toresell your Shares at prices equal to or greater than the price paid for the Shares in the Global Offering.
The market price and trading volume of our Shares may be volatile, which could result in substantiallosses for investors purchasing Shares in the Global Offering. The market price of our Shares mayfluctuate significantly and rapidly as a result of a variety of factors, many of which are beyond our control,including:
• actual and anticipated variations in our results of operations;
• changes in securities analysts’ estimates or market perception of our financial performance;
• announcement by us of significant acquisitions, dispositions, strategic alliances or jointventures;
• recruitment or loss of key personnel by us or our competitors;
• market developments affecting us or the power tool or outdoor power equipment industry;
• regulatory or legal developments, including litigation;
• the operating and stock price performance of other companies, other industries and other events
or factors beyond our control;
RISK FACTORS
– 82 –
• fluctuations in trading volumes or the release of lock-up or other transfer restrictions on our
outstanding Shares or sales of additional Shares by us; and
• general economic, political and stock market conditions in Hong Kong, China and elsewhere
in the world.
Moreover, in recent years, stock markets in general have experienced significant price and volume
fluctuations, some of which have been unrelated or disproportionate to the operating performance of the
listed companies. These broad market and industry fluctuations may adversely affect the market price of
our Shares.
The market price and trading volume of our Shares may be volatile, which could result in substantiallosses for investors who purchase our Shares in the Global Offering.
The market price and trading volume of our Shares may be highly volatile. Several factors, some of
which are beyond our control, such as variations in our revenue, earnings and cash flow, changes in our
pricing policy for products or services as a result of competition, the emergence of new technologies,
strategic alliances or acquisitions, the addition or departure of key personnel, changes in ratings by
financial analysts and credit rating agencies, litigation, the removal of the restrictions on share
transactions or volatility in market prices and changes in the demand for our products, could cause large
and sudden changes to the market price and trading volume at which our Shares will trade. Further,
derivative transactions that may be entered into by investors in our Shares (including cornerstone investors
during their lock-up period to the extent that such transactions are not in violation of the lock-up
restrictions) for hedging purposes, even if these transactions are settled only in cash, could still result in
significant price and trading volume volatility of our Shares. In addition, the stabilization activities to be
carried out by the Stabilizing Manager may be curtailed by certain limitations in the over-allocations in
the Global Offering, which may affect the market price and trading volume of our Shares as well. See the
section headed “Structure of the Global Offering – Stabilization” in this prospectus. Besides, the Hong
Kong Stock Exchange and other securities markets have, from time to time, experienced significant price
and trading volume volatility that are not related to the operating performance of any particular company.
This volatility may also materially and adversely affect the market price of our Shares.
Since there will be a gap of several days between pricing and trading of our Offer Shares, the priceof our Offer Shares could fall below the Offer Price when the trading commences.
The Offer Price of our Shares is expected to be determined on the Price Determination Date.
However, our Shares will not commence trading on the Stock Exchange until they are delivered, which is
expected to be five Hong Kong business days after the pricing date. As a result, investors may not be able
to sell or deal in our Shares during that period. Accordingly, holders of our Shares are subject to the risk
that the price of our Shares could fall below the Offer Price when the trading commences as a result of
adverse market conditions or other adverse developments, that could occur between the time of sale and
the time trading begins.
RISK FACTORS
– 83 –
Purchasers of Shares will experience immediate dilution, and a future significant increase orperceived significant increase in the supply of our Shares in public markets could cause the marketprice of our Shares to decrease significantly, and/or dilute shareholdings of holders of our Shares.
Based on the Offer Price range, the Offer Price is expected to be higher than the net tangible book
value per Share prior to the Global Offering. Therefore, you will experience an immediate dilution in pro
forma net tangible book value per Share.
In addition, the market price of our Shares could decline as a result of future sales of a substantial
number of our Shares or other securities relating to our Shares in the public market, or the issuance of new
shares or other securities, or the perception that such sales or issuances may occur. Future sales, or
anticipated sales, of substantial amounts of our securities, including any future offerings, could also
materially and adversely affect our ability to raise capital at a specific time and on terms favorable to us.
In addition, our Shareholders may experience dilution in their holdings if we issue more securities in the
future. New shares or shares-linked securities issued by us may also confer rights and privileges that take
priority over those conferred by the Shares.
While investors subscribing shares in the Global Offering are not subject to any restrictions on the
disposal of the Shares they subscribed (except as disclosed in this Prospectus), they may have existing
arrangements or agreement to dispose part or all of the Shares they hold immediately or within certain
period upon completion of the Global Offering for legal and regulatory, business and market, or other
reasons. Such disposal may occur within a short period or any time or period after the Listing Date. Any
sale of the Shares subscribed by such investors pursuant to such arrangement or agreement could adversely
affect the market price of our Shares and any sizeable sale could have a material and adverse effect on the
market price of our Shares and could cause substantial volatility in the trading volume of our Shares.
There can be no assurance if and when we will pay dividends in the future. Dividends distributed inthe past may not be indicative of our dividend payment in the future.
We have adopted a general annual dividend policy of declaring and paying dividends on an annual
basis of no less than 20% of our total net profit attributable to us for any particular year. Assuming the
Listing occurs in 2021, 2022 will be the first year for which our total net profit attributable to us will be
used for purposes of declaring and paying dividends in accordance with the aforementioned general annual
dividend policy.
However, the declaration of dividends is subject to the discretion of our Directors, and, if necessary,
the approval of our Shareholders. A decision to declare or to pay any dividends and the amount of any
dividends will depend on various factors, including but not limited to our results of operations, cash flows
and financial conditions, operating and capital expenditure requirements, distributable profits as
determined under applicable laws, our Articles of Association, market conditions, our strategic plans and
prospects for business development, contractual limits and obligations, payment of dividends to us by our
operating subsidiaries, taxation, and any other factors determined by our Board of Directors from time to
time to be relevant to the declaration of dividend payments. As a result, our historical dividend
distributions are not indicative of our future dividend distribution policy. There can be no assurance
whether, when and in what form we will pay dividends in the future or that we will pay dividends in
accordance with our dividend policy. In addition, our Directors may reassess our dividend policy in the
future. See the section headed “Financial Information – Dividend Policy” in this prospectus for more
details of our dividend policy.
RISK FACTORS
– 84 –

Waivers were granted from compliance with certain requirements of the Hong Kong Listing Rulesby the Hong Kong Stock Exchange. Shareholders will not have the benefit of the Hong Kong ListingRules that are so waived. These waivers could be revoked, exposing us and our Shareholders toadditional legal and compliance obligations.
We have applied for, and the Hong Kong Stock Exchange has granted to us, a number of waivers and
consents under the Hong Kong Listing Rules. See the section headed “Waivers from Strict Compliance
with the Listing Rules” in this prospectus for further details. We cannot assure you that the Hong Kong
Stock Exchange will not revoke any of these waivers granted or impose certain conditions on any of these
waivers. If any of these waivers were to be revoked or to be subject to certain conditions, we may be
subject to additional compliance obligations, incur additional compliance costs, and face uncertainties
arising from issues of multi-jurisdictional compliance, all of which could materially and adversely affect
us and our Shareholders.
Our Controlling Shareholders may exert substantial influence over our operation and may not actin the best interests of our independent Shareholders.
Immediately following the completion of the Global Offering (assuming the Over-allotment Option
is not exercised), our Controlling Shareholders being Mr. Pan and Panmercy will together control
approximately 54.3% of our issued share capital. Therefore, they will be able to exercise significant
influence over all matters requiring Shareholders’ approval, including the election of Directors and the
approval of significant corporate transactions. They will also have veto power with respect to any
shareholder action or approval requiring a majority vote except where it is required by relevant rules to
abstain from voting. Such concentration of ownership also may have the effect of delaying, preventing or
deterring a change in control of us that would otherwise benefit our Shareholders. The interests of our
Controlling Shareholders may not always coincide with us or your best interests. If the interests of the
Controlling Shareholders conflict with the interests of us or our other Shareholders, or if our Controlling
Shareholders choose to cause our business to pursue strategic objectives that conflict with the interests of
us or other Shareholders, we or those other Shareholders, including you, may be disadvantaged as a result.
Facts and statistics in this prospectus relating to the market and the industry we operate may notbe fully reliable, and statistics in this prospectus provided by Frost & Sullivan are subject toassumptions and methodologies set forth in the section headed “Industry Overview” in thisprospectus.
Facts and statistics in this prospectus relating to the market and the industry we operate, including
those relating to the economy and the global power tool and outdoor power equipment industry, are
derived from various publications of governmental agencies or industry associations, or an industry report
prepared by Frost & Sullivan and commissioned by us. We cannot guarantee, however, the quality or
reliability of these materials. We believe that the sources of this information are appropriate sources for
such information and have taken reasonable care in extracting and reproducing such information. We have
no reason to believe that such information is false or misleading in any material respect or that any
material fact has been omitted that would render such information false or misleading. The information
has not been independently verified by us, the Joint Representatives, the Joint Global Coordinators, the
Joint Sponsors, the Joint Bookrunners, the Joint Lead Managers or any other party involved in the Global
Offering and no representation is given as to its accuracy and completeness. Investors should not place
undue reliance on such facts or statistics.
RISK FACTORS
– 85 –
You should read the entire prospectus carefully and we strongly caution you not to place any relianceon any information contained in press articles and/or other media regarding us, our business, ourindustry and/or the Global Offering.
There may have been prior to the publication of this prospectus, and there may be subsequent to the
date of this prospectus but prior to the completion of the Global Offering, press and/or media regarding
us, our business, our industry and/or the Global Offering. None of us, the Joint Representatives, the Joint
Global Coordinators, the Joint Sponsors, the Joint Bookrunners, the Joint Lead Managers, the
Underwriters or any other person involved in the Global Offering has authorized the disclosure of
information about the Global Offering in any press or media and none of these parties accepts any
responsibility for the accuracy or completeness of any such information or the fairness or appropriateness
of any forecasts, views or opinions expressed by the press and/or other media regarding our Shares, the
Global Offering, our business, our industry or us. We make no representation as to the appropriateness,
accuracy, completeness or reliability of any such information, forecasts, views or opinions expressed in
any such publications. To the extent that such statements, forecasts, views or opinions are inconsistent or
conflict with the information contained in this prospectus, we disclaim them. Accordingly, you should
make your investment decisions on the basis of the information contained in this prospectus only and
should not rely on any other information.
RISK FACTORS
– 86 –
In preparation for the Global Offering, our Company has sought the following waivers from strictcompliance with the relevant provisions of the Listing Rules.
WAIVER IN RELATION TO MANAGEMENT PRESENCE IN HONG KONG
Pursuant to Rule 8.12 of the Listing Rules, an issuer must have a sufficient management presencein Hong Kong. This will normally mean that at least two of its executive directors must be ordinarilyresident in Hong Kong. As none of our executive Directors currently resides in Hong Kong, we do not and,for the foreseeable future, will not have sufficient management presence in Hong Kong for the purpose ofsatisfying the requirement under Rule 8.12 of the Listing Rules.
Our Group’s management headquarters, senior management, business operations and assets areprimarily based outside Hong Kong, in China and the United States. The Directors consider that theappointment of executive Directors who will be ordinarily resident in Hong Kong would not be beneficialto, or appropriate for, our Group and therefore would not be in the best interests of our Company or theShareholders as a whole.
Accordingly, we have applied for, and the Stock Exchange has granted, a waiver from strictcompliance with Rule 8.12 of the Listing Rules on the basis that we will have proper arrangements tomaintain regular communication with the Stock Exchange. We will ensure that there is an effective channelof communication between us and the Stock Exchange by way of the following arrangements:
(a) pursuant to Rule 3.05 of the Listing Rules, we have appointed and will continue to maintaintwo authorized representatives who shall act at all times as the principal channel ofcommunication with the Stock Exchange. Each of our authorized representatives will be readilycontactable by the Stock Exchange by telephone, facsimile and/or e-mail to deal promptly withenquiries from the Stock Exchange. Both of our authorized representatives are authorized tocommunicate on our behalf with the Stock Exchange. At present, our two authorizedrepresentatives are Ms. Zhang Tong (“Ms. Zhang”), our executive Director and Mr. Hu Yian(“Mr. Hu”), our joint company secretary and chief financial officer;
(b) pursuant to Rule 3.20 of the Listing Rules, each Director will provide their contact information,including mobile phone numbers, office phone numbers and e-mail addresses, to the StockExchange and to the authorized representatives. This will ensure that the Stock Exchange andthe authorized representatives have means for contacting all Directors promptly at all times asand when required;
(c) we will ensure that each Director who is not ordinarily resident in Hong Kong possesses or canapply for valid travel documents to visit Hong Kong and can meet with the Stock Exchangewithin a reasonable period; and
(d) pursuant to Rule 3A.19 of the Listing Rules, we have appointed Guotai Junan Capital Limitedas compliance adviser (the “Compliance Adviser”), who will act as an additional channel ofcommunication with the Stock Exchange. The Compliance Adviser will provide our Companywith professional advice on ongoing compliance with the Listing Rules. We will ensure that theCompliance Adviser has prompt access to our Company’s authorized representatives andDirectors. In turn, they will provide the Compliance Adviser with such information andassistance as the Compliance Adviser may need or may reasonably request in connection withthe performance of the Compliance Adviser’s duties. The Compliance Adviser will also provideadvice to our Company when consulted by our Company in compliance with Rule 3A.23 of theListing Rules.
WAIVERS FROM STRICT COMPLIANCE WITH THE LISTING RULES
– 87 –

WAIVER IN RELATION TO OUR JOINT COMPANY SECRETARIES
Pursuant to Rules 3.28 and 8.17 of the Listing Rules, the company secretary must be an individual
who, by virtue of their academic or professional qualifications or relevant experience, is, in the opinion
of the Stock Exchange, capable of discharging the functions of company secretary.
Pursuant to Note 1 to Rule 3.28 of the Listing Rules, the Stock Exchange considers the following
academic or professional qualifications to be acceptable:
(i) a member of The Hong Kong Institute of Chartered Secretaries;
(ii) a solicitor or barrister as defined in the Legal Practitioners Ordinance (Chapter 159 of the Laws
of Hong Kong); and
(iii) a certified public accountant as defined in the Professional Accountants Ordinance (Chapter 50
of the Laws of Hong Kong).
Pursuant to Note 2 to Rule 3.28 of the Listing Rules, in assessing “relevant experience”, the Stock
Exchange will consider the individual’s:
(i) length of employment with the issuer and other issuers and the roles they played;
(ii) familiarity with the Listing Rules and other relevant law and regulations including the
Securities and Futures Ordinance, Companies Ordinance, Companies (Winding Up and
Miscellaneous Provisions) Ordinance and the Takeovers Code;
(iii) relevant training taken and/or to be taken in addition to the minimum requirement under Rule
3.29 of the Listing Rules; and
(iv) professional qualifications in other jurisdictions.
Our Company appointed Mr. Hu and Ms. Chow Yuk Yin Ivy (“Ms. Chow”), as joint company
secretaries. See the section headed “Directors and Senior Management – Joint Company Secretaries” in
this prospectus for their biographies.
Ms. Chow is a member and fellow of both The Hong Kong Chartered Governance Institute (formerly
known as The Hong Kong Institute of Chartered Secretaries) and The Chartered Governance Institute
(formerly known as The Institute of Chartered Secretaries and Administrators) in the United Kingdom, and
therefore meets the qualification requirements under Rule 3.28 Note 1 of the Listing Rules and is in
compliance with Rule 8.17 of the Listing Rules.
While Mr. Hu does not possess the formal qualifications required of a company secretary, we have
applied for, and the Stock Exchange has granted, a waiver from strict compliance with Rules 3.28 and 8.17
of the Listing Rules for a three-year period from the Listing Date, subject to the conditions that (i) Ms.
Chow is appointed as a joint company secretary to assist Mr. Hu in discharging his functions as a company
secretary and in gaining the relevant experience as required under Rule 3.28 of the Listing Rules; and (ii)
WAIVERS FROM STRICT COMPLIANCE WITH THE LISTING RULES
– 88 –

the wavier can be revoked if there are material breaches of the Listing Rules. The waiver will be revoked
immediately if Ms. Chow, during the three-year period, ceases to provide assistance to Mr. Hu. We will
also adopt the following arrangements:
(a) Ms. Chow will work closely with and provide assistance to Mr. Hu in the discharge of his duties
as a company secretary, so as to enable Mr. Hu to acquire the “relevant experience” as is
required under Rule 3.28 of the Listing Rules;
(b) Mr. Hu will comply with the requirement under Rule 3.29 of the Listing Rules to attend
relevant professional training, so as to gain familiarity with the Listing Rules and other relevant
Hong Kong laws and regulations;
(c) our Company will ensure that Mr. Hu and Ms. Chow have access to relevant training, support
and advice from our compliance adviser (appointed pursuant to Rule 3A.19 of the Listing
Rules) and our Company’s legal and professional advisers, who can provide professional
guidance to us and our joint company secretaries as to compliance with the Listing Rules and
all other applicable laws and regulations; and
(d) prior to the end of the initial three year period, the qualifications and experience of Mr. Hu will
be re-evaluated to determine whether, having benefited from the assistance of Ms. Chow, Mr.
Hu has acquired the “relevant experience” within the meaning of Rule 3.28 of the Listing Rules
so that a further waiver will not be necessary.
WAIVER IN RELATION TO PUBLIC FLOAT
Rule 8.08 of the Listing Rules requires that there must be an open market in the securities for which
listing is sought. Under Rule 8.08(1)(a) of the Listing Rules, this will normally mean that at least 25% of
the issuer’s total issued share capital must at all times be held by the public. However, under Rule
8.08(1)(d) of the Listing Rules the Stock Exchange may, at its discretion, accept a lower percentage
between 15% and 25% in cases where:
(i) the issuer will have an expected market capitalization at the time of listing of over HK$10
billion;
(ii) the number of securities concerned and the extent of their distribution would enable the market
to operate properly with a lower percentage;
(iii) the issuer will make appropriate disclosure of the lower prescribed percentage of public float
in the initial listing document;
(iv) the issuer will confirm the sufficiency of the public float in successive annual reports after
listing; and
(v) a sufficient portion (to be agreed in advance with the Stock Exchange) of any securities
intended to be marketed contemporaneously within and outside Hong Kong must normally be
offered in Hong Kong.
WAIVERS FROM STRICT COMPLIANCE WITH THE LISTING RULES
– 89 –

We have applied to the Stock Exchange to request the Stock Exchange to exercise its discretion under
Rule 8.08(1)(d) of the Listing Rules, and the Stock Exchange has granted to us, a waiver from strict
compliance with the requirements under Rule 8.08(1)(a) of the Listing Rules and that the minimum
percentage of the Shares from time to time held by the public will be the higher of: (i) 18.43%, being the
percentage of Shares held by the public upon completion of the Global Offering (where the Over-allotment
Option is not exercised) and (ii) such percentage of Shares held by the public after the full or partial
exercise of the Over-allotment Option.
In support of the application, we confirmed to the Stock Exchange that:
(a) based on the low end of the indicative offer price range of HK$37.60, the market capitalisation
of the Company will be approximately HK$18.03 billion immediately upon completion of the
Global Offering (assuming the Over-allotment Option is not exercised), which exceeds the
minimum level as required under Rule 8.08(1)(d) of the Listing Rules, and therefore satisfies
the market capitalisation requirement for a lower public float;
(b) there will be an open market in the Shares and that the number of Shares concerned and the
extent of their distribution would enable the market to operate properly with only 18.43% of
the total number of issued Shares of our Company in public hands from time to time;
(c) we will undertake to make appropriate disclosure of the lower prescribed percentage of public
float of our Company in this prospectus and to confirm the sufficiency of the public float in
successive annual reports after Listing; and
(d) we will comply with Rules 8.08(2) and 8.08(3) of the Listing Rules at the time of Listing. We
will also implement appropriate measures and mechanisms to ensure continuous maintenance
of the minimum percentage of public float prescribed by the Stock Exchange.
WAIVERS FROM STRICT COMPLIANCE WITH THE LISTING RULES
– 90 –
DIRECTORS’ RESPONSIBILITY STATEMENT
This prospectus, for which our Directors collectively and individually accept full responsibility,
includes particulars given in compliance with the Companies (Winding Up and Miscellaneous Provisions)
Ordinance, the Securities and Futures (Stock Market Listing) Rules (Chapter 571V of the Laws of Hong
Kong) and the Listing Rules for the purpose of giving information with regard to us. Our Directors, having
made all reasonable enquiries, confirm that to the best of their knowledge and belief the information
contained in this prospectus is accurate and complete in all material respects and not misleading or
deceptive, and there are no other matters the omission of which would make any statement herein or this
prospectus misleading.
THE HONG KONG PUBLIC OFFERING AND THIS PROSPECTUS
This prospectus is published solely in connection with the Hong Kong Public Offering, which forms
part of the Global Offering. For applicants under the Hong Kong Public Offering, this prospectus sets out
the terms and conditions of the Hong Kong Public Offering.
The Hong Kong Offer Shares are offered solely on the basis of the information contained and
representations made in this prospectus and on the terms and subject to the conditions set out herein and
therein. No person is authorized to give any information in connection with the Global Offering or to make
any representation not contained in this prospectus, and any information or representation not contained
herein must not be relied upon as having been authorized by our Company, the Joint Sponsors, the Joint
Representatives, the Joint Global Coordinators, the Joint Bookrunners, the Joint Lead Managers and any
of the Underwriters, any of their respective directors, agents, employees or advisers or any other party
involved in the Global Offering.
The Listing is sponsored by the Joint Sponsors and the Global Offering is managed by the Joint
Representatives. The Hong Kong Public Offering is fully underwritten by the Hong Kong Underwriters
under the terms and conditions of the Hong Kong Underwriting Agreement and is subject to us and the
Joint Representatives (on behalf of the Hong Kong Underwriters) agreeing on the Offer Price. The
International Offering is expected to be fully underwritten by the International Underwriters subject to the
terms and conditions of the International Underwriting Agreement, which is expected to be entered into
on or around the Price Determination Date.
If, for any reason, the Offer Price is not agreed among us and the Joint Representatives (for
themselves and on behalf of the Hong Kong Underwriters), on or before Thursday, December 23, 2021,
the Global Offering will not proceed and will lapse. For full information about the Underwriters and the
underwriting arrangement, please see the section headed “Underwriting” in this prospectus.
Neither the delivery of this prospectus nor any offering, sale or delivery made in connection with the
Shares should, under any circumstances, constitute a representation that there has been no change or
development reasonably likely to involve a change in our affairs since the date of this prospectus or imply
that the information contained in this prospectus is correct as of any date subsequent to the date of this
prospectus.
INFORMATION ABOUT THIS PROSPECTUS AND THE GLOBAL OFFERING
– 91 –
PROCEDURES FOR APPLICATION FOR HONG KONG OFFER SHARES
The procedures for applying for Hong Kong Offer Shares are set forth in the section headed in “How
to Apply for Hong Kong Offer Shares” in this prospectus.
STRUCTURE AND CONDITIONS OF THE GLOBAL OFFERING
Details of the structure of the Global Offering, including its conditions, are set forth in the section
headed “Structure of the Global Offering” in this prospectus.
OVER-ALLOTMENT OPTION AND STABILIZATION
Details of the arrangements relating to the Over-allotment Option and stabilization are set forth in
the section headed “Structure of the Global Offering” in this prospectus. Assuming that the Over-allotment
Option is exercised in full, our Company may be required to allot and issue up to an aggregate of
10,787,400 additional Shares.
RESTRICTIONS ON OFFERS AND SALES OF SHARES
Each person acquiring the Hong Kong Offer Shares under the Hong Kong Public Offering will be
required to, or be deemed by his acquisition of Offer Shares to, confirm that he is aware of the restrictions
on offers of the Offer Shares described in this prospectus.
No action has been taken to permit a public offering of the Offer Shares or the general distribution
of this prospectus in any jurisdiction other than in Hong Kong. Accordingly, this prospectus may not be
used for the purposes of, and does not constitute, an offer or invitation in any jurisdiction or in any
circumstances in which such an offer or invitation is not authorized or to any person to whom it is unlawful
to make such an offer or invitation. The distribution of this prospectus and the offering of the Offer Shares
in other jurisdictions are subject to restrictions and may not be made except as permitted under the
applicable securities laws of such jurisdictions and pursuant to registration with or authorization by the
relevant securities regulatory authorities or an exemption therefrom.
APPLICATION FOR LISTING OF THE SHARES ON THE STOCK EXCHANGE
We have applied to the Stock Exchange for the listing of, and permission to deal in, the Shares in
issue and to be issued pursuant to the Global Offering (including any Shares that may be issued under the
Over-allotment Option).
No part of our equity or debt securities is listed on or dealt in on any other stock exchange and no
such listing or permission to list is being or proposed to be sought in the near future.
COMMENCEMENT OF DEALINGS IN THE SHARES
Dealings in the Shares on the Stock Exchange are expected to commence at 9:00 a.m. on Thursday,
December 30, 2021. The Shares will be traded in board lots of 100 Shares each. The stock code of the
Shares will be 2285.
INFORMATION ABOUT THIS PROSPECTUS AND THE GLOBAL OFFERING
– 92 –
SHARES WILL BE ELIGIBLE FOR ADMISSION INTO CCASS
If the Stock Exchange grants the listing of, and permission to deal in, the Shares and we comply with
the stock admission requirements of HKSCC, the Shares will be accepted as eligible securities by HKSCC
for deposit, clearance and settlement in CCASS with effect from the Listing Date or any other date as
determined by HKSCC. Settlement of transactions between participants of the Stock Exchange is required
to take place in CCASS on the second settlement day after any trading day.
All activities under CCASS are subject to the General Rules of CCASS and CCASS Operational
Procedures in effect from time to time.
Investors should seek the advice of their stockbroker or other professional advisers for details of the
settlement arrangement as such arrangements may affect their rights and interests. All necessary
arrangements have been made to enable the Shares to be admitted into CCASS.
PROFESSIONAL TAX ADVICE RECOMMENDED
You should consult your professional advisers if you are in any doubt as to the taxation implications
of subscribing for, purchasing, holding or disposing of, or dealing in, the Shares or exercising any rights
attaching to the Shares. We emphasize that none of our Company, the Joint Sponsors, the Joint
Representatives, the Joint Global Coordinators, the Joint Bookrunners, the Joint Lead Managers, the
Underwriters, any of our or their respective directors, officers or representatives or any other person
involved in the Global Offering accepts responsibility for any tax effects or liabilities resulting from your
subscription, purchase, holding or disposing of, or dealing in, the Shares or your exercise of any rights
attaching to the Shares.
SHARE REGISTER AND STAMP DUTY
All of our Shares issued pursuant to applications made in the Global Offering will be registered on
our Company’s register of members to be maintained by our Share Registrar, Tricor Investor Services
Limited, in Hong Kong.
Dealings in our Shares registered on our Company’s register of members will be subject to Hong
Kong stamp duty. The stamp duty is charged to each of the seller and purchaser at the ad valorem rate of
0.13% of the consideration for, or (if greater) the value of, the Shares transferred. In other words, a total
of 0.26% is currently payable on a typical sale and purchase transaction of the Shares. In addition, a fixed
duty of HK$5 is charged on each instrument of transfer (if required).
EXCHANGE RATE CONVERSION
Unless otherwise specified, amounts denominated in RMB or HK$ have been translated, for the
purpose of illustration only, into US dollars in this prospectus at the following exchange rates: US$1 to
RMB6.3702 and US$1 to HK$7.7967.
No representation is made that any amounts in RMB or HK$ were or could have been, or could be
converted into US dollars at such rates or any other exchange rates on such date or any other date.
INFORMATION ABOUT THIS PROSPECTUS AND THE GLOBAL OFFERING
– 93 –

ROUNDING
Certain amounts and percentage figures included in this prospectus have been subject to rounding
adjustments. Accordingly, figures shown as totals in certain tables may not be an arithmetic aggregation
of the figures preceding them.
LANGUAGE
If there is any inconsistency between this prospectus and its Chinese translation, this prospectus shall
prevail, provided that if there is any inconsistency between the Chinese names of the entities or enterprises
established in the PRC mentioned in this prospectus and their English translations, the Chinese names
shall prevail. The English translations of the Chinese names of such PRC entities or enterprises marked
with “*” are provided for identification purposes only.
OTHER
Unless otherwise specified, all references to any shareholdings in our Company following the
completion of the Global Offering assume that the Over-allotment Option is not exercised.
INFORMATION ABOUT THIS PROSPECTUS AND THE GLOBAL OFFERING
– 94 –

DIRECTORS
Name Residential Address Nationality
Executive Directors
Mr. Pan Longquan(潘龍泉)
Flat 7E, Hanfu YayuanXuanwu DistrictNanjingPRC
Chinese
Ms. Zhang Tong(張彤)
Building 52No. 8 Jiangjun AvenueJiangning DistrictNanjingPRC
Chinese
Mr. Ke Zuqian(柯祖謙)
Building 3,Jingui Court, Wenhua VillaRuijing Garden, Moling StreetJiangning DistrictNanjingPRC
Chinese
Mr. Michael John Clancy 29307 N. Tortuga Trail CourtRio Verde, AZ 85263USA
American
Independent Non-Executive Directors
Mr. Tian Ming(田明)
Room 1803, Block 218 Fengfu RoadBaixia DistrictNanjingPRC
Chinese
Dr. Li Minghui(李明輝)
Room 204, Building 283 Xikang RoadGulou DistrictNanjingPRC
Chinese
Mr. Jiang Li(蔣立)
Room 270681 Zhongshan RoadGulou DistrictNanjingPRC
Chinese
See the section headed “Directors and Senior Management” in this prospectus for further details.
DIRECTORS AND PARTIES INVOLVED IN THE GLOBAL OFFERING
– 95 –
PARTIES INVOLVED IN THE GLOBAL OFFERING
Joint Sponsors China International Capital CorporationHong Kong Securities Limited29th Floor, One International Finance Centre1 Harbour View StreetCentralHong Kong
Citigroup Global Markets Asia Limited50/F, Champion Tower3 Garden RoadCentralHong Kong
Joint Representatives China International Capital CorporationHong Kong Securities Limited29th Floor, One International Finance Centre1 Harbour View StreetCentralHong Kong
Citigroup Global Markets Asia Limited50/F, Champion Tower3 Garden RoadCentralHong Kong
Joint Global Coordinators China International Capital CorporationHong Kong Securities Limited29th Floor, One International Finance Centre1 Harbour View StreetCentralHong Kong
Citigroup Global Markets Asia Limited50/F, Champion Tower3 Garden RoadCentralHong Kong
The Hongkong and Shanghai Banking CorporationLimited1 Queen’s Road CentralHong Kong
DIRECTORS AND PARTIES INVOLVED IN THE GLOBAL OFFERING
– 96 –
Joint Bookrunners and Joint LeadManagers
China International Capital CorporationHong Kong Securities Limited29th Floor, One International Finance Centre1 Harbour View StreetCentralHong Kong
Citigroup Global Markets Asia Limited50/F Champion Tower3 Garden RoadCentralHong Kong(in relation to the Hong Kong Public Offering only)
Citigroup Global Markets Limited33 Canada SquareCanary WharfLondon E14 5LBUnited Kingdom(in relation to the International Offering only)
The Hongkong and Shanghai Banking CorporationLimited1 Queen’s Road CentralHong Kong
BOCOM International Securities Limited9/F, Man Yee Building68 Des Voeux Road CentralHong Kong
CMB International Capital Limited45/F, Champion Tower3 Garden RoadCentralHong Kong
Legal Advisers to Our Company As to Hong Kong and U.S. laws:
Simpson Thacher & Bartlett35/F, ICBC Tower3 Garden RoadCentralHong Kong
DIRECTORS AND PARTIES INVOLVED IN THE GLOBAL OFFERING
– 97 –

As to PRC laws:
Jia Yuan Law OfficesF408, Ocean PlazaNo. 158 Fuxing Men Nei StreetXicheng DistrictBeijing 100031PRC
As to U.S. laws and regulations:
Warner Norcross + Judd LLP1500 Warner Building150 Ottawa Ave., N.W.Grand Rapids, Michigan 49503USA
As to German laws and regulations:
HEUSSEN Rechtsanwaltsgesellschaft mbHTower 185 Friedrich-Ebert-Anlage 35-3760327 Frankfurt am MainGermany
Legal Advisers to the Joint Sponsorsand the Underwriters
As to Hong Kong and U.S. laws:
Sullivan & Cromwell (Hong Kong) LLP20/F, Alexandra House18 Chater RoadCentralHong Kong
As to PRC laws:
Broad & Bright Law FirmRoom 1508, 15th Floor, Tower COcean Office Park, No. 5 JinghuananjieChaoyang DistrictBeijing 100020PRC
Auditor and Reporting Accountant KPMGCertified Public Accountants8th Floor, Prince’s BuildingCentralHong KongG P O Box 50, Hong Kong
DIRECTORS AND PARTIES INVOLVED IN THE GLOBAL OFFERING
– 98 –

Industry Consultant Frost & Sullivan (Beijing) Inc.,Shanghai Branch Co.Room 2504, Wheelock Square1717 Nanjing West RoadShanghai 200040China
Receiving Bank Bank of China (Hong Kong) Limited1 Garden RoadHong Kong
DIRECTORS AND PARTIES INVOLVED IN THE GLOBAL OFFERING
– 99 –
Registered Office Unit 04, 22/F, Saxon Tower
7 Cheung Shun Street
Lai Chi Kok
Kowloon
Hong Kong
Headquarters No. 99 West Tianyuan Road
Jiangning Economic and Technological
Development Zone
Nanjing
PRC
Principal Place of Business in Hong Kong Unit 04, 22/F, Saxon Tower
7 Cheung Shun Street
Lai Chi Kok
Kowloon
Hong Kong
Company’s Website https://global.chervongroup.com(The information on the website does not form
part of this prospectus)
Joint Company Secretaries Mr. Hu Yian (胡以安)
Room 102, Building 5
Phase I, Renheng Jiangwan City
198 Leshan Road
Jianye District
Nanjing
PRC
Ms. Chow Yuk Yin Ivy (周玉燕)
(FCG FCS)
6/F, Manulife Place
348 Kwun Tong Road
Kowloon
Hong Kong
Authorized Representatives Ms. Zhang Tong (張彤)
Building 52
No. 8 Jiangjun Avenue
Jiangning District
Nanjing
PRC
CORPORATE INFORMATION
– 100 –
Mr. Hu Yian (胡以安)
Room 102, Building 5
Phase I, Renheng Jiangwan City
198 Leshan Road
Jianye District
Nanjing
PRC
Audit Committee Dr. Li Minghui (李明輝) (Chairperson)
Mr. Tian Ming (田明)
Mr. Jiang Li (蔣立)
Remuneration Committee Mr. Tian Ming (田明) (Chairperson)
Ms. Zhang Tong (張彤)
Dr. Li Minghui (李明輝)
Nomination Committee Mr. Jiang Li (蔣立) (Chairperson)
Mr. Tian Ming (田明)
Mr. Pan Longquan (潘龍泉)
Share Registrar Tricor Investor Services LimitedLevel 54, Hopewell Centre
183 Queen’s Road East
Hong Kong
Compliance Adviser Guotai Junan Capital Limited26/F-28/F, Low Block
Grand Millennium Plaza
181 Queen’s Road Central
Hong Kong
Principal Banks The Hongkong and Shanghai BankingCorporation LimitedHSBC Main Building
1 Queen’s Road Central
Hong Kong
Bank of Communications –Nanjing Jiangning Branch1202 Shuanglong Road
Jiangning District
Nanjing
PRC
CORPORATE INFORMATION
– 101 –
This and other sections of this prospectus contain information relating to the industry inwhich we operate. Certain information and statistics set forth in this section have been extractedfrom the Frost & Sullivan Report issued by Frost & Sullivan, an independent market researchagency, which we commissioned, and from various official government publications and otherpublicly available publications. Information and statistics from official government sources havenot been independently verified by us, the Joint Sponsors, the Joint Representatives, Joint GlobalCoordinators, Joint Bookrunners, and Joint Lead Managers, any of the Underwriters, any of ouror their respective directors, officers or representatives or any other person involved in the GlobalOffering and no representation is given as to their correctness or accuracy. Accordingly, youshould not place undue reliance on such information or statistics.
OVERVIEW
According to the Frost & Sullivan Report, power tools can be broadly defined as the type of tools
that operate with additional power and mechanism other than purely manual labor. Examples include
screwdrivers, drills, saws, sanders, miter saws and grinders, among others. OPE products can be broadly
defined as tools or equipment that are primarily used for lawn, garden or yard maintenance. Examples
include lawn mowers, leaf blowers, snow blowers and trimmers, among others.
According to the Frost & Sullivan Report, the value chain of the global power tools and OPE
industry can be divided into three links: (i) upstream component producers or suppliers, (ii) midstream
manufacturers operating under OBM, ODM and/or original equipment manufacturing (“OEM”) business
models, and (iii) downstream sales and distribution channels. We are a midstream manufacturer with OBM
and ODM business models, which mean that we both (i) design, develop, produce and sell products under
our own proprietary brands and (ii) design, develop and produce products based on general product
descriptions provided by the relevant business partners, and the products bear trademarks of such business
partners.
Unless otherwise indicated, the data for the power tool and OPE markets is from Frost & Sullivan,
which is derived from the primary and secondary research conducted by Frost & Sullivan, including
reviewing the annual reports of the listed companies, analyzing publicly available market reports and
interviewing experts from comparable companies and industry associations (collectively referred to as
“Frost & Sullivan Analysis and Estimates”).
GLOBAL POWER TOOL MARKET
According to the Frost & Sullivan Report, the global power tool market grew at a CAGR of 6.1%
from US$30.9 billion in 2016 to US$39.2 billion by revenue in 2020, and is expected to further grow at
a CAGR of 5.5% to US$51.3 billion by revenue in 2025.
INDUSTRY OVERVIEW
– 102 –

By Power Sources
According to the Frost & Sullivan Report, power tools can be categorized into two segments by
power source, namely electric and other power tools. Electric power tools constituted the larger segment
of the market by revenue and are expected to grow at a CAGR of 5.9% to US$38.6 billion in 2025. In the
other power tool segment, while pneumatic (air) power tools are emerging as potential alternatives to
electric power tools for professional/industrial end users, commercial production of pneumatic tools is still
low.
Global Power Tool Market Breakdown by Power Source(US$ billion, except percentages)
8.1 8.8 9.3 9.7 10.1 10.6 11.2 11.7 12.2 12.6
22.824.9 26.5 27.6 29.1 30.9 32.7 34.7 36.6 38.6
30.933.7
35.8 37.339.2
41.543.9
46.348.8
51.3
2016 2017 2018 2019 2020 2021E 2022E 2023E 2024E 2025E
Electric Power Tools
Other Power Tools
2020 - 2025E CAGR: 5.5%
2020 - 2025E CAGR
2016 - 2020 CAGR: 6.1%
5.9%
4.5%
Source: Frost & Sullivan Analysis and Estimates
Electric Power Tool Market
By Power Technology
According to the Frost & Sullivan Report, the dominant global electric power tools can be further
categorized into two segments by power technology, namely cordless (or lithium-ion battery powered,
direct current or DC) and corded (or alternate current or AC). The cordless segment of the electric power
tool market, excluding parts and accessories, is expected to grow at a CAGR of 9.9% from US$10.3 billion
in 2020 to US$16.4 billion in 2025, and such expected growth rate is higher than the CAGR of 2.1% for
corded segment for the same period.
INDUSTRY OVERVIEW
– 103 –

Global Electric Power Tool Market Breakdown by Power Technology(US$ billion, except percentages)
5.8 6.3 6.6 6.9 7.2 7.6 8.0 8.5 8.9 9.3
9.8 10.5 11.0 11.3 11.6 11.9 12.2 12.5 12.7 12.8
7.28.0 8.9 9.4 10.3
11.312.5
13.715.0
16.4
22.824.9
26.527.6
29.130.9
32.734.7
36.638.6
2016 2017 2018 2019 2020 2021E 2022E 2023E 2024E 2025E
Cordless
Corded
Parts & Accessories
2020 - 2025E CAGR: 5.9%
9.9%
5.3%
2.1%
2016 - 2020 CAGR: 6.2%
2020 - 2025E CAGR
Source: Frost & Sullivan Analysis and Estimates
By End-user Category
According to the Frost & Sullivan Report, the global electric power tools market can be further
categorized into two segments by end-user category, namely industrial/professional and consumer.
Industrial/professional electric power tools constituted the larger segment of the market and is expected
to grow by a CAGR of 6.1% from US$20.2 billion in 2020 to US$27.1 billion in 2025. Consumer electric
power tools are expected to grow by a CAGR of 5.3% from US$8.9 billion in 2020 to US$11.5 billion in
2025.
Global Electric Power Tool Market Breakdown by End-user Category(US$ billion, except percentages)
7.1 7.7 8.2 8.4 8.9 9.4 9.9 10.4 10.9 11.5
15.717.1 18.3 19.1 20.2 21.5 22.8 24.2
25.7 27.122.824.9
26.5 27.629.1
30.932.7
34.736.6
38.6
2016 2017 2018 2019 2020 2021E 2022E 2023E 2024E 2025E
Industrial & Professional
Consumer
2020 - 2025E CAGR: 5.9%
6.1%
5.3%
2016 - 2020 CAGR: 6.2%
2020 - 2025E CAGR
Source: Frost & Sullivan Analysis and Estimates
INDUSTRY OVERVIEW
– 104 –
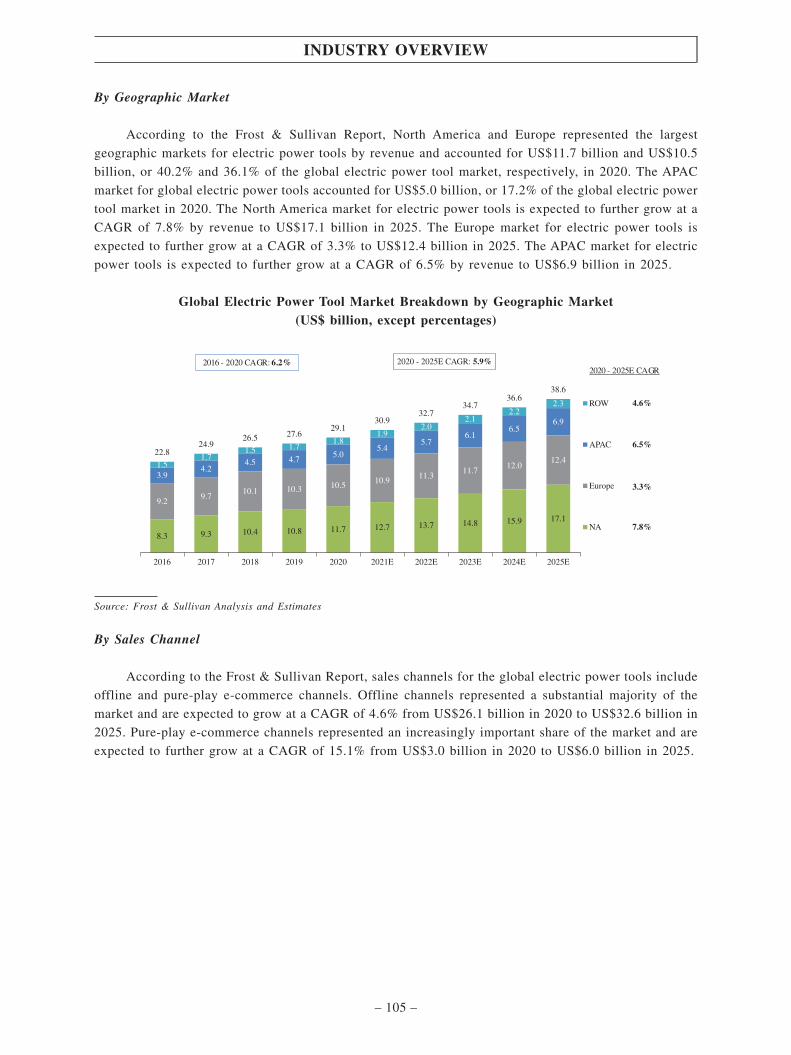
By Geographic Market
According to the Frost & Sullivan Report, North America and Europe represented the largest
geographic markets for electric power tools by revenue and accounted for US$11.7 billion and US$10.5
billion, or 40.2% and 36.1% of the global electric power tool market, respectively, in 2020. The APAC
market for global electric power tools accounted for US$5.0 billion, or 17.2% of the global electric power
tool market in 2020. The North America market for electric power tools is expected to further grow at a
CAGR of 7.8% by revenue to US$17.1 billion in 2025. The Europe market for electric power tools is
expected to further grow at a CAGR of 3.3% to US$12.4 billion in 2025. The APAC market for electric
power tools is expected to further grow at a CAGR of 6.5% by revenue to US$6.9 billion in 2025.
Global Electric Power Tool Market Breakdown by Geographic Market(US$ billion, except percentages)
8.3 9.3 10.4 10.8 11.7 12.7 13.7 14.8 15.9 17.1
9.29.7
10.1 10.3 10.5 10.9 11.311.7
12.012.4
3.94.2
4.5 4.75.0
5.45.7
6.16.5
6.9
1.51.7
1.5 1.71.8
1.92.0
2.12.2
2.3
22.824.9
26.5 27.629.1
30.932.7
34.736.6
38.6
ROW
APAC
Europe
NA
2020 - 2025E CAGR: 5.9%
4.6%
6.5%
3.3%
7.8%
2016 2017 2018 2019 2020 2021E 2022E 2023E 2024E 2025E
2016 - 2020 CAGR: 6.2%2020 - 2025E CAGR
Source: Frost & Sullivan Analysis and Estimates
By Sales Channel
According to the Frost & Sullivan Report, sales channels for the global electric power tools include
offline and pure-play e-commerce channels. Offline channels represented a substantial majority of the
market and are expected to grow at a CAGR of 4.6% from US$26.1 billion in 2020 to US$32.6 billion in
2025. Pure-play e-commerce channels represented an increasingly important share of the market and are
expected to further grow at a CAGR of 15.1% from US$3.0 billion in 2020 to US$6.0 billion in 2025.
INDUSTRY OVERVIEW
– 105 –
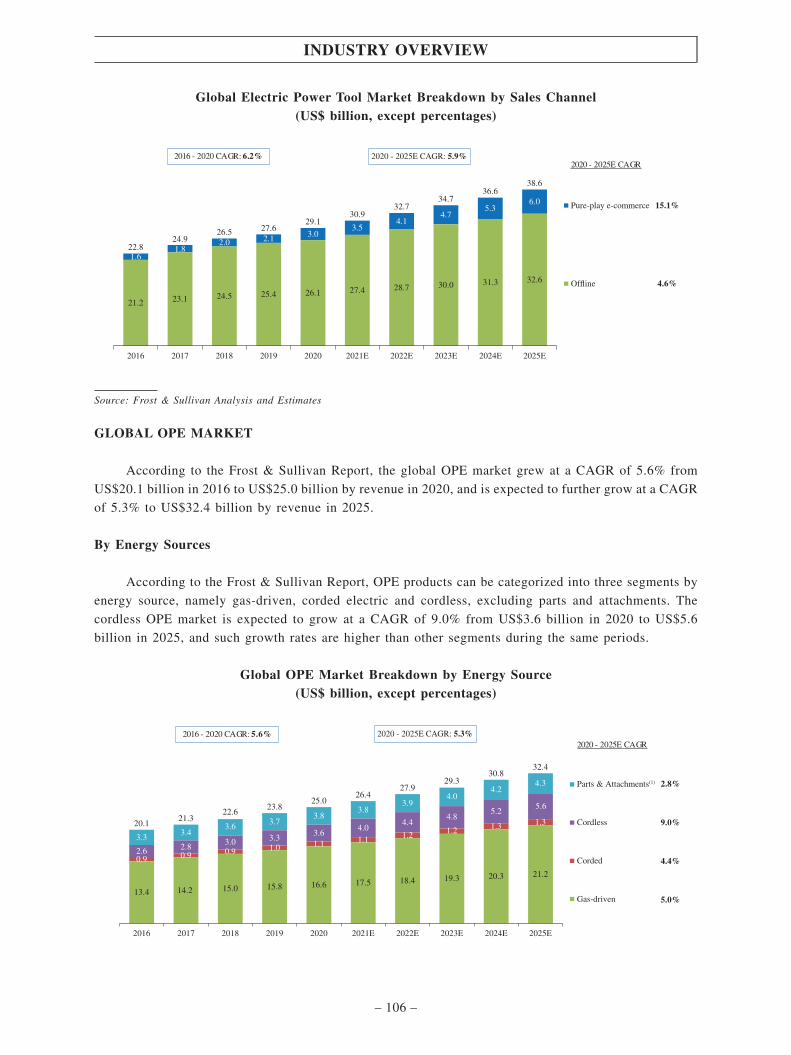
Global Electric Power Tool Market Breakdown by Sales Channel(US$ billion, except percentages)
22.824.9
26.5 27.629.1
30.932.7
34.736.6
38.6
2016 2017 2018 2019 2020 2021E 2022E 2023E 2024E 2025E
Pure-play e-commerce
Offline
15.1%
4.6%
2020 - 2025E CAGR: 5.9%
21.2 23.1 24.5 25.4 26.1 27.4 28.7 30.0 31.3 32.6
1.61.8
2.0 2.1 3.03.5
4.14.7
5.36.0
2016 - 2020 CAGR: 6.2%2020 - 2025E CAGR
Source: Frost & Sullivan Analysis and Estimates
GLOBAL OPE MARKET
According to the Frost & Sullivan Report, the global OPE market grew at a CAGR of 5.6% from
US$20.1 billion in 2016 to US$25.0 billion by revenue in 2020, and is expected to further grow at a CAGR
of 5.3% to US$32.4 billion by revenue in 2025.
By Energy Sources
According to the Frost & Sullivan Report, OPE products can be categorized into three segments by
energy source, namely gas-driven, corded electric and cordless, excluding parts and attachments. The
cordless OPE market is expected to grow at a CAGR of 9.0% from US$3.6 billion in 2020 to US$5.6
billion in 2025, and such growth rates are higher than other segments during the same periods.
Global OPE Market Breakdown by Energy Source(US$ billion, except percentages)
2016 2017 2018 2019 2020 2021E 2022E 2023E 2024E 2025E
2020 - 2025E CAGR: 5.3%
Parts & Attachments(1)
Cordless
Corded
Gas-driven
2.8%
9.0%
4.4%
5.0%13.4 14.2 15.0 15.8 16.6 17.5 18.4 19.3 20.3 21.2
0.9 0.9 0.9 1.0 1.1 1.1 1.2 1.2 1.3 1.3
2.6 2.83.0 3.3
3.64.0
4.44.8
5.25.6
3.33.4
3.63.7
3.83.8
3.94.0
4.24.3
20.121.3
22.623.8
25.026.4
27.929.3
30.832.4
2016 - 2020 CAGR: 5.6%2020 - 2025E CAGR
INDUSTRY OVERVIEW
– 106 –
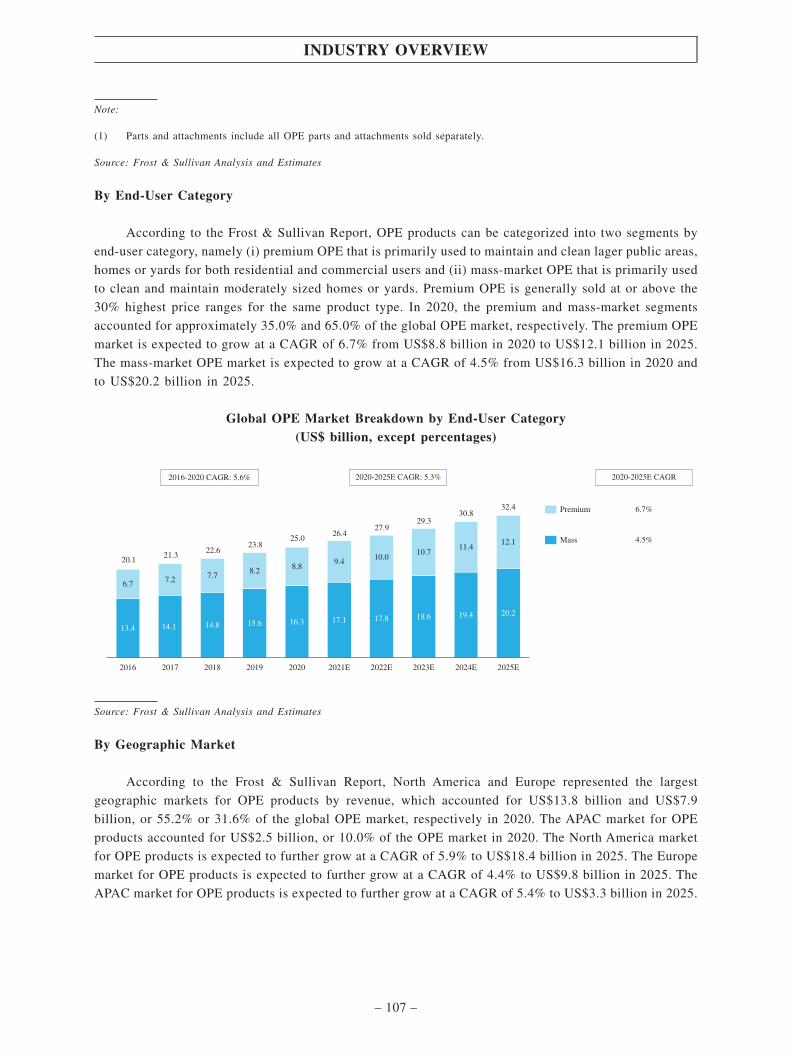
Note:
(1) Parts and attachments include all OPE parts and attachments sold separately.
Source: Frost & Sullivan Analysis and Estimates
By End-User Category
According to the Frost & Sullivan Report, OPE products can be categorized into two segments by
end-user category, namely (i) premium OPE that is primarily used to maintain and clean lager public areas,
homes or yards for both residential and commercial users and (ii) mass-market OPE that is primarily used
to clean and maintain moderately sized homes or yards. Premium OPE is generally sold at or above the
30% highest price ranges for the same product type. In 2020, the premium and mass-market segments
accounted for approximately 35.0% and 65.0% of the global OPE market, respectively. The premium OPE
market is expected to grow at a CAGR of 6.7% from US$8.8 billion in 2020 to US$12.1 billion in 2025.
The mass-market OPE market is expected to grow at a CAGR of 4.5% from US$16.3 billion in 2020 and
to US$20.2 billion in 2025.
Global OPE Market Breakdown by End-User Category(US$ billion, except percentages)
21.3
32.4
20.122.6
23.825.0
26.427.9
29.330.8
Mass
Premium
4.5%
6.7%
2016 2017 2018 2019 2020 2021E 2022E 2023E 2024E 2025E
2020-2025E CAGR: 5.3% 2020-2025E CAGR
13.4 14.1 14.8 15.6 16.3 17.1 17.8 18.6 19.4 20.2
6.7 7.2 7.78.2 8.8
9.4 10.010.7
11.412.1
2016-2020 CAGR: 5.6%
Source: Frost & Sullivan Analysis and Estimates
By Geographic Market
According to the Frost & Sullivan Report, North America and Europe represented the largest
geographic markets for OPE products by revenue, which accounted for US$13.8 billion and US$7.9
billion, or 55.2% or 31.6% of the global OPE market, respectively in 2020. The APAC market for OPE
products accounted for US$2.5 billion, or 10.0% of the OPE market in 2020. The North America market
for OPE products is expected to further grow at a CAGR of 5.9% to US$18.4 billion in 2025. The Europe
market for OPE products is expected to further grow at a CAGR of 4.4% to US$9.8 billion in 2025. The
APAC market for OPE products is expected to further grow at a CAGR of 5.4% to US$3.3 billion in 2025.
INDUSTRY OVERVIEW
– 107 –

Global OPE Market Breakdown by Geographic Market(US$ billion, except percentages)
2016 2017 2018 2019 2020 2021E 2022E 2023E 2024E 2025E
2020 - 2025E CAGR: 5.3%
10.8 11.5 12.2 13.0 13.8 14.7 15.5 16.5 17.4 18.4
6.5 6.9 7.2 7.6 7.9 8.3
8.6 9.0
9.4 9.8
2.0 2.2 2.3
2.4 2.5
2.6 2.8
2.9 3.1
3.3
0.8 0.8 0.8
0.8 0.9 0.9
0.9 0.9
0.9 1.0
20.1 21.3 22.6
23.8 25.0 26.4
27.9 29.3
30.8 32.4
ROW
APAC
Europe
NA
2.2%
5.4%
4.4%
5.9%
2016 - 2020 CAGR: 5.6%
2020 - 2025E CAGR
Source: Frost & Sullivan Analysis and Estimates
By Sales Channel
According to the Frost & Sullivan Report, sales channels for the global OPE products can be
categorized into offline and pure-play e-commerce channels. Offline channels represented a substantial
majority of the market and are expected to grow at a CAGR of 4.7% from US$22.7 billion in 2020 to
US$28.5 billion in 2025. Pure-play e-commerce channels represented an increasingly important share of
the market and are expected to grow at a CAGR of 10.2% from US$2.4 billion in 2020 to US$3.9 billion
in 2025.
Global OPE Market Breakdown by Sales Channel(US$ billion, except percentages)
2016 2017 2018 2019 2020 2021E 2022E 2023E 2024E 2025E
Pure-play e-commerce
Offline
2020 - 2025E CAGR: 5.3%
10.2%
4.7%
18.6 19.6 20.7 21.7 22.7 23.8 24.9 26.1 27.3 28.5
1.61.7
1.92.1
2.42.7
2.93.2
3.6 3.9
20.121.3
22.623.8
25.026.4
27.929.3
30.8 32.4
2016 - 2020 CAGR: 5.6%
2020 - 2025E CAGR
Source: Frost & Sullivan Analysis and Estimates
INDUSTRY OVERVIEW
– 108 –
KEY GROWTH DRIVERS, FUTURE INDUSTRY TRENDS AND BARRIERS TO ENTRY
According to the Frost & Sullivan Report, the following factors are expected to be some of the key
drivers of growth, future industry trends and barriers to entry for the global power tool and OPE industry
over the next several years:
Key Growth Drivers and Future Industry Trends
The global power tool and OPE industry is driven by both (i) supply side factors, such as
development of lithium-ion battery platforms and adoption of advanced technologies, as well as (ii)
demand side factors, such as consumption upgrade, increased demand for professional power tools and
do-it-yourself consumer behavior, which represent the future trends of the industry.
Supply Side Factors
Development of lithium-ion battery platforms. Rapid advancement in the lithium-ion battery system
technology is a significant driver of the power tool and OPE market. According to the Frost & Sullivan
Report, in the past several decades, the global power tool and OPE industry has been transformed by a
technology-driven shift from corded tools or gasoline-powered tools to cordless tools, which provide for
benefits such as convenience, compactness, cost-efficiency and environmental friendliness without
sacrificing power and performance. This continuous product upgrade is primarily driven by the rapid
improvement and fast penetration of high energy density batteries that are safer and last longer once
charged. In addition, increased compatibility of battery platforms across a range of tools helps increase
convenience and reduce costs for end users, who will be able to purchase and carry to worksites a variety
of different tools or equipment with a limited number of interchangeable battery packs. The compatibility
of battery platforms will likely promote customer loyalty to the same series of products. As a result of the
development of lithium-ion battery platforms, end users have showed a growing preference for battery
powered tools and OPE products.
Emergence and adoption of advanced and smart technologies. Introduction of new product
categories to the market, together with emerging technologies to enhance existing products have always
been an important driver of industry growth in terms of capturing or renewing consumer interest in power
tools and OPE products. Increasing emphasis on innovation and new product development by key power
tool and OPE market players as an effort to increase differentiation and maintain competitive strengths is
expected to drive additional incremental growth in the industry going forward. Major market players have
been introducing new products equipped with advanced technologies to meet the diverse needs and
preferences of end-users. For example, multi-functional tools that can combine tools such as saws, sanders
and grinders, have gained increasing popularity. Furthermore, IoT-, sensor- or AI-enabled products have
become a potential future growth area given their ability to enhance user experience. Such advancement
in technologies has the potential to enhance productivity and drive market demand for power tools and
outdoor power equipment in a variety of use cases, such as in household renovations, smart factories and
construction projects.
INDUSTRY OVERVIEW
– 109 –
Expansion of multi-channel sales and marketing strategies. Diverse sales channels have been
established to address end-users’ purchase preferences. In recent years, emerging channels, including
e-commerce channels and other online platforms for sales and marketing purposes, such as social media,
have been rapidly gaining prominence in capturing previously untapped or underpenetrated markets. Due
to intense industry competition, major market players generally adopt a multi-channel sales and
distribution strategy, which involves multiple channels including physical stores and online platforms
through which customers and end-users purchase power tools and OPE products. A typical sales and
distribution strategy covers retailers, distributors and pure-play e-commerce platforms.
Integrated value chain approach. Major market players typically operate under an integrated value
chain approach that combines key links along the value chain, including research and development,
manufacturing, sales and distribution, marketing and after-sales services. This approach typically will
enable companies to achieve operational efficiency and cost-savings. Companies also generally make
more efforts to be more customer-oriented and devote resources to gaining insights into the behaviors and
preferences of end-users in order to rapidly upgrade their product portfolio.
Demand Side Factors
Consumption upgrade. Consumers are typically willing to spend more on products equipped with
cutting edge technologies and advanced features, such as compactness, high-energy output, battery life and
environmental friendliness, which are expected to drive growth in the global power tool and OPE industry.
Increased demand for professional power tools. Market demand for power tools and OPE products
is also expected to increase due to growth of infrastructure and commercial construction activities,
residential construction and increasing sales of new homes in the U.S. market and increased demand for
power tools in industrial projects has contributed to the growth of the market. According to the Frost &
Sullivan Report, in the United States, government expenditure on infrastructure increased from US$309.0
billion in 2016 to US$384.1 billion in 2020 representing a CAGR of 5.6%. Furthermore, new residential
home sales increased from 561.0 thousand units in 2016 to 822.0 thousand units in 2020 representing a
CAGR of 10.0%. In addition, from 2016 to 2020, the value of residential construction put in place in the
United States increased from US$465.6 billion to US$604.4 billion, representing a CAGR of 6.7%, and
the value of non-residential construction put in place in the United States increased from US$699.0 billion
to US$808.0 billion, representing a CAGR of 3.7%, according to the same source.
Impact of do-it-yourself consumer behavior. Consumers in North America and Europe typically
showed preferences for do-it-yourself home decoration or maintenance with purchased power tools or OPE
products. This overall market demand is strengthened by the impact of the COVID-19 pandemic, which
has led more consumers to spend more time at home and a larger proportion of their budgets on power
tools and OPE products.
Preference for lithium-ion battery powered products. End users have shown increasing preference for
lithium-ion battery power tools, which generally provide for a good user experience, convenience and long
run time in different work environments. Similarly, end users have demonstrated growing demands for
lithium-ion battery OPE products, which are environmentally friendly and typically deliver better user
experience than traditional gasoline-engine products by generating less noise and vibration and offering
greater convenience. Lithium-ion battery power tools and OPE products can also offer greater cost
efficiency because battery platforms can be made compatible across different product types under the same
INDUSTRY OVERVIEW
– 110 –

brand and they do not require regular maintenance expected for traditional gasoline-engine products.
Advancement in lithium-ion battery technologies also enables lithium-ion battery powered tools and OPE
to provide power, performance and run time that rival traditional gasoline-engine products.
Barriers to Entry
According to the Frost & Sullivan Report, the following are key barriers to entry for the global power
tool and OPE markets:
Reputation and brand recognition. Reputation and brand recognition is one of the most critical
success factors in the power tools and OPE industry. Consumers generally prefer to purchase products
from brands which they perceive as superior, in terms of design, quality, functionality, value or other
factors. A strong reputation and brand recognition will also afford companies with stronger pricing power
and help attract and retain customers in new markets to further expansion plans in terms of developing
multiple categories of products across different markets around the world. However, reputation and brand
recognition generally take a long time to build up, often requiring a lengthy and proven track record, and
represents a key industry barrier to entry. Existing well-known brands, as well as the time and financial
resources required to build a brand, may pose challenges to new companies trying to enter the market.
Sales and distribution network. A well-established sales and distribution network is critical to
reaching and serving customers and end-users. Establishing an extensive, efficient and multi-channel
global sales network requires a significant amount of time and resources which may pose challenges to
new market entrants who are unlikely to have the required market knowledge and key relationships across
the value chain to compete effectively on a global basis.
Technology and research and development capabilities. Strong product research, design and
development capabilities are critical for competitive differentiation and to attract and retain customers and
end-users. Recruiting, training and integrating a strong research, design and development team, including
skilled management personnel, takes a significant amount of time and resources and in conjunction with
a well-developed global product and brand portfolio act as strong barriers to entry. New entrants are forced
to either license processes and technology from established companies or deploy significant resources in
to replicating the capabilities that existing companies already possess.
Industry expertise. Industry expertise and knowledge, including manufacturing know-how and
ability to quickly adapt to ever-changing end-user preferences, are critical factors to succeed in the
industry and generally can only be cultivated over time. With a growing number of increasingly complex
product models and inventories, companies that seek to enter the power tool and OPE markets will need
strong industry expertise to ensure the consistency of quality controls and the efficiency of cost structures.
INDUSTRY OVERVIEW
– 111 –
KEY MARKET CHALLENGES
Set forth below are the key challenges facing the global power tool and OPE markets:
• Product competition. Companies in the global power tool and OPE markets face product
competition in terms of technological advancement and pricing. Relevant technologies are
constantly evolving in the global power tool and OPE markets, such as from corded to cordless
and from gasoline to electric. Faced with increasing end-user expectations for product features
such as multi-tasking functions and upgraded IoT applications, companies must devote
resources in a timely and cost-efficient manner to support the development of new products that
can provide greater performance, versatility and convenience. In addition, as price competition
is prevalent in the markets, companies may lose customers, end-users and market shares if they
are unable to offer quality products with prices that are lower than competitors’ products of
similar performance.
• Relationship with major retailers and distributors. Competition is intense among companies in
establishing effective relationships with major retailers and distributors, which account for a
substantial portion of the sales in the global power tool and OPE markets. If the relationships
between a company and its major retailers or distributors deteriorate, the company’s financial
performance may be negatively affected.
• Price fluctuations and potential shortages of raw materials. Fluctuations in the price of raw
materials may have a negative impact on the costs of companies in the power tool and OPE
markets. In addition, the raw materials that companies need for manufacturing of products may
be in short supply. For example, the supply for lithium-ion batteries may be limited due to the
increased use of such batteries in electric vehicles.
• Uncertainty of global operations. Many companies in the power tool and OPE markets are
faced with challenges arising from their global business operations, such as evolving
regulations, economic recessions, foreign currency fluctuations, among other aspects. For
example, in respect of international trade, the U.S.-China trade tensions have contributed to
increased costs of goods, and the COVID-19 pandemic has caused interruptions to
manufacturing and exports and imports of many businesses, as well as fluctuations of freight
and shipping costs.
COMPETITIVE LANDSCAPE
Industry-leading, innovative providers of power tools and OPE products are driving consumption
trends in the industry. We generally compete with other power tool and OPE companies. Principal
competitive factors that are important to us include product features, relative price and performance,
product quality and reliability, design innovation, brands, consumer experience, marketing and
distribution capability, and corporate reputation. Our main competitors include domestic PRC and global
power equipment industry leaders.
The industry ranking of market shares by revenue in this section is derived from the Frost & Sullivan
Report. Calculations of market shares are subject to a number of factors, assumptions and limitations,
according to the same report. Such calculations incorporate revenue figures only from peer companies’
comparable business segments (namely power tools and OPE), among others, in terms of the relevant
INDUSTRY OVERVIEW
– 112 –

markets (such as power tools market and OPE market), and exclude revenue figures from such peer
companies’ business segments that are not comparable to the relevant markets (such as information system
solutions). Selection of peer companies and comparable business segments involves judgment by Frost &
Sullivan. Furthermore, revenue figures for private companies were derived from interviews conducted by
Frost & Sullivan with industry experts and peer companies, and supplemented by Frost & Sullivan’s
in-house analysis.
The competitive landscape of global electric power tool market is relatively concentrated, as the top
10 players accounted for approximately 73.3% of market shares by revenue in 2020. According to the Frost
& Sullivan Report, our ranking by revenue in the global electric power tool market increased from the 9th
in 2018 to the 7th in 2020. We were one of the few major electric power tool providers that have gained
market shares from 2018 to 2020.
Top 10 Global Electric Power Tool Providers by Revenue (2020)
Rank Company Market Share
1 Company A(1) 16.6%2 Company B(2) 16.0%3 Company C(3) 14.9%4 Company D(4) 6.9%5 Company E(5) 6.3%6 Company F(6) 4.1%7 Our Company 2.3%8 Company G(7) 2.2%9 Company H(8) 2.2%10 Company I(9) 1.8%
Source: Frost & Sullivan Analysis and Estimates
Notes:
(1) Founded in 1985, Company A (Hong Kong Stock Exchange-listed) offers power tools, accessories, hand tools, outdoorpower equipment, and floorcare equipment. Company A maintains a global manufacturing (across Europe, NorthAmerica, China, Mexico and Vietnam) and product development footprint with over 48,000 employees. (Sources: Frost& Sullivan Report; Company A’s annual report and official website.)
(2) Founded in 1886, Company B is a leading Stuttgart, Germany-based, global supplier of technology and servicesfocusing on automobile parts and components, industrial products and construction products. Company B operates fourbusiness sectors: mobility solutions, industrial technology, consumer goods and energy and building technology. As ofDecember 31, 2020, Company B had roughly 395,000 employees and operated in more than 400 locations across 60countries. Company B has manufacturing footprints across Europe, North America and China. (Sources: Frost &Sullivan Report; Company B’s official website.)
(3) Founded in 1843, Company C (NYSE-listed) is a U.S.-based global provider of hand tools, power tools and relatedaccessories, engineered fastening systems and products, services and equipment for oil & gas and infrastructureapplications, commercial electronic security and monitoring systems, healthcare solutions, and automatic doors. As ofJanuary 2, 2021, Company C had approximately 53,100 employees in over 60 countries. Company C has manufacturingfootprints across Europe, North America and Asia. (Sources: Frost & Sullivan Report; Company C’s annual report andofficial website.)
(4) Founded in 1915, Company D (Tokyo Stock Exchange-listed) is a Japan-based global manufacturer of power tools,gardening equipment, and similar products. As of March 31, 2021, Company D had approximately 18,624 employees.Company D has manufacturing footprints across Japan, China, the U.S., the U.K., Germany, Brazil, Romania andThailand. (Sources: Frost & Sullivan Report; Company D’s official website.)
INDUSTRY OVERVIEW
– 113 –

(5) Founded in 1941, Company E is a Schaan, Liechtenstein-based provider of power tools, system solutions, software andservices. Company E’s products cover powder-actuated fastening, drilling and demolition, diamond coring and cutting,measuring, firestop, screw fastening, adhesive and mechanical anchoring, and strut and hanger systems. Company Ehas approximately 30,000 employees in more than 120 countries. Company E has manufacturing footprints acrossEurope, North America, China and India. (Sources: Frost & Sullivan Report; Company E’s official website.)
(6) Incorporated in 1948, Company F is a Japan-based provider of power tools (such as grinders and screwdrivers) andoutdoor power equipment (such as lawnmowers and chainsaws). As of March 31, 2021, Company F had approximately6,790 employees around the world. (Sources: Frost & Sullivan Report; Company F’s official website.)
(7) Founded in 1873, Company G (Nasdaq Stockholm-listed) is a Sweden-based industrial company that providescompressors, air treatment systems, vacuum solutions, industrial power tools (such as drills, assembly tools andgrinders) and assembly systems, machine vision and power and flow solutions. Company G has approximately 40,000employees and sells products to customers in more than 180 countries and regions. (Sources: Frost & Sullivan Report;Company G’s official website.)
(8) Founded in 1995, Company H is a PRC-based provider of power tools and outdoor power equipment (such asscrewdrivers and chainsaws), armatures, stators and related spare parts, which are used in the fields of buildingconstruction, home decoration, stone processing, ship building and water conservatory projects. Company H has morethan 5,000 employees with a sales network covering more than 60 countries and regions. (Sources: Frost & SullivanReport; Company H’s official website.)
(9) Founded in 1920, Company I (NYSE-listed) is a U.S.-based provider of tools, equipment, diagnostics, repairinformation and systems solutions for professional users. Company I’s products and services include hand and powertools, tool storage, diagnostics software, handheld and PC-based diagnostic products, information and managementsystems, shop equipment and solutions for vehicle dealerships and repair centers, as well as for customers in industries,such as aviation and aerospace, agriculture, construction, government and military, mining, natural resources, powergeneration and technical education. Company I has approximately 12,500 employees, customers in more than 130countries and 4,800 mobile stores worldwide. Company I has manufacturing, warehouse, distribution, research anddevelopment and office facilities throughout the world, including 13 manufacturing facilities in the U.S. (Sources:Frost & Sullivan Report; Company I’s official website.)
The competitive landscape of global electric OPE market is highly concentrated, as the top 10
players accounted for approximately 88.4% of market shares by revenue in 2020. According to the Frost
& Sullivan Report, our ranking by revenue among top global providers of electric OPE products rose
rapidly from the 7th in 2018 to the 2nd in 2020. Ranking of our EGO brand among top global electric OPE
brands rose from the 6th in 2018 to the 3rd in 2020. Electric OPE products accounted for the majority of
our OPE revenue during the Track Record Period.
Top 10 Global Electric OPE Product Providersby Revenue (2020)
Top 10 Global Electric OPE Brandsby Revenue (2020)
Rank CompanyMarket
Share Rank CompanyMarket
Share
1 Company A 20.4% 1 Brand R(7) 16.3%2 Our Company 11.4% 2 Brand S(8) 10.4%3 Company C 10.4% 3 EGO 9.8%4 Company B 10.4% 4 Brand T(9) 8.8%5 Company J(1) 10.1% 5 Brand U(10) 7.1%6 Company K(2) 7.9% 6 Brand V(11) 6.1%7 Company L(3) 6.8% 7 Brand W(12) 4.2%8 Company M(4) 4.2% 8 Brand X(13) 3.6%9 Company N(5) 3.4% 9 Brand Y(14) 3.3%10 Company O(6) 3.3% 10 Brand Z 2.8%
Source: Frost & Sullivan Analysis and Estimates
INDUSTRY OVERVIEW
– 114 –

Notes:
(1) Founded in 2002, Company J is a PRC-based provider of outdoor power equipment for both consumers and landscapingprofessionals. Company J also manufactures private label products, as well as other products as original equipmentmanufacturers. Company J has manufacturing footprints across China and the U.S. (Sources: Frost & Sullivan Report;Company J’s official website.)
(2) Founded in 1994, Company K is a PRC-based provider of power tools and garden tools. Company K’s product linesinclude drills, drivers, rotary hammers, impact drivers and wrenches, among others. Company K has manufacturingfootprints across Europe, North America, Asia Pacific, Middle East and Africa. (Sources: Frost & Sullivan Report;Company K’s official website.)
(3) Company L is a Stockholm, Sweden-based manufacturer that produces outdoor power products including chainsaws,trimmers, brush cutters, cultivators, garden tractors, and mowers. Company L also offers consumers watering products,cutting equipment and diamond tools for construction and stone industries. Company L has 30 production facilitiesacross Europe, U.S. and China, among other countries and regions. (Sources: Frost & Sullivan Report; Company L’sofficial website.)
(4) Founded in 1926, Company M is a Waiblingen, Germany-based provider of outdoor power equipment for forestry,agriculture, landscaping, construction and customers. Company M product lines include chainsaws, trimmers andblowers, among others. As of December 31, 2020, Company M had seven manufacturing plants and approximately18,200 employees worldwide. Company M has manufacturing footprints across China, Brazil, Austria, Switzerland, theUnited States, the Philippines and Germany. Company M’s sales network consists of 41 sales and marketing companies,approximately 120 importers and more than 54,000 independent, authorized dealers in over 160 countries. (Sources:Frost & Sullivan Report; Company M’s official website and annual report.)
(5) Company N is a provider of outdoor power equipment, including lawnmowers and snow blowers for both residentialand commercial use. Company N had manufacturing footprints across Europe, North America and Asia Pacific. As ofDecember 1, 2021, Company N was acquired by Company C. (Sources: Frost & Sullivan Report; Company N’s officialwebsite.)
(6) Founded in 1914, Company O is a U.S.-based company that develops, produces, and sales a range of turf maintenanceequipment, snow removal equipment, and irrigation system supplies for commercial and residential gardens, publicparks, golf courses, sports fields and agricultural fields. Company O has a distribution network of professionaldistributors, dealers and retailers in more than 125 countries. Company O has manufacturing footprints across Europeand North America. (Sources: Frost & Sullivan Report; Company O’s official website.)
(7) Brand R belongs to Company A.
(8) Brand S belongs to Company B.
(9) Brand T belongs to Company C.
(10) Brand U belongs to Company K.
(11) Brand V belongs to Company L.
(12) Brand W belongs to Company M.
(13) Brand X belongs to Company J.
(14) Brand Y belongs to Company O.
INDUSTRY OVERVIEW
– 115 –

RAW MATERIALS
Our major raw materials primarily include (i) battery cells, (ii) metals such as copper and aluminum,
(iii) electronic components such as printed circuit boards and (iv) plastic particle materials such as Nylon
plastic (PA) and Polypropylene (PP). Material increases in the market prices of, or fluctuations in the
supply of, raw materials due to changes in the macro economy, supply and demand forces and market
expectations, will likely negatively affect the results of operations for power tool & OPE manufacturers.
The charts below set forth historical prices of major raw materials used by our company for the periods
indicated.
Copper
According to the Frost & Sullivan Report, the price of copper showed an upward trend from 2016
to 2018, followed by a decline in 2019. In 2020, the price of copper remained relatively flat. Beginning
in 2021, the price of copper is expected to rise over time primarily due to the increased market demand
driven by the expected global economic recovery and relatively stable supply of copper.
0.0
LME: CopperThousand USD/Ton, 2016-2025E
5.0
10.0
15.0
2016 2017 2018 2019 2020 2021E 2022E 2023E 2024E 2025E
4.96.2 6.5 6.0 6.2
9.3 9.4 9.6 9.7 9.8
Source: Frost & Sullivan Analysis and Estimate; London Metal Exchange; Bloomberg NEF; Wind
INDUSTRY OVERVIEW
– 116 –

Aluminum
Aluminum price increased from 2016 to 2018 driven by market demand, and decreased from 2018
to 2020 due to over-supply in the market. Beginning in 2021, the price of aluminum is expect to rise
primarily due to the increase in market demand driven by the recovery of the global production of
manufacturing goods.
0.0
LME: AluminumThousand USD/Ton, 2016-2025E
1.0
3.0
5.0
2016 2017 2018 2019 2020 2021E 2022E 2023E 2024E 2025E
1.62.0 2.1
1.8 1.7
2.42.6 2.7 2.8 2.9
2.0
4.0
Source: Frost & Sullivan Analysis and Estimate; London Metal Exchange; Bloomberg NEF; Wind
Battery cells
The prices of battery cells have generally declined from 2018 to 2020, which have contributed to the
improvement of our cost structures. Despite the recent fluctuations in the price of lithium-ion battery cells,
their prices are expected to decline in the long term due to favorable global environmental policies and
advancement in battery-related technologies.
0.0
50.0
150.0
250.0
2016 2017 2018 2019 2020 2021E 2022E 2023E 2024E 2025E
215.0
155.0
130.0110.0 102.0 95.9 91.6 88.4 85.9 83.9
Volume-weighted Average Cell PriceReal 2020 $/kWh, 2016-2025E
100.0
200.0
Source: Frost & Sullivan Analysis and Estimate; London Metal Exchange; Bloomberg NEF; Wind
INDUSTRY OVERVIEW
– 117 –

Nylon plastic and polypropylene
The price index of nylon plastic (PA) and polypropylene (PP) was relatively flat over the period from
2016 to 2020. Beginning in 2021, the price index of PA and PP is expected to increase with the recovery
of the global economy.
0.0
50.00
1,500.0
2016 2017 2018 2019 2020 2021E 2022E 2023E 2024E 2025E
821.4896.1
985.5
PAPP
893.6830.9
1,007.21,087.8
1,153.1 1,199.2 1,223.2
788.1837.0928.4903.4 859.5
766.3867.7
974.8 1,004.1 1,024.1
Price index of Nylon plastic (PA) and Polypropylene (PP)2010/1/4 = 1000, 2016-2025E
1,000.0
Source: Frost & Sullivan Analysis and Estimate; London Metal Exchange; Bloomberg NEF; Wind
FOREIGN EXCHANGE
The vast majority of our employees and manufacturing facilities are located in China, while the vast
majority of our sales are in international markets outside of China. As a result, a substantial portion of our
costs and expenses are denominated in RMB and a substantial portion of our sales are denominated in U.S.
dollars or euro. As a result, given the global nature of our business, we are exposed to foreign exchange
fluctuations. The charts below set forth the historical fluctuations of the U.S. dollar in relation to euro and
RMB during the Track Record Period.
0.0
Euro to USD2016-2020
0.5
1.0
1.5
2016 2017 2018 2019 2020
1.05801.1720 1.1381 1.1063
1.2117
0.0
RMB to USD2016-2020
0.1
0.2
2016 2017 2018 2019 2020
0.14420.1530 0.1457 0.1433
0.1533
Source: Frost & Sullivan Analysis and Estimates; United States Federal Reserve; The People’s Bank of China
INDUSTRY OVERVIEW
– 118 –

SOURCE OF INFORMATION
We commissioned Frost & Sullivan, an independent marketing and consulting agency, for the
research and preparation of the Frost & Sullivan Report on global power tool and OPE market, including
general economic and industry data. The consideration for the research and preparation of the Frost &
Sullivan Report is RMB600,000, which we believe reflects the market rate for such reports. Frost &
Sullivan is an independent global consulting firm, which was founded in 1961 in New York. It offers
industry research and market strategies and provides growth consulting and corporate training. Its industry
coverage includes automotive and transportation, chemicals, materials and food, commercial aviation,
consumer products, energy and power systems, environment and building technologies, healthcare,
industrial automation and electronics, industrial and machinery, and technology, media and telecom.
Except for the Frost & Sullivan Report, we did not commission any other customized report. In the
regions covered by the Frost & Sullivan Report, Frost & Sullivan adopted a methodology of both primary
research and secondary research and obtained knowledge, statistics, information and insights on industry
trends within the power tools and OPE products market. Primary research involved interviewing leading
industry participants. Secondary research involved reviewing company reports, independent research
reports and Frost & Sullivan’s proprietary database. Forecast data was obtained from historical data
analyses plotted against macroeconomic data as well as specific industry-related drivers, such as
purchasing power and consumer expenditure on outdoor leisure products. Frost & Sullivan developed its
forecast on the following bases and assumptions:
• Global social, economic and political environment is likely to remain stable in the forecast
period;
• Purchasing power is expected to continue to rise rapidly in emerging regions and to grow
steadily in developed regions and
• Related industry key drivers are likely to drive the market in the forecast period.
Our Directors confirm that, after taking reasonable care, there is no adverse change in the market
information since the date of the Frost & Sullivan Report, which may qualify, contradict or have an impact
on the information as disclosed in this section.
INDUSTRY OVERVIEW
– 119 –

REGULATORY OVERVIEW
1. LAW AND REGULATIONS RELATING TO OUR GROUP’S BUSINESS AND OPERATIONSIN THE PRC
A summary of the major PRC laws, rules and regulations relating to our business is set out below.
Major Regulators
The power tool and garden tool industries in the PRC are under the common management of
government authorities and industry associations. Government authorities focus on macro management of
the industry, while the latter focus on self-regulatory management within the industry. The competent
government authorities of the power tool and garden tool industries in the PRC mainly comprise the
Ministry of Industry and Information Technology (the “MIIT”) and the National Development and Reform
Commission (the “NDRC”). The Power Tools Branch under the China Electrical Equipment Industry
Association is a self-regulatory organization for the actual management and coordination in the power tool
industry.
The MIIT
The MIIT is responsible for formulating and organizing the implementation of industrial planning,
industrial policies and standards, monitoring the daily operation of the industries, and promoting the
development and independent innovation of major technology and equipment.
The NDRC
The NDRC is mainly responsible for formulating macro-industrial policies, implementing industrial
planning, and providing guidance on investment in fixed assets and technological transformation.
The Power Tools Branch under the China Electrical Equipment Industry Association
The Power Tools Branch under the China Electrical Equipment Industry Association is a social
organization formed by the enterprises and public institutions engaging in power tool manufacturing,
scientific research and design as well as operation on an equal, mutually beneficial and voluntary basis.
It is an industry organization covering various regions, departments and forms of ownerships.
Industrial Policies Encouraging the Development and Innovation of the Power Tool and Garden ToolIndustries
The National People’s Congress approved the Outline of the 13th Five-Year Plan for the National
Economic and Social Development of the People’s Republic of China (《中華人民共和國國民經濟和社會發展第十三個五年規劃綱要》) on March 16, 2016, which proposed to encourage the development of the
equipment manufacturing industry, carry out large-scale land greening initiatives, and strengthen the
construction of key projects.
REGULATORY OVERVIEW
– 120 –
The Central Committee of the Communist Party of China and the State Council promulgated the
Outline of the National Strategy of Innovation-Driven Development (《國家創新驅動發展戰略綱要》) in
May 2016, which proposed to develop intelligent green manufacturing technology, and promote the
upward transition of the manufacturing industry along the value chain. It also proposed to strengthen the
construction of basic industrial technology capabilities and test platforms, and improve the level of key
generic technologies such as basic materials, basic parts, basic processes and basic software.
The State Council promulgated the Notice of the State Council on Publishing the 13th Five-Year Plan
on National Science and Technology Innovation (《國務院關於印發“十三五”國家科技創新規劃的通知》)
on July 28, 2016, which proposed to develop, among others, green design technology, basic processing
technology, mechanical and electrical product development technology, remanufacturing and recycling
technology, build a green manufacturing technology system based on the full life cycle of the product, and
carry out the promotion and application of green manufacturing technology and equipment and
demonstrations to the industry.
The NDRC, the Ministry of Ecology and Environment and the Ministry of Commerce promulgated
the Implementation Plan for Promoting the Upgrading of Key Consumer Goods and the Recycling of
Resources (2019-2020) (《推動重點消費品更新升級暢通資源循環利用實施方案(2019–2020年)》) on
June 3, 2019, which proposed to support the research and development of energy-saving and smart home
appliances, and encourage the development of home appliance combination products and integrated
products based on the Internet of Things and artificial intelligence (“AI”) technologies.
The Ministry of Transport, the Ministry of Commerce, the General Administration of Customs and
other authorities promulgated the Notice of Better Serving the Stabilization of Foreign Trade in the
Current Situation (《關於當前更好服務穩外貿工作的通知》) on April 20, 2020, which proposed to reduce
the charges for import and export. It also proposed to fully implement the phased exemption of import and
export cargo port construction fees, reduction of cargo port fees, port facility security fees, and ship oil
pollution damage compensation funds and other fee reduction policies.
The National People’s Congress approved the Outline of the 14th Five-Year Plan for National
Economic and Social Development of the People’s Republic of China and the Long-Range Objectives
Through the Year 2035 (《中華人民共和國國民經濟和社會發展第十四個五年規劃和2035年遠景目標綱要》) on March 11, 2021, which proposed to uphold the strategy of manufacturing power, and promote
high-end, intelligentized, and green manufacturing. It also proposed to maintain self-dependence,
controllability, safety and efficiency, push forward the advancement of industrial foundation and
modernization of industrial chain, sustain the general stability of the manufacturing industry, enhance the
competitive advantages of the manufacturing industry, and promote the high-quality development of the
manufacturing industry.
Major Regulatory Laws and Regulations
Our business in the PRC are subject to laws and regulations which mainly relate to foreign
investment, research and development, production and sales of power tools, labor protection, intellectual
property, environmental protection, taxation, foreign exchange and other sectors.
REGULATORY OVERVIEW
– 121 –
Foreign Investment
Since January 1, 2020, the Foreign Investment Law of the People’s Republic of China (《中華人民共和國外商投資法》) (the “Foreign Investment Law”) promulgated by the National People’s Congress on
March 15, 2019 has come into effect. The former Law of the People’s Republic of China on Sino-foreign
Equity Joint Ventures (《中華人民共和國中外合資經營企業法》), the Law of the People’s Republic of
China on Wholly Foreign-owned Enterprises (《中華人民共和國外資企業法》) and the Law of the
People’s Republic of China on Sino-foreign Cooperative Joint Ventures (《中華人民共和國中外合作經營企業法》) were abolished at the same time. Since then, the Foreign Investment Law has become the
fundamental law regulating foreign-invested enterprises wholly or partially invested by foreign investors.
The organization form, institutional framework and standard of conduct of foreign-invested enterprises
shall be subject to the provisions of the Company Law of the PRC (《中華人民共和國公司法》) and other
laws.
The PRC implements the management system of pre-establishment national treatment plus negative
list for foreign investment, and has canceled the original approval and filing management system for the
establishment and change of foreign-invested enterprises. Pre-establishment national treatment refers to
the treatment given to foreign investors and their investments at their pre-admission shall be no less
favorable than that given to domestic investors and their investments; while the Negative List refers to the
special administrative measures for foreign investment access implemented according to the requirements
of the state with respect of foreign investment in specific industries, and the national treatment will be
given to foreign investments outside the negative list. The negative list currently implemented is the
Special Administrative Measures for Access of Foreign Investment (Negative List) (2020 Edition) (《外商投資准入特別管理措施(負面清單)(2020年版)》) promulgated by the NDRC and the Ministry of
Commerce on June 23, 2020 and implemented on July 23, 2020. While strengthening investment
promotion and protection, the Foreign Investment Law further regulates the administration of foreign
investment and proposes to establish a foreign investment information reporting system to replace the
existing approval and filing system of the Ministry of Commerce for foreign investment enterprises.
According to the Measures for the Reporting of Foreign Investment Information, foreign investors
conducting investment activities directly or indirectly in the PRC shall submit investment information to
the competent commerce authorities through the enterprise registration system and the national enterprise
credit information publicity system, which shall include initial reports, change reports, cancelation reports
and annual reports.
According to the Special Administrative Measures for Access of Foreign Investment (Negative List)
(2020 Edition) and the Catalog of Industries for Encouraging Foreign Investment (2020 Edition) (《鼓勵外商投資產業目錄(2020年版)》), which was promulgated by the NDRC and the Ministry of Commerce on
December 27, 2020 and became effective on January 27, 2021, foreign investment projects can be
classified into three categories, namely encouraged, restricted and prohibited. Foreign investment projects
which are not included in the Negative List are permitted foreign investment projects.
To date, the operations of our Company do not fall within the categories of restricted or prohibited
industries specified in the Special Administrative Measures for Access of Foreign Investment (Negative
List) (2020 Edition).
REGULATORY OVERVIEW
– 122 –
Safe Production
According to the Work Safety Law of the People’s Republic of China (the “Work Safety Law”)
(《中華人民共和國安全生產法》), which was revised on June 10, 2021 by the Standing Committee of the
National People’s Congress (the “SCNPC”) and implemented on September 1, 2021, a production and
business operation entity must (i) abide by this Law and other laws and regulations related to production
safety, strengthen production safety management, and establish and improve a production safety
responsibility system and production safety rules and regulations for all employees; (ii) increase the
efforts to guarantee the input of funds, materials, technology and personnel in production safety, improve
production safety conditions, and strengthen standardization and informatization of production safety;
(iii) construct a dual prevention mechanism consisting of graded management and control of safety risks
and examination and control of potential risks, improve the risk prevention and resolution mechanism,
raise production safety levels and ensure production safety. Entities that do not fulfil the safety production
conditions shall not engage in production and business activities.
Production and business entities shall meet the safety production conditions set forth in the Work
Safety Law and other relevant laws, administrative regulations and national standards or industry
standards. Entities that do not meet the above safety production conditions shall not engage in production
and business activities. Production and business entities shall provide their employees with education and
training on production safety to ensure that their employees possess necessary safety production
knowledge, are familiar with relevant safety production rules and regulations as well as safety operation
regulations, master the safety operation skills of their position, understand emergency measures and
acknowledge the rights and responsibilities in terms of safety production. Employees who do not enroll
in or fail the safety production education and training are not allowed to commence working in their
positions.
According to the Fire Protection Law of the People’s Republic of China (《中華人民共和國消防法》), which was revised by the SCNPC and implemented on April 29, 2021, and the Provisions on the
Supervision and Inspection over Fire Protection (《消防監督檢查規定》), which was revised by the
Ministry of Public Security on July 17, 2012 and implemented on November 1, 2012, enterprises shall
implement the fire safety responsibility system, and formulate their own fire safety system and operating
procedures; configure fire protection facilities and equipment, and regularly organize inspections and
maintenance; conduct a comprehensive inspection on the fire protection facilities at least once a year, and
archive the inspection records for future reference; adopt other fire safety measures; and perform other fire
safety duties. Construction projects that are subject to fire protection inspection and acceptance in
accordance with the law are prohibited from being put into use if they do not go through or fail the fire
protection inspection and acceptance. Other construction projects that fail the random inspection
according to law shall be suspended.
Product Quality and Consumer Rights Protection
According to the Product Quality Law of the People’s Republic of China (《中華人民共和國產品質量法》) (the “Product Quality Law”), which was revised by the SCNPC and became effective on
December 29, 2018, all production and sales activities in China must abide by this law. Producers and
sellers shall establish and improve the internal product quality management system, and strictly implement
work quality specifications, quality accountability and corresponding assessment methods. Producers and
sellers shall bear the responsibility for product quality in accordance with the provisions of this law.
REGULATORY OVERVIEW
– 123 –

The product quality supervision department of the State Council is responsible for the nationalproduct quality supervision work. The relevant departments of the State Council are responsible forproduct quality supervision within their respective responsibilities. The quality of products shall beinspected and qualified, and unqualified products shall not be presented as qualified products. Industrialproducts that may endanger human health and personal and property safety must meet the nationalstandards and industry standards that protect human health and personal and property safety. If nationalstandards and industry standards have not been established, such products must meet the requirements forensuring human health and personal and property safety. Any producer or seller who violates the ProductQuality Law may be subject to confiscation of such sales proceeds, revocation of business license, orimposition of fines. If the circumstances are serious, criminal responsibility shall be investigated. Theproducer or seller shall be responsible for damages to persons or property resulting from product defectscaused by their default.
According to the Administration Regulations on Compulsory Product Certification (《強制性產品認證管理規定》), which was promulgated on July 3, 2009 by the former State Administration of QualitySupervision, Inspection and Quarantine and implemented on September 1, 2009, relevant productsspecified by the state must be certified (the “compulsory product certification”) and marked thecertification mark before delivery, sale, import or use in other business activities. For products subject tocompulsory product certification, the state shall unify the product catalog, unify the mandatoryrequirements, standards and conformity assessment procedures of the technical specifications, unify thecertification mark, and unify the charging standards. The producers, sellers or importers of the productslisted in the catalogue shall entrust the certification body designated by the Certification and AccreditationAdministration of the People’s Republic of China to certify the products they produce, sell or import.
Import and Export of Goods
According to the Foreign Trade Law of the People’s Republic of China (《中華人民共和國對外貿易法》), which was revised by the SCNPC and implemented on November 7, 2016 and the Measures forthe Filing and Registration of Foreign Trade Business Operators (《對外貿易經營者備案登記辦法》),which was revised by the Ministry of Commerce and implemented on May 10, 2021, foreign trade businessoperators engaging in import and export of goods or technology shall file and register with the Ministryof Commerce or an agency entrusted by the Ministry of Commerce. If a foreign trade operator fails to gothrough the filing and registration procedures in accordance with the regulations, the Customs shall nothandle the customs declaration, inspection and release procedures for import and export goods. Accordingto the Notice of the Ministry of Commerce on Relevant Issues Concerning the Filing and Registration ofthe Right to Foreign Trade of Foreign-invested Enterprises (《商務部關於外商投資企業外貿權備案登記有關問題的通知》) issued by the Ministry of Commerce and came into effect on August 17, 2004,foreign-invested enterprises which were approved to be established in accordance with the law before July1, 2004 and have not applied for change of scope of business or added any other import and exportbusiness activities, are not required to go through the process of filing and registration of foreign tradebusiness operators.
According to the Customs Law of the People’s Republic of China (《中華人民共和國海關法》),which was revised by the SCNPC and implemented on April 29, 2021, the Customs is the entry and exitsupervision authority of the state. Consignees and consignors of import and export goods and customsdeclaration enterprises shall file with the Customs in accordance with the law when handling the customsdeclaration procedures. Enterprises and individuals engaging in customs declaration shall not illegallydeclare customs on behalf of others. Unless otherwise specified, customs declaration and payment ofduties for import and export goods may be handled by the consignees and consignors themselves, or theymay entrust a customs declaration enterprise to handle the formalities.
REGULATORY OVERVIEW
– 124 –

Anti-Unfair Competition
According to the Anti-Unfair Competition Law of the People’s Republic of China (《中華人民共和國反不正當競爭法》) (the “Anti-Unfair Competition Law”), which was revised by the SCNPC and
became effective on April 23, 2019, acts of unfair competition refer to the acts of business operators that
violate the provisions of the Anti-Unfair Competition Law, disrupt the order of market competition, and
harm the lawful rights and interests of other operators or consumers during business activities. According
to the Anti-Unfair Competition Law, business operators shall follow the principles of voluntariness,
equality, fairness, and integrity in market transactions, and abide by laws and business ethics. Business
operators who violate the provisions of the Anti-Unfair Competition Law shall bear corresponding civil,
administrative or criminal liabilities according to the specific circumstances.
Labor and Social Security
According to the Labor Law of the People’s Republic of China (《中華人民共和國勞動法》) which
was revised by the SCNPC and implemented on December 29, 2018, the Chinese Labor Contract Law
(《中華人民共和國勞動合同法》), which was revised by the Standing Committee of the National People’s
Congress on December 28, 2012 and implemented on July 1, 2013, and the Regulations for the
Implementation of the Chinese Labor Contract Law (《中華人民共和國勞動合同法實施條例》) issued by
the State Council and implemented on September 18, 2008, employers shall strictly abide by national
standards and provide workers with relevant training to ensure that workers enjoy labor rights and perform
labor obligations. The employers and the employees shall sign a written labor contract. The wage paid by
the employers to the employees shall not be lower than the local standard of minimum wage.
According to the Chinese Social Insurance Law (《中華人民共和國社會保險法》), which was
revised by the SCNPC and implemented on December 29, 2018, the Regulations on the Administration of
Housing Provident Funds (《住房公積金管理條例》), which was revised by the State Council and
implemented on March 24, 2019, and the Interim Regulations on the Collection and Payment of Social
Insurance Premiums (《社會保險費徵繳暫行條例》), which was revised by the State Council and
implemented on March 24, 2019, employers should pay contributions to basic pension insurance,
unemployment insurance, maternity insurance, work-related injury insurance, basic medical insurance and
housing provident fund for their employees according to the statutory payment base and payment ratio. If
the relevant payment is not paid in full and on time to the relevant local administrative agency, the
employer may be ordered to make up the gap or pay a fine.
Intellectual Property
Trademark
The Trademark Law of the People’s Republic of China (《中華人民共和國商標法》), which was
revised by the SCNPC on April 23, 2019 and became effective on November 1, 2019, and the Regulations
for the Implementation of the Trademark Law of the People’s Republic of China (《中華人民共和國商標法實施條例》), which was amended on April 29, 2014 and became effective on May 1, 2014, provide for
the application, review and approval, renewal, alteration, transfer, use, and invalidity cases of trademark
registration, and protect the trademark registrant’s to exclusive use of trademark. According to the above
laws and regulations, the validity period of a registered trademark is ten years, starting on the day when
the registration is approved. If the validity period of a registered trademark has expired and further use
is required, the renewal procedures must be completed in accordance with the regulations within 12
REGULATORY OVERVIEW
– 125 –

months before the expiration date. The validity period of each renewal of registration is 10 years. The State
Administration for Industry and Commerce has the power to investigate and handle any act of
infringement of the exclusive right to use a registered trademark according to law; if the case is so serious
as to constitute a crime, it shall be transferred to the judicial authority for handling.
Patent
According to the Patent Law of the People’s Republic of China (《中華人民共和國專利法》), which
was revised by the SCNPC on October 17, 2020 and became effective on June 1, 2021, and the
Implementation Regulations of the Patent Law of the People’s Republic of China (《中華人民共和國專利法實施細則》), which was amended by the State Council on January 9, 2010 and became effective on
February 1, 2010, the patent administration department under the State Council is responsible for the
patent work throughout the country. It receives and examines patent applications and grants patent rights
for inventions-creations in accordance with law. The patent administration departments of the people’s
governments of provinces, autonomous regions and municipalities directly under the central government
are responsible for the administration of patents within their respective administrative regions. Patent
protection is divided into three categories, namely, invention patent, utility patent and design patent.
Invention patents refer to any new technical solution relating to a product, a process or an improvement.
Utility patents mean any new technical solution relating to the shape, the structure, or their combination,
of a product, which are fit for practical use. Design patents mean any new design of the shape, pattern,
color, or their combination, of a product, which create an aesthetic feeling and are fit for industrial
application. Invention patents are valid for twenty years from the date of application, while design patents
and utility patents are valid for ten years from the date of application, respectively. Once an invention
patent, utility patent or a design patent is granted, unless otherwise permitted by law, no individual or
entities may exploit the patent without permission of the patent holder.
Copyright
According to the Copyright Law of the People’s Republic of China (《中華人民共和國著作權法》),
which was revised by the SCNPC on November 11, 2020 and became effective on June 1, 2021, for the
innovative and intellectual works that can be presented in certain manners in respect of Chinese citizens,
legal persons or non-legal person organizations, including literature, art and science, regardless of whether
they are published or not, the owners enjoy the copyright in accordance with the Copyright Law. Copyright
holders enjoy various rights, including the publication right, the right of authorship and the right of
reproduction.
According to the Measures for the Registration of Computer Software Copyright (《計算機軟件著作權登記辦法》), which was promulgated by the National Copyright Administration on February 20,
2002, the Computer Software Protection Regulations (《計算機軟件保護條例》), which was amended by
the State Council on January 30, 2013 and became effective on March 1, 2013, the National Copyright
Administration is in charge of software copyright registration and management across the country, and the
China Copyright Protection Center is recognized as the software registration agency. The China Copyright
Protection Center will grant registration certificates to computer software copyright applicants who
conform to the Measures for Registration of Computer Software Copyright and the Regulations on
Computer Software Protection.
REGULATORY OVERVIEW
– 126 –

Domain Names
According to the Measures for the Administration of Internet Domain Names (《互聯網域名管理辦法》) promulgated by the MIIT on August 24, 2017 and came into effect on November 1, 2017, the MIIT
is responsible for the supervision and administration of domain name services nationwide, and the
communications administrations of provinces, autonomous regions and municipalities are responsible for
that within their respective administrative regions. The domain name registration services shall follow the
principle of “first to register”. Upon completion of the domain name registration, the applicant becomes
the holder of the relevant registered domain names.
Environmental Protection
Pursuant to the Law of the PRC on Environment Impact Assessment (《中華人民共和國環境影響評價法》), which was revised by the SCNPC and became effective on December 29, 2018, the Regulations
on the Administration of Construction Project Environmental Protection (《建設項目環境保護管理條例》), which was revised by the State Council on July 16, 2017 and became effective on October 1, 2017,
and the Interim Measures on the Environmental Protection Acceptance Check on Construction Projects
(《建設項目竣工環境保護驗收暫行辦法》), which was promulgated by the former Ministry of
Environmental Protection and became effective on November 20, 2017, for a construction project for
which an environmental impact report or environmental impact statement shall be prepared, the
construction unit shall submit the environmental impact report or environmental impact statement to the
competent administrative department of the environmental protection for approval before starting
construction. For a construction project for which an environmental impact registration form shall be filled
in pursuant to the law, the construction unit shall submit the environmental impact registration form to the
competent administrative department of the environmental protection for record. For a construction
project for which an environmental impact report or environmental impact statement shall be prepared,
before starting to operate, the construction unit shall organize the inspection and acceptance, after passing
the acceptance check, the project can be officially put into production or delivered for use.
Enterprises and other producers and business operators that discharge pollutants shall take measures
to prevent and control the environmental pollution and harm caused by waste gas, waste water, waste
residues, dust, etc. generated during production, construction or other activities. Enterprises and other
producers and operators that discharge pollutants shall each establish an environmental protection
responsibility system, and specify the responsibilities of the persons in charge and relevant personnel
thereof. The facilities for preventing and control of pollution must comply with requirements of approved
environmental impact assessment files and must not be dismantled or left idle without permission.
According to the Catalogue of Classification Management of Discharge Permits for Stationary
Pollution Sources (2019 Edition) (《固定污染源排污許可分類管理名錄(2019年版)》) issued by the
Ministry of Ecological Environment and becoming effective on December 20, 2019 and the Guidance for
the Discharge Registration of Stationary Pollution Sources (trail) (《固定污染源排污登記工作指南(試行)》) issued by the Ministry of Ecological Environment and becoming effective on January 6, 2020, the
state implements key management, simplified management, and registration management of pollutant
discharge permits based on factors such as the amount of pollutants produced by the pollutant discharge
units that discharge pollutants, their emissions, and their impact on the environment. The pollutant
discharge units that implement registration management are not required to obtain the discharge permits
but shall make the discharge registration in accordance with this requirement.
REGULATORY OVERVIEW
– 127 –
TAX
Enterprise Income Tax
Pursuant to the Law of the PRC on Enterprise Income Tax (《中華人民共和國企業所得稅法》) (the
“EIT Law”), which was revised by the SCNPC and became effective on December 29, 2018, and the
Implementation Regulations for the Enterprise Income Tax Law of the PRC (《中華人民共和國企業所得稅法實施條例》),which was amended by the State Council and became effective on April 23, 2019,
taxpayers consist of resident enterprises and non-resident enterprises. Resident enterprises are defined as
enterprises that are established in China in accordance with PRC laws, or that are established in
accordance with the laws of foreign countries but whose actual or de facto control is administered from
within the PRC. Non-resident enterprises are defined as enterprises that are set up in accordance with the
laws of foreign countries and whose actual administration is conducted outside the PRC, but have
established institutions or premises in the PRC, or have no such established institutions or premises but
have income generated from inside the PRC. Under the EIT Law and relevant implementing regulations,
a uniform enterprise income tax rate of 25% is applicable. However, if non-resident enterprises have not
formed permanent establishments or premises in the PRC, or if they have formed permanent establishment
institutions or premises in the PRC but there is no actual relationship between the relevant income derived
in the PRC and the established institutions or premises set up by them, the enterprise income tax is, in that
case, set at the rate of 10% for their income sourced from inside the PRC. High and new technology
enterprises which are supported by the State may enjoy a reduced EIT rate of 15%.
Value-added Tax
Pursuant to the Interim Regulations of PRC on Value-added Tax (《中華人民共和國增值稅暫行條例》), which was promulgated by the State Council and became effective on November 19, 2017, and the
Detailed Rules for the Implementation of the Interim Regulation of the PRC on Value Added Tax (《中華人民共和國增值稅暫行條例實施細則》), which was amended by the Ministry of Finance on October
28, 2011 and came into effect on November 1, 2011, all taxpayers selling goods, providing labor services
of processing, repairing or maintenance, or selling services, intangible assets or real property in China, or
importing goods to China, shall pay value-added tax. A tax rate of 17% shall be levied on general taxpayers
selling goods and services, leasing of tangible movable assets or importing goods whereas the applicable
rate for the export of goods by taxpayers shall be nil, unless otherwise stipulated.
Pursuant to the Notice of the Ministry of Finance and the State Administration of Taxation on
Adjusting Value added Tax Rates (《財政部、稅務總局關於調整增值稅稅率的通知》) which was issued
jointly by the Ministry of Finance and the State Administration of Taxation on April 4, 2018 and became
effective on May 1, 2018, the tax rates of 17% and 11% applicable to the taxpayers who have VAT taxable
sales activities or imported goods are adjusted to 16% and 10%, respectively. Pursuant to the Notice of
the Ministry of Finance, the State Administration of Taxation and the General Administration of Customs
on Relevant Policies for Deepening Value Added Tax Reform (《財政部、稅務總局、海關總署關於深化增值稅改革有關政策的公告》) which was issued jointly by the Ministry of Finance, the State
Administration of Taxation and the General Administration of Customs on March 20, 2019 and became
effective on April 1, 2019, VAT taxable sales or imported goods in respect of general taxpayer of value
added tax, the original applicable tax rates, being 16% and 10%, have been adjusted to 13% and 9%,
respectively.
REGULATORY OVERVIEW
– 128 –
Dividend Withholding Tax
Pursuant to the Arrangement between Mainland China and Hong Kong for the Avoidance of DoubleTaxation and Prevention of Fiscal Evasion with respect to Taxes on Income (《內地和香港特別行政區關於對所得避免雙重徵稅和防止偷漏稅的安排》) which was promulgated by the State Administration ofTaxation on August 21, 2006 and became effective from December 8, 2006, the withholding tax rate 5%applies to dividends paid by a PRC company to a beneficial owner, provided that such beneficial ownerdirectly holds at least 25% of the equity interests in the PRC company. The 10% withholding tax rateapplies to dividends paid by a PRC company to a beneficial owner if such beneficial owner holds less than25% of the equity interests in the PRC company.
Pursuant to The Announcement on Issues Concerning “Beneficial Owners” in Tax Treaties (《國家稅務總局關於稅收協定中“受益所有人”有關問題的公告》) promulgated by the State Administration ofTaxation on February 3, 2018 and taking effect on April 1, 2018, certain conditions should be taken intoaccount when defining a company as a “beneficial owner” under the relevant tax treaty, including but notlimited to whether the applicant is obligated to pay more than 50% of its income to residents of the thirdcountry (region) within 12 months, whether the business activities conducted by the applicant constitutesubstantial business operation, whether the country (region) of the contracting party does not tax orexempt the relevant income, or whether the tax is levied but the actual tax rate is extremely low, andmeanwhile, there will be a comprehensive analysis based on the reality of specific cases.
Pursuant to the Circular of the State Administration of Taxation on Relevant Issues Concerning theImplementation of Dividend Clauses in Tax Treaties (《國家稅務總局關於執行稅收協定股息條款有關問題的通知》), which was promulgated by the State Administration of Taxation on and became effectivefrom February 20, 2009, all of the following requirements should be satisfied where a resident companyneeds to be entitled to preferential tax rates: (1) such a fiscal resident who obtains dividends should bea company as provided in the tax agreement; (2) owner’s equity interests and voting shares of the PRCresident company directly owned by such a fiscal resident reaches a specified percentage; and (3) theequity interests of the PRC resident company directly owned by such a fiscal resident, at any time duringthe 12 consecutive months prior to the acquisition of the dividends, reaches a percentage specified in thetax agreement.
Pursuant to the Measures for Non-residents Taxpayers’ Enjoyment of Treaty Benefits (《非居民納稅人享受協定待遇管理辦法》), which was revised by the State Administration of Taxation on October 14,2019 and became effective on January 1, 2020, non-resident taxpayers may self-assess and conclude thatit satisfies the criteria for claiming treaty benefits, it may enjoy treaty benefits at the time of taxdeclaration or at the time of withholding through the withholding agent, simultaneously gather and retainthe relevant materials pursuant to the provisions of these Measures for future inspection, and acceptfollow-up administration by the tax authorities.
PRC Enterprise Income Tax on Indirect Transfer of Non-Resident Enterprises
Pursuant to the Announcement of the State Administration of Taxation on Certain Issues Concerningthe Enterprise Income Tax on the Indirect Transfer of Properties by Non-resident Enterprises (《關於非居民企業間接轉讓財產企業所得稅若干問題的公告》) (the “Circular 7”) which was issued by the StateAdministration of Taxation on February 3, 2015, where a non-resident enterprise transfers the assets(including equity interests) in an overseas holding company which directly or indirectly owns PRC taxableproperties, including shares in a PRC company, for the purposes of avoiding PRC enterprise income taxesthrough an arrangement without reasonable commercial purpose, such indirect transfer should bereclassified and recognized to be a direct transfer of the assets (including equity interests) of a PRCresident enterprise in accordance with the Enterprise Income Tax Law, unless the overall arrangementsrelating to an indirect transfer of PRC Taxable Assets fulfill one of the conditions as stipulated under theCircular 7.
REGULATORY OVERVIEW
– 129 –

Furthermore, pursuant to the Announcement on Issues Relating to Withholding at Source of Income
Tax of Non-resident Enterprises (《關於非居民企業所得稅源泉扣繳有關問題的公告》) issued by the
State Administration of Taxation on October 17, 2017 and revised on June 15, 2018, the “income from
property transfer” shall include the income from the transfer of equity interests and equity investment
assets. The balance after deducting the net value of equities from the income from equity transfer is the
taxable income from equity transfer. When calculating the income from equity transfer, an enterprise shall
not deduct the amount that may be distributed from the shareholders’ retained proceeds that are
attributable to such equities, such as the undistributed profits of the invested enterprise.
Foreign Exchange
Pursuant to the Regulation of the PRC on Foreign Exchange Administration (《中華人民共和國外匯管理條例》) which was amended and implemented by the State Council on August 5, 2008, foreign
currency payments under current account items by domestic institutions, including payments for imports
and exports of goods and services and payments of income and current transfers into and outside the PRC
must be either paid with their own foreign currency with valid documentation or with foreign currency
purchased from any financial institution engaged in foreign currency sale and settlement. Foreign currency
income accounted for under current account items may be retained or sold to financial institutions engaged
in foreign currency sale and settlement in accordance with the relevant PRC laws and regulations. Foreign
currency payments under capital account items include cross border transfers of capital, direct
investments, securities investments, derivative products and loans. For foreign-invested enterprises wound
up in accordance with the law, funds denominated in RMB that belong to a foreign investor after
liquidation and after payment of tax may be used to purchase foreign currency from any financial
institution engaged in foreign exchange sale and settlement in order to remit the foreign currency outside
of the PRC.
Pursuant to the Circular of the State Administration of Foreign Exchange on Further Simplifying and
Improving the Direct Investment-related Foreign Exchange Administration Policies(《國家外匯管理局關於進一步簡化和改進直接投資外匯管理政策的通知》) which was promulgated by the SAFE on February
13, 2015 and came into force on June 1, 2015, certain administrative approval procedures relating to the
domestic and overseas direct investment in certain districts have been cancelled, and the foreign exchange
registration for domestic direct investment shall be directly reviewed and handled by qualified banks in
instead.
Pursuant to the Circular of the State Administration of Foreign Exchange on Reforming the
Administration Measures on Conversion of Foreign Exchange Registered Capital of Foreign-invested
Enterprises (《國家外匯管理局關於改革外商投資企業外匯資本金結匯管理方式的通知》), which was
promulgated by the SAFE and became effective on March 30, 2015, a foreign-invested enterprise may
settle their foreign exchange capital at its discretion, that is, it, in response to its actual business needs,
settle with a bank the portion of the foreign exchange capital in its capital account for which the relevant
foreign exchange bureau has confirmed monetary contribution rights and interests (or for which the bank
has registered the account crediting of monetary contribution). Foreign-invested enterprises are allowed
to settle such portion at 100% of their foreign exchange capital on a discretionary basis. The SAFE may
adjust the aforesaid proportion according to the international income and expense conditions when due.
REGULATORY OVERVIEW
– 130 –

Pursuant to the Issues Relating to the Foreign Exchange Administration of Offshore
Investment, Financing and Return Investment by Domestic Resident via Special Purpose Vehicles (《國家外匯管理局關於境內居民通過特殊目的公司境外投融資及返程投資外匯管理有關問題的通知》) which
was promulgated and implemented by the SAFE on July 4, 2014, a “special purpose company” shall refer
to an overseas enterprise directly established or indirectly controlled by a domestic resident (including
domestic institutions or domestic resident individuals) for the purpose of investment and financing with
the enterprise assets or interests it holds legally inside the PRC or overseas. Before injecting domestic and
overseas legal assets or interests into their special purpose company, the domestic residents including
domestic institutions and domestic resident individuals shall apply for foreign exchange registration of
overseas investments with the SAFE. Where the domestic resident fails to apply for relevant foreign
exchange registration, the punishment may be imposed by the SAFE under the provisions of the
Regulation of the PRC on Foreign Exchange Administration (《中華人民共和國外匯管理條例》) .
Regulations on Dividend Distribution
Pursuant to the Foreign Investment Law, PRC-sourced dividends payable to foreign investors may
be remitted in or out freely in Renminbi or foreign currencies by law. Furthermore, pursuant to the
Company Law of the People’s Republic of China (《中華人民共和國公司法》) amended and implemented
by the SCNPC on October 26, 2018, when domestic enterprises and foreign-invested enterprises distribute
their after-tax profits in a given year, they shall allocate 10% of such profits to their statutory capital
reserve funds. Where the accumulated amount of the statutory capital reserve fund reaches 50% or more
of their registered capital, no further allocation is required. If losses in any prior fiscal year were not yet
covered, domestic enterprises and foreign-invested enterprises shall not distribute any of their profit, and
the undistributed profits during the past fiscal years can be distributed together with the profits available
for distribution during the current fiscal year.
2. LAW AND REGULATIONS RELATING TO OUR GROUP’S BUSINESS AND OPERATIONSIN THE UNITED STATES
We engage in sales, marketing and customer service activities through Chervon North America, Inc.
a corporation headquartered in Naperville, Illinois but organized under the laws of the State of Delaware,
USA. The following is a summary of certain U.S. federal and state laws and regulations that are material
to our operations. This summary does not purport to be complete or describe applicable U.S. federal, state,
or local laws in their entirety. The summary highlights material laws, rules, and regulations to illustrate
the legal issues that arise in the conduct of our business, but does not explain every single law,
interpretation or application. In many cases, the outcome of a legal matter will be highly fact-specific.
Product Liability and Consumer Protection
As a manufacturer and seller of power tools and outdoor power equipment, we may be liable for
injuries and damages caused by our products under broad and consumer-friendly products liability laws
if the products are proven to be defective. Each of the 50 states in the United States has different laws and
judicial precedents that can vary significantly from one another. While circumstances and jurisdictions can
differ in significant ways, the following provides a broad overview of the product liability law concepts
that are generally followed in the majority of the states within the United States.
REGULATORY OVERVIEW
– 131 –

Product liability lawsuits may be brought against manufacturers by individual plaintiffs who havesustained injury, death, or property damage due to a defective product. In addition, lawsuits may bebrought by groups of plaintiffs who have suffered similarly-situated claims relating to a defective productand who are certified by a court as a proper class of plaintiffs to act together to bring a class action suitin the United States. Manufacturers may also be subject to cross-claims or third-party claims for indemnityor contribution brought by other defendants in a product liability suit who may be upstream or downstreamin the supply chain.
The types of product liability claims brought by plaintiffs generally fall into three broad categories:(1) design defect claims, which are based upon inherent flaws in the intended design or make-up of theproduct, (2) manufacturing defect claims, which are based on product flaws caused during the constructionor production of the particular item that deviate from the intended design, and (3) failure to warn claims,which are based on inadequate product warnings or instructions, and whether inherent dangers could havebeen mitigated or avoided through adequate warnings to the user. Some states have also added anadditional post-sale duty to warn of later discovered latent defects, designed to prevent future injuriesinvolving the same product.
Plaintiffs generally assert product liability claims premised on legal theories of liability based onnegligence, strict liability, or breach of an express or implied warranty. Most jurisdictions permit thesubmission of a case under multiple theories, so it is common to see a plaintiff plead his or her complaintunder all of the aforementioned theories of liability. Regardless of the theory a plaintiff chooses to pursue,the burden is generally on the plaintiff to establish and prove (1) that the product in question wasdefective, (2) an injury and/or damages, and (3) a causal relationship between the defect and the injury.
Negligence is the failure of a manufacturer to do something that a manufacturer exercisingreasonable care under the circumstances would have done in the same or similar circumstances. Generally,a negligence claim requires the plaintiff to demonstrate that the defendant owed a legal duty of care, thedefendant breached that duty, and such breach caused the plaintiff’s injury.
Strict liability is another theory of liability adopted by most states. A lawsuit based on strict liabilitydoes not depend on the fault or lack of care by the manufacturer. Rather, such a lawsuit is based solelyon the presence of a defect that renders the product unreasonably dangerous and that causes injury.
A claim for breach of warranty is generally governed by contract law. The vast majority of stateshave adopted Article 2 of the Uniform Commercial Code (“UCC”), which governs the sale of goods.Under Article 2 of the UCC, there are express warranties and implied warranties. An express warranty canbe created by a representation by the seller, a description of the good which is made part of the basis ofthe bargain, or by showing a sample or model of a product to the buyer where the buyer reasonablyassumed that the whole of the goods would conform to the sample. An implied warranty, on the other hand,covers those expectations common to all products (e.g., that the product is fit for its ordinary purpose) andis presumed to have been made by the seller unless it is clearly and unambiguously disclaimed in writingas part of the sales agreement.
In all jurisdictions, numerous defenses are available to the manufacturer in a product liabilitylawsuit. While the defenses, like the claims themselves, are dependent upon the facts, the commondefenses include: product alteration, where the plaintiff or others have altered or modified the productafter manufacture; product misuse/abuse, where the plaintiff was using the product outside therecommended or normal use; comparative negligence, where the plaintiff through their own actions wasnegligent and contributed to the cause of their injury, and; assumption of risk, where the plaintiff knewthe dangers of using the product in a certain way and knowingly assumed the risk of injury.
REGULATORY OVERVIEW
– 132 –

If a product liability claim is proven, the following types of damages, among others, may be
recoverable by the plaintiff depending on the particular facts and the specific jurisdiction: (1) money
damages for pain and suffering; (2) money damages for lost earnings or medical expenses; (3) long-term
care expenses; (4) loss of financial support; (5) loss of consortium; (6) damage to property; and (7)
punitive damages in the event the plaintiff can demonstrate reckless or intentional behavior on the part of
the manufacturer. Punitive damages awards can be many times higher than the amount of compensatory
damages and they are not awarded to compensate an injured party but rather to punish past and deter future
misconduct. In some jurisdictions, plaintiffs may also be able to recover statutory damages and attorneys’
fees if a state or U.S. federal statute permits such recovery. Usually, such statutes target specific goods or
industries. The sources for these regulations are either state statutes or administrative regulations that
place specific requirements on certain industries. Such requirements often take the form of labeling or
licensing requirements and are usually enforced by public health or state safety agencies or by state
attorneys-general. Civil and/or criminal penalties may be imposed for violations of the safety-driven
consumer product regulations.
In addition to the state laws and regulations, some of our products are also governed by the federal
Consumer Product Safety Act and its regulations, which are enforced by the U.S. Consumer Product Safety
Commission (CPSC). These safety oriented laws and regulations govern consumer products. The laws
require affirmative reporting to the CPSC of consumer product defects that constitute substantive product
hazards. Failure to timely report substantial product hazards can result in significant fines and penalties.
The CPSC also governs recalls of consumer products. Product recalls are normally implemented to remove
or repair defective products in the market to help avoid injuries and limit product liability risk. The broad
public notification issued for consumer product recalls can often provide a defense to product liability
claims where plaintiffs were aware of but failed to participate in a recall.
The U.S. Magnuson-Moss Warranty-Federal Trade Commission Improvements Act
(“Magnuson-Moss”) addresses both written and implied warranties for consumer products. Magnuson-
Moss authorizes the adoption of federal regulations concerning both written and implied warranties,
governs disclosure and designation standards for written warranties, specifies standards for full
warranties, and affords consumers with remedies for breach of warranty obligations and/or obligations
under service contracts for consumer products. Consumer products sold in the United States are not
required to have warranties, but any warranties provided by a manufacturer must comply with
Magnuson-Moss. The statute governs the manner in which warranties must be communicated to
consumers. In general, the terms and conditions of warranties must be conspicuously and fully disclosed,
in simple and readily understood language, and any ambiguities are to be construed against the drafter of
the warranty. The U.S. Federal Trade Commission has authority to enforce the requirements of
Magnuson-Moss and regulations thereunder, and may seek an injunction to stop violations. Consumers
may seek recourse for Magnuson-Moss violations in individual or class actions, and a prevailing consumer
may recover the costs of suit (including attorneys’ fees) in addition to damages.
Please see Risk Factors section of this prospectus, and in particular, the risk factors entitled
“Unsatisfactory performance of or defects in our products may harm our reputation, lead to product returns
or recalls, subject us to significant product liability litigations and have a material adverse effect on our
business, financial conditions, and results of operations” and “Our power tools and OPE products make
use of lithium-ion battery packs, and lithium-ion battery packs may catch fire or vent smoke and flame on
rare occasions,” for a discussion of certain product liability risks associated with our business.
REGULATORY OVERVIEW
– 133 –
Labor and Employment Laws
The employment of individuals in the United States is governed by federal, state and sometimes local
laws. Labor and employment laws can generally be categorized under the headings of (i) equal
employment opportunity, (ii) wage and hour, (iii) medical/disability, (iv) union rights, and (v) workplace
safety. Typically, national laws set the minimum legal standard for employee rights, and state and local
laws, if adopted, enhance those rights. Most employees in the United States are hired “at-will,” meaning
that their employment can be terminated at any time, with or without notice, cause, or government-
mandated severance pay. However, individual employment agreements between an employee and
employer may vary this status, and even an at-will employee may not be terminated for an illegal reason
(such as discrimination), nor may an employee be terminated or otherwise retaliated against for engaging
in protected activity under the law. In addition, employers are required to maintain workplaces that are free
of harassment based on protected characteristics such as sex, race, etc.
Employees who believe they have suffered discrimination, harassment, or other alleged wrongs may
pursue claims against us through state and U.S. federal governmental agencies and the courts. If we are
found to violate applicable labor and employment laws, we may have to compensate affected employees
and may face fines and penalties (monetary and otherwise).
Laws and Regulations concerning International Trade
The summary below addresses key U.S. legal and regulatory issues associated with international
trade. Our cross-border operations include the importation of goods into the United States and the
exportation of goods from the United States. As a result, our business requires compliance with tariffs and
other import controls, antidumping rules and regulations, export controls, U.S. economic and other
sanctions programs, and anti-bribery laws and regulations. See the sections headed “Risk Factors – Risks
Relating to Our Industry and Business – We have operations in a number of different countries and
jurisdictions, including in the PRC, which are subject to legal, regulatory, operational and other risks
inherent in international and cross-border operations.”, “Risk Factors – Risks Relating to Our Industry and
Business – We are subject to import and export regulations.” and “Risk Factors – Risks Relating to Our
Industry and Business – Unfavorable economic and geopolitical conditions in the markets in which we
operate, such as the trade tensions between China and the United States, may adversely affect our sales.”
in this prospectus, for further discussion of certain risks that arise in connection with our international and
cross-border operations.
Importation of Goods into the United States
Importation of goods into the customs territory of the United States is governed principally by the
Tariff Act of 1930, as amended, the Customs Modernization Act of 1983, and the regulations of U.S.
Customs and Border Protection (“CBP”).
Under these laws and regulations, U.S. importers have primary legal responsibility for initially
valuing, classifying, and determining the rate of duty applicable to imported merchandise. The importer
is required to exercise “reasonable care” in entering merchandise into the United States. This includes
when providing to CBP information and documentation necessary for it to assess duties on imported
merchandise, collect accurate import statistics, and determine whether an import complies with applicable
laws.
REGULATORY OVERVIEW
– 134 –

Civil penalties may be assessed against any person who uses false or misleading statements to enter
goods into the United States. In determining the applicable penalty for such a wrongdoing, CBP first
determines the applicable degree of culpability of the offending party. In general, higher penalties are
assigned to more egregious offenses, which are classified according to degree of culpability as due to
negligence, gross negligence, or fraud. CBP considers that a violation is a result of negligence “if it results
from failure to exercise reasonable care and competence: (a) to ensure that statements made and
information provided in connection with the importation of merchandise are complete and accurate; or (b)
to perform any material act required by statute or regulation.” Gross negligence and fraud are found in
more egregious cases where circumstances indicate more than a lack of due care. Gross negligence is
assigned where CBP finds a violation done “with actual knowledge of or wanton disregard for the relevant
facts and with indifference to or disregard for the offender’s obligations under the statute.” Fraud is
assigned where the act was “committed (or omitted) knowingly, i.e. was done voluntarily and intentionally,
as established by clear and convincing evidence.” Where false statements affect the assessment of duties
on imports, the statutory maximum civil monetary penalties vary depending on whether the violation is
due to fraud, negligence, or gross negligence.
In addition to regulating the process of importation into the United States, CBP is charged with
enforcing the import and export-related regulations of approximately 40 other U.S. federal agencies. Each
such agency promulgates regulations governing importation of the products under their jurisdiction. CBP
is charged with ensuring that imports (and exports) comply with those regulations and is authorized, in
many cases, to effect seizures, forfeitures, and rejection of entry of non-conforming goods.
Antidumping Laws and Regulations
U.S. federal antidumping laws and regulations prohibit unfair global competition by prohibiting
non-U.S. entities from selling products in the U.S. for unreasonably low prices. The usual test is whether
the goods are being sold in the U.S. for less than they are sold for in the home market. If a company is
found to be violating antidumping regulations, U.S. customs can impose additional duties on the imported
goods.
Tariffs
The United States imposes a variety of tariffs on imported goods. While the U.S. Constitution grants
Congress the authority to impose tariffs, several statutes have shifted that authority to the President under
certain circumstances. Within the United States, agencies involved in international trade regulation include
the CBP, the U.S. International Trade Commission (“ITC”), and the Office of the U.S. Trade
Representative (“USTR”). CBP is responsible for collecting tariffs on goods imported to the United States
during the customs clearance process. The ITC is a quasi-judicial agency that administers U.S. laws
governing trade remedies and provides analysis, information, and other support concerning tariffs and
other international trade matters for the President, U.S. Congress, and the USTR. The ITC also investigates
alleged violations of U.S. trade law, including unfair trade practices under Section 337 of the Tariff Act
of 1930, illegal foreign financial subsidies, and violations, and Section 201 of the Trade Act of 1974
(imports of goods into the U.S. at an increased quantity that is a substantial cause of serious injury to a
U.S. domestic industry). The USTR is a cabinet-level position within the office of the President of the
United States, and serves as the President’s principal adviser, negotiator, and spokesperson regarding
matters of international trade.
REGULATORY OVERVIEW
– 135 –

The USTR is authorized to take certain action under Section 301 of the Trade Act of 1974 (“Section301”), including without limitation the imposition of tariffs or other restrictions on imports, if it
determines after investigation that a foreign government has engaged in unfair trade practices. In 2018,
following a USTR investigation and report, the United States imposed tariffs on certain imported goods
of Chinese origin. Section 301 tariffs are assessed and collected in addition to any other duties that may
apply (including, without limitation, antidumping duties). Both the United States and China have brought
claims against one another before the World Trade Organization in connection with this trade dispute.
Export Controls
The U.S. prohibits the export of controlled goods, services, and information through two primary sets
of laws. The International Traffic in Arms Regulations (“ITAR”) were created by the Arms Export Control
Act of 1976. ITAR-controlled exports are regulated by the U.S. State Department. A separate set of export
controls is administered by the U.S. Department of Commerce under the Export Administration
Regulations (“EAR”).
Both ITAR and EAR govern “exports” which are broadly defined to be a transfer of (a) something
that is controlled, (b) from a U.S. person, (c) to a non-U.S. person. Controlled transfers include physical
products, services, and technology. U.S. persons are defined as U.S. citizens and lawful permanent
residents along with companies incorporated in one or more U.S. states. Non-U.S. persons are any
individual, company, government, or other entity that does not meet the definition of a U.S. person.
Exports subject to control under ITAR and EAR can be made by the physical transfer of goods, or
by visual, oral, or electronic transmission. Transfers of goods or information that take place within the
borders of the United States can still be subject to export control laws if the transfer is to a non-U.S.
person.
In order to legally export controlled goods, services, or information, the proposed exporter must
register with the State Department or Commerce Department and then obtain a license prior to initiating
the export. Penalties for non-compliance with U.S. export control laws can be both civil and criminal and
include substantial monetary fines.
Economic Sanctions
The U.S. imposes various economic sanctions against targeted countries, groups, and individuals
(collectively, the “U.S. Sanctions Programs”). Each sanctions program is authorized under either the
International Emergency Economic Powers Act (“IEEPA”) or the Trading with the Enemy Act of 1917
(“TWEA”). Most are administered by the U.S. Treasury Department’s Office of Foreign Assets Control
(“OFAC”), while aspects of certain sanctions programs are administered by the U.S. Department of State.
Export-related aspects of restrictions against certain countries are also under the jurisdiction of the EAR
and administered by the Department of Commerce.
The U.S. Sanctions Programs include both comprehensive trade restrictions, i.e. embargos, against
countries or regimes, and selective sanctions measures, depending on foreign policy and national security
objectives sought to be achieved through sanctions. In some cases, sanctions are directed against
designated groups or individuals, including terrorist organizations, narcotics traffickers, weapons
proliferators, and others, and include blocking and asset freeze requirements related to sanctioned parties.
REGULATORY OVERVIEW
– 136 –
The U.S. maintains comprehensive embargoes against certain nations and areas including Cuba, Iran,North Korea, Syria, and the Crimea region of Ukraine. Persons subject to U.S. sanctions are prohibitedfrom most transactions involving these countries, including exports, imports, sales, services, and financialtransactions that pertain to the sanctioned county or persons in the sanctioned country. In addition, the U.S.Sanctions Programs against these countries include blocking provisions that prohibit U.S. persons fromdealing in any property or property interest of certain designated persons or entities in each country.
In general, the comprehensive sanctions programs apply only to “U.S. Persons.” This is defined toinclude “any United States citizen, permanent resident alien, entity organized under the laws of the UnitedStates or any jurisdiction within the United States (including foreign branches), or any person in theUnited States.” However, in recent years, OFAC, the President, and the U.S. Congress have adoptedmeasures to extend the reach of U.S. sanctions beyond just U.S. persons and borders. This has beenaccomplished by targeting foreign sanctions evaders and transactions that seek to evade or avoid, causea violation of, or attempt to violate the sanctions, and conspiracies formed for those purposes. In addition,the Cuban and parts of the Iranian sanctions programs apply to non-U.S. subsidiaries of U.S. persons (i.e.,entities owned or controlled by a United States person and established under the laws of another nationor maintained outside the United States).
In addition to the comprehensive sanctions programs, the U.S. maintains “list-based” sanctionsprograms against targeted regimes, entities and individuals that have been found to have taken actionscontrary to the foreign policy or national security interests of the United States.
In the United States, there are three primary sanctions lists that are maintained by OFAC. The mostextensive is the List of Specially Designated Nationals and Blocked Persons (the “OFAC SDN List”). TheOFAC SDN List comprises persons and entities whose property or interests in property are required to beblocked or “frozen” if in the U.S. or under U.S. jurisdiction. OFAC is authorized to direct persons subjectto U.S. jurisdiction to block or freeze property in which a sanctions target (i.e., an SDN) has an interest,however remote. Consequently, U.S. Persons are prohibited from virtually all transactions with SDNs ortheir property (absent OFAC authorization).
Penalties for violations of the U.S. Sanctions Programs are prescribed under IEEPA. They includecivil penalties and criminal penalties up to US$1 million per violation and imprisonment of up to 20 years.
The Foreign Corrupt Practices Act and Other Anti-Bribery Laws
The U.S. federal Foreign Corrupt Practices Act (“FCPA”) includes two key elements:
• Anti-bribery provisions. A person may not give or offer money, gifts, or anything of value toa foreign government official to obtain or retain business.
• Accounting requirements. Companies must maintain accurate books and records and adequateinternal accounting controls to avoid disguising corrupt payments. The U.S. Department ofJustice and Securities and Exchange Commission enforce the FCPA. This Note focuses on theFCPA’s anti-bribery provisions.
The FCPA applies to two broad categories of persons: those with formal ties to the US and those whotake action in furtherance of a violation while in the U.S. Recently, foreign companies in both categorieshave been the focus of an increasing number of enforcement actions.
In addition to the FCPA, U.S. state criminal laws generally prohibit bribery of government officialsand private commercial actors.
REGULATORY OVERVIEW
– 137 –

Tax Law
Federal Government
The U.S. federal government can levy a variety of taxes on U.S. businesses, non-U.S. businessesengaging in certain activities in the United States, and business owners and their employees. Our businessactivities in the U.S. require us to pay U.S. federal income tax, taxes on the sale of certain assets, incometax on dividends, distributions, and interest, sales and other transfer taxes, employee payroll taxes,withholding obligations, and other taxes.
Federal and state tax laws are subject to change. For example, U.S. President’s administration hasproposed several changes to federal taxation of corporations, including multinational corporations, andparts of the proposal are working their way through the legislative process. Changes to federal and statetaxation adopted into law after the date of this prospectus could be material to our business.
State and Local Governments
In addition to the federal government, the 50 U.S. states and their political subdivisions play animportant role in taxing and regulating business activity within their respective jurisdictions. For example,our business activities within a U.S. state may be subject to the state’s business and personal income tax,payroll tax, sales tax, real and personal property tax, franchise tax, withholding obligations, and othertaxes. In addition, some local governments, such as counties and cities, may impose their own similartaxes.
Registration and Regulation
There is no such thing as a “U.S. corporation.” Instead, corporations in the United States areregistered and organized in one of the 50 states. In addition to its legal formation in a particular state, acorporation that does business in more than one state may need to qualify or register to do business in otherstates if the corporation’s activities establish “minimum contacts” for tax purposes in those states.
Individual state laws apply to business transactions occurring in each state, unless such laws conflictwith, or are superseded by, U.S. federal law, which takes precedence over state and local law. For thisreason, U.S. businesses frequently must comply with separate federal, state and local regulations.
Transfer Pricing Rules
The U.S. federal government requires related parties to transact with each other using arm’s lengthpricing. In effect, this prohibits multinationals from avoiding income tax on U.S.-generated profits byovercharging their U.S. subsidiaries for foreign-made products. In the event that this occurs, U.S. federaltax authorities will “readjust” the prices charged by the non-U.S. entity to its wholly owned U.S.subsidiary.
Intellectual Property Law
The United States has both federal and state laws that govern intellectual property rights (“IPRs”).Some IPRs are governed exclusively by federal law, while others are governed by both federal and statelaws. See the section headed “Risk Factors” in this prospectus for a discussion of the importance ofintellectual property protection to our business and certain risks related to our intellectual property.
REGULATORY OVERVIEW
– 138 –

Intellectual Property Rights Governed by Federal Law
The IPRs that are the exclusive domain of federal law are copyrights and patents.
Copyrights. A copyright is a set of exclusive rights owned by the creator of an original work that is
fixed in tangible form. A copyright (i) covers expressions, not ideas; (ii) cannot be purely functional; and
(iii) must be an original work. U.S. copyright law is governed by the Copyright Act of 1976, codified at
17 U.S.C. 101 et seq.
Patents. A patent is a government grant providing the patent owner with the right to exclude others
from manufacturing, using, or selling a claimed invention within the United States or practicing a claimed
method within the United States. A patent is obtained by filing an application with the U.S. Patent and
Trademark Office (“USPTO”) claiming a useful, novel invention. The application must comply with
various requirements set forth in the Patent Act (codified at 35 U.S.C. § 1 et seq) and regulations
established by the USPTO, which is an agency within the U.S. Department of Commerce.
A patent owner can bring an infringement action in a U.S. federal court or, where the importation
of infringing goods is involved, before the ITC. A patent owner may be entitled to remedies against an
infringing party including preliminary and permanent injunctions, direct damages (including lost profits
or royalties), and, in exceptional cases, treble damages and attorneys’ fees.
Intellectual Property Rights Governed by both Federal and State Law
Trademarks and service marks. A “mark” is the use of one or more words, symbols, or logos to
identify and distinguish the mark owner’s goods and/or services. A trademark is a mark used for goods;
a service mark is a mark used in connection with providing services. U.S. trademarks and service marks
generally must (i) be different from prior marks, (ii) not be generic, and (iii) not be descriptive. U.S.
federal trademark law is governed by the Lanham Act, codified at 15 U.S.C. § 1051 et seq. The USPTO
is responsible for examining trademark and service mark applications and either granting or rejecting
applications to register marks. Once granted, a trademark or service mark provides its owner with
nationwide exclusivity within one or more particular fields of use.
State law is an alternative basis for trademark and service mark rights, either under specific state
laws or under common law. States generally provide common law rights in trademarks and service marks
upon their first use in commerce, without requiring registration. Some states have registries for trademarks
and service marks. The rights inherent in such marks are limited to the state where they are used.
The owner of a trademark generally has a cause of action for infringement against a defendant who
uses a mark that is likely to cause confusion in the relevant marketplace about the source of goods or
services, or likely to cause consumers to falsely infer some association or affiliation between the
trademark owner and the defendant. A plaintiff may be entitled to preliminary and permanent injunctions
(including destruction of infringing articles), actual monetary damages, accounting of the defendant’s
profits, and in some cases, attorneys’ fees.
Trade secrets. A trade secret is information that (i) has independent economic value from being
generally unknown by the public and (ii) is the subject of reasonable efforts under the circumstances to
maintain its secrecy. Trade secrets are governed by both federal and state law. The Defend Trade Secrets
Act, codified at 18 U.S.C. § 1836, et seq. (“DTSA”), is the federal trade secret law. Enacted recently in
REGULATORY OVERVIEW
– 139 –

2016, the DTSA applies only to trade secrets used in interstate or foreign commerce. The DTSA provides
specific remedies for trade secret misappropriation, including ex parte seizure in specific and generally
rare instances. The DTSA is similar to the Uniform Trade Secret Act (“UTSA”), a model set of laws
enacted by almost all fifty states within the U.S. A trade secret owner may often have a choice in enforcing
its trade secret rights under the DTSA or a relevant state’s version of the UTSA.
Distribution Relationships
As a producer of consumer goods, we have numerous contractual relationships with distributors,
dealers and resellers who sell our products to the public. U.S. antitrust laws and regulations may be
implicated in the event that we seek to terminate a contract or other relationship with a dealer, distributor,
or other reseller of our goods. In addition, state dealer protection statutes and state franchise laws may
apply to commercial relationships with dealers and resellers of our products.
Generally, a manufacturer or supplier may have liability under U.S. federal antitrust laws, primarily
the Sherman Antitrust Act of 1890, as amended (“Sherman Act”) and the Federal Trade Commission Act
of 1914, as amended (“FTC Act”) and regulations thereunder. The Sherman Act prohibits agreements that
unreasonably restrain trade, as well as monopolization, attempted monopolization, and conspiracies to
monopolize. Although a monopoly is not inherently illegal under U.S. federal antitrust laws and
regulations, use of a monopoly to prevent competitors from entering or effectively participating in the
market may violate antitrust laws. The FTC Act gives the U.S. Federal Trade Commission authority to
bring claims against unfair competition.
Successful antitrust claims may carry significant penalties (in addition to litigation and defense
costs), including without limitation treble damages and/or an injunction prohibiting the defendant from
conducting business in a particular manner. Criminal sanctions may include monetary penalties, and
individuals convicted of antitrust violations may be sentenced to serve up to ten years in prison in addition
to a monetary penalty.
State dealer protection laws and franchise laws are intended to provide dealers and franchisees with
certain remedies to address real or perceived imbalances in bargaining power between dealers and
franchisees and their suppliers. Dealer and franchise protection laws vary significantly among states
within the U.S.; although may states have dealer protection laws, not all dealer protection laws may be
applicable to resellers of our products. To the extent that state dealer protection and/or franchise laws
apply to our relationships with dealers, distributors, or other resellers of our products, the rights and
remedies afforded to dealers, distributors, and other resellers vary significantly. These rights may address
procedural matters, such as a right to receive written notice within a specified period before termination
of a dealership or distributorship arrangement. Others provide substantive remedies, which may be
substantial. These remedies may include a requirement that a manufacturer or supplier must have good
cause to terminate, decline to renew, or substantially change its relationship with a distributor, dealer or
reseller, as well as a right to require the manufacturer or supplier to repurchase inventory upon
termination. These dealer protection and franchise laws are enacted and enforced at the state government
level, and often provide dealers and distributors with a cause of action against their suppliers.
In addition to governmental enforcement through the Federal Trade Commission, distributor and
dealer terminations (including actual termination, as well as non-renewal and/or constructive termination,
such as making terms more onerous such that the dealer or distributor relationship is effectively terminated
though not technically terminated under the terms of a contract) are a common source of private antitrust
REGULATORY OVERVIEW
– 140 –

claims. In these actions, a plaintiff may allege that the termination resulted from an illegal conspiracy
among a supplier and other distributors (competitors of the plaintiff) to shield themselves from price
competition from the terminated distributor.
U.S.-Based Data Privacy Regulations
We are subject to federal and individual U.S state laws and regulations that dictate whether, how, and
under what circumstances we can collect, transfer, process, and/or retain certain data that is critical to our
operations, as well as when we must notify individuals and governmental authorities if there is a breach
of this data. Several federal laws are in place that regulate various types of data, including the Health
Insurance Portability and Accountability Act of 1996, which governs the collection and use of certain
health information (for example, with respect to our U.S. employees). There are also numerous state laws
that are not uniformly adopted by other states, and new laws are being added more frequently than ever
before. For example, California, Nevada and Virginia all have differing requirements when collecting
personal information about consumers residing in these states, including website disclosures that must be
made by the collector.
There have been a number of recent legislative proposals in the United States, at both the federal and
state level, that could impose new obligations in areas related to consumer privacy. Various U.S.
government agencies, including the Federal Trade Commission, have advocated for greater regulation of
data privacy with respect to consumer information, including information collected over the internet, but
uniform legislation has not yet been proposed.
Currently, the most comprehensive state data protection law in the United States is the California
Consumer Privacy Act (“CCPA”), which generally regulates the collection, use, and disclosure of personal
information of consumers in California (the most populous U.S. state). The California Attorney General
enforces the CCPA and may seek civil penalties of up to US$7,500 per intentional violation. The law also
allows consumers, under certain circumstances, to bring suits in the event of a data breach. Businesses
within the scope of the CCPA are subject to several requirements regarding disclosures, mandatory
consumer rights, and contractual provision with vendors. This law will be replaced by the California
Privacy Rights Act, which adds additional requirements effective January 1, 2023. Several other states are
planning to implement similar legislation in the near future.
Certain risks relating to consumer and other data protection are discussed in the Risk Factors section
of this prospectus, under the heading “Our business and platforms generate and process a large amount of
consumer and other data, and the improper use or disclosure of such data could subject us to fines and legal
liability and harm our reputation.”
Environmental Laws and Regulations
Our activities in the U.S. are subject to U.S. federal, state, and municipal laws governing the release
of pollutants into the water, air, and soil. These laws affect how we receive, handle, store, market, label,
and sell our products, and how our consumers use and dispose of our products. The U.S. Environmental
Protection Agency (“EPA”) is primarily responsible for promulgating and enforcing environmental
regulations. U.S. states are generally free to adopt laws that are more stringent than U.S. federal law. Most
U.S. states have adopted and enforce environmental laws and regulations applicable to businesses
conducting activity in their states. Environmental laws in the U.S. are strictly enforced by federal, state,
and local law enforcement agencies.
REGULATORY OVERVIEW
– 141 –

The U.S. Resource Conservation and Recovery Act (“RCRA”) gives the EPA and delegated state
agencies broad authority to regulate the generation, treatment, storage, transportation, and disposal of
hazardous waste. To the extent our products include hazardous material, we are subject to regulations that
provide how we must manage waste, label containers, and where the waste can be sent, among others. We
may be required to send waste to a permitted hazardous waste disposal facility or a recycler. Our
consumers may be required to dispose of our products in accordance with local environmental laws and
regulations.
For further discussion, please see the section headed “Risk Factors – Risks Relating to Our Industry
and Business – Risks Relating to Our Industry and Business – We are subject to national and local
environmental and health and safety directives, laws, and regulations.” in this prospectus.
3. LAW AND REGULATIONS RELATING TO OUR GROUP’S BUSINESS AND OPERATIONSIN GERMANY
German Employment and Labor Law
German Protection Against Unfair Dismissal Act (KSchG)
An employer’s ability to (unilaterally) terminate an employment relationship is substantially
restricted by the KSchG. The KSchG is applicable if the operation has more than 10 employees and the
employee to be dismissed has been employed for more than 6 months. Under the KSchG, an ordinary
dismissal (i.e. with notice) will only be effective if based on one of the three reasons for termination
explicitly permitted by the KSchG. These are conduct-related dismissal, dismissal for reasons connected
with the individual employee and dismissal for operational reasons.
Federal Vacation Act (BUrlG)
The BUrlG sets forth the rules regarding the minimum vacation entitlement of employees, the
granting of vacation as well as the expiry of the vacation entitlement.
German Part-Time and Limited Term Employment Act (TzBfG)
The TzBfG sets forth rules to promote part-time work, to define the requirements for the
permissibility of employment agreements for limited terms and to prevent discrimination against part-time
and limited term employees.
German Works Constitution Act (BetrVG)
The BetrVG stipulates employee codetermination within an establishment. The most important
codetermining body under the BetrVG is the works council, an elected employee representative body
which has rights of its own vis-a-vis the employer. It exercises most of the codetermination rights
governed by the BetrVG.
REGULATORY OVERVIEW
– 142 –
German Collective Bargaining Agreements Act (TVG)
The TVG regulates the right to and content of collective bargaining agreements. Collective
bargaining agreement, inter alia, set forth a minimum standard for working conditions, such as
remuneration, working hours and holiday entitlement.
German Environmental Law
Environmentally sound design of energy-related products (EVPG, EnVKG)
Ecodesign
The Framework Directive 2009/125/EC (also known as the Ecodesign Directive) provides the
European legal framework for setting requirements for the ecodesign of energy-related products. It is
transposed into German law by the Energy-related Products Act (EVPG). Corresponding requirements for
the individual product groups (primarily mass-produced products) are laid down in the form of EC or EU
regulations. Manufacturers or importers in the European Economic Area are responsible for compliance
with these requirements. Ten new European Union (EU) regulations for the first time lay down
requirements for repairability for certain product groups in addition to energy efficiency requirements.
This is intended to ensure that appliances consume less electricity and can be used for longer. From the
time the last unit is placed on the market, manufacturers must make spare parts available for seven to ten
years (depending on the product group). Delivery must take place within a maximum of 15 working days
after receipt of the order. All these parts must be replaceable with commonly available tools. These are
different product categories, such as electric motors and external power supplies.
Energy Consumption Labelling
The Energy Consumption Labelling Act (EnVKG) transposes the Framework Directive 2010/30/EU
on the indication of the consumption of energy and other resources (also called the Labelling Directive)
into German law. The Labelling Directive aims to establish requirements for labelling on the consumption
of energy and other resources for individual product groups such as energy-related products.
Corresponding requirements for individual product groups (mainly mass-produced products) are laid down
in the form of EC or EU regulations. Consumers are to be informed in a prescribed manner about the
energy consumption of the products concerned here before making their purchase decision.
Waste Legislation
Waste law is shaped by a large number of European legal acts. One of the central directives in the
area of waste management is the Waste Framework Directive (Directive 2008/98/EC amended by Directive
2018/851/EU)). It defines essential waste-related terms and establishes, among other things, a five-level
waste hierarchy.
Main sources of law in this field are the Life Cycle Waste Management Act (KrWG) and the Landfill
Site Regulation (DepV). The Federal KeWG is supplemented and substantiated by the waste laws of the
federal states (Bundesländer), which essentially regulate questions of enforcement and the authorities
responsible in the waste sector.
REGULATORY OVERVIEW
– 143 –

According to Section 1 of the KrWG, the purpose of the Act is to promote the circular economy in
order to conserve natural resources and to ensure the environmentally sound management of waste. Under
the KrWG, a company must, inter alia, ensure that waste is disposed of according to the rules set forth for
the respective properties, e.g. the hazardousness, of such waste and must document such disposal. Waste
classified as dangerous may only be handed over to certified waste disposal contractors. The rules for the
close-down and the follow up care for landfills are inter alia set forth in the DepV.
Regulations for specific product waste can also be found inter alia in the Packaging Act (VerpackG),
the Battery Act (BatterieG), the Electrical and Electronic Equipment Act (ElektroG), the Electrical and
Electrical Equipment Substances Ordinance (Elektrostoff-VO).
The ElektroG sets out requirements for product stewardship in accordance with § 23 of the KrWG
for electrical and electronic equipment. The ElektroG regulates the placing on the market, the
take-back/recycling and the environmentally sound disposal of electrical and electronic equipment.
Among other things, it also regulates which appliances must be registered and labelled (for example, with
the ubiquitous symbol of the “crossed-out dustbin”). The current ElektroG is based on the amendment of
the original WEEE Directive 2002/96/EC, i.e. on the newer WEEE Directive 2012/19/EU, also called
WEEE2. According to the ElektroG, every obligated manufacturer, distributor, importer and direct shipper
must register in Germany with the competent authority (Stiftung ear) before the corresponding products
may be placed on the market. Pursuant to the ElektroG, distributors must specially label the appliances
they place on the market. A WEEE labelling includes, among other things, the application of the appliance
manufacturer’s name or the corresponding brand name under which the appliance is registered with the ear
foundation on the respective appliance. Products aimed at end consumers must also be labelled with the
symbol of the crossed-out dustbin.
Some electrical and electronic equipment contains substances that are hazardous to health and the
environment. For this reason, Directive 2011/65/EU (RoHS-II) was issued in 2011.The ElektroStoffV
transposed the EU Directive into German law. Electrical and electronic equipment within the meaning of
the ElektroStoffV may only be placed on the market if it does not contain more than 0.1 percent by weight
of the following substances per homogeneous material: Lead, mercury, hexavalent chromium,
polybrominated biphenyls (PBB), polybrominated diphenyl ethers (PBDE), etc. For cadmium, a maximum
permissible concentration of 0.01 percent by weight per homogeneous material applies. According to the
ElektroStoffV, it is the duty of the manufacturer to ensure that the requirements of the ElektroStoffV are
met when placing electrical and electronic equipment on the market. The manufacturer must ensure that
the technical documentation is available, must carry out the conformity assessment procedure, and must
issue the EU declaration of conformity and ensure that the electrical or electronic equipment bears the CE
marking. By issuing the EU declaration of conformity, the manufacturer confirms that the substance
restrictions are complied with and that the conformity assessment procedure has been carried out.
Manufacturers may only place equipment on the market that also bears a CE marking. In the case of a
product bearing the CE marking, there is a rebuttable legal presumption that the electrical or electronic
equipment does not contain any prohibited substances above the specifications of the ElektroStoffV, that
it has the required documentation, that the conformity assessment procedure has been carried out and that
it has been provided with an EU declaration of conformity.
The BattG transposes the European Battery Directive 2006/66/EC into German law. It regulates the
placing on the market, the return and the environmentally sound disposal of batteries and accumulators.
The law first came into force in 2009 and was updated in 2021. Further changes are expected from 2022
onwards from the update of the Battery Directive. The Battery Act only applies in Germany. Each country
REGULATORY OVERVIEW
– 144 –

in the EU has its own battery legislation. Affected are non-rechargeable batteries (primary batteries) and
rechargeable batteries (secondary batteries, accumulators), regardless of whether they are installed in
appliances or not – unless an exemption is applicable. Manufacturers, importers and, if applicable, foreign
suppliers must first register with the Battery Register of the EAR Foundation for all battery brands and
battery classes before they are allowed to offer corresponding batteries or accumulators for sale or place
them on the market in Germany for the first time. For all three battery classes, manufacturers as initial
distributors must ensure the take-back and proper disposal of corresponding waste batteries from
distributors and end-users. Batteries and accumulators must be correctly labelled. Manufacturers and
distributors must provide certain mandatory information to end-users. Batteries containing hazardous
substances are subject to special labelling requirements and a ban on circulation above certain thresholds.
Manufacturers have regular obligations to report the batteries and accumulators they place on the market
in Germany.
The German VerpackG transposes the European Packaging Directive 94/62/EC into German law. It
regulates the placing of packaging on the market as well as the return and high-quality recovery of
packaging waste. The VerpackG was amended in 2021 and has been in force since July 3, 2021. All
distributors (manufacturers, dealers, importers) of products and thus also distributors of electrical
appliances (ElektroG/WEEE) are affected by the VerpackG. This is because anyone who sells electrical
appliances or other products also places packaging on the market. Manufacturers and importers of
packaging must register with the Central Packaging Register Foundation (ZSVR) (from July 2022 at the
latest, this will also apply to packaging that is not subject to system participation) before they may place
it on the market in Germany for the first time. Furthermore, they must join a dual system for the
nationwide collection and recovery of packaging subject to system participation. The packaging quantities
placed on the market for the first time in Germany must then be regularly reported both to the Packaging
Register and to the system. Manufacturers and subsequent distributors of B2B packaging must ensure the
take-back and recovery of the corresponding packaging waste. This now also applies to reusable
packaging. In the case of recovery, certain minimum quotas must be observed with regard to the type of
recycling.
Legislation regarding the Protection of the Soil and of the Water
Main sources of law are the Federal Soil Protection Act (BBodSchG) and the Water Resources Act
(WHG). Under these laws, a company is obligated to take the necessary precautionary measures to ensure
that the soil and the water is not contaminated by it and to remediate contamination should it occur. These
acts and the regulations promulgated thereunder stipulate that installations must be operated and that
substances must be handled in a way that ensures this goal. If water is withdrawn from a body of water
for the operations of a company, inter alia, the provisions of the WHG apply. If a company discharges rain
water into a body of water, the discharge is regulated inter alia by the Waste Water Regulation (AbwV).
The discharge of waste water from the production process into the municipal sewage water system is, inter
alia, regulated by municipal waste water regulations.
Emission Control
The Federal Emission Control Act (BImSchG) and the regulations promulgated thereunder are major
sources of law in this field. Their goal is the protection of the environment from detrimental effects caused
by pollution of the air, noise, vibrations and similar occurrences.
REGULATORY OVERVIEW
– 145 –
The Equipment and Machinery Noise Abatement Ordinance (32.BImSchV, thirty-second ordinance
promulgated under the BImSchG) transposed the European Directive 2000/14/EC of the European
Parliament and of the Council of May 8, 2000 on the approximation of the laws of the Member States
relating to the noise emission in the environment by equipment for use outdoors into German law. It
applies to 57 different types of equipment and machinery, including landscape and garden equipment such
as chainsaws, leaf blowers and lawn mowers. All of these products must be labelled when placed on the
market, with manufacturers indicating the sound power level that is guaranteed not to be exceeded. Certain
types of equipment and machinery must additionally comply with noise limits that are precisely regulated
in the European Directive.
Equipment and machines according to column 2 of the Annex to the 32.BImSchV are only subject
to compulsory labelling (e.g. portable motorised chain saw, hedge trimmer, leaf blower). This corresponds
to Article 13 of Directive 2000/14/EC. For equipment and machinery according to column 1 (e.g. lawn
mowers, motor hoes < 3 kW), additional noise emission limits apply according to Article 12 of Directive
2000/14/EC.
Chemicals
The use of chemicals is mainly regulated by the Chemicals Act (ChemG) and the by the Regulation
on the Protection from Dangerous Substances (GefStoffV), as well as the Act regarding the Transportation
of Dangerous Goods (GGBefG). Pursuant to the ChemG and the GefStoffV, each chemical must be
classified and labeled. The handling of the chemical and the applied protection and safety measures with
regard to the chemical must be suitable with respect to the respective classification of the chemical. Under
the GGBefG and the regulation GGVSEB promulgated under it, a company must, inter alia, make sure that
dangerous goods that it ships are adequately packed and labeled and that the carrier is notified of the
dangerous goods.
On EU-level, companies are required to comply inter alia with the REACH Regulation ((EC No.
1907/2006) (“REACH”) and the Classification, Labelling and Packaging (CLP) Regulation ((EC) No.
1272/2008) (“CLP”). REACH requires companies to identify and manage the risks linked to the
substances they manufacture and market in the EU. They have to demonstrate how the substance can be
safely used, and they must communicate the risk management measures to the users. Regulation (EU)
2020/878 of June 18, 2020 amends Annex II to the REACH Regulation with effect from January 1, 2021.
This Annex II contains the requirements for the preparation of safety data sheets for chemical substances
and mixtures. CLP is based on the United Nations’ Globally Harmonised System (GHS) and its purpose
is to ensure a high level of protection of health and the environment, as well as the free movement of
substances, mixtures and articles. It requires manufacturers, importers or downstream users of substances
or mixtures to classify, label and package their hazardous chemicals appropriately before placing them on
the market. On April 20, 2021, the European Commission amended Part 1 of Annex VI to Regulation (EC)
No 1272/2008 on Classification, Labelling and Packaging of Substances and Mixtures (CLP Regulation)
for Adaptation to Technical and Scientific Progress (ATP) by Delegated Regulation (EU) 2021/643. This
is the 16th adaptation. Both regulations are legally binding across the EU Member States and directly
applicable to all industrial sectors.
REGULATORY OVERVIEW
– 146 –
German Occupational Health and Safety Law
Principal rules regarding occupational health and safety are set forth in the Occupational Health and
Safety Act (ArbSchG) and in the accident prevention regulations which are promulgated thereunder. The
ArbSchG and the accident prevention regulations inter alia set forth that the potential hazards of a job must
be evaluated, that preventive occupational medical care is offered to the employees where required and
that employees wear personal protective equipment where required.
German Law Regarding Exports
Pursuant to the Foreign Trade Act (AWG), the Foreign Trade Regulation (AWV) promulgated under
it and Council Regulation (EC) No 428/2009 as amended by Commission Delegated Regulation (EU) No
2020/1749 of October 7, 2020, the export of certain products, in particular certain military and dual use
products, to countries that are not members of the EU and also to EU member states (such intra-EU export
is referred to as mere transfer (Verbringung)) is subject to a permission. On June 11, 2021, the revised
version of the EC Dual-Use Regulation 428/2009 was published in the Official Journal of the European
Union under the official title “Regulation (EU) 2021/821 of the European Parliament and of the Council
of May 20, 2021 setting up a Union regime for the control of exports, brokering, technical assistance,
transit and transfer of dual-use items (revised version)”. Regulation (EU) 2021/821 will enter into force
on September 9, 2021.
Principles of German Product Liability and Product Safety Law
The Product Liability Law (ProdHaftG) sets forth the liability of the manufacturer of a product fordamages caused by a defect of the product. Pursuant to the ProdHaftG also the manufacturer of anupstream product is considered as a manufacturer within the meaning of the law, the same applies to thedistributor who affixes his logo or his own trademark to the manufacturer’s product or to the importer ofthe product.
The Product Security Act (ProdSG) stipulates that a product may only be introduced onto the marketif it does not jeopardize the safety and the health of persons if used in a regular and foreseeable way.Insofar as a product is subject to one or more legal regulations under the ProdSG, it may only be madeavailable on the market if it additionally meets the requirements provided for therein. Under the ProdSG,the assessment whether a product is secure is based in particular on the characteristics of the product, onthe impact of the product on other products, on the product-related information (presentation, marking,warnings and instructions for use and operation, etc.) as well as on the group of users of the product(consumer or particularly endangered user groups). The ProdSG establishes uniform federal safetystandards for products by prescribing regulations on the safety requirements of consumer products. Themanufacturer’s labelling according to the ProdSG provides, among other things, for the indication of themanufacturer’s data on consumer products. This is to enable traceability as well as identification in caseof e.g. consumer warnings or product recalls. The manufacturer, his authorized representative and theimporter must affix a clear identification mark on the consumer product. The marking, in conjunction withthe manufacturer’s data, must ensure the identification of a product, e.g. in the event of a recall. Theresponsible persons must also ensure that the user is informed about risks associated with the consumerproduct during its period of use (e.g. instructions for use).
REGULATORY OVERVIEW
– 147 –

Tax Law
Customs Law
In principal, Germany’s Constitution grants exclusive authority to legislate customs duties todomestic federal competence. However, as a member of the EU, Germany has transferred this authorityto the European Union to a vast extent.
Therefore, the main legal bases for collecting customs duties in Germany include the followinglegislative acts and their subsequent amendments:
(a) the Union Customs Code (UCC) (Regulation (EU) No 952/2013 of October 9, 2013 layingdown the Union Customs Code);
(b) the Delegated Regulation (DA) (with corrigendum) (Regulation (EU) 2015/2446 of July 28,2015 supplementing the UCC) and (Regulation (EU) 2016/651 of April 5, 2016 correcting theDelegated Regulation);
(c) the Implementing Regulation (IA) (Regulation (EU) 2015/2447 of November 24, 2015 layingdown detailed rules for the implementation of the provisions of the IUCC);
(d) the Transitional provisions (TDA) (Regulation (EU) 2016/341 of December 17, 2015supplementing the UCC as regards transitional provisions for certain provisions of the UnionCustoms Code where the relevant electronic systems are not yet operational and amendingDelegated Regulation (EU) 2015/2446);
(e) the Customs Duty Exemption Regulation (Customs Duty Exemption Regulation) CouncilRegulation (EC) No 1186/2009 setting up a Community system of reliefs from customs dutythe Common Customs Tariff of the European Communities;
(f) the Customs Administration Act of December 21, 1992 and the Customs Ordinance ofDecember 23, 1993 implementing the Customs Administration Act.
Intellectual Property Law
Trademark Law
Trade mark rights can exist at national, European and international level. A distinction is madebetween word marks (the written name), figurative marks (for example, the graphic representation of alogo) and combined word-image marks. Rather rarely, there are also colour marks, sound marks, olfactorymarks and haptic marks. Accordingly, there are national trade marks, EU trade marks and IR trademarks.
The trademark finds in Germany its legal basis in the Trademark Act (MarkenG) and serves toidentify the goods or services of a company. Pursuant to Section 4 No. 1 Trade Mark Act (MarkenG), trademark protection generally arises only through the filing of an application for registration and the entry ofthe sign in the trade mark register, which is subject to a fee. The German trade mark register is kept atthe German Patent and Trade Mark Office (DPMA). In principle, the application must be filed beforeregistration. Trade mark protection can also be obtained through “reputation” alone, i.e. the use of a signas a trade mark in the course of trade. However, a prerequisite for this is that the sign has acquired areputation as a trade mark within the relevant public.
REGULATORY OVERVIEW
– 148 –
The European Union has enacted the harmonized trademark law in 1992 and the EuropeanIntellectual Property Office (EUIPO) was established in 1994 in Alicante (formerly known as Office forthe Harmonization of the Internal Market, OHIM). There is a uniform European trade mark, the so-called“European Union trade mark”, which is registered with the European Intellectual Property Office(EUIPO). This is valid for all EU member states. The last amendment of the European regulation (EU)2017/1001, i.e. introducing new forms of trademarks, came in force on October 1, 2017.
Under European law all signs capable of distinguishing goods and services originating from onecompany from another company can be protected. Once registered trademarks are protected for a periodof 10 years and can be renewed multiple times for periods of ten years.
Trademarks under the European regime have to be used within the period of the last five yearsotherwise they are open to cancellation actions due to none-use. This cancellation action can be filed byanyone even without claiming any specific right to do so.
Trademarks can be filed and registered with these offices and provide protection in the respectivecountry according to the national rules. The national laws can differ substantially from another.
Trademarks registered with the EUIPO are enforceable in front of the civil courts in every memberstate of the EU. National trademark registrations are enforceable in the national courts of the respectivecountry only.
If a trade mark is also to be protected outside Germany, then there is also international (“worldwide”)trade mark registration, or IR trade mark for short, in addition to the EU trade mark (“EU trade mark”).IR stands for “internationally registered”. However, an international trade mark is not a world trade mark.With the IR trade mark, the trade mark owner receives a kind of “protection right in the association”.
The basis of the international trade mark is the so-called Madrid Agreement concerning theInternational Registration of Marks (MMA), which was concluded as early as 1891 by a number ofcountries, especially European countries. The agreement was supplemented by an additional protocol in1989, the Protocol to the Madrid Agreement, PMMA. This made it possible for many other states to jointhe agreement and to (considerably) expand trade mark protection globally. Germany is a party to both theMMA and the PMMA.
Depending on whether a country is a member of the Agreement (MMA) and/or a member of theProtocol (PMMA), the application procedure for an international trade mark differs. The applicationprocedure is handled centrally by the World Intellectual Property Organization (WIPO) in Geneva. For aninternational trade mark application under the Madrid Agreement or the Protocol to the Madrid Agreement,a so-called basic trade mark is first required in the country of origin of the trade mark applicant.
Patent law
Patents are granted for inventions in all fields of technology which are new, based on an inventivestep and industrially applicable (Section 1 (1) of German Patent Act (PatG)).
With the grant of a patent, the owner of the patent is granted a right effective against everyone toprohibit others from using the invention (exclusive right). Although the patent proprietor is granted theexclusive right of use (positive right of use) under Section 9, sentence 1, PatG, this is limited by theconflict with prohibition rights (e.g. patents) of third parties, which may be older but also younger.
REGULATORY OVERVIEW
– 149 –
The term of a patent is 20 years calculated from the day after the application is filed. However, the
exclusive right is effective only from the date on which the grant of the patent has been published in the
Patent Gazette.
To obtain a patent, a patent application must be filed with the German Patent and Trademark Office
or the European Patent Office.
A European patent is a patent granted by the European Patent Office (EPO) under the European
Patent Convention (EPC).
Unlike the European patent with unitary effect, which has been planned for a long time but has still
not been realised, it is not a patent that is valid for the whole of Europe or for the entire European Union.
Only the application and the procedure for grant are centralised at the European Patent Office (EPO). After
grant, the European patent has the same effect as a national patent in those states which were designated
in the application and for which the respective national phases were initiated.
For this reason, a patent granted by the EPO can also be valid in states (e.g. Switzerland, Turkey)
that are not members of the EU but are members of the EPC.
Tax Law
Company Taxation
The taxation of German companies depends on the entity’s legal form.
Corporations are treated as nontransparent for tax purposes, i.e. that the taxable profit is subject to
taxation at the level of the corporation itself. Profits of corporations are subject to corporation tax,
solidarity surcharge and trade tax.
Partnerships are treated as transparent for tax purposes, i.e. that the taxable profit will be allocated
to the partners and depending on the legal form of the partner is subject to income tax or corporation tax
at the level of the partner. If the partnership has a commercial business, the partnership must pay trade tax.
Corporation Tax Act (KStG)
Corporation tax is the income tax for corporations such as a GmbH. The basis of taxation is the
income earned during the calendar year. What constitutes income and how it is computed is determined
in accordance with the Income Tax Act by way of reference. However, the Corporation Tax Act also sets
out specific provisions that only apply to legal entities. Corporation tax, like income tax, is a direct tax.
It is a tax imposed on the person of the taxpayer, i.e. the legal entity, and is not deductible from income.
The Corporation Tax Act distinguishes between limited and unlimited tax liability. Unlimited
liability applies to legal entities whose registered office or place of management is located in Germany.
Unlimited liability for corporation tax extends to income from all sources worldwide. If a corporation has
neither its registered office nor its place of management in Germany, and only generates income in
Germany, for example through a permanent establishment, it is subject only to a limited tax liability in
Germany. In that case only the domestic income is taxable in Germany. The applicable double taxation
agreements may offer ways to avoid double taxation.
REGULATORY OVERVIEW
– 150 –

Corporation tax is levied at the rate of 15% on the taxable profits. An additional solidarity surcharge
of 5.5% of the tax amount is levied on corporation tax so that the total tax rate (corporate tax and solidarity
surcharge) currently amounts to 15.825%.
Trade Tax Act (GewStG)
All commercial businesses that operate in Germany are liable for trade tax. Businesses are deemed
to operate in Germany if they have a permanent establishment, i.e. a place of business, in the country. The
activities of a corporation such as a GmbH are always deemed commercial business operations.
Trade tax is collected by the relevant local authority who also determines its rate of tax. Therefore,
the rates differ in accordance with the city in which the business is located. Current effective rates range
from around 14% to 18% of business income, whereby smaller towns are on the lower, larger towns on
the higher end.
Value Added Tax Act (UStG)
Principally, VAT is chargeable on all public and private consumption (i.e. goods and service
purchased by final consumers).
The main tax rates under the VAT Act are 19%, the general rate and 7%, the reduced rate. The tax
base is the consideration for the goods or services provided.
If certain requirements are met, goods are exempt from VAT if they are delivered to another EU
Member State (intra-Community deliveries of goods), as are goods delivered to a non-EU country (export
deliveries). Also exempt are certain activities as medical treatments and the granting and brokering of
loans. Land rentals are also exempt from value-added tax, although in some cases one may opt to be
subject to VAT.
VAT legislation has largely been harmonized within the European Union, particularly through the
VAT Directive. In Germany, the main legal bases for imposing VAT are the current versions of the VAT
Act; the VAT Implementing Ordinance; the “Council Implementing Regulation (EU) No 282/2011 of
March 15, 2011 laying down implementing measures for Directive 2006/112/EC on the common system
of value added tax”, which entered into force on July 1, 2011 and replaced Implementation Regulation No
1777/2005 of October 17, 2005; and the Import VAT Exemption Ordinance. The VAT Application
Ordinance, which took effect on November 1, 2010 and replaced the 2008 VAT Guidelines, provides
revenue authorities with instructions on how to interpret VAT law.
Real Property Tax Act (GrStG)
Real property tax is a tax imposed on the ownership of real property. The tax base is the value of
the property under tax valuation laws. The legal basis for the imposition of real property tax is the Real
Property Tax Act, in the version published in the Act to Reform Real Property Tax Law of August 7, 1973,
with subsequent amendments. Real property tax is collected by the local authorities who also determine
its rate of tax.
REGULATORY OVERVIEW
– 151 –
Real Estate Transfer Tax Act (GrEStG)
Real estate transfer tax is a transactions tax. It is imposed on transactions in respect of real property
located in Germany, to the extent that these transactions transfer ownership or near ownership status. The
tax particularly applies to contracts of sale and other legal transactions under which a party acquires a right
to the transfer of title to real property located in Germany. Real Estate transfer tax will not only be
imposed if real estate is directly sold to another party but may also be triggered if shares in a company
owning real estate in Germany will be transferred.
The legal basis is the current version of the Real Estate Transfer Tax Act.
Real estate transfer tax is collected by the Länder, i.e. the German states, who also determine its rate
currently ranging from 3.5% to 6.5% of the purchase price. It is market standard that Real Estate Transfer
Tax is borne by the purchaser although by law the purchaser and the seller are liable for the tax.
REGULATORY OVERVIEW
– 152 –

OVERVIEW
We are a China-based global provider of power tools and OPE. Mr. Pan, Ms. Zhang and Mr. XuNingfeng founded Chervon International Trading, the predecessor of our Group in 1994, while Mr. KeZuqian (“Mr. Ke”) also joined as a new business partner and became our Shareholder in 1996. Mr. XuNingfeng left our Group in 1997 due to a shift in his business focus and later re-joined as a shareholderin March 2021. See “– The Reorganization” “– Pre-IPO Investment” below for details. Mr. Pan, Ms. Zhangand Mr. Ke are currently our executive Directors, all of whom have extensive experience in the powertools and OPE industry. See the section headed “Directors and Senior Management” in this prospectus fordetails.
Our history can be traced back to 1994, when Mr. Pan and his two business partners, Ms. Zhang andMr. Xu Ningfeng, started a foreign trading company with their personal funds, focusing on the export ofpower tools. Leveraging their experience in international trade and with the knowledge and competenceof Mr. Ke, we decided to expand into the manufacturing business in 1997 in order to penetrate into theupstream supply chain and seize wider business opportunities. On February 19, 1999, our Company wasestablished in Hong Kong as the holding company of our Group. We launched our power tools productionline and further expanded into the OPE industry. During the Track Record Period, our products were soldto customers in more than 100 countries and regions, making our Group one of the top players in the globalelectric power tool and global electric OPE markets by revenue.
KEY BUSINESS MILESTONES
The following is a summary of our Group’s key business development milestones:
Year Event
1994 Mr. Pan, Ms. Zhang and Mr. Xu Ningfeng founded a foreign tradingcompany, Chervon International Trading, in Nanjing, focusing on theexport of power tools and related products
1997 We decided to expand into the manufacturing business and establishedNanjing Chervon Industry in the PRC
1999 Our Company was incorporated in Hong Kong
2005 Chervon NA was incorporated in the United States
2006 We opened our new CHERVON Industrial Park as our upgradedproduction base
2007 We launched our first professional brand, DEVON, targeting professionaland industrial customers in China
Chervon Europe Limited was incorporated in the United Kingdom
We formed a joint venture with Bosch in Nanjing known as NanjingBovon with a focus on benchtop products
HISTORY, REORGANIZATION AND CORPORATE STRUCTURE
– 153 –

Year Event
2013 We acquired Flex-Elektrowerkzeuge GmbH, a German power toolcompany, marking our expansion into the European professional market
We launched our first outdoor power equipment brand, EGO, introducingthe world’s first 56V Lithium-ion battery driven outdoor powerequipment
We launched our brand X-TRON, targeting on the needs of hands-oncontractors in the construction and home-improvement industries inChina
2015 We opened our second CHERVON Industrial Park, Green Power, whichis also used for outdoor power equipment business unit
2017 We acquired SKIL business in North America and Europe
2020 Chervon Vietnam was incorporated in Vietnam
CORPORATE DEVELOPMENT OF OUR GROUP
Major shareholding changes of our Company
Our Company was incorporated in Hong Kong with limited liability on February 19, 1999, and is theholding company of our Group. Upon its incorporation, the authorized share capital of our Company wasHK$1,000 divided into 1,000 ordinary shares with a par value of HK$1.00 each. At the time ofincorporation, our Company issued two ordinary shares with a par value of HK$1.00 each to MidlandInvestments Limited and Victoria Investments Limited, each an independent third party, which weresubsequently transferred to PS Holdings Limited, a company wholly owned by Mr. Pan, on the same date.
Over time, our shareholding structure evolved as a result of a number of issuances of ordinary sharesand equity transfers since our incorporation and up to the Latest Practicable Date. The major shareholdingchanges of our Company are set out below.
Initial increase of share capital
On May 21, 1999, the authorized share capital of our Company was increased to HK$7,800,000divided into 7,800,000 ordinary shares of par value HK$1.00 each. On June 22, 1999, our Company issuedand allotted 7,799,998 Shares of par value HK$1.00 each. Upon completion, the shareholding structure ofour Company is as follows:
Name of ShareholderNumber of
Shares Percentage
(%)
PS Holdings Limited(1) 3,822,000 49.00K Holdings Limited(2) 1,404,000 18.00SZ Holdings Limited(3) 1,404,000 18.00Woodlane Holding Limited(4) 780,000 10.00KW Holdings Limited(5) 390,000 5.00Total 7,800,000 100.00
HISTORY, REORGANIZATION AND CORPORATE STRUCTURE
– 154 –
Notes:
(1) PS Holdings Limited was wholly owned by Mr. Pan.(2) K Holdings Limited was wholly owned by Mr. Alain Savoure, an independent third party.(3) SZ Holdings Limited was wholly owned by Ms. Zhang.(4) Woodlane Holding Limited was wholly owned by Mr. Leung Siu Chung and his brother Mr. Leung Siu Yan, each an
independent third party.(5) KW Holdings Limited was wholly owned by Mr. Ke.
Subsequent share transfers and increases in share capital
From July 2003 to April 2008, several share transfers took place among and from our then existing
Shareholders to new Shareholders and our Company increased its share capital on multiple occasions,
which were subscribed by certain of our then existing Shareholders and new Shareholders. By April 10,
2008, the shareholding structure of our Company upon completion of the share transfers and the share
subscriptions were as follows:
Name of ShareholderNumber of
Shares Percentage
(%)
Panmercy(1) 10,689,230 66.53Green Hope(2) 3,926,656 24.44Klamm(3) 1,090,738 6.79Vision Easy Investments Limited(4) 180,688 1.12K Holdings Limited(5) 180,688 1.12Total 16,068,000 100.00
Notes:
(1) Panmercy was wholly owned by Mr. Pan.(2) Green Hope was wholly owned by Ms. Zhang.(3) Klamm was wholly owned by Mr. Ke.(4) Ms. Wu Hongwei is an independent third party who was our then vice president of the European market sales division
from July 2003 to June 2021, and was subsequently re-designated as the vice president of business development of theCompany since June 2021. Ms. Wu Hongwei was awarded 156,000 Shares as part of a share incentive arrangement onDecember 28, 2006, who subsequently transferred her shares to Vision Easy Investments Limited, a company whollyowned by her, on March 11, 2008. In April 2008, Vision Easy Investments Limited further acquired (i) 3,509 sharesfrom an independent former employee at a consideration of HK$160,575; and (ii) 21,179 shares from WoodlaneHolding Limited at the consideration of US$131,812. The consideration for the above transfers were determined basedon arm’s length negotiation with reference to the financial performance and net assets value of the Company at thetime.
(5) K Holdings Limited was wholly owned by Mr. Alain Savoure, an independent third party.
HISTORY, REORGANIZATION AND CORPORATE STRUCTURE
– 155 –

Issue and allotment and transfer of Shares to Chervon Global
To better delineate the different businesses of Mr. Pan, we decided to incorporate Chervon Global
as our Group’s holding company. On October 28, 2009, the authorized share capital of our Company was
increased to HK$468,000,000 divided into 468,000,000 ordinary shares of par value HK$1.00 each. On
October 29, 2009, our Company issued and allotted 373,932,000 Shares of par value HK$1.00 each to
Chervon Global.
In order for our shareholders to hold their Shares through Chervon Global, on December 7, 2009,
Chervon Global acquired 16,068,000 Shares, representing all Shares held by Panmercy, Green Hope,
Klamm, Vision Easy Investments Limited and K Holdings Limited, respectively, at a purchase price of
HK$2.11 per Share. The consideration for the abovementioned transfers was determined with reference to
our financial position at the time. Upon completion of the transfers, our Company became wholly owned
by Chervon Global.
Changes to the structure and composition of the Board
Mr. Lo Wing Yan William ceased to be a director of our Company with effect from May 21, 2019.
Pursuant to our former articles of association, our Directors were subject to re-election once every two
years, and Mr. Lo Wing Yan William decided not to offer himself for re-election at the time given (i) his
ordinary residence in Hong Kong limits his access to our business in the PRC; and (ii) his shift of focus
to other personal commitments.
In preparation of its proposed Listing, our Company adjusted its board structure and composition in
light of relevant Listing Rules requirements for enhanced corporate governance. Mr. Cheng Hong Kei and
Mr. Xiao Jun resigned as directors of our Company with effect from August 4, 2021, and Mr. Cheng Hong
Kei remained in our Group as a director of Chervon (HK) Limited, one of our principal operating
subsidiaries.
To the best of our Director’s knowledge and belief, there was no dispute or disagreement between
(i) Mr. Lo Wing Yan William, Mr. Xiao Jun and Mr. Cheng Hong Kei and (ii) the Company, the Directors
or Shareholders and there is no other matter relating to their resignation that needs to be brought to the
attention of our Shareholders.
Pre-IPO Reorganization
Since December 2020, in preparation for the listing of our Shares, we underwent a corporate
reorganization, which includes, amongst others, (i) the transfer of our entire issued share capital by
Chervon Global as consideration for the repurchase of 21,809 ordinary shares by Chervon Global from its
then shareholders; (ii) the issue and allotment of 5,844,911 Shares by way of rights issue; and (iii) the
issue and allotment of 11,670,500 Shares pursuant to a one-off employee incentive arrangement. See “–
The Reorganization” below for further details.
HISTORY, REORGANIZATION AND CORPORATE STRUCTURE
– 156 –

Our major subsidiaries and operating entities
As at the Latest Practicable Date, due to the geographical locations in which our Group operates, we
conducted our business through 24 subsidiaries(1).
The details of our subsidiaries which made a material contribution to our results of operations during
the Track Record Period are shown below:
Name of subsidiaryDate ofincorporation
Place ofincorporation
Issued/registered
capital
Equitableinterest
attributableto ourGroup Principal activities
Nanjing Chervon Industry September 26,
1997
PRC US$144,073,464 100% Production of tools,
research and
development, salesChervon (China) Tool Sales June 28, 2010 PRC RMB66,506,700 100% Sales of power tools in
the PRCChervon HK November 8,
2010
Hong Kong HK$5,000,000 100% Trading, financial
managementChervon NA February 25,
2005
United States US$300,000 100% Research in the North
American market,
product design, sales
and servicesEGO Europe November 20,
2015
Germany 50,000 Euro 100% Operation of our EGO
brand, sales and
servicesSkil B.V.(2) August 12,
2016
Netherlands 50,000 Euro 100% DIY business design in
Europe, operations and
salesFLEX EL(3) November 27,
1980
Germany 3,580,100 Euro 100% Production of our
FLEX brand, design,
sales and servicesChervon Vietnam January 21,
2020
Vietnam 46,600,000,000
Vietnamese
Dongs
100% Production of
gardening tools
Notes:
(1) Nanjing Bovon was deregistered on September 22, 2021.
(2) Skil B.V. was established by our Group for acquiring the business of SKIL.
(3) Other than FLEX EL, which we acquired in 2013, all of our major subsidiaries as described above were established by ourGroup.
HISTORY, REORGANIZATION AND CORPORATE STRUCTURE
– 157 –

TH
ER
EO
RG
AN
IZA
TIO
N
The
prin
cipa
lst
eps
ofth
eR
eorg
aniz
atio
n,ca
rrie
dou
tin
prep
arat
ion
for
the
list
ing
ofou
rS
hare
san
din
orde
rto
stre
amli
neou
rco
rpor
ate
stru
ctur
e,ar
ese
tou
tbe
low
.
Asi
mpl
ifie
dco
rpor
ate
stru
ctur
epr
ior
toth
eR
eorg
aniz
atio
nis
set
out
belo
w:
Mr.
Ke
Zuq
ian
Mr.
Fra
ncoi
s D
Sic
art(1
)K
lam
m(H
K)
Gre
en H
ope
(HK
)
100%
100%
100%
100%
0.21
%6.
20%
24.4
0%
Ms.
Zha
ng T
ong
100%
Mr.
Pan 10
0%
Ms.
Wu
Hon
gwei
(2)
100%
Pan
mer
cy(H
K) 67
.55%
Che
rvon
Glo
bal
(BV
I) 100%
Our
Com
pany
(HK
)
Nan
jing
Che
rvon
Indu
stry
(PR
C)
90%
5%3%
2%
100%
100%
100%
100%
100%
100%
100%
100%
96%
100%
100%
100%
100%
100%
100%
50%
50%
100%
100%
100%
100%
100%
Che
rvon
Ove
rsea
sH
oldi
ngs
Lim
ited
(HK
)
Che
rvon
(H
K)
Lim
ited
(HK
)
Che
rvon
Gm
bH(G
erm
any)
SK
IL B
.V.
(Net
herl
ands
)
Che
rvon
Aus
tral
iaP
ty L
imit
ed(A
ustr
alia
)
EG
O E
urop
eG
mbH
(Ger
man
y)
Che
rvon
Eur
ope
Ltd
.(U
K)
Che
rvon
Nor
thA
mer
ica
Inc.
(US)
Che
rvon
Can
ada
Inc.
(Can
ada)
Che
rvon
(C
hina
) To
ol S
ales
(PR
C)
Jiuh
ao
Ele
ctro
mec
hani
cal
(PR
C)
Nan
jing
Bov
on(5
)
(PR
C)
Che
rvon
(C
hina
)T
radi
ng C
o., L
td.
(PR
C)
FL
EX
Ver
wal
tung
sG
mbH
& C
o. K
G
(Ger
man
y)
FL
EX
EL
(Ger
man
y)
FL
EX
PO
WE
R T
OO
LS
BV
(Bel
gium
)
FL
EX
Ita
lia
S.r
.l(I
taly
)
FE
MA
(Fra
nce)
FL
EX
Pow
er T
ools
B.V
.(N
ethe
rlan
ds)
FL
EX
Ele
ktro
nářa
dí,
s.r.
o(C
zech
Rep
ubli
c)
FL
EX
Pow
er T
ools
Lim
ited
(UK
)
FL
EX
Ges
chäf
tsfü
hrun
gsG
mbH
(Ger
man
y)
Che
rvon
Vie
tnam
(Vie
tnam
)
Vis
ion
Eas
yIn
vest
men
ts L
imit
ed(B
VI) 1.
19%
Che
rvon
(C
hina
)In
vest
men
t(P
RC
)
Che
rvon
Int
erna
tion
alT
radi
ng(P
RC
)
Abo
ve S
ucce
ssD
evel
opm
ents
Lim
ited
(BV
I) 0.44
%
50%
Mr.
Che
ng H
ong
Kei
(3)
50%
Ms.
Li Y
uen
Yu(4
)
85%
4%
Che
rvon
Aut
oP
reci
sion
Tec
hnol
ogy
(PR
C)
23.1
2%
HISTORY, REORGANIZATION AND CORPORATE STRUCTURE
– 158 –
Notes:
(1) Mr. Sicart is the founding partner of an investment management company and has extensive experience in asset managementand investments and an independent third party. He acquired 80 ordinary shares of Chervon Global from Mr. Alain Savoure,also an independent third party, at a consideration of US$482,792 in April 2015. The consideration was determined based onarm’s length negotiation with reference to the financial performance and net assets value of Chervon Global and itssubsidiaries as a whole at the time. Pursuant to the Reorganization, Mr. Sicart became a direct shareholder of our Companyin March 2021. Please see “– The Reorganization” below for details.
(2) Ms. Wu Hongwei is an independent third party who was our then vice president of the European market sales division fromJuly 2003 to June 2021 and was subsequently re-designated as the vice president of business development of the Companysince June 2021.
(3) Mr. Cheng Hong Kei is a director of Chervon (HK) Limited, Chervon Global Holdings Limited, Chervon Asset ManagementHoldings Limited, Chervon Investment Limited and Chervon Capital Management Limited. Mr. Cheng Hong Kei acquired,through Above Success Developments Limited, 167 ordinary shares of Chervon Global from Panmercy at a consideration ofUS$1,002,487 in February 2017. The consideration was determined based on arm’s length negotiation with reference to thefinancial performance and net assets value of Chervon Global and its subsidiaries as a whole at the time. Pursuant to theReorganization, Mr. Cheng Hong Kei became a direct shareholder of our Company in March 2021. Please see “– TheReorganization” below for details. Mr. Cheng Hong Kei was a former director of our Company from September 2003 toAugust 2021, who resigned from directorship with effect from August 4, 2021.
(4) Ms. Li Yuen Yu is the spouse of Mr. Cheng Hong Kei.(5) Nanjing Bovon was jointly established in January 2007 and held by the Company, Bosch Power Tools Holding AG and Bosch
(China) Investment Ltd. as to 50%, 40% and 10% respectively, which is in proportion to their initial investment ofUS$5,000,000, US$4,000,000 and US$1,000,000 respectively.
Transfer of 10% equity interest in Nanjing Chervon Industry to our Company
On December 20, 2020, Panmercy, Green Hope and Klamm transferred to our Company 5%, 3% and
2% equity interest in Nanjing Chervon Industry for a cash consideration of RMB92,250,000,
RMB55,350,000 and RMB36,900,000, respectively. The consideration for the abovementioned transfers
was determined with reference to an independent valuation of the net assets value of Nanjing Chervon
Industry as of September 30, 2020 and was settled on March 4, 2021. The registration of the transfers was
completed on January 22, 2021, upon which Nanjing Chervon Industry became our wholly-owned
subsidiary.
Issue and allotment of shares by Chervon Global
On January 27, 2021, Chervon Global issued and allotted 1,853 ordinary shares, among which 926
shares were issued and allotted to Panmercy, 556 shares to Green Hope and 371 shares to Klamm at the
subscription price of US$14,458.43 per share.
Repurchase of shares by Chervon Global
To improve the flexibility of our shareholding structure, on February 8, 2021, Chervon Global
transferred 390,000,000 Shares, representing the entire issued share capital of our Company, to its then
shareholders as consideration for repurchasing 21,809 of its ordinary shares. The consideration for the
repurchase of shares of the Company was determined with reference to the financial performance and net
assets of Chervon Global and Company at the time. Upon completion, our Company was held by Panmercy
as to 66.72%, Green Hope as to 24.67%, Klamm as to 6.85%, Vision Easy Investments Limited as to
1.14%, Above Success Developments Limited as to 0.42% and Mr. Francois D Sicart as to 0.20%.
HISTORY, REORGANIZATION AND CORPORATE STRUCTURE
– 159 –

Issue and allotment of Shares by way of rights issue
On March 17, 2021, our Company issued and allotted 5,844,911 Shares by way of rights issue at the
subscription price of HK$1.00 per Share to its then existing Shareholders in proportion to their
shareholding. Panmercy voluntarily gave up its right under the rights issue to subscribe for an additional
3,900,000 Shares, which were in turn subscribed by Nanjing Ruxin, a limited partnership whose sole
general partner and executive partner is Mr. Xu Ningfeng. The surrendering of such right under the rights
issue was to invite Mr. Xu Ninfeng to rejoin as a shareholder of our Company in recognition of his
previous contributions to our Group as one of the co-founders. Upon completion, our Company was held
by Panmercy as to 65.74%, Green Hope as to 24.67%, Klamm as to 6.85%, Vision Easy Investments
Limited as to 1.14%, Above Success Developments Limited as to 0.42%, Mr. Francois D Sicart as to
0.20% and Nanjing Ruxin as to 0.99%.
Establishment of employee shareholding platforms and issue and allotment of Shares pursuant to anemployee incentive arrangement
In recognition of the contributions of our senior management, core employees and other skilled
personnel, our Company established ten PRC employee shareholding platforms on January 25, 2021, and
two offshore employee shareholding platforms on February 18, 2021. On March 25, 2021, our Company
issued and allotted 11,670,500 Shares at the price of HK$4.75 per Share to these employee shareholding
platforms pursuant to a one-off employee incentive arrangement. The consideration paid by the relevant
employees was determined based on our net assets value and financial position at the time. See
“– Corporate Structure” below and the section headed “Appendix IV – Statutory and General Information
– A. Further Information about our Group – 2. Changes in the Share Capital of our Company” in this
prospectus for further details.
Disposal of PRC companies
To achieve clear delineation between our Group and the companies owned by our Controlling
Shareholders, we disposed of our equity interest in the following companies which are not closely
associated with our principal business:
(a) 85% equity interest in Chervon International Trading
Chervon International Trading was established on January 10, 1994 as a limited liability company
and is principally engaged in secondary market investment. On February 24, 2021, Chervon (China)
Investment, our wholly-owned subsidiary, transferred 85% equity interest in Chervon International
Trading to Chervon Management Services, a newly incorporated holding company set up for investment
management business which is indirectly wholly owned by Chervon Global, for a cash consideration of
RMB47,814,000. The consideration was determined with reference to a valuation conducted by an
independent valuer of the net assets value of Chervon International Trading as at September 30, 2020 and
was settled on March 24, 2021. Prior to the disposal, the revenue and net profit of Chervon International
Trading for the year ended 31 December 2020 are RMB297,000 and RMB261,000 respectively. The
registration of the transfer was completed on February 25, 2021, upon which our Group ceased to hold any
interest in Chervon International Trading.
HISTORY, REORGANIZATION AND CORPORATE STRUCTURE
– 160 –
(b) 100% equity interest in Jiuhao Electromechanical
Jiuhao Electromechanical was established on July 12, 2016 as a limited liability company and is
principally engaged in property leasing. On February 25, 2021, Nanjing Chervon Industry transferred the
entire equity interest in Jiuhao Electromechanical to Chervon Management Services for a cash
consideration of RMB171,160,000. The consideration was determined with reference to a valuation
conducted by an independent valuer of the net assets value of Jiuhao Electromechanical as at September
30, 2020 and was settled on March 15, 2021. Prior to the disposal, the revenue and net profit of Jiuhao
Electromechanical for the year ended 31 December 2020 are RMB10,073,000 and RMB1,758,000
respectively. The registration of the transfer was completed on March 8, 2021, upon which our Group
ceased to hold any interest in Jiuhao Electromechanical.
(c) 100% equity interest in Nanjing Suquan
Nanjing Suquan Investment Co., Ltd.* (南京蘇泉投資管理有限公司) (“Nanjing Suquan”) was
established on February 5, 2008 as a limited liability company in the PRC with a registered capital of
RMB58 million. It is an investment holding company and does not have its own business operations.
Nanjing Yaoquan Investment Management Co., Ltd.* (南京耀泉投資管理有限公司) (“Nanjing Yaoquan”)
which was a wholly owned subsidiary of Nanjing Suquan, was established on August 12, 2008 as a limited
liability company in the PRC with a registered capital of RMB10 million and is engaged in private equity
fund management businesses.
Nanjing Suquan was the subsidiary of the Company before December 28, 2018. On December 28,
2018, the Group entered into an agreement with Mr. Xiao Jun, a minority shareholder of Nanjing Suquan.
Pursuant to the agreement, the Group agreed to dispose its 61% equity interest in Nanjing Suquan to Mr.
Xiao Jun at a cash consideration of RMB10,921,300. Upon the completion of the Group’s disposal on
March 12, 2019, the Group’s interest in Nanjing Suquan and Nanjing Yaoquan has been reduced to 24.88%
and the aforementioned entities ceased to be subsidiaries of the Group but became associates of the Group.
On February 24, 2021, the Group entered into an agreement with Chervon Management Services,
which is a related party wholly owned by Mr. Pan. Pursuant to the agreement, the Group agreed to transfer
19.02% equity interest in Nanjing Suquan to Chervon Management Services for a cash consideration of
RMB8,373,300 (USD1,287,000). The consideration was determined with reference to the valuation of
Nanjing Suquan performed by independent valuation firm. The remaining 5.86% equity interest in Nanjing
Suquan, which was held by Chervon International Trading, was also disposed along with the disposal of
Chervon International Trading on the same date.
As confirmed by our Directors, (i) the disposals of Chervon International Trading, Jiuhao
Electromechanical and Nanjing Suquan do not have a material impact on our Group’s operations and upon
completion of the transfers, our Group has not had any subsequent business arrangement with the disposed
companies; and (ii) each of the disposed companies had complied with all applicable PRC laws and
regulations in all material respects during the Track Record Period prior to their respective disposals.
Chervon International Trading, Jiuhao Electromechanical and Nanjing Suquan are not engaged in our
principal business. During the Track Record Period, Chervon International Trading was principally
engaged in the trading of secondary market securities, Jiuhao Electromechanical held a property for
leasing, while Nanjing Suquan is an investment holding company and does not have its own business
HISTORY, REORGANIZATION AND CORPORATE STRUCTURE
– 161 –

operations. As the businesses of the disposed companies do not represent a separate major line of business
or geographical area of operations of our Group, their respective disposals were therefore not treated as
discontinued operation in our Group’s consolidated financial statements in accordance with HKFRS 5.
COMPLIANCE WITH PRC LAWS
Our PRC Legal Adviser confirmed that: (i) all necessary regulatory approvals, permits and licenses
required under PRC laws in relation to the Reorganization have been obtained; and (ii) all share transfers
and changes in registered capital as part of the Reorganization has complied with all applicable PRC laws
in all material respects.
MAJOR ACQUISITIONS, DISPOSALS AND MERGERS
Nanjing Bovon was established as a joint venture in the PRC in January 2007 with an initial
registered capital of US$10,000,000. Upon incorporation, it was held by our Company as to 50%, Bosch
Power Tools Holding AG as to 40% and Bosch (China) Investment Ltd.* (博世(中國)投資有限公司)
(“Bosch China”) as to 10%. In November 2011, Bosch Power Tools Holding AG was acquired by Scintilla
A.G., a member of the Bosch group, which became a shareholder of Nanjing Bovon holding 40% of its
registered capital.
On September 29, 2019, in order to consolidate our interest in companies associated with our
principal business into our Group to better focus on our core business, and to reduce our compliance
burden regarding potential connected transactions upon Listing, Nanjing Chervon Industry entered into an
equity transfer agreement with Scintilla A.G. and Bosch China, each an independent third party, to acquire
40% and 10% of the equity interest in Nanjing Bovon, a power tools supplier, from Scintilla A.G. and
Bosch China for a cash consideration of RMB32,000,000 and RMB8,000,000, respectively. The
registration of the transfer was completed on December 6, 2019, upon which Nanjing Bovon became our
wholly-owned subsidiary. The consideration was arrived at arm’s length negotiation with reference to the
appraised net assets value of Nanjing Bovon as determined by an independent third party valuer in a
valuation report dated September 30, 2019 and was fully settled on December 27, 2019. After the
acquisition, the personnel, equipment and operations of Nanjing Bovon were transferred to Nanjing
Chervon Industry in order to streamline our corporate group structure, and Nanjing Bovon was
deregistered on September 22, 2021 as the Group intended to simplify its corporate group structure. As
advised by our PRC Legal Adviser, Nanjing Bovon had complied with all applicable PRC laws and
regulations in all material respects and was not the subject of any material regulatory actions, regulatory
enquiries or investigations, legal claims or proceedings during the Track Record Period and up to the date
of its deregistration.
As advised by our PRC Legal Adviser, the acquisition has been properly and legally completed and
settled and all necessary regulatory approvals required under PRC laws have been obtained.
During the Track Record Period and up to the Latest Practicable Date, save as disclosed above, we
did not conduct any other acquisitions, disposals or mergers that we consider to be material to us.
HISTORY, REORGANIZATION AND CORPORATE STRUCTURE
– 162 –

PRE-IPO INVESTMENT
On January 29, 2021, Nanjing Ruxin entered into an investment agreement with the Company and
Chervon Global, pursuant to which, subject to our Shareholders’ and our Board’s approval for the issue
and allotment of Shares by way of rights issue before completion of the agreement, Nanjing Ruxin agreed
to subscribe for 3,900,000 Shares at a consideration of HK$3,900,000, which was determined based on the
amount of paid up share capital of our Company as of January 29, 2021. The consideration was fully
settled on March 29, 2021. For details, see “– The Reorganization – Issue and allotment of Shares by way
of rights issue” above.
Upon completion, our Company became directly owned as to 0.96% by Nanjing Ruxin.
Further details of the pre-IPO investment are set out below:
Name of investor Nanjing Ruxin
Date of the investment agreement January 29, 2021
Amount of consideration paid(1) HK$3,900,000
Payment date of consideration March 29, 2021
Cost per Share paid HK$1.00
Discount to the Offer price(2) 97.54%
Use of proceeds The proceeds are intended to be utilized
towards our general working capital. As of
the Latest Practicable Date, none of the
proceeds from the pre-IPO investments had
been utilized.
Strategic benefits The pre-IPO investment contributed part of
the offshore funding required in connection
with the Reorganization.
Shareholding in our Company immediatelyfollowing the completion of the GlobalOffering (assuming the Over-allotmentOption is not exercised)
0.81%
Notes:
(1) The consideration was decided on the basis of HK$1 per share based on the amount of paid up share capital of ourCompany at the time of the investment agreement.
(2) The discount percentages are based on an Offer Price of HK$40.60, being the mid-price of the indicative range of theOffer Price between HK$37.60 and HK$43.60.
HISTORY, REORGANIZATION AND CORPORATE STRUCTURE
– 163 –

With respect to the pre-IPO investment, Nanjing Ruxin has not been granted any special rights in
relation to our Company.
Background of Nanjing Ruxin and Mr. Xu Ningfeng
Nanjing Ruxin is a limited partnership incorporated in the PRC and whose sole general partner and
executive partner is Mr. Xu Ningfeng, one of our co-founders. In June 1991, Mr. Xu Ningfeng obtained
his bachelor’s degree from University of International Business and Economics* (北京對外經濟貿易大學)
in the PRC. After graduation, he worked in Nanjing Machinery, Minerals, Metals & Medicine Import and
Export Company* (南京機械五金礦產醫藥保健品進出口公司) from 1991 to 1993. In 1994, Mr. Pan, Ms.
Zhang and Mr. Xu Ningfeng founded Chervon International Trading, the predecessor of our Group, where
Mr. Xu Ningfeng served as a director and was involved in managing its business strategies and day-to-day
operations.
On March 22, 1997, Mr. Xu Ningfeng voluntarily transferred his entire shareholding in ChervonInternational (Hong Kong) Corp., Limited (泉峰國際(香港)有限公司) to the other co-founders of ourGroup to pursue new business and investment opportunities due to a change in his business focus. Afterhis departure, Mr. Xu Ningfeng had not taken up any roles and responsibilities in our Group until here-joined the Group as a passive investor by virtue of his shareholding in Nanjing Ruxin in March 2021.
To the best of our Directors’ knowledge, information and belief, Mr. Xu Ningfeng decided to investin our Group as he believed in the prospect of the power tools and OPE industry and that he was one ofco-founders who had knowledge and confidence in our management. The relevant pre-IPO investment wasduly approved by our Shareholders. Having taken into consideration that (i) the subscription by NanjingRuxin was made pursuant to Mr. Pan/Panmercy’s voluntary surrender of his/its right under the rights issueto subscribe for an additional 3,900,000 Shares; (ii) Mr. Xu Ningfeng’s previous contributions to ourGroup as one of the co-founders; (iii) the Listing is conditional and may or may not go forward; (iv) theequity risk assumed by Nanjing Ruxin in investing in an unlisted company; and (v) the basis ofdetermination of the consideration as disclosed above, our Company believes that it is in our commercialinterests to enter into the pre-IPO investment.
Following the completion of the Global Offering (assuming the Over-allotment Option is notexercised), Nanjing Ruxin will be interested in 3,900,000 Shares, representing 0.81% of the total numberof our Shares in issue. Neither Nanjing Ruxin nor Mr. Xu Ningfeng will be a substantial shareholder ofour Company, and other than investment in our Group, Nanjing Ruxin and Mr. Xu Ningfeng are partiesindependent of our Company and its connected persons, hence the Shares held by Nanjing Ruxin will betreated as part of the public float of our Company following Listing for the purpose of Rule 8.08 of theListing Rules. Save as disclosed above and to the best knowledge of the Directors, there are no other pastor present relationships between Mr. Xu Ningfeng and the Company and its subsidiaries, theirshareholders, directors and senior management, and any of their respective associates.
Compliance with Interim Guidance and Guidance Letters
The Joint Sponsors have confirmed that the terms of the Pre-IPO investment as described above arein compliance with (i) the Guidance Letter HKEX-GL29-12 issued by the Stock Exchange in January 2012and as updated in March 2017; and (ii) the Guidance Letter HKEX-GL43-12 issued by the Stock Exchangein October 2012 and as updated in July 2013 and March 2017; and (iii) the Guidance LetterHKEX-GL44-12 issued by the Stock Exchange in October 2012 and as updated in March 2017.
HISTORY, REORGANIZATION AND CORPORATE STRUCTURE
– 164 –

PRC LISTING PLAN
Following the continued growth in our scale of business and with a view to enhance our corporateimage and broaden our investor base, we decided to tap into the capital markets by seeking a listing ofour shares on a reputable stock exchange. Our Directors considered that the vision of the Shanghai StockExchange Science and Technology Innovation Board (“SSE STAR Market”) aligns with our corporateimage and dedication to business innovation, and initially explored the possibility of seeking an initialpublic offering on the SSE STAR Market (the “PRC Listing Plan”). We engaged China InternationalCapital Corporation Limited as the tutoring agency to provide guidance and preliminary complianceadvice with regard to our proposed listing on the SSE STAR Market. We made a preliminary tutoring filing(上市輔導備案申請) with the Jiangsu Regulatory Bureau of CSRC (中國證券監督管理委員會江蘇監管局)in March 2021, and submitted a tutoring progress report (輔導進展報告) in June 2021.
Meanwhile, our Directors also consider the Stock Exchange, as an internationally recognized andreputable stock exchange, to be an appropriate listing venue to provide us with a good platform to accessthe international equity market and expand our global business.
After taking into consideration a number of factors, including timing and other commercialconsiderations, we decided not to proceed with the PRC Listing Plan at the current stage. On September27, 2021, the Company voluntarily terminated its preliminary tutoring with China International CapitalCorporation Limited and informed the Jiangsu Regulatory Bureau of CSRC. Our Directors believe that thedecision not to pursue the PRC Listing Plan was commercially sensible and in the interest of the long-termdevelopment of the Company.
As of the Latest Practicable Date, we had not filed any formal listing application in relation to ourproposed listing on the SSE STAR Market with the CSRC and had not received any verbal or writtencomments or inquiries from the Jiangsu Regulatory Bureau of CSRC since our preliminary tutoring filingin March 2021. To the best of our Directors’ knowledge and belief, there were no material adverse findingsabout our Group or other matters relating to the PRC Listing Plan that might potentially affect thesuitability of our Group to be listed on the SSE STAR Market. Based on the foregoing and the duediligence conducted by the Joint Sponsors, the Joint Sponsors concur with the Directors’ view.
CORPORATE STRUCTURE
Corporate structure before the Global Offering
The following diagram illustrates the corporate structure of our Group immediately after theReorganization and before completion of the Global Offering:
HISTORY, REORGANIZATION AND CORPORATE STRUCTURE
– 165 –

100%
Nan
jing
Che
rvon
Indu
stry
(PR
C)
100%
100%
100%
100%
100%
100%
100%
100%
100%
96%
100%
100%
100%
100%
100%
100%
100%
100%
100%
100%
100%
100%
Che
rvon
Ove
rsea
sH
oldi
ngs
Lim
ited
(HK
)
Che
rvon
(H
K)
Lim
ited
(HK
)
Che
rvon
Gm
bH(G
erm
any)
SK
IL B
.V.
(Net
herl
ands
)
Che
rvon
Aus
tral
iaP
ty L
imit
ed(A
ustr
alia
)
EG
O E
urop
eG
mbH
(Ger
man
y)
Che
rvon
Eur
ope
Ltd
.(U
K)
Che
rvon
Nor
thA
mer
ica
Inc.
(US)
Che
rvon
Can
ada
Inc.
(Can
ada)
Che
rvon
Vie
tnam
(Vie
tnam
)
FL
EX
Ver
wal
tung
sG
mbH
& C
o. K
G
(Ger
man
y)
FL
EX
EL
(Ger
man
y)
FL
EX
PO
WE
R T
OO
LS
BV
(Bel
gium
)
FL
EX
Ita
lia
S.r
.l(I
taly
)
FE
MA
(Fra
nce)
FL
EX
Pow
er T
ools
B.V
.(N
ethe
rlan
ds)
FL
EX
Ele
ktro
nářa
dí,
s.r.
o(C
zech
Rep
ubli
c)
FL
EX
Pow
er T
ools
Lim
ited
(UK
)
FL
EX
Ges
chäf
tsfü
hrun
gsG
mbH
(Ger
man
y)
4%
Che
rvon
NZ
Sub
sidi
ary
Lim
ited
(New
Zea
land
)
Che
rvon
(C
hina
) To
ol S
ales
(PR
C)
Che
rvon
(C
hina
)T
radi
ng C
o., L
td.
(PR
C)
Our
Com
pany
(HK
)
63.8
6%6.
66%
23.9
6%1.
10%
100%
Mr.
Pan
Mr.
Ke
Zuq
ian
100%
Ms.
Zha
ng T
ong
100%
Ms.
Wu
Hon
gwei
(1)
100%
100%
0.20
%2.
57%
0.29
%0.
96%
Pan
mer
cyK
lam
mO
ffsh
ore
Em
ploy
eeS
hare
hold
ing
Pla
tfor
ms(6
)
(BV
I)
PR
C E
mpl
oyee
Sha
reho
ldin
g P
latf
orm
s(5)
(PR
C)
Nan
jing
Rux
in(4
)
(PR
C)
Gre
en H
ope
Vis
ion
Eas
yIn
vest
men
ts L
imit
ed(B
VI)
0.41
%
Abo
ve S
ucce
ssD
evel
opm
ents
Lim
ited
(BV
I)M
r. F
ranc
ois
D S
icar
t(3)
Che
rvon
(C
hina
)In
vest
men
t(P
RC
)
Uni
vers
al S
ucce
ssL
imit
ed(B
VI) 10
0%
100%
Mr.
Che
ng H
ong
Kei
(2)
Che
rvon
Aut
oP
reci
sion
Tec
hnol
ogy
(PR
C)
23.1
2%
HISTORY, REORGANIZATION AND CORPORATE STRUCTURE
– 166 –

Notes:
(1) Ms. Wu Hongwei is an independent third party who was our then vice president of the European market sales division fromJuly 2003 to June 2021 and was subsequently re-designated as the vice president of business development of the Companysince June 2021.
(2) Mr. Cheng Hong Kei is a director of Chervon (HK) Limited, Chervon Global Holdings Limited, Chervon Asset ManagementHoldings Limited, Chervon Investment Limited and Chervon Capital Management Limited.
(3) Mr. Francois D Sicart is an independent third party.
(4) Nanjing Ruxin is a limited partnership whose (i) sole general partner and executive partner is Mr. Xu Ningfeng, ourco-founder and an independent third party and (ii) sole limited partner is Ms. Xu Ningyan, his sister and an independent thirdparty.
(5) The purpose of establishing these 10 PRC employee shareholding platforms was to incentivize certain employees of our Groupwho are PRC residents pursuant to a one-off employee incentive arrangement of our Company. Since the maximum numberof holders of these limited partnerships was limited to 50 individuals or entities, 10 shareholding platforms were establishedto include, as of the Latest Practicable Date, a total of 406 employees as limited partners. Save for Mr. Hu Yian, a directorof certain of our subsidiaries, all other limited partners are employees of our Group in the PRC and are independent thirdparties. Ms. Chen Xiaoyuan (陳曉圓), our representative of securities affairs and an independent third party, is the sole generalpartner and executive partner of each of these PRC employee shareholding platforms. See “ – The Reorganization –Establishment of employee shareholding platforms and issue and allotment of Shares pursuant to an employee incentivearrangement” above and the section headed “Appendix IV – Statutory and General Information – A. Further Information aboutour Group – 2. Changes in the Share Capital of our Company” in this prospectus for further details. The Shares directly heldby Nanjing Ningyi Enterprise Management Partnership (Limited Partnership) (南京寧宜企業管理合夥企業(有限合夥)), one ofthe PRC employee shareholding platforms holding 3,235,250 Shares as of the Latest Practicable Date, will not be countedtowards the public float upon Listing for the purpose of Rule 8.08 of the Listing Rules, as Mr. Hu Yian is interested in 13.60%as a limited partner as of the Latest Practicable Date.
(6) The purpose of establishing these 2 offshore employee shareholding platforms was to hold incentive Shares for, as of theLatest Practicable Date, a total of 13 employees of our Group who are foreign residents pursuant to a one-off employeeincentive arrangement of our Company. Ms. Zhang is the sole director of each of the offshore employee shareholdingplatforms. Save for Ms. Zhang, Mr. Michael John Clancy (“Mr. Clancy”), Mr. Peter John Melrose and Dr. Christian Neuner,who held shares in the offshore employee shareholding platforms under the employee incentive arrangement, all other relevantemployees are independent third parties. See “ – The Reorganization – Establishment of employee shareholding platforms andissue and allotment of Shares pursuant to an employee incentive arrangement” above and the section headed “Appendix IV– Statutory and General Information – A. Further Information about our Group – 2. Changes in the Share Capital of ourCompany” in this prospectus for further details. The Shares directly held by these 2 offshore employee shareholding platformswill not be counted towards the public float upon Listing for the purpose of Rule 8.08 of the Listing Rules, as Ms. Zhangcontrols their boards as the sole director, and therefore they are associates of a core connected person of our Company asdefined under the Listing Rules.
HISTORY, REORGANIZATION AND CORPORATE STRUCTURE
– 167 –

Cor
por
ate
stru
ctu
reim
med
iate
lyfo
llow
ing
the
Glo
bal
Off
erin
g
The
foll
owin
gdi
agra
mil
lust
rate
sth
eco
rpor
ate
stru
ctur
eof
our
Gro
upim
med
iate
lyfo
llow
ing
the
com
plet
ion
ofth
eG
loba
lO
ffer
ing
(ass
umin
gth
eO
ver-
allo
tmen
tO
ptio
nis
not
exer
cise
d):
100%
Nan
jing
Che
rvon
Indu
stry
(PR
C)
100%
100%
100%
100%
100%
100%
100%
100%
96%
100%
100%
100%
100%
100%
100%
100%
100%
100%
100%
100%
100%
Che
rvon
Ove
rsea
sH
oldi
ngs
Lim
ited
(HK
)
Che
rvon
(H
K)
Lim
ited
(HK
)
Che
rvon
Gm
bH(G
erm
any)
SK
IL B
.V.
(Net
herl
ands
)
Che
rvon
Aus
tral
iaP
ty L
imit
ed(A
ustr
alia
)
EG
O E
urop
eG
mbH
(Ger
man
y)
Che
rvon
Eur
ope
Ltd
.(U
K)
Che
rvon
Nor
thA
mer
ica
Inc.
(US)
Che
rvon
Can
ada
Inc.
(Can
ada)
Che
rvon
Vie
tnam
(Vie
tnam
)
FL
EX
Ver
wal
tung
sG
mbH
& C
o. K
G
(Ger
man
y)
FL
EX
EL
(Ger
man
y)
FL
EX
PO
WE
R T
OO
LS
BV
(Bel
gium
)
FL
EX
Ita
lia
S.r
.l(I
taly
)
FE
MA
(Fra
nce)
FL
EX
Pow
er T
ools
B.V
.(N
ethe
rlan
ds)
FL
EX
Ele
ktro
nářa
dí,
s.r.
o(C
zech
Rep
ubli
c)
FL
EX
Pow
er T
ools
Lim
ited
(UK
)
FL
EX
Ges
chäf
tsfü
hrun
gsG
mbH
(Ger
man
y)
4%
Che
rvon
NZ
Sub
sidi
ary
Lim
ited
(New
Zea
land
)
Che
rvon
(C
hina
) To
ol S
ales
(PR
C)
Che
rvon
(C
hina
)T
radi
ng C
o., L
td.
(PR
C)
Our
Com
pany
(HK
)
54.2
8%5.
66%
20.3
7%0.
94%
100%
Mr.
Pan
Ms.
Zha
ng T
ong
100%
100%
0.35
%0.
17%
0.25
%15
%0.
81%
Pan
mer
cyK
lam
mO
ther
Pub
lic
Sha
reho
lder
s
Off
shor
e E
mpl
oyee
Sha
reho
ldin
g P
latf
orm
s(6)
(BV
I)
Nan
jing
Rux
in(4
)
(PR
C)
Gre
en H
ope
Vis
ion
Eas
yIn
vest
men
ts L
imit
ed(B
VI)
Abo
ve S
ucce
ssD
evel
opm
ents
Lim
ited
(BV
I)M
r. F
ranc
ois
D S
icar
t(3)
Che
rvon
(C
hina
)In
vest
men
t (P
RC
)
2.18
%
PR
C E
mpl
oyee
Sha
reho
ldin
g P
latf
orm
s(5)
(PR
C)
100%
Mr.
Ke
Zuq
ian
100%
Ms.
Wu
Hon
gwei
(1)
100%
Uni
vers
al S
ucce
ssL
imit
ed(B
VI) 10
0%
100%
Mr.
Che
ng H
ong
Kei
(2)
Che
rvon
Aut
oP
reci
sion
Tec
hnol
ogy
(PR
C)
23.1
2%
Not
e:
See
the
prec
edin
gpa
gefo
rno
tes
(1)
to(6
).
HISTORY, REORGANIZATION AND CORPORATE STRUCTURE
– 168 –
WHO WE ARE
We are a global provider of power tools and outdoor power equipment (“OPE”). Our focus on
innovation, especially lithium-ion battery system technology, has enabled us to achieve significant scale
and rapid growth. According to the Frost & Sullivan Report, in 2020, we ranked the 13th and accounted
for approximately 1.9% of the combined global power tool and OPE markets by revenue. We also ranked
the 9th and accounted for approximately 1.7% of the global power tool market, and ranked the 10th and
accounted for approximately 2.1% of the global OPE market, in each case by revenue, according to the
same report. In 2020, the global electric power tools market accounted for 74.1% of the global power tools
market, and the global electric OPE market accounted for 18.6% of the global OPE market, according to
the Frost & Sullivan Report. Our global ranking by revenue for electric power tools rose from the 9th in
2018 to the 7th in 2020, and our global ranking by revenue for electric OPE rose quickly from the 7th in
2018 to the 2nd in 2020, according to the same source. From 2018 to 2020, our revenue from power tools
grew by a CAGR of 16.9%, and our revenue from OPE grew by a CAGR of 62.8%.
Our research and development capabilities have enabled us to seize market opportunities amidst a
period of growth and rapid transformation within our industry, particularly with respect to the
lithium-ion/cordless market segment. Our revenue from the lithium-ion battery powered products grew
from US$347.3 million in 2018 to US$827.3 million in 2020, representing a CAGR of 54.3%. According
to the Frost & Sullivan Report, end users have shown increasing preference for lithium-ion battery power
tools and OPE, due to benefits such as enhanced user experience, cost-efficiency and environmental
friendliness, while delivering power and performance that can rival traditional products. According to the
Frost & Sullivan Report, from 2020 to 2025, the global cordless power tool market is projected to grow
at a CAGR of 9.9% and the global cordless OPE market is projected to grow at a CAGR of 9.0%. Having
recognized the transformative impact of lithium-ion batteries and related technologies, we focused on this
industry segment and became one of the first businesses in the world to commercialize lithium-ion battery
power tools in 2006 and high-voltage OPE products in 2014.
We offer a comprehensive range of products under a portfolio of well-recognized brands, which are
tailored to address the diverse needs of our end users around the world. Our power tools target both
industrial/professional and consumer end users, and our OPE products target both premium and
mass-market end users. We currently own five differentiated and well-recognized brands that cover key
geographies and segments, namely EGO, FLEX, SKIL, DEVON and X-TRON. In particular, our EGO brand
has gained strong recognition in the global electric OPE market since its establishment in 2013.
BUSINESS
– 169 –

The pictures below illustrate our brands and some of our main products.
Brand Primary products
No. 3 in the global electric
OPE market(1)
A premium professional
power tool brand for
industrial/professional
markets with German
origin from 1922
Note:
(1) EGO ranks No. 3 in the global electric OPE market by revenue in 2020 according to the Frost & Sullivan Report.
BUSINESS
– 170 –
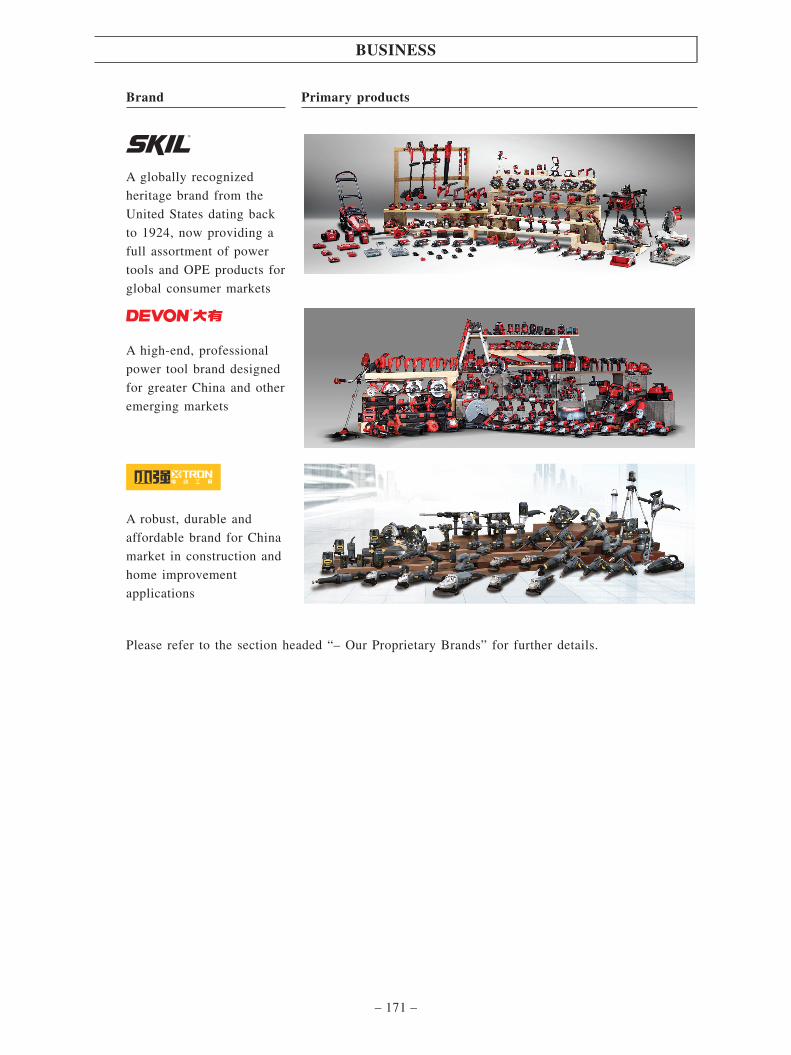
Brand Primary products
A globally recognized
heritage brand from the
United States dating back
to 1924, now providing a
full assortment of power
tools and OPE products for
global consumer markets
A high-end, professional
power tool brand designed
for greater China and other
emerging markets
A robust, durable and
affordable brand for China
market in construction and
home improvement
applications
Please refer to the section headed “– Our Proprietary Brands” for further details.
BUSINESS
– 171 –
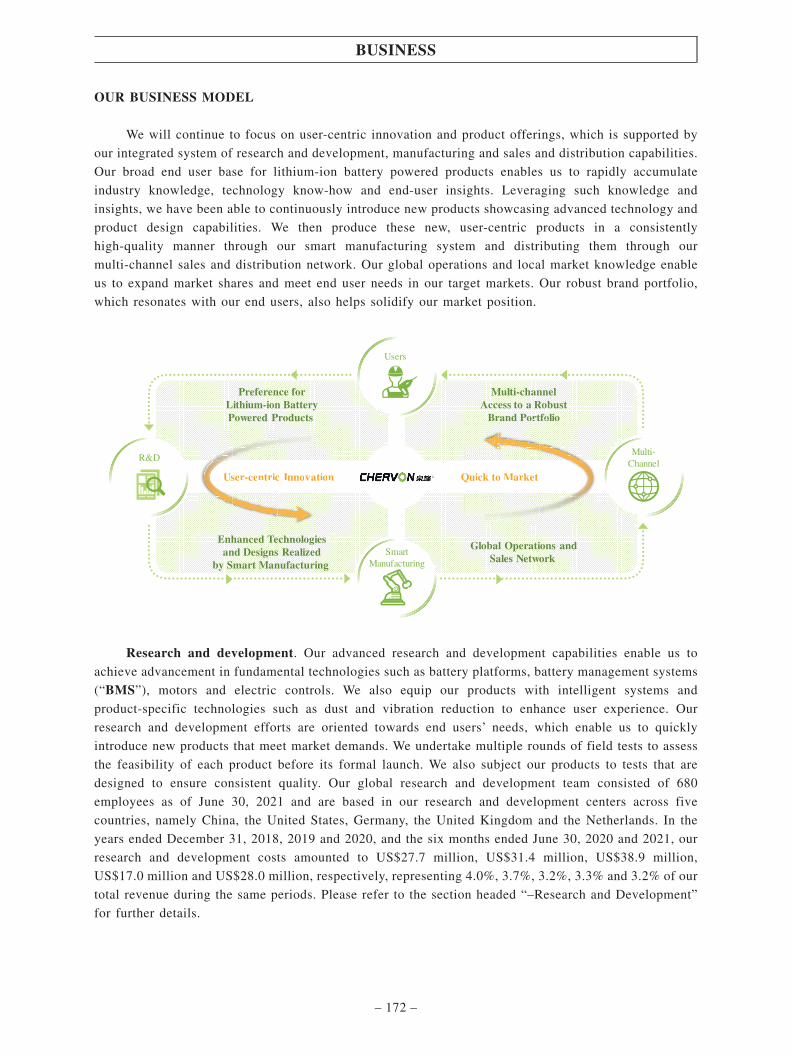
OUR BUSINESS MODEL
We will continue to focus on user-centric innovation and product offerings, which is supported by
our integrated system of research and development, manufacturing and sales and distribution capabilities.
Our broad end user base for lithium-ion battery powered products enables us to rapidly accumulate
industry knowledge, technology know-how and end-user insights. Leveraging such knowledge and
insights, we have been able to continuously introduce new products showcasing advanced technology and
product design capabilities. We then produce these new, user-centric products in a consistently
high-quality manner through our smart manufacturing system and distributing them through our
multi-channel sales and distribution network. Our global operations and local market knowledge enable
us to expand market shares and meet end user needs in our target markets. Our robust brand portfolio,
which resonates with our end users, also helps solidify our market position.
SmartManufacturing
Multi-Channel
Users
R&D
User-centric Innovation
Enhanced Technologiesand Designs Realized
by Smart Manufacturing
Preference forLithium-ion BatteryPowered Products
Multi-channelAccess to a Robust
Brand Portfolio
Global Operations andSales Network
Quick to Market UseUU r-centric Innovation
BBrraanndd PPoorrttffooff liioo
Quick to Market
Research and development. Our advanced research and development capabilities enable us to
achieve advancement in fundamental technologies such as battery platforms, battery management systems
(“BMS”), motors and electric controls. We also equip our products with intelligent systems and
product-specific technologies such as dust and vibration reduction to enhance user experience. Our
research and development efforts are oriented towards end users’ needs, which enable us to quickly
introduce new products that meet market demands. We undertake multiple rounds of field tests to assess
the feasibility of each product before its formal launch. We also subject our products to tests that are
designed to ensure consistent quality. Our global research and development team consisted of 680
employees as of June 30, 2021 and are based in our research and development centers across five
countries, namely China, the United States, Germany, the United Kingdom and the Netherlands. In the
years ended December 31, 2018, 2019 and 2020, and the six months ended June 30, 2020 and 2021, our
research and development costs amounted to US$27.7 million, US$31.4 million, US$38.9 million,
US$17.0 million and US$28.0 million, respectively, representing 4.0%, 3.7%, 3.2%, 3.3% and 3.2% of our
total revenue during the same periods. Please refer to the section headed “–Research and Development”
for further details.
BUSINESS
– 172 –
Multi-channel sales and distribution. We have established, and will continue to expand, a global
multi-channel sales and distribution network that offers us effective touchpoints for end users across key
markets, including North America, Europe and Asia. We collaborate with leading home centers and mass
market retailers, while also partnering with qualified distributors and local retailers to diversify our sales
channels and promote brand recognition. Retailers are those that purchase products from us and typically
sell them directly to end-users. By contrast, distributors purchase products from us and distribute them to
other third parties, which may consist of other retailers or sub-distributors, who then on-sell the products
to end-users. During the Track Record Period, our products were sold to customers in more than 100
countries and regions. We have achieved substantial penetration of professional distributor networks for
both electric power tools and OPE on a global scale. We have also established online sales channels for
our products by collaborating with e-commerce platforms and operating our own e-stores. In addition, we
design and manufacture products for certain home centers and mass market retailers, such as Lowe’s,
Walmart and Kingfisher, and international tool companies on an ODM basis. Please refer to the section
headed “– Sales, Marketing and Distribution” for further details.
Smart manufacturing. We have focused on building competitive advantages by advancing our
manufacturing technologies and production management capabilities over the past 20 years. We have made
long-term investments in a vertically integrated manufacturing system, which enables us to incorporate
new technologies into core product components such as battery packs, motors and electric control circuits.
With respect to product assembly, we have focused on promoting the application of industrial engineering
and quality control technologies in our assembly lines. Our highly automated, module-based production
lines enable us to fulfill high-mix and low-volume orders by quickly switching among different product
specifications and customer order requirements. With respect to production management, we have
significantly improved the level of automation and transparency in our logistics system by horizontally
integrating our information technology systems. Meanwhile, we leverage our integrated supply chain
management system to source certain raw materials, parts and components from qualified suppliers in
order to maintain high quality standards. Please refer to the section headed “–Production” for further
details.
OUR FINANCIAL PERFORMANCE
We have achieved strong revenue growth and improved profitability during the Track Record Period.
Our revenue increased at a CAGR of 31.9% from US$690.7 million in 2018 to US$1,200.9 million in
2020, which was significantly higher than the 4.9% for the global power tool and OPE industry over the
same period, according to the Frost & Sullivan Report. Our revenue increased by 68.9% from US$514.4
million for the six months ended June 30, 2020 to US$868.8 million for the six months ended June 30,
2021. Our gross profit increased at a CAGR of 44.9% from US$175.5 million in 2018 to US$368.7 million
in 2020. In addition, our gross profit increased by 70.0% from US$147.7 million for the six months ended
June 30, 2020 to US$251.1 million for the six months ended June 30, 2021. We recorded loss of US$13.5
million for 2018 and profit of US$36.1 million and US$48.4 million for 2019 and 2020, respectively. In
addition, our profit increased significantly from US$20.5 million for the six months ended June 30, 2020
to US$91.2 million for the six months ended June 30, 2021. Our adjusted net loss (non-HKFRSs measure)
was US$13.5 million for 2018, and our adjusted net profit (non-HKFRSs measure) was US$36.1 million,
US$69.7 million, US$20.5 million and US$93.4 million in 2019 and 2020 and the six months ended June
30, 2020 and 2021. See “Financial Information – Non-HKFRSs Measures.”
BUSINESS
– 173 –

OUR STRENGTHS
We believe the following competitive strengths have been key factors for our success to date and willenable us to maintain our global market position and capture the expected future growth across our targetmarkets:
Leveraging industry transformations, we are a fast-growing provider of power tools and OPEproducts.
We are a global provider of power tools and OPE. Our focus on innovation, particularly lithium-ionbattery system technology, has enabled us to achieve significant scale and rapid growth. According to theFrost & Sullivan Report, in 2020, we ranked the 13th and accounted for approximately 1.9% of thecombined global power tool and OPE markets by revenue. We also ranked the 9th and accounted forapproximately 1.7% of the global power tool market, and ranked the 10th and accounted for approximately2.1% of the global OPE market, in each case by revenue, according to the same report. In 2020, the globalelectric power tools market accounted for 74.1% of the global power tools market, and the global electricOPE market accounted for 18.6% of the global OPE market, according to the Frost & Sullivan Report. Ourglobal ranking by revenue for electric power tools rose from the 9th in 2018 to the 7th in 2020, and ourglobal ranking by revenue for electric OPE rose quickly from the 7th in 2018 to the 2nd in 2020, accordingto the same source. From 2018 to 2020, our revenue from power tools grew by a CAGR of 16.9%, andour revenue from OPE grew by a CAGR of 62.8%.
Our management team believes that lithium-ion battery technologies represent the future of theglobal electric power tool and OPE industry, and we have focused on leveraging such industrytransformations: we were one of the first businesses to apply lithium-ion battery technology to power toolsand to develop industry-leading, high-voltage OPE products. Our ability to lead and innovate has enabledus to seize the growth opportunities afforded by technological advancement and continuously increase ourmarket share.
We have expanded our market shares in rapidly expanding segments of the global power tools andOPE markets. According to the Frost & Sullivan Report, our share of the global electric power tool marketincreased from 1.8% in 2018 to 2.3% in 2020, and our share of the global electric OPE market grew from5.0% in 2018 to 11.4% in 2020. From 2020 to 2025, the global cordless power tool market is projectedto grow at a CAGR of 9.9%, and the global cordless OPE market is projected to grow at a CAGR of 9.0%,according to the same source.
We have continuously introduced new products that are grounded in advanced technology andend-user insights.
We focus on developing new products in-house and driving industry transformations. According tothe Frost & Sullivan Report, end users have shown an increasing preference for lithium-ion battery powertools, which generally provide for exceptional easy-to-use experience, convenience and long run time indifferent work environments. Similarly, end users have demonstrated growing demands for lithium-ionbattery OPE products, which are environmentally friendly and typically deliver better user experience thantraditional gasoline-engine products by generating less noise and vibration and offering greaterconvenience. Lithium-ion battery OPE products can also offer greater cost efficiency because batteryplatforms can be made compatible across different product types under the same brand and they do notrequire regular maintenance expected for traditional gasoline-engine products. Advancement in lithium-ion battery technologies also enables lithium-ion battery powered OPE products to provide power,performance and run time that rival traditional gasoline-engine products.
BUSINESS
– 174 –

Having recognized the tremendous potential of lithium-ion battery technologies, we started therelevant research and development efforts in 2005. In 2006, we became one of the first companies in theworld to commercialize a lithium-ion battery power tool. In 2014, we also led the application ofhigh-voltage lithium-ion battery technologies to OPE products under our EGO brand. Leveraging ourresearch and development capabilities, we have continuously upgraded our product portfolio. Forexample, we have brought to market our riding mowers in 2021, which are equipped with brushless motortechnology and powered by removable platform-compatible EGO lithium-ion batteries, which is one of thefirst of its kind to apply across riding mowers, walk-behind mowers and handheld OPE products. Our newriding mower product delivers the power and performance equivalent to a gasoline engine, which has ledto the same level of breakthrough disruptions to the riding mower category as EGO’s initial launch did tothe OPE industry. We are also currently developing, among other things, new technologies in BMS tofurther enhance the safety and longevity of our products. Besides lithium-ion battery platforms, we alsodevote significant resources to research and development of IoT, sensor and AI technologies to improveuser experience and create premium product offerings.
Our global research and development team possesses advanced product development capabilities andhas enabled us to acquire substantial intellectual property resources. As of June 30, 2021, we had morethan 1630 patents globally that cover core technologies relating to our products, such as BMS and electricmotors. As of June 30, 2021, we had 680 employees in our research and development centers across fivecountries, namely China, the United States, Germany, the United Kingdom and the Netherlands, whichprovide for strong product development capabilities. We have built a global system of industrial design byintegrating our Nanjing-based research and development center and industrial design teams based inGermany, the United Kingdom and the United States, which are staffed by professional designers withknowledge of the local consumer markets. Furthermore, we leverage our massive network of sales,distribution and after-sales services channels to develop insights into the needs and preferences ofend-users across our key geographic markets, future trends in the electric power tool and OPE markets,as well as overall patterns of consumer behavior.
We incurred US$27.7 million, US$31.4 million, US$38.9 million, US$17.0 million and US$28.0million of research and development costs for the years ended December 31, 2018, 2019 and 2020, andfor the six months ended June 30, 2020 and 2021, respectively. During the Track Record Period, weintroduced 751 new products, and lithium-ion battery powered products accounted for 65.2% of the totalnew products. During the Track Record Period, we developed approximately 860 products, 495 or 57.6%of which are lithium-ion battery powered.
We have a well-recognized brand portfolio, particularly our EGO brand.
We have built a portfolio of well-recognized brands through both self-creation and strategicacquisitions. We have achieved rapid growth in large part through our five well-recognized anddifferentiated brands that comprehensively cover industrial/professional and consumer power tools andpremium and mass-market OPE products.
Supported by our end-user insights, advanced technologies and global sales and distribution network,our proprietary brands have gained strong recognition in their respective markets and contributedsignificantly to our revenue growth. We tailor our proprietary brands and the relevant product offeringsbased on the varying needs, preferences and cost considerations of industrial/professional and consumerusers for power tools, as well as premium and mass-market users for OPE products, across our keymarkets. For example, our EGO brand primarily targets premium and commercial end users for OPEproducts in North America, Europe and Asia Pacific markets, while our DEVON brand primarily targetsprofessional end users for power tools in Asia and other emerging markets. Revenue from our proprietarybrands grew from US$431.8 million in 2018 to US$746.3 million in 2020, representing a CAGR of 31.5%.Revenue from our proprietary brands accounted for 62.1% of our total revenue in 2020.
BUSINESS
– 175 –

Our EGO brand has gained strong recognition since its establishment in 2013, which has enabled us
to rise rapidly in the global electric OPE market. According to the Frost & Sullivan Report, EGO ranked
No. 3 among the top global electric OPE brands by revenue in 2020. Under the EGO brand, we
transformed the OPE industry by successfully commercializing a range of lithium-ion battery OPE
products, such as our walk-behind mowers, leaf blowers, chain saws and riding mowers, that rival
traditional products in terms of power and performance. Our EGO products also share our proprietary
Arc-Lithium™ battery and charger system, which provides convenience and cost-savings for end-users.
EGO has delivered successful sales results in global OPE markets, particularly North America. Revenue
from EGO products grew at a CAGR of 61.8% from US$175.3 million in 2018 to US$459.1 million in
2020.
Our FLEX brand primarily features high-end power tools for industrial/professional end users in
Europe, North America and Asia Pacific regions. Founded in Germany in 1922, our FLEX brand has
achieved high recognition primarily in the professional tool market, and is supported by Made-In-Germany
manufacturing, as well as substantial knowledge and experience in product development. As the inventor
of the world’s first high speed angle grinder with a flexible shaft, FLEX is often used synonymously with
angle grinders in the German language. Since our acquisition of FLEX in 2013, we have devoted
substantial resources to increasing brand recognition, expanding sales channels and enriching the product
assortment by introducing the FLEX lithium-ion battery platform, which combines intelligent battery
management with THERMA-TECH™ cooling technology. Such efforts have enabled us to solidify FLEX’s
position as one of the premium brands in the professional tool market on a global scale.
Our SKIL brand primarily features quality power tools and recently entered into the OPE segment
for consumer end users in North America, Europe and Asia Pacific. With its origin in the United States
in 1924, SKIL is the inventor of the first portable electric circular saw and a well-recognized brand name
in the global power tool industry. SKIL-branded products include tools that run on a wide range of battery
platforms, including 12V, 20V, and 40V, totalling 201 products, which are tailored to different end users
and work environments. According to Research Now SSI, consumer brand awareness for the SKIL power
tools was 87% in the U.S. power tool market in 2018. Since our acquisition of SKIL in 2017, we have
continued to broaden sales channels and product offerings and invest in marketing initiatives for the brand.
Our DEVON (大有) brand is designed for industrial/professional high-end users primarily in the
Greater China market and other emerging markets. Self-created and launched in 2007 as our first original
brand, DEVON features six major power tool product lines that are widely used in fields such as
manufacturing, automobile maintenance and decoration.
We have established a highly effective multi-channel sales and distribution network with a growingemphasis on e-commerce channels.
Our products are prominently featured and well recognized across sales channels that are familiar to
our industrial/professional and consumer end users. We have built an multi-channel sales and distribution
network that involves close collaboration with a diverse group of business partners, including retailers and
distributors, among others, around the world. Retailers are those that purchase products from us and
typically sell them directly to end-users. By contrast, distributors purchase products from us and distribute
them to other third parties, which may consist of other retailers or sub-distributors, who then on-sell the
products to end-users. We strategically develop and optimize our sales and distribution network on a
region-by-region basis and tailor our approach based on local market needs and business norms. For
example, in North America, we sell our products primarily through leading national retailers including
BUSINESS
– 176 –

home centers and mass-market retailers, while in China, we sell our products primarily through a large and
growing network of high-quality distributors. We have also formed dedicated sales and marketing teams
in key global markets such as North America, Europe, China and Australia, which enable us to strengthen
our relationships with local business partners and gather valuable insights into each market. As of June 30,
2021, our products were sold to customers in more than 100 countries and regions.
We have achieved substantial penetration of professional distributor networks for both electric power
tools and OPE on a global scale. We collaborate with leading home centers, mass market retailers and
distributors in our key markets. For example, our electric power tools and OPE under the EGO, SKIL, and
FLEX brands are currently available across Lowe’s, a Fortune 500 home improvement company that serves
approximately 20 million customers a week in the United States and Canada. In addition, we collaborate
with leading home centers such as Kingfisher in Europe, as well as Walmart, a leading mass-market
retailer in the United States.
We have also established online sales channels for our products by collaborating with major
e-commerce platforms such as Amazon.com, Tmall and JD.com, including through self-operated e-stores.
Our revenue from pure-play e-commerce channels grew by a CAGR of 59.1% from 2018 to 2020, which
we believe showed the strengths of our portfolio of proprietary brands and the importance of e-commerce
platforms. We expect our revenue from pure-play e-commerce sales channels will account for a higher
percentage of our total revenue.
Leveraging advanced software systems, we gather valuable market information through our sales and
distribution channels in real time to capitalize on the rapidly evolving markets. We record, track and
maintain our customer and end-user relationships by implementing a cloud-based Customer Relationship
Management (“CRM”) system, which not only enables us to improve operational efficiency and inventory
turnover but also offers us first-hand data on market demand. The large volume of end-user feedback
accumulated through our sales channels can in turn help us upgrade and optimize our products based on
insights into the needs and preferences of our end users.
We have a global team with strategic vision and deep expertise.
We are guided by a founder-led management team with the ability to navigate our Company through
the constantly evolving market environment. Our senior management team consists of industry experts
with an average of over 20 years of industry experience and firm commitment to our company culture of
“Integrity, Diligence, Enthusiasm and Aspiration.” Mr. Pan, our co-founder and chief executive officer, has
over 30 years of experience in the power tool and OPE industry, and he has spearheaded our strategic
direction and growth amidst rapid industry transformations. Ms. Zhang, our co-founder and executive vice
president, brings industry insights and business acumen accumulated through 23 years of leadership
experience in our global sales and marketing operations, particularly in overseeing our significant growth
in the North America market in the last decade. Mr. Ke Zuqian, our co-founder and executive vice
president, leads our efforts in improving our production systems, supported by his qualifications and
experience in the field of industrial automation.
We attribute our success to an open-minded, diversified and globalized management team, which
consists of individuals from China, North America, Europe, Australia and Japan, who collectively bring
substantial talent and capabilities in research and development, sales and marketing, manufacturing,
supply chain management, as well as knowledge of our key local markets.
BUSINESS
– 177 –

We believe our senior management team, with their innovative mindset, industry insights and
strategic vision, will be able to effectively guide our strategic directions in a rapidly evolving market
environment, lead our teams in developing new products that meet customer needs and strengthen our
position in the global power tool and OPE industries. For more details, please refer to the section headed
“Directors and Senior Management” in this prospectus.
OUR STRATEGIES
We are committed to driving sustainable long-term growth and strengthening our market position in
electric power tool and OPE products through the following strategies:
Develop and commercialize new products that combine advanced technologies with user-friendlydesigns
We have expanded our market share by offering electric power tools and OPE products that enable
our end users to work more efficiently, safely and comfortably for longer periods of time. We will continue
to develop and upgrade our comprehensive product portfolio that combines advanced technologies with
user-friendly designs, which will be informed by our insights into the diverse needs of our
industrial/professional and consumer end users for power tools, as well as premium and mass-market end
users for OPE products. We aim to maintain our technological edge by leveraging our market-driven,
nimble system of product development and industrial design. Furthermore, we will continue to expand into
compatible and high-potential product categories in order to access an even larger market share, just like
our recent success in breaking into the riding mower segment.
We will continue implementing our product strategy that focuses on lithium-ion battery and smart
power tools and OPE, which we believe represent the future of our industry. We strive to continuously
improve the performance of our products, such as by further increasing the power and longevity of our
battery platforms and further reducing weight and noise levels of our electric power tools. We will also
seek to make our battery platforms compatible across a wider range of electric power tools and OPE
products, which we believe will promote end user loyalty to our product families. In addition, we will
continue to invest in technologies such as advanced BMS, high-power vector electric control, intelligent
parameter identification, and robotic and AI technologies. We will also develop and offer IoT-enabled
products to improve user convenience. We believe these efforts will enable us to capture market
opportunities and strengthen our position in the global electric power tool and OPE industry. For further
details regarding our use of proceeds from the Global Offering for research and development of our
products, please refer to the section headed “Future Plans and Use of Proceeds” of this prospectus.
Expand our sales and distribution network globally with a growing emphasis on e-commerceplatforms
We have built a global sales and distribution network with substantial penetration in our key markets.We will continue to expand and optimize our sales and distribution network by implementing tailoredstrategies for each market. In North America and Europe, we will (i) maintain and strengthen our strategicrelationships with national retailers, such as large home centers and mass market retailers, as well asestablished distributors with significant experience in local markets and (ii) increase our penetration ofonline channels through partnerships with large e-commerce platforms such as Amazon.com. In China, wewill continue to grow our distributor network and also broaden our reach to a large and internet-savvypopulation of end users by expanding our e-commerce channels, including through cooperation with Tmall
BUSINESS
– 178 –

and JD.com. Global revenue attributable to pure-play e-commerce channels for the global electric powertool and OPE industry is expected to grow at a CAGR of 15.1% and 10.2% from 2020 to 2025,respectively, according to the Frost & Sullivan Report. We plan to collaborate with more e-commerceplatforms in our key markets. We will also selectively enter into new markets where we identifyopportunities that can support our growth and profitability. For further details regarding our use ofproceeds from the Global Offering for enhancing our sales and distribution channels, please refer to thesection headed “Future Plans and Use of Proceeds” of this prospectus.
Further enhance market recognition of our brands
We currently own five differentiated and well-recognized brands that cover key geographies andsegments. We aim to further strengthen our brand recognition and grow the respective market share of ourbrands. We plan to promote our brands through social media and enhance our presence on e-commerceplatforms. We will focus on solidifying the leadership position of our EGO brand in the global high-endOPE market segment. We also strive to enhance recognition for our power tool brands, namely FLEX,SKIL, DEVON and X-TRON, in their respective markets. For example, our FLEX brand started to be ajersey sponsor of the Los Angeles Football Club in 2021, which coincided with the mainstreamprofessional market launch of our FLEX products in North America. We will continue to develop andrapidly promote consumer awareness of our proprietary brands, thus increasing market share in theirrespective target markets. For further details regarding our use of proceeds from the Global Offering forpromoting our brands, please refer to the section headed “Future Plans and Use of Proceeds” of thisprospectus.
Continue to expand production capacities and improve operational efficiency
We have built advanced manufacturing operations, and we will continue to expand our productioncapacities to capitalize on the growing demands of our products as well as to strengthen our industryposition. In particular, we plan to establish two new production facilities in China with a combinedadditional annual production capacity of 22.4 million units by 2024, while implementing technologicalupgrades for existing production facilities and production management systems. We expect our expandedproduction capacities will enable us to benefit from enhanced economies of scale. Please refer to “–Production Expansion Plan” and “Future Plans and Use of Proceeds” below for further details. Inexpanding our production capacities, we will consistently apply our standardized CHERVON productionsystem, module-based automated production lines and smart production IT systems, which will enable usto integrate our end-to-end production processes. Meanwhile, we are exploring opportunities for buildingnew or expanding existing production facilities in Europe, North America, Southeast Asia and otherregions, which we believe will provide us with diversified manufacturing capabilities.
We strive to continuously improve the efficiency and flexibility of our production system. We aimto enhance our profitability by continuously reducing our reliance on manual labor in the productionprocess and quality control through automation and digitalization, while enhancing the quality of ourproducts. We will continue to collaborate with leading research institutions to develop strategies toimprove our operational efficiency. In particular, we will continuously optimize our module-basedproduction process and enhance the versatility of our production lines. Furthermore, we will continue toupgrade and integrate our software systems, such as Manufacturing Execution System (“MES”), SupplierRelationship Management (“SRM”) and Warehouse Management System (“WMS”), to further improveour abilities to plan for, monitor, control and optimize the end-to-end production process.
BUSINESS
– 179 –
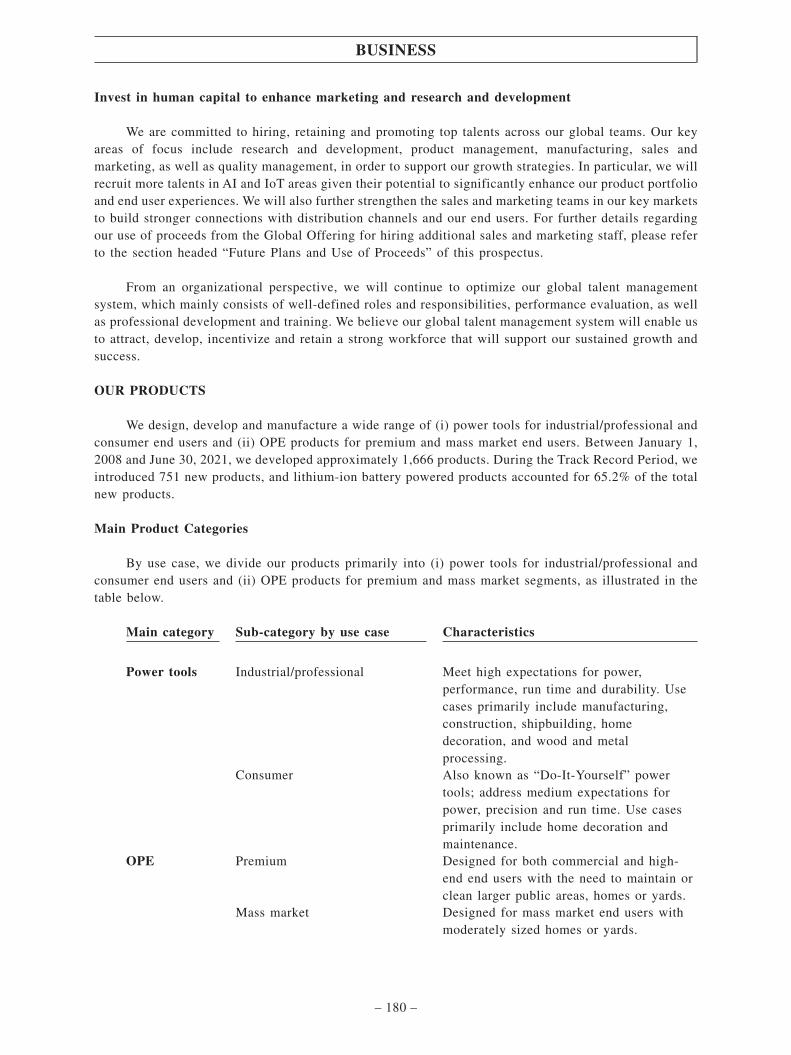
Invest in human capital to enhance marketing and research and development
We are committed to hiring, retaining and promoting top talents across our global teams. Our keyareas of focus include research and development, product management, manufacturing, sales andmarketing, as well as quality management, in order to support our growth strategies. In particular, we willrecruit more talents in AI and IoT areas given their potential to significantly enhance our product portfolioand end user experiences. We will also further strengthen the sales and marketing teams in our key marketsto build stronger connections with distribution channels and our end users. For further details regardingour use of proceeds from the Global Offering for hiring additional sales and marketing staff, please referto the section headed “Future Plans and Use of Proceeds” of this prospectus.
From an organizational perspective, we will continue to optimize our global talent managementsystem, which mainly consists of well-defined roles and responsibilities, performance evaluation, as wellas professional development and training. We believe our global talent management system will enable usto attract, develop, incentivize and retain a strong workforce that will support our sustained growth andsuccess.
OUR PRODUCTS
We design, develop and manufacture a wide range of (i) power tools for industrial/professional andconsumer end users and (ii) OPE products for premium and mass market end users. Between January 1,2008 and June 30, 2021, we developed approximately 1,666 products. During the Track Record Period, weintroduced 751 new products, and lithium-ion battery powered products accounted for 65.2% of the totalnew products.
Main Product Categories
By use case, we divide our products primarily into (i) power tools for industrial/professional andconsumer end users and (ii) OPE products for premium and mass market segments, as illustrated in thetable below.
Main category Sub-category by use case Characteristics
Power tools Industrial/professional Meet high expectations for power,performance, run time and durability. Usecases primarily include manufacturing,construction, shipbuilding, homedecoration, and wood and metalprocessing.
Consumer Also known as “Do-It-Yourself” powertools; address medium expectations forpower, precision and run time. Use casesprimarily include home decoration andmaintenance.
OPE Premium Designed for both commercial and high-end end users with the need to maintain orclean larger public areas, homes or yards.
Mass market Designed for mass market end users withmoderately sized homes or yards.
BUSINESS
– 180 –

Power Tools
Based on functionality, our power tool products primarily include (i) cutting tools, such as circularsaws, reciprocating saws and tile saws, (ii) fixing tools, such as hammer drills and impact wrenches and(iii) surface treatment tools, such as angle grinders and sanders. The following table shows our main powertool products as of June 30, 2021.
Product sub-categoryby functionality Primary products
Cutting tools
Circular saws Reciprocating saws Jig saws
Tile saws Miter saws
Fixing tools
Hammer drills Impact wrenches
Rotary hammers Screwdrivers
Surface treatment tools
Angle grinders Sanders Polishers
Based on use case, we offer power tool products primarily for (i) industrial/professional users inindustries such as manufacturing, construction, shipbuilding, home decoration, and wood and metalprocessing and (ii) do-it-yourself consumer users in areas such as home maintenance, decoration andcleaning. We offer professional power tool products (i) on an OBM basis under our proprietary brands,namely FLEX, DEVON (大有) and X-TRON (小強) and (ii) on an ODM basis for international toolcompanies. We also provide a wide range of power tool products for consumer end users to meet theirhousehold needs. We offer consumer power tool products (i) primarily under our proprietary brands,namely SKIL, and (ii) on an ODM basis for national retailers such as Lowe’s and Kingfisher.
BUSINESS
– 181 –

Based on power source, our power tool products include (i) alternating current (“AC”), or traditional
corded tools, and (ii) direct current (“DC”), or cordless tools powered by lithium-ion batteries.
Between January 1, 2008 and June 30, 2021, we developed approximately 1,445 power tool products.
During the Track Record Period, we developed a total of 628 new power tool products.
The following table provides recommended retail price ranges in the United States, our largest
geographic market by revenue in 2020, of our power tool products as of June 30, 2021.
Product sub-categoryby functionality Primary products
Recommended retail price rangesin the United States as of
June 30, 2021
(US$ per unit)
Cutting tools Circular saws 39 – 299Reciprocating saws 49 – 249Jig saws 35 – 199Tile saws 89 – 139Miter saws 249 – 649
Fixing tools Hammer drills 39 – 249Impact drivers/
wrenches 79 – 299Rotary hammers 109 – 299Screwdrivers 24 – 159
Surface treatment tools Angle grinders 29 – 249Sanders 24 – 139Polishers 129 – 649
BUSINESS
– 182 –

Outdoor Power Equipment
Our OPE products primarily include (i) ride-on outdoor equipment, such as riding mowers, (ii)
walk-behind wheeled outdoor equipment, such as walk-behind mowers and snow blowers, and (iii)
handheld outdoor tools, such as leaf blowers, string trimmers, hedge trimmers and chain saws. The
following table shows our primary OPE products as of June 30, 2021.
Product sub-categoryby functionality Primary products
Ride-on outdoor equipment
Riding mowers
Walk-behind wheeled outdoor
equipment
Walk-behind mowers Snow blowers
Handheld outdoor tools
Leaf blowers String trimmers
Hedge trimmers Chain saws
BUSINESS
– 183 –

Between January 1, 2008 and June 30, 2021, we developed approximately 221 OPE products,including 179 OPE products that operate on lithium-ion battery platforms. During the Track RecordPeriod, excluding batteries, chargers and accessories, we developed a total of 123 new OPE products,including 117 new OPE products that operate on lithium-ion battery platforms. The following tableprovides recommended retail price ranges in the United States, our largest geographic market by revenuein 2020, of our OPE products as of June 30, 2021.
Product Sub-categoryby functionality Primary products
Recommended retail price rangesin the United States as of
June 30, 2021
(US$ per unit)
Ride-on outdoor equipment Riding mowers 4,999 – 7,999
Walk-behind wheeled outdoorequipment
Walk-behind mowers 349 – 749Snow blowers 399 – 1,499
Handheld outdoor tools Leaf blowers 119 – 399String trimmers 129 – 369Hedge trimmers 99 – 299Chain saws 199 – 349
We offer OPE products primarily under the EGO and SKIL brands, which target premium andmass-market consumer segments, respectively. We also manufacture OPE tools for retail brands, such asLowe’s, on an ODM basis.
Business Mix
We offer our products under both OBM and ODM models. Under the OBM model, we design,develop, manufacture and sell our products primarily to retailers, distributors and e-commerce platformsunder our proprietary brands. Under the ODM model, we strategically enter into manufacturing contractswith certain home centers and mass market retailers, such as Lowe’s, and international tool companies ona selective basis. Under the ODM model, we design, develop and manufacture products based on generalproduct descriptions provided by the relevant business partners, and the products bear trademarks of suchbusiness partners. We generally retain the intellectual property rights to the products we produce in suchcases. After purchasing the products from us, the business partners sell the products to consumers throughtheir own sales and distribution networks. We believe our ODM business is complementary with our OBMbusiness as it allows us to more effectively increase our sales and shares in specific markets and/or toenhance our partnerships with selected customers. Through such partnerships, we can better expand ourbusiness, achieve economies of scale and reduce costs due to the increased customer and end-userdemands. Where appropriate and consistent with contractual obligations, we and our ODM customers arealso able to share industry know-hows (in the case of large industrial-oriented ODM customers) andconsumer end-user insights (in the case of large consumer-oriented ODM customers) that bring mutualbenefits to our respective businesses. The brand image, positioning and target end-users between ourproprietary brands and our customers’ brands are generally different, which allows our collaborations withcustomers to cover wider variety of end users. For example, our EGO-branded products primarily targetthe premium OPE segment, while the ODM products that we supply to large customers primarily targetthe mass-market OPE segment. Furthermore, our SKIL brand differentiates from the ODM products thatwe supply to large customers primarily through brand positioning and price ranges. In particular, our SKILbrand is primarily positioned at the mid-end price level in the consumer or mass market segment, whilethe ODM products that we supply to large customers are primarily positioned at the mid-to-high end pricelevel in the consumer or mass market segment. For further details, please refer to “– Sales, Marketing andDistribution – Sales of Products for Our ODM Business” below.
BUSINESS
– 184 –

Revenue Breakdown
By Product Category and Sub-category
The following table sets forth our revenue breakdown by product category and sub-category in anabsolute amount and as a percentage of our total revenue for the years and periods indicated.
Year ended December 31, Six months ended June 30,
2018 2019 2020 2020 2021
US$ % US$ % US$ % US$ % US$ %(Unaudited)
(in thousands, except for percentages)
Power Tools 483,370 70.0 549,680 65.2 661,081 55.1 278,887 54.2 451,066 51.9Cutting tools 163,057 23.6 156,702 18.6 241,094 20.1 104,291 20.3 161,723 18.6Fixing tools 145,744 21.1 194,271 23.0 157,754 13.2 61,350 11.9 118,773 13.7Surface treatment
tools 60,677 8.8 70,355 8.3 114,585 9.5 50,736 9.9 78,174 9.0Other power
tools(1) 113,892 16.5 128,352 15.3 147,648 12.3 62,510 12.1 92,396 10.6Outdoor Power
Equipment 201,410 29.1 287,971 34.1 533,691 44.4 231,451 45.0 414,041 47.7Ride-on outdoor
equipment – – – – – – – – 2,361 0.3Walk-behind
wheeled outdoorEquipment 70,408 10.1 96,932 11.5 187,244 15.5 95,780 18.6 166,571 19.2
Handheld outdoortools 115,285 16.7 162,914 19.3 298,673 24.9 116,861 22.7 187,072 21.5
Other OPE(2) 15,717 2.3 28,125 3.3 47,774 4.0 18,810 3.7 58,037 6.7Others(3) 5,918 0.9 5,927 0.7 6,130 0.5 4,021 0.8 3,690 0.4
Total 690,698 100.0 843,578 100.0 1,200,902 100.0 514,359 100.0 868,797 100.0
Notes:
(1) Primarily include batteries and accessories, and other non-core categories such as laser measuring tools, heating clothing,radios, among others.
(2) Primarily include batteries and accessories for OPE products.
(3) Others revenue primarily includes our sales of parts and components to a company engaging in a home appliance business.Revenue from such sales is categorized separately due to the difference in the nature of products sold, which are generallynot categorized as power tools or OPE.
BUSINESS
– 185 –

By Product Category and End-user Segment
The following table sets forth our revenue breakdown by product category and end-user segment inan absolute amount and as a percentage of our total revenue for the years and periods indicated.
Year ended December 31, Six months ended June 30,
2018 2019 2020 2020 2021
US$ % US$ % US$ % US$ % US$ %(Unaudited)
(in thousands, except for percentages)
Power Tools(1) 483,370 70.0 549,680 65.2 661,081 55.1 278,887 54.2 451,066 51.9Industrial/
professional 210,863 30.5 240,939 28.6 235,644 19.6 120,481 23.4 211,678 24.3Consumer 272,507 39.5 308,741 36.6 425,437 35.5 158,406 30.8 239,388 27.6
OPE(1) 201,410 29.1 287,971 34.1 533,691 44.4 231,451 45.0 414,041 47.7Premium 175,700 25.4 216,361 25.6 459,133 38.2 209,260 40.7 341,572 39.3Mass-market 25,710 3.7 71,610 8.5 74,558 6.2 22,191 4.3 72,469 8.4
Others(2) 5,918 0.9 5,927 0.7 6,130 0.5 4,021 0.8 3,690 0.4
Total revenue 690,698 100.0 843,578 100.0 1,200,902 100.0 514,359 100.0 868,797 100.0
Notes:
(1) Power Tools and OPE revenue includes tools, batteries and accessories in the respective category.
(2) Others revenue primarily includes our sales of parts and components to a company engaging in a home appliance business.
By OBM and ODM
The following table sets forth our revenue breakdown by OBM and ODM businesses in an absoluteamount and as a percentage of our total revenue for the years and periods indicated.
Year ended December 31, Six months ended June 30,
2018 2019 2020 2020 2021
US$ % US$ % US$ % US$ % US$ %(Unaudited)
(in thousands, except for percentages)
OBM 431,838 62.5 465,144 55.2 746,313 62.1 336,259 65.4 591,146 68.0EGO 175,330 25.3 216,360 25.7 459,126 38.1 209,260 40.8 341,420 39.3FLEX 91,780 13.3 91,622 10.9 99,396 8.3 45,694 8.9 102,818 11.8SKIL 127,749 18.5 115,272 13.7 138,892 11.6 52,615 10.2 98,175 11.3DEVON 30,247 4.4 35,733 4.2 41,447 3.5 24,341 4.7 41,705 4.8X-TRON 6,732 1.0 6,157 0.7 7,452 0.6 4,349 0.8 7,028 0.8
ODM 258,860 37.5 378,434 44.8 454,589 37.9 178,100 34.6 277,651 32.0
Total revenue 690,698 100.0 843,578 100.0 1,200,902 100.0 514,359 100.0 868,797 100.0
Please refer to the section headed “Financial Information” of this prospectus for additional details.
BUSINESS
– 186 –

By Power Source
The following table sets forth our revenue breakdown by power sources in an absolute amount andas a percentage of our total revenue for the years and periods indicated.
Year ended December 31, Six months ended June 30,
2018 2019 2020 2020 2021
US$ % US$ % US$ % US$ % US$ %(Unaudited)
(in thousands, except for percentages)
Power Tools(1) 483,370 70.0 549,680 65.2 661,081 55.1 278,887 54.2 451,066 51.9AC 336,307 48.7 302,095 35.8 370,093 30.8 165,227 32.1 231,084 26.6DC 147,063 21.3 247,585 29.4 290,988 24.3 113,660 22.1 219,982 25.3
OPE(1) 201,410 29.1 287,971 34.1 533,691 44.4 231,451 45.0 414,041 47.7AC(2) 1,112 0.1 – – – – – – – –DC 200,298 29.0 287,971 34.1 533,691 44.4 231,451 45.0 414,041 47.7
Others(3) 5,918 0.9 5,927 0.7 6,130 0.5 4,021 0.8 3,690 0.4
Total 690,698 100.0 843,578 100.0 1,200,902 100.0 514,359 100.0 868,797 100.0
Notes:
(1) Power Tools and OPE revenue includes tools, batteries and accessories in the respective category.
(2) We ceased producing and selling AC OPE due to our strategic focus on DC OPE products. Please refer to the section headed“– Our Strengths” for additional details.
(3) Others revenue primarily includes our sales of parts and components to a company engaging in a home appliance business.
By Sales and Distribution Channels
The following table sets forth our revenue breakdown by sales and distribution channels in an
absolute amount and as percentage of our revenue for the years and periods indicated.
Year ended December 31, Six months ended June 30,
2018 2019 2020 2020 2021
US$ % US$ % US$ % US$ % US$ %(unaudited)
(in thousands, except for percentages)
Retailers 326,756 47.3 357,330 42.4 599,789 49.9 269,372 52.4 433,223 49.9Distributors 85,127 12.3 84,519 10.0 95,991 8.0 53,470 10.4 116,633 13.4Pure-play
e-commerce
channels 19,955 2.9 23,295 2.8 50,533 4.2 13,417 2.6 41,290 4.7
Total for OBMbusiness 431,838 62.5 465,144 55.2 746,313 62.1 336,259 65.4 591,146 68.0
BUSINESS
– 187 –

OUR PROPRIETARY BRANDS
We have established a portfolio of differentiated brands to cover a wide range of geographies andmarket segments, which helps us meet the diversified needs of customers and end users around the world,adjust to changing market conditions and support our revenue growth. As of June 30, 2021, our proprietarybrands for power tool and OPE products primarily included EGO, FLEX, SKIL, DEVON (大有) andX-TRON (小強).
Brand Brand PositionMain ProductCategories Target End Users
GeographicFocus
RecommendedRetail PriceRanges
No. 3 in the global electric OPEmarket(1)
OPE Commercial/premium end users
North America,Europe andAsia Pacific
US$100-7,999
A premium professional power toolbrand for industrial/professionalmarkets with German origin from1922
Power tools Professional endusers
Europe, NorthAmerica andAsia Pacific
US$50-1,050
A globally recognized heritagebrand from the United States datingback to 1924, now providing a fullassortment of power tools and OPEproducts for global consumermarkets
Power toolsand OPE
Professionalbuilders andconsumer end users
North America,Europe andAsia Pacific
US$20-450
A high-end, professional power toolbrand designed for greater Chinaand other emerging markets
Power tools Professional/industrial end users
Asia and otheremergingmarkets
RMB199-6,999
A robust, durable and affordablebrand for China market inconstruction and home improvementapplications
Power tools Contractors in theconstruction andhome-improvementindustries
China RMB139-1,229
Note:
(1) EGO ranks No. 3 in the global electric OPE market by revenue in 2020 according to the Frost & Sullivan Report.
Our brand strategy seeks to provide comprehensive coverage and avoid overlap between marketsegments at the same time through differentiation in brand positioning, product categories, target endusers, pricing and geographic focus. We also conduct annual product roadmap planning and routine newproduct reviews to avoid competition among products across brands.
BUSINESS
– 188 –
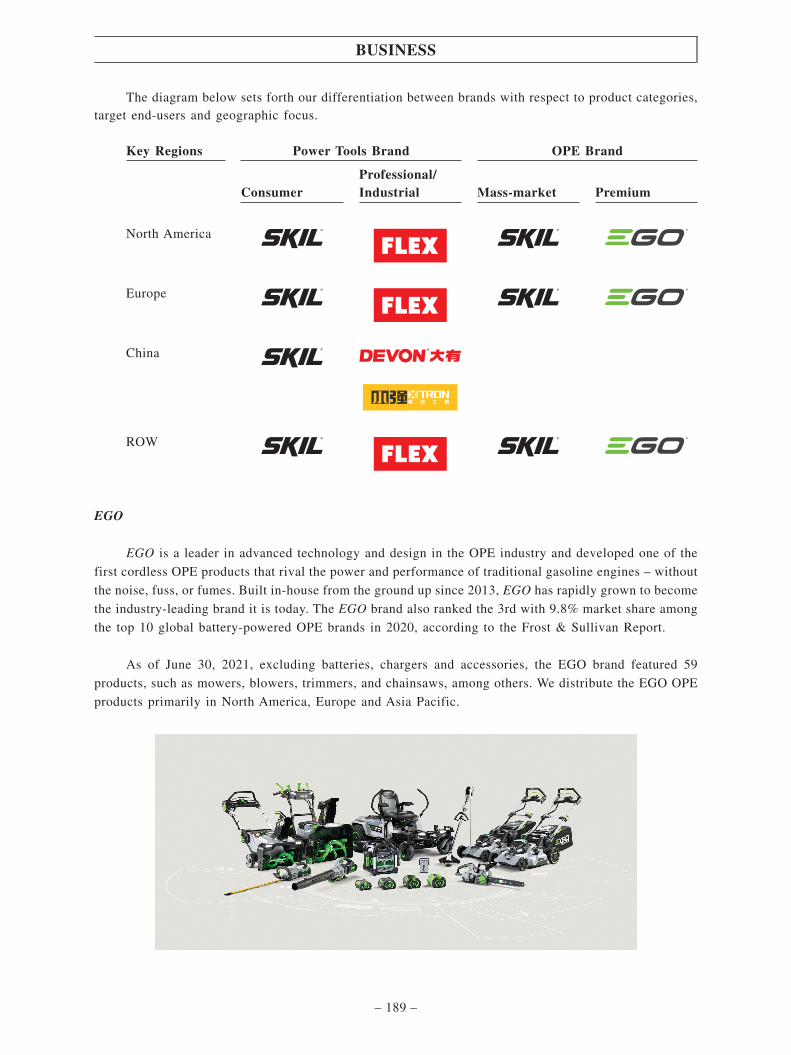
The diagram below sets forth our differentiation between brands with respect to product categories,target end-users and geographic focus.
Key Regions Power Tools Brand OPE Brand
ConsumerProfessional/Industrial Mass-market Premium
North America
Europe
China
ROW
EGO
EGO is a leader in advanced technology and design in the OPE industry and developed one of the
first cordless OPE products that rival the power and performance of traditional gasoline engines – without
the noise, fuss, or fumes. Built in-house from the ground up since 2013, EGO has rapidly grown to become
the industry-leading brand it is today. The EGO brand also ranked the 3rd with 9.8% market share among
the top 10 global battery-powered OPE brands in 2020, according to the Frost & Sullivan Report.
As of June 30, 2021, excluding batteries, chargers and accessories, the EGO brand featured 59
products, such as mowers, blowers, trimmers, and chainsaws, among others. We distribute the EGO OPE
products primarily in North America, Europe and Asia Pacific.
BUSINESS
– 189 –

Arc-LithiumTM Battery Platforms
As one of the industry’s first 56V battery platforms, EGO’s Arc-LithiumTM battery technologyenables our OPE products to provide for performance, durability and run time, even in tough conditions.Packed in a robust case and with electronics submerged in an epoxy, Arc-LithiumTM battery platforms arewater-, dust- and shock-resistant and are compatible across a range of OPE products from riding mowersto walk-behind wheeled outdoor equipment and to handheld tools.
EGO-branded products include riding mowers, walk-behind mowers, leaf blowers, string trimmers,hedge trimmers, chainsaws and portable power stations, among others.
Riding Mowers
Equipped with brushless motor technology, our lithium-ion battery powered riding mowers deliverthe power and performance equivalent to a gasoline engine and feature adjustable hydraulic seatsuspensions for a comfortable mowing experience for end users. Each riding mower can hold up to sixEGO 56V Arc LithiumTM batteries – the same battery platform powering all EGO products. Reaching atop speed of eight miles per hour, the riding mower covers up to two acres (approximately 8,100 sq.m.)on a single charge with four 56V Arc LithiumTM 10Ah batteries. End users can customize their rides withan LCD interface featuring three driving modes, namely control, standard and sport, that come withdifferent speeds and driving experience. The riding mower also includes features such as LED lights, USBcharging port and Bluetooth connectivity.
BUSINESS
– 190 –

Walk-Behind Mowers and Snow Blowers
Walk-behind wheeled outdoor equipment primarily includes walk-behind mowers and snow blowers.
Our walk-behind mower product features intuitive ambidextrous self-propel control, a variable-speed dial,
a brushless motor and a multi-blade cutting system, which collectively provide for superior power,
performance, versatility and long run time. Our snow blower product combines remote chute control, a
variable-speed dial, and a wide steel auger shaft to deliver enhanced clearing capabilities, even for heavy
and wet snow.
Leaf Blowers
Inspired by advanced aeronautics, we have equipped with our blower products with high speed
turbine fan technology to generate enhanced power and run time. The blower can run continuously for over
90 minutes and at various levels of speeds, generating a maximum air speed of 180 miles per hour that
is comparable to a Category 5 hurricane. With our patented antistatic technology and featuring one of the
first middle intake airflow design, EGO blower offers quietness, light-weight and compactness that
enables end users to get the job done faster and more comfortably compared to traditional gasoline engine
products.
BUSINESS
– 191 –

String Trimmers
Our EGO string trimmer product features (i) the patented POWERLOAD™ Technology, which
solves a significant pain point of string trimmers by being one of the world’s first string trimmer tool that
can automatically wind the trimmer line by a simple push of button and (ii) a carbon-fiber shaft that is
stronger than steel but lighter than aluminum and can be telescopic so that users at different height can
use the product at comfortable positions.
FLEX
Under the FLEX brand, we primarily manufacture power tools that are designed for the professionalcraftsmen. FLEX-branded products include sanders, polishers, angle grinders, metal surfacing tools, drills,impact drivers, impact wrenches and saws, among others. Our FLEX-branded products are applied in avariety of professional/industrial use cases that require precision, such as metal treatment, building andrenovation, automotive (car care and repair), and stone working. The FLEX brand embodies high standardsof power, performance, precision, run time and durability that meet the needs of our end users inprofessional work environments.
BUSINESS
– 192 –

FLEX main products and use cases
Metal treatment primarily covers vessel construction, metal
sheet work, work on stainless steel and surface treatment.
Applicable FLEX tools include angle grinders, straight
grinders, burnishing machines and belt sanders, among
others.
Building and renovation primarily covers completion of the
interior construction of buildings, renovating and
modernizing, such as drywall, electrical work, plumbing,
HVAC installing and painting. Applicable FLEX tools
include angle grinders, sanders, saws, drills, vacuums, and
rotary hammer, among others.
Automotive car care and repair primarily covers car body
preparation, smart repair, and paint preparation as well as
finishing that demands high degree of precision. Applicable
FLEX tools include polishers, sanders, impact wrenches
and vacuums, among others.
Stone working primarily covers professional sanding and
other types of processing of natural and artificial stones.
Applicable FLEX tools include angle grinders, sanders,
rotary hammers and polishers, among others.
As of June 30, 2021, the FLEX brand featured 193 products. Founded in Germany in 1922, FLEXdeveloped the world’s first high speed angle grinder in 1954, and the name FLEX is often usedsynonymously with angle grinders in the German language. FLEX was acquired by us in 2013. Wedistribute our FLEX products primarily in Europe, North America and Asia Pacific.
BUSINESS
– 193 –

Polisher
The FLEX polisher features multiple functions, namely rotary, mild orbital and aggressive orbital for various applications,with a working head that can be changed by only one push.
FLEX 24V Lithium-ion Range
FLEX lithium-ion battery tools combine 24V lithium-ion battery platforms, intelligent BMS and
THERMA-TECH™ cooling technology to deliver enhanced power, run time and fast charging capabilities
for power tools.
BUSINESS
– 194 –

FLEX 24V Brushless Inline Circular Saw
With its unique inline structure, FLEX 24V brushless inline circular saw can provide better cutting experience and morecutting depths compared to traditional circular saws.
SKIL
Founded in 1924, SKIL is a well-recognized brand in the power tool industry. We acquired SKIL in
2017 and has invested in strengthening its position in the industry. SKIL also offers a comprehensive
line-up of OPE products. SKIL products are equipped with advanced technologies that resonate with both
professional builders and home improvement enthusiasts. With its full assortment of products with
innovative features, SKIL has gained popularity and trust among end users in North America and European
markets.
As of June 30, 2021, the SKIL brand featured 201 products. We provide SKIL-branded products under
the following sub-categories: (i) power tools, including circular saws, reciprocating saws, worm drive
saws, drills, hammer drills, impact drivers, wrenches, angle grinders and sanders, among others, as well
as (ii) OPE products, including mowers, string trimmers, hedge trimmers, leaf blowers and chain saws.
Equipped with our patented PWRCoreTM battery technology and PWRJumpTM charging capability, our SKIL 12V brushlessdrill drivers performance, power, compactness and long run time. The PWRAssistTM technology also enables the battery to chargeother devices with a built-in USB port.
SKIL-branded products include tools that run on a wide range of battery platforms, including 12V,
20V and 40V, which are tailored for different end user requirements and work environments. SKIL’s
battery system also features convenient charging methods, such as the PWRASSIST™ Mobile Charging
system with a built-in USB port, which is similar to that of a phone or tablet. SKIL’s battery system also
provides fast-charging capabilities. For example, our PWRJUMP™ technology can replenish PWR CORE
BUSINESS
– 195 –
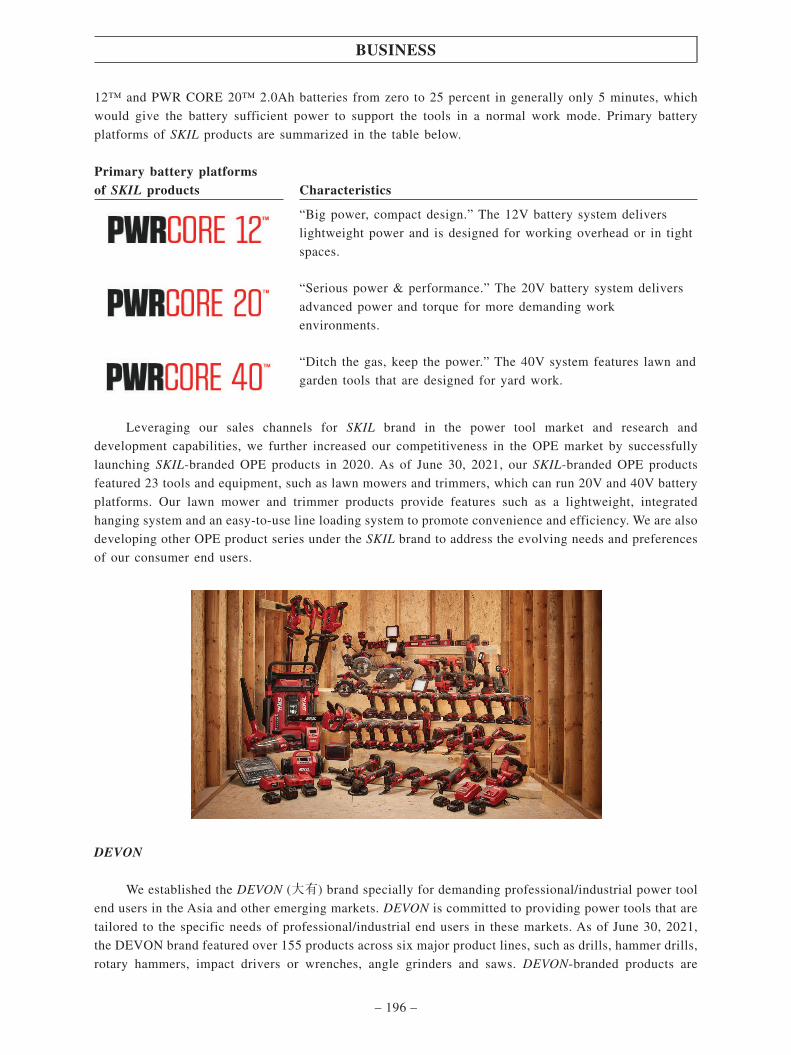
12™ and PWR CORE 20™ 2.0Ah batteries from zero to 25 percent in generally only 5 minutes, which
would give the battery sufficient power to support the tools in a normal work mode. Primary battery
platforms of SKIL products are summarized in the table below.
Primary battery platformsof SKIL products Characteristics
“Big power, compact design.” The 12V battery system delivers
lightweight power and is designed for working overhead or in tight
spaces.
“Serious power & performance.” The 20V battery system delivers
advanced power and torque for more demanding work
environments.
“Ditch the gas, keep the power.” The 40V system features lawn and
garden tools that are designed for yard work.
Leveraging our sales channels for SKIL brand in the power tool market and research and
development capabilities, we further increased our competitiveness in the OPE market by successfully
launching SKIL-branded OPE products in 2020. As of June 30, 2021, our SKIL-branded OPE products
featured 23 tools and equipment, such as lawn mowers and trimmers, which can run 20V and 40V battery
platforms. Our lawn mower and trimmer products provide features such as a lightweight, integrated
hanging system and an easy-to-use line loading system to promote convenience and efficiency. We are also
developing other OPE product series under the SKIL brand to address the evolving needs and preferences
of our consumer end users.
DEVON
We established the DEVON (大有) brand specially for demanding professional/industrial power tool
end users in the Asia and other emerging markets. DEVON is committed to providing power tools that are
tailored to the specific needs of professional/industrial end users in these markets. As of June 30, 2021,
the DEVON brand featured over 155 products across six major product lines, such as drills, hammer drills,
rotary hammers, impact drivers or wrenches, angle grinders and saws. DEVON-branded products are
BUSINESS
– 196 –

widely used in machinery manufacturing, furniture manufacturing, stone material, shipbuilding, casting,
steel structure, construction, decoration, automobile maintenance and other professional fields. Our
DEVON-branded products can be powered by both 12V and 20V lithium-ion battery platforms.
X-TRON
X-TRON (小強), which we developed in-house, delivers power tools that are tailored to the needs ofhands-on contractors in the construction and home-improvement industries in China. Offering durable andaffordable power tools with enhanced performance, X-TRON enjoys widespread recognition in its targetmarket. X-TRON-branded products primarily include drills, hammer drills, rotary hammers, impact driversor wrenches, angle grinders and saws. As of June 30, 2021, the X-TRON brand featured 45 products.X-TRON engineers and manufactures with the vision of combining a “no fuss” approach in design withrobustness, performance and affordability.
RESEARCH AND DEVELOPMENT
We have an unwavering focus on research and development and are dedicated to being an innovatorin the power tool and OPE industry. We devote resources to research and development to support provisionof new products with enhanced performance to meet the needs of our customers and end users. We incurredUS$27.7 million, US$31.4 million, US$38.9 million, US$17.0 million and US$28.0 million of researchand development expenses for the years ended December 31, 2018, 2019 and 2020, and for the six monthsended June 30, 2020 and 2021.
BUSINESS
– 197 –
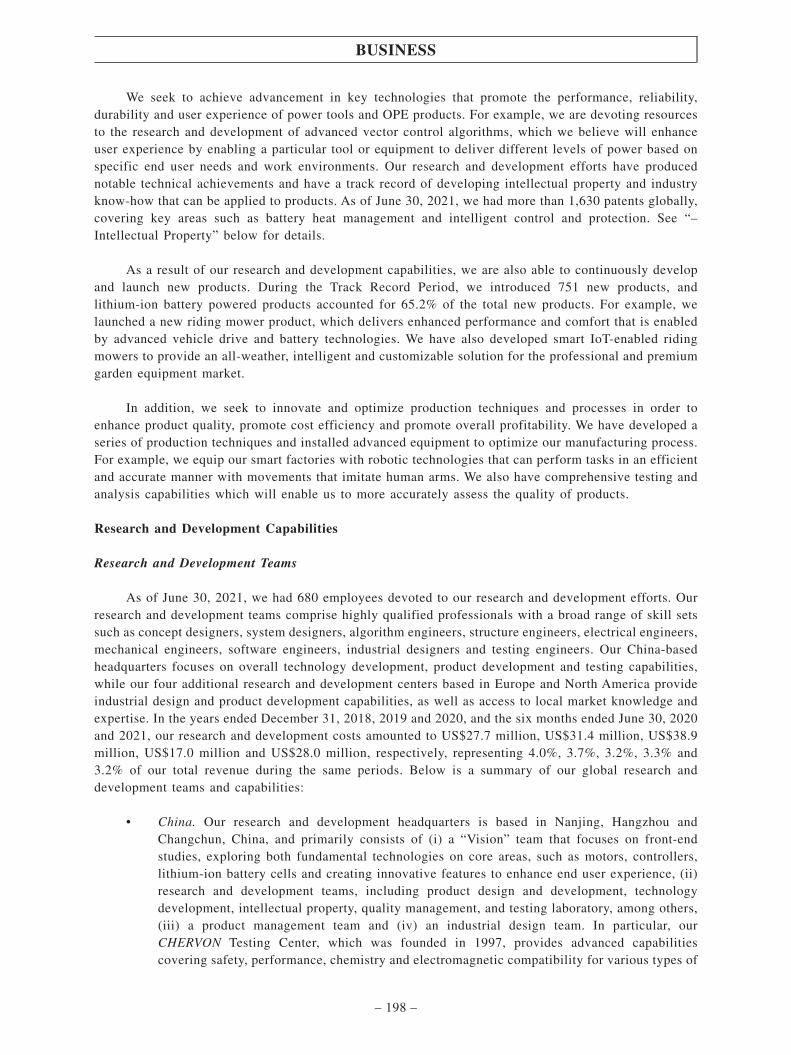
We seek to achieve advancement in key technologies that promote the performance, reliability,durability and user experience of power tools and OPE products. For example, we are devoting resourcesto the research and development of advanced vector control algorithms, which we believe will enhanceuser experience by enabling a particular tool or equipment to deliver different levels of power based onspecific end user needs and work environments. Our research and development efforts have producednotable technical achievements and have a track record of developing intellectual property and industryknow-how that can be applied to products. As of June 30, 2021, we had more than 1,630 patents globally,covering key areas such as battery heat management and intelligent control and protection. See “–Intellectual Property” below for details.
As a result of our research and development capabilities, we are also able to continuously developand launch new products. During the Track Record Period, we introduced 751 new products, andlithium-ion battery powered products accounted for 65.2% of the total new products. For example, welaunched a new riding mower product, which delivers enhanced performance and comfort that is enabledby advanced vehicle drive and battery technologies. We have also developed smart IoT-enabled ridingmowers to provide an all-weather, intelligent and customizable solution for the professional and premiumgarden equipment market.
In addition, we seek to innovate and optimize production techniques and processes in order toenhance product quality, promote cost efficiency and promote overall profitability. We have developed aseries of production techniques and installed advanced equipment to optimize our manufacturing process.For example, we equip our smart factories with robotic technologies that can perform tasks in an efficientand accurate manner with movements that imitate human arms. We also have comprehensive testing andanalysis capabilities which will enable us to more accurately assess the quality of products.
Research and Development Capabilities
Research and Development Teams
As of June 30, 2021, we had 680 employees devoted to our research and development efforts. Ourresearch and development teams comprise highly qualified professionals with a broad range of skill setssuch as concept designers, system designers, algorithm engineers, structure engineers, electrical engineers,mechanical engineers, software engineers, industrial designers and testing engineers. Our China-basedheadquarters focuses on overall technology development, product development and testing capabilities,while our four additional research and development centers based in Europe and North America provideindustrial design and product development capabilities, as well as access to local market knowledge andexpertise. In the years ended December 31, 2018, 2019 and 2020, and the six months ended June 30, 2020and 2021, our research and development costs amounted to US$27.7 million, US$31.4 million, US$38.9million, US$17.0 million and US$28.0 million, respectively, representing 4.0%, 3.7%, 3.2%, 3.3% and3.2% of our total revenue during the same periods. Below is a summary of our global research anddevelopment teams and capabilities:
• China. Our research and development headquarters is based in Nanjing, Hangzhou andChangchun, China, and primarily consists of (i) a “Vision” team that focuses on front-endstudies, exploring both fundamental technologies on core areas, such as motors, controllers,lithium-ion battery cells and creating innovative features to enhance end user experience, (ii)research and development teams, including product design and development, technologydevelopment, intellectual property, quality management, and testing laboratory, among others,(iii) a product management team and (iv) an industrial design team. In particular, ourCHERVON Testing Center, which was founded in 1997, provides advanced capabilitiescovering safety, performance, chemistry and electromagnetic compatibility for various types of
BUSINESS
– 198 –

power tools and OPE products in accordance with applicable regulations. Such capabilitiessupport critical functions such as product evaluation, certification, standard development andshipment quality control. The CHERVON Testing Center has achieved accreditations by bothChinese and international standard-setters, such as the China National Accreditation Servicefor Conformity Assessment (“CNAS”), the Underwriters Laboratories’ (“UL”) Client Test DataProgram (“CTDP”), the DEKRA company’s Customer Testing Facility Stage 3 (“CTF3”)program. We were the first PRC-based laboratory for power tools and equipment to achieve theUL-CTDP accreditation. UL is a global independent safety science company that providesproduct testing, inspection and certification services, among other aspects. The UL-CTDPaccreditation enables a product provider to utilize its own testing facilities to generate certaindata required for the UL certifications with respect to product safety. In order to qualify for theaccreditation, a product provider must have in place a laboratory quality program, physicalresources, equipment, qualified personnel and procedures needed to conduct specified tests. ULwill conduct initial and annual assessments on these elements. The Testing Center was alsorecognized by the Productivity Promotion Center of Electric Tool Industry (電動工具行業生產力促進中心) as the Leading Enterprise Laboratory in Chinese Power Tool Industry in 2021.
• Europe. Our European research and development centers are based in Germany, the UnitedKingdom and the Netherlands, which provide for superior talent and capabilities in areas suchas product development and industrial design. The FLEX team based in Germany also providesfor end-to-end product development, research and development capabilities.
• North America. Our North America research and development center is based in the UnitedStates, which provide for superior talent and capabilities in areas such as product developmentand industrial design.
Product Development Process
We develop our products in accordance with an established process and roles and responsibilities. Inthe product planning phase, we analyze the end user needs and competitive environment to identifypotential opportunities based on our industry insights and expertise, especially advanced and suitabletechnologies that may be applied to products across categories.
Once an opportunity is identified and project established, our multi-disciplinary team evaluates theproposed product concept design, which involves a joint effort by our product engineering, qualityassurance, safety, intellectual property and procurement teams, to determine the feasibility of the productbased on factors such as aesthetics, function, costs, manufacturability and market positioning. We alsotypically develop a product development plan. Our product and industrial design engineers then developthe structural and technical design and set out the quantity and specifications of raw materials, parts andaccessories needed to manufacture the product. Our intellectual property team registers patents when theyidentify novel and unique features. In addition, our safety engineers monitor our adherence to applicableproduct safety standards. Meanwhile, our procurement team works with product engineers to engagereliable suppliers to develop required parts and accessories, as needed. We organize such processes undera concurrent engineering structure.
Thereafter, we build, evaluate and refine a selected number of prototypes, and send a prototype toan independent laboratory for further evaluations. Once such internal and external evaluations arecomplete, we conduct pilot production and evaluate the manufacturing processes in order to enhanceefficiency in our production lines. We then pass on the product to our manufacturing facilities for massproduction.
BUSINESS
– 199 –
We continuously upgrade our products and refine our designs based on consumer feedback through
product development and after product launch. We collect end user feedback from a variety of sources,
including online reviews, user testing sessions, social media and comments from staff throughout our
offline distribution network, which will guide our product definition and development efforts.
Industry Standard-Setting
As a member of global and PRC-based standard-setting committees for power tools and OPE
products, we participated in the development of more than 100 published industry standards, including
taking a leading role in creating (i) one international standard regarding safety requirements for chain
beam saws and (ii) 11 industry standards in China covering a range of safety requirements for power tools,
battery packs and chargers. We submitted numerous commentaries to help improve drafts of industry
standards. We are a member of leading industry committees and organizations, including the International
Electrotechnical Commission (“IEC”), International Standard Organization (“ISO”), Canadian Standards
Association (“CSA”), Power Tool Institute (“PTI”) and Outdoor Power Equipment Institute (“OPEI”).
Collaboration with Research Institutions
We collaborate with research institutions to gain insights into industry trends, consumer preferences
in various markets and emerging new technologies and to focus on research and development efforts more
effectively. For example, in partnership with Fraunhofer-Gesellschaft in Germany, we develop
technologies to enhance the performance of our products. Fraunhofer-Gesellschaft is a large applied
research organization focusing on technologies such as artificial intelligence and computing. We also
collaborate with universities on research projects into fundamental technologies relevant to our products.
The salient terms of our agreements with research institutions are set forth below:
• Scope of collaboration. The agreements typically specify the research projects that the parties
collaborate on and the expected timeframes for such projects.
• Compensation. The agreements typically provide for the amount of compensation to be paid by
us to the research institutions, and such compensation is typically paid in installments.
• Confidentiality. The research institutions are required to maintain confidentiality of
information provided by us.
• Intellectual property rights. The agreements typically provide that we have intellectual
property rights in the results of relevant research projects.
• Termination. If the research results produced by a research institution fail to meet the
evaluation standards mutually agreed by the parties, we typically have the right to terminate the
relevant agreement.
BUSINESS
– 200 –

Our Technologies
We develop most of our key technologies in-house to achieve a rapid pace of innovation and tailor
our product offerings to industrial/professional and consumer, as well as premium and mass-market end
users. Such technologies encompass a range of technology stacks, including (i) fundamental technologies
covering battery platforms, electric controls and motors, (ii) IoT and intelligent systems and (iii)
product-specific technologies. We are able to understand the performance and user experience of our
products and have the flexibility to continuously improve them.
Fundamental Technologies
The performance of power tools and OPE depends on fundamental technologies involving battery
platforms, motors and electric controls. Battery platforms provide energy and power that are converted by
motors into driving forces for a tool or equipment, with electric control systems monitoring and directing
the operation of the tool or equipment to optimize end user experience and enhance power efficiency for
cordless tools. Leveraging our superior in-house research and development capabilities, we are able to
improve our power tools and equipment through user friendly features and noise and vibration reduction.
Battery Platforms
Our power tools and equipment utilize battery cells with high energy density, which are packed into
modules and fastened to a high-strength frame. Through our research and development efforts, we equip
our advanced battery platforms with technologies such as thermal control, intelligent pack matching and
multi-level safety protection, which enable our battery-powered products, such as mowers and blowers, to
operate in tough environments for longer periods of time and to enhance user experience by providing
power, performance, safety and run time. In addition, we believe the compatibility of our battery system
will enable us to leverage future technological advancement relating to battery cells. Our BMS is designed
in-house to optimize battery performance. It monitors the status of each battery cell in real time and
ensures the safe and efficient functioning of the battery system. Our BMS accurately calculates the
remaining battery capacity, and the accuracy of such calculation is essential to the battery’s safety and
longevity, as well as to an end user’s experience working with our tools and equipment. In addition, our
BMS has strong heat management capabilities. Our battery platforms are also capable of rapid charging,
which offer our customers a convenient experience and have received positive comments from customers
around the world.
(i) Arc LithiumTM Battery Platform
Our flagship EGO 56V Arc LithiumTM battery platform is a first-to-market differentiator which
features a patented “arc” shaped design, unlike other battery packs that are shaped like bricks and
retain heat. The battery platform is protected against water and elements by sealed and shock-
resistant materials, which support a high level of performance and durability. Inside the battery
platform, we use our intelligent battery management system that monitors and optimizes each
individual battery cell to promote power, performance and run time, including a patented proprietary
technology that enables high-accuracy temperature control. The battery platform also provides a
patented high-voltage battery system that uses a third parallel row of cells which evenly distributes
power across the rows, so that our battery can handle challenging conditions and provide enhanced
performance. In addition, our KEEP COOLTM technology protects each individual battery cell by
surrounding it with phase-changing material that pushes heat away, which, coupled with our patented
BUSINESS
– 201 –

Arc Lithium™ design, keeps the battery platform from overheating. The battery platform also comes
with our Turbo Charger system that can replenish a depleted 2.5Ah battery in approximately 30
minutes, which is made possible by an intelligent battery control system that monitors each cell’s
charge and temperature and a fan-cooling system that allows the battery to start charging sooner and
finish faster.
Shock Resistant DesignIntelligent BatteryManagement
Third ParallelRow of Cells
Keep Cool CellTechnology
Our sealed and shock-resistant
design protects batteries from
water and elements.
Our intelligent BMS
monitors and optimizes
each individual battery
cell to maximize power,
performance and run
time.
We obtained a patent for
our high-voltage battery
system that uses a third
parallel row of cells. This
innovative design evenly
distributes power across
the rows, so that our
battery can handle
challenging conditions
and provide enhanced
performance.
Each cell of our EGO
battery is surrounded by
phase-changing material
that absorbs heat.
Coupled with our
patented Arc Lithium™
design, this keeps the
battery from overheating
and equipment running
longer at full power.
BUSINESS
– 202 –
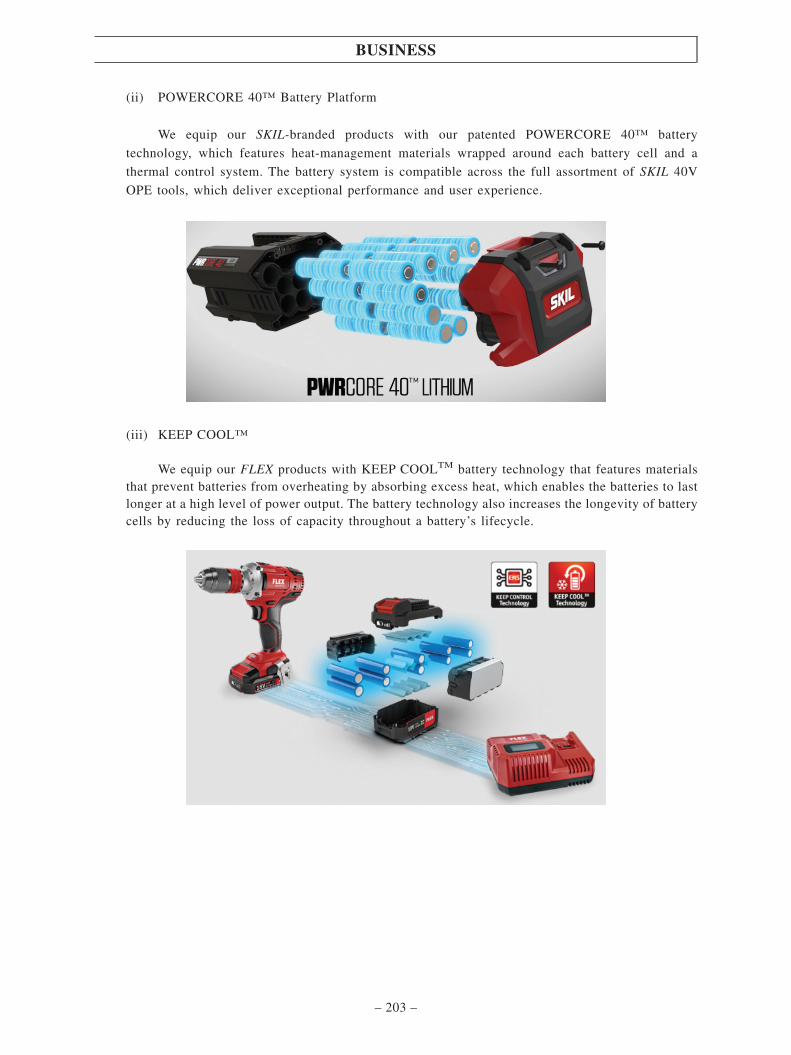
(ii) POWERCORE 40™ Battery Platform
We equip our SKIL-branded products with our patented POWERCORE 40™ battery
technology, which features heat-management materials wrapped around each battery cell and a
thermal control system. The battery system is compatible across the full assortment of SKIL 40V
OPE tools, which deliver exceptional performance and user experience.
(iii) KEEP COOL™
We equip our FLEX products with KEEP COOLTM battery technology that features materialsthat prevent batteries from overheating by absorbing excess heat, which enables the batteries to lastlonger at a high level of power output. The battery technology also increases the longevity of batterycells by reducing the loss of capacity throughout a battery’s lifecycle.
BUSINESS
– 203 –

Motors
Motors translate the electricity supplied by battery platforms into rotating motions that drive a powertool or equipment. With brushless permanent-magnet synchronization and direct-drive external rotortechnologies, our motors have a more compact structure that weighs less, achieves higher power efficiencyand reduces noise levels. These motor technologies were developed in-house and have been primarilyapplied to industrial and professional tools and equipment, such as impact wrenches and circular saws.
Electric Controls
Functioning like a nerve center, an electric control system (i) gathers and responds to informationthrough input devices such as sensors and (ii) controls the tool or equipment by using electrical energyin the form of an output action. Through substantial investments in in-house research and development,we are able to offer products that feature sensorless control, vector control and alternating-currentbrushless technologies, which are designed to make our products, such as drills and grinders, morepowerful, efficient, reliable and comfortable.
• Sensorless control. Unlike traditional motors with physical sensors that are prone tomalfunctioning due to metal dust exposure, our motors are sensorless and feature advancedcapabilities such as high-frequency injection and back electromagnetic field detection, whichmake our power tool equipment more compact and reliable.
• Vector control. Our vector control technology increases the versatility of our power tools andOPE products by expanding the range of motor speed and enabling smooth transitions betweenhigh-speed and high-capacity modes. The technology also enables high-accuracy torque controlthat provides for comfort and ease for end users in operating our riding outdoor equipment.
• AC brushless control. We replace the traditional series-wound motors with AC brushlessmotors that make our power tools, such as angle grinders and sanders, more compact andpowerful.
BUSINESS
– 204 –

IoT and Intelligent System Technologies
We are committed to leading the development of new power tool and OPE products based not only
on advanced engineering techniques, but also on IoT, sensors, machine learning and algorithms, which we
believe will help our products become more intelligent and evolve and upgrade more rapidly.
• Robotic mowers. Our robotic mower product is equipped with advanced outdoor positioning
and intelligent route planning capability that enables the mower to navigate unfamiliar
environments without human intervention and more accurately return to the starting point, even
under low power modes. In particular, the relevant technology combines intelligent navigation,
multi-sensor and equipment docking capabilities.
• IoT-based intelligent interactive technology. We devote significant resources into research and
development regarding IoT and sensor technologies, such as riding lawn mowers and battery
chargers, by providing for a data-driven, cloud-based platform that directly connects with end
users’ equipment. Our IoT-enabled equipment allows end users to remotely control and monitor
machine and battery status, conduct diagnosis and troubleshooting, and purchase additional
equipment and accessories through a mobile application.
• Intelligent control and protection. We provide end users of our power tools, such as drills, with
more comfort and safety through application of electric torque control and reverse rotation
protection technologies. The electric torque control technology enhances the accuracy of tool
controls by identifying relevant parameters in the electric system and building advanced
computer models based on such parameters. With data collected through sensors and control
algorithms, the reverse rotation protection technology enables an electric control system to
monitor the operating posture of power tools and apply necessary protective measures in
milliseconds, thus promoting the safety of power tools such as cordless drills.
• Machine learning-based multi-objective optimization system. We apply active learning
algorithms to analyze and optimize the combination of relevant performance indicators, such
as power, vibration, and run time, across a variety of power tools including sanders and impact
drivers. This capability has enabled us to rapidly optimize our power tool products.
Product-Specific Technologies
We develop product-specific technologies to enhance user experience for a variety of power tools
and equipment.
• Battery powered riding vehicle technology. We developed an advanced battery powered riding
vehicle technology in-house, which primarily consists of (i) a low-profile structural design, (ii)
independent field oriented control (“FOC”) on brushless motors for driving and cutting, (iii)
a power system that is compatible with battery platforms and (iv) a dual motor for differential
drive and a distributed cooling system. With these technological features, our riding mowers
can provide end users with enhanced control, stability, safety and comfort. The module-based
design also makes it easier and cheaper to maintain and service the riding mower products.
BUSINESS
– 205 –

• Vibration reduction. Our power tool products, such as angle grinders, are equipped with our
patented technology on vibration reduction, which makes the operation of our tools more
comfortable by detecting, insulating and absorbing vibrations to minimize their impact on end
users’ main touchpoints on the tools.
• Dust reduction. Our power tool products, such as sanders, feature our patented technology for
dust reduction through a vortex duct vacuum that is washable and does not require installation
of filters.
PRODUCTION
Over more than 20 years, we have been building competitive advantages in our production
capabilities. Our production process is designed to promote high standards of quality while delivering the
ability to rapidly ramp up production of products on short timeframes to meet our customers’ needs. Our
design and manufacturing capabilities enable us to bring to market a wide range of power tools and OPE
products.
We focus on vertically integrating our production capabilities for several key reasons, including
acquiring advanced technologies, promoting product quality, ensuring production capacities and
controlling costs. For example, we design, develop and manufacture core parts and components such as
battery packs, motors, and printed circuit board assembly or PCBA, which generally have significant
impact on the quality of our products. We also source certain non-core parts, components or materials from
quality suppliers to optimize our cost structure.
Production Process
In order to maximize efficiency and ensure timeliness of product delivery, we employ a variety of
manufacturing technologies, including (i) production lines that combine automated and manual processes,
(ii) specialized automated production lines, as well as (iii) module-based, intelligent and flexible
production systems. We believe our manufacturing system enables us to produce a wide variety of power
tool and OPE products based on not only mass production, but also high-mix and low-volume orders in
an efficient and timely manner.
Our specialized engineering team is dedicated to continuously developing production and
management techniques with respect to component manufacturing and product assembly, with the
objective of promoting our manufacturing and production management capabilities, accelerating the
application of automated and digital technologies to production lines, and advancing implementation of
operation systems and smart factories within our proprietary CHERVON Production System. We apply
advanced industrial engineering and automated equipment design and manufacturing technologies to
achieve a high degree of balance and error prevention, reduce reliance on manual labor and improve
efficiency and quality. We have also applied principles and processes grounded in our CHERVON
Production System across our manufacturing activities.
BUSINESS
– 206 –
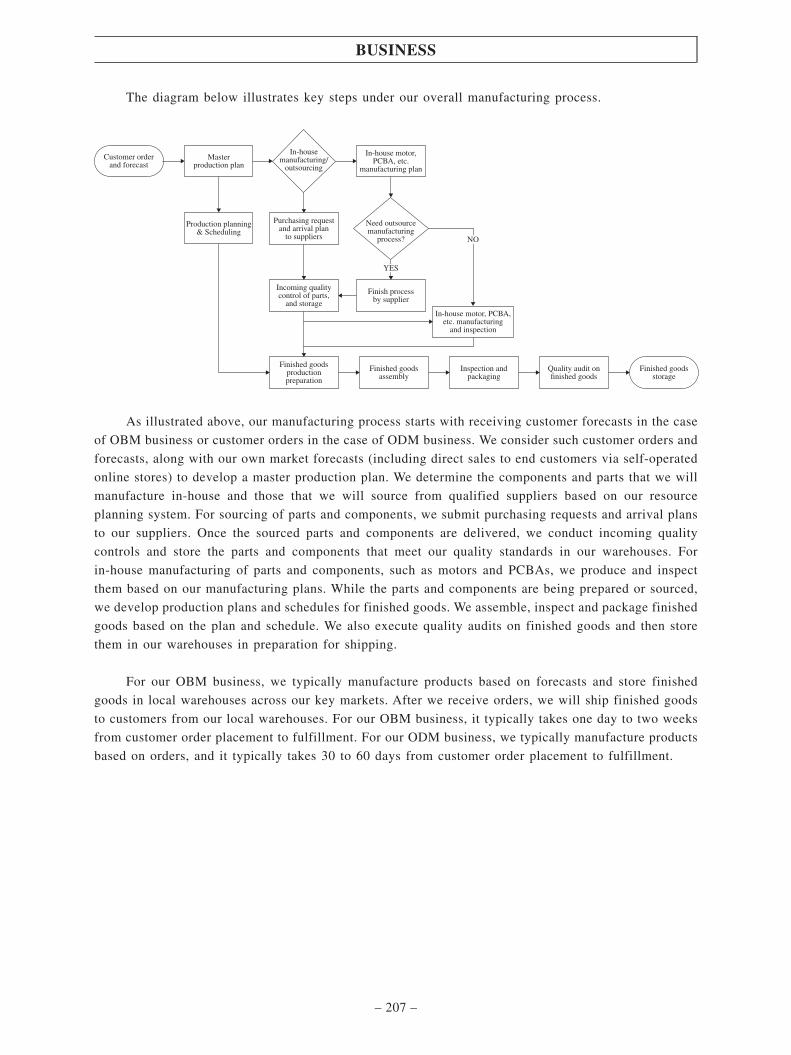
The diagram below illustrates key steps under our overall manufacturing process.
Customer orderand forecast
Masterproduction plan
In-housemanufacturing/
outsourcing
In-house motor,PCBA, etc.
manufacturing plan
Purchasing requestand arrival plan
to suppliers
Incoming qualitycontrol of parts,
and storageIn-house motor, PCBA,
etc. manufacturingand inspection
Finish processby supplier
Production planning& Scheduling
Finished goodsstorage
Finished goodsproductionpreparation
Finished goodsassembly
Inspection andpackaging
Quality audit onfinished goods
Need outsourcemanufacturing
process? NO
YES
As illustrated above, our manufacturing process starts with receiving customer forecasts in the case
of OBM business or customer orders in the case of ODM business. We consider such customer orders and
forecasts, along with our own market forecasts (including direct sales to end customers via self-operated
online stores) to develop a master production plan. We determine the components and parts that we will
manufacture in-house and those that we will source from qualified suppliers based on our resource
planning system. For sourcing of parts and components, we submit purchasing requests and arrival plans
to our suppliers. Once the sourced parts and components are delivered, we conduct incoming quality
controls and store the parts and components that meet our quality standards in our warehouses. For
in-house manufacturing of parts and components, such as motors and PCBAs, we produce and inspect
them based on our manufacturing plans. While the parts and components are being prepared or sourced,
we develop production plans and schedules for finished goods. We assemble, inspect and package finished
goods based on the plan and schedule. We also execute quality audits on finished goods and then store
them in our warehouses in preparation for shipping.
For our OBM business, we typically manufacture products based on forecasts and store finished
goods in local warehouses across our key markets. After we receive orders, we will ship finished goods
to customers from our local warehouses. For our OBM business, it typically takes one day to two weeks
from customer order placement to fulfillment. For our ODM business, we typically manufacture products
based on orders, and it typically takes 30 to 60 days from customer order placement to fulfillment.
BUSINESS
– 207 –

Machinery and Equipment
Our manufacturing facilities feature advanced equipment, which we believe is essential to promoting
product quality and cost competitiveness. Many of the machines and equipment that we operate require
minimal human operation, which allows us to reduce labor costs. We design, customize and integrate a
variety of advanced technologies into our production processes. Some of our critical production and
testing equipment were imported from countries such as Japan, Germany and the United States. We have
also internally developed many of the production technologies and equipment used in our production and
testing processes. Key machinery and equipment applied in our production processes are set forth below:
• For battery packs: An automated battery assembly production line that is equipped with
four-axle and six-axle robotic arms, advanced spot welding equipment and battery cell sorting
equipment, among other capabilities;
• For PCBA: A Surface Mount Technology (“SMT”) production line which is used for
assembling a variety of key components for our products and primarily consists of high-end
equipment imported from Japan and Germany;
• For motors: A brushless motor production line which is equipped with advanced technologies
such as robotic assembly, visual and audio-visual recognition and motor performance testing;
• For machining process: A horizontal machining center that is characterized by speed,efficiency and accuracy and primarily used for manufacturing components for our bench tools,as well as a high-precision Computer Numerical Control (“CNC”) lathe which is primarilyused for manufacturing product components that require high-grade engineering precision.
Set forth below are examples of our production lines and equipment.
Assembly Line for Riding Mowers
PCBA Production Line
BUSINESS
– 208 –

Existing Production Facilities
As of the Latest Practicable Date, we had production facilities with an annual production capacityof more than 22 million units, covering an aggregate floor area of approximately 183,000 sq.m.
During the Track Record Period, we operated four production facilities, namely CHERVONIndustrial Park (德朔工業園), CHERVON Green Power Industrial Park (泉峰新能源工業園), FLEXGermany Plant and CHERVON Vietnam Plant. The production facilities house 120 production lines in totaland have an aggregate annual production capacity of more than 16.8 million units, which offers us thescale needed to maintain stable supply to our key markets.
The table below sets forth information regarding our production facilities during the Track RecordPeriod.
Facility Name LocationGross floor
areaPrimaryproducts
Constructioncompletionyear/yearacquired
Designedannual
productioncapacity
(sq.m.) (units)
CHERVON Industrial Park(德朔工業園)
Nanjing, PRC 65,491 Power tools 2006 8,000,000
CHERVON GreenPower Industrial Park(泉峰新能源工業園)
Nanjing, PRC 80,752 OPE andpower tools
2015 8,070,000
CHERVON Vietnam Plant Binh Duong,Vietnam
6,750 OPE 2020 700,000
FLEX Germany Plant Steinheim,Germany
13,057 Power tools 2013 120,000
To meet increased market demand, we have also converted three leased properties into productionfacilities, which are described in more detail below. These facilities commenced mass production inAugust and September of 2021.
Facility LocationFloor area
for production Key products
Designedannual
productioncapacity Lease term
(sq.m.) (units)
Facility A Nanjing, PRC 11,055 Power tools andOPE products
3,744,000 July 11, 2021 toSeptember 10,2026
Facility B Nanjing, PRC 3,200 Power tools andOPE products
1,560,000 June 20, 2021 toJune 19, 2024
Facility C Nanjing, PRC 2,700 OPE products 30,000 March 1, 2021 toFebruary 29,2024
BUSINESS
– 209 –
We expect these production facilities will provide a combined additional annual production capacity
of approximately 5.3 million units, and they will serve as a transitional arrangement to supplement our
production capacity while our planned production facilities are under construction. In making the
conversions, we determined the portion of facilities that is suitable for production purposes, cleared the
premises and installed relevant equipment in accordance with safety standards. Such conversions complied
with the land use rights of the respective properties. We may move the machinery and equipment installed
at these facilities to our planned production facilities before they commence operation in 2023 and 2024.
Depending on the market demand, we may also use the production facilities for a longer period of time
and renew the relevant lease agreements.
Set forth below are some of the key features and capabilities of our existing production facilities.
Smart Factory. Grounded in advanced information systems, including Enterprise Resource Planning
(“ERP”) system, product life cycle management (“PLM”) system, Manufacturing Execution System
(“MES”), Supplier Relationship Management (“SRM”) and Warehouse Management System (“WMS”),
our facilities feature a high level of digitalization and automation that enables us to track, monitor, control,
and optimize the end-to-end production processes on a real-time basis, from planning and scheduling to
procurement and warehousing, and from production to finished goods shipping. Connected with MES and
production equipment, our electronic control system leverages automated equipment, a data service
platform and a signal data collection system to trace production and testing data for our products and
support real-time data processing. We have applied automated equipment and robotic technology to all key
production steps, such as the surface mount technology production line and the production lines for battery
packs and brushless motors. We have automated production lines, enabling automated assembly of
components and packaging of products.
Robotic Technologies. Our facilities are equipped with robotic technologies, such as automated
robotic arms, which are able to imitate the movement of human arms in executing a wide variety of tasks.
We believe these capabilities can promote efficiency and precision in our manufacturing process and
enhances consistency in the quality of our products. In addition, the use of robotic technologies can
enhance workplace safety and reduce labor costs by reducing human involvement in the manufacturing
process. We currently deploy over one hundred of robots and automated guided vehicles (“AGVs”) at our
production facilities. We plan to make further investments in robotic technology to enhance the level of
automation of our production process.
Automated Warehouse. Located at the center of CHERVON Green Power Industrial Park (泉峰新能源工業園), our 11-deck, fully automated warehouse helps us enhance productivity and efficiency by
providing for larger storage capacity – representing an increase in capacity by up to approximately 300
percent compared to conventional storage rack and forklift operations – and enabling timely delivery of
materials and finished goods to our production lines. As of September 30, 2021, we deployed AGVs and
other automated equipment at our warehouses. Our automated warehousing equipment is deeply integrated
with WMS, SRM, MES and ERP to achieve automation of our logistics tasks and enhance operational
efficiency. We were recognized as “Smart Logistics Facility of Jiangsu Province” (江蘇省智能物流車間)
in December 2021 by the Jiangsu provincial government.
BUSINESS
– 210 –

Set forth below are aerial views of our main China-based production facilities.
CHERVON Industrial Park (on the foreground) CHERVON Green Power Industrial Park
The CHERVON Green Power Industrial Park incorporates environmentally friendly designs such as
using solar power and ground source heat, recycling rain water and installing low-flow valves. Please refer
to the section headed “– Environmental, Social and Governance” of this prospectus for additional details.
BUSINESS
– 211 –

The
foll
owin
gta
ble
sets
fort
ha
sum
mar
yof
our
annu
alpr
oduc
tion
capa
city
inte
rms
ofde
sign
edpr
oduc
tion
capa
city
and
util
izat
ion
rate
sfo
rou
r
prod
ucti
onfa
cili
ties
for
the
year
san
dpe
riod
sin
dica
ted.
We
have
gene
rall
ym
aint
aine
dhi
ghut
iliz
atio
nra
tes
duri
ngth
eT
rack
Rec
ord
Per
iod.
The
CH
ER
VO
N
Vie
tnam
Pla
ntha
slo
wer
util
izat
ion
rate
sin
2020
and
the
six
mon
ths
ende
dJu
ne30
,20
21pr
imar
ily
due
toit
sne
wco
nstr
ucti
onan
dpr
oduc
tion
ram
p-up
peri
ods.
The
FL
EX
Ger
man
ypl
ant
had
alo
wer
util
izat
ion
rate
at61
%in
2020
prim
aril
ydu
eto
the
impa
ctof
the
CO
VID
-19
pand
emic
.The
FL
EX
Ger
man
y
Pla
ntw
ascl
osed
for
seve
ral
wee
ksin
Apr
il20
20,
and
grad
uall
yre
sum
edop
erat
ions
sinc
eM
ay20
20.
Des
igne
dpr
oduc
tion
capa
city
mea
nsth
epl
anne
d
max
imum
prod
ucti
onca
paci
tyat
the
rele
vant
faci
liti
esfo
rth
eye
aror
peri
od.
Dur
ing
the
Tra
ckR
ecor
dP
erio
d,th
ede
sign
edpr
oduc
tion
capa
city
atou
r
prod
ucti
onfa
cili
ties
incr
ease
dpr
imar
ily
due
toou
rin
vest
men
tsin
purc
hasi
ngad
diti
onal
mac
hine
san
deq
uipm
ent.
Year
ende
dDe
cem
ber3
1,Si
xm
onth
send
edJu
ne30
,
2018
2019
2020
2021
Desig
ned
Prod
uctio
nCa
pacit
y
Actu
alPr
oduc
tion
Volu
me
Utili
zatio
nRa
te(1
)
Desig
ned
Prod
uctio
nCa
pacit
y
Actu
alPr
oduc
tion
Volu
me
Utili
zatio
nRa
te(1
)
Desig
ned
Prod
uctio
nCa
pacit
y
Actu
alPr
oduc
tion
Volu
me
Utili
zatio
nRa
te(1
)
Desig
ned
Prod
uctio
nCa
pacit
y
Actu
alPr
oduc
tion
Volu
me
Utili
zatio
nRa
te(1
)
CHER
VON
Indu
strial
Park
(德朔工業園
)5,
252,
400
5,36
3,03
110
2%5,
995,
200
5,46
1,27
191
%7,
072,
000
6,77
5,60
896
%5,
062,
000
4,63
3,00
092
%CH
ERVO
NGr
een
Powe
r
Indu
strial
Park
(泉峰新能源工業園
)4,
196,
250
3,68
9,44
788
%4,
923,
750
4,36
9,00
089
%5,
768,
200
5,09
5,20
288
%4,
318,
000
4,16
8,00
097
%CH
ERVO
NVi
etnam
Plan
t–
––
––
–32
0,00
016
9,25
053
%50
4,00
032
4,00
064
%FL
EXGe
rman
yPl
ant
110,
000
109,
249
99%
110,
000
94,9
9986
%12
0,00
073
,180
61%
63,0
0050
,544
80%
Total
9,55
8,65
09,
161,
727
96%
11,0
28,9
509,
925,
270
90%
13,2
80,2
0012
,113,
240
91%
9,94
7,00
09,
175,
544
92%
Not
e:
(1)
The
util
izat
ion
rate
isca
lcul
ated
base
don
the
actu
alou
tput
for
the
rele
vant
peri
oddi
vide
dby
the
desi
gned
prod
ucti
onca
paci
tyfo
rth
ere
leva
ntpe
riod
.
BUSINESS
– 212 –
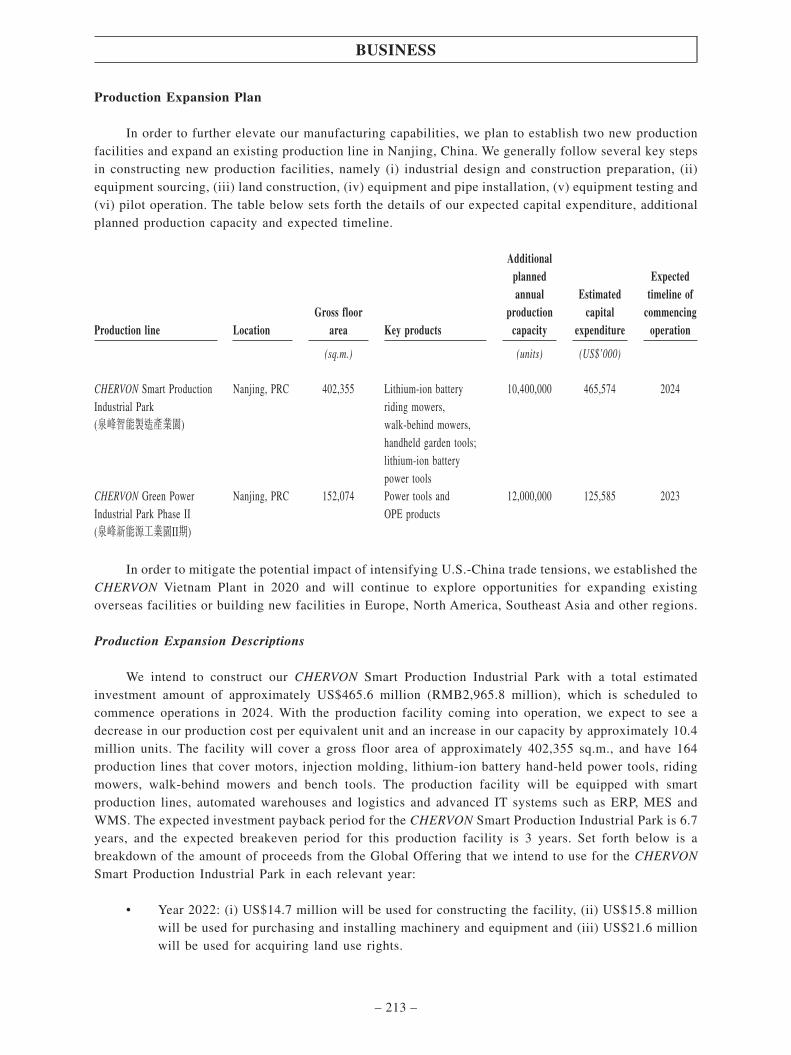
Production Expansion Plan
In order to further elevate our manufacturing capabilities, we plan to establish two new productionfacilities and expand an existing production line in Nanjing, China. We generally follow several key stepsin constructing new production facilities, namely (i) industrial design and construction preparation, (ii)equipment sourcing, (iii) land construction, (iv) equipment and pipe installation, (v) equipment testing and(vi) pilot operation. The table below sets forth the details of our expected capital expenditure, additionalplanned production capacity and expected timeline.
Production line LocationGross floor
area Key products
Additionalplannedannual
productioncapacity
Estimatedcapital
expenditure
Expectedtimeline of
commencingoperation
(sq.m.) (units) (US$’000)
CHERVON Smart ProductionIndustrial Park(泉峰智能製造產業園)
Nanjing, PRC 402,355 Lithium-ion batteryriding mowers,walk-behind mowers,handheld garden tools;lithium-ion batterypower tools
10,400,000 465,574 2024
CHERVON Green PowerIndustrial Park Phase II(泉峰新能源工業園II期)
Nanjing, PRC 152,074 Power tools andOPE products
12,000,000 125,585 2023
In order to mitigate the potential impact of intensifying U.S.-China trade tensions, we established theCHERVON Vietnam Plant in 2020 and will continue to explore opportunities for expanding existingoverseas facilities or building new facilities in Europe, North America, Southeast Asia and other regions.
Production Expansion Descriptions
We intend to construct our CHERVON Smart Production Industrial Park with a total estimatedinvestment amount of approximately US$465.6 million (RMB2,965.8 million), which is scheduled tocommence operations in 2024. With the production facility coming into operation, we expect to see adecrease in our production cost per equivalent unit and an increase in our capacity by approximately 10.4million units. The facility will cover a gross floor area of approximately 402,355 sq.m., and have 164production lines that cover motors, injection molding, lithium-ion battery hand-held power tools, ridingmowers, walk-behind mowers and bench tools. The production facility will be equipped with smartproduction lines, automated warehouses and logistics and advanced IT systems such as ERP, MES andWMS. The expected investment payback period for the CHERVON Smart Production Industrial Park is 6.7years, and the expected breakeven period for this production facility is 3 years. Set forth below is abreakdown of the amount of proceeds from the Global Offering that we intend to use for the CHERVONSmart Production Industrial Park in each relevant year:
• Year 2022: (i) US$14.7 million will be used for constructing the facility, (ii) US$15.8 millionwill be used for purchasing and installing machinery and equipment and (iii) US$21.6 millionwill be used for acquiring land use rights.
BUSINESS
– 213 –

• Year 2023: (i) US$29.4 million will be used for constructing the facility and (ii) US$31.6million will be used for purchasing and installing machinery and equipment.
• Year 2024: (i) US$55.6 million will be used for constructing the facility and (ii) US$36.7million will be used for purchasing and installing machinery and equipment.
CHERVON Green Power Industrial Park Phase II will cover a gross floor area of approximately152,074 sq.m. This facility will cost an estimated total of approximately US$125.6 million (RMB800.0million), which is scheduled to commence operations in 2023. This facility is expected to further increaseour production capacity by approximately 12.0 million units on an annual basis. The type of products thatCHERVON Green Power Industrial Park Phase II will focus on are power tools and OPE products. Theexpected investment payback period for the CHERVON Green Power Industrial Park Phase II is 7.4 years,and the expected breakeven period for this production facility is 4 years. Set forth below is a breakdownof the amount of proceeds from the Global Offering that we intend to use for the CHERVON Green PowerIndustrial Park Phase II in each relevant year:
• Year 2022: (i) US$11.5 million will be used for constructing the facility and (ii) US$7.0 millionwill be used for purchasing and installing machinery and equipment.
• Year 2023: (i) US$5.4 million will be used for constructing the facility and (ii) US$5.3 millionwill be used for purchasing and installing machinery and equipment.
The existing production line expansion primarily involves expanding floor areas for production at anexisting facility and purchasing additional, and relocating certain existing, machines and equipment toincrease production capacity. Such expansion complied with the land use rights of the respective property.The estimated investment for this expansion is approximately RMB14.0 million (US$2.2 million).
Reasons for Production Expansion
We develop production expansion plans based on, among other things, (i) estimated supply and
demand for relevant products; (ii) prevailing and anticipated prices for relevant products; (iii) utilization
of existing manufacturing facilities and feasibility for expanding existing facilities; (iv) estimated cost of
development; and (v) availability and cost of capital resources. Although our customers’ purchases are
made on a purchase order basis, we have partnered with our existing customers from product design
through product development to the final delivery of our products. We have collaborated with them on
product planning and developed long-term relationships. Our production expansion plan is primarily based
on our understandings of business plans, product planning, potential demands for existing and new
products and expected orders from these customers in the coming years. Such close partnerships and
communications enable us to anticipate, identify and react to the market trends and understand customers’
demands so as to facilitate our overall strategy formulation and planning, and to capture growth
opportunities in different segments of the market.
We believe that there will be sufficient market demand to support our expansion plan based on
several reasons, including (i) the global cordless power tool market and global cordless OPE market by
revenue are estimated by Frost & Sullivan to increase at a CAGR of 9.9% and 9.0% from 2020 to 2025,
respectively; (ii) during the Track Record Period, our revenue for power tools grew at a CAGR of 16.9%
and our revenue for OPE products grew at a CAGR of 62.8% from 2018 to 2020; and (iii) the COVID-19
pandemic has not had a material adverse effect on the demand from our customers and end users. With the
BUSINESS
– 214 –
large scale of our new production bases, we will be able to fulfill customer demand and the needs of our
rapid business growth. There is no guarantee that any of the expansion projects will proceed as planned.
We may also invest in additional expansion projects as we continue to grow our business worldwide.
Maintenance
We carry out inspections and maintenance at our production facilities. Each of our major equipment
or machinery will be periodically maintained and serviced based on pre-defined schedules. We have
developed and periodically update internal procedures at our production facilities according to the
characteristics and requirements of the particular equipment or machinery in order to ensure they function
properly. During the Track Record Period and up to the Latest Practicable Date, we did not experience any
material or prolonged suspensions of operations due to machinery, equipment or other facility failures.
Delivery and Transportation
We designed our logistics network to ensure the timely and orderly delivery of our products. We
distribute products from our warehouses to customers around the world. We have outsourced our domestic
and international product transportation to independent third-party logistics service providers. Our
products are usually delivered by road to our customers in China or by sea and air to our overseas
customers. We have long-term relationships with our logistic service providers, including qualified
shipping companies. We assess our logistics service providers based on the frequency of on-time delivery,
transportation capability, service coverage, financial strength, pricing and overall service quality.
Typically, finished products are transported by the chosen third-party logistics service providers to the
distributors and retailers after quality inspection and packaging. We may also use an expedited process for
scenarios with high-efficiency shipment requirement such as major promotion events in order to meet the
increasing sales volume in short period of time to ensure the timeliness of delivery to our customers. Our
shipping arrangement vary among customers. In the case of FOB arrangement, we pay for the
transportation of products to the port of shipment, and the customer bears the cost of the remainder of the
shipping process. In other cases, we are responsible for the entire cost of shipping to the customer’s
warehouse. We are liable for shipping delays that occur in the part of shipping process for which we bear
the cost.
The salient terms of our agreements with logistic service providers are set forth below:
• Transportation of goods. The logistic service provider is responsible for timely and safe
shipments of goods to destinations specified by us.
• Shipping cost. The cost for each shipment is determined based on the specifications in the
relevant shipping order, such as quantity of goods, manner of transportation and destination of
the shipment.
• Payment terms. We are typically required to pay the logistic service provider within 60 days
after the goods are shipped from us.
• Duration and termination. The agreements are typically of one-year term. Unless either party
terminates the agreement in writing prior to the expiration of the previous term, the agreement
is automatically renewed for an additional one-year term.
BUSINESS
– 215 –

• Liability for damages. The logistic service provider is liable for damages to goods that occur
during the transportation process.
• Insurance. We typically bear the cost of shipping insurance.
During the Track Record Period and up to the Latest Practicable Date, we had experienced certain
delays due to the impact of COVID-19 on the global transportation network. While such delays affected
our production schedule from time to time, they did not result in a material adverse impact on our business
operations or financial performance, as evidenced by our growth in revenue and gross profit during the
Track Record Period and in the third quarter of 2021. Please refer to the section headed “Risk Factors –
Risks Relating to Our Industry and Business – Our business depends on third-party suppliers to meet our
requirements for high-quality production and timely delivery of raw materials and components. Significant
disruption in their supply or increase in their prices may materially and negatively affect our business.”
in this prospectus for additional details. During the Track Record Period and up to the Latest Practicable
Date, we had not experienced any significant poor handling of goods or any major incidents of loss or theft
that materially and adversely affected our business operations.
SALES, MARKETING AND DISTRIBUTION
During the Track Record Period, our products were sold in more than 100 countries and regions,primarily in North America, Europe and Asia Pacific, including China. The table below sets out thebreakdown of our revenue by destination of shipment, each expressed in an absolute amount as apercentage of our total revenue, for the periods indicated.
Countries/Regions Year ended December 31, Six months ended June 30,
2018 2019 2020 2020 2021
US$ % US$ % US$ % US$ % US$ %(Unaudited)
(in thousands, except for percentages)
North America 383,675 55.6 506,900 60.1 798,913 66.4 321,707 62.5 572,683 65.9Europe 232,995 33.7 257,821 30.6 297,260 24.8 140,757 27.5 207,752 23.9China 56,564 8.2 61,540 7.3 69,295 5.8 38,820 7.5 61,378 7.1ROW 17,464 2.5 17,317 2.0 35,434 3.0 13,075 2.5 26,984 3.1
Total revenue 690,698 100.0 843,578 100.0 1,200,902 100.0 514,359 100.0 868,797 100.0
Multi-Channel Sales and Distribution Network for Our Branded Products
Overview
We have established robust multi-channel sales and distribution networks that are tailored to therespective markets. Our sales and distribution network for our branded products consists of retailers,distributors and pure-play e-commerce channels, as illustrated in the diagram below. Retailers are thosethat purchase products from us and typically sell them directly to end-users. By contrast, distributorspurchase products from us and distribute them to other third parties, which may consist of other retailersor sub-distributors, who then on-sell the products to end-users.
BUSINESS
– 216 –

Our Company
Retailers DistributorsPure-play e-commerce
channels
Other third parties(1)
Our end-users
Note:
(1) Other third parties consist of retailers and sub-distributors; we typically do not establish direct contractual relationships withsuch other third parties.
We develop and manage our sales and distribution network on a region-by-region basis and adjust
our strategy for each brand based on retail landscape and business norms in that particular region. For
example, in North America, we sell our products primarily through leading national retailers including
home centers and mass-market retailers, while in China, we sell our products primarily through a large and
growing network of qualified distributors. Our products are featured in the sales channels that are top of
mind for local consumers. We are constantly evaluating our existing channels and exploring new channels
to optimize our sales and distribution network. We seek to avoid competition among sales channels
primarily by monitoring retail prices and coordinating promotional activities across sales channels.
The following table sets forth our revenue breakdown by sales and distribution channels in anabsolute amount and as percentage of our revenue for the years and periods indicated.
Year ended December 31, Six months ended June 30,
2018 2019 2020 2020 2021
US$ % US$ % US$ % US$ % US$ %(unaudited)
(in thousands, except for percentages)
Retailers 326,756 47.3 357,330 42.4 599,789 49.9 269,372 52.4 433,223 49.9Distributors 85,127 12.3 84,519 10.0 95,991 8.0 53,470 10.4 116,633 13.4Pure-playe-commercechannels 19,955 2.9 23,295 2.8 50,533 4.2 13,417 2.6 41,290 4.7
Total for OBMbusiness 431,838 62.5 465,144 55.2 746,313 62.1 336,259 65.4 591,146 68.0
BUSINESS
– 217 –
Retailers
Our retailers network comprises of national retailers and local retailers. National retailers consistmostly of home centers or mass market retailers that operate a large network of retail stores and may alsooperate online channels, such as Lowe’s, Walmart, ACE Hardware and Kingfisher. National retailers,which are typically our major customers, are of critical importance to our growth strategy as theirsubstantial and ongoing needs for our products enable us to develop and execute multi-year strategic plansinvolving product development and expansion of our production capacities. We collaborate with nationalretailers by providing products based on insights into the practical needs of end users. Compared tonational retailers, a local retailer typically operates a single retail store or a smaller number of retail storesthat target a local market and sell our products directly to end users. We have devoted resources to thedevelopment of logistics, warehouses and CRM systems to enhance our abilities to engage with andsupport a wider network of local retailers. In the years ended December 31, 2018, 2019 and 2020 and sixmonths ended June 30, 2020 and 2021, our revenue generated from sales to retailers amounted toUS$326.8 million, US$357.3 million, US$599.8 million, US$269.4 million and US$433.2 million,respectively, accounting for 47.3%, 42.4%, 49.9%, 52.4% and 49.9%, respectively, of our total revenue.
Distributors
We have been increasing our penetration of regional markets and accumulating valuable experienceand local resources by maintaining long-term cooperation with key distributors. We believe thatcooperating with distributors is a cost-effective way to reach a diverse customer base in our targetgeographic markets. For each geographical region, we choose a limited number of qualified distributorsto distribute to the local retailers in the respective regions and prohibit cross-region sales in order tomitigate the potential cannibalization among distributors. In the years ended December 31, 2018, 2019 and2020 and six months ended June 30, 2020 and 2021, our revenue generated from sales to distributorsamounted to US$85.1 million, US$84.5 million, US$96.0 million, US$53.5 million and US$116.6 million,respectively, accounting for 12.3%, 10.0%, 8.0%, 10.4% and 13.4%, respectively, of our total revenue. Webelieve that, and Frost & Sullivan, our Industry Consultant, is also of the view that, our distribution modelis consistent with market practice in the global power tool and OPE industry.
(i) Selection and Assessment Criteria for Our Distributors
We select our distributors based on a number of criteria, including, among others, theirexperience, marketing capabilities and financial condition. The table below sets forth the number ofdistributors for our branded products for the years and periods indicated:
Year Ended December 31,
January 1, 2021to the LatestPracticable
Date2018 2019 2020
Number of distributorsAt the start of the period 409 415 439 348Increase in distributors(1) 37 149 50 22Decrease in distributors(2) (31) (125) (141) (7)
Total at the end of the period 415 439 348 363
BUSINESS
– 218 –
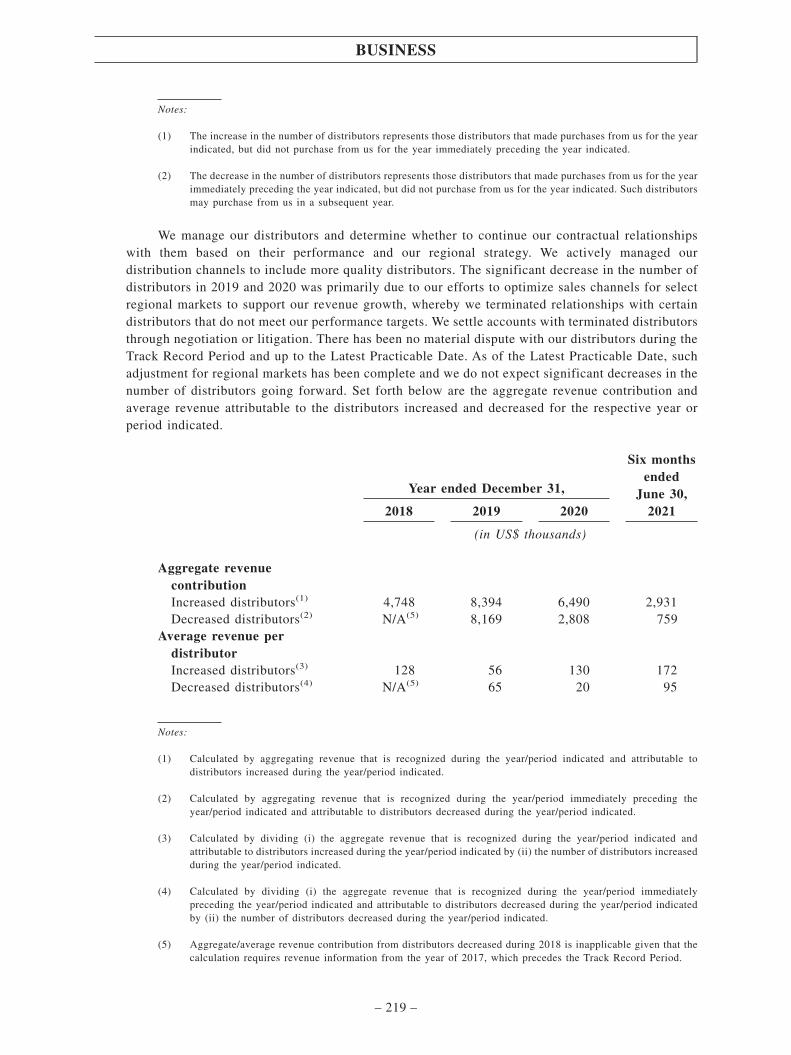
Notes:
(1) The increase in the number of distributors represents those distributors that made purchases from us for the yearindicated, but did not purchase from us for the year immediately preceding the year indicated.
(2) The decrease in the number of distributors represents those distributors that made purchases from us for the yearimmediately preceding the year indicated, but did not purchase from us for the year indicated. Such distributorsmay purchase from us in a subsequent year.
We manage our distributors and determine whether to continue our contractual relationshipswith them based on their performance and our regional strategy. We actively managed ourdistribution channels to include more quality distributors. The significant decrease in the number ofdistributors in 2019 and 2020 was primarily due to our efforts to optimize sales channels for selectregional markets to support our revenue growth, whereby we terminated relationships with certaindistributors that do not meet our performance targets. We settle accounts with terminated distributorsthrough negotiation or litigation. There has been no material dispute with our distributors during theTrack Record Period and up to the Latest Practicable Date. As of the Latest Practicable Date, suchadjustment for regional markets has been complete and we do not expect significant decreases in thenumber of distributors going forward. Set forth below are the aggregate revenue contribution andaverage revenue attributable to the distributors increased and decreased for the respective year orperiod indicated.
Year ended December 31,
Six monthsended
June 30,20212018 2019 2020
(in US$ thousands)
Aggregate revenuecontributionIncreased distributors(1) 4,748 8,394 6,490 2,931Decreased distributors(2) N/A(5) 8,169 2,808 759
Average revenue perdistributorIncreased distributors(3) 128 56 130 172Decreased distributors(4) N/A(5) 65 20 95
Notes:
(1) Calculated by aggregating revenue that is recognized during the year/period indicated and attributable todistributors increased during the year/period indicated.
(2) Calculated by aggregating revenue that is recognized during the year/period immediately preceding theyear/period indicated and attributable to distributors decreased during the year/period indicated.
(3) Calculated by dividing (i) the aggregate revenue that is recognized during the year/period indicated andattributable to distributors increased during the year/period indicated by (ii) the number of distributors increasedduring the year/period indicated.
(4) Calculated by dividing (i) the aggregate revenue that is recognized during the year/period immediatelypreceding the year/period indicated and attributable to distributors decreased during the year/period indicatedby (ii) the number of distributors decreased during the year/period indicated.
(5) Aggregate/average revenue contribution from distributors decreased during 2018 is inapplicable given that thecalculation requires revenue information from the year of 2017, which precedes the Track Record Period.
BUSINESS
– 219 –
As a result of our strategic management of our distribution channels, our revenue attributable
to distributors grew 12.8% from US$85.1 million in the year ended December 31, 2018 to US$96.0
million in the year ended December 31, 2020, and the number of distributors declined from 415 to
348 over the same period. Going forward, we will continue to seek cooperation with quality
distributors to drive our revenue growth.
(ii) Arrangements with Our Distributors
We enter into distributorship agreements with our distributors. They directly purchase products
from us and are our customers, who on-sell our products to other third parties including
sub-distributors and local retailers. The sales to distributors are direct sales as the distributors
purchase products from us and maintain their own inventories, and we generally do not permit
product returns except for quality issues. Our distributors may further enter into agreements with
their sub-distributors, and we normally do not enter into distributorship agreements or directly
establish relationships with the sub-distributors. Accordingly, we generally have limited control over
the sub-distributors and we rely on our distributors to manage and control the sub-distributors. We
control and manage our distributors primarily through our contractual relationships with them. In
limited circumstances such as promotional activities, we take the opportunity to communicate with
other third parties including sub-contractors and local retailers to help them better understand our
products.
We control channel stuffing risks among our distributors through the distributorship
agreements and relevant management policies including (i) establishing product return policies and
(ii) monitoring levels of inventories held by distributors, as further set forth below. To mitigate
potential stuffing in the channel, we adhere to our product return policies and generally do not allow
product return for reasons other than product quality issues. We also generally do not buy back our
products except in limited circumstances such as bankruptcies or liquidations of the distributors’
business or termination of distribution agreements with the distributors. We generally provide
recommendations on pricing policies as well as support on sales and marketing to our distributors.
For local retailers who directly purchase our products from our distributors, we normally do not
establish any direct relationship with them and have no control over them. In limited circumstances,
we provide certain sales incentives, such as rewards in the form of products or shelf racks, to local
retailers. They are not required to sell our products exclusively, and we rely on our distributors to
manage them. We consider local retailers as an important channel for reaching a wider group of end
users.
The following sets forth the key terms of our distributorship agreements that generally apply
across regions:
• Credit limits and terms. We may provide credit to distributors with limits and terms
determined based the creditworthiness of the distributors, which generally range from 30
to 90 days. Such limits and terms will be set forth in the distributorship agreements.
• Indicative purchase targets. We may set indicative purchase targets for distributors and
may adjust the distributor relationship if such purchase targets are not fulfilled, such as
by changing the wholesale pricing or authorized area of distribution. There are no
penalties for failure to meet the indicative purchase targets.
BUSINESS
– 220 –

• Sub-distributors. The distributors are allowed to engage sub-distributors, and are required
to manage their sub-distributors. If sub-distributors are disqualified, distributors are
required to recover all inventories from such disqualified sub-distributors or undertake
joint liabilities. A distributor may be required to notify our Company prior to engaging
sub-distributors.
• Trademarks. The distributors and sub-distributors are not allowed to use our trademarks
or logos unless otherwise authorized by us.
• Product returns. Other than return of goods due to quality issues, we generally do not
permit return or exchange of the products we sell to the distributors. As confirmed by our
Industry Consultant, our product return policies with our distributors are in line with
industry practice.
• Prohibition on cross-region sales. The distributors are allowed to sell in designated
region only and cross-region sale is forbidden.
• Contract term. The distributorship agreement generally has an initial term of one year,
and is typically renewed annually unless terminated by either party.
• Termination. Subject to limitations imposed by local laws, either party can terminate the
distributorship agreement at will upon 30 days’ notice in writing, and we can terminate
the distributorship agreement immediately if we find the distributors are in breach of their
obligations and fail to make adequate rectification measures.
• Breach of contracts and damages. If the distributors fail to sell our products in the manner
required by us, the distributors are accountable for such breach of contracts. If a
distributor breaches the distributorship agreement, we are entitled to demand liquidation
damages and other compensations for our losses.
(iii) Sales Rebates
We may provide retrospective sales rebates to our customers once their value of products
purchased from us during the period exceeds a pre-set target specified in the sales agreement. While
practices may vary by region, rebates are typically offset against amounts payable by such
customers. In the years ended December 31, 2018, 2019, 2020 and the six months ended June 30,
2020 and 2021, the amounts of sales rebates were US$48.5 million, US$57.0 million, US$87.6
million, US$42.2 million and US$47.1 million, respectively. During the Track Record Period,
approximately 20% of our customers were granted sales rebates.
(iv) Relationship with Our Distributors
To the best of our knowledge, all of our distributors are Independent Third Parties. The
distributors are not connected to any of the Company, its subsidiaries, their shareholders, directors,
senior management or any of their respective associates. To our best knowledge, besides the ordinary
course distribution arrangement with us, there is no other relationship between the distributors and
each of our Company, our subsidiaries, our shareholders, directors or senior management or any of
their respective associates. Our relationship with our distributors is in essence a buyer and seller
BUSINESS
– 221 –

relationship. They are our customers and they do not act on our behalf when dealing with their
respective end users, and we have no management control over their daily operations. Our
distributors place orders with us when and to the extent they deem appropriate. In general, our
relationships with distributors have remained stable.
To monitor the performance of our distributors, our internal policy includes requiring our sales
representatives to carry out random site visits at distributors, monitor sales performance and pricing,
as well as marketing activities of our distributors. We also regularly visit our distributors to check
the inventory levels and to further mitigate the risk of inventory accumulation born by our
distributors.
Our distributorship agreements explicitly prohibit cross-region sales by distributors. If a
distributor breaches such restriction, we have the right to terminate the relevant distributorship
agreement and/or sue the distributor for damages. In some instances, we also manage potential
competition among distributors by entering into tri-party agreements with distributors and
sub-distributors.
During the Track Record Period and up to the Latest Practicable Date, to the best of our
knowledge there was no material non-compliance with the terms and conditions of our agreements
with our distributors. See the section headed “Risk Factors – Risks Relating to Our Industry and
Business – We have limited control over our distributors, and we cannot assure you that our
distributors will continuously operate their distribution business in compliance with relevant laws
and regulations or their obligations under the applicable distribution agreement.” in this prospectus
for more details.
Pure-play E-commerce Channels
E-commerce platforms have become an important and fast-growing sales channel due to its
increasing penetration of the power tool and equipment markets, according to the Frost & Sullivan Report.
Our pure-play e-commerce channels primarily include (i) leading e-commerce platforms that purchase our
products and on-sell to customers, such as Amazon.com and (ii) our self-operated online stores made
available through major e-commerce platforms in China, such as Tmall and JD.com. In the years ended
December 31, 2018, 2019 and 2020 and six months ended June 30, 2020 and 2021, our revenue generated
from sales to pure-play e-commerce platforms amounted to US$20.0 million, US$23.3 million, US$50.5
million, US$13.4 million and US$41.3 million, respectively, accounting for 2.9%, 2.8%, 4.2%, 2.6% and
4.7%, respectively, of our total revenue.
BUSINESS
– 222 –

Revenue Breakdown
The following table sets forth the breakdown of our revenue from OBM business by destination of
shipment and sales and distribution channel, each expressed in an absolute amount and as a percentage of
total revenue for the years and periods indicated:
Year ended December 31, Six months ended June 30,
2018 2019 2020 2020 2021
US$ % US$ % US$ % US$ % US$ %(Unaudited)
(in thousands, except for percentages)
North America 258,504 37.4 286,478 34.0 548,787 45.7 236,420 46.0 424,423 48.8Retailers 237,222 34.3 261,857 31.1 494,845 41.2 221,872 43.2 378,301 43.5Distributors 6,019 0.9 6,670 0.8 9,664 0.8 3,694 0.7 9,246 1.1Pure-play
e-commerce
platform 15,263 2.2 17,951 2.1 44,278 3.7 10,854 2.1 36,876 4.2Europe 126,069 18.3 127,832 15.2 135,761 11.3 66,844 13.0 107,839 12.4
Retailers 79,776 11.6 85,150 10.1 91,549 7.6 43,033 8.4 44,328 5.1Distributors 45,228 6.5 41,827 5.0 43,434 3.6 23,427 4.5 62,590 7.2Pure-play
e-commerce
platform 1,065 0.2 855 0.1 778 0.1 384 0.1 921 0.1China(1) 39,391 5.7 43,209 5.1 51,847 4.3 30,017 5.8 50,987 5.9ROW(2) 7,874 1.1 7,625 0.9 9,918 0.8 2,978 0.6 7,897 0.9
Total revenue fromOBM business 431,838 62.5 465,144 55.2 746,313 62.1 336,259 65.4 591,146 68.0
Notes:
(1) In China, we primarily sell our products to distributors. We also offer our products through pure-play e-commerce channels.
(2) In other markets to which we distribute our products, such as Australia and New Zealand, we primarily sell our products toretailers. Our practices may vary in different markets subject to the local conditions.
BUSINESS
– 223 –

North America
In North America, we sell our products primarily through national retailers, such as Lowe’s and
Walmart. To a lesser extent we sell our products through local retailers. In addition, we sell our products
through pure-play e-commerce platforms such as Amazon.com. We monitor the inventory levels of national
retailers on a regular basis.
In North America, we select our retailers based on various factors such as market share, market
positioning, abilities to reach various consumer population, and reputation of the customers. To maximize
the reach of our products to consumers, we strategically cover various major offline and online channels
that have leading market shares and reputation among consumers, to ensure that our products are able to
realize broad coverage of the consumer population. We believe that such practice is in line with general
market practice and is consistent with our general sales strategies.
We have established stable business relationship with our retailers and other customers, and we
believe that recent developments in China’s relationships with countries such as the United States have not
materially and adversely affected our ability to carry out our business with customers or business partners
in North America. We have maintained good collaboration with them through various kinds of branding,
sales, marketing and promotion activities, which not only enhanced the sale of our products, but also
promoted our brand recognition among the consumers covering various demographical groups in North
America.
We enter into framework agreements with our retailers, which usually provide, among other things,
product quality warranty, product return mechanism and credit term.
• Duration and termination. Our retailer agreement typically provides for an initial term of two
years and automatically renews for successive periods of one year unless either party gives the
other written notice to the contrary at least 90 days prior to the scheduled date of renewal. The
agreements may generally be terminated upon mutual consent.
• Sales and pricing policies. We sell our products at the prices in effect on current price list or
as otherwise agreed between the parties.
• Quality and return. Our retailer may return products for credit or refund if (i) the product is
defective upon delivery to the retailer, (ii) we initiate a product recall, (iii) the terms of
applicable warranty authorize such returns or (iv) we provide prior written approval for such
returns. A retailer agreement may also provide for a return allowance, which allows the retailer
to recover the amount of actual returns received by the retailer that exceed such allowance.
• Minimum purchase requirements. We typically do not set minimum purchase requirements forretailers.
• Payment and credit terms. Retailers will pay amounts due pursuant to the credit terms agreedby both parties.
BUSINESS
– 224 –

Our business is subject to the risk of U.S.-China trade tensions. Nonetheless, our products do not
involve sensitive technologies or functions, and we have no reason to believe that the U.S. government
would impose import restrictions on our products. Furthermore, as we are a provider of power tools and
OPE products, we do not believe that our business would adversely affect the national interests of the
United States, and therefore, we do not expect that the U.S. government would impose export restrictions
on the raw materials or components sourced by us. In the event that the U.S. government imposes such
export restrictions, we believe we will be able to find suitable alternative suppliers at reasonable costs and
in a timely manner. Therefore, the Directors are of the view that the U.S.-China trade tension are unlikely
to impede our ability to carry out our business with customers or collaboration with partners in North
America, or to have a material adverse impact on our operations and financial performance in the near
future. Having regard to the due diligence conducted, nothing has come to the attention of the Joint
Sponsors which would cast doubt on the Director’s view that the U.S.-China trade tension is not likely to
impede the Company’s ability to carry out its business with customers/collaboration partners in North
America or its operations and financial performance in the near future.
As contingency measures to mitigate the potential impact of intensifying U.S.-China trade tensions,
we will continue to explore expanding sales channels in Europe, China, Australia and other markets. In
addition, we have recently established companies in the United Kingdom and New Zealand in order to
better serve local customers and markets. We may consider expanding the production capacity in our
Vietnam-based facility, and we have also undertaken feasibility studies over establishing additional
factories in North America and Europe. Furthermore, we sought to mitigate the impact of the costs
associated with U.S. tariffs primarily by (i) promoting new products with higher margins that partially
cover the tariff costs, (ii) sharing tariff costs with customers or suppliers, and (iii) raising selling prices
of products subject to tariffs where appropriate, taking into consideration factors such as foreign exchange
rates and raw material prices. We share tariff costs with customers and suppliers only through contractual
terms that are mutually agreed upon with such customers or suppliers. We negotiated with such customers
or suppliers in good faith in relation to the tariff costs. Accordingly, we believe the sharing of tariff costs
with customers or suppliers has not impeded, and we do not expect it to impede, our ability to carry out
business with our customers or suppliers. However, we cannot provide assurances that these efforts will
be effective or achieve desired outcome. If our contingency measures to mitigate the potential impact of
intensifying U.S.-China trade tensions are not effective or do not achieve desired outcome, our business
operations and financial performance may be materially and adversely affected. Please refer to the section
headed “Risk Factors – We may not be successful in implementing our future business plans and strategies,
and if we are unable to execute them effectively and efficiently, our business, financial conditions, results
of operations and growth prospects may be materially and adversely affected” in this prospectus for
additional details. During the Track Record Period, the absolute amounts of our sales to regions outside
of North America have increased from US$307.0 million in 2018 to US$402.0 million in 2020,
representing a CAGR of 14.4%. From 2018 to 2020, the CAGR of sales to countries outside the United
States is 19.9%.
BUSINESS
– 225 –

The table below sets forth the number of distributors in North America for our branded products for
the years/period indicated:
Year Ended December 31,
January 1, 2021to the LatestPracticable
Date2018 2019 2020
Number of distributorsAt the start of the period 31 31 32 26Increase in distributors(1) – 5 – 3Decrease in distributors(2) – (4) (6) (3)
Total at the end of the period 31 32 26 26
Notes:
(1) The increase in the number of distributors represents those distributors that made purchases from us for the yearindicated, but did not purchase from us for the year immediately preceding the year indicated.
(2) The decrease in the number of distributors represents those distributors that made purchases from us for the yearimmediately preceding the year indicated, but did not purchase from us for the year indicated. Such distributors maypurchase from us in a subsequent year.
The table below sets out the breakdown of our revenue from major countries in North America by
destination of shipment, each expressed in an absolute amount as a percentage of our total revenue, for
the years and periods indicated.
Countries Year ended December 31, Six months ended June 30,
2018 2019 2020 2020 2021
US$ % US$ % US$ % US$ % US$ %
(Unaudited)(in thousands, except for percentages)
United States 376,363 54.5 466,792 55.3 749,047 62.3 299,762 58.3 538,003 61.9Canada 7,312 1.1 40,108 4.8 49,866 4.1 21,945 4.2 34,680 4.0Total for NorthAmerica 383,675 55.6 506,900 60.1 798,913 66.4 321,707 62.5 572,683 65.9
BUSINESS
– 226 –
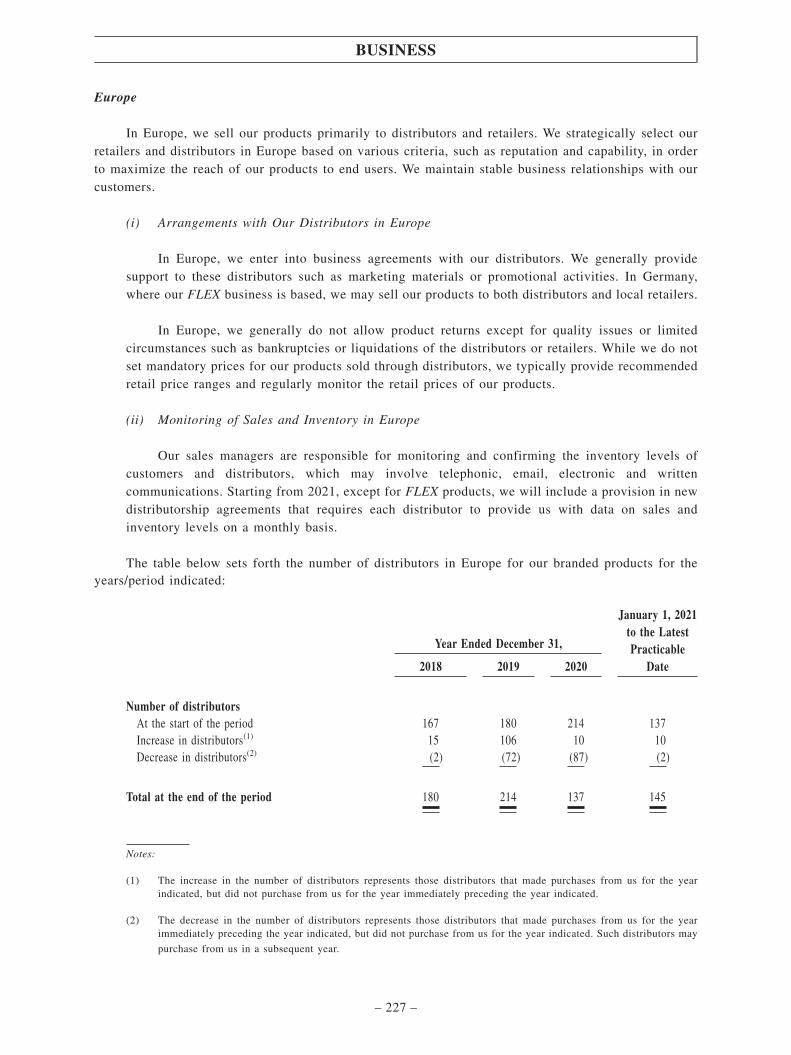
Europe
In Europe, we sell our products primarily to distributors and retailers. We strategically select ourretailers and distributors in Europe based on various criteria, such as reputation and capability, in orderto maximize the reach of our products to end users. We maintain stable business relationships with ourcustomers.
(i) Arrangements with Our Distributors in Europe
In Europe, we enter into business agreements with our distributors. We generally providesupport to these distributors such as marketing materials or promotional activities. In Germany,where our FLEX business is based, we may sell our products to both distributors and local retailers.
In Europe, we generally do not allow product returns except for quality issues or limitedcircumstances such as bankruptcies or liquidations of the distributors or retailers. While we do notset mandatory prices for our products sold through distributors, we typically provide recommendedretail price ranges and regularly monitor the retail prices of our products.
(ii) Monitoring of Sales and Inventory in Europe
Our sales managers are responsible for monitoring and confirming the inventory levels ofcustomers and distributors, which may involve telephonic, email, electronic and writtencommunications. Starting from 2021, except for FLEX products, we will include a provision in newdistributorship agreements that requires each distributor to provide us with data on sales andinventory levels on a monthly basis.
The table below sets forth the number of distributors in Europe for our branded products for theyears/period indicated:
Year Ended December 31,
January 1, 2021to the LatestPracticable
Date2018 2019 2020
Number of distributorsAt the start of the period 167 180 214 137Increase in distributors(1) 15 106 10 10Decrease in distributors(2) (2) (72) (87) (2)
Total at the end of the period 180 214 137 145
Notes:
(1) The increase in the number of distributors represents those distributors that made purchases from us for the yearindicated, but did not purchase from us for the year immediately preceding the year indicated.
(2) The decrease in the number of distributors represents those distributors that made purchases from us for the yearimmediately preceding the year indicated, but did not purchase from us for the year indicated. Such distributors may
purchase from us in a subsequent year.
BUSINESS
– 227 –

The decrease in the numbers of distributors in 2019 and 2020 were primarily due to the same reasonsas described in the section headed “– Multi-Channel Sales and Distribution Network for Our BrandedProducts – Distributors – (i) Selection and Assessment Criteria for Our Distributors.”
The table below sets out the breakdown of our revenue from major countries in Europe by destinationof shipment, each expressed in an absolute amount as a percentage of our total revenue, for the years andperiods indicated.
Year ended December 31, Six months ended June 30,
2018 2019 2020 2020 2021
US$ % US$ % US$ % US$ % US$ %
(Unaudited)(in thousands, except for percentages)
Germany 99,714 14.4 88,966 10.6 140,699 11.8 64,618 12.7 94,231 10.8France 35,317 5.1 51,474 6.1 40,125 3.3 18,796 3.7 23,917 2.8UK 14,870 2.2 25,315 3.0 30,671 2.6 14,212 2.8 19,820 2.3Other(1) 83,094 12.0 92,066 10.9 85,766 7.1 43,131 8.4 69,784 8.0
Total for Europe 232,995 33.7 257,821 30.6 297,260 24.8 140,757 27.5 207,752 23.9
Note:
(1) Other European countries primarily include Belgium, Czech Republic, Italy and the Netherlands.
China
In China, we primarily sell our products to distributors, who on-sell our products to other third
parties including sub-distributors and local retailers. Although we consider local retailers to be an
important channel for establishing connection with our end users, we do not sell our products directly to
local retailers, and we do not have self-operated physical stores that sell directly to end users. We also
offer our products through online channels including: (i) directly selling to end users through B2C
channels such as our flagship store on Tmall or through our e-stores on other online platforms, and (ii)
selling our products to B2B2C channels, such as JD.com, which maintain inventories of our products and
on-sell them to end users. In 2018, 2019 and 2020 and the six months ended June 30, 2020 and 2021, our
revenue from China amounted to US$56.6 million, US$61.5 million, US$69.3 million, US$38.8 million
and US$61.4 million, representing 8.2%, 7.3%, 5.8%, 7.5% and 7.1% of our revenue, respectively.
Distributors
(i) Arrangements with Our Distributors in China
We enter into distributorship agreements with our distributors in China. We manage our
distributors by region, and we prohibit and monitor cross-region sales primarily through establishing
contractual obligations and tracking product information. We may take enforcement measures such
as deducting sales rebates or terminating distributorship agreements against violations of contractual
obligations regarding prohibition of cross-region sales. We also segment our distributors based on
BUSINESS
– 228 –
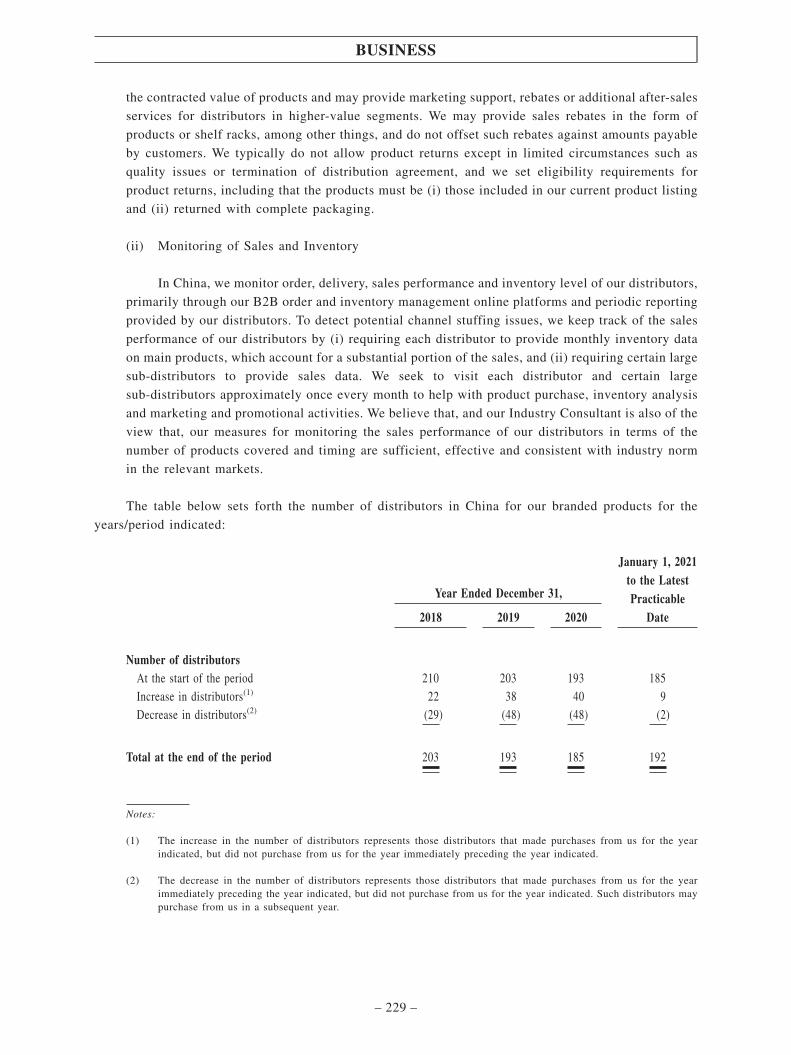
the contracted value of products and may provide marketing support, rebates or additional after-sales
services for distributors in higher-value segments. We may provide sales rebates in the form of
products or shelf racks, among other things, and do not offset such rebates against amounts payable
by customers. We typically do not allow product returns except in limited circumstances such as
quality issues or termination of distribution agreement, and we set eligibility requirements for
product returns, including that the products must be (i) those included in our current product listing
and (ii) returned with complete packaging.
(ii) Monitoring of Sales and Inventory
In China, we monitor order, delivery, sales performance and inventory level of our distributors,
primarily through our B2B order and inventory management online platforms and periodic reporting
provided by our distributors. To detect potential channel stuffing issues, we keep track of the sales
performance of our distributors by (i) requiring each distributor to provide monthly inventory data
on main products, which account for a substantial portion of the sales, and (ii) requiring certain large
sub-distributors to provide sales data. We seek to visit each distributor and certain large
sub-distributors approximately once every month to help with product purchase, inventory analysis
and marketing and promotional activities. We believe that, and our Industry Consultant is also of the
view that, our measures for monitoring the sales performance of our distributors in terms of the
number of products covered and timing are sufficient, effective and consistent with industry norm
in the relevant markets.
The table below sets forth the number of distributors in China for our branded products for the
years/period indicated:
Year Ended December 31,
January 1, 2021to the LatestPracticable
Date2018 2019 2020
Number of distributorsAt the start of the period 210 203 193 185Increase in distributors(1) 22 38 40 9Decrease in distributors(2) (29) (48) (48) (2)
Total at the end of the period 203 193 185 192
Notes:
(1) The increase in the number of distributors represents those distributors that made purchases from us for the yearindicated, but did not purchase from us for the year immediately preceding the year indicated.
(2) The decrease in the number of distributors represents those distributors that made purchases from us for the yearimmediately preceding the year indicated, but did not purchase from us for the year indicated. Such distributors maypurchase from us in a subsequent year.
BUSINESS
– 229 –
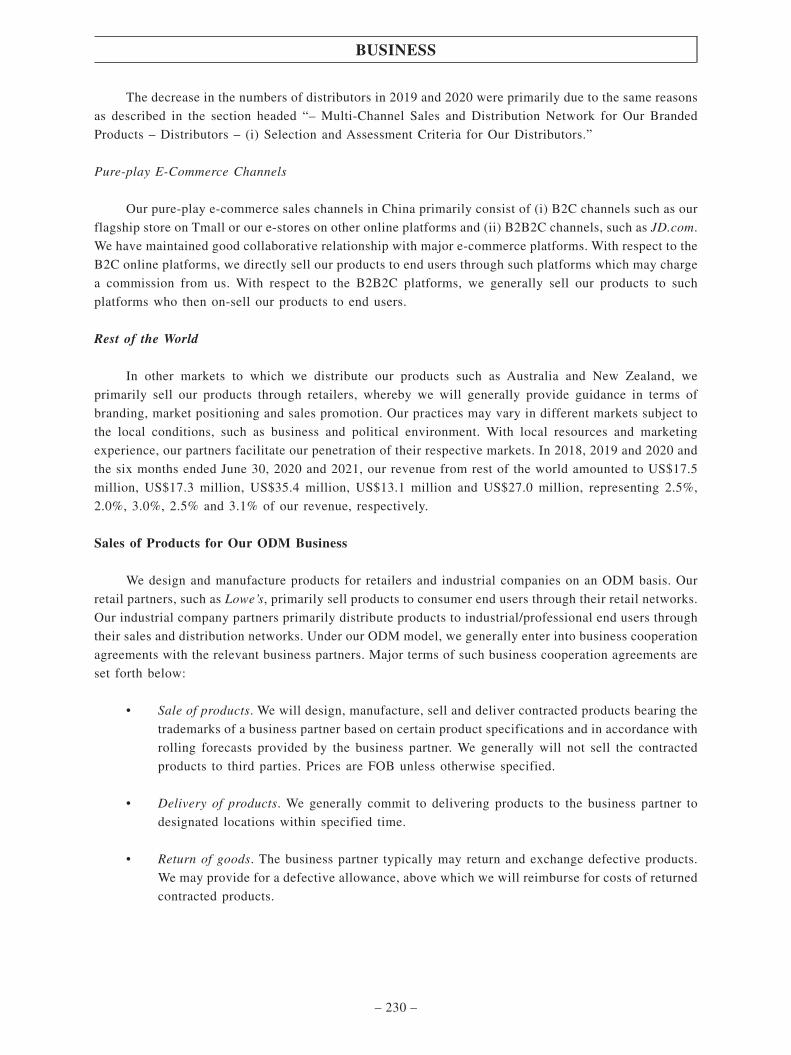
The decrease in the numbers of distributors in 2019 and 2020 were primarily due to the same reasons
as described in the section headed “– Multi-Channel Sales and Distribution Network for Our Branded
Products – Distributors – (i) Selection and Assessment Criteria for Our Distributors.”
Pure-play E-Commerce Channels
Our pure-play e-commerce sales channels in China primarily consist of (i) B2C channels such as our
flagship store on Tmall or our e-stores on other online platforms and (ii) B2B2C channels, such as JD.com.
We have maintained good collaborative relationship with major e-commerce platforms. With respect to the
B2C online platforms, we directly sell our products to end users through such platforms which may charge
a commission from us. With respect to the B2B2C platforms, we generally sell our products to such
platforms who then on-sell our products to end users.
Rest of the World
In other markets to which we distribute our products such as Australia and New Zealand, we
primarily sell our products through retailers, whereby we will generally provide guidance in terms of
branding, market positioning and sales promotion. Our practices may vary in different markets subject to
the local conditions, such as business and political environment. With local resources and marketing
experience, our partners facilitate our penetration of their respective markets. In 2018, 2019 and 2020 and
the six months ended June 30, 2020 and 2021, our revenue from rest of the world amounted to US$17.5
million, US$17.3 million, US$35.4 million, US$13.1 million and US$27.0 million, representing 2.5%,
2.0%, 3.0%, 2.5% and 3.1% of our revenue, respectively.
Sales of Products for Our ODM Business
We design and manufacture products for retailers and industrial companies on an ODM basis. Our
retail partners, such as Lowe’s, primarily sell products to consumer end users through their retail networks.
Our industrial company partners primarily distribute products to industrial/professional end users through
their sales and distribution networks. Under our ODM model, we generally enter into business cooperation
agreements with the relevant business partners. Major terms of such business cooperation agreements are
set forth below:
• Sale of products. We will design, manufacture, sell and deliver contracted products bearing the
trademarks of a business partner based on certain product specifications and in accordance with
rolling forecasts provided by the business partner. We generally will not sell the contracted
products to third parties. Prices are FOB unless otherwise specified.
• Delivery of products. We generally commit to delivering products to the business partner to
designated locations within specified time.
• Return of goods. The business partner typically may return and exchange defective products.
We may provide for a defective allowance, above which we will reimburse for costs of returned
contracted products.
BUSINESS
– 230 –

• Warranties and indemnifications. We may warrant that the contracted products do not infringe
upon patents or other intellectual property rights owned or controlled by a third party. We may
indemnify the business partner or its customers against third-party claims relating to the
infringement of intellectual property rights by the contracted products unless such claims arise
due to product specifications supplied by the business partner.
• Insurance. We typically obtain product liability insurance that covers the contracted products,
and assume manufacturer’s liability for damages that arise from deliveries of defective
contracted products.
• Intellectual properties. If we achieve inventions in the exercise of our obligations arising out
of the business agreement, we will own the inventions exclusively. If we and our business
partner achieve inventions in the exercise of joint obligations arising out of the agreement, we
and our business partner will own the inventions jointly.
• Termination. The agreement can be terminated by either party without cause typically by giving
6- to 12-month advance notice in writing.
Major Customers
Our customers primarily include retailers, distributors, e-commerce platforms and tool companies.
During the Track Record Period, our top customers were primarily retailers with nationwide presence and
ODM customers. In the years ended December 31, 2018, 2019 and 2020, and the six months ended June
30, 2021, revenue from our top five customers accounted for 51.7%, 56.8%, 64.8% and 64.4% of our
revenue for the respective periods, and revenues from our largest customer in each period during the Track
Record Period accounted for 22.9%, 20.9%, 29.0%, and 39.6% of our revenue for the respective periods.
As of June 30, 2021, we had maintained business relationships with our five largest customers for three
to more than 15 years.
BUSINESS
– 231 –
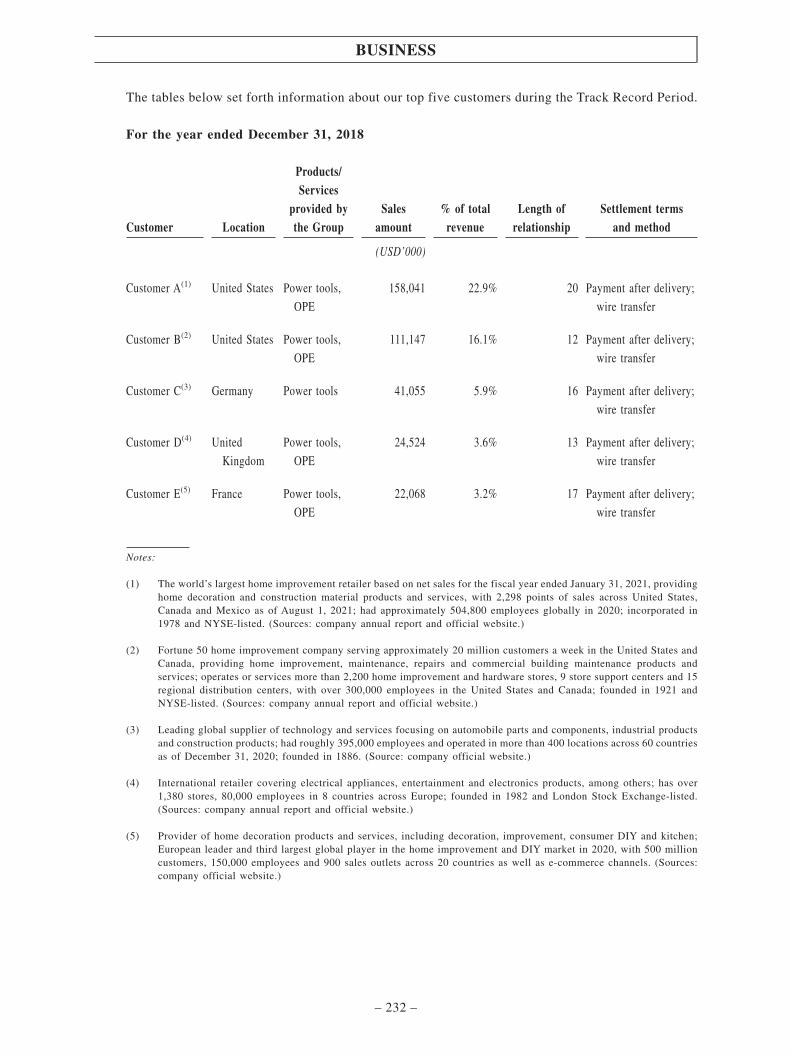
The tables below set forth information about our top five customers during the Track Record Period.
For the year ended December 31, 2018
Customer Location
Products/Services
provided bythe Group
Salesamount
% of totalrevenue
Length ofrelationship
Settlement termsand method
(USD’000)
Customer A(1) United States Power tools,
OPE
158,041 22.9% 20 Payment after delivery;
wire transfer
Customer B(2) United States Power tools,
OPE
111,147 16.1% 12 Payment after delivery;
wire transfer
Customer C(3) Germany Power tools 41,055 5.9% 16 Payment after delivery;
wire transfer
Customer D(4) United
Kingdom
Power tools,
OPE
24,524 3.6% 13 Payment after delivery;
wire transfer
Customer E(5) France Power tools,
OPE
22,068 3.2% 17 Payment after delivery;
wire transfer
Notes:
(1) The world’s largest home improvement retailer based on net sales for the fiscal year ended January 31, 2021, providinghome decoration and construction material products and services, with 2,298 points of sales across United States,Canada and Mexico as of August 1, 2021; had approximately 504,800 employees globally in 2020; incorporated in1978 and NYSE-listed. (Sources: company annual report and official website.)
(2) Fortune 50 home improvement company serving approximately 20 million customers a week in the United States andCanada, providing home improvement, maintenance, repairs and commercial building maintenance products andservices; operates or services more than 2,200 home improvement and hardware stores, 9 store support centers and 15regional distribution centers, with over 300,000 employees in the United States and Canada; founded in 1921 andNYSE-listed. (Sources: company annual report and official website.)
(3) Leading global supplier of technology and services focusing on automobile parts and components, industrial productsand construction products; had roughly 395,000 employees and operated in more than 400 locations across 60 countriesas of December 31, 2020; founded in 1886. (Source: company official website.)
(4) International retailer covering electrical appliances, entertainment and electronics products, among others; has over1,380 stores, 80,000 employees in 8 countries across Europe; founded in 1982 and London Stock Exchange-listed.(Sources: company annual report and official website.)
(5) Provider of home decoration products and services, including decoration, improvement, consumer DIY and kitchen;European leader and third largest global player in the home improvement and DIY market in 2020, with 500 millioncustomers, 150,000 employees and 900 sales outlets across 20 countries as well as e-commerce channels. (Sources:company official website.)
BUSINESS
– 232 –

For the year ended December 31, 2019
Customer Location
Products/Services
provided bythe Group
Salesamount
% of totalrevenue
Length ofrelationship
Settlement termsand method
(USD’000)
Customer A United States Power tools,OPE
176,292 20.9% 20 Payment after delivery;wire transfer
Customer B United States Power tools,OPE
170,280 20.2% 12 Payment after delivery;wire transfer
Customer D UnitedKingdom
Power tools,OPE
57,648 6.8% 13 Payment after delivery;wire transfer
Customer F(1) United States Power tools,OPE
37,974 4.5% 17 Payment after delivery;wire transfer
Customer C Germany Power tools 37,015 4.4% 16 Payment after delivery;wire transfer
For the year ended December 31, 2020
Customer Location
Products/Services
provided bythe Group
Salesamount
% of totalrevenue
Length ofrelationship
Settlement termsand method
(USD’000)
Customer B United States Power tools,OPE
347,821 29.0% 12 Payment after delivery;wire transfer
Customer A United States Power tools,OPE
189,023 15.7% 20 Payment after delivery;wire transfer
Customer C Germany Power tools 115,151 9.6% 16 Payment after delivery;wire transfer
Customer G(2) United States Power tools,OPE
75,143 6.3% 3 Payment after delivery;wire transfer
Customer D UnitedKingdom
Power tools,OPE
50,716 4.2% 13 Payment after delivery;wire transfer
Notes:
(1) The world’s largest retailer for fiscal year ended January 31, 2021; has approximately 240 million customers per week,11,400 stores across 26 countries and 2.3 million employees around the world; founded in 1962 and NYSE-listed.(Sources: company annual report and official website.)
(2) Cooperative of hardware stores providing hardware, home goods, lumber and construction materials; founded in 1924and currently has over 5,000 stores in over 60 countries. (Source: company official website.)
BUSINESS
– 233 –

For the six months ended June 30, 2021
Customer Location
Products/Services
provided bythe Group
Salesamount
% of totalrevenue
Length ofrelationship
Settlement termsand method
(USD’000)
Customer B United States Power tools,OPE
344,008 39.6% 12 Payment after delivery;wire transfer
Customer G United States Power tools,OPE
76,313 8.8% 3 Payment after delivery;wire transfer
Customer C Germany Power tools 74,762 8.6% 16 Payment after delivery;wire transfer
Customer H(1) United States Power tools,OPE
37,442 4.3% 8 Payment after delivery;wire transfer
Customer D UnitedKingdom
Power tools,OPE
26,655 3.1% 13 Payment after delivery;wire transfer
Note:
(1) One of the world’s largest e-commerce platforms, with approximately 1.3 million employees, more than 200 millioncustomer-members and 1.9 million small and medium-sized business sellers as of December 31, 2020; founded in 1994
and NASDAQ-listed. (Sources: company annual report and official website.)
During the Track Record Period, all of our five largest customers were independent thirdparties. None of our Directors, their associates or any of our current Shareholders (who, to theknowledge of our Directors, own more than 5% of our share capital) has any interest in any of ourfive largest customers during the Track Record Period that is required to be disclosed under theListing Rules. Customer C is one of the Company’s top five customers and also one of its suppliersduring the Track Record Period. The Company sells power tool products to Customer C on an ODMbasis, and purchases an immaterial amount of components in connection with the ODM arrangement.As advised by the Company’s Industry Consultant, it is common for an ODM manufacturer topurchase components from, and sells finished products to its customers.
Pricing Strategies
We price our products for external sales based on a number of factors, including costs of rawmaterials and production, prevailing market conditions and specification of products. Our pricing is alsoaffected by the global and domestic economic environment, demand for our products and marketcompetition in the power tool and OPE industries. Our pricing strategy also takes into consideration theneed for maintaining the premium status of our brands and stabilizing the prices of our productsthroughout their life cycles. The typical product life cycle of our major products ranges from 3.5 to 5.5years.
BUSINESS
– 234 –
We cannot control the prices of our products sold through distribution channels, though we providerecommended retail prices. Distributors generally have discretion to set their retail prices. We will monitorthe distributors’ selling price by requiring distributors to submit periodic reports and by monitoring pricesthrough online channels. Prior to the launch of each series of products, we determine the recommendedretail price based on careful market research.
Marketing
Our marketing and brand-building activities include sponsorships, advertisements on television,print media and the internet, trade shows and exhibitions. We also have established marketing platformson social media to promote our products and communicate with our existing and potential end users.
Sales and Marketing Team
Our internal sales staff are organized into sales teams and located in close proximity to its customersso as to bring dedicated expertise and knowledge to its customers. In order to fully serve our customers,we assign an account manager and establish a team dedicated specifically to each of our major customers.The account manager responsible for a specific customer works closely with both the customer and ouremployees, including staff from our research and development teams and product design and developmentengineers from our manufacturing facilities, in order to develop products tailored to meet that customer’sspecific needs. We believe that our model of maintaining close contacts between our staff, customers andend users provide for a more meaningful understanding of market trends and leads to the new products thatfurther strengthen our customer relationships. We have established region-focused sales and marketingteams for our North America, Europe, China and Australia/New Zealand markets.
PROCUREMENT AND SUPPLY CHAIN MANAGEMENT
We source certain raw materials and components from qualified suppliers in order to maintain qualitystandards, optimize our cost structure and achieve desired scale of production. We have a dedicated teamof supply chain experts that focus on deepening our supplier relationships, enforcing our quality controlstandards, increasing our bargaining power in raw material pricing and implementing comprehensive riskmanagement measures throughout the procurement process. Our supply chain management system, withits data and analytics capabilities, enhances our ability to collaborate with our suppliers in order to reduceprocurement costs and enhance overall operating efficiency as we seek to further expand our businessglobally.
Materials, Parts and Components
The key raw materials, parts and components for our operations primarily include (i) battery cells,
(ii) metals such as copper and aluminum, (iii) electronic components such as printed circuit boards
assembly (“PCBA”) and (iv) plastic particle materials such as Nylon plastic (PA) and Polypropylene (PP).
During the Track Record Period, we sourced raw materials from both domestic and international suppliers.
In addition, chips are a key component for certain of our lithium-ion battery powered products.
During the Track Record Period, prices of our raw materials experienced certain fluctuations. We
monitor and manage the impact of such fluctuations by entering into long-term strategic agreements with
our suppliers, pricing the costs of raw materials based on average prices through longer time horizons and
taking into account such fluctuations when pricing our products. For example, we entered into a long-term
arrangement with qualified international suppliers to provide for a stable supply of battery cells. Due to
the impact of the COVID-19 pandemic, we experienced shortages of certain of our raw materials, such as
BUSINESS
– 235 –
battery cells and chips, that affected our production schedule. Nonetheless, such shortages in battery cells
and chips have not had a material adverse impact on our business, results of operations or financial
condition during the Track Record Period and up to the Latest Practicable Date. As disclosed in the
“Summary” and “Financial Information” sections of this prospectus, we still experienced robust growth
in revenue and gross profit during the Track Record Period and in the third quarter of 2021. In addition,
we do not expect the U.S.-China trade tension to impede our ability to source chips for our products. We
believe that the U.S.-China tension is more likely to affect the ability of China-based businesses to source
high-end chips with cutting-edge computing capabilities. Our products do not require such high-end chips.
Nonetheless, to mitigate the potential geopolitical risk, we have broadened our supplier base for chips. In
the third quarter of 2021, we sourced a significant portion of our chips from China-based suppliers, and
such chips have relatively lower costs compared to chips sourced from our suppliers outside of China and
their quality meets our production needs. Please refer to the section headed “Risk Factors – Risks Relating
to Our Industry and Business – Our results of operations could be negatively impacted by our ability to
obtain raw materials, component parts, freight, energy, labor and sourced finished goods in a timely and
cost-effective manner and inflationary or deflationary economic conditions.” in this prospectus for
additional details. During the Track Record Period and up to the Latest Practicable Date, we did not
experience quality issues with our raw materials that materially affected our operations.
Supplier Management
Selection and Engagement of Our Suppliers
We develop our sourcing strategy based on our needs for raw materials and components and the
availability of qualified suppliers. We generally select suppliers that can offer quality products, cost
efficiency, timely delivery, production capacity and valuable customer services. We also consider our
needs for technological development and security. For parts or components that will be sourced, our supply
chain management (“SCM”) department (i) develops a sourcing plan taking into consideration the
requirements set forth by our research and development department, (ii) selects potential suppliers to
produce test batches and (iii) prepares an approved supplier list based on quality of the final pilot batches.
We determine the final pricing based on market analysis, price comparison and negotiations with our
suppliers. We monitor and evaluate the performance of approved suppliers on a regular basis. Given the
large scale of our purchase orders, we believe we have established credibility with our suppliers, which
helps us to obtain favorable pricing for our sourced materials, parts and components. Our long-term
cooperative relationship with our suppliers also promotes the stability of our supply chain.
We believe that in-house, high-quality manufacturing capabilities for core parts and components are
a core competency for a provider of power tools and OPE products. Upon careful evaluation of the
capabilities and capacity of existing suppliers, we have strategically developed aspects of in-house
manufacturing capabilities with respect to motors, PCBA, injection molding and machining and adjusted
the proportion of in-house manufacturing versus sourcing for each aspect based on our pre-defined
manufacturing strategy. SCM has participated in the development of our manufacturing strategy and helps
plan for the sourced portion of parts and components needed for our production.
For raw materials, parts and components of strategic importance to us, such as battery cells and
chips, we build strategic relationships with our suppliers and perform systematic forecasts for our sourcing
needs based on annual budgets and sales plans. In accordance our business plan, we coordinate with our
key suppliers with respect to technology development, production capacity and pricing, and monitor
service levels on a quarterly and monthly basis. Our inventory management system enables us to maintain
BUSINESS
– 236 –

an appropriate level of inventory for strategic raw materials, parts and components to meet our weekly
production needs. We source other non-strategic raw materials, parts and components based on actual
production needs. We will enter purchase orders that we receive from customers into our ERP system, and
disaggregate them into more discrete purchase orders and delivery expectations for raw materials, parts
and components that we will place with our suppliers. Such information system enables us to maintain an
appropriate level of inventory, monitor the performance of suppliers and adjust the allocation of orders
accordingly.
We monitor the quality of raw materials, parts and components provided our suppliers by
implementing a comprehensive quality control system, which covers the end-to-end production processes
such as purchase order placement, pre-delivery inspections and laboratory tests. We further utilize our
ERP system to manage resource planning effectively. We also evaluate our suppliers periodically based on
a range of factors, including quality and on-time delivery.
Based on the performance, delivery and quality data of suppliers and our monitoring of market
prices, we will convene an interdisciplinary team involving product development, quality control and
operations to periodically review and adjust our supply chains, including by engaging new suppliers,
consolidate existing supplier relationships and conducting supplier training.
Payment and Credit Terms
We believe our stable network of quality suppliers enables us to flexibly mobilize resources and
achieve the anticipated scale of procurement, and our comprehensive supply chain management system
supports our ability to offer high-quality products at competitive prices, which in turn will boost efficiency
and profitability. We typically seek to enter into long-term agreements with our strategic suppliers. For
other suppliers, we renew a supplier framework agreement on an annual basis. Our payment methods
include wire transfers and supply chain financing, among others. Our annual purchase agreement with
suppliers include payment terms, which typically include a monthly settlement cycle.
Subcontracting
We have engaged certain subcontractors, including both (i) whole product manufacturers, to which
we outsource the entire manufacturing processes of certain products, and (ii) production partners, to which
we outsource certain steps of manufacturing processes. We engage whole product manufacturers primarily
to supplement our production capacities. For example, for certain non-core products over which we do not
have sufficient capacity or cost efficiency, we may outsource such products to whole product
manufacturers to meet customer demands, while taking measures such as inspections to ensure the product
quality meets our standards. We engage production partners primarily to complete certain non-core
manufacturing steps more cost efficiently, such as spray painting. In such cases, we typically ship the
components or semi-finished products to the facilities of the sub-contractors, who will then complete the
outsourced manufacturing steps and ship the components or products back to us. We also will conduct
inspections to ensure that the manufacturing steps are completed pursuant to our standards. In the years
ended December, 31, 2018, 2019 and 2020 and six months ended June 30, 2021, our revenue attributable
to whole product subcontracting was US$106.5 million, US$67.3 million, US$70.2 million and US$36.9
million, respectively, which amounted to 15.4%, 8.0%, 5.8% and 4.2% of our revenue during the same
BUSINESS
– 237 –

year or period. For the years ended December 31, 2018, 2019 and 2020 and the six months ended June 30,
2021, our subcontracting costs amounted to US$73.7 million, US$47.1 million, US$44.4 million and
US$23.0 million, respectively, which amounted to 14.3%, 8.0%, 5.3% and 3.7% of our cost of sales during
the same year or period.
We carefully select subcontractors among a pool of reputable candidates. We evaluate the potentialsubcontractors in terms of, among other aspects, qualifications, technical skills, product quality, workplacesafety and delivery commitments. We require our subcontractors to comply with our internal policies andclosely monitor their performance. In the event of any failure by our subcontractors to meet our internalpolicies, we may cease to work with them or claim damages. We apply testing to ensure that the sourcedproducts meet our product specifications, quality standards and customers’ expectations. We havegenerally maintained long-term relationships with our subcontractors, and all of our subcontractors areindependent third parties.
The salient terms of the agreements with our representative whole product manufacturers are setforth below:
• Price. Whole product manufacturers will generally supply products at the prices agreed inpurchase orders.
• Delivery. Whole product manufacturers are typically responsible for transporting products todesignated places and bearing the associated expenses and costs.
• Warranty period. Typically 36 months, unless otherwise agreed between the parties.
• Product liability. Whole product manufacturers generally indemnify us for product liabilityresulting from defects of products manufactured by them.
• Duration and termination. Generally three years, automatically renewed in one-year termsunless terminated by either party by six-month advance notice.
The salient terms of the agreements with our representative production partners are set forth below:
• Price. Production partners will provide the services at a price confirmed in writing by theparties.
• Warranty period. Typically 36 months, unless otherwise agreed between the parties.
• Components, parts and materials. We are generally responsible for providing components,parts and materials required for the outsourced manufacturing steps, either for free or at a costmutually agreed upon by the parties.
• Product liability. Production partners generally indemnify us for product liability resultingfrom defects of products supplied by them.
• Payment terms. Generally 90-day payment period, unless otherwise agreed between the parties.
• Duration and termination. Generally five years, automatically renewed in one-year terms,unless terminated by either party by 90-day advance notice.
BUSINESS
– 238 –

Major Suppliers
During the Track Record Period, our top suppliers primarily include providers of battery cells,electronics parts and components and logistics and warehouse services. In the years ended December 31,2018, 2019 and 2020, and the six months ended June 30, 2021, purchases from our largest five suppliersin aggregate accounted for 18.2%, 19.7%, 24.8% and 20.6% of our total purchases for the respectiveperiods, and purchases from our largest supplier in each period during the Track Record Period accountedfor 10.9%, 11.9%, 16.1% and 12.6% of our total purchases for the respective periods. Our key suppliersare primarily located in China, Korea, Germany, the United States. As of June 30, 2021, we had maintainedbusiness relationships with our five largest suppliers for five to over ten years. We generally have theflexibility to seek alternative suppliers for our sourcing needs.
For the year ended December 31, 2018
Supplier Location
Products/services
received bythe group
Purchaseamount
% of totalpurchase
Length ofrelationship
Settlement termsand method
(USD’000)
Supplier A(1) China andKorea
Lithium-ionbattery cells
61,631 10.9% 8 Payment after delivery;wire transfer
Supplier B(2) United States Logistics andwarehouse
15,947 2.8% 5 Payment after delivery;wire transfer
Supplier C(3) Germany Vacuumcleaners
8,676 1.5% 10 Payment after delivery;wire transfer
Supplier D(4) China Enameledwires
8,458 1.5% 18 Payment after delivery;wire transfer
Supplier E(5) China Angle grinders 8,384 1.5% 15 Payment after delivery;wire transfer
Notes:
(1) Provider of lithium-ion battery, automobile battery, lithium-ion energy system and electronic materials; founded in1970 and currently has operations in 27 locations, including 12 production facilities and 13 sales sites, in 12 countriesand regions across Asia Pacific, Europe and North America; Korea Exchange-listed. (Sources: company annual reportand official website.)
(2) Provider of logistics solutions, including delivery and e-commerce operation, transportation management and materialshandling equipment; founded in 1950; currently has 90 distribution facilities comprising 30 million square feet ofspace, and serves over 200 customers across a wide range of industries. (Source: company official website.)
(3) One of the world’s leading manufacturers of professional cleaning equipment, including floorcare equipment, vacuumcleaners and high pressure washers; founded in 1906 and has approximately 4,500 employees across 40 countries, withsales companies reaching approximately 100 countries through direct sales and dealers; Nasdaq Copenhagen-listed.(Sources: company annual report and official website.)
(4) Provider of enameled wires, bare copper wires and electric wires and cables; has approximately 438 employees withannual production capacity of approximately 60,000 tons. (Source: company official website.)
(5) Provider of electrical equipment, power electronic devices, auto parts and components, metal tools, electric tools andair tools; has approximately 94 employees. (Source: company official website and commercial database.)
BUSINESS
– 239 –

For the year ended December 31, 2019
Supplier Location
Products/services
received bythe group
Purchaseamount
% of totalpurchase
Length ofrelationship
Settlement termsand method
(USD’000)
Supplier A China and
Korea
Lithium-ion
battery cells
76,395 11.9% 8 Payment after delivery;
wire transfer
Supplier B United States Logistics and
warehouse
19,317 3.0% 5 Payment after delivery;
wire transfer
Supplier F(1) China Lawn mowers,
small air
blowers and
axial
blowers
13,623 2.1% 15 Payment after delivery;
wire transfer
Supplier G(2) China Battery holder
components,
battery pack
covers,
cases and
handles
8,944 1.4% 10 Payment after delivery;
wire transfer
Supplier E China Angle grinders 8,503 1.3% 15 Payment after delivery;
wire transfer
Notes:
(1) Provider of power tools, gardening metal tools, plastic products and materials, metal products, motors, chemical rawmaterials and construction materials; founded in 1999 and has approximately 800 employees and sells about 2 milliongarden tool products worldwide on an annual basis; serves as an OEM manufacturer for brand customers globally, suchas distributors, importers, manufacturers and retail stores. (Source: company official website.)
(2) Provider of power tools accessories, press parts, auto parts and components, aluminum die casting and warehousingservices; has approximately 25 employees. (Source: company official website and commercial database.)
BUSINESS
– 240 –

For the year ended December 31, 2020
Supplier Location
Products/services
received bythe group
Purchaseamount
% of totalpurchase
Length ofrelationship
Settlement termsand method
(USD’000)
Supplier A China and
Korea
Lithium-ion
battery cells
124,399 16.1% 8 Payment after delivery;
wire transfer
Supplier B United States Logistics and
warehouse
30,296 3.9% 5 Payment after delivery;
wire transfer
Supplier H(1) United States Marketing 14,116 1.8% 6 Payment after delivery;
wire transfer
Supplier F China Lawn mowers,
small air
blowers and
axial
blowers
11,752 1.5% 15 Payment after delivery;
wire transfer
Supplier I(2) China Power MOS
devices
11,301 1.5% 7 Payment after delivery;
wire transfer
Notes:
(1) Provider of advertising services; founded in 1998 and currently has 250 employees across four offices in the UnitedStates. (Source: company official website.)
(2) Provider of electronic products, electromechanical devices, communication devices, computer software and hardware,and product-related technologies focusing on the automobile industry; founded in 2008 and had 290 employees as ofDecember 31, 2020; sells products primarily to customers in Greater China and the Asia Pacific region; Shenzhen StockExchange-Listed. (Sources: company annual report and official website.)
BUSINESS
– 241 –

For the six months ended June 30, 2021
Supplier Location
Products/services
received bythe group
Purchaseamount
% of totalpurchase
Length ofrelationship
Settlement termsand method
(USD’000)
Supplier A China and
Korea
Lithium-ion
battery cells
87,003 12.6% 8 Payment after delivery;
wire transfer
Supplier B United States Logistics and
warehouse
20,398 3.0% 5 Payment after delivery;
wire transfer
Supplier H United States Marketing 15,207 2.2% 6 Payment after delivery;
wire transfer
Supplier I China Power MOS
devices
10,938 1.6% 7 Payment after delivery;
wire transfer
Supplier J(1) China Plastic
particles
8,577 1.2% 17 Payment after delivery;
wire transfer
Note:
(1) Provider of plastics, synthetic materials and composite materials, as well as products made of the above materials;founded in 2010 and has approximately 626 employees; subsidiary of a Shanghai Stock Exchange-listed company.
(Source: company official website and commercial database.)
All of our five largest suppliers are independent third parties of our Group. None of our Directors,
their associates or any of our current Shareholders (who, to the knowledge of our Directors, own more than
5% of our share capital) has any interest in any of our five largest suppliers during the Track Record Period
that is required to be disclosed under the Listing Rules. During the Track Record Period and up to the
Latest Practicable Date, none of the ultimate controlling shareholders of our five largest suppliers is a
connected person of ours as defined under the Hong Kong Listing Rules.
Based on management judgements formed primarily through the proportion of our purchase amount
relative to a supplier’s revenue, several suppliers had significant reliance on us in terms of their sales of
raw materials and components, such as injection molded parts, wiring harnesses and magnetic steel. One
of such suppliers, Supplier G, is among our top five suppliers in 2019. Our purchases from Supplier G in
2019 primarily included battery holder components, battery pack covers, cases and handles, which
amounted to US$8.9 million or 1.4% of our total purchases during the year. We believe that these supplier
relationships have not resulted, and will not result in material risks to our supply chain, and that we will
be able to find suitable replacements for our existing suppliers at reasonable costs as there are other
suppliers that can provide comparable materials or components.
BUSINESS
– 242 –

LOGISTICS, TRANSPORTATION AND INVENTORY MANAGEMENT
Logistics and Transportation
We manage transportation and delivery of finished products to customers, and engage third party
logistics services providers to provide such services. Our logistics service providers help us (i) transport
raw materials, parts and components between our production facilities and warehouses, (ii) transport
finished goods internationally and (iii) transport finished goods to designated warehouses of customers.
Inventory Management
To monitor our finished product inventory levels and minimize obsolete inventory, we have a strict
inventory control policy and closely monitor sales records of our distributors and retailers. We have
established a comprehensive inventory management policy, which consists of First In, First Out (“FIFO”)
and First Expired, First Out (“FEFO”) principles, as well as processes for cycle counting, re-inspection
and disposal, among other aspects. In order to reduce inventory surplus and age, we utilize our ERP and
warehouse management system, or WMS system to monitor the stock level of raw materials, parts and
components, work-in-progress and finished products. Through various data feeds from these systems, we
are able to access information from many of our major distributors and retailers including sales volume
fluctuation, unit selling price movement, volume of inventory on hand and inventory turnover.
Our inventory includes finished products, components (i.e. work-in-progress), and raw materials.
• Finished products. We design and implement manufacturing plans to accommodate our sales
and maintain reasonable inventory levels. Our production planning involves setting
manufacturing targets over the year based on annual sales estimates and monthly delivery
schedules.
• Work-in-progress. We produce work-in-progress in batches to adapt to the rolling sales
estimates and to match the manufacturing plans for our finished products.
• Raw materials. We monitor our inventory levels of raw materials and make periodic
adjustments to match our procurement plans with our manufacturing plans, based on the
integrated information sharing platform under the MES system and ERP system. Please refer
to “– Information Technology Systems” below for additional details.
We stock certain components, parts and raw materials to be used in our in-house production. Through
accurate production planning, close coordination with our customers and suppliers, as well as making
frequent purchases in batches from our suppliers, we are able to carry a manageable level of in-progress
inventories, which lowers our inventory risk.
For the years ended December 31, 2018, 2019 and 2020, and for the six months ended June 30, 2021,
our inventory turnover days were 150 days, 159 days, 129 days, and 97 days, respectively. Please see the
section headed “Financial Information – Analysis of Selected Statement of Financial Position Items –
Inventories” in this prospectus for more details.
BUSINESS
– 243 –

QUALITY CONTROL
Overview
We have devoted substantial resources to quality control since the founding of our business. We
established an advanced testing center in 1997 and obtained ISO9001 certification for our quality
management system in 2003. Our quality control system encompasses all aspects of our operations,
including product design and development, sourcing of raw materials, parts and components, production,
packaging, inventory storage, delivery and after-sales services. As of June 30, 2021, we had over 400
quality control personnel.
Based on over 20 years of experience in implementing the ISO9001 standards, we have established
and continuously improved our quality control system. We are subject to external reviews on an annual
basis, which involve both comprehensive and target reviews of our quality control system, product
certifications and production facilities. Meanwhile, our quality control audit team, which had more than
30 full-time employees as of June 30, 2021, is responsible for conducting internal reviews on an annual
basis. Through such external and internal reviews, we continuously identify opportunities for improvement
and resolve issues based on a closed-loop process. Our CHERVON testing center based in Nanjing, PRC
conducts thorough tests and assessments on our products to ensure that they conform with relevant
standards. For details of our testing center and its qualifications, please see “– Research and Development
– Research and Development Capabilities” below.
Our products are sold worldwide and are subject to different safety standards and quality
requirements depending on where they are sold. We also adopt the appropriate quality control system and
engage independent product testing and certification organizations to test and certify our products on the
relevant standards of each target market. For example, our products are certified by UL in North America,
Conformite Europeene (“CE”) Mark in Europe and China Compulsory Certificate (“CCC”), which
represent leading product safety and quality standards in the respective market.
As a result of our commitment to adherence to quality control procedures, we did not experience any
material sales returns or any material product liability or major legal claims due to quality control issues,
and we did not recall any products during the Track Record Period and up to the Latest Practicable Date.
See the section headed “Risk Factors – Risks Relating to Our Industry and Business – We are subject to
various regulatory and customer-imposed guidelines and may not be successful in maintaining an effective
quality control system.” in this prospectus for more details.
Quality Control Measures
Below is a summary of our quality control measures throughout the end-to-end product development,
procurement, production, delivery and after-sales processes.
Product Development
We place great emphasis on quality management during the product development phase. Our quality
control over research and development has continuously improved based on a rigorous product
development process, advanced IT systems and a dedicated quality control team. We have designed our
research and development process in accordance with leading industry practices and strict quality control
BUSINESS
– 244 –

measures, such as the Failure Modes and Effects Analysis (“FMEA”). Our research and development
center operates an independent quality control team, which is responsible for quality planning, process
quality inspections and testing plan development.
Procurement
Before placing large-volume orders with new suppliers, we evaluate them based on a range of
factors, including the quality of raw materials, parts and components and the ability to meet our delivery
timelines. We source raw materials, parts and components only from a list of approved suppliers. Once the
sourced materials, parts and components are delivered to us, we apply Incoming Quality Control (“IQC”)
measures to ensure that we only use raw materials, parts and components that meet our quality standards.
We also conduct reviews and inspections of suppliers and resolve quality issues in accordance with a
closed-loop issue management process.
Production
We have established a vertically integrated production system, which enables us to manufacture core
components in-house, such as motors, PCBA, machining and injection molding, in order to maintain close
control over key parameters during the production process, make improvements based on quality-related
feedback and promote the quality of finished products. We have also devoted substantial resources to the
automation of production and testing, error prevention and machine vision inspections, which we believe
will enable us to enhance our quality control capabilities. Furthermore, we have built a comprehensive
quality testing and inspection team, with established roles such as IQC, In-Process Quality Control
(“IPQC”) and Outgoing Quality Control (“OQC”) that cover key steps such as sourcing, production and
packaging. In addition, we have established specialized laboratories that possess advanced testing
capabilities such as chemical and physiochemical tests. Leveraging leading industry practices, we have
established our own CHERVON production system, which includes aspects of quality control and quality
assurance. We have also devoted substantial resources into information technology systems such as our
Quality Management System (“QMS”), in order to enhance our quality control capabilities and maintain
high quality standards for our products.
Our manufacturing facilities are subject to periodic inspections and examinations conducted by
relevant government authorities. They inspect our manufacturing processes, quality control measures and
products to determine our compliance status and to identify areas for further improvement. During the
Track Record Period and up to the Latest Practicable Date, we did not receive any written notice or
sanction for material non-compliance, violation, or recommendation for improvement with respect to our
production operations from the government authorities.
Packaging and Logistics
Our packaging team ensures that the packaging standards required by our customers are met prior
to product delivery. We typically hire professional logistics service providers to transport products for us
and keep track of our products during the transportation process.
BUSINESS
– 245 –

Warehousing
Our finished products are first packaged and stored at our warehouses before being transported and
delivered to customers. In China, we operate five warehouses in Nanjing, Jiangsu Province. We also utilize
warehouses operated by third-party logistics providers to service certain overseas markets, to enable us to
deliver products to our customers within a competitive timeframe. We conduct regular inspections on our
warehousing conditions in accordance with our internal guidance. We also have a dedicated team with
systematic training to ensure the proper condition and operations of our warehouses to minimize fire
hazards and other similar risks to our products.
Warranty and After-Sales Services
We believe that high quality after-sales services constitute an essential factor that determines our
success because it extends the value chain of our products and promotes customer and end-user
satisfaction. We have been developing and optimizing our after-sales services since the establishment of
our proprietary brands.
Our after-sales services cover product support, as well as repair, return and exchange of defective
products. We have established a variety of channels for our end users to contact us for after-sales services,
including in person at points of sale, through online CRM system, and over the phone. We have
implemented a cloud-based CRM system to record, track and maintain our end-user relationships, which
enables us to respond to end-user needs in an efficient and timely manner and to continuously improve
end-user experience based on insights generated from the CRM system.
In North America, we have established a call center and product repairs support teams and also
engage with third-party call centers to meet the needs of our end users. In addition, we have a network
of over 460 authorized service centers that are located close to our points of sales across North America
and can provide repair services for our end users. In other regions of the world, we primarily engage with
a network of third-party service providers and distributors to provide comprehensive after-sales services
for our end users. In order to continuously improve our products, our quality control team analyzes
insights generated from our after-sales services network and obtains first-hand information on product
quality and end-user feedback by conducting inspections of returned goods at our service centers.
Consumers can replace defective products or request repairs for defective products within certain
time periods, in compliance with regulatory requirements or our policies or the relevant retailers’ policies
on the return, replacement and repair of products. Consumers may also replace their products for specific
types of defects or quality issues pursuant to our warranty policies or applicable laws and regulations. We
believe that, and Frost & Sullivan, our Industry Consultant, is also of the view that, our product return
policy is in line with the general market practice in our industry. In 2018, 2019, 2020 and the six months
ended June 30, 2021, the amount of returned products was US$10.6 million, US$17.5 million, US$23.7
million and US$4.5 million, respectively, which amounted to 1.5%, 2.1%, 2.0% and 0.5%, respectively,
of our revenue for the relevant years/periods. During the Track Record Period and up to the Latest
Practicable Date, we did not receive complaints from customers that materially and adversely affected our
results of operations.
BUSINESS
– 246 –

Under our general terms and conditions of sale and in accordance with industry practice, we typically
provide a limited warranty on our products providing for the return, repair or replacement of defective
items or a credit with respect to amount paid for such items. While the terms of the warranties provided
by us differ depending on the type of products, customer and geographic market, they generally range from
one to five years.
INFORMATION TECHNOLOGY SYSTEMS
We have in place information technology systems and infrastructure that are designed to meet our
business and operational needs with respect to research and development, sales management, procurement,
production, financial reporting and human resources, among other aspects. Our main information
technology systems include the following:
• ERP system. We utilize the enterprise resource planning, or ERP, system to retrieve and analyze
our operational data to support decision-making and increase productivity and profitability.
The ERP system covers various aspects of our operations, including manufacturing, financial
accounting, forecast and planning, purchasing, order management, enterprise performance
management and human capital management.
• MES system. We utilize the manufacturing execution system, or MES, to support our
production process. The system enables real-time monitoring of production process by
recording the progress of each production line and transmit production-related data, including
volume, time and labor, to a centralized database. The system also enables our production
planning department to monitor production loading and capacity, order scheduling and
production scheduling plan. In addition, we deployed this system to boost production efficiency
at our manufacturing facilities, including quality management, energy management and
environmental and waste management. Data collected from our manufacturing process feeds
into our ERP system for further consolidation, analysis and reporting.
• SRM system. We utilize the supplier relationship management system, or SRM system, to
support business transactions and communications between us and our suppliers, including
placing orders, managing inventories and measuring supplier performance.
• WMS system. We utilize the warehouse management system, or WMS system, to manage,
control and monitor our warehouse operations. Primary functions of the WMS system include
identifying inventory records, shipment details, stock locations and warehouse capacity. We
also integrate the WMS with other systems such as ERP and SRM to streamline information
flow and increase productivity.
• CRM system. We utilize customer relationship management system, or CRM system, to manage
relationships and interactions with our current or potential customers. The CRM system
encompasses the end-to-end customer lifecycle, including marketing, sales, promotion, digital
commerce, and customer services.
• PLM system. We are upgrading our PLM system to seamlessly integrate CAD, data and
software into a platform to facilitate collaborate and project management, which we believe
will improve the efficiency of our research and development efforts.
BUSINESS
– 247 –

• BI system and big data platform. We utilize the business intelligence system, or BI system, totransform complex data into actionable insights in order to support our decision-making andstrategic and operational planning. The BI system combines data gathering, storage, analysisand reporting, as well as knowledge management capabilities.
We intend to continuously maintain and update our information technology systems to keep up withthe growth of our business.
RISK MANAGEMENT AND INTERNAL CONTROL
We have adopted and implemented comprehensive risk management policies in various aspects ofour business operations to address operational, financial, legal and market risks identified in relation toour operations, which include but are not limited to procurement management, sales management,inventory management, research and development management, investment management, credit risk,related party transaction controls, information disclosure controls, human resources, IT management andother financial and operational controls and monitoring procedures. These risk management policies setforth procedures the relevant reporting hierarchy of risks identified in our operations. Our Board isresponsible for overseeing our overall risk management. After due consideration, our Directors are of theview that our current internal control measures are adequate and effective.
Financial Reporting Risk Management
We have in place a set of accounting policies in connection with our financial reporting riskmanagement, such as financial report management policies, budget management policies, financialstatements preparation policies and financial department and staff management policies. We have variousprocedures in place to implement accounting policies, and our financial department reviews ourmanagement accounts based on such procedures. We also provide regular training to our financialdepartment staff to ensure that they understand financial management and accounting policies andimplement them in our daily operations. As of June 30, 2021, our finance department consisted of 85employees.
Information System Risk Management
Sufficient maintenance, storage and protection of user data and other related information is criticalto our success. We have implemented relevant internal procedures and controls to ensure that user data isprotected and that leakage and loss of such data is avoided. Our information technology department isresponsible for ensuring the security of our information technology infrastructure and ensuring that theusage, maintenance and protection of user data are in compliance with our internal rules and applicablelaws and regulations. During the Track Record Period and up to the Latest Practicable Date, we did notexperience any material information leakage or loss of user data.
Internal Control Risk Management
We have designed and adopted strict internal procedures to ensure the compliance of our businessoperations with applicable rules and regulations. In accordance with our procedures, our legal &compliance department performs reviews and update the forms of contracts we enter into with ourcustomers and suppliers. Our legal & compliance department also examines the contract terms and reviewsrelevant documents for our business operations, including licenses and permits obtained by thecounterparties and other due diligence materials, before we enter into any contracts or businessarrangements.
BUSINESS
– 248 –
To ensure compliance with the applicable securities or financial markets laws, rules and regulations,
we have adopted the following internal control measures. Based on document reviews and testing, our
internal control consultant did not identify any insufficiency or ineffectiveness of the control measures.
(a) we have put in place connected transactions management policies for all of our Directors and
employees to comply with;
(b) we have established the Audit Committee comprising three independent non-executive
Directors to oversee the internal control procedures and accounting and financial reporting
matters of our Group. Pursuant to its terms of reference, one of the duties and obligations of
the Audit Committee is to ensure our Group’s compliance with the relevant regulatory
requirements and to review any arrangement which may raise concerns about possible
improprieties in financial reporting, internal control or other matters;
(c) we have engaged external legal advisers to assist us, as needed, in reviewing payment
arrangements and agreements to be entered into by us and/or matters associated with business
operated by our Group in the future as well as to advise us on compliance with applicable laws,
rules and regulations; and
(d) regular training given by external legal advisers will be arranged for all of our Directors,
company secretary and senior management members so as to discuss and study the relevant
regulatory requirements in relation to our responsibilities and duties under the laws and
regulations relevant to our business operations.
We also have in place detailed internal procedures to ensure that our legal & compliance department
reviews our products and services, including upgrades to existing products, for regulatory compliance
before they are made available to the general public. Our legal & compliance department is responsible
for obtaining requisite governmental pre-approvals or consents, including preparing and submitting
necessary documents for filing with relevant government authorities within prescribed regulatory
timelines. As of June 30, 2021, our legal & compliance department consisted of 6 employees.
Human Resources Risk Management
We provide regular and specialized training tailored to the needs of our employees in different
departments. Our human resources department regularly organizes internal training sessions conducted by
internal or external experts on topics of interest. Our human resource department schedules online training
sessions, reviews the content of the training programs and follows up with employees to evaluate the
impact of such training. Through these trainings, we ensure that our staff’s skill sets remain up-to-date,
enabling them to better discover and meet consumers’ needs.
We have in place an employee handbook approved by our management and distributed to all of our
employees, which contains internal rules and guidelines regarding best commercial practices, work ethics,
fraud prevention mechanism, negligence and corruption. We provide employees with regular trainings and
resources to explain the guidelines contained in the employee handbook.
BUSINESS
– 249 –
We also have in place an anti-corruption policy to safeguard against any corruption within our
Company. The policy explains potential corruption conducts and our anti-corruption measures. We make
our internal reporting channel available for our staff to report any corruption acts, and our staff can also
make anonymous reports to our internal audit department. Our internal audit department is responsible for
investigating any reported incidents and taking appropriate measures. We conduct risk-based due diligence
before hiring any third party and ensure that the hiring procedure is implemented fully in accordance with
the anti-bribery policy. We also have regular training for employees regarding the anti-bribery policy to
facilitate implementation of the policy. During the Track Record Period and up to the Latest Practicable
Date, we were not aware of any anti-bribery incident by our employees in relation to our customers.
Investment Risk Management
Our investment strategy is grounded in the principles of compliance, prudence, safety and
effectiveness. We consider the following criteria in making investment decisions:
• Size, expected returns and associated risks;
• Compliance with applicable laws and regulations;
• Consistency with our growth strategy;
• Appropriateness of enterprise resource allocation; and
• Optimization of our portfolio.
We set up investment plans in line with our business strategies with inputs from various business
departments. An investment budget is set up based on our business strategies every year. We generally
intend to hold our investments for the long term. With surplus cash on hand, we may also make
investments in cash management products to generate finance income at a yield higher than the current
bank deposit interest rates, with an emphasis on capital preservation. Each investment decision is made
based on internal vetting and discussions, considering factors such as market dynamics, expected returns
and risks involved.
We believe that our internal strategy and policies regarding investments and the related risk
management mechanisms are adequate, and that our investment decisions have been in full compliance
with our investment strategy and policies.
HEDGING
We may enter into foreign currency forward contracts and foreign currency option contracts withbanks to mitigate the currency risk arising from certain of our bank loans and receivables denominated inUS dollars and euro. We also may enter into interest rate swaps contracts with banks to mitigate the riskof interest rate fluctuations arising from bank loans at floating interest rates. See Note 21 to theAccountants’ Report set forth in Appendix I to this prospectus. We do not enter into hedging transactionsfor speculative purposes.
BUSINESS
– 250 –

As of December 31, 2018, 2019, 2020 and June 30, 2021, we primarily had the following foreignexchange forward and option contracts: (i) US$0.5 million, US$1.0 million, US$5.8 million and US$3.1million of assets in foreign currency forward and option contracts, respectively, and (ii) US$3.6 million,US$1.3 million, US$0.3 million and US$0.6 million of liabilities in foreign currency forward and optioncontracts, respectively. In a typical foreign currency forward contract, one party agrees to buy fromanother party a certain amount of foreign currencies on a specific future date at a predetermined foreignexchange rate, in order to reduce the level of risks arising from foreign exchange fluctuations. Please referto the section headed “Risk Factors – We are exposed to counterparty risk in our hedging arrangements.”and “Risk Factors – We are exposed to market risk from changes in foreign currency exchange rates whichcould materially and negatively impact our profitability.”
The following table illustrates the effect of hypothetical fluctuations in foreign exchange rates on ourprofit or loss after taxation and retained profits for the years and periods indicated, assuming all otherfactors affecting our profitability remained unchanged. Such effect is estimated by the following method:(i) for each of the Company’s subsidiaries and assuming that the US dollar or euro appreciates ordepreciates by one percent against the functional currency of the relevant subsidiary at the end of areporting period, calculate the effect of such appreciation or depreciation on the relevant subsidiary’sprofit or loss after taxation and retained profits and (ii) aggregate such effects at the Group level. Asubsidiary’s functional currency is the currency in which the subsidiary’s assets and liabilities areprimarily denominated.
Year ended December 31, Six months endedJune 30, 20212018 2019 2020
Increase/(decrease)in foreignexchange
rates
Effect onloss aftertaxation
andretainedprofits
Increase/(decrease)in foreignexchange
rates
Effect onprofitafter
taxationand
retainedprofits
Increase/(decrease)in foreignexchange
rates
Effect onprofitafter
taxationand
retainedprofits
Increase/(decrease)in foreignexchange
rates
Effect onprofitafter
taxationand
retainedprofits
% US$ % US$ % US$ % US$(in thousands, except for percentages)
USD 1 93 1 902 1 968 1 853(1) (93) (1) (902) (1) (968) (1) (853)
EUR 1 111 1 255 1 57 1 289(1) (111) (1) (255) (1) (57) (1) (289)
Note:
This sensitivity analysis is intended for reference only, and any variation may differ from the amounts indicated. Investorsshould note in particular that this sensitivity analysis is not intended to be exhaustive and is limited to the impact of changesin foreign exchange rates only.
For further details, please refer to Note 37(d)(ii) of the Accountants’ Report in Appendix I of thisprospectus.
BUSINESS
– 251 –

TRANSFER PRICING POLICY
Our Company and our subsidiaries conduct intra-group sales of products, provisions of services and
other related party transactions in accordance with our transfer pricing policy. We follow the fundamental
principle that inter-company transactions must be conducted at an arm’s length basis. We have established
and implemented guidelines, processes, documentations and controls with respect to inter-company
transactions to ensure that the execution of transfer pricing methods is applied consistently in our
day-to-day operations. In order to comply with the applicable law and regulations on transfer pricing in
relevant jurisdictions, including OECD Transfer Pricing Guidelines and recent update of Base Erosion and
Profit Shifting (“BEPS”) guidance, we engaged independent tax advisers to prepare master and local files
and country-by-country reports to meet the requirements of local tax offices in the countries where we
have major operations.
Our intra-group transactions primarily arise from the following relationships: (i) product sales from
our subsidiaries which operate manufacturing facilities, such as Nanjing Chervon Industry, to trading
subsidiaries, such as Chervon HK, (ii) provisions of services, including consulting, marketing support and
research and development etc from subsidiaries which have service functions, such as Chervon GmbH, to
other subsidiaries, such as EGO Europe GmbH, (iii) office rental and canteen charges for facilities located
in Nanjing, PRC, and (iv) royalty fees, including FLEX brand license fees paid from Chervon HK to FLEX
Elektrowerkzeuge GmbH. The aggregate amounts of intra-group transactions for the years ended
December 31, 2018, 2019 and 2020 and the six months ended June 30, 2020 and 2021 were US$744.4
million, US$997.4 million, US$1,125.8 million, US$454.1 million and US$821.7 million, respectively.
We have engaged independent transfer pricing consultants to conduct transfer pricing reviews of our
intra-group cross-border transactions. In conducting the reviews, the independent transfer pricing
consultants performed the following procedures:
• Reviewed our financial results, tax records and correspondence with relevant tax authorities;
• Reviewed quantitative information, including indicators such as return on sales and cost-plus;
• Reviewed the Group’s practices against transfer pricing rules in relevant jurisdictions;
• Discussed with management of our Group to understand the functions and risks undertaken by
our subsidiaries; and
• Sampled and reviewed our Group’s pricing data and benchmarked them against comparable
transactions from companies operating in similar industries or carrying on similar businesses,
which are sourced from databases that are widely used in the relevant industries.
The transfer pricing reviews covered our ten main subsidiaries across eight jurisdictions, including
the PRC, Hong Kong, the United States, Canada, Australia, Germany, the Netherlands and Vietnam. In
accordance with applicable laws and regulations in the relevant jurisdictions, the independent transfer
pricing consultants primarily adopted the following transfer pricing methodologies to conduct the transfer
pricing reviews: (i) transactional net margin method and (ii) comparable profit method. Due to differences
in local tax laws and regulatory requirements, certain transfer pricing reports for FLEX-Elektrowerkzeuge
GmbH, FLEX-Verwaltungs GmbH and Skil B.V. for the years of 2018, 2019 and 2020 are still under
preparation as of the Latest Practicable Date. We expect to complete such reports in the first half of the
BUSINESS
– 252 –
year of 2022. After consulting with our independent transfer pricing consultants, we were not aware of (i)
any materially non-compliant or unusual transfer pricing policies adopted by the relevant entities or any
other relevant Group members or (ii) any material changes in the transfer pricing policies and compliance
of the relevant entities since the last issued reports.
After consulting with the independent transfer pricing consultants and upon reviewing thecorresponding reports, we believe our intra-group transactions were executed in accordance with theGroup’s transfer pricing strategy and methodology to ensure they are at arm’s length and in compliancewith international and local transfer pricing regulations in all material respects. Therefore, we believethere is no potential material exposure of tax payable.
In 2016 and 2017, FLEX Italia S.r.l (“FLEX Italia”), our Italy-based subsidiary, was subject to a taxaudit by, and received a tax assessment notice from, the Italian Tax Police in connection with certaintransactions carried out between FLEX Italia and certain other FLEX entities during fiscal years 2013,2014 and 2015. The Italian Tax Police alleged that FLEX Italia improperly deducted costs associated withthe purchase of finished goods from FLEX-Elektrowerkzeuge GmbH and purchase of support servicesrendered by FLEX-Verwaltungs GmbH. As of the Latest Practicable Date, the case in connection with taxassessments for fiscal years 2013 and 2014 was under arbitration at the Office for Advanced Rulings andInternational Disputes of the Revenue Agency in Rome, Italy. In December 2021, FLEX Italia received anadditional tax assessment notice from the Italian Tax Police regarding transactions carried out betweenFLEX Italia and certain other FLEX entities during fiscal year 2015. The aggregate potential tax liabilityof FLEX Italia in connection with this tax dispute is estimated to be approximately 186.3 thousand euros(US$210.6 thousand), which represents the amount of additional tax liabilities alleged in the Italian TaxPolice’s assessment notice for the fiscal years 2013-2015 (net of interest due). We believe that such disputehas not had, and will not have, a material adverse impact on our results of operation or financial condition.
Based on the foregoing and after consulting with our transfer pricing consultants, our Directors areof the view that the Group is in compliance with applicable transfer pricing laws and regulations in allmaterial respects in relevant jurisdictions and that our transfer pricing arrangements did not involve taxevasion. Based on the due diligence conducted, nothing has come to the attention of the Joint Sponsorsfor them to disagree with the Directors’ view above.
COMPETITION
The power tools and OPE industries are relatively concentrated and highly competitive, and we facecompetition in all aspects of our business. We generally compete with other global and domestic leadersin the power tool and OPE industries. As confirmed by our Industry Consultant, despite the relativeconcentration of the industry, there are more than 1,000 market players in the global power tool and OPEmarkets. We compete on the basis of what we consider to be the principal competitive factors in ourindustry, including our reputation for product quality, emphasis on product innovation and development,the breadth of our product lines, our well-known brands and our strong customer relationships andafter-sales services. We also experience significant competition for highly skilled personnel, includingmanagement, engineers, designers and product managers, as our growth depends in part on our ability toretain our existing personnel and recruit highly skilled employees.
We maintain our competitive position and seek to gain market shares from our competitors byproviding innovative products, maintaining high-quality standards and managing our brand strategy tooffer different products to different customer segments.
BUSINESS
– 253 –
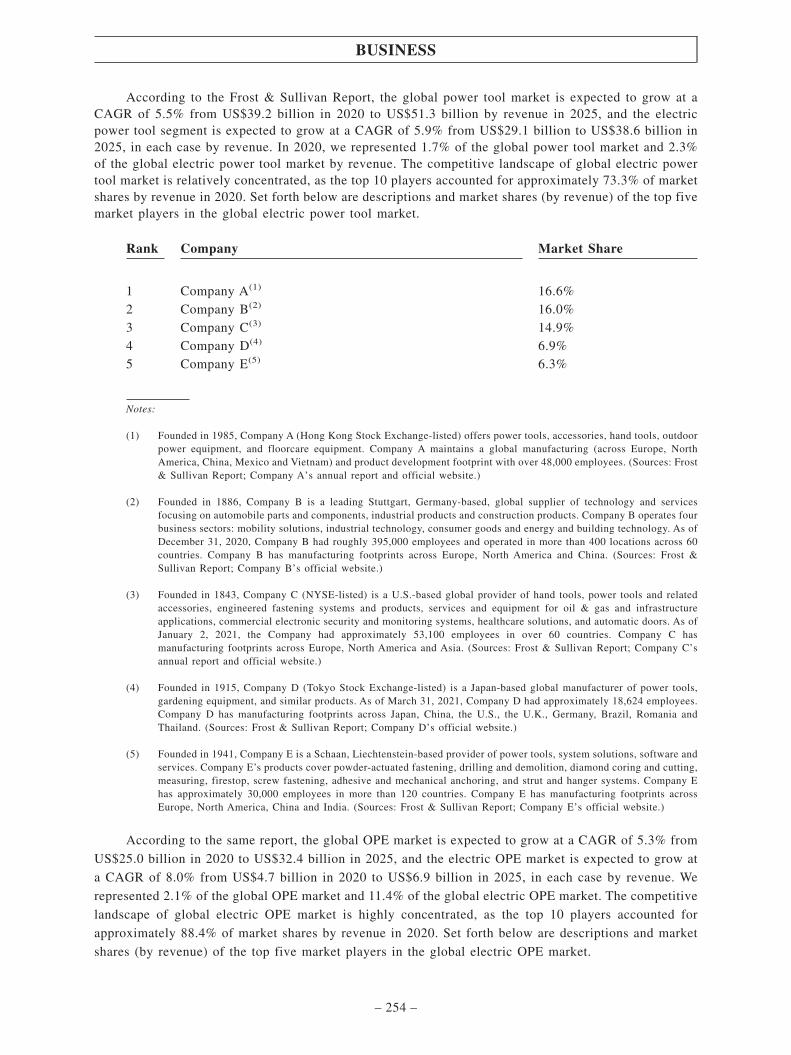
According to the Frost & Sullivan Report, the global power tool market is expected to grow at aCAGR of 5.5% from US$39.2 billion in 2020 to US$51.3 billion by revenue in 2025, and the electricpower tool segment is expected to grow at a CAGR of 5.9% from US$29.1 billion to US$38.6 billion in2025, in each case by revenue. In 2020, we represented 1.7% of the global power tool market and 2.3%of the global electric power tool market by revenue. The competitive landscape of global electric powertool market is relatively concentrated, as the top 10 players accounted for approximately 73.3% of marketshares by revenue in 2020. Set forth below are descriptions and market shares (by revenue) of the top fivemarket players in the global electric power tool market.
Rank Company Market Share
1 Company A(1) 16.6%2 Company B(2) 16.0%3 Company C(3) 14.9%4 Company D(4) 6.9%5 Company E(5) 6.3%
Notes:
(1) Founded in 1985, Company A (Hong Kong Stock Exchange-listed) offers power tools, accessories, hand tools, outdoorpower equipment, and floorcare equipment. Company A maintains a global manufacturing (across Europe, NorthAmerica, China, Mexico and Vietnam) and product development footprint with over 48,000 employees. (Sources: Frost& Sullivan Report; Company A’s annual report and official website.)
(2) Founded in 1886, Company B is a leading Stuttgart, Germany-based, global supplier of technology and servicesfocusing on automobile parts and components, industrial products and construction products. Company B operates fourbusiness sectors: mobility solutions, industrial technology, consumer goods and energy and building technology. As ofDecember 31, 2020, Company B had roughly 395,000 employees and operated in more than 400 locations across 60countries. Company B has manufacturing footprints across Europe, North America and China. (Sources: Frost &Sullivan Report; Company B’s official website.)
(3) Founded in 1843, Company C (NYSE-listed) is a U.S.-based global provider of hand tools, power tools and relatedaccessories, engineered fastening systems and products, services and equipment for oil & gas and infrastructureapplications, commercial electronic security and monitoring systems, healthcare solutions, and automatic doors. As ofJanuary 2, 2021, the Company had approximately 53,100 employees in over 60 countries. Company C hasmanufacturing footprints across Europe, North America and Asia. (Sources: Frost & Sullivan Report; Company C’sannual report and official website.)
(4) Founded in 1915, Company D (Tokyo Stock Exchange-listed) is a Japan-based global manufacturer of power tools,gardening equipment, and similar products. As of March 31, 2021, Company D had approximately 18,624 employees.Company D has manufacturing footprints across Japan, China, the U.S., the U.K., Germany, Brazil, Romania andThailand. (Sources: Frost & Sullivan Report; Company D’s official website.)
(5) Founded in 1941, Company E is a Schaan, Liechtenstein-based provider of power tools, system solutions, software andservices. Company E’s products cover powder-actuated fastening, drilling and demolition, diamond coring and cutting,measuring, firestop, screw fastening, adhesive and mechanical anchoring, and strut and hanger systems. Company Ehas approximately 30,000 employees in more than 120 countries. Company E has manufacturing footprints acrossEurope, North America, China and India. (Sources: Frost & Sullivan Report; Company E’s official website.)
According to the same report, the global OPE market is expected to grow at a CAGR of 5.3% from
US$25.0 billion in 2020 to US$32.4 billion in 2025, and the electric OPE market is expected to grow at
a CAGR of 8.0% from US$4.7 billion in 2020 to US$6.9 billion in 2025, in each case by revenue. We
represented 2.1% of the global OPE market and 11.4% of the global electric OPE market. The competitive
landscape of global electric OPE market is highly concentrated, as the top 10 players accounted for
approximately 88.4% of market shares by revenue in 2020. Set forth below are descriptions and market
shares (by revenue) of the top five market players in the global electric OPE market.
BUSINESS
– 254 –

Rank Company Market Share
1 Company A 20.4%2 Our Company 11.4%3 Company C 10.4%4 Company B 10.4%5 Company J(1) 10.1%
Note:
(1) Founded in 2002, Company J is a PRC-based provider of outdoor power equipment for both consumers and landscapingprofessionals. Company J also manufactures private label products, as well as other products as original equipmentmanufacturers. Company J has manufacturing footprints across China and the U.S. (Sources: Frost & Sullivan Report;Company J’s official website.)
Please refer to the section headed “Industry Overview – Competitive Landscape” for further details.
PROPERTIES
We occupy certain properties in China and overseas in connection with our business operations.These properties are used for non-property activities as defined under Rule 5.01(2) of the Listing Rules.They mainly include premises for our manufacturing facilities, warehouses and offices.
As of the Latest Practicable Date, none of the properties owned or leased by us had a carryingamount of 15% or more of our consolidated total assets. Therefore, according to Chapter 5 of the ListingRules and section 6(1) of the Companies (Exemption of Companies and Prospectuses from Compliancewith Provisions) Notice (Cap. 32L of the Laws of Hong Kong), this document is exempted fromcompliance with the requirements of section 38(1)(b) of the Companies (Winding Up and MiscellaneousProvisions) Ordinance in relation to paragraph 34(2) of the Third Schedule to the Companies (Winding Upand Miscellaneous Provisions) Ordinance which requires a valuation report with respect to all our interestsin land or buildings.
Our Owned or Leased Properties in the PRC
To carry out our principal operations in China, we have three parcels of owned land, three ownedproperties and 11 leased properties primarily for industrial use, factories and offices.
Owned Land and Properties
As of the Latest Practicable Date, we owned three parcels of land with an aggregate site area ofapproximately 378,654.02 sq.m.
Our headquarters are located in Nanjing, PRC, where we owned three properties with an aggregatefloor area of approximately 220,203.53 sq.m. used as manufacturing facilities and offices to support ourbusiness operations as of the Latest Practicable Date. A substantial majority of our employees are basedin Nanjing, PRC.
Our PRC Legal Adviser confirmed that, as of the Latest Practicable Date, we had obtained allrelevant properties title certificates and other relevant land use rights certificates for our materialmanufacturing facilities in China.
BUSINESS
– 255 –

Leased Properties
As of the Latest Practicable Date, we leased 11 properties in Nanjing, Hangzhou and Changchun,
PRC, with an aggregate floor area of approximately 133,439 sq.m. used as manufacturing facilities, offices
and warehouses to support our business operations.
Title defects
As of the Latest Practicable Date, we were not provided with a valid title certificate in respect of one
of our leased properties, which covers a total gross floor area of approximately 4,790 sq.m., or 3.59% of
our total leased properties. The leased property with title defects has been used as our temporary
warehouse. In the event that the validity of such lease is challenged by third parties, we will have to
relocate to other premises. We believe we will be able to seek an alternative location with comparable rent
rates within a reasonable period of time. There are no safety issues associated with the leased property
with title defects. Our Directors believe that such title defects individually or collectively would not
materially affect our business and results of operations.
Non-registration of Lease Agreements
As of the Latest Practicable Date, we had not completed the registration of all 11 lease agreements
relating to our leased properties in PRC. These leased properties had an aggregate gross floor area of
approximately 133,439 sq.m. These non-compliance incidents were primarily caused by lack of
cooperation from the landlords in registering lease agreements. We were advised by our PRC Legal
Adviser that we might be ordered to rectify this non-compliance by competent authorities and if we fail
to rectify within a certain period, a penalty of RMB1,000 to RMB10,000 per agreement may be imposed
on us as a result of non-registration. The maximum potential penalties in connection with the
non-registration of our lease agreements are RMB110,000 (US$17,267.9).
As of the Latest Practicable Date, we did not receive any notice from any regulatory authority withrespect to potential administrative penalties or enforcement actions as a result of our failure to register theleases described above. Our PRC Legal Adviser has advised us that the failure to register the leaseagreements would not affect the validity of the lease agreements. For more information relating to risksassociated with this non-compliance, please refer to the section headed “Risk Factors – Risks Relating toOur Industry and Business – Defects related to certain properties leased by us in China may adverselyaffect our ability to use such properties” in this prospectus. Although we may be fined by the relevantauthorities, given the maximum amount of the potential penalties is relatively low, our Directors believethat there will not be any material adverse impact on our overall business, financial conditions or resultsof operations.
Going forward, we will renew our lease for a certain property only if such property: (i) is compliantwith all environment, health and safety laws and regulations, (ii) is not subject to any dispute, lawsuit orother factors that may affect our use, (iii) offers quality property management service, and (iv) is locatedat a place with sufficient substitute properties in case we cannot renew our lease. These properties are usedfor non-property activities as defined under Rule 5.01(2) of the Listing Rules.
As advised by our PRC Legal Adviser, the leased properties with certain defects will not,individually or in the aggregate, materially and adversely affect our business and operation.
BUSINESS
– 256 –

Our Properties in Jurisdictions outside the PRC
We own and lease certain properties in jurisdictions outside the PRC including but not limited to
Vietnam, Germany, United States, France, United Kingdom and Australia. Such properties are mainly used
for purposes such as offices, production facilities and research and development centers.
INTELLECTUAL PROPERTY
Intellectual property is fundamental to our success and competitiveness, and we devote significant
time and resources to their development and protection. As of June 30, 2021, we had more than 1630
patents, more than 570 registered trademarks as well as certain domain names globally.
We rely upon a combination of patent, trade secret, copyright and trademark laws, license
agreements, confidentiality procedures, nondisclosure agreements with employees, customers and others,
and technical measures to protect intellectual property used in our businesses. In addition, our employees
must enter into a standard employment contract which includes a clause acknowledging that all inventions,
trade secrets, developments and other processes generated by them during their employment with us are
our properties, and assigning to us any ownership rights that they may claim in those works. If we are
unable to protect our patents, copyrights, trademarks and domain names adequately, that could have a
material adverse effect on our business and prevent us in establishing and maintaining our brands.
We also rely on certain intellectual property rights licensed from third parties. These third-party
licenses may not continue to be available to us on commercially reasonable terms. Our loss of or inability
to maintain or obtain upgrades to any of these licenses could significantly harm us. In addition, because
we license content from third parties, we may be exposed to copyright infringement actions if those parties
are subject to claims regarding the origin and ownership of that content. Furthermore, despite our
precautions, third parties may obtain and use intellectual property that we own or license without our
consent.
During the Track Record Period, we were involved in certain intellectual property-related legal
proceedings or claims, and such claims and legal proceedings individually or in aggregate have not had
and would not have, any material financial or operational adverse impact on us. However, future
unauthorized use of our intellectual property by third parties and the expenses incurred in protecting our
intellectual property rights from such unauthorized use may adversely affect our business and results of
operations. See the section headed “Risk Factors – Risks Related to Our Industry and Business – Our
business depends in part on our ability to protect our intellectual property rights and operating without
infringing on the rights of third parties” in this prospectus for more details.
Below is a summary of the intellectual property-related lawsuits filed against our subsidiaries during
the Track Record Period and up to the Latest Practicable Date. None of these cases have had, or are
expected to have, a material adverse effect on our business or results of operations.
BUSINESS
– 257 –

Settled Cases
• On January 21, 2020, an intellectual property legal services provider filed a lawsuit in the
United States against Chervon NA, alleging patent infringement involving certain battery packs
for cordless power tools. The parties have reached a settlement agreement on April 20, 2020,
whereby the plaintiff has granted Chervon NA and its subsidiaries a non-exclusive and
non-sublicensable use of the relevant patent for US$40,000.
• On April 20, 2021, a power tool provider filed a lawsuit in the United States against Chervon
NA alleging infringement of a non-registered trademark. The parties reached a settlement on
June 25, 2021, whereby Chervon NA paid US$18,000 in legal costs to the plaintiff.
Because the two above cases were settled before the courts ruled on the merits of the disputes, we
were not found by the courts to have infringed on the intellectual property rights of the plaintiffs.
Furthermore, the settlement agreement in each case stipulates that we make no admission as to the alleged
infringement, and the parties are mutually released from each other’s claims.
Ongoing Case
• On February 23, 2018, a battery pack manufacturer and a research institution jointly filed a
lawsuit in the United States against Chervon NA, primarily alleging patent infringement
involving the EGO POWER+ batteries for electric OPE. The discovery stage of the case is
close to completion as of the Latest Practicable Date, and based on the advice from our legal
counsel on this case, we do not expect the amount of damages to be claimed by the plaintiffs
will be material.
We have established a comprehensive policy that enables us to manage risks related to intellectual
property violations. The policy is embedded into the overall product development process, covering
product definition, research and development, manufacturing and sales. The policy also sets forth roles and
responsibilities for company teams such as technical supervisors, research engineers and patent analysts
with respect to identifying and mitigating relevant risks. Please refer to the section headed “– Risk
Management and Internal Control – Internal Control Risk Management” for further details.
Based on the due diligence conducted on, among other things, (i) the background and impact of the
intellectual property-related lawsuits, (ii) the litigation and compliance records of the Company and the
Directors and (iii) the internal control measures adopted by the Company, and taking into account the
relevant experience and track record of the Directors, nothing has come to the attention of the Joint
Sponsors with respect to the intellectual property-related lawsuits which would cast doubt on Directors’
competence and integrity to manage the Company’s business in a law-abiding manner and their suitability
to act as directors of a listed company under Rules 3.08 and 3.09.
INSURANCE
We maintain various insurance policies, including:
• Property damage all risk insurance on our fixed assets, equipment and inventory;
• Marine cargo insurance;
BUSINESS
– 258 –
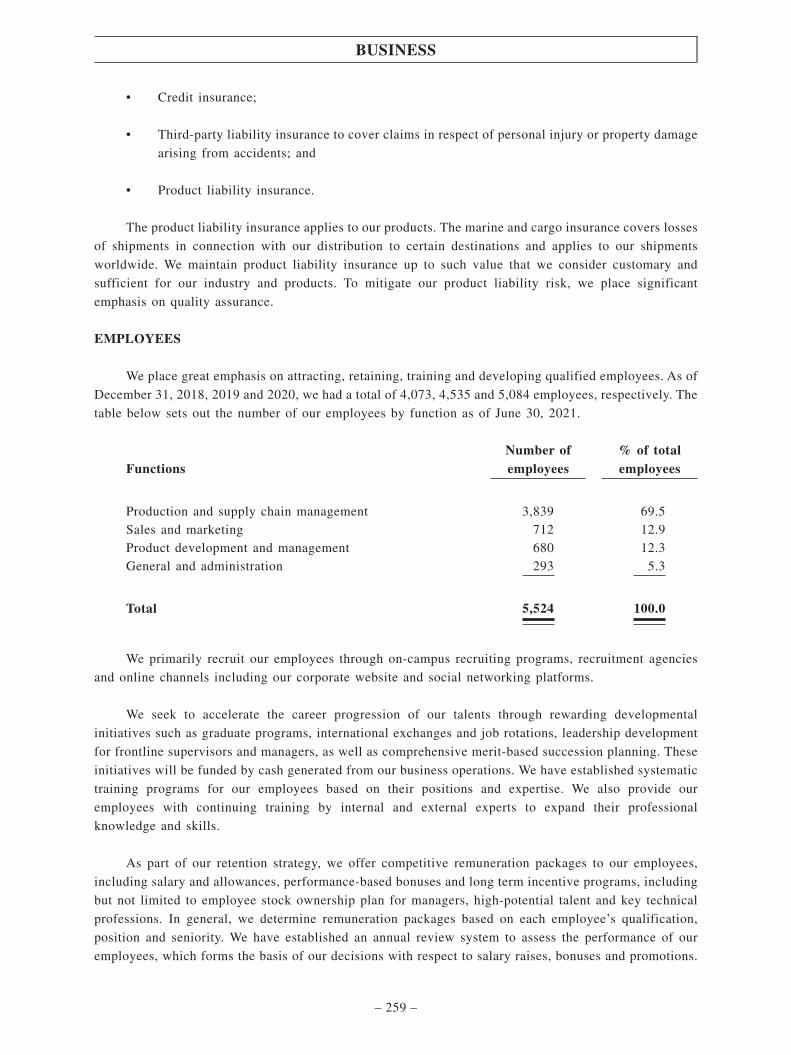
• Credit insurance;
• Third-party liability insurance to cover claims in respect of personal injury or property damage
arising from accidents; and
• Product liability insurance.
The product liability insurance applies to our products. The marine and cargo insurance covers losses
of shipments in connection with our distribution to certain destinations and applies to our shipments
worldwide. We maintain product liability insurance up to such value that we consider customary and
sufficient for our industry and products. To mitigate our product liability risk, we place significant
emphasis on quality assurance.
EMPLOYEES
We place great emphasis on attracting, retaining, training and developing qualified employees. As of
December 31, 2018, 2019 and 2020, we had a total of 4,073, 4,535 and 5,084 employees, respectively. The
table below sets out the number of our employees by function as of June 30, 2021.
FunctionsNumber ofemployees
% of totalemployees
Production and supply chain management 3,839 69.5Sales and marketing 712 12.9Product development and management 680 12.3General and administration 293 5.3
Total 5,524 100.0
We primarily recruit our employees through on-campus recruiting programs, recruitment agencies
and online channels including our corporate website and social networking platforms.
We seek to accelerate the career progression of our talents through rewarding developmental
initiatives such as graduate programs, international exchanges and job rotations, leadership development
for frontline supervisors and managers, as well as comprehensive merit-based succession planning. These
initiatives will be funded by cash generated from our business operations. We have established systematic
training programs for our employees based on their positions and expertise. We also provide our
employees with continuing training by internal and external experts to expand their professional
knowledge and skills.
As part of our retention strategy, we offer competitive remuneration packages to our employees,
including salary and allowances, performance-based bonuses and long term incentive programs, including
but not limited to employee stock ownership plan for managers, high-potential talent and key technical
professions. In general, we determine remuneration packages based on each employee’s qualification,
position and seniority. We have established an annual review system to assess the performance of our
employees, which forms the basis of our decisions with respect to salary raises, bonuses and promotions.
BUSINESS
– 259 –
As required under PRC regulations, we participate in housing fund and various employee social security
plans that are organized by applicable local municipal and provincial governments, including housing,
pension, medical, work-related injury and unemployment benefit plans, under which we make
contributions at specified percentages of the salaries of our employees. In addition to regulatory social
insurances, we also provide supplemental commercial health and life insurances to secure the health and
wellbeing of our employees and their families.
We enter into standard labor contracts and confidentiality agreements with our employees.
We believe that we maintain a constructive working relationship with our employees and we did not
experience any significant labor disputes or any difficulty in recruiting staff for our operations.
ENVIRONMENTAL, OCCUPATIONAL, HEALTH AND SAFETY
We are subject to evolving and increasingly stringent environmental, occupational, health and safety
laws and regulations. We impose safety and anti-pollution measures as well as internal safety and
environmental inspections at all stages of the production process to minimize the possibility of
work-related accidents and injuries, occupational illness and environmental contamination. We believe
that our operations are in substantial compliance with the terms of applicable health, safety and
environmental laws and regulations as currently interpreted in all material respects. During the Track
Record Period and up to the Latest Practicable Date, we have not been subject to any material fines or
other penalties due to non-compliance in relation to environmental, health or occupational safety laws and
regulations and have not been involved in any significant accident, or claim for personal or property
damage made by our employees which had materially and adversely affected our financial condition or
business operations.
Compliance with more stringent laws, regulations and enforcement policies may require additional
expenditures by us that may materially affect our consolidated financial condition, results of operations
or cash flows. Refer to the sections headed “Regulatory Overview” and “Risk Factors – Risks Related to
Our Industry and Business – We are subject to national and local environmental and health and safety
directives, laws and regulations.” in this prospectus for more details.
Health and Safety Regulation
We are subject to health and safety laws and regulations in the jurisdictions in which we operate. For
example, in the PRC, we are subject to various workplace safety regulatory requirements such as the Work
Safety Law of the People’s Republic of China (《中華人民共和國安全生產法》). In the United States, we
are subject to certain labor and employment laws regarding workplace safety. In Germany, we are subject
to the laws of the European Union as well as certain local regulations. Our products must meet safety
standards in the jurisdictions in which they are sold and/or used. In addition, because lithium is deemed
a dangerous substance under relevant regulations, we must package and transport our lithium-ion batteries
and products containing such batteries in accordance with relevant international and national laws and
regulations.
BUSINESS
– 260 –
We have established a dedicated safety management department, which is responsible for handling
production safety accidents and keeping records. We also have in place comprehensive work safety
policies and procedures to promote compliance with applicable laws and regulations, which primarily
include the following:
i. Officers accountability system. We have set out clear guidance in the safety policies and
procedures in relation to the responsibilities of personnel at all levels in each of our operating
departments and manufacturing facilities.
ii. Well-established work safety system. Our work safety system standardizes our operations such
that our employees can easily adhere to our safety guidance to follow the appropriate work
practices.
iii. Training. We provide regular safety-related training and monthly production safety briefings to
our employees to raise awareness of workplace safety issues. In addition, we have adopted
emergency plans for our manufacturing facilities that designate the responsible personnel and
response procedures in the event of occupational health and safety emergencies.
iv. Regular inspections. We carry out regular safety checks on our production equipment at our
manufacturing facilities to ensure that the equipment is thoroughly tested and safe for use on
a daily or weekly basis.
v. Accident investigation and corrective measures. We maintain a system of recording, handling,
investigating and reporting accidents on a timely basis in order to develop measures to avoid
similar accidents.
vi. Performance evaluations. Work safety is an important factor in our annual performance
evaluations.
During the Track Record Period and up to the Latest Practicable Date, we have not had any material
incidents of work-related injuries or casualties or been penalized for any material non-compliance relating
to work safety laws and regulations.
Environmental Regulation
We are subject to extensive air, water and other environmental laws and regulations the jurisdictions
in which we operate, including the PRC, United States and Germany. For example, in the PRC, we are
subject to environmental regulations such as the Environmental Protection Law of the PRC (《中華人民共和國環境保護法》) and the Law of Prevention and Treatment of Environmental Pollution by Solid
Wastes (《固體廢物污染環境防治法》). In the United States, we are subject to certain federal, state and
municipal laws governing the release of pollutants into the water, air and soil. In Germany, we are subject
to various environmental initiatives promulgated by the European Union and transposed into German law,
such as certain requirements for the ecodesign of energy-related products. Government agencies that are
charged with enforcing these laws and regulations generally have the authority to inspect our facilities at
any time.
BUSINESS
– 261 –

We have implemented measures to promote compliance with applicable laws and regulations related
to environmental protection. These measures include strengthening mechanical ventilation in our factories,
installing soot purifiers in our employees’ kitchens and enhancing sewage treatment. We believe our
manufacturing process does not generate hazards that have any significant adverse effect on the
environment and our environmental protection measures are adequate to comply with applicable laws and
regulations.
We focus on developing materials-recycling and energy use measures to decrease our environmental
impact. We seek to recycle returned products and process scraps to reduce the waste we send to landfill
or to incineration facilities. We also sell our factory wastes to local materials-recycling facilities, among
which part of these wastes are sent to our suppliers for recycling.
ENVIRONMENTAL, SOCIAL AND GOVERNANCE
We seek to be a leader in fulfilling environmental, social and governance (“ESG”) responsibilities
by championing employee development, supporting social causes and exploring ways to protect the
environment. We help build a better world by actively participating in philanthropic activities involving
education, disaster relief and infrastructure for underdeveloped regions.
The Board is responsible for evaluating and managing material ESG issues. Company management
is responsible for developing the Company’s ESG strategy, policy and reporting, including assessing and
managing climate-related risks, with oversight provided by the Board. For environmental matters, our
Environmental, Health and Safety (“EHS”) department and equipment management department are
responsible for managing environmental and climate-related risks arising from our business operations.
The EHS department identifies key environmental factors, establishes operational control requirements
and procedures and conducts relevant monitoring and inspections. The EHS department also reviews and
updates the operational control procedures on an annual basis in accordance with changes to key
environmental factors, applicable laws and regulations and compliance assessments. Our internal Culture
Committee is responsible for coordinating the social activities such as charity donations and community
volunteering.
We have established a set of internal policies with respect to ESG issues covered under relevant
international standards. For environmental matters, we have adopted policies related to (i) reduction of
greenhouse gas emissions, (ii) use of environmentally friendly resources, (iii) treatment of exhaust gas,
sewage and solid waste and (iv) conservation of energy, among other aspects. For social matters, we have
adopted policies related to (i) production safety, (ii) product quality, (iii) employee health, promotion,
compensation, benefits and training and (iv) employee complaint handling and relevant privacy protection
measures, among other aspects. We conduct periodic reviews to monitor our compliance with the above
policies.
BUSINESS
– 262 –

Our business and manufacturing operations for power tools and OPE products generate (i) exhaust
gas, sewage and solid waste that if left untreated, would have a negative impact on the environment and
(ii) greenhouse gas that may lead to climate-related risks. We are committed to sustainability and
environmental protection as we continue to grow our revenue and expand our production facilities. We
have adopted comprehensive measures to mitigate environmental impact from our business, strategy and
financial performance in the near, medium and long term, as summarized below:
Focus area Key measures
Green products • Design and manufacture power tool and OPE products powered
by lithium-ion batteries, which help alleviate air pollution and
reduce environmental noises
Exhaust gas management • Adopt exhaust gas treatment system and install active carbon
filters
Greenhouse gas
management
• Increase the use of clean energy such as solar and ground source
heat
• Use energy efficient equipment at production facilities
Sewage management • Install sewage treatment system
Solid waste management • Require proper handling and disposal of solid waste
• Set up hazardous waste storage sites in accordance with relevant
standards and establish standardized hazardous waste
management system
• Engage qualified third-party suppliers for solid waste disposal
Energy and resource
conservation
• Increase the use of solar power and ground source heat
• Improve energy-saving features at production facilities, such as
energy management system and energy-saving transformers
• Conserve water by recycling rain water and installing low-flow
valves
BUSINESS
– 263 –

Further, we monitor the following metrics to assess and manage the environmental and climate-
related risks arising from our business and manufacturing operations:
Resource consumption
• Electricity consumption. We monitor our electricity consumption levels at the production
facilities and implement measures such as increasing the use of solar power and ground
source heat to improve energy efficiency. In the years ended December 31, 2018, 2019
and 2020 and six months ended June 30, 2021, our electricity consumption levels were
24.1 million kWh, 28.0 million kWh, 33.2 million kWh and 18.8 million kWh,
respectively.
• Water consumption. We monitor our water consumption levels at the production facilities
and implement measures such as recycling rain water and installing low-flow valves to
promote water conservation. In the years ended December 31, 2018, 2019 and 2020 and
six months ended June 30, 2021, our water consumption levels were 338.4 thousand tons,
308.1 thousand tons, 341.6 thousand tons and 212.7 thousand tons, respectively.
Pollutant management
• Exhaust gas discharge. We monitor our exhaust gas discharge levels on a periodic basis.
In the years ended December 31, 2018, 2019 and 2020 and six months ended June 30,
2021, our exhaust gas discharge levels were 5.0 tons, 0.5 tons, 1.1 tons and 0.6 tons,
respectively, and such exhaust gas was properly treated prior to discharge.
• Sewage discharge. We monitor our sewage discharge levels on a periodic basis. In the
years ended December 31, 2018, 2019 and 2020 and six months ended June 30, 2021, our
sewage discharge levels were 270.7 thousand tons, 246.5 thousand tons, 273.3 thousand
tons and 170.1 thousand tons, respectively, and such sewage was properly treated prior
to discharge.
• Hazardous waste discharge. We monitor our hazardous waste discharge levels on a
periodic basis. In the years ended December 31, 2018, 2019 and 2020 and six months
ended June 30, 2021, our hazardous waste discharge levels were 289 tons, 148 tons, 134
tons and 119 tons, respectively, and such waste was disposed by qualified third parties.
For further details related to our policies relating to environmental matters, health and workplace
safety, please see the paragraph headed “– Environmental, Occupational, Health and Safety” in this
section.
Set forth below is a summary of our recent key initiatives with respect to social responsibility and
environmental protection.
BUSINESS
– 264 –

Social Responsibility
Since our founding, we have strived to be a responsible corporate citizen for our society and the
world in which we work and live. We are actively involved in social causes, including various short- and
long-term projects in close cooperation with non-profit organizations. In 2013, we commenced our annual
CHERVON “Charity Run” (愛跑) initiative to encourage our employees to exercise for health, while also
supporting our social welfare undertakings. As of April 30, 2021, we have donated more than RMB1.3
million in proceeds from the Charity Run initiative to support our “Water Cellar” project that benefited
the drought-stricken area in western China, our “Ya’an post-disaster school reconstruction” (四川雅安災後學校重建) projects and other social initiatives. Since 2016, we have been part of the Spring Bud
Learning Support (春蕾助學) initiative through donation and volunteer teaching to help support education
in Northern Jiangsu (蘇北). In 2020, the initiative changed its name to New Bud Learning Support (新芽助學) and expanded the coverage to a wider population of economically disadvantaged children who
possess high intellect and moral character.
In February 2020, we undertook several initiatives to help prevent the spread of the COVID-19
pandemic, including donations and a fund-raising campaign that resulted in total proceeds of over RMB
1.2 million.
Due to our efforts in connection with fulfilling our social responsibilities, we received the Social
Responsibility Award from the China Europe International Business School in 2018.
Environmental Protection
As a manufacturing business, we understand our critical role in environmental protection and have
been applying the concepts of “green, low-carbon emission and eco-efficient” to our business growth and
development. After years of research and development, we commercialized one of the first high-voltage
OPE products under our EGO brand. Unlike traditional gasoline engines products that generate noises and
pollutions, our EGO OPE products are designed to help significantly reduce carbon emissions while
enhancing user experience.
We seek to minimize our environmental impact through developing and integrating environmentally
sustainable practices into our operations. Our environmental initiatives and awards include, but are not
limited to the following:
• CHERVON’s Green Roof. In 2004, we installed the “Green Roof” system on the buildings of
our research and development headquarters, covering roof areas of approximately 7,000 sq.m..
The system uses green plants as roofing materials to insulate heat and filter rainwater, and it
can reduce oil consumption by approximately 35,000 liters per year.
• CHERVON’s Blue Roof. We equipped our CHERVON Green Power Industrial Park (泉峰新能源工業園) based in Nanjing, PRC with new technology and equipment, including a rooftop
photovoltaic power station that can generate solar power of 2,000 megawatt hours and reduce
CO2 emissions by approximately 730 tons per year. The solar water heating system on the
facility collects solar heat and can save approximately 244 tons of standard coal on an annual
basis. The production facility is also equipped with solar street lights, which can save
approximately 4.5 tons of standard coal on an annual basis.
BUSINESS
– 265 –

• Using the Earth to Save the Earth. We equipped our CHERVON Green Power Industrial Park
with an advanced ground-source heat-pump system that is designed to provide for air
conditioning in the buildings. Applying advanced geothermal technologies, this system uses the
earth itself as a heat source in the winter and a heat sink in the summer, which translates into
an annual reduction of CO2 emissions by approximately 839 tons.
• Environmental Vendor. We earned the LEEDS certification for Leadership in Energy and
Environmental Design for our North America headquarters in Naperville, Ill. This newly
constructed building hosts more than 100 of our employees.
In 2021, we have qualified for and obtained a “green loan” of approximately US$10.0 million from
a leading international bank based on our fulfillment of our social responsibilities by reducing annual
carbon emissions.
AWARDS AND RECOGNITION
During the Track Record Period, we have received recognition with respect to our products, research
and development capabilities, including but are not limited to the following:
Awards/Recognition Entity/Product Awarding Authority/Entity
Year ofAward/Recognition
Industry
Red Dot Design Award Various FLEX
products
Nordrhein Westfalen Design Center 2018
Pro-Tool Innovation Award Various EGO and
SKIL products
Pro-Tools Reviews 2019 to 2020
Plus X Award Various FLEX
products
Media Society Networks 2019 to 2020
Australian Business Award
(ABA100)
Various EGO
products
Award Base 2020
Partner of the Year 2018 CHERVON Home Depot 2018
Environmental Partner of
Year 2019
CHERVON; EGO
lithium-ion battery
OPE product line
Home Depot 2019
Vendor Partner of the Year in
the Power Tool Division
CHERVON Lowe’s 2020
BUSINESS
– 266 –

Awards/Recognition Entity/Product Awarding Authority/Entity
Year ofAward/Recognition
Leading Enterprise Laboratory
in Chinese Power Tool Industry
CHERVON Testing
Center
Productivity Promotion Center of
Electric Tool Industry (電動工具行業生產力促進中心)
2021
Government
High and New Tech Enterprises
(國家高新技術企業)
Nanjing Chervon
Industry Co., Ltd (南京德朔實業有限公司)
Department of Science and
Technology of Jiangsu Province;
Department of Finance of Jiangsu
Province; Jiangsu Provincial Tax
Service, State Taxation Bureau;
Jiangsu Provincial Tax Service,
Local Taxation Bureau
2016
Jiangsu Province Engineering
Research Center of Renewable
Energy Tools (江蘇省新能源工具工程技術研究中心)
Nanjing Chervon
Industry Co., Ltd (南京德朔實業有限公司)
Jiangsu Provincial Department of
Science and Technology
2016
Brand Name Product of
Nanjing (南京市名牌產品)
DEVON wood work
series of power tools
and EGO OPE
products
Nanjing Municipal People’s
Government
2017
Gold Award for Industrial
Design, Designated by Jiangsu
Province (“江蘇省工業設計”金獎)
EGO; string
trimmers
Department of Industry and
Information Technology of Jiangsu
Province
2018
Model Smart Factories – Power
Tool Smart Logistical
Production Lines, Designated
by Jiangsu Province (江蘇省示範智慧車間–動力工具智慧物流車間)
Nanjing Chervon
Industry Co., Ltd (南京德朔實業有限公司)
Department of Industry and
Information Technology of Jiangsu
Province; Department of Finance of
Jiangsu Province
2018
National Green Factories,
Designated by PRC Ministry of
Industry and Information
Technology (中華人民共和國工業和資訊化部國家綠色工廠)
Nanjing Chervon
Industry Co., Ltd (南京德朔實業有限公司)
Department of Industry and
Information Technology of Jiangsu
Province
2019
BUSINESS
– 267 –
Awards/Recognition Entity/Product Awarding Authority/Entity
Year ofAward/Recognition
National Industrial Design
Center (國家級工業設計中心)
Nanjing Chervon
Industry Co., Ltd (南京德朔實業有限公司)
PRC Ministry of Industry and
Information Technology
2019
Global Brand Name and
Leading Enterprise Support and
Development in Jiangsu
Province (江蘇省重點培育和發展的國際知名品牌和領軍企業)
Nanjing Chervon
Industry Co., Ltd (南京德朔實業有限公司); EGO products
Department of Commerce of
Jiangsu Province
2017 to 2019
Jiangsu Provincial Strategic
Development Plan for
Enterprise Intellectual Property
Rights (“江蘇省企業智慧財產權戰略推進計畫”承擔單位)
Nanjing Chervon
Industry Co., Ltd (南京德朔實業有限公司)
Intellectual Property Office of
Jiangsu Province
2020
Excellence Award for Design
Patent in Nanjing City
(南京市優秀外觀專利獎)
Nanjing Chervon
Industry Co., Ltd (南京德朔實業有限公司); blower products
Intellectual Property Office of
Nanjing
2020
CERTIFICATES, LICENSES, PERMITS AND APPROVALS
As advised by our PRC Legal Adviser, as of the Latest Practicable Date, we had obtained all requisite
certificates, licenses, permits and approvals from relevant authorities that are material for our operations
in the PRC and such certificates, licenses, permits and approvals are valid and effective.
The following table sets out a list of material certificates, licenses, permits and approvals currently
held by our subsidiaries in the PRC.
Import and Export Qualifications and Permits
Certificate/License/Permit/Approval Holder Expiration Date
Registration Certificate of the Customs
of the People’s Republic of China
for the Declaration Enterprises
(報關單位註冊登記證書)
Nanjing Chervon Industry Co.,
Ltd (南京德朔實業有限公司)
N/A(1)
Registration of Foreign Trade Business
Operators (對外貿易經營者備案登記表)
Chervon (China) Tools Sales Co.,
Ltd (泉峰(中國)工具銷售有限公司)
N/A(1)
BUSINESS
– 268 –

Certificate/License/Permit/Approval Holder Expiration Date
Registration Certificate of the Customs
of the People’s Republic of China
for the Declaration Enterprises
(報關單位註冊登記證書)
Chervon (China) Tools Sales Co.,
Ltd (泉峰(中國)工具銷售有限公司)
N/A(1)
Registration of Foreign Trade Business
Operators (對外貿易經營者備案登記表)
Chervon (China) Trading Co.,
Ltd. (泉峰(中國)貿易有限公司)
N/A(1)
Registration Certificate of the Customs
of the People’s Republic of China for
the Declaration Enterprises
(報關單位註冊登記證書)
Chervon (China) Trading Co.,
Ltd. (泉峰(中國)貿易有限公司)
N/A(1)
Note:
(1) The license or permit remains effective indefinitely as long as we comply with all applicable requirements.
Environmental Permits
Certificate/License/Permit/Approval Holder Address Expiration Date
License for the Discharge
of Urban Sewage into the
Drainage Network (城鎮污水排入排水管網許可證)
Nanjing Chervon
Industry Co., Ltd
(南京德朔實業有限公司)
No. 99 West Tianyuan Road,
Jiangning Economic and
Technological Development
Zone, Nanjing, Jiangsu
Province, 211106
Aug. 29, 2024
Pollutant Discharge Permit
(排污許可證)
Nanjing Chervon
Industry Co., Ltd
(南京德朔實業有限公司)
No. 159 Jiangjun Avenue,
Jiangning Economic and
Technological Development
Zone, Nanjing, Jiangsu
Province 211106
Dec. 22, 2022
License fort the Discharge
of Urban Sewage into the
Drainage Network (城鎮污水排入排水管網許可證)
Nanjing Chervon
Industry Co., Ltd
(南京德朔實業有限公司)
No. 529, Jiangjun Avenue,
Jiangning Economic and
Technological Development
Zone, Nanjing, Jiangsu
Province 211106
Sep. 28, 2023
Registration Receipt for
Pollutant Discharge of
Fixed Pollution Sources
(固定污染源排污登記回執)
Nanjing Chervon
Industry Co., Ltd
(南京德朔實業有限公司)
No. 529, Jiangjun Avenue,
Jiangning Economic and
Technological Development
Zone, Nanjing, Jiangsu
Province 211106
Apr. 11, 2025
BUSINESS
– 269 –
As of the Latest Practicable Date, we have obtained all licenses, permits, approvals and certificates
that are material and necessary for our material business operations outside the PRC, and such licenses,
permits, approvals and certificates are valid and effective.
The following table sets out a list of material certificates, licenses, permits and approvals currently
held by our subsidiaries in Germany. There are no required licenses, permits, approvals or certificates in
jurisdictions outside of the PRC and Germany that are material to our business operations.
Certificate/License/Permit/Approval Holder Expiration Date
LUCID Registry (registration of packaging
manufacturer/importer pursuant to the German
Packing Act)
Flex Elektrowerkzeuge GmbH N/A(1)
Battery Act – Federal Environment Agency
Reporting Register (Registration regarding
recycling of batteries)
Flex Elektrowerkzeuge GmbH N/A(1)
Register EAR – Foundation for Waste Electrical
Equipment Register (various registrations
pursuant to the German Electrical Act)
Flex Elektrowerkzeuge GmbH N/A(1)
LUCID Registry (Registration of packaging
manufacturer/importer pursuant to the German
Packing Act)
EGO Europe GmbH N/A(1)
Landbell AG für Rückhol-Systeme (Registration
and licensing regarding recycling of packaging
pursuant to the German Packing Act)
EGO Europe GmbH N/A(1)
Battery Act – Federal Environment Agency
Reporting Register (Registration regarding
recycling of batteries)
EGO Europe GmbH N/A(1)
Register EAR – Foundation for Waste Electrical
Equipment Register (various registrations
pursuant to the German Electrical Act)
EGO Europe GmbH N/A(1)
Note:
(1) The license or permit remains effective indefinitely as long as we comply with all applicable requirements.
BUSINESS
– 270 –
LEGAL PROCEEDINGS AND COMPLIANCE
Legal Proceedings
From time to time, we have been, and may in the future be, involved in arbitration, litigation or
regulatory proceedings relating to various aspects of our operations in the ordinary course of our business.
See the section headed “Risk Factors – Risks Related to Our Industry and Business – Our failure to
continue to successfully avoid, manage, defend, litigate and accrue for claims and litigation could
negatively impact our results of operations or cash flows.” in this prospectus for more details. We are
currently not a party to any material legal or administrative proceedings.
From time to time, we settle certain of the litigations we have been involved in. We believe none of
these settlements have a material adverse effect on our financial results and reputations.
Our Directors have confirmed that, during the Track Record Period and up to the Latest Practicable
Date, there were no legal proceedings pending or threatened against us or our Directors that could,
individually or in the aggregate, have a material adverse effect on our business, financial condition and
results of operations. As such, we did not make any provisions for any legal proceedings or claims during
the Track Record Period.
BUSINESS
– 271 –

Com
pli
ance
The
foll
owin
gta
ble
sets
fort
hou
rno
n-co
mpl
ianc
ein
cide
nts
unde
rth
ere
leva
ntP
RC
law
san
dre
gula
tion
sdu
ring
the
Tra
ckR
ecor
dP
erio
dan
dup
toth
eL
ates
tP
ract
icab
leD
ate,
and
the
corr
ecti
veac
tion
sw
eha
veta
ken
inre
spon
seto
thes
ein
cide
nts:
Non-
comp
lianc
einc
iden
tsRe
ason
sfor
then
on-co
mplia
nce
Lega
lcon
sequ
ence
sand
maxim
umpe
nalti
esRe
medi
esan
dre
ctific
ation
meas
ures
take
n
Acco
rding
tothe
Chine
seSo
cialI
nsur
ance
Law
(《中華
人民共和國社會保險法》)
and
other
relev
antr
egula
tions
,we
arereq
uired
topr
ovide
oure
mploy
eesw
ithwe
lfare
sche
mesc
overi
ngso
ciali
nsur
ance
.
Acco
rding
tothe
Regu
lation
sonA
dmini
strati
onof
Hous
ingPr
ovide
ntFu
ndof
thePR
C(《住房公積金管理
條例》)
,wea
rereq
uired
toma
keho
using
prov
ident
fund
contr
ibutio
nsfo
rour
emplo
yees
.
Durin
gthe
Trac
kRe
cord
Perio
d,we
failed
toma
keco
ntribu
tions
tothe
socia
lins
uran
cean
dho
using
prov
ident
fund
swith
respe
ctto
certa
inof
oure
mploy
ees,
most
ofwh
omare
prod
uctio
nlin
ewor
kers,
infu
llam
ount
asreq
uired
bythe
relev
antP
RClaw
sand
regula
tions
.In
theye
arsen
ded
Dece
mber
31,2
018,
2019
and
2020
and
sixmo
nthse
nded
June
30,2
021,
wees
timate
thesh
ortfa
llam
ounts
ofsu
chso
ciali
nsur
ance
and
hous
ingpr
ovide
ntfu
ndco
ntribu
tions
were
RMB1
4.1mi
llion
,RM
B15.4
milli
on,R
MB1
7.0mi
llion
and
RMB1
0.0mi
llion
,res
pecti
vely.
Thes
enon
-comp
lianc
einc
idents
occu
rred
prim
arily
beca
use:
(i)we
have
alarg
elab
orfo
rcewi
threl
ative
lyhig
hmo
bility
and
(ii)a
certa
innu
mber
ofou
rpro
ducti
onlin
ewor
kers
were
notw
illing
tobe
arthe
costs
asso
ciated
with
socia
lins
uran
cean
dho
using
prov
ident
fund
sstri
ctly
inpr
opor
tion
tothe
irsa
lary.
OurP
RCLe
galA
dvise
rhas
advis
edus
that,
unde
rPRC
lawsa
ndreg
ulatio
ns,i
nres
pect
ofou
tstan
ding
socia
lins
uran
ceco
ntribu
tions
,the
relev
antP
RCau
thorit
iesma
yde
mand
usto
pay
theou
tstan
ding
socia
lins
uran
ceco
ntribu
tions
withi
nas
tipula
tedde
adlin
eand
wema
ybe
liable
toal
atepa
ymen
tfee
equa
lto
0.05%
ofthe
outst
andin
gam
ount
fore
ach
day
ofde
lay;i
fwef
ailto
make
such
paym
ents,
wema
ybe
liable
toaf
ineof
onet
othr
eetim
esthe
amou
ntof
theou
tstan
ding
contr
ibutio
ns.I
nthe
years
ende
dDe
cemb
er31
,201
8,20
19an
d20
20,a
ndthe
sixmo
nthse
nded
June
30,2
021,
wees
timate
thatt
hesh
ortfa
llam
ounts
ofsu
chso
cial
insur
ance
contr
ibutio
nswe
reRM
B10.6
milli
on(U
S$1.7
milli
on),
RMB1
1.6mi
llion
(US$
1.8mi
llion
),RM
B12.8
milli
on(U
S$2.0
milli
on)a
ndRM
B7.5
milli
on(U
S$1.2
milli
on),
and
theco
rresp
ondin
glat
epay
ment
feest
hatw
emay
belia
blefo
rare
RMB1
.9mi
llion
(US$
0.3mi
llion
),RM
B2.1
milli
on(U
S$0.3
milli
on),
RMB2
.3mi
llion
(US$
0.4mi
llion
)and
RMB0
.7mi
llion
(US$
0.1mi
llion
),res
pecti
vely.
This
amou
ntsto
atota
lofR
MB7
.0mi
llion
(US$
1.1mi
llion
)in
maxim
umlat
epay
ment
feest
hatw
emay
belia
blefo
r.If
weare
orde
redto
make
such
paym
entb
yco
mpete
ntgo
vern
ment
autho
rities
,wew
illdo
sowi
thin
thepr
escri
bed
time
perio
dan
dwe
dono
texp
ectt
oinc
urfin
esfo
rthe
outst
andin
gam
ounts
ofso
ciali
nsur
ance
contr
ibutio
ns.
OurP
RCLe
galA
dvise
rhas
also
advis
edus
that,
inthe
even
ttha
twe
failt
opa
ythe
hous
ingpr
ovide
ntfu
ndsi
nfu
llam
ount,
theho
using
prov
ident
fund
admi
nistra
tivec
enter
will
orde
rust
opa
ythe
amou
ntwi
thin
apres
cribe
dtim
elim
it.If
wefai
lto
doso
upon
theex
pirati
onof
theab
ovem
entio
ned
timel
imit,
furth
erap
plica
tion
may
bema
deto
thePe
ople’
sCou
rtfo
rcom
pulso
ryen
force
ment.
Inthe
years
ende
dDe
cemb
er31
,201
8,20
19an
d20
20,a
ndthe
sixmo
nths
ende
dJu
ne30
,202
1,we
estim
atetha
tthe
shor
tfall
amou
ntsof
such
hous
ingfu
ndsc
ontri
butio
nswe
reRM
B3.5
milli
on(U
S$0.6
milli
on),
RMB3
.8mi
llion
(US$
0.6mi
llion
),RM
B4.2
milli
on(U
S$0.7
milli
on)
and
RMB2
.5mi
llion
(US$
0.4mi
llion
),res
pecti
vely.
Ifwe
were
orde
redto
make
such
paym
ent,
wewi
lldo
sowi
thin
thepr
escri
bed
timep
eriod
,and
wedo
note
xpec
tto
incur
latep
ayme
ntfee
sorf
ines
fora
nyou
tstan
ding
amou
ntsof
contr
ibutio
ns.
OurP
RCLe
galA
dvise
riso
fthe
opini
ontha
tthe
risk
ofus
being
fined
isrem
otepr
ovide
dtha
twep
aythe
unpa
idam
ount
fors
ocial
insur
ance
and
hous
ingpr
ovide
ntfu
ndsi
nfu
llam
ount
inat
imely
mann
eraft
errec
eiving
notic
esto
rectif
ysu
chno
ncom
plian
cefro
mthe
relev
antP
RCau
thorit
ies.
Asof
theLa
testP
ractic
able
Date,
(i)we
had
notb
een
subje
ctto
any
admi
nistra
tive
actio
ns,f
ineso
rpen
alties
duet
osu
chno
n-co
mplia
nce,
(ii)w
ehad
notr
eceiv
edan
yno
tifica
tion
from
therel
evan
tPRC
autho
rities
requir
ingus
topa
yfo
roro
therw
isema
keup
thesh
ortfa
llsor
any
overd
uech
arges
with
respe
ctto
socia
lins
uran
ceco
ntribu
tions
orho
using
prov
ident
fund
contr
ibutio
ns,a
nd(ii
i)we
were
nota
ware
ofan
yem
ploye
ecom
plaint
sfile
dag
ainst
usno
rwere
weinv
olved
inan
yma
terial
labor
dispu
teswi
thou
remp
loyee
swith
respe
ctto
socia
lins
uran
ceor
hous
ingpr
ovide
ntfu
ndco
ntribu
tions
.Con
sideri
ngrel
evan
treg
ulator
ypo
licies
and
thefac
tssta
tedab
ovea
ndthe
conf
irmati
onsw
ehav
erec
eived
from
both
theco
mpete
ntPR
Cau
thorit
iesan
dou
remp
loyee
s,the
PRC
Lega
lAdv
iseri
soft
hevie
wtha
tthe
likeli
hood
thato
urPR
Csu
bsidi
aries
will
besu
bject
toce
ntrali
zed
colle
ction
ofhis
torica
lsho
rtfall
sand
any
pena
ltydu
eto
thefai
luret
oma
kefu
llso
ciali
nsur
ance
orho
using
prov
ident
fund
contr
ibutio
nsfo
remp
loyee
sofo
urPR
Csu
bsidi
aries
that
will
caus
eama
terial
adve
rseeff
ecto
nou
rbus
iness
isrem
ote.
BUSINESS
– 272 –

Non-
comp
lianc
einc
iden
tsRe
ason
sfor
then
on-co
mplia
nce
Lega
lcon
sequ
ence
sand
maxim
umpe
nalti
esRe
medi
esan
dre
ctific
ation
meas
ures
take
n
Weh
aveo
btaine
dco
nfirm
ation
sfro
mrel
evan
tcom
peten
tauth
oriti
esco
nfirm
ingtha
tthe
rewa
sno
recor
dof
ourP
RCsu
bsidi
aries
being
pena
lized
fora
nyinc
idents
ofno
n-co
mplia
nceo
rbrea
chof
thelaw
san
dreg
ulatio
nsin
relati
onto
socia
lins
uran
ceco
ntribu
tions
and
hous
ingpr
ovide
ntfu
ndsf
rom
Janu
ary1,
2018
toJu
ne30
,202
1.
Fors
ocial
insur
ance
,the
relev
antc
ompe
tenta
uthor
ities
areNa
njing
Mun
icipa
lSoc
ialIn
suran
ceM
anag
emen
tCen
ter(南京市社會保險管
理中心)
and
Nanji
ngM
unici
palH
uman
Reso
urce
sand
Socia
lSe
curit
yBu
reau,
Jiang
Ning
Distr
ict(南京市江寧區人力資源和社會
保障局)
.For
hous
ingpr
ovide
ntfu
nds,
therel
evan
tcom
peten
tau
thorit
yis
Nanji
ngHo
using
Prov
ident
Fund
Man
agem
entC
enter
,Jia
ngNi
ngSu
b-ce
nter(南京住房公積金管理中心江寧分中心
).
Asof
theLa
testP
ractic
able
Date,
wedid
notr
eceiv
eany
notic
efro
man
yreg
ulator
yau
thorit
yto
rectif
ythe
abov
enon
-comp
lianc
e.
Form
orei
nfor
matio
nrel
ating
toris
ksas
socia
tedwi
ththi
snon
-co
mplia
nce,
pleas
erefe
rto
these
ction
head
ed“R
iskFa
ctors
–Ri
sks
Relat
ingto
OurI
ndus
tryan
dBu
sines
s–W
emay
bereq
uired
toma
kead
dition
alco
ntribu
tions
ofso
ciali
nsur
ance
fund
and/o
rho
using
prov
ident
fund
and
latep
ayme
ntsan
dfin
esun
derP
RClaw
san
dreg
ulatio
ns”i
nthi
spro
spec
tus.
Wea
reco
mmitt
edto
being
fully
comp
liant
with
appli
cable
lawsa
ndreg
ulatio
ns,
and
have
begu
nto
imple
ment
meas
ures
torec
tify
ourn
on-co
mplia
ncew
ithso
cial
insur
ance
and
hous
ingpr
ovide
ntfu
ndsl
awsa
ndreg
ulatio
ns.W
eund
ertak
eto
make
timely
paym
ents
fort
hede
ficien
tamo
unta
ndov
erdue
charg
es,a
ssoo
nas
reque
sted
bythe
comp
etent
gove
rnme
ntau
thorit
ies.
Going
forw
ard,w
ewill
useo
urbe
steff
orts
tofu
llyco
mply
with
thereg
ulator
yreq
uirem
ents.
Wea
rein
thepr
oces
sofc
ommu
nicati
ngwi
thou
remp
loyee
swith
avie
wto
seek
ingthe
irun
derst
andin
gan
dco
opera
tion
inco
mplyi
ngwi
ththe
appli
cable
paym
entb
ase,
which
also
requir
esad
dition
alco
ntribu
tions
from
our
emplo
yees
.Weh
avee
nhan
ced
ouri
ntern
alco
ntrol
meas
ures
,inc
luding
enha
ncing
polic
yon
socia
lins
uran
cean
dho
using
prov
ident
fund
contr
ibutio
nsin
comp
lianc
ewi
threl
evan
tPRC
lawsa
ndreg
ulatio
ns.I
nad
dition
,weh
aved
esign
ated
ourh
uman
resou
rcesd
epart
ment
torev
iewan
dmo
nitor
therep
ortin
gan
dco
ntribu
tions
ofso
ciali
nsur
ance
and
hous
ingpr
ovide
ntfu
ndon
amon
thly
basis
.Wew
illco
ntinu
eto
cons
ultou
rcor
porat
eleg
alco
unse
lon
areg
ularb
asis
fora
dvice
onrel
evan
tPRC
lawsa
ndreg
ulatio
nsto
keep
usab
reast
ofrel
evan
treg
ulator
yde
velop
ments
.We
will
prov
idese
niorm
anag
emen
t,hu
man
resou
rcesd
epart
ment
and
relev
ants
taffs
with
traini
ngreg
arding
theleg
alan
dreg
ulator
yreq
uirem
ents
appli
cable
toou
rop
eratio
ns.W
eexp
ectt
ogr
adua
llyrec
tify
ours
ocial
insur
ance
and
hous
ingpr
ovide
ntfu
ndco
ntribu
tions
ofou
remp
loyee
sbeg
inning
inthe
seco
ndha
lfof
2021
.Our
comp
lianc
ewith
socia
lins
uran
cean
dho
using
prov
ident
fund
contr
ibutio
nsis
inpa
rtsu
bject
toco
opera
tion
from
oure
mploy
ees,
who
may
notb
erec
eptiv
eand
may
have
adiff
erent
attitu
detow
ardss
uch
contr
ibutio
nsdu
eto
thereq
uirem
entt
hatt
hey
co-co
ntribu
te.Ba
sed
ondo
cume
ntrev
iewsa
ndsa
mple
testin
g,ou
rinte
rnal
contr
olco
nsult
antd
idno
tide
ntify
instan
ceso
fina
dequ
ateor
ineffe
ctive
contr
olsin
conn
ectio
nwi
thso
cials
ecur
ityan
dho
using
prov
ident
fund
contr
ibutio
ns.
Base
don
thefo
regoin
g,ou
rDire
ctors
areof
thevie
w,an
dthe
Joint
Spon
sors
conc
ur,tha
tthe
enha
nced
intern
alco
ntrols
aread
equa
tean
dap
prop
riate
and
theref
ore,
theCo
mpan
yis
notu
nsuit
able
forl
isting
.
Cons
iderin
gthe
facts
and
therec
tifica
tion
meas
ures
discu
ssed
abov
e,we
didno
tma
kean
ypr
ovisi
onfo
rthe
shor
tfall
ofthe
socia
lins
uran
cean
dho
using
prov
ident
fund
contr
ibutio
ns,a
ndsu
chno
n-co
mplia
ncew
illno
thav
eama
terial
adve
rseeff
ect
onou
rfina
ncial
cond
ition
orres
ultso
fope
ration
s.
OurD
irecto
rsbe
lieve
there
will
notb
eany
mater
ialad
verse
impa
cton
ouro
veral
lbu
sines
s,fin
ancia
lcon
dition
sorr
esult
sofo
perat
ionsa
sares
ultof
theab
ove-
menti
oned
non-
comp
lianc
e.
BUSINESS
– 273 –

RELATIONSHIP WITH OUR CONTROLLING SHAREHOLDER(S)
Immediately following the completion of the Global Offering (assuming the Over-allotment Optionis not exercised), Mr. Pan through Panmercy will control an aggregate of 54.28% of the issued sharecapital of our Company. Therefore, Mr. Pan and Panmercy will be our Controlling Shareholders.
DELINEATION OF BUSINESS
Business of our Group
We design, develop and manufacture a wide range of (i) power tools for industrial/professional andconsumer end-users and (ii) OPE products for premium and mass-market end users. See the section headed“Business” in this prospectus for further details of our business and operations.
Other businesses of our Controlling Shareholder
Apart from our business, Mr. Pan, our Controlling Shareholder, through certain companies controlledby him (the “Excluded Group”) has invested in other businesses including, amongst others, themanufacturing of automobile components, property leasing and investment management. Details of whichare set out below:
Manufacturing of Automobile Components
Chervon Auto Precision Technology is the principal operating entity for the automobile componentmanufacturing business. It was established in the PRC with limited liability on March 19, 2012 and isprincipally engaged in the production, sales and research and development of automotive power systemsand relevant components. Its shares are currently listed on the Shanghai Stock Exchange (stock code:603982.SH.).
Property Leasing
Jiuhao Electromechanical is the principal operating entity for the property leasing business. It wasestablished in the PRC with limited liability on July 12, 2016 with a registered capital of RMB108 million.It manages and leases a self-owned industrial property located at Nanjing, PRC.
Investment Management
Nanjing Yaoquan Investment Management Co., Ltd. and Chervon International Trading are the twoprincipal operating entities for the investment management business. Nanjing Yaoquan InvestmentManagement Co., Ltd. was established in the PRC with limited liability on August 12, 2008 with aregistered capital of RMB10 million and is principally engaged in private equity fund managementbusinesses, while Chervon International Trading was established in the PRC with limited liability onJanuary 10, 1994 with a registered capital of RMB5 million and is principally engaged in secondarymarket investment.
It has been our Group’s strategy to focus on power tools and OPE products design and manufacturingbusiness. The Excluded Group held by Mr. Pan are separate and distinct from our business.
Given the differences in the nature of the business between our Group and the businesses of theExcluded Group, our Directors are of the view that there is a clear business delineation between our Groupand those operated by the Excluded Group. As a result, none of the business of the Excluded Group wouldcompete or is expected to compete, directly or indirectly, with the business of our Group.
RELATIONSHIP WITH OUR CONTROLLING SHAREHOLDERS
– 274 –

During the Track Record Period, our Group had entered into arrangement with Chervon AutoPrecision Technology, being a member of the Excluded Group in respect of the supply of electricity supplysharing services. It is expected that our Group will continue to engage the Excluded Group for theprovision of such services after Listing. See the section headed “Connected Transactions” in thisprospectus for details of such continuing connected transactions.
As of the Latest Practicable Date, none of our Controlling Shareholders, our Directors and theirrespective close associates had any interest in any business which competes or is likely to compete, eitherdirectly or indirectly with our Company’s business which would require disclosure under Rule 8.10 of theListing Rules.
INDEPENDENCE FROM OUR CONTROLLING SHAREHOLDER(S)
Having considered the following factors, our Directors are satisfied that we are capable of carryingout our business independently from our Controlling Shareholder(s) and their respective close associatesafter the Global Offering.
Management Independence
Upon Listing, our Board will comprise four executive Directors and three independent non-executiveDirectors. See “Directors and Senior Management” for further details.
As of the Latest Practicable Date, save as disclosed below, none of our Directors or members of oursenior management serves as director or member of senior management in our Controlling Shareholdersand their close associates (other than members of our Group):
NamePosition withour Company
Position with our Controlling Shareholders ortheir respective close associates
Mr. Pan Chairman, executiveDirector and chiefexecutive officer
• Director of Panmercy
• Director of Chervon Global and certain of itssubsidiaries including Chervon PrecisionTechnology Holdings Company Limited(“Chervon Precision Technology”), ChervonAssets Management Limited, Chervon AssetsHoldings Limited, Chervon CapitalManagement Limited, Chervon InvestmentLimited, Chervon Management Services,Chervon International Trading and NanjingJiuhao Electromechanical Industry Co., Ltd.*(南京玖浩機電實業有限公司) (“JiuhaoElectromechanical”)
• Director of Chervon Auto PrecisionTechnology
• Director of Chervon Auto PrecisionTechnology (Anhui) Co., Ltd.* (泉峰汽車精密技術(安徽)有限公司) a wholly-ownedsubsidiary of Chervon Auto PrecisionTechnology
RELATIONSHIP WITH OUR CONTROLLING SHAREHOLDERS
– 275 –

NamePosition withour Company
Position with our Controlling Shareholders ortheir respective close associates
Ms. Zhang Executive Directorand executive vicepresident for theNorth America salesand marketing
• Director of Chervon Global and certain of itssubsidiaries including Chervon PrecisionTechnology, Chervon Assets HoldingsLimited, Chervon Management Services andChervon International Trading
• Director of Chervon Auto PrecisionTechnology
Mr. Ke Executive Directorand executive vicepresident formanufacturing andsupply chain
• Director of Chervon Global and certain of itssubsidiaries including Chervon PrecisionTechnology, Chervon Assets Holdings Limitedand Chervon Management Services
• Director of Chervon Auto PrecisionTechnology
Mr. Hu Yian Chief financialofficer
• Supervisor of Jiuhao Electromechanical
• Director of Chervon Auto PrecisionTechnology
Despite the overlapping roles assumed by Mr. Pan, Ms. Zhang, Mr. Ke and Mr. Hu as illustrated
above, each of Mr. Pan, Ms. Zhang, Mr. Ke and Mr. Hu confirmed that their involvement in the
aforementioned companies will not affect the discharge of their duties as Directors and/or senior
management of our Group on the basis that:
(a) four out of seven Directors, being a majority of the members of the Board, do not and will not
hold any directorship or senior management position in our Controlling Shareholders or their
respective close associates;
(b) Mr. Pan, Ms. Zhang, Mr. Ke and Mr. Hu have been and will continue to be supported by the
separate and independent board and/or senior management team of our Group and the
aforementioned companies;
(c) save for Chervon Auto Precision Technology, Chervon Capital Management Limited, Chervon
Investment Limited, Chervon International Trading and Jiuhao Electromechanical, all other
companies are merely investment holding companies and do not engage in other business
activities;
(d) save for Mr. Pan, each of Ms. Zhang, Mr. Ke and Mr. Hu are taking up non-executive roles in
the aforementioned companies and do not participate in their daily management and operations;
(e) despite Mr. Pan acting as an executive director in the aforementioned companies, his role has
been limited to high-level decision-making for important strategic and policy matters and as a
result, his positions in these companies do not require him to devote substantial amount of time
in the day-to-day management of their business operations;
RELATIONSHIP WITH OUR CONTROLLING SHAREHOLDERS
– 276 –

(f) each of our Directors is aware of his/her fiduciary duties as a Director, which require, among
other things, that he/she acts for the benefit and in the best interests of our Company and does
not allow any conflict between his/her duties as a Director and his/her personal interests; and
(g) in the event that there is a potential conflict of interest arising out of any transaction to be
entered into between our Group and any of the Directors or their respective close associates,
the interested Director(s) shall abstain from voting at the relevant board meetings of our
Company in respect of such transactions and shall not be counted in the quorum. See “–
Corporate Governance Measures” below for other corporate governance measures we have
adopted to manage conflicts of interest, if any, between our Group and our Controlling
Shareholders.
Based on the above, our Directors believe that our Group is capable of managing our business
independently from our Controlling Shareholders and their respective close associates upon Listing.
Operational independence
Our Directors believe that our Group will be able to operate independently from our Controlling
Shareholder(s) for the following reasons:
(a) although our Controlling Shareholder(s) will retain a controlling interest in our Company after
the Listing, our Board has full rights to make all decisions on, and to carry out, its own business
operations independently;
(b) our Company (through its subsidiaries) holds all material licenses necessary to carry on its
businesses and has sufficient capital, equipment and employees to operate its business
independently from our Controlling Shareholder(s); and
(c) our Group has an independent work force to carry out its operations independently from our
Controlling Shareholder(s). We have established our own operational and organizational
structure with dedicated departments and management personnel to run daily operations. We
have our own employees equipped with the relevant skills to run the ordinary course of our
business and a management team which possesses the requisite experience and expertise in
running our business.
Save as those disclosed in the section headed “Connected Transactions” in this prospectus, our
Directors currently do not expect that, following the Listing, there will be any non-exempt connected
transactions between our Company and our Controlling Shareholder(s) or their respective associates. Our
Company confirms that we will fully comply with Chapter 14A of the Listing Rules if any other connected
transaction arises in the future.
Based on the above, our Directors believe that our business is operationally independent of our
Controlling Shareholders.
RELATIONSHIP WITH OUR CONTROLLING SHAREHOLDERS
– 277 –

Financial Independence
During the Track Record Period and up to the Latest Practicable Date, our Group has our own
internal control and accounting systems, accounting and finance department, independent treasury
function for cash receipts and payments and we make financial decisions according to our own business
needs.
We are capable of obtaining financing from third parties, if necessary, without reliance on our
Controlling Shareholders. During the Track Record Period, we had certain advances to and from related
parties. See Note 40 to the Accountants’ Report set out in Appendix I in this prospectus.
On June 4, 2021, Chervon (China) Investment, our wholly owned subsidiary, undertook to exercise
its pre-emptive rights to subscribe for the public A-share convertible bonds issued by Chervon Auto
Precision Technology. The subscription amount of RMB118,500,000 was based on the proportion of its
shareholding in Chervon Auto Precision Technology and paid on September 14, 2021. As the convertible
bonds may not be converted for a period of six months from the date of completion, Chervon (China)
Investment cannot and does not intend to convert such convertible bonds before the completion of the
Global Offering. See the sections headed “Financial Information – Related Party Transaction” and
“Summary – Recent Developments” in this prospectus for details.
The subscription of convertible bonds does not affect the financial independence from our
Controlling Shareholders or their respective close associates, as no financial assistance is being provided
by Chervon Auto Precision Technology to our Group. In addition, our Group does not rely on Chervon
Auto Precision Technology for the provision of financial resources.
Save as disclosed above, we will fully repay or settle all outstanding loans, advances and balances
due to or from our Controlling Shareholders or their close associates which did not arise out of the
ordinary course of business and there will be no financial assistance, security and/or guarantee provided
by our Controlling Shareholders or their associates in favor of our Group or vice-versa (as the case may
be) upon Listing.
Based on the above, our Directors believe that our business is financially independent of our
Controlling Shareholders and their respective close associates.
CORPORATE GOVERNANCE MEASURES
Our Company will comply with the provisions of the Corporate Governance Code in Appendix 14
to the Listing Rules, which sets out principles of good corporate governance.
Our Directors recognize the importance of good corporate governance in protection of our
Shareholders’ interests. We will adopt the following measures to safeguard good corporate governance
standards and to avoid potential conflict of interests between our Group and our Controlling Shareholders:
(a) in preparation for the Listing, our Company has amended our Articles to comply with the
Listing Rules. Under the Articles, where a Shareholders’ meeting is held to consider proposed
transactions or arrangements in which our Controlling Shareholders or any of their associates
have a material interest, our Controlling Shareholder(s) shall abstain from voting and their
votes shall not be counted;
RELATIONSHIP WITH OUR CONTROLLING SHAREHOLDERS
– 278 –
(b) our Company has established internal control mechanisms to identify connected transactions,
and we will comply with the applicable Listing Rules if we enter into connected transactions
with our Controlling Shareholders or any of their associates after Listing;
(c) the independent non-executive Directors will review, on an annual basis, whether there is any
conflict of interests between our Group and our Controlling Shareholders (the “AnnualReview”) and provide impartial and professional advice to protect the interests of our minority
Shareholders;
(d) our Controlling Shareholders will undertake to provide all information necessary or requested
by the independent non-executive Directors for the Annual Review, including all relevant
financial, operational and market information;
(e) our Company will disclose decisions on matters reviewed by the independent non-executive
Directors either in its annual reports or by way of announcements as required by the Listing
Rules;
(f) where our Directors reasonably request the advice of independent professionals, such as
financial advisers, the appointment of such independent professionals will be made at our
Company’s expense;
(g) we have appointed Guotai Junan Capital Limited as our Compliance Adviser to provide advice
and guidance to us in respect of compliance with the applicable laws and regulations, as well
as the Listing Rules, including various requirements relating to corporate governance; and
(h) we have established our audit committee, remuneration committee and nomination committee
with written terms of reference in compliance with the Listing Rules and the Code of Corporate
Governance and Corporate Governance Report in Appendix 14 to the Listing Rules.
Based on the above, our Directors believe that sufficient corporate governance measures have been
put in place to manage conflicts of interest between our Group and our Controlling Shareholders, and to
protect minority Shareholders’ interests after the Listing.
RELATIONSHIP WITH OUR CONTROLLING SHAREHOLDERS
– 279 –
OUR CONNECTED PERSONS
We have entered into certain transactions that will constitute continuing connected transactions
under Rule 14A.31 of the Listing Rules upon Listing. Those transactions are entered into with the
following connected persons and their associates:
Connected Person Connected Relationship
Chervon Auto Precision Technology Chervon Auto Precision Technology is owned as
to 35.75% by Chervon Precision Technology,
which is an indirect subsidiary of Panmercy. As
such, Chervon Auto Precision Technology is an
associate of Panmercy and therefore our
connected person under Rule 14A.13(3) of the
Listing Rules.
Nanjing Yaoquan Investment Management
Co., Limited* (南京耀泉投資管理有限公司)
(“Nanjing Yaoquan”)
Nanjing Yaoquan is wholly-owned by Nanjing
Suquan Investment Co., Limited* (南京蘇泉投資管理有限公司), which is owned as to 75.12% by
Mr. Xiao Jun (肖鈞)(1), who was a former
director of our Company in the last 12 months.
Nanjing Yaoquan is an associate of Mr. Xiao Jun
and therefore our connected person under Rule
14A.12(1)(c) of the Listing Rules.
Cheng & Cheng Corporate Services Limited
(“Cheng & Cheng”)
Cheng & Cheng is owned as to 50% by
Mr. Cheng Hong Kei (鄭康棋) and 50% by his
spouse. Cheng & Cheng is an associate
of Mr. Cheng Hong Kei, a director of
Chervon (HK) Limited, and therefore our
connected person under Rule 14A.12(1)(c) of the
Listing Rules.
Cheng & Cheng Taxation Services Limited
(“Cheng & Cheng Taxation”)
Cheng & Cheng Taxation is owned as to 50% by
Mr. Cheng Hong Kei (鄭康棋) and 50% by his
spouse. Cheng & Cheng Taxation is an associate
of Mr. Cheng Hong Kei, a director of Chervon
(HK) Limited, and therefore our connected
person under Rule 14A.12(1)(c) of the Listing
Rules.
Note:
(1) The reason for the resignation of Mr. Xiao Jun as a director of our Company with effect from August 4, 2021 is toenhance corporate governance and to adjust the board structure and composition in light of its proposed Listing andthe relevant Listing Rules requirements. It is the intention that Mr. Xiao Jun shall focus on the investment managementbusiness and continue to serve as a director of our associated entities which are principally engaged in investmentbusiness, including Chervon Capital Management Limited, Chervon Investment Limited, Chervon InternationalTrading and Nanjing Yaoquan Investment Management Co., Ltd..
CONNECTED TRANSACTIONS
– 280 –

Following the Group’s disposal of its interest in Nanjing Suquan Investment Co., Ltd. and Nanjing Yaoquan InvestmentManagement Co., Ltd. on March 12, 2019, our Directors believe that it is more suitable for Mr. Xiao Jun to cease beinga director of our Company for clearer business delineation.
To the best of our Director’s knowledge and belief, there was no dispute or disagreement between Mr. Xiao Jun andthe Company, Directors or Shareholders and there is no other matter relating to his resignation that needs to be broughtto the attention of our Shareholders.
OUR EXISTING ONE-OFF CONNECTED TRANSACTION
1. Subscription of Public A Share Convertible Bonds
Parties: Chervon (China) Investment (our wholly-owned subsidiary) (as subscriber) and Chervon
Auto Precision Technology (as issuer)
Principal terms: On August 3, 2021, Chervon Auto Precision Technology announced that it has
obtained approval from the CSRC to issue public A-share convertible bonds (the “A Share ConvertibleBonds”) in an aggregate principal amount of RMB620 million (US$95.9 million) with a maturity date on
the sixth year after the date of issuance. Pursuant to the terms of the A Share Convertible Bonds offering,
Chervon (China) Investment as an existing shareholder has pre-emptive rights to subscribe for the A Share
Convertible Bonds in an amount up to the proportional interests of such shareholder in Chervon Auto
Precision Technology. Chervon (China) Investment, which owns 23.12% of Chervon Auto Precision
Technology, has exercised and paid for such pre-emptive rights to subscribe for RMB118.5 million
(US$18.3 million) of the principal amount of the A Share Convertible Bonds. As the A Share Convertible
Bonds may not be converted for a period of six months from the date of completion, Chervon (China)
Investment cannot and does not intend to convert such convertible bonds before the completion of the
Global Offering.
If Chervon (China) Investment opts not to convert its convertible bonds upon their expiry, the
shareholding in Chervon Auto Precision Technology held by Chervon (China) Investment would be diluted
from 23.12% as of the Latest Practicable Date to approximately 20.86% immediately after full conversion
of convertible bonds by other subscribers based on the current conversion price, assuming that there is no
other change in the issued share capital and shareholding structure of Chervon Auto Precision Technology
at the maturity date of the A Share Convertible Bonds.
Details of the A Share Convertible Bonds are as follows:
Type of Convertible Bonds Issued The A Share Convertible Bonds were issued on September
14, 2021 (the “Date of Issuance”) at par with a nominal
value of RMB100 each.
The A Share Convertible Bonds can be converted into A
share(s) of Chervon Auto Precision Technology with a
nominal value of RMB1.00 each which are listed on the
Shanghai Stock Exchange and traded in RMB (stock code:
603982) (the “A Shares”).
Maturity Date September 13, 2027 (six years after the Date of Issuance)
CONNECTED TRANSACTIONS
– 281 –

Interest Rate, Timing of Interest
Payment
The A Share Convertible Bonds will bear a coupon rate of
0.4% in the first year, 0.6% in the second year, 1.0% in the
third year, 1.5% in the fourth year, 2.5% in the fifth year and
3.0% in the sixth year.
The interest of the A Share Convertible Bonds will be paid
annually, and the principal and the interest for the final year
will be paid upon maturity.
(1) Calculation of Annual Interest
“Annual Interest” means the interest accrued to a
holder of the A Share Convertible Bonds (the “A ShareConvertible Bonds Holder”) in each year on each
anniversary of the Date of Issuance which is calculated
based on the aggregate nominal value of the A Share
Convertible Bonds held by him/her.
The formula for calculating the Annual Interest is:
I=B×i
I: denotes the Annual Interest;
B: denotes the aggregate nominal value of the A
Share Convertible Bonds held by an A Share
Convertible Bonds Holder as at the record date for
interest payment (“that year” or “each year”) in
an interest accrual year;
i: denotes the coupon rate of the A Share
Convertible Bonds of that year.
(2) Timing of interest payment
a. Interest of the A Share Convertible Bonds will be
paid annually, accruing from the Date of Issuance.
b. Interest payment date: the interest is payable
annually on each anniversary of the Date of
Issuance. If such date falls on a statutory holiday
or rest day, the interest payment date shall be
postponed to the first trading day immediately
thereafter, provided that no additional interest will
be accrued during the period of postponement.
The period between an interest payment date and
the immediately following interest payment date
will be an interest accrual year.
CONNECTED TRANSACTIONS
– 282 –

Conversion Period The conversion period of A Share Convertible Bonds shall
commence from March 22, 2022 until September 13, 2027.
Conversion Price (1) Basis for determining the initial conversion price
The initial conversion price of A Share Convertible
Bonds is RMB23.03 per A Share, which shall not be
lower than the average trading price of the A Shares for
the 20 trading days preceding the date of publication of
the A Share Convertible Bonds offering document (in
the event that during such 20 trading days, the share
price has been adjusted due to ex-rights or ex-dividend,
the price of each of these trading days before
adjustment shall be adjusted with reference to the
adjusted share price following the ex-rights or ex-
dividend events), as well as the average trading price of
the A Shares on the trading day preceding the date of
the A Share Convertible Bonds offering document. The
average trading price of the A Shares for the 20
preceding trading days = total trading amount of the A
Shares for such 20 trading days/total trading volume of
the A Shares for such 20 trading days; the average
trading price of the A Shares for the preceding trading
day = total trading amount of A Shares for such trading
day/total trading volume of the A Shares for such
trading day.
(2) Method of adjustments to the conversion price
The conversion price is subject to adjustment upon the
issuance in case of certain events, such as distribution
of share dividends, capitalization, issuance of new
shares or rights issue (excluding any increase in the
share capital as a result of conversion of the A Share
Convertible Bonds), allotment and distribution of cash
dividends.
CONNECTED TRANSACTIONS
– 283 –

Upon occurrence of any of the above-mentioned
changes in shares and/or interests of the shareholders of
Chervon Auto Precision Technology, Chervon Auto
Precision Technology will adjust the conversion price
in accordance with the method determined, and publish
an announcement in relation to the adjustment of the
conversion price on the media designated by CSRC for
information disclosure of listed companies. Such
announcement will indicate the date of adjustment to
the conversion price, adjustment method and
suspension period of share conversion (if necessary). If
the conversion price adjustment date is on or after the
date on which an A Share Convertible Bonds Holder
applies for conversion of his/her A Share Convertible
Bonds but before the registration date of the A Shares to
be issued upon conversion, then such conversion will be
executed based on the conversion price adjusted by
Chervon Auto Precision Technology.
In the event that the creditor’s interests or the interests
derived from the share conversion of the A Share
Convertible Bonds Holders are affected by the change
in Chervon Auto Precision Technology’s share class,
quantity and/or the interests of the shareholders of
Chervon Auto Precision Technology due to any possible
share repurchase, consolidation, division or any other
circumstances, Chervon Auto Precision Technology
will adjust the conversion price based on the actual
situations and in accordance with the principles of
fairness, justice and equality so as to fully protect the
interests of A Share Convertible Bonds Holders. The
details of adjustment to conversion price and its
implementation measures shall be determined in
accordance with then relevant PRC laws and
regulations and the relevant requirements of the
securities regulatory authorities.
CONNECTED TRANSACTIONS
– 284 –

Terms of Downward Adjustment to
Conversion Price
(1) Authorization and magnitude of adjustment
If, during the term of the A Share Convertible Bonds,
the closing prices of the A Shares in at least 15 trading
days out of any 30 consecutive trading days are lower
than 90% of the prevailing conversion price, the board
of directors of Chervon Auto Precision Technology is
entitled to propose a downward adjustment to the
conversion price and submit it to the shareholders of
Chervon Auto Precision Technology at the general
meeting for their consideration and approval. In the
event that an adjustment to the conversion price by
Chervon Auto Precision Technology is made during the
aforementioned trading days, in respect of the trading
days prior to the adjustment to the conversion price, the
calculation shall be based on the unadjusted conversion
price and the closing price of the A Shares on each such
day, and in respect of the days on which adjustment to
the conversion price is made and the trading days
afterwards, the calculation shall be based on the
adjusted conversion price and the closing price of the A
Shares on each such day.
The above-mentioned proposals are subject to
approvals of more than two-thirds of the shareholders
of Chervon Auto Precision Technology with voting
rights who attend the general meeting. The shareholders
of Chervon Auto Precision Technology who hold the A
Share Convertible Bonds should abstain from voting at
the general meeting. The adjusted conversion price
should be no less than the average trading price of the
A Shares for 20 trading days preceding the date of the
general meeting for consideration and approval of the
aforementioned proposals and the average trading price
of the A Shares on the trading day preceding the date of
such meeting.
CONNECTED TRANSACTIONS
– 285 –
(2) Procedures of adjustment
If a downward adjustment to the conversion price is
approved at the general meeting, Chervon Auto
Precision Technology will publish an announcement in
relation to the resolutions at the general meeting on
media designated by CSRC for information disclosure
of listed companies. Such announcement will disclose
information including the magnitude of the adjustment,
the registration date of shares and the suspension period
of share conversion (if necessary). Application for
conversion at adjusted conversion price shall be
resumed upon the first trading day after the registration
date, i.e. the conversion price adjustment date. If the
conversion price adjustment date is on or after the date
on which an A Share Convertible Bonds Holder applies
for conversion of his/her A Share Convertible Bonds
but before the registration date of the A Shares to be
issued upon conversion, then such conversion will be
executed based on the adjusted conversion price.
Method for Determining the
Number of A Shares for
Conversion
Where an A Share Convertible Corporate Bonds Holder
applies to convert his/her A Share Convertible Corporate
Bonds into the A Shares during the conversion period, the
formula for calculating the number of the A Shares to be
issued upon conversion is as below:
Q = V/P, any fractional share shall be rounded down to the
nearest integer.
Where: “Q”: denotes the number of the A Shares to be issued
upon conversion; “V”: denotes the aggregate nominal value
of the A Share Convertible Corporate Bonds in respect of
which the A Share Convertible Corporate Bonds Holder
applies for conversion; “P”: denotes the valid conversion
price on the date of application for conversion.
Within five trading days from the date of conversion by any
A Share Convertible Corporate Bonds Holder, Chervon Auto
Precision Technology shall pay the A Share Convertible
Corporate Bonds Holder in cash an amount equal to the
remaining balance of such A Share Convertible Corporate
Bonds which is insufficient to be converted into one A Share
and the interest accrued on such balance, in accordance with
the relevant requirements of the Shanghai Stock Exchange
and such other authorities.
CONNECTED TRANSACTIONS
– 286 –

Transferability and Restrictions The A Share Convertible Bonds are transferrable, provided
that any transfer of the A Share Convertible Bonds is made in
accordance with the laws, administrative regulations, the
Rules for A Share Convertible Bonds Holders’ Meetings and
the articles of association of Chervon Auto Precision
Technology.
Redemption (1) Terms of redemption upon maturity
Within five trading days upon maturity of A Share
Convertible Bonds, Chervon Auto Precision
Technology will redeem all the A Share Convertible
Bonds from the A Share Convertible Bonds Holders
which have not been converted into A Shares by then, at
a price calculated at 115% of the nominal value of A
Share Convertible Bonds (including the interest accrued
in the last interest accrual year).
(2) Terms of conditional redemption
During the conversion period of A Share Convertible
Bonds, if the closing prices of the A Shares during at
least 15 trading days out of any 30 consecutive trading
days are no less than 130% (inclusive) of the prevailing
conversion price, or the total par value of the
outstanding A Share Convertible Bonds is lower than
RMB30 million, Chervon Auto Precision Technology
shall have the right to redeem all or part of the
outstanding A Share Convertible Bonds, at a price equal
to the nominal value of A Share Convertible Bonds plus
then accrued interest.
In the event that an adjustment to the conversion price
by Chervon Auto Precision Technology is made during
the aforementioned 30 trading days, in respect of the
trading days prior to the adjustment to the conversion
price, the calculation shall be based on the unadjusted
conversion price and the closing price of the A Shares
on each such day, and in respect of the days on which
adjustment to the conversion price is made and the
trading days afterwards, the calculation shall be based
on the adjusted conversion price and the closing price
of the A Shares on each such day.
CONNECTED TRANSACTIONS
– 287 –

Terms of Sale Back (1) Terms of conditional sale back
During the last two interest accrual years within the
term of the A Share Convertible Bonds, if the closing
prices of the A Shares on any 30 consecutive trading
days are lower than 70% of the prevailing conversion
price, the A Share Convertible Bonds Holders are
entitled to sell back all or part of the A Share
Convertible Bonds they hold to Chervon Auto Precision
Technology at a price equal to the nominal value of the
A Share Convertible Bonds plus the then accrued
interest.
In the event that an adjustment to the conversion price
by Chervon Auto Precision Technology is made due to
events such as distribution of share dividends,
capitalization, issuance of new shares (excluding any
increase in the share capital as a result of conversion of
the A Share Convertible Bonds), rights issue and
distribution of cash dividends during the
aforementioned trading days, in respect of the trading
days prior to the adjustment to the conversion price, the
calculation shall be based on the unadjusted conversion
price and the closing price of the A Shares on each such
day, and in respect of the days on which adjustment to
the conversion price is made and the trading days
afterwards, the calculation shall be based on the
adjusted conversion price and the closing price of the A
Shares on each such day. In the event that there is a
downward adjustment to the conversion price, the
aforesaid “30 consecutive trading days” shall be re-
counted from the first trading day following the
adjustment to the conversion price.
The A Share Convertible Bonds Holders can exercise
their sale back rights once every year when the sale
back conditions are initially satisfied according to the
above-mentioned agreed terms in the last two interest
accrual years within the term of the A Share Convertible
Bonds. If the sale back conditions are initially satisfied,
but the A Share Convertible Bonds Holders do not apply
for and exercise their sale back rights during the sale
back declaration period then announced by Chervon
Auto Precision Technology, they shall not exercise the
sale back rights during such accrual years. The A Share
Convertible Bonds Holders are not allowed to exercise
part of their sale back rights repeatedly.
CONNECTED TRANSACTIONS
– 288 –

(2) Additional terms of sale back
If the actual use of the proceeds from A ShareConvertible Bonds significantly differs from theundertakings of the use of proceeds set out by ChervonAuto Precision Technology in the A Share ConvertibleBonds offering document, and such change is deemedas a deviation in the use of proceeds pursuant torelevant rules of CSRC or is considered by CSRC as adeviation in the use of proceeds, the A ShareConvertible Bonds Holders will be entitled to a one-offright to sell all or part of A Share Convertible Bondsback to Chervon Auto Precision Technology at a priceequal to the nominal value of the A Share ConvertibleBonds plus then accrued interest. Upon the satisfactionof the additional condition of sale back, the A ShareConvertible Bonds Holders may sell their A ShareConvertible Bonds back to Chervon Auto PrecisionTechnology during the additional sale back declarationperiod after it is announced by Chervon Auto PrecisionTechnology. If the A Share Convertible Bonds Holdersdo not exercise their sale back rights during suchperiod, they shall not exercise such rights later. Pleaserefer to the terms of redemption above for the formulafor calculating then accrued interest.
Events of Default In the event that Chervon Auto Precision Technology defaultsin paying the principal and interest of the A ShareConvertible Bonds for the current period on time, ChervonAuto Precision Technology shall pay the accrued interest forthe current period to the relevant A Share Convertible BondsHolders, which is calculated based on the number of days onwhich interest is accrued and at a rate of 20% plus thenominal interest rate of the A Share Convertible Bonds in aninterest accrual year. The A Share Convertible Bonds Holdersmay also convene an A Share Convertible Bonds Holders’meeting upon the occurrence of certain events of default,including but not limited to: (i) default in payment of theprincipal, interest or accrued interest of the A ShareConvertible Bonds; (ii) capital reduction (excluding capitalreduction as a result of share repurchase by Chervon AutoPrecision Technology due to equity incentive schemes or aneed to maintain its company value and its shareholders’interests), merger, division or dissolution or filing forbankruptcy undertaken by Chervon Auto PrecisionTechnology; or (iii) occurrence of any event which has amaterial adverse effect on Chervon Auto PrecisionTechnology’s ability to pay the principal and interest or onthe A Share Convertible Bonds Holders’ interests, in which aresolution can be passed by the A Share Convertible BondsHolders to initiate legal proceedings against Chervon AutoPrecision Technology.
CONNECTED TRANSACTIONS
– 289 –
Ranking The new A Shares to be issued as a result of the conversionof the A Share Convertible Corporate Bonds shall rank paripassu with all the existing A Shares, and all ordinary holdersof the A Shares (including those derived from the conversionof the A Share Convertible Corporate Bonds) whose namesare recorded on the register of members of Chervon AutoPrecision Technology on the record date for dividenddistribution shall be entitled to receive the dividend of thatperiod and enjoy equal rights and interests.
Listing Status The A Share Convertible Bonds were listed on the ShanghaiStock Exchange on October 21, 2021 (bond code: 113629).
Listing Rules Implications: The subscription of public A Share Convertible Bonds is a one-off
connected transaction of the Company for the purpose of the Listing Rules. Accordingly, the reporting,
announcement, annual review and independent Shareholders’ approval requirements under Chapter 14A of
the Listing Rules are not applicable. The Company will comply with the reporting, announcement and/or
independent Shareholders’ approval requirements (as applicable) under Chapter 14 and 14A of the Listing
Rules, if necessary, in the event that Chervon (China) Investment proposes to exercise its conversion right
under the convertible bonds.
OUR CONTINUING CONNECTED TRANSACTIONS
Continuing Connected Transactions Fully Exempt from the Reporting, Annual Review,Announcement and Independent Shareholders’ Approval Requirements
1. Nanjing Chervon Auto Precision Technology Factory Lease
Parties: Nanjing Chervon Industry (our wholly-owned subsidiary) (as lessor) and Chervon Auto
Precision Technology (as lessee)
Principal terms: Nanjing Chervon Industry entered into a lease agreement with Nanjing Chervon
Auto Precision Technology (the “Nanjing Chervon Auto Precision Technology Factory Lease”) on
January 1, 2021, pursuant to which Nanjing Chervon Industry agreed to lease to Chervon Auto Precision
Technology part of its factory of an area of approximately 7,651.22m2 located at No. 159 Jiangjun Avenue,
Jiangning District, Nanjing, the PRC (the “Factory”) for a term commencing from January 1, 2021 to
December 31, 2021.
Under the Nanjing Chervon Auto Precision Technology Factory Lease, the total rental payments
receivable by Nanjing Chervon Industry for the year ending December 31, 2021 is RMB2,112,000. Such
terms were determined by the parties through arm’s length negotiation with reference to the prevailing
market rent of similar property located in the vicinity.
Historical amount: The historical rental expenses recognized by Nanjing Chervon Industry from
Chervon Auto Precision Technology for the years ended December 2018, 2019 and 2020 and the six
months ended June 30, 2021 were RMB564,000, RMB366,000, RMB526,000 and RMB1,006,000,
respectively. The increase in the rental payments for the six months ended June 30, 2021 was due to an
increase in the leased factory area at the same location from 2,000m2 to 7,651.22m2 from January 1, 2021
onwards.
CONNECTED TRANSACTIONS
– 290 –
Listing Rules Implications: Since the applicable percentage ratios calculated for the purpose of
Chapter 14A of the Listing Rules for the transactions under the Nanjing Chervon Auto Precision
Technology Factory Lease are less than 0.1%, the transactions under the Nanjing Chervon Auto Precision
Technology Factory Lease constitute de minimis transactions of our Company and are exempt from the
reporting, announcement, annual review and independent Shareholder’s approval requirements under
Chapter 14A of the Listing Rules.
2. Water Utility Bill Sharing Agreement
Parties: Nanjing Chervon Industry (our wholly-owned subsidiary) and Nanjing Chervon Auto
Precision Technology
Principal terms: Due to the design of the Factory shared by the parties, Chervon Auto Precision
Technology has no independent water meter with the relevant utility services provider and needs to share
such facility with Nanjing Chervon Industry, who maintains the water utility account for the Factory. As
such, Nanjing Chervon Industry entered into a water utility bill sharing agreement with Chervon Auto
Precision Technology on January 1, 2021, pursuant to which Nanjing Chervon Industry agreed to procure
supply of water services in respect of the Factory for the operations of Chervon Auto Precision Technology
for a term commencing from January 1, 2021 to December 31, 2021.
The water supply services in respect of the Factory are payable by Chervon Auto Precision
Technology to Nanjing Chervon Industry on an at-cost basis at the government-prescribed rates charged
on the Factory and the consumption amount will be confirmed by both parties by jointly inspecting the
readings on the relevant meter on a monthly basis. Nanjing Chervon Industry will subsequently settle the
amount with the relevant utility services provider.
Historical amount: The historical water utility charges recognized by Nanjing Chervon Industry
from Chervon Auto Precision Technology for the years ended December 2018, 2019 and 2020 and the six
months ended June 30, 2021 were RMB568,000, RMB577,000, RMB756,000 and RMB455,000,
respectively.
Listing Rules Implications: The utility supply service is “consumer services” on the basis that such
service is (i) of a type ordinarily supplied for the private use or consumption of Chervon Auto Precision
Technology; (ii) for its own consumption or use and there is an open market and transparency in the
pricing of the service; (iii) consumed or used by them in the same state as when they were bought; and
(iv) of terms no less favorable to them than those terms available to independent third parties. On the basis
of the above and given that our use of the water supply service is on normal commercial terms in its
ordinary and usual course of business, the payment for water utility charges under the Water Utility Bill
Sharing Agreement on an at-cost basis is fully exempt from the reporting, announcement and independent
shareholders’ approval requirements under Rule 14A.97 of the Listing Rules.
CONNECTED TRANSACTIONS
– 291 –
3. Electricity Utility Bill Sharing Agreement
Parties: Nanjing Chervon Industry (our wholly-owned subsidiary) and Chervon Auto Precision
Technology
Principal terms: Due to the design of the Factory shared by the parties, Nanjing Chervon Industry
has no independent electricity meter with the relevant utility services provider and needs to share such
facility with Chervon Auto Precision Technology, who maintains the electricity utility account for the
Factory. As such, Nanjing Chervon Industry entered into an electricity utility bill sharing agreement with
Chervon Auto Precision Technology on January 1, 2021, pursuant to which Chervon Auto Precision
Technology agreed to procure supply of electricity services in respect of the Factory for our operations for
a term commencing from January 1, 2021 to December 31, 2021.
The electricity supply services in respect of the Factory are payable by Nanjing Chervon Industry to
Chervon Auto Precision Technology on an at-cost basis at the government-prescribed rates charged on the
Factory and the consumption amount will be confirmed by both parties by jointly inspecting the readings
on the relevant meter on a monthly basis. Chervon Auto Precision Technology will subsequently settle the
amount with the relevant utility services provider. Pursuant to a supplemental agreement dated June 1,
2021, Nanjing Chervon Industry agreed to prepay its electricity utility charges to Chervon Auto Precision
Technology as deposit at the beginning of every month.
Historical amount: The historical electricity utility charges recognized by Nanjing Chervon
Industry to Chervon Auto Precision Technology for the years ended December 2018, 2019 and 2020 and
the six months ended June 30, 2021 were RMB11,778,000, RMB8,223,000, RMB8,059,000 and
RMB2,504,000, respectively.
Listing Rules Implications: The utility supply service is “consumer services” on the basis that such
service is (i) of a type ordinarily supplied for our private use or consumption; (ii) for our own consumption
or use and there is an open market and transparency in the pricing of the service; (iii) consumed or used
by us in the same state as when they were bought; and (iv) of terms no less favorable to our Group than
those terms available to independent third parties. On the basis of the above and given that our use of the
electricity supply service is on normal commercial terms in its ordinary and usual course of business, the
payment for electricity utility charges under the Electricity Utility Bill Sharing Agreement on an at-cost
basis is fully exempt from the reporting, announcement and independent shareholders’ approval
requirements under Rule 14A.97 of the Listing Rules.
4. Nanjing Yaoquan Office Lease
Parties: Nanjing Chervon Industry (our wholly-owned subsidiary) (as lessor) and Nanjing Yaoquan
(as lessee)
Principal terms: Nanjing Chervon Industry entered into a lease agreement with Nanjing Yaoquan
(the “Nanjing Yaoquan Office Lease”) on January 1, 2021, pursuant to which Nanjing Chervon Industry
agreed to lease to Nanjing Yaoquan an office area of approximately 300m2 located at No. 99 West
Tianyuan Road, Jiangning Economic and Technological Development Zone, Nanjing, the PRC for a term
commencing from January 1, 2021 to December 31, 2021.
CONNECTED TRANSACTIONS
– 292 –
Under the Nanjing Yaoquan Office Lease, the total rental expenses by Nanjing Chervon Industry for
the year ending December 31, 2021 is RMB115,200 (including basic facilities charges, administrative
charges, water and electricity utilities charges). Such terms were determined by the parties through arm’s
length negotiation with reference to the prevailing market rent of similar property located in the vicinity.
Historical amount: The historical rental expenses recognized by Nanjing Chervon Industry from
Nanjing Yaoquan for the years ended December 2018, 2019 and 2020 and the six months ended June 30,
2021 were RMB108,000, RMB112,000, RMB115,000 and RMB58,000, respectively.
Listing Rules Implications: Since the applicable percentage ratios calculated for the purpose of
Chapter 14A of the Listing Rules for the transactions under the Nanjing Yaoquan Office Lease are less than
0.1%, the transactions under the Nanjing Yaoquan Office Lease constitute de minimis transactions of our
Company and are exempt from the reporting, announcement, annual review and independent Shareholder’s
approval requirements under Chapter 14A of the Listing Rules.
5. Company Secretarial Services Agreement
Parties: Our Company and Cheng & Cheng
Principal terms: Our Company entered into a company secretarial services agreement with Cheng
& Cheng (the “Company Secretarial Services Agreement”) on January 4, 2021, pursuant to which Cheng
& Cheng agreed to provide company secretarial services, custody of company records and act as the
designated representative of certain of our subsidiaries for a term commencing from January 1, 2021 to
December 31, 2021.
Under the Company Secretarial Services Agreement, the total service fees payable for the yearending December 31, 2021 are HK$88,200. Such terms were determined by the parties through arm’slength negotiation with reference to factors such as the personnel and working hours estimated to beequipped and spent on providing company secretarial services and other related services, the fees chargedfor historical transactions of similar nature and the prevailing market rent of similar services.
Historical amount: The historical service fees recognized by our Company to Cheng & Cheng forthe years ended December 2018, 2019 and 2020 and the six months ended June 30, 2021 were HK$43,000,HK$44,000, HK$47,000 and HK$46,000, respectively.
6. Tax Compliance Services Agreement
Parties: Our Company and Cheng & Cheng Taxation
Principal terms: Our Company entered into a tax compliance services agreement with Cheng &Cheng Taxation (the “Tax Compliance Services Agreement”) on February 9, 2021, pursuant to whichCheng & Cheng Taxation agreed to provide routine tax compliance services and prepare profits tax returnsand tax computations to our Company and certain of its subsidiaries for a term commencing from January1, 2021 to December 31, 2021.
CONNECTED TRANSACTIONS
– 293 –
Under the Tax Compliance Services Agreement, the total service fees payable for the year endingDecember 31, 2021 are HK$79,500. Such terms were determined by the parties through arm’s lengthnegotiation with reference to factors such as the personnel and working hours estimated to be equippedand spent on providing tax compliance services, the fees charged for historical transactions of similarnature and the prevailing market rent of similar services.
Historical amount: The historical service fees recognized by Chervon (HK) Limited to Cheng &Cheng Taxation for the years ended December 2018, 2019 and 2020 and the six months ended June 30,2021 were HK$78,000, HK$80,000, HK$70,000 and HK$40,000, respectively.
Listing Rules Implications: Pursuant to Rules 14A.82(1) and 14A.83 of the Listing Rules, since (i)Cheng & Cheng and Cheng & Cheng Taxation are both associates of Mr. Cheng Hong Kei, and aretherefore connected persons of our Company; and (ii) our Company’s transactions with these entities areof a similar nature, these transactions contemplated under the Company Secretarial Services Agreementand the Tax Compliance Services Agreement will be aggregated and treated as if they were onetransaction. Accordingly, the annual caps in respect of these agreements with each of these entities areaggregated and such aggregate amount is used when calculating the relevant percentage ratios underChapter 14A of the Listing Rules. Since the applicable percentage ratios calculated for the purpose ofChapter 14A of the Listing Rules for the aggregated transactions under the Company Secretarial ServicesAgreement and the Tax Compliance Services Agreement are less than 0.1%, the aggregated transactionsconstitute de minimis transactions of our Company and are exempt from the reporting, announcement,annual review and independent Shareholder’s approval requirements under Chapter 14A of the ListingRules.
DIRECTORS’ VIEW
In the view of our Directors (including our independent non-executive Directors), it is in the interestsof our Group to continue with the continuing connected transactions described in this section after theListing, and that all these transactions are conducted on normal commercial terms, were entered into inthe ordinary and usual course of business of our Group, the terms are fair and reasonable and are in theinterests of our Company and our Shareholders as a whole.
CONNECTED TRANSACTIONS
– 294 –

BOARD OF DIRECTORS
Our Board consists of seven Directors, comprising four executive Directors, and three independentnon-executive Directors. The following sets forth certain information regarding our Directors and seniormanagement:
Name Age
Date ofjoining ourGroup
Date ofappointmentas Director Position Roles and responsibilities
Relationship withother Directors andsenior management
DirectorsMr. Pan Longquan(潘龍泉)
58 September1997
June 22, 1999 Executive Director,Chairman and ChiefExecutive Officer
Supervising overalloperations, management,strategic planning andbusiness development ofour Group; member of ourNomination Committee
None
Ms. Zhang Tong(張彤)
50 September1997
June 22, 1999 Executive Director andExecutive Vice President –North America Sales &Marketing
Supervising overalloperations, management,strategic planning andsales and marketingdevelopment of our Groupin North America; memberof our RemunerationCommittee
None
Mr. Ke Zuqian(柯祖謙)
60 September1997
June 22, 1999 Executive Director andExecutive Vice President –Manufacturing and SupplyChain
Supervising manufacturingand production processesand management of ourGroup
None
Mr. Michael JohnClancy
66 September2018
August 4,2021
Executive Director andSenior Vice President –North America Sales andMarketing
Supervising overalloperations, management,strategic planning andsales and marketingdevelopment of our Groupin North America
None
Mr. Tian Ming(田明)
60 December 8,2021
December 8,2021
Independent non-executiveDirector
Supervising and providingindependent judgment toour Board; chairperson ofour RemunerationCommittee and member ofour Audit Committee andNomination Committee
None
DIRECTORS AND SENIOR MANAGEMENT
– 295 –

Name Age
Date ofjoining ourGroup
Date ofappointmentas Director Position Roles and responsibilities
Relationship withother Directors andsenior management
Dr. Li Minghui(李明輝)
47 December 8,2021
December 8,2021
Independent non-executiveDirector
Supervising and providingindependent judgment toour Board; chairperson ofour Audit Committee andmember of ourRemuneration Committee
None
Mr. Jiang Li(蔣立)
57 December 8,2021
December 8,2021
Independent non-executiveDirector
Supervising and providingindependent judgment toour Board; chairperson ofour Nomination Committeeand member of our AuditCommittee
None
Name Age
Date ofjoining ourGroup
Date ofappointmentas seniormanagement Position
Roles andResponsibilities
Relationship withother Directors andsenior management
Senior ManagementMr. Hu Yian(胡以安)
53 April 2003 April 1, 2003 Chief Financial Officer Overseeing overallfinancial operations,financing and investmentactivities of our Group
None
Mr. Wu Shuming(吳書明)
55 June 1997 March 1, 2010 Vice President – Research& Development
Supervising and managingthe research anddevelopment system andtechnological developmentof our Group
None
Mr. Wu Gang(吳鋼)
48 April 2021 April 26, 2021 Chief Digital Officer Overseeing the digitalstrategy and informationtechnology development ofour Group
None
Mr. Zhang Ding(章鼎)
42 March 2003 January 1,2013
Vice President – ProductManagement
Overseeing the productplanning and productmanagement of our Groupacross all brands andcategories
None
DIRECTORS AND SENIOR MANAGEMENT
– 296 –
Name Age
Date ofjoining ourGroup
Date ofappointmentas seniormanagement Position
Roles andResponsibilities
Relationship withother Directors andsenior management
Ms. Shan Xiaodong(單曉東)
54 May 2017 May 16, 2017 Vice President – HumanResources
Overseeing humanresources & administrativeplanning and managementof our Group
None
Mr. Peter JohnMelrose
55 June 2007 November 26,2015
Vice President – EuropeanSales & Marketing
Supervising overalloperations, management,strategic planning andsales and marketingdevelopment of our Groupin Europe
None
Dr. Christian Neuner 46 August 2014 October 9,2016
Vice President – FLEXbrand
Supervising overalloperations, management,strategic planning andsales and marketingdevelopment of the FLEXbrand product
None
DIRECTORS
Executive Directors
Mr. Pan Longquan (潘龍泉), aged 58, is our principal founder, executive Director, Chairman and
Chief Executive Officer. Mr. Pan is primarily responsible for supervising overall operations, management,
strategic planning and business development of our Group.
Mr. Pan has over 30 years of experience in the power tool and OPE products industry and 27 years
of management experience in our Group. Mr. Pan founded our principal operating subsidiary, Nanjing
Chervon Industry and has served as its chairman since September 1997. On June 22, 1999, Mr. Pan was
appointed as our executive Director, Chairman and Chief Executive Officer. Mr. Pan currently serves as
a director in a number of our subsidiaries and as the general manager of Chervon (China) Investment. He
is also a director of Chervon Global and its various subsidiaries, which are principally engaged in the
production of key automobile and mechanical components and investment management. Mr. Pan serves as
the chairman of Chervon Auto Precision Technology, a company listed on the Shanghai Stock Exchange
(stock code: 603982.SH) since October 2012. Prior to founding the predecessor company of our Group,
Chervon International Trading in 1994, Mr. Pan served as a salesperson in Nanjing Machinery, Minerals,
Metals & Medicine Import and Export Company* (南京機械五金礦產醫藥保健品進出口公司), a company
engaged in machinery import and export trading, from July 1988 to June 1993.
DIRECTORS AND SENIOR MANAGEMENT
– 297 –

Mr. Pan received his bachelor’s degree and his master’s degree in earth sciences from Nanjing
University (南京大學) in the PRC, in July 1985 and July 1988, respectively.
On June 9, 2021, Mr. Pan and Chervon Auto Precision Technology received a warning letter from
the Shanghai Stock Exchange in relation to the occupation of non-operating funds of Chervon Auto
Precision Technology in contravention of applicable PRC laws, listing rules of the Shanghai Stock
Exchange and his commitment under the relevant director undertakings arising from (i) the payment of
corporate income tax expense of approximately RMB1.07 million by Chervon Auto Precision Technology
on behalf of its overseas controlling shareholder on July 20, 2020 in connection with Chervon Auto
Precision Technology’s dividend payment to its overseas controlling shareholder made on July 15, 2020
and (ii) the prepayment of electricity bills by Chervon Auto Precision Technology for Nanjing Chervon
Industry in the amount of approximately RMB8.06 million pursuant to the payment arrangement under an
electricity utility bill sharing agreement entered into between Chervon Auto Precision Technology and
Nanjing Chervon Industry on January 1, 2020. Given that (i) the occupation of non-operating funds has
been fully rectified and the payment arrangements are now in compliance with all applicable PRC laws
and listing rules of the Shanghai Stock Exchange, (ii) the warning letter is a non-punitive supervisory
measure implemented by the Shanghai Stock Exchange, which does not constitute a disciplinary measure
or public sanction, and (iii) the Company has taken rectification measures as set out in the section headed
“Business – Risk Management and Internal Control – Internal Control Risk Management” in this
prospectus, our Directors are of the view that such incident does not materially affect the suitability of Mr.
Pan to serve as a director of our Company. Based on the foregoing and the due diligence conducted by the
Joint Sponsors, the Joint Sponsors concur with the Directors’ view.
As advised by our PRC Legal Adviser, given that (i) the amounts involved in relation to the
occupation of non-operating funds of Chervon Auto Precision Technology were relatively small; (ii) the
payment of corporate income tax and prepayment of electricity bills by Chervon Auto Precision
Technology on behalf of other entities had been fully repaid or returned to Chervon Auto Precision
Technology before the end of 2020; and (iii) the Company has adopted rectification measures to prevent
recurrence of similar incidents as mentioned above, the risk of the PRC regulatory authorities imposing
additional penalties or sanctions on the Company or Mr. Pan is minimal.
Ms. Zhang Tong (張彤), aged 50, is our co-founder, executive Director and executive vice president
for the North America sales & marketing. Ms. Zhang is primarily responsible for supervising overall
operations, management, strategic planning and sales and marketing development of our Group in North
America.
Ms. Zhang has over 20 years of experience in the power tool and OPE products industry and
management experience in our Group. Ms. Zhang co-founded our principal operating subsidiary, Nanjing
Chervon Industry, and has served as its director since September 1997. On June 22, 1999, Ms. Zhang was
appointed as our executive Director and executive vice president for the North America sales and
marketing. Ms. Zhang currently serves as a director in a number of our subsidiaries. She is also a director
of Chervon Global and its various subsidiaries, which are principally engaged in the production of key
automobile and mechanical components and investment management. Ms. Zhang serves as a director of
Chervon Auto Precision Technology, a company listed on the Shanghai Stock Exchange (stock code:
603982.SH), since October 2016.
DIRECTORS AND SENIOR MANAGEMENT
– 298 –

Ms. Zhang studied foreign trade English from Hohai University (河海大學) in the PRC and graduated
in July 1991. Ms. Zhang received her master’s degree in business management from China Europe
International Business School (中歐商學院) in the PRC in May 2012.
Mr. Ke Zuqian (柯祖謙), aged 60, is our co-founder, executive Director and executive vice president
for manufacturing and supply chain. Mr. Ke is primarily responsible for supervising manufacturing and
production processes and management of our Group.
Mr. Ke has over 20 years of experience in the power tool and OPE products industry and
management experience in our Group. Mr. Ke joined Chervon International Trading in January 1996 as a
technical director, and has served as a director and a vice general manager of Nanjing Chervon Industry
since September 1997. On June 22, 1999, Mr. Ke was appointed as our executive Director and executive
vice president for manufacturing. Mr. Ke currently serves as a director in a number of our subsidiaries and
as the general manager of Nanjing Chervon Industry. He is also a director of Chervon Global and its
various subsidiaries, which are principally engaged in the production of key automobile and mechanical
components and investment management. Mr. Ke serves as a director of Chervon Auto Precision
Technology, a company listed on the Shanghai Stock Exchange (stock code: 603982.SH), since October
2016. Prior to joining our Group, Mr. Ke was a lecturer in Tongji University (同濟大學) from July 1984
to June 1992, a technical manager in TÜV Rheinland (TUV 德國萊茵公司), a technical services provider,
from July 1992 to May 1994 and a technical manager in TÜV SUD (TUV 添福產品服務公司), a testing
and certification provider, from June 1994 to December 1995.
Mr. Ke received his bachelor’s degree and his master’s degree in industrial automation from Tongji
University (同濟大學) in the PRC in July 1984 and April 1990, respectively.
Mr. Michael John Clancy, aged 66, is our executive Director and senior vice president for the North
America sales and marketing. Mr. Clancy is primarily responsible for supervising overall operations,
management, strategic planning and sales and marketing development of our Group in North America.
Mr. Clancy has extensive experience in the power tool industry and has accumulated over 30 years
of experience in corporate management.
Mr. Clancy joined our Group in September 2018 and has since served as the chief executive officer
of Chervon NA. Mr. Clancy was appointed as our executive Director on August 4, 2021. Prior to joining
our Group, Mr. Clancy served as the vice president for the national accounts unit of Skil Corporation from
1978 to 1992, a power tool and accessory supplier which was later acquired by our Group, the vice
president of the consumer business group of Rust-Oleum Corporation, a paint supplier, from 1992 to 1995
the president of RotoZip Tool Corp, a power tool and accessory supplier, from 1995 to 2000 and the senior
vice president of the North American Sales organization and the project management of Robert Bosch Tool
Corporation, a power tool and accessory supplier, from 2010 to 2016 and from 2016 to 2017, respectively.
Mr. Clancy received his bachelor’s degree in business from Western Illinois University in the U.S.
in May 1977 and his master’s degree in business administration from Depaul University in the U.S. in
February 1983. Mr. Clancy has been one of the board members of the OPEI since March 2021.
DIRECTORS AND SENIOR MANAGEMENT
– 299 –
Independent non-executive Directors
Mr. Tian Ming (田明), aged 60, has been appointed as our independent non-executive director with
effect from December 8, 2021. Mr. Tian is primarily responsible for supervising and providing
independent judgment to our Board.
Mr. Tian has 20 years of extensive experience in the fields of competitive strategy, operation
management and property investment and development. Mr. Tian worked at the Nanjing People’s
Government (南京市人民政府) from July 1991 to October 2001, with his last position being the deputy
department head. He was also the executive secretary of Nanjing Changjiang Waterway Bureau (南京市長江航道管理局) from December 1979 to April 1991. In December 2001, Mr. Tian founded Landsea Group
Co., Ltd. (朗詩集團股份有限公司), a company principally engaged in property development, and has since
served as its director and chief executive officer. He has been the chairman of the board of Shanghai
Landleaf Architecture Technology Co., Ltd.* (上海朗綠建築科技有限公司) since July 2013, a company
principally engaged in providing green construction technologies related services and the shares of which
were listed on the National Equities Exchange and Quotations Co., Ltd. (stock code: 870998.NEEQ) from
February 2017 to March 2020.
Mr. Tian has served as the chairman and an executive director in Landsea Green Properties Co., Ltd.
(朗詩綠色地產有限公司) (stock code: 106.HK) since July 2013 and Landsea Homes Corporation, a
company listed on the NASDAQ Stock Market (symbols: “LSEA”, “LSEAW”) since January 2021. He was
appointed as a director of Landsea Green Life Service Company Limited (朗詩綠色生活服務有限公司)
(stock code: 1965.HK) in December 2020, and subsequently, its chairman of the board and a non-executive
director in January 2021 and has served since then.
Mr. Tian served on various committees, such as the vice president of China Real Estate Chamber of
Commerce (全聯房地產商會) from October 2016 to October 2021, the president of the CEIBS Alumni
Association from April 2017 to April 2020, and the rotating chairman of China Urban Realty Association
(中城聯盟) from April 2018 to April 2020.
Mr. Tian received a diploma in engine management from Nanjing Heyun School* (南京河運學校)
(currently known as Nanjing Maritime School* (南京航運學校)) in the PRC in December 1979 and a
diploma in Chinese from Nanjing Vocational Tertiary Institute* (南京職工高等學校) in the PRC in
December 1988. Mr. Tian completed a master’s course programme in administrative management from
Nanjing University (南京大學) in the PRC in August 1997 and received his master’s degree in business
management from China Europe International Business School (中歐國際工商學院) (“CEIBS”) in the
PRC in September 2007. Mr. Tian was awarded the “EY Entrepreneur of the Year” in the real estate
industry by Ernst & Young in October 2019.
Dr. Li Minghui (李明輝), aged 47, has been appointed as our independent non-executive director
with effect from December 8, 2021. Dr. Li is primarily responsible for supervising and providing
independent judgment to our Board.
Dr. Li was a lecturer in accounting from August 2003 to July 2005 and an associate professor in
accounting from August 2005 to November 2006 at the School of Management in Xiamen University (廈門大學). Dr. Li served as an associate professor at the School of Business in Nanjing University (南京大學) from December 2006 to December 2009. Since December 2009, Dr. Li has been a professor in
accounting at the School of Business in Nanjing University (南京大學).
DIRECTORS AND SENIOR MANAGEMENT
– 300 –
Dr. Li has been an independent non-executive director of Nanjing Zhongweixin Software Technology
Co., Ltd.* (南京中衛信軟件科技股份有限公司), a company principally engaged in computer software
development since August 2020 and has also served as an independent non-executive director of a number
of listed companies, including Baosheng Science and Technology Innovation Co., Ltd. (寶勝科技創新股份有限公司) (stock code: 600973.SH) from December 2014 to May 2019, Changchai Co., Ltd. (常柴股份有限公司) (stock code: 000570.SZ) from March 2015 to April 2020, Jiangsu Fasten Co., Ltd. (江蘇法爾勝股份有限公司) (stock code: 000890.SZ) from April 2015 to November 2019, Nanjing Securities Co.,
Ltd. (南京證券股份有限公司) (stock code: 601990.SH) since May 2016 and GCL Energy Technology Co.,
Ltd. (協鑫能源科技股份有限公司) (stock code: 002015.SZ) since June 2019.
Dr. Li has been a director of China Audit Society (中國審計學會) since December 2009 and the vice
president of Jiangsu Audit Society* (江蘇審計學會) since January 2019.
Dr. Li received his bachelor’s degree in accounting from Nanjing University of Science and
Technology (南京理工大學) in the PRC in June 1997 and his master’s degree in accounting from Shandong
University of Economics (山東經濟學院) (currently known as Shandong University of Finance and
Economics (山東財經大學)) in the PRC in June 2000. Dr. Li obtained his doctorate degree in accounting
from Xiamen University (廈門大學) in July 2003. Dr. Li is qualified as a non-practicing certified public
accountant issued by The Chinese Institute of Certified Public Accountants since December 2009.
Mr. Jiang Li (蔣立), aged 57, has been appointed as our independent non-executive director with
effect from December 8, 2021. Mr. Jiang is primarily responsible for supervising and providing
independent judgment to our Board.
Mr. Jiang was the founder of Nanjing Tianjia Air-conditioning Equipment Co., Ltd.* (南京天加空調設備有限公司), which was later renamed as Nanjing Tianjia Environmental Technology Co., Ltd.* (南京天加環境科技有限公司) and had been appointed as its director and general manager in 1999, and has
currently served as the chairman of the board of the same. Mr. Jiang served as a director of MayAir
Technology (China) Co., Ltd (美埃(中國)環境科技股份有限公司) from July 2019 to March 2020 and was
appointed as the chairman of its board since March 2020. Mr. Jiang has been a director of Guangzhou
Smardt Chiller Manufacturing Co., Ltd.* (廣州思茂特冷凍設備製造有限公司) since January 2021. Mr.
Jiang is also a member of the National Professional Standardization Technical Committee* (全國專業標準化技術委員會).
Mr. Jiang received his master’s degree in business management from China Europe International
Business School (中歐商學院) in the PRC in September 2009. During his career, Mr. Jiang was nominated
as an innovative enterprise talent by the Ministry of Science and Technology* (科技部創新企業人才) and
an excellent contributor to the cause of socialism with Chinese characteristics in Jiangsu Province* (江蘇省優秀中國特色社會主義事業建設者). Mr Jiang was also awarded the first prize and the second prize in
China machinery industry science and technology* (中國機械工業科學技術一等獎及二等獎) and Nanjing
science and technology progress award* (南京市科技進步獎).
Save as disclosed herein, none of the Directors have held directorships in any listed company over
the past three years and none of our Directors and members of senior management are related to other
Directors or members of senior management.
DIRECTORS AND SENIOR MANAGEMENT
– 301 –

Saved as disclosed above (and their respective interests or short positions (if any) as set out in the
section headed “Statutory and General Information – C. Further Information about our Directors and
Substantial Shareholders” in Appendix IV), there are no other matters in respect of each of our Directors
that is required to be disclosed pursuant to Rule 13.51(2)(a) to (v) of the Listing Rules and there is no other
material matter relating to our Directors that needs to be brought to the attention of our Shareholders.
SENIOR MANAGEMENT
Our senior management team comprises our executive Directors, biographies of whom are set out in
“– Directors – Executive Directors” above, and the following members:
Mr. Hu Yian (胡以安), aged 53, is our chief financial officer. Mr. Hu is primarily responsible for
overseeing overall financial operations, financing and investment activities of our Group.
Mr. Hu joined our Group in April 2003 and has since served as the director and financial vice
president of Nanjing Chervon Industry. Mr. Hu currently also serves as a director in a number of our
subsidiaries. Mr. Hu has been a director of Chervon Auto Precision Technology, a company listed on the
Shanghai Stock Exchange (stock code: 603982.SH), since October 2012. Prior to joining our Group, he
was a financial manager of Nanjing Ericsson Panda Communication Co., Ltd.* (南京愛立信熊貓通信有限公司) from November 1995 to March 2003.
Mr. Hu received his bachelor’s degree in industrial accounting from Northeast Institute of
Technology (東北工學院) in the PRC in June 1992 and his master’s degree in international management
from The Australian National University in Australia in June 2001.
Mr. Wu Shuming (吳書明), aged 55, is our vice president for research and development. Mr. Wu is
primarily responsible for supervising and managing the research and development system and leading
technological development of our Group.
Mr. Wu joined our Group as an engineer in Nanjing Chervon Industry in June 1997. Mr. Wu was
appointed as the general manager of R&D of our Group in March 2010. Prior to joining our Group, Mr.
Wu was an engineer in Nanjing Soil Instrument Factory* (南京土壤儀器廠) from July 1989 to May 1997.
Mr. Wu received his bachelor’s degree in vacuum technology and equipment from Hefei University
of Technology (合肥工業大學) in the PRC in July 1989.
Mr. Wu Gang (吳鋼), aged 48, is our chief digital officer. Mr. Wu is primarily responsible for
overseeing the digital strategy and information technology development of our Group.
Mr. Wu has extensive experience in managing the digital and information system at various
companies in the automotive industry. He joined our Group as the chief digital officer on April 26, 2021.
Prior to joining our Group, Mr. Wu was the IT system project manager of SAIC General Motors Co., Ltd.
from April 1998 to July 2005, the IT application director and the IT PMO director of SAIC Motor
Corporation Limited from August 2005 to July 2011, the chief IT director of industrial group of Nippon
China Limited from July 2011 to March 2012, the IT director of Geely and Volvo China in April 2012 and
the chief digital officer of SAIC MAXUS Automotive Co., Ltd. from February 2017 to July 2020.
DIRECTORS AND SENIOR MANAGEMENT
– 302 –

Mr. Wu received his bachelor’s degree in computer science and technology from Shanghai Jiao Tong
University (上海交通大學) in the PRC in July 1996 and his master’s degree in business administration
from Fudan University (復旦大學) in the PRC in January 2008.
Mr. Zhang Ding (章鼎), aged 42, is our vice president for product management. Mr. Zhang is
primarily responsible for overseeing the product planning and product management for our Group across
all brands and categories.
Mr. Zhang joined our Group in March 2003 as the sales manager of Nanjing Chervon Industry. From
2006 to 2020, Mr. Zhang held various positions in Nanjing Chervon Industry, including the product
manager, the product management director and the product management senior director, and has been the
vice president for product management of Nanjing Chervon Industry since April 2020.
Mr. Zhang received his bachelor’s degree in English from Guangdong University of Foreign Studies
(廣東外語外貿大學) in the PRC in June 2001 and his master’s degree in international marketing
management from The University of Leeds in the UK in November 2002.
Ms. Shan Xiaodong (單曉東), aged 54, is our vice president for human resources. Ms. Shan is
primarily responsible for overseeing human resources planning and management of our Group. Ms. Shan
joined our Group in May 2017 as the vice president for human resources in Nanjing Chervon Industry.
Prior to joining our Group, Ms. Shan was a lecturer in School of Economics and Management of
Inner Mongolia University (內蒙古大學經濟管理學院) from 1995 to 1996. Subsequently, Ms. Shan held
senior human resources management positions in various companies, including serving as a human
resources and administrative manager at BP China Ltd. from 2001 to 2003, the vice president for Asia
Pacific human resources (亞太人力資源總監) of Hexion Inc. (previously Momentive Specialty Chemicals)
from 2003 to 2015 and the vice president for human resources of Shanghai Fortune Map Trading Limited
(上海運圖貿易有限公司) from 2015 to 2017.
Ms. Shan received her bachelor’s degree in economic management from Fudan University (復旦大學) in the PRC in July 1988 and her master’s degree in management from BI Norwegian School of
Management in Norway in February 1999.
Mr. Peter John Melrose, aged 55, is our vice president for the European sales & marketing. Mr.
Melrose is primarily responsible for supervising overall operations, management, strategic planning and
sales and marketing development of our DIY power tools and OPE business in Europe.
Mr. Melrose joined our Group as a general manager of Chervon Europe in June 2007 and was
appointed as the managing director of EGO Europe GmbH since November 2015. Prior to joining our
Group, Mr. Melrose began his career with Black & Decker and held various sales, marketing and product
development positions before joining NEC (UK) LTD as the European marketing manager. Mr. Melrose
continued his career in marketing with one of the UK’s foremost companies (Centrica plc) within its
energy supply business (British Gas Trading Ltd) and re-joined the power tool industry in Europe as a
commercial director with Global Machinery Company Pty.
Mr. Melrose received his bachelor’s degree in civil engineering from Hatfield Polytechnic in the UK
in July 1988 and his master’s degree in business administration (MBA) with a major in strategic marketing
from Hull University in the UK in July 1997.
DIRECTORS AND SENIOR MANAGEMENT
– 303 –
Dr. Christian Neuner, aged 46, is our vice president for FLEX. Mr. Neuner is primarily responsible
for supervising overall operations, management, strategic planning and sales and marketing development
of the FLEX brand product.
Dr. Neuner joined our Group in August 2014 as the vice president of corporate strategy and
development of Nanjing Chervon Industry. Dr. Neuner has subsequently held positions in a number of our
subsidiaries, including the managing director of Chervon GmbH since October 2016, the managing
director of Flex EL since May 2017, the managing director of Flex Geschäftsführungs GmbH since June
2017 and the chief executive officer of Flex Verwaltungs GmbH & Co. KG since January 2018. Prior to
joining our Group, Dr. Neuner served as a project manager of Roland Berger Strategy Consultants GmbH
from May 2003 to October 2010 and a principal of Roland Berger Management Consultants (Shanghai)
Co., Ltd. from October 2010 to July 2014.
Dr. Neuner received his master’s degree in business administration with a major in marketing andproduction and his doctorate degree in business administration from the University of Bayreuth inGermany in May 2002 and April 2009, respectively. Dr. Neuner has been one of the board members of theEuropean Power Tool Association (EPTA) since January 2020 and has been elected as the vice presidentof the German Power Tool Association (ZVEI) in July 2021.
Save as disclosed above, none of our senior management team has been a director of any listedcompanies during the three years immediately prior to the date of this prospectus.
JOINT COMPANY SECRETARIES
Mr. Hu Yian (胡以安), aged 52 was appointed as one of the joint company secretaries of ourCompany on August 4, 2021, which took effect on the same day.
See “– Senior Management” in this section above for his biography.
Ms. Chow Yuk Yin Ivy (周玉燕) was appointed as one of the joint company secretaries of ourCompany on August 4, 2021, which took effect on the same day.
Ms. Chow is a Director of Corporate Services of Tricor Services Limited. She has over 20 years ofexperience in the fields of corporate secretarial and compliance services. Ms. Chow obtained a Bachelorof Arts degree from The Hong Kong Polytechnic University and was qualified as chartered secretary andchartered governance professional. She has been admitted as a fellow of The Hong Kong CharteredGovernance Institute, a fellow of The Chartered Governance Institute in the United Kingdom and anordinary member of the Hong Kong Securities and Investment Institute since 2012.
MANAGEMENT AND CORPORATE GOVERNANCE
Board Committees
Audit Committee
We have established an audit committee written terms of reference in compliance with Rule 3.21 ofthe Listing Rules and the Corporate Governance Code set out in Appendix 14 to the Listing Rules. Theprimary duties of the audit committee are to review and supervise the financial reporting process andinternal controls system of our Group, review and approve connected transactions and provide advice and
DIRECTORS AND SENIOR MANAGEMENT
– 304 –

comments to the Board. The audit committee comprises three members, namely Dr. Li Minghui, Mr. TianMing and Mr. Jiang Li, with Dr. Li Minghui (being our independent non-executive Director with theappropriate professional qualifications) as the chairperson of the audit committee.
Remuneration Committee
We have established a remuneration committee with written terms of reference in compliance withRule 3.25 of the Listing Rules and the Corporate Governance Code set out in Appendix 14 to the ListingRules. The primary duties of the remuneration committee are to review and make recommendations to theBoard on the terms of remuneration packages, bonuses and other compensation payable to our Directorsand other senior management. The remuneration committee comprises three members, namely Mr. TianMing, Ms. Zhang and Dr. Li Minghui, with Mr. Tian Ming as the chairperson of the remunerationcommittee.
Nomination Committee
We have established a nomination committee with written terms of reference in compliance with the
Code on Corporate Governance in Appendix 14 to the Listing Rules. The primary duties of the nomination
committee are to make recommendations to our Board on the appointment of Directors and management
of Board succession. The nomination committee comprises three members, namely Mr. Pan, Mr. Tian
Ming and Mr. Jiang Li, with Mr. Jiang Li as the chairperson of the nomination committee.
Corporate Governance Code
We aim to achieve high standards of corporate governance which are crucial to our development and
safeguard the interests of our Shareholders. In order to accomplish this, we expect to comply with the
Corporate Governance Code set out in Appendix 14 to the Listing Rules save for the below.
Code provision A.2.1 of the Corporate Governance Code and Corporate Governance Report in
Appendix 14 to the Listing Rules, recommends, but does not require, that the roles of chairperson and
chief executive should be separate and should not be performed by the same person. Our Company
deviates from this provision as Mr. Pan performs both the roles of the Chairman of our Board and the chief
executive officer of our Company. Mr. Pan is the principal founder of our Group and has extensive
experience in the business operations and management of our Group. Our Board believes that vesting the
roles of both chairman and chief executive officer to Mr. Pan has the benefit of ensuring consistent
leadership within our Group and enables more effective and efficient overall strategic planning. This
structure will enable our Company to make and implement decisions promptly and effectively.
Our Board considers that the balance of power and authority will not be impaired due to this
arrangement. In addition, all major decisions are made in consultation with members of our Board,
including the relevant Board committees, and three independent non-executive Directors. Our Board will
reassess the division of the roles of chairman and the chief executive officer from time-to-time, and may
recommend dividing the two roles between different people in the future, taking into account the
circumstances of our Group as a whole.
DIRECTORS AND SENIOR MANAGEMENT
– 305 –

Board diversity
Our Company has adopted a board diversity policy which sets out the approach to achieve diversity
of the Board. Our Company recognises and embraces the benefits of having a diverse Board and sees
increasing diversity at our Board level, including gender diversity, as an essential element in maintaining
our Company’s competitive advantage and enhancing its ability to attract, retain and motivate employees
from the widest possible pool of available talent. Pursuant to the board diversity policy, in reviewing and
assessing suitable candidates to serve as a director of our Company, the nomination committee will
consider a number of factors, including but not limited to gender, age, cultural and educational
background, professional qualifications, skills, knowledge, and industry experience. Pursuant to the board
diversity policy, the nomination committee will discuss periodically and when necessary, agree on the
measurable objectives for achieving diversity, including gender diversity, on our Board and recommend
them to our Board for formal adoption.
Given one out of seven of our Directors is female upon Listing, we will continue to take steps to
promote gender diversity at the Board of our Company. After the Listing, we will strive to achieve gender
balance of the Board through certain measures to be implemented by our nomination committee in
accordance with our board diversity policy. In particular, we will actively identify female individuals
suitably qualified to become our Board members and we aim to achieve a target of 20% female
representation in our Board. To further ensure gender diversity of our Board in a long run, our Group will
also identify and select several female individuals with a diverse range of skills, experience and
knowledge in different fields from time to time, and maintain a list of such female individuals who possess
qualities to become our Board members, which will be reviewed by our nomination committee periodically
in order to develop a pipeline of potential successors to our Board to promote gender diversity of our
Board.
The Nomination Committee is responsible for compliance with relevant codes governing board
diversity under the Corporate Governance Code. After the Listing Date, the Nomination Committee will
review the board diversity policy from time to time to ensure its continued effectiveness and we will
disclose in our corporate governance report about the implementation of the board diversity policy on an
annual basis.
WAIVERS GRANTED BY THE STOCK EXCHANGE
Management presence
Pursuant to Rule 8.12 of the Listing Rules, an issuer must have a sufficient management presence
in Hong Kong. This will normally mean that at least two of its executive directors must be ordinarily
resident in Hong Kong. We do not have sufficient management presence in Hong Kong for the purposes
of Rule 8.12 of the Listing Rules. Accordingly, we have applied for, and the Stock Exchange has granted,
a waiver from strict compliance with Rule 8.12 of the Listing Rules. See the section headed “Waivers from
Strict Compliance with the Listing Rules – Waiver in relation to Management Presence in Hong Kong” in
this prospectus for further details.
DIRECTORS AND SENIOR MANAGEMENT
– 306 –
Qualification of one of our Joint Company Secretaries
We have applied to the Stock Exchange for, and the Stock Exchange has granted, a waiver under andin respect of Rules 3.28 and 8.17 of the Listing Rules in relation to the requirement on the qualificationsof one of our joint company secretaries, Mr. Hu. See the section headed “Waivers from Strict Compliancewith the Listing Rules – Waiver in relation to our Joint Company Secretaries” in this prospectus for furtherdetails.
COMPENSATION OF DIRECTORS AND SENIOR MANAGEMENT
Our executive and independent non-executive Directors receive compensation in the form of fees,salaries, allowances, bonuses and benefits in kind, including our Company’s contribution to the pensionscheme on their behalf. We determine the salaries of our Directors based on each Director’sresponsibilities, qualification, position and seniority.
The aggregate amount of remuneration paid by us to our Directors for the three years endedDecember 31, 2018 and 2019 and 2020 and the six months ended June 30, 2021 were US$1.7 million,US$1.7 million, US$1.9 million and US$0.6 million, respectively. It is estimated that remuneration andbenefit in kind (excluding any possible payment of discretionary bonus) equivalent to approximatelyUS$1,849,000 in aggregate will be paid and granted to our Directors by us for the year endingDecember 31, 2021, based on the arrangements in force as of the date of this prospectus.
The aggregate amount of remuneration paid by us to our five highest paid individuals (including ourDirectors, senior management members and employees) for the three years ended December 31, 2018,2019 and 2020 and the six months ended June 30, 2021 were US$2.3 million, US$2.5 million, US$4.9million and US$1.3 million, respectively.
No compensation was paid by us to our Directors and our five highest paid individuals as aninducement to join, or upon joining, our Group during the Track Record Period. No compensation was paidto, or receivable by, our Directors, past Directors or the five highest paid individuals for the Track RecordPeriod for the loss of office as director of any member of our Group or of any other office in connectionwith the management of the affairs of any member of our Group. None of our Directors had waived oragreed to waive any emoluments during the same period.
For additional information on Directors’ remuneration during the Track Record Period as well asinformation on our highest paid individuals, please see Notes 8 and 9 to the Accountants’ Report set outin Appendix I in this prospectus.
COMPLIANCE ADVISER
We have appointed Guotai Junan Capital Limited as our Compliance Adviser pursuant to Rule 3A.19of the Listing Rules. The Compliance Adviser will provide us with guidance and advice as to compliancewith the requirements under the Listing Rules and applicable Hong Kong laws. Pursuant to Rule 3A.23of the Listing Rules, the Compliance Adviser will advise our Company, among others, in the followingcircumstances:
(a) before the publication of any regulatory announcement, circular, or financial report;
(b) where a transaction, which might be a notifiable or connected transaction, is contemplated,including share issues and share repurchases;
DIRECTORS AND SENIOR MANAGEMENT
– 307 –

(c) where we propose to use the proceeds of the Global Offering in a manner different from thatdetailed in this prospectus or where the business activities, development or results of the Groupdeviate from any forecast, estimate or other information in this prospectus; and
(d) where the Stock Exchange makes an inquiry to the Company regarding unusual movements inthe price or trading volume of its listed securities or any other matters in accordance with Rule13.10 of the Listing Rules.
The term of appointment of the Compliance Adviser shall commence on the Listing Date and isexpected to end on the date on which we comply with Rule 13.46 of the Listing Rules in respect of ourfinancial results for the first full financial year commencing after the Listing Date.
DIRECTORS AND SENIOR MANAGEMENT
– 308 –

So far as our Directors are aware, immediately following the completion of the Global Offering(assuming that the Over-allotment Option is not exercised), the following persons will have an interest ora short position in our Shares or underlying Shares of our Company which will be required to be disclosedto our Company and the Stock Exchange pursuant to the provisions of Division 2 and 3 of Part XV of theSFO or will be, directly or indirectly, interested in 10% or more of any class of share capital carrying rightsto vote in all circumstances at general meetings of our Company or any of our subsidiaries:
Shares held as of the dateof this prospectus
Immediately after theGlobal Offering
Name of shareholderName ofCompany
Nature ofinterest(1)
Number ofShares or
interests held
Approximatepercentage of
interest in ourCompany or our
subsidiary
Number ofShares or
interests held
Approximatepercentage of
interest in ourCompany or our
subsidiary(2)
Mr. Pan(3) Our Company Interest incontrolledcorporation
260,226,344 63.86% 260,226,344 54.28%
Panmercy(3) Our Company Beneficialowner
260,226,344 63.86% 260,226,344 54.28%
Ms. Zhang(4)(5) Our Company Interest incontrolledcorporation
98,835,550 24.25% 98,835,550 20.62%
Green Hope(4) Our Company Beneficialowner
97,637,750 23.96% 97,637,750 20.37%
Mr. Ke(6) Our Company Interest incontrolledcorporation
27,118,822 6.66% 27,118,882 5.66%
Klamm(6) Our Company Beneficialowner
27,118,822 6.66% 27,118,822 5.66%
Notes:
(1) All interests stated are long positions.
(2) The calculation is based on the total number of 479,431,411 Shares in issue immediately following the completion of theGlobal Offering and assuming that the Over-allotment Option is not exercised.
(3) Panmercy is wholly owned by Mr. Pan, who is also a director of Panmercy.
(4) 97,637,750 Shares are held by Green Hope, which is wholly owned by Ms. Zhang, who is also a director of Green Hope.
(5) 1,197,800 Shares are held by two offshore employee shareholding platforms, Sky Roc Investment Limited and NP KunInvestment Limited, pursuant to an employee incentive arrangement. Ms. Zhang is the sole director of the offshoreshareholding platforms and is deemed to be interested in these Shares for the purposes of the SFO.
(6) Klamm is wholly owned by Mr. Ke, who is also a director of Klamm.
SUBSTANTIAL SHAREHOLDERS
– 309 –

Save as disclosed above and in the section headed “Statutory and General Information – C. Further
Information about Our Directors and Substantial Shareholders – 1. Directors” in Appendix IV to this
prospectus, our Directors are not aware of any person who will, immediately following the completion of
the Global Offering (assuming the Over-allotment Option is not exercised), have an interest or a short
position in the Shares or underlying Shares which will be required to be disclosed to our Company and
the Stock Exchange under the provisions of Division 2 and 3 of Part XV of the SFO or will be, directly
or indirectly, interested in 10% or more of any class of share capital carrying rights to vote in all
circumstances at general meetings of any other member of our Group.
SUBSTANTIAL SHAREHOLDERS
– 310 –

THE CORNERSTONE INVESTMENT
We have entered into cornerstone investment agreements (each a “Cornerstone InvestmentAgreement”, and together the “Cornerstone Investment Agreements”) with the cornerstone investors set
out below (each a “Cornerstone Investor”, and together the “Cornerstone Investors”), pursuant to
which the Cornerstone Investors have agreed to, subject to certain conditions, subscribe at the Offer Price
for such number of Offer Shares (rounded down to the nearest whole board lot of 100 Shares) that may
be purchased for an aggregate amount of approximately US$210 million (or approximately HK$1.64
billion, calculated based on an exchange rate of US$1.00 to HK$7.7967) (the “CornerstoneInvestment”).
Assuming an Offer Price of HK$37.60, being the low-end of the indicative Offer Price range set out
in this Prospectus, the total number of Offer Shares to be subscribed by the Cornerstone Investors would
be 43,549,400 Offer Shares, representing approximately 60.56% of the Offer Shares pursuant to the Global
Offering and approximately 9.08% of our total issued share capital immediately upon completion of the
Global Offering (assuming the Over-allotment Option is not exercised).
Assuming an Offer Price of HK$40.60, being the mid-point of the indicative Offer Price range set
out in this Prospectus, the total number of Offer Shares to be subscribed by the Cornerstone Investors
would be 40,331,400 Offer Shares, representing approximately 56.08% of the Offer Shares pursuant to the
Global Offering and approximately 8.41% of our total issued share capital immediately upon completion
of the Global Offering (assuming the Over-allotment Option is not exercised).
Assuming an Offer Price of HK$43.60, being the high-end of the indicative Offer Price range set out
in this Prospectus, the total number of Offer Shares to be subscribed by the Cornerstone Investors would
be 37,556,500 Offer Shares, representing approximately 52.22% of the Offer Shares pursuant to the Global
Offering and approximately 7.83% of our total issued share capital immediately upon completion of the
Global Offering (assuming the Over-allotment Option is not exercised).
Our Company is of the view that, leveraging on the Cornerstone Investors’ investment experience,
the Cornerstone Investment will help raise the profile of our Company and to signify that such investors
have confidence in our business and prospect. Our Company became acquainted with each of the
Cornerstone Investors in its ordinary course of business or through introduction by the Joint
Representatives in the Global Offering.
The Cornerstone Investment will form part of the International Offering and the Cornerstone
Investors will not subscribe for any Offer Shares under the Global Offering (other than pursuant to the
Cornerstone Investment Agreements). The Offer Shares to be subscribed by the Cornerstone Investors will
rank pari passu in all respect with the fully paid Shares in issue and will be counted towards the public
float of our Company. Immediately following the completion of the Global Offering, none of the
Cornerstone Investors will become a substantial shareholder of our Company, the Cornerstone Investors
or their close associates will not, by virtue of their cornerstone investments, have any Board representation
in our Company. Other than a guaranteed allocation of the relevant Offer Shares at the final Offer Price,
the Cornerstone Investors do not have any preferential rights in the Cornerstone Investment Agreements
compared with other public Shareholders.
CORNERSTONE INVESTORS
– 311 –
To the best knowledge of our Company, (i) each of the Cornerstone Investors is an independent third
party; (ii) none of the Cornerstone Investors is accustomed to take instructions from our Company, our
subsidiaries, the Directors, chief executive, Controlling Shareholders, substantial Shareholders, existing
Shareholders or their respective close associates in relation to the acquisition, disposal, voting, or other
disposition of Shares registered in its name or otherwise held by it; and (iii) none of the subscription of
the relevant Offer Shares by any of the Cornerstone Investors is financed by our Company, the Directors,
chief executives, Controlling Shareholders, substantial Shareholders, existing Shareholders or any of our
subsidiaries or their respective close associates. Each of the Cornerstone Investors has confirmed that all
necessary approvals have been obtained with respect to the Cornerstone Investment and no specific
approval from any stock exchange (if relevant) or its shareholder is required for the relevant cornerstone
investment as each of them has general authority to invest.
Each of the Cornerstone Investors has confirmed that their subscription under the Cornerstone
Investment will be financed by their own internal resources. There are no side arrangements or agreements
between our Company and the Cornerstone Investors or any benefit, direct or indirect, conferred on the
Cornerstone Investors by virtue of or in relation to the Cornerstone Investment, other than a guaranteed
allocation of the relevant Offer Shares at the final Offer Price.
There is no delayed delivery arrangement for the Cornerstone Investors. Each Cornerstone Investor
has agreed that it shall pay the relevant Offer Shares on or before the Listing Date. There will be no
delayed settlement of payment.
The Offer Shares to be subscribed by the Cornerstone Investors may be affected by reallocation in
the event of over-subscription under the Hong Kong Public Offering, as described in the section headed
“Structure of the Global Offering – The Hong Kong Public Offering – Reallocation”; in such case, the
amount allocated to each Cornerstone Investor will be scaled back on a pro rata basis. In the event that
50% of the total number of Offer Shares initially made available under the Global Offering is reallocated
to the Hong Kong Public Offering, the amount of Offer Shares allocated to the Cornerstone Investors will
be adjusted in proportion to their original subscription amount and represent, in aggregate, approximately
50% of the total number of Offer Shares initially available under the Global Offering. Assuming that the
Over-allotment Option is fully exercised, the Offer Shares allocated to the Cornerstone Investors, in
aggregate, will represent approximately 43.48% of the total number of Offer Shares (as enlarged by the
exercise of the Over-allotment Option). Details of the actual number of Offer Shares to be allocated to the
Cornerstone Investors will be disclosed in the allotment results announcement to be issued by us on or
around December 29, 2021.
THE CORNERSTONE INVESTORS
The information about our Cornerstone Investors set forth below has been provided by our
Cornerstone Investors in connection with the Cornerstone Investment.
Value Partners Hong Kong
Value Partners Hong Kong Limited (“Value Partners Hong Kong”), was established in 1999. It acts
as investment manager or investment advisor to certain investment funds. It is a wholly-owned subsidiary
of Value Partners Group Limited, a company listed on the Stock Exchange of Hong Kong Limited (stock
code: 806) (“Value Partners”). Value Partners is one of Asia’s largest independent asset management
firms. It is headquartered in Hong Kong and operates in Shanghai, Shenzhen, Singapore, Malaysia and
CORNERSTONE INVESTORS
– 312 –

London. Value Partners investment strategies cover equities, fixed income, multi-asset, quantitative
investment solutions and alternatives for institutional and individual clients in the Asia Pacific, Europe and
the United States. Value Partners has approximately US$10.7 billion of unaudited assets under
management as at October 31, 2021.
Greenwoods
Greenwoods Asset Management Hong Kong Limited (“Greenwoods”) is a private fund management
company incorporated in Hong Kong with limited liability. Established in 2005, Greenwoods is one of the
largest and earliest China-focused asset managers mainly specializing in investing into companies in the
Greater China region. Greenwoods is the manager/advisor of funds such as Golden China Master Fund.
Greenwoods focuses on fundamental research, value investments, and local due diligence. Investors of
funds and accounts managed by Greenwoods mainly consist of global institutional investors such as
sovereign wealth funds, university endowments, financial institutions, and family offices.
Prime Capital Funds
Dragon Billion China Master Fund (“DBCMF”), Dragon Billion Select Master Fund (“DBSMF”)
and Map 147 Segregated Portfolio (“MAP 147”) (collectively, the “Prime Capital Funds”) are
investment funds or accounts managed or advised by Prime Capital Management Company Limited in its
full discretion as investment manager or adviser. Prime Capital Management Company Limited, a
company organized in Hong Kong with limited liability, is licensed with the SFC and registered with the
US Securities and Exchange Commission. Each of DBCMF and DBSMF is an investment fund established
in the Cayman Islands as an exempted company with limited liability. MAP 147 is a segregated portfolio
of LMA SPC, an exempted segregated portfolio company organized in the Cayman Islands. Prime Capital
Funds has approximately US$1.9 billion of assets under management as at November 30, 2021.
3W Fund
3W Fund Management Limited (“3W Fund”) is incorporated in Hong Kong with limited liability and
licensed by the SFC to carry out Type 9 (asset management) regulated activity. 3W Fund has agreed to
procure certain investors, namely 3W Greater China Focus Fund and 3W Global Fund, that 3W Fund has
discretionary investment management power over, to subscribe for such number of the Investor Shares.
3W Greater China Focus Fund and 3W Global Fund pursue to maximize absolute return and seek
long-term capital growth primarily through fundamental investment principle with value approach.
IvyRock
IvyRock Asset Management (HK) Limited (“IvyRock”) is incorporated with limited liability in
Hong Kong in 2009 and licensed by the SFC to carry out Type 9 (asset management) regulated activity
in 2014. The firm is ultimately owned by Mr. Yong HUANG. IvyRock is a discretionary investment
manager of certain commingled funds and institutional separate managed account (together, the “IvyRockFunds”). IvyRock has approximately US$1.3 billion of assets under management as at November 30,
2021.
The IvyRock Funds pursue to achieve long-term capital appreciation by investing primarily in the
listed securities of companies which have great exposure to the greater china region with a fundamentals-
driven approach.
CORNERSTONE INVESTORS
– 313 –

Ms. Luo
Ms. Luo Jinhong (駱錦紅) (“Ms. Luo”) is the chairman of the board of directors and the chief
executive officer of Xizang EVE Holding Company (西藏億緯控股有限公司) (“Xizang EVE”), a
company incorporated in the PRC with limited liability and engaged in equity investment. Ms. Luo and
her husband Mr. Liu Jincheng (劉金成) each holds 50% of equity interests in Xizang EVE, with Ms. Luo
as the controlling shareholder of Xizang EVE. Ms. Luo and Xizang EVE have invested in EVE Energy
Co., Ltd. (惠州億緯鋰能股份有限公司) (“EVE Energy”), a company listed on the growth enterprise board
(ChiNext board) of the Shenzhen Stock Exchange (stock code: 300014.SZ) and a supplier of our Group.
As of September 30, 2021, Xizang EVE and Ms. Luo hold equity interests of 32% and 1.27% in EVE
Energy, respectively. As of December 10, 2021, EVE Energy has an approximate market value of RMB260
billion based on its closing price on the same day.
CORNERSTONE INVESTORS
– 314 –

The table below sets forth details of the Cornerstone Investment:
Based on the Offer Price of HK$37.60 (being the low-end of the indicative Offer Price range)
CornerstoneInvestor
Total investmentAmount
Number of OfferShares to beacquired(1)(2)
Assuming the Over-allotmentOption is not exercised
Assuming the Over-allotmentOption is fully exercised
Approximate % ofthe Offer Shares
Approximate % ofownership
Approximate % ofthe Offer Shares
Approximate % ofownership
Value Partners
Hong Kong US$50 million 10,367,900 14.42% 2.16% 12.54% 2.11%Greenwoods US$20 million 4,147,100 5.77% 0.87% 5.01% 0.85%Prime Capital Funds US$30 million 6,220,700 8.65% 1.30% 7.52% 1.27%3W Fund US$30 million 6,220,700 8.65% 1.30% 7.52% 1.27%IvyRock US$30 million 6,220,700 8.65% 1.30% 7.52% 1.27%Ms. Luo HK$390 million 10,372,300 14.42% 2.16% 12.54% 2.12%
Total US$210 million(1) 43,549,400 60.56% 9.08% 52.66% 8.88%
Based on the Offer Price of HK$40.60 (being the mid-point of the indicative Offer Price range)
CornerstoneInvestor
Total investmentAmount
Number of OfferShares to beacquired(1)(2)
Assuming the Over-allotment Option isnot exercised
Assuming the Over-allotment Option isfully exercised
Approximate % ofthe Offer Shares
Approximate % ofownership
Approximate % ofthe Offer Shares
Approximate % ofownership
Value Partners
Hong Kong US$50 million 9,601,800 13.35% 2.00% 11.61% 1.96%Greenwoods US$20 million 3,840,700 5.34% 0.80% 4.64% 0.78%Prime Capital Funds US$30 million 5,761,000 8.01% 1.20% 6.97% 1.18%3W Fund US$30 million 5,761,000 8.01% 1.20% 6.97% 1.18%IvyRock US$30 million 5,761,000 8.01% 1.20% 6.97% 1.18%Ms. Luo HK$390 million 9,605,900 13.36% 2.00% 11.61% 1.96%
Total US$210 million(1) 40,331,400 56.08% 8.41% 48.77% 8.23%
CORNERSTONE INVESTORS
– 315 –

Based on the Offer Price of HK$43.60 (being the high-end of the indicative Offer Price range)
CornerstoneInvestor
Total investmentAmount
Number of OfferShares to beacquired(1)(2)
Assuming the Over-allotment Option isnot exercised
Assuming the Over-allotment Option isfully exercised
Approximate % ofthe Offer Shares
Approximate % ofownership
Approximate % ofthe Offer Shares
Approximate % ofownership
Value Partners
Hong Kong US$50 million 8,941,100 12.43% 1.86% 10.81% 1.82%Greenwoods US$20 million 3,576,400 4.97% 0.75% 4.32% 0.73%Prime Capital Funds US$30 million 5,364,700 7.46% 1.12% 6.49% 1.09%3W Fund US$30 million 5,364,700 7.46% 1.12% 6.49% 1.09%IvyRock US$30 million 5,364,700 7.46% 1.12% 6.49% 1.09%Ms. Luo HK$390 million 8,944,900 12.44% 1.87% 10.82% 1.82%
Total US$210 million(1) 37,556,500 52.22% 7.83% 45.41% 7.66%
Notes:
(1) Calculated based on an exchange rate of US$1.00 to HK$7.7967.
(2) Subject to rounding down to the nearest whole board lot of 100 Shares.
CLOSING CONDITIONS
The obligation of each of the Cornerstone Investors to acquire the Offer Shares under the respective
Cornerstone Investment Agreement is subject to, among other things, the following closing conditions:
(i) the Hong Kong Underwriting Agreement and the International Underwriting Agreement being
entered into and having become effective and unconditional (in accordance with their
respective original terms or as subsequently waived or varied by agreement of the parties
thereto) by no later than the time and date as specified in the Hong Kong Underwriting
Agreement and the International Underwriting Agreement, and neither the Hong Kong
Underwriting Agreement nor the International Underwriting Agreement having been
terminated;
(ii) the Offer Price having been agreed upon between the Company and the Joint Representatives
(on behalf of the underwriters of the Global Offering);
(iii) the Listing Committee having granted the listing of, and permission to deal in, the Shares
(including the Shares under the Cornerstone Investment) as well as other applicable waivers
and approvals and such approval, permission or waiver having not been revoked prior to the
commencement of dealings in the Shares on the Stock Exchange;
CORNERSTONE INVESTORS
– 316 –

(iv) no laws shall have been enacted or promulgated by any government authority which prohibits
the consummation of the transactions contemplated in Hong Kong Public Offering, the
International Offering or the Cornerstone Investment Agreement, and there shall be no orders
or injunctions from a court of competent jurisdiction in effect precluding or prohibiting
consummation of such transactions; and
(v) the respective representations, warranties, acknowledgements, undertakings and confirmations
of the Cornerstone Investor under the Cornerstone Investment Agreement are accurate and true
in all respects and not misleading and that there is no material breach of the Cornerstone
Investment Agreement on the part of the Cornerstone Investor.
RESTRICTIONS ON THE CORNERSTONE INVESTOR
Each of the Cornerstone Investors has agreed that it will not, whether directly or indirectly, at any
time during the period of six months from the Listing Date (the “Lock-up Period”), dispose of any of the
Offer Shares they have purchased pursuant to the relevant Cornerstone Investment Agreements, save for
certain limited circumstances, such as transfers to any of its wholly-owned subsidiaries who will be bound
by the same obligations of such Cornerstone Investor, including the Lock-up Period restriction.
CORNERSTONE INVESTORS
– 317 –

SHARE CAPITAL
As of the Latest Practicable Date, the issued shares of our Company comprised fully paid
407,515,411 ordinary shares. Pursuant to the Companies Ordinance, with effect from March 3, 2014,
companies incorporated in Hong Kong no longer have an authorized share capital and there is no longer
the concept of par value in respect of issued shares. Accordingly, our Company does not have authorized
share capital and our Shares have no par value.
Details of the issued share capital of our Company immediately following the completion of the
Global Offering are set out below:
Issued and to be issued, fully paid or credited as fully paid: Number of Shares
Shares in issue as of the date of this prospectus 407,515,411Shares to be issued pursuant to the Global Offering 71,916,000
Total 479,431,411
ASSUMPTIONS
The above table assumes that the Global Offering becomes unconditional and the Shares are issued
pursuant to the Global Offering. The above does not take into account any Shares (i) which may be issued
pursuant to the Over-allotment Option; or (ii) any Shares which may be issued or repurchased by our
Company pursuant to the general mandates granted to our Directors to issue or repurchase Shares as
described below or otherwise.
RANKING
The Shares are ordinary shares in the share capital of our Company and rank equally with all Shares
currently in issue or to be issued and, in particular, will rank in full for all dividends or other distributions
declared, made or paid on the Shares in respect of a record date which falls after the date of this
prospectus.
GENERAL MANDATE TO ISSUE SHARES
Subject to the Global Offering becoming unconditional, our Directors have been granted a general
mandate to allot, issue and deal with Shares, particulars of which are set out in the section headed
“Statutory and General Information – A. Further Information about our Group – 3. Resolutions in Writing
of the Shareholders of our Company passed on December 8, 2021” in Appendix IV to this prospectus.
GENERAL MANDATE TO REPURCHASE SHARES
Subject to the Global Offering becoming unconditional, our Directors have been granted a general
mandate to repurchase Shares, particulars of which are set out in “Statutory and General Information – A.
Further Information about our Group – 3. Resolutions in Writing of the Shareholders of our Company
passed on December 8, 2021” in Appendix IV to this prospectus.
SHARE CAPITAL
– 318 –

You should read the following discussion and analysis of our financial condition and results of
operations together with our consolidated financial statements as of and for each of the years ended
December 31, 2018, 2019 and 2020 and the six months ended June 30, 2021 and the accompanying
notes included in the Accountants’ Report set out in Appendix I to this prospectus. Our consolidated
financial statements have been prepared in accordance with HKFRSs. Potential investors should read
the whole of the Accountants’ Report set out in Appendix I to this prospectus and not rely merely on
the information contained in this section. The following discussion and analysis contains forward-
looking statements that involve risks and uncertainties. For additional information regarding these
risks and uncertainties, please refer to the section headed “Risk Factors” in this prospectus.
OVERVIEW
We are a global provider of power tools and outdoor power equipment (“OPE”). Our focus oninnovation, especially lithium-ion battery system technology, has enabled us to achieve significant scaleand rapid growth. According to the Frost & Sullivan Report, in 2020, we ranked the 13th and accountedfor approximately 1.9% of the combined global power tool and OPE markets by revenue. We also rankedthe 9th and accounted for approximately 1.7% of the global power tool market, and ranked the 10th andaccounted for approximately 2.1% of the global OPE market, in each case by revenue, according to thesame report. In 2020, the global electric power tools market accounted for 74.1% of the global power toolsmarket, and the global electric OPE market accounted for 18.6% of the global OPE market, according tothe Frost & Sullivan Report. Our global ranking by revenue for electric power tools rose from the 9th in2018 to the 7th in 2020, and our global ranking by revenue for electric OPE rose quickly from the 7th in2018 to the 2nd in 2020, according to the same source. From 2018 to 2020, our revenue from power toolsgrew by a CAGR of 16.9%, and our revenue from OPE grew by a CAGR of 62.8%.
We offer a comprehensive range of products under a portfolio of well-recognized brands, which aretailored to address the diverse needs of our end users around the world. Our power tools target bothindustrial/professional and consumer end users, and our OPE products target both premium andmass-market end users. We currently own five differentiated and well-recognized brands that cover keygeographies and segments, namely EGO, FLEX, SKIL, DEVON and X-TRON. In particular, our EGO brandhas gained strong recognition in the global electric OPE market since its establishment in 2013.
We will continue to focus on user-centric innovation and product offerings, which is supported byour integrated system of research and development, manufacturing and sales and distribution capabilities.Our broad end user base for lithium-ion battery powered products enables us to rapidly accumulateindustry knowledge, technology know-how and end-user insights. Leveraging such knowledge andinsights, we have been able to continuously introduce new products showcasing advanced technology andproduct advanced capabilities. We then produce these new, user-centric products in a consistentlyhigh-quality manner through our smart manufacturing system and distributing them through ourmulti-channel sales and distribution network. Our global operations and local market knowledge enableus to expand market shares and meet end user needs in our target markets. Our robust brand portfolio,which resonates with our end users, also helps solidify our market position.
FINANCIAL INFORMATION
– 319 –
We have achieved strong revenue growth and improved profitability during the Track Record Period.Our revenue increased at a CAGR of 31.9% from US$690.7 million in 2018 to US$1,200.9 million in2020, which was significantly higher than the 4.9% for the global power tool and OPE industry over thesame period, according to the Frost & Sullivan Report. Our revenue increased by 68.9% from US$514.4million for the six months ended June 30, 2020 to US$868.8 million for the six months ended June 30,2021. Our gross profit increased at a CAGR of 44.9% from US$175.5 million in 2018 to US$368.7 millionin 2020. In addition, our gross profit increased by 70.0% from US$147.7 million for the six months endedJune 30, 2020 to US$251.1 million for the six months ended June 30, 2021. We recorded net loss ofUS$13.5 million for 2018 and net profit of US$36.1 million and US$48.4 million for 2019 and 2020,respectively. In addition, our profit increased significantly from US$20.5 million for the six months endedJune 30, 2020 to US$91.2 million for the six months ended June 30, 2021. Our adjusted net loss(non-HKFRSs measure) was US$13.5 million for 2018, and our adjusted net profit (non-HKFRSsmeasure) was US$36.1 million, US$69.7 million, US$20.5 million and US$93.4 million in 2019 and 2020and the six months ended June 30, 2020 and 2021. See “– Non-HKFRSs Measures.”
FACTORS AFFECTING OUR FINANCIAL CONDITION AND RESULTS OF OPERATIONS
General Factors Affecting Our Results of Operations
We are a global provider of innovative power tools and OPE. Our results of operations are affectedby the following general factors:
• Economic conditions and consumer spending in our key markets, especially North America andEurope;
• Trends and developments in the power tools and OPE industry, such as growing consumerpreference for lithium-ion battery powered products, deeper penetration of online saleschannels;
• Fluctuations in the major currencies in which our revenue and costs are denominated, namelyUS dollar, Euro and RMB; and
• Changes in raw material prices, particularly with respect to (i) battery cells, (ii) metals such ascopper and aluminum, (iii) electronic components such as printed circuit boards and (iv) plasticparticle materials such as Nylon plastic (PA) and Polypropylene (PP).
Changes in any of these general industry conditions and our ability to adapt to such changes couldaffect our business and result of operations.
Specific Factors Affecting Our Results of Operations
Besides the general factors affecting the global power tools and OPE markets, our business andresults of operations are also affected by company-specific factors, including the following major factors:
Competitiveness of our product portfolio and brand recognition
Our ability to continuously introduce new power tools and OPE products will be an importantcontributor to our future growth. During the Track Record Period, we introduced 751 new products, andlithium-ion battery powered products accounted for 65.2% of the total new products. We will continue todevelop and upgrade our comprehensive product portfolio that combines advanced technologies with
FINANCIAL INFORMATION
– 320 –
user-friendly designs. We will continue to focus on lithium-ion battery powered and smart power tools andOPE, which we believe represent the future of our industry. We expect our revenue growth to be drivenin part by the continued enhancement of our product offerings.
Our growth in revenue and profitability will also depend in part on our ability to maintain andpromote brand recognition by end users. We achieved rapid growth in large part through our fivewell-recognized, differentiated brands that cover both industrial/professional and consumer segments forpower tools and premium and mass market segments for OPE, as well as most categories of power toolsand OPE products. Supported by our end-user insights, advanced technologies and global sales anddistribution network, our proprietary brands have gained strong recognition in their respective markets,and we expect that our brand strategy will continue to drive our growth.
Investment in technology and talents
We develop most of our key technologies in-house to achieve a rapid pace of innovation. Suchtechnologies encompass (i) fundamental technologies including battery platforms, motors and electriccontrols, (ii) IoT and intelligent systems and (iii) product-specific technologies such as vibration and dustreduction. Accordingly, we dedicate significant resources towards research and development, and ourproduct development and design staff accounted for 11.2% of our total employees as of June 30, 2021. Wewill continue to recruit and retain top talents to grow our strengths in key technologies. In addition, wewill continue to invest in technologies such as advanced BMS, high-power vector electric control,intelligent parameter identification, and robotic and AI technologies. We expect our strategic focus onproduct innovation, technology and talents will further differentiate our power tools and OPE products,which will in turn enhance our competitiveness.
Effectiveness of sales and distribution network
During the Track Record Period, our products were sold to customers in more than 100 countries andregions, primarily in North America, Europe and Asia Pacific, including China. Our products areprominently featured and well recognized across sales channels that are familiar to our industrial,professional and consumer end users in our key markets. We have built a multi-channel sales anddistribution network that involves close collaboration with a diverse group of business partners around theworld, including national retailers, local retailers, distributors and e-commerce platforms. We willcontinue to expand and optimize our sales and distribution network by implementing tailored strategies foreach market. For example, in North America and Europe, we will (i) maintain and strengthen ourrelationships with national retailers, such as large home centers and mass market retailers, as well asestablished distributors with significant experience in local markets and (ii) increase our penetration ofonline channels through partnerships with large online platforms such as Amazon.com. We believe ourefforts to expand our sales and distribution network will continue to drive our future business growth.
Improvement of production system
We will continue to expand our production capacities to capitalize on the growing demands of our
products as well as to strengthen our position in the power tools and OPE industry. In particular, we plan
to establish two new production facilities in China, while implementing technological upgrades at our
existing facilities. We will also strive to improve the efficiency and flexibility of our production system
by further automating and digitalizing our production system, which we believe will improve our cost
structure. We will optimize our module-based production process and enhance the versatility of our
production lines. As we expand and optimize our production system, we expect our production cost as a
percentage of our revenue to decrease.
FINANCIAL INFORMATION
– 321 –

IMPACT OF COVID-19 ON OUR OPERATIONS
The outbreak of COVID-19, which was declared a “pandemic” by the World Health Organization in
March 2020, and its continued spread worldwide has introduced uncertainty and volatility in global
markets. The outbreak has resulted in restrictions on travel, public transport and prolonged closures of
workplaces which has had and may continue to have a material adverse effect on the global economy and
may cause interruptions to our business. Furthermore, the COVID-19 pandemic and the resultant
restrictions and closures may impact demand, supply and efficient functioning of markets.
While we have resumed normal business operations, we have experienced certain disruptions in our
operations as a result of the government-imposed suspensions due to the COVID-19 outbreak. In the first
quarter of 2020, a substantial number of our production facilities and offices were closed for certain days.
Specifically, our production facilities in Nanjing were closed for 13 days, and our production facility in
Germany was closed for 12 days. As a result, our production volume has decreased in the first quarter of
2020. Furthermore, the COVID-19 pandemic has affected and may affect future delivery of components
from certain suppliers that suspended production. For example, some of our suppliers were unable to
deliver sufficient components to us due to the COVID-19 outbreak in the beginning of 2020. By April
2020, these suppliers had resumed their normal delivery of components. The cost and time for
transportation of our products in certain regions of the world also increased as a result of the impact of
the COVID-19 pandemic. Furthermore, our overseas offices in North America and Europe were also
temporarily closed for certain periods from February to April 2020.
In July 2021, a number of positive COVID-19 cases appeared in certain areas of Nanjing, PRC,
where a majority of our production facilities and offices are located, and Yangzhou, PRC, where a number
of our suppliers are located. In July and August of 2021, our production facilities and offices in Nanjing
remained open and we have imposed social distancing, mask-wearing and mandatory virus testing
requirements for our employees. However, for certain weeks in July and August 2021, some of our
employees were subject to temporary stay at home orders and travel restrictions, and one of our main
warehouses suspended operations for 16 days. Some of our suppliers also suspended operations or reduced
production levels during such period. As a result, the outbreak caused delays to our supply chain,
production schedule and product delivery. In addition, due to the impact of the pandemic, our
manufacturing facility in Vietnam suspended operations for 8 days in July and August 2021, and gradually
resumed production since August 2021. In the six months ended June 30, 2021, the designed annual
production capacity of the Vietnam plant accounted for approximately 5% of our aggregate designed
annual production capacity. In the third quarter of 2021, we have converted three leased properties into
production facilities. Given the establishment of additional production facilities, our production capacity
has increased since August 2021. As a result of the impact of the COVID-19 cases in Nanjing and
Yangzhou, PRC and Vietnam, we expect our revenue growth for the third quarter of 2021 to slow down
compared to prior periods. Our revenue increased by US$41.0 million, or 13.3%, from US$307.2 million
for the three months ended September 30, 2020 to US$348.2 million for the same period in 2021. In
comparison, our revenue increased by 68.9% from US$514.4 million for the six months ended June 30,
2020 to US$868.8 million for the six months ended June 30, 2021.
We believe that the COVID-19 pandemic has not had a material adverse impact on our results of
operations. Our revenue increased by 42.4% from US$843.6 million in 2019 to US$1,200.9 million in
2020, and by 68.9% from US$514.4 million in the six months ended June 30, 2020 to US$868.8 million
in the same period in 2021. In the years ended December 31, 2018, 2019 and 2020 and the six months
ended June 30, 2021, the utilization rates of our production facilities remained relatively stable at 96%,
FINANCIAL INFORMATION
– 322 –

90%, 91% and 92%, respectively. Furthermore, we generally did not incur penalties or charges for delays
of product delivery caused by the COVID-19 pandemic, and our customer relationships have remained
stable during the Track Record Period and up to the Latest Practicable Date.
At this point, we cannot accurately predict what effects the COVID-19 pandemic would have on our
business, which will depend on, among other factors, the ultimate geographic spread of the virus, the
duration of the pandemic and the corresponding travel restrictions and business closures imposed by
government authorities. For further details, please refer to to the section headed “Risk Factors – Risks
Related to Our Industry and Business – Our business may be affected by the occurrence of contagious
diseases, such as COVID-19” in this prospectus.
BASIS OF PRESENTATION
Our Company was incorporated in Hong Kong on February 19, 1999 as a limited liability company
with its registered office at Unit 04, 22/F, Saxon Tower, 7 Cheung Shun Street, Lai Chi Kok, Kln, Hong
Kong.
Our Company is an investment holding company. Our Company and its subsidiaries are principally
engaged in researching, developing, manufacturing, testing, sales, and after-sale services for power tools
and OPE products. The information of the principal subsidiaries is set out in Note 16 to the Accountants’
Report in Appendix I to this prospectus.
The Historical Financial Information has been prepared in accordance with all applicable Hong Kong
Financial Reporting Standards (“HKFRSs”) which collective term includes all applicable individual Hong
Kong Financial Reporting Standards, Hong Kong Accounting Standards and Interpretations issued by the
HKICPA. Further details of the significant accounting policies adopted are set out in Note 2 to the
Accountants’ Report in Appendix I in this prospectus.
The HKICPA has issued a number of new and revised HKFRSs. For the purpose of preparing this
Historical Financial Information, our Group has adopted all applicable new and revised HKFRSs to the
Track Record Period. The accounting policies set out in Note 2 to the Accountants’ Report in Appendix
I to this prospectus have been applied consistently throughout the Track Record Period and our Group has
not adopted any new standards or interpretations that are effective for the accounting year beginning on
or after January 1, 2021. The revised and new accounting standards and interpretations issued which
effective for the accounting years beginning on or after January 1, 2021 and not yet adopted by our Group
are set out in Note 42 to the Accountants’ Report in Appendix I to this prospectus.
The Historical Financial Information also complies with the applicable disclosure provisions of the
Rules Governing the Listing of Securities on The Stock Exchange of Hong Kong Limited (the “StockExchange”).
The accounting policies set out below have been applied consistently to all periods presented in the
Historical Financial Information.
FINANCIAL INFORMATION
– 323 –

CRITICAL ACCOUNTING POLICIES AND ESTIMATES
A summary of our significant accounting policies is set forth in Note 2 to the Accountants’ Report
in Appendix I to this prospectus. Critical accounting policies are those that require our management to
exercise judgment in applying assumptions and making estimates that would yield materially different
results if our management applied different assumptions or made different estimates. Estimates and
judgments are continually re-evaluated and are based on historical experience and other factors, including
industry practices and expectations of future events that are believed to be reasonable under the
circumstances. We have not changed our assumptions or estimates in the past and have not noticed any
material errors regarding our assumptions or estimates. Under current circumstances, we do not expect that
our assumptions or estimates are likely to change significantly in the future. We believe the following
critical accounting policies involve the most significant judgments in the preparation of our consolidated
financial statements.
Revenue Recognition
Revenue is recognized when control over a product or service is transferred to the customer, or the
lessee has the right to use the asset, at the amount of promised consideration to which our Group is
expected to be entitled, excluding those amounts collected on behalf of third parties. Revenue excludes
value added tax or other sales taxes and is after deduction of any trade discounts.
Inventories
Inventories are assets which are held for sale in the ordinary course of business, in the process ofproduction for such sale or in the form of materials or supplies to be consumed in the production processor in the rendering of services.
Inventories are carried at the lower of cost and net realizable value.
Cost is calculated using the weighted average cost formula and comprises all costs of purchase, costsof conversion and other costs incurred in bringing the inventories to their present location and condition.In the case of work in progress, costs include direct labor and appropriate share of overheads based onnormal operating capacity.
Net realizable value is the estimated selling price in the ordinary course of business less theestimated costs of completion and the estimated costs necessary to make the sale.
When inventories are sold, the carrying amount of those inventories is recognized as an expense inthe period in which the related revenue is recognized.
The amount of any write-down of inventories to net realizable value and all losses of inventories arerecognized as an expense in the period the write-down or loss occurs. The amount of any reversal of anywrite-down of inventories is recognized as a reduction in the amount of inventories recognized as anexpense in the period in which the reversal occurs.
FINANCIAL INFORMATION
– 324 –

Property, Plant and Equipment
Property, plant and equipment are stated at cost (which is, in the case of assets acquired in a business
combination, the acquisition date fair value). Items of property, plant and equipment are stated at cost less
accumulated depreciation and impairment losses.
The cost of self-constructed items of property, plant and equipment includes the cost of materials,
direct labor, the initial estimate, where relevant, of the costs of dismantling and removing the items and
restoring the site on which they are located, and an appropriate proportion of overheads and borrowing
costs.
Gains or losses arising from the retirement or disposal of an item of property, plant and equipment
are determined as the difference between the estimated net disposal proceeds and the carrying amount of
the item and are recognized in profit or loss on the date of retirement or disposal.
Depreciation is calculated to write off the cost of property, plant and equipment, less their estimated
residual value, if any, using the straight line method over their estimated useful lives as follows:
Estimated Useful Life
Leasehold land over the period of leasesPlant and buildings 20 years or remaining lease termsMachinery and equipment 5 – 10 yearsFurniture, fixtures and office equipment 3 – 5 yearsMotor vehicles 5 – 10 years
Share-based Payments
The fair value of share-based payment awards granted to employees is recognized as an employee
cost with a corresponding increase in a reserve within equity. The fair value is measured at grant date by
reference to the market price or the valuer’s valuation of the underlying shares. Where the employees have
to meet vesting conditions before becoming unconditionally entitled to the shares, the total estimated fair
value of the shares is spread over the vesting period, taking into account the probability that the shares
will vest.
During the vesting period, the number of shares that is expected to vest is reviewed. Any resulting
adjustment to the cumulative fair value recognized in prior years is charged/credited to the profit or loss
for the year of the review, unless the original employee expenses qualify for recognition as an asset, with
a corresponding adjustment to the capital reserve. On vesting date, the amount recognized as an expense
is adjusted to reflect the actual number that vest (with a corresponding adjustment to the reserve).
FINANCIAL INFORMATION
– 325 –

Fair Value Measurement of Financial Instruments
Our financial instruments primarily include unlisted units in investment funds, insurance products,
structured deposits and wealth management products, foreign currency forward contracts, foreign currency
option contracts and trade receivables, among others. The level into which a fair value measurement is
classified is determined with reference to the observability and significance of the inputs used in the
valuation technique as set forth below:
• Level 1 valuations: Fair value measured using only Level 1 inputs, that is, unadjusted quoted
prices in active markets for identical assets or liabilities at the measurement date;
• Level 2 valuations: Fair value measured using Level 2 inputs, that is, observable inputs which
fail to meet Level 1, and not using significant unobservable inputs. Unobservable inputs are
inputs for which market data are not available; and
• Level 3 valuations: Fair value measured using significant unobservable inputs.
Please refer to Appendix I of the Accountants’ Report for further details regarding the valuation
methodology.
We are satisfied as to the basis for the valuation of Level 3 financial assets at fair value through profit
or loss for the following reasons: (i) we have applied appropriate methodology and financial models, such
as discounted cash flow, in preparing the valuation for the respective underlying assets; (ii) we have used
reliable sources of information, such as official bank reports or audited financial statements of investment
funds, as input into the valuation process; (iii) we have engaged qualified, independent professional third
parties to assist us in preparing the valuation; and (iv) we have exercised care, diligence and independent
judgment in overseeing the work performed by the professional third parties, including by setting
appropriate scope, providing all material information and inquiring about the methodologies, assumptions
and limitations used by the third parties.
As part of the procedures of our reporting accountants on our historical financial information as of
and for the years ended December 31, 2018, 2019 and 2020 and six months ended June 30, 2021, for the
purposes of expressing an opinion on such historical financial information taken as a whole, our reporting
accountants have performed certain procedures in respect of our estimation on the valuation of financial
assets at fair value. These procedures include, but are not limited to, assessing the relevant internal
controls, evaluating the reasonableness of valuation models used by us, and reviewing the adequacy of the
disclosures made in our historical financial information.
In respect of our financial assets measured within Level 3 fair value measurement, the Joint Sponsors
have, among others: (i) discussed with our management in relation to the nature of the financial assets and
the valuation methodology and financial models applied to determine the valuation; (ii) considered the
work and procedures undertaken by the Directors and the Reporting Accountants and obtained and
reviewed (a) the investment agreements of the Level 3 financial assets, (b) the audited financial statements
of the investment funds, (c) the balance statements of the insurance products, structured deposits and
wealth management products, (d) the agreements in respect of the trade receivables and (e) the valuation
schedule prepared by our management on which the Directors’ assessment of the Level 3 financial assets
was based; and (iii) reviewed relevant notes in the Accountants’ Report as contained in Appendix I to this
prospectus and considered the Reporting Accountants’ opinion on the historical financial information of
FINANCIAL INFORMATION
– 326 –

the Group as a whole for the Track Record Period. Based on the above due diligence and having considered
the opinions of the Directors and the Reporting Accountants, nothing has come to the Joint Sponsors’
attention for them to cast doubt on the valuation of the Group’s financial assets measured within level 3
fair value measurement as provided in the Accountants’ Report.
RESULTS OF OPERATIONS
The following table sets forth a summary, for the periods indicated, of our consolidated results of
operations. Each item has also been expressed as a percentage of our revenue. Our historical results
presented below are not necessarily indicative of the results that may be expected for any future period.
Consolidated Statements of Profit or Loss
Year Ended December 31, Six months ended June 30,
2018 2019 2020 2020 2021
US$ % US$ % US$ % US$ % US$ %(Unaudited)
(in thousands, except for percentages and per share data)
Revenue 690,698 100.0 843,578 100.0 1,200,902 100.0 514,359 100.0 868,797 100.0Cost of sales (515,173) (74.6) (588,325) (69.7) (832,190) (69.3) (366,701) (71.3) (617,688) (71.1)
Gross profit 175,525 25.4 255,253 30.3 368,712 30.7 147,658 28.7 251,109 28.9
Other revenue 3,515 0.5 3,838 0.4 5,801 0.5 2,791 0.5 2,081 0.2Other net (loss)/gain (8,192) (1.2) 943 0.1 (3,140) (0.3) (1,647) (0.3) 19,754 2.4Selling and distribution
expenses (100,527) (14.5) (128,083) (15.2) (179,447) (15.0) (73,411) (14.3) (96,418) (11.1)Administrative and other
operating expenses (45,378) (6.6) (48,932) (5.8) (82,843) (6.9) (25,280) (4.9) (32,614) (3.8)Research and development
costs (27,656) (4.0) (31,356) (3.7) (38,939) (3.2) (16,984) (3.3) (27,967) (3.2)
(Loss)/profit from operations (2,713) (0.4) 51,663 6.1 70,144 5.8 33,127 6.4 115,945 13.4
Net finance costs (17,164) (2.5) (19,754) (2.3) (17,357) (1.4) (8,070) (1.5) (7,895) (0.9)Share of profits of associates 4,287 0.6 9,206 1.1 6,724 0.6 155 0.0 2,801 0.3Share of profits of a joint
venture 1,176 0.2 1,233 0.1 – – – – – –
(Loss)/profit before tax (14,414) (2.1) 42,348 5.0 59,511 5.0 25,212 4.9 110,851 12.8
FINANCIAL INFORMATION
– 327 –
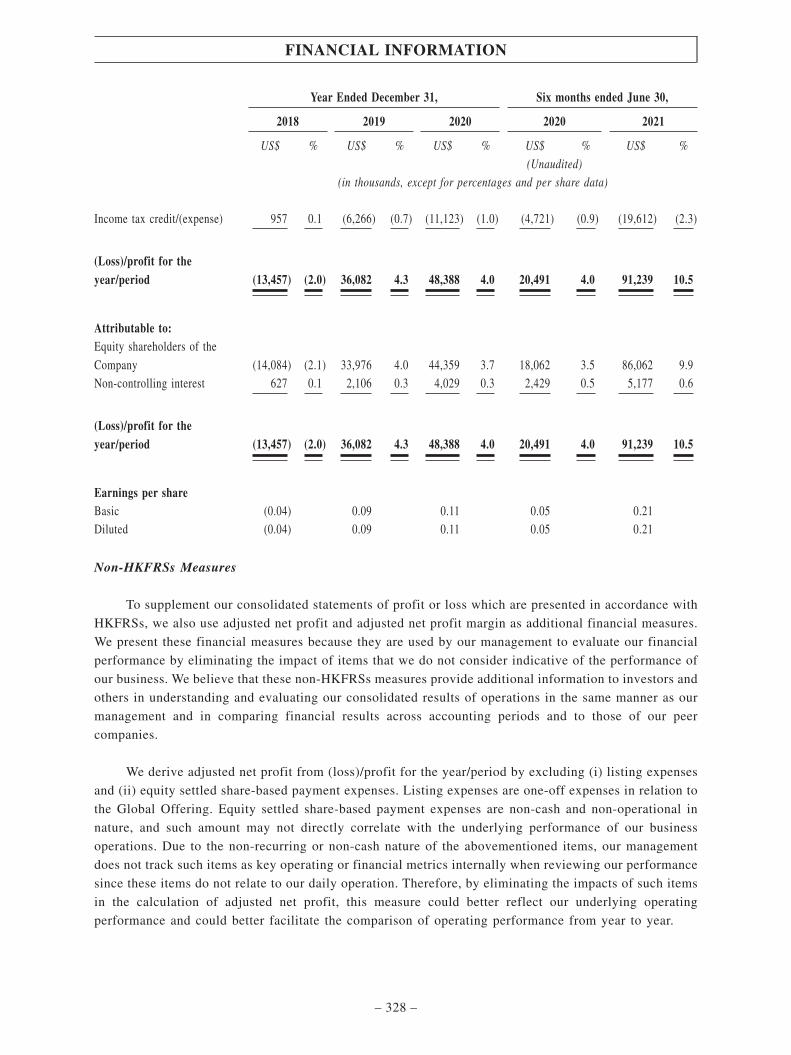
Year Ended December 31, Six months ended June 30,
2018 2019 2020 2020 2021
US$ % US$ % US$ % US$ % US$ %(Unaudited)
(in thousands, except for percentages and per share data)
Income tax credit/(expense) 957 0.1 (6,266) (0.7) (11,123) (1.0) (4,721) (0.9) (19,612) (2.3)
(Loss)/profit for theyear/period (13,457) (2.0) 36,082 4.3 48,388 4.0 20,491 4.0 91,239 10.5
Attributable to:Equity shareholders of the
Company (14,084) (2.1) 33,976 4.0 44,359 3.7 18,062 3.5 86,062 9.9Non-controlling interest 627 0.1 2,106 0.3 4,029 0.3 2,429 0.5 5,177 0.6
(Loss)/profit for theyear/period (13,457) (2.0) 36,082 4.3 48,388 4.0 20,491 4.0 91,239 10.5
Earnings per shareBasic (0.04) 0.09 0.11 0.05 0.21Diluted (0.04) 0.09 0.11 0.05 0.21
Non-HKFRSs Measures
To supplement our consolidated statements of profit or loss which are presented in accordance with
HKFRSs, we also use adjusted net profit and adjusted net profit margin as additional financial measures.
We present these financial measures because they are used by our management to evaluate our financial
performance by eliminating the impact of items that we do not consider indicative of the performance of
our business. We believe that these non-HKFRSs measures provide additional information to investors and
others in understanding and evaluating our consolidated results of operations in the same manner as our
management and in comparing financial results across accounting periods and to those of our peer
companies.
We derive adjusted net profit from (loss)/profit for the year/period by excluding (i) listing expenses
and (ii) equity settled share-based payment expenses. Listing expenses are one-off expenses in relation to
the Global Offering. Equity settled share-based payment expenses are non-cash and non-operational in
nature, and such amount may not directly correlate with the underlying performance of our business
operations. Due to the non-recurring or non-cash nature of the abovementioned items, our management
does not track such items as key operating or financial metrics internally when reviewing our performance
since these items do not relate to our daily operation. Therefore, by eliminating the impacts of such items
in the calculation of adjusted net profit, this measure could better reflect our underlying operating
performance and could better facilitate the comparison of operating performance from year to year.
FINANCIAL INFORMATION
– 328 –

However, the terms adjusted net profit and adjusted net profit margin are not defined under HKFRSs.
Items excluded from adjusted net profit are significant components in understanding and assessing our
operating and financial performance. In light of the foregoing limitations for this non-HKFRSs measure,
when assessing our operating and financial performance, you should not consider adjusted net profit or
adjusted net profit margin in isolation or as a substitute for (loss)/profit for the year/period or any other
operating performance measure that is calculated in accordance with HKFRSs. In addition, because these
non-HKFRSs measures may not be calculated in the same manner by all companies, they may not be
comparable to other similar titled measures used by other companies. The following table reconciles our
adjusted net (loss)/profit for the years presented to the most directly comparable financial measure
calculated and presented in accordance with HKFRSs, which is (loss)/profit for the year/period:
Year ended December 31,Six months ended
June 30,
2018 2019 2020 2020 2021
(Unaudited)
(In US$ thousands)
(Loss)/profit for the year/period (13,457) 36,082 48,388 20,491 91,239Add:Listing expenses – – 272 – 2,122Equity settled share–based
payment expenses – – 21,077 – –
Adjusted net (loss)/profit (13,457) 36,082 69,737 20,491 93,361
We incurred an adjusted net loss (non-HKFRSs measure) of US$13.5 million in 2018 primarily due
to (i) our increased investments in the OBM business, including marketing and research and development
spending in 2018 and (ii) integration costs associated with our acquisition of the SKIL business. With
respect to our investments in the OBM business, for example, we devoted substantial resources into
developing SKIL-branded lithium-ion battery powered products, which did not launch in Europe market
until the fourth quarter of 2018. Our gross profit margin for 2018 was also lower due to promotion of OBM
products, particularly EGO, through price reductions in order to quickly gain market share. With respect
to the SKIL integration costs, such costs primarily include: (a) replacing certain operational support,
logistics and IT systems, (b) investing in additional research and development efforts, (c) increasing
production capacity and (d) enhancing relevant marketing activities during the transition period. We were
able to achieve an adjusted net profit (non-HKFRSs measure) of US$36.1 million and US$69.7 million in
2019 and 2020, primarily due to (i) the growth of sales from products targeting industrial/professional and
premium end users, such as EGO OPE products and FLEX power tools, which usually had higher gross
profit margins and (ii) improvement in our operational efficiency achieved by economies of scale.
FINANCIAL INFORMATION
– 329 –

The following table sets forth our adjusted net (loss)/profit margin for the periods indicated:
Year ended December 31,Six months ended
June 30,
2018 2019 2020 2020 2021
Adjusted net (loss)/profit margin (%)(1) (2.0) 4.3 5.8 4.0 10.7
Note:
(1) Equals adjusted net (loss)/profit divided by revenue for the year/period and multiplied by 100%.
PRINCIPAL COMPONENTS OF CONSOLIDATED STATEMENTS OF PROFIT OR LOSS
Revenue
We are principally engaged in the manufacturing and sales of power tools and OPE products. During
the Track Record Period, we generated revenue primarily from sale of goods. Revenue represents the fair
value of the consideration received or receivable for the sales of our products which is recorded net of
product returns, discounts and rebates and after eliminating intra-group sales during the Track Record
Period.
Our revenue increased from US$690.7 million in the year ended December 31, 2018 to US$1,200.9
million in the year ended December 31, 2020, representing a CAGR of 31.9%. Such robust growth was
primarily due to our ability to (i) continuously introduce new products with a strategic focus on
lithium-ion battery powered products, (ii) establish industry-leading premium brands such as EGO, (iii)
build strategic partnerships with leading national retailers, qualified distributors and large e-commerce
platforms, particularly in the North America market, and (iv) grow our ODM business. Our revenue
increased by 68.9% from US$514.4 million for the six months ended June 30, 2020 to US$868.8 million
for the same period in 2021. The significant growth in our total revenue during this period was also related
to improvements in our product portfolio, brand recognition and sales and distribution network. For details
of our products, please see the section headed “Business – Our Products” in this prospectus. Our sales
volumes and average selling prices have both increased during the Track Record Period. For the years
ended December 31, 2018, 2019 and 2020 and the six months ended June 30, 2020 and 2021, our sales
volumes were 12.6 million, 12.7 million, 13.7 million, 5.8 million and 9.3 million, respectively. For the
same years/periods, our average selling prices were US$54.87, US$66.13, US$87.62, US$88.39 and
US$93.71, respectively.
FINANCIAL INFORMATION
– 330 –

Revenue by Product Category and Sub-category
The following table sets forth our revenue breakdown by product category and sub-category in an
absolute amount and as a percentage of our total revenue for the years and periods indicated.
Year ended December 31, Six months ended June 30,
2018 2019 2020 2020 2021
US$ % US$ % US$ % US$ % US$ %(Unaudited)
(in thousands, except for percentages)
Power Tools 483,370 70.0 549,680 65.2 661,081 55.1 278,887 54.2 451,066 51.9Cutting tools 163,057 23.6 156,702 18.6 241,094 20.1 104,291 20.3 161,723 18.6Fixing tools 145,744 21.1 194,271 23.0 157,754 13.2 61,350 11.9 118,773 13.7Surface treatment
tools 60,677 8.8 70,355 8.3 114,585 9.5 50,736 9.9 78,174 9.0Other power tools 113,892 16.5 128,352 15.3 147,648 12.3 62,510 12.1 92,396 10.6
Outdoor PowerEquipment 201,410 29.1 287,971 34.1 533,691 44.4 231,451 45.0 414,041 47.7Ride-on outdoor
equipment – – – – – – – – 2,361 0.3Walk-behind
wheeled outdoor
Equipment 70,408 10.1 96,932 11.5 187,244 15.5 95,780 18.6 166,571 19.2Handheld outdoor
tools 115,285 16.7 162,914 19.3 298,673 24.9 116,861 22.7 187,072 21.5Other OPE 15,717 2.3 28,125 3.3 47,774 4.0 18,810 3.7 58,037 6.7
Others(1) 5,918 0.9 5,927 0.7 6,130 0.5 4,021 0.8 3,690 0.4
Total 690,698 100.0 843,578 100.0 1,200,902 100.0 514,359 100.0 868,797 100.0
Note:
(1) Others revenue primarily includes our sales of parts and components relating to a home appliance business.
FINANCIAL INFORMATION
– 331 –

Revenue by Product Category and End-user Segment
We offer a comprehensive range of power tools and OPE products. The following table shows the
revenue of our product category and end-user segment by absolute amount and as a percentage of our total
revenue for the years and periods indicated:
Year ended December 31, Six months ended June 30,
2018 2019 2020 2020 2021
US$ % US$ % US$ % US$ % US$ %(Unaudited)
(in thousands, except for percentages)
Power Tools(1) 483,370 70.0 549,680 65.2 661,081 55.1 278,887 54.2 451,066 51.9Industrial/
professional 210,863 30.5 240,939 28.6 235,644 19.6 120,481 23.4 211,678 24.3Consumer 272,507 39.5 308,741 36.6 425,437 35.5 158,406 30.8 239,388 27.6
OPE(1) 201,410 29.1 287,971 34.1 533,691 44.4 231,451 45.0 414,041 47.7Premium 175,700 25.4 216,361 25.6 459,133 38.2 209,260 40.7 341,572 39.3Mass-market 25,710 3.7 71,610 8.5 74,558 6.2 22,191 4.3 72,469 8.4
Others(2) 5,918 0.9 5,927 0.7 6,130 0.5 4,021 0.8 3,690 0.4
Total revenue 690,698 100.0 843,578 100.0 1,200,902 100.0 514,359 100.0 868,797 100.0
Notes:
(1) Power Tools and OPE revenue includes tools, batteries and accessories in the respective category.
(2) Others revenue primarily includes our sales of parts and components to a company engaging in a home appliancebusiness.
Revenue from the sales of power tools increased by 13.7% from US$483.4 million in 2018 to
US$549.7 million in 2019 and further increased by 20.3% to US$661.1 million in 2020. Revenue from the
sales of power tools increased by 61.7% from US$278.9 million in the six months ended June 30, 2020
to US$451.1 million in the six months ended June 30, 2021. The growth was primarily driven by (i)
introduction of new power tools with a focus on lithium-ion battery platforms under our proprietary
brands, such as the launch of a new series of professional power tools on lithium-ion battery platforms in
the first quarter of 2021, and (ii) expansion of our ODM power tool business.
Revenue from the sales of OPE products increased by 43.0% from US$201.4 million in 2018 to
US$288.0 million in 2019 and further increased by 85.3% to US$533.7 million in 2020. Revenue from the
sales of OPE increased by 78.8% from US$231.5 million in the six months ended June 30, 2020 to
US$414.0 million in the six months ended June 30, 2021. The growth was primarily driven by (i) our
successful expansion of EGO product lines and sales channels, which enabled us to seize market
opportunities with respect to lithium-ion battery powered OPE, (ii) expansion of OPE business with key
ODM customers and (iii) our launch of OPE products under the SKIL brand.
FINANCIAL INFORMATION
– 332 –
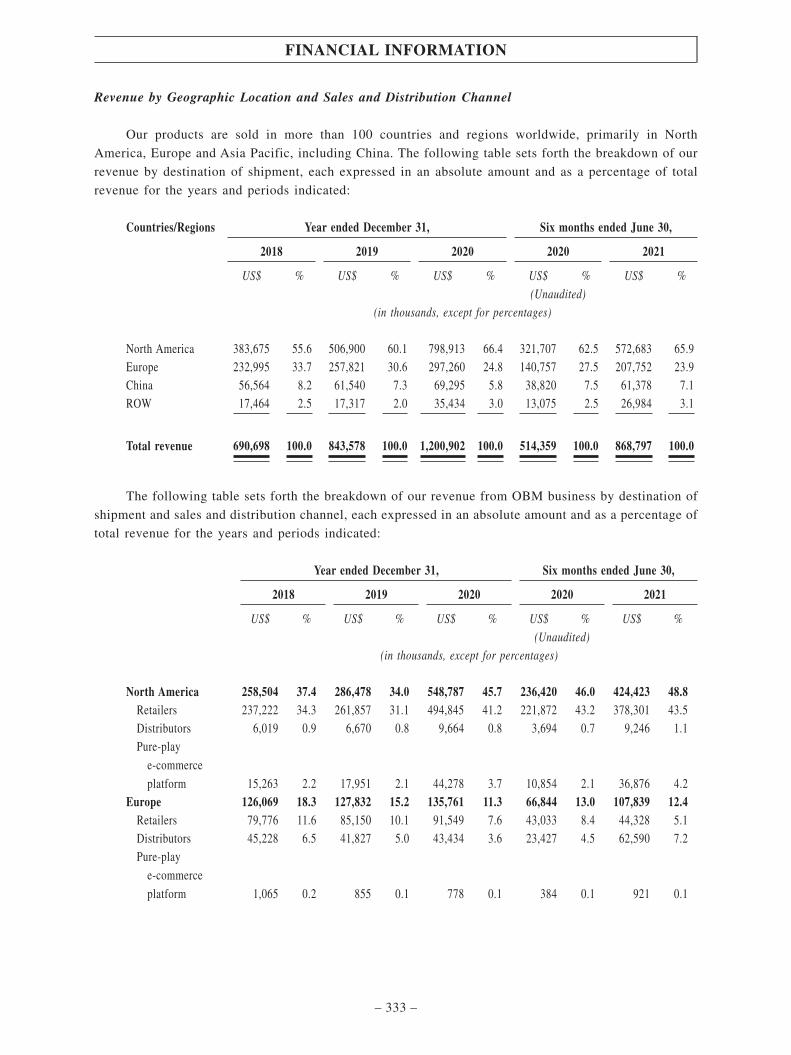
Revenue by Geographic Location and Sales and Distribution Channel
Our products are sold in more than 100 countries and regions worldwide, primarily in North
America, Europe and Asia Pacific, including China. The following table sets forth the breakdown of our
revenue by destination of shipment, each expressed in an absolute amount and as a percentage of total
revenue for the years and periods indicated:
Countries/Regions Year ended December 31, Six months ended June 30,
2018 2019 2020 2020 2021
US$ % US$ % US$ % US$ % US$ %(Unaudited)
(in thousands, except for percentages)
North America 383,675 55.6 506,900 60.1 798,913 66.4 321,707 62.5 572,683 65.9Europe 232,995 33.7 257,821 30.6 297,260 24.8 140,757 27.5 207,752 23.9China 56,564 8.2 61,540 7.3 69,295 5.8 38,820 7.5 61,378 7.1ROW 17,464 2.5 17,317 2.0 35,434 3.0 13,075 2.5 26,984 3.1
Total revenue 690,698 100.0 843,578 100.0 1,200,902 100.0 514,359 100.0 868,797 100.0
The following table sets forth the breakdown of our revenue from OBM business by destination of
shipment and sales and distribution channel, each expressed in an absolute amount and as a percentage of
total revenue for the years and periods indicated:
Year ended December 31, Six months ended June 30,
2018 2019 2020 2020 2021
US$ % US$ % US$ % US$ % US$ %(Unaudited)
(in thousands, except for percentages)
North America 258,504 37.4 286,478 34.0 548,787 45.7 236,420 46.0 424,423 48.8Retailers 237,222 34.3 261,857 31.1 494,845 41.2 221,872 43.2 378,301 43.5Distributors 6,019 0.9 6,670 0.8 9,664 0.8 3,694 0.7 9,246 1.1Pure-play
e-commerce
platform 15,263 2.2 17,951 2.1 44,278 3.7 10,854 2.1 36,876 4.2Europe 126,069 18.3 127,832 15.2 135,761 11.3 66,844 13.0 107,839 12.4
Retailers 79,776 11.6 85,150 10.1 91,549 7.6 43,033 8.4 44,328 5.1Distributors 45,228 6.5 41,827 5.0 43,434 3.6 23,427 4.5 62,590 7.2Pure-play
e-commerce
platform 1,065 0.2 855 0.1 778 0.1 384 0.1 921 0.1
FINANCIAL INFORMATION
– 333 –

Year ended December 31, Six months ended June 30,
2018 2019 2020 2020 2021
US$ % US$ % US$ % US$ % US$ %(Unaudited)
(in thousands, except for percentages)
China(1) 39,391 5.7 43,209 5.1 51,847 4.3 30,017 5.8 50,987 5.9ROW(2) 7,874 1.1 7,625 0.9 9,918 0.8 2,978 0.6 7,897 0.9
Total revenue fromOBM business 431,838 62.5 465,144 55.2 746,313 62.1 336,259 65.4 591,146 68.0
Notes:
(1) In China, we primarily sell our products to distributors. We also offer our products through pure-play e-commerce channels.
(2) In other markets to which we distribute our products, such as Australia and New Zealand, we primarily sell our products toretailers. Our practices may vary in different markets subject to the local conditions.
North America
North America had the largest revenue contribution during the Track Record Period. Our revenue
generated from North America grew from US$383.7 million in the year ended December 31, 2018 to
US$798.9 million in the year ended December 31, 2020, representing a CAGR of 44.3%. Revenue
generated from North America increased by 78.0% from US$321.7 million in the six months ended June
30, 2020 to US$572.7 million in the six months ended June 30, 2021. Our revenue growth in North
America was primarily due to (i) expansion of our product portfolio associated with premium brand
names, such as our EGO, SKIL and FLEX products, (ii) establishment and continued growth of our
collaboration with certain major customers, (iii) expansion of network of distributors and local retailers
and (iv) growth of our ODM business.
Europe
Our revenue from Europe grew form US$233.0 million in the year ended December 31, 2018 to
US$297.3 million in the year ended December 31, 2020, representing a CAGR of 13.0%. Revenue
generated from Europe increased by 47.6% from US$140.8 million in the six months ended June 30, 2020
to US$207.8 million in the six months ended June 30, 2021. Our revenue growth in Europe was primarily
due to (i) increased revenue from sales of our FLEX power tools and EGO OPE products and (ii) continued
strengths in our ODM business for European customers.
FINANCIAL INFORMATION
– 334 –
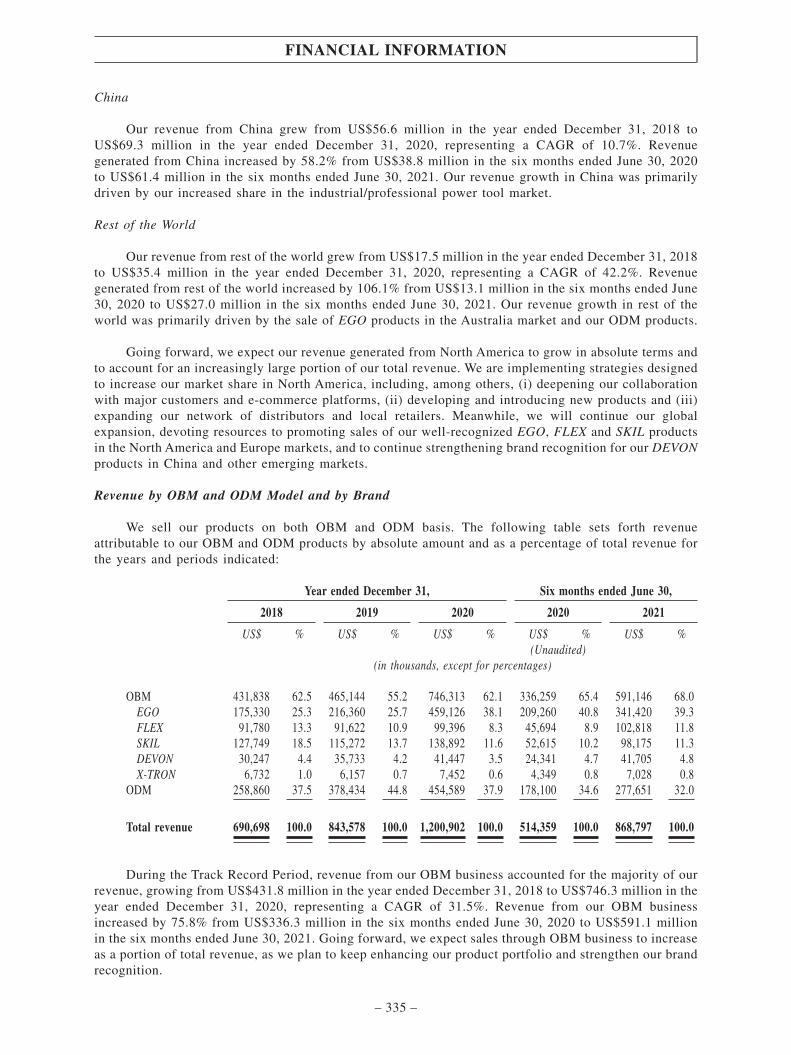
China
Our revenue from China grew from US$56.6 million in the year ended December 31, 2018 toUS$69.3 million in the year ended December 31, 2020, representing a CAGR of 10.7%. Revenuegenerated from China increased by 58.2% from US$38.8 million in the six months ended June 30, 2020to US$61.4 million in the six months ended June 30, 2021. Our revenue growth in China was primarilydriven by our increased share in the industrial/professional power tool market.
Rest of the World
Our revenue from rest of the world grew from US$17.5 million in the year ended December 31, 2018to US$35.4 million in the year ended December 31, 2020, representing a CAGR of 42.2%. Revenuegenerated from rest of the world increased by 106.1% from US$13.1 million in the six months ended June30, 2020 to US$27.0 million in the six months ended June 30, 2021. Our revenue growth in rest of theworld was primarily driven by the sale of EGO products in the Australia market and our ODM products.
Going forward, we expect our revenue generated from North America to grow in absolute terms andto account for an increasingly large portion of our total revenue. We are implementing strategies designedto increase our market share in North America, including, among others, (i) deepening our collaborationwith major customers and e-commerce platforms, (ii) developing and introducing new products and (iii)expanding our network of distributors and local retailers. Meanwhile, we will continue our globalexpansion, devoting resources to promoting sales of our well-recognized EGO, FLEX and SKIL productsin the North America and Europe markets, and to continue strengthening brand recognition for our DEVONproducts in China and other emerging markets.
Revenue by OBM and ODM Model and by Brand
We sell our products on both OBM and ODM basis. The following table sets forth revenueattributable to our OBM and ODM products by absolute amount and as a percentage of total revenue forthe years and periods indicated:
Year ended December 31, Six months ended June 30,
2018 2019 2020 2020 2021
US$ % US$ % US$ % US$ % US$ %(Unaudited)
(in thousands, except for percentages)
OBM 431,838 62.5 465,144 55.2 746,313 62.1 336,259 65.4 591,146 68.0EGO 175,330 25.3 216,360 25.7 459,126 38.1 209,260 40.8 341,420 39.3FLEX 91,780 13.3 91,622 10.9 99,396 8.3 45,694 8.9 102,818 11.8SKIL 127,749 18.5 115,272 13.7 138,892 11.6 52,615 10.2 98,175 11.3DEVON 30,247 4.4 35,733 4.2 41,447 3.5 24,341 4.7 41,705 4.8X-TRON 6,732 1.0 6,157 0.7 7,452 0.6 4,349 0.8 7,028 0.8
ODM 258,860 37.5 378,434 44.8 454,589 37.9 178,100 34.6 277,651 32.0
Total revenue 690,698 100.0 843,578 100.0 1,200,902 100.0 514,359 100.0 868,797 100.0
During the Track Record Period, revenue from our OBM business accounted for the majority of ourrevenue, growing from US$431.8 million in the year ended December 31, 2018 to US$746.3 million in theyear ended December 31, 2020, representing a CAGR of 31.5%. Revenue from our OBM businessincreased by 75.8% from US$336.3 million in the six months ended June 30, 2020 to US$591.1 millionin the six months ended June 30, 2021. Going forward, we expect sales through OBM business to increaseas a portion of total revenue, as we plan to keep enhancing our product portfolio and strengthen our brandrecognition.
FINANCIAL INFORMATION
– 335 –

Revenue by Power Source
The following table sets forth our revenue breakdown by power sources in an absolute amount andas a percentage of our total revenue for the years and periods indicated.
Year ended December 31, Six months ended June 30,
2018 2019 2020 2020 2021
US$ % US$ % US$ % US$ % US$ %
(Unaudited)(in thousands, except for percentages)
Power Tools(1) 483,370 70.0 549,680 65.2 661,081 55.1 278,887 54.2 451,066 51.9AC 336,307 48.7 302,095 35.8 370,093 30.8 165,227 32.1 231,084 26.6DC 147,063 21.3 247,585 29.4 290,988 24.3 113,660 22.1 219,982 25.3
OPE(1) 201,410 29.1 287,971 34.1 533,691 44.4 231,451 45.0 414,041 47.7AC 1,112 0.1 – – – – – – – –DC 200,298 29.0 287,971 34.1 533,691 44.4 231,451 45.0 414,041 47.7
Others(2) 5,918 0.9 5,927 0.7 6,130 0.5 4,021 0.8 3,690 0.4
Total 690,698 100.0 843,578 100.0 1,200,902 100.0 514,359 100.0 868,797 100.0
Note:
(1) Power Tools and OPE revenue includes tools, batteries and accessories in the respective category.
(2) Others revenue primarily includes our sales of parts and components to a company engaging in a home appliancebusiness.
Sales Volume by Product Category and End-user Segment
Set forth below is a breakdown of our sales volume by product category and end-user segment for
the years and periods indicated.
Year ended December 31,Six months ended
June 30,
2018 2019 2020 2020 2021
(Units in thousands)
Power tools 9,954.5 9,992.7 10,267.8 4,450.0 6,975.3Industrial/professional 3,055.9 2,999.1 2,833.2 1,534.0 2,259.1Consumer 6,898.6 6,993.6 7,434.6 2,916.0 4,716.2
OPE 2,627.1 2,751.4 3,430.3 1,368.7 2,295.5Premium 858.6 981.6 2,079.3 949.0 1,416.6Mass-market 1,768.5 1,769.8 1,351.0 419.7 878.9
Total sales volume 12,581.6 12,744.1 13,698.1 5,818.7 9,270.8
FINANCIAL INFORMATION
– 336 –
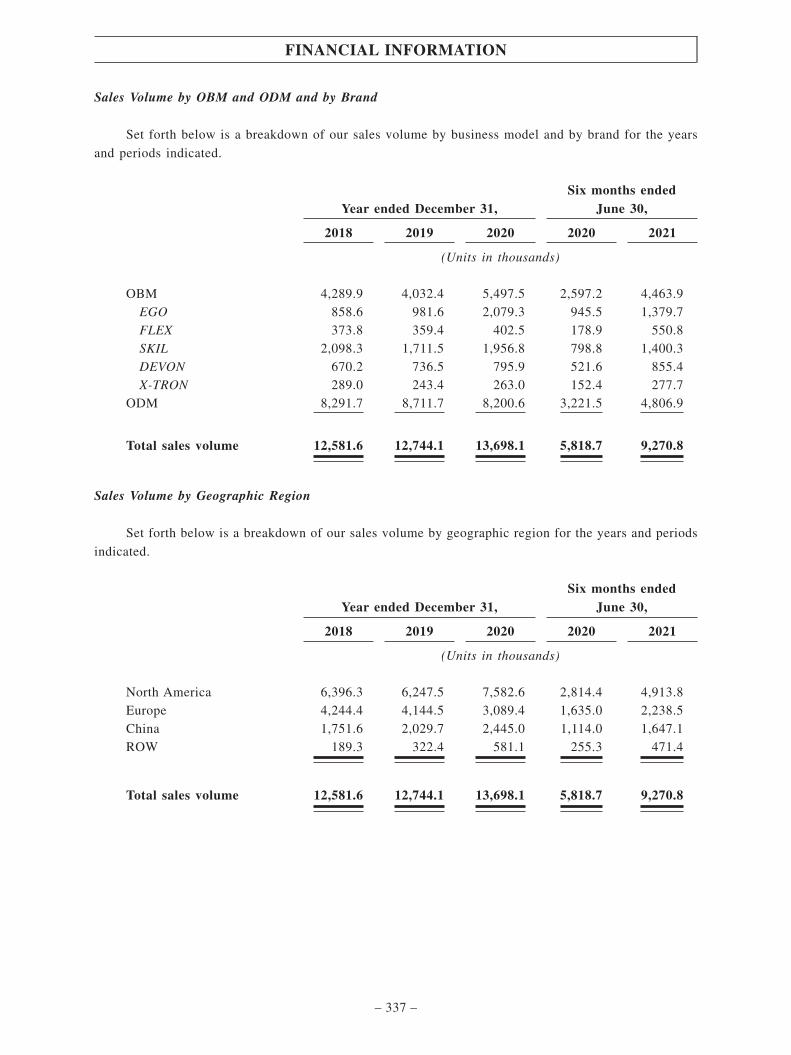
Sales Volume by OBM and ODM and by Brand
Set forth below is a breakdown of our sales volume by business model and by brand for the years
and periods indicated.
Year ended December 31,Six months ended
June 30,
2018 2019 2020 2020 2021
(Units in thousands)
OBM 4,289.9 4,032.4 5,497.5 2,597.2 4,463.9EGO 858.6 981.6 2,079.3 945.5 1,379.7FLEX 373.8 359.4 402.5 178.9 550.8SKIL 2,098.3 1,711.5 1,956.8 798.8 1,400.3DEVON 670.2 736.5 795.9 521.6 855.4X-TRON 289.0 243.4 263.0 152.4 277.7
ODM 8,291.7 8,711.7 8,200.6 3,221.5 4,806.9
Total sales volume 12,581.6 12,744.1 13,698.1 5,818.7 9,270.8
Sales Volume by Geographic Region
Set forth below is a breakdown of our sales volume by geographic region for the years and periods
indicated.
Year ended December 31,Six months ended
June 30,
2018 2019 2020 2020 2021
(Units in thousands)
North America 6,396.3 6,247.5 7,582.6 2,814.4 4,913.8Europe 4,244.4 4,144.5 3,089.4 1,635.0 2,238.5China 1,751.6 2,029.7 2,445.0 1,114.0 1,647.1ROW 189.3 322.4 581.1 255.3 471.4
Total sales volume 12,581.6 12,744.1 13,698.1 5,818.7 9,270.8
FINANCIAL INFORMATION
– 337 –

Average Selling Price by Product Category and End-User Segment
Set forth below is a breakdown of our average selling prices by product category and end-user
segment for the years and periods indicated.
Year ended December 31,Six months ended
June 30,
2018 2019 2020 2020 2021
(in US$)
Power Tools 48.53 54.95 64.35 62.67 64.65Industrial/professional 68.96 80.25 83.12 78.54 93.70Consumer 39.48 44.10 57.19 54.32 50.74
OPE 76.63 104.55 155.49 169.09 180.41Premium 204.53 220.19 220.68 220.48 241.18Mass-market 14.53 40.42 55.15 52.88 82.46
Total 54.87 66.13 87.62 88.39 93.71
The average selling prices of our products increased from US$54.87 in 2018 to US$87.62 in 2020,
and from US$88.39 in the six months ended June 30, 2020 to US$93.71 in the same period in 2021, which
were primarily attributable to (i) the expansion of our OBM business, particularly the EGO products (for
the premium OPE segment) and FLEX products (for the industrial/professional power tool segment),
which typically have higher prices, as well as (ii) the increased proportion of sales from lithium-ion
battery powered products, which typically have higher selling prices, relative to our total revenue. For the
same reasons, average selling prices of both power tool and OPE segments increased during the Track
Record Period.
The average selling prices of industrial/professional power tools increased from US$68.96 in 2018
to US$83.12 in 2020, and from US$78.54 in the six months ended June 30, 2020 to US$93.70 in the same
period in 2021, primarily due to the increased proportion of sales from our FLEX products and from
lithium-ion battery powered products, which typically have higher prices.
The average selling prices of consumer power tools increased from US$39.48 in 2018 to US$57.19
in 2020, primarily due to the increased proportion of sales from lithium-ion battery powered products,
which typically have higher prices. The average selling prices of consumer power tools decreased from
US$54.32 in the six months ended June 30, 2020 to US$50.74 in the same period in 2021, primarily due
to our promotion of relevant products through price reductions in order to gain market shares.
The average selling prices of premium OPE increased from US$204.53 in 2018 to US$220.68 in
2020, and from US$220.48 in the six months ended June 30, 2020 to US$241.18 in the same period in
2021, primarily due to increases in the average selling prices of our EGO products.
The average selling prices of mass-market OPE increased from US$14.53 in 2018 to US$55.15 in
2020, and from US$52.88 in the six months ended June 30, 2020 to US$82.46 in the same period in 2021,
primarily due to our launch of OPE products under the SKIL brand.
FINANCIAL INFORMATION
– 338 –
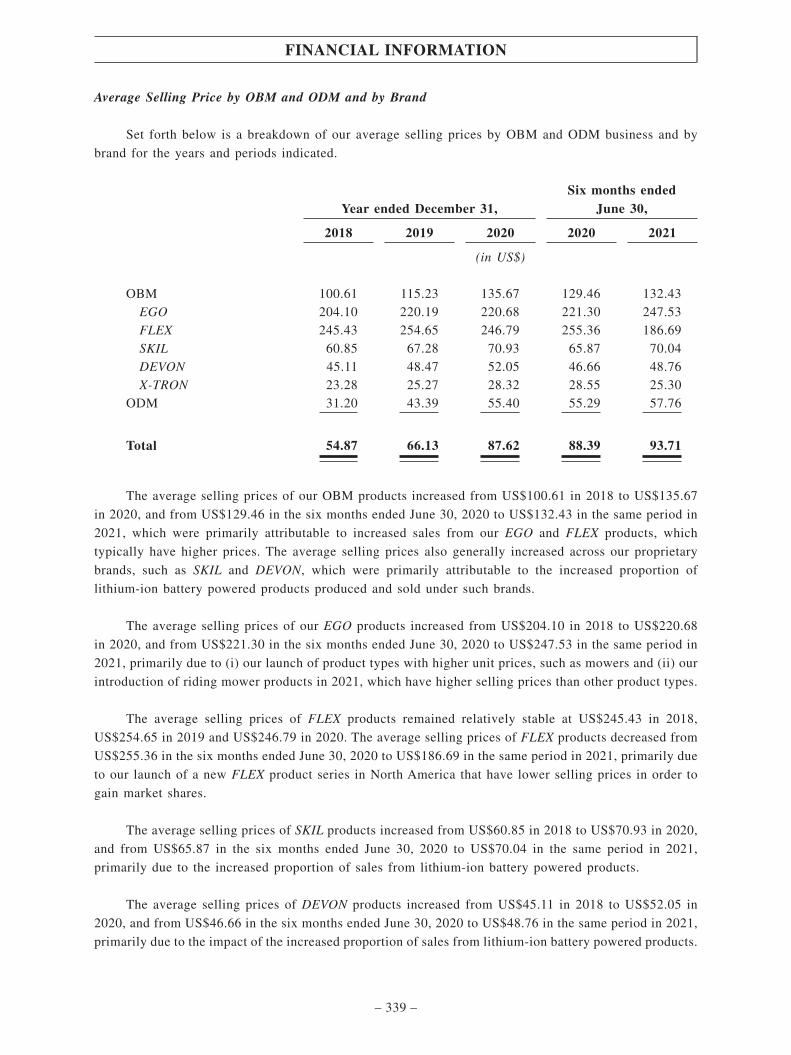
Average Selling Price by OBM and ODM and by Brand
Set forth below is a breakdown of our average selling prices by OBM and ODM business and by
brand for the years and periods indicated.
Year ended December 31,Six months ended
June 30,
2018 2019 2020 2020 2021
(in US$)
OBM 100.61 115.23 135.67 129.46 132.43EGO 204.10 220.19 220.68 221.30 247.53FLEX 245.43 254.65 246.79 255.36 186.69SKIL 60.85 67.28 70.93 65.87 70.04DEVON 45.11 48.47 52.05 46.66 48.76X-TRON 23.28 25.27 28.32 28.55 25.30
ODM 31.20 43.39 55.40 55.29 57.76
Total 54.87 66.13 87.62 88.39 93.71
The average selling prices of our OBM products increased from US$100.61 in 2018 to US$135.67
in 2020, and from US$129.46 in the six months ended June 30, 2020 to US$132.43 in the same period in
2021, which were primarily attributable to increased sales from our EGO and FLEX products, which
typically have higher prices. The average selling prices also generally increased across our proprietary
brands, such as SKIL and DEVON, which were primarily attributable to the increased proportion of
lithium-ion battery powered products produced and sold under such brands.
The average selling prices of our EGO products increased from US$204.10 in 2018 to US$220.68
in 2020, and from US$221.30 in the six months ended June 30, 2020 to US$247.53 in the same period in
2021, primarily due to (i) our launch of product types with higher unit prices, such as mowers and (ii) our
introduction of riding mower products in 2021, which have higher selling prices than other product types.
The average selling prices of FLEX products remained relatively stable at US$245.43 in 2018,
US$254.65 in 2019 and US$246.79 in 2020. The average selling prices of FLEX products decreased from
US$255.36 in the six months ended June 30, 2020 to US$186.69 in the same period in 2021, primarily due
to our launch of a new FLEX product series in North America that have lower selling prices in order to
gain market shares.
The average selling prices of SKIL products increased from US$60.85 in 2018 to US$70.93 in 2020,
and from US$65.87 in the six months ended June 30, 2020 to US$70.04 in the same period in 2021,
primarily due to the increased proportion of sales from lithium-ion battery powered products.
The average selling prices of DEVON products increased from US$45.11 in 2018 to US$52.05 in
2020, and from US$46.66 in the six months ended June 30, 2020 to US$48.76 in the same period in 2021,
primarily due to the impact of the increased proportion of sales from lithium-ion battery powered products.
FINANCIAL INFORMATION
– 339 –

The average selling prices of X-TRON products increased from US$23.28 in 2018 to US$28.32 in
2020, primarily due to the increased proportion of sales from lithium-ion battery powered products. The
average selling prices of X-TRON products decreased from US$28.55 in the six months ended June 30,
2020 to US$25.30 in the same period in 2021, primarily due to our promotion of X-TRON products through
price reductions in order to gain market shares.
Cost of Sales
Our cost of sales comprises of direct material costs, direct labor costs and overhead costs. During
the Track Record Period, cost of sales increased in line with increased revenue. Cost of sales amounted
to US$515.2 million, US$588.3 million, US$832.2 million, US$366.7 million and US$617.7 million in the
years ended December 31, 2018, 2019 and 2020 and the six months ended June 30, 2020 and 2021,
respectively, and represented 74.6%, 69.7%, 69.3%, 71.3% and 71.1% of our revenue for the same years
or periods, respectively. From the year ended December 31, 2018 to the year ended December 31, 2019,
our cost of sales declined as a percentage of revenue due to the rapid increase in sales and economies of
scale. Our cost of sales remained relatively stable as a percentage of revenue in 2020 and the six months
ended June 30, 2021.
The following table sets forth a breakdown of key components of cost of sales, expressed as an
absolute amount and as a percentage of our total revenue, for the years and periods indicated.
Year Ended December 31, Six months ended June 30,
2018 2019 2020 2020 2021
US$ % US$ % US$ % US$ % US$ %(Unaudited)
(in thousands, except for percentages)
Direct material costs 418,591 60.6 475,497 56.4 678,560 56.5 297,474 57.9 504,171 58.0Direct labor costs 25,300 3.7 30,610 3.6 42,486 3.5 16,164 3.1 33,480 3.9Overhead costs(1) 71,283 10.3 82,219 9.7 111,144 9.3 53,063 10.3 80,037 9.2
Total cost of sales(2) 515,173 74.6 588,325 69.7 832,190 69.3 366,701 71.3 617,688 71.1
Notes:
(1) Overhead costs primarily consist of manufacturing costs, freight costs, duty costs and warehousing inbound/outboundhandling costs.
(2) Our subcontracting costs are typically reflected in our cost of sales under direct material costs (such as whole machinepurchase costs). Whole machine purchase costs are generally incurred when we purchase finished products fromsub-contractors, which we will further sell to our customers. For the years ended December 31, 2018, 2019 and 2020 and thesix months ended June 30, 2021, our subcontracting costs amounted to US$73.7 million, US$47.1 million, US$44.4 millionand US$23.0 million, respectively, which amounted to 14.3%, 8.0%, 5.3% and 3.7% of our cost of sales during the same yearor period.
FINANCIAL INFORMATION
– 340 –
Our direct material costs amounted to US$418.6 million, US$475.5 million, US$678.6 million,
US$297.5 million and US$504.2 million in the years ended December 31, 2018, 2019 and 2020 and the
six months ended June 30, 2020 and 2021, respectively, and represented 60.6%, 56.4%, 56.5%, 57.9% and
58.0% of our revenue for the same years or periods, respectively.
Our direct labor costs amounted to US$25.3 million, US$30.6 million, US$42.5 million, US$16.2
million and US$33.5 million in the years ended December 31, 2018, 2019 and 2020 and the six months
ended June 30, 2020 and 2021, respectively, and represented 3.7%, 3.6%, 3.5%, 3.1% and 3.9% of our
revenue for the same years or periods, respectively.
Our overhead costs amounted to US$71.3 million, US$82.2 million, US$111.1 million, US$53.1
million and US$80.0 million in the years ended December 31, 2018, 2019 and 2020 and the six months
ended June 30, 2020 and 2021, respectively, and represented 10.3%, 9.7%, 9.3%, 10.3% and 9.2% of our
revenue for the same years or periods, respectively.
Gross Profit and Gross Profit Margin
Our gross profit represents our revenue less our cost of sales, and our gross profit margin representsour gross profit divided by our revenue, expressed as a percentage.
In 2018, 2019 and 2020, our gross profit was US$175.5 million, US$255.3 million and US$368.7million, respectively. Our overall gross profit margin was 25.4%, 30.3% and 30.7%, respectively, in thesame years. In the six months ended June 30, 2020 and 2021, our gross profit was US$147.7 million andUS$251.1 million, respectively. Our gross profit margin was 28.7% and 28.9%, respectively, in the sameperiods. During the Track Record Period, the overall increase in our gross profit margin was primarily dueto (i) an increase in the share of our OBM business, which in general has higher gross profit margin thanour ODM business, as a percentage of our total revenue, (ii) growth in the sales of high-end products, suchas our EGO OPE products and FLEX power tools, which are typically sold at higher prices and (iii)economies of scale and reduced costs due to the expansion of, and operational improvement in, ourproduction facilities.
FINANCIAL INFORMATION
– 341 –
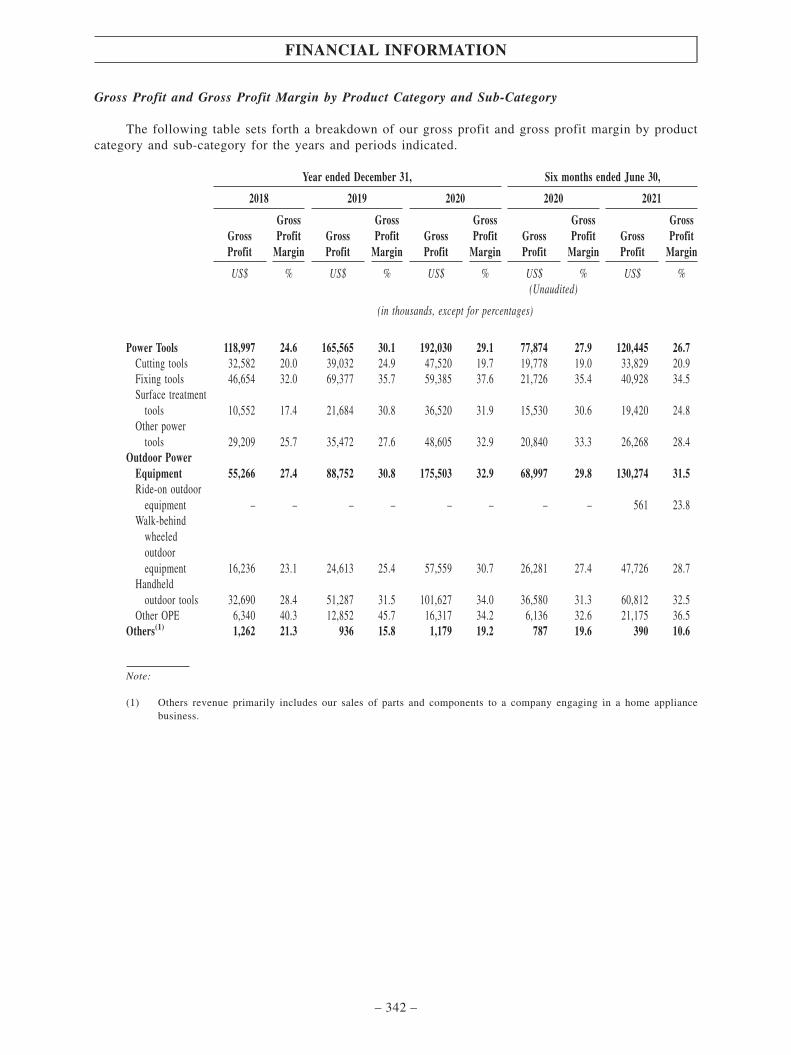
Gross Profit and Gross Profit Margin by Product Category and Sub-Category
The following table sets forth a breakdown of our gross profit and gross profit margin by productcategory and sub-category for the years and periods indicated.
Year ended December 31, Six months ended June 30,
2018 2019 2020 2020 2021
GrossProfit
GrossProfit
MarginGrossProfit
GrossProfit
MarginGrossProfit
GrossProfit
MarginGrossProfit
GrossProfit
MarginGrossProfit
GrossProfit
Margin
US$ % US$ % US$ % US$ % US$ %(Unaudited)
(in thousands, except for percentages)
Power Tools 118,997 24.6 165,565 30.1 192,030 29.1 77,874 27.9 120,445 26.7Cutting tools 32,582 20.0 39,032 24.9 47,520 19.7 19,778 19.0 33,829 20.9Fixing tools 46,654 32.0 69,377 35.7 59,385 37.6 21,726 35.4 40,928 34.5Surface treatment
tools 10,552 17.4 21,684 30.8 36,520 31.9 15,530 30.6 19,420 24.8Other power
tools 29,209 25.7 35,472 27.6 48,605 32.9 20,840 33.3 26,268 28.4Outdoor Power
Equipment 55,266 27.4 88,752 30.8 175,503 32.9 68,997 29.8 130,274 31.5Ride-on outdoor
equipment – – – – – – – – 561 23.8Walk-behind
wheeledoutdoorequipment 16,236 23.1 24,613 25.4 57,559 30.7 26,281 27.4 47,726 28.7
Handheldoutdoor tools 32,690 28.4 51,287 31.5 101,627 34.0 36,580 31.3 60,812 32.5
Other OPE 6,340 40.3 12,852 45.7 16,317 34.2 6,136 32.6 21,175 36.5Others(1) 1,262 21.3 936 15.8 1,179 19.2 787 19.6 390 10.6
Note:
(1) Others revenue primarily includes our sales of parts and components to a company engaging in a home appliancebusiness.
FINANCIAL INFORMATION
– 342 –
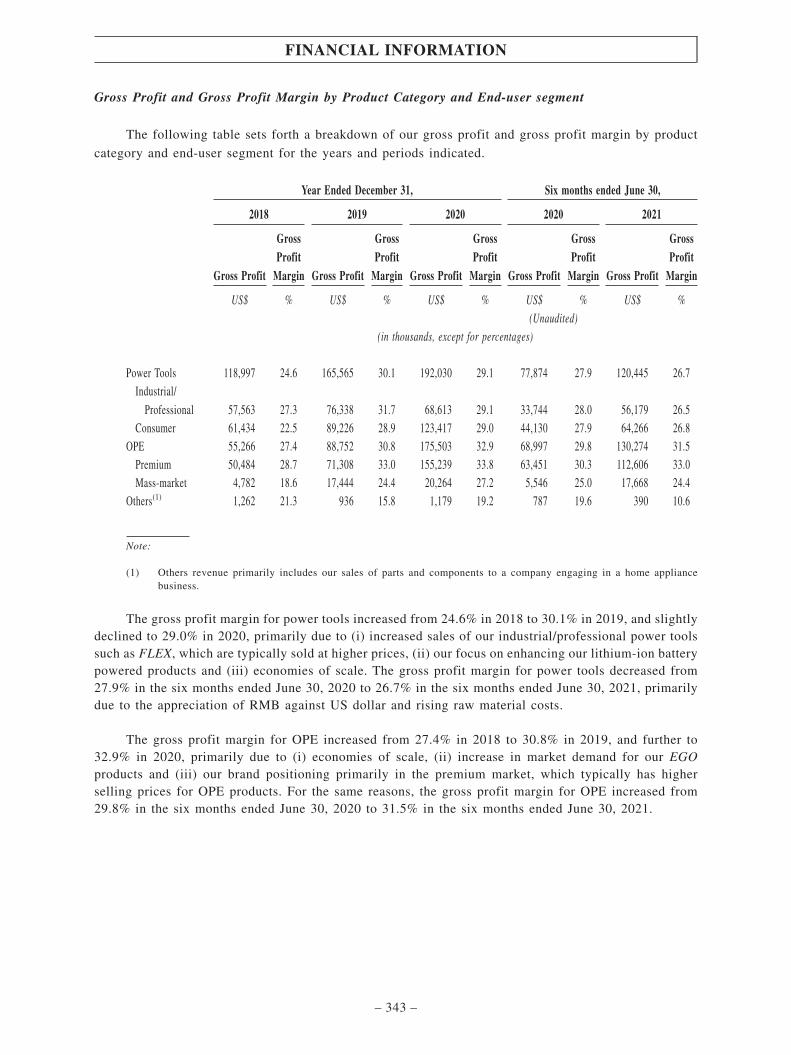
Gross Profit and Gross Profit Margin by Product Category and End-user segment
The following table sets forth a breakdown of our gross profit and gross profit margin by product
category and end-user segment for the years and periods indicated.
Year Ended December 31, Six months ended June 30,
2018 2019 2020 2020 2021
Gross Profit
GrossProfit
Margin Gross Profit
GrossProfit
Margin Gross Profit
GrossProfit
Margin Gross Profit
GrossProfit
Margin Gross Profit
GrossProfit
Margin
US$ % US$ % US$ % US$ % US$ %(Unaudited)
(in thousands, except for percentages)
Power Tools 118,997 24.6 165,565 30.1 192,030 29.1 77,874 27.9 120,445 26.7Industrial/
Professional 57,563 27.3 76,338 31.7 68,613 29.1 33,744 28.0 56,179 26.5Consumer 61,434 22.5 89,226 28.9 123,417 29.0 44,130 27.9 64,266 26.8
OPE 55,266 27.4 88,752 30.8 175,503 32.9 68,997 29.8 130,274 31.5Premium 50,484 28.7 71,308 33.0 155,239 33.8 63,451 30.3 112,606 33.0Mass-market 4,782 18.6 17,444 24.4 20,264 27.2 5,546 25.0 17,668 24.4
Others(1) 1,262 21.3 936 15.8 1,179 19.2 787 19.6 390 10.6
Note:
(1) Others revenue primarily includes our sales of parts and components to a company engaging in a home appliancebusiness.
The gross profit margin for power tools increased from 24.6% in 2018 to 30.1% in 2019, and slightlydeclined to 29.0% in 2020, primarily due to (i) increased sales of our industrial/professional power toolssuch as FLEX, which are typically sold at higher prices, (ii) our focus on enhancing our lithium-ion batterypowered products and (iii) economies of scale. The gross profit margin for power tools decreased from27.9% in the six months ended June 30, 2020 to 26.7% in the six months ended June 30, 2021, primarilydue to the appreciation of RMB against US dollar and rising raw material costs.
The gross profit margin for OPE increased from 27.4% in 2018 to 30.8% in 2019, and further to32.9% in 2020, primarily due to (i) economies of scale, (ii) increase in market demand for our EGOproducts and (iii) our brand positioning primarily in the premium market, which typically has higherselling prices for OPE products. For the same reasons, the gross profit margin for OPE increased from29.8% in the six months ended June 30, 2020 to 31.5% in the six months ended June 30, 2021.
FINANCIAL INFORMATION
– 343 –

Gross Profit and Gross Profit Margin by OBM and ODM Models
The following table sets forth a breakdown of our gross profit and gross profit margin by OBM and
ODM business models and brands for the years and periods indicated.
Year ended December 31, Six months ended June 30,
2018 2019 2020 2020 2021
Gross Profit
GrossProfit
Margin Gross Profit
GrossProfit
Margin Gross Profit
GrossProfit
Margin Gross Profit
GrossProfit
Margin Gross Profit
GrossProfit
Margin
US$ % US$ % US$ % US$ % US$ %(Unaudited)
(in thousands, except for percentages)
OBM 122,270 28.3 147,836 31.8 246,403 33.0 100,188 29.8 186,825 31.6ODM 53,255 20.6 107,417 28.4 122,309 26.9 47,470 26.7 64,284 23.2
The gross profit margin for OBM business increased from 28.3% in 2018 to 31.8% in 2019, and
increased further to 33.0% in 2020, primarily due to increased revenue contributions from our EGO and
FLEX brands, which generally have higher gross profit margins. For the same reason, the gross profit
margin for OBM business increased from 29.8% for the six months ended June 30, 2020 to 31.6% for the
same period in 2021.
The gross profit margin for our ODM business increased from 20.6% in 2018 to 28.4% in 2019
primarily due to increased revenue contribution from sales of higher end ODM products, which typically
have higher profit margins. The gross profit margin decreased from 28.4% in 2019 to 26.9% in 2020
primarily due to the impact of the consolidation of the Nanjing Bovon business, which primarily
manufactures bench tools that had lower profit margins. As of September 22, 2021, Nanjing Bovon has
ceased operations and completed its deregistration process. We do not expect the deregistration process of
Nanjing Bovon to affect the Group’s results of operations as the entity’s business has been transferred to
the Group. For the same reason, the gross profit margin for ODM business decreased from 26.7% for the
six months ended June 30, 2020 to 23.2% for the same period in 2021.
FINANCIAL INFORMATION
– 344 –

Gross Profit and Gross Profit Margin by Geographical Regions and Sales and Distribution ChannelsUnder OBM Model
The following table sets forth a breakdown of our gross profit and gross profit margin by
geographical regions and sales and distribution channels under OBM model for the years and periods
indicated.
Year ended December 31, Six months ended June 30,
2018 2019 2020 2020 2021
GrossProfit
GrossProfit
MarginGrossProfit
GrossProfit
MarginGrossProfit
GrossProfit
MarginGrossProfit
GrossProfit
MarginGrossProfit
GrossProfit
Margin
US$ % US$ % US$ % US$ % US$ %(Unaudited)
(in thousands, except for percentages)
North America 64,300 24.9 87,911 30.7 178,106 32.5 65,670 27.8 137,735 32.5Retailers 57,931 24.4 80,780 30.8 163,416 33.0 61,604 27.8 124,762 33.0Distributors 1,151 19.1 1,502 22.5 2,242 23.2 969 26.2 2,015 21.8Pure-play
e-commerceplatform 5,219 34.2 5,630 31.4 12,447 28.1 3,097 28.5 10,958 29.7
Europe 46,604 37.0 48,205 37.7 49,862 36.7 25,374 38.0 34,398 31.9Retailers 29,229 36.6 32,146 37.8 34,367 37.5 16,180 37.6 14,586 32.9Distributors 16,965 37.5 15,800 37.8 15,252 35.1 9,061 38.7 19,420 31.0Pure-play
e-commerceplatform 410 38.5 259 30.3 243 31.2 133 34.6 393 42.7
China(1) 8,534 21.7 8,841 20.5 13,888 26.8 7,771 25.9 11,098 21.8ROW(2) 2,832 36.0 2,879 37.8 4,547 45.8 1,373 46.1 3,594 45.5
Notes:
(1) In China, we primarily sell our products to distributors. We also offer our products through pure-play e-commerce channels.
(2) In other markets to which we distribute our products, such as Australia and New Zealand, we primarily sell our products toretailers. Our practices may vary in different markets subject to the local conditions. The gross profit margins for ROW werehigher because the sales of EGO products, which typically had higher profit margins, accounted for a larger proportion of ourrevenue from ROW.
Our gross profit margin for North America increased from 24.9% in 2018 to 30.7% in 2019, and
further increased to 32.5% in 2020, primarily due to the expansion of our premium brands, such as EGO.
Our gross profit margin for North America increased from 27.8% in the six months ended June 30, 2020
to 32.5% in the six months ended June 30, 2021 for the same reason.
Our gross profit margin for Europe remained relatively stable at 37.0%, 37.7% and 36.7% in 2018,
2019 and 2020, respectively. Our gross profit margin for Europe declined from 38.0% in the six months
ended June 30, 2020 to 31.9% in the six months ended June 30, 2021, primarily due to the increased sales
from SKIL products that generally had lower profit margins.
FINANCIAL INFORMATION
– 345 –

Other Revenue and Other Net Loss or Gain
Other Revenue
Our other revenue primarily consists of (i) government grants, which include financial subsidies that
we receive from local governments in recognition of our contributions to technology innovation and
regional business development, (ii) income from sale of scrap materials, and (iii) rental income, which
represented leasing of our properties. Government grants were given at the discretion of the relevant
government authorities. There is no assurance that similar grants will be made to us in any future period.
In 2018, 2019, 2020 and the six months ended June 30, 2020 and 2021, our other revenue was US$3.5
million, US$3.8 million, US$5.8 million, US$2.8 million and US$2.1 million, respectively, representing
0.5%, 0.4%, 0.5%, 0.5% and 0.2% of revenue, respectively.
The following table sets forth the breakdown of the key components of our other revenue for the
years and periods indicated.
Year ended December 31,Six months ended
June 30,
2018 2019 2020 2020 2021
(unaudited)(In US$ thousands)
Government grants(1) 855 888 3,650 1,719 1,027Sale of scrap materials 596 935 1,058 617 878Rental income(2) 1,571 1,819 1,093 455 176Others 493 196 – – –
3,515 3,838 5,801 2,791 2,081
Notes:
(1) Represent unconditional government grants as rewards of the Group’s contribution to technology innovation andregional economic development.
(2) Represents rental income from leasing a property, which included certain office space and was held by JiuhaoElectromechanical. As of March 8, 2021, we no longer hold any interest in Jiuhao Electromechanical.
Other Net Loss or Gain
Our other net loss or gain primarily consists of (i) net foreign exchange gain or loss and (ii) net
realized and unrealized losses or gains on derivative financial instruments. We had other net gain of
US$0.9 million and US$19.8 million in 2019 and six months ended June 30, 2021, representing 0.1% and
2.4% of our revenue, respectively. The other net gain of US$19.8 million in the six months ended June
30, 2021 was primarily attributable to our sales of interests in Jiuhao Electromechanical. We also had other
net loss of US$8.2 million, US$3.1 million and US$1.6 million in 2018, 2020 and six months ended June
30, 2020, representing 1.2%, 0.3% and 0.3% of our revenue, respectively. Our net loss or gain was
primarily attributable to fluctuations in foreign exchange rates, particularly between RMB and US dollars.
FINANCIAL INFORMATION
– 346 –

The following table sets forth the breakdown of the key components of our other net loss or gain for
the years and periods indicated.
Year ended December 31,Six months ended
June 30,
2018 2019 2020 2020 2021
(unaudited)(in US$ thousands)
Net foreign exchange gain/(loss) 2,617 466 (11,497) (584) (5,374)Net (loss)/gain on disposal of
properties, plants and equipment (320) (74) (43) (4) (196)Net realized and unrealized
(losses)/gains on financial assets at
FVPL (83) (41) 165 430 454Net realized and unrealized
(losses)/gains on derivative financial
instruments (10,419) (810) 8,209 (1,501) 3,686Loss on disposal of associates and a
joint venture – – (131) – (677)(Loss)/gain on disposal of a
subsidiary – (4) – – 21,969Gain on business combination – 1,326 – – –Others 13 80 157 12 (108)
(8,192) 943 (3,140) (1,647) 19,754
FINANCIAL INFORMATION
– 347 –

Research and Development Costs
Our research and development costs primarily consist of (i) employees’ salaries and benefits, (ii)
share-based compensation, (iii) research and development material costs, (iv) depreciation and
amortization and (v) intellectual rights application fees. The following table sets forth a breakdown of our
research and development costs, each expressed in the absolute amount and as a percentage of our total
revenue, during the Track Record Period:
Year Ended December 31, Six months ended June 30,
2018 2019 2020 2020 2021
US$ % US$ % US$ % US$ % US$ %(Unaudited)
(in thousands, except for percentages)
Employees’ salariesand benefits 20,315 3.0 23,865 2.8 27,577 2.3 14,261 2.8 22,690 2.6Share-basedcompensation – – – – 4,841 0.4 – – – –Research anddevelopmentmaterial costs 3,599 0.5 3,408 0.4 2,318 0.2 982 0.2 2,743 0.3Depreciation andamortization 1,202 0.2 1,357 0.2 1,442 0.1 729 0.1 1,011 0.1Intellectual rightsapplication fees 1,020 0.1 1,242 0.1 1,332 0.1 531 0.1 836 0.1Others(1) 1,520 0.2 1,484 0.2 1,429 0.1 481 0.1 687 0.1
Total research anddevelopment costs 27,656 4.0 31,356 3.7 38,939 3.2 16,984 3.3 27,967 3.2
Note:
(1) Primarily include leasing expenses, travel expenses, office expenses and other fees.
In the years ended December 31, 2018, 2019 and 2020, and the six months ended June 30, 2020 and
2021, our research and development costs amounted to US$27.7 million, US$31.4 million, US$38.9
million, US$17.0 million and US$28.0 million, respectively, representing 4.0%, 3.7%, 3.2%, 3.3% and
3.2% of our revenue during the same periods. Our research and development expenses increased as an
absolute amount during the Track Record Period primarily due to an increase in employees’ salaries and
benefits resulting from the increased headcount and average compensation for research and development
staff, as well as share-based compensation expenses, which was the result of our continuous focus on
research of key technologies. Our research and development costs generally decreased as a percentage of
our total revenue primarily due to the rapid increase in sales and economies of scale.
FINANCIAL INFORMATION
– 348 –

Selling and Distribution Expenses
Selling and distribution costs primarily consist of (i) employees’ salaries and benefits, (ii)
share-based compensation, (iii) marketing expenses, (iv) warranty expenses and (v) depreciation and
amortization. The following table sets forth a breakdown of our selling and distribution expenses, each
expressed in the absolute amount and as a percentage of our total revenue, during the Track Record Period:
Year Ended December 31, Six months ended June 30,
2018 2019 2020 2020 2021
US$ % US$ % US$ % US$ % US$ %(Unaudited)
(in thousands, except for percentages)
Employees’ salariesand benefits 33,268 4.8 36,148 4.3 40,830 3.4 17,517 3.4 22,549 2.6Share-basedcompensation – – – – 3,063 0.3 – – – –Marketing expenses 44,070 6.4 58,001 6.9 83,806 7.0 42,507 8.3 56,893 6.5Warranty expenses 9,900 1.4 22,056 2.6 38,624 3.2 9,312 1.8 11,660 1.3Depreciation andamortization 1,826 0.3 2,192 0.3 2,509 0.2 815 0.2 1,268 0.1Others(1) 11,463 1.6 9,686 1.1 10,615 0.9 3,260 0.6 4,048 0.5
Total selling anddistributionexpenses 100,527 14.5 128,083 15.2 179,447 15.0 73,411 14.3 96,418 11.1
Note:
(1) Primarily include travel expenses, office expenses, IT expenses and consulting fees.
In the years ended December 31, 2018, 2019 and 2020, and the six months ended June 30, 2020 and
2021, our selling and distribution expenses amounted to US$100.5 million, US$128.1 million, US$179.4
million, US$73.4 million and US$96.4 million, respectively, representing 14.5%, 15.2%, 15.0%, 14.3%
and 11.1% of our revenue during the same periods. Our selling and distribution expenses increased as an
absolute amount during the Track Record Period, primarily due to (i) an increase in our marketing
expenses driven by our advertisement and promotional activities and (ii) an increase in warranty expenses
driven by our increased sales, partially offset by a reduction in travel expenses in 2020 due to the impact
of the COVID-19 pandemic. Our selling and distribution costs generally decreased as a percentage of our
total revenue, primarily due to the rapid increase in sales.
FINANCIAL INFORMATION
– 349 –
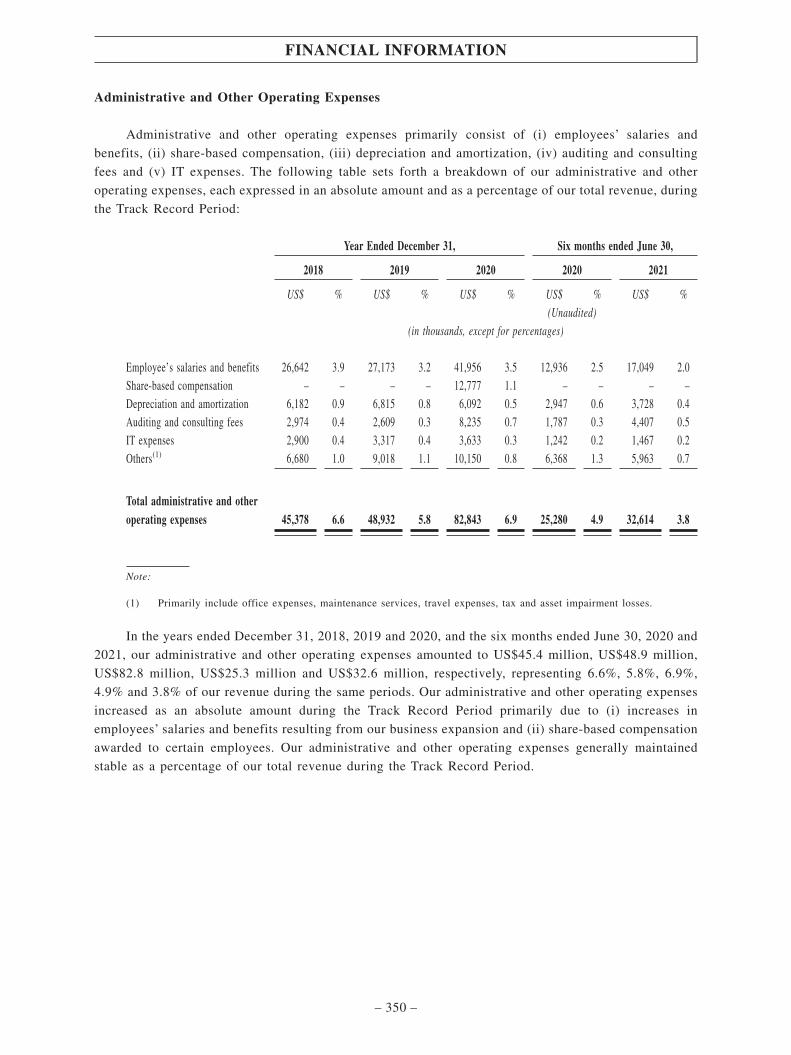
Administrative and Other Operating Expenses
Administrative and other operating expenses primarily consist of (i) employees’ salaries and
benefits, (ii) share-based compensation, (iii) depreciation and amortization, (iv) auditing and consulting
fees and (v) IT expenses. The following table sets forth a breakdown of our administrative and other
operating expenses, each expressed in an absolute amount and as a percentage of our total revenue, during
the Track Record Period:
Year Ended December 31, Six months ended June 30,
2018 2019 2020 2020 2021
US$ % US$ % US$ % US$ % US$ %(Unaudited)
(in thousands, except for percentages)
Employee’s salaries and benefits 26,642 3.9 27,173 3.2 41,956 3.5 12,936 2.5 17,049 2.0Share-based compensation – – – – 12,777 1.1 – – – –Depreciation and amortization 6,182 0.9 6,815 0.8 6,092 0.5 2,947 0.6 3,728 0.4Auditing and consulting fees 2,974 0.4 2,609 0.3 8,235 0.7 1,787 0.3 4,407 0.5IT expenses 2,900 0.4 3,317 0.4 3,633 0.3 1,242 0.2 1,467 0.2Others(1) 6,680 1.0 9,018 1.1 10,150 0.8 6,368 1.3 5,963 0.7
Total administrative and otheroperating expenses 45,378 6.6 48,932 5.8 82,843 6.9 25,280 4.9 32,614 3.8
Note:
(1) Primarily include office expenses, maintenance services, travel expenses, tax and asset impairment losses.
In the years ended December 31, 2018, 2019 and 2020, and the six months ended June 30, 2020 and
2021, our administrative and other operating expenses amounted to US$45.4 million, US$48.9 million,
US$82.8 million, US$25.3 million and US$32.6 million, respectively, representing 6.6%, 5.8%, 6.9%,
4.9% and 3.8% of our revenue during the same periods. Our administrative and other operating expenses
increased as an absolute amount during the Track Record Period primarily due to (i) increases in
employees’ salaries and benefits resulting from our business expansion and (ii) share-based compensation
awarded to certain employees. Our administrative and other operating expenses generally maintained
stable as a percentage of our total revenue during the Track Record Period.
FINANCIAL INFORMATION
– 350 –

Net Finance Costs
Our finance income primarily consists of interest income from bank deposits. Our finance costsprimarily consist of (i) interest on bank loans and (ii) interest on lease liabilities. In the years endedDecember 31, 2018, 2019 and 2020, and the six months ended June 30, 2020 and 2021, our net financecosts amounted to US$17.2 million, US$19.8 million, US$17.4 million, US$8.1 million and US$7.9million, respectively, representing 2.5%, 2.3%, 1.4%, 1.5% and 0.9% of our revenue during the sameperiods.
Share of Profits of Associates and a Joint Venture
Our share of profits primarily consists of share of profits from associates and a joint venture. In theyears ended December 31, 2018, 2019 and 2020, and the six months ended June 30, 2020 and 2021, ourshare of profits of associates and a joint venture amounted to US$5.5 million, US$10.4 million, US$6.7million, US$0.2 million and US$2.8 million, respectively. During the Track Record Period, our share ofprofits of associates was primarily attributable to our interests in Chervon Auto Precision Technology,which primarily engaged in manufacturing, research and development and sales of auto parts. During theTrack Record Period, our share of profits of a joint venture was primarily attributable to our interests inNanjing Bovon, which was a joint venture among the Group, Bosch (China) Investment Ltd. and ScintillaA.G. and was primarily engaged in the manufacturing, research and development and sales of power toolsand OPE products. As of September 22, 2021, Nanjing Bovon has ceased operations and completed itsderegistration process. Please refer to the section headed “History, Reorganization and CorporateStructure” of this prospectus and Notes 17 and 18 of the Accountants’ Report for further details.
Taxation
Income tax expense primarily represents our total current and deferred tax expenses under therelevant income tax rules and regulations in the jurisdictions where we operate. In 2019 and 2020 and thesix months ended June 30, 2020 and 2021, our effective tax rates were 14.8%, 18.7%, 18.7% and 17.7%,respectively. Effective tax rate was inapplicable to 2018, when we recorded a loss before taxation. Duringthe Track Record Period and up to the Latest Practicable Date, we had fulfilled all of our tax obligationsand did not have any material unresolved tax disputes.
The following table sets forth the components of income tax expense in absolute amounts for theyears indicated:
Year ended December 31,Six months ended
June 30,
2018 2019 2020 2020 2021
(Unaudited)(In US$ thousands)
Current taxPRC corporate income tax 227 789 1,253 726 4,969Hong Kong profits tax – – 2,916 1,716 7,856Tax jurisdictions outside PRCand Hong Kong 598 4,241 5,869 3,444 2,387Deferred tax (1,782) 1,236 1,085 (1,165) 4,400
Total income tax(credit)/expense (957) 6,266 11,123 4,721 19,612
FINANCIAL INFORMATION
– 351 –
Pursuant to the income tax rules and regulations of Hong Kong, the Company and the subsidiary inHong Kong were subject to the Hong Kong Profits Tax at a rate of 16.5% during the years ended December31, 2018, 2019 and 2020 and the six months ended June 30, 2020 and 2021.
The PRC subsidiaries of the Group are subject to PRC Corporate Income Tax (“CIT”) at a statutoryrate of 25%, except for the following specified subsidiary.
According to the Administrative Measures for Determination of High-Tech Enterprises (高新技術企業認定管理辦法) (國科發火[2016] No. 32), Nanjing Chervon Industry, which is our PRC subsidiary,obtained the qualification as a high-tech enterprise and was entitled to a preferential income tax rate of15% for the years from 2016 to 2019, and renewed the qualification from 2019 to 2021.
According to the prevailing PRC CIT law and its relevant regulations, non-PRC tax residententerprises are levied withholding tax on dividends from their PRC resident investees for intra-groupearnings accumulated beginning on January 1, 2008, at 10% (unless reduced by tax treaties or similararrangements), respectively. Undistributed earnings generated prior to 2008 are exempt from suchwithholding tax.
Under the arrangement between the Mainland China and Hong Kong Special Administrative Regionfor the Avoidance of Double Taxation and the Prevention of Fiscal Evasion with respect to Taxes onIncome and its relevant regulations, dividends paid by a PRC resident enterprise to its direct holdingcompany in Hong Kong will be subject to withholding tax at a reduced rate of 5% (if the Hong Konginvestor is the “beneficial owner” and owns directly at least 25% of the equity interest of the PRC residententerprise for the past twelve months before the dividends distribution). We met the beneficial ownerrequirements in 2015 and were entitled to a preferential rate of 5% since 2015.
Pursuant to the income tax rules and regulations of the United States, our subsidiaries in the UnitedStates was liable to United States federal income tax at a rate of 21% comprising federal income tax ata flat rate and state income tax at a rate ranging from 0.75% to 9.99% during the Track Record Period.
Pursuant to the income tax rules and regulations of the United Kingdom, our subsidiary in the UnitedKingdom was liable for the United Kingdom corporation tax at a rate of 20% during the Track RecordPeriod.
Pursuant to the income tax rules and regulations of Germany, Chervon GmbH, FlexGeschaftsfuhrungs GmbH, Flex Verwaltungs GmbH & Co.KG, Flex-Elektrowerkzeuge Gmb and EGOEurope GmbH were liable for German corporate tax at a rate between 22.825% and 26.825% determinedby municipalities during the Track Record Period.
Pursuant to the rules and regulations of Australia, our subsidiary in Australia was liable for theAustralia corporation tax at a rate of 27.5% during the Track Record Period.
Pursuant to the rules and regulations of Canada, our subsidiary in Canada was liable for the Canadacorporation tax at a rate of 26.5% during the Track Record Period.
Pursuant to the rules and regulations of the Netherlands, our subsidiaries in Netherlands was liablefor the Netherlands corporation tax at a rate of 25% during the Track Record Period.
Pursuant to the rules and regulations of Czech, our subsidiary in Czech was liable for the Czechcorporation tax at a rate of 19% during the Track Record Period.
FINANCIAL INFORMATION
– 352 –
Pursuant to the rules and regulations of Belgium, our subsidiary in Belgium was liable for theBelgium corporation tax at a rate of 25% during the Track Record Period.
Pursuant to the rules and regulations of Italy, our subsidiary in the Italy was liable to the Italiancorporation tax at a rate of 24% during the Track Record Period. FLEX Italia, our Italy-based subsidiary,has been subject to a tax dispute with relevant Italian tax authorities. Please refer to the section headed“Business – Transfer Pricing Policy” for further details.
Pursuant to the rules and regulations of France, our subsidiary in France was liable for the Francecorporation tax at a rate of 28% during the Track Record Period.
Pursuant to the Vietnam Investment Law and the approval of Industry Zone Committee of Tinh BinhDuong, our subsidiary in the Vietnam was entitled to a tax exemption for 2020 and 2021 and a preferentialincome tax rate of 10% from 2022 to 2025.
YEAR TO YEAR COMPARISON OF RESULTS OF OPERATIONS
Six Months Ended June 30, 2021 Compared to the Six Months Ended June 30, 2020
Revenue
Our revenue increased by 68.9% from US$514.4 million for the six months ended June 30, 2020 toUS$868.8 million for the six months ended June 30, 2021.
Power tools
Our revenue from sales of power tools increased by 61.7% from US$278.9 million for the six monthsended June 30, 2020 to US$451.1 million for the six months ended June 30, 2021. Such growth wasprimarily due to increased sales of our SKIL and FLEX power tools in the North America and Europemarkets, supported by our brand awareness initiatives and strengthened partnerships with major retailers,distributors and e-commerce platforms.
OPE products
Our revenue from sales of OPE products increased by 78.8% from US$231.5 million for the sixmonths ended June 30, 2020 to US$414.0 million for the six months ended June 30, 2021. Such growthwas primarily due to increased sales of our EGO and SKIL OPE products in the North America market,supported by our brand awareness initiatives and strengthened partnerships with major retailers,distributors and e-commerce platforms.
Cost of Sales
Our cost of sales increased by 68.4% from US$366.7 million for the six months ended June 30, 2020to US$617.7 million for the six months ended June 30, 2021 primarily due to increases in cost of rawmaterials and labor cost, which were in line with our business growth. Our cost of sales as a percentageof our revenue decreased from 71.3% to 71.1% for the same periods, primarily due to economies of scaleand our enhanced ability to control and manage cost to improve our profitability.
FINANCIAL INFORMATION
– 353 –
Gross Profit and Gross Profit Margin
As a result of the foregoing, our gross profit increased by 70.0% from US$147.7 million for the six
months ended June 30, 2020 to US$251.1 million for the six months ended June 30, 2021. Our gross profit
margin slightly increased from 28.7% to 28.9%, primarily due to an increase in the proportion of revenue
contribution from our OBM business, particularly EGO-branded products.
Our gross profit for power tools increased by 54.6% from US$77.9 million for the six months ended
June 30, 2020 to US$120.4 million for the six months ended June 30, 2021. Our gross profit margin for
power tools declined from 27.9% to 26.7%, respectively, for the same periods.
Our gross profit for OPE increased by 88.8% from US$69.0 million for the six months ended June
30, 2020 to US$130.3 million for the six months ended June 30, 2021. Our gross profit margin for OPE
increased from 29.8% to 31.5% for the same respective periods, primarily due to the rapid growth in the
sales of EGO OPE products, which typically target the premium market and are sold at higher prices.
Other Revenue and Other Net Loss or Gain
Our other revenue decreased from US$2.8 million for the six months ended June 30, 2020 to US$2.1
million for the six months ended June 30, 2021. Our other revenue as a percentage of our revenue
decreased from 0.5% for the six months ended June 30, 2020 to 0.2% for the six months ended June 30,
2021.
Our other net losses US$1.6 million for the six months ended June 30, 2020 turned to other net gains
of US$19.8 million for the six months ended June 30, 2021. The increase was primarily due to our net gain
on disposal of a subsidiary of US$22.0 million, which was attributable to our sales of interests in Jiuhao
Electromechanical. Please refer to the section headed “History, Reorganization and Corporate Structure”
in this prospectus for more details. Our other net loss or gain as a percentage of our total revenue increased
from negative 0.3% for the six months ended June 30, 2020 to 2.4% for the six months ended June 30,
2021.
Research and Development Costs
Our research and development costs increased by 64.7% from US$17.0 million for the six months
ended June 30, 2020 to US$28.0 million for the six months ended June 30, 2021, primarily due to an
increase in employees’ salaries and benefits. Our research and development costs as a percentage of
revenue decreased from 3.3% to 3.2%, primarily due to the rapid increase in our sales.
Selling and Distribution Expenses
Our selling and distribution expenses increased by 31.3% from US$73.4 million for the six months
ended June 30, 2020 to US$96.4 million for the six months ended June 30, 2021, primarily due to (i) an
increase in employees’ salaries and benefits and (ii) an increase in marketing expenses attributable to
increased spending on marketing and promotional activities. Our selling and distribution expenses as a
percentage of revenue decreased from 14.3% to 11.1%, primarily due to the rapid increase in our sales.
FINANCIAL INFORMATION
– 354 –
Administrative and Other Operating Expenses
Our administrative and other operating expenses increased by 28.9% from US$25.3 million for the
six months ended June 30, 2020 to US$32.6 million for the six months ended June 30, 2021, primarily due
to increases in auditing and consulting fees and reduced asset impairment losses. Our administrative and
other operating expenses as a percentage of revenue decreased from 4.9% to 3.8%, primarily due to our
ability to control costs, rapid increase in our sales and economies of scale.
Net Finance Costs
Our finance costs increased by 1.2% from US$8.3 million for the six months ended June 30, 2020
to US$8.4 million for the six months ended June 30, 2021, primarily due to a decrease in interest rates on
our bank borrowings. Our finance income increased from US$0.2 million for the six months ended June
30, 2020 to US$0.5 million for the six months ended June 30, 2021. As a result, our net finance costs
decreased by 2.5% from US$8.1 million for the six months ended June 30, 2020 to US$7.9 million for the
six months ended June 30, 2021, which represented 1.5% and 0.9% of our total revenue during the same
periods.
Share of Profits of Associates
We recorded a share of profits of associates of US$0.2 million for the six months ended June 30,
2020, while we recorded a share of profits of associates and a joint venture of US$2.8 million for the six
months ended June 30, 2021.
Profit before Tax
As a result of the foregoing, our profit before tax increased significantly from US$25.2 million for
the six months ended June 30, 2020 to US$110.9 million for the six months ended June 30, 2021.
Income Tax Expense
Our income tax expense increased significantly from US$4.7 million for the six months ended June
30, 2020 to US$19.6 million for the six months ended June 30, 2021, primarily due to a significant
increase in our taxable income due to an increase in sales revenue. Additionally, for the six months ended
June 30, 2020 and 2021, our effective tax rates were 18.7% and 17.7%, respectively. The increase in
effective tax rates was primarily due to increases in taxable income of our subsidiaries in jurisdictions with
higher tax rates.
Profit for the Period
As a result of the foregoing, our net profit for the period increased significantly from US$20.5
million for the six months ended June 30, 2020 to US$91.2 million for the six months ended June 30, 2021.
Our net profit margin increased from 4.0% for the six months ended June 30, 2020 to 10.5% for the six
months ended June 30, 2021.
FINANCIAL INFORMATION
– 355 –

Year Ended December 31, 2020 Compared to the Year Ended December 31, 2019
Revenue
Our revenue increased by 42.4% from US$843.6 million for the year ended December 31, 2019 to
US$1,200.9 million for the year ended December 31, 2020. Such growth was primarily driven by increases
in revenue from both power tools and OPE product segments.
Power tools
Our revenue from sales of power tools increased by 20.3% from US$549.7 million for the year ended
December 31, 2019 to US$661.1 million for the year ended December 31, 2020. Our OBM business
experienced strong growth primarily driven by the increased sales of our SKIL power tool products in the
North America market, which are supported by (i) our strategic partnership with a leading national retailer,
(ii) our expanding network of quality distributors and (iii) cooperation with leading online e-commerce
platforms. Our ODM business also experienced growth in revenue, albeit at a relatively lower rate
compared to our OBM business.
OPE products
Our revenue from sales of OPE products increased by 85.3% from US$288.0 million for the year
ended December 31, 2019 to US$533.7 million for the year ended December 31, 2020. Such growth was
primarily due to continued strong growth in the sales of EGO products.
Cost of Sales
Our cost of sales increased by 41.5% from US$588.3 million for the year ended December 31, 2019
to US$832.2 million for the year ended December 31, 2020, primarily due to increases in cost of raw
materials and labor cost, which were in line with our business growth. Our cost of sales as a percentage
of our revenue decreased from 69.7% in 2019 to 69.3% in 2020, primarily due to economies of scale and
our ability to control and manage cost to enhance our profitability.
Gross Profit and Gross Profit Margin
As a result of the foregoing, our gross profit increased by 44.4% from US$255.3 million for the year
ended December 31, 2019 to US$368.7 million for the year ended December 31, 2020. Our gross profit
margin increased from 30.3% to 30.7%, primarily due to an increase in the proportion of revenue
contribution from our OBM business and our strategic focus on lithium-ion battery powered products,
which typically generate higher gross profit margins.
Our gross profit for power tools increased by 15.9% from US$165.6 million for the year ended
December 31, 2019 to US$192.0 million for the year ended December 31, 2020. Our gross profit margin
for power tools slightly decreased from 30.1% to 29.0% for the same respective periods.
Our gross profit for OPE increased by 97.6% from US$88.8 million for the year ended December 31,
2019 to US$175.5 million for the year ended December 31, 2020. Our gross profit margin for OPE
increased from 30.8% to 32.9% for the same respective periods.
FINANCIAL INFORMATION
– 356 –

Other Revenue and Other Net Loss or Gain
Our other revenue increased from US$3.8 million for the year ended December 31, 2019 to US$5.8
million for the year ended December 31, 2020. The increase was primarily due to an increase in
government grants of US$2.8 million. Our other revenue as a percentage of our total revenue remained
0.4% for the year ended December 31, 2019 and 0.5% for the year ended December 31, 2020.
Our other net loss or gain decreased from a gain of US$0.9 million for the year ended December 31,
2019 to a loss of US$3.1 million for the year ended December 31, 2020, representing 0.1% and negative
0.3% of our revenue for the respective periods. The decrease was primarily due to net foreign exchange
loss of US$11.5 million driven by appreciation of RMB against US dollars, partially offset by net realized
and unrealized gains on derivative financial instruments of US$8.2 million in 2020.
Research and Development Costs
Our research and development costs increased by 23.9% from US$31.4 million for the year ended
December 31, 2019 to US$38.9 million for the year ended December 31, 2020, primarily due to increases
in employees’ salaries and benefits and share-based compensation expenses, which was the result of our
continuous focus on research of key technologies. Our research and development costs as a percentage of
revenue decreased from 3.7% to 3.2%, primarily due to the rapid increase in our sales.
Selling and Distribution Expenses
Our selling and distribution expenses increased by 40.0% from US$128.1 million for the year ended
December 31, 2019 to US$179.4 million for the year ended December 31, 2020, primarily due to (i) an
increase in marketing expenses driven by our expanded marketing and promotional activities and (ii) an
increase in warranty expenses driven by the growth of our sales. Our selling and distribution expenses as
a percentage of revenue remained relatively stable at 15.2% in 2019 and 15.0% in 2020.
Administrative and Other Operating Expenses
Our administrative and other operating expenses increased by 69.3% from US$48.9 million for the
year ended December 31, 2019 to US$82.8 million for the year ended December 31, 2020, primarily due
to (i) increases in employees’ salaries and benefits and share-based compensation expenses and (ii) an
increase in consulting fees. Our administrative and other operating expenses as a percentage of revenue
increased from 5.8% to 6.9%.
Net Finance Costs
Our finance costs decreased by 11.8% from US$20.4 million for the year ended December 31, 2019
to US$18.0 million for the year ended December 31, 2020, primarily due to a decrease in interest rates on
our bank borrowings. Our finance income remained stable at US$0.6 million and US$0.6 million for the
years ended December 31, 2019 and 2020. As a result, our net finance costs decreased by 12.1% from
US$19.8 million for the year ended December 31, 2019 to US$17.4 million for the year ended December
31, 2020, which represented 2.3% and 1.4% of our total revenue during the same periods.
FINANCIAL INFORMATION
– 357 –
Share of Profits of Associates and a Joint Venture
We recorded a share of profits of associates and a joint venture of US$10.4 million for the year ended
December 31, 2019, and we recorded a share of profits of associates and a joint venture of US$6.7 million
for the year ended December 31, 2020.
Profit before Tax
As a result of the foregoing, our profit before tax increased by 40.7% from US$42.3 million for the
year ended December 31, 2019 to US$59.5 million for the year ended December 31, 2020.
Income Tax Expense
Our income tax expense increased from US$6.3 million for the year ended December 31, 2019 to
US$11.1 million for the year ended December 31, 2020, primarily due to a significant increase in our
taxable income due to an increase in sales revenue. Additionally, for the years ended December 31, 2019
and 2020, our effective tax rates were 14.8% and 18.7%, respectively. The increase in effective tax rates
was primarily due to increases in taxable income of our subsidiaries in jurisdictions with higher tax rates.
Profit for the Year
As a result of the foregoing, our net profit for the year increased by 34.1% from US$36.1 million
for the year ended December 31, 2019 to US$48.4 million for the year ended December 31, 2020. Our net
profit margin decreased from 4.3% for the year ended December 31, 2019 to 4.0% for the year ended
December 31, 2020.
Year Ended December 31, 2019 Compared to the Year Ended December 31, 2018
Revenue
Our revenue increased by 22.1% from US$690.7 million for the year ended December 31, 2018 to
US$843.6 million for the year ended December 31, 2019.
Power tools
Our revenue from sales of power tools increased by 13.7% from US$483.4 million for the year ended
December 31, 2018 to US$549.7 million for the year ended December 31, 2019. Such growth was
primarily due to (i) increased sales of power tools under our proprietary brands, (ii) growth in our ODM
business and (iii) increased revenue contribution from lithium-ion battery powered products, which are
typically sold at higher prices.
OPE products
Our revenue from sales of OPE products increased by 43.0% from US$201.4 million for the year
ended December 31, 2018 to US$288.0 million for the year ended December 31, 2019. Such growth was
primarily due to increased sales of our EGO OPE products in the North America market.
FINANCIAL INFORMATION
– 358 –

Cost of Sales
Our cost of sales increased by 14.2% from US$515.2 million for the year ended December 31, 2018
to US$588.3 million for the year ended December 31, 2019 primarily due to increases in cost of raw
materials and labor cost, which were in line with our business growth. Our cost of sales as a percentage
of our revenue decreased from 74.6% in 2018 to 69.7% in 2019, primarily due to economies of scale and
our enhanced ability to control and manage cost to improve our profitability.
Gross Profit and Gross Profit Margin
As a result of the foregoing, our gross profit increased by 45.5% from US$175.5 million for the year
ended December 31, 2018 to US$255.3 million for the year ended December 31, 2019. Our gross profit
margin increased from 25.4% to 30.3%, primarily due to an increase in the proportion of revenue
contribution from our OBM business and our strategic focus on lithium-ion battery powered products.
Our gross profit for power tools increased by 39.2% from US$119.0 million for the year ended
December 31, 2018 to US$165.6 million for the year ended December 31, 2019. Our gross profit margin
for power tools increased from 24.6% to 30.1% for the same respective periods, primarily due to increased
revenue contribution from lithium-ion battery powered products sold under our proprietary brands.
Our gross profit for OPE increased by 60.6% from US$55.3 million for the year ended December 31,
2018 to US$88.8 million for the year ended December 31, 2019. Our gross profit margin for OPE
increased from 27.4% to 30.8% for the same respective periods, primarily due to the increased sales of our
EGO OPE products that target the premium market.
Other Revenue and Other Net Loss or Gain
Our other revenue increased from US$3.5 million for the year ended December 31, 2018 to US$3.8
million for the year ended December 31, 2019. Our other revenue as a percentage of our total revenue
remained 0.5% for the year ended December 31, 2018 and 0.4% for the year ended December 31, 2019.
We had other net losses of US$8.2 million for the year ended December 31, 2018 and other net gains
of US$0.9 million for the year ended December 31, 2019. The net other loss in 2018 was primarily
attributable to net realized and unrealized losses on derivative financial instruments of US$10.4 million,
partially offset by net foreign exchange gains of US$2.6 million. Our other net loss as a percentage of our
revenue was 1.2% for the year ended December 31, 2018, and our other net gain as a percentage of our
total revenue was 0.1% for the year ended December 31, 2019.
Research and Development Costs
Our research and development costs increased by 13.4% from US$27.7 million for the year ended
December 31, 2018 to US$31.4 million for the year ended December 31, 2019, primarily due to an increase
in employees’ salaries and benefits, which was the result of our continuous focus on research of key
technologies. Our research and development costs as a percentage of revenue decreased from 4.0% to
3.7%, primarily due to the increase in our sales.
FINANCIAL INFORMATION
– 359 –
Selling and Distribution Expenses
Our selling and distribution expenses increased by 27.5% from US$100.5 million for the year endedDecember 31, 2018 to US$128.1 million for the year ended December 31, 2019, primarily due to (i) anincrease in marketing expenses driven by our expanded marketing and promotional activities and (ii) anincrease in warranty expenses driven by the growth of our sales. Our selling and distribution expenses asa percentage of revenue increased from 14.5% to 15.2%.
Administrative and Other Operating Expenses
Our administrative and other operating expenses increased by 7.7% from US$45.4 million for theyear ended December 31, 2018 to US$48.9 million for the year ended December 31, 2019, primarily dueto increases in employees’ salaries and benefits and IT expenses associated with an increase in the totalnumber of our employees caused by our business expansion. Our administrative and other operatingexpenses as a percentage of revenue decreased from 6.6% to 5.8%.
Net Finance Costs
Our finance costs increased by 17.2% from US$17.4 million for the year ended December 31, 2018to US$20.4 million for the year ended December 31, 2019, primarily due to an increase in the averagebalance of our bank borrowings. Our finance income increased from US$0.2 million for the year endedDecember 31, 2018 to US$0.6 million for the year ended December 31, 2019. As a result, our net financecosts increased by 15.1% from US$17.2 million for the year ended December 31, 2018 to US$19.8 millionfor the year ended December 31, 2019, which represented 2.5% and 2.3% of our total revenue during thesame periods.
Share of Profits of Associates and a Joint Venture
We recorded a share of profits of associates and a joint venture of US$5.5 million for the year endedDecember 31, 2018, while we recorded a share of profits of associates and a joint venture of US$10.4million for the year ended December 31, 2019.
Profit before Tax
As a result of the foregoing, our loss before tax was US$14.4 million for the year ended December31, 2018 and our profit before tax was US$42.3 million for the year ended December 31, 2019.
Income Tax Expense
Our income tax credit was US$1.0 million for the year ended December 31, 2018 and our incometax expense was US$6.3 million for the year ended December 31, 2019, primarily due to our taxableincome returning to positive. For the year ended December 31, 2019, our effective tax rate was 14.8%.
Profit for the Year
As a result of the foregoing, we incurred a loss of US$13.5 million for the year ended December 31,2018 and a profit of US$36.1 million for the year ended December 31, 2019. Our net profit margin was4.3% for the year ended December 31, 2019. We incurred a net loss of in 2018 primarily due to (i) ourincreased investments in the OBM business, including marketing and research and development spending
FINANCIAL INFORMATION
– 360 –

in 2018 and (ii) integration costs associated with our acquisition of the SKIL business. With respect to ourinvestments in the OBM business, for example, we devoted substantial resources into developingSKIL-branded lithium-ion battery powered products, which did not launch in Europe market until thefourth quarter of 2018. Our gross profit margin for 2018 was also lower due to promotion of OBMproducts, particularly EGO, through price reductions in order to quickly gain market share. With respectto the SKIL integration costs, such costs primarily include: (a) replacing certain operational support,logistics and IT systems, (b) investing in additional research and development efforts, (c) increasingproduction capacity and (d) enhancing relevant marketing activities during the transition period. We wereable to achieve a net profit in 2019, primarily due to (i) the growth of sales from products targetingindustrial/professional and premium end users, such as EGO OPE products and FLEX power tools, whichusually had higher gross profit margins and (ii) improvement in our operational efficiency achieved byeconomies of scale.
LIQUIDITY AND CAPITAL RESOURCES
Overview
During Track Record Period, we have financed our operations primarily through cash from ouroperations and proceeds from bank loans. As of June 30, 2021, we had US$238.6 million in cash and cashequivalents, primarily consisting of cash on hand and demand deposits.
The following table sets forth a summary of our cash flows for the periods indicated:
Year Ended December 31,Six Months Ended
June 30,
2018 2019 2020 2020 2021
(Unaudited)(in US$ thousands)
Net cash generated fromoperating activities 8,143 39,577 133,729 66,257 89,102Net cash (used in)/generatedfrom investing activities (21,940) (25,458) (15,660) (10,075) 687Net cash generatedfrom/(used in) financingactivities 35,018 7,568 (50,433) (18,108) (19,086)
Net increase in cash andcash equivalents 21,221 21,687 67,636 38,074 70,703Cash and cash equivalentsat the beginning of theyear/period 54,798 73,266 94,064 94,064 166,937Effect of foreign exchangerate changes (2,753) (889) 5,237 (1,775) 942
Cash and cash equivalentsat the end of year/period 73,266 94,064 166,937 130,363 238,582
FINANCIAL INFORMATION
– 361 –
Operating Activities
In the six months ended June 30, 2021, we had net cash flow generated from operating activities of
US$89.1 million, consisting of US$111.0 million in operating profit before changes in working capital,
offset by net cash outflow of US$14.4 million relating to change in working capital and income tax paid
of US$7.4 million. Our net cash generated from operations before changes in working capital were
primarily attributable to our profit before income tax of US$110.9 million, adjusted for non-cash items,
including primarily addition of depreciation of property, plant and equipment of US$10.5 million, and
deduction of gain on disposal of a subsidiary of US$22.0 million, which was mainly attributable to our
sales of interests in Jiuhao Electromechanical. Please refer to the section headed “History, Reorganization
and Corporate Structure” in this prospectus for more details. Our net cash outflows relating to changes in
working capital were primarily attributable to (i) an increase in inventories of US$89.7 million, which is
primarily driven by market demands and expansion of our production capacities, (ii) an increase in trade
and bills receivables of US$65.0 million, which is primarily driven by the growth of our sales, partially
offset by (i) a decrease in prepayments, deposits and other receivables of US$18.4 million, (ii) an increase
in trade payables of US$99.9 million and (iii) an increase in other payables and accruals of US$23.2
million.
In the six months ended June 30, 2020, we had net cash flow generated from operating activities of
US$66.3 million, consisting of US$48.5 million in operating profit before changes in working capital and
net cash inflow of US$26.0 million relating to change in working capital, offset by income tax paid of
US$8.2 million. Our net cash generated from operations before changes in working capital were primarily
attributable to our profit before income tax of US$25.2 million, adjusted for non-cash items, including
primarily addition of depreciation of property, plant and equipment of US$8.8 million and net finance
costs of US$8.1 million. Our net cash inflows relating to changes in working capital were primarily
attributable to a decrease in inventories of US$78.1 million, partially offset by an increase in trade and
bills receivables of US$98.3 million, which is primarily driven by the growth of our sales.
In the year ended December 31, 2020, we had net cash flow generated from operating activities of
US$133.7 million, consisting of US$117.4 million in operating profit before changes in working capital
and net cash inflow of US$27.4 million relating to change in working capital, offset by income tax paid
of US$11.1 million. Our net cash generated from operations before changes in working capital were
primarily attributable to our profit before income tax of US$59.5 million, adjusted for non-cash items,
including primarily addition of (i) depreciation of property, plant and equipment of US$17.9 million, (ii)
net finance costs of US$17.4 million, (iii) equity settled share-based payment expenses of US$21.1
million, and (iv) foreign exchange loss of US$11.5 million, which was primarily resulted from
appreciation of RMB against US dollars, and deduction of (i) share of profits of associates of US$6.7
million, which was primarily related to our investment in Chervon Auto Precision Technology, and (ii) net
realized and unrealized gains on derivative financial instruments of US$8.2 million, which were
attributable to appreciation of RMB against US dollars that increased the value of our foreign currency
forward contracts. Our net cash inflow relating to changes in working capital were primarily attributable
to (i) an increase in warranty provision of US$22.2 million, which was in line with our growth in sales,
(ii) a decrease in inventories of US$8.3 million, which was primarily driven by market demands for our
products, (iii) an increase in trade payables of US$83.7 million, (iv) an increase in other payables and
accruals of US$40.5 million and (v) an increase in refund liabilities from right of return of US$5.1 million,
partially offset by (i) an increase in trade and bills receivables of US$119.0 million, which was driven by
the growth in our sales, (ii) an increase in prepayments, deposits and other receivables of US$8.6 million,
which was primarily related to other deposits and receivables.
FINANCIAL INFORMATION
– 362 –

In the year ended December 31, 2019, we had net cash flow generated from operating activities of
US$39.6 million, consisting of US$76.7 million in operating profit before changes in working capital,
offset by net cash outflow of US$27.0 million relating to change in working capital and income tax paid
of US$10.1 million. Our net cash generated from operations before changes in working capital were
primarily attributable to our profit before income tax of US$42.3 million, adjusted for non-cash items,
including primarily addition of (i) depreciation of property, plant and equipment of US$17.4 million, (ii)
net finance costs of US$19.8 million, and (iii) provision for write-down of inventory of US$2.9 million
and deduction of share of profits of associates of US$9.2 million. Our net cash outflow relating to changes
in working capital were primarily due to (i) an increase in inventories of US$84.9 million, which was
driven by the expansion of our production capacities and market demands and (ii) an increase in trade and
bills receivables of US$9.2 million, partially offset by (i) an increase in trade payables of US$24.9 million
and (ii) an increase in other payables and accruals of US$33.1 million.
In the year ended December 31, 2018, we had net cash flow generated from operating activities of
US$8.1 million, consisting of US$26.7 million in operating profit before changes in working capital, offset
by net cash outflow of US$10.9 million relating to change in working capital and income tax paid of
US$7.6 million. Our net cash generated from operations before changes in working capital were primarily
attributable to our loss before income tax of US$14.4 million, adjusted for non-cash items, including
primarily addition of (i) depreciation of property, plant and equipment of US$19.3 million, (ii) net finance
costs of US$17.2 million, (iii) net realized and unrealized losses on derivative financial instruments of
US$10.4 million, which were attributable to depreciation of RMB against US dollars that increased the
value of our foreign currency forward contracts, (iv) provision of write-down of inventory of US$1.4
million and deduction of share of profits of associates of US$4.3 million. Our net cash outflow relating
to changes in working capital were primarily attributable to (i) an increase in inventories of US$25.4
million, (ii) an increase in prepayments, deposits and other receivables of US$14.3 million, partially offset
by (i) a decrease in trade and bills receivables of US$11.0 million, (ii) an increase in trade payables of
US$8.6 million and (iii) an increase in other payables and accruals of US$8.7 million.
For further details, please see Note 25 to the Accountants’ Report set out in Appendix I in this
prospectus.
Investing Activities
In the six months ended June 30, 2021, our net cash generated from investing activities was US$0.7
million, primarily consisting of (i) proceeds from disposal of financial assets measured at fair value
through profit or loss of US$125.5 million, (ii) net proceeds from disposal of subsidiaries of US$32.7
million, partially offset by (i) payment for acquisition of financial assets measured at fair value through
profit or loss of US$123.3 million and (ii) payment for the acquisition of property, plant and equipment
of US$36.1 million.
In the six months ended June 30, 2020, our net cash used in investing activities was US$10.1 million,
primarily consisting of (i) payment for acquisition of financial assets measured at fair value through profit
or loss of US$66.8 million and (ii) payment for the acquisition of property, plant and equipment of
US$15.8 million, partially offset by proceeds from disposal of financial assets measured at fair value
through profit or loss of US$72.0 million.
FINANCIAL INFORMATION
– 363 –

In the year ended December 31, 2020, our net cash used in investing activities was US$15.7 million,
primarily consisting of (i) payment for the acquisition of property, plant and equipment of US$31.6 million
and (ii) payment for the acquisition of financial assets measured at fair value through profit or loss of
US$133.5 million, partially offset by (i) proceeds from disposal of financial assets measured at fair value
through profit or loss of US$144.1 million and (ii) dividends received of US$4.2 million.
In the year ended December 31, 2019, our net cash used in investing activities was US$25.5 million,
primarily consisting of (i) payment for the acquisition of property, plant and equipment of US$25.6 million
and (ii) payment for the acquisition of financial assets measured at fair value through profit or loss of
US$141.9 million, partially offset by proceeds from disposal of financial assets measured at fair value
through profit or loss of US$143.7 million.
In the year ended December 31, 2018, our net cash used in investing activities was US$21.9 million,
primarily consisting of (i) payment for the acquisition of property, plant and equipment of US$26.3 million
and (ii) payment for the acquisition of financial assets measured at fair value through profit or loss of
US$54.0 million, partially offset by (i) proceeds from disposal of financial assets measured at fair value
through profit or loss of US$56.6 million.
Financing Activities
In the six months ended June 30, 2021, our net cash used in financing activities was US$19.1 million,
which primarily consisted of (i) repayment of bank loans of US$223.5 million, (ii) interest paid of
US$10.4 million, (iii) increase in pledged deposits for banking facilities of US$35.9 million, (iv)
acquisition of non-controlling interest of US$28.4 million, which was attributable to the Reorganization
and (v) dividends paid to equity shareholders of our Company of US$15.0 million, partially offset by (i)
proceeds from new bank loans of US$288.3 million and (ii) proceeds from issuance of ordinary shares of
US$7.9 million, which was attributable to the Reorganization.
In the six months ended June 30, 2020, our net cash used in financing activities was US$18.1 million,
which primarily consisted of (i) repayment of bank loans of US$318.7 million and (ii) interest paid of
US$5.7 million, partially offset by proceeds from new bank loans of US$310.9 million.
In the year ended December 31, 2020, our net cash used in financing activities was US$50.4 million,
which primarily consisted of (i) capital element of lease rental paid of US$2.5 million, (ii) repayment of
bank loans of US$638.4 million and (iii) interest paid of US$15.6 million, partially offset by (i) proceeds
from new bank loans of US$604.4 million and (ii) decrease in pledged deposits for banking facilities of
US$2.3 million.
In the year ended December 31, 2019, our net cash generated from financing activities was US$7.6
million, which primarily consisted of proceeds from new bank loans of US$587.3 million, partially offset
by (i) capital element of lease rental paid of US$2.3 million, (ii) repayment of bank loans of US$557.4
million, and (iii) interest paid of US$20.0 million.
In the year ended December 31, 2018, our net cash generated from financing activities was US$35.0
million, which primarily consisted of proceeds from new bank loans of US$618.8 million, partially offset
by (i) capital element of lease rental paid of US$1.7 million, (ii) repayment of bank loans of US$549.1
million, (iii) interest paid of US$21.1 million and (iv) an increase in pledged deposits for banking facilities
of US$11.3 million.
FINANCIAL INFORMATION
– 364 –

COMMITMENTS
Capital Commitments
The following table sets forth the total amount of our capital expenditures contracted but not yet
provided for as of the respective dates:
As of December 31,As of
June 30,
2018 2019 2020 2021
(In US$ thousands)
Contracted for 54,076 49,536 47,326 38,897Authorised but not contracted for – – 2,153 459,515
54,076 49,536 49,479 498,412
Represented by:Construction of plant and buildings 52,507 48,547 46,900 492,813Acquisition of machinery and
equipment 1,569 989 2,579 5,599
54,076 49,536 49,479 498,412
CAPITAL EXPENDITURES
We made payment for capital expenditures of US$26.3 million, US$25.6 million, US$31.6 million,
US$15.8 million and US$36.1 million for the years ended December 31, 2018, 2019 and 2020 and six
months ended June 30, 2020 and 2021, respectively. During the Track Record Period, our capital
expenditures were used primarily to purchase property, plant and equipment and intangible assets. The
following table sets forth our capital expenditures for the years indicated.
Year Ended December 31,Six Months Ended
June 30,
2018 2019 2020 2020 2021
(unaudited)(in US$ thousands)
– Payments for acquisition
of property, plant and
equipment 26,292 25,591 31,557 15,778 36,103
FINANCIAL INFORMATION
– 365 –
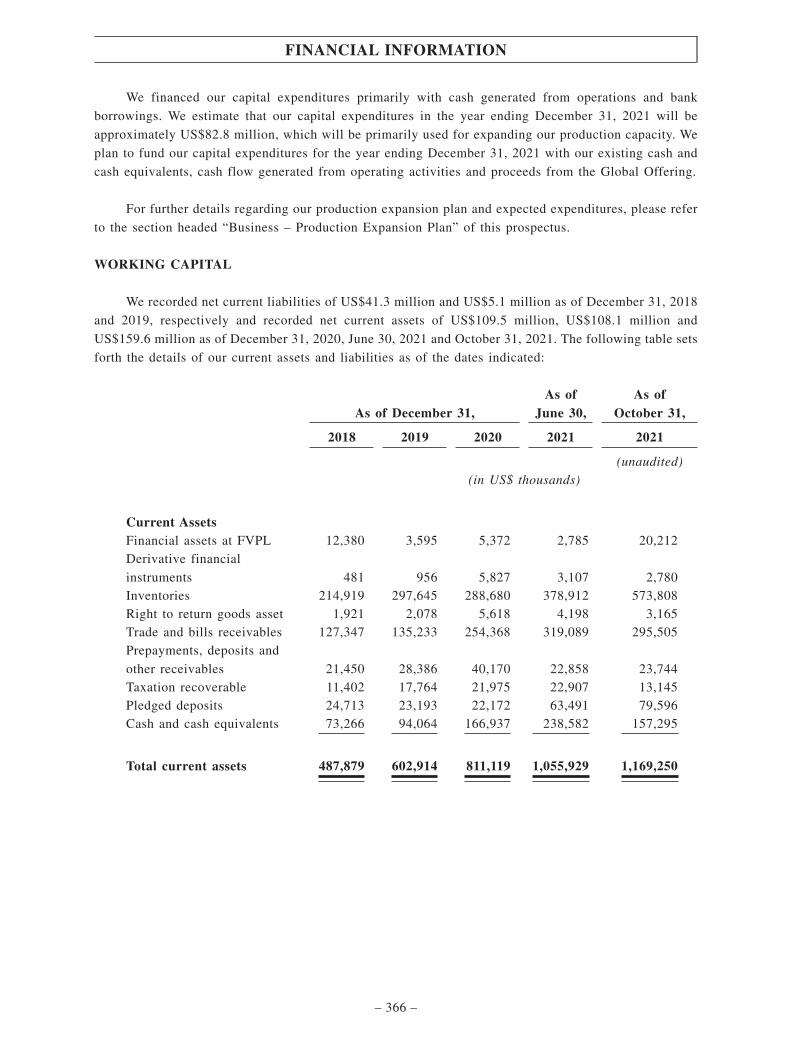
We financed our capital expenditures primarily with cash generated from operations and bank
borrowings. We estimate that our capital expenditures in the year ending December 31, 2021 will be
approximately US$82.8 million, which will be primarily used for expanding our production capacity. We
plan to fund our capital expenditures for the year ending December 31, 2021 with our existing cash and
cash equivalents, cash flow generated from operating activities and proceeds from the Global Offering.
For further details regarding our production expansion plan and expected expenditures, please refer
to the section headed “Business – Production Expansion Plan” of this prospectus.
WORKING CAPITAL
We recorded net current liabilities of US$41.3 million and US$5.1 million as of December 31, 2018
and 2019, respectively and recorded net current assets of US$109.5 million, US$108.1 million and
US$159.6 million as of December 31, 2020, June 30, 2021 and October 31, 2021. The following table sets
forth the details of our current assets and liabilities as of the dates indicated:
As of December 31,As of
June 30,As of
October 31,
2018 2019 2020 2021 2021
(unaudited)(in US$ thousands)
Current AssetsFinancial assets at FVPL 12,380 3,595 5,372 2,785 20,212Derivative financial
instruments 481 956 5,827 3,107 2,780Inventories 214,919 297,645 288,680 378,912 573,808Right to return goods asset 1,921 2,078 5,618 4,198 3,165Trade and bills receivables 127,347 135,233 254,368 319,089 295,505Prepayments, deposits and
other receivables 21,450 28,386 40,170 22,858 23,744Taxation recoverable 11,402 17,764 21,975 22,907 13,145Pledged deposits 24,713 23,193 22,172 63,491 79,596Cash and cash equivalents 73,266 94,064 166,937 238,582 157,295
Total current assets 487,879 602,914 811,119 1,055,929 1,169,250
FINANCIAL INFORMATION
– 366 –
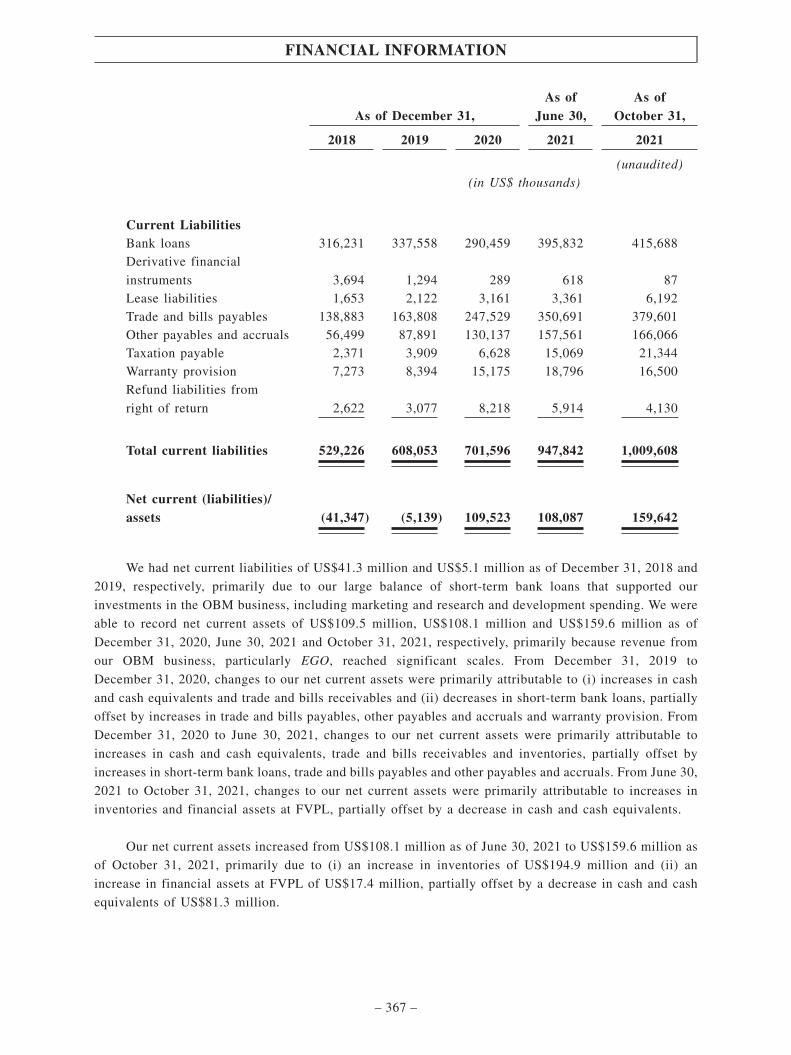
As of December 31,As of
June 30,As of
October 31,
2018 2019 2020 2021 2021
(unaudited)(in US$ thousands)
Current LiabilitiesBank loans 316,231 337,558 290,459 395,832 415,688Derivative financial
instruments 3,694 1,294 289 618 87Lease liabilities 1,653 2,122 3,161 3,361 6,192Trade and bills payables 138,883 163,808 247,529 350,691 379,601Other payables and accruals 56,499 87,891 130,137 157,561 166,066Taxation payable 2,371 3,909 6,628 15,069 21,344Warranty provision 7,273 8,394 15,175 18,796 16,500Refund liabilities from
right of return 2,622 3,077 8,218 5,914 4,130
Total current liabilities 529,226 608,053 701,596 947,842 1,009,608
Net current (liabilities)/assets (41,347) (5,139) 109,523 108,087 159,642
We had net current liabilities of US$41.3 million and US$5.1 million as of December 31, 2018 and
2019, respectively, primarily due to our large balance of short-term bank loans that supported our
investments in the OBM business, including marketing and research and development spending. We were
able to record net current assets of US$109.5 million, US$108.1 million and US$159.6 million as of
December 31, 2020, June 30, 2021 and October 31, 2021, respectively, primarily because revenue from
our OBM business, particularly EGO, reached significant scales. From December 31, 2019 to
December 31, 2020, changes to our net current assets were primarily attributable to (i) increases in cash
and cash equivalents and trade and bills receivables and (ii) decreases in short-term bank loans, partially
offset by increases in trade and bills payables, other payables and accruals and warranty provision. From
December 31, 2020 to June 30, 2021, changes to our net current assets were primarily attributable to
increases in cash and cash equivalents, trade and bills receivables and inventories, partially offset by
increases in short-term bank loans, trade and bills payables and other payables and accruals. From June 30,
2021 to October 31, 2021, changes to our net current assets were primarily attributable to increases in
inventories and financial assets at FVPL, partially offset by a decrease in cash and cash equivalents.
Our net current assets increased from US$108.1 million as of June 30, 2021 to US$159.6 million as
of October 31, 2021, primarily due to (i) an increase in inventories of US$194.9 million and (ii) an
increase in financial assets at FVPL of US$17.4 million, partially offset by a decrease in cash and cash
equivalents of US$81.3 million.
FINANCIAL INFORMATION
– 367 –
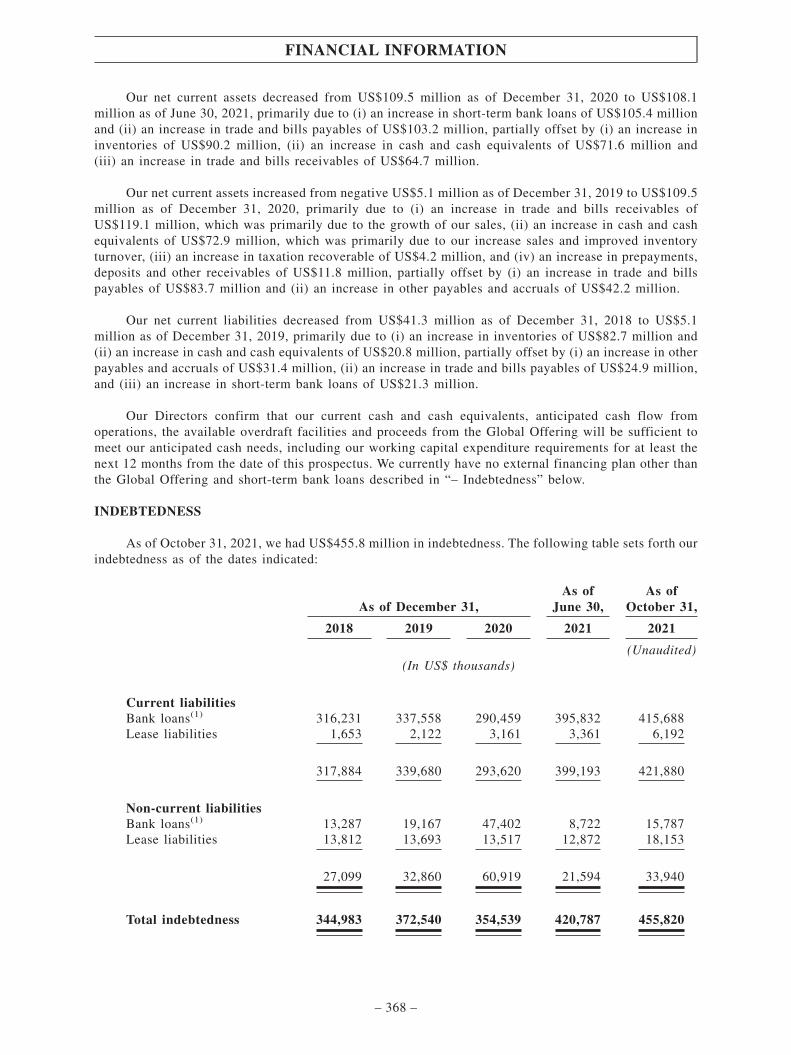
Our net current assets decreased from US$109.5 million as of December 31, 2020 to US$108.1million as of June 30, 2021, primarily due to (i) an increase in short-term bank loans of US$105.4 millionand (ii) an increase in trade and bills payables of US$103.2 million, partially offset by (i) an increase ininventories of US$90.2 million, (ii) an increase in cash and cash equivalents of US$71.6 million and(iii) an increase in trade and bills receivables of US$64.7 million.
Our net current assets increased from negative US$5.1 million as of December 31, 2019 to US$109.5million as of December 31, 2020, primarily due to (i) an increase in trade and bills receivables ofUS$119.1 million, which was primarily due to the growth of our sales, (ii) an increase in cash and cashequivalents of US$72.9 million, which was primarily due to our increase sales and improved inventoryturnover, (iii) an increase in taxation recoverable of US$4.2 million, and (iv) an increase in prepayments,deposits and other receivables of US$11.8 million, partially offset by (i) an increase in trade and billspayables of US$83.7 million and (ii) an increase in other payables and accruals of US$42.2 million.
Our net current liabilities decreased from US$41.3 million as of December 31, 2018 to US$5.1million as of December 31, 2019, primarily due to (i) an increase in inventories of US$82.7 million and(ii) an increase in cash and cash equivalents of US$20.8 million, partially offset by (i) an increase in otherpayables and accruals of US$31.4 million, (ii) an increase in trade and bills payables of US$24.9 million,and (iii) an increase in short-term bank loans of US$21.3 million.
Our Directors confirm that our current cash and cash equivalents, anticipated cash flow fromoperations, the available overdraft facilities and proceeds from the Global Offering will be sufficient tomeet our anticipated cash needs, including our working capital expenditure requirements for at least thenext 12 months from the date of this prospectus. We currently have no external financing plan other thanthe Global Offering and short-term bank loans described in “– Indebtedness” below.
INDEBTEDNESS
As of October 31, 2021, we had US$455.8 million in indebtedness. The following table sets forth ourindebtedness as of the dates indicated:
As of December 31,As of
June 30,As of
October 31,
2018 2019 2020 2021 2021
(Unaudited)(In US$ thousands)
Current liabilitiesBank loans(1) 316,231 337,558 290,459 395,832 415,688Lease liabilities 1,653 2,122 3,161 3,361 6,192
317,884 339,680 293,620 399,193 421,880
Non-current liabilitiesBank loans(1) 13,287 19,167 47,402 8,722 15,787Lease liabilities 13,812 13,693 13,517 12,872 18,153
27,099 32,860 60,919 21,594 33,940
Total indebtedness 344,983 372,540 354,539 420,787 455,820
FINANCIAL INFORMATION
– 368 –
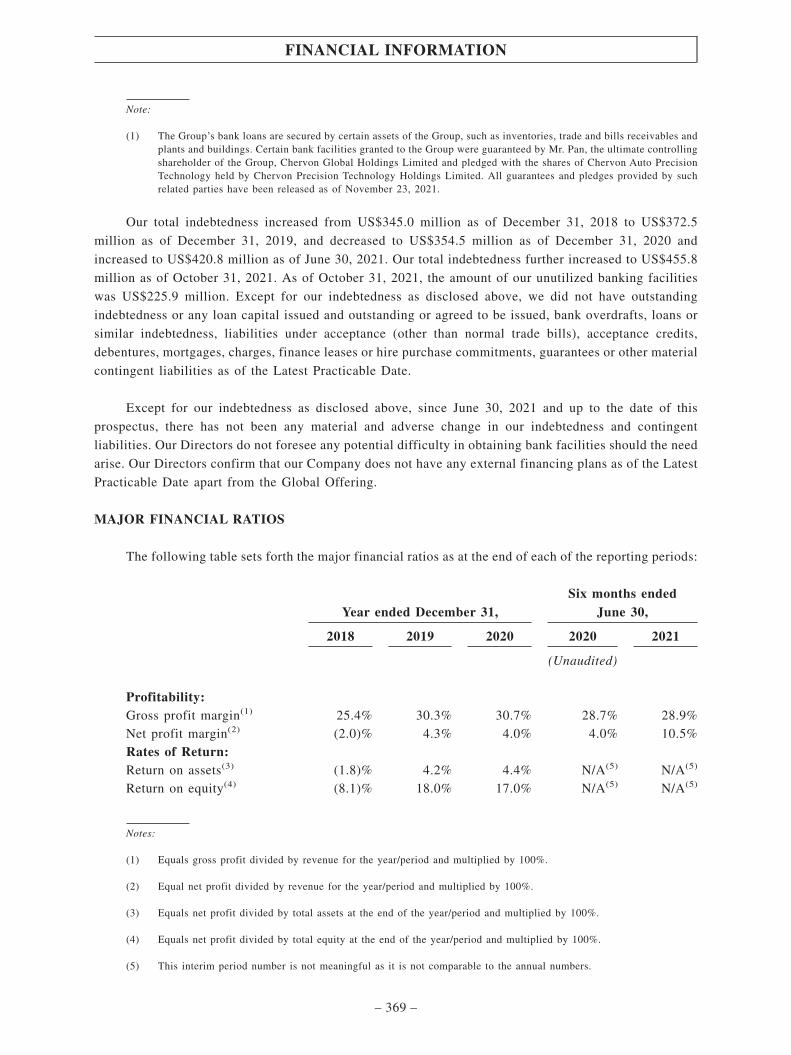
Note:
(1) The Group’s bank loans are secured by certain assets of the Group, such as inventories, trade and bills receivables andplants and buildings. Certain bank facilities granted to the Group were guaranteed by Mr. Pan, the ultimate controllingshareholder of the Group, Chervon Global Holdings Limited and pledged with the shares of Chervon Auto PrecisionTechnology held by Chervon Precision Technology Holdings Limited. All guarantees and pledges provided by suchrelated parties have been released as of November 23, 2021.
Our total indebtedness increased from US$345.0 million as of December 31, 2018 to US$372.5
million as of December 31, 2019, and decreased to US$354.5 million as of December 31, 2020 and
increased to US$420.8 million as of June 30, 2021. Our total indebtedness further increased to US$455.8
million as of October 31, 2021. As of October 31, 2021, the amount of our unutilized banking facilities
was US$225.9 million. Except for our indebtedness as disclosed above, we did not have outstanding
indebtedness or any loan capital issued and outstanding or agreed to be issued, bank overdrafts, loans or
similar indebtedness, liabilities under acceptance (other than normal trade bills), acceptance credits,
debentures, mortgages, charges, finance leases or hire purchase commitments, guarantees or other material
contingent liabilities as of the Latest Practicable Date.
Except for our indebtedness as disclosed above, since June 30, 2021 and up to the date of this
prospectus, there has not been any material and adverse change in our indebtedness and contingent
liabilities. Our Directors do not foresee any potential difficulty in obtaining bank facilities should the need
arise. Our Directors confirm that our Company does not have any external financing plans as of the Latest
Practicable Date apart from the Global Offering.
MAJOR FINANCIAL RATIOS
The following table sets forth the major financial ratios as at the end of each of the reporting periods:
Year ended December 31,Six months ended
June 30,
2018 2019 2020 2020 2021
(Unaudited)
Profitability:Gross profit margin(1) 25.4% 30.3% 30.7% 28.7% 28.9%Net profit margin(2) (2.0)% 4.3% 4.0% 4.0% 10.5%Rates of Return:Return on assets(3) (1.8)% 4.2% 4.4% N/A(5) N/A(5)
Return on equity(4) (8.1)% 18.0% 17.0% N/A(5) N/A(5)
Notes:
(1) Equals gross profit divided by revenue for the year/period and multiplied by 100%.
(2) Equal net profit divided by revenue for the year/period and multiplied by 100%.
(3) Equals net profit divided by total assets at the end of the year/period and multiplied by 100%.
(4) Equals net profit divided by total equity at the end of the year/period and multiplied by 100%.
(5) This interim period number is not meaningful as it is not comparable to the annual numbers.
FINANCIAL INFORMATION
– 369 –

As of December 31,As of
June 30,
2018 2019 2020 2021
Liquidity:Gearing ratio(1) 2.1 1.9 1.2 1.2Net debt to capital ratio(2) 1.5 1.3 0.6 0.4Current ratio(3) 0.9 1.0 1.2 1.1Quick ratio(4) 0.5 0.5 0.7 0.7
Notes:
(1) Equals total debt (including bank loans and lease liabilities) divided by total equity as of the respective end date forthe year/period.
(2) Equals net debt divided by total equity as of the respective end date for the year/period. Net debt is calculated as totaldebt (including bank loans and lease liabilities) less cash and cash equivalents and pledged deposits.
(3) Equals total current assets divided by total current liabilities as of the respective end date for the year/period.
(4) Equal total current assets less inventory and divided by total current liabilities as of the respective end date for theyear/period.
We incurred a net loss in 2018 primarily due to (i) our increased investments in the OBM business,
including marketing and research and development spending in 2018 and (ii) integration costs associated
with our acquisition of the SKIL business. With respect to our investments in the OBM business, for
example, we devoted substantial resources into developing SKIL-branded lithium-ion battery powered
products, which did not launch in Europe market until the fourth quarter of 2018. Our gross profit margin
for 2018 was also lower due to promotion of OBM products, particularly EGO, through price reductions
in order to quickly gain market share. With respect to the SKIL integration costs, such costs primarily
include: (a) replacing certain operational support, logistics and IT systems, (b) investing in additional
research and development efforts, (c) increasing production capacity and (d) enhancing relevant marketing
activities during the transition period. We were able to achieve a net profit margin of 4.3% and 4.0% in
2019 and 2020, primarily due to (i) the growth of sales from products targeting industrial/professional and
premium end users, such as EGO OPE products and FLEX power tools, which usually have higher profit
margins, and (ii) improvement in our operational efficiency achieved by economies of scale. For the same
reasons, our cash flows from operating activities also improved since 2019. Our net profit margin
increased significantly from 4.0% in the six months ended June 30, 2020 to 10.5% in the six months ended
June 30, 2021, primarily due to (i) a one-time gain from disposal of our equity interests in Jiuhao
Electromechanical, (ii) higher gross margin due to increased sales from industrial/professional and
premium products, such as EGO OPE products and FLEX power tools and (iii) the decrease in selling and
distribution expenses, administrative and other operating expenses and research and development
expenses as a percentage of revenue due to the rapid increase in our sales.
Our gearing ratio decreased from 2.1 as of December 31, 2018 to 1.9 as of December 31, 2019, and
further decreased to 1.2 as of December 31, 2020 and 1.2 as of June 30, 2021. Our net debt to capital ratio
decreased from 1.5 as of December 31, 2018 to 1.3 as of December 31, 2019, and further decreased to 0.6
as of December 31, 2020 and 0.4 as of June 30, 2021 . The improvement in our gearing ratio and net debt
to capital ratio was primarily due to our increased levels of capital through growing revenue and enhancing
profitability.
FINANCIAL INFORMATION
– 370 –

ANALYSIS OF SELECTED STATEMENT OF FINANCIAL POSITION ITEMS
Property, Plant and Equipment
Our property, plant and equipment is comprised of (i) plant and buildings, (ii) machinery and
equipment, (iii) furniture, fixtures and office equipment, (iv) motor vehicles and (v) construction in
progress. Our property, plant and equipment increased from US$109.5 million as of December 31, 2018
to US$120.0 million as of December 31, 2019, to US$143.0 million as of December 31, 2020, and further
to US$165.7 million as of June 30, 2021, primarily due to (i) our expansion of manufacturing facilities
and (ii) purchase of new machinery and equipment. See the sections headed “Business – Our Strategies”
and “Business – Production – Existing Production Facilities” in this prospectus for additional details.
Inventories
During the Track Record Period, inventories were one of the principal components of our current
assets. Our inventories primarily consist of raw materials, consumables, semi-finished goods and finished
goods. We have implemented an effective inventory control system that requires close coordination among
our various departments to ensure that our inventory levels are sufficient to satisfy demand and not cause
any disruptions in production while minimizing carrying costs.
The following table sets forth the balance of our inventories at the end of each reporting period:
As of December 31,As of
June 30,
2018 2019 2020 2021
(in US$ thousands)
Raw materials 36,595 32,523 56,085 90,391Consumables 1,786 3,174 3,729 4,646Semi-finished goods 13,948 18,052 32,997 37,883Finished goods 165,157 249,307 201,516 251,123Write down of inventories (2,567) (5,411) (5,647) (5,131)
Total inventories 214,919 297,645 288,680 378,912
The value of our inventories increased by 38.5% from US$214.9 million as of December 31, 2018
to US$297.6 million as of December 31, 2019 and decreased by 3.0% to US$288.7 million as of December
31, 2020. As of October 31, 2021, US$313.3 million, or 82.7%, of our inventories as of June 30, 2021 had
been used or sold subsequent to June 30, 2021. The increases of the value of our inventories throughout
the Track Record Period were in line with the growth of our business and our expanded warehouse
capacities.
FINANCIAL INFORMATION
– 371 –
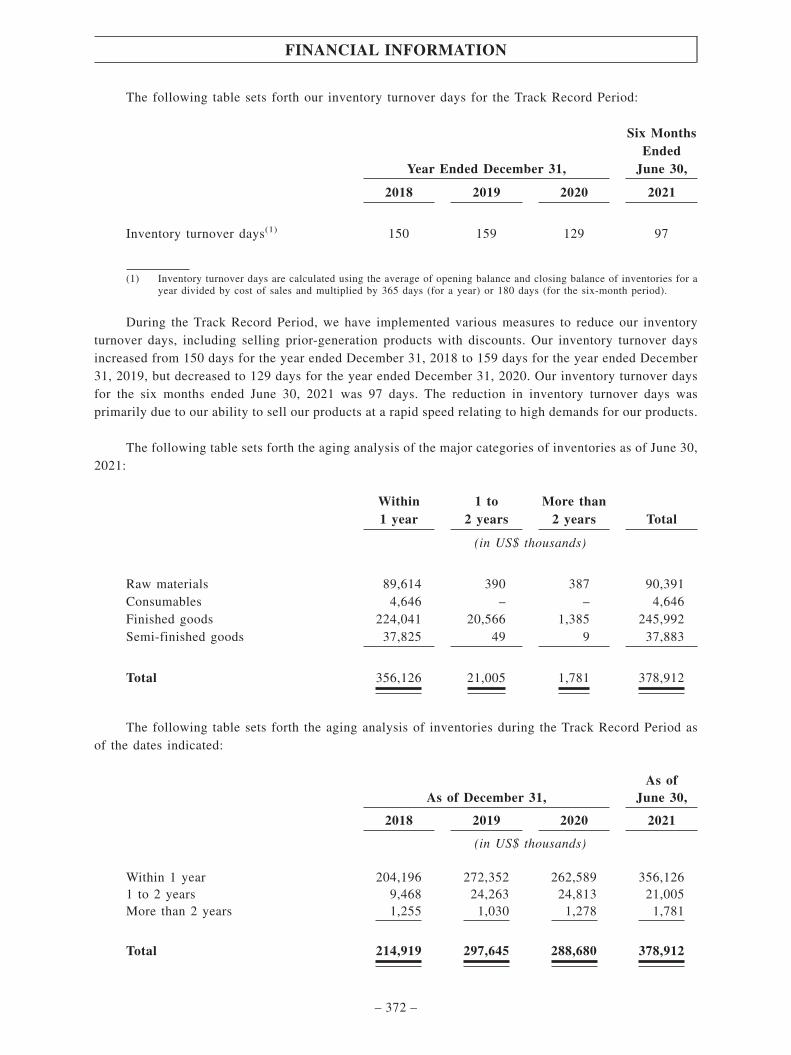
The following table sets forth our inventory turnover days for the Track Record Period:
Year Ended December 31,
Six MonthsEnded
June 30,
2018 2019 2020 2021
Inventory turnover days(1) 150 159 129 97
(1) Inventory turnover days are calculated using the average of opening balance and closing balance of inventories for ayear divided by cost of sales and multiplied by 365 days (for a year) or 180 days (for the six-month period).
During the Track Record Period, we have implemented various measures to reduce our inventoryturnover days, including selling prior-generation products with discounts. Our inventory turnover daysincreased from 150 days for the year ended December 31, 2018 to 159 days for the year ended December31, 2019, but decreased to 129 days for the year ended December 31, 2020. Our inventory turnover daysfor the six months ended June 30, 2021 was 97 days. The reduction in inventory turnover days wasprimarily due to our ability to sell our products at a rapid speed relating to high demands for our products.
The following table sets forth the aging analysis of the major categories of inventories as of June 30,2021:
Within1 year
1 to2 years
More than2 years Total
(in US$ thousands)
Raw materials 89,614 390 387 90,391Consumables 4,646 – – 4,646Finished goods 224,041 20,566 1,385 245,992Semi-finished goods 37,825 49 9 37,883
Total 356,126 21,005 1,781 378,912
The following table sets forth the aging analysis of inventories during the Track Record Period asof the dates indicated:
As of December 31,As of
June 30,
2018 2019 2020 2021
(in US$ thousands)
Within 1 year 204,196 272,352 262,589 356,1261 to 2 years 9,468 24,263 24,813 21,005More than 2 years 1,255 1,030 1,278 1,781
Total 214,919 297,645 288,680 378,912
FINANCIAL INFORMATION
– 372 –
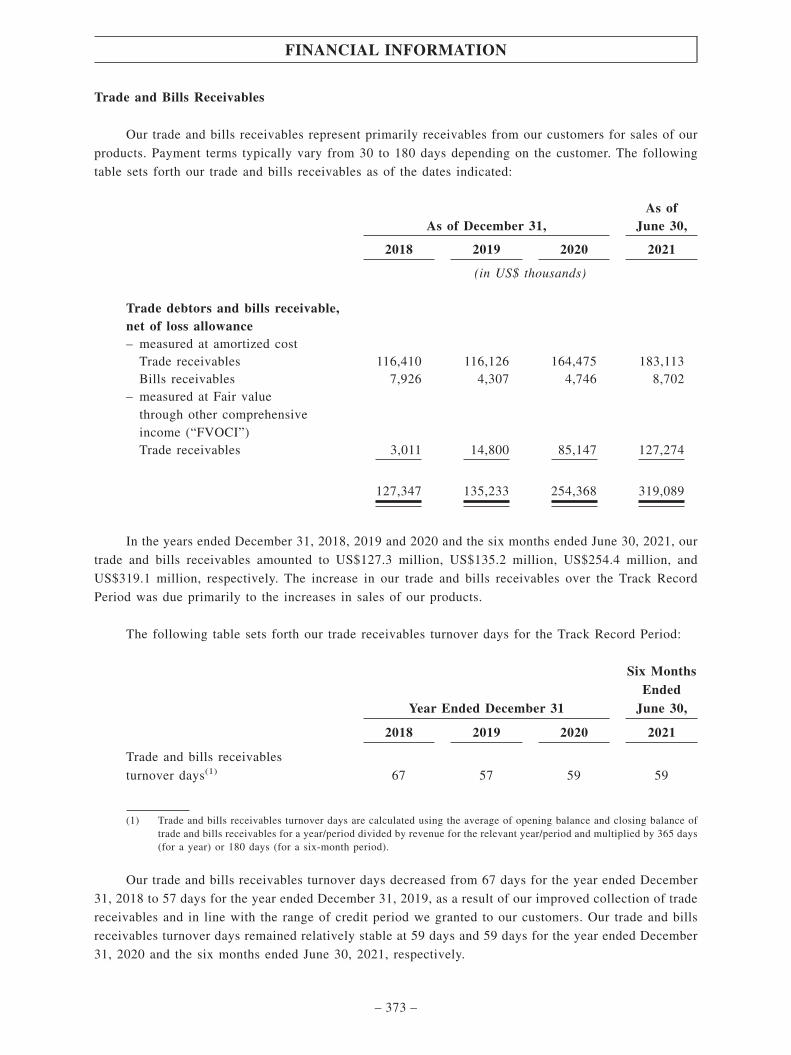
Trade and Bills Receivables
Our trade and bills receivables represent primarily receivables from our customers for sales of our
products. Payment terms typically vary from 30 to 180 days depending on the customer. The following
table sets forth our trade and bills receivables as of the dates indicated:
As of December 31,As of
June 30,
2018 2019 2020 2021
(in US$ thousands)
Trade debtors and bills receivable,net of loss allowance– measured at amortized cost
Trade receivables 116,410 116,126 164,475 183,113Bills receivables 7,926 4,307 4,746 8,702
– measured at Fair valuethrough other comprehensiveincome (“FVOCI”)Trade receivables 3,011 14,800 85,147 127,274
127,347 135,233 254,368 319,089
In the years ended December 31, 2018, 2019 and 2020 and the six months ended June 30, 2021, our
trade and bills receivables amounted to US$127.3 million, US$135.2 million, US$254.4 million, and
US$319.1 million, respectively. The increase in our trade and bills receivables over the Track Record
Period was due primarily to the increases in sales of our products.
The following table sets forth our trade receivables turnover days for the Track Record Period:
Year Ended December 31
Six MonthsEnded
June 30,
2018 2019 2020 2021
Trade and bills receivables
turnover days(1) 67 57 59 59
(1) Trade and bills receivables turnover days are calculated using the average of opening balance and closing balance oftrade and bills receivables for a year/period divided by revenue for the relevant year/period and multiplied by 365 days(for a year) or 180 days (for a six-month period).
Our trade and bills receivables turnover days decreased from 67 days for the year ended December
31, 2018 to 57 days for the year ended December 31, 2019, as a result of our improved collection of trade
receivables and in line with the range of credit period we granted to our customers. Our trade and bills
receivables turnover days remained relatively stable at 59 days and 59 days for the year ended December
31, 2020 and the six months ended June 30, 2021, respectively.
FINANCIAL INFORMATION
– 373 –

Aging Analysis
The following table sets out the aging analysis of trade and bills receivables, based on the invoice
date and net of loss allowance, as of the dates indicated:
As of December 31,As of
June 30,
2018 2019 2020 2021
(in US$ thousands)
Within 6 months 115,677 113,751 165,140 189,088Over 6 months but within 12 months 4,761 4,068 3,153 1,847Over 12 months 3,898 2,614 928 880
Total 124,336 120,433 169,221 191,815
As of October 31, 2021, US$288.9 million, or 90.5% of our total trade and bills receivables as of
June 30, 2021, had been settled subsequent to June 30, 2021.
Prepayments, Deposits and Other Receivables
Our prepayments, deposits and other receivables consist of (i) amount due from related parties, (ii)
value added tax recoverable, (iii) other tax recoverable, (iv) prepayments for materials and expenses, (v)
advances to employee and (vi) other deposits and receivables. The following table sets forth our
prepayments, deposits and other receivables as of the dates indicated:
As of December 31,As of
June 30,
2018 2019 2020 2021
(in US$ thousands)
CurrentAmount due from related parties 58 10,959 21,487 –Value added tax recoverable 9,296 6,881 10,633 11,274Other tax recoverable 319 449 478 1Prepayments for materials
and expenses 2,322 3,228 3,193 6,919Advances to employee 874 846 1,011 527Other deposits and receivables 8,644 6,644 4,616 4,223Less: loss allowance (63) (621) (1,248) (86)
Total current 21,450 28,386 40,170 22,858
FINANCIAL INFORMATION
– 374 –

During the Track Record Period, our prepayments, deposits and other receivables consisted primarilyof amount due from related parties, value added tax recoverable, prepayments for materials and expenses,advances to staff and other deposits and receivables. Current balances of prepayments, deposits and otherreceivables are expected to be recovered or recognized as expenses within one year.
Our prepayments, deposits and other receivables increased by 32.1% from US$21.5 million as ofDecember 31, 2018 to US$28.4 million as of December 31, 2019 primarily attributable to an increase inamount due from related parties of US$10.9 million, partially offset by a decrease in other deposits andreceivables of US$2.0 million.
Our prepayments, deposits and other receivables increased by 41.5% from US$28.4 million as ofDecember 31, 2019 to US$40.2 million as of December 31, 2020 primarily attributable to (i) an increasein value added tax recoverable of US$3.8 million and (ii) an increase in amount due from related partiesof US$10.5 million.
Our prepayments, deposits and other receivables decreased by 43.1% from US$40.2 million as ofDecember 31, 2020 to US$22.9 million as of June 30, 2021 primarily attributable to a decrease in amountdue from related parties of US$21.5 million, partially offset by an increase in prepayments for materialsand expenses of US$3.7 million.
As of October 31, 2021, US$7.3 million, or 25.4% of our prepayments, deposits and otherreceivables as of June 30, 2021, had been settled subsequent to June 30, 2021.
Trade and Bills Payables Analysis
The following table sets forth our trade and bills payables as of the dates indicated:
As of December 31,As of
June 30,
2018 2019 2020 2021
(in US$ thousands)
Trade payables 128,682 141,480 217,788 307,706Bills payables 10,201 22,328 29,741 42,985
Total 138,883 163,808 247,529 350,691
The following table sets forth our trade and other payables as of the dates indicated:
As of December 31,As of
June 30,
2018 2019 2020 2021
(in US$ thousands)
Within 3 months 121,256 149,286 216,913 310,9343 to 12 months 17,627 14,522 30,616 39,757
Total 138,883 163,808 247,529 350,691
FINANCIAL INFORMATION
– 375 –

Our trade and bill payables primarily consist of payables to our suppliers. All of our trade and billspayables are expected to be settled within one year. The increase in our trade payables throughout theTrack Record Period was in line with the growth of our business and particularly our production output.
The following table sets forth our trade and bills payables turnover days for the Track Record Period:
Year Ended December 31,
Six MonthsEnded
June 30,
2018 2019 2020 2021
Trade and bills payablesturnover days(1) 95 94 90 87
(1) Trade payables and bills turnover days are calculated using the average of opening balance and closing balance of tradeand bills payables for a year/period divided by cost of sales for the relevant year and multiplied by 365 days (for ayear) or 180 days (for a six-month period).
Our trade and bills payables turnover days remained relatively stable in 2018, 2019 and 2020. Ourtrade and bills payables turnover days decreased to 87 for the six months ended June 30, 2021, which wasprimarily due to the timing of settlement for trade and bill payables and therefore not comparable to annualfigures.
As of October 31, 2021, US$295.9 million, or 96.2% of our trade and bills payables as of June 30,2021, had been settled subsequent to June 30, 2021.
Other Payables and Accruals Analysis
The following table sets forth our other payables and accruals as of the dates indicated:
As of December 31,As of
June 30,
2018 2019 2020 2021
(in US$ thousands)
Amount due to related parties 5,949 15,198 8,251 2,441Other payables and accrued charges 29,761 41,847 78,357 131,932Salaries, wages, bonuses andbenefits payable 15,657 18,157 31,726 14,086Payables for purchase of properties,plants and equipment 878 2,666 2,849 1,828Interest payables 1,368 1,130 3,062 888Other tax payables 2,231 8,052 5,256 5,877Receipt in advance – leaseprepayment 655 841 636 509
Total 56,499 87,891 130,137 157,561
FINANCIAL INFORMATION
– 376 –

During the Track Record Period, we incur other payables and accruals in connection with various
aspects of our operations, including accruals for marketing and advertising fee, payroll expenses, utility
expenses, service fee and other expenses.
Our other payables and accruals increased by 21.1% from US$130.1 million as of December 31,
2020 to US$157.6 million as of June 30, 2021 primarily due to (i) an increase in other payables and
accrued charges of US$53.6 million mainly attributable to increases in marketing, promotion and
advertising expenses, as well as other relevant accrued charges in line with our increased product sales and
(ii) an increase in other tax payables of US$0.6 million, partially offset by (i) a decrease in salaries, wages,
bonuses and benefits payable of US$17.6 million and (ii) a decrease in amount due to related parties of
US$5.8 million.
Our other payables and accruals increased by 48.0% from US$87.9 million as of December 31, 2019
to US$130.1 million as of December 31, 2020 primarily due to (i) an increase in other payables and
accrued charges of US$36.5 million and (ii) an increase in salaries, wages, bonuses and benefits payable
of US$13.6 million, partially offset by (i) a decrease in amount to related parties of US$6.9 million and
(ii) a decrease in other tax payables of US$2.8 million.
Our other payables and accruals increased by 55.6% from US$56.5 million as of December 31, 2018
to US$87.9 million as of December 31, 2019 primarily due to (i) an increase in amount to related parties
of US$9.2 million and (ii) an increase in other payables and accrued charges of US$12.1 million and (iii)
an increase in other tax payables of US$5.8 million.
As of October 31, 2021, US$71.2 million, or 45.2% of our other payables and accruals as of June
30, 2021, had been settled subsequent to June 30, 2021.
OFF-BALANCE SHEET ARRANGEMENTS
We have not entered into, nor do we expect to enter into, any off-balance sheet arrangements.
Furthermore, we do not have any retained or contingent interest in assets transferred to an unconsolidated
entity that serve as credit, liquidity or market risk support to such entity. We do not have any variable
interest in any unconsolidated entity that provides financing, liquidity, market risk or credit support to us
or that engages in leasing, hedging or research and development services with us.
CONTINGENT LIABILITIES
During the Track Record Period, we provided guarantees in respect of certain loans made by
financial institutions in the PRC to Chervon Auto Precision Technology. We provide such guarantees for
Chervon Auto Precision Technology for the primary purposes of (i) facilitating access to bank credit
amidst a period of rapid growth of Chervon Auto Precision Technology and (ii) reducing transaction costs
because guarantees by external financial services providers typically involved higher costs. As of June 30,
2021, the guarantees to Chervon Auto Precision Technology have been released.
FINANCIAL INFORMATION
– 377 –

During the Track Record Period, some of our subsidiaries also provided guarantees to financial
institutions in the PRC for certain indebtedness of our independent third-party customers. We provided
such guarantees to third-party customers, which are typically qualified distributors of ours in the PRC,
primarily to enhance access to credit by these distributors, which in turn supported our revenue growth.
We believe that credit risks arising from such guarantees can be mitigated for the following reasons: (i)
we provided guarantees only to qualified distributors that have established stable relationships with us; (ii)
we had familiarity with the financial, operational and reputational aspects of these distributors; and (iii)
we required that the proceeds from the guaranteed loans must be primarily used for purchasing goods from
us. As of December 31, 2018, 2019 and 2020 and June 30, 2021, the maximum guarantee amount to
third-party customers was US$0.9 million, US$1.0 million, US$9.8 million and US$9.9 million,
respectively. For more details, please refer to Note 39 to the Accountants’ Report set forth in Appendix
I of this prospectus. During the Track Record Period, we did not have any loans made to independent
third-party customers.
RELATED PARTY TRANSACTIONS
For a discussion of related party transactions, see Note 40 to the Accountants’ Report set out in
Appendix I to this prospectus.
On August 3, 2021, Chervon Auto Precision Technology announced that it has obtained approval
from the CSRC to issue public A-share convertible bonds in an aggregate principal amount of RMB620
million (US$97.3 million) with a maturity date on the sixth year after the date of issuance. Pursuant to the
terms of the convertible bond offering, an existing shareholder of Chervon Auto Precision Technology has
pre-emptive rights to subscribe for the convertible bonds in an amount up to the proportional interests of
such shareholder in Chervon Auto Precision Technology. Chervon (China) Investment, which is our
wholly-owned subsidiary and owns 23.12% of Chervon Auto Precision Technology, has exercised and paid
for such pre-emptive rights to subscribe for RMB118.5 million (US$18.6 million) of the principal amount
of the convertible bond. As the convertible bonds may not be converted for a period of six months from
the date of completion, Chervon (China) Investment cannot and does not intend to convert such
convertible bonds before the completion of the Global Offering.
Our Directors confirm that other than the amounts due to related parties, the related party
transactions were carried out on an arm’s length basis and did not cause any distortion of our results of
operations or make our historical results not reflective of our performance during the Track Record Period.
Our Directors confirm that although the amounts due to related parties are unsecured and interest
free, these amounts arose primarily as a result of the Restructuring and did not cause any distortion of our
results of operations or make our historical results not reflective of our performance during the Track
Record Period.
As of June 30, 2021, we had US$6.1 million in net settlement of amounts due from and due to related
parties. The amounts due from and to related parties were non-trade in nature. We expect all such amounts
to be fully repaid and settled prior to the Global Offering.
FINANCIAL INFORMATION
– 378 –

NO OTHER OUTSTANDING INDEBTEDNESS
Save as disclosed in “– Indebtedness”, we did not have outstanding indebtedness or any loan capital
issued and outstanding or agreed to be issued, bank overdrafts, loans or similar indebtedness, liabilities
under acceptances (other than normal trade bills), acceptance credits, debentures, mortgages, charges,
finance leases or hire purchase commitments, guarantees or other contingent liabilities or any covenant in
connection therewith as of June 30, 2021, being our indebtedness statement date. After due and careful
consideration, our Directors confirm that, up to the Latest Practicable Date, there has been no material
adverse change in our indebtedness since June 30, 2021.
QUANTITATIVE AND QUALITATIVE DISCLOSURES ABOUT MARKET RISK
We are exposed to a variety of market risks including credit risk and liquidity risk in the normal
course of our business. We manage and monitor these exposures to ensure appropriate measures are
implemented on a timely and effective manner. For details of the risks to which we are exposed, see Note
37 to the Accountants’ Report set out in Appendix I in this prospectus.
LISTING EXPENSES
Assuming an Offer Price of HK$40.60 per Share (being the mid-point of the proposed Offer Price
range) and that the Over-allotment Option is not exercised, our total listing expenses are estimated to be
HK$170.3 million, representing approximately 5.8% of the gross proceeds from the Global Offering. The
estimated listing expenses consist of (i) underwriting-related expenses (including underwriting fees and
commissions) of HK$109.5 million, (ii) fees and expenses of legal advisers and accountants of HK$47.8
million and (iii) other fees and expenses of HK$13.0 million. HK$2.1 million and HK$16.5 million have
been recognized as administrative expenses in our consolidated statements of profit or loss for the year
ended December 31, 2020 and six months ended June 30, 2021 and after the Track Record Period,
respectively, and HK$151.7 million is expected to be accounted for as a deduction from equity directly
upon Listing. The listing expenses above are the latest practicable estimate for reference only, and the
actual amounts may differ from this estimate. Our Directors do not expect such expenses to have a material
and adverse impact on our financial results in 2021.
DIVIDEND POLICY
We have adopted a general annual dividend policy of declaring and paying dividends on an annual
basis of no less than 20% of our total net profit attributable to us for any particular year. Assuming the
Listing occurs in 2021, 2022 will be the first year for which our total net profit attributable to us will be
used for purposes of declaring and paying dividends in accordance with the aforementioned general annual
dividend policy.
FINANCIAL INFORMATION
– 379 –

The declaration of dividends is subject to the discretion of our Directors, and, if necessary, the
approval of our Shareholders. A decision to declare or to pay any dividends and the amount of any
dividends will depend on various factors, including but not limited to our results of operations, cash flows
and financial conditions, operating and capital expenditure requirements, distributable profits as
determined under applicable laws, our Articles of Association, market conditions, our strategic plans and
prospects for business development, contractual limits and obligations, payment of dividends to us by our
operating subsidiaries, taxation, and any other factors determined by our Board of Directors from time to
time to be relevant to the declaration of dividend payments. Our future declarations of dividends may or
may not reflect our historical declarations of dividends. In addition, our Directors may reassess our
dividend policy in the future.
We may distribute dividends by way of cash or by other means that we consider appropriate. We are
a holding company incorporated in Hong Kong. Our ability to pay dividends depends substantially on the
payment of dividends to us by our subsidiaries in China. In particular, each of our PRC subsidiaries may
pay dividends only out of its accumulated distributable profits, if any, determined in accordance with its
articles of association, and the accounting standards and regulations in China. Moreover, pursuant to
relevant PRC laws and regulations applicable to our subsidiaries in China, each of our PRC subsidiaries
is required to set aside a certain amount of its accumulated after tax profits each year, if any, to fund
statutory reserves. These reserves may not be distributed as cash dividends. Furthermore, if we or any of
our subsidiaries incur debt on our or its own behalf in the future, the instruments governing the debt may
restrict our or their ability to pay dividends or make other payments to our Shareholders or to us.
On December 1, 2018, July 1, 2020 and January 31, 2021, the Board approved certain dividends, and
the dividends payable to equity shareholders were US$4.5 million, nil, US$3.7 million and US$15.0
million during the years ended December 31, 2018, 2019 and 2020 and the six months ended June 30,
2021, respectively. As of the Latest Practicable Date, the approved dividends have been paid. Dividends
declared in the past are not indicative of our future dividend policy.
DISTRIBUTABLE RESERVES
As of December 31, 2018, 2019, 2020 and the six months ended June 30, 2021, our reserves available
for distribution represented retained earnings of the Company, which amounted to US$80.4 million,
US$110.3 million, US$147.0 million and US$218.1 million, respectively.
NO MATERIAL ADVERSE CHANGE
After due and careful consideration, our Directors confirm that, up to the date of this prospectus,
there has been no material adverse change in our financial and trading position or prospects since June 30,
2021, and there is no event since June 30, 2021 which would materially affect the information shown in
the Accountants’ Report, the text of which is set out in Appendix I to this prospectus. Please refer to the
section headed “Summary – Recent Development” for information relating to our operations and financial
performance subsequent to the Track Record Period.
FINANCIAL INFORMATION
– 380 –

UNAUDITED PRO FORMA ADJUSTED NET TANGIBLE ASSETS
The following unaudited pro forma statement of adjusted net tangible assets of our Group is prepared
in accordance with Rule 4.29 of the Listing Rules and is set out below for the purpose to illustrate the
effect of the Global Offering on the consolidated net tangible assets attributable to equity shareholders of
the Company as of June 30, 2021 as if it had taken place on June 30, 2021.
The statement of unaudited pro forma adjusted net tangible assets has been prepared for illustrative
purpose only and because of its hypothetical nature, it may not give a true picture of the financial position
of the Group had the Global Offering been completed as of June 30, 2021 or at any future date.
Consolidatednet tangible
assetsattributable to
the equityshareholders ofthe Companyas of June 30,
2021(1)
Estimated netproceeds from
this GlobalOffering(2)(4)
Unaudited proforma adjusted
net tangibleassets
attributable tothe equity
shareholders ofthe Company
Unaudited pro formaadjusted net tangibleassets attributable to
the equityshareholders of theCompany per Share
(US$’000) (US$’000) (US$’000) US$(3) HK$(4)
Based on an
Offer Price of
HK$37.60
per Share 337,317 327,373 664,690 1.39 10.81
Based on an
Offer Price of
HK$43.60
per Share 337,317 382,717 720,034 1.50 11.71
Notes:
(1) The consolidated net tangible assets attributable to equity shareholders of the Company as of June 30, 2021 iscalculated based on the audited consolidated total equity attributable to the equity shareholders of the Company ofUS$338,922,000 less the intangible assets of US$1,605,000 as at that date, as shown in the Accountant’s Report, thetext of which is set out in Appendix I to this Prospectus.
(2) The estimated net proceeds from this Global Offering are based on the expected issuance of 71,916,000 shares and theindicative Offer Prices of HK$37.60 and HK$43.60 per Share, respectively, being the lower end price and higher endprice of the stated Offer Price range, after deduction of the estimated underwriting fees and other estimated relatedexpenses payable of the Group of US$14.0 million and US$5.4 million respectively (excluding approximately US$2.4million listing expenses which have been accounted for prior to June 30, 2021) and does not take into account of anyshares which may be issued upon the exercise of the Over-allotment Option.
(3) The unaudited pro forma adjusted net tangible assets attributable to the equity shareholders of the Company per Shareis arrived after the above adjustment and on the basis that a total of 479,431,411 shares are in issue following thecompletion of the Global Offering assuming the Global Offering had been completed on June 30, 2021 without takinginto account of any Shares which may be issued upon the exercise of the Over-allotment Option.
FINANCIAL INFORMATION
– 381 –

(4) For illustrative purpose, the estimated net proceeds from the Global Offering is converted from the Hong Kong dollarinto United States dollar and the unaudited pro forma adjusted net tangible assets attributable to the equity shareholdersof the Company per Share is converted from United States dollar into Hong Kong dollar at the exchange rate of HK$1to US$0.1283, being the prevailing exchange rate by PBOC at the December 6, 2021. No representation is made thatthe Hong Kong Dollars amounts have been, could have been or may be converted to United States dollar, or vice versa,at that rate.
(5) No adjustment has been made to the unaudited pro forma adjusted net tangible assets attributable to equity shareholderof the Company to reflect any trading results or other transactions entered into subsequent to June 30, 2021.
DISCLOSURE REQUIRED UNDER THE LISTING RULES
As of the Latest Practicable Date, our Directors confirmed that there are no circumstances that will
give rise to a disclosure requirement under Rules 13.13 to 13.19 of the Listing Rules.
NO SIGNIFICANT INTERRUPTIONS
Our Directors confirm that there have been no interruptions in our business that may have a material
adverse effect on our financial position and results of operations in the 12 months period prior to the Latest
Practicable Date.
FINANCIAL INFORMATION
– 382 –

FUTURE PLANS
For further details of our future plans, please see the sections headed “Business – Our Strategies”and “Business – Production – Production Expansion Plan” in this prospectus.
USE OF PROCEEDS
We estimate the net proceeds of the Global Offering which we will receive, assuming an Offer Priceof HK$40.60 per Offer Share (being the mid-point of the Offer Price range stated in this prospectus), willbe approximately HK$2,749.5 million, after deduction of underwriting fees and commissions andestimated expenses payable by us in connection with the Global Offering and assuming the Over-allotmentOption is not exercised.
In line with our strategies, we intend to use our proceeds from the Global Offering for the followingpurposes assuming the Offer Price is fixed at HK$40.60 per Offer Share (being the mid-point of theindicative Offer Price range):
• Approximately 66.5%, or HK$1,829.7 million (US$234.7 million), will be used to expand andupgrade our production facilities in China including:
i. HK$1,602.2 million (US$205.5 million) for our CHERVON Smart Production IndustrialPark (泉峰智能製造產業園), including US$84.2 million (HK$656.5 million) forpurchasing and installing machinery and equipment;
• We intend to construct our CHERVON Smart Production Industrial Park with a totalestimated investment amount of approximately US$465.6 million (RMB2,965.8million), which is scheduled to commence operations in 2024. With the productionfacility coming into operation, we expect to see a decrease in our averageproduction cost per unit and an increase in our capacity by approximately 10.4million units. The facility will cover a gross floor area of approximately 402,355sq.m., and have 164 production lines that cover motors, injection molding and arange of lithium-ion battery powered products, such as hand-held power tools,riding mowers, walk-behind mowers and bench tools. The production facility willbe equipped with smart production lines, automated warehouses and logistics andadvanced IT systems such as ERP, MES and WMS.
• Set forth below is a breakdown of the amount of proceeds from the Global Offeringthat we intend to use for the CHERVON Smart Production Industrial Park in eachrelevant year:
o Year 2022: (i) US$14.7 million will be used for constructing the facility, (ii)US$15.8 million will be used for purchasing and installing machinery andequipment and (iii) US$21.6 million will be used for acquiring land use rights.
o Year 2023: (i) US$29.4 million will be used for constructing the facility and(ii) US$31.6 million will be used for purchasing and installing machinery andequipment.
FUTURE PLANS AND USE OF PROCEEDS
– 383 –
o Year 2024: (i) US$55.6 million will be used for constructing the facility and
(ii) US$36.7 million will be used for purchasing and installing machinery and
equipment.
ii. HK$227.5 million (US$29.2 million) for our CHERVON Green Power Industrial Park
Phase II production facility (泉峰新能源工業園II期), including US$12.3 million
(HK$95.9 million) for purchasing and installing machinery and equipment.
• CHERVON Green Power Industrial Park Phase II will cover a gross floor area of
approximately 152,074 sq.m. This facility will cost an estimated total of
approximately US$125.6 million (RMB800.0 million), which is scheduled to
commence operations in 2023. This facility is expected to further increase our
production capacity by approximately 12.0 million units on an annual basis.
CHERVON Green Power Industrial Park Phase II will produce both power tools and
OPE products.
• Set forth below is a breakdown of the amount of proceeds from the Global Offering
that we intend to use for the CHERVON Green Power Industrial Park Phase II in
each relevant year:
o Year 2022: (i) US$11.5 million will be used for constructing the facility and
(ii) US$7.0 million will be used for purchasing and installing machinery and
equipment.
o Year 2023: (i) US$5.4 million will be used for constructing the facility and (ii)
US$5.3 million will be used for purchasing and installing machinery and
equipment.
For details of our expansion plans, please see the sections headed “Business – Production –
Production Expansion Plan” in this prospectus.
We develop production expansion plans based on, among other things, (i) estimated supply and
demand for relevant products; (ii) prevailing and anticipated prices for relevant products; (iii)
utilization of existing manufacturing facilities and feasibility for expanding existing facilities;
(iv) estimated cost of development; and (v) availability and cost of capital resources. Please
refer to the section headed “Business – Production – Existing Production Facilities” for further
details regarding our existing production facilities. Although our customers’ purchases are
made on a purchase order basis, we have partnered with our existing customers from product
design through product development to the final delivery of our products. We have collaborated
with them on product planning and developed long-term relationships. Our production
expansion plan is primarily based on our understandings of business plans, product planning,
potential demands for existing and new products and expected orders from these customers in
the coming years. Such close partnerships and communications enable us to anticipate, identify
and react to the market trends and understand customers’ demands so as to facilitate our overall
strategy formulation and planning, and to capture growth opportunities in different segments
of the market.
FUTURE PLANS AND USE OF PROCEEDS
– 384 –

With our own production facilities, we have more flexibility to tailor the design of the facilities
to our use, upgrade the facilities or install new equipment. Further, we can avoid rent increases,
and we would not need to spend time and effort on finding new suitable leased properties and
incur expensive relocation costs when leases expire or are terminated. We can also save costs
associated with logistics and transportation due to the geographic proximity of the planned
production facilities to our existing facilities in Nanjing.
We believe that there will be sufficient market demand to support our expansion plan based on
several reasons, including (i) the global cordless power tool market and global cordless OPE
market by revenue are estimated by Frost & Sullivan to increase at a CAGR of 9.9% and 9.0%
from 2020 to 2025, respectively; (ii) during the Track Record Period, our revenue for power
tools grew at a CAGR of 16.9% and our revenue for OPE products grew at a CAGR of 62.8%
from 2018 to 2020; and (iii) the COVID-19 pandemic has not had a material adverse effect on
the demand from our customers and end users. With the large scale of our new production
bases, we will be able to fulfill customer demand and the needs of our rapid business growth.
There is no guarantee that any of the expansion projects will proceed as planned. We may also
invest in additional expansion projects as we continue to grow our business worldwide.
• Approximately 9.0%, or HK$247.4 million (US$31.7 million), will be used for research and
development of our products, including (i) US$22.1 million (HK$172.7 million) for the
compensation of additional research and development staff, including in the areas of advanced
BMS, high-power vector electric control, intelligent parameter identification, robotics, AI and
IoT and (ii) US$9.6 million (HK$74.7 million) for other research and development costs, such
as purchasing and upgrading research and development equipment, as well as purchasing
research and development materials and consumables. In particular, we plan to increase the
power and longevity of our battery platforms and further reducing weight and noise levels of
our electric power tools. We will also seek to make our battery platforms compatible across a
wider range of electric power tools and OPE products. We will also develop and offer
IoT-enabled products to improve user convenience. We expect to hire approximately 15
additional research and development employees with the requisite experience and
qualifications in each of year 2022, 2023 and 2024, representing a total increase of
approximately 45 employees. The annual salaries for each additional research and development
employee will generally range from RMB350,000 to RMB600,000.
• Approximately 7.0%, or HK$191.9 million (US$24.6 million), will be used for enhancing sales
and distribution channels, including (i) US$2.4 million (HK$18.5 million) for the
compensation of additional sales and marketing staff and (ii) US$22.2 million (HK$173.4
million) for advertising and promotional activities in key markets such as North America,
Europe and China. We will further develop our multi-channel sales and distribution strategy
and promote our products and brands through different channels, including online
advertisements and other targeted marketing campaigns. We will enhance our sales and
distribution channels primarily through hiring talents and deepening our relationships with
qualified retailers and distributors. We expect to hire approximately 8 additional sales and
marketing employees with the requisite experience and qualifications in each of year 2022,
2023 and 2024, representing a total increase of approximately 23 employees. The annual
salaries for each additional employee will be approximately RMB300,000.
FUTURE PLANS AND USE OF PROCEEDS
– 385 –

• Approximately 7.5%, or RMB170.9 million (HK$205.6 million), will be used to payinterest-bearing bank borrowings (which were generally used for working capital purposes),among which:
i. Approximately 5.9%, or RMB134.5 million (HK$161.7 million), will be used to partiallyrepay RMB236.0 million of borrowings from the Export-Import Bank of China (中國進出口銀行). As of June 30, 2021, our borrowings from the Export-Import Bank of Chinabore an effective interest rate of 3.4%, with maturities up to March 16, 2022.
ii. Approximately 0.2%, or RMB5.7 million (HK$6.9 million), will be used to partiallyrepay RMB10.0 million of borrowings from Ping An Bank (平安銀行). As of June 30,2021, our borrowings from Ping An Bank bore an effective interest rate of 4.50%, withmaturities up to January 5, 2022.
iii. Approximately 0.5%, or RMB10.8 million (HK$13.0 million), will be used to partiallyrepay RMB19.0 million of borrowings from Jiangsu Zijin Rural Commercial Bank (江蘇紫金農村商業銀行). As of June 30, 2021, our borrowings from Jiangsu Zijin RuralCommercial Bank bore an effective interest rate of 4.35%, with maturities up to March18, 2022.
iv. Approximately 0.4%, or RMB8.5 million (HK$10.3 million), will be used to partiallyrepay RMB15.0 million of borrowings from Bank of China (中國銀行). As of June 30,2021, our borrowings from Bank of China bore an effective interest rate of 4.10%, withmaturities up to March 2, 2022.
v. Approximately 0.5%, or RMB11.4 million (HK$13.7 million), will be used to partiallyrepay RMB20 million of borrowings from Bank of Jiangsu (江蘇銀行). As of June 30,2021, our borrowings from Bank of Jiangsu bore an effective interest rate of 4.36%, withmaturities up to January 27, 2022.
• Approximately 10.0%, or HK$274.9 million (US$35.3 million), will be used for workingcapital and other general corporate purposes.
Except for the amount of HK$205.6 million that we expect to use to repay interest-bearing bankborrowings, the allocation of the proceeds outlined above will be adjusted on a pro rata basis in the eventthat the Offer Price is fixed at a higher level or lower level compared to the mid-point of the estimatedoffer price range or the Over-allotment Option is exercised. If the Offer Price is fixed at a higher levelcompared to the mid-point of the estimated offer price range or the Over-allotment Option is exercised,not more than 10% of the net proceeds will be used for working capital and other general corporatepurposes.
Assuming an Offer Price of HK$37.60 per Offer Share (being the low end of the Offer Price rangestated in this prospectus), we estimate that (i) the gross proceeds of the Global Offering that we willreceive will be approximately HK$2,704.0 million, and (ii) the net proceeds of the Global Offering thatwe will receive, after deduction of underwriting fees and commissions and estimated expenses payable byus in connection with the Global Offering, will be approximately HK$2,541.9 million.
To the extent that the net proceeds are not immediately applied to the above purposes and to theextent permitted by applicable law and regulations, we currently intend to deposit the net proceeds onlyinto short-term interest-bearing deposits in licensed banks and/or financial institutions. We will make anappropriate announcement if there is any change to the above proposed use of proceeds or if any amountof the proceeds will be used for general corporate purpose.
FUTURE PLANS AND USE OF PROCEEDS
– 386 –

HONG KONG UNDERWRITERS
China International Capital Corporation Hong Kong Securities Limited
Citigroup Global Markets Asia Limited
The Hongkong and Shanghai Banking Corporation Limited
BOCOM International Securities Limited
CMB International Capital Limited
UNDERWRITING
This prospectus is published solely in connection with the Hong Kong Public Offering. The Hong
Kong Public Offering is fully underwritten by the Hong Kong Underwriters on a conditional basis. The
International Offering is expected to be fully underwritten by the International Underwriters. If, for any
reason, the Offer Price is not agreed between the Joint Representatives (on behalf of the Underwriters) and
our Company, the Global Offering will not proceed and will lapse.
The Global Offering comprises the Hong Kong Public Offering of initially 7,191,600 Hong Kong
Offer Shares and the International Offering of initially 64,724,400 International Offer Shares, subject, in
each case, to reallocation on the basis as described in the section headed “Structure of the Global Offering”
in this prospectus as well as to the Over-allotment Option (in the case of the International Offering).
UNDERWRITING ARRANGEMENTS AND EXPENSES
Hong Kong Public Offering
Hong Kong Underwriting Agreement
Pursuant to the Hong Kong Underwriting Agreement, our Company is offering the Hong Kong Offer
Shares for subscription on the terms and conditions set out in this prospectus, the GREEN Application
Form and the Hong Kong Underwriting Agreement at the Offer Price.
Subject to (a) the Listing Committee granting approval for the listing of, and permission to deal in,
the Shares to be offered pursuant to the Global Offering (including any additional Shares that may be
issued pursuant to the exercise of the Over-allotment Option) on the Main Board of the Stock Exchange
and such approval not subsequently having been revoked prior to the commencement of trading of the
Shares on the Stock Exchange and (b) certain other conditions set out in the Hong Kong Underwriting
Agreement, the Hong Kong Underwriters have agreed severally but not jointly to procure subscribers for,
or themselves to subscribe for, their respective applicable proportions of the Hong Kong Offer Shares
being offered which are not taken up under the Hong Kong Public Offering on the terms and conditions
set out in this prospectus, the GREEN Application Form and the Hong Kong Underwriting Agreement.
The Hong Kong Underwriting Agreement is conditional on, among other things, the International
Underwriting Agreement having been executed and becoming unconditional and not having been
terminated in accordance with its terms.
UNDERWRITING
– 387 –

Grounds for Termination
The Joint Representatives (for themselves and on behalf of the Hong Kong Underwriters) may in
their absolute discretion and upon giving notice in writing to our Company terminate the Hong Kong
Underwriting Agreement with immediate effect if any of the following events shall occur prior to 8:00 a.m.
on the Listing Date:
(a) there shall develop, occur, exist or come into effect:
(i) any local, national, regional or international event, or series of events or circumstances,
in the nature of force majeure (including any acts of government, declaration of a
national, regional or international emergency or war, calamity, crisis, epidemic,
pandemic, outbreak of diseases, escalation or adverse mutation of disease, economic
sanctions, strikes, lock-outs, fire, explosion, flooding, earthquake volcanic eruption, civil
commotion, riots, public disorder, acts of war, outbreak or escalation of hostilities
(whether or not war is declared), acts of God, acts of terrorism) in or affecting Hong
Kong, the PRC, the United States, the United Kingdom, Vietnam, Canada, Australia, the
European Union (or any member thereof) (each a “Relevant Jurisdiction” and
collectively, the “Relevant Jurisdictions”); or
(ii) any change or development involving a prospective change or any event or circumstances
likely to result in any change or development involving a prospective change in any local,
national, regional or international financial, economic, political, military, industrial,
fiscal, regulatory, currency, credit or market conditions (including conditions in the stock
and bond markets, money and foreign exchange markets, the interbank markets and credit
markets) in or affecting any Relevant Jurisdictions; or
(iii) any moratorium, suspension or restriction (including any imposition of or requirement for
any minimum or maximum price limit or price range) in or on trading in securities
generally on the Stock Exchange, the New York Stock Exchange, the NASDAQ Global
Market, the London Stock Exchange, the Shanghai Stock Exchange or the Shenzhen
Stock Exchange; or
(iv) any general moratorium on commercial banking activities in Hong Kong (imposed by the
Financial Secretary or the Hong Kong Monetary Authority or other competent Authority),
New York (imposed at the U.S. Federal or New York State level or by any other
competent authority), London, the PRC, the European Union (or any member thereof) or
any other Relevant Jurisdictions or any disruption in commercial banking or foreign
exchange trading or securities settlement or clearance services, procedures or matters in
any Relevant Jurisdictions; or
(v) any new law or any change or development involving a prospective change in existing
laws or any change or development involving a prospective change in the interpretation
or application thereof by any court or other competent governmental Authority in or
affecting any of the Relevant Jurisdictions; or
(vi) the imposition of economic sanctions under any sanctions laws in any of the Relevant
Jurisdictions; or
UNDERWRITING
– 388 –

(vii) any change or development involving a prospective change in or affecting taxation or
foreign exchange control, currency exchange rates or foreign investment regulations
(including a material devaluation of the Hong Kong dollar or RMB against any foreign
currencies), or the implementation of any exchange control, in any of the Relevant
Jurisdictions; or
(viii) other than with the prior written consent of the Joint Representatives, the issue or
requirement to issue by our Company of a supplement or amendment to this prospectus,
the GREEN Application Form or other documents issued or used in connection with the
offer and sale of the Offer Shares pursuant to the Companies (Winding Up and
Miscellaneous Provisions) Ordinance or the Listing Rules or upon any requirement or
request of the Stock Exchange and/or the SFC; or
(ix) any order or petition for the winding up or liquidation of any member of the Group or any
composition or arrangement made by any member of the Group with its creditors or a
scheme of arrangement entered into by any member of the Group or any resolution for the
winding-up of any member of the Group or the appointment of a provisional liquidator,
receiver or manager over all or part of the assets or undertaking of any member of the
Group or anything analogous thereto occurring in respect of any member of the Group;
or
(x) any litigation, legal action, claim of any third party or regulatory, investigation being
threatened, instigated, or announced against any member of the Group or any of the
Controlling Shareholders; or
(xi) any change or development involving a prospectus change in, or a materialization of, any
of the risks set out in the section headed “Risk Factors” in this prospectus; or
(xii) save as disclosed in this prospectus, any contravention by any member of the Group of
any applicable laws or the Listing Rules; or
(xiii) any non-compliance of this prospectus (or any other documents used in connection with
the contemplated offer of the Shares) or any aspect of the Global Offering with the Listing
Rules or any other applicable laws; or
(xiv) any Director being charged with an indictable offence or prohibited by operation of law
or otherwise disqualified from taking part in the management or taking directorship of a
company, or being subject to any disciplinary proceedings by or before any authority in
any Relevant Jurisdiction; or
(xv) the chief executive officer or the chief financial officer of our Company vacating his
office; or
(xvi) an authority in any Relevant Jurisdiction commencing any investigation or other action,
or announcing an intention to investigate or take other action, against any Director,
UNDERWRITING
– 389 –

which, individually or in the aggregate, in the sole opinion of the Joint Representatives (for
themselves and on behalf of the Hong Kong Underwriters) (1) has or will or is likely to result
in a material adverse change, or any development involving a prospective material adverse
change, in or affecting the assets, liabilities, business, general affairs, management, prospects,
shareholders’ equity, profits, losses, results of operations, position or condition, financial or
otherwise, or performance of the Group, taken as a whole; or (2) has or will have or is likely
to have a material adverse effect on the success of the Global Offering or the level of
applications under the Hong Kong Public Offering or the level of interest under the
International Offering; or (3) makes or will make or is likely to make it inadvisable,
inexpedient or impracticable for the Global Offering to proceed or to market the Global
Offering; or (4) has or will or is likely to have the effect of making any part of the Hong Kong
Underwriting Agreement (including underwriting) incapable of performance in accordance
with its terms or preventing the processing of applications and/or payments pursuant to the
Global Offering or pursuant to the underwriting thereof; or
(b) there has come to the notice of any of the Joint Representatives that:
(i) any statement contained in any of this prospectus, the GREEN Application Form and/or
in any notices, announcements, advertisements, communications or other documents
issued or used by or on behalf of our Company in connection with the Hong Kong Public
Offering (collectively, the “Offer Related Documents”) (including any supplement or
amendment thereto) but excluding information relating to the Hong Kong Underwriters
and the International Underwriters) was, when it was issued, or has become, untrue,
inaccurate or misleading in any material respect, or that any estimate, forecast, expression
of opinion, intention or expectation contained in any of the Offer Related Documents
(including any supplement or amendment thereto) is not fair and honest and based on
reasonable assumptions; or
(ii) any matter has arisen or has been discovered which would, had it arisen or been
discovered immediately before the date of this prospectus, constitute a material
misstatement in, or a material omission from any of the Offer Related Documents
(including any supplement or amendment thereto); or
(iii) any breach of, or any event or circumstance rendering untrue or incorrect or misleading
in any respect, any of the warranties given by our Company or any of the Controlling
Shareholders pursuant to the Hong Kong Underwriting Agreement or the International
Underwriting Agreement; or
(iv) any material breach of any of the obligations imposed upon our Company or the
Controlling Shareholders under the Hong Kong Underwriting Agreement or the
International Underwriting Agreement (including any supplement or amendment thereto),
as applicable; or
(v) any material adverse change, or any development involving a prospective material
adverse change, in or affecting the assets, liabilities, business, general affairs,
management, prospects, shareholders’ equity, profits, losses, results of operations,
position or condition, financial or otherwise, or performance of the Group, taken as a
whole; or
UNDERWRITING
– 390 –
(vi) the approval by the Listing Committee of the Stock Exchange of the listing of, and
permission to deal in, the Shares in issue and to be issued pursuant to the Global Offering
(including pursuant to any exercise of the Over-allotment Option) is refused or not
granted, on or before the Listing Date, or if granted, the approval is subsequently
withdrawn, qualified (other than by customary conditions), revoked or withheld; or
(vii) any person (other than any of the Joint Sponsors) has withdrawn its consent to being
named in this prospectus or to the issue of any of this prospectus and the GREENApplication Form; or
(viii) our Company withdraws this prospectus, the GREEN Application Form or the Global
Offering; or
(ix) there is a prohibition on our Company for whatever reason from offering, allotting,
issuing or selling any of the Offer Shares pursuant to the terms of the Global Offering.
Undertakings to the Stock Exchange pursuant to the Listing Rules
Undertakings by our Company
Pursuant to Rule 10.08 of the Listing Rules, our Company has undertaken to the Stock Exchange that
it will not issue any further Shares, or securities convertible into equity securities of our Company
(whether or not of a class already listed) or enter into any agreement to such an issue within six months
from the Listing Date (whether or not such issue of Shares or securities will be completed within six
months from the Listing Date), except (a) pursuant to the Global Offering and the Over-allotment Option,
(b) upon the exercise of the options granted, or (c) under any of the circumstances provided under Rule
10.08 of the Listing Rules.
Undertakings by the Controlling Shareholders
Pursuant to Rule 10.07(1) of the Listing Rules, each of the Controlling Shareholders has irrevocably
and unconditionally undertaken to the Stock Exchange and our Company that, except in compliance with
the requirements of the Listing Rules, he/it will not and will procure that the relevant registered holder(s)
will not, either directly or indirectly:
(a) in the period commencing on the date by reference to which disclosure of his/her shareholding
in our Company is made in this prospectus and ending on the date which is six months from
the Listing Date (the “First Six-Month Period”), dispose of, nor enter into any agreement to
dispose of or otherwise create any options, rights, interests or encumbrances in respect of any
of the securities of our Company in respect of which he/it is shown in this prospectus to be the
beneficial owner(s); and
(b) in the period of six months commencing on the date on which the First Six-Month Period
expires (the “Second Six-Month Period”), dispose of, nor enter into any agreement to dispose
of or otherwise create any options, rights, interests or encumbrances in respect of any of the
securities referred to in paragraph (a) above if, immediately following such disposal or upon
the exercise or enforcement of such options, rights, interests or encumbrances, he/it would
cease to be a controlling shareholder (as defined in the Listing Rules) of our Company.
UNDERWRITING
– 391 –

Pursuant to Note 3 to Rule 10.07(2) of the Listing Rules, each of the Controlling Shareholders has
irrevocably and unconditionally undertaken to the Stock Exchange and our Company that, within the
period commencing on the date by reference to which disclosure of his/her shareholding in our Company
is made in this prospectus and ending on the date which is twelve months from the Listing Date, he/it will
and will procure that the relevant registered holder(s) will:
(a) when he/it pledges or charges any securities of our Company beneficially owned by him/her in
favor of an authorized institution (as defined in the Banking Ordinance (Chapter 155 of the
Laws of Hong Kong)) pursuant to Note (2) to Rule 10.07(2) of the Listing Rules, immediately
inform our Company of such pledge/charge together with the number of the securities so
pledged or charged; and
(b) when he/it receives any indication, either verbal or written, from the pledgee or chargee that
any of the pledged/charged securities will be disposed of, immediately inform our Company of
such indications.
Our Company will inform the Stock Exchange as soon as it has been informed of the matters referred
to in paragraph (a) and (b) above (if any) by any of the Controlling Shareholders and subject to the then
requirements of the Listing Rules disclose such matters by way of an announcement which is published
in accordance with Rule 2.07C of the Listing Rules as soon as possible.
Undertakings pursuant to the Hong Kong Underwriting Agreement
Undertakings by our Company and the Controlling Shareholders in respect of our Company
Pursuant to the Hong Kong Underwriting Agreement, our Company has undertaken to each of the
Joint Sponsors, the Joint Representatives, the Joint Global Coordinators, the Joint Bookrunners and the
Hong Kong Underwriters not to, without the prior written consent of the Joint Sponsors and the Joint
Representatives (for themselves and on behalf of the Hong Kong Underwriters) and unless in compliance
with the requirements of the Listing Rules, except for the offer, allotment and issue of the Offer Shares
pursuant to the Global Offering (including pursuant to any exercise of the Over-allotment Option), at any
time during the period commencing on the date of the Hong Kong Underwriting Agreement and ending
on and including the date that is six months after the Listing Date (the “First Six-Month Period”):
(a) allot, issue, sell, accept subscription for, contract or agree to allot, issue or sell, mortgage,
pledge, hypothecate, lend, grant or sell any option, warrant, right or contract to subscribe for
or purchase, grant or purchase any option, warrant, right or contract to allot, issue or sell, or
otherwise transfer or dispose of, either directly or indirectly, conditionally or unconditionally,
any Shares or other equity securities of our Company, or any interests in any of the foregoing
(including but not limited to any securities that are convertible into or exercisable or
exchangeable for, or that represent the right to receive, or any warrants or other rights to
purchase, any Shares or other equity securities of our Company); or
(b) enter into any swap or other arrangement that transfers to another, in whole or in part, any of
the economic consequences of ownership of any Shares or other equity securities of our
Company, or any interest therein (including without limitation any securities of which are
convertible into or exchangeable or exercisable for, or represent the right to receive, or any
warrants or other rights to purchase, any Shares or other equity securities of our Company); or
UNDERWRITING
– 392 –
(c) enter into any transaction with the same economic effect as any transaction specified in (a) or
(b) above; or
(d) offer to or agree to or announce that our Company will enter into any such transaction specified
in (a), (b) or (c) above,
in each case, whether any of the transactions specified in (a), (b) or (c) above is to be settled by delivery
of Shares or other equity securities of our Company, in cash or otherwise (whether or not the issue of such
Shares or other equity securities of our Company will be completed within the First Six-Month Period).
In the event that, at any time during the period of six months commencing on the date on which the
First Six-Month Period expires (the “Second Six-Month Period”), our Company enters into any of the
transactions specified in (a), (b) or (c) above or offers to or agrees to, or announces any intention to, enter
into any such transactions, our Company shall take all reasonable steps to ensure that it will not create a
disorderly or false market in the Shares or other equity securities of the Company in a manner that violates
the Securities and Futures Ordinance (Chapter 571 of the Laws of Hong Kong), as amended, supplemented
or otherwise modified from time to time.
The Controlling Shareholders have jointly and severally undertaken to each of the Joint Sponsors,
the Joint Representatives, the Joint Global Coordinators, the Joint Bookrunners and the Hong Kong
Underwriters to procure our Company to comply with the above undertakings.
Each of our Company and the Controlling Shareholders agrees and undertakes to each of the Joint
Sponsors, the Joint Representatives, the Joint Global Coordinators, the Joint Bookrunners and the Hong
Kong Underwriters, that it will not affect any purchase of Shares, or agree to do so, which may reduce the
holdings of Shares held by the public (as defined in Rule 8.24 of the Listing Rules) below the minimum
public float requirements specified in the Listing Rules or any waiver granted and not revoked by the
Stock Exchange on or before the date falling six months after the Listing Date without first having
obtained the prior written consent of the Joint Representatives (for themselves and on behalf of the Hong
Kong Underwriters).
Undertakings by the Controlling Shareholders in respect of themselves
Each of the Controlling Shareholders has undertaken to each of our Company, the Joint Sponsors,
the Joint Representatives, the Joint Global Coordinators, the Joint Bookrunners and the Hong Kong
Underwriters that, except as pursuant to the exercise of the Over-allotment Option and the Stock
Borrowing Agreement, without the prior written consent of the Joint Sponsors and the Joint
Representatives (for themselves and on behalf of the Hong Kong Underwriters) and unless in compliance
with the requirements of the Listing Rules:
(a) it will not, at any time during the First Six-Month Period, (i) sell, offer to sell, contract or agree
to sell, mortgage, charge, pledge, hypothecate, lend, grant or sell any option, warrant, contract
or right to purchase, grant or purchase any option, warrant, contract or right to sell, or
otherwise transfer or dispose of or create an encumbrance over, or agree to transfer or dispose
of or create an encumbrance over either directly or indirectly, conditionally or unconditionally,
any Shares or other equity securities of our Company or any interest therein (including, without
limitation, any securities convertible into or exchangeable or exercisable for or that represent
the right to receive, or any warrants or other rights to purchase, any Shares), or deposit any
UNDERWRITING
– 393 –
Shares or other equity securities of our Company with a depositary in connection with the issue
of depositary receipts, or (ii) enter into any swap or other arrangement that transfers to another,
in whole or in part, any of the economic consequences of ownership of any Shares or other
securities of the Company or any interest therein (including any securities convertible into or
exchangeable or exercisable for or that represent the right to receive, or any warrants or other
rights to purchase, any Shares or other securities of the Company), or (iii) enter into any
transaction with the same economic effect as any transaction specified in (i) or (ii) above, or
(iv) offer to or agree to or announce any intention to affect any transaction specified in (i), (ii)
or (iii) above, in each case, whether any of the transactions specified in (i), (ii) or (iii) above
is to be settled by delivery of Shares or other securities of our Company or in cash or otherwise
(whether or not issue of such Shares or other securities will be completed within the First
Six-Month Period); and
(b) until the expiry of the Second Six-Month Period, in the event that it enters into any of the
transactions specified in (a)(i), (a)(ii) or (a)(iii) above or offers to or agrees to or announces
any intention to affect any such transaction, it will take all reasonable steps to ensure that it
will not create a disorderly or false market in the securities of our Company.
The restrictions in above do not apply to any pledge or charge or any Shares or other equity
securities of our Company, as applicable, or any interest in any of the foregoing (including, without
limitation, any securities convertible into or exchangeable or exercisable for or that represent the
right to receive, or any warrants or other rights to purchase, any Shares or other equity securities of
our Company) after the Global Offering in favor of an authorized institution as defined in the
Banking Ordinance (Chapter 155 of the Laws of Hong Kong), as amended, supplemented or
otherwise modified from time to time (the “Banking Ordinance”), for a bona fide commercial loan.
Undertakings by the existing Shareholders (other than the Controlling Shareholders)
Each of the existing Shareholders (other than the Controlling Shareholders) has undertaken to the
Company and the Joint Representatives that except as may be required by applicable law and regulation
or with the prior written consent of the Company and the Joint Representatives, they will not and will
procure that none of the companies controlled by them or any nominee or trustee holding in trust for them
will, at any time during the period commencing on the date of their respective undertaking and ending on,
and including the date that is six months from the Listing Date (the “Lock-up Period”):
(i) sell, offer to sell, contract or agree to sell, mortgage, charge, pledge, hypothecate, lend, grant
or sell any option, warrant, contract or right to purchase, grant or purchase any option, warrant,
contract or right to sell, or otherwise transfer or dispose of or create any mortgage, charge,
pledge, lien or other security interest or any option, restriction, right of first refusal, right of
pre-emption or other third party claim, right, interest or preference or any other encumbrance
of any kind (the “Encumbrance”) over, or agree to transfer or dispose of or create an
Encumbrance over, either directly or indirectly, conditionally or unconditionally, any Shares or
other securities of the Company or any interest therein (including any securities convertible
into or exchangeable or exercisable for or that represent the right to receive, or any warrants
or other rights to purchase, any Shares or other securities of the Company) directly or indirectly
held by them as at the date of their respective undertaking (the “Lock-up Shares”), or deposit
any Lock-up Shares or other securities of the Company with a depositary in connection with
any issue of depositary receipts, or
UNDERWRITING
– 394 –
(ii) enter into any swap or other arrangement that transfers to another, in whole or in part, any of
the economic consequences of ownership of any Lock-up Shares or other securities of the
Company or any interest therein (including any securities convertible into or exchangeable or
exercisable for or that represent the right to receive, or any warrants or other rights to purchase,
any Shares or other securities of the Company), or
(iii) enter into any transaction with the same economic effect as any transaction specified in clause
(i) or (ii) above, or
(iv) offer to or agree to or announce any intention to effect any transaction specified in clause (i),
(ii) or (iii) above,
in each case, whether any of the transactions specified in clause (i), (ii) or (iii) above is to be settled
by delivery of Shares or other securities of the Company or in cash or otherwise (whether or not the issue
of such Shares or other securities will be completed within the Lock-up Period), provided that the above
shall not apply to, inter alia, Shares acquired by them directly or indirectly after the Listing Date.
Hong Kong Underwriters’ Interests in our Company
Save for their respective obligations under the Hong Kong Underwriting Agreement, as of the Latest
Practicable Date, none of the Hong Kong Underwriters was interested, legally or beneficially, directly or
indirectly, in any Shares or any securities of any member of our Group or had any right or option (whether
legally enforceable or not) to subscribe for or purchase, or to nominate persons to subscribe for or
purchase, any Shares or any securities of any member of our Group.
Following the completion of the Global Offering, the Hong Kong Underwriters and their affiliated
companies may hold a certain portion of the Shares as a result of fulfilling their respective obligations
under the Hong Kong Underwriting Agreement.
International Offering
International Underwriting Agreement
In connection with the International Offering, our Company and the Controlling Shareholders expect
to enter into the International Underwriting Agreement with the International Underwriters on or around
the Price Determination Date. Under the International Underwriting Agreement and subject to the
Over-allotment Option, the International Underwriters would, subject to certain conditions set out therein,
agree severally but not jointly to procure subscribers for, or themselves to subscribe for, their respective
applicable proportions of the International Offer Shares initially being offered pursuant to the
International Offering. It is expected that the International Underwriting Agreement may be terminated on
similar grounds as the Hong Kong Underwriting Agreement. Potential investors should note that in the
event that the International Underwriting Agreement is not entered into or is terminated, the Global
Offering will not proceed. See the section headed “Structure of the Global Offering – The International
Offering” in this prospectus for more details.
UNDERWRITING
– 395 –

Over-allotment Option
Our Company is expected to grant to the International Underwriters the Over-allotment Option,
exercisable by the Joint Representatives on behalf of the International Underwriters at any time from the
Listing Date until 30 days after the last day for lodging applications under the Hong Kong Public Offering,
pursuant to which our Company may be required to issue up to an aggregate of 10,787,400 Shares,
representing not more than 15% of the number of Offer Shares initially available under the Global
Offering, at the Offer Price, to cover over-allocations (if any) in the International Offering. See the section
headed “Structure of the Global Offering – Over-allotment Option” in this prospectus for more details.
Commissions and Expenses
The Underwriters will receive an underwriting commission of 3.0% of the aggregate Offer Price of
all the Offer Shares (including any Offer Shares to be issued pursuant to the exercise of the Over-allotment
Option), out of which they will pay any sub-underwriting commissions and other fees.
The Underwriters may receive a discretionary incentive fee of up to 0.75% of the aggregate Offer
Price of all the Offer Shares (including any Offer Shares to be issued pursuant to the exercise of the
Over-allotment Option).
For any unsubscribed Hong Kong Offer Shares reallocated to the International Offering, the
underwriting commission will not be paid to the Hong Kong Underwriters but will instead be paid, at the
rate applicable to the International Offering, to the relevant International Underwriters.
The aggregate underwriting commissions payable to the Underwriters in relation to the Global
Offering (assuming an Offer Price of HK$40.60 per Offer Share (which is the mid-point of the Offer Price
range), the full payment of the discretionary incentive fee and no exercise of the Over-allotment Option)
will be approximately HK$109.5 million.
The aggregate underwriting commissions and fees together with the Stock Exchange listing fees, the
SFC transaction levy and the Stock Exchange trading fee, legal and other professional fees and printing
and all other expenses relating to the Global Offering are estimated to be approximately HK$178.1 million
(assuming an Offer Price of HK$40.60 per Offer Share (being the mid-point of the Offer Price range), the
full payment of the discretionary incentive fee and no exercise of the Over-allotment Option), which will
be made by our Company.
Indemnity
Each of our Company and the Controlling Shareholders has agreed to indemnify the Hong Kong
Underwriters for certain losses which they may suffer or incur, including losses arising from the
performance of their obligations under the Hong Kong Underwriting Agreement and any breach by any of
our Company and the Controlling Shareholders of the Hong Kong Underwriting Agreement.
ACTIVITIES BY SYNDICATE MEMBERS
The underwriters of the Hong Kong Public Offering and the International Offering (together, the
“Syndicate Members”) and their affiliates may each individually undertake a variety of activities (as
further described below) which do not form part of the underwriting or stabilizing process.
UNDERWRITING
– 396 –

The Syndicate Members and their affiliates are diversified financial institutions with relationships in
countries around the world. These entities engage in a wide range of commercial and investment banking,
brokerage, funds management, trading, hedging, investing and other activities for their own account and
for the account of others. In the ordinary course of their various business activities, the Syndicate
Members and their respective affiliates may purchase, sell or hold a broad array of investments and
actively trade securities, derivatives, loans, commodities, currencies, credit default swaps and other
financial instruments for their own account and for the accounts of their customers. Such investment and
trading activities may involve or relate to assets, securities and/or instruments of our Company and/or
persons and entities with relationships with our Company and may also include swaps and other financial
instruments entered into for hedging purposes in connection with our Group’s loans and other debt.
In relation to the Shares, the activities of the Syndicate Members and their affiliates could include
acting as agent for buyers and sellers of the Shares, entering into transactions with those buyers and sellers
in a principal capacity, including as a lender to initial purchasers of the Shares (which financing may be
secured by the Shares) in the Global Offering, proprietary trading in the Shares, and entering into over the
counter or listed derivative transactions or listed or unlisted securities transactions (including issuing
securities such as derivative warrants listed on a stock exchange) which have as their underlying assets,
assets including the Shares. Such transactions may be carried out as bilateral agreements or trades with
selected counterparties. Those activities may require hedging activity by those entities involving, directly
or indirectly, the buying and selling of the Shares, which may have a negative impact on the trading price
of the Shares. All such activities could occur in Hong Kong and elsewhere in the world and may result
in the Syndicate Members and their affiliates holding long and/or short positions in the Shares, in baskets
of securities or indices including the Shares, in units of funds that may purchase the Shares, or in
derivatives related to any of the foregoing.
In relation to issues by Syndicate Members or their affiliates of any listed securities having the
Shares as their underlying securities, whether on the Stock Exchange or on any other stock exchange, the
rules of the stock exchange may require the issuer of those securities (or one of its affiliates or agents)
to act as a market maker or liquidity provider in the security, and this will also result in hedging activity
in the Shares in most cases.
All such activities may occur both during and after the end of the stabilizing period described in the
section headed “Structure of the Global Offering” in this prospectus. Such activities may affect the market
price or value of the Shares, the liquidity or trading volume in the Shares and the volatility of the price
of the Shares, and the extent to which this occurs from day to day cannot be estimated.
It should be noted that when engaging in any of these activities, the Syndicate Members will be
subject to certain restrictions, including the following:
(a) the Syndicate Members (other than the Stabilization Manager or its affiliates or any person
acting for it) must not, in connection with the distribution of the Offer Shares, effect any
transactions (including issuing or entering into any option or other derivative transactions
relating to the Offer Shares), whether in the open market or otherwise, with a view to
stabilizing or maintaining the market price of any of the Offer Shares at levels other than those
which might otherwise prevail in the open market; and
UNDERWRITING
– 397 –

(b) the Syndicate Members must comply with all applicable laws and regulations, including the
market misconduct provisions of the SFO, including the provisions prohibiting insider dealing,
false trading, price rigging and stock market manipulation.
Certain of the Syndicate Members or their respective affiliates have provided from time to time, and
expect to provide in the future, investment banking and other services to our Company and each of its
affiliates for which such Syndicate Members or their respective affiliates have received or will receive
customary fees and commissions.
In addition, the Syndicate Members or their respective affiliates may provide financing to investors
to finance their subscriptions of Offer Shares in the Global Offering.
UNDERWRITING
– 398 –

THE GLOBAL OFFERING
This prospectus is published in connection with the Hong Kong Public Offering as part of the Global
Offering. China International Capital Corporation Hong Kong Securities Limited, Citigroup Global
Markets Asia Limited and The Hongkong and Shanghai Banking Corporation Limited are the Joint Global
Coordinators of the Global Offering.
The listing of the Shares on the Stock Exchange is sponsored by the Joint Sponsors. The Joint
Sponsors have made an application on behalf of our Company to the Listing Committee of the Stock
Exchange for the listing of, and permission to deal in, the Shares in issue and to be issued as mentioned
in this prospectus.
71,916,000 Offer Shares will initially be made available under the Global Offering comprising:
(a) the Hong Kong Public Offering of initially 7,191,600 Shares (subject to reallocation) in Hong
Kong as described in the sub-section “The Hong Kong Public Offering” in this section below;
and
(b) the International Offering of initially 64,724,400 Shares (subject to reallocation and the
Over-allotment Option) (i) in the United States solely to QIBs in reliance on Rule 144A or
another exemption from, or in a transaction not subject to, the registration requirements of the
U.S. Securities Act and (ii) outside the United States (including to professional and
institutional investors within Hong Kong) in offshore transactions in reliance on Regulation S,
as described in the sub-section headed “The International Offering” this section below.
Investors may either:
(i) apply for Hong Kong Offer Shares under the Hong Kong Public Offering; or
(ii) apply for or indicate an interest for International Offer Shares under the International Offering,
but may not do both.
The Offer Shares will represent approximately 15.0% of the total Shares in issue immediately
following the completion of the Global Offering, assuming the Over-allotment Option is not exercised. If
the Over-allotment Option is exercised in full, the Offer Shares (including Shares issued pursuant to the
full exercise of the Over-allotment Option) will represent approximately 16.9% of the total Shares in issue
immediately following the completion of the Global Offering and the issue of Offer Shares pursuant to the
Over-Allotment Option.
References in this prospectus to applications, the GREEN Application Form, application monies or
the procedure for applications relate solely to the Hong Kong Public Offering.
STRUCTURE OF THE GLOBAL OFFERING
– 399 –
THE HONG KONG PUBLIC OFFERING
Number of Offer Shares initially offered
Our Company is initially offering 7,191,600 Shares (subject to reallocation) for subscription by thepublic in Hong Kong at the Offer Price, representing approximately 10.0% of the total number of OfferShares initially available under the Global Offering. The number of Offer Shares initially offered underthe Hong Kong Public Offering, subject to any reallocation of Offer Shares between the InternationalOffering and the Hong Kong Public Offering, will represent approximately 1.5% of the total Shares inissue immediately following the completion of the Global Offering (assuming the Over-allotment Optionis not exercised).
The Hong Kong Public Offering is open to members of the public in Hong Kong as well as toinstitutional and professional investors. Professional investors generally include brokers, dealers,companies (including fund managers) whose ordinary business involves dealing in shares and othersecurities and corporate entities that regularly invest in shares and other securities.
Completion of the Hong Kong Public Offering is subject to the conditions set out in the sub-sectionheaded “Conditions of the Global Offering” in this section.
Allocation
Allocation of Offer Shares to investors under the Hong Kong Public Offering will be based solelyon the level of valid applications received under the Hong Kong Public Offering. The basis of allocationmay vary, depending on the number of Hong Kong Offer Shares validly applied for by applicants. Suchallocation could, where appropriate, consist of balloting, which could mean that some applicants mayreceive a higher allocation than others who have applied for the same number of Hong Kong Offer Shares,and those applicants who are not successful in the ballot may not receive any Hong Kong Offer Shares.
For allocation purposes only, the total number of Hong Kong Offer Shares available under the HongKong Public Offering (after taking into account any reallocation referred to below) will be divided equallyinto two pools: pool A and pool B (with any odd lots being allocated to pool A). The Hong Kong OfferShares in pool A will be allocated on an equitable basis to applicants who have applied for Hong KongOffer Shares with an aggregate price of HK$5 million (excluding the brokerage, the SFC transaction levyand the Stock Exchange trading fee payable) or less. The Hong Kong Offer Shares in pool B will beallocated on an equitable basis to applicants who have applied for Hong Kong Offer Shares with anaggregate price of more than HK$5 million (excluding the brokerage, the SFC transaction levy and theStock Exchange trading fee payable) and up to the total value in pool B.
Investors should be aware that applications in pool A and applications in pool B may receivedifferent allocation ratios. If any Hong Kong Offer Shares in one (but not both) of the pools areunsubscribed, such unsubscribed Hong Kong Offer Shares will be transferred to the other pool to satisfydemand in that other pool and be allocated accordingly. For the purpose of the immediately precedingparagraph only, the “price” for Hong Kong Offer Shares means the price payable on application therefor(without regard to the Offer Price as finally determined). Applicants can only receive an allocation ofHong Kong Offer Shares from either pool A or pool B and not from both pools. Multiple or suspectedmultiple applications under the Hong Kong Public Offering and any application for more than 3,595,800Hong Kong Offer Shares is liable to be rejected.
STRUCTURE OF THE GLOBAL OFFERING
– 400 –
Reallocation
The allocation of Offer Shares between the Hong Kong Public Offering and the InternationalOffering is subject to reallocation under the Listing Rules. Paragraph 4.2 of Practice Note 18 of the ListingRules requires a clawback mechanism to be put in place which would have the effect of increasing thenumber of Hong Kong Offer Shares to a certain percentage of the total number of Offer Shares to beoffered in the Global Offering if certain prescribed total demand levels in the Hong Kong Public Offeringare reached.
If the International Offering is fully subscribed or oversubscribed and the number of Offer Sharesvalidly applied for under the Hong Kong Public Offering represents (a) 15 times or more but less than 50times, (b) 50 times or more but less than 100 times and (c) 100 times or more of the total number of OfferShares initially available under the Hong Kong Public Offering, then Offer Shares will be reallocated tothe Hong Kong Public Offering from the International Offering. As a result of such reallocation, the totalnumber of Offer Shares available under the Hong Kong Public Offering will be increased to 21,574,800Offer Shares (in the case of (a)), 28,766,400 Offer Shares (in the case of (b)) and 35,958,000 Offer Shares(in the case of (c)), representing approximately 30%, approximately 40% and 50% of the total number ofOffer Shares initially available under the Global Offering, respectively (before any exercise of theOver-allotment Option), reallocation being referred to in this prospectus as “Mandatory Reallocation”. Ineach case, the additional Offer Shares reallocated to the Hong Kong Public Offering will be allocatedbetween pool A and pool B and the number of Offer Shares allocated to the International Offering will becorrespondingly reduced in such manner as the Joint Representatives deem appropriate.
If the Hong Kong Public Offering is not fully subscribed for, the Joint Representatives have theauthority to reallocate all or any unsubscribed Hong Kong Offer Shares to the International Offering, insuch proportions as the Joint Representatives deem appropriate. In addition, the Joint Representatives mayin their sole discretion reallocate Offer Shares from the International Offering to the Hong Kong PublicOffering to satisfy valid applications under the Hong Kong Public Offering. In particular, if (i) theInternational Offering is not fully subscribed and the Hong Kong Public Offering is fully subscribed oroversubscribed; or (ii) the International Offering is fully subscribed or oversubscribed and the Hong KongPublic Offering is fully subscribed or oversubscribed with the number of Offer Shares validly applied forin the Hong Kong Public Offering representing less than 15 times of the number of Shares initiallyavailable for subscription under the Hong Kong Public Offering, the Joint Representatives have theauthority to reallocate International Offer Shares originally included in the International Offering to theHong Kong Public Offering in such number as it deems appropriate, provided that in accordance withGuidance Letter HKEX-GL91-18 issued by the Stock Exchange, (i) the number of International OfferShares reallocated to the Hong Kong Public Offering should not exceed 7,191,600 Shares, representingapproximately 10% of the total number of Offer Shares initially available under the Global Offering,increasing the total number of Offer Shares available under the Hong Kong Public Offering to 14,383,200Shares, representing approximately 20% of the total number of Offer Shares initially available under theGlobal Offering; and (ii) the final Offer Price should be fixed at the bottom end of the indicative OfferPrice range (i.e. HK$37.60 per Offer Share) stated in this prospectus.
In each case, the additional Offer Shares reallocated to the Hong Kong Public Offering will beallocated between pool A and pool B and the number of Offer Shares allocated to the International Offeringwill be correspondingly reduced in such manner as the Joint Representatives deem appropriate.
Details of any reallocation of Offer Shares between the Hong Kong Public Offering and theInternational Offering will be disclosed in the results announcement of the Global Offering, which isexpected to be published on Wednesday, December 29, 2021.
STRUCTURE OF THE GLOBAL OFFERING
– 401 –
Applications
Each applicant under the Hong Kong Public Offering will be required to give an undertaking andconfirmation in the application submitted by him/her/it that he/she/it and any person(s) for whose benefithe/her/it is making the application has not applied for or taken up, or indicated an interest for, and willnot apply for or take up, or indicate an interest for, any International Offer Shares under the InternationalOffering. Such applicant’s application is liable to be rejected if such undertaking and/or confirmationis/are breached and/or untrue (as the case may be) or if he/she/it has been or will be placed or allocatedInternational Offer Shares under the International Offering.
Applicants under the Hong Kong Public Offering are required to pay, on application, the maximumOffer Price of HK$43.60 per Offer Share in addition to the brokerage, the SFC transaction levy and theStock Exchange trading fee payable on each Offer Share, amounting to a total of HK$4,403.94 for oneboard lot of 100 Shares. If the Offer Price, as finally determined in the manner described in the sub-sectionheaded “Pricing and Allocation” in this section below, is less than the maximum Offer Price of HK$43.60per Offer Share, appropriate refund payments (including the brokerage, the SFC transaction levy and theStock Exchange trading fee attributable to the surplus application monies) will be made to successfulapplicants, without interest. Further details are set out in the section headed “How to Apply for Hong KongOffer Shares” in this prospectus.
THE INTERNATIONAL OFFERING
Number of Offer Shares initially offered
The International Offering will consist of an offering of initially 64,724,400 Shares, representingapproximately 90% of the total number of Offer Shares initially available under the Global Offering(subject to reallocation and the Over-allotment Option). The number of Offer Shares initially offered underthe International Offering, subject to any reallocation of Offer Shares between the International Offeringand the Hong Kong Public Offering, will represent approximately 13.5% of the total Shares in issueimmediately following the completion of the Global Offering (assuming the Over-allotment Option is notexercised).
Allocation
The International Offering will include selective marketing of Offer Shares to QIBs in the UnitedStates in accordance with Rule 144A as well as institutional and professional investors and other investorsanticipated to have a sizeable demand for such Offer Shares in Hong Kong and other jurisdictions outsidethe United States in reliance on Regulation S. Professional investors generally include brokers, dealers,companies (including fund managers) whose ordinary business involves dealing in shares and othersecurities and corporate entities that regularly invest in shares and other securities. Allocation of OfferShares pursuant to the International Offering will be effected in accordance with the “book-building”process described in sub-section headed “Pricing and Allocation” in this section and based on a numberof factors, including the level and timing of demand, the total size of the relevant investor’s invested assetsor equity assets in the relevant sector and whether or not it is expected that the relevant investor is likelyto buy further Shares and/or hold or sell its Shares after the Listing. Such allocation is intended to resultin a distribution of the Shares on a basis which would lead to the establishment of a solid professional andinstitutional shareholder base to the benefit of our Group and the Shareholders as a whole.
STRUCTURE OF THE GLOBAL OFFERING
– 402 –

The Joint Representatives (on behalf of the Underwriters) may require any investor who has been
offered Offer Shares under the International Offering and who has made an application under the Hong
Kong Public Offering to provide sufficient information to the Joint Representatives so as to allow them
to identify the relevant applications under the Hong Kong Public Offering and to ensure that they are
excluded from any allocation of Offer Shares under the Hong Kong Public Offering.
Reallocation
The total number of Offer Shares to be issued or sold pursuant to the International Offering may
change as a result of the clawback arrangement described in the subsection “The Hong Kong Public
Offering – Reallocation” in this section above, the exercise of the Over-allotment Option in whole or in
part and/or any reallocation of unsubscribed Offer Shares originally included in the Hong Kong Public
Offering.
OVER-ALLOTMENT OPTION
In connection with the Global Offering, our Company is expected to grant the Over-allotment Option
to the International Underwriters, exercisable by the Joint Representatives (on behalf of the International
Underwriters).
Pursuant to the Over-allotment Option, the International Underwriters will have the right,
exercisable by the Joint Representatives (on behalf of the International Underwriters) at any time from the
Listing Date until 30 days after the last day for lodging applications under the Hong Kong Public Offering,
to require our Company to issue up to an aggregate of 10,787,400 additional Shares, representing not more
than 15% of the total number of Offer Shares initially available under the Global Offering, at the Offer
Price under the International Offering to, cover over-allocations (if any) in the International Offering.
If the Over-allotment Option is exercised in full, the additional Offer Shares to be issued pursuant
thereto will represent approximately 2.2% of the total Shares in issue immediately following the
completion of the Global Offering and the issue of Offer Shares pursuant to the Over-allotment Option.
If the Over-allotment Option is exercised, an announcement will be made.
STABILIZATION
Stabilization is a practice used by underwriters in some markets to facilitate the distribution of
securities. To stabilize, the underwriters may bid for, or purchase, the securities in the secondary market
during a specified period of time, to retard and, if possible, prevent a decline in the initial public market
price of the securities below the offer price. Such transactions may be effected in all jurisdictions where
it is permissible to do so, in each case in compliance with all applicable laws and regulatory requirements,
including those of Hong Kong. In Hong Kong, the price at which stabilization is effected is not permitted
to exceed the offer price.
STRUCTURE OF THE GLOBAL OFFERING
– 403 –
In connection with the Global Offering, the Stabilization Manager (or its affiliates or any person
acting for it), on behalf of the Underwriters, may over-allocate or effect transactions with a view to
stabilizing or supporting the market price of the Shares at a level higher than that which might otherwise
prevail for a limited period after the Listing Date. However, there is no obligation on the Stabilization
Manager (or its affiliates or any person acting for it) to conduct any such stabilizing action. Such
stabilizing action, if taken, (a) will be conducted at the absolute discretion of the Stabilization Manager
(or its affiliates or any person acting for it) and in what the Stabilization Manager reasonably regards as
the best interest of our Company, (b) may be discontinued at any time and (c) is required to be brought
to an end within 30 days of the last day for lodging applications under the Hong Kong Public Offering.
Stabilization action permitted in Hong Kong pursuant to the Securities and Futures (Price
Stabilizing) Rules of the SFO includes (a) over-allocating for the purpose of preventing or minimizing any
reduction in the market price of the Shares, (b) selling or agreeing to sell the Shares so as to establish a
short position in them for the purpose of preventing or minimizing any reduction in the market price of
the Shares, (c) purchasing, or agreeing to purchase, the Shares pursuant to the Over-allotment Option in
order to close out any position established under paragraph (a) or (b) above, (d) purchasing, or agreeing
to purchase, any of the Shares for the sole purpose of preventing or minimizing any reduction in the market
price of the Shares, (e) selling or agreeing to sell any Shares in order to liquidate any position established
as a result of those purchases and (f) offering or attempting to do anything as described in paragraph (b),
(c), (d) or (e) above.
Specifically, prospective applicants for and investors in the Offer Shares should note that:
(a) the Stabilization Manager (or its affiliates or any person acting for it) may, in connection with
the stabilizing action, maintain a long position in the Shares;
(b) there is no certainty as to the extent to which and the time or period for which the Stabilization
Manager (or its affiliates or any person acting for it) will maintain such a long position;
(c) liquidation of any such long position by the Stabilization Manager (or its affiliates or any
person acting for it) and selling in the open market may have an adverse impact on the market
price of the Shares;
(d) no stabilizing action can be taken to support the price of the Shares for longer than the
stabilization period, which will begin on the Listing Date, and is expected to expire on the 30th
day after the last day for lodging applications under the Hong Kong Public Offering. After this
date, when no further stabilizing action may be taken, demand for the Shares, and therefore the
price of the Shares, could fall;
(e) the price of the Shares cannot be assured to stay at or above the Offer Price by the taking of
any stabilizing action; and
(f) stabilizing bids or transactions effected in the course of the stabilizing action may be made at
any price at or below the Offer Price and can, therefore, be done at a price below the price paid
by applicants for, or investors in, the Offer Shares.
STRUCTURE OF THE GLOBAL OFFERING
– 404 –

Our Company will ensure or procure that an announcement in compliance with the Securities and
Futures (Price Stabilizing) Rules of the SFO will be made within seven days of the expiration of the
stabilization period.
Over-Allocation
Following any over-allocation of Shares in connection with the Global Offering, the Stabilization
Manager (or its affiliates or any person acting for it) may cover such over-allocations by exercising the
Over-allotment Option in full or in part, by using Shares purchased by the Stabilization Manager (or its
affiliates or any person acting for it) in the secondary market at prices that do not exceed the Offer Price,
through stock borrowing arrangement or by a combination of these these means. Any such purchases will
be made in accordance with the laws, rules and regulations in place in Hong Kong, including in relation
to stabilization, the Securities and Futures (Price Stabilizing) Rules, as amended, made under the SFO. The
number of Offer Shares which can be over-allocated will not exceed the number of Offer Shares which
may be sold pursuant to the exercise in full of the Over-allotment Option, being 10,787,400 Offer Shares,
representing no more than 15% of the Offer Shares initially available under the Global Offering.
STOCK BORROWING AGREEMENT
In order to facilitate the settlement of over-allocations, if any, in connection with the Global
Offering, the Stabilization Manager (on its own or through its affiliates) may choose to borrow up to
10,787,400 Shares (representing the maximum number of Shares which may be issued pursuant to the
exercise of the Over-allotment Option) from Panmercy pursuant to the Stock Borrowing Agreement, which
is expected to be entered into between the Stabilization Manager and/or its affiliates and Panmercy on or
around the Price Determination Date.
If the Stock Borrowing Agreement is entered into, the borrowing of Shares will only be affected by
the Stabilization Manager (on its own or through its affiliates) for the settlement of over-allocations in the
International Offering.
The same number of Shares so borrowed must be returned to Panmercy on the third business day
following the earlier of (a) the last day on which the Over-allotment Option may be exercised, (b) the day
on which the Over-allotment Option is exercised in full and all relevant Shares have been issued and
allotted by the Company, or (c) such earlier time as the Stabilization Manager and/or its affiliates and
Panmercy may from time to time agree in writing.
The shares borrowing arrangement described above will be affected in compliance with all
applicable laws, rules and regulatory requirements. No payment will be made to Panmercy by the
Stabilization Manager (on its own or through its affiliates) in relation to such shares borrowing
arrangement.
PRICING AND ALLOCATION
Pricing for the Offer Shares for the purpose of the various offerings under the Global Offering will
be fixed on the Price Determination Date, which is expected to be on or about Wednesday, December 22,
2021 and, in any event, no later than Thursday, December 23, 2021, by agreement between the Joint
Representatives (on behalf of the Underwriters) and our Company, and the number of Offer Shares to be
allocated under the various offerings will be determined shortly thereafter.
STRUCTURE OF THE GLOBAL OFFERING
– 405 –

The Offer Price will not be more than HK$43.60 per Offer Share and is expected to be not less than
HK$37.60 per Offer Share, unless otherwise announced, as further explained below. Applicants under the
Hong Kong Public Offering must pay, on application, the maximum Offer Price of HK$43.60 per Offer
Share plus brokerage of 1.0%, SFC transaction levy of 0.0027% and Stock Exchange trading fee of
0.005%, amounting to a total of HK$4,403.94 for one board lot of 100 Shares. Prospective investorsshould be aware that the Offer Price to be determined on the Price Determination Date may be, butis not expected to be, lower than the minimum Offer Price stated in this prospectus.
The International Underwriters will be soliciting from prospective investors indications of interest
in acquiring Offer Shares in the International Offering. Prospective professional and institutional investors
will be required to specify the number of Offer Shares under the International Offering they would be
prepared to acquire either at different prices or at a particular price. This process, known as
“book-building,” is expected to continue up to, and to cease on or about, the last day for lodging
applications under the Hong Kong Public Offering.
The Joint Representatives (on behalf of the Underwriters) may, where they deem appropriate, based
on the level of interest expressed by prospective investors during the book-building process in respect of
the International Offering, and with the consent of our Company, reduce the number of Offer Shares
offered and/or the Offer Price Range below that stated in this prospectus at any time on or prior to the
morning of the last day for lodging applications under the Hong Kong Public Offering. In such a case, our
Company will, as soon as practicable following the decision to make such reduction, and in any event not
later than the morning of the last day for lodging applications under the Hong Kong Public Offering, cause
to be published on the websites of our Company and the Stock Exchange at
https://global.chervongroup.com and www.hkexnews.hk, respectively, notices of the reduction. Upon
the issue of such a notice, the revised number of Offer Shares and/or the Offer Price range will be final
and conclusive and the Offer Price, if agreed upon by the Joint Representatives (on behalf of the
Underwriters) and our Company, will be fixed within such revised Offer Price Range. Our Company will
also, as soon as practicable following the decision to make such change, issue a supplemental prospectus
updating investors of the change in the number of Offer Shares being offered under the Global Offering
and/or the Offer Price, extend the period under which the Hong Kong Public Offering was opened for
acceptance to allow potential investors sufficient time to consider their subscriptions or reconsider their
submitted subscriptions, and require investors who had applied for the Hong Kong Offer Shares to
positively confirm their applications for Offer Shares in light of the change in the number of Offer Shares
and/or the Offer Price. Upon the issue of such a notice and supplemental prospectus, the revised number
of Offer Shares and/or the Offer Price range will be final and conclusive and the Offer Price, if agreed
upon by the Joint Representatives (on behalf of the Underwriters) and our Company, will be fixed within
such revised Offer Price range. If the number of Offer Shares and/or the Offer Price range is so reduced,
all applicants who have already submitted an application will need to confirm their applications in
accordance with the procedures set out in the supplemental prospectus and all unconfirmed applications
will not be valid.
Before submitting applications for the Hong Kong Offer Shares, applicants should have regard to the
possibility that any announcement of a reduction in the number of Offer Shares and/or the Offer Price
range may not be made until the last day for lodging applications under the Hong Kong Public Offering.
Such notice will also include confirmation or revision, as appropriate, of the working capital statement and
the Global Offering statistics as currently set out in this prospectus, and any other financial information
which may change as a result of any such reduction. In the absence of any such notice so published, the
STRUCTURE OF THE GLOBAL OFFERING
– 406 –

number of Offer Shares will not be reduced and/or the Offer Price, if agreed upon by the Joint
Representatives (on behalf of the Underwriters) and our Company, will under no circumstances be set
outside the Offer Price Range as stated in this prospectus.
The final Offer Price, the level of indications of interest in the International Offering, the level of
applications in the Hong Kong Public Offering, the basis of allocations of the Hong Kong Offer Shares
and the results of allocations in the Hong Kong Public Offering are expected to be made available through
a variety of channels in the manner described in the section headed “How to Apply for Hong Kong Offer
Shares – (D) Publication of Results” in this prospectus.
UNDERWRITING
The Hong Kong Public Offering is fully underwritten by the Hong Kong Underwriters under the
terms and conditions of the Hong Kong Underwriting Agreement and is subject to, among other things,
the Joint Representatives (on behalf of the Underwriters) and our Company agreeing on the Offer Price.
Our Company expects to enter into the International Underwriting Agreement relating to the
International Offering on or around the Price Determination Date.
These underwriting arrangements, including the Underwriting Agreements, are summarized in the
section headed “Underwriting” in this prospectus.
CONDITIONS OF THE GLOBAL OFFERING
Acceptance of all applications for Offer Shares will be conditional on, among other things:
(a) the Listing Committee granting approval for the listing of, and permission to deal in, the Shares
to be issued pursuant to the Global Offering (including any additional Shares that may be
issued pursuant to the exercise of the Over-allotment Option) on the Main Board of the Stock
Exchange and such approval and permission not subsequently having been withdrawn or
revoked prior to the Listing Date;
(b) the Offer Price having been agreed between the Joint Representatives (on behalf of the
Underwriters) and our Company;
(c) the execution and delivery of the International Underwriting Agreement on or about the Price
Determination Date; and
(d) the obligations of the Hong Kong Underwriters under the Hong Kong Underwriting Agreement
and the obligations of the International Underwriters under the International Underwriting
Agreement becoming and remaining unconditional and not having been terminated in
accordance with the terms of the respective agreements,
in each case on or before the dates and times specified in the respective Underwriting Agreements (unless
and to the extent such conditions are validly waived on or before such dates and times) and, in any event,
not later than the date which is 30 days after the date of this prospectus.
STRUCTURE OF THE GLOBAL OFFERING
– 407 –

If, for any reason, the Offer Price is not agreed between the Joint Representatives (on behalf of the
Underwriters) and our Company on or before Thursday, December 23, 2021, the Global Offering will not
proceed and will lapse.
The consummation of each of the Hong Kong Public Offering and the International Offering is
conditional upon, among other things, the other offering becoming unconditional and not having been
terminated in accordance with its terms.
If the above conditions are not fulfilled or waived prior to the dates and times specified, the Global
Offering will lapse and the Stock Exchange will be notified immediately. Notice of the lapse of the Hong
Kong Public Offering will be published by our Company on the websites of our Company and the Stock
Exchange at https://global.chervongroup.com and www.hkexnews.hk, respectively, on the next day
following such lapse. In such a situation, all application monies will be returned, without interest, on the
terms set out in the section headed “How to Apply for Hong Kong Offer Shares – (F) Refund of
Application Monies” in this prospectus. In the meantime, all application monies will be held in separate
bank account(s) with the receiving banks or other bank(s) in Hong Kong licensed under the Banking
Ordinance (Chapter 155 of the Laws of Hong Kong).
Share certificates for the Offer Shares will only become valid at 8:00 a.m. on Thursday, December
30, 2021, provided that the Global Offering has become unconditional in all respects at or before that time
and the right of termination set out in “Underwriting – Underwriting Arrangements and Expenses – Hong
Kong Public Offering – Grounds for Termination” has not been exercised. Investors who trade Shares prior
to the receipt of Share certificates or prior to the Share certificates becoming valid evidence of title do so
entirely at their own risk.
DEALINGS IN THE SHARES
Assuming that the Hong Kong Public Offering becomes unconditional at or before 8:00 a.m. in Hong
Kong on Thursday, December 30, 2021, it is expected that dealings in the Shares on the Stock Exchange
will commence at 9:00 a.m. on Thursday, December 30, 2021.
The Shares will be traded in board lots of 100 Shares each and the stock code of the Shares will be
2285.
STRUCTURE OF THE GLOBAL OFFERING
– 408 –

IMPORTANT NOTICE TO INVESTORS:
Fully Electronic Application Process
We have adopted a fully electronic application process for the Hong Kong Public Offering. Wewill not provide any printed copies of this prospectus or any printed copies of any application formsfor use by the public.
This prospectus is available at the website of the Stock Exchange at www.hkexnews.hk under the“HKEXnews > New Listings > New Listing Information” section, and our website athttps://global.chervongroup.com. If you require a printed copy of this prospectus, you may downloadand print from the website addresses above.
The contents of the electronic version of this prospectus are identical to the printed prospectus asregistered with the Registrar of Companies in Hong Kong pursuant to Section 38D of the Companies(Winding Up and Miscellaneous Provisions) Ordinance.
Set out below are procedures through which you can apply for the Hong Kong Offer Shareselectronically. We will not provide any physical channels to accept any application for the Hong KongOffer Shares by the public.
If you are an intermediary, broker or agent, please remind your customers, clients or principals, asapplicable, that this prospectus is available online at the website addresses above.
If you have any question about the application for the Hong Kong Offer Shares, you may call theenquiry hotline of our Share Registrar, at +852 3907 7333 from (i) 9:00 a.m. to 6:00 p.m. on Friday,December 17, 2021; (ii) 9:00 a.m. to 6:00 p.m. on Monday, December 20, 2021; (iii) 9:00 a.m. to 6:00 p.m.on Tuesday, December 21, 2021 and (iv) 9:00 a.m. to 12:00 noon on Wednesday, December 22, 2021.
(A) APPLICATIONS FOR HONG KONG OFFER SHARES
1. How to Apply
We will not provide any printed application forms for use by the public.
If you apply for Hong Kong Offer Shares, then you may not apply for or indicate an interest forInternational Offer Shares.
To apply for Hong Kong Offer Shares, you may:
(1) apply online via the HK eIPO White Form service in the IPO App (which can be downloadedby searching “IPO App” in App Store or Google Play or downloaded atwww.hkeipo.hk/IPOApp or www.tricorglobal.com/IPOApp) or at www.hkeipo.hk; or
(2) apply through the CCASS EIPO service to electronically cause HKSCC Nominees to apply onyour behalf, including by:
(i) instructing your broker or custodian who is a CCASS Clearing Participant or a CCASSCustodian Participant to give electronic application instructions via CCASS terminalsto apply for the Hong Kong Offer Shares on your behalf; or
HOW TO APPLY FOR HONG KONG OFFER SHARES
– 409 –
(ii) (if you are an existing CCASS Investor Participant) giving electronic applicationinstructions through the CCASS Internet System (https://ip.ccass.com) or through the
CCASS Phone System by calling +852 2979 7888 (using the procedures in HKSCC’s “An
Operating Guide for Investor Participants” in effect from time to time). HKSCC can also
input electronic application instructions for CCASS Investor Participants through
HKSCC’s Customer Service Centre at 1/F, One & Two Exchange Square, 8 Connaught
Place, Central, Hong Kong by completing an input request.
If you apply through channel (1) above, the Hong Kong Offer Shares successfully applied for will
be issued in your own name.
If you apply through channels (2)(i) or (2)(ii) above, the Hong Kong Offer Shares successfully
applied for will be issued in the name of HKSCC Nominees and deposited directly into CCASS to be
credited to your or a designated CCASS Participant’s stock account.
None of you or your joint applicant(s) may make more than one application, except where you are
a nominee and provide the required information in your application.
Our Company, the Joint Representatives, the HK eIPO White Form Service Provider and their
respective agents may reject or accept any application, in full or in part, for any reason at their discretion.
2. Who Can Apply
You can apply for Hong Kong Offer Shares if you or any person(s) for whose benefit you are
applying:
• are 18 years of age or older;
• have a Hong Kong address; and
• are outside the United States (within the meaning of Regulation S) or are a person described
in paragraph (h)(3) of Rule 902 of Regulation S.
If you apply for Hong Kong Offer Shares online through the HK eIPO White Form service, in
addition to the above, you must also provide a valid e-mail address and a contact telephone number.
If you are a firm, the application must be in the individual members’ names.
If an application is made by a person under a power of attorney, our Company and the Joint
Representatives, as our Company’s agent, may accept it at their discretion, and on any conditions they
think fit, including requiring evidence of the attorney’s authority.
The number of joint applicants may not exceed four.
If you are applying for the Hong Kong Offer Shares online by instructing your broker or custodianwho is a CCASS Clearing Participant or a CCASS Custodian Participant to give electronic applicationinstructions via CCASS terminals, please contact them for the items required for the application.
HOW TO APPLY FOR HONG KONG OFFER SHARES
– 410 –

Unless permitted by the Listing Rules, you cannot apply for any Hong Kong Offer Shares if:
• you are an existing beneficial owner of Shares and/or shares of any of our Company’ssubsidiaries;
• you are a director, supervisor or chief executive of our Company and/or any of our Company’ssubsidiaries;
• you are a close associate of any of the above persons;
• you are a core connected person of our Company or will become a core connected person ofour Company immediately upon completion of the Global Offering; or
• you have been allocated or have applied for any International Offer Shares or otherwiseparticipate in the International Offering.
3. Terms and Conditions of an Application
By applying through the application channels specified in this prospectus, among other things, you:
(a) undertake to execute all relevant documents and instruct and authorize our Company and/or theJoint Representatives (or their agents or nominees), as agents of our Company, to execute anydocuments for you and to do on your behalf all things necessary to register any Hong KongOffer Shares allocated to you in your name or in the name of HKSCC Nominees as requiredby the Articles of Association;
(b) agree to comply with the Articles of Association, Companies (Winding Up and MiscellaneousProvisions) Ordinance and the Companies Ordinance;
(c) confirm that you have read the terms and conditions and application procedures set out in thisprospectus and agree to be bound by them;
(d) confirm that you have received and read this prospectus and have relied only on the informationand representations in this prospectus in making your application and will not rely on any otherinformation or representations, except those in any supplement to this prospectus;
(e) confirm that you are aware of the restrictions on the Global Offering set out in this prospectus;
(f) agree that none of our Company, the Joint Sponsors, the Joint Representatives, the Joint GlobalCoordinators, the Joint Bookrunners, the Underwriters, the HK eIPO White Form ServiceProvider, any of their or our Company’s respective directors, officers, employees, partners,agents, advisers or representatives and any other parties involved in the Global Offering (the“Relevant Persons”) is or will be liable for any information and representations not in thisprospectus (and any supplement to this prospectus);
(g) undertake and confirm that you or the person(s) for whose benefit you have made theapplication have not applied for or taken up, or indicated an interest for, and will not apply foror take up, or indicate an interest for, any International Offer Shares nor participated in theInternational Offering;
HOW TO APPLY FOR HONG KONG OFFER SHARES
– 411 –

(h) agree to disclose to our Company, the Share Registrar, the receiving bank and the Relevant
Persons any personal data which any of them may require about you and the person(s) for
whose benefit you have made the application;
(i) if the laws of any place outside Hong Kong apply to your application, agree and warrant that
you have complied with all such laws and neither our Company nor the Relevant Persons will
breach any laws outside Hong Kong as a result of the acceptance of your offer to purchase, or
any action arising from your rights and obligations under the terms and conditions in this
prospectus;
(j) agree that once your application has been accepted, you may not rescind it because of an
innocent misrepresentation;
(k) agree that your application will be governed by the laws of Hong Kong;
(l) represent, warrant and undertake that (i) you understand that the Hong Kong Offer Shares have
not been and will not be registered under the U.S. Securities Act and (ii) you and any person
for whose benefit you are applying for the Hong Kong Offer Shares are outside the United
States (within the meaning of Regulation S) or are a person described in paragraph (h)(3) of
Rule 902 of Regulation S;
(m) warrant that the information you have provided is true and accurate;
(n) agree to accept the Hong Kong Offer Shares applied for, or any lesser number allocated to you
under the application;
(o) authorize (i) our Company to place your name(s) or the name of HKSCC Nominees on the
register of members of our Company as the holder(s) of any Hong Kong Offer Shares allocated
to you and such other registers as required under the Articles of Association and (ii) our
Company and/or its agents to send any Share certificate(s) and/or any e-Auto Refund payment
instructions and/or any refund cheque(s) to you or the first-named applicant for joint
applications by ordinary post at your own risk to the address stated on the application, unless
you have fulfilled the criteria mentioned in “– Personal Collection” below to collect the Share
certificate(s) and/or refund cheque(s) in person;
(p) declare and represent that this is the only application made and the only application intended
by you to be made to benefit you or the person for whose benefit you are applying;
(q) understand that the Joint Representatives may reallocate Offer Shares from the International
Offering to the Hong Kong Public Offering to satisfy valid applications under the Hong Kong
Public Offering and in accordance with Guidance Letter HKEX-GL91-18 issued by the Stock
Exchange, if such reallocation is done other than pursuant to Practice Note 18 of the Listing
Rules, the maximum total number of Offer Shares that may be reallocated to the Hong Kong
Public Offering following such reallocation shall be not more than double the initial allocation
to the Hong Kong Public Offering (i.e. 14,383,200 Offer Shares). Further details of the
reallocation are stated in the section headed “Structure of the Global Offering” in this
prospectus;
HOW TO APPLY FOR HONG KONG OFFER SHARES
– 412 –

(r) understand that our Company, the Directors and the Joint Representatives will rely on yourdeclarations and representations in deciding whether or not to allocate any of the Hong KongOffer Shares to you and that you may be prosecuted for making a false declaration;
(s) (if the application is made for your own benefit) warrant that no other application has been orwill be made for your benefit by giving electronic application instructions to HKSCC or tothe HK eIPO White Form Service Provider by you or by any one as your agent or by any otherperson; and
(t) (if you are making the application as an agent for the benefit of another person) warrant that(i) no other application has been or will be made by you as agent for or for the benefit of thatperson or by that person or by any other person as agent for that person by giving electronicapplication instructions to HKSCC and (ii) you have due authority to give electronicapplication instructions on behalf of that other person as its agent.
For the avoidance of doubt, our Company and all other parties involved in the preparation of thisprospectus acknowledge that each applicant and CCASS Participant who gives or causes to give electronicapplication instructions is a person who may be entitled to compensation under Section 40 of theCompanies (Winding Up and Miscellaneous Provisions) Ordinance.
4. Minimum Application Amount and Permitted Numbers
Your application through the HK eIPO White Form service or the CCASS EIPO service must befor a minimum of 100 Hong Kong Offer Shares and in one of the numbers set out in the table below. Youare required to pay the amount next to the number you select.
No. ofHong Kong
Offer Sharesapplied for
Amountpayable onapplication
No. ofHong Kong
Offer Sharesapplied for
Amountpayable onapplication
No. ofHong Kong
Offer Sharesapplied for
Amountpayable onapplication
No. ofHong Kong
Offer Sharesapplied for
Amountpayable onapplication
HK$ HK$ HK$ HK$
100 4,403.94 2,000 88,078.71 30,000 1,321,180.72 400,000 17,615,742.88200 8,807.88 3,000 132,118.07 40,000 1,761,574.29 500,000 22,019,678.60300 13,211.80 4,000 176,157.43 50,000 2,201,967.86 600,000 26,423,614.32400 17,615.74 5,000 220,196.79 60,000 2,642,361.43 700,000 30,827,550.04500 22,019.68 6,000 264,236.14 70,000 3,082,755.00 800,000 35,231,485.76600 26,423.62 7,000 308,275.50 80,000 3,523,148.58 900,000 39,635,421.48700 30,827.55 8,000 352,314.86 90,000 3,963,542.15 1,000,000 44,039,357.20800 35,231.48 9,000 396,354.21 100,000 4,403,935.72 2,000,000 88,078,714.40900 39,635.42 10,000 440,393.57 200,000 8,807,871.44 3,000,000 132,118,071.60
1,000 44,039.36 20,000 880,787.14 300,000 13,211,807.16 3,595,800(1) 158,356,720.62
(1) Maximum number of Hong Kong Offer Shares you may apply for.
No application for any other number of the Hong Kong Offer Shares will be considered and any such
application is liable to be rejected.
HOW TO APPLY FOR HONG KONG OFFER SHARES
– 413 –

5. Applying Through the HK eIPO White Form Service
General
Individuals who meet the criteria in “– A. Applications for Hong Kong Offer Shares – 2. Who Can
Apply” above may apply through the HK eIPO White Form service for the Offer Shares to be allocated
and registered in their own names through the IPO App or the designated website at www.hkeipo.hk.
Detailed instructions for application through the HK eIPO White Form service are set out in the
IPO App or on the designated website. If you do not follow the instructions, your application may be
rejected and may not be submitted to our Company. If you apply through the IPO App or the designated
website, you authorize the HK eIPO White Form Service Provider to apply on the terms and conditions
in this prospectus, as supplemented and amended by the terms and conditions of the HK eIPO WhiteForm service.
If you have any questions on how to apply through the HK eIPO White Form service for the Hong
Kong Offer Shares, please contact the telephone enquiry line of the Share Registrar at +852 3907 7333
which is available from (i) 9:00 a.m. to 6:00 p.m. on Friday, December 17, 2021; (ii) 9:00 a.m. to 6:00
p.m. on Monday, December 20, 2021; (iii) 9:00 a.m. to 6:00 p.m. on Tuesday, December 21, 2021 and (iv)
9:00 a.m. to 12:00 noon on Wednesday, December 22, 2021.
Time for Submitting Applications under the HK eIPO White Form Service
You may submit your application through the HK eIPO White Form service in the IPO App or on
the designated website at www.hkeipo.hk (24 hours daily, except on the last day for applications) from
9:00 a.m. on Friday, December 17, 2021 until 11:30 a.m. on Wednesday, December 22, 2021 and the latest
time for completing full payment of application monies in respect of such applications will be 12:00 noon
on Wednesday, December 22, 2021, the last day for applications, or such later time as described in the
paragraph headed “– (C) Effect of Bad Weather and/or Extreme Conditions on the Opening and Closing
of the Application Lists” in this section below.
No Multiple Applications
If you apply by means of the HK eIPO White Form service, once you complete payment in respect
of any electronic application instruction given by you or for your benefit through the HK eIPO WhiteForm service to make an application for Hong Kong Offer Shares, an actual application will be deemed
to have been made. For the avoidance of doubt, giving an electronic application instruction under the
HK eIPO White Form service more than once and obtaining different payment reference numbers without
effecting full payment in respect of a particular reference number will not constitute an actual application.
Only one application may be made for the benefit of any person. If you are suspected of submitting
more than one application through the HK eIPO White Form service or by any other means, all of your
applications are liable to be rejected.
If you are a nominee, in the box marked “For Nominees” you must include an account number or
some other identification code for each beneficial owner or, in the case of joint beneficial owners, for each
joint beneficial owner when you fill in the application details. If you do not include this information, the
application will be treated as being made for your own benefit.
HOW TO APPLY FOR HONG KONG OFFER SHARES
– 414 –
Section 40 of the Companies (Winding Up and Miscellaneous Provisions) Ordinance
For the avoidance of doubt, our Company and all other parties involved in the preparation of this
prospectus acknowledge that each applicant who gives or causes to give electronic applicationinstructions is a person who may be entitled to compensation under Section 40 of the Companies
(Winding Up and Miscellaneous Provisions) Ordinance.
6. Applying Through the CCASS EIPO Service
General
CCASS Participants may give electronic application instructions to apply for the Hong Kong Offer
Shares and to arrange payment of the money due on application and payment of refunds under their
participant agreements with HKSCC and the General Rules of CCASS and the CCASS Operational
Procedures.
If you are a CCASS Investor Participant, you may give these electronic application instructionsthrough the CCASS Phone System by calling +852 2979 7888 or through the CCASS Internet System
(https://ip.ccass.com) (using the procedures in HKSCC’s “An Operating Guide for Investor Participants”
in effect from time to time).
HKSCC can also input electronic application instructions for you if you go to:
Hong Kong Securities Clearing Company LimitedCustomer Service Center
1/F, One & Two Exchange Square
8 Connaught Place, Central
Hong Kong
and complete an input request form.
If you are not a CCASS Investor Participant, you may instruct your broker or custodian who is a
CCASS Clearing Participant or a CCASS Custodian Participant to give electronic applicationinstructions via CCASS terminals to apply for the Hong Kong Offer Shares on your behalf.
You will be deemed to have authorized HKSCC and/or HKSCC Nominees to transfer the details of
your application to our Company, the Joint Representatives and the Share Registrar.
Applying through the CCASS EIPO Service
Where you have given electronic application instructions to apply for the Hong Kong Offer Shares
and an application is made by HKSCC Nominees on your behalf:
(a) HKSCC Nominees will only be acting as a nominee for you and is not liable for any breach
of the terms and conditions of this prospectus; and
(b) HKSCC Nominees will do the following things on your behalf:
HOW TO APPLY FOR HONG KONG OFFER SHARES
– 415 –
• agree that the Hong Kong Offer Shares to be allocated shall be registered in the name of
HKSCC Nominees and deposited directly into CCASS for the credit of the CCASS
Participant’s stock account on your behalf or your CCASS Investor Participant’s stock
account;
• agree to accept the Hong Kong Offer Shares applied for or any lesser number allocated;
• undertake and confirm that you have not applied for or taken up, or indicated an interest
for, and will not apply for or take up, or indicate an interest for, any International Offer
Shares nor participated in the International Offering;
• (if the electronic application instructions are given for your benefit) declare that only
one set of electronic application instructions has been given for your benefit;
• (if you are an agent for another person) declare that you have only given one set of
electronic application instructions for the other person’s benefit and are duly authorized
to give those instructions as its agent;
• confirm that you understand that our Company, the Directors and the Joint
Representatives will rely on your declarations and representations in deciding whether or
not to allocate any of the Hong Kong Offer Shares to you and that you may be prosecuted
for making a false declaration;
• authorize our Company to place HKSCC Nominees’ name on the Share register of our
Company as the holder of the Hong Kong Offer Shares allocated to you and such other
registers as required under the Articles of Association, and dispatch Share certificate(s)
and/or refund monies in accordance with the arrangements separately agreed between our
Company and HKSCC;
• confirm that you have read the terms and conditions and application procedures set out
in this prospectus and agree to be bound by them;
• confirm that you have received and read a copy of this prospectus and have relied only
on the information and representations in this prospectus in causing the application to be
made and will not rely on any other information or representations, except those in any
supplement to this prospectus;
• agree that neither our Company nor the Relevant Persons is or will be liable for any
information and representations not in this prospectus (and any supplement to this
prospectus);
• agree to disclose to our Company, the Share Registrar, the receiving bank and the
Relevant Persons any personal data which they may require about you;
• agree (without prejudice to any other rights which you may have) that once HKSCC
Nominees’ application has been accepted, it cannot be rescinded for innocent
misrepresentation;
HOW TO APPLY FOR HONG KONG OFFER SHARES
– 416 –
• agree that any application made by HKSCC Nominees on your behalf is irrevocable on
or before the fifth day after the time of the opening of the application lists (excluding for
this purpose any day which is a Saturday, Sunday or public holiday in Hong Kong), such
agreement to take effect as a collateral contract with our Company, and to become binding
when you give the instructions and such collateral contract to be in consideration of our
Company agreeing that it will not offer any Hong Kong Offer Shares to any person on or
before the fifth day after the time of the opening of the application lists (excluding for
this purpose any day which is a Saturday, Sunday or public holiday in Hong Kong),
except by means of one of the procedures referred to in this prospectus. However,
HKSCC Nominees may revoke the application on or before the fifth day after the time of
the opening of the application lists (excluding for this purpose any day which is a
Saturday, Sunday or public holiday in Hong Kong) if a person responsible for this
prospectus under Section 40 of the Companies (Winding Up and Miscellaneous
Provisions) Ordinance gives a public notice under that section which excludes or limits
that person’s responsibility for this prospectus;
• agree that once HKSCC Nominees’ application is accepted, neither that application nor
your electronic application instructions can be revoked, and that acceptance of that
application will be evidenced by the announcement of the results of the Hong Kong
Public Offering by our Company;
• agree to the arrangements, undertakings and warranties under the participant agreement
between you and HKSCC, read with the General Rules of CCASS and the CCASS
Operational Procedures, for giving electronic application instructions to apply for Hong
Kong Offer Shares;
• agree that your application, any acceptance of it and the resulting contract will be
governed by and construed in accordance with the laws of Hong Kong.
Effect of Applying through the CCASS EIPO Service
By applying through the CCASS EIPO service, you (and, if you are joint applicants, each of you
jointly and severally) are deemed to have done the following things. Neither HKSCC nor HKSCC
Nominees will be liable to our Company or any other person in respect of the things mentioned below:
• instructed and authorized HKSCC to cause HKSCC Nominees (acting as nominee for the
relevant CCASS Participants) to apply for the Hong Kong Offer Shares on your behalf;
• instructed and authorized HKSCC to arrange payment of the maximum Offer Price, brokerage,
SFC transaction levy and Stock Exchange trading fee by debiting your designated bank account
and, in the case of a wholly or partially unsuccessful application and/or if the Offer Price is less
than the maximum Offer Price initially paid on application, refund of the application monies
(including brokerage, SFC transaction levy and Stock Exchange trading fee) by crediting your
designated bank account; and
• instructed and authorized HKSCC to cause HKSCC Nominees to do on your behalf all the
things stated in this prospectus.
HOW TO APPLY FOR HONG KONG OFFER SHARES
– 417 –

Time for Inputting Electronic Application Instructions(1)
CCASS Clearing/Custodian Participants can input electronic application instructions at the
following times on the following dates:
• Friday, December 17, 2021 – 9:00 a.m. to 8:30 p.m.
• Monday, December 20, 2021 – 8:00 a.m. to 8:30 p.m.
• Tuesday, December 21, 2021 – 8:00 a.m. to 8:30 p.m.
• Wednesday, December 22, 2021 – 8:00 a.m. to 12:00 noon
CCASS Investor Participants can input electronic application instructions from 9:00 a.m. on
Friday, December 17, 2021 until 12:00 noon on Wednesday, December 22, 2021 (24 hours daily, except
on Wednesday, December 22, 2021, the last day for applications).
The latest time for inputting your electronic application instructions will be 12:00 noon on
Wednesday, December 22, 2021, the last day for applications or such later time as described in “– (C)
Effect of Bad Weather and/or Extreme Conditions on the Opening and Closing of the Application Lists”
in this section below.
Note:
(1) The times in this sub-section are subject to change as HKSCC may determine from time to time with prior notificationto CCASS Clearing/Custodian Participants and/or CCASS Investor Participants.
No Multiple Applications
If you are suspected of having made multiple applications or if more than one application is made
for your benefit, the number of Hong Kong Offer Shares applied for by HKSCC Nominees will be
automatically reduced by the number of Hong Kong Offer Shares for which you have given such
instructions and/or for which such instructions have been given for your benefit. Any electronicapplication instructions to make an application for the Hong Kong Offer Shares given by you or for your
benefit to HKSCC will be deemed to be an actual application for the purposes of considering whether
multiple applications have been made.
Section 40 of the Companies (Winding Up and Miscellaneous Provisions) Ordinance
For the avoidance of doubt, our Company and all other parties involved in the preparation of this
prospectus acknowledge that each CCASS Participant who gives or causes to give electronic applicationinstructions is a person who may be entitled to compensation under Section 40 of the Companies
(Winding Up and Miscellaneous Provisions) Ordinance.
HOW TO APPLY FOR HONG KONG OFFER SHARES
– 418 –

Personal Data
The following Personal Information Collection Statement applies to any personal data held by the
Company, the Share Registrar, the receiving bank, the Joint Representatives, the Joint Global
Coordinators, the Underwriters and any of their respective advisers and agents about you in the same way
as it applies to personal data about applicants other than HKSCC Nominees. By applying through the
CCASS EIPO service or the HK eIPO White Form service, you agree to all of the terms of the Personal
Information Collection Statement below.
Personal Information Collection Statement
This Personal Information Collection Statement informs applicant for, and holder of, the Hong Kong
Offer Shares, of the policies and practices of the Company and its Share Registrar in relation to personal
data and the Personal Data (Privacy) Ordinance (Chapter 486 of the Laws of Hong Kong).
Reasons for the Collection of Your Personal Data
It is necessary for applicants and registered holders of the Hong Kong Offer Shares to supply correct
personal data to the Company or its agents and the Share Registrar when applying for the Hong Kong Offer
Shares or transferring the Hong Kong Offer Shares into or out of their names or in procuring the services
of the Share Registrar.
Failure to supply the requested data may result in your application for the Hong Kong Offer Shares
being rejected, or in delay or the inability of our Company or its Share Registrar to effect transfers or
otherwise render their services. It may also prevent or delay registration or transfers of the Hong Kong
Offer Shares which you have successfully applied for and/or the dispatch of Share certificate(s) to which
you are entitled.
It is important that the holders of the Hong Kong Offer Shares inform our Company and the Share
Registrar immediately of any inaccuracies in the personal data supplied.
Purposes
Your personal data may be used, held, processed, and/or stored (by whatever means) for the
following purposes:
• processing your application and refund check or e-Auto Refund payment instruction, where
applicable, verification of compliance with the terms and application procedures set out in this
prospectus and announcing results of allocation of the Hong Kong Offer Shares;
• compliance with applicable laws and regulations in Hong Kong and elsewhere;
• registering new issues or transfers into or out of the names of the holders of our Company’s
Shares including, where applicable, HKSCC Nominees;
• maintaining or updating our Company’s Register of Members;
• verifying identities of the holders of our Company’s Shares;
HOW TO APPLY FOR HONG KONG OFFER SHARES
– 419 –

• establishing benefit entitlements of holders of our Company’s Shares, such as dividends, rights
issues, bonus issues, etc.;
• distributing communications from our Company and its subsidiaries;
• compiling statistical information and profiles of the holder of our Company’s Shares;
• disclosing relevant information to facilitate claims on entitlements; and
• any other incidental or associated purposes relating to the above and/or to enable our Company
and the Share Registrar to discharge their obligations to holders of our Company’s Shares
and/or regulators and/or any other purposes to which the securities’ holders may from time to
time agree.
Transfer of Personal Data
Personal data held by our Company and its Share Registrar relating to the holders of the Hong Kong
Offer Shares will be kept confidential but our Company and its Share Registrar may, to the extent
necessary for achieving any of the above purposes, disclose, obtain or transfer (whether within or outside
Hong Kong) the personal data to, from or with any of the following:
• our Company’s appointed agents such as financial advisers and receiving bankers;
• where applicants for the Hong Kong Offer Shares request a deposit into CCASS, HKSCC or
HKSCC Nominees, who will use the personal data for the purposes of operating CCASS;
• any agents, contractors or third-party service providers who offer administrative,
telecommunications, computer, payment or other services to our Company or the Share
Registrar in connection with their respective business operation;
• the Stock Exchange, the SFC and any other statutory regulatory or governmental bodies or
otherwise as required by laws, rules or regulations; and
• any persons or institutions with which the holders of the Hong Kong Offer Shares have or
propose to have dealings, such as their bankers, solicitors, accountants or stockbrokers etc..
Retention of Personal Data
Our Company and its Share Registrar will keep the personal data of the applicants and holders of the
Hong Kong Offer Shares for as long as necessary to fulfil the purposes for which the personal data were
collected. Personal data which is no longer required will be destroyed or dealt with in accordance with the
Personal Data (Privacy) Ordinance (Chapter 486 of the Laws of Hong Kong).
Access to and Correction of Personal Data
Holders of the Hong Kong Offer Shares have the right to ascertain whether our Company or the
Share Registrar hold their personal data, to obtain a copy of that data, and to correct any data that is
inaccurate. Our Company and the Share Registrar have the right to charge a reasonable fee for the
HOW TO APPLY FOR HONG KONG OFFER SHARES
– 420 –
processing of such requests. All requests for access to data or correction of data should be addressed to
our Company, at our Company’s registered address disclosed in the section headed “Corporate
Information” in this prospectus or as notified from time to time, for the attention of the secretary, or our
Company’s Share Registrar for the attention of the privacy compliance officer.
7. Warning for Electronic Applications
The subscription of the Hong Kong Offer Shares through giving electronic application instructionsto HKSCC is only a facility provided to CCASS Participants. Similarly, the application for Hong Kong
Offer Shares through the HK eIPO White Form service is only a facility provided by the HK eIPO WhiteForm Service Provider to public investors. Such facilities are subject to capacity limitations and potential
service interruptions and you are advised not to wait until the last application day to make your electronic
application. Our Company, the Relevant Persons and the HK eIPO White Form Service Provider take no
responsibility for such applications and provide no assurance that any CCASS Participant or person
applying through the HK eIPO White Form service will be allocated any Hong Kong Offer Shares.
To ensure that CCASS Investor Participants can give their electronic application instructions, they
are advised not to wait until the last minute to input their instructions to the systems. In the event that
CCASS Investor Participants have problems connecting to the CCASS Phone System or the CCASS
Internet System for submission of their electronic application instructions, they should go to HKSCC’s
Customer Service Centre to complete an input request form for electronic application instructions before
12:00 noon on Wednesday, December 22, 2021, the last day for applications, or such later time as
described in the paragraph headed “– (C) Effect of Bad Weather and/or Extreme Conditions on the
Opening and Closing of the Application Lists” in this section below.
8. How Many Applications Can You Make
Multiple applications for the Hong Kong Offer Shares are not allowed except by nominees.
All of your applications will be rejected if more than one application through the CCASS EIPOservice (directly or indirectly through your broker or custodian) or through the HK eIPO White Formservice is made for your benefit (including the part of the application made by HKSCC Nominees acting
on electronic application instructions), and the number of Hong Kong Offer Shares applied by HKSCC
Nominees will be automatically reduced by the number of Hong Kong Offer Shares for which you have
given such instructions and/or for which such instructions have been given for your behalf.
For the avoidance of doubt, giving an electronic application instruction under the HK eIPO WhiteForm service more than once and obtaining different payment reference numbers without effecting full
payment in respect of a particular reference number will not constitute an actual application. However, any
electronic application instructions to make an application for the Hong Kong Offer Shares given by you
or for your benefit to HKSCC will be deemed to be an actual application for the purposes of considering
whether multiple applications have been made.
If an application is made by an unlisted company and:
• the principal business of that company is dealing in securities; and
• you exercise statutory control over that company,
HOW TO APPLY FOR HONG KONG OFFER SHARES
– 421 –

then the application will be treated as being made for your benefit.
“Unlisted company” means a company with no equity securities listed on the Stock Exchange.
“Statutory control” means you:
• control the composition of the board of directors of the company;
• control more than half of the voting power of the company; or
• hold more than half of the issued share capital of the company (not counting any part of it
which carries no right to participate beyond a specified amount in a distribution of either profits
or capital).
(B) HOW MUCH ARE THE HONG KONG OFFER SHARES
The maximum Offer Price is HK$43.60 per Offer Share. You must also pay brokerage of 1.0%, SFC
transaction levy of 0.0027% and Stock Exchange trading fee of 0.005%. This means that for one board lot
of 100 Hong Kong Offer Shares, you will pay HK$4,403.94.
You must pay the maximum Offer Price, together with brokerage, SFC transaction levy and Stock
Exchange trading fee, in full upon application for Hong Kong Offer Shares.
You may submit an application through the HK eIPO White Form service or the CCASS EIPOservice in respect of a minimum of 100 Hong Kong Offer Shares. Each application or electronicapplication instruction in respect of more than 100 Hong Kong Offer Shares must be in one of the
numbers set out in the table in “4. Minimum Application Amount and Permitted Numbers” in this section,
or as otherwise specified in the IPO App or on the designated website at www.hkeipo.hk.
If your application is successful, brokerage will be paid to the Exchange Participants (as defined in
the Listing Rules), and the SFC transaction levy and the Stock Exchange trading fee will be paid to the
Stock Exchange (in the case of the SFC transaction levy, collected by the Stock Exchange on behalf of
the SFC).
For further details on the Offer Price, see the section headed “Structure of the Global Offering
– Pricing and Allocation” in this prospectus.
(C) EFFECT OF BAD WEATHER AND/OR EXTREME CONDITIONS ON THE OPENING ANDCLOSING OF THE APPLICATION LISTS
The application lists will not open or close if there is/are:
• a tropical cyclone warning signal number 8 or above;
• a “black” rainstorm warning; and/or
• Extreme Conditions,
HOW TO APPLY FOR HONG KONG OFFER SHARES
– 422 –
in force in Hong Kong at any time between 9:00 a.m. and 12:00 noon on Wednesday, December 22, 2021.
Instead they will open between 11:45 a.m. and 12:00 noon on the next business day which does not have
any of those warnings and/or Extreme Conditions in force in Hong Kong at any time between 9:00 a.m.
and 12:00 noon.
If the application lists do not open and close on Wednesday, December 22, 2021 or if there is/are a
tropical cyclone warning signal number 8 or above, a “black” rainstorm warning signal and/or Extreme
Conditions in force in Hong Kong that may affect the dates mentioned in the section headed “Expected
Timetable” in this prospectus, an announcement will be made.
(D) PUBLICATION OF RESULTS
Our Company expects to announce the Offer Price, the level of indications of interest in the
International Offering, the level of applications in the Hong Kong Public Offering and the basis of
allocations of the Hong Kong Offer Shares on Wednesday, December 29, 2021 on the websites of our
Company at https://global.chervongroup.com and the Stock Exchange at www.hkexnews.hk.
The results of allocations and the Hong Kong identity card/passport/Hong Kong business registration
numbers of successful applicants under the Hong Kong Public Offering will be available at the times and
dates and in the manner set out below:
• in the announcement to be posted on the websites of our Company and the Stock Exchange at
https://global.chervongroup.com and www.hkexnews.hk, respectively, by no later than 9:00
a.m. on Wednesday, December 29, 2021;
• from “allotment results” function in the IPO App or the designated results of allocations
website at www.tricor.com.hk/ipo/result or www.hkeipo.hk/IPOResult with a “search by ID
function” on a 24 hour basis from 8:00 a.m. on Wednesday, December 29, 2021 to 12:00
midnight on Tuesday, January 4, 2022; and
• from the allocation results telephone enquiry line by calling +852 3691 8488 between 9:00 a.m.
and 6:00 p.m. from Wednesday, December 29, 2021 to Monday, January 3, 2022 (excluding
Saturday, Sunday and public holiday in Hong Kong).
If our Company accepts your offer to purchase (in whole or in part), which it may do by announcing
the basis of allocations and/or making available the results of allocations publicly, there will be a binding
contract under which you will be required to purchase the Hong Kong Offer Shares if the conditions of
the Global Offering are satisfied and the Global Offering is not otherwise terminated. Further details are
set out in the section headed “Structure of the Global Offering” in this prospectus.
You will not be entitled to exercise any remedy of rescission for innocent misrepresentation at any
time after acceptance of your application. This does not affect any other right you may have.
HOW TO APPLY FOR HONG KONG OFFER SHARES
– 423 –

(E) CIRCUMSTANCES IN WHICH YOU WILL NOT BE ALLOCATED HONG KONG OFFERSHARES
You should note the following situations in which the Hong Kong Offer Shares will not be allocated
to you:
(a) If your application is revoked:
• By applying through the CCASS EIPO service or the HK eIPO White Form service,
you agree that your application or the application made by HKSCC Nominees on your
behalf cannot be revoked on or before the fifth day after the time of the opening of the
application lists (excluding for this purpose any day which is a Saturday, Sunday or
public holiday in Hong Kong). This agreement will take effect as a collateral contract
with our Company.
Your application or the application made by HKSCC Nominees on your behalf may only be revoked
on or before the fifth day after the time of the opening of the application lists (excluding for this purpose
any day which is a Saturday, Sunday or public holiday in Hong Kong) in the following circumstances:
(i) if a person responsible for this prospectus under Section 40 of the Companies (Winding Up and
Miscellaneous Provisions) Ordinance gives a public notice under that section which excludes
or limits that person’s responsibility for this prospectus; or
(ii) if any supplement to this prospectus is issued, in which case applicants who have already
submitted an application will be notified that they are required to confirm their applications.
If applicants have been so notified but have not confirmed their applications in accordance with
the procedure to be notified, all unconfirmed applications will be deemed revoked.
If your application or the application made by HKSCC Nominees on your behalf has been accepted,
it cannot be revoked. For this purpose, acceptance of applications which are not rejected will be
constituted by notification in the press of the results of allocation, and where such basis of allocation is
subject to certain conditions or provides for allocation by ballot, such acceptance will be subject to the
satisfaction of such conditions or results of the ballot, respectively.
(b) If our Company or its agents exercise their discretion to reject your application:
Our Company, the Joint Representatives, the HK eIPO White Form Service Provider and their
respective agents or nominees have full discretion to reject or accept any application, or to accept only part
of any application, without giving any reasons.
(c) If the allocation of Hong Kong Offer Shares is void:
The allocation of Hong Kong Offer Shares will be void if the Listing Committee does not grant
permission to list the Shares either:
• within three weeks from the closing date of the applications lists; or
HOW TO APPLY FOR HONG KONG OFFER SHARES
– 424 –

• within a longer period of up to six weeks if the Listing Committee notifies our Company
of that longer period within three weeks of the closing date of the application lists.
(d) If:
• you make multiple applications or are suspected of making multiple applications;
• you or the person for whose benefit you apply for, have applied for or taken up, or
indicated an interest for, or have been or will be placed or allocated (including
conditionally and/or provisionally) Hong Kong Offer Shares and International Offer
Shares;
• your payment is not made correctly;
• your electronic application instructions through the HK eIPO White Form service are
not completed in accordance with the instructions, terms and conditions in the IPO Appor on the designated website;
• you apply for more than 3,595,800 Hong Kong Offer Shares, being approximately 50%
of the 7,191,600 Hong Kong Offer Shares initially available under the Hong Kong Public
Offering;
• our Company or the Joint Representatives believe that by accepting your application, they
would violate applicable securities or other laws, rules or regulations; or
• the Underwriting Agreements do not become unconditional or are terminated.
(F) REFUND OF APPLICATION MONIES
If an application is rejected, not accepted or accepted in part only, or if the Offer Price as finally
determined is less than the maximum Offer Price per Offer Share (excluding brokerage, SFC transaction
levy and Stock Exchange trading fee payable thereon) paid on application, or if the conditions of the
Global Offering as set out in the section headed “Structure of the Global Offering – Conditions of the
Global Offering” in this prospectus are not satisfied or if any application is revoked, the application
monies, or the appropriate portion thereof, together with the related brokerage, SFC transaction levy and
Stock Exchange trading fee, will be refunded, without interest or the check or banker’s cashier order will
not be cleared.
Any refund of your application monies will be made on or before Wednesday, December 29, 2021.
(G) DISPATCH/COLLECTION OF SHARE CERTIFICATES AND REFUND MONIES
You will receive one Share certificate for all Hong Kong Offer Shares allocated to you under the
Hong Kong Public Offering (except pursuant to applications made through the CCASS EIPO service
where the Share certificates will be deposited into CCASS as described below).
No temporary document of title will be issued in respect of the Offer Shares. No receipt will be
issued for sums paid on application.
HOW TO APPLY FOR HONG KONG OFFER SHARES
– 425 –

Subject to arrangement on dispatch/collection of Share certificates and refund monies as mentioned
below, any refund cheque(s) and Share certificate(s) are expected to be posted on or before Wednesday,
December 29, 2021. The right is reserved to retain any Share certificate(s) and any surplus application
monies pending clearance of cheque(s) or banker’s cashier order(s).
Share certificates will only become valid at 8:00 a.m. on Thursday, December 30, 2021, provided
that the Global Offering has become unconditional in all respects at or before that time and the right of
termination set out in the section headed “Underwriting” in this prospectus has not been exercised.
Investors who trade Shares on the basis of publicly available allocation details or prior to the receipt of
Share certificates or prior to the Share certificates becoming valid do so entirely at their own risk.
Personal Collection
(a) If you apply through the HK eIPO White Form service:
• If you apply for 1,000,000 Hong Kong Offer Shares or more and your application is wholly or
partially successful, you may collect your Share certificate(s) (where applicable) in person
from the Share Registrar, Tricor Investor Services Limited, at Level 54, Hopewell Centre, 183
Queen’s Road East, Hong Kong, from 9:00 a.m. to 1:00 p.m. on Wednesday, December 29,
2021, or any other place or date notified by our Company in the newspapers as the date of
dispatch/collection of Share certificates/e-Auto Refund payment instructions/refund cheques.
• If you do not personally collect your Share certificate(s) within the time specified for
collection, they will be sent to the address specified in your application instructions by ordinary
post and at your own risk.
• If you apply for less than 1,000,000 Hong Kong Offer Shares, your Share certificate(s) (where
applicable) will be sent to the address specified in your application instructions on or before
Wednesday, December 29, 2021 by ordinary post and at your own risk.
• If you apply and pay the application monies from a single bank account, any refund monies will
be dispatched to that bank account in the form of e-Auto Refund payment instructions. If you
apply and pay the application monies from multiple bank accounts, any refund monies will be
dispatched to the address as specified in your application instructions in the form of refund
cheque(s) in your name (or, in the case of joint applications, the first-named applicant) by
ordinary post and at your own risk.
(b) If you apply through the CCASS EIPO service:
Allocation of Hong Kong Offer Shares
• For the purposes of allocating Hong Kong Offer Shares, HKSCC Nominees will not be treated
as an applicant. Instead, each CCASS Participant who gives electronic applicationinstructions or each person for whose benefit instructions are given will be treated as an
applicant.
HOW TO APPLY FOR HONG KONG OFFER SHARES
– 426 –

Deposit of Share Certificates into CCASS and Refund of Application Monies
• If your application is wholly or partially successful, your Share certificate(s) will be issued in
the name of HKSCC Nominees and deposited into CCASS for the credit of your designated
CCASS Participant’s stock account or your CCASS Investor Participant stock account on
Wednesday, December 29, 2021, or, on any other date determined by HKSCC or HKSCC
Nominees.
• Our Company expects to publish the application results of CCASS Participants (and where the
CCASS Participant is a broker or custodian, our Company will include information relating to
the relevant beneficial owner), your Hong Kong identity card number/passport or other
identification code (Hong Kong business registration number for corporations) and the basis of
allocations of the Hong Kong Offer Shares in the manner as described in “– (D) Publication of
Results” above on Wednesday, December 29, 2021. You should check the announcement
published by our Company and report any discrepancies to HKSCC before 5:00 p.m. on
Wednesday, December 29, 2021 or such other date as determined by HKSCC or HKSCC
Nominees.
• If you have instructed your broker or custodian to give electronic application instructions on
your behalf, you can also check the number of Hong Kong Offer Shares allocated to you and
the amount of refund monies (if any) payable to you with that broker or custodian.
• If you have applied as a CCASS Investor Participant, you can also check the number of Hong
Kong Offer Shares allocated to you and the amount of refund monies (if any) payable to you
via the CCASS Phone System and the CCASS Internet System (under the procedures contained
in HKSCC’s “An Operating Guide for Investor Participants” in effect from time to time) on
Wednesday, December 29, 2021. Immediately following the credit of the Hong Kong Offer
Shares to your stock account and the credit of the refund monies to your bank account, HKSCC
will also make available to you an activity statement showing the number of Hong Kong Offer
Shares credited to your CCASS Investor Participant stock account and the amount of refund
monies (if any) credited to your designated bank account.
• Refund of your application monies (if any) in respect of wholly and partially unsuccessful
applications and/or difference between the Offer Price and the maximum Offer Price per Offer
Share initially paid on application (including brokerage, SFC transaction levy and Stock
Exchange trading fee but without interest) will be credited to your designated bank account or
the designated bank account of your broker or custodian on Wednesday, December 29, 2021.
(H) ADMISSION OF THE SHARES INTO CCASS
If the Stock Exchange grants the listing of, and permission to deal in, the Shares and our Company
complies with the stock admission requirements of HKSCC, the Shares will be accepted as eligible
securities by HKSCC for deposit, clearance and settlement in CCASS with effect from the date of
commencement of dealings in the Shares on the Stock Exchange or any other date HKSCC chooses.
Settlement of transactions between Exchange Participants (as defined in the Listing Rules) is required to
take place in CCASS on the second settlement day after any trading day.
HOW TO APPLY FOR HONG KONG OFFER SHARES
– 427 –

All activities under CCASS are subject to the General Rules of CCASS and CCASS Operational
Procedures in effect from time to time.
Investors should seek the advice of their stockbroker or other professional adviser for details of the
settlement arrangements as such arrangements may affect their rights and interests.
All necessary arrangements have been made to enable the Shares to be admitted into CCASS.
HOW TO APPLY FOR HONG KONG OFFER SHARES
– 428 –

The following is the text of a report received from our Company’s reporting accountants, KPMG,
Certified Public Accountants, Hong Kong, for the purpose of incorporation in this document.
ACCOUNTANTS’ REPORT ON HISTORICAL FINANCIAL INFORMATION TO THE BOARD OFDIRECTORS OF CHERVON HOLDINGS LIMITED, CHINA INTERNATIONAL CAPITALCORPORATION HONG KONG SECURITIES LIMITED AND CITIGROUP GLOBAL MARKETSASIA LIMITED
Introduction
We report on the historical financial information of Chervon Holdings Limited (the “Company”) and
its subsidiaries (together, the “Group”) set out on pages I-5 to I-125, which comprises the consolidated
statements of financial position of the Group and the statements of financial position of the Company as
at December 31, 2018, 2019 and 2020 and June 30, 2021, the consolidated statements of profit or loss, the
consolidated statements of profit or loss and other comprehensive income, the consolidated statements of
changes in equity and the consolidated cash flow statements, for each of the years ended December 31,
2018, 2019 and 2020 and the six months ended June 30, 2021 (the “Relevant Periods”), and a summary
of significant accounting policies and other explanatory information (together, the “Historical Financial
Information”). The Historical Financial Information set out on pages I-5 to I-125 forms an integral part
of this report, which has been prepared for inclusion in the prospectus of the Company dated December
17, 2021 (the “Prospectus”) in connection with the initial listing of shares of the Company on the Main
Board of The Stock Exchange of Hong Kong Limited.
Directors’ responsibility for Historical Financial Information
The directors of the Company are responsible for the preparation of Historical Financial Information
that gives a true and fair view in accordance with the basis of preparation and presentation set out in Note
1 to the Historical Financial Information, and for such internal control as the directors of the Company
determine is necessary to enable the preparation of the Historical Financial Information that is free from
material misstatement, whether due to fraud or error.
Reporting accountants’ responsibility
Our responsibility is to express an opinion on the Historical Financial Information and to report our
opinion to you. We conducted our work in accordance with Hong Kong Standard on Investment Circular
Reporting Engagements 200 “Accountants’ Reports on Historical Financial Information in Investment
Circulars” issued by the Hong Kong Institute of Certified Public Accountants (“HKICPA”). This standard
requires that we comply with ethical standards and plan and perform our work to obtain reasonable
assurance about whether the Historical Financial Information is free from material misstatement.
APPENDIX I ACCOUNTANTS’ REPORT
– I-1 –

Our work involved performing procedures to obtain evidence about the amounts and disclosures in
the Historical Financial Information. The procedures selected depend on the reporting accountants’
judgement, including the assessment of risks of material misstatement of the Historical Financial
Information, whether due to fraud or error. In making those risk assessments, the reporting accountants
consider internal control relevant to the entity’s preparation of Historical Financial Information that gives
a true and fair view in accordance with the basis of preparation and presentation set out in Note 1 to the
Historical Financial Information in order to design procedures that are appropriate in the circumstances,
but not for the purpose of expressing an opinion on the effectiveness of the entity’s internal control. Our
work also included evaluating the appropriateness of accounting policies used and the reasonableness of
accounting estimates made by the directors, as well as evaluating the overall presentation of the Historical
Financial Information.
We believe that the evidence we have obtained is sufficient and appropriate to provide a basis for
our opinion.
Opinion
In our opinion, the Historical Financial Information gives, for the purpose of the accountants’ report,
a true and fair view of the Company’s and the Group’s financial position as at December 31, 2018, 2019
and 2020 and June 30, 2021 and of the Group’s financial performance and cash flows for the Relevant
Periods in accordance with the basis of preparation and presentation set out in Note 1 to the Historical
Financial Information.
Review of stub period corresponding financial information
We have reviewed the stub period corresponding financial information of the Group which comprises
the consolidated statement of profit or loss, the consolidated statement of profit or loss and other
comprehensive income, the consolidated statement of changes in equity and the consolidated cash flow
statement for the six months ended June 30, 2020 and other explanatory information (the “Stub Period
Corresponding Financial Information”). The directors of the Company are responsible for the preparation
and presentation of the Stub Period Corresponding Financial Information in accordance with the basis of
preparation and presentation set out in Note 1 to the Historical Financial Information. Our responsibility
is to express a conclusion on the Stub Period Corresponding Financial Information based on our review.
We conducted our review in accordance with International Standard on Review Engagements 2410
“Review of Interim Financial Information Performed by the Independent Auditor of the Entity” issued by
the HKICPA. A review consists of making enquiries, primarily of persons responsible for financial and
accounting matters, and applying analytical and other review procedures. A review is substantially less in
scope than an audit conducted in accordance with Hong Kong Standards on Auditing and consequently
does not enable us to obtain assurance that we would become aware of all significant matters that might
be identified in an audit. Accordingly, we do not express an audit opinion. Based on our review, nothing
has come to our attention that causes us to believe that the Stub Period Corresponding Financial
Information, for the purpose of the accountants’ report, is not prepared, in all material respects, in
accordance with the basis of preparation and presentation set out in Note 1 to the Historical Financial
Information.
APPENDIX I ACCOUNTANTS’ REPORT
– I-2 –
Report on matters under the Rules Governing the Listing of Securities on The Stock Exchange ofHong Kong Limited and the Companies (Winding Up and Miscellaneous Provisions) Ordinance
Adjustments
In preparing the Historical Financial Information, no adjustments to the Underlying Financial
Statements as defined on page I-4 have been made.
Dividends
We refer to Note 36(b) to the Historical Financial Information which contains information about the
dividends paid by the Company in respect of the Relevant Periods.
Section 436 of the Companies (Winding Up and Miscellaneous Provisions) Ordinance
The Historical Financial Information contained in this Prospectus does not constitute the Company’s
statutory annual consolidated financial statements for the years ended 31 December 2018, 2019 or 2020
but is derived from those financial statements. Further information relating to these statutory financial
statements required to be disclosed in accordance with section 436 of the Companies Ordinance is as
follows:
As the Company is a private company, the Company is not required to deliver its financial statements
to the Registrar of Companies, and has not done so.
The Company’s auditors have reported on these financial statements for the three years. The
auditors’ reports were unqualified; did not include a reference to any matters to which the auditor drew
attention by way of emphasis; and did not contain a statement under either sections 406(2), 407(2) or (3)
of the Companies Ordinance.
KPMG
Certified Public Accountants
8th Floor, Prince’s Building
10 Chater Road
Central, Hong Kong
December 17, 2021
APPENDIX I ACCOUNTANTS’ REPORT
– I-3 –

HISTORICAL FINANCIAL INFORMATION
Set out below is the Historical Financial Information which forms an integral part of this
accountants’ report.
The consolidated financial statements of the Group for the Relevant Periods, on which the Historical
Financial Information is based, were audited by KPMG Huazhen LLP in accordance with Hong Kong
Standards on Auditing issued by the HKICPA (the “Underlying Financial Statements”).
APPENDIX I ACCOUNTANTS’ REPORT
– I-4 –

CONSOLIDATED STATEMENTS OF PROFIT OR LOSS(Expressed in US dollar)
Year ended December 31,Six months ended
June 30,
Note 2018 2019 2020 2020 2021
USD’000 USD’000 USD’000 USD’000 USD’000(unaudited)
Revenue 4 690,698 843,578 1,200,902 514,359 868,797Cost of sales (515,173) (588,325) (832,190) (366,701) (617,688)
Gross profit 175,525 255,253 368,712 147,658 251,109Other revenue 5(a) 3,515 3,838 5,801 2,791 2,081Other net (loss)/gain 5(b) (8,192) 943 (3,140) (1,647) 19,754Selling and distributionexpenses (100,527) (128,083) (179,447) (73,411) (96,418)Administrative and otheroperating expenses (45,378) (48,932) (82,843) (25,280) (32,614)Research anddevelopment costs (27,656) (31,356) (38,939) (16,984) (27,967)
(Loss)/profit fromoperations (2,713) 51,663 70,144 33,127 115,945Net finance costs 6(a) (17,164) (19,754) (17,357) (8,070) (7,895)Share of profits ofassociates 17 4,287 9,206 6,724 155 2,801Share of profits of a jointventure 18 1,176 1,233 – – –
(Loss)/profit beforetaxation 6 (14,414) 42,348 59,511 25,212 110,851Income taxcredit/(expense) 7 957 (6,266) (11,123) (4,721) (19,612)
(Loss)/profit for theyear/period (13,457) 36,082 48,388 20,491 91,239
Attributable to:Equity shareholders ofthe Company (14,084) 33,976 44,359 18,062 86,062Non-controlling interests 627 2,106 4,029 2,429 5,177
(Loss)/profit for theyear/period (13,457) 36,082 48,388 20,491 91,239
Earnings per share 11Basic (USD) (0.04) 0.09 0.11 0.05 0.21
Diluted (USD) (0.04) 0.09 0.11 0.05 0.21
The accompanying notes form part of the Historical Financial Information.
APPENDIX I ACCOUNTANTS’ REPORT
– I-5 –

CONSOLIDATED STATEMENTS OF PROFIT OR LOSS AND OTHER COMPREHENSIVEINCOME(Expressed in US dollar)
Year ended December 31,Six months ended
June 30,
Note 2018 2019 2020 2020 2021
USD’000 USD’000 USD’000 USD’000 USD’000(unaudited)
(Loss)/profit for theyear/period (13,457) 36,082 48,388 20,491 91,239
Other comprehensiveincome for theyear/period (after taxadjustments) 10Item that will not bereclassified to profit orloss:Remeasurement of netdefined benefit liability,net of tax (19) (86) (39) (20) (25)Item that may bereclassified subsequentlyto profit or loss:Exchange difference ontranslation of financialstatements of subsidiarieswith functionalcurrencies other than USdollar (“USD”) (4,843) (1,258) 17,451 (5,661) 818
Other comprehensiveincome for theyear/period (4,862) (1,344) 17,412 (5,681) 793
Total comprehensiveincome for theyear/period (18,319) 34,738 65,800 14,810 92,032
Attributable to:Equity shareholders ofthe Company (18,160) 32,329 60,221 12,616 86,809Non-controlling interests (159) 2,409 5,579 2,194 5,223
Total comprehensiveincome for theyear/period (18,319) 34,738 65,800 14,810 92,032
The accompanying notes form part of the Historical Financial Information.
APPENDIX I ACCOUNTANTS’ REPORT
– I-6 –

CONSOLIDATED STATEMENTS OF FINANCIAL POSITION(Expressed in US dollar)
As at December 31,As at
June 30,
Note 2018 2019 2020 2021
USD’000 USD’000 USD’000 USD’000
Non-current assetsProperties, plants and equipment 12 109,520 120,020 143,020 165,654Right-of-use assets 13 41,720 40,829 42,629 42,048Investment properties 14 1,614 1,384 1,262 –Intangible assets 15 2,347 2,050 1,754 1,605Interest in associates 17 49,069 58,011 57,201 58,268Interest in a joint venture 18 6,865 – – –Prepayments, deposits and otherreceivables 24 4,663 3,485 4,455 5,764Financial assets at fair value throughprofit or loss (“FVPL”) 20 20,718 17,267 5,849 5,938Deferred tax assets 30(b) 21,415 21,217 24,178 21,480
257,931 264,263 280,348 300,757
Current assetsFinancial assets at FVPL 20 12,380 3,595 5,372 2,785Derivative financial instruments 21 481 956 5,827 3,107Inventories 22 214,919 297,645 288,680 378,912Right to returned goods asset 1,921 2,078 5,618 4,198Trade and bills receivables 23 127,347 135,233 254,368 319,089Prepayments, deposits and otherreceivables 24 21,450 28,386 40,170 22,858Taxation recoverable 30(a) 11,402 17,764 21,975 22,907Pledged deposits 25(b) 24,713 23,193 22,172 63,491Cash and cash equivalents 25(a) 73,266 94,064 166,937 238,582
487,879 602,914 811,119 1,055,929
Current liabilitiesBank loans 26 316,231 337,558 290,459 395,832Derivative financial instruments 21 3,694 1,294 289 618Lease liabilities 27 1,653 2,122 3,161 3,361Trade and bills payables 28 138,883 163,808 247,529 350,691Other payables and accruals 29 56,499 87,891 130,137 157,561Taxation payable 30(a) 2,371 3,909 6,628 15,069Warranty provision 31 7,273 8,394 15,175 18,796Refund liabilities from right of return 32 2,622 3,077 8,218 5,914
529,226 608,053 701,596 947,842
Net current (liabilities)/assets (41,347) (5,139) 109,523 108,087
Total assets less current liabilities 216,584 259,124 389,871 408,844
The accompanying notes form part of the Historical Financial Information.
APPENDIX I ACCOUNTANTS’ REPORT
– I-7 –

As at December 31,As at
June 30,
Note 2018 2019 2020 2021
USD’000 USD’000 USD’000 USD’000
Non-current liabilities
Bank loans 26 13,287 19,167 47,402 8,722Lease liabilities 27 13,812 13,693 13,517 12,872Warranty provision 31 13,121 15,246 30,775 32,215Deferred income 33 4,131 3,974 4,152 4,145Defined benefit retirement plans
obligation 34 922 921 972 956Deferred tax liabilities 30(b) 4,196 5,285 9,029 11,012
49,469 58,286 105,847 69,922
NET ASSETS 167,115 200,838 284,024 338,922
CAPITAL AND RESERVESShare capital 36 50,279 50,279 50,279 58,135Reserves 36 99,523 131,852 209,459 280,787
Total equity attributable to equityshareholders of the Company 149,802 182,131 259,738 338,922Non-controlling interests 17,313 18,707 24,286 –
TOTAL EQUITY 167,115 200,838 284,024 338,922
The accompanying notes form part of the Historical Financial Information.
APPENDIX I ACCOUNTANTS’ REPORT
– I-8 –
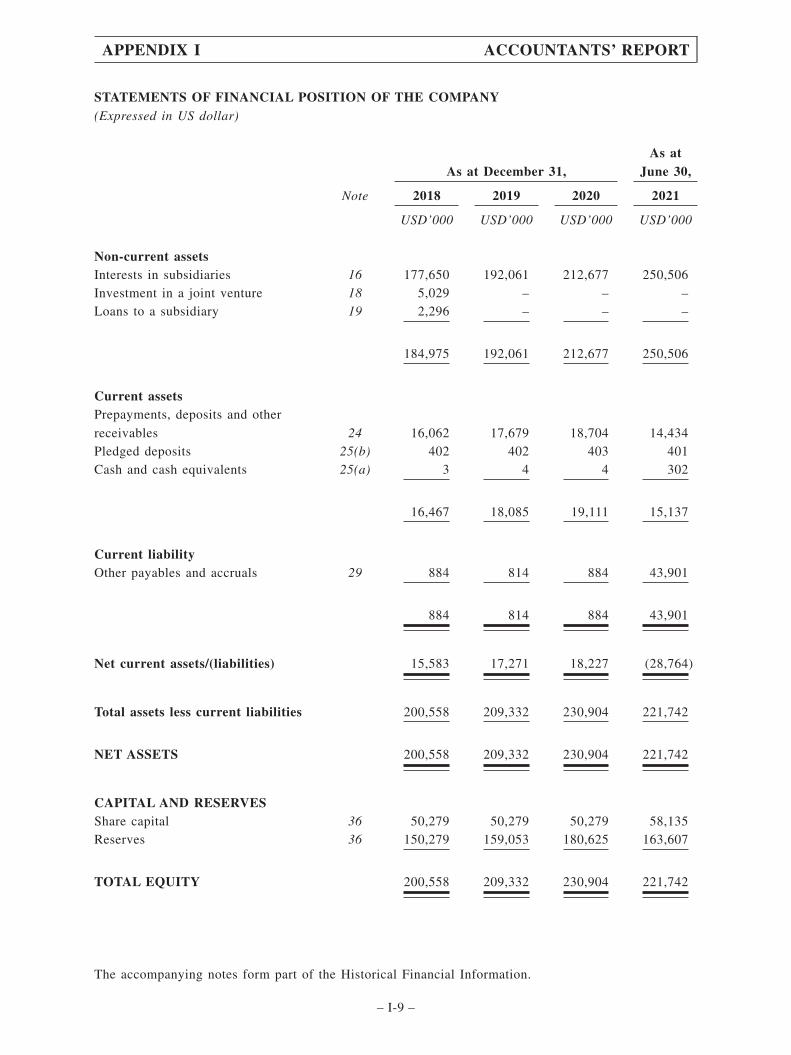
STATEMENTS OF FINANCIAL POSITION OF THE COMPANY(Expressed in US dollar)
As at December 31,As at
June 30,
Note 2018 2019 2020 2021
USD’000 USD’000 USD’000 USD’000
Non-current assetsInterests in subsidiaries 16 177,650 192,061 212,677 250,506Investment in a joint venture 18 5,029 – – –Loans to a subsidiary 19 2,296 – – –
184,975 192,061 212,677 250,506
Current assetsPrepayments, deposits and other
receivables 24 16,062 17,679 18,704 14,434Pledged deposits 25(b) 402 402 403 401Cash and cash equivalents 25(a) 3 4 4 302
16,467 18,085 19,111 15,137
Current liabilityOther payables and accruals 29 884 814 884 43,901
884 814 884 43,901
Net current assets/(liabilities) 15,583 17,271 18,227 (28,764)
Total assets less current liabilities 200,558 209,332 230,904 221,742
NET ASSETS 200,558 209,332 230,904 221,742
CAPITAL AND RESERVESShare capital 36 50,279 50,279 50,279 58,135Reserves 36 150,279 159,053 180,625 163,607
TOTAL EQUITY 200,558 209,332 230,904 221,742
The accompanying notes form part of the Historical Financial Information.
APPENDIX I ACCOUNTANTS’ REPORT
– I-9 –
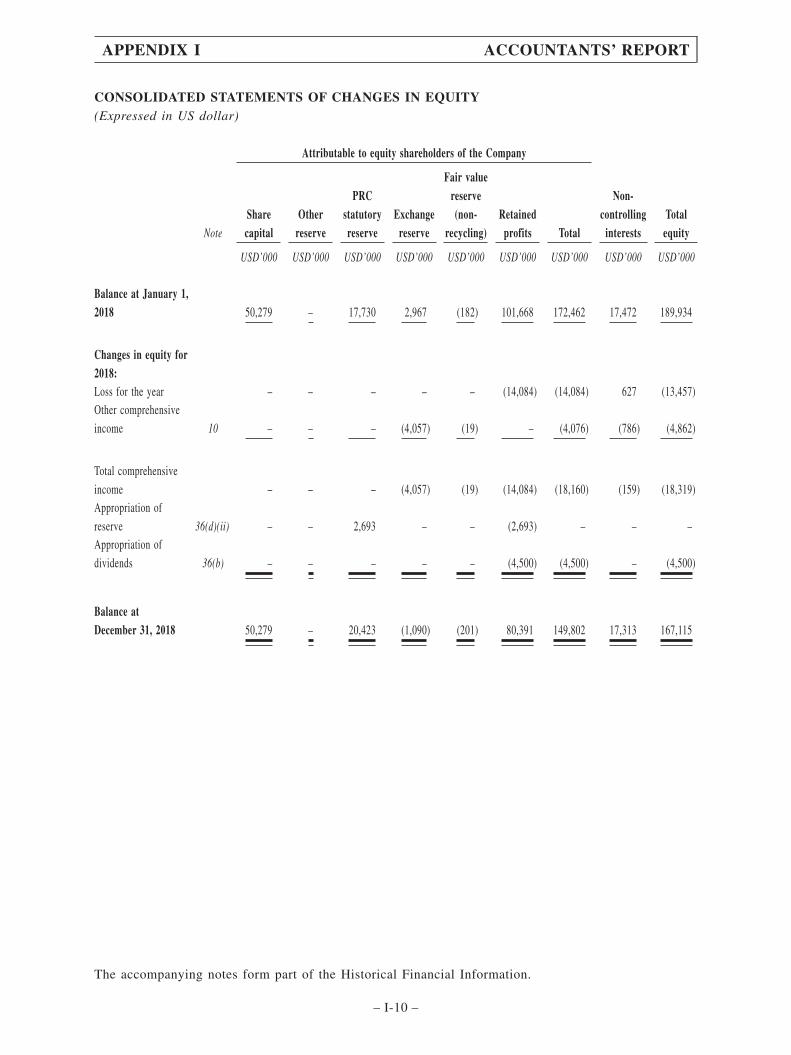
CONSOLIDATED STATEMENTS OF CHANGES IN EQUITY(Expressed in US dollar)
Attributable to equity shareholders of the Company
Note
Sharecapital
Otherreserve
PRCstatutoryreserve
Exchangereserve
Fair valuereserve(non-
recycling)Retained
profits Total
Non-controlling
interestsTotal
equity
USD’000 USD’000 USD’000 USD’000 USD’000 USD’000 USD’000 USD’000 USD’000
Balance at January 1,2018 50,279 – 17,730 2,967 (182) 101,668 172,462 17,472 189,934
Changes in equity for2018:Loss for the year – – – – – (14,084) (14,084) 627 (13,457)Other comprehensive
income 10 – – – (4,057) (19) – (4,076) (786) (4,862)
Total comprehensive
income – – – (4,057) (19) (14,084) (18,160) (159) (18,319)Appropriation of
reserve 36(d)(ii) – – 2,693 – – (2,693) – – –Appropriation of
dividends 36(b) – – – – – (4,500) (4,500) – (4,500)
Balance atDecember 31, 2018 50,279 – 20,423 (1,090) (201) 80,391 149,802 17,313 167,115
The accompanying notes form part of the Historical Financial Information.
APPENDIX I ACCOUNTANTS’ REPORT
– I-10 –

Attributable to equity shareholders of the Company
Note
Sharecapital
Otherreserve
PRCstatutoryreserve
Exchangereserve
Fair valuereserve(non-
recycling)Retained
profits Total
Non-controlling
interestsTotal
equity
USD’000 USD’000 USD’000 USD’000 USD’000 USD’000 USD’000 USD’000 USD’000
Balance atDecember 31, 2018and January 1, 2019 50,279 – 20,423 (1,090) (201) 80,391 149,802 17,313 167,115
Changes in equity for2019:Profit for the year – – – – – 33,976 33,976 2,106 36,082Other comprehensive
income 10 – – – (1,561) (86) – (1,647) 303 (1,344)
Total comprehensive
income – – – (1,561) (86) 33,976 32,329 2,409 34,738Appropriation of
reserve 36(d)(ii) – – 4,075 – – (4,075) – – –Disposal of a
subsidiary 25(g) – – – – – – – (1,015) (1,015)
Balance atDecember 31, 2019 50,279 – 24,498 (2,651) (287) 110,292 182,131 18,707 200,838
The accompanying notes form part of the Historical Financial Information.
APPENDIX I ACCOUNTANTS’ REPORT
– I-11 –
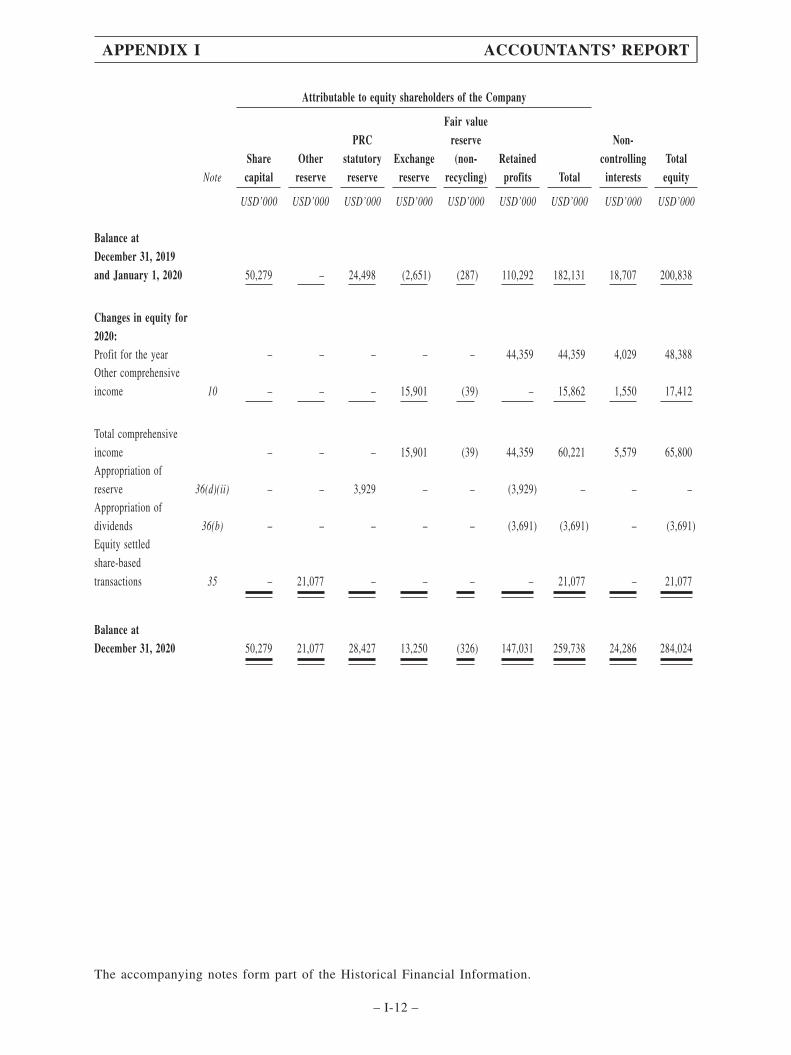
Attributable to equity shareholders of the Company
Note
Sharecapital
Otherreserve
PRCstatutoryreserve
Exchangereserve
Fair valuereserve(non-
recycling)Retained
profits Total
Non-controlling
interestsTotal
equity
USD’000 USD’000 USD’000 USD’000 USD’000 USD’000 USD’000 USD’000 USD’000
Balance atDecember 31, 2019and January 1, 2020 50,279 – 24,498 (2,651) (287) 110,292 182,131 18,707 200,838
Changes in equity for2020:Profit for the year – – – – – 44,359 44,359 4,029 48,388Other comprehensive
income 10 – – – 15,901 (39) – 15,862 1,550 17,412
Total comprehensive
income – – – 15,901 (39) 44,359 60,221 5,579 65,800Appropriation of
reserve 36(d)(ii) – – 3,929 – – (3,929) – – –Appropriation of
dividends 36(b) – – – – – (3,691) (3,691) – (3,691)Equity settled
share-based
transactions 35 – 21,077 – – – – 21,077 – 21,077
Balance atDecember 31, 2020 50,279 21,077 28,427 13,250 (326) 147,031 259,738 24,286 284,024
The accompanying notes form part of the Historical Financial Information.
APPENDIX I ACCOUNTANTS’ REPORT
– I-12 –

Attributable to equity shareholders of the Company
Note
Sharecapital
Otherreserve
PRCstatutoryreserve
Exchangereserve
Fair valuereserve(non-
recycling)Retained
profits Total
Non-controlling
interestsTotal
equity
USD’000 USD’000 USD’000 USD’000 USD’000 USD’000 USD’000 USD’000 USD’000
Balance atDecember 31, 2020and January 1, 2021 50,279 21,077 28,427 13,250 (326) 147,031 259,738 24,286 284,024
Changes in equity forthe six months endedJune 30, 2021:Profit for the
six-month period – – – – – 86,062 86,062 5,177 91,239Other comprehensive
income 10 – – – 772 (25) – 747 46 793
Total comprehensive
income – – – 772 (25) 86,062 86,809 5,223 92,032Appropriation of
dividends 36(b) – – – – – (15,000) (15,000) – (15,000)Issuance of ordinary
shares 36(c) 7,856 – – – – – 7,856 – 7,856Acquisition of
non-controlling
interests – (481) – – – – (481) (27,945) (28,426)Disposal of a
subsidiary 25(g) – – – – – – – (1,564) (1,564)
Balance at June 30,2021 58,135 20,596 28,427 14,022 (351) 218,093 338,922 – 338,922
The accompanying notes form part of the Historical Financial Information.
APPENDIX I ACCOUNTANTS’ REPORT
– I-13 –

Attributable to equity shareholders of the Company
Note
Sharecapital
Otherreserve
PRCstatutoryreserve
Exchangereserve
Fair valuereserve(non-
recycling)Retained
profits Total
Non-controlling
interestsTotal
equity
USD’000 USD’000 USD’000 USD’000 USD’000 USD’000 USD’000 USD’000 USD’000
(Unaudited)Balance atDecember 31, 2019and January 1, 2020 50,279 – 24,498 (2,651) (287) 110,292 182,131 18,707 200,838
Changes in equitythe six months endedJune 30, 2020:Profit for the
six-month period – – – – – 18,062 18,062 2,429 20,491Other comprehensive
income 10 – – – (5,426) (20) – (5,446) (235) (5,681)
Total comprehensive
income – – – (5,426) (20) 18,062 12,616 2,194 14,810
Balance at June 30,2020 50,279 – 24,498 (8,077) (307) 128,354 194,747 20,901 215,648
The accompanying notes form part of the Historical Financial Information.
APPENDIX I ACCOUNTANTS’ REPORT
– I-14 –

CONSOLIDATED CASH FLOW STATEMENTS(Expressed in US dollar)
Year ended December 31,Six months ended
June 30,
Note 2018 2019 2020 2020 2021
USD’000 USD’000 USD’000 USD’000 USD’000(unaudited)
Operating activitiesCash generated from
operations 25(c) 15,749 49,638 144,846 74,488 96,509Tax paid 30(a) (7,606) (10,061) (11,117) (8,231) (7,407)
Net cash generated fromoperating activities 8,143 39,577 133,729 66,257 89,102
Investing activitiesPayment for the acquisition of
properties, plants and
equipment (26,292) (25,591) (31,557) (15,778) (36,103)Proceeds from disposal of
properties, plants and
equipment 477 341 542 271 86Proceeds from disposal of
financial assets measured at
fair value through
profit or loss 56,602 143,707 144,091 71,964 125,480Payment for acquisition of
financial assets measured at
fair value through
profit or loss (53,977) (141,917) (133,541) (66,771) (123,263)Acquisition of subsidiaries, net 25(f) – (3,330) – – –Disposal of subsidiaries, net 25(g) – (291) – – 32,740Disposal of associate, net – – – – 1,287Dividends received 1,003 1,018 4,167 – –Interest received 247 605 638 239 460
Net cash (used in)/generatedfrom investing activities (21,940) (25,458) (15,660) (10,075) 687
The accompanying notes form part of the Historical Financial Information.
APPENDIX I ACCOUNTANTS’ REPORT
– I-15 –
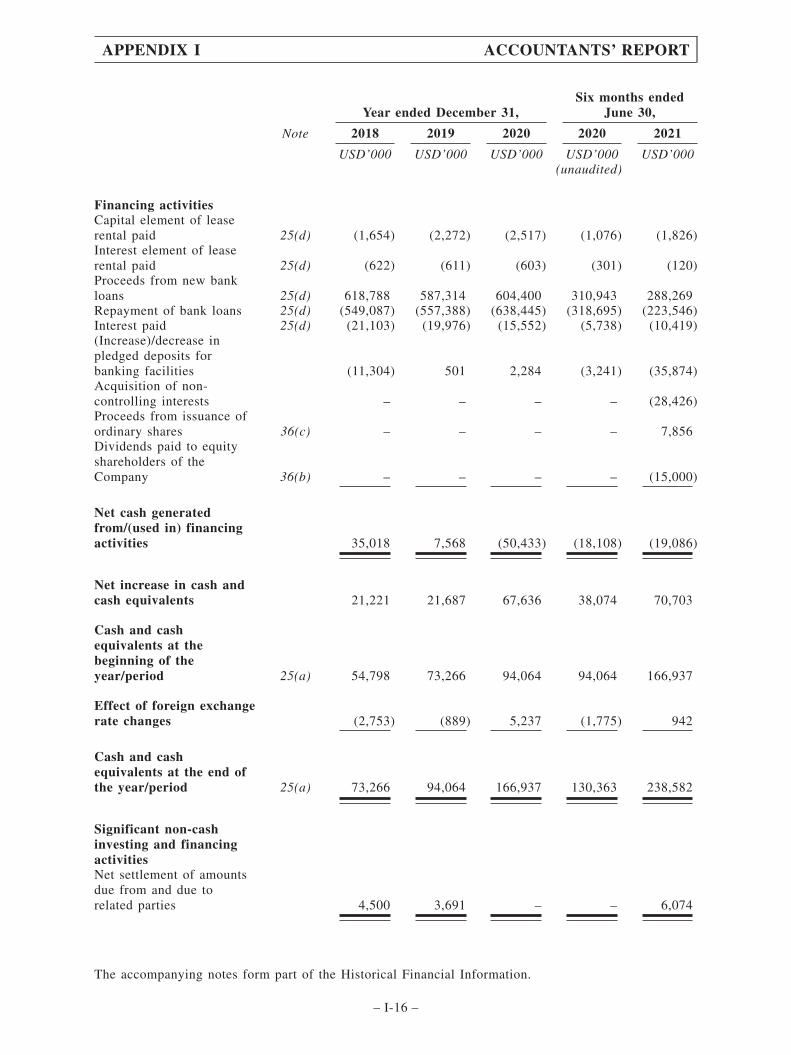
Year ended December 31,Six months ended
June 30,
Note 2018 2019 2020 2020 2021
USD’000 USD’000 USD’000 USD’000 USD’000(unaudited)
Financing activitiesCapital element of leaserental paid 25(d) (1,654) (2,272) (2,517) (1,076) (1,826)Interest element of leaserental paid 25(d) (622) (611) (603) (301) (120)Proceeds from new bankloans 25(d) 618,788 587,314 604,400 310,943 288,269Repayment of bank loans 25(d) (549,087) (557,388) (638,445) (318,695) (223,546)Interest paid 25(d) (21,103) (19,976) (15,552) (5,738) (10,419)(Increase)/decrease inpledged deposits forbanking facilities (11,304) 501 2,284 (3,241) (35,874)Acquisition of non-controlling interests – – – – (28,426)Proceeds from issuance ofordinary shares 36(c) – – – – 7,856Dividends paid to equityshareholders of theCompany 36(b) – – – – (15,000)
Net cash generatedfrom/(used in) financingactivities 35,018 7,568 (50,433) (18,108) (19,086)
Net increase in cash andcash equivalents 21,221 21,687 67,636 38,074 70,703
Cash and cashequivalents at thebeginning of theyear/period 25(a) 54,798 73,266 94,064 94,064 166,937
Effect of foreign exchangerate changes (2,753) (889) 5,237 (1,775) 942
Cash and cashequivalents at the end ofthe year/period 25(a) 73,266 94,064 166,937 130,363 238,582
Significant non-cashinvesting and financingactivitiesNet settlement of amountsdue from and due torelated parties 4,500 3,691 – – 6,074
The accompanying notes form part of the Historical Financial Information.
APPENDIX I ACCOUNTANTS’ REPORT
– I-16 –

NOTES TO THE HISTORICAL FINANCIAL INFORMATION
1 Basis of preparation and presentation of Historical Financial Information
Chervon Holdings Limited (the “Company”) was incorporated in Hong Kong on February 19, 1999
as a limited liability company with its registered office at Unit 04, 22/F, Saxon Tower, 7 Cheung Shun
Street, Lai Chi Kok, Kln, Hong Kong.
The Company is an investment holding company. The Company and its subsidiaries (together, “the
Group”) are principally engaged in researching, developing, manufacturing, testing, sales, and after-sale
services for power tools, outdoor power equipment and related products. The information of the principal
subsidiaries is set out in Note 16.
The Historical Financial Information has been prepared in accordance with all applicable Hong Kong
Financial Reporting Standards (“HKFRSs”) which collective term includes all applicable individual Hong
Kong Financial Reporting Standards, Hong Kong Accounting Standards and Interpretations issued by the
HKICPA. Further details of the significant accounting policies adopted are set out in Note 2.
The HKICPA has issued a number of new and revised HKFRSs. For the purpose of preparing this
Historical Financial Information, the Group has adopted all applicable new and revised HKFRSs to the
Relevant Periods. The accounting policies set out in Note 2 have been applied consistently throughout the
Relevant Periods and the Group has not adopted any new standards or interpretations that are effective for
the accounting year beginning on or after January 1, 2021. The revised and new accounting standards and
interpretations issued which effective for the accounting years beginning on or after January 1, 2021 and
not yet adopted by the Group are set out in Note 42.
The Historical Financial Information also complies with the applicable disclosure provisions of the
Rules Governing the Listing of Securities on The Stock Exchange of Hong Kong Limited (the “Stock
Exchange”).
The accounting policies set out below have been applied consistently to all periods presented in the
Historical Financial Information.
The Stub Period Corresponding Financial Information has been prepared in accordance with the
same basis of preparation and presentation adopted in respect of the Historical Financial Information.
2 Significant accounting policies
(a) Basis of measurement
The Historical Financial Information is presented in USD, rounded to the nearest thousand,
unless otherwise indicated.
The measurement basis used in the preparation of the Historical Financial Information is the
historical cost basis except that the following assets and liabilities are stated at their fair value as
explained in the accounting policies as set out below.
APPENDIX I ACCOUNTANTS’ REPORT
– I-17 –

(b) Use of estimates and judgements
The preparation of financial statements in conformity with HKFRSs requires management to
make judgements, estimates and assumptions that affect the application of policies and reported
amounts of assets, liabilities, income and expenses. The estimates and associated assumptions are
based on historical experience and various other factors that are believed to be reasonable under the
circumstances, the results of which form the basis of making the judgements about carrying values
of assets and liabilities that are not readily apparent from other sources. Actual results may differ
from these estimates.
The estimates and underlying assumptions are reviewed on an ongoing basis. Revisions to
accounting estimates are recognized in the period in which the estimate is revised if the revision
affects only that period, or in the period of the revision and future periods if the revision affects both
current and future periods.
Judgements made by management in the application of HKFRSs that have significant effect on
the financial statements and major sources of estimation uncertainty are discussed in Note 3.
(c) Subsidiaries and non-controlling interests
Subsidiaries are entities controlled by the Group. The Group controls an entity when it is
exposed, or has rights, to variable returns from its involvement with the entity and has the ability to
affect those returns through its power over the entity. When assessing whether the Group has power,
only substantive rights (held by the Group and other parties) are considered.
An investment in a subsidiary is consolidated into the Historical Financial Information from the
date that control commences until the date that control ceases. Intra-group balances and transactions
and cash flows and any unrealized profits arising from intra-group transactions are eliminated in full
in preparing the Historical Financial Information. Unrealized losses resulting from intra-group
transactions are eliminated in the same way as unrealized gains but only to the extent that there is
no evidence of impairment.
Non-controlling interests represent the equity in a subsidiary not attributable directly or
indirectly to the Company, and in respect of which the Group has not agreed any additional terms
with the holders of those interests which would result in the Group as a whole having a contractual
obligation in respect of those interests that meets the definition of a financial liability. For each
business combination, the Group can elect to measure any non-controlling interests either at fair
value or at the non-controlling interests’ proportionate share of the subsidiary’s net identifiable
assets.
Non-controlling interests are presented in the consolidated statement of financial position
within equity, separately from equity attributable to the equity shareholders of the Company.
Non-controlling interests in the results of the Group are presented on the face of the consolidated
statement of profit or loss and the consolidated statement of profit or loss and other comprehensive
income as an allocation of the total profit or loss and total comprehensive income for the year
between non-controlling interests and the equity shareholders of the Company. Loans from holders
APPENDIX I ACCOUNTANTS’ REPORT
– I-18 –
of non-controlling interests and other contractual obligations towards these holders are presented as
financial liabilities in the consolidated statement of financial position in accordance with Notes 2(q)
or (r) depending on the nature of the liability.
Changes in the Group’s interests in a subsidiary that do not result in a loss of control are
accounted for as equity transactions, whereby adjustments are made to the amounts of controlling
and non-controlling interests within consolidated equity to reflect the change in relative interests, but
no adjustments are made to goodwill and no gain or loss is recognized.
When the Group loses control of a subsidiary, it is accounted for as a disposal of the entire
interest in that subsidiary, with a resulting gain or loss being recognized in profit or loss. Any interest
retained in that former subsidiary at the date when control is lost is recognized at fair value and this
amount is regarded as the fair value on initial recognition of a financial asset or, when appropriate,
the cost on initial recognition of an investment in an associate or joint venture.
In the Company’s statement of financial position, an investment in a subsidiary is stated at cost
less impairment losses (see Note 2(l)(ii)), unless the investment is classified as held for sale (or
included in a disposal group that is classified as held for sale).
(d) Associates and a joint venture
An associate is an entity in which the Group has significant influence, but not control or joint
control, over its management, including participation in the financial and operating policy decisions.
A joint venture is an arrangement whereby the Group and other parties contractually agree to
share control of the arrangement and have rights to the net assets of the arrangement.
An investment in an associate or a joint venture is accounted for in the Historical Financial
Information under the equity method, unless it is classified as held for sale (or included in a disposal
group that is classified as held for sale). Under the equity method, the investment is initially recorded
at cost, adjusted for any excess of the Group’s share of the acquisition-date fair values of the
investee’s identifiable net assets over the cost of the investment (if any). The cost of the investment
includes purchase price, other costs directly attributable to the acquisition of the investment, and any
direct investment into the associate or joint venture that forms part of the Group’s equity investment.
Thereafter, the investment is adjusted for the post acquisition change in the Group’s share of the
investee’s net assets and any impairment loss relating to the investment (see Note 2(l)(ii)). Any the
Group’s share of the post-acquisition, post-tax results of the investees and any impairment losses for
the year are recognized in the consolidated statements of profit or loss, whereas the Group’s share
of the post-acquisition post-tax items of the investees’ other comprehensive income is recognized in
the consolidated statements of profit or loss and other comprehensive income.
When the Group’s share of losses exceeds its interest in the associate or the joint venture, the
Group’s interest is reduced to nil and recognition of further losses is discontinued except to the
extent that the Group has incurred legal or constructive obligations or made payments on behalf of
the investee. For this purpose, the Group’s interest is the carrying amount of the investment under
the equity method together with any other long-term interests that in substance form part of the
Group’s net investment in the associate or the joint venture.
APPENDIX I ACCOUNTANTS’ REPORT
– I-19 –

Unrealized profits and losses resulting from transactions between the Group and the associates
or the joint venture are eliminated to the extent of the Group’s interest in the investee, except where
unrealized losses provide evidence of an impairment of the asset transferred, in which case they are
recognized immediately in profit or loss.
When the Group ceases to have significant influence over an associate or joint control over a
joint venture, it is accounted for as a disposal of the entire interest in that investee, with a resulting
gain or loss being recognized in profit or loss. Any interest retained in that former investee at the
date when significant influence or joint control is lost is recognized at fair value and this amount is
regarded as the fair value on initial recognition of a financial asset (see Note 2(f)).
In the company’s statement of financial position, investments in associates and joint venture
are stated at cost less impairment losses (see Note 2(l)(ii)), unless classified as held for sale (or
included in a disposal group that is classified as held for sale).
(e) Business combinations and goodwill
Business combinations are accounted for using the acquisition method. The consideration
transferred is measured at the acquisition date fair value which is the sum of the acquisition date fair
values of assets transferred by the Group, liabilities assumed by the Group to the former owners of
the acquiree and the equity interests issued by the Group in exchange for control of the acquiree. For
each business combination, the Group elects whether to measure the non-controlling interests in the
acquiree that are present ownership interests and entitle their holders to a proportionate share of net
assets in the event of liquidation at fair value or at the proportionate share of the acquiree’s
identifiable net assets. All other components of non-controlling interests are measured at fair value.
Acquisition-related costs are expensed as incurred.
The Group determines that it has acquired a business when the acquired set of activities and
assets includes an input and a substantive process that together significantly contribute to the ability
to create outputs.
When the Group acquires a business, it assesses the financial assets and liabilities assumed for
appropriate classification and designation in accordance with the contractual terms, economic
circumstances and pertinent conditions as at the acquisition date. This includes the separation of
embedded derivatives in host contracts of the acquiree.
If the business combination is achieved in stages, the previously held equity interest is
remeasured at its acquisition date fair value and any resulting gain or loss is recognised in profit or
loss.
Any contingent consideration to be transferred by the acquirer is recognised at fair value at the
acquisition date. Contingent consideration classified as an asset or liability is measured at fair value
with changes in fair value recognised in profit or loss. Contingent consideration that is classified as
equity is not remeasured and subsequent settlement is accounted for within equity.
APPENDIX I ACCOUNTANTS’ REPORT
– I-20 –

Goodwill represents the excess of
(i) the aggregate of the fair value of the consideration transferred, the amount of any
non-controlling interest in the acquiree and the fair value of the Group’s previously held
equity interest in the acquiree; over
(ii) the net fair value of the acquiree’s identifiable assets and liabilities measured as at the
acquisition date.
When (ii) is greater than (i), then this excess is recognized immediately in profit or loss as a
gain on a bargain purchase.
Goodwill is stated at cost less accumulated impairment losses. Goodwill arising on a business
combination is allocated to each cash-generating unit, or groups of cash generating units, that is
expected to benefit from the synergies of the combination and is tested annually for impairment (see
Note 2(l)(ii)).
On disposal of a cash generating unit during the year, any attributable amount of purchased
goodwill is included in the calculation of the profit or loss on disposal.
(f) Other investments in debt and equity securities
The Group’s policies for investments in debt and equity securities, other than investments in
subsidiaries, associates and a joint venture, are set out below.
Investments in debt and equity securities are recognized/derecognized on the date the Group
commits to purchase/sell the investment. The investments are initially stated at fair value plus
directly attributable transaction costs, except for those investments measured at fair value through
profit or loss (FVPL) for which transaction costs are recognized directly in profit or loss. For an
explanation of how the Group determines fair value of financial instruments, see Note 37(e). These
investments are subsequently accounted for as follows, depending on their classification.
(i) Investments other than equity investments
Non-equity investments held by the Group are classified into one of the following
measurement categories:
– amortized cost, if the investment is held for the collection of contractual cash flows
which represent solely payments of principal and interest. Interest income from the
investment is calculated using the effective interest method (see Note 2(v)(iii)).
– fair value at profit or loss (FVPL) if the investment does not meet the criteria for
being measured at amortized cost or fair value through other comprehensive income
(FVOCI) (recycling). Changes in the fair value of the investment (including
interest) are recognized in profit or loss.
APPENDIX I ACCOUNTANTS’ REPORT
– I-21 –
(ii) Equity investments
An investment in equity securities is classified as FVPL unless the equity investment is
not held for trading purposes and on initial recognition of the investment the Group makes an
irrevocable election to designate the investment at FVOCI (non-recycling) such that subsequent
changes in fair value are recognized in other comprehensive income. Such elections are made
on an instrument-by-instrument basis but may only be made if the investment meets the
definition of equity from the issuer’s perspective. Where such an election is made, the amount
accumulated in other comprehensive income remains in the fair value reserve (non-recycling)
until the investment is disposed of. At the time of disposal, the amount accumulated in the fair
value reserve (non-recycling) is transferred to retained earnings. It is not recycled through
profit or loss. Dividends from an investment in equity securities, irrespective of whether
classified as at FVPL or FVOCI, are recognized in profit or loss as other income in accordance
with the policy set out in Note 2(v)(v).
(g) Derivative financial instruments
Derivative financial instruments are recognised at fair value. At the end of each reporting
period the fair value is remeasured. The gain or loss on remeasurement to fair value is recognised
immediately in profit or loss, except where the derivatives qualify for cash flow hedge accounting
or hedges of net investment in a foreign operation, in which case recognition of any resultant gain
or loss depends on the nature of the item being hedged.
(h) Investment property
Investment properties are buildings which are owned or held under a leasehold interest to earn
rental income and/or for capital appreciation.
Investment properties are stated at cost less accumulated depreciation and impairment losses.
Any gain or loss arising from the retirement or disposal of an investment property is recognized in
profit or loss. Rental income from investment properties is accounted for as described in Note
2(v)(ii).
Transfers to investment properties shall be made when there is a change in use, evidenced by
end of owner-occupation, for a transfer from owner-occupied property to investment property. Since
the Group uses the cost model, transfers between investment properties and owner-occupied
properties do not change the carrying amount of the property transferred and they do not change the
cost of that properties for measurement or disclosure purposes.
Depreciation is calculated to write off the cost of investment property, less their estimated
residual value, if any, using the straight-line method over their estimated useful lives.
Estimated useful life
Plant and buildings 20 yearsLeasehold land over the period of leases
APPENDIX I ACCOUNTANTS’ REPORT
– I-22 –
(i) Property, plant and equipment
Property, plant and equipment are stated at cost (which is, in the case of assets acquired in a
business combination, the acquisition date fair value). Items of property, plant and equipment are
stated at cost less accumulated depreciation and impairment losses (see Note 2(l)(ii)).
The cost of self-constructed items of property, plant and equipment includes the cost of
materials, direct labour, the initial estimate, where relevant, of the costs of dismantling and removing
the items and restoring the site on which they are located, and an appropriate proportion of overheads
and borrowing costs (see Note 2(y)).
Gains or losses arising from the retirement or disposal of an item of property, plant and
equipment are determined as the difference between the estimated net disposal proceeds and the
carrying amount of the item and are recognized in profit or loss on the date of retirement or disposal.
Depreciation is calculated to write off the cost of property, plant and equipment, less their
estimated residual value, if any, using the straight line method over their estimated useful lives as
follows:
Estimated useful life
Leasehold land (see Note 2(k)) over the period of leasesPlant and buildings 20 years or remaining lease termsMachinery and equipment 5-10 yearsFurniture, fixtures and office equipment 3-5 yearsMotor vehicles 5-10 years
Where parts of an item of property, plant and equipment have different useful lives, the cost
is allocated on a reasonable basis between the parts and each part is depreciated separately. Both the
useful life of an asset and its residual value, if any, are reviewed annually.
Construction in progress represents properties under construction and machinery and
equipment pending installation and is stated at cost (which is, in the case of assets acquired in a
business combination, the acquisition date fair value) less impairment losses (see Note 2(l)(ii)). Cost
comprises the purchase costs of the asset and the related construction and installation costs.
Construction in progress is transferred to property, plant and equipment when the asset is
substantially ready for its intended use and depreciation will be provided at the appropriate rates in
accordance with the depreciation polices specified above.
No depreciation is provided in respect of construction in progress.
APPENDIX I ACCOUNTANTS’ REPORT
– I-23 –

(j) Intangible assets (other than goodwill)
Expenditure on research activities is recognized as an expense in the period in which it is
incurred. Expenditure on development activities is capitalized if the product or process is technically
and commercially feasible and the Group has sufficient resources and the intention to complete
development. The expenditure capitalized includes the costs of materials, direct labour, and an
appropriate proportion of overheads. Other development expenditure is recognized as an expense in
the period in which it is incurred.
Intangible assets that are acquired through business combination are stated at cost (the
acquisition date fair value) less accumulated amortization (where the estimated useful life is finite)
and impairment losses (see Note 2(l)(ii)).
Amortization of intangible assets with finite useful lives is charged to profit or loss on a
straight-line basis over the assets’ estimated useful lives. The following intangible assets with finite
useful lives are amortized from the date they are available for use and their estimated useful lives
are as follows:
Estimated useful life
Patents 10 yearsTrademarks 10 years
The patents and trademark of the Group is associated with different products arising from the
combination and acquisition from a third party. The useful lives of patents and trademark are
estimated based on the remaining period of economic benefits to be derived from the respective
products to be produced relying on the acquired patents and product trademark.
The Group estimates the period of economic benefits to be derived from the respective products
based on the expected time period required from its discovery to commercialization and other
factors, including the patent protection period, the historical life of similar products, the
characteristics of such technologies, their update frequency and market requirement and competition.
Based on such assessment, the Group considers that the expected economic useful lives of the patents
and trademark held by the Group are 10 years.
Both the period and method of amortization are reviewed annually.
APPENDIX I ACCOUNTANTS’ REPORT
– I-24 –

(k) Leased assets
At inception of a contract, the Group assesses whether the contract is, or contains, a lease. A
contract is, or contains, a lease if the contract conveys the right to control the use of an identified
asset for a period of time in exchange for consideration. Control is conveyed where the customer has
both the right to direct the use of the identified asset and to obtain substantially all of the economic
benefits from that use.
(i) As a lessee
Where the contract contains lease component(s) and non-lease component(s), the Group
has elected not to separate non-lease components and accounts for each lease component and
any associated non-lease components as a single lease component for all leases.
At the lease commencement date, the Group recognizes a right-of-use asset and a lease
liability, except for short-term leases that have a lease term of 12 months or less and leases of
low-value assets. When the Group enters into a lease in respect of a low-value asset, the Group
decides whether to capitalize the lease on a lease-by-lease basis. The lease payments associated
with those leases which are not capitalized are recognized as an expense on a systematic basis
over the lease term.
Where the lease is capitalized, the lease liability is initially recognized at the present
value of the lease payments payable over the lease term, discounted using the interest rate
implicit in the lease or, if that rate cannot be readily determined, using a relevant incremental
borrowing rate. After initial recognition, the lease liability is measured at amortized cost and
interest expense is calculated using the effective interest method. Variable lease payments that
do not depend on an index or rate are not included in the measurement of the lease liability and
hence are charged to profit or loss in the accounting period in which they are incurred.
The right-of-use asset recognized when a lease is capitalized is initially measured at cost,
which comprises the initial amount of the lease liability plus any lease payments made at or
before the commencement date, and any initial direct costs incurred. Where applicable, the cost
of the right-of-use assets also includes an estimate of costs to dismantle and remove the
underlying asset or to restore the underlying asset or the site on which it is located, discounted
to their present value, less any lease incentives received. The right-of-use asset is subsequently
stated at cost less accumulated depreciation and impairment losses (see Notes 2(i) and 2(l)(ii)).
The lease liability is remeasured when there is a change in future lease payments arising
from a change in an index or rate, or there is a change in the Group’s estimate of the amount
expected to be payable under a residual value guarantee, or there is a change arising from the
reassessment of whether the Group will be reasonably certain to exercise a purchase, extension
or termination option. When the lease liability is remeasured in this way, a corresponding
adjustment is made to the carrying amount of the right-of-use asset, or is recorded in profit or
loss if the carrying amount of the right-of-use asset has been reduced to zero.
The Group presents “right-of-use assets” and presents “lease liabilities” separately in the
consolidated statement of financial position.
APPENDIX I ACCOUNTANTS’ REPORT
– I-25 –

(ii) As a lessor
When the Group acts as a lessor, it determines at lease inception whether each lease is a
finance lease or an operating lease. A lease is classified as a finance lease if it transfers
substantially all the risks and rewards incidental to the ownership of an underlying assets to the
lessee. If this is not the case, the lease is classified as an operating lease.
When a contract contains lease and non-lease components, the Group allocates the
consideration in the contract to each component on a relative stand-alone selling price basis.
The rental income from operating leases is recognized in accordance with Note 2(v)(ii).
(l) Credit losses and impairment of assets
(i) Credit losses from financial instruments
The Group recognizes a loss allowance for expected credit losses (ECLs) on financial
assets measured at amortized cost (including cash and cash equivalents, trade and other
receivables and loans to related parties and third parties).
Financial assets measured at fair value are not subject to the ECL assessment.
Measurement of ECLs
ECLs are a probability-weighted estimate of credit losses. Credit losses are
measured as the present value of all expected cash shortfalls (i.e. the difference between
the cash flows due to the Group in accordance with the contract and the cash flows that
the Group expects to receive).
The expected cash shortfalls are discounted using the following discount rates
where the effect of discounting is material:
– fixed-rate financial assets and trade and other receivables: effective interest
rate determined at initial recognition or an approximation thereof; and
– variable-rate financial assets: current effective interest rate.
The maximum period considered when estimating ECLs is the maximum
contractual period over which the Group is exposed to credit risk.
In measuring ECLs, the Group takes into account reasonable and supportable
information that is available without undue cost or effort. This includes information about
past events, current conditions and forecasts of future economic conditions.
ECLs are measured on either of the following bases:
– 12-month ECLs: these are losses that are expected to result from possible
default events within the 12 months after the reporting date; and
APPENDIX I ACCOUNTANTS’ REPORT
– I-26 –
– lifetime ECLs: these are losses that are expected to result from all possible
default events over the expected lives of the items to which the ECL model
applies.
Loss allowances for trade and other receivables are always measured at an amount
equal to lifetime ECLs. ECLs on these financial assets are estimated using a provision
matrix based on the Group’s historical credit loss experience, adjusted for factors that are
specific to the debtors and an assessment of both the current and forecast general
economic conditions at the reporting date.
For all other financial instruments, the Group recognizes a loss allowance equal to
12-month ECLs unless there has been a significant increase in credit risk of the financial
instrument since initial recognition, in which case the loss allowance is measured at an
amount equal to lifetime ECLs.
Significant increases in credit risk
In assessing whether the credit risk of a financial instrument has increased
significantly since initial recognition, the Group compares the risk of default occurring
on the financial instrument assessed at the reporting date with that assessed at the date of
initial recognition. In making this reassessment, the Group considers that a default event
occurs when (i) the debtor is unlikely to pay its credit obligations to the Group in full,
without recourse by the Group to actions such as realizing security (if any is held); or (ii)
the financial asset is twelve months past due. The Group considers both quantitative and
qualitative information that is reasonable and supportable, including historical experience
and forward-looking information that is available without undue cost or effort.
In particular, the following information is taken into account when assessing
whether credit risk has increased significantly since initial recognition:
– failure to make payments of principal or interest on their contractually due
dates;
– an actual or expected significant deterioration in a financial instrument’s
external or internal credit rating (if available);
– an actual or expected significant deterioration in the operating results of the
debtor; and
– existing or forecast changes in the technological, market, economic or legal
environment that have a significant adverse effect on the debtor’s ability to
meet its obligation to the Group.
Depending on the nature of the financial instruments, the assessment of a significant
increase in credit risk is performed on either an individual basis or a collective basis.
When the assessment is performed on a collective basis, the financial instruments are
grouped based on shared credit risk characteristics, such as past due status and credit risk
ratings.
APPENDIX I ACCOUNTANTS’ REPORT
– I-27 –

ECLs are remeasured at each reporting date to reflect changes in the financial
instrument’s credit risk since initial recognition. Any change in the ECL amount is
recognized as an impairment gain or loss in profit or loss. The Group recognizes an
impairment gain or loss for all financial instruments with a corresponding adjustment to
their carrying amount through a loss allowance account.
Basis of calculation of interest income
Interest income recognized in accordance with Note 2(v)(iii) is calculated based on
the gross carrying amount of the financial asset unless the financial asset is credit-
impaired, in which case interest income is calculated based on the amortized cost (i.e. the
gross carrying amount less loss allowance) of the financial asset.
At each reporting date, the Group assesses whether a financial asset is credit-
impaired. A financial asset is credit-impaired when one or more events that have a
detrimental impact on the estimated future cash flows of the financial asset have
occurred.
Evidence that a financial asset is credit-impaired includes the following observable
events:
– significant financial difficulties of the debtor;
– a breach of contract, such as a default or delinquency in interest or principal
payments;
– it becoming probable that the borrower will enter into bankruptcy or other
financial reorganization;
– significant changes in the technological, market, economic or legal
environment that have an adverse effect on the debtor; or
– the disappearance of an active market for a security because of financial
difficulties of the issuer.
Write-off policy
The gross carrying amount of a financial asset is written off (either partially or in
full) to the extent that there is no realistic prospect of recovery. This is generally the case
when the Group determines that the debtor does not have assets or sources of income that
could generate sufficient cash flows to repay the amounts subject to the write-off.
Subsequent recoveries of an asset that was previously written off are recognized as
a reversal of impairment in profit or loss in the period in which the recovery occurs.
APPENDIX I ACCOUNTANTS’ REPORT
– I-28 –
(ii) Impairment of other non-current assets
Internal and external sources of information are reviewed at the end of each reporting
period to identify indications that the following assets may be impaired or, except in the case
of goodwill, an impairment loss previously recognized no longer exists or may have decreased:
– properties, plants and equipment, including right-of-use assets;
– investment properties;
– intangible assets;
– interest in associates and interest in a joint venture; and
– interest in subsidiaries and interest in a joint venture in the Company’s statement of
financial position.
If any such indication exists, the asset’s recoverable amount is estimated. In addition, for
goodwill, the recoverable amount is estimated annually whether or not there is any indication
of impairment:
– Calculation of recoverable amount
The recoverable amount of an asset is the greater of its fair value less costs to sell
and value in use. In assessing value in use, the estimated future cash flows are discounted
to their present value using a pre-tax discount rate that reflects current market
assessments of the time value of money and the risks specific to the asset. Where an asset
does not generate cash inflows largely independent of those from other assets, the
recoverable amount is determined for the smallest group of assets that generates cash
inflows independently (i.e. a cash-generating unit).
– Recognition of impairment losses
An impairment loss is recognized in profit or loss if the carrying amount of an asset,
or the cash-generating unit to which it belongs, exceeds its recoverable amount.
Impairment losses recognized in respect of cash-generating units are allocated first to
reduce the carrying amount of any goodwill allocated to the cash-generating unit (or
group of units) and then, to reduce the carrying amount of the other assets in the unit (or
group of units) on a pro rata basis, except that the carrying value of an asset will not be
reduced below its individual fair value less costs to sell, or value in use (if determinable).
– Reversals of impairment losses
In respect of assets other than goodwill, an impairment loss is reversed if there has
been a favourable change in the estimates used to determine the recoverable amount. An
impairment loss in respect of goodwill is not reversed.
APPENDIX I ACCOUNTANTS’ REPORT
– I-29 –

A reversal of an impairment loss is limited to the asset’s carrying amount that would
have been determined had no impairment loss been recognized in prior years. Reversals
of impairment losses are credited to profit or loss in the year in which the reversals are
recognized.
(m) Inventories
Inventories are assets which are held for sale in the ordinary course of business, in the process
of production for such sale or in the form of materials or supplies to be consumed in the production
process or in the rendering of services.
Inventories are carried at the lower of cost and net realizable value.
Cost is calculated using the weighted average cost formula and comprises all costs of purchase,
costs of conversion and other costs incurred in bringing the inventories to their present location and
condition. In the case of work in progress, costs include direct labour and appropriate share of
overheads based on normal operating capacity.
Net realizable value is the estimated selling price in the ordinary course of business less the
estimated costs of completion and the estimated costs necessary to make the sale.
When inventories are sold, the carrying amount of those inventories is recognized as an
expense in the period in which the related revenue is recognized.
The amount of any write-down of inventories to net realizable value and all losses of
inventories are recognized as an expense in the period the write-down or loss occurs. The amount
of any reversal of any write-down of inventories is recognized as a reduction in the amount of
inventories recognized as an expense in the period in which the reversal occurs.
(n) Contract liabilities
A contract liability is recognized when the customer pays consideration before the Group
recognizes the related revenue (see Note 2(v)). A contract liability would also be recognized if the
Group has an unconditional right to receive consideration before the Group recognizes the related
revenue. In such cases, a corresponding receivable would also be recognized (see Note 2(o)).
(o) Trade and other receivables
A receivable is recognized when the Group has an unconditional right to receive consideration.
A right to receive consideration is unconditional if only the passage of time is required before
payment of that consideration is due.
Receivables are stated at amortized cost using the effective interest method less allowance for
credit losses (see Note 2(l)(i)).
APPENDIX I ACCOUNTANTS’ REPORT
– I-30 –

(p) Cash and cash equivalents
Cash and cash equivalents comprise cash at bank and on hand, demand deposits with banks and
other financial institutions, and short-term, highly liquid investments that are readily convertible into
known amounts of cash and which are subject to an insignificant risk of changes in value, having
been within six months of maturity at acquisition. Cash and cash equivalents are assessed for
expected credit losses (ECL) in accordance with the policy set out in Note 2(l)(i).
(q) Interest-bearing borrowings
Interest-bearing borrowings are measured initially at fair value less transaction costs.
Subsequent to initial recognition, interest-bearing borrowings are stated at amortized cost using the
effective interest method. Interest expense is recognized in accordance with the Group’s accounting
policy for borrowing costs (see Note 2(y)).
(r) Trade and other payables
Trade and other payables are initially recognized at fair value and are subsequently stated at
amortized cost unless the effect of discounting would be immaterial, in which case they are stated
at cost.
(s) Employee benefits
(i) Short-term employee benefits and contributions to defined contribution retirement plans
Salaries, annual bonuses, paid annual leave, contributions to defined contribution
retirement plans and the cost of non-monetary benefits are accrued in the year in which the
associated services are rendered by employees. Where payment or settlement is deferred and
the effect would be material, these amounts are stated at their present values.
Contributions to local retirement schemes pursuant to the relevant labour rules and
regulations in the jurisdictions in which the Group’s subsidiaries located are recognized as an
expense in profit or loss as incurred, except to the extent that they are included in the cost of
inventories not yet recognized as an expense.
(ii) Termination benefits
Termination benefits are recognized at the earlier of the dates when the Group can no
longer withdraw the offer of those benefits and when the Group recognises restructuring costs
and involves the payment of termination benefits.
(iii) Defined benefit retirement plans obligation
The Group’s net obligation in respect of defined benefit retirement plans is calculated
separately for each plan by estimating the amount of future benefit that employees have earned
in return for their service in the current and prior periods; that benefit is discounted to
determine the present value. The calculation is performed by a qualified actuary using the
APPENDIX I ACCOUNTANTS’ REPORT
– I-31 –
projected unit credit method. When the calculation results in a benefit to the Group, the
recognized asset is limited to the present value of economic benefits available in the form of
any future refunds from the plan or reductions in future contributions to the plan.
Service cost and net interest expense (income) on the net defined benefit liability (asset)
are recognised in profit or loss and allocated by function as part of “cost of sales”, “selling and
distribution expenses” or “administrative expenses”. Current service cost is measured as the
increase in the present value of the defined benefit obligation resulting from employee service
in the current period. Net interest expense (income) for the period is determined by applying
the discount rate used to measure the defined benefit obligation at the beginning of the
reporting period to the net defined benefit liability (asset). The discount rate is the yield at the
end of the reporting period on high quality corporate bonds that have maturity dates
approximating the terms of the Group’s obligations.
When the benefits of a plan are changed, or when a plan is curtailed, current service cost
for the portion of the changed benefit related to past service by employees, or the gain or loss
on curtailment, is recognised as an expense in profit or loss at the earlier of when the plan
amendment or curtailment occurs and when related restructuring costs or termination benefits
are recognised.
Remeasurements arising from defined benefit retirement plans are recognised in other
comprehensive income and reflected immediately in retained earnings. Remeasurements
comprise actuarial gains and losses, the return on plan assets (excluding amounts included in
net interest on the net defined benefit liability (asset)) and any change in the effect of the asset
ceiling (excluding amounts included in net interest on the net defined benefit liability (asset)).
(iv) Share-based payments
The fair value of share-based payment awards granted to employees is recognized as an
employee cost with a corresponding increase in a reserve within equity. The fair value is
measured at grant date by reference to the market price or the valuer’s valuation of the
underlying shares. Where the employees have to meet vesting conditions before becoming
unconditionally entitled to the shares, the total estimated fair value of the shares is spread over
the vesting period, taking into account the probability that the shares will vest.
During the vesting period, the number of shares that is expected to vest is reviewed. Any
resulting adjustment to the cumulative fair value recognized in prior years is charged/credited
to the profit or loss for the year of the review, unless the original employee expenses qualify
for recognition as an asset, with a corresponding adjustment to the capital reserve. On vesting
date, the amount recognized as an expense is adjusted to reflect the actual number that vest
(with a corresponding adjustment to the reserve).
APPENDIX I ACCOUNTANTS’ REPORT
– I-32 –

(t) Income tax
Income tax for the year comprises current tax and movements in deferred tax assets and
liabilities. Current tax and movements in deferred tax assets and liabilities are recognized in profit
or loss except to the extent that they relate to items recognized in other comprehensive income or
directly in equity, in which case the relevant amounts of tax are recognized in other comprehensive
income or directly in equity, respectively.
Current tax is the expected tax payable on the taxable income for the year, using tax rates
enacted or substantively enacted at the end of each reporting period, and any adjustment to tax
payable in respect of previous years.
Deferred tax assets and liabilities arise from deductible and taxable temporary differences
respectively, being the differences between the carrying amounts of assets and liabilities for financial
reporting purposes and their tax bases. Deferred tax assets also arise from unused tax losses and
unused tax credits.
Apart from certain limited exceptions, all deferred tax liabilities, and all deferred tax assets to
the extent that it is probable that future taxable profits will be available against which the asset can
be utilized, are recognized. Future taxable profits that may support the recognition of deferred tax
assets arising from deductible temporary differences include those that will arise from the reversal
of existing taxable temporary differences, provided those differences relate to the same taxation
authority and the same taxable entity, and are expected to reverse either in the same period as the
expected reversal of the deductible temporary difference or in periods into which a tax loss arising
from the deferred tax asset can be carried back or forward. The same criteria are adopted when
determining whether existing taxable temporary differences support the recognition of deferred tax
assets arising from unused tax losses and credits, that is, those differences are taken into account if
they relate to the same taxation authority and the same taxable entity, and are expected to reverse
in a period, or periods, in which the tax loss or credit can be utilized.
The limited exceptions to recognition of deferred tax assets and liabilities are those temporary
differences arising from the initial recognition of assets or liabilities that affect neither accounting
nor taxable profit (provided they are not part of a business combination), and temporary differences
relating to investments in subsidiaries to the extent that, in the case of taxable differences, the Group
controls the timing of the reversal and it is probable that the differences will not reverse in the
foreseeable future, or in the case of deductible differences, unless it is probable that they will reverse
in the future.
The amount of deferred tax recognized is measured based on the expected manner of realization
or settlement of the carrying amount of the assets and liabilities, using tax rates enacted or
substantively enacted at the end of each reporting period. Deferred tax assets and liabilities are not
discounted.
The carrying amount of a deferred tax asset is reviewed at the end of each reporting period and
is reduced to the extent that it is no longer probable that sufficient taxable profit will be available
to allow the related tax benefit to be utilized. Any such reduction is reversed to the extent that it
becomes probable that sufficient taxable profit will be available.
APPENDIX I ACCOUNTANTS’ REPORT
– I-33 –

Additional income taxes that arise from the distribution of dividends are recognized when the
liability to pay the related dividends is recognized.
Current tax balances and deferred tax balances, and movements therein, are presented
separately from each other and are not offset. Current tax assets are offset against current tax
liabilities, and deferred tax assets against deferred tax liabilities, if the Group has the legally
enforceable right to set off current tax assets against current tax liabilities and the following
additional conditions are met:
– in the case of current tax assets and liabilities, the Company or the Group intends either
to settle on a net basis, or to realize the asset and settle the liability simultaneously; or
– in the case of deferred tax assets and liabilities, if they relate to income taxes levied by
the same taxation authority on either:
– the same taxable entity; or
– different taxable entities, which, in each future period in which significant amounts
of deferred tax liabilities or assets are expected to be settled or recovered, intend to
realize the current tax assets and settle the current tax liabilities on a net basis or
realize and settle simultaneously.
(u) Provisions and contingent liabilities
Provisions are recognized when the Group has a legal or constructive obligation arising as a
result of a past event, it is probable that an outflow of economic benefits will be required to settle
the obligation and a reliable estimate can be made. Where the time value of money is material,
provisions are stated at the present value of the expenditures expected to settle the obligation.
Where it is not probable that an outflow of economic benefits will be required, or the amount
cannot be estimated reliably, the obligation is disclosed as a contingent liability, unless the
probability of outflow of economic benefits is remote. Possible obligations, whose existence will
only be confirmed by the occurrence or non-occurrence of one or more future events, are also
disclosed as contingent liabilities unless the probability of outflow of economic benefits is remote.
(v) Revenue and other income
Income is classified by the Group as revenue when it arises from the sale of goods, the
provision of services or the use by others of the Group’s assets under leases in the ordinary course
of the Group’s business.
Revenue is recognized when control over a product or service is transferred to the customer,
or the lessee has the right to use the asset, at the amount of promised consideration to which the
Group is expected to be entitled, excluding those amounts collected on behalf of third parties.
Revenue excludes value added tax or other sales taxes and is after deduction of any trade discounts.
APPENDIX I ACCOUNTANTS’ REPORT
– I-34 –
Where the contract contains a financing component which provides a significant financingbenefit to the customer for more than 12 months, revenue is measured at the present value of theamount receivable, discounted using the discount rate that would be reflected in a separate financingtransaction with the customer, and interest income is accrued separately under the effective interestmethod. Where the contract contains a financing component which provides a significant financingbenefit to the Group, revenue recognized under that contract includes the interest expense accretedon the contract liability under the effective interest method. The Group takes advantage of thepractical expedient in paragraph 63 of HKFRS 15 and does not adjust the consideration for anyeffects of a significant financing component if the period of financing is 12 months or less.
Further details of the Group’s revenue and other income recognition policies are as follows:
(i) Sale of goods
Revenue is recognized when the customer takes possession of and accepts the products.If the products are a partial fulfilment of a contract covering other goods, then the amount ofrevenue recognized is an appropriate proportion of the total transaction price under thecontract, allocated between all the goods promised under the contract on a relative stand-aloneselling price basis.
For a sale of goods with a right of return/exchange for dissimilar products, the Grouprecognizes all of the following:
(a) revenue for the transferred products in the amount of consideration to which theGroup expects to be entitled (therefore, revenue would not be recognized for theproducts expected to be returned/exchanged);
(b) a refund liability (see Note 2(w)); and
(c) an asset (and corresponding adjustment to cost of sales) for its right to recoverproducts from customers and are presented as right to returned goods asset.
(ii) Rental income from operating leases
Rental income receivable under operating leases is recognized in profit or loss in equalinstalments over the periods covered by the lease term, except where an alternative basis ismore representative of the pattern of benefits to be derived from the use of the leased asset.Lease incentives granted are recognized in profit or loss as an integral part of the aggregate netlease payments receivable.
(iii) Interest income
Interest income is recognised as it accrues under the effective interest method using therate that exactly discounts estimated future cash receipts through the expected life of thefinancial asset to the gross carrying amount of the financial asset. For financial assets measuredat amortised cost or FOCI (recycling) that are not credit-impaired, the effective interest rate isapplied to the gross carrying amount of the asset. For credit-impaired financial assets, theeffective interest rate is applied to the amortised cost (i.e. gross carrying amount net of lossallowance) of the asset.
APPENDIX I ACCOUNTANTS’ REPORT
– I-35 –

(iv) Government grants
Government grants are recognized in the statement of financial position initially when
there is reasonable assurance that they will be received and that the Group will comply with
the conditions attaching to them. Grants that compensate the Group for expenses incurred are
recognized as income in profit or loss on a systematic basis in the same periods in which the
expenses are incurred. Grants that compensate the Group for the cost of an asset are presented
in the consolidated statements of financial position by setting up the grant as deferred income
and consequently are effectively recognized in profit or loss on a systematic basis over the
useful life of the asset.
(v) Dividends
Dividend income is recognized when the shareholder’s right to receive payment is
established.
(w) Refund liabilities
A refund liability is the obligation to refund some or all of the consideration received (or
receivable) from the customer and is measured at the amount the Group ultimately expects it will
have to return to the customer. The Group updates its estimates of refund liabilities (and the
corresponding change in the transaction price) at the end of each reporting period.
(x) Translation of foreign currencies
Foreign currency transactions during the Relevant Periods are translated at the foreign
exchange rates ruling at the transaction dates. Monetary assets and liabilities denominated in foreign
currencies are translated at the foreign exchange rates ruling at the end of the reporting period.
Exchange gains and losses are recognized in profit or loss.
Non-monetary assets and liabilities that are measured in terms of historical cost in a foreign
currency are translated using the foreign exchange rates ruling at the transaction dates. The
transaction date is the date on which the Company initially recognizes such non-monetary assets or
liabilities. Non-monetary assets and liabilities denominated in foreign currencies that are stated at
fair value are translated using the foreign exchange rates ruling at the dates the fair value was
measured.
The results of foreign operations are translated into USD at the exchange rates approximating
the foreign exchange rates ruling at the dates of the transactions. The resulting exchange differences
are recognized in other comprehensive income and accumulated separately in equity in the exchange
reserve.
APPENDIX I ACCOUNTANTS’ REPORT
– I-36 –

(y) Borrowing costs
Borrowing costs that directly attributable to the acquisition, construction or production of anasset which necessarily takes a substantial period of time to get ready for its intended use or sale arecapitalized as part of the cost of that asset. Other borrowing costs are expensed in the period in whichthey are incurred.
The capitalization of borrowing costs as part of the cost of a qualifying asset commences whenexpenditure for the asset is being incurred, borrowing costs are being incurred and activities that arenecessary to prepare the asset for its intended use or sale are in progress. Capitalization of borrowingcosts is suspended or ceases when substantially all the activities necessary to prepare the qualifyingasset for its intended use or sale are interrupted or complete.
(z) Related parties
(a) A person, or a close member of that person’s family, is related to the Group if that person:
(i) has control or joint control over the Group;
(ii) has significant influence over the Group; or
(iii) is a member of the key management personnel of the Group or the Group’s parent.
(b) An entity is related to the Group if any of the following conditions applies:
(i) The entity and the Group are members of the same group (which means that eachparent, subsidiary and fellow subsidiary is related to the others).
(ii) One entity is an associate or a joint venture of the other entity (or an associate ora joint venture of a member of a group of which the other entity is a member).
(iii) Both entities are joint ventures of the same third party.
(iv) One entity is a joint venture of a third entity and the other entity is an associate ofthe third entity.
(v) The entity is a post-employment benefit plan for the benefit of employees of eitherthe Group or an entity related to the Group.
(vi) The entity is controlled or jointly controlled by a person identified in (a).
(vii) A person identified in (a)(i) has significant influence over the entity or is a memberof the key management personnel of the entity (or of a parent of the entity).
(viii) The entity, or any member of a group of which it is a part, provides key managementpersonnel services to the Group or to the Group’s parent.
Close members of the family of a person are those family members who may be expected toinfluence, or be influenced by, that person in their dealings with the entity.
APPENDIX I ACCOUNTANTS’ REPORT
– I-37 –
(aa) Segment reporting
Operating segments, and the amounts of each segment item reported in the financial statements,are identified from the financial information provided regularly to the Group’s most senior executivemanagement for the purposes of allocating resources to, and assessing the performance of, theGroup’s various lines of business and geographical locations.
Individually material operating segments are not aggregated for financial reporting purposesunless the segments have similar economic characteristics and are similar in respect of the nature ofproducts and services, the nature of production processes, the type or class of customers, the methodsused to distribute the products or provide the services, and the nature of the regulatory environment.Operating segments which are not individually material may be aggregated if they share a majorityof these criteria.
3 Significant accounting judgements and estimates
Key sources of estimation uncertainty
Notes 20, 21, 23, 35, and 37(e) contains information about the assumptions and their riskfactors relating to fair value of financial assets and fair value of shares granted. Other key sourcesof estimation uncertainty are as follows:
(a) Net realizable value of inventories
Net realizable value of inventories is the estimated selling price in the ordinary course ofbusiness less estimated costs of completion and the estimated costs necessary to make the sale.These estimates are based on the current market conditions and the historical experience ofselling products with similar nature. Any change in the assumptions would increase or decreasethe amount of inventories write-down or the related reversals of write-down made in prior yearsand affect the Group’s net assets value. The Group reassesses these estimates annually.
(b) Impairment of trade and other receivables
The Group estimates the amount of loss allowance for ECLs on trade and otherreceivables that are measured at amortized cost based on the credit risk of the respectivefinancial instruments. The loss allowance amount is measured as the asset’s carrying amountand the present value of estimated future cash flows with the consideration of expected futurecredit loss of the respective financial instrument. The assessment of the credit risk of therespective financial instrument involves high degree of estimation and uncertainty. When theactual future cash flows are less than expected or more than expected, a material impairmentloss or a material reversal of impairment loss may arise, accordingly.
(c) Warranty provisions
The Group makes provisions under the warranties it gives on sale of its power tools andoutdoor power equipment taking into account the Group’s recent claim experience. As theGroup is continually upgrading its product designs and launching new models it is possible thatthe recent claim experience is not indicative of future claims that it will receive in respect ofpast sales. Any increase or decrease in the provision would affect profit or loss in future years.
APPENDIX I ACCOUNTANTS’ REPORT
– I-38 –
(d) Equity settled share-based transactions
The determination of the fair values of ordinary shares granted under Share Incentive
Scheme to the qualified employees of the Group involve the use of judgment and estimates. The
fair values of share options have been estimated using key judgmental assumptions set out in
note 35.
4 Revenue and segment reporting
(a) Revenue
The principal activities of the Group are researching, developing, manufacturing, testing, sales,
and after-sale services for power tools, outdoor power equipment and related products. Further
details regarding the Group’s principal activities are disclosed in Note 4(b).
(i) Disaggregation of revenue
Disaggregation of revenue from contracts with customers by business lines is as follows:
Year ended December 31,Six months ended
June 30,
2018 2019 2020 2020 2021
USD’000 USD’000 USD’000 USD’000 USD’000(unaudited)
Revenue from contracts withcustomers within the scopeof HKFRS 15Disaggregated by major
products– Sales of power tools 483,370 549,680 661,081 278,887 451,066– Sales of outdoor power
equipment 201,410 287,971 533,691 231,451 414,041– Others 5,918 5,927 6,130 4,021 3,690
690,698 843,578 1,200,902 514,359 868,797
The Group’s revenue from contracts with customers were recognized at point in time for
the Relevant Periods.
The Group’s customer base is diversified and two, two, two, three, two customers with
whom transactions have exceeded 10% of the Group’s revenues for the years ended December
31, 2018, 2019 and 2020 and the six months ended June 30, 2020 and 2021, respectively.
Details of concentrations of credit risk arising from the customers are set out in Note 37(a).
APPENDIX I ACCOUNTANTS’ REPORT
– I-39 –

(ii) Revenue expected to be recognized in the future arising from contracts with customers inexistence at the reporting date
As at December 31, 2018, 2019 and 2020 and June 30, 2021, the Group has applied thepractical expedient in paragraph 121 of HKFRS 15 to its sales contracts for goods such thatinformation about revenue expected to be recognized in the future is not disclosed in respectof revenue that the Group will be entitled to when it satisfies the remaining performanceobligations under the contracts for sales of goods that had an expected duration of one year orless.
(b) Segment reporting
The Group manages its businesses by divisions, which are organised by a mixture of bothbusiness lines (products and services) and geography. In a manner consistent with the way in whichinformation is reported internally to the Group’s most senior executive management for the purposesof resource allocation and performance assessment, the Group has presented the following reportablesegments. No operating segments have been aggregated to form the following reportable segments.
• Power tools: sales of power tools and power tool accessories for consumer, professionaland industrial users. The products are available under the FLEX, DEVON SKIL andX-TRON brands plus original design manufacturer (“ODM”) customers.
• Outdoor power equipment: sales of outdoor tools and outdoor tool accessories forpremium or professional and mass-market users. The products are available under theEGO and SKIL brands.
• Others: sales of parts and components to a home appliances business.
(i) Information about reportable segments
For the purposes of assessing segment performance and allocating resources betweensegments, the Group’s senior executive management monitor the results attributable to eachreportable segment on the following bases:
Revenue are allocated to the reportable segments with reference to sales generated bythose segments.
The measure used for reporting segment profit is gross profit. Segment profit is used tomeasure performance as management believes that such information is the most relevant inevaluating the results of the respective segments relative to other entities that operate in thesame industries.
In addition to receiving segment information concerning segment results, management isprovided with segment information concerning revenue generated by the segments in theiroperations.
Segment assets and liabilities are not regularly reported to the Group’s executive directorsand therefore information of reportable segment assets and liabilities are not presented in theconsolidated financial statements.
APPENDIX I ACCOUNTANTS’ REPORT
– I-40 –

Disaggregation of revenue from contracts with customers by the timing of revenue
recognition, as well as information regarding the Group’s reportable segments as provided to
the Group’s senior executive management for the purposes of resource allocation and
assessment of segment performance for Relevant Periods is set out below.
Reportable segments
Power tools
Outdoorpower
equipment Others
Totalreportablesegments
USD’000 USD’000 USD’000 USD’000
2018Revenue from externalcustomersPoint in time 483,370 201,410 5,918 690,698
Gross profit from
external customers and
reportable segment profit 118,997 55,266 1,262 175,525
Reportable segments
Power tools
Outdoorpower
equipment Others
Totalreportablesegments
USD’000 USD’000 USD’000 USD’000
2019Revenue from externalcustomersPoint in time 549,680 287,971 5,927 843,578
Gross profit from external
customers and reportable
segment profit 165,565 88,752 936 255,253
APPENDIX I ACCOUNTANTS’ REPORT
– I-41 –

Reportable segments
Power tools
Outdoorpower
equipment Others
Totalreportablesegments
USD’000 USD’000 USD’000 USD’000
2020Revenue from externalcustomersPoint in time 661,081 533,691 6,130 1,200,902
Gross profit from externalcustomers and reportablesegment profit 192,030 175,503 1,179 368,712
Reportable segments
Power tools
Outdoorpower
equipment Others
Totalreportablesegments
USD’000 USD’000 USD’000 USD’000
Six months endedJune 30, 2021Revenue from externalcustomersPoint in time 451,066 414,041 3,690 868,797
Gross profit from externalcustomers and reportablesegment profit 120,445 130,274 390 251,109
Reportable segments
Power tools
Outdoorpower
equipment Others
Totalreportablesegments
USD’000 USD’000 USD’000 USD’000
(unaudited)Six months endedJune 30, 2020Revenue from externalcustomersPoint in time 278,887 231,451 4,021 514,359
Gross profit from externalcustomers and reportablesegment profit 77,874 68,997 787 147,658
APPENDIX I ACCOUNTANTS’ REPORT
– I-42 –
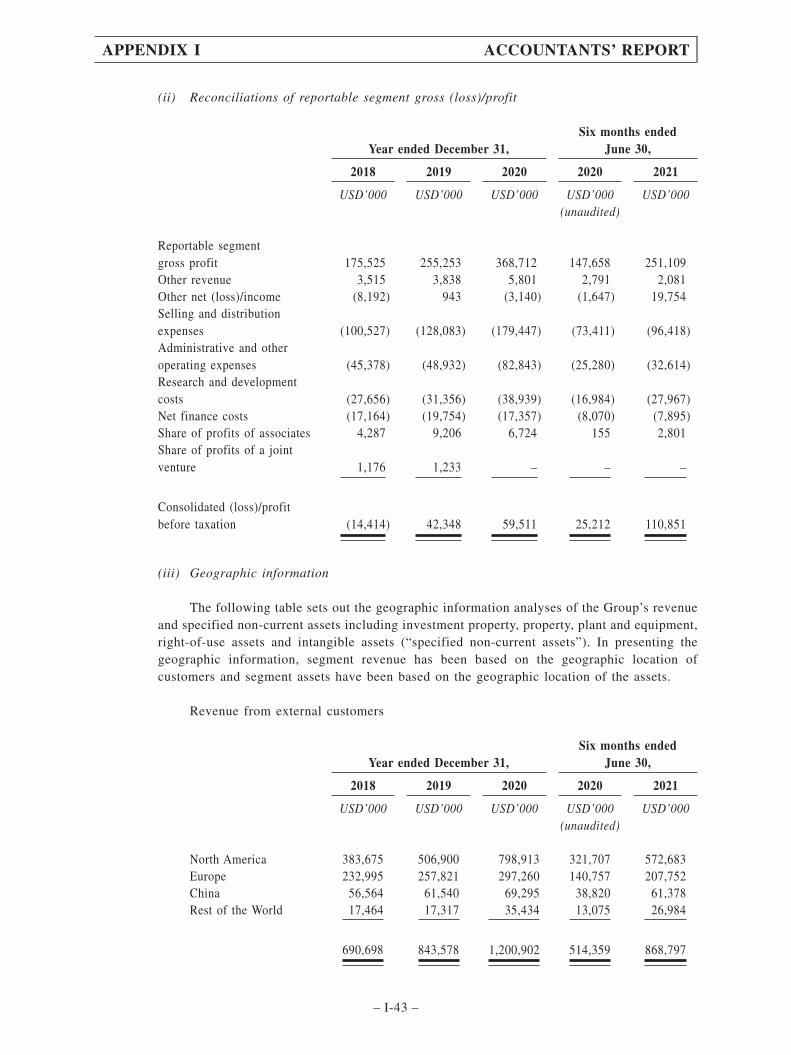
(ii) Reconciliations of reportable segment gross (loss)/profit
Year ended December 31,Six months ended
June 30,
2018 2019 2020 2020 2021
USD’000 USD’000 USD’000 USD’000 USD’000(unaudited)
Reportable segmentgross profit 175,525 255,253 368,712 147,658 251,109Other revenue 3,515 3,838 5,801 2,791 2,081Other net (loss)/income (8,192) 943 (3,140) (1,647) 19,754Selling and distributionexpenses (100,527) (128,083) (179,447) (73,411) (96,418)Administrative and otheroperating expenses (45,378) (48,932) (82,843) (25,280) (32,614)Research and developmentcosts (27,656) (31,356) (38,939) (16,984) (27,967)Net finance costs (17,164) (19,754) (17,357) (8,070) (7,895)Share of profits of associates 4,287 9,206 6,724 155 2,801Share of profits of a jointventure 1,176 1,233 – – –
Consolidated (loss)/profitbefore taxation (14,414) 42,348 59,511 25,212 110,851
(iii) Geographic information
The following table sets out the geographic information analyses of the Group’s revenueand specified non-current assets including investment property, property, plant and equipment,right-of-use assets and intangible assets (“specified non-current assets”). In presenting thegeographic information, segment revenue has been based on the geographic location ofcustomers and segment assets have been based on the geographic location of the assets.
Revenue from external customers
Year ended December 31,Six months ended
June 30,
2018 2019 2020 2020 2021
USD’000 USD’000 USD’000 USD’000 USD’000(unaudited)
North America 383,675 506,900 798,913 321,707 572,683Europe 232,995 257,821 297,260 140,757 207,752China 56,564 61,540 69,295 38,820 61,378Rest of the World 17,464 17,317 35,434 13,075 26,984
690,698 843,578 1,200,902 514,359 868,797
APPENDIX I ACCOUNTANTS’ REPORT
– I-43 –

Specified non-current assets
At December 31,At
June 30,
2018 2019 2020 2021
USD’000 USD’000 USD’000 USD’000
North America 12,161 11,210 10,296 17,103Europe 13,775 15,173 19,790 23,156China 129,265 137,900 158,579 169,048
155,201 164,283 188,665 209,307
5 Other revenue and other net (loss)/gain
(a) Other revenue
Year ended December 31,Six months ended
June 30,
2018 2019 2020 2020 2021
USD’000 USD’000 USD’000 USD’000 USD’000(unaudited)
Government grants (Note i) 855 888 3,650 1,719 1,027Sale of scrap materials 596 935 1,058 617 878Rental income 1,571 1,819 1,093 455 176Others 493 196 – – –
3,515 3,838 5,801 2,791 2,081
Note:
(i) During the years ended December 31, 2018, 2019 and 2020 and the six months ended June 30, 2020 and 2021,the Group received unconditional government grants of USD855,000, USD888,000, USD3,650,000,USD1,719,000 and USD1,027,000, respectively, as rewards of the Group’s contribution to technologyinnovation and regional economic development.
APPENDIX I ACCOUNTANTS’ REPORT
– I-44 –

(b) Other net (loss)/gain
Year ended December 31,Six months ended
June 30,
2018 2019 2020 2020 2021
USD’000 USD’000 USD’000 USD’000 USD’000(unaudited)
Net foreign exchangegain/(loss) 2,617 466 (11,497) (584) (5,374)Net (loss)/gain on disposal ofproperties, plants andequipment (320) (74) (43) (4) (196)Net realized and unrealized(losses)/gains on financialassets at FVPL (83) (41) 165 430 454Net realized and unrealized(losses)/gains on derivativefinancial instruments (10,419) (810) 8,209 (1,501) 3,686Loss on disposal of associatesand a joint venture – – (131) – (677)(Loss)/gain on disposal of asubsidiary (Note 25 (g)) – (4) – – 21,969Gain on business combination(Note 25 (f)) – 1,326 – – –Others 13 80 157 12 (108)
(8,192) 943 (3,140) (1,647) 19,754
6 Profit before taxation
Profit before taxation is arrived at after charging/(crediting):
(a) Net finance costs
Year ended December 31,Six months ended
June 30,
2018 2019 2020 2020 2021
USD’000 USD’000 USD’000 USD’000 USD’000(unaudited)
Interest income from bankdeposits (247) (605) (638) (239) (460)
Finance income (247) (605) (638) (239) (460)
Interest on bank loans 16,789 19,748 17,392 8,008 8,235Interest on lease liabilities 622 611 603 301 120
Finance costs 17,411 20,359 17,995 8,309 8,355
Net finance costs 17,164 19,754 17,357 8,070 7,895
APPENDIX I ACCOUNTANTS’ REPORT
– I-45 –

(b) Staff costs
Year ended December 31,Six months ended
June 30,
2018 2019 2020 2020 2021
USD’000 USD’000 USD’000 USD’000 USD’000(unaudited)
Salaries, wages and otherbenefits 97,578 106,264 130,788 65,394 73,911Contributions to definedcontribution retirement plans 22,025 23,215 21,782 10,891 14,209Equity settled share-basedpayment expenses (Note 35) – – 21,077 – –Expenses recognized inrespect of defined benefitretirement plans obligation(Note 34(a)) 16 16 9 5 7
119,619 129,495 173,656 76,290 88,127
(c) Other items
Year ended December 31,Six months ended
June 30,
2018 2019 2020 2020 2021
USD’000 USD’000 USD’000 USD’000 USD’000(unaudited)
Depreciation charge– owned properties, plants
and equipment 19,279 17,416 17,858 8,799 10,467– right-of-use assets 2,582 3,091 3,302 1,520 2,230– investment property 214 206 206 100 37Amortization of intangibleassets 312 296 296 148 149Research and developmentcosts (Note i) 27,656 31,356 38,939 16,984 27,967(Reversal)/Provision forimpairment loss on trade andother receivables (2,688) 1,825 450 607 (853)Provision for write-down ofinventories 1,369 2,930 696 2,486 2,996Auditors’ remuneration– audit services 284 357 388 40 266– non-audit services 149 130 174 26 11Listing expenses – – 272 – 2,122Cost of inventories sold(Note ii) 515,528 591,201 832,230 369,116 617,870
APPENDIX I ACCOUNTANTS’ REPORT
– I-46 –
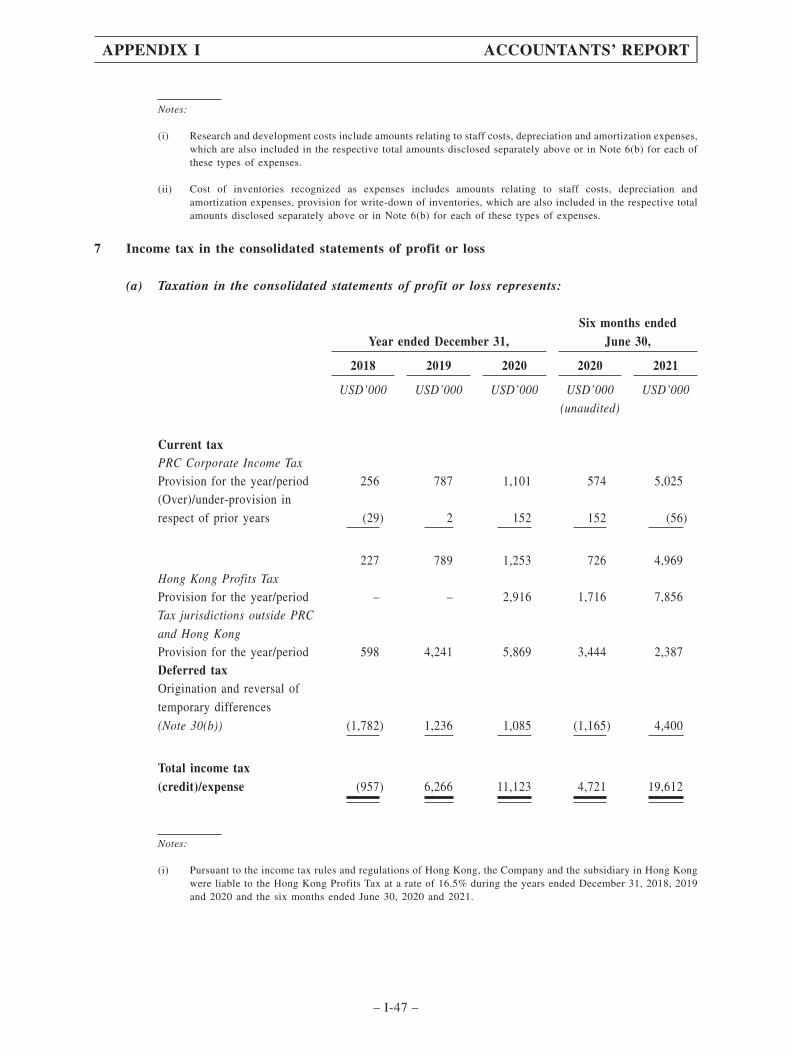
Notes:
(i) Research and development costs include amounts relating to staff costs, depreciation and amortization expenses,which are also included in the respective total amounts disclosed separately above or in Note 6(b) for each ofthese types of expenses.
(ii) Cost of inventories recognized as expenses includes amounts relating to staff costs, depreciation andamortization expenses, provision for write-down of inventories, which are also included in the respective totalamounts disclosed separately above or in Note 6(b) for each of these types of expenses.
7 Income tax in the consolidated statements of profit or loss
(a) Taxation in the consolidated statements of profit or loss represents:
Year ended December 31,Six months ended
June 30,
2018 2019 2020 2020 2021
USD’000 USD’000 USD’000 USD’000 USD’000(unaudited)
Current taxPRC Corporate Income TaxProvision for the year/period 256 787 1,101 574 5,025(Over)/under-provision in
respect of prior years (29) 2 152 152 (56)
227 789 1,253 726 4,969Hong Kong Profits TaxProvision for the year/period – – 2,916 1,716 7,856Tax jurisdictions outside PRC
and Hong KongProvision for the year/period 598 4,241 5,869 3,444 2,387Deferred taxOrigination and reversal of
temporary differences
(Note 30(b)) (1,782) 1,236 1,085 (1,165) 4,400
Total income tax(credit)/expense (957) 6,266 11,123 4,721 19,612
Notes:
(i) Pursuant to the income tax rules and regulations of Hong Kong, the Company and the subsidiary in Hong Kongwere liable to the Hong Kong Profits Tax at a rate of 16.5% during the years ended December 31, 2018, 2019and 2020 and the six months ended June 30, 2020 and 2021.
APPENDIX I ACCOUNTANTS’ REPORT
– I-47 –

(ii) The PRC subsidiaries of the Group are subject to PRC Corporate Income Tax (“CIT”) at a statutory rate of 25%,except for the following specified subsidiary:
According to the Administrative Measures for Determination of High-Tech Enterprises (Guokefahuo [2016] No.32), Nanjing Chervon Industry Co., Ltd. obtained the qualification as a high-tech enterprise and was entitled toa preferential income tax rate of 15% for the years from 2016 to 2019. Nanjing Chervon Industry Co., Ltd.renewed the qualification in 2019 and was entitled to a preferential income tax rate of 15% from 2019 to 2021.
According to the prevailing PRC CIT law and its relevant regulations, non-PRC tax resident enterprises arelevied withholding tax on dividends from their PRC resident investees for intra-group earnings accumulatedbeginning on January 1, 2008, at 10% (unless reduced by tax treaties or similar arrangements), respectively.Undistributed earnings generated prior to 2008 are exempt from such withholding tax.
Under the arrangement between the Mainland China and Hong Kong Special Administrative Region for theAvoidance of Double Taxation and the Prevention of Fiscal Evasion with respect to Taxes on Income and itsrelevant regulations, dividends paid by a PRC resident enterprise to its direct holding company in Hong Kongwill be subject to withholding tax at a reduced rate of 5% (if the Hong Kong investor is the “beneficial owner”and owns directly at least 25% of the equity interest of the PRC resident enterprise for the past twelve monthsbefore the dividends distribution). The Group met the beneficial owner requirements in 2015 and were entitledto a preferential rate of 5% since 2015.
(iii) Pursuant to the income tax rules and regulations of the United States, the Group’s subsidiaries in the UnitedStates was liable to United States federal income tax at a rate of 21% and state income tax at a rate ranging from0.75% to 9.99% during the Relevant Periods.
(iv) Pursuant to the income tax rules and regulations of the United Kingdom, the Group’s subsidiary in the UnitedKingdom was liable to the United Kingdom corporation tax at a rate of 20% during the Relevant Periods.
(v) Pursuant to the income tax rules and regulations of Germany, Chervon GmbH, Flex Geschaftsfuhrungs GmbH,Flex Verwaltungs GmbH & Co.KG, Flex-Elektrowerkzeuge Gmb and EGO Europe GmbH were liable toGerman corporate tax at a rate between 22.825% and 26.825% determined by municipalities during the RelevantPeriods.
(vi) Pursuant to the rules and regulations of the Australia, the Group’s subsidiary in the Australia was liable to theAustralia corporation tax at a rate of 27.5% during the Relevant Periods.
(vii) Pursuant to the rules and regulations of the Canada, the Group’s subsidiary in the Canada was liable to theCanada corporation tax at a rate of 26.5% during the Relevant Periods.
(viii) Pursuant to the rules and regulations of the Netherlands, the Group’s subsidiaries in the Netherlands was liableto the Netherlands corporation tax at a rate of 25% during the Relevant Periods.
(ix) Pursuant to the rules and regulations of the Czech, the Group’s subsidiary in the Czech was liable to the Czechcorporation tax at a rate of 19% during the Relevant Periods.
(x) Pursuant to the rules and regulations of the Belgium, the Group’s subsidiary in the Belgium was liable to theBelgium corporation tax at a rate of 25% during the Relevant Periods.
(xi) Pursuant to the rules and regulations of the Italia, the Group’s subsidiary in the Italia was liable to the Italiacorporation tax at a rate of 24% during the Relevant Periods.
(xii) Pursuant to the rules and regulations of the France, the Group’s subsidiary in the France was liable to the Francecorporation tax at a rate of 28% during the Relevant Periods.
(xiii) Pursuant to the Vietnam Investment Law and the approval of Industry Zone Committee of Tinh Binh Duong,the Group’s subsidiary in the Vietnam was entitled to a tax exemption for 2020 and 2021 and a preferentialincome tax rate of 10% from 2022 to 2025.
APPENDIX I ACCOUNTANTS’ REPORT
– I-48 –

(b) Reconciliation between (loss)/profit before taxation and tax expense and at applicable taxrates:
Year ended December 31,Six months ended
June 30,
2018 2019 2020 2020 2021
USD’000 USD’000 USD’000 USD’000 USD’000(unaudited)
(Loss)/profit before taxation (14,414) 42,348 59,511 25,212 110,851
Notional tax on (loss)/profit
before taxation, calculated at
the rates applicable to profits
in the jurisdictions concerned (1,713) 9,198 12,834 5,402 23,545Effect of PRC tax concessions
obtained (1,119) (1,069) (729) (80) (2,782)Tax effect of non-deductible
expenses (Note) 1,761 1,940 3,098 1,576 1,695Tax effect of non-taxable
income (471) (3,367) (4,231) (1,664) (3,493)Tax effect of tax losses not
recognized 2,491 1,645 1,916 858 1,167Tax effect of bonus deduction
for research and development
costs (2,221) (2,944) (3,420) (1,790) (2,703)Provision of withholding tax
on undistributed profits 344 861 1,503 267 2,239(Over)/under-provision in
prior years (29) 2 152 152 (56)
Income tax (credit)/expense (957) 6,266 11,123 4,721 19,612
Note:
Tax effect of non-deductible expenses mainly represented tax effect of equity settled share-based payment expenses,expenses incurred by entities without assessable profits and other non-deductible expenses.
APPENDIX I ACCOUNTANTS’ REPORT
– I-49 –
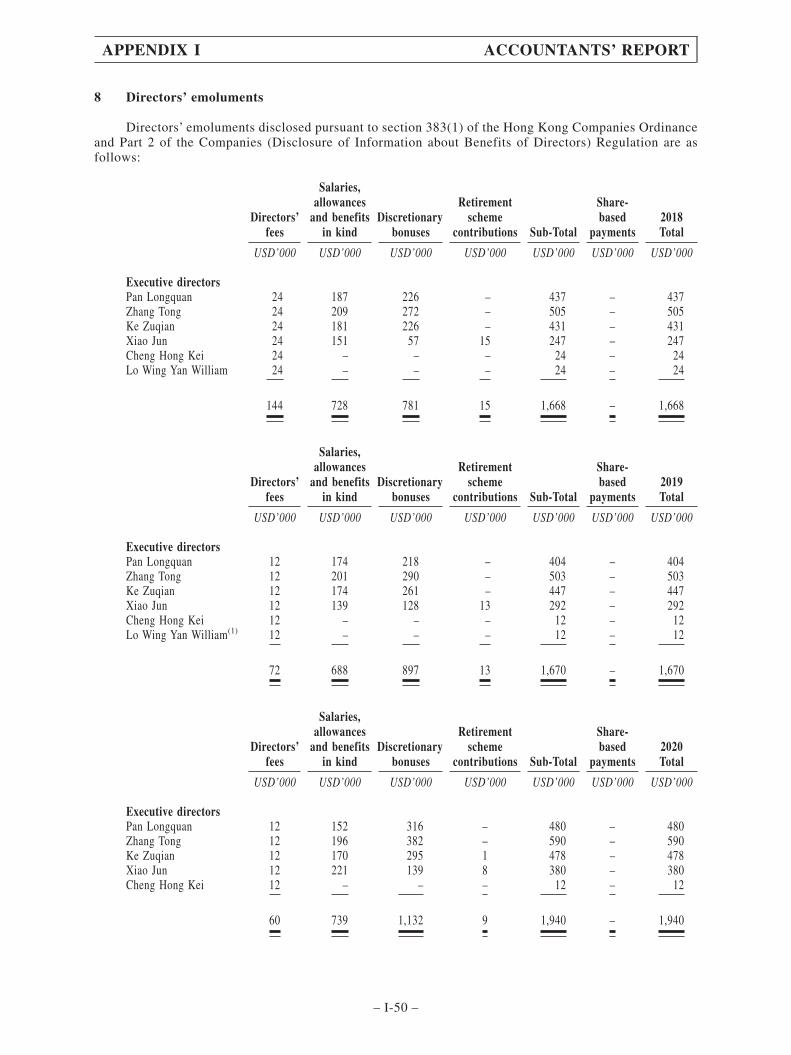
8 Directors’ emoluments
Directors’ emoluments disclosed pursuant to section 383(1) of the Hong Kong Companies Ordinanceand Part 2 of the Companies (Disclosure of Information about Benefits of Directors) Regulation are asfollows:
Directors’fees
Salaries,allowances
and benefitsin kind
Discretionarybonuses
Retirementscheme
contributions Sub-Total
Share-based
payments2018Total
USD’000 USD’000 USD’000 USD’000 USD’000 USD’000 USD’000
Executive directorsPan Longquan 24 187 226 – 437 – 437Zhang Tong 24 209 272 – 505 – 505Ke Zuqian 24 181 226 – 431 – 431Xiao Jun 24 151 57 15 247 – 247Cheng Hong Kei 24 – – – 24 – 24Lo Wing Yan William 24 – – – 24 – 24
144 728 781 15 1,668 – 1,668
Directors’fees
Salaries,allowances
and benefitsin kind
Discretionarybonuses
Retirementscheme
contributions Sub-Total
Share-based
payments2019Total
USD’000 USD’000 USD’000 USD’000 USD’000 USD’000 USD’000
Executive directorsPan Longquan 12 174 218 – 404 – 404Zhang Tong 12 201 290 – 503 – 503Ke Zuqian 12 174 261 – 447 – 447Xiao Jun 12 139 128 13 292 – 292Cheng Hong Kei 12 – – – 12 – 12Lo Wing Yan William(1) 12 – – – 12 – 12
72 688 897 13 1,670 – 1,670
Directors’fees
Salaries,allowances
and benefitsin kind
Discretionarybonuses
Retirementscheme
contributions Sub-Total
Share-based
payments2020Total
USD’000 USD’000 USD’000 USD’000 USD’000 USD’000 USD’000
Executive directorsPan Longquan 12 152 316 – 480 – 480Zhang Tong 12 196 382 – 590 – 590Ke Zuqian 12 170 295 1 478 – 478Xiao Jun 12 221 139 8 380 – 380Cheng Hong Kei 12 – – – 12 – 12
60 739 1,132 9 1,940 – 1,940
APPENDIX I ACCOUNTANTS’ REPORT
– I-50 –

Note:
(1) Mr. Lo Wing Yan William was our former director from January 2010 to May 2019, who resigned from directorshipwith effect from May 21, 2019. The reason for the resignation of Mr. Lo Wing Yan William as a director of ourCompany is that pursuant to our former articles of association our Board will voluntarily resign and be re-elected onceevery two years and during that time Mr. Lo Wing Yan William decided not to pursue the re-election due to (i) hisordinary residence in Hong Kong which limits his access to our business in the PRC; and (ii) his shift of focus to othercommitments.
Directors’fees
Salaries,allowances
and benefitsin kind
Discretionarybonuses
Retirementscheme
contributions Sub-TotalShare-based
payments
Six monthsended
June 30,2020Total
USD’000 USD’000 USD’000 USD’000 USD’000 USD’000 USD’000(unaudited) (unaudited) (unaudited) (unaudited) (unaudited) (unaudited) (unaudited)
Executive directorsPan Longquan 6 64 68 – 138 – 138Zhang Tong 6 94 68 – 168 – 168Ke Zuqian 6 81 68 – 155 – 155Xiao Jun 6 139 – 4 149 – 149Cheng Hong Kei 6 – – – 6 – 6
30 378 204 4 616 – 616
Directors’fees
Salaries,allowances
and benefitsin kind
Discretionarybonuses
Retirementscheme
contributions Sub-TotalShare-based
payments
Six monthsended
June 30,2021Total
USD’000 USD’000 USD’000 USD’000 USD’000 USD’000 USD’000
Executive directorsPan Longquan – 93 74 – 167 – 167Zhang Tong – 100 74 – 174 – 174Ke Zuqian – 93 74 – 167 – 167Xiao Jun – 83 – 8 91 – 91Cheng Hong Kei – – – – – – –
– 369 222 8 599 – 599
All the executive directors are key management personnel of the Group during the Relevant Periods and their remunerationdisclosed above include those for services rendered by them as key management personnel.
APPENDIX I ACCOUNTANTS’ REPORT
– I-51 –

9 Individuals with highest emoluments
Of the five individuals with the highest emoluments, two, three, nil, nil and nil is director during the
years ended December 31, 2018, 2019 and 2020 and the six months ended June 30, 2020 and 2021,
respectively, whose emoluments are disclosed in Note 8. The aggregate of the emoluments in respect of
the remaining individuals are as follows:
Year ended December 31,Six months ended
June 30,
2018 2019 2020 2020 2021
USD’000 USD’000 USD’000 USD’000 USD’000(unaudited)
Salaries, allowances and benefits
in kind 1,319 1,220 1,109 848 820Discretionary bonuses 856 1,196 898 380 378Retirement scheme contributions 97 50 75 126 144Share-based payments – – 2,833 – –
2,272 2,466 4,915 1,354 1,342
The emoluments of the five, five, five, five and five individuals with the highest emoluments during
the years ended December 31, 2018, 2019 and 2020 and the six months ended June 30, 2020 and 2021,
respectively, are within the following bands:
Year ended December 31,Six months ended
June 30,
2018 2019 2020 2020 2021
Number of
individuals
Number of
individuals
Number of
individuals
Number of
individuals
Number of
individuals
(unaudited)
USD nil to USD500,000 4 4 – 5 5USD500,001 to USD1,000,000 1 1 2 – –USD1,000,001 to USD1,500,000 – – 3 – –
APPENDIX I ACCOUNTANTS’ REPORT
– I-52 –
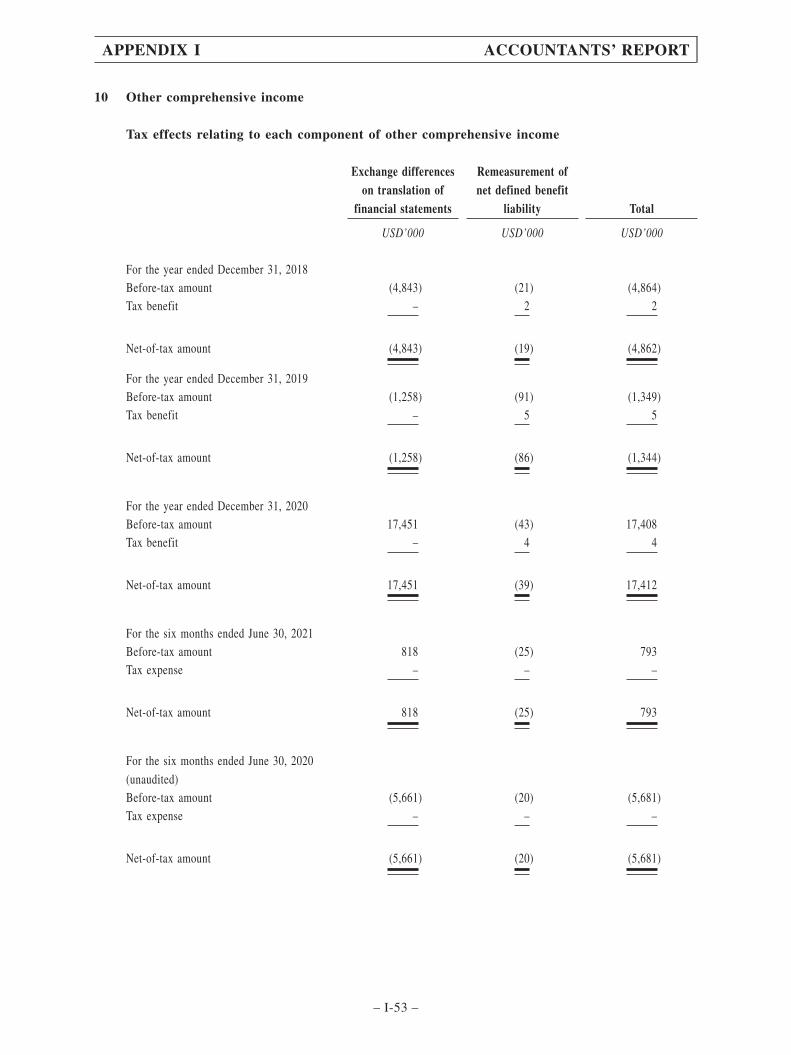
10 Other comprehensive income
Tax effects relating to each component of other comprehensive income
Exchange differenceson translation of
financial statements
Remeasurement ofnet defined benefit
liability Total
USD’000 USD’000 USD’000
For the year ended December 31, 2018Before-tax amount (4,843) (21) (4,864)Tax benefit – 2 2
Net-of-tax amount (4,843) (19) (4,862)
For the year ended December 31, 2019Before-tax amount (1,258) (91) (1,349)Tax benefit – 5 5
Net-of-tax amount (1,258) (86) (1,344)
For the year ended December 31, 2020Before-tax amount 17,451 (43) 17,408Tax benefit – 4 4
Net-of-tax amount 17,451 (39) 17,412
For the six months ended June 30, 2021Before-tax amount 818 (25) 793Tax expense – – –
Net-of-tax amount 818 (25) 793
For the six months ended June 30, 2020
(unaudited)Before-tax amount (5,661) (20) (5,681)Tax expense – – –
Net-of-tax amount (5,661) (20) (5,681)
APPENDIX I ACCOUNTANTS’ REPORT
– I-53 –
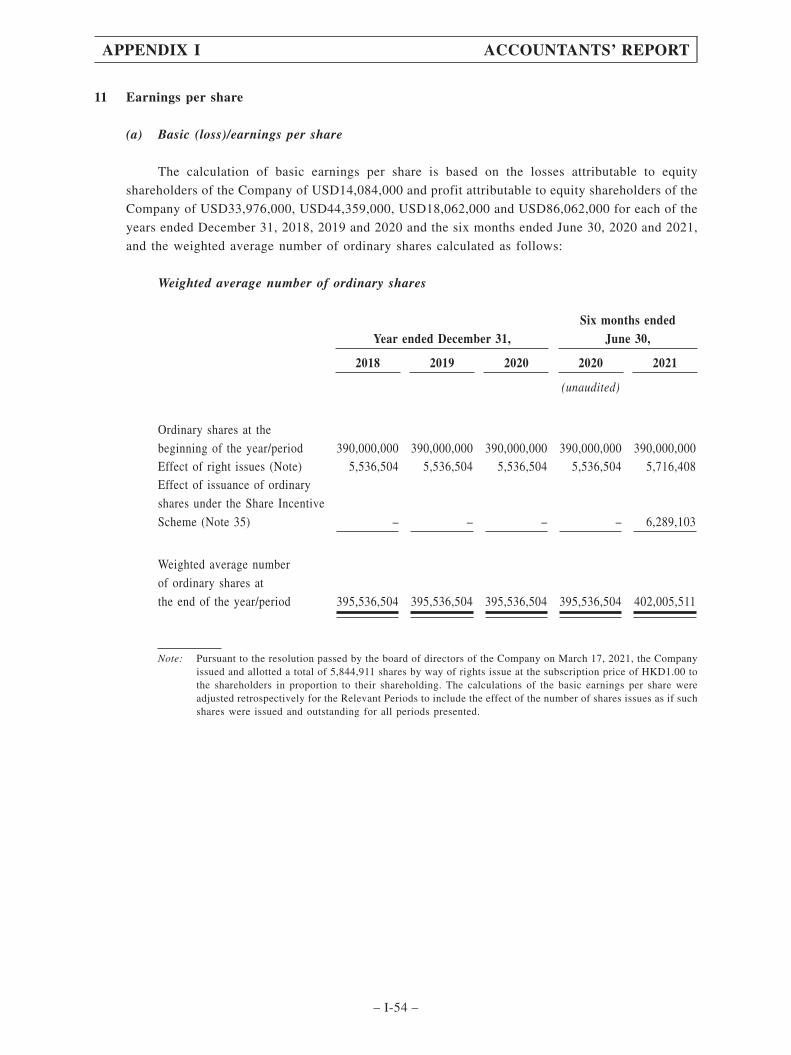
11 Earnings per share
(a) Basic (loss)/earnings per share
The calculation of basic earnings per share is based on the losses attributable to equity
shareholders of the Company of USD14,084,000 and profit attributable to equity shareholders of the
Company of USD33,976,000, USD44,359,000, USD18,062,000 and USD86,062,000 for each of the
years ended December 31, 2018, 2019 and 2020 and the six months ended June 30, 2020 and 2021,
and the weighted average number of ordinary shares calculated as follows:
Weighted average number of ordinary shares
Year ended December 31,Six months ended
June 30,
2018 2019 2020 2020 2021
(unaudited)
Ordinary shares at the
beginning of the year/period 390,000,000 390,000,000 390,000,000 390,000,000 390,000,000Effect of right issues (Note) 5,536,504 5,536,504 5,536,504 5,536,504 5,716,408Effect of issuance of ordinary
shares under the Share Incentive
Scheme (Note 35) – – – – 6,289,103
Weighted average number
of ordinary shares at
the end of the year/period 395,536,504 395,536,504 395,536,504 395,536,504 402,005,511
Note: Pursuant to the resolution passed by the board of directors of the Company on March 17, 2021, the Companyissued and allotted a total of 5,844,911 shares by way of rights issue at the subscription price of HKD1.00 tothe shareholders in proportion to their shareholding. The calculations of the basic earnings per share wereadjusted retrospectively for the Relevant Periods to include the effect of the number of shares issues as if suchshares were issued and outstanding for all periods presented.
APPENDIX I ACCOUNTANTS’ REPORT
– I-54 –
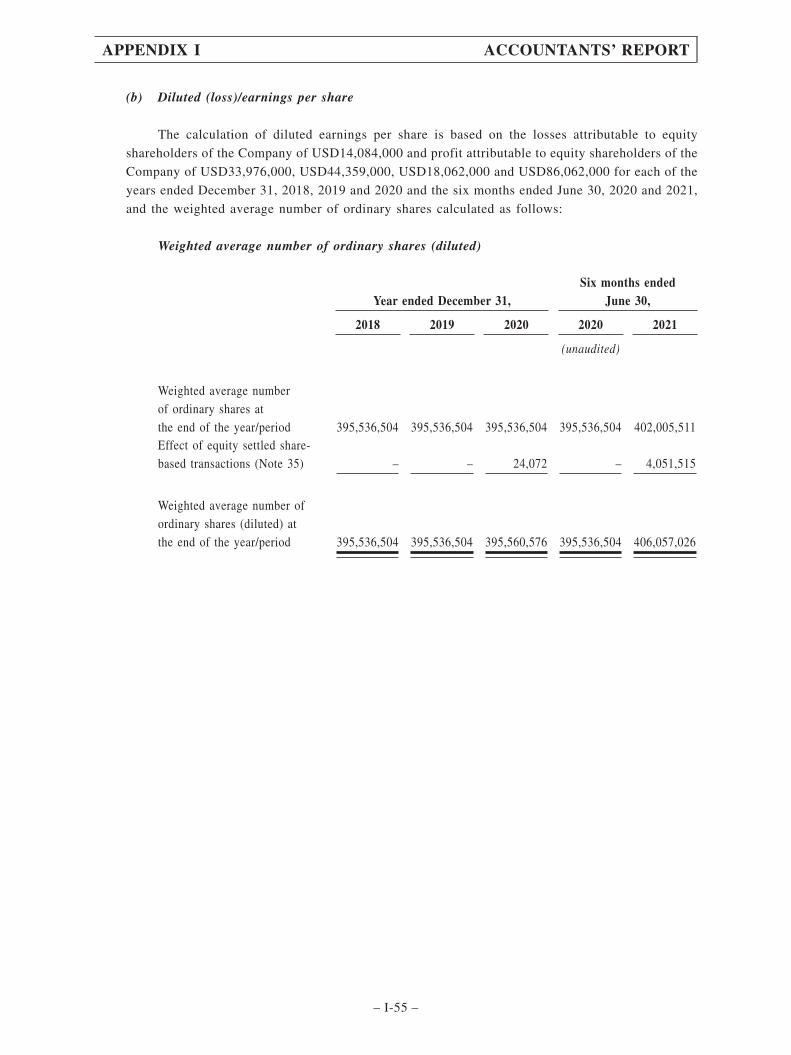
(b) Diluted (loss)/earnings per share
The calculation of diluted earnings per share is based on the losses attributable to equity
shareholders of the Company of USD14,084,000 and profit attributable to equity shareholders of the
Company of USD33,976,000, USD44,359,000, USD18,062,000 and USD86,062,000 for each of the
years ended December 31, 2018, 2019 and 2020 and the six months ended June 30, 2020 and 2021,
and the weighted average number of ordinary shares calculated as follows:
Weighted average number of ordinary shares (diluted)
Year ended December 31,Six months ended
June 30,
2018 2019 2020 2020 2021
(unaudited)
Weighted average numberof ordinary shares atthe end of the year/period 395,536,504 395,536,504 395,536,504 395,536,504 402,005,511Effect of equity settled share-based transactions (Note 35) – – 24,072 – 4,051,515
Weighted average number ofordinary shares (diluted) atthe end of the year/period 395,536,504 395,536,504 395,560,576 395,536,504 406,057,026
APPENDIX I ACCOUNTANTS’ REPORT
– I-55 –
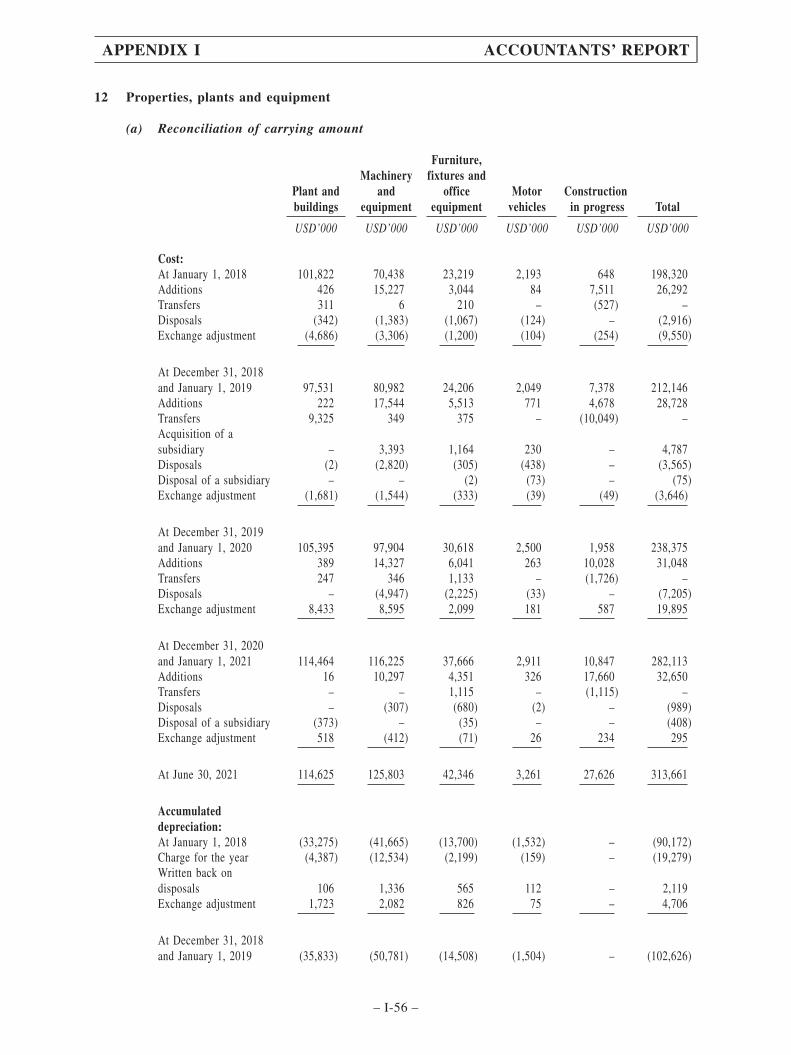
12 Properties, plants and equipment
(a) Reconciliation of carrying amount
Plant andbuildings
Machineryand
equipment
Furniture,fixtures and
officeequipment
Motorvehicles
Constructionin progress Total
USD’000 USD’000 USD’000 USD’000 USD’000 USD’000
Cost:At January 1, 2018 101,822 70,438 23,219 2,193 648 198,320Additions 426 15,227 3,044 84 7,511 26,292Transfers 311 6 210 – (527) –Disposals (342) (1,383) (1,067) (124) – (2,916)Exchange adjustment (4,686) (3,306) (1,200) (104) (254) (9,550)
At December 31, 2018and January 1, 2019 97,531 80,982 24,206 2,049 7,378 212,146Additions 222 17,544 5,513 771 4,678 28,728Transfers 9,325 349 375 – (10,049) –Acquisition of asubsidiary – 3,393 1,164 230 – 4,787Disposals (2) (2,820) (305) (438) – (3,565)Disposal of a subsidiary – – (2) (73) – (75)Exchange adjustment (1,681) (1,544) (333) (39) (49) (3,646)
At December 31, 2019and January 1, 2020 105,395 97,904 30,618 2,500 1,958 238,375Additions 389 14,327 6,041 263 10,028 31,048Transfers 247 346 1,133 – (1,726) –Disposals – (4,947) (2,225) (33) – (7,205)Exchange adjustment 8,433 8,595 2,099 181 587 19,895
At December 31, 2020and January 1, 2021 114,464 116,225 37,666 2,911 10,847 282,113Additions 16 10,297 4,351 326 17,660 32,650Transfers – – 1,115 – (1,115) –Disposals – (307) (680) (2) – (989)Disposal of a subsidiary (373) – (35) – – (408)Exchange adjustment 518 (412) (71) 26 234 295
At June 30, 2021 114,625 125,803 42,346 3,261 27,626 313,661
Accumulateddepreciation:At January 1, 2018 (33,275) (41,665) (13,700) (1,532) – (90,172)Charge for the year (4,387) (12,534) (2,199) (159) – (19,279)Written back ondisposals 106 1,336 565 112 – 2,119Exchange adjustment 1,723 2,082 826 75 – 4,706
At December 31, 2018and January 1, 2019 (35,833) (50,781) (14,508) (1,504) – (102,626)
APPENDIX I ACCOUNTANTS’ REPORT
– I-56 –
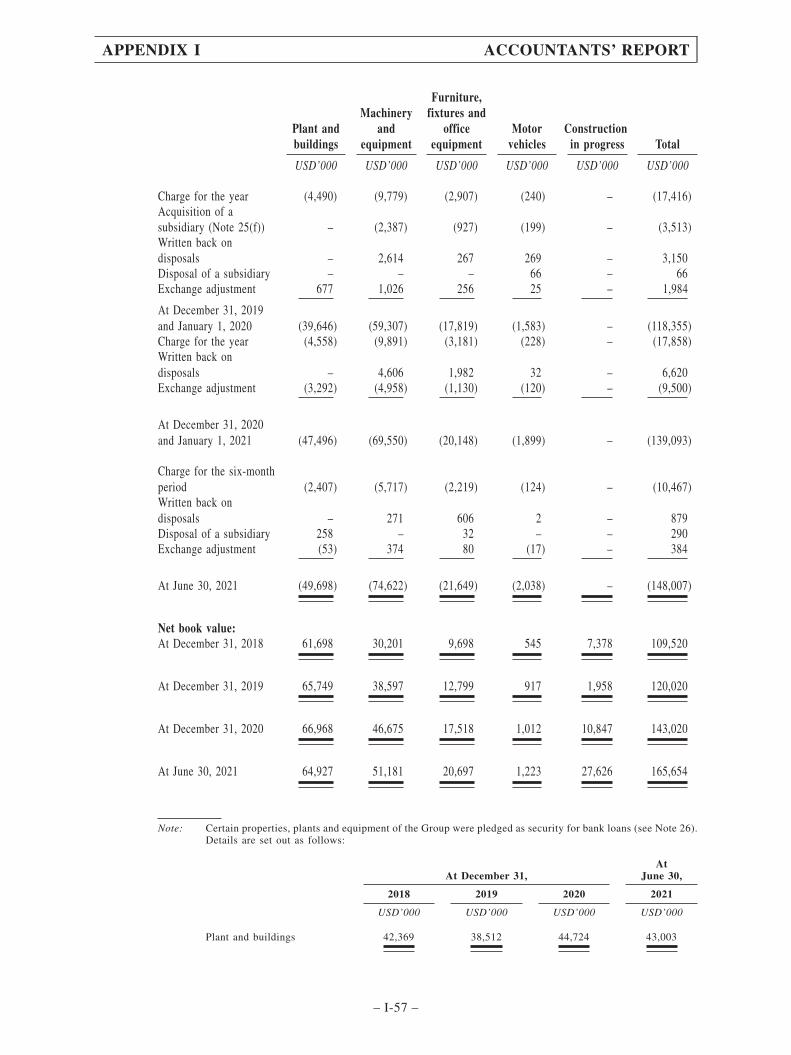
Plant andbuildings
Machineryand
equipment
Furniture,fixtures and
officeequipment
Motorvehicles
Constructionin progress Total
USD’000 USD’000 USD’000 USD’000 USD’000 USD’000
Charge for the year (4,490) (9,779) (2,907) (240) – (17,416)Acquisition of asubsidiary (Note 25(f)) – (2,387) (927) (199) – (3,513)Written back ondisposals – 2,614 267 269 – 3,150Disposal of a subsidiary – – – 66 – 66Exchange adjustment 677 1,026 256 25 – 1,984
At December 31, 2019and January 1, 2020 (39,646) (59,307) (17,819) (1,583) – (118,355)Charge for the year (4,558) (9,891) (3,181) (228) – (17,858)Written back ondisposals – 4,606 1,982 32 – 6,620Exchange adjustment (3,292) (4,958) (1,130) (120) – (9,500)
At December 31, 2020and January 1, 2021 (47,496) (69,550) (20,148) (1,899) – (139,093)
Charge for the six-monthperiod (2,407) (5,717) (2,219) (124) – (10,467)Written back ondisposals – 271 606 2 – 879Disposal of a subsidiary 258 – 32 – – 290Exchange adjustment (53) 374 80 (17) – 384
At June 30, 2021 (49,698) (74,622) (21,649) (2,038) – (148,007)
Net book value:At December 31, 2018 61,698 30,201 9,698 545 7,378 109,520
At December 31, 2019 65,749 38,597 12,799 917 1,958 120,020
At December 31, 2020 66,968 46,675 17,518 1,012 10,847 143,020
At June 30, 2021 64,927 51,181 20,697 1,223 27,626 165,654
Note: Certain properties, plants and equipment of the Group were pledged as security for bank loans (see Note 26).Details are set out as follows:
At December 31,At
June 30,
2018 2019 2020 2021
USD’000 USD’000 USD’000 USD’000
Plant and buildings 42,369 38,512 44,724 43,003
APPENDIX I ACCOUNTANTS’ REPORT
– I-57 –

13 Right-of-use assets
The analysis of the net book value of right-of-use assets by class of underlying asset is presentedbelow:
Plant andbuildings
LeaseholdLand Total
USD’000 USD’000 USD’000
Cost:At January 1, 2018 17,874 31,514 49,388Additions 1,638 – 1,638Exchange adjustment (136) (1,631) (1,767)
At December 31, 2018 and January 1, 2019 19,376 29,883 49,259Additions 2,686 – 2,686Disposals (246) – (246)Exchange adjustment (70) (484) (554)
At December 31, 2019 and January 1, 2020 21,746 29,399 51,145Additions 3,028 – 3,028Disposals (798) – (798)Exchange adjustment 465 2,033 2,498
At December 31, 2020 and January 1, 2021 24,441 31,432 55,873Additions 1,410 – 1,410Disposals (110) – (110)Exchange adjustment (58) 315 257
At June 30, 2021 25,683 31,747 57,430
Accumulated depreciation:At January 1, 2018 (2,278) (2,917) (5,195)Charge for the year (1,964) (618) (2,582)Exchange adjustment 66 172 238
At December 31, 2018 and January 1, 2019 (4,176) (3,363) (7,539)Charge for the year (2,496) (595) (3,091)Written back on disposals 246 – 246Exchange adjustment 7 61 68
At December 31, 2019 and January 1, 2020 (6,419) (3,897) (10,316)Charge for the year (2,707) (595) (3,302)Written back on disposals 798 – 798Exchange adjustment (121) (303) (424)
At December 31, 2020 and January 1, 2021 (8,449) (4,795) (13,244)Charge for the six-month period (1,913) (317) (2,230)Written back on disposals 110 – 110Exchange adjustment 30 (48) (18)
At June 30, 2021 (10,222) (5,160) (15,382)
APPENDIX I ACCOUNTANTS’ REPORT
– I-58 –

Plant andbuildings
LeaseholdLand Total
USD’000 USD’000 USD’000
Net book value:At December 31, 2018 15,200 26,520 41,720
At December 31, 2019 15,327 25,502 40,829
At December 31, 2020 15,992 26,637 42,629
At June 30, 2021 15,461 26,587 42,048
Notes:
(i) The Group obtains the right-of-use certain land in the PRC under several operating lease agreements of 50 years. Asat December 31, 2018, 2019 and 2020 and June 30, 2021, the carrying amounts of leasehold land held for own use wereUSD26,520,000, USD25,502,000, USD26,637,000 and USD26,587,000, respectively.
(ii) The Group has obtained the right to use certain office and warehouse properties through tenancy agreements duringthe Relevant Periods. The leases typically run for a period of 1 to 13 years.
The analysis of expense items in relation to leases recognized in profit or loss is as follows:
At December 31,Six months ended
June 30,
2018 2019 2020 2020 2021
USD’000 USD’000 USD’000 USD’000 USD’000(unaudited)
Depreciation charge of right-of-useassets by class of underlying asset:– Leasehold land 618 595 595 292 317– Plant and buildings 1,964 2,496 2,707 1,228 1,913
2,582 3,091 3,302 1,520 2,230
Interest on lease liabilities(Note 6(a)) 622 611 603 301 120Expense relating to short-termleases 846 922 1,022 458 928
Details of total cash outflow for leases and the maturity analysis of lease liabilities are set out inNotes 25(e) and 27, respectively.
APPENDIX I ACCOUNTANTS’ REPORT
– I-59 –

Certain right-of-use assets of the Group were pledged as security for bank loans (see Note 26).
Details are set out as follows:
At December 31,At
June 30,
2018 2019 2020 2021
USD’000 USD’000 USD’000 USD’000
Leasehold land 25,375 24,409 25,503 25,458
14 Investment Properties
Plant andbuildings
LeaseholdLand Total
USD’000 USD’000 USD’000
Cost:At January 1, 2018 4,600 526 5,126Exchange adjustment (221) (26) (247)
At December 31, 2018 and January 1, 2019 4,379 500 4,879Exchange adjustment (71) (8) (79)
At December 31, 2019 and January 1, 2020 4,308 492 4,800Exchange adjustment 298 34 332
At December 31, 2020 and January 1, 2021 4,606 526 5,132Disposal of a subsidiary (4,622) (529) (5,151)Exchange adjustment 16 3 19
At June 30, 2021 – – –
Accumulated amortization:At January 1, 2018 (3,021) (192) (3,213)Charge for the year (204) (10) (214)Exchange adjustment 152 10 162
At December 31, 2018 and January 1, 2019 (3,073) (192) (3,265)Charge for the year (196) (10) (206)Exchange adjustment 52 3 55
APPENDIX I ACCOUNTANTS’ REPORT
– I-60 –
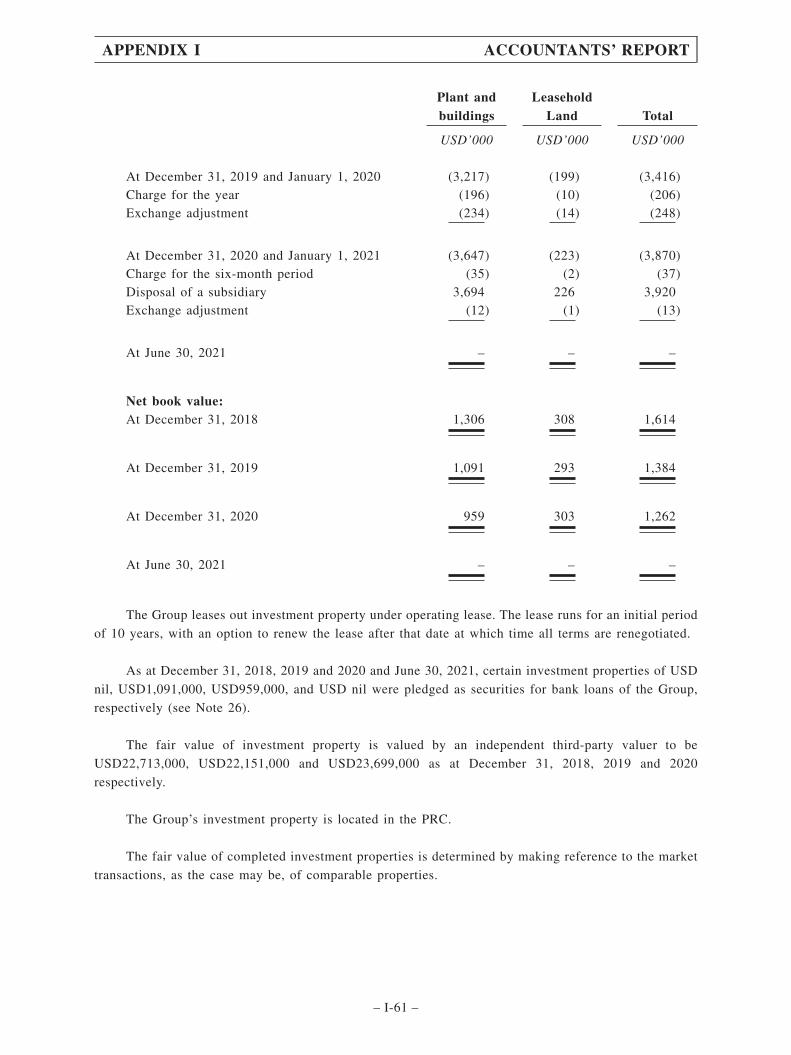
Plant andbuildings
LeaseholdLand Total
USD’000 USD’000 USD’000
At December 31, 2019 and January 1, 2020 (3,217) (199) (3,416)Charge for the year (196) (10) (206)Exchange adjustment (234) (14) (248)
At December 31, 2020 and January 1, 2021 (3,647) (223) (3,870)Charge for the six-month period (35) (2) (37)Disposal of a subsidiary 3,694 226 3,920Exchange adjustment (12) (1) (13)
At June 30, 2021 – – –
Net book value:At December 31, 2018 1,306 308 1,614
At December 31, 2019 1,091 293 1,384
At December 31, 2020 959 303 1,262
At June 30, 2021 – – –
The Group leases out investment property under operating lease. The lease runs for an initial period
of 10 years, with an option to renew the lease after that date at which time all terms are renegotiated.
As at December 31, 2018, 2019 and 2020 and June 30, 2021, certain investment properties of USD
nil, USD1,091,000, USD959,000, and USD nil were pledged as securities for bank loans of the Group,
respectively (see Note 26).
The fair value of investment property is valued by an independent third-party valuer to be
USD22,713,000, USD22,151,000 and USD23,699,000 as at December 31, 2018, 2019 and 2020
respectively.
The Group’s investment property is located in the PRC.
The fair value of completed investment properties is determined by making reference to the market
transactions, as the case may be, of comparable properties.
APPENDIX I ACCOUNTANTS’ REPORT
– I-61 –
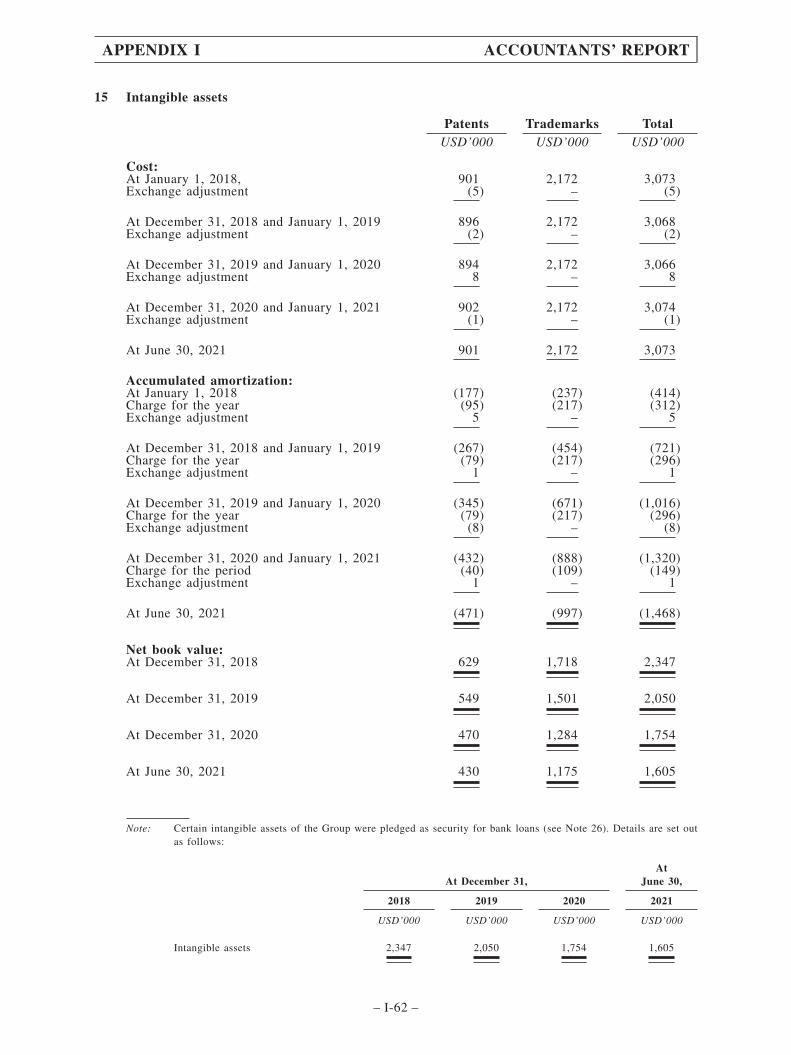
15 Intangible assets
Patents Trademarks TotalUSD’000 USD’000 USD’000
Cost:At January 1, 2018, 901 2,172 3,073Exchange adjustment (5) – (5)
At December 31, 2018 and January 1, 2019 896 2,172 3,068Exchange adjustment (2) – (2)
At December 31, 2019 and January 1, 2020 894 2,172 3,066Exchange adjustment 8 – 8
At December 31, 2020 and January 1, 2021 902 2,172 3,074Exchange adjustment (1) – (1)
At June 30, 2021 901 2,172 3,073
Accumulated amortization:At January 1, 2018 (177) (237) (414)Charge for the year (95) (217) (312)Exchange adjustment 5 – 5
At December 31, 2018 and January 1, 2019 (267) (454) (721)Charge for the year (79) (217) (296)Exchange adjustment 1 – 1
At December 31, 2019 and January 1, 2020 (345) (671) (1,016)Charge for the year (79) (217) (296)Exchange adjustment (8) – (8)
At December 31, 2020 and January 1, 2021 (432) (888) (1,320)Charge for the period (40) (109) (149)Exchange adjustment 1 – 1
At June 30, 2021 (471) (997) (1,468)
Net book value:At December 31, 2018 629 1,718 2,347
At December 31, 2019 549 1,501 2,050
At December 31, 2020 470 1,284 1,754
At June 30, 2021 430 1,175 1,605
Note: Certain intangible assets of the Group were pledged as security for bank loans (see Note 26). Details are set outas follows:
At December 31,At
June 30,
2018 2019 2020 2021
USD’000 USD’000 USD’000 USD’000
Intangible assets 2,347 2,050 1,754 1,605
APPENDIX I ACCOUNTANTS’ REPORT
– I-62 –
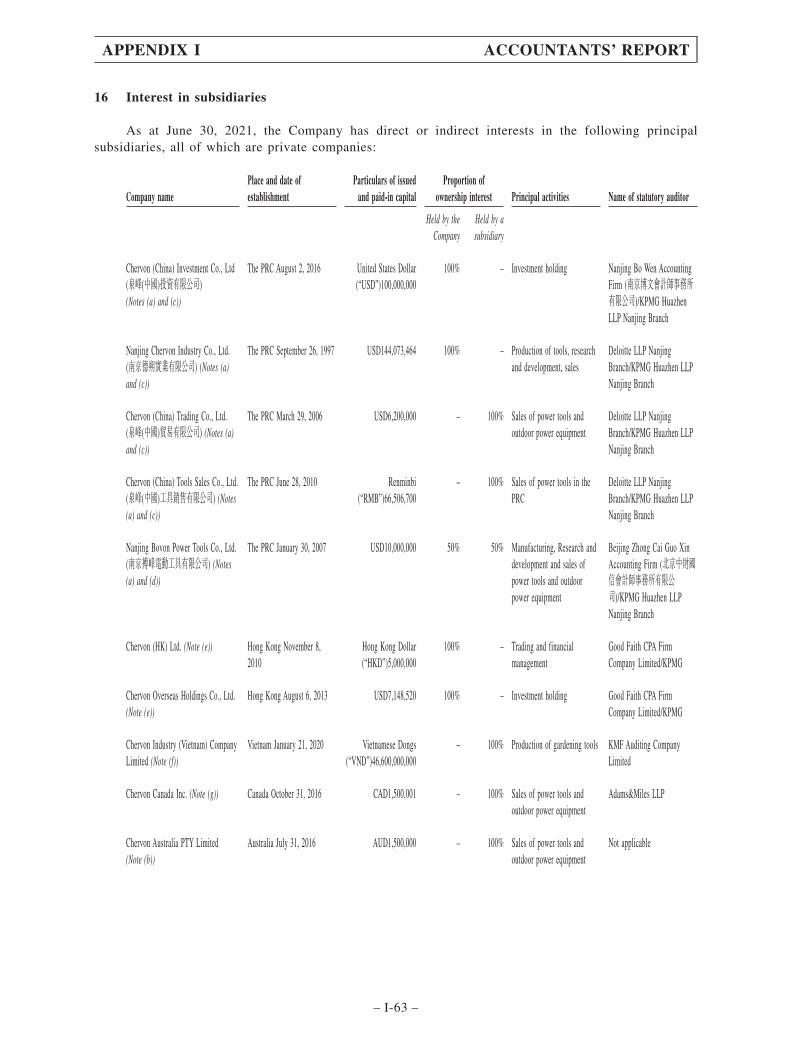
16 Interest in subsidiaries
As at June 30, 2021, the Company has direct or indirect interests in the following principalsubsidiaries, all of which are private companies:
Company namePlace and date ofestablishment
Particulars of issuedand paid-in capital
Proportion ofownership interest Principal activities Name of statutory auditor
Held by theCompany
Held by asubsidiary
Chervon (China) Investment Co., Ltd(泉峰(中國)投資有限公司)(Notes (a) and (c))
The PRC August 2, 2016 United States Dollar(“USD”)100,000,000
100% – Investment holding Nanjing Bo Wen AccountingFirm (南京博文會計師事務所有限公司)/KPMG HuazhenLLP Nanjing Branch
Nanjing Chervon Industry Co., Ltd.(南京德朔實業有限公司) (Notes (a)and (c))
The PRC September 26, 1997 USD144,073,464 100% – Production of tools, researchand development, sales
Deloitte LLP NanjingBranch/KPMG Huazhen LLPNanjing Branch
Chervon (China) Trading Co., Ltd.(泉峰(中國)貿易有限公司) (Notes (a)and (c))
The PRC March 29, 2006 USD6,200,000 – 100% Sales of power tools andoutdoor power equipment
Deloitte LLP NanjingBranch/KPMG Huazhen LLPNanjing Branch
Chervon (China) Tools Sales Co., Ltd.(泉峰(中國)工具銷售有限公司) (Notes(a) and (c))
The PRC June 28, 2010 Renminbi(“RMB”)66,506,700
– 100% Sales of power tools in thePRC
Deloitte LLP NanjingBranch/KPMG Huazhen LLPNanjing Branch
Nanjing Bovon Power Tools Co., Ltd.(南京搏峰電動工具有限公司) (Notes(a) and (d))
The PRC January 30, 2007 USD10,000,000 50% 50% Manufacturing, Research anddevelopment and sales ofpower tools and outdoorpower equipment
Beijing Zhong Cai Guo XinAccounting Firm (北京中財國信會計師事務所有限公司)/KPMG Huazhen LLPNanjing Branch
Chervon (HK) Ltd. (Note (e)) Hong Kong November 8,2010
Hong Kong Dollar(“HKD”)5,000,000
100% – Trading and financialmanagement
Good Faith CPA FirmCompany Limited/KPMG
Chervon Overseas Holdings Co., Ltd.(Note (e))
Hong Kong August 6, 2013 USD7,148,520 100% – Investment holding Good Faith CPA FirmCompany Limited/KPMG
Chervon Industry (Vietnam) CompanyLimited (Note (f))
Vietnam January 21, 2020 Vietnamese Dongs(“VND”)46,600,000,000
– 100% Production of gardening tools KMF Auditing CompanyLimited
Chervon Canada Inc. (Note (g)) Canada October 31, 2016 CAD1,500,001 – 100% Sales of power tools andoutdoor power equipment
Adams&Miles LLP
Chervon Australia PTY Limited(Note (b))
Australia July 31, 2016 AUD1,500,000 – 100% Sales of power tools andoutdoor power equipment
Not applicable
APPENDIX I ACCOUNTANTS’ REPORT
– I-63 –

Company namePlace and date ofestablishment
Particulars of issuedand paid-in capital
Proportion ofownership interest Principal activities Name of statutory auditor
Held by theCompany
Held by asubsidiary
Chervon North America Inc.(Note (h))
United States February 25,2005
USD300,000 – 100% Research in the NorthAmerican market, productdesign, sales and services
Hungerford Nichols CPA
Flex North America Inc. (Note (i)) United States December 19,2005
USD1 – 100% Sales of power tools andoutdoor power equipment
Steve Ramaekers CPA LLC
Flex Geschaftsfuhrungs GmbH(Note (b))
Germany May 3, 2013 Euro(“EUR”)25,000 – 100% Investment holding Not applicable
Flex Verwaltungs GmbH & Co., KG(Note (j))
Germany May 22, 2013 EUR19,000,500 – 100% Production of FLEX brand,design, sales and services
Ebner Stolz GmbH & Co.KG
Flex-Elektrowerkzeuge GmbH(Note (j))
Germany November 27, 1980 EUR3,580,100 – 100% Production of FLEX brand,design, sales and services
Ebner Stolz GmbH & Co.KG
Chervon GmbH (Note (b)) Germany July 1, 2016 EUR25,000 – 100% Sales of power tools andoutdoor power equipment
Not applicable
EGO Europe GmbH (Note (k)) Germany November 20, 2015 EUR50,000 – 100% Operation of EGO brands,sales and services
Ebner Stolz GmbH & Co. KG
Flex Elektronáradí, s.r.o (Note (b)) Czech June 18, 2008 CZK500,000 – 100% Sales of power tools andoutdoor power equipment
Not applicable
Flex Italia S.r.l. (Note (b)) Italy July 11, 2012 EUR50,000 – 100% Sales of power tools andoutdoor power equipment
Not applicable
Flex Electroportatif Machines ETAccessoires (Note (j))
France July 11, 2012 EUR10,000 – 100% Sales of power tools andoutdoor power equipment
Novances Nexia
FLEX POWER TOOLS BV (Note (j)) Belgium May 15, 2005 EUR95,167,585 – 100% Sales of power tools andoutdoor power equipment
VGD Bedrijfsrevisoren CVBA
Flex Power Tools B. V. (Note (b)) Netherlands January 24, 2012 EUR31,800 – 100% Sales of power tools andoutdoor power equipment
Not applicable
Skil B.V. (Note (l)) Netherlands August 12, 2016 EUR50,000 – 100% Do-It-Yourself businessdesign in Europe operationsand sales
Not applicable
Flex Power Tools Ltd. (Note (b)) United Kingdom November 9,2020
GBP1 – 100% Sales of power tools andoutdoor power equipment
Not applicable
Chervon Europe Limited (Note (m)) United Kingdom June 7, 2007 GBP1 – 100% Sales of power tools andoutdoor power equipment
Masons Statutory Auditors
Chervon NZ Subsidiary Limited(Note (n))
New Zealand May 3, 2021 New Zealand Dollar(“NZD”)1,500,100
– 100% Sales of power tools andoutdoor power equipment
Not applicable
APPENDIX I ACCOUNTANTS’ REPORT
– I-64 –
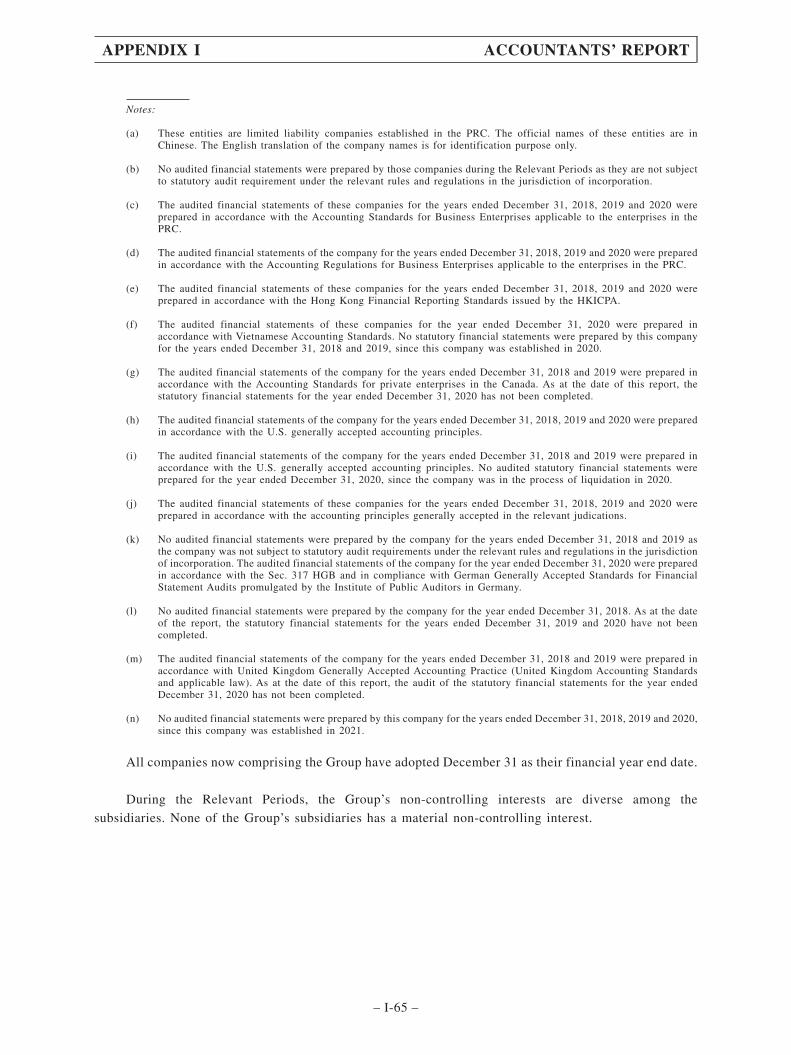
Notes:
(a) These entities are limited liability companies established in the PRC. The official names of these entities are inChinese. The English translation of the company names is for identification purpose only.
(b) No audited financial statements were prepared by those companies during the Relevant Periods as they are not subjectto statutory audit requirement under the relevant rules and regulations in the jurisdiction of incorporation.
(c) The audited financial statements of these companies for the years ended December 31, 2018, 2019 and 2020 wereprepared in accordance with the Accounting Standards for Business Enterprises applicable to the enterprises in thePRC.
(d) The audited financial statements of the company for the years ended December 31, 2018, 2019 and 2020 were preparedin accordance with the Accounting Regulations for Business Enterprises applicable to the enterprises in the PRC.
(e) The audited financial statements of these companies for the years ended December 31, 2018, 2019 and 2020 wereprepared in accordance with the Hong Kong Financial Reporting Standards issued by the HKICPA.
(f) The audited financial statements of these companies for the year ended December 31, 2020 were prepared inaccordance with Vietnamese Accounting Standards. No statutory financial statements were prepared by this companyfor the years ended December 31, 2018 and 2019, since this company was established in 2020.
(g) The audited financial statements of the company for the years ended December 31, 2018 and 2019 were prepared inaccordance with the Accounting Standards for private enterprises in the Canada. As at the date of this report, thestatutory financial statements for the year ended December 31, 2020 has not been completed.
(h) The audited financial statements of the company for the years ended December 31, 2018, 2019 and 2020 were preparedin accordance with the U.S. generally accepted accounting principles.
(i) The audited financial statements of the company for the years ended December 31, 2018 and 2019 were prepared inaccordance with the U.S. generally accepted accounting principles. No audited statutory financial statements wereprepared for the year ended December 31, 2020, since the company was in the process of liquidation in 2020.
(j) The audited financial statements of these companies for the years ended December 31, 2018, 2019 and 2020 wereprepared in accordance with the accounting principles generally accepted in the relevant judications.
(k) No audited financial statements were prepared by the company for the years ended December 31, 2018 and 2019 asthe company was not subject to statutory audit requirements under the relevant rules and regulations in the jurisdictionof incorporation. The audited financial statements of the company for the year ended December 31, 2020 were preparedin accordance with the Sec. 317 HGB and in compliance with German Generally Accepted Standards for FinancialStatement Audits promulgated by the Institute of Public Auditors in Germany.
(l) No audited financial statements were prepared by the company for the year ended December 31, 2018. As at the dateof the report, the statutory financial statements for the years ended December 31, 2019 and 2020 have not beencompleted.
(m) The audited financial statements of the company for the years ended December 31, 2018 and 2019 were prepared inaccordance with United Kingdom Generally Accepted Accounting Practice (United Kingdom Accounting Standardsand applicable law). As at the date of this report, the audit of the statutory financial statements for the year endedDecember 31, 2020 has not been completed.
(n) No audited financial statements were prepared by this company for the years ended December 31, 2018, 2019 and 2020,since this company was established in 2021.
All companies now comprising the Group have adopted December 31 as their financial year end date.
During the Relevant Periods, the Group’s non-controlling interests are diverse among the
subsidiaries. None of the Group’s subsidiaries has a material non-controlling interest.
APPENDIX I ACCOUNTANTS’ REPORT
– I-65 –

17 Interest in associates
The following list contains the particulars of the Group’s associates, except Nanjing Chervon AutoPrecision Technology Co., Ltd., all of which are unlisted corporate entities whose quoted market price isnot available:
Name of associate
Form ofbusinessstructure
Place ofincorporationand business
Particulars of issuedand paid-up capital
Proportion of ownership interestas at June 30, 2021 Principal activities
Group’seffectiveinterest
Heldby the
CompanyHeld by asubsidiary
Nanjing Chervon Auto PrecisionTechnology Co., Ltd. (南京泉峰汽車精密技術股份有限公司) (“Chervon AutoPrecision Technology”) (Note i)
Incorporated The PRC Renminbi(“RMB”)201,415,700
23.12% – 23.12% Manufacturing,Research anddevelopment and salesof auto parts
Nanjing Jiangning LianshangInvestment Co., Ltd. (南京江寧聯商股權投資有限公司) (Note ii)
Incorporated The PRC RMB120,000,000 – – – Investment
Nanjing Suquan Investment Co., Ltd.(南京蘇泉投資管理有限公司)(Note iii)
Incorporated The PRC RMB58,000,000 – – – Investment
Nanjing Yaoquan InvestmentManagement Co., Ltd.(南京耀泉投資管理有限公司)(Note iii)
Incorporated The PRC RMB10,000,000 – – – Investment
Notes:
(i) Nanjing Chervon Auto Precision Technology Co., Ltd. was established in the PRC with limited liability on March 19,2012 and is principally engaged in the production, sales and research and development of automotive power systemsand relevant components. Its shares are currently listed on the Shanghai Stock Exchange (stock code: 603982.SH). InSeptember 2016, the Group acquired 38.8% of the equity interest in Chervon Auto Precision Technology from NanjingChervon Industry Co., Ltd. of USD19,400,000 (RMB129,776,300 equivalent). In November 2016, Chervon AutoPrecision Technology reduced its registered capital and the Group reduced its investment to RMB46,560,000 on a prorata basis. In March 2017, the proportion of the Group’s interest in Chervon Auto Precision Technology has beendiluted to 31.04% due to the new financing obtained by Chervon Auto Precision Technology and further diluted to23.28% in April 2019 due to the listing of Chervon Auto Precision Technology on Shanghai Stock Exchange. In June2020, the proportion of the Group’s interest in Chervon Auto Precision Technology has been diluted to 23.10% due tothe new issuance of shares and increased to 23.12% due to the repurchase of the shares by Chervon Auto PrecisionTechnology in the first half of 2021.
(ii) Nanjing Jiangning Lianshang Investment Co., Ltd. (南京江寧聯商股權投資有限公司) was established in the PRC withlimited liability on March 31, 2014 with a registered capital of RMB120 million for the purpose of a proposedinvestment project in Nanjing. The Group acquired 31.25% of the equity interest in Nanjing Jiangning LianshangInvestment Co., Ltd. in 2014 through capital injection of RMB50,000,000 and the proportion of the Group’s interestincreased to 41.67% in 2019 due to the withdrawal share capital of a shareholder. On July 13, 2020, the board ofNanjing Jiangning Lianshang Investment Co., Ltd. approved a plan to liquidate of itself. On October 31, 2020, theGroup derecognized the associate after the completion of deregistration.
(iii) Nanjing Suquan Investment Co., Ltd. was established in the PRC with the limited liability on February 5, 2008 witha registered capital of RMB58 million. It is an investment holding company and does not have its own businessoperations. Nanjing Yaoquan Investment Management Co., Ltd. which was a wholly owned subsidiary of NanjingSuquan Investment Co., Ltd., was established in the PRC with limited liability on August 12, 2008 with a registeredcapital of RMB10 million and is engaged in private equity fund management businesses.
Nanjing Suquan Investment Co., Ltd., was the subsidiary of the Company before December 28, 2018. On December28, 2018, the Group entered into an agreement with Mr. Xiao Jun, a minority shareholder of Nanjing SuquanInvestment Co., Ltd. Pursuant to the agreement, the Group agreed to dispose its 61% equity interest in Nanjing SuquanInvestment Co., Ltd. to Mr. Xiao Jun at a cash consideration of RMB10,921,300. Upon the completion of the Group’sdisposal on March 12, 2019, the Group’s interest in Nanjing Suquan Investment Co., Ltd. and Nanjing YaoquanInvestment Management Co., Ltd. has been reduced to 24.88% and the aforementioned entities ceased to besubsidiaries of the Group but became associates of the Group.
APPENDIX I ACCOUNTANTS’ REPORT
– I-66 –
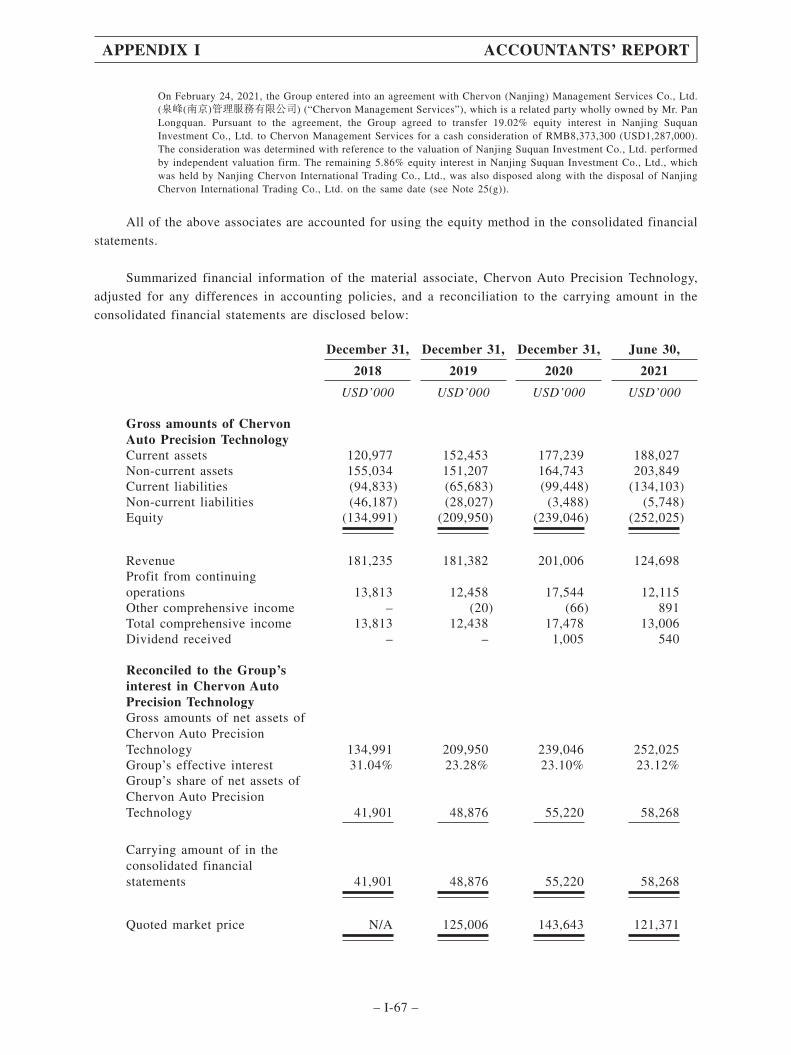
On February 24, 2021, the Group entered into an agreement with Chervon (Nanjing) Management Services Co., Ltd.(泉峰(南京)管理服務有限公司) (“Chervon Management Services”), which is a related party wholly owned by Mr. PanLongquan. Pursuant to the agreement, the Group agreed to transfer 19.02% equity interest in Nanjing SuquanInvestment Co., Ltd. to Chervon Management Services for a cash consideration of RMB8,373,300 (USD1,287,000).The consideration was determined with reference to the valuation of Nanjing Suquan Investment Co., Ltd. performedby independent valuation firm. The remaining 5.86% equity interest in Nanjing Suquan Investment Co., Ltd., whichwas held by Nanjing Chervon International Trading Co., Ltd., was also disposed along with the disposal of NanjingChervon International Trading Co., Ltd. on the same date (see Note 25(g)).
All of the above associates are accounted for using the equity method in the consolidated financial
statements.
Summarized financial information of the material associate, Chervon Auto Precision Technology,
adjusted for any differences in accounting policies, and a reconciliation to the carrying amount in the
consolidated financial statements are disclosed below:
December 31, December 31, December 31, June 30,
2018 2019 2020 2021
USD’000 USD’000 USD’000 USD’000
Gross amounts of ChervonAuto Precision TechnologyCurrent assets 120,977 152,453 177,239 188,027Non-current assets 155,034 151,207 164,743 203,849Current liabilities (94,833) (65,683) (99,448) (134,103)Non-current liabilities (46,187) (28,027) (3,488) (5,748)Equity (134,991) (209,950) (239,046) (252,025)
Revenue 181,235 181,382 201,006 124,698Profit from continuingoperations 13,813 12,458 17,544 12,115Other comprehensive income – (20) (66) 891Total comprehensive income 13,813 12,438 17,478 13,006Dividend received – – 1,005 540
Reconciled to the Group’sinterest in Chervon AutoPrecision TechnologyGross amounts of net assets ofChervon Auto PrecisionTechnology 134,991 209,950 239,046 252,025Group’s effective interest 31.04% 23.28% 23.10% 23.12%Group’s share of net assets ofChervon Auto PrecisionTechnology 41,901 48,876 55,220 58,268
Carrying amount of in theconsolidated financialstatements 41,901 48,876 55,220 58,268
Quoted market price N/A 125,006 143,643 121,371
APPENDIX I ACCOUNTANTS’ REPORT
– I-67 –

December 31, December 31, December 31, June 30,
2018 2019 2020 2021
USD’000 USD’000 USD’000 USD’000
Group’s share of ChervonAuto Precision TechnologyProfit from continuingoperations 4,288 2,900 4,053 2,801Other comprehensive income – (5) (15) 206Total comprehensive income 4,288 2,895 4,038 3,007
The Group assesses whether this is any objective evidence that its interest in the associates are
impaired at the end of each reporting period by considering the associates’ business development process,
any significant financial difficulty, default or bankruptcy encountered by the associates and adverse
change in technological, market, economic or legal environment. Based on the assessment above, the
Group concluded that no impairment indicator was identified at the end of each reporting period and no
impairment loss of interest in associates is considered necessary to be recognized in the consolidated
statements of profit or loss.
Aggregate information of associates that are not individually material:
At December 31,At
June 30,
2018 2019 2020 2021
USD’000 USD’000 USD’000 USD’000
Aggregate carrying amount of
individually immaterial associates in
the consolidated financial statements 7,168 9,135 1,981 –
Year ended December 31,Six months ended
June 30,
2018 2019 2020 2020 2021
USD’000 USD’000 USD’000 USD’000 USD’000(unaudited)
Aggregate amounts of the
Group’s share of those
associates’(Loss)/Profit from continuing
operations (1) 1,461 530 (208) –Other comprehensive income – – – – –Total comprehensive income (1) 1,461 530 (208) –
APPENDIX I ACCOUNTANTS’ REPORT
– I-68 –

18 Interest in a joint venture
Details of the Group’s interest in the joint venture which is accounted for using equity method in the
consolidated financial statements are set out below:
Name of Joint venture
Form ofbusinessstructure
Place ofincorporationand business
Particulars of issuedand paid-in capital Proportion of ownership interest Principal activities
Group’s
effective
interest
Held
by the
Company
Held by a
subsidiary
Nanjing Bovon Power Tools Co., Ltd.
(南京搏峰電動工具有限公司)
Incorporated The PRC USD10,000,000 50% 50% – Manufacturing,
Research and
development and sales
of power tools and
outdoor power
equipment
In January 2007, the Group, Bosch (China) Investment Ltd. and Scintilla A.G. established Nanjing
Bovon Power Tools Co., Ltd. (“Nanjing Bovon”) by capital contribution with the interest of 50%, 40% and
10%, respectively.
In September 2019, the Group signed an agreement to acquire 40% and 10% equity interest in
Nanjing Bovon at consideration of RMB32,000,000 (USD4,642,000 equivalent) and RMB8,000,000
(USD1,160,000 equivalent) from Bosch (China) Investment Ltd. and Scintilla A.G., respectively. Upon the
completion of share transfer on December 6, 2019, Nanjing Bovon became a subsidiary of the Group.
Nanjing Bovon is an unlisted corporate entity whose quoted market price is not available.
Summarised financial information of Nanjing Bovon, adjusted for any differences in accounting
policies, and a reconciliation to the carrying amount in the consolidated financial statements, are disclosed
below.
December 31,
2018
USD’000
Gross amounts of Nanjing Bovon’sCurrent assets 20,767Non-current assets 1,467Current liabilities (8,505)Equity (13,729)Included in the above assets and liabilitiesCash 9,247Revenue 49,227
APPENDIX I ACCOUNTANTS’ REPORT
– I-69 –

December 31,
2018
USD’000
Profit from continuing operations 2,352Other comprehensive income –Total comprehensive income 2,352Dividend received 1,018Included in the above profit:Depreciation and amortisation 290Interest income 60Interest expense –Income tax expense 32
Reconciled to the Group’s interest in Nanjing BovonGross amounts of net assets of Nanjing Bovon 13,729Group’s effective interest 50%
Group’s share of net assets of Nanjing Bovon 6,865Carrying amount of in the consolidated financial statements 6,865
19 Loans to a subsidiary
At December 31,At
June 30,
2018 2019 2020 2021
USD’000 USD’000 USD’000 USD’000
Flex Verwaltungs GmbH & Co., KG 2,296 – – –
As at December 31, 2018, the Company’s unsecured loan to Flex Verwaltungs GmbH & Co., KG wassubject to interest rates at 2.5% per annum.
20 Financial assets at fair value through profit or loss
At December 31,At
June 30,
2018 2019 2020 2021
USD’000 USD’000 USD’000 USD’000
Financial assets at FVPL –non-current– Insurance product 5,482 5,663 5,844 5,938– Unlisted units in investment funds 15,236 11,604 5 –
20,718 17,267 5,849 5,938
APPENDIX I ACCOUNTANTS’ REPORT
– I-70 –
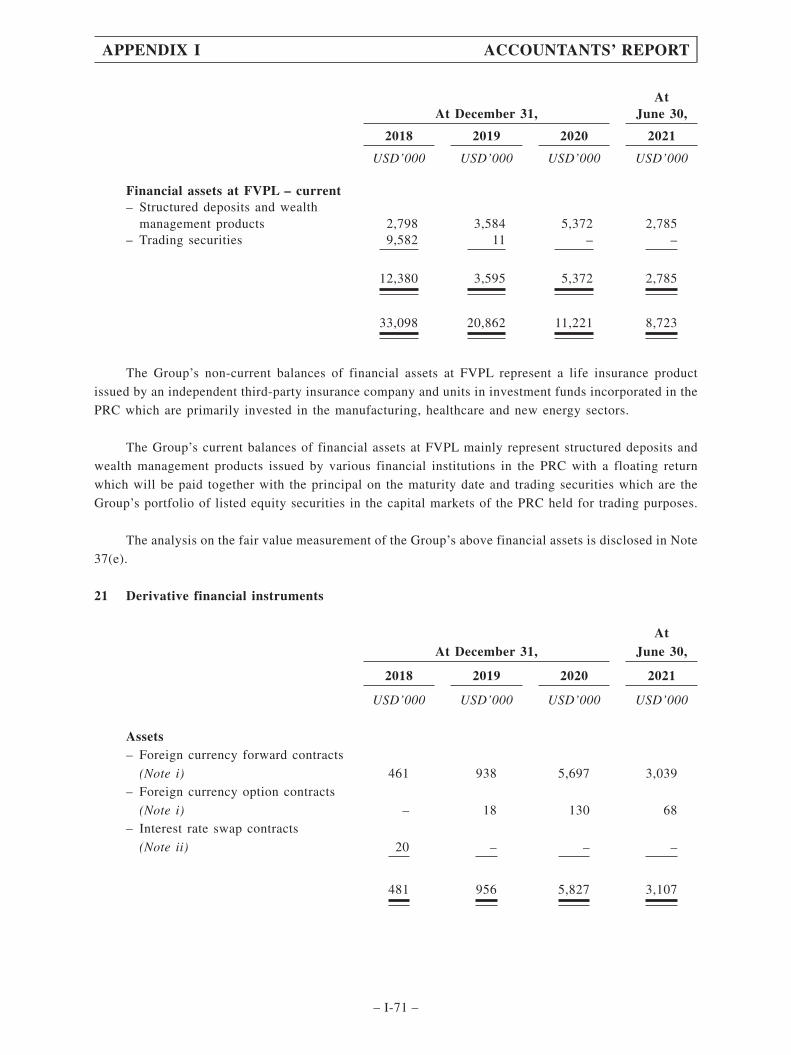
At December 31,At
June 30,
2018 2019 2020 2021
USD’000 USD’000 USD’000 USD’000
Financial assets at FVPL – current– Structured deposits and wealth
management products 2,798 3,584 5,372 2,785– Trading securities 9,582 11 – –
12,380 3,595 5,372 2,785
33,098 20,862 11,221 8,723
The Group’s non-current balances of financial assets at FVPL represent a life insurance product
issued by an independent third-party insurance company and units in investment funds incorporated in the
PRC which are primarily invested in the manufacturing, healthcare and new energy sectors.
The Group’s current balances of financial assets at FVPL mainly represent structured deposits and
wealth management products issued by various financial institutions in the PRC with a floating return
which will be paid together with the principal on the maturity date and trading securities which are the
Group’s portfolio of listed equity securities in the capital markets of the PRC held for trading purposes.
The analysis on the fair value measurement of the Group’s above financial assets is disclosed in Note
37(e).
21 Derivative financial instruments
At December 31,At
June 30,
2018 2019 2020 2021
USD’000 USD’000 USD’000 USD’000
Assets– Foreign currency forward contracts
(Note i) 461 938 5,697 3,039– Foreign currency option contracts
(Note i) – 18 130 68– Interest rate swap contracts
(Note ii) 20 – – –
481 956 5,827 3,107
APPENDIX I ACCOUNTANTS’ REPORT
– I-71 –
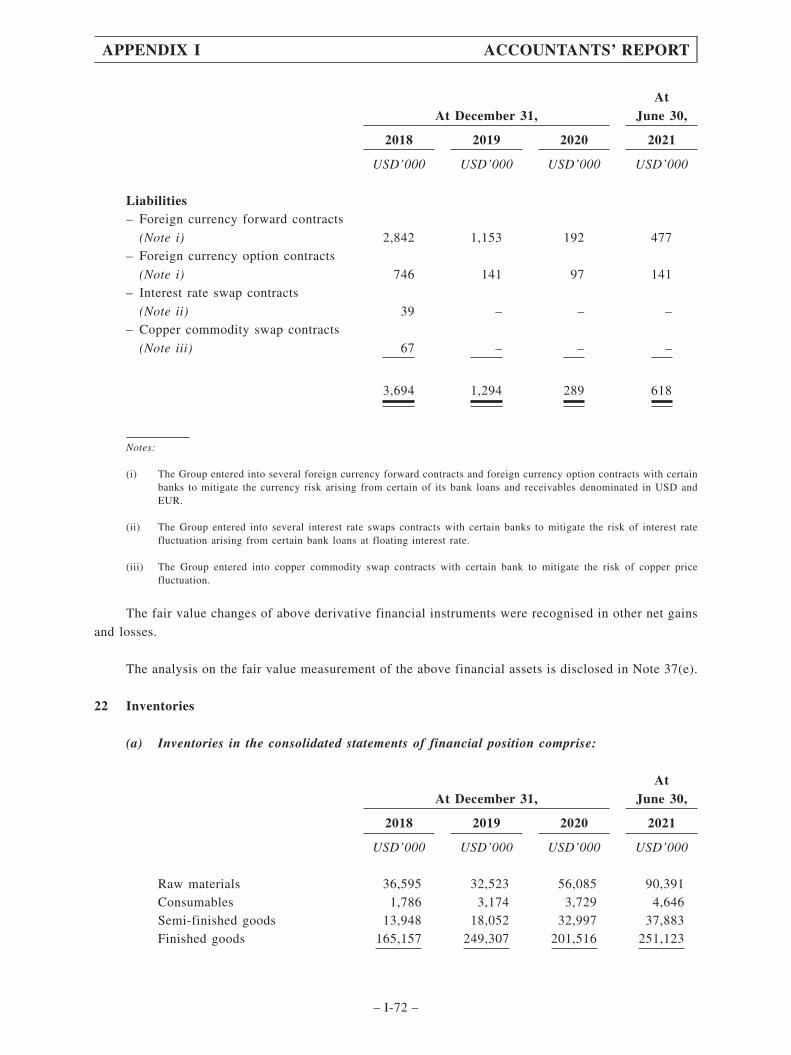
At December 31,At
June 30,
2018 2019 2020 2021
USD’000 USD’000 USD’000 USD’000
Liabilities– Foreign currency forward contracts
(Note i) 2,842 1,153 192 477– Foreign currency option contracts
(Note i) 746 141 97 141– Interest rate swap contracts
(Note ii) 39 – – –– Copper commodity swap contracts
(Note iii) 67 – – –
3,694 1,294 289 618
Notes:
(i) The Group entered into several foreign currency forward contracts and foreign currency option contracts with certainbanks to mitigate the currency risk arising from certain of its bank loans and receivables denominated in USD andEUR.
(ii) The Group entered into several interest rate swaps contracts with certain banks to mitigate the risk of interest ratefluctuation arising from certain bank loans at floating interest rate.
(iii) The Group entered into copper commodity swap contracts with certain bank to mitigate the risk of copper pricefluctuation.
The fair value changes of above derivative financial instruments were recognised in other net gains
and losses.
The analysis on the fair value measurement of the above financial assets is disclosed in Note 37(e).
22 Inventories
(a) Inventories in the consolidated statements of financial position comprise:
At December 31,At
June 30,
2018 2019 2020 2021
USD’000 USD’000 USD’000 USD’000
Raw materials 36,595 32,523 56,085 90,391Consumables 1,786 3,174 3,729 4,646Semi-finished goods 13,948 18,052 32,997 37,883Finished goods 165,157 249,307 201,516 251,123
APPENDIX I ACCOUNTANTS’ REPORT
– I-72 –

At December 31,At
June 30,
2018 2019 2020 2021
USD’000 USD’000 USD’000 USD’000
217,486 303,056 294,327 384,043Write down of inventories (2,567) (5,411) (5,647) (5,131)
214,919 297,645 288,680 378,912
(b) The analysis of the amount of inventories recognized as an expense and included in profitor loss is as follows:
Year ended December 31,Six months ended
June 30,
2018 2019 2020 2020 2021
USD’000 USD’000 USD’000 USD’000 USD’000(unaudited)
Carrying amount of
inventories sold 515,173 588,325 832,190 366,736 617,364Written-off of inventories (1,014) (54) (656) (106) (2,490)Provision for write-down of
inventories 1,369 2,930 696 2,486 2,996
515,528 591,201 832,230 369,116 617,870
All inventories are expected to be recovered within one year.
(c) Certain inventories assets of the Group were pledged as security for bank loans (see Note 26).Details are set out as follows:
At December 31,At
June 30,
2018 2019 2020 2021
USD’000 USD’000 USD’000 USD’000
Inventories 107,196 161,152 98,519 97,755
APPENDIX I ACCOUNTANTS’ REPORT
– I-73 –

23 Trade and bills receivables
At December 31,At
June 30,
2018 2019 2020 2021
USD’000 USD’000 USD’000 USD’000
Trade debtors and bills receivable,net of loss allowance– measured at amortised cost (i)
Trade receivables 116,410 116,126 164,475 183,113Bills receivables 7,926 4,307 4,746 8,702
– measured at FVOCI (ii)Trade receivables 3,011 14,800 85,147 127,274
127,347 135,233 254,368 319,089
All of the trade and bills receivables are expected to be recovered within one year.
Bills receivable primarily represent short-term bank acceptance notes receivable that entitle theGroup to receive the full face amount from the banks at maturity, which generally ranges from 3 to12 months from the date of issuance. Historically, the Group had experienced no credit losses on billsreceivable.
(i) As at December 31, 2018, 2019 and 2020 and June 30, 2021, certain trade debtors ofUSD42,579,000, USD49,936,000, USD92,175,000, and USD101,314,000 were pledged assecurities for bank loans of the Group, respectively (see Note 26).
(ii) Certain amounts of the Group’s trade debtors and bill receivables measured at FVOCI are tradedebtors factored to banks in accordance with receivables purchase agreements. These factoredtrade debtors were held for both collection of contractual cash flows and sales. The contractualcash flows of the trade debtors comprised solely payments of principal and interest. Changesin fair value are recognised in other comprehensive income, except for the recognition in profitor loss of ECLs.
Aging analysis
As of the end of the reporting period, the aging analysis of trade and bills receivables, basedon the invoice date and net of loss allowance, is as follows:
At December 31,At
June 30,
2018 2019 2020 2021
USD’000 USD’000 USD’000 USD’000
Within 6 months 115,677 113,751 165,140 189,088Over 6 months but within 12 months 4,761 4,068 3,153 1,847Over 12 months 3,898 2,614 928 880
124,336 120,433 169,221 191,815
APPENDIX I ACCOUNTANTS’ REPORT
– I-74 –
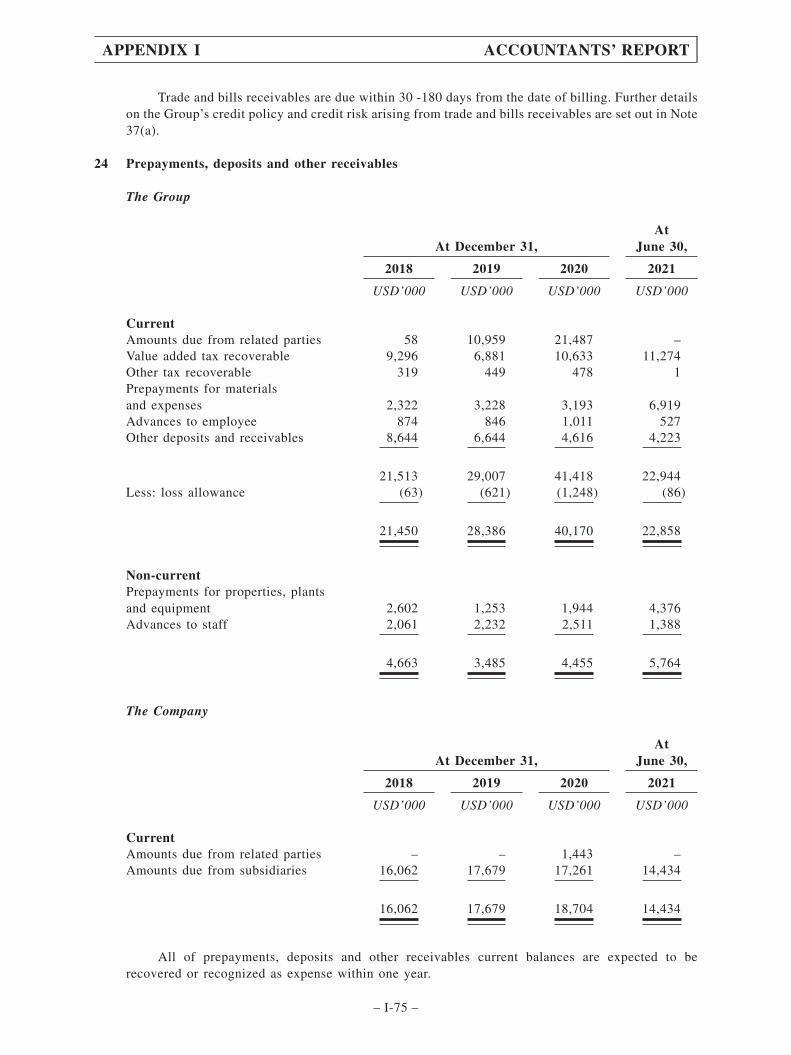
Trade and bills receivables are due within 30 -180 days from the date of billing. Further detailson the Group’s credit policy and credit risk arising from trade and bills receivables are set out in Note37(a).
24 Prepayments, deposits and other receivables
The Group
At December 31,At
June 30,
2018 2019 2020 2021
USD’000 USD’000 USD’000 USD’000
CurrentAmounts due from related parties 58 10,959 21,487 –Value added tax recoverable 9,296 6,881 10,633 11,274Other tax recoverable 319 449 478 1Prepayments for materialsand expenses 2,322 3,228 3,193 6,919Advances to employee 874 846 1,011 527Other deposits and receivables 8,644 6,644 4,616 4,223
21,513 29,007 41,418 22,944Less: loss allowance (63) (621) (1,248) (86)
21,450 28,386 40,170 22,858
Non-currentPrepayments for properties, plantsand equipment 2,602 1,253 1,944 4,376Advances to staff 2,061 2,232 2,511 1,388
4,663 3,485 4,455 5,764
The Company
At December 31,At
June 30,
2018 2019 2020 2021
USD’000 USD’000 USD’000 USD’000
CurrentAmounts due from related parties – – 1,443 –Amounts due from subsidiaries 16,062 17,679 17,261 14,434
16,062 17,679 18,704 14,434
All of prepayments, deposits and other receivables current balances are expected to berecovered or recognized as expense within one year.
APPENDIX I ACCOUNTANTS’ REPORT
– I-75 –

25 Cash and cash equivalents and pledged deposits
(a) Cash and cash equivalents comprise:
The Group
At December 31,At
June 30,
2018 2019 2020 2021
USD’000 USD’000 USD’000 USD’000
Cash at bank 73,206 94,014 166,862 238,510Cash in hand 60 50 75 72
73,266 94,064 166,937 238,582
The Company
At December 31,At
June 30,
2018 2019 2020 2021
USD’000 USD’000 USD’000 USD’000
Cash at bank 3 4 4 302
(b) Pledged deposits comprise:
The Group
At December 31,At
June 30,
2018 2019 2020 2021
USD’000 USD’000 USD’000 USD’000Pledged deposits for– issuance of bills payable 11,517 10,502 11,759 17,204– issuance of banking facilities 13,196 12,691 10,413 46,287
24,713 23,193 22,172 63,491
The Company
At December 31,At
June 30,
2018 2019 2020 2021
USD’000 USD’000 USD’000 USD’000
Pledged deposits for– issuance of banking facilities 402 402 403 401
The pledged deposits will be released upon the settlement of letters of credit and billspayable and by the Group or the expiry of relevant banking facilities.
APPENDIX I ACCOUNTANTS’ REPORT
– I-76 –

(c) Reconciliation of (loss)/profits before taxation to cash generated from operations
Year ended December 31,Six months ended
June 30,
Note 2018 2019 2020 2020 2021
USD’000 USD’000 USD’000 USD’000 USD’000(unaudited)
(Loss)/Profit before taxation (14,414) 42,348 59,511 25,212 110,851Adjustments for:Depreciation of properties, plantsand equipment 6(c) 19,279 17,416 17,858 8,799 10,467Depreciation of right-of-use assets 6(c) 2,582 3,091 3,302 1,520 2,230Depreciation of investment property 6(c) 214 206 206 100 37Amortization of intangible assets 6(c) 312 296 296 148 149Net finance costs 6(a) 17,164 19,754 17,357 8,070 7,895Share of profits of associates 17 (4,287) (9,206) (6,724) (155) (2,801)Share of profits of a joint venture 18 (1,176) (1,233) – – –Net losses/(gains) on disposal ofproperties, plants and equipment 5(b) 320 74 43 4 196Net realised and unrealisedlosses/(gains) on FVPL 5(b) 83 41 (165) (430) (454)Net realized and unrealizedlosses/(gains) on derivativefinancial instruments 5(b) 10,419 810 (8,209) 1,501 (3,686)Loss on disposal of an associate 5(b) – – 131 – 677Loss/(gain) on disposal of a subsidiary 5(b) – 4 – – (21,969)Gain on business combination 25(f) – (1,326) – – –Equity settled share-basedpayment expenses 35 – – 21,077 – –(Reversal)/provision for impairmentloss on trade and other receivables 6(c) (2,688) 1,825 450 607 (853)Provision for write-downof inventories 6(c) 1,369 2,930 696 2,486 2,996Amortization of deferred income 94 91 91 46 49Foreign exchange (gain)/loss (2,617) (466) 11,497 584 5,168
Operating profit before changes inworking capital 26,654 76,655 117,417 48,492 110,952(Increase)/decrease in pledged deposits (1,208) 1,019 (1,263) 6,015 (5,445)(Increase)/decrease in inventories (25,439) (84,872) 8,318 78,078 (89,716)Decrease/(increase) in trade andbills receivables 11,020 (9,165) (118,954) (98,334) (65,031)(Increase)/decrease in prepayments,deposits and other receivables (14,256) 4,510 (8,616) (2,615) 18,443Decrease/(increase) in right to returnedgoods asset 1,174 (157) (3,541) (2,509) 1,420Increase/(decrease) in trade payables 8,572 24,925 83,720 23,175 99,943Increase/(decrease) in other payablesand accruals 8,679 33,071 40,456 (468) 23,155(Decrease)/increase in warrantyprovision (1,305) 3,265 22,244 19,312 5,085Increase/(decrease) in refund liabilitiesfrom right of return 1,934 455 5,141 3,380 (2,304)(Decrease)/increase in defined benefitretirement plans obligation (76) (68) (76) (38) 7
Cash generated from operations 15,749 49,638 144,846 74,488 96,509
APPENDIX I ACCOUNTANTS’ REPORT
– I-77 –

(d) Reconciliation of liabilities arising from financing activities
The table below details changes in the Group’s liabilities from financing activities, includingboth cash and non-cash changes. Liabilities arising from financing activities are liabilities for whichcash flows were, or future cash flows will be, classified in the Group’s consolidated cash flowstatements as cash flows from financing activities.
Bank loansInterestpayable
Leaseliabilities Total
USD’000 USD’000 USD’000 USD’000(Note 26) (Note 29) (Note 27)
At January 1, 2018 266,832 5,766 15,597 288,195
Changes from financing cash flows:Proceeds from bank loans 618,788 – – 618,788Repayment of bank loans (549,087) – – (549,087)Capital element of lease rentals paid – – (1,654) (1,654)Interest element of lease rentals paid – – (622) (622)Interest paid – (21,103) – (21,103)
Total changes from financing cash flows 69,701 (21,103) (2,276) 46,322
Exchange adjustments (7,015) (84) (116) (7,215)
Other changes:Increase in lease liabilities from enteringinto new leases during the year – – 1,638 1,638Interest expenses (Note 6(a)) – 16,789 622 17,411
Total other changes – 16,789 2,260 19,049
At December 31, 2018 andJanuary 1, 2019 329,518 1,368 15,465 346,351
Changes from financing cash flows:Proceeds from bank loans 587,314 – – 587,314Repayment of bank loans (557,388) – – (557,388)Capital element of lease rentals paid – – (2,272) (2,272)Interest element of lease rentals paid – – (611) (611)Interest paid – (19,976) – (19,976)
Total changes from financing cash flows 29,926 (19,976) (2,883) 7,067
Exchange adjustments (2,719) (10) (64) (2,793)
Other changes:Increase in lease liabilities from enteringinto new leases during the year – – 2,686 2,686Interest expenses (Note 6(a)) – 19,748 611 20,359
Total other changes – 19,748 3,297 23,045
At December 31, 2019 andJanuary 1, 2020 356,725 1,130 15,815 373,670
APPENDIX I ACCOUNTANTS’ REPORT
– I-78 –
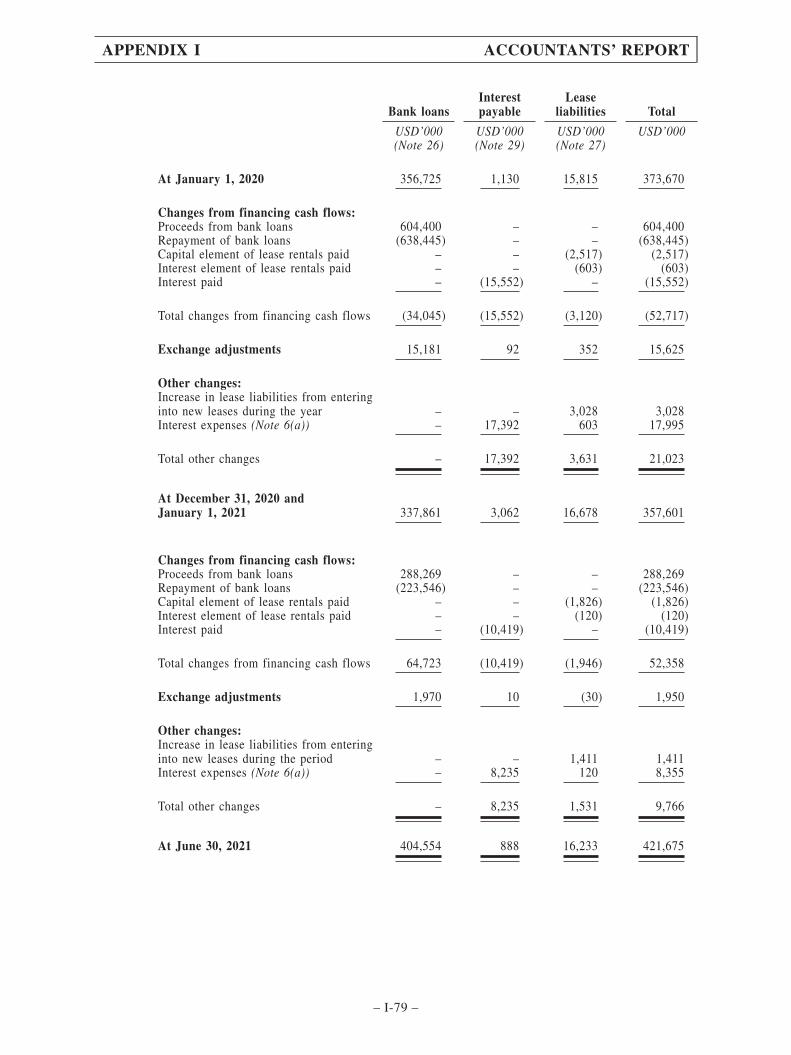
Bank loansInterestpayable
Leaseliabilities Total
USD’000 USD’000 USD’000 USD’000(Note 26) (Note 29) (Note 27)
At January 1, 2020 356,725 1,130 15,815 373,670
Changes from financing cash flows:Proceeds from bank loans 604,400 – – 604,400Repayment of bank loans (638,445) – – (638,445)Capital element of lease rentals paid – – (2,517) (2,517)Interest element of lease rentals paid – – (603) (603)Interest paid – (15,552) – (15,552)
Total changes from financing cash flows (34,045) (15,552) (3,120) (52,717)
Exchange adjustments 15,181 92 352 15,625
Other changes:Increase in lease liabilities from enteringinto new leases during the year – – 3,028 3,028Interest expenses (Note 6(a)) – 17,392 603 17,995
Total other changes – 17,392 3,631 21,023
At December 31, 2020 andJanuary 1, 2021 337,861 3,062 16,678 357,601
Changes from financing cash flows:Proceeds from bank loans 288,269 – – 288,269Repayment of bank loans (223,546) – – (223,546)Capital element of lease rentals paid – – (1,826) (1,826)Interest element of lease rentals paid – – (120) (120)Interest paid – (10,419) – (10,419)
Total changes from financing cash flows 64,723 (10,419) (1,946) 52,358
Exchange adjustments 1,970 10 (30) 1,950
Other changes:Increase in lease liabilities from enteringinto new leases during the period – – 1,411 1,411Interest expenses (Note 6(a)) – 8,235 120 8,355
Total other changes – 8,235 1,531 9,766
At June 30, 2021 404,554 888 16,233 421,675
APPENDIX I ACCOUNTANTS’ REPORT
– I-79 –

Bank loansInterestpayable
Leaseliabilities Total
USD’000 USD’000 USD’000 USD’000(Note 26) (Note 29) (Note 27)
(Unaudited)At January 1, 2020 356,725 1,130 15,815 373,670
Changes from financing cash flows:Proceeds from bank loans 310,943 – – 310,943Repayment of bank loans (318,695) – – (318,695)Capital element of lease rentals paid – – (1,076) (1,076)Interest element of lease rentals paid – – (301) (301)Interest paid – (5,738) – (5,738)
Total changes from financing cash flows (7,752) (5,738) (1,377) (14,867)
Exchange adjustments (2,542) (17) (7) (2,566)
Other changes:Increase in lease liabilities from enteringinto new leases during the period – – 1,514 1,514Interest expenses (Note 6(a)) – 8,008 301 8,309
Total other changes – 8,008 1,815 9,823
At June 30, 2020 346,431 3,383 16,246 366,060
(e) Total cash flow for leases
Amounts included in the cash flow statement for leases comprise the following:
Year ended December 31,Six months ended
June 30,
2018 2019 2020 2020 2021
USD’000 USD’000 USD’000 USD’000 USD’000(unaudited)
Within operating cash flows 846 922 1,022 458 928Within financing cash flows 2,276 2,883 3,120 1,377 1,946
3,122 3,805 4,142 1,835 2,874
These amounts relate to the following:
Year ended December 31,Six months ended
June 30,
2018 2019 2020 2020 2021
USD’000 USD’000 USD’000 USD’000 USD’000(unaudited)
Lease rentals paid 3,122 3,805 4,142 1,835 2,874
APPENDIX I ACCOUNTANTS’ REPORT
– I-80 –

(f) Net cash outflow arising from the acquisition of a subsidiary
On December 31, 2019, the Group acquired its interests in Nanjing Bovon (see Note 18). The
recognised amounts of assets acquired and liabilities at the date of acquisition of the subsidiary
comprise the following:
Fair value ondate of
acquisition
USD’000
Cash 2,454Financial assets at FVPL 1,886Trade and bills receivables 15,447Inventories 2,246Properties, plants and equipment (Note 12) 1,274Prepayments, deposits and other receivables 976Other payables and accruals (10,026)
Identified net assets 14,257
Loss arising from remeasurement of the pre-existing 50% of equity interest of Nanjing Bovon
is as below:
USD’000
Fair value of pre-existing 50% of equity interest of Nanjing Bovon 5,802Carrying amount of pre-existing 50% of equity interest of Nanjing
Bovon (7,129)
Loss arising from remeasurement of the pre-existing 50% of equity
interest of Nanjing Bovon (1,327)
Gains on business combination arising from the acquisition has been recognized as below:
USD’000
Consideration paid 5,802Fair value of pre-existing 50% of equity interest of Nanjing Bovon 5,802Loss arising from remeasurement of the pre-existing 50% of equity
interest of Nanjing Bovon 1,327Less: fair value of identifiable net assets (14,257)
Gains on business combination 1,326
APPENDIX I ACCOUNTANTS’ REPORT
– I-81 –
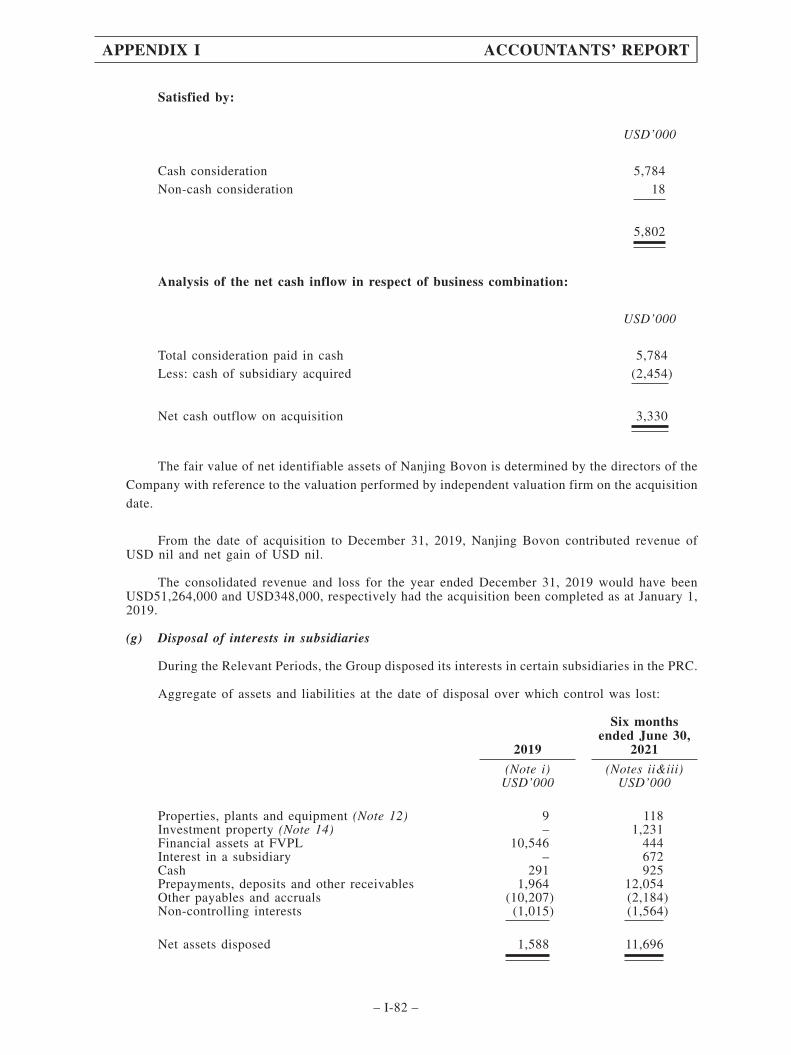
Satisfied by:
USD’000
Cash consideration 5,784Non-cash consideration 18
5,802
Analysis of the net cash inflow in respect of business combination:
USD’000
Total consideration paid in cash 5,784Less: cash of subsidiary acquired (2,454)
Net cash outflow on acquisition 3,330
The fair value of net identifiable assets of Nanjing Bovon is determined by the directors of the
Company with reference to the valuation performed by independent valuation firm on the acquisition
date.
From the date of acquisition to December 31, 2019, Nanjing Bovon contributed revenue ofUSD nil and net gain of USD nil.
The consolidated revenue and loss for the year ended December 31, 2019 would have beenUSD51,264,000 and USD348,000, respectively had the acquisition been completed as at January 1,2019.
(g) Disposal of interests in subsidiaries
During the Relevant Periods, the Group disposed its interests in certain subsidiaries in the PRC.
Aggregate of assets and liabilities at the date of disposal over which control was lost:
2019
Six monthsended June 30,
2021
(Note i) (Notes ii&iii)USD’000 USD’000
Properties, plants and equipment (Note 12) 9 118Investment property (Note 14) – 1,231Financial assets at FVPL 10,546 444Interest in a subsidiary – 672Cash 291 925Prepayments, deposits and other receivables 1,964 12,054Other payables and accruals (10,207) (2,184)Non-controlling interests (1,015) (1,564)
Net assets disposed 1,588 11,696
APPENDIX I ACCOUNTANTS’ REPORT
– I-82 –

(Loss)/gains on disposal of interests in subsidiaries:
2019
Six monthsended June 30,
2021
USD’000 USD’000
Consideration 1,584 33,665Net assets disposed of (1,588) (11,696)
(Loss)/gains on disposal of interests in
subsidiaries (Note 5(b)) (4) 21,969
Analysis of net cash in respect of the disposal of interests in subsidiaries is as follows:
2019
Six monthsended June 30,
2021
USD’000 USD’000
Consideration 1,584 33,665Less: cash disposed of (291) (925)Less: consideration not received (1,584) –
(Payment)/Proceeds received for disposal of
interests in subsidiaries (291) 32,740
Notes:
(i) Nanjing Yaoquan Investment Management Co., Ltd. is a wholly-owned subsidiary of Nanjing SuquanInvestment Co., Ltd., which is the subsidiary of the Company before December 28, 2018. On December 28,2018, the Group has entered into an agreement with Mr. Xiao Jun, a minority shareholder of Nanjing SuquanInvestment Co., Ltd. Pursuant to the agreement, the Group agreed to dispose its 61% equity interest in NanjingSuquan Investment Co., Ltd. to Mr. Xiao Jun at a cash consideration of RMB10,921,300 (USD: 1,584,000equivalent). The consideration was determined with reference to the valuation performed by independentvaluation firm.
(ii) On February 24, 2021, the Group has entered into an agreement with Chervon Management Services, which isa related party wholly owned by Mr. Pan Longquan. Pursuant to the agreement, the Group agreed to transfer85% equity interest in Nanjing Chervon International Trading Co., Ltd. to Chervon Management Services fora cash consideration of RMB47,813,800 (USD7,351,000 equivalent). The consideration was determined withreference to the valuation of Nanjing Chervon International Trading Co., Ltd. performed by independentvaluation firm.
(iii) On February 25, 2021, the Group has entered into an agreement with Chervon Management Services, which isa related party wholly owned by Mr. Pan Longquan. Pursuant to the agreement, the Group agreed to transfer100% equity interest in Nanjing Jiuhao Electromechanical Industry Co., Ltd. to Chervon Management Servicesfor a cash consideration of RMB171,160,100 (USD26,314,000 equivalent). The consideration was determinedwith reference to the valuation of Nanjing Jiuhao Electromechanical Industry Co., Ltd. performed byindependent valuation firm. The registration of the transfer was completed on March 8, 2021, upon whichNanjing Jiuhao Electromechanical Industry Co., Ltd. ceased to be the Group’s subsidiary.
APPENDIX I ACCOUNTANTS’ REPORT
– I-83 –
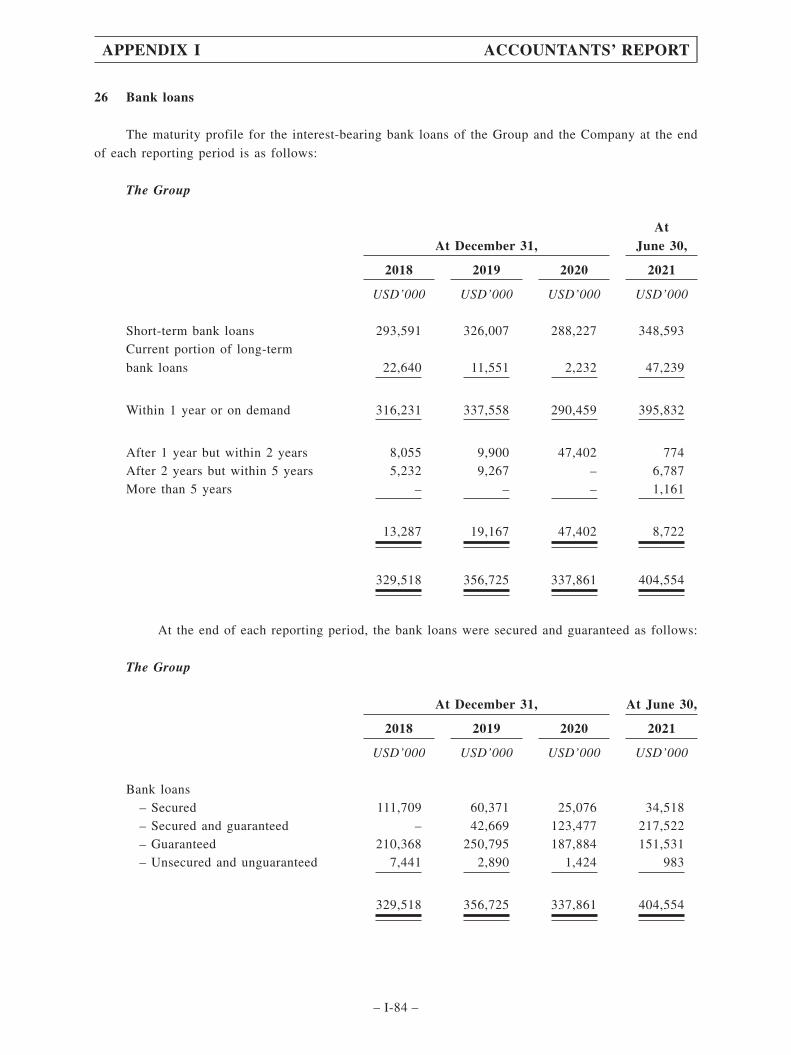
26 Bank loans
The maturity profile for the interest-bearing bank loans of the Group and the Company at the end
of each reporting period is as follows:
The Group
At December 31,At
June 30,
2018 2019 2020 2021
USD’000 USD’000 USD’000 USD’000
Short-term bank loans 293,591 326,007 288,227 348,593Current portion of long-term
bank loans 22,640 11,551 2,232 47,239
Within 1 year or on demand 316,231 337,558 290,459 395,832
After 1 year but within 2 years 8,055 9,900 47,402 774After 2 years but within 5 years 5,232 9,267 – 6,787More than 5 years – – – 1,161
13,287 19,167 47,402 8,722
329,518 356,725 337,861 404,554
At the end of each reporting period, the bank loans were secured and guaranteed as follows:
The Group
At December 31, At June 30,
2018 2019 2020 2021
USD’000 USD’000 USD’000 USD’000
Bank loans– Secured 111,709 60,371 25,076 34,518– Secured and guaranteed – 42,669 123,477 217,522– Guaranteed 210,368 250,795 187,884 151,531– Unsecured and unguaranteed 7,441 2,890 1,424 983
329,518 356,725 337,861 404,554
APPENDIX I ACCOUNTANTS’ REPORT
– I-84 –
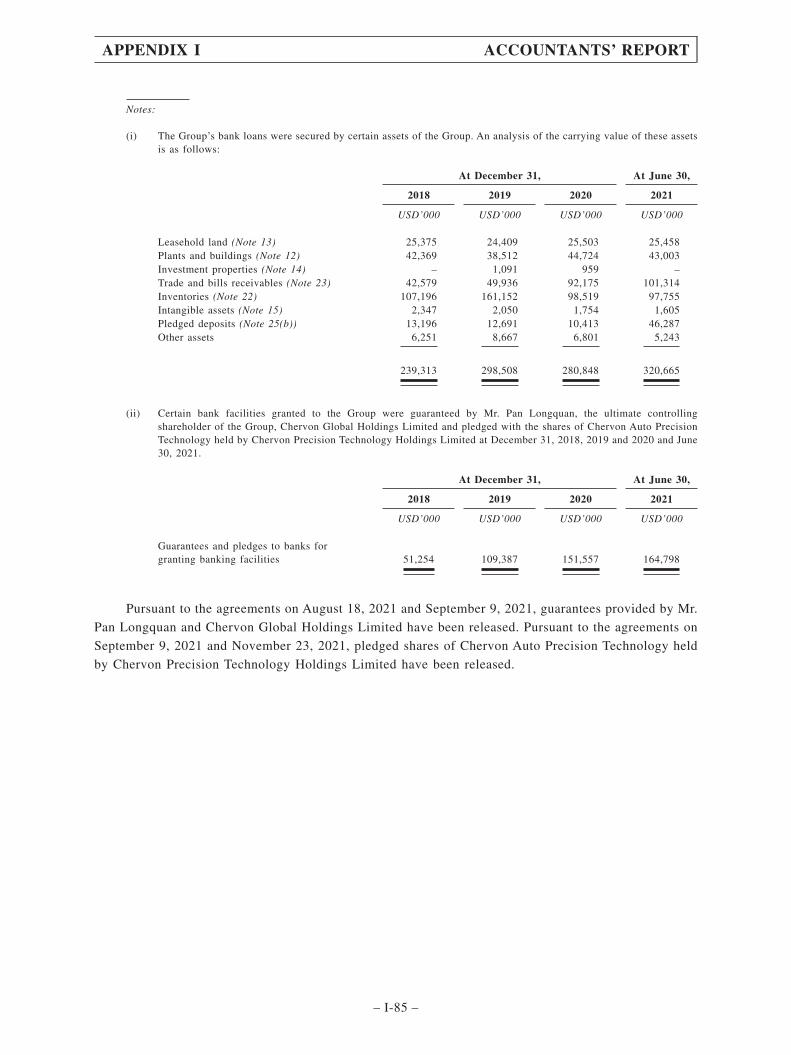
Notes:
(i) The Group’s bank loans were secured by certain assets of the Group. An analysis of the carrying value of these assetsis as follows:
At December 31, At June 30,
2018 2019 2020 2021
USD’000 USD’000 USD’000 USD’000
Leasehold land (Note 13) 25,375 24,409 25,503 25,458Plants and buildings (Note 12) 42,369 38,512 44,724 43,003Investment properties (Note 14) – 1,091 959 –Trade and bills receivables (Note 23) 42,579 49,936 92,175 101,314Inventories (Note 22) 107,196 161,152 98,519 97,755Intangible assets (Note 15) 2,347 2,050 1,754 1,605Pledged deposits (Note 25(b)) 13,196 12,691 10,413 46,287Other assets 6,251 8,667 6,801 5,243
239,313 298,508 280,848 320,665
(ii) Certain bank facilities granted to the Group were guaranteed by Mr. Pan Longquan, the ultimate controllingshareholder of the Group, Chervon Global Holdings Limited and pledged with the shares of Chervon Auto PrecisionTechnology held by Chervon Precision Technology Holdings Limited at December 31, 2018, 2019 and 2020 and June30, 2021.
At December 31, At June 30,
2018 2019 2020 2021
USD’000 USD’000 USD’000 USD’000
Guarantees and pledges to banks forgranting banking facilities 51,254 109,387 151,557 164,798
Pursuant to the agreements on August 18, 2021 and September 9, 2021, guarantees provided by Mr.
Pan Longquan and Chervon Global Holdings Limited have been released. Pursuant to the agreements on
September 9, 2021 and November 23, 2021, pledged shares of Chervon Auto Precision Technology held
by Chervon Precision Technology Holdings Limited have been released.
APPENDIX I ACCOUNTANTS’ REPORT
– I-85 –

27 Lease liabilities
At the end of the reporting periods, the lease liabilities were repayable as follows:
At December 31,At
June 30,
2018 2019 2020 2021
USD’000 USD’000 USD’000 USD’000
Within 1 year 1,653 2,122 3,161 3,361
After 1 year but within 2 years 1,325 2,037 2,642 3,049After 2 years but within 5 years 3,693 4,172 4,704 4,345After 5 years 8,794 7,484 6,171 5,478
13,812 13,693 13,517 12,872
15,465 15,815 16,678 16,233
28 Trade and bills payables
At December 31,At
June 30,
2018 2019 2020 2021
USD’000 USD’000 USD’000 USD’000
Trade payables 128,682 141,480 217,788 307,706Bills payable 10,201 22,328 29,741 42,985
138,883 163,808 247,529 350,691
As of the end of the reporting period, the aging analysis of trade and bills payables, based on theinvoice date, is as follows:
At December 31,At
June 30,
2018 2019 2020 2021
USD’000 USD’000 USD’000 USD’000
Within 3 months 121,256 149,286 216,913 310,9343 to 12 months 17,627 14,522 30,616 39,757
138,883 163,808 247,529 350,691
All of the trade and bills payables are expected to be settled within one year or repayable on demand.
APPENDIX I ACCOUNTANTS’ REPORT
– I-86 –

29 Other payables and accruals
The Group
At December 31,At
June 30,
2018 2019 2020 2021
USD’000 USD’000 USD’000 USD’000
Amounts due to related parties 5,949 15,198 8,251 2,441Other payables and accrued charges 29,761 41,847 78,357 131,932Salaries, wages, bonus and
benefits payable 15,657 18,157 31,726 14,086Payables for purchase of properties,
plants and equipment 878 2,666 2,849 1,828Interest payables 1,368 1,130 3,062 888Other tax payables 2,231 8,052 5,256 5,877Receipt in advance – lease
prepayment 655 841 636 509
56,499 87,891 130,137 157,561
The Company
At December 31,At
June 30,
2018 2019 2020 2021
USD’000 USD’000 USD’000 USD’000
Amounts due to subsidiaries 71 700 529 43,619Other payables and accruals 813 114 355 282
884 814 884 43,901
All of the other payables and accruals are expected to be settled within one year or repayable
on demand.
Note: Other payables and accrued charges primarily comprise accruals for marketing and advertising fee, utility expenses,service fee and other expenses.
APPENDIX I ACCOUNTANTS’ REPORT
– I-87 –

30 Income tax in the consolidated statements of financial position
(a) Current taxation in the consolidated statements of financial position represents:
At December 31,At
June 30,
2018 2019 2020 2021
USD’000 USD’000 USD’000 USD’000
At the beginning of the
year/period 2,575 9,031 13,855 15,347Provision for the year/period:– PRC Corporate Income Tax (256) (787) (1,101) (5,025)– Hong Kong Profits Tax – – (2,916) (7,856)– Income tax for tax
jurisdictions outside PRC
and Hong Kong (598) (4,241) (5,869) (2,387)Effect of withholding tax
on dividends – – (1,275) –Over/(under)-provision in
respect of prior years 29 (2) (152) 56Tax paid:– PRC Corporate Income Tax 4,299 7,604 5,891 7,397– Hong Kong Profits Tax 1,237 26 200 4– Income tax for tax
jurisdictions outside PRC
and Hong Kong 2,070 2,431 3,751 6– Withholding tax – – 1,275 –
Exchange adjustment (325) (207) 1,688 296
At the end of the year/period 9,031 13,855 15,347 7,838
Represented by:Taxation recoverable 11,402 17,764 21,975 22,907Taxation payable (2,371) (3,909) (6,628) (15,069)
9,031 13,855 15,347 7,838
APPENDIX I ACCOUNTANTS’ REPORT
– I-88 –
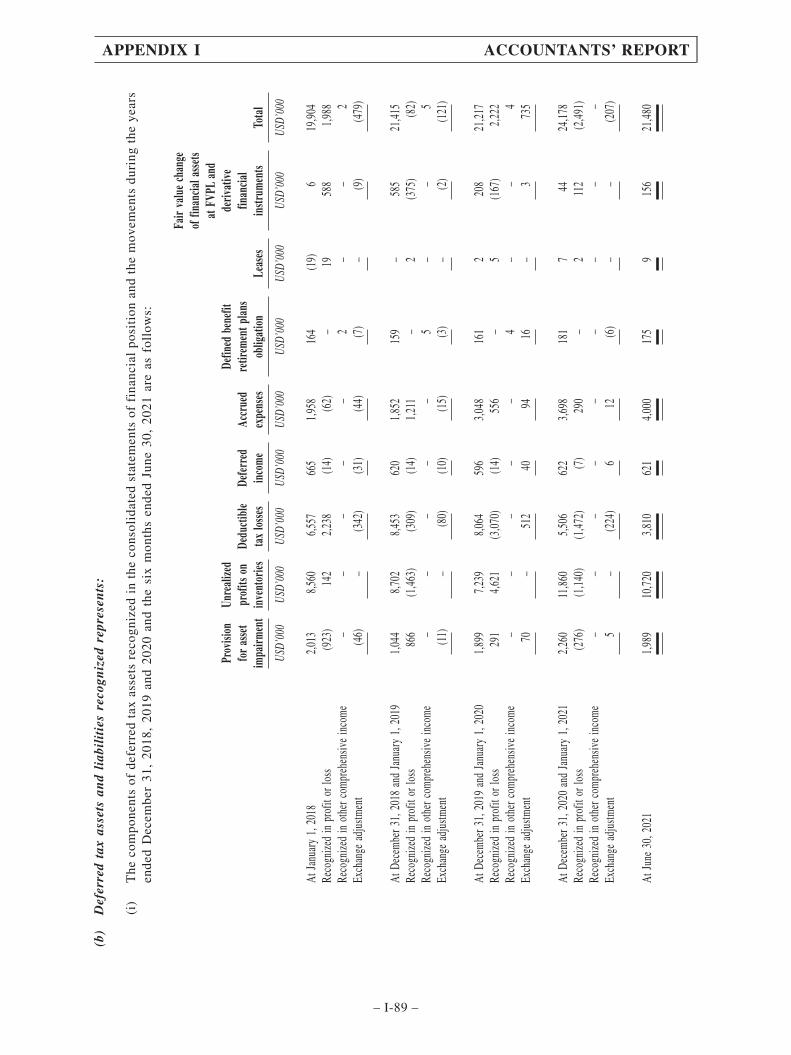
(b)
Def
erre
dta
xas
sets
and
liab
ilit
ies
reco
gniz
edre
pres
ents
:
(i)
The
com
pone
nts
ofde
ferr
edta
xas
sets
reco
gniz
edin
the
cons
olid
ated
stat
emen
tsof
fina
ncia
lpo
siti
onan
dth
em
ovem
ents
duri
ngth
eye
ars
ende
dD
ecem
ber
31,
2018
,20
19an
d20
20an
dth
esi
xm
onth
sen
ded
June
30,
2021
are
asfo
llow
s:
Prov
ision
fora
sset
impa
irmen
t
Unre
alize
dpr
ofits
onin
vent
ories
Dedu
ctib
leta
xlo
sses
Defe
rred
inco
me
Accr
ued
expe
nses
Defin
edbe
nefit
retir
emen
tpla
nsob
ligat
ion
Leas
es
Fair
valu
ech
ange
offin
ancia
lass
ets
atFV
PLan
dde
rivat
ive
finan
cial
instr
umen
tsTo
tal
USD’
000
USD’
000
USD’
000
USD’
000
USD’
000
USD’
000
USD’
000
USD’
000
USD’
000
AtJa
nuar
y1,
2018
2,01
38,
560
6,55
766
51,
958
164
(19)
619
,904
Reco
gnize
din
prof
itor
loss
(923
)14
22,
238
(14)
(62)
–19
588
1,98
8Re
cogn
ized
inot
herc
ompr
ehen
sive
inco
me
––
––
–2
––
2Ex
chan
gead
justm
ent
(46)
–(3
42)
(31)
(44)
(7)
–(9
)(4
79)
AtDe
cem
ber3
1,20
18an
dJa
nuar
y1,
2019
1,04
48,
702
8,45
362
01,
852
159
–58
521
,415
Reco
gnize
din
prof
itor
loss
866
(1,4
63)
(309
)(1
4)1,
211
–2
(375
)(8
2)Re
cogn
ized
inot
herc
ompr
ehen
sive
inco
me
––
––
–5
––
5Ex
chan
gead
justm
ent
(11)
–(8
0)(1
0)(1
5)(3
)–
(2)
(121
)
AtDe
cem
ber3
1,20
19an
dJa
nuar
y1,
2020
1,89
97,
239
8,06
459
63,
048
161
220
821
,217
Reco
gnize
din
prof
itor
loss
291
4,62
1(3
,070
)(1
4)55
6–
5(1
67)
2,22
2Re
cogn
ized
inot
herc
ompr
ehen
sive
inco
me
––
––
–4
––
4Ex
chan
gead
justm
ent
70–
512
4094
16–
373
5
AtDe
cem
ber3
1,20
20an
dJa
nuar
y1,
2021
2,26
011
,860
5,50
662
23,
698
181
744
24,1
78Re
cogn
ized
inpr
ofit
orlo
ss(2
76)
(1,1
40)
(1,4
72)
(7)
290
–2
112
(2,4
91)
Reco
gnize
din
othe
rcom
preh
ensiv
ein
com
e–
––
––
––
––
Exch
ange
adju
stmen
t5
–(2
24)
612
(6)
––
(207
)
AtJu
ne30
,202
11,
989
10,7
203,
810
621
4,00
017
59
156
21,4
80
APPENDIX I ACCOUNTANTS’ REPORT
– I-89 –

(ii) The components of deferred tax liabilities recognized in the consolidated statements of
financial position and the movements during the years ended December 31, 2018, 2019
and 2020 and the six months ended June 30, 2021 are as follows:
Depreciationof properties,
plants, andequipment Properties
Fair value changeof financial assets
at FVPL andderivativefinancial
instrumentsUndistributed
profits Total
USD’000 USD’000 USD’000 USD’000 USD’000
At January 1, 2018 – (442) (2,202) (1,505) (4,149)Recognized in profit or loss (472) 145 465 – 138Effect of withholding tax on dividends – – – (344) (344)Exchange adjustment 16 16 43 84 159
At December 31, 2018 and
January 1, 2019 (456) (281) (1,694) (1,765) (4,196)
Recognized in profit or loss (819) 140 386 – (293)Effect of withholding tax on dividends – – – (861) (861)Exchange adjustment 17 3 6 39 65
At December 31, 2019 and
January 1, 2020 (1,258) (138) (1,302) (2,587) (5,285)
Recognized in profit or loss (580) 140 (1,364) – (1,804)Effect of withholding tax on dividends – – – (1,503) (1,503)Exchange adjustment (120) (2) (52) (263) (437)
At December 31, 2020 and
January 1, 2021 (1,958) – (2,718) (4,353) (9,029)
Recognized in profit or loss (94) – 424 – 330Effect of withholding tax on dividends – – – (2,239) (2,239)Exchange adjustment (20) – (9) (45) (74)
At June 30, 2021 (2,072) – (2,303) (6,637) (11,012)
APPENDIX I ACCOUNTANTS’ REPORT
– I-90 –
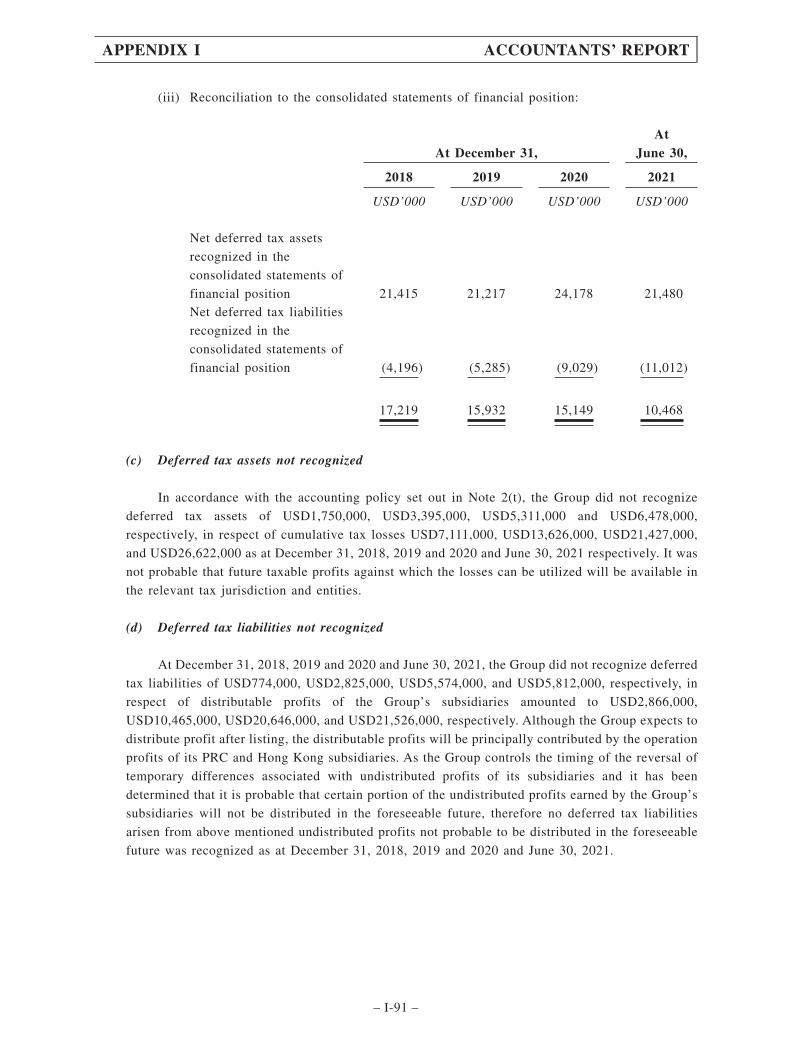
(iii) Reconciliation to the consolidated statements of financial position:
At December 31,At
June 30,
2018 2019 2020 2021
USD’000 USD’000 USD’000 USD’000
Net deferred tax assets
recognized in the
consolidated statements of
financial position 21,415 21,217 24,178 21,480Net deferred tax liabilities
recognized in the
consolidated statements of
financial position (4,196) (5,285) (9,029) (11,012)
17,219 15,932 15,149 10,468
(c) Deferred tax assets not recognized
In accordance with the accounting policy set out in Note 2(t), the Group did not recognize
deferred tax assets of USD1,750,000, USD3,395,000, USD5,311,000 and USD6,478,000,
respectively, in respect of cumulative tax losses USD7,111,000, USD13,626,000, USD21,427,000,
and USD26,622,000 as at December 31, 2018, 2019 and 2020 and June 30, 2021 respectively. It was
not probable that future taxable profits against which the losses can be utilized will be available in
the relevant tax jurisdiction and entities.
(d) Deferred tax liabilities not recognized
At December 31, 2018, 2019 and 2020 and June 30, 2021, the Group did not recognize deferred
tax liabilities of USD774,000, USD2,825,000, USD5,574,000, and USD5,812,000, respectively, in
respect of distributable profits of the Group’s subsidiaries amounted to USD2,866,000,
USD10,465,000, USD20,646,000, and USD21,526,000, respectively. Although the Group expects to
distribute profit after listing, the distributable profits will be principally contributed by the operation
profits of its PRC and Hong Kong subsidiaries. As the Group controls the timing of the reversal of
temporary differences associated with undistributed profits of its subsidiaries and it has been
determined that it is probable that certain portion of the undistributed profits earned by the Group’s
subsidiaries will not be distributed in the foreseeable future, therefore no deferred tax liabilities
arisen from above mentioned undistributed profits not probable to be distributed in the foreseeable
future was recognized as at December 31, 2018, 2019 and 2020 and June 30, 2021.
APPENDIX I ACCOUNTANTS’ REPORT
– I-91 –

31 Warranty provision
Total
USD’000
At January 1, 2018 21,704Provision in the year 9,900Utilization of provision (11,205)Exchange adjustment (5)
At December 31, 2018 and January 1, 2019 20,394Provision in the year 22,056Utilization of provision (18,791)Exchange adjustment (19)
At December 31, 2019 and January 1, 2020 23,640Provision in the year 38,624Utilization of provision (16,380)Exchange adjustment 66
At December 31, 2020 and January 1, 2021 45,950Provision in the six-month period 11,660Utilization of provision (6,575)Exchange adjustment (24)
At June 30, 2021 51,011
Reconciliation to the consolidated statements of financial position:
At December 31,At
June 30,
2018 2019 2020 2021
USD’000 USD’000 USD’000 USD’000
Warranty provision – current 7,273 8,394 15,175 18,796Warranty provision – non-current 13,121 15,246 30,775 32,215
20,394 23,640 45,950 51,011
Under the terms of the Group’s sales agreements, the Group will rectify any product defects arising
within two or three years of the date of sale. The warranty provision represents management’s best
estimate of the Group’s service commitments arising from products sold, based on past claims.
APPENDIX I ACCOUNTANTS’ REPORT
– I-92 –
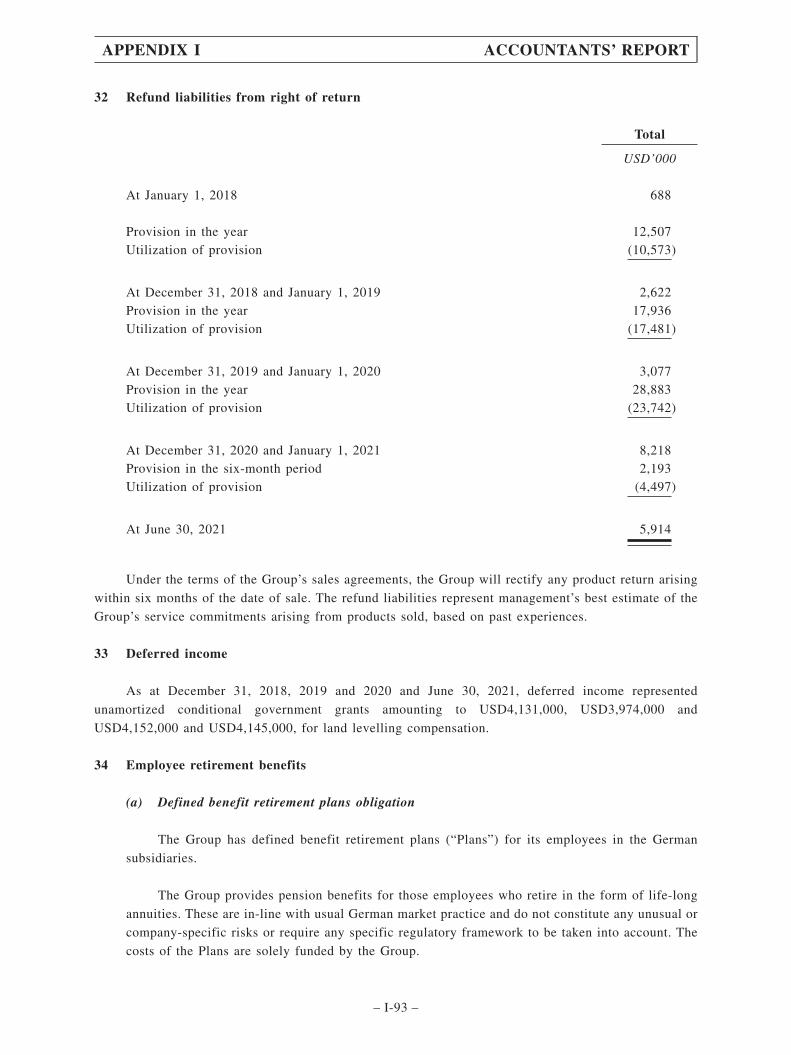
32 Refund liabilities from right of return
Total
USD’000
At January 1, 2018 688
Provision in the year 12,507Utilization of provision (10,573)
At December 31, 2018 and January 1, 2019 2,622Provision in the year 17,936Utilization of provision (17,481)
At December 31, 2019 and January 1, 2020 3,077Provision in the year 28,883Utilization of provision (23,742)
At December 31, 2020 and January 1, 2021 8,218Provision in the six-month period 2,193Utilization of provision (4,497)
At June 30, 2021 5,914
Under the terms of the Group’s sales agreements, the Group will rectify any product return arising
within six months of the date of sale. The refund liabilities represent management’s best estimate of the
Group’s service commitments arising from products sold, based on past experiences.
33 Deferred income
As at December 31, 2018, 2019 and 2020 and June 30, 2021, deferred income represented
unamortized conditional government grants amounting to USD4,131,000, USD3,974,000 and
USD4,152,000 and USD4,145,000, for land levelling compensation.
34 Employee retirement benefits
(a) Defined benefit retirement plans obligation
The Group has defined benefit retirement plans (“Plans”) for its employees in the German
subsidiaries.
The Group provides pension benefits for those employees who retire in the form of life-long
annuities. These are in-line with usual German market practice and do not constitute any unusual or
company-specific risks or require any specific regulatory framework to be taken into account. The
costs of the Plans are solely funded by the Group.
APPENDIX I ACCOUNTANTS’ REPORT
– I-93 –

The calculation is performed by qualified staff of Kern Mauch & Kollegen GmbH, an
independent actuarial firm. The actuarial valuations of the defined benefit retirement obligation were
performed in accordance with HKAS 19 “Employee Benefits” by actuaries using the projected unit
credit method in the Relevant Periods.
(i) The amounts recognized in the consolidated statement of financial position are as
follows:
At December 31,At
June 30,
2018 2019 2020 2021
USD’000 USD’000 USD’000 USD’000
Present value of defined
benefit retirement plans
obligation 922 921 972 956
(ii) Movements in the present value of the defined benefit retirement plans obligation:
At December 31,At
June 30,
2018 2019 2020 2021
USD’000 USD’000 USD’000 USD’000
At the beginning of the
year/period 1,021 922 921 972Remeasurements effect
recognized in other
comprehensive income– Actuarial loss 19 86 39 25– Exchange adjustment (42) (19) 88 (48)
998 989 1,048 949
Benefits paid by the plans (92) (84) (85) –Current service cost 2 2 2 1Interest cost 14 14 7 6
At the end of the
year/period 922 921 972 956
APPENDIX I ACCOUNTANTS’ REPORT
– I-94 –

(iii) Amounts recognized in the consolidated statement of profit or loss and other
comprehensive income are as follows:
At December 31, At June 30,
2018 2019 2020 2021
USD’000 USD’000 USD’000 USD’000
Current service cost 2 2 2 1Interest on defined benefit
retirement plans obligation 14 14 7 6
Total amounts recognized
in profit or loss (Note 6(b)) 16 16 9 7
Actuarial loss 19 86 39 25Exchange adjustment (42) (19) 88 (48)
Total amounts recognized
in other comprehensive
income (23) 67 127 (23)
Total defined benefit costs (7) 83 136 (16)
(iv) The current service cost and the interest on defined retirement obligation are recognized
in the following line items in the consolidated statement of profit or loss:
At December 31,At
June 30,
2018 2019 2020 2021
USD’000 USD’000 USD’000 USD’000
Cost of sales 16 16 9 7
APPENDIX I ACCOUNTANTS’ REPORT
– I-95 –

(v) Significant actuarial assumptions (expressed as weighted averages) and sensitivity
analysis are as follows:
At December 31,At
June 30,
2018 2019 2020 2021
USD’000 USD’000 USD’000 USD’000
Discount rate 1.40% 1.61% 0.75% 0.26%Rate of pension increase 1% 1% 1% 1%Death rate RT 2018 G RT 2018 G RT 2018 G RT 2018 GRetirement age age 65 age 65 age 65 age 65Staff turnover 0.00% 0.00% 0.00% 0.00%
The below analysis shows how the defined benefit obligation would have increased/(decreased)
as a result of 20% change in the discount rate:
At December 31, At June 30,
2018 2019 2020 2021
Increase
in 20%
Decrease
in 20%
Increase
in 20%
Decrease
in 20%
Increase
in 20%
Decrease
in 20%
Increase
in 20%
Decrease
in 20%USD’000 USD’000 USD’000 USD’000 USD’000 USD’000 USD’000 USD’000
Discount
rate (17) 17 (17) 17 (15) 16 (16) 16
The above sensitivity analysis is based on the assumption that changes in actuarial assumptions
are not correlated and therefore it does not take into account the correlations between the actuarial
assumptions.
(b) Defined contribution retirement plans
Pursuant to the relevant labor rules and regulations in the PRC, the PRC subsidiaries of the
Group participate in defined contribution retirement plans (the “Schemes”) organized by the local
authorities whereby the entities are required to make contributions to the Schemes based on a
percentage of the eligible employees’ salaries during the years ended December 31, 2018, 2019 and
2020 and the six months ended June 30, 2021. Contributions to the Schemes vest immediately. Under
the Schemes, retirement benefits of existing and retired employees are payable by the relevant
scheme administrators and the Group has no further obligations beyond the annual contributions.
The Group’s subsidiaries in jurisdictions other than the PRC, make contributions to local
retirement schemes pursuant to the relevant labor rules and regulations in the jurisdiction in which
such subsidiary located.
APPENDIX I ACCOUNTANTS’ REPORT
– I-96 –

35 Equity settled share-based transactions
Pursuant to a resolution of the board of directors of the Company passed on December 30, 2020, a
Share Incentive Scheme (“Share Incentive Scheme”) was adopted for purpose of providing incentives to
the qualified employees of the Group. The Share Incentive Scheme granted to qualified employees of the
Group for the right to subscribe a total of 11,670,500 ordinary shares of the Company (the “Share
Awards”). As there is no service condition of the Share Incentive Scheme, the Share Awards were fully
vested on December 30, 2020.
Under the Share Incentive Scheme, the Share Awards were granted to 429 employees of the Group
through 12 shareholding platforms at a price of HKD4.7529 (equivalent to USD0.6093) per share.
Fair value of shares granted
The fair value of the Share Awards granted was calculated based on the fair value of underlying
ordinary shares as at the grant date. The directors have used the income approach to determine the
fair value of the underlying shares of the Company.
Grant date Grant date fair value
December 30, 2020 RMB185,093,000
Share-based payment expense of RMB138,358,000 (USD21,077,000 equivalent) is recognized
as staff costs (Note 6(b)) in the consolidated statements of profit or loss for the year ended
December 31, 2020.
The discounted cash flow derived by management considered the Group’s future business plan,
specific business and financial risks, the stage of development of the Group’s operations and
economic and competitive elements affecting the Group’s business, industry and market. The
discount rates used for the grant date fair value were 13.56%.
The directors estimated the risk-free interest rate based on the yield of Chinese government
bonds with maturity of 30 years. Weighted average cost of capital was estimated based on selected
comparable companies.
APPENDIX I ACCOUNTANTS’ REPORT
– I-97 –

36 Capital, reserves and dividends
(a) Movement in components of equity
The reconciliation between the opening and closing balances of each component of the Group’sconsolidated equity is set out in the consolidated statements of changes in equity. Details of thechanges in the Company’s individual components of equity between the beginning and the end ofeach reporting period are set out below:
The Company
Reserves
NoteSharecapital
Otherreserve
Retainedprofits Total
USD’000 USD’000 USD’000 USD’000
At January 1, 2018 50,279 – 144,337 194,616Changes in equity for 2018:Profit and total comprehensiveincome for the year – – 10,442 10,442Appropriation of dividends 36(b) – – (4,500) (4,500)
Balance at December 31, 2018and January 1, 2019 50,279 – 150,279 200,558Change in equity for 2019:Profit and total comprehensiveincome for the year – – 8,774 8,774
Balance at December 31, 2019and January 1, 2020 50,279 – 159,053 209,332Changes in equity for 2020:Profit and total comprehensiveincome for the year – – 4,186 4,186Equity settled share-basedtransactions 35 – 21,077 – 21,077Appropriation of dividends 36(b) – – (3,691) (3,691)
Balance at December 31, 2020and January 1, 2021 50,279 21,077 159,548 230,904Changes in equity for the sixmonths ended June 30, 2021:Loss and total comprehensiveincome for the six-month period – – (2,018) (2,018)Issuance of ordinary shares 7,856 – – 7,856Appropriation of dividends 36(b) – – (15,000) (15,000)
Balance at June 30, 2021 58,135 21,077 142,530 221,742
APPENDIX I ACCOUNTANTS’ REPORT
– I-98 –
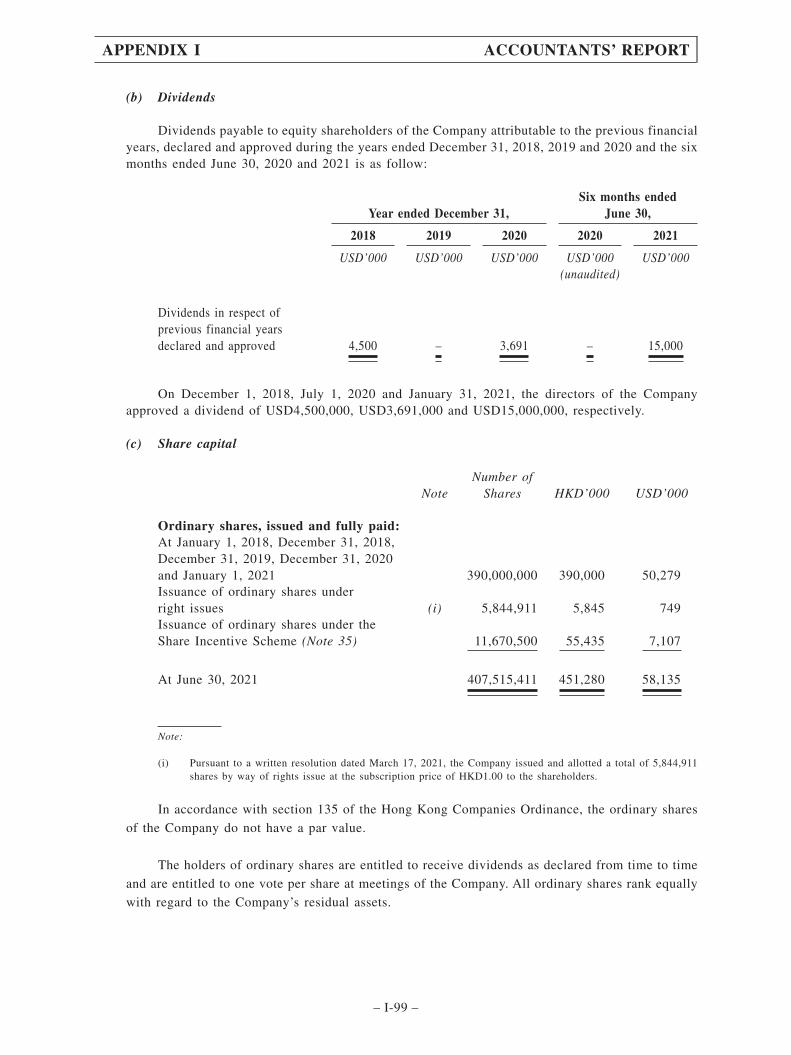
(b) Dividends
Dividends payable to equity shareholders of the Company attributable to the previous financialyears, declared and approved during the years ended December 31, 2018, 2019 and 2020 and the sixmonths ended June 30, 2020 and 2021 is as follow:
Year ended December 31,Six months ended
June 30,
2018 2019 2020 2020 2021
USD’000 USD’000 USD’000 USD’000 USD’000(unaudited)
Dividends in respect ofprevious financial yearsdeclared and approved 4,500 – 3,691 – 15,000
On December 1, 2018, July 1, 2020 and January 31, 2021, the directors of the Companyapproved a dividend of USD4,500,000, USD3,691,000 and USD15,000,000, respectively.
(c) Share capital
NoteNumber of
Shares HKD’000 USD’000
Ordinary shares, issued and fully paid:At January 1, 2018, December 31, 2018,December 31, 2019, December 31, 2020and January 1, 2021 390,000,000 390,000 50,279Issuance of ordinary shares underright issues (i) 5,844,911 5,845 749Issuance of ordinary shares under theShare Incentive Scheme (Note 35) 11,670,500 55,435 7,107
At June 30, 2021 407,515,411 451,280 58,135
Note:
(i) Pursuant to a written resolution dated March 17, 2021, the Company issued and allotted a total of 5,844,911shares by way of rights issue at the subscription price of HKD1.00 to the shareholders.
In accordance with section 135 of the Hong Kong Companies Ordinance, the ordinary shares
of the Company do not have a par value.
The holders of ordinary shares are entitled to receive dividends as declared from time to time
and are entitled to one vote per share at meetings of the Company. All ordinary shares rank equally
with regard to the Company’s residual assets.
APPENDIX I ACCOUNTANTS’ REPORT
– I-99 –
(d) Nature and purpose of reserves
(i) Other reserve
Other reserve primarily represented the portion of the grant date fair value of shares
granted by the Share Incentive Scheme to the directors and employees of the Group that has
been recognized in accordance with the accounting policy adopted for share-based payments in
Note 2(s)(iv).
(ii) PRC statutory reserve
Statutory reserve is established in accordance with the relevant PRC rules and regulations
and the articles of association of the companies comprising the Group which are incorporated
in the PRC.
In accordance with the PRC Company Law, certain subsidiaries of the Group which are
domestic enterprises are required to allocate 10% of their profit after tax, as determined in
accordance with the relevant PRC accounting standards, to their respective statutory reserves
until the reserves reach 50% of their respective registered capital. For the entity concerned,
statutory reserves can be used to make good previous years’ losses, if any, and may be
converted into capital in proportion to the existing equity interests of investors, provided that
the balance of the reserve after such conversion is not less than 25% of the entity’s registered
capital.
(iii) Exchange reserve
The exchange reserve comprises all foreign exchange differences arising from the
translation of the financial statements of operations with functional currency other than USD.
The reserve is dealt with in accordance with the accounting policy as set out in Note 2(x).
(e) Capital management
The Group’s primary objectives when managing capital are to safeguard the Group’s ability to
continue as a going concern, so that it can continue to provide returns for shareholders and benefits
for other stakeholders, by pricing products and services commensurately with the level of risk and
by securing access to finance at a reasonable cost.
The Group actively and regularly reviews and manages its capital structure to maintaining a
balance between the higher shareholders returns that might be possible with higher levels of
borrowings and the advantages and security afforded by a sound capital position, and makes
adjustments to the capital structure in light of changes in economic conditions.
The Group monitors its capital structure on the basis of a net gearing ratio. For this purpose,
the Group defines net debt as total current and non-current bank loans and lease liabilities less cash
and cash equivalents and pledged deposits. The Group defines capital as including all components
of equity.
APPENDIX I ACCOUNTANTS’ REPORT
– I-100 –
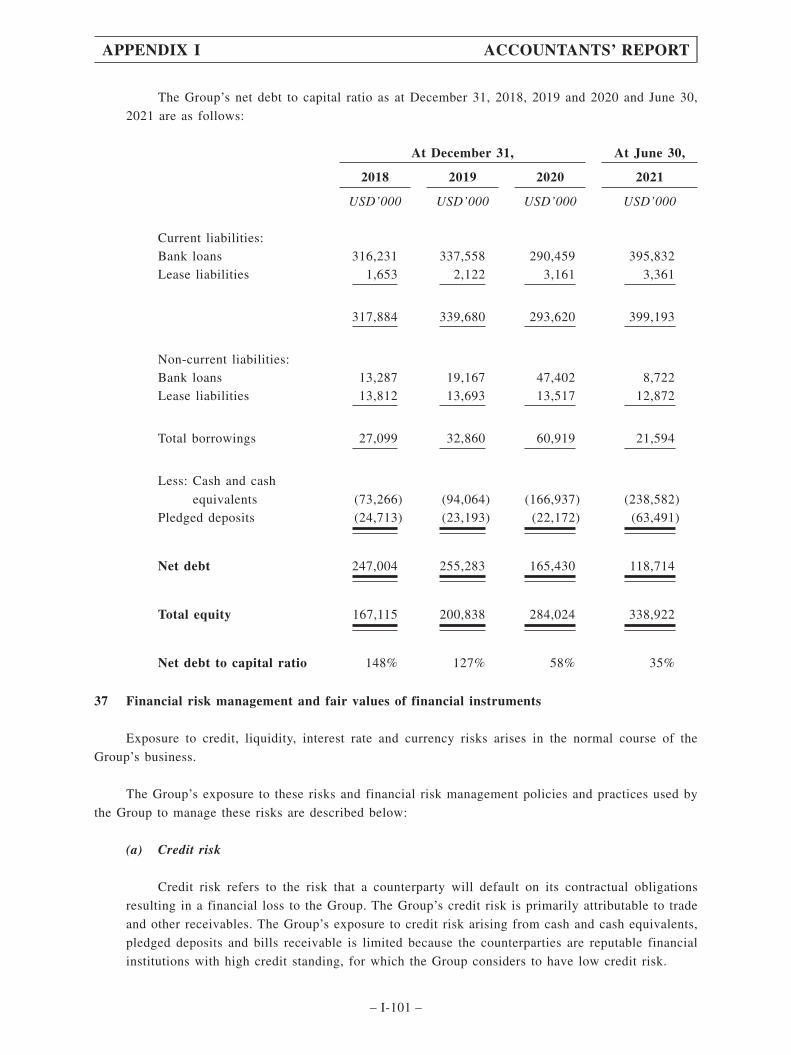
The Group’s net debt to capital ratio as at December 31, 2018, 2019 and 2020 and June 30,
2021 are as follows:
At December 31, At June 30,
2018 2019 2020 2021
USD’000 USD’000 USD’000 USD’000
Current liabilities:Bank loans 316,231 337,558 290,459 395,832Lease liabilities 1,653 2,122 3,161 3,361
317,884 339,680 293,620 399,193
Non-current liabilities:Bank loans 13,287 19,167 47,402 8,722Lease liabilities 13,812 13,693 13,517 12,872
Total borrowings 27,099 32,860 60,919 21,594
Less: Cash and cash
equivalents (73,266) (94,064) (166,937) (238,582)Pledged deposits (24,713) (23,193) (22,172) (63,491)
Net debt 247,004 255,283 165,430 118,714
Total equity 167,115 200,838 284,024 338,922
Net debt to capital ratio 148% 127% 58% 35%
37 Financial risk management and fair values of financial instruments
Exposure to credit, liquidity, interest rate and currency risks arises in the normal course of the
Group’s business.
The Group’s exposure to these risks and financial risk management policies and practices used by
the Group to manage these risks are described below:
(a) Credit risk
Credit risk refers to the risk that a counterparty will default on its contractual obligations
resulting in a financial loss to the Group. The Group’s credit risk is primarily attributable to trade
and other receivables. The Group’s exposure to credit risk arising from cash and cash equivalents,
pledged deposits and bills receivable is limited because the counterparties are reputable financial
institutions with high credit standing, for which the Group considers to have low credit risk.
APPENDIX I ACCOUNTANTS’ REPORT
– I-101 –
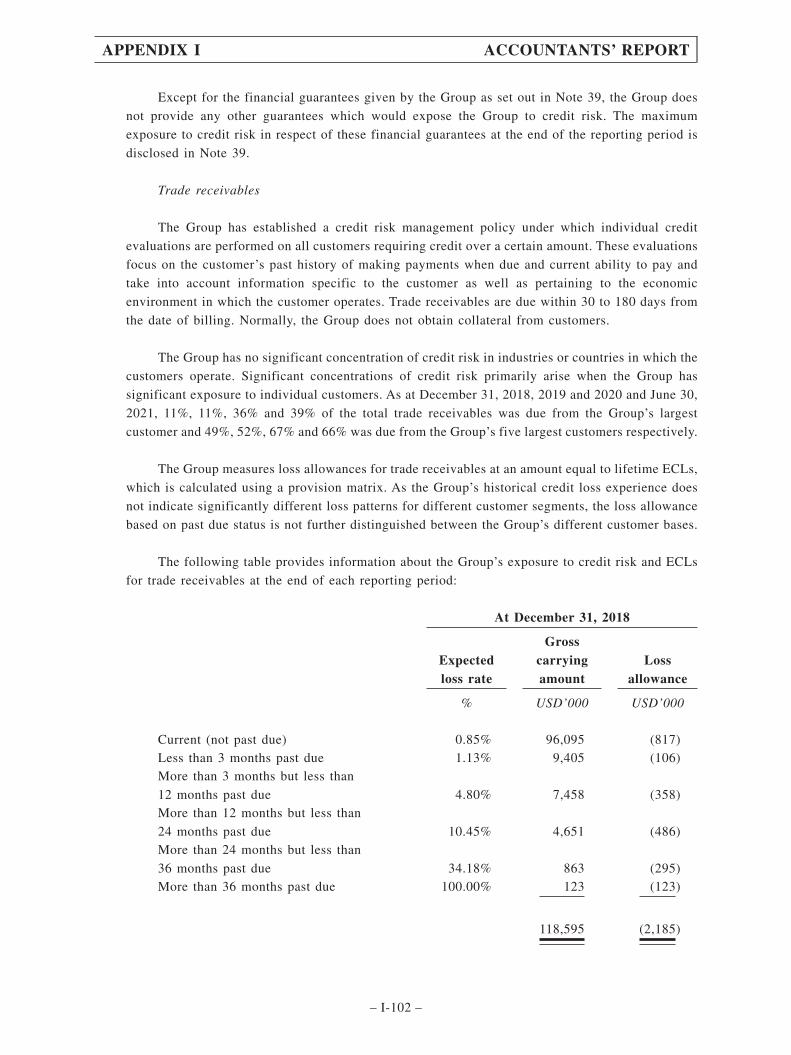
Except for the financial guarantees given by the Group as set out in Note 39, the Group does
not provide any other guarantees which would expose the Group to credit risk. The maximum
exposure to credit risk in respect of these financial guarantees at the end of the reporting period is
disclosed in Note 39.
Trade receivables
The Group has established a credit risk management policy under which individual credit
evaluations are performed on all customers requiring credit over a certain amount. These evaluations
focus on the customer’s past history of making payments when due and current ability to pay and
take into account information specific to the customer as well as pertaining to the economic
environment in which the customer operates. Trade receivables are due within 30 to 180 days from
the date of billing. Normally, the Group does not obtain collateral from customers.
The Group has no significant concentration of credit risk in industries or countries in which the
customers operate. Significant concentrations of credit risk primarily arise when the Group has
significant exposure to individual customers. As at December 31, 2018, 2019 and 2020 and June 30,
2021, 11%, 11%, 36% and 39% of the total trade receivables was due from the Group’s largest
customer and 49%, 52%, 67% and 66% was due from the Group’s five largest customers respectively.
The Group measures loss allowances for trade receivables at an amount equal to lifetime ECLs,
which is calculated using a provision matrix. As the Group’s historical credit loss experience does
not indicate significantly different loss patterns for different customer segments, the loss allowance
based on past due status is not further distinguished between the Group’s different customer bases.
The following table provides information about the Group’s exposure to credit risk and ECLs
for trade receivables at the end of each reporting period:
At December 31, 2018
Expectedloss rate
Grosscarryingamount
Lossallowance
% USD’000 USD’000
Current (not past due) 0.85% 96,095 (817)Less than 3 months past due 1.13% 9,405 (106)More than 3 months but less than
12 months past due 4.80% 7,458 (358)More than 12 months but less than
24 months past due 10.45% 4,651 (486)More than 24 months but less than
36 months past due 34.18% 863 (295)More than 36 months past due 100.00% 123 (123)
118,595 (2,185)
APPENDIX I ACCOUNTANTS’ REPORT
– I-102 –
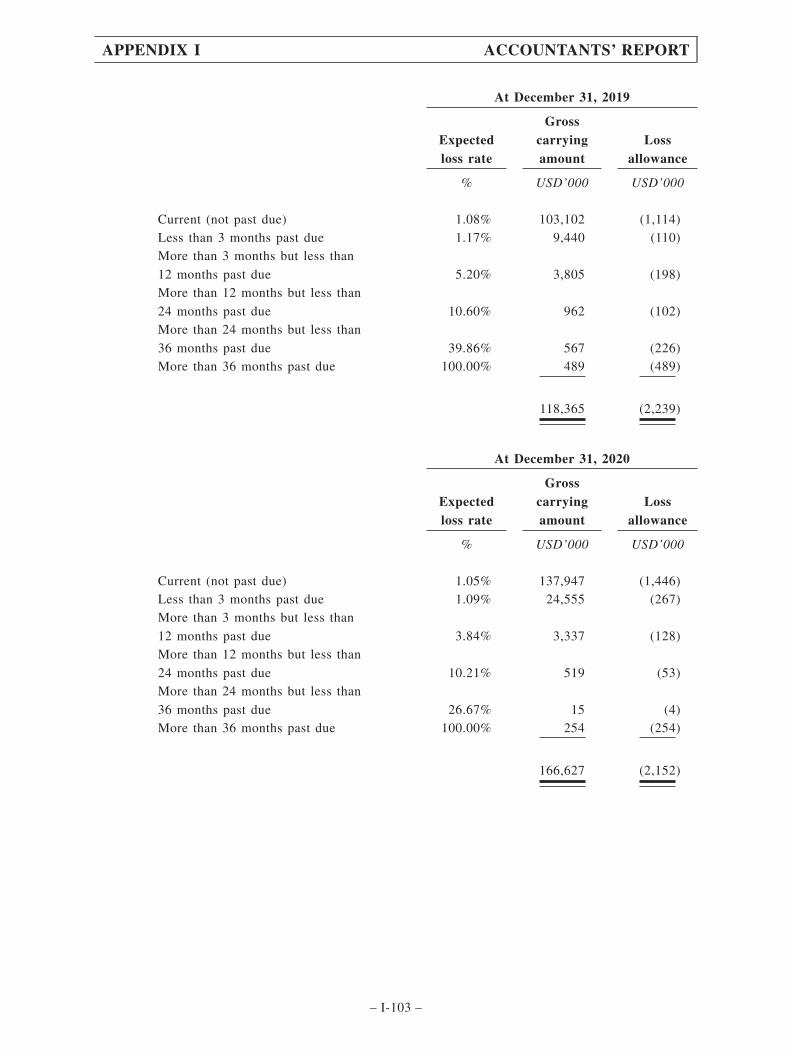
At December 31, 2019
Expectedloss rate
Grosscarryingamount
Lossallowance
% USD’000 USD’000
Current (not past due) 1.08% 103,102 (1,114)Less than 3 months past due 1.17% 9,440 (110)More than 3 months but less than
12 months past due 5.20% 3,805 (198)More than 12 months but less than
24 months past due 10.60% 962 (102)More than 24 months but less than
36 months past due 39.86% 567 (226)More than 36 months past due 100.00% 489 (489)
118,365 (2,239)
At December 31, 2020
Expectedloss rate
Grosscarryingamount
Lossallowance
% USD’000 USD’000
Current (not past due) 1.05% 137,947 (1,446)Less than 3 months past due 1.09% 24,555 (267)More than 3 months but less than
12 months past due 3.84% 3,337 (128)More than 12 months but less than
24 months past due 10.21% 519 (53)More than 24 months but less than
36 months past due 26.67% 15 (4)More than 36 months past due 100.00% 254 (254)
166,627 (2,152)
APPENDIX I ACCOUNTANTS’ REPORT
– I-103 –

At June 30, 2021
Expectedloss rate
Grosscarryingamount
Lossallowance
% USD’000 USD’000
Current (not past due) 1.06% 165,897 (1,754)Less than 3 months past due 1.10% 14,300 (158)More than 3 months but less than
12 months past due 4.51% 4,387 (198)More than 12 months but less than
24 months past due 13.58% 589 (80)More than 24 months but less than
36 months past due 22.16% 167 (37)More than 36 months past due 100.00% 247 (247)
185,587 (2,474)
Expected loss rates are based on actual loss experience over the past years. These rates are
adjusted to reflect differences between economic conditions during the period over which the historic
data has been collected, current conditions and the Group’s view of economic conditions over the
expected lives of the receivables.
Movement in the loss allowance in respect of trade receivables during the Relevant Periods is
as follows:
At December 31, At June 30,
2018 2019 2020 2021
USD’000 USD’000 USD’000 USD’000
At the beginning of the
year/period 5,069 2,185 2,239 2,152Impairment loss recognized (2,702) 1,259 (103) 321Amounts written off during the
year/period (90) (1,184) (63) –Exchange adjustment (92) (21) 79 1
At the end of the year/period 2,185 2,239 2,152 2,474
APPENDIX I ACCOUNTANTS’ REPORT
– I-104 –

The following significant changes in the gross carrying amounts of trade receivablescontributed to the change in the loss allowance during the years ended December 31, 2018, 2019 and2020 and the six months ended June 30, 2021:
– origination of new trade receivables net of those settled resulted in a decrease ofUSD2,702,000, an increase in loss allowance of USD1,259,000, a decrease ofUSD103,000 and an increase of USD321,000, respectively.
– a write-off of trade receivables with a gross carrying amount of USD90,000USD1,184,000, USD63,000 and USD nil resulted in a decrease in loss allowance,respectively.
(b) Liquidity risk
Individual operating entities within the Group are responsible for their own cash management,including the short-term investment of cash surpluses and the raising of loans to cover expected cashdemands, subject to approval by the parent company’s board when the borrowings exceed certainpredetermined levels of authority. The Group’s policy is to regularly monitor its liquidityrequirements and its compliance with lending covenants to ensure that it maintains sufficientreserves of cash and adequate committed lines of funding from major financial institutions to meetits liquidity requirements in the short and longer term.
The following tables show the remaining contractual maturities at the end of each reportingperiod of the Group’s financial liabilities, which are based on contractual undiscounted cash flows(including interest payments computed using contractual rates or, if floating, based on rates currentat the reporting date) and the earliest date the Group can be required to pay:
At December 31, 2018
Within1 yearor on
demand
More than1 year butless than2 years
More than2 years but
less than5 years
More than5 years Total
Carryingamount at
December 31,2018
USD’000 USD’000 USD’000 USD’000 USD’000 USD’000
Bank loans 324,746 8,576 5,397 – 338,719 329,518Lease liabilities 1,922 1,540 4,293 9,956 17,711 15,465Trade and bills payables 138,883 – – – 138,883 138,883Other payables and accruals 56,499 – – – 56,499 56,499Refund liabilities from right ofreturn 2,622 – – – 2,622 2,622
524,672 10,116 9,690 9,956 554,434 542,987
Financial guarantees issued:Maximum amount guaranteed(Note 39) 874 – – – 874 –
Derivatives settled gross:Foreign currency forward andoption contracts (Note 21)
– outflow (136,837) – – – (136,837) –– inflow 140,050 – – – 140,050 –
APPENDIX I ACCOUNTANTS’ REPORT
– I-105 –

At December 31, 2019
Within 1year or on
demand
More than1 year butless than 2
years
More than2 years butless than 5
yearsMore than
5 years Total
Carryingamount at
December 31,2019
USD’000 USD’000 USD’000 USD’000 USD’000 USD’000
Bank loans 346,758 10,666 9,312 – 366,736 356,725Lease liabilities 2,511 2,349 5,178 8,343 18,381 15,815Trade and bills payables 163,808 – – – 163,808 163,808Other payables and accruals 87,891 – – – 87,891 87,891Refund liabilities from right ofreturn 3,077 – – – 3,077 3,077
604,045 13,015 14,490 8,343 639,893 627,316
Financial guarantees issued:Maximum amount guaranteed(Note 39) 1,003 – – – 1,003 –
Derivatives settled gross:Foreign currency forward andoption contracts (Note 21)
– outflow (136,322) – – – (136,322) –– inflow 136,660 – – – 136,660 –
At December 31, 2020
Within 1year or on
demand
More than1 year butless than 2
years
More than2 years butless than 5
yearsMore than
5 years Total
Carryingamount at
December 31,2020
USD’000 USD’000 USD’000 USD’000 USD’000 USD’000
Bank loans 298,219 47,690 – – 345,909 337,861Lease liabilities 3,752 3,086 5,636 6,777 19,251 16,678Trade and bills payables 247,529 – – – 247,529 247,529Other payables and accruals 130,137 – – – 130,137 130,137Refund liabilities from right ofreturn 8,218 – – – 8,218 8,218
687,855 50,776 5,636 6,777 751,044 740,423
Financial guarantees issued:Maximum amount guaranteed(Note 39) 9,808 – – – 9,808 –
Derivatives settled gross:Foreign currency forward andoption contracts (Note 21)
– outflow (231,113) – – – (231,113) –– inflow 225,575 – – – 225,575 –
APPENDIX I ACCOUNTANTS’ REPORT
– I-106 –

At June 30, 2021
Within1 year or
on demand
More than1 year butless than2 years
More than2 years but
less than5 years
More than5 years Total
Carryingamount at
June 30, 2021
USD’000 USD’000 USD’000 USD’000 USD’000 USD’000
Bank loans 402,788 1,181 7,542 1,189 412,700 404,554Lease liabilities 3,361 3,049 4,345 5,478 16,233 16,233Trade and bills payables 350,691 – – – 350,691 350,691Other payables and accruals 157,561 – – – 157,561 157,561Refund liabilities from rightof return 5,914 – – – 5,914 5,914
920,315 4,230 11,887 6,667 943,099 934,953
Financial guarantees issued:Maximum amount guaranteed(Note 39) 9,907 – – – 9,907 –
Derivatives settled gross:Foreign currency forward andoption contracts (Note 21)
– outflow (204,910) – – – (204,910) –– inflow 202,421 – – – 202,421 –
(c) Interest rate risk
The Group’s interest rate risk arises primarily from short-term and long-term borrowings.Borrowings issued at variable rates and at fixed rates expose the Group to cash flow interest rate riskand fair value interest rate risk respectively. The Group’s interest rate profile as monitored bymanagement is set out in (i) below:
(i) Interest rate profile
The following table details the interest rate profile of the Group’s total borrowings as atthe end of each reporting period:
At December 31, At June 30,
2018 2019 2020 2021
Effective
Interest
rate Amount
Effective
Interest
rate Amount
Effective
Interest
rate Amount
Effective
Interest
rate Amount
% USD’000 % USD’000 % USD’000 % USD’000
Fixed rate borrowings:
Bank loans
3.6850%-
9.1700% 186,487
3.2625%-
9.4865% 231,083
1.4073%-
6.6000% 76,911
1.5000%-
4.9000% 296,841
APPENDIX I ACCOUNTANTS’ REPORT
– I-107 –

At December 31, At June 30,
2018 2019 2020 2021
Effective
Interest
rate Amount
Effective
Interest
rate Amount
Effective
Interest
rate Amount
Effective
Interest
rate Amount
% USD’000 % USD’000 % USD’000 % USD’000
Variable rate borrowings:
Bank loans
1.9000%-
5.7600% 143,031
2.2000%-
6.6000% 125,642
1.6439%-
3.3939% 260,950
0.7000%-
5.1450% 107,713
Total borrowings 329,518 356,725 337,861 404,554
Fixed rate borrowings as a
percentage of total
borrowings 57% 65% 23% 73%
(ii) Sensitivity analysis
It is estimated that a general increase/decrease of 100 basis points in interest rates, withall other variables held constant, would have increased/decreased the Group’s loss aftertaxation and decreased/increased retained profits by approximately USD1,066,000 as atDecember 31, 2018 and decreased/increased the Group’s profit after taxation and retainedprofits by approximately USD936,000, USD1,944,000 and USD802,000 in response to thegeneral increase or decrease in interest rates as at December 31, 2019 and 2020 and June 30,2021.
The sensitivity analysis above indicates the annualised impact on the Group’s interestexpense that would arise assuming that the change in interest rates had occurred at the end ofthe reporting period and had been applied to floating rate instruments which expose the Groupto cash flow interest rate risk at that date. The analysis is performed on the same basis as 2018.
The sensitivity analysis above indicates the instantaneous change in the Group’s
(loss)/profit after taxation (and retained profits) that would arise assuming that the change in
interest rates had occurred at the end of each reporting period and had been applied to floating
rate non-derivative instruments held by the Group, which expose the Group to cash flow
interest rate risk. The impact on the Group’s (loss)/profit after taxation (and retained profits)
is estimated as an annualized impact on interest expense of such a change in interest rates.
Fixed rate financial instruments are excluded for the above analysis. The analysis is performed
on the same basis during the Relevant Periods.
(d) Currency risk
The Group is exposed to currency risk primarily through sales, purchase and borrowings which
give rise to receivables, payables, cash balances and bank loans that are denominated in a currency
other than the functional currency of the operations to which the transactions relate. The currencies
giving rise to this risk are primarily USD.
APPENDIX I ACCOUNTANTS’ REPORT
– I-108 –

(i) Exposure to currency risk
The following table details the Group’s exposure as at December 31, 2018, 2019 and 2020
and June 30, 2021 to currency risk arising from the recognized assets or liabilities denominated
in a currency other than the functional currency of the entity to which they relate. For
presentation purpose, the amounts of exposure are shown in USD translated using the spot rate
of the end of each reporting period. Differences resulting from the translation of the financial
statements of the Group’s subsidiaries with functional currency other than USD into the
Group’s presentation currency are excluded.
As the HKD is pegged to the USD, the group considers the risk of movements in
exchange rates between the HKD and the USD to be insignificant.
At December 31, At June 30,
2018 2019 2020 2021
USD’000 USD’000 USD’000 USD’000
USDCash and cash equivalents 30,069 30,783 63,925 59,984Trade and bills receivables 148,318 218,921 209,209 220,583Bank loans (99,068) (101,126) (53,323) (82,311)Trade and bills payables (10,041) (3,595) (3,714) (7,345)Other payables and accruals – – (96) (105)
Gross exposure arising from
recognized assets and
liabilities 69,278 144,983 216,001 190,806
Notional amounts of
forward exchange contracts
and foreign currency option
contracts used as economic
hedges (56,812) (24,700) (87,000) (77,100)
Net exposure arising from
recognized assets and
liabilities 12,466 120,283 129,001 113,706
APPENDIX I ACCOUNTANTS’ REPORT
– I-109 –
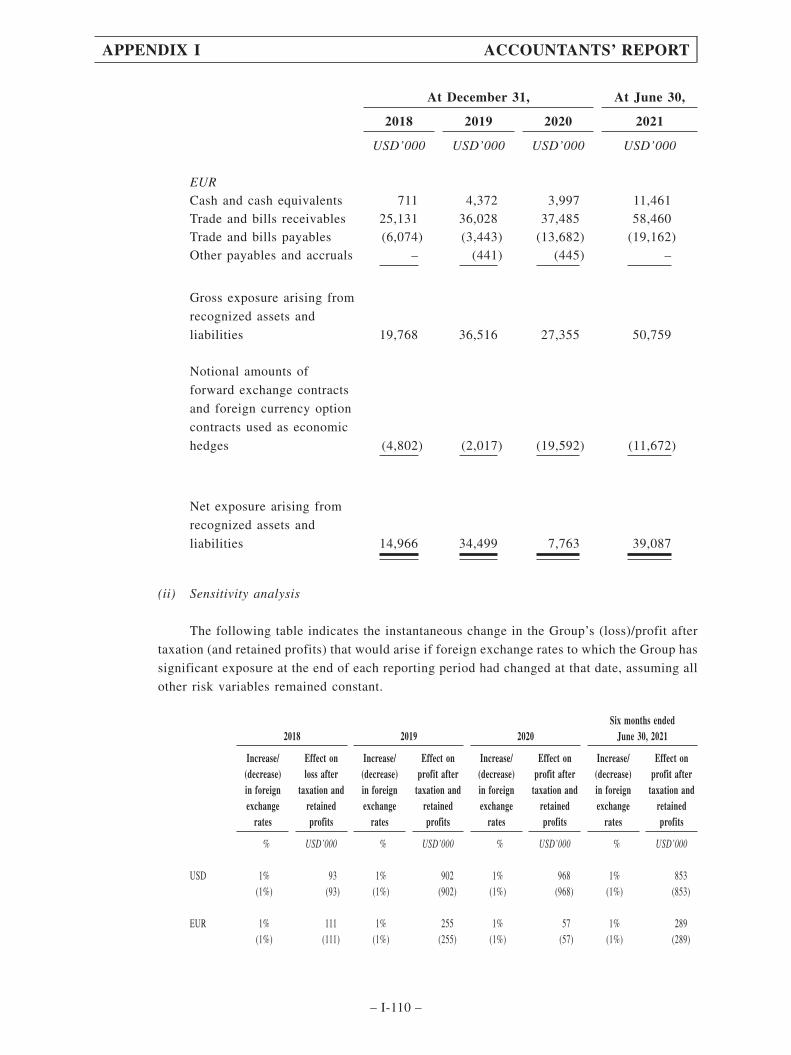
At December 31, At June 30,
2018 2019 2020 2021
USD’000 USD’000 USD’000 USD’000
EURCash and cash equivalents 711 4,372 3,997 11,461Trade and bills receivables 25,131 36,028 37,485 58,460Trade and bills payables (6,074) (3,443) (13,682) (19,162)Other payables and accruals – (441) (445) –
Gross exposure arising from
recognized assets and
liabilities 19,768 36,516 27,355 50,759
Notional amounts of
forward exchange contracts
and foreign currency option
contracts used as economic
hedges (4,802) (2,017) (19,592) (11,672)
Net exposure arising from
recognized assets and
liabilities 14,966 34,499 7,763 39,087
(ii) Sensitivity analysis
The following table indicates the instantaneous change in the Group’s (loss)/profit after
taxation (and retained profits) that would arise if foreign exchange rates to which the Group has
significant exposure at the end of each reporting period had changed at that date, assuming all
other risk variables remained constant.
2018 2019 2020Six months ended
June 30, 2021
Increase/(decrease)in foreignexchange
rates
Effect onloss after
taxation andretainedprofits
Increase/(decrease)in foreignexchange
rates
Effect onprofit after
taxation andretainedprofits
Increase/(decrease)in foreignexchange
rates
Effect onprofit after
taxation andretainedprofits
Increase/(decrease)in foreignexchange
rates
Effect onprofit after
taxation andretainedprofits
% USD’000 % USD’000 % USD’000 % USD’000
USD 1% 93 1% 902 1% 968 1% 853(1%) (93) (1%) (902) (1%) (968) (1%) (853)
EUR 1% 111 1% 255 1% 57 1% 289(1%) (111) (1%) (255) (1%) (57) (1%) (289)
APPENDIX I ACCOUNTANTS’ REPORT
– I-110 –
Results of the analysis as presented in the above table represent an aggregation of the
instantaneous effects on each of the Group subsidiaries’ profit after tax and equity measured
in the respective functional currencies, translated into USD at the exchange rate ruling at the
end of each reporting period for presentation purpose.
The sensitivity analysis assumes that the change in foreign exchange rates had been
applied to re-measure those financial instruments held by the Group which expose the Group
to foreign currency risk as at December 31, 2018, 2019 and 2020 and June 30, 2021, including
inter-company payables and receivables within the Group which are denominated in a currency
other than the functional currencies of the lender or the borrower. The analysis excludes
differences that would result from the translation of the financial statements of entities whose
functional currency is not USD. The analysis is performed on the same basis for the years
ended December 31, 2018, 2019 and 2020 and the six months ended June 30, 2021.
(e) Fair value measurement
Fair value hierarchy
The following table presents the fair value of the Group’s financial instruments measured
at the end of each reporting period on a recurring basis, categorized into the three-level fair
value hierarchy as defined in HKFRS 13, Fair value measurement. The level into which a fair
value measurement is classified is determined with reference to the observability and
significance of the inputs used in the valuation technique as follows:
– Level 1 valuations: Fair value measured using only Level 1 inputs i.e. unadjusted
quoted prices in active markets for identical assets or
liabilities at the measurement date;
– Level 2 valuations: Fair value measured using Level 2 inputs i.e. observable
inputs which fail to meet Level 1, and not using significant
unobservable inputs. Unobservable inputs are inputs for which
market data are not available;
– Level 3 valuations: Fair value measured using significant unobservable inputs.
APPENDIX I ACCOUNTANTS’ REPORT
– I-111 –

Analysis on fair value measurement of derivative financial instruments as at
December 31, 2018, 2019 and 2020 and June 30, 2021 are as follows:
Fair value atDecember 31,
2018Fair value measurement at December 31,
2018 categorized into
USD’000 Level 1 Level 2 Level 3
Recurring fair valuemeasurement
Financial assets at FVPL– Unlisted units in
investment funds 15,236 – – 15,236– Insurance product 5,482 – – 5,482– Structured deposits and
wealth management
products 2,798 – – 2,798– Trading securities 9,582 9,582 – –
Derivative financialinstruments– Foreign currency forward
contracts (2,381) – (2,381) –– Foreign currency option
contracts (746) – (746) –– Interest rate swap contracts (19) – (19) –– Copper commodity swap
contracts (67) – (67) –
Trade receivables 3,011 – – 3,011
APPENDIX I ACCOUNTANTS’ REPORT
– I-112 –

Fair value atDecember 31,
2019Fair value measurement at December 31,
2019 categorized into
USD’000 Level 1 Level 2 Level 3
Recurring fair valuemeasurement
Financial assets at FVPL– Unlisted units in
investment funds 11,604 – – 11,604– Insurance product 5,663 – – 5,663– Structured deposits and
wealth managementproducts 3,584 – – 3,584
– Trading securities 11 11 – –
Derivative financialinstruments– Foreign currency forward
contracts (215) – (215) –– Foreign currency option
contracts (123) – (123) –
Trade receivables 14,800 – – 14,800
Fair value atDecember 31,
2020Fair value measurement at December 31,
2020 categorized into
USD’000 Level 1 Level 2 Level 3
Recurring fair valuemeasurement
Financial assets at FVPL– Unlisted units in
investment funds 5 – – 5– Insurance product 5,844 – – 5,844– Structured deposits and
wealth managementproducts 5,372 – – 5,372
Derivative financialinstruments– Foreign currency forward
contracts 5,505 – 5,505 –– Foreign currency option
contracts 33 – 33 –
Trade receivables 85,147 – – 85,147
APPENDIX I ACCOUNTANTS’ REPORT
– I-113 –

Fair value atJune 30,
2021Fair value measurement at June 30, 2021
categorized into
USD’000 Level 1 Level 2 Level 3
Recurring fair valuemeasurement
Financial assets at FVPL– Insurance product 5,938 – – 5,938– Structured deposits and
wealth management
products 2,785 – – 2,785
Derivative financialinstruments– Foreign currency forward
contracts 2,562 – 2,562 –– Foreign currency option
contracts (73) – (73) –
Trade receivables 127,274 – – 127,274
During the years ended December 31, 2018, 2019 and 2020 and June 30, 2021, there were
no transfers, or transfers into or out of Level 3. The Group’s policy is to recognize transfers
between levels of fair value hierarchy as at the end of the reporting period in which they occur.
Valuation techniques and inputs used in Level 2 fair value measurements
The fair value of forward exchange contracts in Level 2 is determined by discounting the
difference between the contractual forward price and the current forward price. The discount
rate used is derived from the relevant government yield curve as at the end of the reporting
period plus an adequate constant credit spread.
The fair value of interest rate swaps is the estimated amount that the Group would receive
or pay to transfer the swap at the end of the reporting period, taking into account current
interest rates and the current creditworthiness of the swap counterparties.
APPENDIX I ACCOUNTANTS’ REPORT
– I-114 –

Information about Level 3 fair value measurements
Valuation techniques Significant unobservable inputs
Unlisted units in investment
funds
Net asset value (Note i) Net asset value of underlying
investments
Insurance product Cash value (Note ii) Expected return rate
Structured deposits and wealth
management products
Discounted cash flow
(Note iii)
Expected return rate
Trade receivables Discounted cash flow
(Note iv)
Expected return rate
Notes:
(i) The fair value of unlisted units in investment funds is determined referencing net asset value of underlyinginvestments. The fair value measurement is positively correlated to net asset value of underlying investments.As at December 31, 2018, it is estimated that with all other variables held constant, an increase/decrease in netasset value of underlying investments by 5% would have decreased/increased the Group’s loss for the year byUSD571,000, and as at December 31, 2019 and 2020 and June 30, 2021, it is estimated that with all othervariables held constant, an increase/decrease in net asset value of underlying investments by 5% would haveincreased/decreased the Group’s profit for the year/period by USD435,000, USD nil, and USD nil, respectively.
(ii) The fair value of insurance product is the cash value that can be recovered from insurance company. The fairvalue measurement is positively correlated to expected return rate. As at December 31, 2018, it is estimated thatwith all other variables held constant, an increase/decrease in fair value of insurance product by 5% would havedecreased/increased the Group’s loss for the year by USD201,000, and as at December 31, 2019 and 2020 andJune 30, 2021, it is estimated that with all other variables held constant, an increase/decrease in fair value ofinsurance product by 5% would have increased/decreased the Group’s profit for the year/period byUSD208,000, USD215,000, and USD218,000, respectively.
(iii) The fair value of structured deposits and wealth management products is calculated by discounting the expectedfuture cash flows. The fair value measurement is positively correlated to expected return rate. As at December31, 2018, it is estimated that with all other variables held constant, an increase/decrease in fair value ofstructured deposits and wealth management products by 5% would have decreased/increased the Group’s lossfor the year by USD105,000, and as at December 31, 2019 and 2020 and June 30, 2021, it is estimated that withall other variables held constant, an increase/decrease in fair value of structured deposits and wealthmanagement products by 5% would have increased/decreased the Group’s profit for the year/period byUSD134,000, USD201,000 and USD104,000, respectively.
(iv) The fair value of trade receivables is calculated by discounting the expected future cash flows. The fair valuemeasurement is positively correlated to expected return rate. As at December 31, 2018, it is estimated that withall other variables held constant, an increase/decrease in fair value of trade receivables by 5% would havedecreased/increased the Group’s loss for the year by USD112,000, and as at December 31, 2019 and 2020 andJune 30, 2021, it is estimated that with all other variables held constant, an increase/decrease in fair value oftrade receivables by 5% would have increased/decreased the Group’s profit for the year/period by USD551,000,USD3,172,000 and USD4,741,000 respectively.
APPENDIX I ACCOUNTANTS’ REPORT
– I-115 –

The following table shows a reconciliation from the beginning balances to the ending
balances for fair value measurement for Financial assets at FVPL in Level 3 of the fair value
hierarchy:
Financialassets at FVPL
USD’000
As at January 1, 2018 37,510Net realized and unrealized gains on financial assets at FVPL (83)Purchases 44,395Sales and settlements (56,602)Exchange difference (1,704)
As at December 31, 2018 and January 1, 2019 23,516
Net realized and unrealized gains on financial assets at FVPL (41)Purchases 141,906Sales and settlements (134,125)Disposal of subsidiaries (10,546)Exchange difference 141
As at December 31, 2019 and January 1, 2020 20,851
Net realized and unrealized losses on financial assets at FVPL 165Purchases 133,541Sales and settlements (144,080)Exchange difference 744
As at December 31, 2020 and January 1, 2021 11,221
Net realized and unrealized losses on financial assets at FVPL 454Purchases 123,263Sales and settlements (125,480)Disposal of subsidiaries (474)Exchange difference (261)
As at June 30, 2021 8,723
Trade receivables carried at FVOCI are not materially different from their values as at
December 31, 2018, 2019 and 2020 and June 30, 2021.
All financial instruments carried at cost or amortized cost are at amounts not materially
different from their values as at December 31, 2018, 2019 and 2020 and June 30, 2021.
APPENDIX I ACCOUNTANTS’ REPORT
– I-116 –

38 Capital commitments
Capital commitments outstanding at the respective year/period end not provided for in the HistoricalFinancial Information are as follows:
At December 31, At June 30,
2018 2019 2020 2021
USD’000 USD’000 USD’000 USD’000
Contracted for 54,076 49,536 47,326 38,897Authorised but not contracted for – – 2,153 459,515
54,076 49,536 49,479 498,412
Represented by:Construction of plant andbuildings 52,507 48,547 46,900 492,813Acquisition of machinery andequipment 1,569 989 2,579 5,599
54,076 49,536 49,479 498,412
39 Contingent liabilities
(a) Guarantee to Chervon Auto Precision Technology
The Group has issued guarantees in respect of loans made by certain financial institutions tothe Chervon Auto Precision Technology in the Relevant Periods (see Note 40(c))
(b) Guarantee to customers
Guarantees were given by certain subsidiaries in the Group to financial institutions in the PRCfor certain indebtedness of independent third-party customers of the Group. The maximum exposuresto the Group are limited to the facilities granted to individual customer. Details of guarantee tocustomers are set out below:
2018 2019 2020Six months ended
June 30, 2021
Maximumguarantee
amountGuarantee
issued
Maximumguarantee
amountGuarantee
issued
Maximumguarantee
amountGuarantee
issued
Maximumguarantee
amountGuarantee
issued
USD’000 USD’000 USD’000 USD’000 USD’000 USD’000 USD’000 USD’000
Bank A – – – – 8,429 1,137 8,514 2,174Bank B 874 718 1,003 942 1,379 790 1,393 768
874 718 1,003 942 9,808 1,927 9,907 2,942
APPENDIX I ACCOUNTANTS’ REPORT
– I-117 –

40 Material related party transactions
(a) Key management personnel remuneration
Remuneration for key management personnel of the Group, including amounts paid to theCompany’s directors as disclosed in Note 8 and certain of the highest paid employees as disclosedin Note 9, is as follows:
Year ended December 31,Six months ended
June 30,
2018 2019 2020 2020 2021
USD’000 USD’000 USD’000 USD’000 USD’000(unaudited)
Short-term employee benefits 3,364 3,728 4,471 1,633 1,837Contributions to definedcontribution retirement plans 189 177 159 88 132Equity settled share-basedpayment expenses – – 2,877 – –
3,553 3,905 7,507 1,721 1,969
Total remuneration is included in “staff costs” (see Note 6(b)).
(b) Names and relationships of the related parties that had other material transactions with theGroup during the Track Record Period:
Name of related party Relationship
Mr. Pan Longquan Ultimate controlling shareholder of the GroupMs. Zhang Tong Director of the GroupMr. Ke Zuqian Director of the GroupMr. Xiao Jun Director of the GroupNanjing Jiangning Lianshang InvestmentCo., Ltd.
Associate of the Group
Nanjing Chervon Auto Precision TechnologyCo., Ltd.
Associate of the Group
Nanjing Suquan Investment Co., Ltd. Associate of the GroupNanjing Yaoquan Investment ManagementCo., Ltd.
Associate of the Group
Nanjing Bovon Power Tools Co., Ltd. Joint Venture of the GroupCheng and Cheng Corporate ServicesLimited
Controlled by a director of the Group
Cheng and Cheng Taxation Service Limited Controlled by a director of the GroupCheng and Cheng Limited Controlled by a director of the GroupChervon Global Holdings Limited Controlled by the ultimate controlling shareholder of
the GroupChervon Precision Technology HoldingsCo., Ltd.
Controlled by the ultimate controlling shareholder ofthe Group
Nanjing Jiuhao Electromechanical IndustryCo., Ltd.
Controlled by the ultimate controlling shareholder ofthe Group
Chervon (Nanjing) Management ServicesCo., Ltd.
Controlled by the ultimate controlling shareholder ofthe Group
APPENDIX I ACCOUNTANTS’ REPORT
– I-118 –

(c) Guarantees issued by related parties
At December 31, At June 30,
2018 2019 2020 2021
USD’000 USD’000 USD’000 USD’000
Banking facilities granted to
the Group with guarantees and
pledges issued by related
parties 51,254 109,387 151,557 164,798
Pursuant to the agreements on August 18, 2021 and September 9, 2021, guarantees provided by
Mr. Pan Longquan and Chervon Global Holdings Limited have been released. Pursuant to the
agreements on September 9, 2021 and November 23, 2021, pledged shares of Chervon Auto
Precision Technology held by Chervon Precision Technology Holdings Limited have been released.
(d) Guarantees issued to related parties
At December 31, At June 30,
2018 2019 2020 2021
USD’000 USD’000 USD’000 USD’000
Guarantees issued to Nanjing
Chervon Auto Precision
Technology Co., Ltd. 25,322 9,516 8,706 3,096
At December 31, 2018, 2019 and 2020 and June 30, 2021, guarantees were issued to Nanjing
Chervon Auto Precision Technology Co., Ltd. for its bank facilities. All guarantees issued to Nanjing
Chervon Auto Precision Technology Co., Ltd. were released in September 2021.
APPENDIX I ACCOUNTANTS’ REPORT
– I-119 –

(e) Other significant related party transactions
During the years ended December 31, 2018, 2019 and 2020 and the six months ended June 30,
2020 and 2021, the Group had following transactions with related parties:
Year ended December 31,Six months ended
June 30,
2018 2019 2020 2020 2021
USD’000 USD’000 USD’000 USD’000 USD’000(unaudited)
Purchase of goods and serviceNanjing Chervon Auto Precision
Technology Co., Ltd. 58 151 – – –Cheng and Cheng Taxation Service
Limited 10 10 9 6 5Cheng and Cheng Corporate Services
Limited 6 6 6 4 6Cheng and Cheng Limited 1 14 – – –Nanjing Bovon Power Tools Co., Ltd. 4,837 – – – –
4,912 181 15 10 11
Sales of goods and rendering ofservicesNanjing Bovon Power Tools Co., Ltd 6,336 – – – –
Lease payment fromNanjing Chervon Auto Precision
Technology Co., Ltd. 87 53 76 75 155Nanjing Yaoquan Investment
Management Co., Ltd. – 17 17 9 9Nanjing Bovon Power Tools Co., Ltd. 32 – – – –
119 70 93 84 164
Lease payment toNanjing Chervon Auto Precision
Technology Co., Ltd. 443 106 114 8 8
APPENDIX I ACCOUNTANTS’ REPORT
– I-120 –

Year ended December 31,Six months ended
June 30,
2018 2019 2020 2020 2021
USD’000 USD’000 USD’000 USD’000 USD’000(unaudited)
Disposal of interest in subsidiariesand associatesXiao Jun – 1,584 – – –Chervon (Nanjing) Management
Services Co., Ltd. – – – – 33,665
– 1,584 – – 33,665
Acquisition of non-controllinginterestsPan Longquan – – – – 14,236Zhang Tong – – – – 8,514Ke Zuqian – – – – 5,676
– – – – 28,426
Disposal of unlisted units ininvestment fundsChervon Global Holdings Limited – – 8,917 – –
Dividends receivedNanjing Jiangning Lianshang
Investment Co., Ltd. – – 3,162 – –Nanjing Chervon Auto Precision
Technology Co., Ltd. – – 1,005 1,005 540Nanjing Bovon Power Tools Co., Ltd. 1,003 1,018 – – –
1,003 1,018 4,167 1,005 540
Sales of properties, plants andequipmentNanjing Bovon Power Tools Co., Ltd. 1 – – – –
APPENDIX I ACCOUNTANTS’ REPORT
– I-121 –

Year ended December 31,Six months ended
June 30,
2018 2019 2020 2020 2021
USD’000 USD’000 USD’000 USD’000 USD’000(unaudited)
Payments made on behalf ofrelated partiesNanjing Bovon Power Tools Co., Ltd. 30 – – – –Nanjing Chervon Auto Precision
Technology Co., Ltd. 1,775 1,227 1,169 439 387
1,805 1,227 1,169 439 387
Receivables made on behalf ofa related partyNanjing Chervon Auto Precision
Technology Co., Ltd 86 84 110 36 70
Advance to related partiesChervon Global Holdings Limited – – 505 – 781Pan Longquan 7 1 472 – –Zhang Tong 4 – 257 – –
11 1 1,234 – 781
Repayment from related partiesPan Longquan – – – – 508Zhang Tong – – – – 277
– – – – 785
APPENDIX I ACCOUNTANTS’ REPORT
– I-122 –

(f) Significant related party balances
At December 31, 2018, 2019 and 2020 and June 30, 2021, the Group had following in naturebalances with related parties:
At December 31, At June 30,
2018 2019 2020 2021
USD’000 USD’000 USD’000 USD’000
Trade and bills receivablesNanjing Bovon Power Tools Co., Ltd. 144 – – –
Trade and bills payablesNanjing Bovon Power Tools Co., Ltd. 1,836 – – –
Prepayments, deposits and otherreceivables (Non-trade) (Note 24)Nanjing Yaoquan Investment ManagementCo., Ltd. – 9,380 9,475 –Chervon Global Holdings Limited – – 9,502 1,303Nanjing Bovon Power Tools Co., Ltd. 47 – – –Pan Longquan 7 8 556 –Zhang Tong 4 4 302 –Xiao Jun – 1,567 1,652 –
58 10,959 21,487 1,303
Other payables and accruals(Non-trade) (Note 29)Pan Longquan 3,853 3,658 3,980 –Zhang Tong 2,025 1,925 2,094 –Nanjing Suquan Investment Co., Ltd – 1,887 2,042 –Chervon Global Holdings Limited 71 688 135 –Nanjing Jiuhao ElectromechanicalIndustry Co., Ltd. – – – 2,441Nanjing Jiangning Lianshang InvestmentCo., Ltd. – 7,040 – –
5,949 15,198 8,251 2,441
Guarantees issued to Nanjing ChervonAuto Precision Technology Co., Ltd.
71,626 35,667 9,196 –
APPENDIX I ACCOUNTANTS’ REPORT
– I-123 –
The directors of the Company confirm that the non-trade balance will be settled before thelisting of the Company’s shares on the Stock Exchange.
41 Immediate and ultimate controlling party
At June 30, 2021, the directors of the Company consider the immediate parent of the Group is
Panmercy Holdings Limited, a company incorporated in Hong Kong, while as at December 31, 2018, 2019
and 2020, the immediate parent of the Group is Chervon Global Holdings Limited, a company
incorporated in BVI.
The ultimate controlling party of the Group is Mr. Pan Longquan, Chairman of the Group. Panmercy
Holdings Limited and Chervon Global Holdings Limited do not produce financial statements available for
public use.
42 Possible impact of amendments, new standards and interpretations issued but not yet effectivefor year ended December 31, 2021
Up to date of issue of the Historical Financial Information, the HKICPA has issued a number of
amendments and a new standard, HKFRS 17, Insurance Contracts, which are not yet effective for the
Relevant Periods and which have not been adopted in the Historical Financial Information. These include
the following which may be relevant to the Group.
Effective foraccounting periods
beginning on or after
Amendments to HKFRS 3, Reference to the conceptual framework 1 January 2022
Amendments to HKAS 16, Property, plant and equipment: Proceeds before
Intended Use
1 January 2022
Amendments to HKAS 37, Onerous contracts – cost of fulfilling a contract 1 January 2022
Annual improvements to HKFRSs 2018-2020 cycle 1 January 2022
Amendments to HKAS 1, Classification of liabilities as current or non-current 1 January 2023
Amendments to HKAS 1 and HKFRS Practice Statement 2, Disclosure of
accounting policies
1 January 2023
Amendments to HKAS 8, Definition of accounting estimates 1 January 2023
Amendments to HKAS 12, Deferred tax related to assets and liabilities arising
from a single transaction
1 January 2023
The Group is in the process of making an assessment of what the impact of these developments is
expected to be in the period of initial application. So far it has concluded that the adoption of them is
unlikely to have a significant impact on the consolidated financial statements.
APPENDIX I ACCOUNTANTS’ REPORT
– I-124 –

43 Subsequent events
On August 3, 2021, Chervon Auto Precision Technology announced that it has obtained approval
from the CSRC to issue public A-share convertible bonds in an aggregate principal amount of
RMB620,000,000 (US$95,900,000) with a maturity date on the sixth year after the date of issuance.
Pursuant to the terms of the convertible bond offering, an existing shareholder of Chervon Auto Precision
Technology has pre-emptive rights to subscribe for the convertible bonds in an amount up to the
proportional interests of such shareholder in Chervon Auto Precision Technology. As of September 30,
2021, Chervon (China) Investment, which is our wholly-owned subsidiary and owns 23.12% of Chervon
Auto Precision Technology, has exercised and paid for such pre-emptive rights to subscribe for
RMB118,500,000 (US$18,300,000) of the principal amount of the convertible bond. As the convertible
bonds may not be converted for a period of six months from the date of completion, Chervon (China)
Investment cannot and does not intend to convert such convertible bonds before the completion of the
Global Offering.
SUBSEQUENT FINANCIAL STATEMENTS
No audited financial statements have been prepared by the Company and its subsidiaries in respect
of any period subsequent to June 30, 2021.
APPENDIX I ACCOUNTANTS’ REPORT
– I-125 –
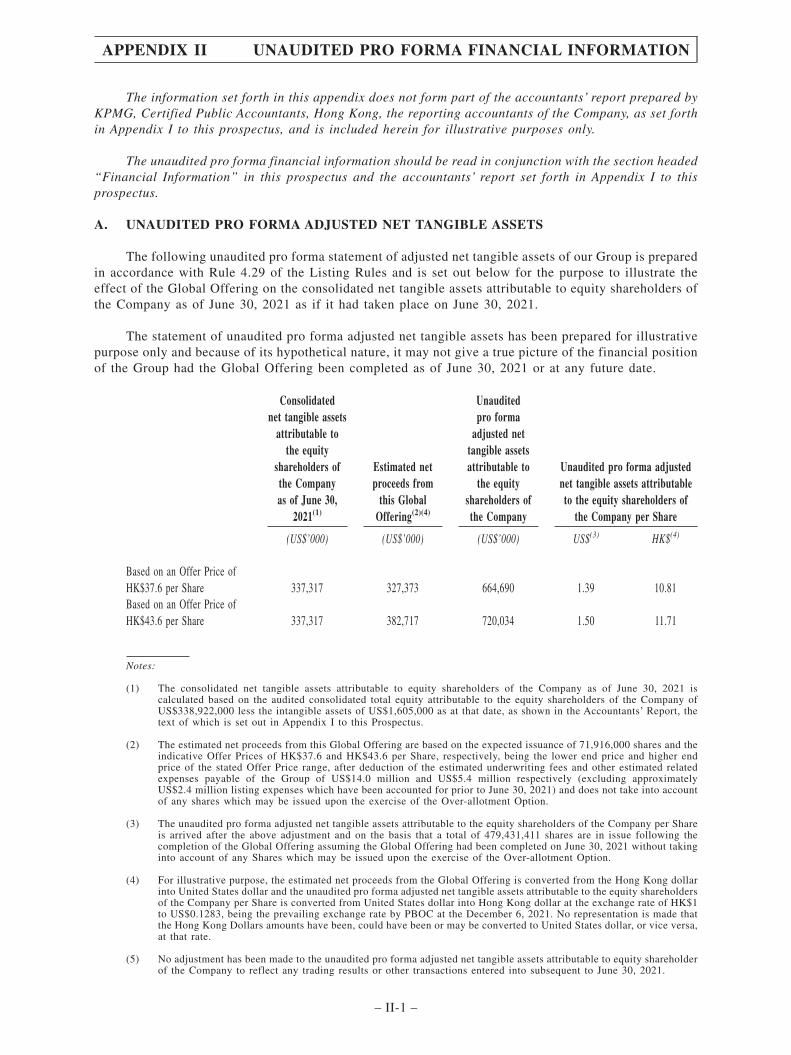
The information set forth in this appendix does not form part of the accountants’ report prepared byKPMG, Certified Public Accountants, Hong Kong, the reporting accountants of the Company, as set forthin Appendix I to this prospectus, and is included herein for illustrative purposes only.
The unaudited pro forma financial information should be read in conjunction with the section headed“Financial Information” in this prospectus and the accountants’ report set forth in Appendix I to thisprospectus.
A. UNAUDITED PRO FORMA ADJUSTED NET TANGIBLE ASSETS
The following unaudited pro forma statement of adjusted net tangible assets of our Group is preparedin accordance with Rule 4.29 of the Listing Rules and is set out below for the purpose to illustrate theeffect of the Global Offering on the consolidated net tangible assets attributable to equity shareholders ofthe Company as of June 30, 2021 as if it had taken place on June 30, 2021.
The statement of unaudited pro forma adjusted net tangible assets has been prepared for illustrativepurpose only and because of its hypothetical nature, it may not give a true picture of the financial positionof the Group had the Global Offering been completed as of June 30, 2021 or at any future date.
Consolidatednet tangible assets
attributable tothe equity
shareholders ofthe Companyas of June 30,
2021(1)
Estimated netproceeds from
this GlobalOffering(2)(4)
Unauditedpro forma
adjusted nettangible assetsattributable to
the equityshareholders ofthe Company
Unaudited pro forma adjustednet tangible assets attributableto the equity shareholders of
the Company per Share
(US$’000) (US$’000) (US$’000) US$(3) HK$(4)
Based on an Offer Price ofHK$37.6 per Share 337,317 327,373 664,690 1.39 10.81Based on an Offer Price ofHK$43.6 per Share 337,317 382,717 720,034 1.50 11.71
Notes:
(1) The consolidated net tangible assets attributable to equity shareholders of the Company as of June 30, 2021 iscalculated based on the audited consolidated total equity attributable to the equity shareholders of the Company ofUS$338,922,000 less the intangible assets of US$1,605,000 as at that date, as shown in the Accountants’ Report, thetext of which is set out in Appendix I to this Prospectus.
(2) The estimated net proceeds from this Global Offering are based on the expected issuance of 71,916,000 shares and theindicative Offer Prices of HK$37.6 and HK$43.6 per Share, respectively, being the lower end price and higher endprice of the stated Offer Price range, after deduction of the estimated underwriting fees and other estimated relatedexpenses payable of the Group of US$14.0 million and US$5.4 million respectively (excluding approximatelyUS$2.4 million listing expenses which have been accounted for prior to June 30, 2021) and does not take into accountof any shares which may be issued upon the exercise of the Over-allotment Option.
(3) The unaudited pro forma adjusted net tangible assets attributable to the equity shareholders of the Company per Shareis arrived after the above adjustment and on the basis that a total of 479,431,411 shares are in issue following thecompletion of the Global Offering assuming the Global Offering had been completed on June 30, 2021 without takinginto account of any Shares which may be issued upon the exercise of the Over-allotment Option.
(4) For illustrative purpose, the estimated net proceeds from the Global Offering is converted from the Hong Kong dollarinto United States dollar and the unaudited pro forma adjusted net tangible assets attributable to the equity shareholdersof the Company per Share is converted from United States dollar into Hong Kong dollar at the exchange rate of HK$1to US$0.1283, being the prevailing exchange rate by PBOC at the December 6, 2021. No representation is made thatthe Hong Kong Dollars amounts have been, could have been or may be converted to United States dollar, or vice versa,at that rate.
(5) No adjustment has been made to the unaudited pro forma adjusted net tangible assets attributable to equity shareholderof the Company to reflect any trading results or other transactions entered into subsequent to June 30, 2021.
APPENDIX II UNAUDITED PRO FORMA FINANCIAL INFORMATION
– II-1 –
The following is the text of a report received from the reporting accountants, KPMG, Certified Public
Accountants, Hong Kong, in respect of the Group’s pro forma financial information for the purpose in this
prospectus.
B. INDEPENDENT REPORTING ACCOUNTANTS’ ASSURANCE REPORT ON THECOMPILATION OF PRO FORMA FINANCIAL INFORMATION
To the Directors of Chervon Holding Limited
We have completed our assurance engagement to report on the compilation of pro forma financial
information of Chervon Holdings Limited. (the “Company”) and its subsidiaries (collectively the
“Group”) by the directors of the Company (the “Directors”) for illustrative purposes only. The unaudited
pro forma financial information consists of the unaudited pro forma statement of adjusted net tangible
assets as at June 30, 2021 and related notes as set out in Part A of Appendix II in this prospectus dated
December 17, 2021 (the “Prospectus”) issued by the Company. The applicable criteria on the basis of
which the Directors have compiled the pro forma financial information are described in Part A of Appendix
II in this prospectus.
The pro forma financial information has been compiled by the Directors to illustrate the impact of
the proposed offering of the ordinary shares of the Company (the “Global Offering”) on the Group’s
financial position as at June 30, 2021 as if the Global Offering had taken place at June 30, 2021. As part
of this process, information about the Group’s financial position as at June 30, 2021 has been extracted
by the Directors from the Group’s historical financial information included in the Accountants’ Report as
set out in Appendix I in this Prospectus.
Directors’ Responsibilities for the Pro Forma Financial Information
The Directors are responsible for compiling the pro forma financial information in accordance with
paragraph 4.29 of the Rules Governing the Listing of Securities on The Stock Exchange of Hong Kong
Limited (the “Listing Rules”) and with reference to Accounting Guideline 7 “Preparation of Pro Forma
Financial Information for Inclusion in Investment Circulars” (“AG 7”) issued by the Hong Kong Institute
of Certified Public Accountants (“HKICPA”).
Our Independence and Quality Control
We have complied with the independence and other ethical requirements of the Code of Ethics for
Professional Accountants issued by the HKICPA, which is founded on fundamental principles of integrity,
objectivity, professional competence and due care, confidentiality and professional behaviour.
The firm applies Hong Kong Standard on Quality Control 1 “Quality Control for Firms That Perform
Audits and Reviews of Financial Statements, and Other Assurance and Related Services Engagements”
issued by the HKICPA and accordingly maintains a comprehensive system of quality control including
documented policies and procedures regarding compliance with ethical requirements, professional
standards and applicable legal and regulatory requirements.
APPENDIX II UNAUDITED PRO FORMA FINANCIAL INFORMATION
– II-2 –
Reporting Accountants’ Responsibilities
Our responsibility is to express an opinion, as required by paragraph 4.29(7) of the Listing Rules,
on the pro forma financial information and to report our opinion to you. We do not accept any
responsibility for any reports previously given by us on any financial information used in the compilation
of the pro forma financial information beyond that owed to those to whom those reports were addressed
by us at the dates of their issue.
We conducted our engagement in accordance with Hong Kong Standard on Assurance Engagements
(“HKSAE”) 3420 “Assurance Engagements to Report on the Compilation of Pro Forma Financial
Information Included in a Prospectus” issued by the HKICPA. This standard requires that the reporting
accountants plan and perform procedures to obtain reasonable assurance about whether the Directors have
compiled the pro forma financial information in accordance with paragraph 4.29 of the Listing Rules, and
with reference to AG 7 issued by the HKICPA.
For purpose of this engagement, we are not responsible for updating or reissuing any reports or
opinions on any historical financial information used in compiling the pro forma financial information, nor
have we, in the course of this engagement, performed an audit or review of the financial information used
in compiling the pro forma financial information.
The purpose of pro forma financial information included in an investment circular is solely to
illustrate the impact of a significant event or transaction on unadjusted financial information of the Group
as if the event had occurred or the transaction had been undertaken at an earlier date selected for purposes
of the illustration. Accordingly, we do not provide any assurance that the actual outcome of events or
transactions as at June 30, 2021 would have been as presented.
A reasonable assurance engagement to report on whether the pro forma financial information has
been properly compiled on the basis of the applicable criteria involves performing procedures to assess
whether the applicable criteria used by the Directors in the compilation of the pro forma financial
information provide a reasonable basis for presenting the significant effects directly attributable to the
event or transaction, and to obtain sufficient appropriate evidence about whether:
• the related pro forma adjustments give appropriate effect to those criteria; and
• the pro forma financial information reflects the proper application of those adjustments to the
unadjusted financial information.
The procedures selected depend on the reporting accountants’ judgement, having regard to the
reporting accountants’ understanding of the nature of the Group, the event or transaction in respect of
which the pro forma financial information has been compiled, and other relevant engagement
circumstances.
The engagement also involves evaluating the overall presentation of the pro forma financial
information.
We believe that the evidence we have obtained is sufficient and appropriate to provide a basis for
our opinion.
APPENDIX II UNAUDITED PRO FORMA FINANCIAL INFORMATION
– II-3 –

Our procedures on the pro forma financial information have not been carried out in accordance with
attestation standards or other standards and practices generally accepted in the United States of America,
auditing standards of the Public Company Accounting Oversight Board (United States) or any overseas
standards and accordingly should not be relied upon as if they had been carried out in accordance with
those standards and practices.
We make no comments regarding the reasonableness of the amount of net proceeds from the issuance
of the Company’s shares, the application of those net proceeds, or whether such use will actually take
place as described in the section headed “Future Plans and Use of Proceeds” in this prospectus.
Opinion
In our opinion:
(a) the pro forma financial information has been properly compiled on the basis stated;
(b) such basis is consistent with the accounting policies of the Group; and
(c) the adjustments are appropriate for the purposes of the pro forma financial information as
disclosed pursuant to paragraph 4.29(1) of the Listing Rules.
KPMG
Certified Public Accountants
8th Floor, Prince’s Building
10 Chater Road
Central, Hong Kong
December 17, 2021
APPENDIX II UNAUDITED PRO FORMA FINANCIAL INFORMATION
– II-4 –
This Appendix contains a summary of the Articles of Association of our Company. As the information
set out below is in summary form, it does not contain all of the information that may be important to
potential investors. A copy of the Articles of Association will be published on the websites specified in
“Documents Delivered to the Registrar of Companies and Documents on Display” in Appendix V to this
prospectus.
The Articles of Association were adopted on December 8, 2021 and will become effective from the
date on which this prospectus and GREEN Application Form (together with the other documents required)
are submitted to the Registrar of Companies in Hong Kong. The following is a summary of certain
provisions of the Articles of Association. The powers conferred or permitted by the Articles of Association
are subject to the provisions of the Companies Ordinance, the Companies (Winding Up and Miscellaneous
Provisions) Ordinance, other ordinances and subsidiary legislation and the Listing Rules.
CHANGES IN CAPITAL
Our Company may from time to time by ordinary resolution alter its share capital in any one or more
of the ways set out in section 170 of the Companies Ordinance, including but not limited to:
(a) increasing its share capital by allotting and issuing new shares in accordance with the
Companies Ordinance;
(b) increasing its share capital without allotting and issuing new shares, if the funds or other assets
for the increase are provided by the members of our Company;
(c) capitalizing its profits, with or without allotting and issuing new shares;
(d) allotting and issuing bonus shares with or without increasing its share capital;
(e) converting all or any of its shares into a larger or smaller number of existing shares;
(f) dividing its shares into several classes and attaching thereto respectively any preferential,
deferred, qualified or special rights, privileges or conditions, provided always that where our
Company issues shares which do not carry voting rights, the words “non-voting” shall appear
in the designation of such shares and where the equity capital includes shares with different
voting rights, the designation of each class of shares, other than those with the most favorable
voting rights, must include the words “restricted voting” or “limited voting”;
(g) cancelling shares:
(i) that, at the date of the passing of the passing of the resolution for cancellation, have not
been taken or agreed to be taken by any person; or
(ii) that have been forfeited; or
(h) making provision for the issue and allotment of shares which do not carry any voting rights.
Our Company may by special resolution reduce its share capital subject to any conditions prescribed
by law.
APPENDIX III SUMMARY OF ARTICLES OF ASSOCIATION
– III-1 –
MODIFICATION OF RIGHTS
Subject to the provisions of the Companies Ordinance, all or any of the special rights attached to any
class of shares (unless otherwise provided for by the terms of issue of the shares of that class) for the time
being in issue may, at any time, as well before as during liquidation, be altered or abrogated either with
the consent in writing of the holders of not less than three-fourths of the issued shares of that class or with
the sanction of a special resolution passed at a separate general meeting of the holders of shares of that
class, and all the provisions contained in the Articles of Association relating to the general meetings shall
mutatis mutandis apply to every such meeting, except that (a) the quorum thereof shall be not less than
two persons holding or representing by proxy one third of the total voting rights of holders of shares of
the class, and that (b) any holder of shares of that class present in person or by proxy may demand a poll.
The provisions of the foregoing Article shall apply to the variation or abrogation of the special rights
attached to some only of the shares of any class as if each group of shares of the class differently treated
formed a separate class the rights whereof are to be varied.
The special rights conferred upon the holders of the shares or class of shares shall not, unless
otherwise expressly provided in the rights attaching to or the terms of issue of such shares, be deemed to
be altered by the creation or issue of further shares ranking pari passu with them.
TRANSFER OF SHARES
The right of members to transfer their fully-paid shares shall not be restricted (except where
permitted by the Stock Exchange) and shall also be free from all lien.
The instrument of transfer of any shares in our Company shall be in writing and in the usual form
or in such other form as the Board may accept and shall be executed by or on behalf of the transferor and
by or on behalf of the transferee. The instrument of transfer may be executed by hand only or, if the
transferor or transferee is a Clearing House (or its nominee), by hand or by machine imprinted signature
or by such other manner of execution as the Board may approve from time to time. The transferor shall
remain the holder of the shares concerned until the name of the transferee is entered in the Register in
respect thereof. Nothing in the Articles of Association shall preclude the Board from recognizing a
renunciation of the allotment or provisional allotment of any share by the allottee in favour of some other
person.
Every instrument of transfer and other documents relating to or affecting the title to any shares of
our Company shall be lodged at the Office for registration (or at such other place as the Board may appoint
for such purpose) accompanied by the certificate relating to the shares to be transferred and such other
evidence as the Directors may require in relation thereto.
All instruments of transfer which shall be registered shall be retained by our Company, but save
where fraud is suspected, any instrument of transfer which the Directors refuse to register shall, on
demand, be returned to the person lodging the same.
APPENDIX III SUMMARY OF ARTICLES OF ASSOCIATION
– III-2 –

There shall be paid to our Company in respect of the registration of a transfer and of any grant of
probate or letters of administration, certificate of marriage or death, power of attorney or other document
relating to or affecting the title to any share or for making of any entry in the Register affecting the title
to any share such fee (if any) as the Directors may from time to time require or prescribed, provided that
such fee (if any) shall not exceed the maximum fees as the Stock Exchange may from time to time
prescribe or permit.
GENERAL MEETINGS
Our Company shall in respect of each financial year hold a general meeting as its annual general
meeting in addition to any other meetings in that year. The annual general meeting shall be held within
6 months after the end of each financial year and at such place(s) as may be determined by the Directors.
The Directors may whenever they think fit, and shall on requisition in accordance with the
Companies Ordinance, convene an extraordinary general meeting.
NOTICE OF GENERAL MEETINGS
Subject to section 578 of the Companies Ordinance, an annual general meeting shall be called by not
less than notice in writing of at least 21 days (or such longer period as may be required by the Listing
Rules), and any other general meeting shall be called by not less than notice in writing of at least 14 days
(or such longer period as may be required by the Listing Rules).
Notwithstanding that a meeting of our Company is called by shorter notice than that specified in the
Articles of Association or required by the Companies Ordinance, it shall be deemed to have been duly
called if it is so agreed:
(a) in the case of a meeting called as the annual general meeting, by all the shareholders entitled
to attend and vote thereat; and
(b) in the case of any other meeting, by a majority in number of the shareholders having the right
to attend and vote at the meeting, being a majority together holding not less than 95% of the
shares giving that right.
The accidental omission to give any notice or to send any instrument of proxy to, or the non-receipt
of any notice or any instrument of proxy by, any person entitled to receive notice shall not invalidate any
resolution passed or any proceeding at any such meeting.
Subject to sections 576 and 578 of the Companies Ordinance, the notice shall specify the place(s),
date and time of a meeting. The notice convening an annual general meeting shall specify the meeting as
such, and the notice convening a meeting to pass a special resolution shall specify the intention to propose
the resolution as a special resolution. There shall appear on every such notice with reasonable prominence
a statement that a member entitled to attend and vote is entitled to appoint one or more proxies to attend
and vote instead of him and that a proxy needs not be a member of our Company.
APPENDIX III SUMMARY OF ARTICLES OF ASSOCIATION
– III-3 –

VOTING AT GENERAL MEETINGS
Subject to the provisions of the Companies Ordinance, the Articles of Association and to any specialrights, privileges or restrictions as to voting for the time being attached to any class or classes of shares,every member who (being an individual) is present in person or (being a corporation) is present by arepresentative duly authorized at any general meeting shall be entitled, on a show of hands, to one voteonly and, on a poll, to one vote for every fully paid-up share of which he is the holder.
On a poll, votes may be given either personally or by proxy or (in the case of a corporate member)by a duly authorized representative. A member entitled to more than one vote need not use all his votesor cast all the votes he uses in the same way.
In the case of joint holders, the vote of the senior who tenders a vote, whether in person or by proxy,shall be accepted to the exclusion of the votes of the other joint holders, and seniority shall be determinedby the order in which the names stand in the Register in respect of such share.
Where a member is, under the Listing Rules, required to abstain from voting on any resolution orrestricted to voting only for or only against any resolution, any vote cast by or on behalf of such memberin contravention of such requirement or restriction shall not be counted.
DIRECTORS NEED NOT BE MEMBERS
A Director shall not be required to hold any Shares. A Director who is not a Shareholder shallnevertheless be entitled to attend and speak at general meetings.
BORROWING POWERS
The Directors may exercise all the powers of our Company to borrow money and to mortgage orcharge all or any part of the undertaking, property and assets (present and future) and uncalled capital ofour Company and to issue debentures, debenture stocks, bonds and other securities, whether outright oras collateral security for any debt, liability or obligation of our Company or of any third party.
APPOINTMENT, REMOVAL AND RETIREMENT OF DIRECTORS
Our Board shall have power from time to time and at any time to appoint any person as a Directoreither to fill a casual vacancy or as an addition to our Board.
No person (other than a Director retiring in accordance with the Articles of Association) shall, unlessrecommended by the Board for re-election, be eligible for election to the office of Director at any generalmeeting under the last paragraph unless:
(a) he is recommended by the Board for re-election; or
(b) he is nominated by notice in writing by a member (other than the person to be proposed)entitled to attend and vote at the meeting, and such notice of nomination shall be given to theCompany Secretary within the seven-day period (or a longer period as may be determined bythe Directors from time to time) commencing no earlier than the day after the despatch of thenotice of such meeting and ending no later than seven days prior to the date appointed for suchmeeting. The notice of nomination shall be accompanied by a notice signed by the proposedcandidate indicating his willingness to be appointed or re-appointed.
APPENDIX III SUMMARY OF ARTICLES OF ASSOCIATION
– III-4 –

Without prejudice to the power of our Company in general meeting in accordance with any of the
provisions of the Articles of Association to appoint any person to be a Director, the Board shall have
power, exercisable at any time and from time to time, to appoint any other person as a Director, either to
fill a casual vacancy or as an addition to the Board, provided that the number of Directors so appointed
shall not exceed the maximum number determined from time to time (if any) by the shareholders in general
meeting. Any Director so appointed shall hold office only until the next following annual general meeting
of our Company and shall then be eligible for reelection, but shall not be taken into account in determining
the Directors or the number of Directors who are to retire by rotation at each annual general meeting.
Our Company may, at any general meeting convened and held in accordance with the Companies
Ordinance, by ordinary resolution remove any Director before the expiration of his period of service
notwithstanding anything in the Articles of Association or in any agreement between him and our
Company (but without prejudice to any claim he may have for damages for termination of such agreement
not in accordance with its terms), and may, if thought fit, by ordinary resolution appoint another person
in his stead. Any person so elected shall hold office for such time only as the Director in whose place he
is elected would have held the same if he had not been removed.
The office of a Director shall ipso facto be vacated:
(a) if he ceases to be a Director by virtue of any provision of the Companies Ordinance or the
Companies (Winding Up and Miscellaneous Provisions) Ordinance or he becomes prohibited
from being a Director by laws;
(b) if he becomes bankrupt or has a receiving order made against him or suspends payment or
compounds with his creditors generally;
(c) if he is, or may be, suffering from mental disorder and an order is made by a court claiming
jurisdiction in that behalf (whether in Hong Kong or elsewhere) in matters concerning mental
disorder for his detention or for the appointment of a receiver, curator bonis or other person
by whatever name called to exercise powers with respect to his property or affairs; or
(d) if he is absent from meetings of the Board during a continuous period of six months without
special leave of absence from the Board, and his alternate Director(if any) shall not during such
period have attended such meetings in his stead, and the Board passes a resolution that he has
by reason of such absence vacated his office; or
(e) if he is removed from office by notice in writing served upon him signed by all other Directors;
(f) if he serves on our Company notice of his wish to resign, in which case he shall vacate office
on the service of such notice to our Company or such later time as is specified in such notice;
(g) if he is removed by ordinary resolution in accordance with the Companies Ordinance; or
(h) if he is convicted of an indictable offence.
If the office of a Director is vacated for any reason, he shall cease to be a member of any committee
or sub-committee appointed by the Board.
APPENDIX III SUMMARY OF ARTICLES OF ASSOCIATION
– III-5 –

QUALIFICATION OF DIRECTORS
A Director shall not be required to hold any qualification shares but shall nevertheless be entitled to
attend and speak at all general meeting or meeting of the holders of shares of any class of our Company.
DIRECTORS’ REMUNERATION AND EXPENSES
Our Directors shall be entitled to receive by way of remuneration for their services such sum as shall
from time to time be determined by our Company in general meeting, such sum (unless otherwise directed
by the resolution by which it is voted) to be divided amongst our Directors in such proportions and in such
manner as our Directors may agree, or failing agreement, equally, except that in such event any Director
holding office for less than the whole of the relevant period in respect of which the remuneration is paid
shall only rank in such division in proportion to the time during such period for which he has held office.
The foregoing shall not apply to a Director who holds any salaried employment or office in our Company
except in the case of sums paid in respect of Directors’ fees.
Our Directors shall also be entitled to be reimbursed all travelling, hotel accommodation and other
expenses reasonably incurred by them respectively in or about the performance of their duties as Directors,
including their expenses of travelling to and from board meetings, committee meetings or general
meetings or otherwise incurred whilst engaged on the business of our Company or in the discharge of their
duties as Directors.
Our Board may grant special remuneration to any Director who, at the request of our Company, shall
perform any special or extra services to our Company. Such special remuneration may be made payable
to such Director in addition to or in substitution for his ordinary remuneration (if any) as a Director, and
may, without prejudice to the payment of ordinary remuneration, be made payable by a lump sum or by
way of salary, commission or participation in profits or otherwise as the Board may decide.
DIRECTORS’ INTERESTS
If a Director or a senior management officer or any entity connected with such Director or senior
management officer is in any way, whether directly or indirectly, interested in a transaction, arrangement
or contract or proposed transaction, arrangement or contract with our Company, such Director shall
declare the nature and extent of his interest or his connected entities’ interest at a meeting of the Directors
at which the question of entering into the transaction, arrangement or contract is first taken into
consideration, if he knows his interest then exists, or in any other case as soon as reasonably practicable,
and in any event at the first meeting of Directors after he knows that he is or has become so interested.
Such declaration shall be made in accordance with the Companies Ordinance, the Articles of Association
and any other requirements prescribed by our Company for the declaration of interests of Directors in
force from time to time. References to an entity connected with a Director shall be construed in accordance
with section 486 of the Companies Ordinance.
APPENDIX III SUMMARY OF ARTICLES OF ASSOCIATION
– III-6 –

A general notice in writing given by a Director to the Directors at a meeting of the Directors to the
effect that he is a member or a director of a specified company or firm, and is to be regarded as interested
in any contract, transaction, arrangement or dealing which may, after the date of the notice, be entered into
or made with that company or firm, shall be deemed to be a sufficient declaration of interest in relation
to any contract, transaction, arrangement or dealing so entered into or made if such declaration is made
in accordance with the provisions of the Companies Ordinance.
A Director may:
(a) hold any other office or place of profit under our Company (other than the office of Auditor)
in conjunction with his office of Director for such period and on such terms as the Directors
may determine and may be paid such extra remuneration for so doing as the Directors may
determine, either in addition to or in lieu of any remuneration provided for by or pursuant to
the Articles of Association;
(b) act by himself or his firm in a professional capacity for our Company (other than as Auditor),
and he or his firm shall be entitled to remuneration for professional services as if he were not
a Director; and
(c) continue to be or become a director or other officer of, or otherwise interested in, any company
promoted by our Company or in which our Company may be interested as a shareholder or
otherwise, and no such Director shall be accountable to our Company for any remuneration or
other benefit received by him as a director or officer of, or from his interest in, such other
company. The Directors may exercise the voting powers conferred by the shares in any other
company held or owned by our Company, or exercisable by them as directors of such other
company in such manner in all respects as they think fit (including the exercise thereof in favor
of any resolution appointing themselves or any of them directors, managing directors, joint
managing directors, deputy managing directors or officers of such company) and any Director
may vote in favor of the exercise of such voting rights in the manner aforesaid notwithstanding
that he may be, or is about to be appointed a director or officer of such a company, and that
as such he is or may become interested in the exercise of such voting rights in manner
aforesaid.
Subject to the provisions of the Companies Ordinance, no Director or intended Director shall be
disqualified by his office from contracting with our Company, nor shall any contract, transaction or
arrangement entered into by or on behalf of our Company with any Director or any firm or company in
which any Director is in any way interested be liable to be avoided, nor shall any Director so contracting
or being so interested be liable to account to our Company for any profit, remuneration or other benefits
realized by any such contract, transaction or arrangement by reason only of such Director holding that
office or of any fiduciary relationship thereby established, provided that such Director shall duly declare
the nature and extent of his interest in any contract, transaction or arrangement in accordance with the
Articles of Association.
APPENDIX III SUMMARY OF ARTICLES OF ASSOCIATION
– III-7 –
A Director shall not vote (or be counted in the quorum) on any resolution of the Board in respect of
any contract or transaction or arrangement or proposal in which he or any of his close associates, is to his
knowledge, materially interested, and if he shall do so his vote shall not be counted (nor shall he be
counted in the quorum for that resolution), but this prohibition shall not apply to and the Directors may
vote (and be counted in the quorum) in respect of any resolution concerning any one or more of the
following matters:
(a) the giving by our Company of any security or indemnity to him or any of his close associates
in respect of money lent or obligations incurred or undertaken by him or any of them at the
request of or for the benefit of our Company or any of its subsidiaries;
(b) the giving by our Company of any security or indemnity to a third party in respect of a debt
or obligation of our Company or any of its subsidiaries for which he himself or any of his close
associates has assumed responsibilities in whole or in part whether alone or jointly under a
guarantee or indemnity or by the giving of the security;
(c) any proposal concerning an offering of shares or debentures or other securities of or by our
Company or any other company which our Company may promote or be interested in for
subscription or purchase where he or any of his close associates is or is to be interested as a
participant in the underwriting or sub-underwriting of the offer;
(d) any proposal concerning any other company in which he or his close associates are interested
only, whether directly or indirectly, as an officer or executive or shareholder or in which he or
his close associates are beneficially interested in shares of that company, provided that he and
any of his close associates are not in aggregate beneficially interested in five per cent. or more
of the issued shares of any class of the share capital of such company (or of any third company
through which his interest or that of his close associates is derived) or of the voting rights;
(e) any proposal or arrangement concerning the benefit of employees of our Company or its
subsidiaries including:
(i) the adoption, modification or operation of any employees’ share scheme or any share
incentive or share option scheme under which he or his close associates may benefit; or
(ii) the adoption, modification or operation of a pension fund or retirement, death or
disability benefit scheme which relates both to him, his close associates and employees
of our Company or of any of its subsidiaries and does not provide in respect of him or
his close associates any privilege or advantage not generally accorded to the class of
persons to whom such scheme or fund relates; and
(f) any contract or arrangement in which he or any of his close associates is interested in the same
manner as other holders of shares or debentures or other securities of our Company by virtue
only of his interest in shares or debentures or other securities of our Company.
APPENDIX III SUMMARY OF ARTICLES OF ASSOCIATION
– III-8 –
If any question shall arise at any meeting of the Board as to the materiality of the interest of aDirector (other than the Chairman of the meeting) or as to the entitlement of any Director (other than suchChairman) to vote or be counted in the quorum and such question is not resolved by his voluntarilyagreeing to abstain from voting or not to be counted in the quorum, such question shall be referred to theChairman of the meeting and his ruling in relation to the Director concerned shall be final and conclusiveexcept in a case where the nature or extent of the interest of the Director or any of his close associatesconcerned so far as known to him has not been fairly disclosed to the Board. If any question as aforesaidshall arise in respect of the Chairman of the meeting or any of his close associates, such question shallbe decided by a resolution of the Board (for which purpose such Chairman shall not be counted in thequorum and shall not vote thereon) and such resolution shall be final and conclusive except in a case wherethe nature or extent of the interest of such Chairman so far as known to him has not been fairly disclosedto the Board.
Subject to the provisions of the Companies Ordinance, our Company may by ordinary resolutionsuspend or relax the provisions of the Articles of association to any extent or ratify any transaction notduly authorized by reason of a contravention of Article of Association.
DIVIDENDS
Subject to the provisions of the Companies Ordinance, our Company may by ordinary resolutiondeclare a dividend to be paid to the members, according to their respective right and interests in the profits,and may fix the time for payment of such dividend, but no such dividend shall exceed the amountrecommended by the Directors. No dividend shall be payable except out of the profits or otherdistributable reserves of our Company.
Unless and to the extent that the Articles of Association or the rights attached to any shares or theterms of issue thereof otherwise provide, all dividends shall (as regards any shares not fully paidthroughout the period in respect of which the dividend is paid) be apportioned and paid pro rata accordingto the amounts paid on the shares during any portion or portions of the period in respect of which thedividend is paid. No amount paid on a share in advance of calls shall be treated as paid on the share.
The Directors may, if they think fit, from time to time, resolve to pay to the members such interimdividends as appear to the Directors to be justified. If at any time the share capital of our Company isdivided into different classes the Directors may resolve to pay such interim dividends in respect of thoseshares in the capital of our Company which confer on the holders thereof deferred or non-preferred rightsas well as in respect of those shares which confer on the holders thereof preferential or special rights inregard to dividends, and provided that the Directors act bona fide they shall not incur any responsibilityto the holders of shares conferring a preference for any damage that they may suffer by reason of thepayment of an interim dividend on any share having deferred or non-preferred rights. The Directors mayalso resolve to pay at half-yearly or at other suitable intervals to be settled by them any dividend whichmay be payable at a fixed rate if they are of the opinion that the payment is justified.
The Board can offer Shareholders the right to choose to receive extra Shares, which are credited asfully paid up, instead of some or all of their cash dividends. The basis of such allotment shall bedetermined by the Board and the Board shall give notice in writing to the Shareholders of their rights ofelection accorded to them and shall send with such notice forms of election and specify the procedure tobe followed and the place at which and the latest date and time by which duly completed forms of electionmust be lodged in order to be effective. The Shares allotted shall rank pari passu in all respects with thefully paid Shares then in issue save only as regards participation in the relevant dividends or any otherdistributions, bonuses or rights paid, made, declared or announced prior to or contemporaneously with thepayment or declaration of the relevant dividends.
APPENDIX III SUMMARY OF ARTICLES OF ASSOCIATION
– III-9 –

The Directors may distribute in specie or in kind among the members in satisfaction in whole or in
part of any dividend, any of the assets of our Company, and in particular any shares or securities of other
companies to which our Company is entitled, and where any difficulty arises in regard to the distribution
the Board may settle the same as it thinks expedient, and in particular may issue fractional certificates,
disregard fractional entitlements or round the same up or down, and may fix the value for distribution of
such specific assets, or any part thereof, and may determine that cash payments shall be made to any
member upon the footing of the value so fixed in order to adjust the rights of all parties, and may vest any
such specific assets in trustees as may seem expedient to the Board and may appoint any person to sign
any requisite instrument(s) of transfer and other documents on behalf of the persons entitled to the
dividends and such appointment shall be effective. Where required, a contract shall be filed in accordance
with the provisions of the Companies Ordinance and the Board may appoint any person to sign such
contract on behalf of the persons entitled to the dividends and such appointment shall be effective.
UNTRACEABLE SHAREHOLDERS
Without prejudice to the rights of our Company and the provisions under the Articles of Association,
our Company may cease sending cheques for dividend entitlements or dividend warrants by post if such
cheques or warrants have been left uncashed on two consecutive occasions. However, our Company may
exercise the power to cease sending cheques for dividend entitlements or dividend warrants after the first
occasion on which such a cheque or warrant is returned undelivered.
Our Company shall have the power to sell, in such manner as our Board thinks fit, any shares of a
shareholder who is untraceable, but no such sale shall be made unless:
(a) all cheques or warrants for any sum payable in cash to the holder of such shares in respect of
them sent during the relevant period in the manner authorized by the Articles of Association
of our Company have remained uncashed for a total of not less than three times;
(b) so far as it is aware at the end of the relevant period, our Company has not at any time during
the relevant period received any indication of the existence of the shareholder who is the holder
of such shares or of a person entitled to such shares by death, bankruptcy or otherwise; and
(c) our Company has caused an advertisement to be inserted in an English language newspaper and
a Chinese language newspaper giving notice of its intention to sell such shares and has notified
the Stock Exchange of such intention and a period of three months has elapsed since the date
of such advertisement.
For this purpose, “relevant period” means the period commencing 12 years before the date of
publication of the relevant advertisement and ending at the expiry of the period referred to in that
paragraph.
To give effect to any such sale, our Board may authorize any person to transfer the said shares. The
purchaser shall not be bound to see to the application of the purchase money nor shall his title to the shares
be affected by any irregularity or invalidity in the proceedings relating to the sale. The net proceeds of the
sale will belong to our Company and upon receipt by our Company of such net proceeds it shall become
APPENDIX III SUMMARY OF ARTICLES OF ASSOCIATION
– III-10 –
indebted to the former shareholder for an amount equal to such net proceeds. No trust shall be created in
respect of such debt and no interest shall be payable in respect of it, and our Company shall not be required
to account for any money earned from the net proceeds which may be employed in the business of our
Company or as it thinks fit.
WINDING UP
If our Company shall be wound up, the surplus assets remaining after payment to all creditors shall
be divided among the members in proportion to the capital paid up on the shares held by them respectively,
and if such surplus assets shall be insufficient to repay the whole of the paid-up capital, they shall be
distributed so that, as nearly as may be, the losses shall be borne by the members in proportion to the
capital paid up on the shares held by them respectively. The winding up is subject to the rights of the
holders of any shares which may be issued on special terms or conditions.
If our Company shall be wound up (whether the liquidation is voluntary, under supervision or by the
court), the liquidator may, with the sanction of a special resolution and any other sanction required by law,
divide among the shareholders in specie or kind the whole or any part of the assets of our Company and
whether the assets shall consist of property of one kind or shall consist of properties of different kinds and
the liquidator may, for such purpose, set such value as he deems fair upon any one or more class or classes
of property to be divided as aforesaid and may determine how such division shall be carried out as between
the shareholders or different classes of shareholders and the shareholders within each class. The liquidator
may, with the like sanction, vest any part of the assets in trustees upon such trusts for the benefit of
shareholders as the liquidator, with the like sanction, shall think fit, but so that no shareholder shall be
compelled to accept any shares or other assets upon which there is a liability.
INDEMNITY
Subject to the provisions of the Companies Ordinance, every Director, Company Secretary or other
officer of our Company shall be entitled to be indemnified out of the assets of our Company against all
costs, charges, expenses, losses and liabilities which he may sustain or incur in or about the execution of
his office or otherwise in relation thereto.
APPENDIX III SUMMARY OF ARTICLES OF ASSOCIATION
– III-11 –
A. FURTHER INFORMATION ABOUT OUR GROUP
1. Incorporation of our Company
Our Company was incorporated in Hong Kong as a private company with limited liability under
the predecessor ordinance of the Companies Ordinance (which was in force from time to time before
March 3, 2014) on February 19, 1999. Our registered office is at Unit 04, 22/F, Saxon Tower, 78
Cheung Shun Street, Lai Chi Kok, Kowloon, Hong Kong. Our Company will change our company
status from a private company to a public company limited by shares from the date on which this
prospectus and GREEN Application Form (together with the other documents required) are
submitted to the Registrar of Companies in Hong Kong following the approval and adoption of the
Articles of Association (which will take effect from the date on which this prospectus and GREENApplication Form (together with the other documents required) are submitted to the Registrar of
Companies in Hong Kong) by our Shareholder(s) by way of resolutions in writing passed on
December 8, 2021.
As our Company was incorporated in Hong Kong, we operate subject to the laws of Hong Kong
and our constitutive documents which comprise the Articles of Association. A summary of our
Articles of Association is set forth in Appendix III to this prospectus.
2. Changes in the Share Capital of Our Company
As of the date of the incorporation of our Company on February 19, 1999, the authorized share
capital of our Company was HK$1,000 divided into 1,000 shares with a par value of HK$1.00 each.
With effect from March 3, 2014, following the Companies Ordinance becoming effective, provisions
in our Articles of Association concerning, among other matters, the authorized share capital and par
value of Shares were abolished.
The following sets out the changes in our Company’s issued share capital within the two years
immediately preceding the date of this prospectus:
(i) On March 17, 2021, our Company allotted and issued an aggregate of 5,844,911 Shares.
The details of the subscribers are as follows:
Name of ShareholderNumber of
Issued Shares
Above Success Developments Limited 24,630Vision Easy Investments Limited 66,369Klamm Limited 400,427Green Hope 1,441,686Francois D Sicart 11,799Nanjing Ruxin Enterprise Management Partnership
(Limited Partnership) 3,900,000
Total 5,844,911
APPENDIX IV STATUTORY AND GENERAL INFORMATION
– IV-1 –
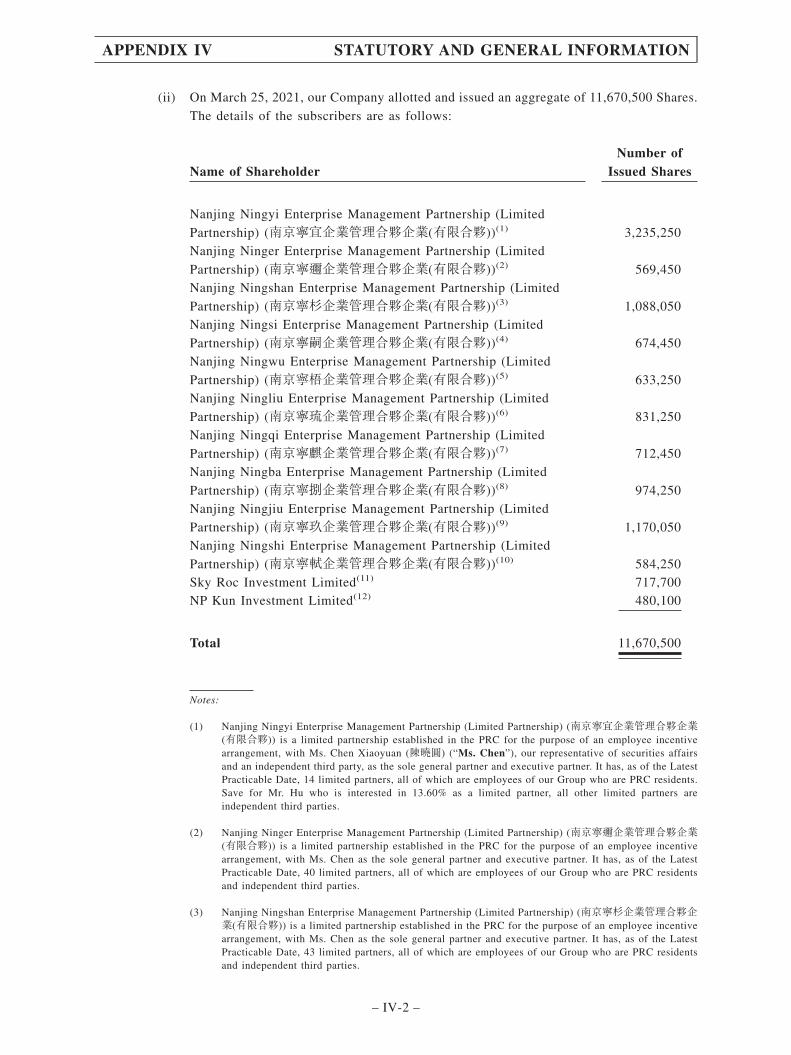
(ii) On March 25, 2021, our Company allotted and issued an aggregate of 11,670,500 Shares.
The details of the subscribers are as follows:
Name of ShareholderNumber of
Issued Shares
Nanjing Ningyi Enterprise Management Partnership (Limited
Partnership) (南京寧宜企業管理合夥企業(有限合夥))(1) 3,235,250Nanjing Ninger Enterprise Management Partnership (Limited
Partnership) (南京寧邇企業管理合夥企業(有限合夥))(2) 569,450Nanjing Ningshan Enterprise Management Partnership (Limited
Partnership) (南京寧杉企業管理合夥企業(有限合夥))(3) 1,088,050Nanjing Ningsi Enterprise Management Partnership (Limited
Partnership) (南京寧嗣企業管理合夥企業(有限合夥))(4) 674,450Nanjing Ningwu Enterprise Management Partnership (Limited
Partnership) (南京寧梧企業管理合夥企業(有限合夥))(5) 633,250Nanjing Ningliu Enterprise Management Partnership (Limited
Partnership) (南京寧琉企業管理合夥企業(有限合夥))(6) 831,250Nanjing Ningqi Enterprise Management Partnership (Limited
Partnership) (南京寧麒企業管理合夥企業(有限合夥))(7) 712,450Nanjing Ningba Enterprise Management Partnership (Limited
Partnership) (南京寧捌企業管理合夥企業(有限合夥))(8) 974,250Nanjing Ningjiu Enterprise Management Partnership (Limited
Partnership) (南京寧玖企業管理合夥企業(有限合夥))(9) 1,170,050Nanjing Ningshi Enterprise Management Partnership (Limited
Partnership) (南京寧軾企業管理合夥企業(有限合夥))(10) 584,250Sky Roc Investment Limited(11) 717,700NP Kun Investment Limited(12) 480,100
Total 11,670,500
Notes:
(1) Nanjing Ningyi Enterprise Management Partnership (Limited Partnership) (南京寧宜企業管理合夥企業(有限合夥)) is a limited partnership established in the PRC for the purpose of an employee incentivearrangement, with Ms. Chen Xiaoyuan (陳曉圓) (“Ms. Chen”), our representative of securities affairsand an independent third party, as the sole general partner and executive partner. It has, as of the LatestPracticable Date, 14 limited partners, all of which are employees of our Group who are PRC residents.Save for Mr. Hu who is interested in 13.60% as a limited partner, all other limited partners areindependent third parties.
(2) Nanjing Ninger Enterprise Management Partnership (Limited Partnership) (南京寧邇企業管理合夥企業(有限合夥)) is a limited partnership established in the PRC for the purpose of an employee incentivearrangement, with Ms. Chen as the sole general partner and executive partner. It has, as of the LatestPracticable Date, 40 limited partners, all of which are employees of our Group who are PRC residentsand independent third parties.
(3) Nanjing Ningshan Enterprise Management Partnership (Limited Partnership) (南京寧杉企業管理合夥企業(有限合夥)) is a limited partnership established in the PRC for the purpose of an employee incentivearrangement, with Ms. Chen as the sole general partner and executive partner. It has, as of the LatestPracticable Date, 43 limited partners, all of which are employees of our Group who are PRC residentsand independent third parties.
APPENDIX IV STATUTORY AND GENERAL INFORMATION
– IV-2 –
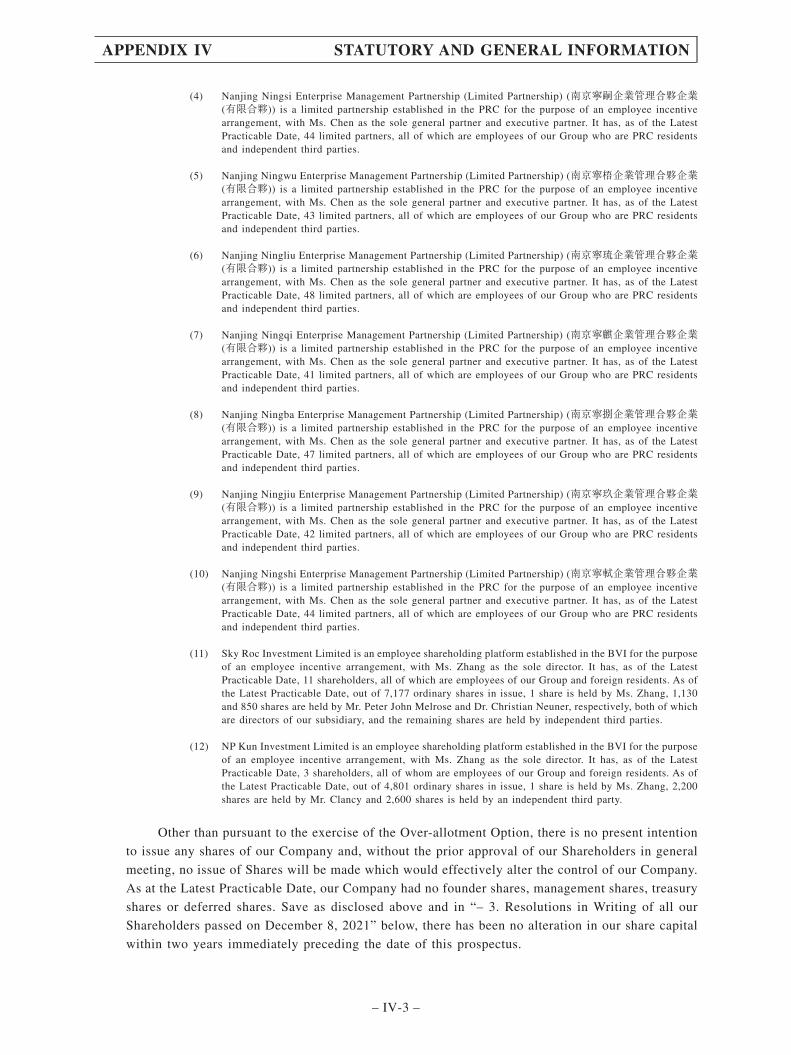
(4) Nanjing Ningsi Enterprise Management Partnership (Limited Partnership) (南京寧嗣企業管理合夥企業(有限合夥)) is a limited partnership established in the PRC for the purpose of an employee incentivearrangement, with Ms. Chen as the sole general partner and executive partner. It has, as of the LatestPracticable Date, 44 limited partners, all of which are employees of our Group who are PRC residentsand independent third parties.
(5) Nanjing Ningwu Enterprise Management Partnership (Limited Partnership) (南京寧梧企業管理合夥企業(有限合夥)) is a limited partnership established in the PRC for the purpose of an employee incentivearrangement, with Ms. Chen as the sole general partner and executive partner. It has, as of the LatestPracticable Date, 43 limited partners, all of which are employees of our Group who are PRC residentsand independent third parties.
(6) Nanjing Ningliu Enterprise Management Partnership (Limited Partnership) (南京寧琉企業管理合夥企業(有限合夥)) is a limited partnership established in the PRC for the purpose of an employee incentivearrangement, with Ms. Chen as the sole general partner and executive partner. It has, as of the LatestPracticable Date, 48 limited partners, all of which are employees of our Group who are PRC residentsand independent third parties.
(7) Nanjing Ningqi Enterprise Management Partnership (Limited Partnership) (南京寧麒企業管理合夥企業(有限合夥)) is a limited partnership established in the PRC for the purpose of an employee incentivearrangement, with Ms. Chen as the sole general partner and executive partner. It has, as of the LatestPracticable Date, 41 limited partners, all of which are employees of our Group who are PRC residentsand independent third parties.
(8) Nanjing Ningba Enterprise Management Partnership (Limited Partnership) (南京寧捌企業管理合夥企業(有限合夥)) is a limited partnership established in the PRC for the purpose of an employee incentivearrangement, with Ms. Chen as the sole general partner and executive partner. It has, as of the LatestPracticable Date, 47 limited partners, all of which are employees of our Group who are PRC residentsand independent third parties.
(9) Nanjing Ningjiu Enterprise Management Partnership (Limited Partnership) (南京寧玖企業管理合夥企業(有限合夥)) is a limited partnership established in the PRC for the purpose of an employee incentivearrangement, with Ms. Chen as the sole general partner and executive partner. It has, as of the LatestPracticable Date, 42 limited partners, all of which are employees of our Group who are PRC residentsand independent third parties.
(10) Nanjing Ningshi Enterprise Management Partnership (Limited Partnership) (南京寧軾企業管理合夥企業(有限合夥)) is a limited partnership established in the PRC for the purpose of an employee incentivearrangement, with Ms. Chen as the sole general partner and executive partner. It has, as of the LatestPracticable Date, 44 limited partners, all of which are employees of our Group who are PRC residentsand independent third parties.
(11) Sky Roc Investment Limited is an employee shareholding platform established in the BVI for the purposeof an employee incentive arrangement, with Ms. Zhang as the sole director. It has, as of the LatestPracticable Date, 11 shareholders, all of which are employees of our Group and foreign residents. As ofthe Latest Practicable Date, out of 7,177 ordinary shares in issue, 1 share is held by Ms. Zhang, 1,130and 850 shares are held by Mr. Peter John Melrose and Dr. Christian Neuner, respectively, both of whichare directors of our subsidiary, and the remaining shares are held by independent third parties.
(12) NP Kun Investment Limited is an employee shareholding platform established in the BVI for the purposeof an employee incentive arrangement, with Ms. Zhang as the sole director. It has, as of the LatestPracticable Date, 3 shareholders, all of whom are employees of our Group and foreign residents. As ofthe Latest Practicable Date, out of 4,801 ordinary shares in issue, 1 share is held by Ms. Zhang, 2,200shares are held by Mr. Clancy and 2,600 shares is held by an independent third party.
Other than pursuant to the exercise of the Over-allotment Option, there is no present intention
to issue any shares of our Company and, without the prior approval of our Shareholders in general
meeting, no issue of Shares will be made which would effectively alter the control of our Company.
As at the Latest Practicable Date, our Company had no founder shares, management shares, treasury
shares or deferred shares. Save as disclosed above and in “– 3. Resolutions in Writing of all our
Shareholders passed on December 8, 2021” below, there has been no alteration in our share capital
within two years immediately preceding the date of this prospectus.
APPENDIX IV STATUTORY AND GENERAL INFORMATION
– IV-3 –
3. Resolutions in Writing of the Shareholders of our Company passed on December 8, 2021
Pursuant to the written resolutions passed by the Shareholders on December 8, 2021, it wasresolved, among others:
(a) the Articles of Association were adopted in substitution of and to the exclusion of theexisting articles of association of our Company with effect from the date on which thisprospectus and GREEN Application Form (together with the other documents required)are submitted to the Registrar of Companies in Hong Kong;
(b) conditional on (i) the Listing Committee of the Stock Exchange granting the approval forthe listing of, and permission to deal in, the Shares in issue and Shares to be issued, (ii)the Offer Price being determined, and (iii) the obligations of the Underwriters under theUnderwriting Agreements becoming unconditional and the Underwriting Agreements notbeing terminated in accordance with their terms or otherwise:
(i) the Global Offering and the Over-allotment Option were approved and our Directorswere authorized to effect the same and to allot and issue the Offer Shares pursuantto the Global Offering and the Over-allotment Option;
(ii) the grant of the Over-allotment Option by our Company to the InternationalUnderwriters, exercisable by the Joint Representatives, pursuant to which the JointRepresentatives (on behalf of the International Underwriters) may require ourCompany to allot and issue up to an aggregate of additional 10,787,400 Shares tocover, among others, the over-allocation in the International Offering was approved;and
(iii) the proposed Listing was approved and our Directors were authorized to implementthe Listing.
(c) a general unconditional mandate was granted to our Directors to allot, issue and deal withShares or securities convertible into Shares or options, warrants or similar rights tosubscribe for Shares or such convertible securities and to make or grant offers,agreements or options which would or might require the exercise of such powers,provided that number of Shares allotted, issued or dealt with or agreed conditionally orunconditionally to be allotted, issued or dealt with by our Directors other than pursuantto (i) a rights issue, (ii) any scrip dividend scheme or similar arrangement providing forthe allotment and issue of Shares in lieu of the whole or part of a dividend on Shares inaccordance with the Articles of Association, (iii) the exercise of any subscription orconversion rights attaching to any warrants or securities which are convertible into Sharesor in issue prior to the date of passing the resolution and (iv) a specific authority grantedby the shareholders of our Company in general meeting, shall not exceed the aggregateof (i) 20% of the total number of the Shares of our Company in issue immediatelyfollowing the completion of the Global Offering (but excluding any Shares which may beissued pursuant to the exercise of the Over-allotment Option) and (ii) the total number ofthe Shares repurchased by the Company (if any) under the general mandate to repurchaseShares as approved by the resolution as described in paragraph (d) and the said approvalshall be limited accordingly, such mandate to remain in effect during the period from thepassing of the resolution until the earliest of (i) the conclusion of our next annual generalmeeting; (ii) the expiration of the period within which we are required by any applicablelaw or the Articles of Association to hold our next annual general meeting; or (iii) the dateon which the resolution is varied or revoked by an ordinary resolution of the Shareholdersin general meeting (the “Applicable Period”);
APPENDIX IV STATUTORY AND GENERAL INFORMATION
– IV-4 –

(d) a general unconditional mandate was granted to our Directors to exercise all powers ofour Company to repurchase on the Stock Exchange or on any other stock exchange onwhich the securities of our Company may be listed and which is recognized by the SFCand the Stock Exchange for this purpose, of Shares with a total number of not more than10% of the total number of the Shares of our Company in issue immediately followingthe completion of the Global Offering (but excluding any Shares which may be issuedpursuant to the exercise of the Over-allotment Option), such mandate to remain in effectduring the Applicable Period; and
(e) the general unconditional mandate mentioned in paragraph (c) above be extended by theaddition to the total number of issued Shares of our Company which may be allotted,issued or dealt with or agreed conditionally or unconditionally to be allotted, issued ordealt with by our Directors pursuant to such general mandate of an amount representingthe total number of issued Shares of our Company repurchased by our Company pursuantto the mandate to repurchase Shares referred to in (d) above, provided that such extendedamount shall not exceed 10% of the total number of Shares in issue immediatelyfollowing the completion of the Global Offering (but excluding any Shares which may beissued pursuant to the exercise of the Over-allotment Option).
4. Our Corporate Reorganization
The companies comprising our Group underwent the Reorganization in preparation for thelisting of its Shares. See the section headed “History, Reorganization and Corporate Structure” in thisprospectus for details.
5. Changes in the Share Capital of Our Subsidiaries
A summary of the corporate information and the particulars of our subsidiaries are listed in theAccountants’ Report set out in Appendix I to this prospectus.
Save as disclosed in the section headed “History, Reorganization and Corporate Structure” andbelow, there has been no alteration in the share capital or the registered capital of any of oursubsidiaries within the two years immediately preceding the date of this prospectus:
(i) Nanjing Chervon Industry
On December 10, 2019, the registered capital of Nanjing Chervon Industry was increasedfrom USD121,111,111 to USD131,111,111.
On March 25, 2021, the registered capital of Nanjing Chervon Industry was increasedfrom USD131,111,111 to USD141,111,111.
On July 1, 2021, the registered capital of Nanjing Chervon Industry was increased fromUSD141,111,111 to USD144,073,464.
(ii) Flex Verwaltungs GmbH & Co. KG
On February 19, 2020, the limited partnership capital contribution of Flex VerwaltungsGmbH & Co. KG was increased from EUR16,000,500 to EUR EUR19,000,500.
APPENDIX IV STATUTORY AND GENERAL INFORMATION
– IV-5 –

(iii) Chervon Industry (Vietnam) Company Limited
On January 21, 2020, Chervon Industry (Vietnam) Company Limited was incorporated by
our Company as a single member limited liability in Vietnam with a registered share capital of
46,600,000,000 Vietnamese Dong.
(iv) FLEX Power Tools Limited
On November 9, 2020, FLEX Power Tools Limited was incorporated by our Company as
a private limited company in the United Kingdom with a registered share capital of 50,000
Great British Pound.
(v) Chervon NZ Subsidiary Limited
On May 3, 2021, Chervon NZ Subsidiary Limited was incorporated by our Company as
a limited liability company in New Zealand with 100 issued shares.
6. Repurchases of Our Own Securities
This section sets out the information required by the Stock Exchange to be included in this
prospectus concerning the repurchase by our Company of its own securities.
(a) Provisions of the Listing Rules
The Listing Rules permit companies whose primary listings are on the Main Board of the
Stock Exchange to repurchase their securities on the Stock Exchange subject to certain
restrictions, the more important of which are summarized below:
(i) Shareholders’ Approval
All proposed repurchases of securities on the Stock Exchange by a company with
a primary listing on the Stock Exchange must be approved in advance by an ordinary
resolution of shareholders, either by way of general mandate or by specific approval of
a particular transaction. Pursuant to the resolutions in writing of our Shareholders passed
on December 8, 2021, a general unconditional mandate (the “Repurchase Mandate”)
was granted to our Directors authorizing the repurchase by our Company on the Stock
Exchange, or on any other stock exchange on which the securities of our Company may
be listed and which is recognized by the SFC and the Stock Exchange for this purpose,
of Shares with a total number not exceeding 10% of the total number of Shares of our
Company in issue immediately following the completion of the Global Offering
(assuming the Over-allotment Option is not exercised), at any time until the conclusion
of the next annual general meeting of our Company, the expiration of the period within
which the next annual general meeting of our Company is required by any applicable law
or the Articles of Association to be held or when such mandate is revoked or varied by
an ordinary resolution of our Shareholders in general meeting, whichever is the earliest.
APPENDIX IV STATUTORY AND GENERAL INFORMATION
– IV-6 –
(ii) Source of Funds
Repurchases must be funded out of funds legally available for the purpose in
accordance with the Articles of Association and the applicable laws of the Hong Kong.
A listed company may not repurchase its own securities on the Stock Exchange for a
consideration other than cash or for settlement otherwise than in accordance with the
trading rules of the Stock Exchange as amended from time to time.
(iii) Trading Restrictions
The total number of shares which a listed company may repurchase on the Stock
Exchange is the number of shares representing up to a maximum of 10% of the aggregate
number of shares in issue. A listed company may not issue or announce a proposed issue
of new securities for a period of 30 days immediately following a repurchase (other than
an issue of securities pursuant to an exercise of warrants, share options or similar
instruments requiring the company to issue securities which were outstanding prior to
such repurchase) without the prior approval of the Stock Exchange. In addition, a listed
company is prohibited from repurchasing its shares on the Stock Exchange if the purchase
price is 5% or more than the average closing market price for the five preceding trading
days on which its shares were traded on the Stock Exchange.
The Listing Rules also prohibit a listed company from repurchasing its securities on
the Stock Exchange if the repurchase would result in the number of listed securities which
are in the hands of the public falling below the relevant prescribed minimum percentage
as required by the Stock Exchange.
A listed company is required to procure that the broker appointed by it to effect a
repurchase of securities disclose to the Stock Exchange such information with respect to
the repurchase made on behalf of the listed company as the Stock Exchange may require.
(iv) Status of Repurchased Shares
All repurchased securities (whether effected on the Stock Exchange or otherwise)
will be automatically delisted and the certificates for those securities must be cancelled
and destroyed.
(v) Suspension of Repurchase
A listed company may not make any repurchase of securities after inside
information has come to its knowledge until the information has been made publicly
available. In particular, during the period of one month immediately preceding the earlier
of (a) the date of the board meeting (as such date is first notified to the Stock Exchange
in accordance with the Listing Rules) for the approval of a listed company’s results for
any year, half-year, quarterly or any other interim period (whether or not required under
the Listing Rules) and (b) the deadline for a listed company to announce its results for
any year or half-year under the Listing Rules, or quarterly or any other interim period
(whether or not required under the Listing Rules) and ending on the date of the results
APPENDIX IV STATUTORY AND GENERAL INFORMATION
– IV-7 –
announcement, the listed company may not repurchase its securities on the Stock
Exchange other than in exceptional circumstances. In addition, the Stock Exchange may
prohibit a repurchase of shares on the Stock Exchange if a listed company has breached
the Listing Rules.
(vi) Reporting Requirements
Certain information relating to repurchases of securities on the Stock Exchange or
otherwise must be reported to the Stock Exchange not later than 30 minutes before the
earlier of the commencement of the morning trading session or any pre-opening session
on the following Business Day. In addition, a listed company’s annual report is required
to disclose details regarding repurchases of securities made during the year reviewed,
including a monthly analysis of the number of securities repurchased, the purchase price
per share or the highest and lowest price paid for all such purchases, where relevant, and
the aggregate prices paid.
(vii) Core Connected Persons
A listed company is prohibited from knowingly repurchasing securities on the Stock
Exchange from a “core connected person”, that is, a director, chief executive or
substantial shareholder of the company or any of its subsidiaries or their respective close
associates and a core connected person is prohibited from knowingly selling his securities
to the company, on the Stock Exchange.
(b) Reasons for Repurchases
Our Directors believe that it is in the best interests of our Company and Shareholders for
our Directors to receive the general authority from our Shareholders to repurchase Shares in the
market. Repurchases of Shares will only be made when our Directors believe that such
repurchases will be in the interest of our Company and our Shareholders. Such repurchases
may, depending on market conditions, funding arrangements and other circumstances at the
time, lead to an enhancement of the net value of our Company and its assets and/or its earnings
per Share.
(c) Funding of Repurchases
In repurchasing securities, our Company may only apply funds legally available for such
purpose in accordance with the Articles of Association, the Listing Rules and the applicable
laws of Hong Kong.
Any payment for the repurchase of Shares will be drawn from the profits or share
premium of our Company or from the proceeds of a fresh issue of shares made for the purpose
of the repurchase or, if authorized by the Articles and subject to the Listing Rules and the
applicable laws and regulations of Hong Kong, out of capital and, in the case of any premium
payable on the purchase, out of the profits of our Company or from sums standing to the credit
of the share premium account of our Company or, if authorized by the Articles and subject to
the Listing Rules and the applicable laws and regulations of Hong Kong, out of capital.
APPENDIX IV STATUTORY AND GENERAL INFORMATION
– IV-8 –
Our Directors do not propose to exercise the Repurchase Mandate to such an extent aswould, under the circumstances, have a material adverse effect in the opinion of our Directorson the working capital requirements of our Company or our gearing levels. However, theremight be a material adverse impact on the working capital or gearing position of our Companyas compared with the position disclosed in this prospectus in the event that the RepurchaseMandate is exercised in full.
(d) Share Capital
The exercise in full of the Repurchase Mandate, on the basis of 479,431,411 Shares inissue immediately following the completion of the Global Offering and assuming theOver-allotment Option is not exercised, could accordingly result in up to approximately47,943,141 Shares being repurchased by our Company during the period prior to:
(i) the conclusion of the next annual general meeting of our Company; or
(ii) the expiration of the period within which the next annual general meeting of ourCompany is required by any applicable law or the Articles of Association to be held;or
(iii) the date on which the Repurchase Mandate is revoked or varied by an ordinaryresolution of our Shareholders in general meeting,
whichever is the earliest.
(e) General
None of our Directors nor, to the best of their knowledge having made all reasonableenquiries, any of their respective close associates has any present intention to sell any Sharesto our Company or our subsidiaries.
Our Directors have undertaken to the Stock Exchange that, so far as the same may beapplicable, they will exercise the Repurchase Mandate in accordance with the Listing Rules,the Articles of Association and the applicable laws and regulations from time to time in forcein Hong Kong. Our Company has not repurchased any Shares since our incorporation.
No core connected person (as defined in the Listing Rules) of our Company has notifiedour Company that he or she or it has a present intention to sell Shares to our Company, or hasundertaken not to do so, if the Repurchase Mandate is exercised.
If, as a result of any repurchase of Shares, a Shareholder’s proportionate interest in thevoting rights of our Company is increased, such increase will be treated as an acquisition forthe purposes of the Takeovers Code. Accordingly, a Shareholder or a group of Shareholdersacting in concert could obtain or consolidate control of our Company and become obliged tomake a mandatory offer in accordance with Rule 26 of the Takeovers Code. Save as aforesaid,our Directors are not aware of any consequences which would arise under the Takeovers Codeas a consequence of any repurchases pursuant to the Repurchase Mandate.
Any repurchase of Shares that results in the number of Shares held by the public beingreduced may require a further waiver from the Stock Exchange in relation to the Listing Rulesrequirements regarding the public float of the Company. It is believed that a waiver of thisprovision would not normally be given other than in exceptional circumstances.
APPENDIX IV STATUTORY AND GENERAL INFORMATION
– IV-9 –

B. FURTHER INFORMATION ABOUT OUR BUSINESS
1. Summary of Material Contracts
The following contracts (not being contracts entered into in the ordinary course of business)were entered into by our Company or its subsidiaries within the two years preceding the date of thisprospectus and are or may be material:
(a) an investment construction agreement dated May 26, 2021 entered into between NanjingChervon Industry and Nanjing Jiangning Economic and Technological DevelopmentManagement Committee* (南京江寧經濟技術開發區管理委員會) pursuant to whichNanjing Chervon Industry agreed to invest in the project involving the construction of anintelligent manufacturing industrial base in the area designated by Nanjing JiangningEconomic and Technological Development Management Committee;
(b) a cornerstone investment agreement dated December 15, 2021 entered into among theCompany, Value Partners Hong Kong Limited, China International Capital CorporationHong Kong Securities Limited and Citigroup Global Markets Asia Limited, details ofwhich are included in the section headed “Cornerstone Investors” in this prospectus;
(c) a cornerstone investment agreement dated December 15, 2021 entered into among theCompany, Greenwoods Asset Management Hong Kong Limited, China InternationalCapital Corporation Hong Kong Securities Limited and Citigroup Global Markets AsiaLimited, details of which are included in the section headed “Cornerstone Investors” inthis prospectus;
(d) a cornerstone investment agreement dated December 15, 2021 entered into among theCompany, Dragon Billion China Master Fund, Dragon Billion Select Master Fund, LMASPC, solely on behalf of the Map 147 Segregated Portfolio, China International CapitalCorporation Hong Kong Securities Limited and Citigroup Global Markets Asia Limited,details of which are included in the section headed “Cornerstone Investors” in thisprospectus;
(e) a cornerstone investment agreement dated December 15, 2021 entered into among theCompany, 3W Fund Management Limited, China International Capital Corporation HongKong Securities Limited and Citigroup Global Markets Asia Limited, details of which areincluded in the section headed “Cornerstone Investors” in this prospectus;
(f) a cornerstone investment agreement dated December 15, 2021 entered into among theCompany, IvyRock Asset Management (HK) Limited, China International CapitalCorporation Hong Kong Securities Limited and Citigroup Global Markets Asia Limited,details of which are included in the section headed “Cornerstone Investors” in thisprospectus;
(g) a cornerstone investment agreement dated December 15, 2021 entered into among theCompany, Ms. Luo Jinhong (駱錦紅), China International Capital Corporation HongKong Securities Limited and Citigroup Global Markets Asia Limited, details of which areincluded in the section headed “Cornerstone Investors” in this prospectus; and
(h) the Hong Kong Underwriting Agreement.
APPENDIX IV STATUTORY AND GENERAL INFORMATION
– IV-10 –

2. Intellectual Property Rights of our Group
As of the Latest Practicable Date, we have registered the following intellectual property rights
which are material in relation to our business.
(a) Trademarks
As of the Latest Practicable Date, we have registered the following trademarks which are
material to our business:
No. Trademark Class Registered OwnerPlace ofRegistration
RegistrationNumber
Application Date/Registration Date Expiry Date
1. 7 Nanjing Chervon
Industry
PRC 14073719 August 14, 2015 August 13,
20252. 7 Nanjing Chervon
Industry
PRC 11967986 March 21, 2015 March 20,
20253. 7 Chervon (China)
Trading Co., Ltd.
PRC 12966079 January 14, 2015 January 13,
20254. 9 Chervon (China)
Trading Co., Ltd.
PRC 12966077 January 7, 2015 January 6,
20255. 7 Nanjing Chervon
Industry
PRC 38165412 August 21, 2020 August 20,
20306. 7 Chervon HK U.S. 4502915 March 25, 2014 March 25,
20247. EGO 7 Chervon HK U.S. 5271419 August 22, 2017 August 22,
20278. ARC LITHIUM 9 Chervon HK U.S. 5142417 February 14, 2017 February 14,
20279. 7, 9 Chervon HK U.S. 4633515 November 4, 2014 November 4,
202410. 7, 9 Chervon HK United
Kingdom
UK00912933461 October 27, 2014 June 3, 2024
11. ARC LITHIUM 9 Chervon HK European
Union
014039028 August 13, 2020 May 8, 2025
12. ARC LITHIUM 9 Chervon HK United
Kingdom
UK00914485106 December 1, 2015 August 19,
202513. KEEP COOL 9 Chervon HK European
Union
014485106 December 1, 2015 August 19,
202514. 7 Nanjing Chervon
Industry
European
Union
1454252 December 17,
2018
December 17,
202815. 7 Nanjing Chervon
Industry
United
Kingdom
UK00801454252 August 13, 2019 December 17,
202816. 7 Chervon HK Australia 1533176 December 24,
2012
December 24,
202217. 9 Nanjing Chervon
Industry
Australia 1996114 March 15, 2019 March 15,
2029
APPENDIX IV STATUTORY AND GENERAL INFORMATION
– IV-11 –

No. Trademark Class Registered OwnerPlace ofRegistration
RegistrationNumber
Application Date/Registration Date Expiry Date
18. 7 Nanjing Chervon
Industry
PRC 358031 August 20, 1989 August 19,
202919. 7 Nanjing Chervon
Industry
PRC 864226 August 21, 1996 August 20,
2026
20. 7 Nanjing Chervon
Industry
PRC 11070572 August 21, 2014 August 20,
2024
21. 9 Nanjing Chervon
Industry
PRC 15486341 January 28, 2016 January 27,
2026
22. 8 Nanjing Chervon
Industry
PRC 4738912 April 21, 2008 April 20, 2028
23. 7 Nanjing Chervon
Industry
PRC 32860165 May 7, 2019 May 6, 2029
24. 9 Nanjing Chervon
Industry
PRC 32853134 June 7, 2020 June 6, 2030
25. 7 Nanjing Chervon
Industry
PRC 34643073 August 7, 2019 August 6,
202926. 9 Nanjing Chervon
Industry
PRC 34633781 August 7, 2019 August 6,
202927. 11 Nanjing Chervon
Industry
PRC 34636710 August 7, 2019 August 6,
202928. 7, 9,
11
Nanjing Chervon
Industry
U.S. 6171839 October 13, 2020 February 5,
202929. 7, 9,
11
Nanjing Chervon
Industry
U.S. 6160713 September 29,
2020
June 17, 2029
30. SKIL I.C. 7 Nanjing Chervon
Industry
U.S. 5216208 June 6, 2017 June 6, 2027
31. 7, 9,
11
Nanjing Chervon
Industry
European
Union
1477907 February 5, 2019 February 5,
202932. 7, 9,
11
Nanjing Chervon
Industry
United
Kingdom
UK00801477907 December 20,
2019
February 5,
202933. 7, 9,
11
Nanjing Chervon
Industry
United
Kingdom
UK00801492551 March 19, 2020 June 17, 2029
34. Skil 7 Nanjing Chervon
Industry
United
Kingdom
UK00000845055 February 13, 1963 February 13,
202835. SKIL 8 Nanjing Chervon
Industry
United
Kingdom
UK00000925361 May 16, 1968 May 16, 2023
36. SKIL 10 Nanjing Chervon
Industry
United
Kingdom
UK00000925362 May 16, 1968 May 16, 2023
37. SKILSAW 7 Nanjing Chervon
Industry
United
Kingdom
UK00000631269 September 1,
1944
September 1,
202738. 7, 9,
11
Nanjing Chervon
Industry
Australia 2024032 March 18, 2020 February 5,
2029
APPENDIX IV STATUTORY AND GENERAL INFORMATION
– IV-12 –

No. Trademark Class Registered OwnerPlace ofRegistration
RegistrationNumber
Application Date/Registration Date Expiry Date
39. SKIL 7 Nanjing Chervon
Industry
Australia 125226 October 13, 1955 October 13,
202740. 7 Nanjing Chervon
Industry
Australia 49254 January 5, 1928 January 5,
202841. 8 Nanjing Chervon
Industry
Australia 243812 January 5, 1928 January 5,
202842. FLEX 7, 8, 9 Flex-Elektrowerkzeuge
GmbH
European
Union
18031906 October 3, 2019 March 6, 2029
43. FLEX 7, 8, 9 Flex-Elektrowerkzeuge
GmbH
United
Kingdom
UK00918031906 October 3, 2019 March 6, 2029
44. 7, 8, 9 Flex-Elektrowerkzeuge
GmbH
European
Union
18064502 October 3, 2019 May 14, 2029
45. 7, 8, 9 Flex-Elektrowerkzeuge
GmbH
United
Kingdom
UK00918064502 October 3, 2019 May 14, 2029
46. 7, 8, 9 Flex-Elektrowerkzeuge
GmbH
European
Union
18064503 October 3, 2019 May 14, 2029
47. 7, 8, 9 Flex-Elektrowerkzeuge
GmbH
United
Kingdom
UK00918064503 October 3, 2019 May 14, 2029
48. FLEX 7, 8, 9 Flex-Elektrowerkzeuge
GmbH
United
Kingdom
UK00900123521 May 3, 1999 April 1, 2026
49. 7 Flex-Elektrowerkzeuge
GmbH
PRC G653831 March 14, 2016 March 13,
202650. FLEX Das Original 7, 8, 9 Flex-Elektrowerkzeuge
GmbH
United
Kingdom
UK00801238965 January 14, 2016 June 12, 2024
51. 7 Nanjing Chervon
Industry
PRC 4417301 October 7, 2008 October 6,
202852. 8 Nanjing Chervon
Industry
PRC 4424907 August 21, 2007 August 20,
202753. 44 Nanjing Chervon
Industry
PRC 4417300 July 28, 2008 July 27, 2028
54. 7 Nanjing Chervon
Industry
PRC 4816341 November 7, 2008 November 6,
202855. 9 Nanjing Chervon
Industry
PRC 4816342 May 7, 2009 May 6, 2029
56. 7 Nanjing Chervon
Industry
PRC 6795132 February 7, 2012 February 6,
202257. 8 Nanjing Chervon
Industry
PRC 6795243 September 21,
2010
September 20,
203058. 9 Nanjing Chervon
Industry
PRC 6795242 February 21, 2011 February 20,
203159. 7 Nanjing Chervon
Industry
PRC 6795241 August 28, 2011 August 27,
203160. 8 Nanjing Chervon
Industry
PRC 6795240 September 21,
2010
September 20,
2030
APPENDIX IV STATUTORY AND GENERAL INFORMATION
– IV-13 –
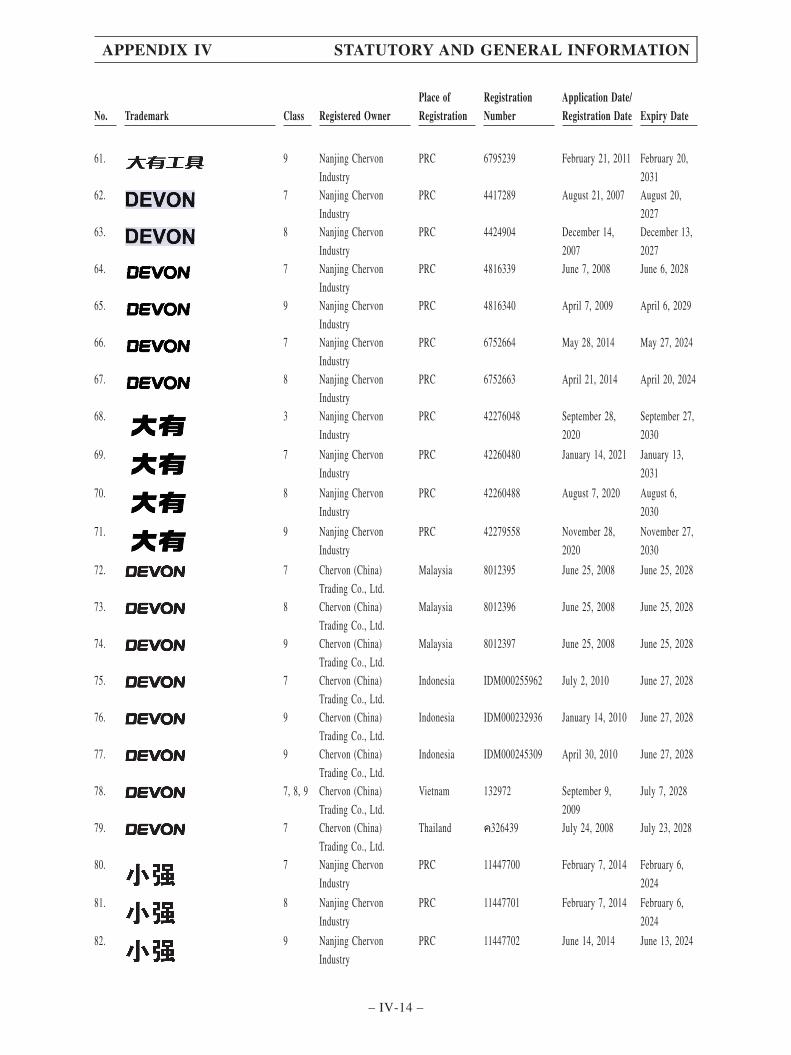
No. Trademark Class Registered OwnerPlace ofRegistration
RegistrationNumber
Application Date/Registration Date Expiry Date
61. 9 Nanjing Chervon
Industry
PRC 6795239 February 21, 2011 February 20,
203162. 7 Nanjing Chervon
Industry
PRC 4417289 August 21, 2007 August 20,
202763. 8 Nanjing Chervon
Industry
PRC 4424904 December 14,
2007
December 13,
202764. 7 Nanjing Chervon
Industry
PRC 4816339 June 7, 2008 June 6, 2028
65. 9 Nanjing Chervon
Industry
PRC 4816340 April 7, 2009 April 6, 2029
66. 7 Nanjing Chervon
Industry
PRC 6752664 May 28, 2014 May 27, 2024
67. 8 Nanjing Chervon
Industry
PRC 6752663 April 21, 2014 April 20, 2024
68. 3 Nanjing Chervon
Industry
PRC 42276048 September 28,
2020
September 27,
2030
69. 7 Nanjing Chervon
Industry
PRC 42260480 January 14, 2021 January 13,
2031
70. 8 Nanjing Chervon
Industry
PRC 42260488 August 7, 2020 August 6,
2030
71. 9 Nanjing Chervon
Industry
PRC 42279558 November 28,
2020
November 27,
2030
72. 7 Chervon (China)
Trading Co., Ltd.
Malaysia 8012395 June 25, 2008 June 25, 2028
73. 8 Chervon (China)
Trading Co., Ltd.
Malaysia 8012396 June 25, 2008 June 25, 2028
74. 9 Chervon (China)
Trading Co., Ltd.
Malaysia 8012397 June 25, 2008 June 25, 2028
75. 7 Chervon (China)
Trading Co., Ltd.
Indonesia IDM000255962 July 2, 2010 June 27, 2028
76. 9 Chervon (China)
Trading Co., Ltd.
Indonesia IDM000232936 January 14, 2010 June 27, 2028
77. 9 Chervon (China)
Trading Co., Ltd.
Indonesia IDM000245309 April 30, 2010 June 27, 2028
78. 7, 8, 9 Chervon (China)
Trading Co., Ltd.
Vietnam 132972 September 9,
2009
July 7, 2028
79. 7 Chervon (China)
Trading Co., Ltd.
Thailand 326439 July 24, 2008 July 23, 2028
80. 7 Nanjing Chervon
Industry
PRC 11447700 February 7, 2014 February 6,
2024
81. 8 Nanjing Chervon
Industry
PRC 11447701 February 7, 2014 February 6,
2024
82. 9 Nanjing Chervon
Industry
PRC 11447702 June 14, 2014 June 13, 2024
APPENDIX IV STATUTORY AND GENERAL INFORMATION
– IV-14 –

No. Trademark Class Registered OwnerPlace ofRegistration
RegistrationNumber
Application Date/Registration Date Expiry Date
83. 7 Nanjing Chervon
Industry
PRC 11447699 February 7, 2014 February 6,
202484. 7 Nanjing Chervon
Industry
PRC 11544055 April 28, 2014 April 27, 2024
85. 9 Nanjing Chervon
Industry
PRC 11544054 May 14, 2014 May 13, 2024
86. 7 Nanjing Chervon
Industry
PRC 11544056 March 7, 2014 March 6, 2024
87. 9 Nanjing Chervon
Industry
PRC 11544057 April 14, 2014 April 13, 2024
(b) Patents
As of the Latest Practicable Date, we have registered the following patents which are
material to our business:
(i) Multiple safety protection system technology of battery pack (電池包多重安全保護系統技術)
No. Title of Patent TypePlace ofregistration
RegisteredOwner
Patent no./Publication no.
ApplicationDate Publication Date Expiry Date
1. Electric tool and battery pack
combination (電動工具和電池包的組合)
Invention PRC Nanjing
Chervon
Industry
ZL201610465239.5 June 23, 2016 March 8, 2019 June 22, 2036
European
Union
Chervon HK EP3109927B1 June 24, 2016 December 4, 2019 June 24, 2036
U.S. Chervon HK US10097015B2 June 23, 2016 October 9, 2018 June 23, 20362. Battery pack, battery pack and
electric tool composition, and
method for connecting battery pack
and electric tool (電池包及其與電動工具的組合和連接它們的方法)
Invention PRC Nanjing
Chervon
Industry
ZL201510471534.7 August 4, 2015 August 6, 2019 August 3,
2035
European
Union
Chervon HK EP3138663B1 July 25, 2016 January 8, 2020 July 25, 2036
U.S. Chervon HK US10476067B2 July 28, 2016 November 12,
2019
August 2,
2037U.S. Chervon HK US10964990B2 September 6,
2019
March 30, 2021 July 28, 2036
3. Control circuit and method for
manipulating a power tool (電動工具控制電路及其操作方法)
Invention PRC Nanjing
Chervon
Industry
ZL201010199754.6 June 9, 2010 September 9,
2015
June 8, 2030
U.S. Chervon HK US8841871B2 June 7, 2011 September 23,
2014
November 16,
2032
APPENDIX IV STATUTORY AND GENERAL INFORMATION
– IV-15 –

No. Title of Patent TypePlace ofregistration
RegisteredOwner
Patent no./Publication no.
ApplicationDate Publication Date Expiry Date
4. Direct current system (一種直流系統)
Invention PRC Nanjing
Chervon
Industry
ZL201110055218.3 March 8, 2011 February 25,
2015
March 7,
2031
U.S. Chervon HK US8963497B2 February 27,
2012
February 24,
2015
March 9,
2033U.S. Chervon HK US9548614B2 January 15,
2015
January 17, 2017 February 27,
2032U.S. Chervon HK US9979208B2 December 5,
2016
May 22, 2018 February 27,
20325. Charger (充電器) Invention PRC Nanjing
Chervon
Industry
ZL201010514214.2 October 21,
2010
March 12, 2014 October 20,
2030
United
Kingdom
Chervon HK GB2484773B August 10, 2011 September 11,
2013
August 10,
2031U.S. Chervon HK US9252463B2 August 10, 2011 February 2, 2016 December 11,
20336. Charging system (充電系統) Invention PRC Nanjing
Chervon
Industry
ZL201110039840.5 October 21,
2010
June 11, 2014 October 20,
2030
7. Cooling charging device and method
for battery pack (電池包的冷卻充電裝置及方法)
Invention PRC Nanjing
Chervon
Industry
ZL201310140954.8 April 22, 2013 September 7,
2016
April 21,
2033
Germany Chervon HK DE202014100391U1 January 29,
2014
April 14, 2014 January 31,
2024U.S. Chervon HK US9608461B2 September 23,
2013
March 28, 2017 October 11,
20348. Battery pack, charging assembly and
electric tool (電池包、充電組合和電動工具)
Invention PRC Nanjing
Chervon
Industry
ZL201410841100.7 December 30,
2014
August 29, 2017 December 29,
2034
United
Kingdom
Chervon HK GB2524363B December 30,
2014
December 30,
2020
December 30,
2034U.S. Chervon HK US9726731B2 December 26,
2014
August 8, 2017 March 19,
20359. Battery pack, charging combination,
electric tool and disconnection
detection method (電池包、充電組合、電動工具以及斷線檢測方法)
Invention PRC Nanjing
Chervon
Industry
ZL201410841937.1 December 30,
2014
December 29,
2017
December 29,
2034
10. Battery pack, charging combination,
electric tool and disconnection
detection method (電池包、充電組合、電動工具以及斷線檢測方法)
Invention PRC Nanjing
Chervon
Industry
ZL201410844719.3 December 30,
2014
January 19, 2018 December 29,
2034
APPENDIX IV STATUTORY AND GENERAL INFORMATION
– IV-16 –
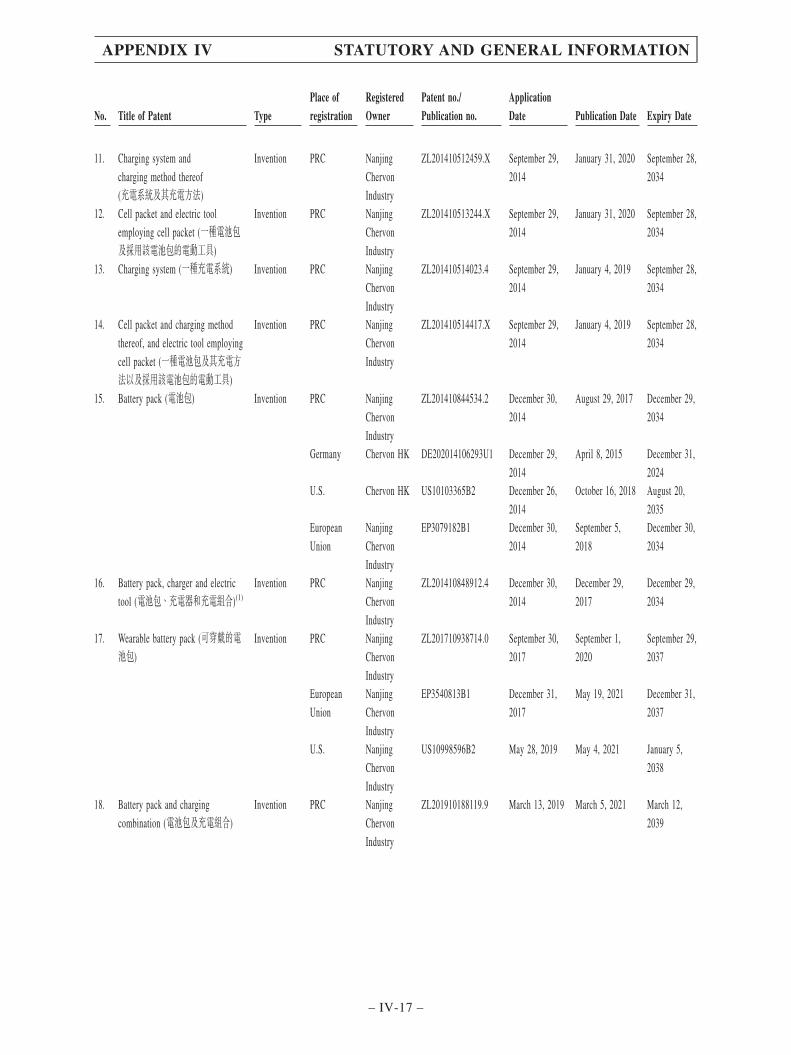
No. Title of Patent TypePlace ofregistration
RegisteredOwner
Patent no./Publication no.
ApplicationDate Publication Date Expiry Date
11. Charging system and
charging method thereof
(充電系統及其充電方法)
Invention PRC Nanjing
Chervon
Industry
ZL201410512459.X September 29,
2014
January 31, 2020 September 28,
2034
12. Cell packet and electric tool
employing cell packet (一種電池包及採用該電池包的電動工具)
Invention PRC Nanjing
Chervon
Industry
ZL201410513244.X September 29,
2014
January 31, 2020 September 28,
2034
13. Charging system (一種充電系統) Invention PRC Nanjing
Chervon
Industry
ZL201410514023.4 September 29,
2014
January 4, 2019 September 28,
2034
14. Cell packet and charging method
thereof, and electric tool employing
cell packet (一種電池包及其充電方法以及採用該電池包的電動工具)
Invention PRC Nanjing
Chervon
Industry
ZL201410514417.X September 29,
2014
January 4, 2019 September 28,
2034
15. Battery pack (電池包) Invention PRC Nanjing
Chervon
Industry
ZL201410844534.2 December 30,
2014
August 29, 2017 December 29,
2034
Germany Chervon HK DE202014106293U1 December 29,
2014
April 8, 2015 December 31,
2024U.S. Chervon HK US10103365B2 December 26,
2014
October 16, 2018 August 20,
2035European
Union
Nanjing
Chervon
Industry
EP3079182B1 December 30,
2014
September 5,
2018
December 30,
2034
16. Battery pack, charger and electric
tool (電池包、充電器和充電組合)(1)
Invention PRC Nanjing
Chervon
Industry
ZL201410848912.4 December 30,
2014
December 29,
2017
December 29,
2034
17. Wearable battery pack (可穿戴的電池包)
Invention PRC Nanjing
Chervon
Industry
ZL201710938714.0 September 30,
2017
September 1,
2020
September 29,
2037
European
Union
Nanjing
Chervon
Industry
EP3540813B1 December 31,
2017
May 19, 2021 December 31,
2037
U.S. Nanjing
Chervon
Industry
US10998596B2 May 28, 2019 May 4, 2021 January 5,
2038
18. Battery pack and charging
combination (電池包及充電組合)
Invention PRC Nanjing
Chervon
Industry
ZL201910188119.9 March 13, 2019 March 5, 2021 March 12,
2039
APPENDIX IV STATUTORY AND GENERAL INFORMATION
– IV-17 –

(ii) Battery temperature precise control technology (電池溫度精確控制技術)
No. Title of Patent TypePlace ofregistration
RegisteredOwner
Patent no./Publication no.
ApplicationDate Publication Date Expiry Date
19. Direct-current system
(一種直流系統)
Invention PRC Nanjing
Chervon
Industry
ZL201110055219.8 March 8, 2011 February 25,
2015
March 7,
2031
20. Cordless tool system
(直流系統)
Invention PRC Nanjing
Chervon
Industry
ZL201110055533.6 March 8, 2011 June 10, 2015 March 7,
2031
21. Battery pack provided with heat
dissipation system (具有散熱系統的電池包)
Invention PRC Nanjing
Chervon
Industry
ZL201310234632.X June 13, 2013 March 20, 2018 June 12,
2033
Germany Chervon HK DE202014102744U1 June 13, 2014 September 8,
2014
June 30,
2024France Chervon HK FR3007212B3 June 13, 2014 September 25,
2015
June 13,
2024United
Kingdom
Chervon HK GB2517551B June 13, 2014 March 31, 2021 June 13,
203422. Battery pack (電池包) Invention PRC Nanjing
Chervon
Industry
ZL201510047351.2 January 29,
2015
April 19, 2019 January 28,
2035
23. Electric tool and control method
thereof (電動工具及其控制方法)
Invention PRC Nanjing
Chervon
Industry
ZL201610389158.1 June 2, 2016 May 26, 2020 June 1, 2026
U.S. Nanjing
Chervon
Industry
US10277064B2 November 29,
2017
April 30, 2019 June 3, 2036
European
Union
Nanjing
Chervon
EP3288147B1 June 3, 2016 May 6, 2020 June 3, 2036
(iii) High salient-pole rate permanent magnet synchronous motor (高凸極率永磁同步電機)
No. Title of Patent TypePlace ofregistration
RegisteredOwner
Patent no./Publication no.
ApplicationDate Publication Date Expiry Date
24. Rotor punching sheet
(轉子沖片)
Invention PRC Nanjing
Chervon
Industry
ZL201611062894.2 November 25,
2016
June 14, 2019 November 24,
2036
European
Union
Nanjing
Chervon
Industry
EP3297130B1 August 29, 2017 July 17, 2019 August 29,
2037
APPENDIX IV STATUTORY AND GENERAL INFORMATION
– IV-18 –
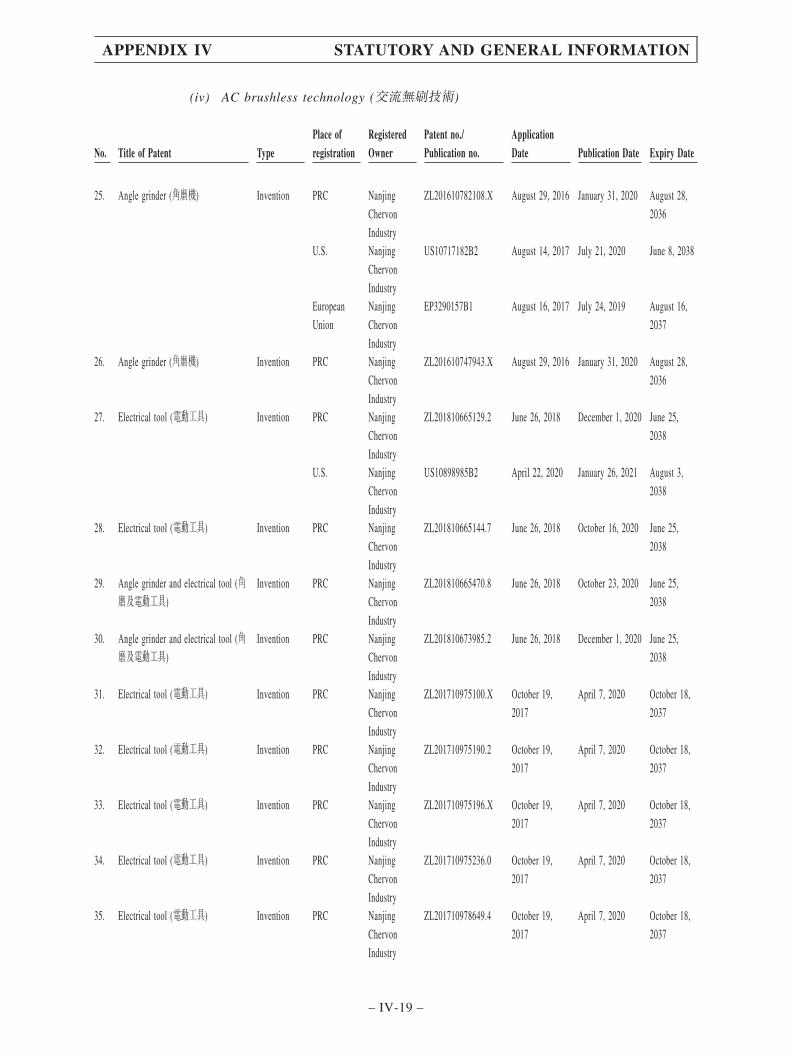
(iv) AC brushless technology (交流無刷技術)
No. Title of Patent TypePlace ofregistration
RegisteredOwner
Patent no./Publication no.
ApplicationDate Publication Date Expiry Date
25. Angle grinder (角磨機) Invention PRC Nanjing
Chervon
Industry
ZL201610782108.X August 29, 2016 January 31, 2020 August 28,
2036
U.S. Nanjing
Chervon
Industry
US10717182B2 August 14, 2017 July 21, 2020 June 8, 2038
European
Union
Nanjing
Chervon
Industry
EP3290157B1 August 16, 2017 July 24, 2019 August 16,
2037
26. Angle grinder (角磨機) Invention PRC Nanjing
Chervon
Industry
ZL201610747943.X August 29, 2016 January 31, 2020 August 28,
2036
27. Electrical tool (電動工具) Invention PRC Nanjing
Chervon
Industry
ZL201810665129.2 June 26, 2018 December 1, 2020 June 25,
2038
U.S. Nanjing
Chervon
Industry
US10898985B2 April 22, 2020 January 26, 2021 August 3,
2038
28. Electrical tool (電動工具) Invention PRC Nanjing
Chervon
Industry
ZL201810665144.7 June 26, 2018 October 16, 2020 June 25,
2038
29. Angle grinder and electrical tool (角磨及電動工具)
Invention PRC Nanjing
Chervon
Industry
ZL201810665470.8 June 26, 2018 October 23, 2020 June 25,
2038
30. Angle grinder and electrical tool (角磨及電動工具)
Invention PRC Nanjing
Chervon
Industry
ZL201810673985.2 June 26, 2018 December 1, 2020 June 25,
2038
31. Electrical tool (電動工具) Invention PRC Nanjing
Chervon
Industry
ZL201710975100.X October 19,
2017
April 7, 2020 October 18,
2037
32. Electrical tool (電動工具) Invention PRC Nanjing
Chervon
Industry
ZL201710975190.2 October 19,
2017
April 7, 2020 October 18,
2037
33. Electrical tool (電動工具) Invention PRC Nanjing
Chervon
Industry
ZL201710975196.X October 19,
2017
April 7, 2020 October 18,
2037
34. Electrical tool (電動工具) Invention PRC Nanjing
Chervon
Industry
ZL201710975236.0 October 19,
2017
April 7, 2020 October 18,
2037
35. Electrical tool (電動工具) Invention PRC Nanjing
Chervon
Industry
ZL201710978649.4 October 19,
2017
April 7, 2020 October 18,
2037
APPENDIX IV STATUTORY AND GENERAL INFORMATION
– IV-19 –

No. Title of Patent TypePlace ofregistration
RegisteredOwner
Patent no./Publication no.
ApplicationDate Publication Date Expiry Date
36. Power tool and control method
thereof (電動工具及電動工具的控制方法)
Invention PRC Nanjing
Chervon
Industry
ZL201710978650.7 October 19,
2017
September 20,
2019
October 18,
2037
U.S. Nanjing
Chervon
Industry
US10972023B2 April 22, 2019 April 6, 2021 October 25,
2037
(v) Riding vehicle technology (騎乘式車輛技術)
No. Title of Patent TypePlace ofregistration
RegisteredOwner
Patent no./Publication no.
ApplicationDate Publication Date Expiry Date
37. Riding lawn mower and operation
device thereof (騎乘式割草機的操作裝置以及騎乘式割草機)
Invention PRC Nanjing
Chervon
Industry
ZL201810690046.9 June 28, 2018 March 5, 2021 June 27,
2038
(vi) Intelligent control and protection technology (智能控制及保護技術)
No. Title of Patent TypePlace ofregistration
RegisteredOwner
Patent no./Publication no.
ApplicationDate Publication Date Expiry Date
38. Grass cutter capable of protecting
operation and safety switch
mechanism thereof (具有操作保護的割草機及其安全開關機構)
Invention PRC Nanjing
Chervon
Industry
ZL201210387914.9 October 15,
2012
November 25,
2015
October 14,
2032
U.S. Chervon HK US10070588B2 August 29, 2016 September 11,
2018
October 10,
2034U.S. Chervon HK US9060463B2 August 8, 2013 June 23, 2015 November 20,
2033U.S. Chervon HK US9596806B2 October 10,
2014
March 21, 2017 October 10,
2034U.S. Chervon HK US9826686B2 August 29, 2016 November 28,
2017
October 10,
2034U.S. Chervon HK US9986686B2 August 29, 2016 June 5, 2018 October 10,
2034U.S. Chervon HK US9888627B2 October 8, 2013 February 13,
2018
June 21, 2034
39. Lawncare apparatus (園林工具)(2) Invention PRC Nanjing
Chervon
Industry
ZL201410167041.X April 23, 2014 November 30,
2016
April 22,
2034
40. Mower with operation protection,
and safety switch mechanism
thereof (具有操作保護的割草機及其安全開關機構)(2)
Invention PRC Nanjing
Chervon
Industry
ZL201410626445.0 October 15,
2012
January 19, 2018 October 14,
2032
APPENDIX IV STATUTORY AND GENERAL INFORMATION
– IV-20 –
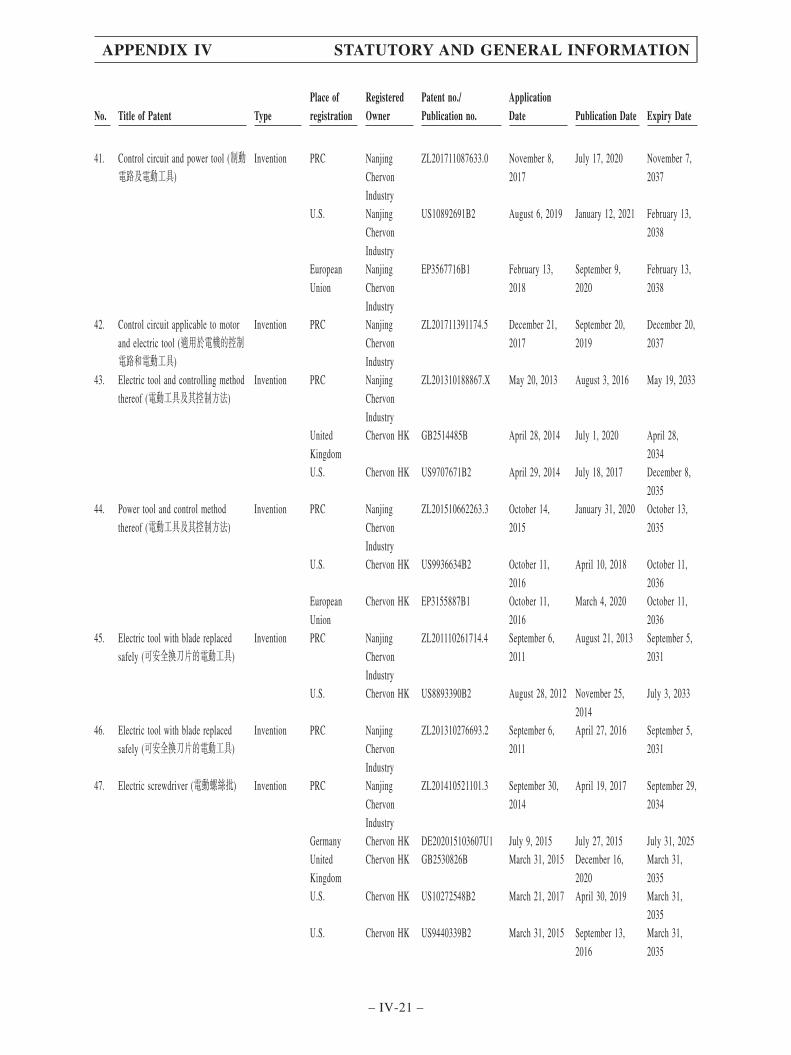
No. Title of Patent TypePlace ofregistration
RegisteredOwner
Patent no./Publication no.
ApplicationDate Publication Date Expiry Date
41. Control circuit and power tool (制動電路及電動工具)
Invention PRC Nanjing
Chervon
Industry
ZL201711087633.0 November 8,
2017
July 17, 2020 November 7,
2037
U.S. Nanjing
Chervon
Industry
US10892691B2 August 6, 2019 January 12, 2021 February 13,
2038
European
Union
Nanjing
Chervon
Industry
EP3567716B1 February 13,
2018
September 9,
2020
February 13,
2038
42. Control circuit applicable to motor
and electric tool (適用於電機的控制電路和電動工具)
Invention PRC Nanjing
Chervon
Industry
ZL201711391174.5 December 21,
2017
September 20,
2019
December 20,
2037
43. Electric tool and controlling method
thereof (電動工具及其控制方法)
Invention PRC Nanjing
Chervon
Industry
ZL201310188867.X May 20, 2013 August 3, 2016 May 19, 2033
United
Kingdom
Chervon HK GB2514485B April 28, 2014 July 1, 2020 April 28,
2034U.S. Chervon HK US9707671B2 April 29, 2014 July 18, 2017 December 8,
203544. Power tool and control method
thereof (電動工具及其控制方法)
Invention PRC Nanjing
Chervon
Industry
ZL201510662263.3 October 14,
2015
January 31, 2020 October 13,
2035
U.S. Chervon HK US9936634B2 October 11,
2016
April 10, 2018 October 11,
2036European
Union
Chervon HK EP3155887B1 October 11,
2016
March 4, 2020 October 11,
203645. Electric tool with blade replaced
safely (可安全換刀片的電動工具)
Invention PRC Nanjing
Chervon
Industry
ZL201110261714.4 September 6,
2011
August 21, 2013 September 5,
2031
U.S. Chervon HK US8893390B2 August 28, 2012 November 25,
2014
July 3, 2033
46. Electric tool with blade replaced
safely (可安全換刀片的電動工具)
Invention PRC Nanjing
Chervon
Industry
ZL201310276693.2 September 6,
2011
April 27, 2016 September 5,
2031
47. Electric screwdriver (電動螺絲批) Invention PRC Nanjing
Chervon
Industry
ZL201410521101.3 September 30,
2014
April 19, 2017 September 29,
2034
Germany Chervon HK DE202015103607U1 July 9, 2015 July 27, 2015 July 31, 2025United
Kingdom
Chervon HK GB2530826B March 31, 2015 December 16,
2020
March 31,
2035U.S. Chervon HK US10272548B2 March 21, 2017 April 30, 2019 March 31,
2035U.S. Chervon HK US9440339B2 March 31, 2015 September 13,
2016
March 31,
2035
APPENDIX IV STATUTORY AND GENERAL INFORMATION
– IV-21 –
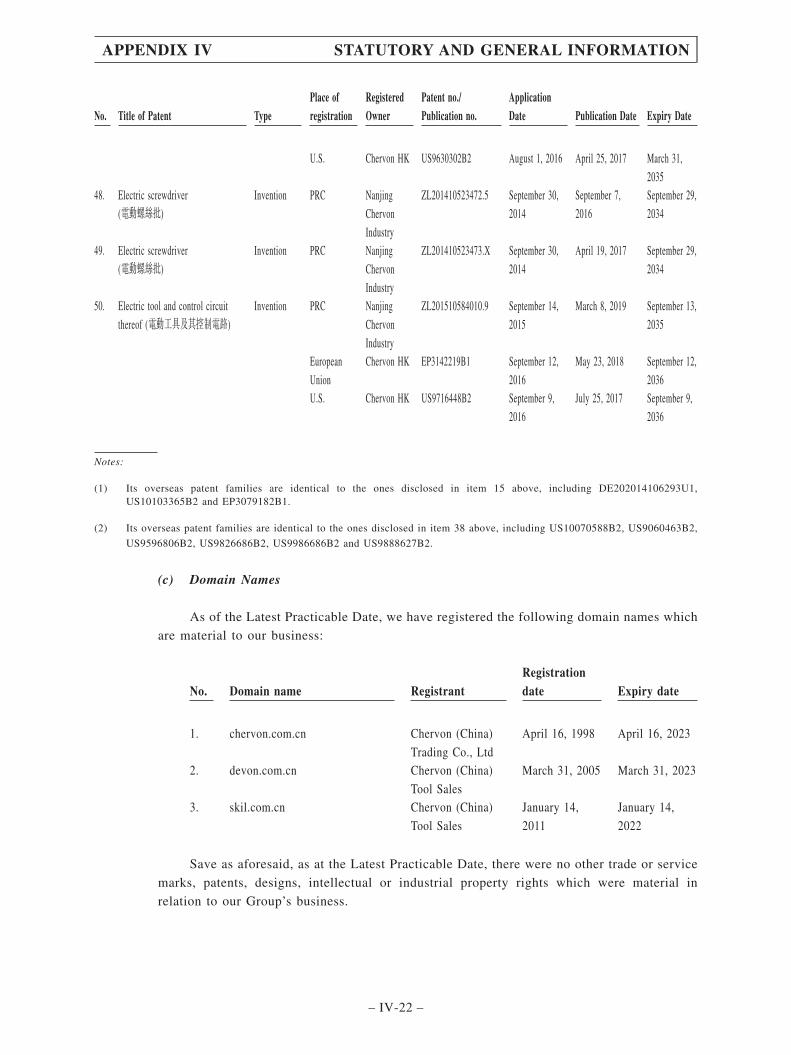
No. Title of Patent TypePlace ofregistration
RegisteredOwner
Patent no./Publication no.
ApplicationDate Publication Date Expiry Date
U.S. Chervon HK US9630302B2 August 1, 2016 April 25, 2017 March 31,
203548. Electric screwdriver
(電動螺絲批)
Invention PRC Nanjing
Chervon
Industry
ZL201410523472.5 September 30,
2014
September 7,
2016
September 29,
2034
49. Electric screwdriver
(電動螺絲批)
Invention PRC Nanjing
Chervon
Industry
ZL201410523473.X September 30,
2014
April 19, 2017 September 29,
2034
50. Electric tool and control circuit
thereof (電動工具及其控制電路)
Invention PRC Nanjing
Chervon
Industry
ZL201510584010.9 September 14,
2015
March 8, 2019 September 13,
2035
European
Union
Chervon HK EP3142219B1 September 12,
2016
May 23, 2018 September 12,
2036U.S. Chervon HK US9716448B2 September 9,
2016
July 25, 2017 September 9,
2036
Notes:
(1) Its overseas patent families are identical to the ones disclosed in item 15 above, including DE202014106293U1,US10103365B2 and EP3079182B1.
(2) Its overseas patent families are identical to the ones disclosed in item 38 above, including US10070588B2, US9060463B2,
US9596806B2, US9826686B2, US9986686B2 and US9888627B2.
(c) Domain Names
As of the Latest Practicable Date, we have registered the following domain names which
are material to our business:
No. Domain name RegistrantRegistrationdate Expiry date
1. chervon.com.cn Chervon (China)
Trading Co., Ltd
April 16, 1998 April 16, 2023
2. devon.com.cn Chervon (China)
Tool Sales
March 31, 2005 March 31, 2023
3. skil.com.cn Chervon (China)
Tool Sales
January 14,
2011
January 14,
2022
Save as aforesaid, as at the Latest Practicable Date, there were no other trade or service
marks, patents, designs, intellectual or industrial property rights which were material in
relation to our Group’s business.
APPENDIX IV STATUTORY AND GENERAL INFORMATION
– IV-22 –

C. FURTHER INFORMATION ABOUT OUR DIRECTORS AND SUBSTANTIALSHAREHOLDERS
1. Directors
(a) Interests of our Directors and the Chief Executive of our Company
Immediately following the completion of the Global Offering and without taking into
account any Shares which may be issued pursuant to the exercise of the Over-allotment Option,
the interests or short positions of our Directors and chief executive of our Company in the
shares, underlying shares and debentures of our Company or our associated corporations
(within the meaning of Part XV of the SFO) which will be required to be notified to our
Company and the Stock Exchange pursuant to Divisions 7 and 8 of Part XV of the SFO
(including interests or short positions which they were taken or deemed to have under such
provisions of the SFO) or which will be required, pursuant to Section 352 of the SFO, to be
entered in the register referred to in that section, or which will be required, pursuant to the
Model Code for Securities Transactions by Directors of Listed Issuers as set out in Appendix
10 to the Listing Rules, to be notified to our Company and the Stock Exchange, once the Shares
are listed, will be as follows:
(i) Interest in our Company
Immediately followingthe completion of
the Global Offering(assuming that the
Over-allotment Optionis not exercised)
Name of Director Nature of interest(1)
Number ofShares held
Approximatepercentage ofshareholding
interest(2)
Mr. Pan Interest in controlled
corporation(3)
260,226,344 54.28%
Ms. Zhang Interest in controlled
corporation(4)
98,835,550 20.62%
Mr. Ke Interest in controlled
corporation(5)
27,118,822 5.66%
Mr. Clancy Interest in controlled
corporation(6)
480,100 0.10%
APPENDIX IV STATUTORY AND GENERAL INFORMATION
– IV-23 –

Notes:
(1) All interests stated are long positions.
(2) The calculation is based on the total number of 479,431,411 Shares in issue immediatelyfollowing the completion of the Global Offering (assuming that the Over-allotment Option is notexercised).
(3) These Shares are held by Panmercy, which is wholly owned by Mr. Pan. Mr. Pan is deemed to beinterested in these Shares for the purposes of the SFO. For details, see the section headed“Substantial Shareholders” in this prospectus.
(4) These Shares include (i) 97,637,750 Shares held by Green Hope, which is wholly owned byMs. Zhang and (ii) 1,197,800 Shares held by two offshore employee shareholding platformspursuant to an employee incentive arrangement, of which Ms. Zhang is the sole director.Ms. Zhang is deemed to be interested in these Shares for the purposes of the SFO. See the sectionsheaded “Substantial Shareholders” and “History, Reorganization and Corporate Structure –Establishment of employee shareholding platforms and issue and allotment of Shares pursuant toan employee incentive arrangement” in this prospectus for details.
(5) These Shares are held by Klamm, which is wholly owned by Mr. Ke. Mr. Ke is deemed to beinterested in these Shares for the purposes of the SFO.
(6) These Shares are held by NP Kun Investment Limited, one of the offshore employee shareholdingplatforms pursuant to an employee incentive arrangement, which is owned as to 46% byMr. Clancy. Mr. Clancy is deemed to be interested in these Shares for the purposes of the SFO.See the section headed “History, Reorganization and Corporate Structure – Establishment ofemployee shareholding platforms and issue and allotment of Shares pursuant to an employeeincentive arrangement” in this prospectus for details.
(ii) Interest in our associated corporations
Name ofDirector Nature of interest
Name of theassociatedcorporation/subsidiary
Approximatepercentage ofshareholding
interest
Mr. Pan Beneficial owner Panmercy 100%Interest in controlledcorporation
Chervon Global 66.72%
Chervon AssetsManagement HoldingsLimited
56.71%
Chervon InvestmentLimited
56.71%
Chervon CapitalManagement Limited
56.71%
Chervon AssetsHoldings Limited
66.72%
Chervon ManagementServices
66.72%
Chervon InternationalTrading
56.71%
JiuhaoElectromechanical
66.72%
Chervon PrecisionTechnology
61.38%
APPENDIX IV STATUTORY AND GENERAL INFORMATION
– IV-24 –
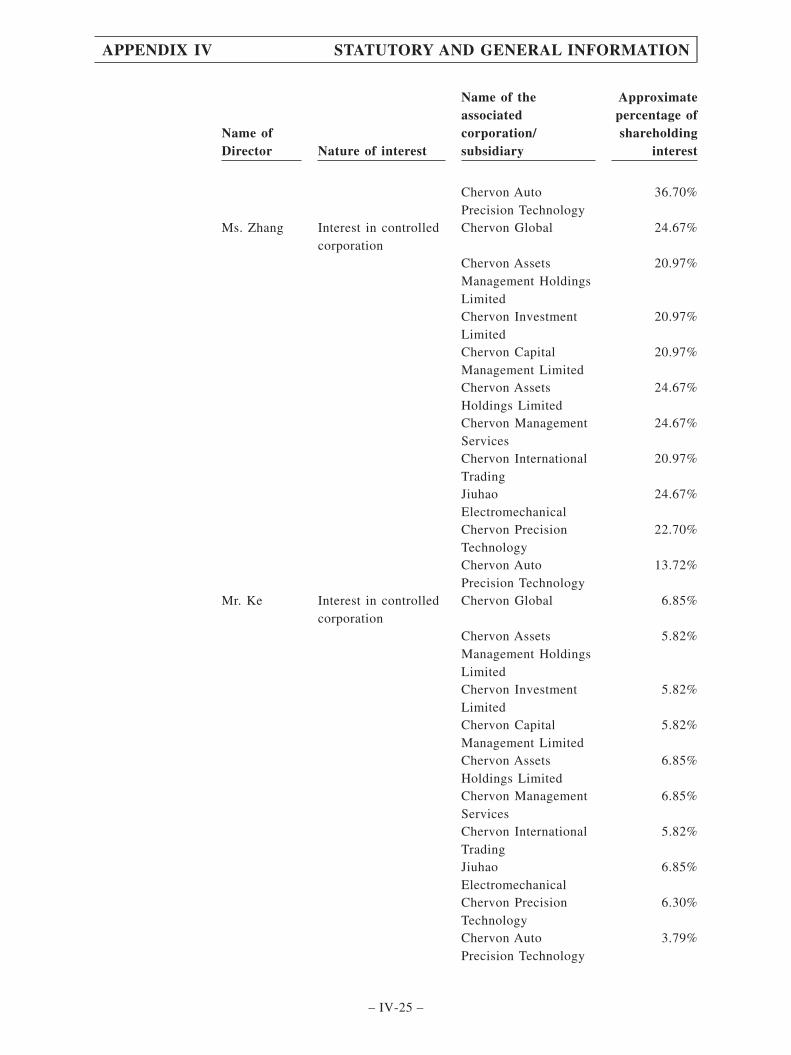
Name ofDirector Nature of interest
Name of theassociatedcorporation/subsidiary
Approximatepercentage ofshareholding
interest
Chervon AutoPrecision Technology
36.70%
Ms. Zhang Interest in controlledcorporation
Chervon Global 24.67%
Chervon AssetsManagement HoldingsLimited
20.97%
Chervon InvestmentLimited
20.97%
Chervon CapitalManagement Limited
20.97%
Chervon AssetsHoldings Limited
24.67%
Chervon ManagementServices
24.67%
Chervon InternationalTrading
20.97%
JiuhaoElectromechanical
24.67%
Chervon PrecisionTechnology
22.70%
Chervon AutoPrecision Technology
13.72%
Mr. Ke Interest in controlledcorporation
Chervon Global 6.85%
Chervon AssetsManagement HoldingsLimited
5.82%
Chervon InvestmentLimited
5.82%
Chervon CapitalManagement Limited
5.82%
Chervon AssetsHoldings Limited
6.85%
Chervon ManagementServices
6.85%
Chervon InternationalTrading
5.82%
JiuhaoElectromechanical
6.85%
Chervon PrecisionTechnology
6.30%
Chervon AutoPrecision Technology
3.79%
APPENDIX IV STATUTORY AND GENERAL INFORMATION
– IV-25 –
(b) Interests of the Substantial Shareholders
Save as disclosed in the section headed “Substantial Shareholders” in this prospectus,
immediately following the completion of the Global Offering and without taking into account
any Shares which may be issued pursuant to the exercise of the Over-allotment Option, our
Directors or chief executive(s) are not aware of any other person (other than a Director or chief
executive of our Company) who will have an interest or short position in the Shares or the
underlying Shares which would fall to be disclosed to our Company and the Stock Exchange
under the provisions of Divisions 2 and 3 of Part XV of the SFO, or are, directly or indirectly,
interested in 10% or more of any class of share capital carrying rights to vote in all
circumstances at general meetings of any other member of our Company.
2. Directors’ Service Contracts and Letters of Appointment
Each of our executive Directors has entered into a service contract with our Company and we
have issued letters of appointment to each of our independent non-executive Directors. The service
contracts with each of our executive Directors and the letters of appointment with each of our
independent non-executive Directors are for an initial fixed term of three years commencing from
December 8, 2021. The service contracts and the letters of appointment are subject to termination in
accordance with their respective terms. The service contracts may be renewed in accordance with our
Articles of Association and the applicable Listing Rules.
Save as disclosed above, none of our Directors has entered, or has proposed to enter, a service
contract with any member of our Group (other than contracts expiring or determinable by the
employer within one year without the payment of compensation (other than statutory
compensation)).
3. Directors’ Remuneration
The aggregate remuneration (including fees, salaries, discretionary bonuses, allowances,
benefits in kind, and contributions to pension schemes) paid to our Directors for the years ended
December 31, 2018, 2019 and 2020 and the six months ended June 30, 2021 were US$1.7 million,
US$1.7 million, US$1.9 million and US$0.6 million, respectively.
Save as disclosed above, no other payments have been made or are payable, in respect of the
years ended December 31, 2018, 2019 and 2020 and the six months ended June 30, 2021, by any of
member of our Group to any of our Directors.
Under the arrangements currently in force, we estimate the aggregate remuneration, excluding
discretionary bonus, of our Directors for the year ending December 31, 2021 to be approximately
US$1,849,000.
APPENDIX IV STATUTORY AND GENERAL INFORMATION
– IV-26 –

4. Disclaimers
Save as disclosed in this prospectus:
(a) none of our Directors or chief executive of our Company has any interests or short
positions in the shares, underlying shares and debentures of our Company or our
associated corporations (within the meaning of Part XV of the SFO) which will be
required to be notified to our Company and the Stock Exchange pursuant to Divisions 7
and 8 of Part XV of the SFO (including interests or short positions which he is taken or
deemed to have taken under such provisions of the SFO) or which will be required,
pursuant to Section 352 of the SFO, to be entered in the register referred to in that section,
or which will be required, pursuant to the Model Code for Securities Transactions by
Directors of Listed Issuers, to be notified to our Company and the Stock Exchange, once
the Shares are listed on the Stock Exchange;
(b) so far as is known to any Director or chief executive of our Company, no person has an
interest or short position in the Shares and underlying Shares which would fall to be
disclosed to our Company and the Stock Exchange under the provisions of Divisions 2
and 3 of Part XV of the SFO, or is, directly or indirectly, interested in 10% or more of
any class of share capital carrying rights to vote in all circumstances at general meetings
of any other member of our Group;
(c) none of our Directors nor any of the persons listed in “– D. Other Information – 5.
Qualification of Experts” below is interested in the promotion of, or in any assets which
have been, within the two years immediately preceding the issue of this prospectus,
acquired or disposed of by or leased to any member of our Group, or are proposed to be
acquired or disposed of by or leased to any member of our Group;
(d) none of our Directors nor any of the persons listed in “– D. Other Information – 5.
Qualification of Experts” below is materially interested in any contract or arrangement
with our Group subsisting at the date of this prospectus which is unusual in its nature or
conditions or which is significant in relation to the business of our Group as a whole;
(e) save in connection with Underwriting Agreements, none of the persons listed in “– D.
Other Information – 5. Qualification of Experts” below has any shareholding in any
member of our Group or the right (whether legally enforceable or not) to subscribe for
or to nominate persons to subscribe for securities in any member of our Group;
(f) none of our Directors has entered or has proposed to enter into any service agreements
with our Company or any member of our Group (other than contracts expiring or
determinable by the employer within one year without payment of compensation other
than statutory compensation); and
(g) none of our Directors, their respective close associates (as defined under the Listing
Rules), or Shareholders who are interested in more than 5% of the issued share capital of
our Company has any interest in our Company’s five largest customers and five largest
suppliers.
APPENDIX IV STATUTORY AND GENERAL INFORMATION
– IV-27 –
D. OTHER INFORMATION
1. Estate duty
Our Directors have been advised that no material liability for estate duty is likely to fall on our
Company or any of our subsidiaries.
2. Litigation
As of the Latest Practicable Date, save as disclosed in in the section headed “Business – Legal
Proceedings and Compliance”, no member of our Group was engaged in any litigation, arbitration
or claim of material importance, and no litigation, arbitration or claim of material importance was
known to our Directors to be pending or threatened by or against our Group, that would have a
material adverse effect on its business, financial condition or results of operations.
3. Joint Sponsors
The Joint Sponsors have made an application on behalf of our Company to the Listing
Committee for the listing of, and permission to deal in, the Shares in issue, the Shares to be issued
pursuant to the Global Offering (including the additional Shares which may be issued pursuant to the
exercise of the Over-allotment Option). All necessary arrangements have been made to enable such
Shares to be admitted into CCASS.
Each of the Joint Sponsors satisfies the independence criteria applicable to sponsors set out in
Rule 3A.07 of the Listing Rules.
The Joint Sponsors are entitled to a fee of US$1,000,000 for acting as our sponsors in
connection with the Global Offering which is to be split equally between the Joint Sponsors.
4. No Material Adverse Change
Our Directors confirm that there has been no material adverse change in the financial or trading
position or prospects of our Group since June 30, 2021 (being the date to which the latest audited
consolidated financial statements of our Group were prepared).
APPENDIX IV STATUTORY AND GENERAL INFORMATION
– IV-28 –

5. Qualification of Experts
The following are the qualifications of the experts (as defined under the Listing Rules and theCompanies (Winding Up and Miscellaneous Provisions) Ordinance) who have given opinions oradvice which are contained in this prospectus:
Name Qualification
China International CapitalCorporation Hong Kong SecuritiesLimited
A licensed corporation to conduct Type 1 (dealing insecurities), Type 2 (dealing in futures contracts), Type 4(advising on securities), Type 5 (advising on futurescontracts) and Type 6 (advising on corporate finance)regulated activities under the SFO
Citigroup Global Markets AsiaLimited
A licensed corporation to conduct Type 1 (dealing insecurities), Type 2 (dealing in futures contracts), Type 4(advising on securities), Type 5 (advising on futurescontracts), Type 6 (advising on corporate finance) andType 7 (providing automated trading services)regulated activities under the SFO
KPMG Certified Public Accountants
Public Interest Entity Auditor registered in accordancewith the Financial Reporting Council Ordinance
Jia Yuan Law Offices PRC Legal Adviser
Frost & Sullivan (Beijing) Inc.,Shanghai Branch Co.
Industry consultant
6. Consents of Experts
Each of the experts as referred to in “– D. Other Information – 5. Qualification of Experts”above in this prospectus has given and has not withdrawn its consent to the issue of this prospectuswith the inclusion of its report(s) and/or letter(s) and/or legal opinion(s) (as the case may be) andreferences to its name included in the form and context in which it respectively appears.
None of the experts named above has any shareholding interests in our Company or any of oursubsidiaries or the right (whether legally enforceable or not) to subscribe for or to nominate personsto subscribe for securities in our Company or any of our subsidiaries.
7. Promoter
Our Company has no promoter for the purpose of the Listing Rules.
Save as disclosed in this prospectus, within the two years immediately preceding the date ofthis prospectus, no cash, securities or other benefit has been paid, allotted or given nor are anyproposed to be paid, allotted or given to any promoters in connection with the Global Offering andthe related transactions described in this prospectus.
APPENDIX IV STATUTORY AND GENERAL INFORMATION
– IV-29 –
8. Preliminary Expenses
We did not incur any material preliminary expenses.
9. Taxation of holders of Shares
The sale, purchase and transfer of Shares registered with our Hong Kong branch register of
members will be subject to Hong Kong stamp duty. The current rate charged on each of the purchaser
and seller is 0.13% of the consideration of or, if higher, of the fair value of the Shares being sold
or transferred. Profits from dealings in the Shares arising in or derived from Hong Kong may also
be subject to Hong Kong profits tax. The Revenue (Abolition of Estate Duty) Ordinance 2005 came
into effect on February 11, 2006 in Hong Kong. No Hong Kong estate duty is payable and no estate
duty clearance papers are needed for a grant of representation in respect of holders of Shares whose
death occurs on or after February 11, 2006.
10. Binding Effect
This prospectus shall have the effect, if an application is made in pursuance of this prospectus,
of rendering all persons concerned bound by all of the provisions (other than the penal provisions)
of Sections 44A and 44B of the Companies (Winding Up and Miscellaneous Provisions) Ordinance
insofar as applicable.
11. Bilingual Prospectus
The English language and Chinese language versions of this prospectus are being published
separately, in reliance upon the exemption provided by section 4 of the Companies (Exemption of
Companies and Prospectuses from Compliance with Provisions) Notice (Chapter 32L of the Laws of
Hong Kong).
If there is any inconsistency between this prospectus and its Chinese translation, this
prospectus shall prevail, provided that if there is any inconsistency between the Chinese names of
the entities or enterprises established in the PRC mentioned in this prospectus and their English
translations, the Chinese names shall prevail. The English translations of the Chinese names of such
PRC entities or enterprises marked with “*” are provided for identification purposes only.
12. Miscellaneous
(a) Save as disclosed in this prospectus:
(i) within the two years immediately preceding the date of this prospectus, neither we
nor any of our subsidiaries has issued or agreed to issue any share or loan capital
fully or partly paid up either for cash or for a consideration other than cash;
(ii) no share or loan capital of our Company or any of our subsidiaries is under option
or is agreed conditionally or unconditionally to be put under option;
APPENDIX IV STATUTORY AND GENERAL INFORMATION
– IV-30 –

(iii) within the 24 months immediately preceding the date of this prospectus, no
commissions, discounts, brokerage or other special terms have been granted in
connection with the issue or sale of any shares or loan capital of any member of our
Group;
(iv) within the two years immediately preceding the date of this prospectus, no
commission has been paid or payable (except commission to sub-underwriters) to
any persons for subscription, agreeing to subscribe, procuring subscription or
agreeing to procure subscription of any shares of our Company or any of our
subsidiaries;
(v) no founder, management or deferred shares of our Company or any of our
subsidiaries have been issued or agreed to be issued;
(vi) our Company has no outstanding convertible debt securities or debentures; and
(vii) there is no arrangement under which future dividends are waived or agreed to be
waived.
(b) Our Directors confirm that there has not been any interruption in the business of our
Company which may have or have had a material adverse effect on the financial position
of our Company in the 12 months immediately preceding the date of this prospectus.
(c) None of the equity and debt securities of our Company, if any, is listed or dealt with in
any other stock exchange nor is any listing or permission to deal being or proposed to be
sought.
APPENDIX IV STATUTORY AND GENERAL INFORMATION
– IV-31 –

1. DOCUMENTS DELIVERED TO THE REGISTRAR OF COMPANIES
The documents attached to a copy of this prospectus and delivered to the Registrar of Companies in
Hong Kong for registration were:
(a) a copy of the GREEN Application Form;
(b) a copy of each of the material contracts referred to in the section headed “Statutory and General
Information – B. Further Information About Our Business – 1. Summary of Material Contracts”
in Appendix IV to this prospectus; and
(c) the written consents referred to in the section headed “Statutory and General Information – D.
Other Information – 6. Consents of Experts” in Appendix IV to this prospectus.
2. DOCUMENTS ON DISPLAY
Copies of the following documents will be published on the Hong Kong Stock Exchange’s website
at www.hkexnews.hk and the Company’s website at https://global.chervongroup.com up to and
including the date which is 14 days from the date of this prospectus:
(a) the Articles of Association of our Company;
(b) the Accountants’ Report prepared by KPMG, the text of which is set out in Appendix I to this
prospectus;
(c) the report on the unaudited pro forma financial information prepared by KPMG, the text of
which is set out in Appendix II to this prospectus;
(d) the audited consolidated financial statements of our Group for the three years ended December
31, 2018, 2019 and 2020 and the six months ended June 30, 2021;
(e) the PRC legal opinions issued by Jia Yuan Law Offices, our PRC legal advisers in respect of
certain aspects of the PRC law;
(f) the industry report issued by Frost & Sullivan, our industry consultant;
(g) the material contracts referred to in the section headed “Statutory and General Information –
B. Further Information About Our Business – 1. Summary of Material Contracts” in Appendix
IV to this prospectus;
(h) the written consents referred to in the section headed “Statutory and General Information – D.
Other Information – 6. Consents of Experts” in Appendix IV to this prospectus; and
(i) service contracts and letters of appointment referred to in the section headed “Statutory and
General Information – C. Further Information about Our Directors and Substantial
Shareholders – 2. Directors’ Service Contracts and Letters of Appointment” in Appendix IV to
this prospectus.
APPENDIX V DOCUMENTS DELIVERED TO THE REGISTRAR OFCOMPANIES AND DOCUMENTS ON DISPLAY
– V-1 –