
Industry Internship and Report on “FMCG & LARGE CAP
75
Industry Internship and Report on “FMCG & LARGE CAP – FUND ANALYSIS FOR LONG TERM BENEFITS” BY Sumant Kumar 1NZ16MBA64 Submitted to DEPARTMENT OF MANAGEMENT STUDIES NEW HORIZON COLLEGE OF ENGINEERING, OUTER RING ROAD, MARATHALLI, BANGALORE In partial fulfillment of the requirements for the award of the degree of MASTER OF BUSINESS ADMINISTRATION Under the guidance of INTERNAL GUIDE EXTERNAL GUIDE Niviya Feston Nandakishore Appanaboyina Sr. Asst. Professor Dir. -Operations & Talent Acquisition 2016-2018
-
Upload
khangminh22 -
Category
Documents
-
view
0 -
download
0
Transcript of Industry Internship and Report on “FMCG & LARGE CAP
Industry Internship and Report on
“FMCG & LARGE CAP – FUND ANALYSIS FOR LONG TERM
BENEFITS”
BY
Sumant Kumar
1NZ16MBA64
Submitted to
DEPARTMENT OF MANAGEMENT STUDIES
NEW HORIZON COLLEGE OF ENGINEERING,
OUTER RING ROAD, MARATHALLI,
BANGALORE
In partial fulfillment of the requirements for the award of the degree of
MASTER OF BUSINESS ADMINISTRATION
Under the guidance of
INTERNAL GUIDE EXTERNAL GUIDE
Niviya Feston Nandakishore Appanaboyina
Sr. Asst. Professor Dir. -Operations & Talent Acquisition
2016-2018

CERTIFICATE
This is to certify that Sumant Kumar bearing USN 1NZ16MBA64, is a bonfide student of
Master of Business Administration course of the Institute Batch 2016-2018, autonomous
program, affiliated to Visvesvaraya Technological University, Belgaum. Internship report
on “FMCG & LARGE CAP – FUND ANALYSIS FOR LONG TERM BENIFITS” is
prepared by him under the guidance of Niviya Feston (Sr. Asst. Professor), in partial
fulfillment of requirements for the award of the degree of Master of Business
Administration of Visvesvaraya Technological University, Belgaum Karnataka.
Signature of Internal Guide Signature of HOD Signature of Principal

DECLARATION
I, Sumant Kumar, hereby declare that the Internship report entitled “FMCG & LARGE
CAP – FUND ANALYSIS FOR LONG TERM BENIFITS” with reference to “Dvija
Digital Pvt. Ltd., Whitefield” prepared by me under the guidance of Niviya Feston (Sr.
Asst. Professor), faculty of M.B.A Department, New Horizon College of Engineering and
external assistance by Dr. Nandakishore Appanaboyina (Director-Operations and Talent
Acquisition), Dvija Digital Pvt. Ltd.
I also declare that this Internship work is towards the partial fulfillment of the university
regulations for the award of the degree of Master of Business Administration by
Visvesvaraya Technological University, Belgaum.
I have undergone an industry internship for a period of Twelve weeks. I further declare that
this report is based on the original study undertaken by me and has not been submitted for
the award of a degree/diploma from any other University / Institution.
Signature of Student
Place:
Date

ACKNOWLEDGEMENT
I Sumant Kumar take this opportunity to express my deep sense of gratitude and whole
hearted thanks along with my profound respect to all those who guided and inspired me in
the completion of project.
First of all I would like to extend my gratitude to our Principal, Dr. Manjunatha for giving
me the opportunity to prepare this project work.
I am thankful to the head of department, Dr. Sheelan Mishra for being the guiding light of
this project.
I am greatly indebted to my internal guide, Ms. Niviya Feston for extending her support
and valuable guidance, without which this project would have not possible.
Lastly, I appreciate the patience and support of my parents, teachers and friends for always
maintaining their faith in me, and have enriched my life with their knowledge and
guidance.
Above all, I would like to thank the amity for making this project a reality.
SUMANT KUMAR
1NZ16MBA64

TABLE OF CONTENTS
Chapter Title Page Nos.
Executive Summary
1 Theoretical Background of the study 1-7
2 Industry and Company Profile 8-41
3 Methodology 42-48
4 Data Analysis and interpretation 49-58
5 Summary of Findings, Suggestion and Conclusion 59-62
6 Learning Experience 63
Bibliography
Annexure

FORMAT OF LIST OF CHARTS AND TABLES
List of Charts
Fact Sheet
No. Particulars Page Nos.
Fact Sheet-4.1 Fact Sheet showing SBI FMCG Fund -
Direct Plan Growth Analysis 50
Fact Sheet-4.2 Fact Sheet showing ICICI Prudential
FMCG Fund Direct Plan-G Analysis 51
Fact Sheet-4.3 Fact Sheet showing Reliance Large Cap
Fund - Direct 52
Fact Sheet-4.4 Fact Sheet showing ICICI Prudential
Balanced Fund Direct Plan Growth 53
List of Tables
Table No. Particulars Page Nos.
Table-4.1 Table showing SBI FMCG Fund - Direct
Plan Growth Analysis 55
Table-4.2 Table showing ICICI Prudential FMCG
Fund Direct Plan-G Analysis 56
Table-4.3 Table showing Reliance Large Cap Fund -
Direct 57
Table-4.4 Table showing ICICI Prudential Balanced
Fund Direct Plan Growth 58

EXECUTIVE SUMMARY
A mutual fund is a collective investment scheme, which specializes in investing a pool of money
collected from many investors for the purpose of investing in securities such as stocks, bonds,
money market instruments and similar assets. It is indirect mode of investing. There are three types
of mutual funds by structure, by investment objective and other fund. This paper is focused FMCG
and Large Cap fund. A Mutual Fund is a trust that pools the savings of a number of investors who
share a common financial goal. It throws the light on how FMCG and Large Cap Mutual funds
really work, how much risk involved in it and how they diversify themselves. Investing involves
risk of loss of principal and is more concerned on the return of investment.
The main objective of the study is to analysis of FMCG and Large Cap Fund for long term and
give investors a basic idea of investing into the FMCG and Large Cap Mutual Funds and encourage
them to invest in those areas where they can maximize the return on their capital. The research
provided an interesting insight into awareness about the mutual funds, differences in risk taking
ability of individuals, investment options preferred etc.
There are 7 parameters taken for calculating risk and return Standard Deviation, Beta, R-squared,
Jensen’s Alpha, Portfolio Turnover Ratio, Sharpe’s Index and Treynor’s Ratio. In this study the
data collected are secondary that is through the factsheets of top funds as on February 2018. The
report is based on the data provided in the factsheets of SBI FMCG Mutual fund &ICICI Prudential
FMCG Mutual Fund and Reliance Large Cap fund & ICICI Prudential Balanced Fund.
BIBLIOGRAPHY
REFERENCE
Prasanna Chandra, Investment Analysis and Portfolio Management.
Fund fact Sheet of a company
www.moneycontrol.com
www.nseindia.com
www.google.com
www.investopedia.com
www.rathi.com
Association of Mutual Funds in India
https://www.pwc.in/assets/pdfs/publications/2017/mutual-funds-2-0-expanding-
into-new-horizons.pdf
www.learn.tradimo.com
www.morningstar.com
RELakhs.com

ANNEXURE
SBI FMCG Fund - Direct Plan

ICICI Prudential FMCG Direct-G

Reliance Large Cap Fund
Report as of 6 May 2018
Reliance Large Cap Fund - Direct Plan - Growth Plan Morningstar® Category Morningstar® Benchmark Fund Benchmark Morningstar Rating™ Large-Cap S&P BSE 100 India TR INR S&P BSE 100 India TR INR QQQQQ
Used throughout report Investment Objective
The primary investment objective of the scheme is to
seek to generate long term capital appreciation by
investing predominantly into equity and equity related
instruments of large cap companies. The secondary
objective is to generate consistent returns by investing
in debt, money market securities, REITs and InvITs.
However, there can be no assurance that the investment
objective of the Scheme will be realized.
Risk Measures 3Y Alpha 0.76 3Y Sharpe Ratio 0.65 3Y Beta 1.04 3Y Std Dev 14.78 3Y R-Squared 93.63 3Y Risk abv avg 3Y Info Ratio 0.28 5Y Risk abv avg 3Y Tracking Error 3.78 10Y Risk - Calculations use S&P BSE 100 India TR INR (where applicable)
Performance
27,000 22,750 18,500 14,250 10,000 5,750
2013 2014 2015 2016 2017 2018-04
- 55.70 1.85 3.43 39.91 -1.26 Fund 7.56 34.21 -1.95 5.02 33.27 1.49 Benchmark 4.26 40.45 -0.86 4.42 31.60 0.54 Category
Trailing Returns % Fund Bmark Cat Quarterly Returns % Q1 Q2 Q3 Q4 3 Months -2.78 -0.73 -1.21 2018 -6.67 - - - 6 Months -0.38 1.27 0.64 2017 15.20 6.33 2.40 11.54 1 Year 14.24 14.46 12.54 2016 -5.47 6.58 8.54 -5.41 3 Years Annualised 11.66 10.64 9.65 2015 5.12 -2.02 -3.21 2.17 5 Years Annualised 19.11 14.66 14.67 2014 8.38 22.39 6.36 10.36
Portfolio 31/03/2018
Asset Allocation % Net Stocks 98.50 Bonds 0.00 Cash 1.26 Other 0.24
Equity Style Box™ S
ize
Large
Sm
all Value Blend Growth Style
Mkt Cap % Fund Giant 44.94 Large 40.55 Medium 13.27 Small 1.24 Micro 0.00 Average Mkt Cap Fund (Mil)
Ave Mkt Cap INR 809,870. 06
America Europe Asia <25 25-50 50-75 >75
Top Holdings
Holding Name Sector %
HDFC Bank Ltd y 6.44 State Bank of India y 6.23 Larsen & Toubro Ltd p 4.46 ITC Ltd s 4.17 Infosys Ltd a 3.69
ICICI Bank Ltd y 3.63 Bajaj Finance Ltd y 3.01 Tata Steel Ltd r 2.97 Divi's Laboratories Ltd d 2.96 ACC Ltd r 2.56
Assets in Top 10 Holdings % 40.11 Total Number of Equity Holdings 54 Total Number of Bond Holdings 0
Operations
Fund Company Reliance Nippon Life Asset Management Ltd Phone +91 22 30994600/30301111 Website www.reliancemutual.com Inception Date 01/01/2013 Manager Name Sailesh Raj Bhan Manager Start Date 08/08/2007 NAV (04/05/2018) INR 33.83 Total Net Assets (mil) 88,251.43 INR (31/03/2018)
Stock Sector Weightings % Fund World Regions % Fund
hCyclical 50.27 Americas 0.00
rBasic Materials 7.73 United States 0.00
tConsumer Cyclical 11.60 Canada 0.00
yFinancial Services 30.93 Latin America 0.00
uReal Estate - Greater Europe 0.00
jSensitive 30.40 United Kingdom 0.00
iCommunication Services 2.04 Eurozone 0.00
oEnergy 6.85 Europe - ex Euro 0.00
pIndustrials 14.02 Europe - Emerging 0.00
aTechnology 7.49 Africa 0.00
kDefensive 19.34 Middle East 0.00
Greater Asia 100.00
sConsumer Defensive 7.48
dHealthcare 8.56 Japan 0.00
fUtilities 3.29 Australasia 0.00
Asia - Developed 0.00
Asia - Emerging 100.00
Share Class Size (mil) - Minimum Initial Purchase 5,000 INR
Domicile India Minimum Additional Purchase 1,000 INR
Currency INR Exit Load 1.00% - 0-1 years
UCITS - 0.00% - >1 years
Inc/Acc Acc Expense Ratio 1.13%
ISIN INF204K01XI3
© 2018 Morningstar. All Rights Reserved. The information, data , analyses and opinions (“Information”) conta ined here in: (1) inc lude the proprie ta ry information of Morningstar and Morningstar’s third party licensors; (2) may
ß ®
not be copied or redistributed except as specifica lly authorised;(3) do not constitute investment advice;(4) a re provided sole ly for informationa l purposes; (5) are not warranted to be comple te, ac cura te or time ly; and (6) may
be drawn from fund da ta published on various da tes. Morningsta r is not responsible for any trading dec isions, damages or other losses rela ted to the Information or its use . Please verify a ll of the Information before usin g it
and don’t make any investment dec ision except upon the advice of a professiona l financ ia l adviser. Past pe rformance is no guarantee of future results. The va lue and income derived from investments may go down as well
as up.
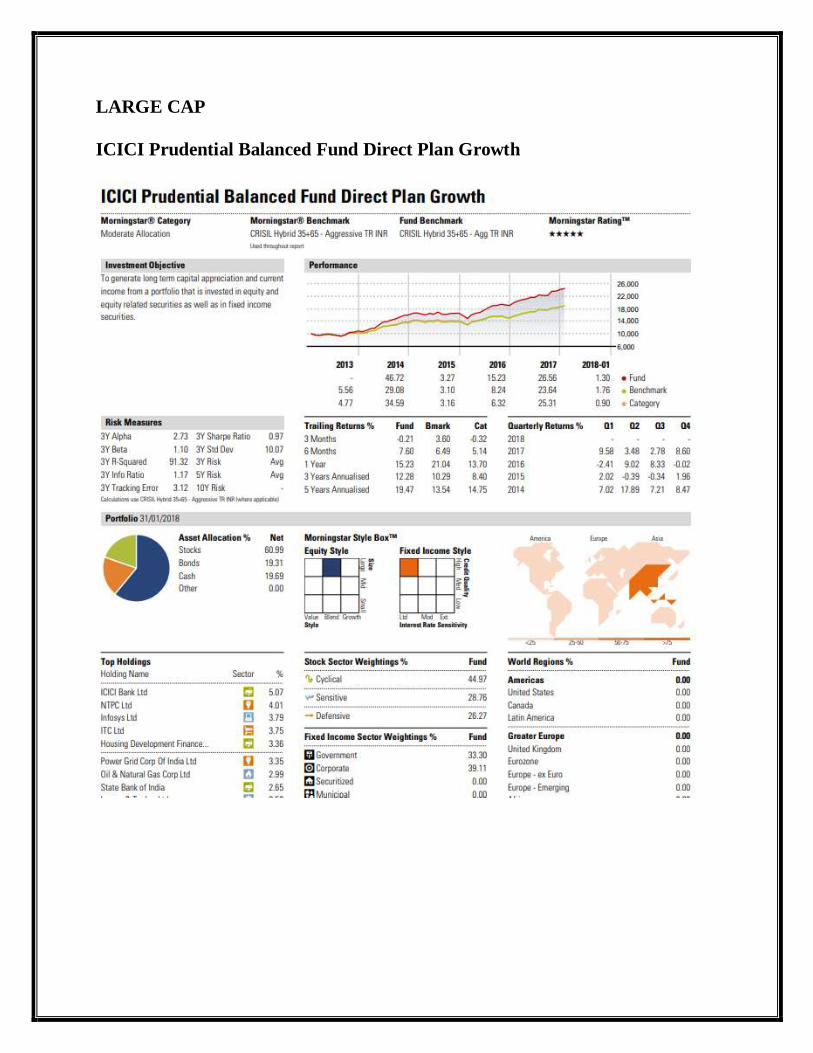
LARGE CAP
ICICI Prudential Balanced Fund Direct Plan Growth

CHAPTER - 1
INTRODUCTION
1. What is Mutual Fund?
Mutual funds are a collective investment vehicle that is they show an indirect way in which
investors can invest in capital market. The objective is to collect the funds, from the investors
and then invest these fund insecurities permitted under the regulations, such kind of
investment is ideal for small investors who want to invest in stock market but cannot in most
of the scrips because of limited amount of capital at their disposal. Mutual funds are suitable
for those investors who do not have sufficient knowledge of capital market and by investing
through a mutual fund. Mutual fund is one of the money related instrument in capital market
here the examination depends on the observational examination on the execution of common
fund schemes, fundamental motivation behind the investigation is to recognize which of the
month and year plot give by most astounding return and limit the hazard. The governing body
of trust gives direction, control, and also manages the overall affairs of the mutual fund. The
trustee has to be a person of high reputation and integrity. One of the member of governing
body becomes a full-time executive of the trust and heads a company known as Asset
Management Company (AMC). Asset Management Company design fund goods,
international financial instrument. So mutual fund industry is high competitive and fund
manager investment style and research team also affecting risk and return of the fund. An
important practical motivation for mutual fund performance evaluation is to help an investor
decide in which mutual funds to invest.
2. What is a FMCG company?
In this study, the aim is to check on how funds focusing on the FMCG sector are performing.
FMCG or Fast Moving Consumer Goods companies deal in manufacture, packing and
distribution of goods that are bought by customers frequently and hence are sold quickly and
relatively at a lower cost.
Sector specific mutual funds invest in specific category of companies only and in this case a
FMCG fund would invest in many companies but only within the FMCG category.

2
3. What are Large Cap funds?
Companies with market capitalization higher than $10 billion are termed as Large Cap
companies. Market capitalization is simply the number of a company's shares outstanding by
its stock price per share.
Sector specific mutual funds invest in specific category companies only and in this case a
Large Cap fund would invest in many companies but only within the Large Cap category.
THE HYPOTHESIS to prove in this study is Long term Equity funds deliver higher returns
in the long term (5yrs for this study) in comparison to FMCG funds.

4. Measuring tools and Techniques:
4.1. Return: Return on a typical investment consists of two components. The basic is the
periodic cash receipts (or income) on the investment, either in the form of interest or
dividends. The second component is the change in the price of the assets-commonly called
the capital gain or loss. This element of return is the difference between the purchase price
and the price at which the assets can be or is sold; therefore, it can be a gain or a loss.
The return has been calculated as under:
NAVt – NAVt-1
Portfolio return: Rit = ---------------------------------
NAV t-1
Where Rit is the difference between Net Asset Values for two consecutive days dividend by
the NAV of the preceding day.
M.indt – M.indt-1
Market return: Rmt = ------------------------
M.indt-1
Where Rmt is the difference between market indices of two consecutive day’s dividend by
the market index for the preceding day.
4.2. Risk: Risk is neither good nor bad. Risk in holding securities is usually related to the
likelihood that completed returns are going to be but expected returns. The difference
between the required rate of returns on mutual fund investment and the risk free return is the
risk premium. Risk can be measured in terms of Beta & standard deviations.
4.3. Standard deviation: - It is wont to measure the variation in individual returns from the
average expected returns over a particular amount. Standard deviation is employed within
the construct of risk of a portfolio of investments. Higher standard deviation suggests
that a bigger fluctuation in expected come.
Standard deviation may be a measure of the dispersion of a collection of data from its
mean. It’s calculated because the root of variance by determinative the variation

4
between every data point relative to the mean. If the data points area unit away from the
mean, there's higher deviation within the data set.
In finance, standard deviation may be an applied mathematics measurement; once applied to
the annual rate of return of an investment, it sheds lightweight on the historical volatility of
that investment. The bigger the standard deviation of a security, the bigger the variance
between every worth and also the mean, indicating a bigger worth vary. As an example, a
volatile stock features a high variance, whereas the deviation of a stable ordinary shares is
sometimes rather low.
4.1. What's Standard Deviance Used For?
Standard deviation is associate degree particularly great tool in investment and
commercialism methods, because it helps measure market and security volatility and predict
performance trends. As it relates to investment, for instance, associate degree open-end
fund may be expected to have a low standard deviation versus its benchmark index, because
the fund's goal is to duplicate the index. Aggressive growth funds on the opposite hand, may
be expected to possess a high standard deviation from relative stock indices, as their portfolio
managers build aggressive bets in an endeavor to get higher-than-average returns. A
lower standard deviation is not essentially desirable. It all depends on the type of investments
one is creating, and also the one's disposition to assume risk. Once coping with the number of
deviation in their portfolios, investors ought to take into account each their personal tolerance
for volatility and their overall investment objectives. A lot of aggressive investors could also
be snug with associate degree investment strategy that opts for vehicles with higher-than-
average volatility, whereas a lot of conservative investors might not.
4.2. Calculating a Standard Deviation
The formula for standard deviation uses 3 variables. The primary variable is to be the
worth of every purpose inside the data set, historically listed as x, with a sub-number
denoting every extra variable (x, x1, x2, x3, etc.). The mean, or average, of the data points is
applied to the worth of the variable M, and therefore the range of
information points concerned is appointed to the variable n.
To determine the mean, the values of the data points should be additional along, which total
is then divided by the quantity of data points that were enclosed? For instance, if the
data points were 5, 7, 3 and 7, the entire would be 22. That total of twenty-two would then be

5
divided by the quantity of data points, during this case four, leading to a mean of 5.5.
This ends up in the subsequent determinations: M = 5.5 and n = 4.
The variance is decided by subtracting the worth of the mean from every information, leading
to -0.5, 1.5, -2.5 and 1.5. Every of these values area unit then square, leading to 0.25, 2.25,
6.25 and 2.25. The sq. values area unit then additional along, leading to a complete of 11
that is then divided by the worth of n-1 that is 3 during this instance leading to a variance or
so of 3.67.The root of the variance is then calculated, leading to the quality deviation of
roughly 13.46.
5. Beta: - Beta measures the systematic risk and shows how prices of securities respond to
the market forces. It is calculated by relating the return on a security with return for the
market. By convention, market will have beta 1.0.Mutual fund is said to be volatile, more
volatile or less volatile. If beta is greater than 1 the stock is said to be riskier than market. If
beta is less than 1, the indication is that stock is less risky in comparison to market. If beta is
zero then the risk is the same as that of the market. Negative beta is rare.
ß = Covariance / (SD) 2
Where, Covariance is the average of the products of deviations for each data point pair. And,
covariance is calculated as:
Covariance = 1/n Σ (xi –µ x) (yi - µy)
Where, x = scheme returns. y = market returns.
µ = mean. β = n Σxy - (Σx) (Σy) nΣx 2 -(Σx)
Where, n = number of years, X = rolling returns of the BSE index, Y = rolling returns of the
schemes
5.2. Using Beta
A security's beta should only be used when a security has a high R-squared value in relation
to the benchmark. The R-squared measures the percentage of a security's historical price
movements that could be explained by movements in a benchmark index.

6
6. Sharpe index
Sharpe index measures risk premium of a portfolio, relative to the total amount of risk in the
portfolio. Sharpe index summarizes the risk and return of a portfolio in a single measure that
categorizes the performance of funds on the risk adjusted basis. The larger the Sharpe’s index
the portfolio over performs the market and vice versa.
6.1. Formula to calculate Sharpe’s measure is:
Where, St = Sharpe’s index Rp= portfolio return, Rf= Risk free rate of return (5%) SD=
Standard Deviation of the portfolio.
6.2. Applications of the Sharpe Ratio
The Sharpe proportion is frequently used to think about the adjustment in a portfolio's general
hazard return attributes when another advantage or resource class is added to it. For instance,
a portfolio director is thinking about adding a flexible investments allotment to his current
50/50 venture arrangement of stocks and bonds which has a Sharpe proportion of 0.67. In the
event that the new portfolio's assignment is 40/40/20 stocks, securities and an expanded
support investments allotment (maybe a reserve of assets), the Sharpe proportion increments
to 0.87. This demonstrates despite the fact that the support stock investments venture is
dangerous as an independent introduction, it really enhances the hazard return normal for the
consolidated portfolio, and in this way includes a broadening advantage. On the off chance
that the option of the new speculation brought down the Sharpe proportion, it ought not to be
added to the portfolio.
The Sharpe proportion can likewise help clarify whether a portfolio's overabundance returns
are because of savvy speculation choices or a consequence of an excess of hazard. Albeit one
portfolio or reserve can appreciate higher returns than its associates, it is just a decent
speculation if those higher returns don't accompany an abundance of extra hazard. The more

7
prominent a portfolio's Sharpe proportion, the better its hazard balanced execution. A
negative Sharpe proportion shows that a hazard less resource would perform superior to
anything the security being broke down.
7. Treynor’s Index
The Treynor proportion, otherwise called the reward-to-unpredictability proportion, is a
metric for restores that surpass those that may have been picked up on a hazard less
speculation, per every unit of market chance. The Treynor proportion, created by Jack
Treynor, is computed as takes after:
(Normal Return of a Portfolio – Average return of the Risk-Free Rate)/Beta of the Portfolio.
It quantifies portfolio chance as far as beta, which is weighted normal of individual security
beta. The proportion is financial specialists, for who the store speaks to just a small amount of
their aggregate resources. The higher the proportion better is the execution.
At the point when the estimation of the Treynor proportion is high, it means that a speculator
has created exceptional yields on every one of the market dangers he has taken. The Treynor
proportion takes into consideration a comprehension of how every venture inside a portfolio
is performing. It likewise gives the financial specialist a thought of how effectively capital is
being utilized.
8. Alpha
The Jensen's measure is a hazard balanced execution measure that speaks to the arrival on
venture above or beneath that anticipated this metric is likewise generally alluded to as
Jensen's alpha, or just alpha.
The measure of the alpha shows the stock's unsystematic return and its normal return free of
market return. If the fund produces the expected return at the level of risk assumed, the fund
would have an alpha equal to zero. A positive alpha indicates that the manager produced
return greater than expected for the risk taken. Alpha is calculated by comparing the fund’s
actual performance with the risk adjusted expected return.
Jensen's alpha is calculated using the following four variables:
R(i) = the realized return of the portfolio or investment
R(m) = the realized return of the appropriate market index
R(f) = the risk-free rate of return for the time period
B = the beta of the portfolio of investment with respect to the chosen market index

8
Using these variables, the formula for Jensen's alpha is:
Alpha = R(i) - (R(f) + B x (R(m) - R(f))
9. R-squared
R-squared may be an applied math measure that represents the proportion of a fund or
security's movements which will be explained by movements in index. R-squared
values vary from zero to one and square measure unremarkably explicit as percentages
from 0 to 100 percent. An R-squared of 100 percent means that all movements of a
security square measure fully explained by movements within the index. A high R-squared,
between 85th and 100 percent, indicates the fund's performance patterns are in line with the
index. A fund with a low R-squared, at 70th or less, indicates the safety doesn't act very
like the index. If a fund incorporates an R-squared worth of near 100 percent however has a
beta below1, it's presumably giving higher risk-adjusted returns.
10. Portfolio turnover ratio
Portfolio turnover is a measure of how habitually resources inside a store are purchased and
sold by the chiefs. Portfolio turnover is ascertained by taking either the aggregate sum of new
securities obtained or the measure of securities sold - whichever is less - over a specific
period, separated by the aggregate Net Asset Value of the reserve. The estimation is typically
detailed for a year day and age. The portfolio turnover estimation ought to be considered by a
speculator before choosing to buy a given shared store or comparable money related
instrument. All things considered, a firm with a high turnover rate will acquire more
exchange costs than a reserve with a lower rate. Unless the prevalent resource choice renders
benefits that counterbalance the additional exchange costs they cause, a less dynamic
exchanging stance may produce higher store returns.
Moreover, cost cognizant store speculators should observe that the value-based business
charge costs are excluded in the count of a reserve's working cost proportion and in this way
speak to what can be, in high-turnover portfolios, a noteworthy extra cost that diminishes
venture return.

9
CHAPTER - 2
INDUSTRY PROFILE AND COMPANY PROFILE
2.1. INTRODUCTION TO MUTUAL FUND
A Mutual Fund gets investment from investors and invests it on behalf of the investors into
diversified Securities thus providing investors with both diversification of their portfolio and
professional management of their funds. Mutual fund may launch many such mutual funds to
investment in different sectors and different combination of factors namely developing
market companies, or new age companies, stable and very minimal risk sectors, high risk and
high return sectors etc.
A mutual fund invests in stocks, bonds, options, money market securities, and commodities,
to name a few depending on the fund’s investment objectives. An investor may choose from
many different mutual funds currently in the market based on his or her risk profile and
investment criteria. Mutual fund is an ideal investment route for individuals who are not
aware or well aware of the investing techniques, limited or no financial literacy regards to
investment tools, techniques and hence cannot invest in the equity or other financial
instruments directly. Investor can invest directly in a mutual fund or hire the services of a
mutual fund advisor.
Over the past decade, mutual funds have increasingly become the investor’s vehicle of choice
for long term investing. As of late, the rising pattern in the common store industry is the
forceful development of the remote claimed shared reserve organizations and the decrease of
the organizations glided by nationalized banks and little private segment players.
What is a Mutual Fund?
Mutual fund is the most popular investment avenue for general public or retail investors.
These are simple to understand and easy to invest compared to other investment options
available in the financial markets. A Mutual Fund pools the funds contributed by a number of
investors who may share a common profile on their investment choice which primarily
concerns with risk taking ability and return expected and the size of investment is also
comparatively smaller. The primary concerns of the small investors the security of their
investment.

10
The cash hence gathered is then put resources into capital market instruments, for example,
offers, debentures and different securities. These funds are like baskets where each basket
holds a certain type of instruments or a blend of multiple instruments like stocks, bonds or a
combination of stocks and bonds for one portfolio. The wage earned through these ventures
and the capital gratefulness acknowledged is shared by its unit holders in extent to the
quantity of units possessed by them Thus a Mutual Fund is most suitable investment for the
common man as it offers an opportunity to invest in a diversified, professionally managed
basket of securities at a relatively low cost.
The value of investment is calculated on a day to day basis and the same value is reported
using Net Asset Value as declared by the fund house. This NAV can change due to change in
the value of bond and equity market and therefore a diversified portfolio would balance out
the risk where some stocks may be doing very well and some not so well. The fund managers
make alteration in the portfolio time to time secure higher return as compare to the other
financial assets.
The flow chart below describes broadly the working of a Mutual fund.
2.2. Mutual Fund Operation Flow Chart

11
2.3. Organization structure of a Mutual Fund Company
Sponsors – One or more persons who come together to establish a mutual fund and
register the same with Securities and Exchange Board of the respective country. For
e.g. in India it is SEBI. The person(s) may also consider setting the mutual fund
jointly with another corporate. Sponsor’s track record of staying actively engaged
with the stock market along with running profitable operations will be considered
while evaluating the registration.
The sponsors then form a Trust as per the Trust Act in the respective country. In India
the Trust Act of 1882 is used for the formation of trust. Mutual Fund is also the trust
which holds the investments. A trust deed is prepared detailing the intended activities
of the trust with the underlying principles and actions needed to protect the interest of
investors is filed with Securities and Exchange Board.
Trustees –Sponsors then appoint the Trustees who chief responsibility is to protect
the financial interests of the mutual fund holders. As a rule there will be restrictions to
appoint trustees who are connected with Sponsor. In India, 2/3rd of Trustees should
not be connected with Sponsors and are addressed as Independent directors.
Asset Management Company (AMC) –Asset Management Company is
appointed by the Trustees as the investment manager of the Mutual Fund. The AMC
can in turn appoint the Registrar and Transfer Agent for the Mutual Fund.
Registrar & Transfer Agent –The registrar and transfer agent stay in touch with
the investors and periodically share reports or account statements.
Custodian – The custodian is a bank, a trust company, or an agent who holds and
safeguards investor’s mutual funds.
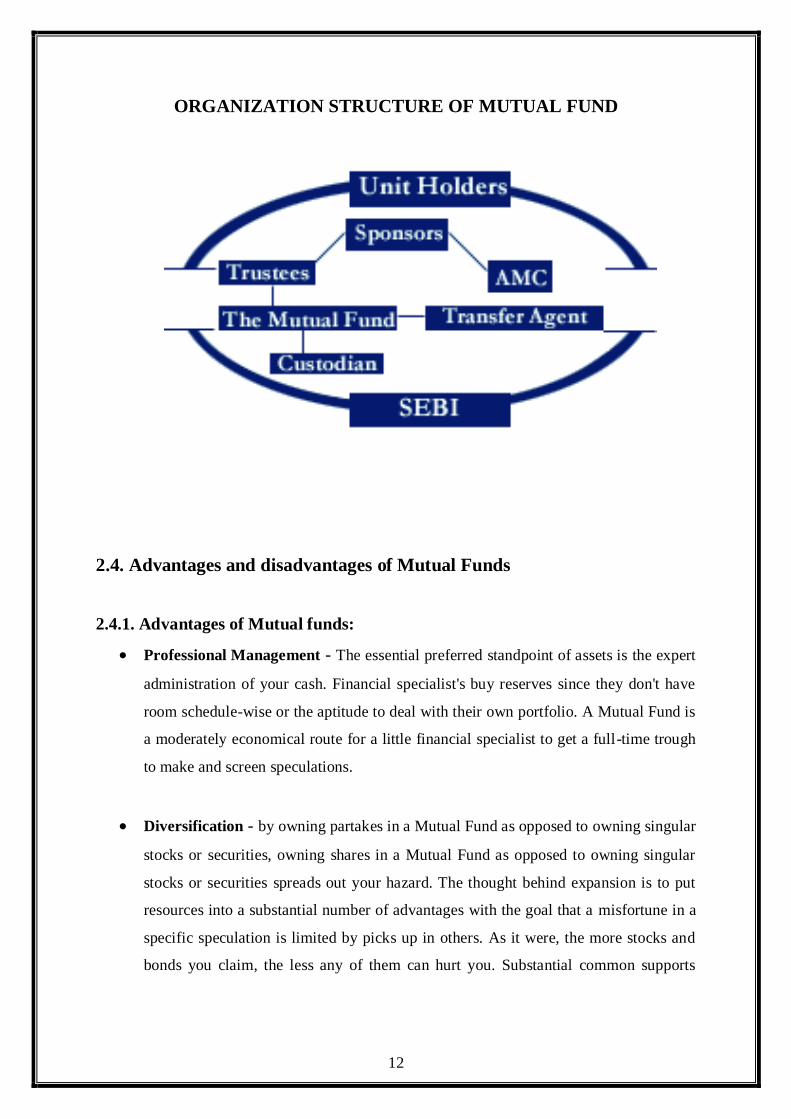
12
ORGANIZATION STRUCTURE OF MUTUAL FUND
2.4. Advantages and disadvantages of Mutual Funds
2.4.1. Advantages of Mutual funds:
Professional Management - The essential preferred standpoint of assets is the expert
administration of your cash. Financial specialist's buy reserves since they don't have
room schedule-wise or the aptitude to deal with their own portfolio. A Mutual Fund is
a moderately economical route for a little financial specialist to get a full-time trough
to make and screen speculations.
Diversification - by owning partakes in a Mutual Fund as opposed to owning singular
stocks or securities, owning shares in a Mutual Fund as opposed to owning singular
stocks or securities spreads out your hazard. The thought behind expansion is to put
resources into a substantial number of advantages with the goal that a misfortune in a
specific speculation is limited by picks up in others. As it were, the more stocks and
bonds you claim, the less any of them can hurt you. Substantial common supports

13
ordinarily claim several distinct stocks in a wide range of businesses. A speculator
wouldn't be able to fabricate this sort of portfolio with a little measure of cash.
Economies of Scale - Because a shared reserve purchases and offers a lot of
securities at any given moment, its exchange costs are lower than you as an individual
would pay.
Liquidity - Just like an individual stock, a common store enables you to ask for that
your offers be changed over into money whenever.
Simplicity – Buying a shared store is simple! Really well any bank has its own
particular line of common assets, and the base speculation is little. Most organizations
additionally have programmed buy designs whereby as meager as $100 can be
contributed on a month to month premise.
2.4.2. Disadvantages of Mutual Funds:
Poor Management – Did you see how we qualified the upside of expert
administration with the word" hypothetically"? Numerous financial specialists banter
about whether or not the alleged experts are any superior to you or I at picking stocks.
Administration is in no way, shape or form trustworthy, and, regardless of whether the
reserve loses cash, the director still takes his/her cut.
Costs - Mutual Funds don't exist exclusively to make your life less demanding all
assets are in it for a benefit. The shared reserve industry is awesome at purchasing
costs under layers of language. These expenses are complicated to the point that in
this instructional exercise we have given a whole segment to the subject
Dilution - It's conceivable to have excessively expansion. Since stores have little
possessions in such a large number of various organizations, exceptional yield from a
couple of ventures regularly don't have much effect on the general return. Weakening
likewise the aftereffect of a win finance getting too enormous. At the point when cash

14
fills subsidizes that have had solid achievement, the chief regularly experiences
difficulty finding a decent speculation for all the new organization.
Taxes - when profiting, subsidize supervisors don't think about your own duty
circumstance. For instance, when a reserve administrator offers a security, a capital-
pick up charge is activated, which influences how productive the individual is from
the deal. It may have been more invaluable for the person to concede the capital
additions risk. Amid an average year, most effectively oversaw common assets offer
somewhere in the range of 20 to 70% of the securities in their portfolios. In the event
that your store makes a benefit on its business, you will pay imposes on the pay you
get, regardless of whether you reinvest the cash you made.
2.5. Mutual Funds have their drawbacks and may not be for everyone:
No Guarantees: No investment is risk free. On the off chance that the whole
securities exchange decreases in esteem, the estimation of common reserve offers will
go down also, regardless of how adjusted the portfolio. Investors encounter fewer
risks when they invest in mutual funds than when they buy and sells stocks on their
own. In any case, any individual who contributes through a common store risks losing
cash.
Charges and commissions: All assets charge authoritative charges to cover their
everyday costs. Some funds also charge sales commission or “loads” to compensate
brokers, financial consultants, or financial planners. Even if you don’t use a broker or
other financial adviser, you will pay a sales commission if you buy shares in a Load
Funds
Management Risk: When an individual invest in Mutual Fund, depend on the fund’s
manager to make the right decisions regarding the fund’s portfolio. If the manager
does not perform as well individual had hoped, he might not make as much money on
individual investment as he expected. Of course, if individual invest in Index Funds,
he forego management risk, because these funds do not employ managers.

15
2.6. Types of Mutual Funds In India
Wide variety of Mutual Fund Schemes exists to cater to the needs such as financial position,
risk tolerance and return expectations etc. The table below gives an overview into the existing
types of Schemes in the industry.
Types of Mutual Fund Schemes
2.6.1. By Structure
i. Open –Ended Schemes
ii. Close-Ended Schemes
iii. Interval Schemes
2.6.2 By investment Objective
i. Growth Schemes
ii. Income Schemes
iii. Balanced Schemes
iv. Money market Schemes
2.6.2. Others Schemes
i. Tax Saving Schemes
ii. Special Schemes
iii. Index Schemes
iv. Sector Specific Schemes
Classification of Mutual Fund
Mutual Fund Scheme can be classified into open-ended scheme and close-ended scheme
depending on its maturity period.
2.6.1. By Structure
i. Open-ended Scheme
An Open-ended scheme is one that is available for subscription and repurchase on a
continuous basis. These schemes do not have a fixed maturity period. Investors can

16
conveniently buy and sell units at Net Asset Value (NAV) related process, which are
declared on a daily basis. The key features of open-ended Schemes are liquidity.
ii. Close-ended Scheme
A Close-ended scheme has a stipulated maturity period e.g. 5-7 years. The fund is
open for subscription only during a specified period at the time of launch of the
scheme. Investors can invest in the scheme at the time of the initial public issue and
thereafter they can buy or sell the units of the scheme on the stock exchanges where
the units are listed. In order to provide an exit route to the investors, some close-ended
funds give an option of selling back the units to the mutual fund through periodic
repurchase at NAV related prices. SEBI Regulations stipulate that at least one of the
two exit routes is provided to the investor either repurchase facility or through listing
on stock exchanges. These mutual funds schemes disclose NAV generally on weekly
basis.
iii. Interval Scheme
Interval Schemes are those that join the highlights of open-ended and close-
ended fund. The units might be exchanged on the stock trade or might be open
available to be purchased or recovery amid pre-decided interims at NAV
related costs.
2.6.2. Categorization by Investment Objective
A Scheme can also be classified as growth scheme, income scheme, or balanced scheme
considering its investment objective. Such schemes may be open-ended or closed-ended
schemes as described earlier. Such schemes may be classified mainly as follows
i. Growth/ Equity Oriented Schemes
The point of development reserves is to give capital increase over the medium to long
haul. Such plans typically invest a major part of their corpus in equities. Such funds
have comparatively high risks. These schemes provide different options to the
investors like dividend option, capital appreciation etc. and the investors may choose
an option depending on their preferences. The financial specialists must show the
choice in the application frame. The common supports additionally enable the

17
financial specialists to change the choices at a later date. Growth schemes are good
for investors to change the options at a later date. Development plans are useful for
speculators having a long haul viewpoint looking for increase over some stretch of
time.
ii. Income/ Debt Oriented Scheme
The point of pay stores is to give customary and relentless salary to investors. Such
plans by and large put resources into settled salary securities, for example, securities,
corporate debentures, Government securities and currency showcase instruments.
Such subsidizes are less risky than contrast of equity schemes. These funds are not
affected because of fluctuation in equity markets. However, opportunities of capital
appreciation are also limited in such funds. The NAVs of such funds affected because
of change in interest rates in the country. On the off chance that the financing costs
fall, NAVs of such subsidizes are probably going to increment in the short run and the
other way around. Nonetheless, long haul investors may not make a fuss over these
variances.
iii. Balanced Fund or Hybrid Fund or Asset Allocation Funds
The aim of balanced funds is to provide both growth and regular income as such
schemes invest both in equities and fixed income securities in the proportion indicated
in their offer documents. These are acceptable for investors looking for moderate
growth. They generally invest 40-60 per cent in equity and debt instruments. These
funds a re also affected because of fluctuations in share prices in the stock markets.
Be that as it may, NAVs of such funds are probably going to be less unstable
contrasted with pure equity fund.
iv. Money Market or Liquid Fund
These funds are also income funds and their aim to provide easy liquidity,
preservation of capital and moderate income. These plans put only in more secure
here and now instruments, for example, Treasury Bills, Certificates of Deposits, and
Commercial Paper and between banks call cash, Government Securities, and so on.
Returns on these schemes fluctuate much less compared to other funds. These funds
18
are fitting for corporate and singular financial specialists as a way to stop their surplus
supports for brief periods.
2.5.3. Others Funds
i. Gilt fund
These funds invest exclusively in government securities. Government Securities have
no default risk. NAVs of these schemes also fluctuate due to change in interest rates
and other economic factor as is the case with income or debt oriented schemes.
ii. Index Funds
Index Funds replicate the portfolio of a particular index such as the BSE Sensitive
index, S&P NSE 50 index (Nifty), etc. These schemes invest in the securities in the
same weightings comprising of an index. NAVs of these plans likewise vary because
of progress in financing costs and other monetary factor similar to the case with wage
or obligation arranged plans. Though not exactly by the same percentage due to some
factors known as “tracking error” in technical terms. Necessary disclosures in this
regard are made in the offer document of the mutual fund scheme. There are also
exchange traded index funds launched by the mutual funds which are traded on the
stock exchanges.
iii. Sector specific funds / Schemes
These are the assets or plans, which put resources into the securities of just those
segments or enterprises as indicated in the offer archives e.g. Pharmaceuticals,
programming, Fast Moving Consumer Goods (FMCG), Petroleum stocks, and so
forth. The profits in these assets are subject to the execution of the separate
parts/ventures. While these assets may give higher returns, they are more dangerous
contrasted with enhanced assets. Financial specialists need to keep a watch on the
execution of those divisions/ventures and should exit at a proper time. They may
likewise look for counsel of a specialist.
iv. Expense Saving Schemes
These plans offer assessment discounts to the financial specialists under particular
arrangements of the Income Tax Act.1962 as the administration offers impose

19
motivators for interest in determined roads e.g. Value Linked Saving Schemes
(ELSS). Annuity Schemes propelled by the common supports additionally offer tax
cuts. These plans are development situated and contribute pre-overwhelmingly I
values. Their development openings and dangers related resemble any value situated
plan.
v. Load or no-heap Fund
A Load finance is one that charges a level of NAV for passage or exit. That is, each
time one purchases or offers units in the store, a charge will be payable. This charge is
utilized by the common store for advertising and dissemination costs. Assume the
NAV per unit is Rs.10. In the section and in addition leave stack charged is.1%, at
that point the speculators who purchase would be required to pay RS.10.10 and these
who offer their units for repurchase the common store will get just Rs.9.90 per unit.
The financial specialists should mull over the heaps while making venture as these
influence their yields/returns. Nonetheless, the financial specialists ought to likewise
consider the execution reputation and administration gauges of the common reserve,
which are more imperative. Proficient assets may give higher returns regardless of
burdens.
A no-heap finance is one that does not charge for passage or exit. It implies the
financial specialists can enter the reserve/plot at NAV and no extra charges are
payable on buy or offer of units.
vi. Guaranteed return plot
Guaranteed return plans are those plans that guarantee a particular come back to the
unit holders regardless of execution of the plan. A plan can't guarantee returns unless
such returns are completely ensured by the support or AMC and this is required to be
revealed in the offer record. Speculators should deliberately read the offer report
whether return is guaranteed for the whole time of the plan or just for a specific
period. A few plans guarantee returns one year a period and they survey and change it
toward the start of the following year.

20
2.7. Key Terminology
Net plus worth (NAV)
Net plus worth is value of the assets of the theme minus its liabilities. The per unit
NAV is that the internet plus worth of the theme divided by the amount of units
outstanding on the Valuation Date.
Redemption worth
Redemption price is that the worth at which open-ended schemes repurchase their
units and close- Sales Load could be a charge collected by a scheme when it sells the
units. Additionally called “Front-end” load. Schemes that do not charge a load area
unit called “No Load” Schemes.
Repurchase or “Back-end” Load
Is a charge collected by a scheme when it buys back the units from the unit holders?
Ended schemes redeem their units on maturity. Such prices are NAV related.
Evaluating Performance
Repurchase or “Back-end” Load is a charge gathered by a plan when it purchases back the
units from the unit-holders?
Ended schemes redeem their units on maturity. Such prices are NAV related.
2.8. Evaluating Performance
Perhaps you've got detected those mutual fund ads that quote amazingly high one-year rates
of return? Your first thought could be, "wow, that mutual fund did great!" Well, yes it did
great last year, but then you look at the three-year performance, which is lower, and also the
five years, which is yet even lower. What’s the underlying story here? Let's inspect associate
actual example from a large mutual fund's performance:
1-year return – 53%
3-year return – 20%
5-year return – 11%
First year, this mutual fund had excellent performance, returning 53 to investors. But, over
the past 3 years the common annual return was just 200th. What did the fund return in years 1
and 2 to bring the average return down to 20%? Simple math shows North American country
that the fund made an average return of 3.5% over those 1st 2 years: 200th = (53% + 3.5% +
3.5%)/3. Since this 3.5% figure is merely an average, it is very doable that the fund lost
money in one or more of those years.

21
It gets more dismal if we glance at the five-year performance. We know that in the last year
the fund returned 53 and in years two {and three and three} we have a tendency to area unit
guessing it returned around 3.5%. So, what happened in years 4 and 5 to bring the average
return all the way down to just 11%? again, by doing some simple calculations we find that
the fund must have lost money, on average -2.5% each year of those 2 years: Martina’s =
(53% + 3.5% + 3.5% - 2.5% - 2.5%)/5. with that in mind the fund's performance does not
look quite therefore spectacular.
2.9. There are 5 ways to evaluate performance of mutual fund
Investing in mutual funds has associate degree inherent risk assumed upon the possession.
However, performance of the mutual funds will be quantified with the mathematical
calculation of the historical returns. The correlation of the potential risk and also the potential
returns perpetually place forth the opportunities to speculate in mutual funds and drive most
potential returns with minimum underlying risk.
Risk adjusted returns- Risk adjusted returns are the shrewd returns your
funds build compared to the chance indicated over the amount of your time. If
compared, some of mutual funds that drive identical share of returns
over identical amount of your time, the lesser risk funds have a better Risk Adjusted
Returns.
Benchmark- Benchmarking is that the activity of quality of the funds against the
quality measurements. It’s a degree of reference compared to the funds peer
markets. Regardless of the objectives of investment in mutual funds, benchmark helps
you gauge the performance of your investment against the market competition.
Considering historical returns against the market conditions can assist
you verify the connation of the performance benchmark for your investments.
However, historical come back isn't a reliable indicator of future results.
Relative performance with peers may be a yardstick of the effectiveness of
your investment company of identical class. Mutual Funds actively try and high the
ranking of the fund universe. Supposed towards a better come for the
determined amount important learning, the relative peer performance is usually
recommended.
Quality of stocks within the portfolio - Quality of stocks within the portfolio
is mirrored in its ability to drive superior returns on capital invested with for a

22
selected amount of your time. It’s knowing check the trade leadership position of
the investment company. Quality of the stocks within the portfolio would mirror in
returns thus within the performance. Qualitative statistics and historical performance
of mutual funds would facilitate evaluating the performance.
Documentation and competency of the fund manager
Your fund manager is a crucial one who makes investment choices and
stock choice within the portfolio. Perceive your fund manager’s competency in
keeping with his/her fund management data and skill. Your fund manager’s past
performance would be a decent parameter to trace his/her record and
will communicate be of an excellent worth for your investments.
2.10. How to buy or purchase and invest in mutual funds?
There are 5 ways by which we can invest in mutual funds.
Through a Financial Advisor: This the oldest and most popular way of investing in
mutual funds in India. AMFI, an industry association of all the SEBI approved AMCs,
provides licenses to financial advisor to advice customers on mutual fund
investments. The financial advisor provides end to end to services, including
collecting KYC (Know your Customer) documents, filling the application forms and
getting your signatures and submitting them for processing. Most financial advisors
do not charge any fee from their customers. They are paid commissions by the mutual
fund companies. If you are new investor it is recommended that you invest through a
financial advisor. Before investing through financial advisors, you should check if
they have a valid AMFI license.
Investing directly with the Mutual Fund companies: You can visit the office of the
mutual fund companies and invest directly at their office. If you are investing for the
first time, you need to submit the necessary documentation for KYC (identity proof,
address proof, PAN card etc.) along with the duly filled application form at the mutual
fund. Once a folio number is generated for you, you can invest online in any scheme
of the mutual company by going to the website of the company.
Investing through registrars (CAMS or Karvy): CAMS or Karvy are registrars who
process the mutual fund transactions and keep records on behalf of the mutual fund
companies. You can visit CAMS or Karvy workplaces and present the shared reserve

23
application shapes there, much the same as contributing specifically with common
store organizations.
Investing through online portals: There are several online portals like
fundsindia.com and fundsupermart.com through you can invest in mutual funds. To
invest through the online portals your KYC has to be registered. Some of the portals
can also help you with getting your KYC registered. One of the advantages of
investing through an online portal is that you can view your entire portfolio
(investment in mutual funds of different companies) in one place. However, you be
aware of to that amount this online portals are registered mutual fund distributors as
you monetary guide and attain commissions beside the mutual resources companies.
Investing through your online demat account: Some brokers who provide online
trading and demat services, also offer online investment in mutual funds.
2.11. Performance of Mutual Fund in India
Let us begin the discussion of the performance of investment companies in India Bharat
Asian country Asian nation from the day the idea of mutual fund took birth in India. The year
was 1963. Investment Company of Asian nation invited investors or rather to people
who believed in savings, to park their cash in UTI Investment Company.
For thirty years it goaled while not a sing second player. Although the 1988-year saw some
new investment company corporations, however UTI remained in a very monopoly position.
The performance of mutual funds in Asian nation within the initial part wasn't even nearer to
satisfactory level. Individuals seldom understood, and after all infesting was out of question.
But yes, some twenty four million shareholders were accustomed with bonded high returns
by the start of relaxation of the business in 1992. This smart record of UTI
became promoting tool for brand spanking new entrants. The expectations of investors
touched the sky in profitableness issue. However, individuals were miles far away from
the state of risks issue when the relaxation. The Assets below Management of UTI was
PRs. 67 billions by the top of 1987. Let, concentrate regarding the performance of mutual
funds in Asian nation through Figures. From PRs. 67 billions the quality below Management
rose to Rs.470 bn. In March 1993 and therefore the figure had a 3 time higher performance
by April 2004. It rose as high as Rs.2.54bn. The net quality worth of mutual funds in Asian
nation declined once stock costs started falling within the year 1992. Those days, the
market laws didn't enable portfolio shifts into different investments. There was rather

24
no alternative excluding holding the money or to any continue investment in shares. An
added factor to be noted, since solely closed-end funds were floated within the market, the
investors disinvested by merchandising at a loss within the secondary market. The
performance of mutual funds in Asian nation suffered qualitatively.
The 1992 exchange scandal, the losses by disinvestments and after all the dearth of clear rules
within the wherever regarding rocked confidence among the investors. Part owning to a
comparatively weak exchange performance, mutual funds haven't however recovered, with
funds commercialism a median discount of 1020% of their NAV. The superordinate authority
adopted a collection of measures to make a clear and competitive surroundings in mutual
funds. A number of them were like reposeful investment restrictions into the market,
introduction of open-ended funds, and paving the entrance for mutual funds to launch pension
schemes. The live was taken to create mutual funds the key instrument for long saving
.The additional the variability offered, the quantitative are going to be investors. At last to
say, as long as investment company corporations area unit performing arts with lower risks
and better profitableness at intervals a brief span of your time, additional and additional
individuals are going to be inclined to take a position till and unless they are totally educated
with the dos and don’ts of mutual funds. Average Assets Under Management (AAUM) of
Indian investment company business for the month of Dec 2017 stood at INR 22,
60,000 large integer. Assets Under Management (AUM) as on day, 2017stood at INR 21,
27,000 large integer.
The Aum Shinrikyo of the Indian MF business has mature from INR 3.26 trillion as
on 31st March 2007 to INR21.27 trillion as on 31st Dec 2017, regarding six and fold
increase in a very span of regarding ten and half years!!
The MF Industry’s Aum Shinrikyo has mature from INR 5.87 trillion as on thirty first March,
2012 to INR twenty one.27 trillion as on thirty first Dec, 2017, regarding 3 and fold
increase in a very span of regarding five and years!! The Industry’s Aum Shinrikyo had
crossed the milestone of INR10 Trillion (INR10 hundred thousand Crore) for the
primary time in might 2014 and in a very short span of regarding 3 and half years, the Aum
Shinrikyo size has exaggerated over 2 folds and stood at INR21.27 Trillion (INR twenty
one.27 hundred thousand Crore) as on thirty first Dec, 2017. The whole variety of accounts
(or folios as per investment company parlance) as on day, 2017 stood at vi.65 large
integer (66.5 million), whereas the amount of folios below Equity, ELSS and Balanced
schemes, whereby the utmost investment is from retail phase stood at five.46 large
integer (54.6 million).
25
2.12. Future of mutual fund in India
As mindfulness expands, MFs could end up one of the principal decisions for both here and
now and long haul ventures. While MF products are not suitable for all kinds of investors, the
sector has shown tremendous growth by exceeding 17 lakh crore INR in assets under
management (AUM), with inflows worth almost 4 lakh crore INR over the most recent 2
years alone. With the demonetization effect, rapid digitization, government incentives,
regulatory initiatives, and a deliberate push for improving investor education, the next 2–3
years should see the AUM reaching another great milestone. "In the prompt future, with loan
fees declining, it is sensible to anticipate that obligation assets will be the drivers of
development in the main portion of 2017, while the effects of the Goods and Services Tax
(GST) will be felt in the second half.
SEBI and Assets Management Organizations (AMCs) themselves have tried a few endeavors
to build the recognition retail financial specialists have with speculation language. This has
made them more comfortable with the idea of investing in MFs over traditional alternatives
such as real estate and gold. The cost of MFs is likewise falling as the business keeps on
building scale. Innovation has assumed a critical part, with numerous open doors for the
business to use.
2.13. Some Facts
Investment companies determine the price of a Mutual Fund on a daily basis. Mutual
Fund companies are monitored by SEBI.
There are several types of Mutual Funds: Equity, Diversified, Gilt, Debt Hybrid,
Index, Debt, and more.
Equity funds include equity diversified funds, sector specific funds, and tax-saving
funds.
Debt funds include income funds, liquid funds, and short-term funds.
Hybrid funds include equity-oriented hybrid funds, arbitrage funds, and debt-oriented
hybrid funds.
Mutual fund investment is similar to investing in a stock except a fund manager does
it for you.
A fund is considered an Equity Fund if more than 65% of the money is invested in
equities (stocks).
Investment companies determine the price of a mutual fund on a daily basis

26
Mutual fund companies are monitored by SEBI
There are four types of Mutual Funds: Stock, Bond, Money Market, and Hybrid
Mutual fund investment is similar to investing in a stock except a fund manager does
it for you
A fund is considered an Equity Fund if more than 65% of the money is invested in
equities (stocks)
Indian shared reserve industry right now midpoints at Rs.19.47 lakh crores
Indexed fund are less many dangerous when contrasted with non-index funds.

27
2.14. PROFILE OF THE COMPANY
2.14.1. MUTUAL FUNDS
2.14.1.1. SBI MUTUAL FUND
History
The investment company business in India originally began in 1963 with the investment
trust of India (UTI) as a Government of India and also the Federal Reserve Bank of India
initiative. Launched in 1987, SBI Investment Company became the primary non-
UTI investment company in Republic of India. In July 2004, bank of Republic of India
determined to divest 37 per cent of its holding in its investment company arm, SBI Funds
Management Pvt. Ltd, to Society General Quality Management, for associate
degree quantity in way over $35 million. Post-divestment, bank of India's stake within
the investment company arm diminished to sixty seven. In could 2011, Amundi picked
up 37thstake in SBI Funds Management that was command by Society
General plus Management, as a part of a worldwide move to merge its quality management
business with Credit Gnaeus Julius Agricola. As of Sept 2015, the fund house claims to serve
around 5.8 million investors through 130 points of acceptance, 29capitalist service
centers, 59 capitalist service desks and 6 capitalist Service Points. As of July 2017,
assets below management of SBI investment company area unit valued at Rs. 1, 82,916 large
integer ($28.4 billion).
SBI Mutual Fund
SBI investment firm may be a bank sponsored fund house with its company headquarters
in Mumbai, India. It’s a venture between the bank of Asian country, Associate in
Nursing Indian international, Public Sector banking and monetary services company and
Amundi, a European quality management company.
With 30years of wealthy expertise in fund management, SBI Funds Management Pvt. Ltd.
brings forward experience by systematically delivering price to investors. They need a
powerful and proud lineage that traces back to the bank of Asian country (SBI) - India's
largest bank. SBI investment firm may be a venture between SBI and AMUNDI
(France), one in all the world's leading fund management firms. With a network of over 222
points of acceptance across Asian country, they aim to deliver price and nurture the trust of
our huge and varied family of investors.

28
Key Information
Mutual Fund SBI Mutual Fund
Setup Date Jun-29-1987
Incorporation Date Feb-07-1992
Sponsor State Bank of India
Trustee SBI Mutual Fund Trustee Company Private Limited
Chairman Mrs. Arundhati Bhattacharya
CEO / MD Mrs. Anuradha Rao
CIO Mr. Navneet Munot
Compliance Officer Ms. Vinaya Datar
Investor Service Officer Mr. Rohidas Nakashe
Assets Managed Rs. 205272.78 crore (Dec-31-2017)
Products and Services
SBI Mutual Fund offers mutual fund schemes such as Debt Schemes, Equity Schemes,
Hybrid Schemes, Exchange-traded fund, Liquid Schemes and Fixed Maturity Plans. It also
offers Portfolio Management and Advisory Services to financial institutions and asset
management companies.
Major competitors
SBI Mutual Fund offers common store plans, for example, Debt Schemes, Equity Schemes,
Hybrid Schemes, Exchange-exchanged reserve, Liquid Schemes and Fixed Maturity Plans. It
likewise offers Portfolio Management and Advisory Services to money related establishments
and resource administration organizations.

29
VISION
“To be the most preferred and the largest fund house for all asset classes, with a consistent
track record of excellent returns and best standards in customer service, product innovation,
technology and HR practices.”
SERVICES
1) Mutual Funds
Financial specialists are need. The mission has been to build up Mutual Funds as a
feasible venture choice to the majority in the nation. Working towards it, they claim to
have created inventive, require particular items and taught the financial specialists
about the additional advantages of putting resources into capital markets by means of
Mutual Funds.
Today, the assets have been currently dealing with financial specialist's benefits not
just through venture mastery in residential shared assets, yet in addition seaward
supports and portfolio administration warning administrations for institutional
speculators.
This makes SBI MF one of the largest investment management firms in India,
managing investment mandates of over 5.4 million investors.
2) Portfolio Management and Advisory Services
SBI Funds Management has risen as one of the biggest player in India exhorting
different money related organizations, benefits assets, and neighborhood and
worldwide resource administration organizations.
They likewise give an incorporated end-to-end redid resource administration answer
for organizations as far as warning administration, optional and non-optional portfolio
administration administrations.
3) Offshore Funds
SBI Funds Management has been effectively overseeing and exhorting India's
devoted seaward subsidizes since 1988. SBI Funds Management was the first bank
supported resource administration organization reserve to dispatch a seaward store
called 'SBI Resurgent India Opportunities Fund' with a goal to give speculators open

30
doors for long haul development in capital, through all around investigated interests in
a broadened container of loads of Indian Companies.
4) Alternative Investment Funds (AIF)
As a component of the different resource administration bundles of items offered by
the SBI Funds Management Private Limited, interchange resource venture items
through Alternative Investment Funds is likewise advertised. To begin with elective
speculation subsidize in 2015 was propelled and more supports are on the iron block
as the space is as yet early and a great deal of chances exist. With a characterized
administrative structure set up, we see AIFs becoming speedier and boosting interests
in the nation with cooperation from local and in addition remote financial specialists.
5) Investment Solutions
Equity Schemes
Medium and long term equity investments for capital growth
Hybrid Schemes
Mix of debt and equity investments to offer income and growth
Exchange Traded Schemes
Stock exchange trading of investments in baskets of securities
Debt Schemes
Debt asset investments aimed at regular and steady income
Liquid Schemes
Focused investments in short-term instruments and cash assets
Fund of Funds
Schemes that invests in other schemes of the same or another fund
New Fund Offer
Subscriptions open for our New Fund Offer
Fixed Maturity Plans
Close ended debt schemes with a fixed maturity date

31
4.10.1.2. ICICI Mutual Fund
History
The AMC is a joint wander between ICICI Bank in India and Prudential Plc, one of
UK's biggest players in the monetary administrations segments.
With its Corporate Office situated in Bandra Kurla Complex, Mumbai, India the
AMC has seen generous development in scale; from 2 areas and 6 workers at the
commencement of the joint wander in 1998, to a present quality of in excess of 1000
representatives with around 120 areas contacting a financial specialist base of in
excess of 1.9 million speculators.
Items and Services
The AMC oversees critical Assets under Management (AUM) in the Mutual Fund
portion crosswise over resource classes. The AMC additionally takes into account
Portfolio Management Services and Real Estate Division for financial specialists,
spread the nation over, alongside International Advisory Mandates for customers
crosswise over worldwide markets.
Shared Fund
The Mutual Fund caters essentially to retail speculators. ICICI Prudential AMC has
acquainted items lined up with address client issues prompting an all-around
expanded arrangement of shared store items.
Portfolio Management Services
The Portfolio Management Services enable high total assets financial specialists to
put resources into a more amassed portfolio going for higher returns. In the year 2000,
ICICI Prudential AMC was the principal institutional member to offer the
administration, and has now got an effective reputation of more than 10 years.
Land Business
The Real Estate division takes into account high total assets financial specialists and
local institutional speculators, with ICICI Prudential AMC beginning the Real Estate
Investment Series Portfolio in the year 2007.
Real Competitors
A couple of the contenders for ICICI Prudential Mutual Fund in the shared store
division are HDFC Mutual Fund, Reliance Mutual Fund, SBI Mutual Fund, and Birla
Sun Life Mutual Fund and UTI Mutual Fund.

32
ICICI Mutual Fund
ICICI Prudential Asset Management Company Ltd. is a main resource administration
organization (AMC) in the nation concentrated on overcoming any issues between funds and
ventures and making long haul riches for financial specialists through a scope of
straightforward and applicable speculation arrangements. The AMC is a joint wander
between ICICI Bank, an outstanding and trusted name in money related administrations in
India and Prudential Plc, one of UK's biggest players in the monetary administrations
divisions. During these time of the joint wander, the organization has produced a place of
pre-greatness in the Indian Mutual Fund industry. The AMC oversees huge Assets under
Management (AUM) in the shared store section. The AMC additionally takes into account
Portfolio Management Services for financial specialists, spread the nation over, alongside
International Advisory Mandates for customers crosswise over universal markets in resource
classes like Debt, Equity and Real Estate. The AMC has seen considerable development in
scale; from 2 areas and 6 workers at the initiation of the joint wander in 1998, to a present
quality of 1476 representatives with a span crosswise over more than 215 areas contacting a
financial specialist base of in excess of 2.5 million speculators (As on March 31, 2017). The
organization's development force has been exponential and it has constantly centered around
expanding availability for its financial specialists. Driven by a totally financial specialist
driven approach, the association today is an appropriate blend of speculation ability, asset
transmission capacity and process introduction. The AMC attempts to streamline its
speculator's excursion to meet their money related objectives, and give a decent financial
specialist encounter through development, consistency and supported hazard balanced
execution.
Sponsors
ICICI Bank is India's biggest private area manage an account with add up to resources of Rs.
7,206.95 billion (US$ 109 billion) at March 31, 2016 and benefit after expense Rs. 97.26
billion (US$ 1,468 million) for the year finished March 31, 2016. ICICI Bank at present has a
system of 4,608 Branches and 14,052 ATM's crosswise over India.
33
Prudential plc is a global money related administrations assemble with huge tasks in Asia, US
and the UK. The organization serves in excess of 24 million protection clients and has £599
billion of advantages under administration (as at 31 December 2016).
Key Information
Mutual Fund ICICI Prudential Mutual Fund
Setup Date Oct-13-1993
Incorporation Date Jun-22-1993
Sponsor Prudential Plc and ICICI Bank Ltd.
Trustee ICICI Prudential Trust Ltd.
Chairman Ms. Chanda Kochhar
CEO / MD Mr. Nimesh Shah
CIO Mr. S Naren
Compliance Officer Ms. Supriya Sapre
Investor Service Officer Mr. Yatin Suvarna
Assets Managed Rs. 293337.55 crore (Dec-31-2017)
Prudential Corporation Asia (PCA)
Prudential is a main life back up plan that traverses 13 advertises in Asia, covering
Cambodia, China, Hong Kong, India, Indonesia, Korea, Laos, Malaysia, the Philippines,
Singapore, Taiwan, Thailand and Vietnam. Prudential has a strong multi-channel dispersion
stage giving a complete scope of funds, speculation and assurance items. East spring
Investments oversees speculations crosswise over Asia in the interest of an extensive variety
of retail and institutional speculators, with about portion of its benefits sourced from life and
annuity items sold by Prudential plc. It is one of the locale's biggest resource administrators
with a nearness in 10 noteworthy Asian markets and in addition dissemination workplaces in

34
the US and Europe. It has £104.9 billion in resources under administration (as at 30 June
2016), overseeing reserves over a scope of advantage classes including values and settled
pay.
Prudential UK and Europe (PUE)
Prudential UK is a main life and benefits' supplier to around 6 million clients in the United
Kingdom. Their mastery in zones, for example, life span, hazard administration and multi-
resource venture, together with our budgetary quality and profoundly regarded mark, implies
that the business is firmly situated to keep seeking after an esteem driven methodology
worked around our center qualities in with-benefits and annuities.
M&G
M&G is Prudential's UK and European reserve administration business with add up to
resources under administration in abundance of £255.4 bn (as at 30 June 2016). M&G has
been contributing cash for individual and institutional customers for more than 80 years.
Today it is one of Europe's biggest dynamic speculation supervisors and in addition being a
powerhouse in settled pay.
Principal Mutual Fund
Main PNB Asset Management Company is the speculation supervisor to Principal Mutual
Fund. Central offer an extensive variety of creative speculation answers for both retail and
institutional financial specialists and hold fast to the key standards of thorough hazard
control, process-introduction and better research than help our venture choices.
Essential oversee resources for more than 4 lakh clients, through 102 financial specialist
lopes with more than 20,000 empaneled merchants the nation over. With a long haul and
trained venture approach that goes for broke supported by strong research, Principal expect to
make, secure and develop Principality of our financial specialists. Chief is conferred towards
helping people, organizations institutional customers make budgetary security progress
Central is sponsored by the budgetary quality, worldwide skill and experience of more than
130 years in resource gathering and resource administration of our parent - the Principal
Financial Group - one of the world's driving venture chiefs. Our Co-Settlor, Punjab National
Bank (one of the biggest Nationalized Banks in the nation) give us the solid brand value and

35
dissemination muscle in India through their broad branch organize over the length and
broadness of the nation.
Important assimilate the moral norms of the Principal Financial Group and enable
organizations and individuals to accomplish their budgetary objectives by giving quality
speculation and long haul money related arrangements. Key have earned this trust through
elevated amounts of trustworthiness, straightforward venture items that produce consistent
with mark execution and approaching financial specialists with deference and decency. By
consolidating our neighborhood showcase information with the worldwide skill of the parent,
Principal deal with customer's benefits through all market cycles and monetary conditions
and are conferred towards conveying better hazard balanced returns than our customers.
Main Funds in the Market
1) Value Funds
• Principal Dividend Yield Fund
• Principal Emerging Blue chip Fund
• Principal Smart Equity Fund
• Principal Arbitrage Fund
• Principal Large Cap Fund
• Principal Growth Fund
• Principal Index Fund - Nifty
• Principal Equity Savings Fund
36
2) ELSS Funds
• Principal Personal Tax Saver Fund (Fresh Subscription Discontinued till additionally
take note)
• Principal Tax Savings Fund
3) Adjusted Funds
• Principal Balanced Fund
4) Obligation/Fixed Income
• Principal Dynamic Bond Fund
• Principal Short Term Income Fund
• Principal Debt Savings Fund
• Principal Money Manager Fund
• Principal Low Duration Fund
• Principal Credit Opportunities Fund
• Principal Government Securities Fund
5) Fluid Funds
• Principal Cash Management Fund
6) Reserve of Funds
• Principal Global Opportunities Fund
• Principal Asset Allocation Fund of Funds

37
4.10.2. LARGE CAP
4.10.2.1. Reliance Capital Limited
History
Reliance Capital limited was incorporated in 1986 at Ahmedabad in Gujarat as Reliance
Capital & Finance Trust limited. The name Reliance Capital came into result on Jan 5, 1995.
In 2002, Reliance Capital Ltd shifted its registered workplace to Jamnagar in Gujarat before
it finally enraptured to Mumbai in Maharashtra, in 2006.
In 2006, Reliance Capital Ventures limited incorporated with Reliance Capital. With this
merger the investor base of Reliance Capital rose from 0.15 million shareholders to 1.3
million.
Reliance Capital entered the capital market with a maiden public issue in 1990 and
in sequent years more a broach the capital market through offer and public problems. The
equity shares were at first listed on the Ahmedabad stock market and therefore the stock
market Mumbai. Presently the shares are listed on the stock market Mumbai and therefore
the National stock market of Bharat.
Reliance Capital Limited is associated nursing Indian diversified monetary services company
promoted by Reliance group.
Reliance Capital, a constituent of nifty Midcap fifty and MSCI international small Cap
Index, may be a part of the Reliance group. It’s amongst India's leading and most
beneficial monetary services firms within the non-public sector. As on March 31,
2017, World Wide Web value of the corporate stood at Rs 16,548 crore, whereas its total
assets as on the date stood at Rs 82,209 crore.
Reliance Capital has businesses in plus management, mutual funds, life assurance and general
insurance, business finance, home finance, stock broking, wealth management services,
distribution of monetary product, non-public equity, plus reconstruction, proprietary
investments and different activities in monetary services. The corporate operates across Asian
country and has over 20 million customers and hands of roughly 15, 595 as of May Day,
2017.
Anil Ambani, promoter of Reliance group is that the Chairman of Reliance
Capital, whereas Amitabh Jhunjhunwala is that the Vice-Chairman and Anmol
Ambani because the administrator.
38
Non-banking financial company
Reliance Capital obtained its registration as a non-banking finance company (NBFC)
in Dec 1998. it's since heterogeneous its activities within the areas of quality management,
life and general insurance, business finance, stock broking, non-public equity and proprietary
investments, asset reconstruction,distribution monetary(ofeconomic) product and different act
ivities in financial service.
Operations
Reliance Capital offers a range of financial services in many business lines. The company is
one of the most diversified financial services firms in India with interests expanding from
asset management, insurance, commercial finance, broking, private equity to other niche
financial services.
Its prominent businesses are as follows
1) Reliance Nippon Life Asset Management
Reliance Capital offers a spread of monetary services in several business lines. The
corporate is one among the foremost varied money services companies in India with
interests increasing from asset management, insurance, industrial finance, broking, non-
public equity to alternative niche money services.
2) Its distinguished businesses area unit as follows.
Reliance Asian country Life asset Management (RNAM; at one time Reliance
Capital asset Management Limited) is one among the biggest quality manager in India and
manages and advises Rs. 3, 58,059 crore as per March 2017, across mutual funds, pension
funds, managed accounts, various investments and offshore funds. RNAM is that the
solely AMC to possess the mandate for fund management by EPFO, PFRDA and CMPFO.
RNAM is that the asset manager of Reliance mutual fund (RMF) Schemes. Sundeep Sikka is
that the executive and Chief military officer of RNAM.As per March 2017, RMF
manages the best assets from the ‘beyond prime fifteen cities’ class across all AMCs within
the trade. RNAM acts because the authority for India centered Equity and fixed financial
gain funds in Japan (launched by Nissay asset Management) and Korean
Peninsula (Samsung asset Management). RNAM conjointly manages offshore funds through
its subsidiaries in Singapore and Mauritius thereby job to investors across Asia, the
center East, the UK, the US, and Europe.

39
3) Reliance Nippon Life Insurance
Reliance Asian nation insurance Company is among the leading non-
public sector insurance corporations in India in terms of individual WRP (weighted received
premium) and new business WRP. the corporate is one among the biggest non-bank
supported non-public life insurers with over 10 million policy holders, a robust distribution
network of over 700 branches and over 75,000 advisors as on March 31, 2017. The
corporate holds one among the highest claim settlement ratios within the industry: it stands
at 95.21% as of March 31, 2017.
Ashish Vohra is that the administrator and Chief executive Officer of RNLI.
Rated amongst the highest four Most trustworthy insurance Service completes by Brand
Equity‘s Most trustworthy Brands Survey 2016, the company’s vision is “To be a
corporation individuals area unit happy with, trust in and grow with;
providing money independence to each life we have a tendency to bit.” With this in mind,
Reliance Asian nation Life caters to 5 distinct segments: protection, child, retirement, saving
& investment, and health, for people further as groups/corporate entities.
In year 2016, when the sanctioning rules, Asian nation Life exaggerated its stake in Reliance
Life from 26th to 49th, behind the receipt of all regulative approval.
Asian nation insurance, additionally referred to as Nissay, is Japan's largest non-
public life insurance underwriter, with 25th market share. The corporate, with over 29 million
policies in Japan, offers a good vary of product, as well as individual and cluster life
and regular payment policies through varied distribution channels. It primarily uses face-to-
face sales channel for its ancient insurance product. The corporate primarily operates in
Japan, North America, Europe and Asia and is headquartered in port, Japan. It absolutely
was hierarchal 114th in world Fortune five hundred corporations in 2016.
4) Reliance General Insurance
Reliance General insurance underwriter restricted is Associate in Nursing Indian insurance
underwriter, a part of Reliance Capital Ltd. The firm features a 7.3% market share within
the personal sector and has the biggest agency channel, with over 24,500 agents.
The business executive and administrator is Rakesh Jainist. The company
has reinforced and wide-ranging its distribution network by formation partnerships with
major banks. Reliance General Insurance is a full of life participant in numerous government
crop insurance schemes, as well as the Pradhan Mantri Fasal Bima Yojna and has insured
over 3 million farmers below this monetary inclusion initiative. The full gross written
premium (GWP) for the year that concluded March 31, 2017, was ₹40.07 billion (US$610

40
million). Reliance General Insurance (RGI) offers insurance solutions for automotive vehicle,
health, home, property, and travel, marine, business and alternative specialty merchandise.
4) Reliance commercial Finance
Reliance business Finance is among the leading lenders within the Indian non-banking
finance sector. The business executive and executive director of the corporate is Devang
Mody.
The company has Associate in nursing operational presence of over forty four locations
in India Associate in Nursing an Aum Shinrikyo of 16759 metallic element. As on March
2017. Reliance commercial Finance offers a good vary of merchandise that embrace business
growth loan, property loans, vehicle loans, construction instrumentation loans, and
infrastructure, microfinance and agriculture loans. The corporate had a loan book at ₹124.36
billion (US$2.1 billion) as on March 31, 2017, with over 268,278 customers (including
microfinance) across India.
5) Reliance Home Finance
Reliance Home Finance limited is one among India’s and most precious monetary services
firms within the personal sector. Ravindra Sudhalkar is that the business executive and
administrator of the corporate.
Reliance Home Finance limited (RHF), a 100% subsidiary of Reliance Capital, provides a
good vary of solutions like home loans, LAP, construction finance, and cheap housing loans.
The corporate additional provides property answer services that facilitate customers notice
their dream homes/property, at the side of funding.
The corporate features a robust distribution network with over 1,750 distributors serving
over 33,300 customers across 90 locations, through a hub and spoke model, across the
country.
6) Reliance Capital's broking and distribution business
Reliance Securities, the broking and distribution arm of Reliance Capital, is one
amongst India’s leading retail broking homes. B Gopkumar is that the Chief executive
officer and decision maker of its broking and distribution business.
It provides a varied client base with access to equities, derivatives, currency, IPOs,
bonds, company FDs and wealth management solutions. The distribution business may be
a comprehensive monetary services and solutions supplier, helping customers with access to

41
mutual funds, insurance product and alternative monetary product, with a pan-India presence
with or so eighty branches.
8) Reliance asset Reconstruction
Reliance quality Reconstruction is that the premier quality reconstruction company, the
principal sponsor/shareholder of that is Reliance cluster (through Reliance Capital).
The Supreme Truth as on March 31, 2017 stands at Rs. 1829 crore (previous year: Rs.1488
crore). Major deal Reliance Capital has stricken a number of the largest deals within
the Indian monetary services sector.
In 2011, Reliance Capital sold twenty sixth stake in its life assurance business, Reliance life
assurance, to Nippon life assurance (Nissay), amongst the world's largest life insurers,
with associate degree Supreme Truth of over 600 billion. The dealings was completed at Rs.
3,082 crore for a 26 per cent stake, valuing Reliance life assurance at $2.6 billion.
Major Deal
This was the biggest the within the insurances sector in Asian nation. Recently, the
government of Asian nation has declare a 49th foreign holding in Indian insurance
corporations, up from the twenty sixth holding allowed earlier. In 2012, Nippon life
assurance bought 26th stake in Reliance Capital asset Management for Rs. 1,450
crore, creating it the largest inward stake supply the open-end investment company trade. The
deals were lauded within the Asian nation monetary services sector in India by
analysts. Worth analysis, a significant monetary analysis firm, lauded this strategic stake sale
by Reliance Capital to Nippon life assurance in 2 of its businesses.
Reports indicate that Reliance Capital is additionally progressing to sell a 26th stake in its
general insurance business, Reliance General Insurance, at associate degree applicable time.
India's leading monetary daily Economic Times wrote, "Since Reliance General Insurance
is one amongst the leading players with eight.4 per cent market share, the projected stake
sale is anticipated to get handsome capital gains for Reliance Capital... Besides de-leveraging
the record, the continued restructuring ought to conjointly facilitate Reliance Capital conserve
capital and generate higher come back ratios."After the announcement by minister of
finance Arun Jaitley to extend investment limit for foreigners in Indian insurance sector
to forty ninth, Espirito Santo same Reliance Capital goes to learn the foremost from the
choice because of its self-made presence in each life and general insurance, and its ability to

42
draw applicable valuation from foreign partners because of its heterogeneous strength
and walk reach in monetary services sector in Asian nation. Reliance Capital in Gregorian
calendar month 2014 declared the merger of its international film associate degreed media
services business with Prime Focus to make an entity with a combined turnover of over
Rs one,800 crore. In Gregorian calendar month 2017, it sold its 125th share in Paytm to
China's Alibaba cluster for Rs 275 crore, creating a profit of 2,600%

43
CHAPTER 3
METHODOLOGY
3.1. Research Methodology
Research Design is a statement or specification of procedures for collecting and analyzing the
information required for the solution of specific problem. It provides a scientific framework
for conducting same research investigation.
According to Graham and Tull “A research design is the specification of methods and
procedures for acquiring the information needed. It is the general operational example or
system of the venture that from which sources and by what techniques.
3.2. Objectives:
To analyze the working of the Mutual Funds in the Market.
To know the impact of the Risk and Return on FMCG and Large Cap.
To Analyze the Risk Tolerance and its impact on Return.
To enhance the knowledge of the investor regarding risk and benefits.
To analyze the best Fund Performance.
3.3. Scope of the Study
Plan of Analysis
The study will be analyzed with formulae’s and tools like charts, tables.
3.4. Methodology
The study is based on the data provided by the Directors of Dvija Digital Company and data
collected from internet, which were thoroughly studied and interpreted.
3.6. Sources of Data
I. Primary data:
Opinion and suggestions from Director of Dvija Digital

44
II. Secondary Data:
The secondary data is collected from the Fund Fact Sheet, Text Books, and various Websites
of internet.
3.7. Limitations:
The Study will be confined only to selected schemes.
Widely used measures will be considered for the study
3.8. Ratios Analysis Interpretation Cheat Sheet
standard deviation
Higher standard deviation suggests
that a bigger fluctuation in expected come
back. High standard deviation from relative
stock indices, as their portfolio
managers create aggressive bets in an
attempt to come up with higher-than-
average returns. A lower standard
deviation is not essentially desirable. It all
depends on the type of investments one
is creating, and also the one's disposition to
assume risk.
Once addressing the quantity of deviation
in their portfolios, investors ought to think
about each their personal tolerance for
volatility and their overall investment
objectives. A lot of aggressive investors is
also snug with Associate in
Nursing investment strategy that opts for
vehicles with higher-than-average
volatility, whereas a lot of conservative
investors might not.
If beta is >1 then the stock is riskier than

45
Beta
the market, if beta <1 then the stock is less
risky than the market. If beta is =1 then the
stock is volatile, if beta=0 then as risky as
the market is. A security's beta should only
be used when a security has a high R-
squared value in relation to the benchmark.
Jensen's alpha
The higher the alpha, a lot of the stock
has earned on top of the amount expected.
To accurately Associate in Nursingalyze
the performance of an investment
manager, Associate in Nursing investor
should look not solely at the overall come
back of a portfolio, however conjointly at
the of that portfolio to examine. If the
investment's come back compensates
for the risk it takes. For instance,
if two mutual funds each have a twelve-
tone system come back, a
rational investor ought to like the fund
that’s less risky. Jensen's measure is one in
every of the ways that to work out if a
portfolio is earning the correct come
back for its level of risk. If the worth is
positive, then the portfolio is earning
excess returns. In alternative words, a
positive worth for Jensen's alpha means
that a fund manager has "beat the market" a
long with his stock selecting skills.
R-squared
R-squared of 100% means all
developments of a security are totally
clarified by developments in list, 85-100%
means the assets' execution designs have
been in accordance with the record, <70%

46
demonstrates that the stock does not act
much like the file.
Portfolio turnover ratio
Higher turnover will bring about more
value-based expenses because of incessant
purchase and offer of benefits inside the
store. Cost cognizant reserve speculators
should observe that the value-based
financier charge costs are excluded in the
estimation of a store's working cost
proportion and in this way speak to what
can be, in high-turnover portfolios, a
noteworthy extra cost that diminishes
venture return.
Sharpe Index
The larger the Sharpe index, the portfolio
over performs the market and if the lower
the sharp index, the portfolio under
performs the market.
Treynor's index
The higher the proportion, better is the
execution. At the point when the estimation
of the Treynor proportion is high, it means
that a financial specialist has created
significant yields on every one of the
market dangers he has taken. The Treynor
proportion takes into account a
comprehension of how every venture inside
a portfolio is performing. It additionally
gives the speculator a thought of how
effectively capital is being utilized.

47
3.8. LITERATURE REVIEW
The Behavior of Individual Investors
Handbook of the Economics of Finance Volume-2, Part-B, 2013
Authors: Brad Barber, Terrance Odean and Luzhng
Abstract: - He had conducted a comprehensive research titled “The Behavior of Mutual
Fund Investors”. The researchers have analyzed over 30,000 households with accounts at a
large u.s. discount broker, for mutual fund purchase and sale decision.
Measuring Performance of Indian Mutual Funds
Finance India, June 2011
Author: Deepak Agrawal
Abstract: - It provides an overview of mutual fund activity in India. He also analyses data at
both the fund-manager and fund-investor levels. The 26- study revealed that the performance
of the Mutual Fund Industry in India is affected by saving and investment habits of the people
on one hand and on the second side the confidence and loyalty of the fund manager.
Mutual Fund performance in emerging market
The case of Thailand, Ph.D. thesis, University of Birminghan, 2010
Author: Supa-Aim and Teerapan
Abstract: - “Mutual Fund performance in emerging market the case of Thailand” specifically
investigates mutual fund in one of the emerging economies, Thailand, using a more extensive
dataset than previous studies; it controls for investment policy and tax-purpose differences, as
unique characteristics of mutual funds in Thailand. The authors scrutinized how fund
managers perform and what strategy they use in managing their portfolios and ask whether
any fund characteristics can explain fund performance.
Does Alpha Really Matter? Evidence from Mutual Fund Indication, Termination
and Manager Change
University of Virginia – Darden School of Business [email protected],
January 2009
Author: Richard B. Evans
Abstract: - He examines the risk-adjusted versus total returns in mutual fund family
investment offering and manager succession decision. He presents evidence that suggests

48
many mutual fund investors do not risk adjust, from an analysis of the decisions of fund
families who observe their investing behavior. Many investors use total return, an intuitive
and readily available performance measure, when making mutual fund investment decisions.
Persistance in Performance of Indian Equity Mutual Fund
An Empirical Investigation, Article Number-2, Volume- 20, Jun-2009
Author: Sowmya Guha Deb, Ashok Banerjee and B.B. Chakrabarti,
Abstract: - The “Downside risk analysis of Indian equity Mutual Funds a value at risk
approach” put forward downside risk lends of Indian equity Mutual Fund using a measure 41
Three parametric models random walk, moving average, exponentially weighted moving
average 6 and one non- parametric model were employed to predict of a sample of equity
Mutual Funds in India in a rolling basis and actual changes in Net Assets Value registered by
the funds were compared with the estimated post facto. The results indicated presence of
considerable downside risk for an investor equity Mutual Funds for the study period under
consideration.
Author: Alan R Palmiter and Ahamed E Taha (2008)
Abstract: - In the study he examines the profiles of mutual fund investors presented by the
mutual fund industry, by the SEC, and by an extensive empirical academic literature
produced primarily by finance professors. The industry portrays fund investors as diligent,
fairly sophisticated, and guided by professional financial advisors.
Department of Dermatology, Under of Taxas Southwestern Medical Center,
Dallas Texas, May 25, 2-2007
Author: Bergstresser
Abstract: - He compared fund choices from 1996-2004 by fund investor who bought through
direct channels and by those who bought through brokers.
Australian Managed Fund Rating and Individual Investors
Australian Journal of Management, Vol. 29, No. 1June 2004,
The Australian graduate School of Management
Author: Paul Gerrans

49
Abstract: - He examines the use and understanding of managed fund ratings the analysis
presented in this paper suggests that managed found rating have become an important and
relied-upon feature and managed fund industry for individual retail investors.
Bargain Hunting or Star Gazing? Investors’ Preferences for Stock Mutual Funds
The Journal of Business, Vol. 76, No.4 (October 2003),
Author: Ronald T. Wilcox
Abstract: - There are of the opinion that investors who wish to purchase share in mutual
funds, balance many types of information, from a variety of source when making their fund
selection. This research examines how investors choose a mutual fund within a given class of
funds. They provide experimental evidence, which indicates that consumers pay close
attention to fees when selecting mutual funds.

50
CHAPTER 4
DATA ANALYSIS AND INTERPRETATION
CHART – 1
SBI FMCG Fund - Direct Plan
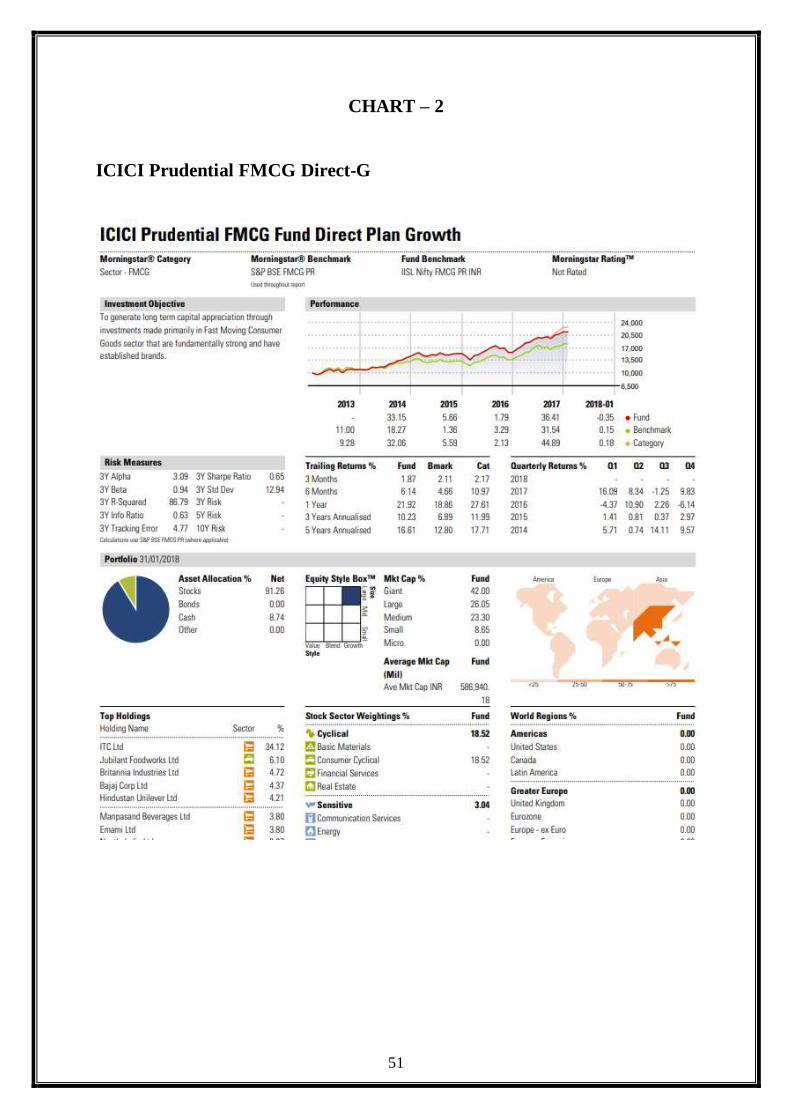
51
CHART – 2
ICICI Prudential FMCG Direct-G

52
CHART - 3
Reliance Large Cap Fund
Report as of 6 May 2018
Reliance Large Cap Fund - Direct Plan - Growth Plan Morningstar® Category Morningstar® Benchmark Fund Benchmark Morningstar Rating™ Large-Cap S&P BSE 100 India TR INR S&P BSE 100 India TR INR QQQQQ
Used throughout report Investment Objective
The primary investment objective of the scheme is to
seek to generate long term capital appreciation by
investing predominantly into equity and equity related
instruments of large cap companies. The secondary
objective is to generate consistent returns by investing
in debt, money market securities, REITs and InvITs.
However, there can be no assurance that the investment
objective of the Scheme will be realized.
Risk Measures 3Y Alpha 0.76 3Y Sharpe Ratio 0.65 3Y Beta 1.04 3Y Std Dev 14.78 3Y R-Squared 93.63 3Y Risk abv avg 3Y Info Ratio 0.28 5Y Risk abv avg 3Y Tracking Error 3.78 10Y Risk - Calculations use S&P BSE 100 India TR INR (where applicable)
Performance
27,000 22,750 18,500 14,250 10,000 5,750
2013 2014 2015 2016 2017 2018-04
- 55.70 1.85 3.43 39.91 -1.26 Fund 7.56 34.21 -1.95 5.02 33.27 1.49 Benchmark 4.26 40.45 -0.86 4.42 31.60 0.54 Category
Trailing Returns % Fund Bmark Cat Quarterly Returns % Q1 Q2 Q3 Q4 3 Months -2.78 -0.73 -1.21 2018 -6.67 - - - 6 Months -0.38 1.27 0.64 2017 15.20 6.33 2.40 11.54 1 Year 14.24 14.46 12.54 2016 -5.47 6.58 8.54 -5.41 3 Years Annualised 11.66 10.64 9.65 2015 5.12 -2.02 -3.21 2.17 5 Years Annualised 19.11 14.66 14.67 2014 8.38 22.39 6.36 10.36
Portfolio 31/03/2018
Asset Allocation % Net Stocks 98.50 Bonds 0.00 Cash 1.26 Other 0.24
Equity Style Box™ S
ize
Large
Sm
all
Value Blend Growth Style
Mkt Cap % Fund Giant 44.94 Large 40.55 Medium 13.27 Small 1.24 Micro 0.00 Average Mkt Cap Fund (Mil)
Ave Mkt Cap INR 809,870. 06
America Europe Asia <25 25-50 50-75 >75
Top Holdings
Holding Name Sector %
HDFC Bank Ltd y 6.44 State Bank of India y 6.23 Larsen & Toubro Ltd p 4.46 ITC Ltd s 4.17 Infosys Ltd a 3.69
ICICI Bank Ltd y 3.63 Bajaj Finance Ltd y 3.01 Tata Steel Ltd r 2.97 Divi's Laboratories Ltd d 2.96 ACC Ltd r 2.56
Assets in Top 10 Holdings % 40.11 Total Number of Equity Holdings 54 Total Number of Bond Holdings 0
Operations
Fund Company Reliance Nippon Life Asset Management Ltd Phone +91 22 30994600/30301111 Website www.reliancemutual.com Inception Date 01/01/2013 Manager Name Sailesh Raj Bhan Manager Start Date 08/08/2007 NAV (04/05/2018) INR 33.83 Total Net Assets (mil) 88,251.43 INR (31/03/2018)
Stock Sector Weightings % Fund World Regions % Fund
hCyclical 50.27 Americas 0.00
rBasic Materials 7.73 United States 0.00
tConsumer Cyclical 11.60 Canada 0.00
yFinancial Services 30.93 Latin America 0.00
uReal Estate - Greater Europe 0.00
jSensitive 30.40 United Kingdom 0.00
iCommunication Services 2.04 Eurozone 0.00
oEnergy 6.85 Europe - ex Euro 0.00
pIndustrials 14.02 Europe - Emerging 0.00
aTechnology 7.49 Africa 0.00
kDefensive 19.34 Middle East 0.00
Greater Asia 100.00
sConsumer Defensive 7.48
dHealthcare 8.56 Japan 0.00
fUtilities 3.29 Australasia 0.00
Asia - Developed 0.00
Asia - Emerging 100.00
Share Class Size (mil) - Minimum Initial Purchase 5,000 INR
Domicile India Minimum Additional Purchase 1,000 INR
Currency INR Exit Load 1.00% - 0-1 years
UCITS - 0.00% - >1 years
Inc/Acc Acc Expense Ratio 1.13%
ISIN INF204K01XI3
© 2018 Morningstar. All Rights Reserved. The information, data , analyses and opinions (“Information”) conta ined here in: (1) inc lude the proprie ta ry information of Morningstar and Morningstar’s third party licensors; (2) may
ß ®
not be copied or redistributed except as specifica lly authorised;(3) do not constitute investment advice;(4) a re provided sole ly for informationa l purposes; (5) are not warranted to be comple te, ac cura te or time ly; and (6) may
be drawn from fund da ta published on various da tes. Morningsta r is not responsible for any trading dec isions, damages or other losses rela ted to the Information or its use . Please verify a ll of the Information before usin g it
and don’t make any investment dec ision except upon the advice of a professiona l financ ia l adviser. Past pe rformance is no guarantee of future results. The va lue and income derived from investments may go down as well
as up.

53
CHART- 4
LARGE CAP
ICICI Prudential Balanced Fund Direct Plan Growth

54
FMCG Returns Table: - as of 21-Feb-2018
Mutual Fund Scheme AUM 1mth 3mth 6mth 1yr 2yr 3yr 5yr
SBI FMCG Fund - Direct 84.29 -3.9 4.8 18.5 36.8 30.6 17.97 20.
ICICI Prudential FMCG
Fund - Direct 42.6 -3.7 1.9 6.1 21.9 22.3 11.98 16.4
CATEGORY AVERAGE
14.49 18.1
Large Cap Returns Table: - as of 21-Feb-2018
Mutual Fund Scheme AUM 1mth 3mth 6mth 1yr 2yr 3yr 5yr
Reliance Large Cap Fund -
Direct
48.79 -8.7 -2.8 -0.4 14.3 22.7 11.6 19.11
ICICI Prudential Balanced
Fund Direct Plan Growth
1.32 -5.4 0.2 7.6 15.8 12.2 15.52 19.47
CATEGORY AVERAGE 12.77 19.29

55
TABLE – 1
FMCG
SBI MUTUAL FUND
Category Data Interpretation of Analysis
Standard
deviation
15.11 The average return for last 3 years is at 15.31 and the returns could
fall anywhere between 15.21 and 15.56. The deviation is very less
hence the fund will give consistent return.
Beta 1.01 If the Beta is more than 1 it means the stock is riskier than the
market but here the Beta is 1.01 so the debt fund is more risky and it
is worst for FMCG fund.
Jensen’s
Alpha
8.28 If the Alpha is more that means it has higher return compared to
other stocks. Here the Alpha is comparatively more than the other
three funds.
R-squared 73.21% Since the R-squared value is more than 70% i.e. 73.21%, it signifies
that the fund does act much like the index.
Sharpe’s
index
0.83 The lower the index, the portfolio under performs the market. I have
to compare with the other fund.
Treynor’s
ratio
22. 13 The higher the ratio, better is the performance. When the value of the
Treynor ratio is high, it is an indication that an investor has
generated high returns on each of the market risks he has taken. The
Treynor ratio allows for an understanding of how each investment
within a portfolio is performing. It also gives the investor an idea of
how efficiently capital is being used.

56
TABLE – 2
FMCG
ICICI Prudential FMCG Fund - Direct
Category Data Interpretation of Analysis
Standard
deviation
12.94 The average return for last 3 years is at 10.23 and the returns could
fall anywhere between 9.54 and 11.06. The deviation is very less
hence the fund will give consistent return.
Beta .94 If the Beta is less than 1 it means the stock is less than the market but
here the Beta is 0.94 so the debt fund is less risky and it is good for
FMCG fund.
Jensen’s
Alpha
3.09 If the Alpha is less that means it has low return compared to other
stocks. Here the Alpha is comparatively less than Principal Cash
Management Fund Direct.
R-squared 86.79% Since the R-squared value is between than 85%-100% i.e. 86.79%, it
means the assets' execution designs have been in accordance with the
record.
Sharpe’s
index
.65 The lesser the index, the portfolio under performs the market. I have
to compare with the other funds.
Treynor’s
ratio
17.2 The higher the ratio, better is the performance. When the value of the
Treynor ratio is high, it is an indication that an investor has
generated high returns on each of the market risks he has taken. The
Treynor ratio allows for an understanding of how each investment
within a portfolio is performing. It also gives the investor an idea of
how efficiently capital is being used.

57
TABLE - 3
LARGE CAP
Reliance Large Cap Fund - Direct
Category Data Interpretation of Analysis
Standard
deviation
14.78 The average return for last 3 years is at 11.66 and the returns could
fall anywhere between 10.36 and 12.86. The deviation is less hence
the fund will give consistent return.
Beta 1.04 If the Beta is more than 1 it means the stock is riskier than the
market but here the Beta is 1.04 so the debt fund is more risky and it
is worst for FMCG fund.
Jensen’s
Alpha
0.76 If the Alpha is less that means it has lower return compared to other
stocks. Here the Alpha is comparatively less than Principal Cash
Management Fund Direct.
R-squared 93.63% Since the R-squared value is more than 85% - 100% i.e. 93.63%, it
means the assets' execution designs have been in accordance with the
record.
Sharpe’s
index
0.65 The lesser the index, the portfolio under performs the market. I have
to compare with the other funds.
Treynor’s
ratio
15.34 The higher the ratio, better is the performance. When the value of the
Treynor ratio is high, it is an indication that an investor has
generated high returns on each of the market risks he has taken. The
Treynor ratio allows for an understanding of how each investment
within a portfolio is performing. It also gives the investor an idea of
how efficiently capital is being used.

58
TABLE - 4
LARGE CAP
ICICI Prudential Balanced Fund Direct Plan Growth
Category Data Interpretation of Analysis
Standard
deviation
10.07 The average return for last 3 years is at 12.28 and the returns could
fall anywhere between 11.36 and 13.86. The deviation is very less
hence the fund will give consistent return.
Beta 1.10 If the Beta is more than 1 it means the stock is riskier than the
market but here the Beta is 1.10 so the debt fund is more risky and it
is worst for long cap fund.
Jensen’s
Alpha
2.73 If the Alpha is less that means it has lesser return compared to other
2 stocks. Here the Alpha is comparatively less than Principal Cash
Management Fund Direct.
R-squared 91.32% Since the R-squared value is between 85% - 100% i.e. 91.32%, it
means the assets' execution designs have been in accordance with the
record.
Sharpe’s
index
0.97 The higher the index, the portfolio over performs the market. I have
to compare with the other funds.
Treynor’s
ratio
19.54 The higher the ratio, better is the performance. When the value of the
Treynor ratio is high, it is an indication that an investor has
generated high returns on each of the market risks he has taken. The
Treynor ratio allows for an understanding of how each investment
within a portfolio is performing. It also gives the investor an idea of
how efficiently capital is being used.

59
CHAPTER 5
FINDINGS, SUGGESTIONS AND CONCLUSION
FINDINGS
Through combinations of my study I learnt working of mutual fund in market. Mutual fund
pools amount from small investors and invest in various securities by doing this it gives small
investors benefit of access to stock market investment and reasonable return. Investors in a
mutual fund may perhaps contribute investors an optimal of diverse combinations of
overheads by means of offering several different categories of share classes.
Standard Deviation – higher standard deviation means greater fluctuation in
expected return and in comparison with relative indices, this also demonstrates
aggressive bets the portfolio managers make in order to deliver higher than expected
returns. Standard deviation values are pretty close between FMCG and Large cap
funds except for Reliance Large Cap fund. However the FMCG funds have delivered
a superior rate of return both for 3yr and less for 5yrs period.
Beta - If beta is >1 then the stock is riskier than the market, if beta <1 then the stock
is less risky than the market. If beta is =1 then the stock is volatile, if beta=0 then as
risky as the market is. The FMCG funds seem to have a higher risk in comparison to
the long term funds with the exception of ICICI Prudence Balance Fund in large cap.
A security's beta should be used along with R-squared value in relation to the
benchmark.
Alpha – The higher the alpha, higher is the earnings of the stock in comparison to the
levels predicted. FMCG funds have a mixed bag where SBI is going aggressive with a
higher risk and higher return and a higher volatility. ICICI is delivering a less in
interest but at a much lower risk. On the long term funds Reliance Large Cap Funds
and ICICI Prudential Balanced Large Cap Funds is going aggressive with high
volatility, higher risk but returns are comparatively lower than all the funds.
60
R-Squared – R-squared of 100% means all movements of a security are completely
explained by movements in index, 85-100% means the fund’s performance patterns
have been in line with the index, <70% indicates that the stock does not act much like
the index. SBI and ICICI Prudence FMCG Fund have a rate indicating that their
performance patterns are not much like the comparable index and in this case the BSE
Index. Both these funds have delivered a superior return but ICICI Prudence FMCG
fund manager is delivering a superior return at a lower risk and with an investment
strategy that is not quite like the other funds or the market index.
Sharpe’s Index – The larger the index, the portfolio is over performing than the
market. ICICI Prudence Balance Long Cap has a very high and clearly is the winner
as per this index.
Treynor’s Ratio - The higher the ratio, better is the performance. When the value of
the Treynor ratio is high, it is an indication that an investor has generated high returns
on each of the market risks he has taken. The Treynor ratio allows for an
understanding of how each investment within a portfolio is performing. It also gives
the investor an idea of how efficiently capital is being used. SBI is consistently doing
well in this index like the other with a higher Treynor’s index.

61
SUGGESTIONS
The hypothesis we set to prove in this study is Long term equity funds deliver a much higher
return in the long term(5yrs for this study) in comparison to Large Cap funds. However I am
not able to establish this for a fact. Large Cap funds have delivered superior returns and the
category averages are also comparable to FMCG funds. There is no pattern I am able to
establish for a sector to say some of the indices are behaving very different for the sector in
comparison to the other sector.
Investors should be well-convinced and adequate information to be given.
Relative market strength is one of the parameters investors have to think before
investing as under the study we have seen its importance.
Agent provides necessary transparent information for the investors and hence investors
are suggested to hold back their investment for a long time and not to sell, as it will
provide better result.
All the parameters is needed to be considered by the investors as there is larger impact
of global cues on Indian market.
Investors should invest in Equity diversified Fund as there is no restriction maximum
gain from the investment. It is used for retirement planning, saving for child education
or marriage whew as Equity Linked Saving Scheme is a tax saving mutual fund which
have a 3 year lock period. Here investor cannot sell the units before the 3 years expire.

62
CONCLUSION
Mutual funds are one of the most highly growing funds in the market. Mutual funds are
suitable for all types of investors from risk adverse and risk bearer. Mutual funds are suitable
to all age of investors. A mutual funds brings a large group of people and invest their
aggregated money in bonds and securities. They are easy to buy and sell. You can either buy
them directly from the fund company or through a third party According to the survey and
from the investor’s point of view, the investors are aware of the different schemes, majority
of the investors are preferring the SIP investment plan which is not risky and it’s easy to
manage in the daily basis. As per the mutual funds and according to the investors nearly half
of the investors are crossed 50 to 60 plus and also, they have schemes for senior citizen. The
starting rate to investing in icici bank starting is 2500per month as per icici prudential mutual
fund schemes. Therefore, the mutual funds play a vital role in the invertor’s point of view
which can be invested from a quite sum amount and which gives a benefit as a lump sum of
profits whereas majority of the investors are expecting high profit and to earn profit.
Investors should try to make changes in their portfolio during market volatility. However, a
little caution can help investors. Mutual fund advisors suggest that if your risk appetite and
investment horizon allows you, you can invest in small and midcap space anytime. “It is
always a good time to start investing but if are planning to invest in a small cap scheme,
make sure you have an investment horizon of close to 10 years,” says Vishal Dhawan in an
economic times article.

63
CHAPTER 6
LEARNING EXPERIENCE
The experience of working as an intern at Dvija Digital Pvt. Ltd. was fascinating and the
experience I got was enough to understand regarding the stock market in India. An internship
project is the essential part of the course mainly to gain knowledge about the working
environment at the company and industry level. This helps us to get a clear picture on the
corporate world and how important is work life balance.
Working as on a project of stock market enabled me understand some important aspects of
Finance such as funds trading in stock market of India, return and risk calculations, the
impact of economic activities on the price fluctuations of stock and the concept of mutual
funds.
At the same time, communication skills, project presentation skills and the ability of multi-
tasking during the working hours is important. To be successful, it is important to be
punctual and honest.
This internship has personally and professionally helped me grow by giving me a real
company environment experience, it has given me the opportunity of networking.
In this report, an attempt is made to analyze the risk and return of FMCG & Large Cap
Mutual Funds for long term by utilizing the statistical tools such as Standard Deviation, Beta,
R-squared, Jensen’s Alpha, Portfolio Turnover Ratio, Sharpe’s Index and Treynor’s Ratio.