INDUSTRIAL CONSUMERS REACTION TO UNINTENTIONAL CHANGES OF OPTIONAL ELECTRICITY TARIFFS IN BRAZIL...
12
7 Revista Brasileira de Energia, Vol. 20, N o . 1, 1 o Sem. 2014, pp. 7-18 INDUSTRIAL CONSUMERS REACTION TO UNINTENTIONAL CHANGES OF OPTIONAL ELECTRICITY TARIFFS IN BRAZIL (2002-2006) Francisco Anuatti Neto 1 Walter Belluzzo 2 Alexandre C. Nicolella 3 RESUMO Esse trabalho apresenta uma análise econométrica com microdados obti- dos do banco de faturamento da AES-Eletropaulo, Região Metropolitana de São Paulo, para o período 2002 a 2006. Empregando um modelo de re- gressão multinominal, avaliou-se a reação dos consumidores industriais co- nectados em alta tensão, entre 2,3 kV e 69kV, às alterações introduzidas no preço relativo da energia de ponta da opção tarifária Verde. Constatou-se que à medida que esse preço relativo era alterado, a probabilidade de mi- gração em busca dessa opção aumentava em detrimento das alternativas Convencional e Azul, mantidas as demais características do consumo sob controle. Embora o regulador tenha alterado a relatividade dos preços de forma não intencional, mostrou-se que os consumidores reagem a estímu- los de preços relativos no uso da energia. Palavras-Chave: Estrutura Tarifária. Consumidores Industriais de Eletricida- de. 1 Departamento de Economia, Faculdade de Economia, Administração e Contabilidade de Ribeirão Pre- to, Universidade de São Paulo. [email protected] 2 Departamento de Economia, Faculdade de Economia, Administração e Contabilidade de Ribeirão Pre- to, Universidade de São Paulo. [email protected] 3 Departamento de Economia, Faculdade de Economia, Administração e Contabilidade de Ribeirão Pre- to, Universidade de São Paulo. [email protected]
Transcript of INDUSTRIAL CONSUMERS REACTION TO UNINTENTIONAL CHANGES OF OPTIONAL ELECTRICITY TARIFFS IN BRAZIL...

7Revista Brasileira de Energia, Vol. 20, No. 1, 1o Sem. 2014, pp. 7-18
INDUSTRIAL CONSUMERS REACTION TO UNINTENTIONAL CHANGES OF OPTIONAL
ELECTRICITY TARIFFS IN BRAZIL (2002-2006)
Francisco Anuatti Neto1
Walter Belluzzo2
Alexandre C. Nicolella3
RESUMO
Esse trabalho apresenta uma análise econométrica com microdados obti-dos do banco de faturamento da AES-Eletropaulo, Região Metropolitana de São Paulo, para o período 2002 a 2006. Empregando um modelo de re-gressão multinominal, avaliou-se a reação dos consumidores industriais co-nectados em alta tensão, entre 2,3 kV e 69kV, às alterações introduzidas no preço relativo da energia de ponta da opção tarifária Verde. Constatou-se que à medida que esse preço relativo era alterado, a probabilidade de mi-gração em busca dessa opção aumentava em detrimento das alternativas Convencional e Azul, mantidas as demais características do consumo sob controle. Embora o regulador tenha alterado a relatividade dos preços de forma não intencional, mostrou-se que os consumidores reagem a estímu-los de preços relativos no uso da energia.
Palavras-Chave: Estrutura Tarifária. Consumidores Industriais de Eletricida-de.
1 Departamento de Economia, Faculdade de Economia, Administração e Contabilidade de Ribeirão Pre-to, Universidade de São Paulo. [email protected]
2 Departamento de Economia, Faculdade de Economia, Administração e Contabilidade de Ribeirão Pre-to, Universidade de São Paulo. [email protected]
3 Departamento de Economia, Faculdade de Economia, Administração e Contabilidade de Ribeirão Pre-to, Universidade de São Paulo. [email protected]

8 REVISTA BRASILEIRA DE ENERGIA
ABSTRACT
This paper presents a micro-econometric analysis of the industrial consu-mers’ reactions to changes in tariff options in São Paulo Metropolitan Re-gion (Brazil) from 2002 to 2006. We use AES-Eletropaulo monthly billing data information of 2699 unidentified industrial companies connected to high voltage levels, from 2.3kV to 69kV. We test if the regulator’s uninten-tional changes in the relative price of peak energy for Green tariff induced industrial consumer to adoption a different tariff option. We found an in-crease in the probability of adopting Green tariff with respect to Conven-tional and Blue tariff, showing the responsiveness of industrial consumers to energy relative prices.
Keywords: Tariff Structure. Industrial Consumers of Electricity.
1. INTRODUCTION
After a drought in the summer of 2000/2001, the Brazilian govern-ment imposed compulsory restrains in energy consumption. Investments in generation were crucial to avoid risks of serious electricity rationing, but to attract investors was necessary to complete the sector reform, in particu-lar to put energy wholesale market to work. It was also necessary to segre-gate activities and prices of power generation, transparent access tariffs to transmission and distribution grids and the end of cross-subsidization from low voltage to high voltage consumers. Even after sector privatization and reforms, started in 1995, tariff structure remained the same until the crisis of 2001 led to changes.
The Brazilian Federal agency for the regulation of the electricity sector, ANEEL, established a transition period from 2003 to 2007 to gradu-ally implement full segregation of access tariffs and the end of cross subsi-dy in energy prices. During this transition period the tariff structures were changed in a way that altered the relative attractiveness of the options in the tariff menu available to industrial consumers.
The existing tariff system was introduced in the mid eighties, when the electricity sector operated as an integrated state monopoly, following a well established approach of Boiteux [1]. The tariff system equates demand for power to the available capacity, allocating investment costs according to consumers’ responsibility in the load curve of the electric systems.

9VOL. 20 | No 1 | 1o SEM. 2014
This study focuses on industrial consumers connected to high vol-tage levels, from 2.3kV to 69kV, that can select a menu with three options - Conventional, Green and Blue tariffs - if capacity contracted is inferior to 300kW. When capacity contracted is equal or exceeds 300kW they can choose between Green and Blue tariffs.
Blue tariff has two capacity prices - peak and off-peak - and four energy prices distinguished by season (dry and humid) and time of the day (peak and off-peak). It is the dominant choice for flat users, load profile typical of processes industries. Green tariff has a single capacity charge and the same energy price structure of the Blue tariff. The Green tariff is designed as an alternative to users with an intermediate load or variable load at peak hours. Conventional tariff has a single capacity charge and a single price for energy, designed to be dominant for consumers with variable load, both peak and off-peak.
This article discusses industrial consumers reactions to unintentio-nal exogenous changes of relevant parameters used to set tariff menu, ob-served during regulatory transition period. The next section presents the relevant parameters used to determine an appropriate tariff menu. Third section deals with the empirical analysis of a specific electricity distribution company (DISCO), AES-Eletropaulo, focusing on possible inducement of switching to different option without effectively changing industrial con-sumer load profile. We close with some final comments.
2. MAKING SENSE OF A TARIFF MENU
A tariff structure can be established for several distribution system load curve levels and for different representative load curves along the year. In the Brazilian case the tariff structure adopted is based on just one repre-sentative load curve, and only two periods are distinguished, peak and off--peak. This is a strong compromise of efficiency of economic signaling in favor of simplicity of the tariff system. This simple structure may be justified by the existing informational and computational restrictions in effect by the time this tariff system was implemented.
Our point here is not to propose a different approach, but to discuss economic signals that this tariff structure sends to industrial consumers. Even assuming that the regulator uses the best information available to set tariff structure, i.e. that DISCO has the incentives to truthfully reveal the best

10 REVISTA BRASILEIRA DE ENERGIA
information to the regulator, uncertainty and asymmetric information pre-vails, since regulated firms do not have enough information with respect to willingness of industrials consumers to transfer their consumption from the peak to off-peak.
DISCO does have access to observed patterns of metering used for billing, but these patterns are conditioned on existing prices. The usual me-asurement campaigns used to compose the aggregate load curves that will be used to calculate the long run marginal costs of capacity are subject to the same problem. If prices changed the observed curves could be diffe-rent.
The approach to overcome such limitation is to use tariff design experiments. Household experiments are more frequently reported in the literature [2], but some experiments on industrial and commercial consu-mers’ response to time-differentiated prices can be mentioned [3]and [4] .
Another issue is the effectiveness of economic signals that a tariff menu can provide. Blue tariff requires that consumers explicitly contract its maximum demand for capacity at peak and off-peak levels. Equation (1) shows a simplified version of total expenditure of Blue Tariff, ignoring the seasonal energy prices.
(1)
Where d is the maximum capacity demand for peak (subscript p) and off-peak (subscript op) periods in kW, e is energy consumed during the month in each period, pd is monthly price for kW contracted in each period, pe is energy prices (kWh) specific of the Blue tariff (superscript B). The dark blue line in Figure 1 represents expenditures of a flat consumer that hires 1kW and uses it constantly for 730 hours of a typical month, with 65 hours of peak (hp).
When a consumer contracts Green tariff it has no need to make ex-plicit if its maximum demand occurs in peak or off-peak hours, as in Equa-tion (2).
(2)
When determining a tariff menu ANEEL has to choose the parame-ters that will properly discriminate consumers that can easily shift demand from peak to off peak hours. Once both Green capacity and off-peak energy

11VOL. 20 | No 1 | 1o SEM. 2014
prices are equal to the Blue off-peak prices, the adjustment has to be taken on energy peak price. Figure 1 presents a comparison for a consumer that contracts 1kW of capacity and has to decide between Blue and Green tariff.
In Equation (3) we make energy a function of the use of capacity or the load factor (lf ) for each period.
(3)
A comparison of the expenditures under Blue and Green tariffs de-pends only on the load factor at the peak hours, since expenditures are the same during off-peak hours. If the peak load factor is below the level defi-ned by the crossing of the slashed green line with solid blue line the choice is the Green tariff. Those who can not reduce their load factor that much would prefer Blue Tariff.
Figure 1- Blue and Green Tariffs
But once the regulator established a peak price it is expected that even typically flat consumers may react reducing part of the capacity con-tracted (flat modulated consumer). In that case, the relevant comparison for the choice between Green and Blue tariffs is pictured in Figure 2. Note that in this case, the indifference load factor is even smaller, turning the Blue tariff a dominant choice.

12 REVISTA BRASILEIRA DE ENERGIA
Figure 2- Flat Modulated Consumer
On the other hand, for consumers whose maximum demand for capacity is variable, short, and are free to be scheduled to occur at any mo-ment of the day would benefit on the Green tariff. In conclusion, when de-termining the relation between Green and Blue tariffs, the regulator must take into account Blue peak prices of energy and capacity and the appro-priate load factor, Equation (4).
(4)
Choosing the appropriate load factor is part of the tariff structure regulators policy. When Green tariff was introduced in Brazil, the peak load factor used to discriminate between a medium user (Green) and a long user (Blue) was 0.66.
Once the transition period started in 2003, elimination of cross--subsidy and segregation of access charges to transmission and distribu-tion grids, led to changes in the relative prices of energy, turning the point of load factor indifference higher than the initial one. Table 1 exhibits the evolution of the load factors calculated using AES-Eletropaulo published tariffs.
Rearranging Equation (4) we get indifference load factor:

13VOL. 20 | No 1 | 1o SEM. 2014
(5)
Table 1- Indifference Load Factors – AES Eletropaulo
Years ILFJuly 2001/June 2002 0,67July 2002/June 2003 0,67July 2003/June 2004 0,71July 2004/June 2005 0,75July 2005/June 2006 0,68July 2006/June 2007 0,95
Analyzing how these changes affected the choices of industrial consumers is the objective of next section. Before moving on, it is necessary to discuss the relation of Blue and Green tariffs with the Conventional tariff.
Conventional Tariff simplifies energy prices by setting only one pri-ce, regardless of season or time during the day (Equation 6).
(6)
In a simple interpretation Conventional tariff is available for consu-mers with capacity contracts smaller than 300kW. If this consumer can opt for both Green and Blue tariffs, this option could be explained on the basis of avoiding metering costs.
If the choices are only Conventional or Green, regulators would need to use Conventional tariff to send economic signals present in Blue tariff, i.e. long utilization of capacity during peak hours should be charged. In that case Conventional tariff would dominate Green tariff only above the indifference load factor as the Blue tariff does. Equation (7) defines the Conventional energy price if the capacity charge is expected to equal Blue peak demand.
(7)
Note that in (7) both peak and off-peak load factors are necessary to set energy price, as well as the term r , that stands for the ratio of peak demand over off-peak demand.

14 REVISTA BRASILEIRA DE ENERGIA
3. EMPIRICAL ANALYSIS
Although our empirical analysis is not a controlled experiment the strategy of the paper is to take advantage of unintended changes the re-gulator introduced in the tariff menu as quasi-experiment for estimate the average willingness to adjust to price incentives.
Database
For the analysis reported here, our primary database consisted of AES-Eletropaulo monthly billing data information of 2699 unidentified in-dustrial companies connected to high voltage levels, from 2.3kV to 69kV, followed from January 2002 to December 2006.
Tariff readjustment occurs every July and tariff revision occurs in a four year cycle. During the period there were four readjustments and one tariff review (2004).To explore the effects of tariff changes we grouped in-dividual consumer information from monthly to average semi-annual, Ja-nuary-June and July-December. In that way we have ten periods and six different tariffs.
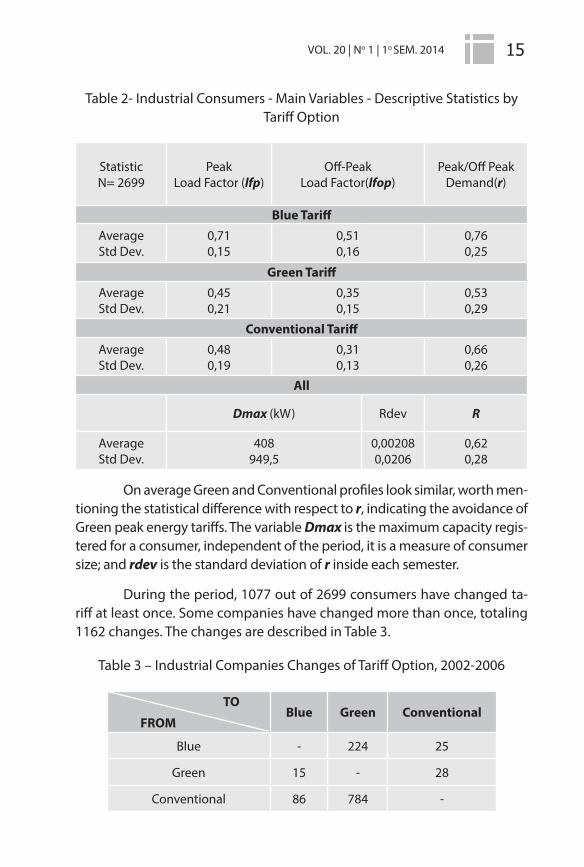
Table 2 exhibits statistics of load factors and ratio of peak and off--peak demands for the whole period, considering consumers grouped by tariff option at each of the ten semesters. The average values reproduce the expected stylized facts: Blue tariff consumers tend to have higher loads at peak and off peak. They also present the higher value of r, meaning that maximum peak demand tends to be 76% of the off-peak demand.
15VOL. 20 | No 1 | 1o SEM. 2014
Table 2- Industrial Consumers - Main Variables - Descriptive Statistics by Tariff Option
StatisticN= 2699
Peak Load Factor (lfp)
Off-PeakLoad Factor(lfop)
Peak/Off Peak Demand(r)
Blue TariffAverageStd Dev.
0,710,15
0,510,16
0,760,25
Green TariffAverageStd Dev.
0,450,21
0,350,15
0,530,29
Conventional TariffAverageStd Dev.
0,480,19
0,310,13
0,660,26
All
Dmax (kW) Rdev R
AverageStd Dev.
408949,5
0,002080,0206
0,620,28
On average Green and Conventional profiles look similar, worth men-tioning the statistical difference with respect to r, indicating the avoidance of Green peak energy tariffs. The variable Dmax is the maximum capacity regis-tered for a consumer, independent of the period, it is a measure of consumer size; and rdev is the standard deviation of r inside each semester.
During the period, 1077 out of 2699 consumers have changed ta-riff at least once. Some companies have changed more than once, totaling 1162 changes. The changes are described in Table 3.
Table 3 – Industrial Companies Changes of Tariff Option, 2002-2006
TO
FROMBlue Green Conventional
Blue - 224 25
Green 15 - 28
Conventional 86 784 -

16 REVISTA BRASILEIRA DE ENERGIA
The strong majority of changes were to Green tariff. This movement seems coherent with both the weak economic signals in the Conventional tariff and the detected changes of the indifference load factor (Table 1).
Empirical Test
The aim of this section is to find association between tariff choices (Conventional, Blue or Green) and ILF and other individual characteristics - (Dmax, r and rdev, discussed above). We have a multinomial data with unor-dered categories. Due to this, we use a multinomial logit model nomina-ting the Green tariff as the baseline (Table 3). We assume that the log-odds of each response follow the linear models as follows:
(8a)
(8b)
Where αj is the constant for j=b (Blue) and c (Conventional) and βj is the vector of regression coefficients. The estimates of the model are in Table 4.
Table 4 – Multinomial Logit Model Results

17VOL. 20 | No 1 | 1o SEM. 2014
In Table 4 the raw regression coefficients indicate that all variables are significant at 1% level. We can say that for one unit change in the va-riable ILF, the log of the ratio of the two probabilities, P(Blue)/P(Green), will be decreased by 4.289, and the log of the ratio of the two probabilities P(Conv)/P(Green) will be decreased by 5.227. Therefore, the higher the re-gulator sets ILF, the more industrial consumers will prefer Green tariff.
Using the regression coefficients we estimated for two power ca-pacity groups the predicted probability of Blue, Green and Conventional tariffs in the midpoint of each predictor and plot them against the variation of ILF. The results are presented in Figure 3.
Figure 3 –Estimated Probability of Tariff Under ILF variations- <300kW or >= 300kW
We observed for the first panel of Figure 3, for the low capacity group (<300kW), the higher the ILF the smaller the probability of being Conventional and higher is the probability of being Green, while Blue re-mains constant. For the second panel of Figure 3 (>=300kW), the higher the ILF the higher is the probability of being Green and the probability of being Blue and Conventional is smaller.

18 REVISTA BRASILEIRA DE ENERGIA
4. CONCLUSION
The interpretation of our results is straightforward, ILF increases during the period reducing the relative price of peak energy for Green tariff. This change led to a significant movement out from the alternatives, Con-ventional and Blue tariff. An evaluation of how this movement has affected DISCO´s revenues was not performed. Also, further investigation is nee-ded to evaluate if the movement in direction of Green tariff was beneficial to a more rational use of power during peak hours. In a recently released working document [5], the regulator seems to realize that changes in indi-fference load factors were actually a consequence of an inadequate proce-dure. The decision to return to the traditional 0,66 ILF lead us to conclude that the changes in relative prices were unintentional.
REFERENCES
[1] M. Boitoeux, 1960, “Peak Load Pricing”, Journal of Business, vol. 33, 157-179.
[2] M. Räsänen, J. Ruusunen, R. P. Hämäläinen, 1997, “Optimal tariff design under consumer self-selection”, Energy Economics, Vol.19, 151-167.
[3] D.J. Aigner, J. Newman, A. Tishler, 1994, “The Response of Small and Medium-Size Business Customers to Time-of-Use (TOU) Electricity Rates in Israel”, Journal of Applied Econometrics, Vol. 9, pp. 283-304.
[4] J. A. Herriges; S. M. Baladi; D. W. Caves; B. F. Neenan, 1993, “The Respon-se of Industrial Customers to Electric Rates Based Upon Dynamic Marginal Costs”, Review of Economics and Statistics, Vol. 75, pp. 446-454.
[5] ANEEL, 2008, “Projeto Estratégico:Metodologia para o Estabelecimen-to de Estrutura Tarifária para o Serviço de Distribuição de Energia Elétrica”, Chamanda no.8, SPE/ANEEL, Brasília, DF.