Guideline tariffs for medical practitioners and dentists - South ...
Upload
khangminh22Category
view
1download
0
Taking Forward the Lima Declaration onthe Free Trade Area of the Asia-Pacific(FTAAP) – Study on Tariffs
APEC Policy Support UnitNovember 2019

Prepared by:
Carlos Kuriyama, Divya Sangaraju, Crystal Liu Jiquan and Denise Cheok
Asia-Pacific Economic Cooperation Policy Support Unit
Asia-Pacific Economic Cooperation Secretariat
35 Heng Mui Keng Terrace
Singapore 119616
Tel: (65) 6891-9600 Fax: (65) 6891-9690
Email: [email protected] Website: www.apec.org
Produced for:
Committee on Trade and Investment
Asia-Pacific Economic Cooperation
APEC#219-SE-01.12
This work is licensed under the Creative Commons Attribution-NonCommercial-
ShareAlike 3.0 Singapore License. To view a copy of this license, visit
http://creativecommons.org/licenses/by-nc-sa/3.0/sg/.
* The analysis conducted in this report is non-binding and strictly for research purposes only. The
content of this report respects APEC mandates and does not prejudice APEC member economies’
rights, positions and commitments in any fora, agreement or trade negotiation. The views expressed in
this document are those of the authors and do not represent those of the APEC Secretariat or APEC
Member Economies. The authors would like to thank the members of the Committee on Trade and
Investment for their comments and the Organisation for Economic Co-operation and Development
(OECD) for providing statistical information.

Table of Contents
i
1. TABLE OF CONTENTS
1 UPDATE OF THE TARIFF ANALYSIS REPORTED IN THE COLLECTIVE
STRATEGIC STUDY ON FTAAP ................................................................................. 5
1.1 TARIFF LANDSCAPE IN THE APEC REGION ................................................... 5
1.2 OPPORTUNITIES FOR FURTHER TARIFF LIBERALIZATION ....................... 9
1.3 OBSERVATIONS .................................................................................................. 13
2 POTENTIAL IMPACT FROM LOWERING TARIFFS THROUGH FTAAP
PATHWAYS ................................................................................................................... 14
2.1 INTRODUCTION .................................................................................................. 14
2.2 RATIONALE .......................................................................................................... 14
2.3 MODELLING CONSTRAINTS ............................................................................ 15
2.4 RESULTS ............................................................................................................... 16
2.5 OBSERVATIONS .................................................................................................. 40
3 MARKET ACCESS COMMITMENTS WITHIN THE CPTPP .............................. 42
3.1 INTRODUCTION .................................................................................................. 42
3.2 RATIONALE .......................................................................................................... 42
3.3 MARKET ACCESS COMMITMENTS ................................................................. 42
3.4 RELATIONSHIP BETWEEN LIBERALIZATION PERIODS AND BASE
TARIFFS ................................................................................................................. 56
3.5 OBSERVATIONS .................................................................................................. 57
4 FINAL REMARKS ........................................................................................................ 58
5 REFERENCES ............................................................................................................... 59
6 ANNEX ............................................................................................................................ 62

Table of Contents
ii
LIST OF FIGURES
Figure 1.1: Percentage of tariff lines with applied tariffs over 15%, by sector ......................... 6
Figure 1.2: Cumulative Number of RTA/FTAs Signed and Enforced by APEC Economies ... 9
Figure 1.3: APEC Economies’ Share of Trade with RTA/FTA Partners (Exports) ................ 10
Figure 1.4: APEC Economies’ Share of Trade with RTA/FTA Partners (Imports) ................ 10
Figure 1.5: Unemployment and trade openness for OECD economies ................................... 11
Figure 1.6: Share of intermediate and capital products in total trade (1995-2011) ................. 11
Figure 1.7: Comparing the incidence of tariffs on the gross value and the domestic value added
of exports ................................................................................................................................. 12
Figure 1.8: ITA participation index in GVCs as a percentage of gross exports ...................... 12
Figure 2.1: Impact of FTAAP on welfare of the APEC region ............................................... 17
Figure 2.2: Impact of depth of FTAAP on the income of APEC economies (in USD billions)
.................................................................................................................................................. 19
Figure 2.3: Impact of depth of FTAAP on the income of APEC economies (as a proportion of
GDP) ........................................................................................................................................ 19
Figure 2.4: Impact of FTAAP on proportion of TOT and Capital Accumulation of APEC
economies ................................................................................................................................ 20
Figure 2.5: Impact of FTAAP on exports of APEC economies .............................................. 21
Figure 2.6: Impact of FTAAP on exports of the world............................................................ 22
Figure 2.7: Impact of TPP on production volume of TPP Participants ................................... 24
Figure 2.8: Impact of TPP/CPTPP on import of APEC and TPP/CPTPP members ............... 26
Figure 2.9: Impact of TPP on investment of the APEC region ............................................... 27
Figure 2.10: Impact of TPP on income of APEC economies .................................................. 28
Figure 2.11: Impact of TPP on welfare of APEC economies .................................................. 29
Figure 2.12: Impact of TPP on inward and outward FDI stocks for APEC economies .......... 30
Figure 2.13: Average labor income growth of ASEAN economies participating in TPP/CPTPP
.................................................................................................................................................. 31
Figure 2.14: Impact of TPP on income of ASEAN, Pacific Alliance and the EAEU ............. 32
Figure 2.15: Impact of TPP on welfare of ASEAN, Pacific Alliance and the EAEU ............. 33
Figure 2.16: Impact of TPP on inward and outward FDI stocks for ASEAN, Pacific Alliance
and the EAEU .......................................................................................................................... 34
Figure 2.17: Impact of RCEP on income of APEC economies ............................................... 36
Figure 2.18: Impact of depth of RCEP on income of APEC economies ................................. 37
Figure 2.19: Dynamic impact of RCEP on GDP growth ......................................................... 37
Figure 2.20: Impact of RCEP on the welfare attributed to terms of trade and Capital
accumulation ............................................................................................................................ 38

Table of Contents
iii
Figure 2.21: Impact of RCEP on exports of the APEC region ................................................ 39
Figure 2.22: Impact of RCEP on ASEAN GDP ...................................................................... 39
Figure 3.1: Number of Tariff Lines for Agriculture and Non-Agriculture Products ............... 43
Figure 3.2: Average base tariffs (%) for CPTPP member economies ..................................... 44
Figure 3.3: Number of staging categories for all products ...................................................... 44
Figure 3.4: Number of staging categories for agriculture and non-agriculture products......... 45
Figure 3.5: Share of Duty-Free Tariff Lines by Each Year of CPTPP Agreement ................. 46
Figure 3.6: Share of duty-free tariff lines at CPTPP date of entry into force .......................... 46
Figure 3.7: Share of Tariff Lines Fully Liberalized after 10 or More Years ........................... 52
Figure 3.8: Relationship between Average Base Tariff and Years to Full Liberalization ....... 56
Figure 3.9: Relationship between Average Base Tariffs and Years to Full Liberalization ..... 57
LIST OF TABLES
Table 1.1: Most favoured nation (MFN) rate trends in the APEC region, 2008-2017 .............. 5
Table 1.2: Average applied most-favoured nation (MFN) rates in APEC region, by product
category ...................................................................................................................................... 7
Table 1.3: Average percentage of duty-free tariff lines in the APEC region, by product category
.................................................................................................................................................... 8
Table 2.1: Impact of FTAAP pathways on APEC (in USD billion) ........................................ 17
Table 2.2: Impact of TPP & CPTPP on income of the APEC region (in USD billion) .......... 24
Table 2.3: Impact of TPP & CPTPP on welfare of the APEC region (in USD billion) .......... 25
Table 2.4: Impact of TPP & CPTPP on welfare of the TPP/CPTPP members ....................... 25
Table 2.5: Impact of TPP on income growth for selected APEC economies (% change) ....... 31
Table 2.6: Impact of RCEP on the APEC region’s income (in USD billion) .......................... 35
Table 3.1: HS Chapters with Full Immediate Liberalization under CPTPP vs. HS Chapters
Duty-Free under WTO Bound Tariff Schedules ...................................................................... 47
Table 3.2: List of HS Chapters with Full Immediate Liberalization Across All CPTPP Parties
.................................................................................................................................................. 48
Table 3.3: Percentage of Tariff Lines with Base Tariff = 0% vis-a-vis Percentage of Tariff
Lines with Duty-Free Access on CPTPP’s Date of Entry into Force ...................................... 49
Table 3.4: Top 5 Chapters with Most Duty-free Tariff Lines at Date of Entry (% of Total Tariff
Lines) ....................................................................................................................................... 51
Table 3.5: Number of HS Chapters Containing Tariff Lines Fully Liberalized After 10 or More
Years ........................................................................................................................................ 53
Table 3.6: Top 5 HS Chapters with Most Tariff Lines Fully Liberalized Only After 10 or More
Years (as % of share within each chapter) ............................................................................... 54
Table 3.7: Number of Tariff Lines Subject to Partial Liberalization ....................................... 55
Table 3.8: Tariff Exclusions under CPTPP.............................................................................. 55

Executive Summary
1
EXECUTIVE SUMMARY
In 2016, Leaders endorsed the Lima Declaration on the Free Trade Area of the Asia Pacific
(FTAAP), instructing officials to work on measures that affected both trade and investment
towards achieving the Bogor Goals, and to advance the vision for the eventual realization of
the FTAAP. As part of this effort, the APEC Committee on Trade and Investment (CTI)
endorsed in 2017 the work program on tariffs spearheaded by Hong Kong, China and supported
by the APEC Policy Support Unit (PSU), which included the preparation of a study on tariffs
with the intention of: 1) updating the tariff analysis in the Collective Strategic Study on Issues
Related to the Realization of the FTAAP; 2) conducting a literature review on previous studies
analyzing the potential impact of lowering tariffs through an FTAAP; and 3) examining the
tariff liberalization commitments at pathways to the FTAAP.
COMPONENT 1: UPDATE OF THE TARIFF ANALYSIS REPORTED IN THE
COLLECTIVE STRATEGIC STUDY ON FTAAP
Average MFN tariffs in the APEC region have followed a downward trend, but continue to
remain higher for agricultural products (11.4% in 2017) than non-agricultural ones (5.3% in
2017). The reduction in tariffs have slowed down in recent years, but average MFN tariffs for
most product categories have continued falling every year.
In addition, the proportion of duty-free tariff lines has increased for most agricultural product
categories, with large increases identified in cotton. Within the non-agricultural sector, the
highest proportions of duty-free tariff lines were found in petroleum products, non-electrical
and electrical machinery.
Among the products with the highest MFN average tariffs in the agriculture sector, they are
found in beverages and tobacco, dairy products, and cereals and preparations. In non-
agricultural sectors, labor-intensive products such as clothing and textiles, and those that are
simultaneously intensive in capital and labor, such as transport equipment, are facing the
highest average tariffs.
Tariffs could affect global value chains (GVCs). Almost 75% of the international trade is
composed of both intermediate and capital goods and this proportion has been increasing over
the years. In addition to increasing product costs, maintaining or increasing tariffs leads to
negative protection of downstream industries, thereby further dampening the entire global
value chain.
Despite the progress made, there is still room for APEC economies to participate more actively
to reduce trade barriers. Some possible ways forward include participating actively through
bilateral/regional free trade agreements (RTA/FTAs), as APEC economies’ share of trade with
RTA/FTA partners accounted for less than 50% of their total trade. Moreover, APEC
economies could participate in multilateral or plurilateral agreements such as the Information
Technology Agreement (ITA).

Executive Summary
2
COMPONENT 2: POTENTIAL IMPACT FROM LOWERING TARIFFS
THROUGH FTAAP PATHWAYS
A review of 17 studies using computable general equilibrium (CGE) models to examine the
impact of reducing or eliminating tariffs through potential pathways of achieving FTAAP was
undertaken in order to analyze the estimated impact for the APEC region and individual
economies on GDP/production levels, welfare, trade flows and investment. These potential
pathways included the Trans-Pacific Partnership (TPP), Comprehensive and Progressive
Agreement for Trans-Pacific Partnership (CPTPP) and the Regional Comprehensive Economic
Partnership (RCEP).
If an FTAAP is implemented, previous studies indicate that income and welfare is expected to
increase for the APEC region, its economies and relevant sub-regions. Most of the benefits
captured by the region would be directed towards its developing economies and driven
primarily by a capital accumulation effect. Many economies would face worsening terms of
trade, as they may be losing the advantage of already having a preferential market access due
to bilateral/regional RTA/FTAs already in place. However, this negative effect would be offset
by a positive capital accumulation effect.
The TPP and the CPTPP pathway predicts income gains for the APEC region to be in the range
of USD 97 billion and USD 438 billion. Similarly, the region is expected to benefit from a net
FDI inflow as a result of factors such as increased GDP and reduced investment barriers within
economies. In aggregate terms, a large proportion of gains would be channeled towards APEC
developed economies, but gains for developing economies would be significant in relative
terms. Whilst those APEC members being part of TPP/CPTPP would benefit from these
pathways, those excluded from the TPP/CPTPP would lose out.
In the case of the RCEP pathway, gains received by APEC economies are largely positive for
almost all of the region’s economies with most benefits directed towards developing
economies. Income gains under the RCEP would be in the range of USD 204 billion and USD
750 billion, larger than those under the TPP/CPTPP for the APEC region. At the individual
level, similar to the case of TPP/CPTPP, almost all non-RCEP economies are predicted to lose
out as opposed to those APEC economies within RCEP.
In general, under any pathway, while the benefits will be possible at the regional level, the
impact for individual economies and sectors will differ depending on several factors. For
example: membership in those pathways, economic structure, availability of factors of
production, market size, development levels and network of RTA/FTA partners.
COMPONENT 3: MARKET ACCESS COMMITMENTS WITHIN THE CPTPP
The market access commitments agreed in CPTPP reflects a very complex negotiation process
as a result of different development levels, production structures, strategic interests and
sensitive matters of participating economies. The presence of high base tariffs in some sectors,
as well as the number of staging categories for participating economies to phase out their
respective tariffs, shows the willingness to look for creative solutions to strike a balance among
participating economies in reaching an agreement.
The market access commitments agreed at CPTPP can be categorized into four approaches: 1)
products are duty-free immediately after the CPTPP is put in force by a signatory party; 2)

Executive Summary
3
products are subject to longer phase-out periods up to 21 years; 3) products subject to partial
liberalization only; and 4) products excluded from the tariff liberalization process.
Substantial progress has been made in lifting tariffs on goods by all parties. Upon entry into
force of the CPTPP, 86.1% of the total tariff lines from the 11 CPTPP parties are immediately
duty-free, which shows a substantial effort to liberalize across all CPTPP parties, noting that
54.1% of all tariff lines had a base tariff equal to 0%. Whilst liberalization efforts under CPTPP
have been uneven across sectors, seven CPTPP members are offering immediate duty-free
entry in more than half of the sectors (i.e. a sector is offered duty-free when all tariff lines
belonging to a specific Harmonized System (HS) chapter are offered duty-free). 10 HS chapters
are offered duty-free by all members, with most of the products related to natural resources
(e.g. oil, minerals), intermediate products (e.g. chemicals, steel) and capital goods (e.g.
machinery, equipment).
Longer liberalization periods apply to sensitive products. 7 out of 11 CPTPP parties have tariff
lines that will be fully liberalized only after 10 or more years. Such slow-paced liberalization
is mostly prevalent in labor-intensive manufactures (e.g. textiles and apparel, footwear),
agricultural products and manufactures important for rural communities (e.g. sugars, milling
products, cotton, leather), products with negative externalities (e.g. tobacco, alcoholic
beverages and arms) and strategic industries for some CPTPP parties (e.g. vehicles).
Overall, the majority of the products will be fully liberalized by year 11 for most members,
even though a small number of tariff lines are excluded from the agreement or will eliminate
tariffs in longer phase out periods. However, for some CPTPP parties, tariff liberalization is
taking a slower pace than in other FTAs in force, as more than 10% of their tariff lines are
liberalized in 10 years or beyond.
9 out of 11 CPTPP members adopt partial tariff liberalization measures, targeting mostly
agriculture products including live animals, meat, dairy produce, cereals, cocoa, sugars,
vegetables, fruits and nuts. These partial liberalization measures include keeping the non ad-
valorem tariff component, reducing partially the ad-valorem tariff rate, maintaining tariff rate
quotas and a price band system.
In addition, three CPTPP parties have excluded products from the tariff liberalization process,
by keeping MFN rates to specific or all CPTPP parties. Such a scheme applies to a very limited
number of tariff lines, affecting the most sensitive products from each member’s trade
perspective, such as sugar, cheese, milk, poultry, beans, wheat, rice, flour, and leather and
articles thereof.
This study has found a positive relationship between base tariffs and the number of years to
achieve full liberalization. On average, an increase of the base tariff by 10 percentage points
(e.g. tariff increasing from 10% to 20%) will lead to an additional 1.8 years to full liberalization.
Agricultural products tend to be more sensitive than non-agricultural products. An additional
10 percentage points in the base tariff will increase the time to liberalize by 2.06 years for
agriculture products and 1.64 years for non-agriculture products.
Nonetheless, it is important to point out that the outcome obtained at the end of the CPTPP
negotiations involved a series of commitments on market access for both goods and services,
as well as obligations related to disciplines and rules. The final agreement was a result of a

Executive Summary
4
balanced package, carefully negotiated through a process of exchange of concessions across
different sectors and areas.

Component 1: Update of the Tariff Analysis in Collective Strategic Study on FTAAP
5
1 UPDATE OF THE TARIFF ANALYSIS REPORTED IN THE
COLLECTIVE STRATEGIC STUDY ON FTAAP
1.1 TARIFF LANDSCAPE IN THE APEC REGION
Globally, tariff rates have remained relatively stable in recent years and this trend has been
reflected within the APEC region as well (UNCTAD, 2017). Nonetheless, tariff peaks in APEC
remain in specific agricultural sectors1. In particular, high tariff on agricultural goods may
impact low income households, which spend a larger proportion of their income on food
(Nielson, 2017).
Average MFN tariffs in APEC have generally fallen, from 6.6% in 2008 to 5.3% in 2017 (Table
1.1). However, this reduction has slowed down in recent years, with tariffs falling 0.5% in the
last eight years. Tariffs on agricultural goods remain higher than those on non-agricultural
products, but both have seen reductions from 2008 to 2017. Over the last ten years, the
percentage of zero-tariff product lines in APEC economies has risen by 4.5 percentage points.
Table 1.1: Most favoured nation (MFN) rate trends in the APEC region, 2008-2017
2008 2009 2010 2011 2012 2013 2014 2015 2016 2017
MFN applied tariff 6.6 6.2 5.8 5.7 5.7 5.8 5.6 5.5 5.5 5.3
MFN applied tariff-
agriculture 13.1 12.0 11.8 12.2 12.0 12.2 11.9 11.8 11.7 11.4
MFN applied tariff-
non-agriculture 5.7 5.3 4.9 4.7 4.7 4.7 4.6 4.5 4.5 4.4
Zero-tariff product
lines (%) 43.4 43.1 45.5 45.3 45.4 45.5 45.4 46.9 46.9 47.9
Zero - Tariff Imports
(%) 56.1 59.0 59.6 60.2 60.2 60.0 60.3 59.7 58.4 -
Source: APEC Policy Support Unit (2018)
Based on data from 2017, UNCTAD reported that tariff peaks mainly affected sectors such as
food products, animal products, apparel and tanning products (Figure 1.1). While the average
MFN tariff rates on animal products, and fruit vegetable and plants was slightly above 10% in
APEC; dairy products and beverages and tobacco reported significantly high MFN tariff
averages of 26.1% and 28.1% respectively in 2017 (Table 1.2).
However, between 2013 and 2017, there were reductions in MFN rates for agricultural goods
in APEC in all products except beverages and tobacco, which saw an increase in tariffs of 4.0
percentage points. Encouragingly, products with high tariffs such as dairy products and cereals
and preparations recorded drops of 4.3 and 0.2 percentage points respectively. (Table 1.2).
Regarding non-agricultural products, MFN tariff rates were reduced between 2006 and 2017,
although less drastically than those for agricultural goods due to already-low rates in non-
agricultural tariffs (Table 1.2). Similar to global tariff peaks, non-agricultural products, in
particular those intensive in the use of labour, such as clothing, reported relatively high tariffs
1 Such as dairy products, beverages and tobacco, and cereals.

Component 1: Update of the Tariff Analysis in Collective Strategic Study on FTAAP
6
in APEC. Between 2013 and 2017, tariffs on clothing, and fish and fish products saw
considerable reduction amongst non-agricultural products by 1.5 and 1.4 percentage points
respectively. Conversely, tariffs on transport equipment saw an increase of 0.4 percentage
points from 2013 to 2017 (Table 1.2).
Figure 1.1: Percentage of tariff lines with applied tariffs over 15%, by sector
Source: UNCTAD (United Nations Conference on Trade and Development). (2018). Key Statistics and Trends in Trade Policy
2018.
0% 5% 10% 15% 20% 25% 30%
Oil, gas, coal
Mining and metal ores
Petroleum products
Office machineries
Basic metals
Machinery various
Chemicals
Precision instruments
Transport equipment
Electrical machinery
Communication products
Tobacco, beverages
Paper products
Non-metallic minerals
Rubber/plastics
Metal products
Motor vehicles
Textiles
Oils and fats
Wood products
Vegetable products
Tanning
Apparel
Animal products
Food products
HS 6-digit lines with a tariff of 15% or higher Trade with applied tariff of 15% or higher

Component 1: Update of the Tariff Analysis in Collective Strategic Study on FTAAP
7
Table 1.2: Average applied most-favoured nation (MFN) rates in APEC region, by
product category
PRODUCT CATEGORIES AVERAGE MFN RATES
2006 2009 2013 2016 2017
Agricultural
Beverages and tobacco 32.2 25.7 24.1 20.4 28.1
Dairy products 31.9 23.8 30.4 26.7 26.1
Cereals and preparations 20.5 18.3 19.3 19.3 19.1
Coffee, tea 14.0 13.3 13.4 12.7 11.7
Fruit, vegetables, plants 12.8 12.3 12.9 11.4 11.1
Sugars and confectionery 15.3 13.5 13.8 12.0 10.8
Animal products 12.0 11.7 11.8 11.0 10.7
Oilseeds, fats and oils 8.4 7.5 8.4 8.1 7.2
Other agricultural products 5.2 4.5 5.0 4.5 4.4
Cotton 3.3 2.4 2.5 2.2 2.4
Non-agricultural
Clothing 16.0 14.1 12.8 11.3 11.3
Transport equipment 8.2 7.3 6.7 6.7 7.1
Textiles 8.5 7.1 6.5 6.3 6.3
Fish and fish products 9.1 7.8 7.5 6.2 6.1
Leather, footwear, etc. 8.4 7.2 6.6 6.3 6.0
Manufactures, n.e.s. 5.8 5.4 4.7 4.6 4.3
Wood, paper, etc. 5.8 5.1 4.5 3.8 3.7
Minerals and metals 4.8 4.3 3.9 3.7 3.6
Electrical machinery 5.5 4.7 3.8 3.9 3.5
Chemicals 3.8 3.2 3.0 2.8 2.7
Non-electrical machinery 3.8 3.1 2.8 2.8 2.7
Petroleum 3.7 2.6 2.2 2.6 2.3
Sources: WTO World Tariff Profiles for 2007, 2010, 2014, 2017 and 2018.
The percentage of duty-free tariff lines for agricultural products rose for most products between
2006 and 2017, with a relatively large increase for products such as cotton and coffee and tea
(Table 1.3). On the other hand, beverages and tobacco saw a reduction in duty-free tariff lines,
from 23.3% in 2006 to 17.2% in 2017, which is unsurprising given its high MFN average
tariffs. In terms of non-agricultural products, electrical machinery, and petroleum saw the
largest overall increase in duty-free tariff lines between 2006 and 2017 by 13.5 and 10.3
percentage points respectively (Table 1.3). However, duty-free tariff lines in petroleum
dropped from 60.6% in 2013, to 58.8% in 2017. Clothing remained as the non-agricultural
sector with the lowest percentage of duty-free tariff lines in 2017 (20.9%).

Component 1: Update of the Tariff Analysis in Collective Strategic Study on FTAAP
8
Table 1.3: Average percentage of duty-free tariff lines in the APEC region, by product
category
PRODUCT CATEGORIES AVERAGE % OF DUTY-FREE TARIFF LINES
2006 2009 2013 2016 2017
Agriculture
Cotton 61.7 66.5 69.9 73.4 72.9
Other agricultural products 49.1 52.6 50.2 55.9 56.7
Oilseeds, fats & oils 41.6 44.2 42.0 44.7 45.4
Animal products 39.2 39.7 37.3 39.5 39.8
Coffee, tea 28.7 32.1 31.0 35.2 37.2
Cereals & preparations 30.2 33.4 33.2 36.1 36.8
Fruit, vegetables, plants 31.8 33.2 30.2 35.1 35.9
Sugars and confectionery 29.7 30.8 30.7 32.1 32.4
Dairy products 28.7 33.0 32.6 30.3 30.1
Beverages & tobacco 23.3 26.0 22.4 27.0 17.2
Non-agricultural
Petroleum 48.5 53.6 60.6 58.0 58.8
Non-electrical machinery 48.6 56.3 56.2 56.3 58.4
Electrical machinery 41.4 46.9 52.1 50.0 54.9
Wood, paper, etc. 46.8 49.7 50.9 53.9 54.1
Chemicals 44.0 48.6 50.0 51.5 52.1
Minerals & metals 44.4 48.8 51.0 51.9 52.0
Manufactures, n.e.s. 42.8 44.3 46.0 46.1 48.3
Fish & fish products 36.6 41.7 39.1 45.9 45.8
Transport equipment 39.3 45.2 45.7 46.1 45.8
Leather, footwear, etc. 30.0 33.3 36.5 37.2 38.1
Textiles 26.9 27.7 26.5 28.6 28.8
Clothing 15.9 16.0 16.1 20.9 20.9
Sources: WTO World Tariff Profiles for 2007, 2010, 2014, 2017 and 2018

Component 1: Update of the Tariff Analysis in Collective Strategic Study on FTAAP
9
1.2 OPPORTUNITIES FOR FURTHER TARIFF LIBERALIZATION
The number of FTAs signed by APEC economies reached 189 in 2018, of which 37.6% were
with other APEC economies. 168 FTAs are currently in force, where 38.1% of them are intra-
APEC (Figure 1.2). Whilst unilateral tariff liberalization has continued marginally in recent
years, APEC economies in general have been actively pursuing trade agreements in order to
reduce tariffs in a negotiated manner. Figure 1.2 shows that the upward trend in implementing
FTAs remains despite the slowdown of unilateral MFN tariff liberalization.
Figure 1.2: Cumulative Number of RTA/FTAs Signed and Enforced by APEC
Economies
Source: APEC Secretariat, Policy Support Unit Calculations
Nonetheless, there are still opportunities for APEC economies to further liberalize their tariff
regimes. The share of trade between RTA/FTA partners amongst APEC economies averages
at nearly half in 2018: 50.0% for exports and 46.3% for imports (Figure 1.3 and Figure 1.4).
While this is a marked increase from slightly over 20% in 1998, there is still room for reducing
tariffs through this avenue, and therefore increasing trade with RTA/FTA partners.

Component 1: Update of the Tariff Analysis in Collective Strategic Study on FTAAP
10
Figure 1.3: APEC Economies’ Share of Trade with RTA/FTA Partners (Exports)
Source: APEC Secretariat, Policy Support Unit Calculations using data from International Monetary Fund – Direction of Trade
Statistics; Chinese Taipei’s Ministry of Finance – Trade Statistics Database
Figure 1.4: APEC Economies’ Share of Trade with RTA/FTA Partners (Imports)
Source: APEC Secretariat, Policy Support Unit Calculations using data from International Monetary Fund – Direction of Trade
Statistics; Chinese Taipei’s Ministry of Finance – Trade Statistics Database
In addition to liberalizing free trade, tariff reductions may also benefit the labor market. Indeed,
a recent study by the OECD concluded that raising import tariffs might cause SMEs that are
unable to cope with higher costs to close down, and lead to larger firms outsourcing their
APEC 1998,
25.7%
APEC 2008,
35.8%
APEC 2018,
50.0%
0%10%20%30%40%50%60%70%80%90%
100%A
ust
rali
a
Bru
nei
Dar
uss
alam
Can
ada
Chil
e
Chin
a
Hong K
ong, C
hin
a
Indones
ia
Japan
Kore
a
Mal
aysi
a
Mex
ico
New
Zea
land
Pap
ua
New
Guin
ea
Per
u
Phil
ippin
es
Russ
ia
Sin
gap
ore
Ch
ines
e T
aipei
Thai
land
Unit
ed S
tate
s
Vie
t N
am
1998 2008 2018
APEC 1998,
24.9%
APEC 2008,
31.4%
APEC 2018,
46.3%
0%10%20%30%40%50%60%70%80%90%
100%
Aust
rali
a
Bru
nei
Dar
uss
alam
Can
ada
Chil
e
Chin
a
Hong K
ong, C
hin
a
Indones
ia
Japan
Kore
a
Mal
aysi
a
Mex
ico
New
Zea
land
Pap
ua
New
Guin
ea
Per
u
Phil
ippin
es
Russ
ia
Sin
gap
ore
Chin
ese
Tai
pei
Thai
lan
d
Unit
ed S
tate
s
Vie
t N
am1998 2008 2018

Component 1: Update of the Tariff Analysis in Collective Strategic Study on FTAAP
11
production (Nielson, 2017). In fact, jobs maintained behind tariff barriers might eventually lead
firms to change the nature of jobs for highly-skilled ones and increased use of automation in
richer economies instead, due to those higher costs firms are facing.
Further research has also found that while trade openness and tariff reductions can initially
cause an increase in unemployment, unemployment levels may eventually decrease below the
initial level (WTO, 2017). The benefits of tariff reduction on jobs range from a 0.35 percent
point decrease in unemployment for a 1 percent point reduction in tariffs (Dutt, Mitra & Ranjan,
2009), to a 0.4 percentage point decrease in aggregate unemployment from a 10 percentage
point increase in trade openness (Figure 1.5).
Figure 1.5: Unemployment and trade openness for OECD economies
Source: Felbermayr, G., Prat, J., & Schmerer, H. J. (2011)
Global value chains continue to play an important role in international trade: intermediate
goods are imported then re-exported downstream before being processed and reaching the
consumer. In 2011, almost 75% of total trade consists of intermediate and capital products that
contribute to the production process (Figure 1.6).
Figure 1.6: Share of intermediate and capital products in total trade (1995-2011)
Source: OECD (2015). Trade Policy Implications of Global Value Chains.
As a result, even low levels of tariffs can cumulate each time an intermediate good crosses a
border, and significantly increase the cost of production. As production costs of inputs rise due
to tariffs, downstream industries experience negative protection instead and there is a
dampening effect on all stages of the value chain (ICTSD, 2016). In selected economies,
57.2% 59.0% 61.3% 63.1% 61.6% 62.8% 63.7%
11.3% 11.2% 10.2% 10.2% 9.9% 9.6% 9.5%
0%
25%
50%
75%
100%
1995 2000 2005 2008 2009 2010 2011
Intermediate Capital

Component 1: Update of the Tariff Analysis in Collective Strategic Study on FTAAP
12
research has found that the domestic value added in manufacturing and agricultural exports
face higher effective tariffs than nominal rates (Figure 1.7). In essence, tariffs negatively impact
the suppliers of the domestic value added content of traded goods.
Figure 1.7: Comparing the incidence of tariffs on the gross value and the domestic value
added of exports
Source: ICTSD. (2016). Trade Policies and Sustainable Development in the Context of Global Value Chains.
Additionally, the OECD found that Information Technology Agreement (ITA) participants
have higher participation index in GVCs, compared to non- participants (Figure 1.8). Prior to
the implementation of ITA, participation index averaged at about 7%. This went up to about
11% amongst ITA participants after implementation. ITA participants are committed to
completely eliminating tariffs on IT products covered by the Agreement. There are currently
82 WTO members participating in the ITA, accounting for approximately 97% of world trade
in information technology product (World Trade Organization, n.d.). A significant percentage
of listed HS lines under the ITA are intermediate inputs, in particular those under the “radio,
television and communication equipment” industry.
Figure 1.8: ITA participation index2 in GVCs as a percentage of gross exports
Source: Miroudot, S., D. Rouzet and F. Spinelli (2013). Trade Policy Implications of Global Value Chains: Case Studies.
2 Participation rate is calculated as a percentage of gross exports and measures both the use of foreign inputs in
exports (backward participation) and the use of domestic intermediate inputs by other economies for their exports
(forward participation).
0%
5%
10%
15%
20%
25%
30%
35%
Un
ited
Sta
tes
Ch
ile
Un
ited
Kin
gdo
m
Jap
an
Ger
man
y
Euro
pea
n U
nio
n
Fra
nce
Net
her
lan
ds
Vie
t N
am
Ch
ina
Ch
ile
Jap
an
Vie
t N
am
Un
ited
Kin
gdo
m
Net
her
lan
ds
Euro
pea
n U
nio
n
Ger
man
y
Fra
nce
Un
ited
Sta
tes
Ch
ina
Manufacturing Agriculture
Tariffs on gross exports Tariffs on the domestic value added of exports
Manufacturing Agriculture
7.0% 6.9%
3.3% 3.3% 3.3%
11.1% 11.4%10.3% 9.8%
0%
2%
4%
6%
8%
10%
12%
1995 2000 2005 2008 2009
Economies not in ITA ITA participants

Component 1: Update of the Tariff Analysis in Collective Strategic Study on FTAAP
13
1.3 OBSERVATIONS
APEC economies have reported progress in reducing tariff barriers, but there are still certain
gaps that should be kept in mind when discussing further steps towards the FTAAP. As pointed
in Figure 1.1 (Percentage of tariff lines with applied tariffs over 15%, by sector) and Table 1.2
(Average applied MFN rates in APEC region by product category), it is noted that there is room
for improvement in the APEC region in addressing the areas identified in this report.
While it is positive that many APEC economies have increased their percentage of trade under
the coverage of trade agreements, there is still room for improvement. As mentioned by
previous studies, tariff reduction could benefit the labor market and lead economies to greater
participation in global value chains.

Component 2: Liberalization through FTAAP Pathways
14
2 POTENTIAL IMPACT FROM LOWERING TARIFFS
THROUGH FTAAP PATHWAYS
2.1 INTRODUCTION
The Lima Declaration on the FTAAP endorsed by Leaders in 2016 instructed officials to both
work on measures affecting trade and investment, as well as build consensus and capacity in
several areas, including tariffs. In continuation of these efforts, CTI endorsed in 2017 the work
program on tariffs spearheaded by Hong Kong, China and supported by PSU. This study is a
component of the program and aims to provide a better understanding on the impact of lowering
tariffs across some key integration initiatives that have been identified as pathways towards
achieving FTAAP.
The report provides a literature review of previous studies that have examined the possible
impact of reducing or eliminating import tariffs across the APEC region through possible
pathways such as TPP, CPTPP and RCEP. Due to the comprehensive nature of these studies,
no new simulations on trade liberalization were conducted. This literature review consolidates
estimated impacts for: (1) the region and its participants; (2) individual economies in the region;
and (3) regional groupings consisting of APEC economies.
Some key findings from the report are that all agreements bring gains across the region’s
income, welfare, trade and investment. However, the largest gain was found with the
implementation of an entire FTAAP. At the individual level, gains concerning these pathways
tend to be more subdued as compared to regional gains. In some cases, economies could be
affected negatively by certain circumstances. For example, some economies will catch up in
terms of preferential access in the same market, as those already enjoying market access at
preferential rates from existing RTA/FTAs may experience a fall in exports. The reason is that
other economies will start obtaining preferential treatment as well, since they will start gaining
preferential market access through these pathways. Furthermore, the distribution of gains
differs across agreements. For instance, in terms of absolute gains, the TPP is estimated to
channel benefits towards APEC’s developed economies whereas within the RCEP, benefits are
primarily captured by developing ones. In relative terms, benefits in most agreements tend to
be greater for developing economies, as these initiatives include some of the largest trading
partners for most developing economies with whom they may not have had prior trade
agreements with.
2.2 RATIONALE
There are significant levels of untapped benefits within the APEC region. For instance, in 2018,
the APEC region was covered by 189 signed RTA/FTAs out of which 168 have been enforced.
While this may seem extensive, only 64.3% of intra-APEC trade flows have been covered by
these agreements3. Furthermore, while there have been several trade agreements in place, depth
in terms of liberalization and rules differ significantly.
3 APEC Policy Support Unit Calculations (June 2019).

Component 2: Liberalization through FTAAP Pathways
15
The FTAAP has long been the goal of APEC for economic integration of the region, and
potential pathways have been identified for reaching this goal. This report attempts to shed
light on the matter through the consolidation of 17 studies that have analyzed the impact of
possible pathways by using computable general equilibrium (CGE) modelling. The estimated
results are summarized for the areas of GDP or production level, welfare, trade flows and
investment. Results related to the possible impact of these pathways on the labor market are
available for some scenarios and have been summarized in this report as well. Additionally,
this report evaluates the impact on sub-groups/sub-regions close to APEC. There is significant
value in consolidating these studies as results are often very diverse and a side-by-side
comparison allows for a better understanding of the impacts.
2.3 MODELLING CONSTRAINTS
2.3.1 OVERVIEW
CGE models are based on general equilibrium principles that quantify the impact of a shock
on markets. Most models use the Global Trade Analysis Project (GTAP) program for the
simulations which undertakes a multi-sectoral and multi-regional approach allowing
interactions between the different markets in the system. While most CGE models are static,
some studies evaluated in this report provide dynamic results investigating the impact of these
agreements over time (e.g. medium run, long run). Shocks implemented by modelers attempt
to replicate the actual policy change (e.g. tariff liberalization schedules) as close as possible
but should agreements not be available, assumptions are made.
2.3.2 ISSUES
Data Issues
It is important for models to make use of timely and accurate data for these predictions.
However, GTAP datasets that are often backdated are commonly used within CGE studies. For
instance, the most recent GTAP 9 dataset used by several studies in this report, only provides
data up to the year 2011, as the data volumes and information details needed to run these models
makes it difficult to update datasets very frequently. This leads to several issues specifically:
(1) lack of updated data on macroeconomic variables (2) recent trade data are not necessarily
considered.
In response, studies have adapted the GTAP database by including information from recent
trade agreements and projecting macroeconomic data to more recent years. While this may
increase the precision of estimates, these projections are still made on assumptions which may
or may not be realistic.
Sector Aggregation Issues
As mentioned by Jackson (2016), the large number of economies and sectors studies to be
evaluated often requires aggregation to be carried out in order to make simulations more
manageable to conduct. However, aggregating the different regions and sectors tends to mask
the effects of individual components by smoothening peaks and improving troughs. For
instance, if ASEAN is evaluated as a region, the negative results of individual economies within
the grouping may not be apparent.

Component 2: Liberalization through FTAAP Pathways
16
2.3.3 CAVEATS
Ambitious Liberalization Schedules
As texts and schedules of agreements are not always made publicly available, studies often
make assumptions on the liberalization carried out within each agreement. Ambitious
assumptions on the depth of liberalization result in overestimation. This is seen particularly
within RCEP and FTAAP where actual liberalization schedules are either yet to be made
known, discussed or negotiated by economies. In response, this report highlights studies that
estimate different liberalization scenarios to show the impact on economies.
Degree of Trade Liberalization
Apart from tariff, other components within trade agreements tend to be difficult to quantify
(e.g. non-tariff barriers or the liberalization of non ad-valorem tariff duties). Despite these
issues, several studies have attempted to include these aspects, but are often based on
approximations and varied assumptions. As a result, this literature review shows a range of
magnitudes that have been estimated by different studies for similar integration initiatives.
2.4 RESULTS
2.4.1 IMPACT OF TRADE LIBERALIZATION THOUGH FTAAP
Several studies have examined the possible economic impact of trade liberalization through
FTAAP. While some studies investigate the impact of achieving FTAAP immediately, others
consider the impact through the implementation of other building blocks as intermediate steps.
In general, the simulations show mostly positive results, but the magnitude of benefits are often
diverse.
Aggregate effect on APEC
GDP or Production level
In absolute terms, Kawasaki (2014)4 predicts these gains to range between USD 809.8 billion
and USD 1,504.2 billion depending on the extent of liberalization. Benefits from more
extensive liberalization are expected to be channeled towards APEC’s developing economies
(USD 947.8 billion).
Welfare5
Welfare gains directed to the region have had various magnitudes estimated (Figure 2.1). For
instance, although Petri, Plummer & Zhai (2011)6 approximate regional welfare gain to reach
USD 862.6 billion, a much lower estimate of USD 262.6 billion was calculated by Gilbert,
Furusawa & Scollay (2016) 7. On average, the study estimates FTAAP to increase gains in
APEC by least 1.3% within each economy. Much of this welfare gain has been captured by
APEC’s developing economies (USD 167.7 billion to USD 724.8 billion).
4 Values are in 2010 USD billion. Data for Papua New Guinea was not available. 5 Studies evaluated measure the change in welfare in terms of equivalent variation. Equivalent variation refers to
the income required, at constant prices, to match the change in welfare. 6 Values are in 2007 USD billion. Data for Papua New Guinea was not available. 7 Values are in 2011 USD billion. Data for Papua New Guinea was not available.

Component 2: Liberalization through FTAAP Pathways
17
Figure 2.1: Impact of FTAAP on welfare of the APEC region
Source: Petri, P., Plummer, M. & Zhai, F. (2011); Gilbert, J., Furusawa, T., & Scollay, R. (2016); and APEC Secretariat, Policy
Support Unit calculations
Note: Data for Papua New Guinea was not available.
Additionally, on disaggregating these welfare gains into its components, Gilbert, Furusawa &
Scollay (2016) find regional welfare to be predominantly driven by capital accumulation
effects8 totaling USD 145.1 billion. This pattern is found to be true for both developing and
developed economies in the region.
When analyzing the estimated impact of FTAAP through pathways such as the TPP/CPTPP or
RCEP, the TPP track may produce regional benefits reaching USD 1,024.3 billion. The RCEP
pathway with gains ranging from USD 55.2 billion to USD 901.3 billion to the APEC region
is the next best choice for FTAAP to be implemented through (Lee & Itakura, 2017).
Furthermore, when pathways are compared across time, Lee & Itakura (2017)9 find a large
proportion of the benefits to be realized in the long run. For instance, gains from the CPTPP
increases significantly from the USD 9.4 billion predicted in the short run to USD 591.2 billion
in the long run.
Table 2.1: Impact of FTAAP pathways on APEC (in USD billion)10
Petri, Plummer & Zhai
(2011)
Lee & Itakura
(2017)
TPP Track 1024.3 25.0 - 655.9
CPTPP Track - 9.4 - 591.2
RCEP Track - 55.2 - 901.3
East Asian FTA (EAFTA) Track11 724.2 -
Source: Petri, P., Plummer, M. & Zhai, F. (2011); Lee, H., & Itakura, K. (2017); and APEC Secretariat, Policy Support Unit
calculations
Note: Data for Hong Kong, China and Papua New Guinea was not available in Lee, H., & Itakura, K. (2017). Data for Papua
New Guinea was not available in Petri, P., Plummer, M. & Zhai, F. (2011).
8 Apart from capital accumulation, other forms of economic welfare include allocative efficiency, terms of trade
(TOT) and change in equity (Lee & Itakura, 2017). 9 Values are in 2011 USD billion. 10 TPP economies include Australia; Brunei Darussalam; Canada; Chile; Japan; Malaysia; Mexico; New Zealand;
Peru; Singapore; United States; and Viet Nam.
CPTPP economies include Australia; Brunei Darussalam; Canada; Chile; Japan; Malaysia; Mexico; New Zealand;
Peru; Singapore; and Viet Nam. 11 EAFTA economies include Brunei Darussalam; Cambodia; China; Indonesia; Japan; Korea; Laos; Malaysia;
Myanmar; Philippines; Singapore; Thailand; and Viet Nam.
0
200
400
600
800
Total APEC Total APEC Developed Total APEC Developing
US
D b
illi
on
Range Average

Component 2: Liberalization through FTAAP Pathways
18
In general, the range of results estimated across pathways are wide. While some variation can
be explained by the different baseline years and data used for each simulation, other possible
explanations could include the extent of liberalization considered where deeper liberalization
assumptions tend to lead to larger benefits.
Trade
There is significant room for FTAAP to contribute towards increasing trade as only 48.1% of
intra-APEC trade pairings were covered by RTA/FTAs in 2017 (APEC Policy Support Unit,
2018). Should additional liberalization be carried out through FTAAP, Petri, Plummer & Zhai
(2011) estimate an increase in exports by USD 2,207.1 billion. All APEC economies, but one,
boast positive export gains with approximately half of the region’s trade expanding by at least
USD 41.6 billion. Additionally, most of the export benefits (76.1%) from liberalization have
been captured by developing APEC economies. None of the reviewed papers analyzed
FTAAP’s impact on APEC’s imports.
Effect on individual APEC economies
GDP or Production Level
At the economy level, Kawasaki (2014) estimates gains to range from USD 0.5 billion to USD
355.5 billion. Additionally, the study finds gains to be amplified with the removal of non-tariff
barriers (Figure 2.2) which the study finds to have larger macroeconomic effects than tariff
removal. For instance, while APEC economies could achieve positive income gains with just
the removal of tariffs, additional liberalization of non-tariff barriers within FTAAP is expected
to increase regional benefits by a further USD 694.4 billion. In absolute terms, United States,
China and Mexico are estimated to experience the largest change in gains from further
liberalization efforts. However, in relative terms as a proportion of GDP, Viet Nam, Malaysia
and the Philippines are expected to benefit the most (Figure 2.3).

Component 2: Liberalization through FTAAP Pathways
19
Figure 2.2: Impact of depth of FTAAP on the income of APEC economies (in USD
billions)
Source: Kawasaki, K. (2014) and APEC Secretariat, Policy Support Unit calculations
Note: Data for Brunei Darussalam and Papua New Guinea was not available.
Figure 2.3: Impact of depth of FTAAP on the income of APEC economies (as a
proportion of GDP)
Source: Kawasaki, K. (2014) and APEC Secretariat, Policy Support Unit calculations
Note: Data for Brunei Darussalam and Papua New Guinea was not available.

Component 2: Liberalization through FTAAP Pathways
20
Welfare
FTAAP is predicted to increase benefits for all APEC economies with average gain estimated
to range from USD 0.5 billion in Brunei Darussalam to USD 168.2 billion in China. In
percentage of GDP terms, Gilbert, Furusawa, & Scollay (2016) estimate positive gains -
ranging between 0.04 and 5.82% of GDP - for all APEC economies. Large deviations between
studies exists particularly for economies such as China and Russia with differences between
the lowest and highest welfare estimates found to be USD 263.8 billion and USD 134.9 billion
respectively (Petri, Plummer & Zhai, 2011; Gilbert, Furusawa & Scollay, 2016).
Gilbert, Furusawa & Scollay (2016) further disaggregate these welfare gains into the terms of
trade and capital accumulation effect. As illustrated in Figure 2.4, while most APEC economies
boast an improvement in terms of trade, others have experienced significant contraction,
especially within economies that have implemented bilateral liberalization commitments
through RTA/FTAs previously put in force. Comparing the two effects, most economies
experience a larger capital accumulation effect.
Figure 2.4: Impact of FTAAP on proportion of TOT and Capital Accumulation of
APEC economies
Source: Gilbert, J., Furusawa, T., & Scollay, R. (2016) and APEC Secretariat, Policy Support Unit calculations
Note: Data for Papua New Guinea was not available.
Trade
Petri, Plummer & Zhai (2011) provide export estimates when FTAAP is achieved through
simultaneous implementation of both a TPP 1312 scenario and enlargement of a hypothetical
East Asia FTA track13. While both groupings are different from the TPP and RCEP known
today, certain similarities in the composition of the TPP 13 and EAFTA scenarios could
indicate that the impact of trade liberalization through these scenarios could have certain
similarities to those under the TPP and RCEP liberalization scenarios.
12 The TPP 13 scenario is described as the TPP original negotiating parties plus Korea. 13 The East Asian Free Trade Agreement scenario includes Brunei Darussalam; Cambodia; China; Indonesia;
Japan; Korea; Laos; Malaysia; Myanmar; Philippines; Singapore; Thailand; and Viet Nam.
-200%
-150%
-100%
-50%
0%
50%
100%
150%
Pro
po
rtio
n o
f T
ota
l E
quiv
alen
t V
aria
tio
n Terms of Trade Capital
Component 2: Liberalization through FTAAP Pathways
21
The study finds export changes ranging from USD -9.8 billion in Singapore to USD 840 billion
in China (Figure 2.5). Small and open economies with low tariff barriers prior to a hypothetical
liberalization through an eventual FTAAP are economies that are likely to experience limited
export expansion. For instance, Singapore, a small and open economy with several trade
agreements with key APEC partners, is predicted to experience export contraction. Some
reasons for this can be attributed to the worsening terms of trade, as they are likely to lose
preferential terms within other APEC markets due to the arrival of new competitors under
similar conditions.
Figure 2.5: Impact of FTAAP on exports of APEC economies
Source: Petri, P., Plummer, M. & Zhai, F. (2011) and APEC Secretariat, Policy Support Unit calculations
Note: Data for Papua New Guinea was not available.
Effect on sub-regions/groups close to APEC
GDP or Production Level
Kawasaki (2014) estimates ASEAN’s14 regional income to increase between USD 93.6 billion
and USD 255.1 billion. The rise is expected to be larger for ASEAN members within FTAAP15,
which is predicted to range from USD 95.0 billion to USD 256.3 billion. In comparison, the
Pacific Alliance16 is estimated to experience lower income gains between USD 37.1 billion and
USD 124.1 billion. While studies on FTAAP’s impact on Eurasian Economic Union (EAEU)17
are limited, the FTAAP impact on this group can be approximated through evaluations of
Russia as it is the largest member18. In absolute terms, this gain is estimated to range between
USD 37.4 billion and USD 80.4 billion (Kawasaki, 2014).
14 ASEAN members include Brunei Darussalam; Cambodia; Indonesia; Laos; Malaysia; Myanmar; the
Philippines; Singapore; Thailand; and Viet Nam. 15 ASEAN-FTAAP members include Brunei Darussalam; Indonesia; Malaysia; the Philippines; Singapore;
Thailand; and Viet Nam. 16 The Pacific Alliance members include Chile; Colombia; Mexico; and Peru. 17 EAEU members include Armenia; Belarus; Kazakhstan; Kyrgyzstan; and Russia. 18 Based on data from the World Bank (World Development Indicators), Russia accounted for 86.4% of the
EAEU’s total GDP in 2017.
32.60.4 17 8.4
840
34.9 58.5
180.5123.1
28.8 57.84.8 13.1 17.7
238.5
-9.8
107.548.2
291.7
113.4
-100
0
100
200
300
400
500
600
700
800
900
US
D b
illi
on
Component 2: Liberalization through FTAAP Pathways
22
Additionally, it is found that several members of both ASEAN and the Pacific Alliance are able
to attain a large proportion of these gains through unilateral liberalization. This signifies that
domestic reforms triggered in preparation of any future FTAAP process will be important in
increasing gains within regional groupings (Kawasaki, 2014).
Welfare
Estimated welfare gains are dispersed. On one hand, Petri, Plummer & Zhai (2011) expect
ASEAN to increase welfare by USD 129.4 billion, while Pacific Alliance members increase
theirs by USD 47.1 billion. Using Russia as a proxy, the EAEU’s welfare gain is estimated to
be USD 152.5 billion. On the other hand, Gilbert, Furusawa & Scollay (2016) predict ASEAN,
Pacific Alliance and EAEU will experience welfare gains of USD 27.8 billion, USD 8.3 billion
and USD 17.6 billion respectively.
When these gains are disaggregated, the terms of trade components of all three groupings are
expected to worsen, registering values between USD -4.7 billion and USD -0.7 billion.
However, capital accumulation, constituting 49.3% to 82.0% of welfare gained by the groups,
is estimated to increase and drive overall regional welfare gains (Gilbert, Furusawa & Scollay,
2016).
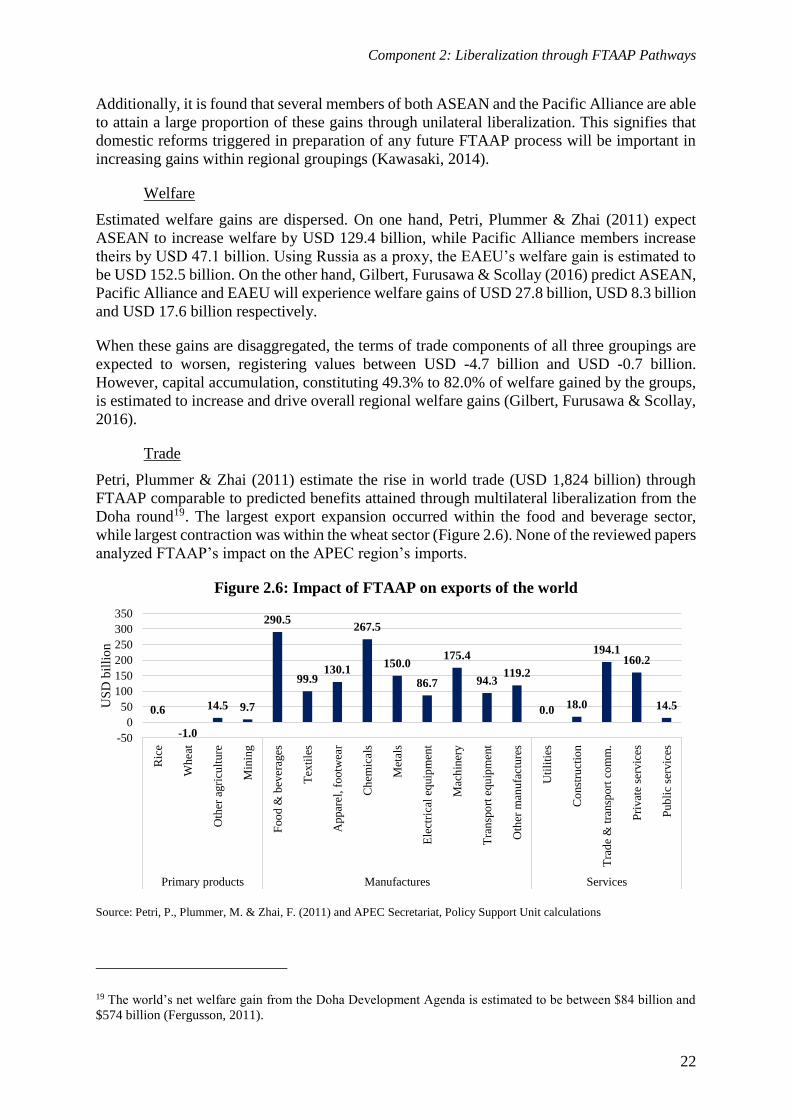
Trade
Petri, Plummer & Zhai (2011) estimate the rise in world trade (USD 1,824 billion) through
FTAAP comparable to predicted benefits attained through multilateral liberalization from the
Doha round19. The largest export expansion occurred within the food and beverage sector,
while largest contraction was within the wheat sector (Figure 2.6). None of the reviewed papers
analyzed FTAAP’s impact on the APEC region’s imports.
Figure 2.6: Impact of FTAAP on exports of the world
Source: Petri, P., Plummer, M. & Zhai, F. (2011) and APEC Secretariat, Policy Support Unit calculations
19 The world’s net welfare gain from the Doha Development Agenda is estimated to be between $84 billion and
$574 billion (Fergusson, 2011).
0.6
-1.0
14.5 9.7
290.5
99.9130.1
267.5
150.0
86.7
175.4
94.3119.2
0.018.0
194.1160.2
14.5
-50
0
50
100
150
200
250
300
350
Ric
e
Whea
t
Oth
er a
gri
cult
ure
Min
ing
Foo
d &
bev
erag
es
Tex
tile
s
Ap
par
el, fo
otw
ear
Ch
emic
als
Met
als
Ele
ctri
cal
equip
men
t
Mac
hin
ery
Tra
nsp
ort
equ
ipm
ent
Oth
er m
anufa
cture
s
Uti
liti
es
Co
nst
ruct
ion
Tra
de
& t
ransp
ort
co
mm
.
Pri
vat
e se
rvic
es
Pub
lic
serv
ices
Primary products Manufactures Services
US
D b
illi
on

Component 2: Liberalization through FTAAP Pathways
23
Within regional groupings, achieving FTAAP through both TPP and EAFTA is estimated to
increase ASEAN exports by USD 257.2 billion with individual economy gains ranging
between USD -9.8 billion and USD 113.4 billion. The largest increase in exports would be
displayed by Viet Nam with its exports contributing to 44.1% of the total regional change. For
the case of the Pacific Alliance, FTAAP increased regional exports by USD 79.3 billion with
Mexico driving most of the improvement (USD 57.8 billion). For the case of EAEU, the trade
impact of FTAAP is not readily available. However, there have been studies evaluating the
simultaneous implementation of both TPP and RCEP on EAEU and have found export growth
of EAEU member economies to increase by an average of 0.1% (Alexander & Vladimir, 2017).
Additionally, should Russia be used as a proxy for the EAEU’s performance, it would fare well
in accordance with Petri, Plummer & Zhai (2011), who estimate an increase in export of USD
238.5 billion. None of the reviewed papers analyzed FTAAP’s impact on the region’s imports.
2.4.2 IMPACT OF TRADE LIBERALIZATION THROUGH TPP/CPTPP
While the studies available on CPTPP are limited, those that have examined CPTPP reflect that
the economic impact are likely to be smaller but still positive for most cases. For instance,
while Dasgupta & Mukhopadhyay (2017) find the withdrawal of the United States to reduce
regional output growth rates, changes are still expected to be positive for most APEC
economies.
Aggregate effect on APEC
GDP or Production Level
The World Bank (2016) study finds the TPP to increase average member economy GDP by
0.4% to 10%. In absolute terms, Petri & Plummer (2016)20 predict regional gains to be between
USD 97 billion and USD 438 billion (Table 2.2). Also, the study finds improvements to be
large and positive even under tests for robustness that estimate low and high 21 TPP
implementation scenarios (Petri & Plummer, 2016). On disaggregating the benefits from the
TPP, Petri & Plummer (2016) find tariff elimination to account for only 12% of benefits
channeled towards TPP members whereas liberalization of non-tariff barriers in goods accounts
for 43% of estimated gains.
For the case of the CPTPP, absolute gains to the APEC region are predicted to be positive at
USD 138 billion. Real GDP is estimated to increase by 0.075% for CPTPP participating
economies (Ciuriak, Xiao & Dadkhah, 2017). The increase in income is generally smaller than
those predicted under the TPP, but is likely a result of the agreement being smaller without the
United States and many CPTPP members already having in place several free trade agreements
with each other (Petri, Plummer, Urata & Zhai, 2017).
With relation to the distribution of these income gains, Table 2.2 shows approximately 60% to
80% of these gains channeled towards developed economies. This is largely consistent with
expectations, as almost all of APEC’s developed economies are part of the TPP or CPTPP,
while only seven out of sixteen developing economies participate.
20 Values are in 2015 USD billion. Data for Papua New Guinea was not available. 21 In comparison to the normal scenario, the low scenario has 20% lower growth rates, use of tariff preferences
and reduction of non-tariff barriers. Whereas, in the high scenario, growth rates and use of tariff preferences are
assumed to be 10% higher.

Component 2: Liberalization through FTAAP Pathways
24
Table 2.2: Impact of TPP & CPTPP on income of the APEC region (in USD billion)
TPP CPTPP
Short Run Medium Run Long Run
APEC 97.0 278.0 438.0 138.0
APEC Developed 78.0 213.0 314.0 81.0
APEC Developing 19.0 65.0 124.0 57.0
Source: Petri, P., & Plummer, M. (2016); Petri, P., Plummer, M., Urata, S., & Zhai, F. (2017); and APEC Secretariat, Policy
Support Unit calculations
Note: Data for Papua New Guinea was not available.
As a result of the TPP, World Bank (2016) estimates that skilled labor industries are likely to
expand faster within advanced economies while the same trend is true for unskilled labor-
intensive industries within developing ones. For instance, Figure 2.7 shows average output
change within the textile industry to grow the most. It is largely driven by increases predicted
in Viet Nam. On the other hand, the largest estimated contractions are found within sectors
such as other crops, motor vehicles and other food products. Furthermore, Gilbert, Furusawa
& Scollay (2016) observe structural changes in production to have occurred within smaller
economies such as Brunei Darussalam and Viet Nam as compared to larger ones.
Figure 2.7: Impact of TPP on production volume of TPP Participants
Source: Gilbert, J., Furusawa, T., & Scollay, R. (2016) and APEC Secretariat, Policy Support Unit calculations
Welfare
Studies estimate TPP’s welfare gain for the APEC region to range from USD 7.5 billion and
USD 31.5 billion. For the CPTPP, Ciuriak, Xiao & Dadkhah (2017)22 calculate this gain to be
approximately USD 10 billion.
As illustrated in Table 2.3, benefits ranging between USD 10.1 billion to USD 25 billion are
directed towards APEC’s developed economies with Gilbert, Furusawa & Scollay (2016) even
22 Values are in 2017 USD billion. Data for Australia; Hong Kong, China; Indonesia; Papua New Guinea;
Philippines; Russia; and Thailand.
-40
-20
0
20
40
60
80
Pad
dy
ric
e
Whea
t
Veg
etab
les
and f
ruit
Oil
see
ds
Sug
ar c
ane
and b
eet
Pla
nt
bas
e fi
ber
s/w
oo
l
Oth
er c
rop
s
Cat
tle
Oth
er a
gri
cult
ure
Mil
k
Fore
stry
Fis
her
ies
Co
al, o
il a
nd g
as
Cat
tle
mea
t
Oth
er m
eat
Veg
etab
le o
ils
Dai
ry
Pro
cess
ed r
ice
Sug
ar
Oth
er f
ood
pro
du
cts
Tex
tile
s
Lum
ber
Pap
er
Ch
emic
als
Met
als
Fab
rica
ted
met
als
Moto
r v
ehic
les
Oth
er t
ransp
ort
eq
uip
men
t
Ele
ctri
cal
eq
uip
men
t
Oth
er m
ach
iner
y
Oth
er m
anu
fact
ure
s
Ser
vic
es
Chan
ge
in p
rod
uct
ion v
olu
me
(%)
Minimum Maximum Average

Component 2: Liberalization through FTAAP Pathways
25
predicting negative effects in the medium run for developing ones. However, this effect on
developing economies is reversed in the long run when tariff liberalization moves toward
completion, with developing economies expected to gain USD 6.5 billion (Gilbert, Furusawa
& Scollay, 2016). The increase in welfare gains are a result of the positive terms of trade effects
registered.
Table 2.3: Impact of TPP & CPTPP on welfare of the APEC region (in USD billion)
TPP CPTPP
Gilbert,
Furusawa, &
Scollay
(2016)
Medium Run
Gilbert,
Furusawa &
Scollay
(2016)
Long Run
Ciuriak, Xiao &
Dadkhah
(2017)
Ciuriak, Xiao &
Dadkhah
(2017)
APEC 7.5 31.5 25.7 10.0
APEC Developed 10.1 25.0 21.7 5.1
APEC Developing -2.5 6.5 3.9 4.8
Source: Gilbert, J., Furusawa, T., & Scollay, R. (2016); Ciuriak, D., Xiao, J., & Dadkhah, A. (2017); and APEC Secretariat,
Policy Support Unit calculations
Note: Data for Papua New Guinea was not available for both studies. Data for Brunei Darussalam; Hong Kong, China;
Indonesia; Philippines; Russia; Papua New Guinea; and Thailand was not available in Ciuriak, D., Xiao, J., & Dadkhah, A.
(2017).
For the case of APEC economies participating in TPP and CPTPP, Table 2.4 shows expected
welfare gains to range from USD 0.5 billion to USD 38 billion. Sikdar & Mukhopadhyay
(2017)23 predict that welfare gains for participants are often higher in the medium run than in
the long run, while Gilbert, Furusawa & Scollay (2016) find long run benefits of the TPP to be
larger. The difference in predictions is likely to be due to differences in liberalization scenarios
with Sikdar & Mukhopadhyay (2017) considering tariff liberalization and trade facilitation
while Gilbert, Furusawa & Scollay (2016) considering liberalization of tariff and non-tariff
barriers
Table 2.4: Impact of TPP & CPTPP on welfare of the TPP/CPTPP members
(in USD billion)
TPP CPTPP
Ciuriak,
Xiao &
Dadkhah
(2017)
Gilbert,
Furusawa &
Scollay
(2016)
Sikdar &
Mukhopadhyay
(2017)
Ciuriak,
Xiao &
Dadkhah
(2017)
Sikdar &
Mukhopadhyay
(2017)
Medium
Run
Long
Run
Medium
Run
Long
Run
Medium
Run
Long
Run
APEC
Member 34.8 14.6 38.0 19.7 0.5 13.5 15.3 0.8
Source: Gilbert, J., Furusawa, T., & Scollay, R. (2016); Ciuriak, D., Xiao, J., & Dadkhah, A. (2017); Sikdar, C., &
Mukhopadhyay, K. (2017); and APEC Secretariat, Policy Support Unit calculations
Note: Data for Brunei Darussalam was not available in Ciuriak, D., Xiao, J., & Dadkhah, A. (2017).
Trade
Petri, Plummer, Urata & Zhai (2017) estimate regional export gains through the TPP and
CPTPP to be USD 1,022 billion and USD 275 billion, respectively. While Ciuriak, Xiao &
23 Values are in 2017 USD billion.

Component 2: Liberalization through FTAAP Pathways
26
Dadkhah (2017) predict a value of USD 40.2 billion for the TPP and USD 10.2 billion for the
CPTPP. The TPP expects approximately between 55% and 71% of regional gains to be
channeled towards developed economies, with the proportion falling slightly under CPTPP to
between 33% and 56%.
Additionally, Ciuriak, Xiao & Dadkhah (2017) predict the intra TPP-export of automotive
products (USD 3.6 billion) in the case of goods, and business services (USD 576 million) in
the case of services to grow the most. As noted under the section on GDP, Viet Nam’s textile
outputs are expected to grow significantly under the TPP, leading to an increase in exports as
well. However, with the CPTPP, these export gains are expected to fall as a result of reduced
access to the United States market.
For the case of imports, regional gains from the TPP and CPTPP are estimated to be USD 43.6
billion and USD 10.6 billion, respectively (Figure 2.8). Approximately 33% to 57% of the
regional increase in imports has been channeled towards APEC’s developed economies. TPP
and CPTPP members register the largest increase in imports of USD 48.3 billion and USD 13.1
billion, respectively.
Figure 2.8: Impact of TPP/CPTPP on import of APEC and TPP/CPTPP members
Source: Ciuriak, D., Xiao, J., & Dadkhah, A. (2017)
Note: Data for Brunei Darussalam; Hong Kong, China; Indonesia; Philippines; Russia; Papua New Guinea; and Thailand was
not available
Investment
As shown in Figure 2.9, Petri & Plummer (2016) predict the TPP to increase APEC’s inward
and outward FDI stocks by USD 482 billion and USD 335 billion respectively. Net investment
for the region is positive, out of which approximately 59% of the increase is channeled towards
APEC’s developed region. Some reasons suggested for the increase of FDI include growth in
GDP and reduced investment barriers across economies (Petri & Plummer, 2016).
With regards to TPP participants, inward and outward FDI would increase by USD 446 billion
and USD 305 billion, respectively. A large proportion of the benefits are directed towards
APEC economies that are part of TPP, as only 4.1% of the increase of APEC’s net FDI stocks
would be channeled towards APEC economies not participating in TPP.
43.6
24.7
19.0
48.3
10.6
3.57.1
13.1
0
5
10
15
20
25
30
35
40
45
50
APEC APEC Developed APEC Developing TPP/CPTPP Members
US
D b
illi
on
TPP CPTPP

Component 2: Liberalization through FTAAP Pathways
27
Figure 2.9: Impact of TPP on investment of the APEC region
Source: Petri, P., & Plummer, M. (2016)
Note: Data for Papua New Guinea was not available.
Effect on individual APEC economies
GDP or Production Level
At the individual economy level, Petri & Plummer (2016)24 predict income changes from the
TPP to range from USD -18 billion to USD 131 billion. For the CPTPP, the range is estimated
to be between USD -10 billion and USD 46 billion. Apart from the large spread identified, the
distribution is uneven with developed economies boasting higher returns – in absolute terms –
over developing ones under both scenarios.
As illustrated in Figure 2.10, TPP’s effects are dependent on the time period evaluated. In the
short run, absolute income gains to TPP members tend to be minimal with liberalization effects
becoming more obvious over time. However, this trend is reversed for non-TPP APEC
members where income gains fall. Hong Kong, China and Russia are exceptions with slight
positive gains registered in the short, medium and long run, due to assumptions by Petri and
Plummer (2016) that TPP provisions would liberalize some trade with non-members. All in all,
in the long run, the United States would produce the largest income gain followed by Japan
and Malaysia under TPP. Petri & Plummer (2016) estimate that Japan’s estimated benefits are
largely a result of its improved market access and liberalization of auto imports in other TPP
counterparts.
24 Values are in 2015 USD billion.
482
339
143
446
335
253
82
305
147
8661
141
0
50
100
150
200
250
300
350
400
450
500
APEC APEC Developed APEC Developing APEC TPP Participants
US
D b
illi
on
Inward FDI Stocks Outward FDI Stocks

Component 2: Liberalization through FTAAP Pathways
28
Figure 2.10: Impact of TPP on income of APEC economies
Source: Petri, P., & Plummer, M. (2016) and APEC Secretariat, Policy Support Unit calculations
Note: Data for Papua New Guinea was not available.
Welfare
Based on Ciuriak, Xiao & Dadkhah (2017), welfare changes for the APEC region resulting
from the TPP would extend from a low of USD -6.2 billion to a high of USD 10.1 billion. A
slightly rosier outcome is predicted by Gilbert, Furusawa & Scollay (2016) who estimates
regional welfare changes from the TPP to be between USD -4.1 billion and USD 18.0 billion.
In absolute terms, these welfare gains are dependent on the size of economies, as the study
estimates larger economies to gain the most. Additionally, the study finds long run welfare
gains to be higher than those in the medium run for more than half of the region.
As shown in Figure 2.11, TPP participants generally benefit from positive welfare gains
through TPP, while others experience a decline in welfare or remain largely unaffected. For
instance, on average, Japan is the largest benefactor followed by Viet Nam and the United
States, all of whom are members of the TPP. On the other hand, economies such as China are
negatively affected. Rahman & Ara (2015) predict similar outcomes with China expected to
experience the largest welfare loss of USD 2.1 billion. Notwithstanding the similarities, these
authors estimate higher welfare gains for Australia than for the United States, with Sikdar &
Mukhopadhyay (2017) predicting benefits to rise even in the long run.
Although in absolute terms, economies such as Japan would benefit with the largest welfare
gains, the pattern differs in terms of GDP with small economies such as Viet Nam emerging as
the largest benefactors (Gilbert, Furusawa & Scollay, 2016).
-20
0
20
40
60
80
100
120
140
US
D b
illi
on
TPP - Short Run TPP - Medium Run TPP - Long Run

Component 2: Liberalization through FTAAP Pathways
29
Figure 2.11: Impact of TPP on welfare of APEC economies
Source: Gilbert, J., Furusawa, T., & Scollay, R. (2016); Ciuriak, D., Xiao, J., & Dadkhah, A. (2017); Sikdar, C., &
Mukhopadhyay, K. (2017); and APEC Secretariat, Policy Support Unit calculations
Note: Data for Papua New Guinea was not available.
For the case of the CPTPP, Ciuriak, Xiao & Dadkhah (2017) and Sikdar & Mukhopadhyay
(2017) estimate changes to be between USD -2.0 billion and USD 4.0 billion. Unlike the TPP,
benefits channeled to CPTPP participants are mostly expected to fall over time (Sikdar &
Mukhopadhyay, 2017).
Trade
Studies by Ciuriak, Xiao & Dadkhah (2017) and Petri, Plummer, Urata, & Zhai (2017) estimate
the impact on exports for each economy to be significantly different. But the relative outcomes
predicted by each study are similar. For instance, both studies predict the TPP to boast the
largest export increases in Japan, the United States and Viet Nam. It is also predicted that China
will be most affected by the TPP, with Rahman & Ara (2015) expecting Chinese exports to fall
by 0.12%. Much of this has been attributed to the trade diversion effects from its trade relations
with TPP/CPTPP members (Sikdar & Mukhopadhyay, 2017).
For the case of the CPTPP, export changes are expected to range from USD -10 billion to USD
97 billion. Furthermore, the agreement is seen to improve outcomes for Canada, Chile, Mexico
and Peru as it prevents erosion of their preferential market access in the United States. Instead,
it allows these economies to gain market shares within Asian markets in which they have
limited shares in. Singapore encounters similar effects with the CPTPP, as its preferential
market access to the United States is protected from other competitors such as most other Asian
economies (Ciuriak, Xiao & Dadkhah, 2017).
At the individual economy level, import gains from the TPP ranged from USD - 3.1 billion to
USD 15.7 billion while CPTPP registered a narrower range between USD -1.8 billion and USD
3.2 billion. While Viet Nam is estimated to feature the largest increase in imports, the estimated
increase through the TPP is almost five times larger than that under the CPTPP (Ciuriak, Xiao,
& Dadkhah, 2017).
-10
-5
0
5
10
15
20
US
D b
illi
on
Minimum Average Maximum

Component 2: Liberalization through FTAAP Pathways
30
Investment
At the economy level, Figure 2.12 illustrates changes in inward FDI stocks exceeding outward
FDI stocks for many economies when the TPP is implemented. The largest benefactors from
the increase in inward FDI stocks are the United States, Canada and Japan. As a whole,
estimated net stocks range from USD -21 billion to USD 91 billion, with ten economies
registering higher increases in inward than outward FDI stocks.
Figure 2.12: Impact of TPP on inward and outward FDI stocks for APEC economies
Source: Petri, P., & Plummer, M. (2016)
Note: Data for Papua New Guinea was not available.
Labor Market
Mukhopadhyay & Thomassin (2018) analyzed the possible impact of TPP and CPTPP on
Canada’s employment levels. Based on the different tariff liberalization scenarios presented in
this study, it is possible to conclude that the impact on employment under TPP will be slightly
larger greater than under CPTPP. TPP would create 36,400 new jobs in Canada, while CPTPP
would create 32,970 new jobs. Jobs for skilled and unskilled workers will increase, with a small
advantage for skilled workers.
However, Mukhopadhyay & Thomassin (2018) find job creation in Canada to be more
significant when tariff liberalization by TPP/CPTPP participants are accompanied by
technological upgrades. In this case, 957,940 new jobs would be created with TPP and 510,210
new jobs with CPTPP. Likewise, under this scenario, more new jobs would be located within
sectors where skilled labor is needed.
Dasgupta & Mukhopadhyay (2017) evaluate the impact of the TPP on selected APEC
economies specifically Brunei Darussalam, Malaysia, Singapore and Viet Nam (Table 2.5). All
four APEC economies boast positive income growth rates for both TPP and CPTPP scenarios,
but income growth rates are lower under the CPTPP scenario for both skilled and unskilled
labor. The absence of the United States in CPTPP is estimated to affect the potential income
growth in these economies, particularly Viet Nam where income growth rates would fall from
100
107
0
19
8 5
92
1
48
82
71 1
28
0 1
128
1623
1
16
2 815
1
63
2
24
2 2 0 0 2
23
1 1
149
00
50
100
150
US
D b
illi
on
Inward FDI Stocks Outward FDI Stocks

Component 2: Liberalization through FTAAP Pathways
31
11.0% in the TPP to 2.2% in the CPTPP for skilled labor, and from 10.6% to 2.2% for unskilled
labor.
Table 2.5: Impact of TPP on income growth for selected APEC economies (% change)
Tariff Liberalization by non-ASEAN
TPP/CPTPP Participants
Tariff Liberalization by ASEAN
TPP/CPTPP Participants
TPP CPTPP TPP CPTPP
Unskilled
Labor
Skilled
Labor
Unskilled
Labor
Skilled
Labor
Unskilled
Labor
Skilled
Labor
Unskilled
Labor
Skilled
Labor
Brunei
Darussalam 0.1 0.1 0.0 0.0 0.3 0.2 0.3 0.2
Malaysia 0.6 0.5 0.3 0.3 1.0 0.8 0.9 0.8
Singapore 0.1 0.1 0.1 0.1 0.0 0.0 0.0 0.0
Viet Nam 10.6 11.0 2.2 2.2 1.0 0.8 0.9 0.7
Source: Dasgupta & Mukhopadhyay (2017)
Additionally, Dasgupta & Mukhopadhyay (2017) find growth of ASEAN economies
participating in TPP/CPTPP to be positive even when these economies only carry out unilateral
liberalization. On average, implementing the TPP leads to these ASEAN economies
experiencing a significant growth of income for skilled and unskilled workers. Compared to
the TPP, the CPTPP scenario registers lower income growth rates for both skilled and unskilled
labor for most ASEAN participants. For these ASEAN economies, not being able to enjoy
preferential market access in the US market affects significantly their labor income growth.
Figure 2.13: Average labor income growth of ASEAN economies participating in
TPP/CPTPP
Source: Dasgupta, & Mukhopadhyay (2017)
Effect on sub-regions/groups close to APEC
Among ASEAN members, four economies are participants to the TPP/CPTPP, whereas for the
Pacific Alliance and the EAEU, participation falls to three and zero respectively. TPP and
CPTPP are likely to have a negative impact in some APEC members that are not part of these
integration initiatives. The following sections provide an overview of the impact of TPP and
CPTPP on sub-regions.
2.9 2.9
0.7 0.7 0.6 0.5 0.5 0.4
0.0
0.5
1.0
1.5
2.0
2.5
3.0
TPP -
Unskilled
Labor
TPP -
Skilled
Labor
CPTPP -
Unskilled
Labor
CPTPP -
Skilled
Labor
TPP -
Unskilled
Labor
TPP -
Skilled
Labor
CPTPP -
Unskilled
Labor
CPTPP -
Skilled
Labor
Tariff liberalization by non-ASEAN TPP/CPTPP
Participants
Tariff liberalization by ASEAN TPP/CPTPP
Participants
Lab
or
inco
me
gro
wth
(%
)

Component 2: Liberalization through FTAAP Pathways
32
GDP or Production Level
As shown in Figure 2.14, larger income gains are expected within ASEAN as compared to the
Pacific Alliance and the EAEU. In general, gains for the three groups are expected to increase
over time. In the long run, ASEAN, the Pacific Alliance and the EAEU25 register gains of USD
103 billion, USD 37 billion and USD 2 billion respectively. Between the short and long run,
ASEAN and the Pacific Alliance will experience income growth by more than six times while
the EAEU will grow by two times, indicating benefits are not often realized immediately.
Figure 2.14: Impact of TPP on income of ASEAN, Pacific Alliance and the EAEU
Source: Petri, P., & Plummer, M. (2016) and APEC Secretariat, Policy Support Unit calculations
Note: Data for Cambodia; Laos; Myanmar; Colombia; Armenia; Belarus; Kazakhstan; and Kyrgyzstan was not available.
In addition, the removal of non-tariff barriers within the TPP has significant impact on ASEAN
with gains increasing by USD 88 billion (Kawasaki, 2014). While the EAEU’s benefits are
small in comparison to the other groups, the inclusion of non-tariff barriers converts its losses
to gains. For ASEAN, this increase is mostly explained by Malaysia; whereas for the Pacific
Alliance, Mexico is the main economy contributing to these gains.
With regards to output, Viet Nam would explain the highest growth among ASEAN economies.
However, under the CPTPP, Viet Nam’s growth rate is estimated to fall. With the exception of
Singapore which remains unaffected, this trend is observed for all other ASEAN members
participating in TPP/CPTPP. While significant changes are noted in regional output, on a
sectoral level, top sectors experience no changes between the TPP and CPTPP. For instance,
despite a decline in the magnitude of output growth, ‘Transport Equipment’ continues to be
Brunei Darussalam’s top sector under the assumption that import tariffs are removed by other
TPP members (Dasgupta & Mukhopadhyay, 2017).
Welfare
During the initial stages, the Pacific Alliance’s welfare is expected to be negatively affected by
the TPP (Figure 2.15). However, over time, this is expected to reverse with the group
registering positive welfare gains of USD 1.9 billion. ASEAN’s welfare is predicted to surge
from USD 2.8 billion to USD 9.6 billion over the long run. While a similar trend is noted for
the EAEU, the increase from USD 0.04 billion to USD 0.4 billion is much smaller.
25 Russia is used as a proxy for the EAEU.
15.0
4.00.0
52.0
19.0
1.0
103.0
37.0
2.0
0
20
40
60
80
100
120
ASEAN Pacific Alliance EAEU
US
D b
illi
on
Short Run Medium Run Long Run

Component 2: Liberalization through FTAAP Pathways
33
Figure 2.15: Impact of TPP on welfare of ASEAN, Pacific Alliance and the EAEU
Source: Gilbert, J., Furusawa, T., & Scollay, R. (2016) and APEC Secretariat, Policy Support Unit calculations
Note: Data for Cambodia; Myanmar; Colombia; Armenia; Belarus; Kazakhstan; and Kyrgyzstan was not available.
Although an increase in welfare gains is expected for all ASEAN economies, the increase is
more significant in Viet Nam and Malaysia (Dasgupta & Mukhopadhyay, 2017). Additionally,
ASEAN members that are not TPP participants are not likely to benefit as they tend to be
adversely affected by trade diversion and preference erosion effects (Gilbert, Furusawa &
Scollay, 2016).
Trade
Under the TPP, Petri, Plummer, Urata & Zhai (2017) estimate export gains for ASEAN, Pacific
Alliance and the EAEU to be approximately USD 225 billion, USD 55 billion and USD 5
billion, respectively. These values are expected to fall to USD 93 billion, USD 41 billion and
USD 1 billion if CPTPP –and not the TPP– is implemented. Despite the lower increase in
exports, economies belonging to these groups continue to benefit.
Estimates by other studies are found to be lower. For instance, while Alexander & Vladimir
(2017) predict exports growth rates of member economies to reach highs of 0.11%, Russia’s
exports are expected to be unaffected. Similarly, estimates by Ciuriak, Xiao & Dadkhah (2017)
find the Pacific Alliance to increase exports by USD 1.9 billion from the TPP and USD 2.7
billion from the CPTPP are lower than those predicted by Petri, Plummer, Urata & Zhai (2017).
For the case of imports, Ciuriak, Xiao & Dadkhah (2017) find the Pacific Alliance to increase
by USD 2.2 billion with the TPP and USD 3.1 billion with the CPTPP.
Investment
Across regional groupings, with the exception of the EAEU, inward FDI stocks would increase
more than outward FDI stocks with the implementation of TPP (Figure 2.16). ASEAN would
register the largest net FDI increase (USD 49 billion) followed by the Pacific Alliance (USD
11 billion). The EAEU would change its net FDI stock by USD -1 billion.
2.8
-0.1
0.04
9.6
1.9
0.4
-2
0
2
4
6
8
10
ASEAN Pacific Alliance EAEU
US
D b
illi
on
Medium Run Long Run

Component 2: Liberalization through FTAAP Pathways
34
Figure 2.16: Impact of TPP on inward and outward FDI stocks for ASEAN, Pacific
Alliance and the EAEU
Source: Petri, P., & Plummer, M. (2016)
Note: Russia used as a proxy for the EAEU; Data for Colombia was not available.
2.4.3 IMPACT OF TRADE LIBERALIZATION THROUGH RCEP
While the RCEP trade agreement is yet to be finalized, several studies have simulated its effects
based on different liberalization scenarios. In general, the benefits are found to be higher than
those estimated for the TPP or CPTPP. The sections below provide an overview of its regional,
individual APEC economy impact as well as within sub-groups.
Aggregate effect on APEC
GDP or Production Level
Benefits from the RCEP agreement to the APEC region are estimated to range from USD 204
billion to USD 747.9 billion (Table 2.6). The large range of estimates are likely due to the
extent of liberalization considered within each study. For instance, while some studies only
considered the effect of tariff liberalization, Kawasaki (2014) considers the depth of the
agreement with the elimination of non-tariff barriers (NTB). Including NTB within the
liberalization package will almost double income gains for all APEC member economies,
regardless of the stage of development.
For APEC members in RCEP, income gains are expected to range from USD 161.7 billion to
USD 746.5 billion. Given that several RCEP members are not developed economies it is no
surprise that approximately 68% to 70% are channeled towards developing economies.
99
15
1
50
4 2
0
20
40
60
80
100
ASEAN Pacific Alliance EAEU
US
D b
illi
on
Inward FDI Stocks Outward FDI Stocks

Component 2: Liberalization through FTAAP Pathways
35
Table 2.6: Impact of RCEP on the APEC region’s income (in USD billion)
Cheong &
Tongzon
(2013)
Kawasaki
(2014)
-Tariffs only
Kawasaki
(2014)
-Tariffs & Non-
Tariff Measures
Petri, Plummer,
Urata & Zhai
(2017)
APEC - 359.1 747.9 204.0
APEC Developed - 104.2 221.9 64.0
APEC Developing - 254.9 526.1 140.0
RCEP APEC
members 161.7 402.2 746.5 203.0
Source: Cheong, I., & Tongzon, J. (2013); Kawasaki, K. (2014); Petri, P., Plummer, M., Urata, S., & Zhai, F. (2017); and
APEC Secretariat, Policy Support Unit calculations
Note: Data for Brunei Darussalam; Philippines; and Thailand was not available in Cheong, I., & Tongzon, J. (2013). Data for
Brunei Darussalam; and Papua New Guinea was not available in Kawasaki, K. (2014). Data for Papua New Guinea for Petri,
P., Plummer, M., Urata, S., & Zhai, F. (2017) was not available.
In comparison to the CPTPP, Ji, Rana, Chia, & Chang (2018) estimate income gained from
RCEP to be higher for all economies except New Zealand. While some of this is attributed to
the larger number of members within RCEP, other reasons include tariff rates of its participants
being higher than members within TPP/CPTPP and the absence of trade agreements between
most of its largest economies (e.g. China, Japan, India and Korea). Furthermore, much of the
trade within the TPP/CPTPP are already covered by free trade agreements with particularly
large trade flows within North America (Petri, Plummer & Zhai, 2011).
Welfare
As a whole, Gilbert, Furusawa & Scollay (2016) and Lee & Itakura (2017) estimate regional
welfare gains to range between USD 130.2 billion and USD 331.3 billion. Additionally, both
studies predict that most benefits will be directed towards the region’s developing economies
with gains predicted to range from a minimum of USD 79.8 billion to a maximum of USD
271.5 billion. The gains by APEC members in RCEP are estimated to be much larger than the
region’s overall gain. For instance, compared to the region, Gilbert, Furusawa & Scollay (2016)
estimate RCEP’s APEC participants to gain an additional USD 9.3 billion.
On decomposing welfare gains into its terms of trade and capital accumulation components,
the latter dominates with a value of USD 78.1 billion. In terms of development level, similar
trends are identified with the region’s developed economies having capital accumulation gains
of USD 20.4 billion, compared to terms of trade gains of USD 14.8 billion. APEC developing
economies would experience the capital accumulation gains of USD 57.7 billion and terms of
trade losses equivalent to USD -8.2 billion.
Trade
Petri, Plummer, Urata & Zhai (2017) estimates an increase in APEC exports to increase by
USD 548 billion, out of which USD 393 billion is to be channeled towards the region’s
developing economies. APEC members in RCEP boast a larger increase in exports (USD 556
billion) as compared to the RCEP region (USD 548 billion). None of the reviewed papers
analyzed the impact of liberalization through RCEP on imports in the APEC region.

Component 2: Liberalization through FTAAP Pathways
36
Effect on individual APEC economies
GDP/Production Level
Figure 2.17 illustrates that while average changes in income range from USD -18.6 billion to
USD 119.7 billion, gains for almost all APEC economies are positive. On average, estimates
show the largest benefactor to be China, followed by Japan and Korea with gains totaling USD
119.7 billion, USD 85.6 and USD 42.6 billion respectively. Cheong & Tongzon (2013) observe
that positive gains from RCEP are due to the activation of the East Asian production network
as well as the creation of a supply chain mechanism facilitating trade in the region. In general,
gains tend to be the lowest for those APEC members not part of the current RCEP negotiations.
Figure 2.17: Impact of RCEP on income of APEC economies
Source: Cheong, I., & Tongzon, J. (2013); Kawasaki, K. (2014); Petri, P., Plummer, M., Urata, S., & Zhai, F. (2017); and
APEC Secretariat, Policy Support Unit calculations
Note: Data for Brunei Darussalam and Papua New Guinea was not available.
Kawasaki (2014) identifies significant benefits of including non-tariff barriers within RCEP’s
liberalization (Figure 2.18). For instance, with tariff elimination, income changes in APEC
economies are predicted to be between USD -27.4 billion and USD 107.9 billion. However,
should non-tariff barriers be reduced as well, these changes are estimated to increase and be
around USD -15.3 billion and USD 199.4 billion. Most of the gains earned by ASEAN
economies have been through their own reduction in tariff and non-tariff measures; while gains
of other economies such as Australia, Japan, Korea and New Zealand have been mainly through
reductions made by other RCEP economies.
-50
0
50
100
150
200
US
D b
illi
on
Minimum Average Maximum

Component 2: Liberalization through FTAAP Pathways
37
Figure 2.18: Impact of depth of RCEP on income of APEC economies
Source: Kawasaki, K. (2014) and APEC Secretariat, Policy Support Unit calculations
Note: Data for Brunei Darussalam and Papua New Guinea was not available.
In a study conducted by Cheong & Tongzon (2013), average GDP growth was expected to
increase year on year for the region had RCEP been implemented in 2013 (Figure 2.19).
Furthermore, APEC’s developing economies would have experienced significantly higher
average GDP growth rates as compared to developed ones.
Figure 2.19: Dynamic impact of RCEP on GDP growth
Source: Cheong, I., & Tongzon, J. (2013)
Note: Data for Brunei Darussalam; Hong Kong, China; Indonesia; Papua New Guinea; Philippines; Russia; Chinese Taipei;
and Thailand was not available.
Welfare
Individual economy average welfare changes are estimated to range between USD -8.5 billion
and USD 42.9 billion. In absolute terms, the largest increase in welfare would be in China,
Japan and Korea (Lee & Itakura, 2017). Gilbert (2013) estimates Viet Nam to experience the
33
.3
-0.8
-0.3
10
7.9
0.2
26
.3
95
.2
56
.4
15
.3
-3.4
3.9
0.0 9.5
-0.7
8.2
-10
.8
27
.9
-27
.4
18
.3
58
.2
4.8
1.7
19
9.4
4.6
41
.4
15
3.5
65
.4
67
.9
-2.2
9.6
0.7
36
.5
11
.4
41
.5
-15
.3
41
.2
-4.2
32
.1
-100
-50
0
50
100
150
200
250
US
D b
illi
on
Tariff elimination Tariff and Non-Tariff Measure elimination
0.2
1.2
0.8
0.0
0.2
0.4
0.6
0.8
1.0
1.2
2013 2014 2015 2016 2017 2018 2019 2020 2021 2022 2023 2024 2025 2026 2027
GD
P G
row
th (
%)
APEC Developed Average APEC Developing Average APEC Average

Component 2: Liberalization through FTAAP Pathways
38
largest increase and attributes this to improvements in its terms of trade. Additionally, Lee &
Itakura (2014) predicts Chinese Taipei to experience a welfare loss from RCEP. This is likely
due to a decrease in its terms of trade, as it is not participating in RCEP negotiations, but at the
same time, it keeps strong trade relationships with RCEP parties.
With the implementation of RCEP, Lee & Itakura (2017) find the terms of trade of economies
with low initial tariffs to improve, whereas those with higher initial tariffs often deteriorate.
This is illustrated within Figure 2.20, which shows the terms of trade of economies like
Singapore and Australia improving, while the opposite holds true for economies such as
Thailand and Viet Nam. Additionally, the increase in capital accumulation effect of RCEP is
seen to dominate the change in terms of trade effects. This is particularly obvious in Japan and
Korea which are observed to boast the largest proportion of capital accumulation effects.
Figure 2.20: Impact of RCEP on the welfare attributed to terms of trade and Capital
accumulation
Source: Gilbert, J., Furusawa, T., & Scollay, R. (2016) and APEC Secretariat, Policy Support Unit calculations
Note: Data for Papua New Guinea was not available.
Trade
Export gains in the region are expected to range from a contraction of USD 7 billion in Chinese
Taipei to an expansion of USD 259 billion in China (Figure 2.21). In general, almost all non-
RCEP members, except the United States and Russia, would experience a contraction in
exports due to possible trade diversion effects from RCEP.
-10
-5
0
5
10
15
20
25
30
35
40
US
D b
illi
on
TOT Capital

Component 2: Liberalization through FTAAP Pathways
39
Figure 2.21: Impact of RCEP on exports of the APEC region
Source: Petri, P., Plummer, M., Urata, S., & Zhai, F. (2017) and APEC Secretariat, Policy Support Unit calculations
Note: Data for Papua New Guinea was not available.
With regards to changes in imports, APEC’s developed economies are estimated to range
between -0.7% in United States and 5.5% in Australia (Rahman & Ara, 2015). Details on the
effect on imports for APEC’s developing economies were not available within reviewed
papers.
Effect on sub-regions/groups close to APEC
GDP or Production Level
For the case of the Pacific Alliance, studies predict that changes in income should be between
USD -30.1 billion and USD 0.16 billion. Using Russia as a gauge for the EAEU, Kawasaki
(2014) estimates changes in GDP to range from USD -0.7 billion to USD 11.4 billion.
Additionally, gains are positive when RCEP undergoes more extensive liberalization efforts
(e.g. removal of non-tariff barriers). While for ASEAN, Rana, Chia & Chang (2018) find the
impact of percentage change in GDP in ASEAN to range between 0.4% in Myanmar and 8.2%
in Cambodia (Figure 2.22). On the other hand, the change in GDP for ASEAN members in
APEC range from a low of 0.6% to a high of 4.5%.
Figure 2.22: Impact of RCEP on ASEAN GDP
Source: Ji, X., Rana, P., Chia, W., & Tai Li, C. (2018) and APEC Secretariat, Policy Support Unit calculations
14 0
-1 -1
259
-1
17
136
62
17
-2
3 0 4 1 3
-7
243 17
-50
0
50
100
150
200
250
300
US
D b
illi
on
-1.9
-8.2
-0.6
-2.4 -2.6
-0.4-1.0
-1.6
-4.5
-3.3
-10-9-8-7-6-5-4-3-2-10
Bru
nei
Dar
uss
alam
Cam
bo
dia
Ind
ones
ia
Lao
s
Mal
aysi
a
My
anm
ar
Ph
ilip
pin
es
Sin
gap
ore
Th
aila
nd
Vie
t N
am
Chan
ge
in R
eal
GD
P (
%)

Component 2: Liberalization through FTAAP Pathways
40
On the whole, ASEAN expects a significantly larger increase in income gains as compared to
the Pacific Alliance and the EAEU. This is not surprising as none of the EAEU or Pacific
Alliance members are participants to the RCEP.
Welfare
On the welfare front, Gilbert, Furusawa & Scollay (2016) estimate gains for ASEAN, EAEU
and Pacific Alliance to be USD 19.6 billion, USD 2.5 billion, and USD 0.4 billion respectively.
Conversely, Lee & Itakura (2017) predict a welfare change of USD 50.2 billion for ASEAN,
USD -0.5 billion for Pacific Alliance and USD -0.4 billion for the EAEU. ASEAN’s gain is
predicted to be even lower in Gilbert (2013) which estimates a value ranging between USD 4.2
billion and USD 5.9 billion.
Additionally, for ASEAN and the Pacific Alliance, the capital accumulation effect tends to
dominate the terms of trade effect. This effect is found to be highest in Thailand for ASEAN
and Mexico for the Pacific Alliance. On the other hand, the EAEU’s terms of trade effect was
found to be larger than the capital accumulation effect.
Across time, RCEP is expected to result in ASEAN’s welfare increasing from USD 5.9 billion
in the medium run to USD 4.2 billion in the long run. While Indonesia is expected to be the
main driver of medium term gains with a value of USD 1.9 billion, Malaysia is largely
responsible for the long run gains estimated (Gilbert, 2013).
Trade
Petri, Plummer, Urata & Zhai (2017) estimate both ASEAN’s and EAEU’s exports to expand
by USD 86 billion and USD 1 billion respectively. Whereas for the Pacific Alliance, exports
are estimated to contract by USD 3 billion. This is likely a result of the trade diversion effect
created by the RCEP and the fact that none of the Pacific Alliance and the EAEU members are
participants to the RCEP. In terms of imports, ASEAN is estimated to grow by 2.9% (Rahman
& Ara, 2015). None of the reviewed papers analyzed the impact of liberalization through RCEP
on imports of the Pacific Alliance and the EAEU.
2.5 OBSERVATIONS
APEC as a whole is seen to perform relatively well in all agreements evaluated in terms of
income, trade, welfare and investment. However, studies have also predicted a diverse range
of results for each scenario.
In general, the FTAAP is anticipated to increase income gains for the APEC region as a whole
and across all economies. A similar trend is observed in terms of welfare. Trade would also
increase for the APEC region. Additionally, FTAAP is found to be beneficial even for regional
groups such as ASEAN, the Pacific Alliance and the EAEU with all three expecting positive
gains in all categories analyzed.
For the TPP and CPTPP scenarios, income gained by the APEC region from these schemes is
predicted to be in the range of USD 97 billion to USD 438 billion. Benefits are positive from
the regional perspective in terms of welfare, trade and investments as well, but values are more
varied at the economy level. For instance, being left out of TPP and CPTPP may have
detrimental effects in terms of falling exports and declining welfare.
The RCEP scenario is estimated to boast the largest gains among all the FTAAP pathways
analyzed for the APEC region. Those studies analyzing tariff liberalization scenarios under
Component 2: Liberalization through FTAAP Pathways
41
both TPP and RCEP found that income gains are higher with RCEP, in part explained by the
larger market size of RCEP in comparison to those of TPP and CPTPP. The distribution of
gains is found to be larger even under this scenario, with developing economies benefiting the
most. However, APEC economies left out of RCEP may experience a reduction in their exports,
welfare and production.
No studies were found analyzing the impact of those scenarios on employment at the regional
level. Nevertheless, evidence by some studies in individual economies show a positive overall
impact on employment or labor income for those economies participating in these integration
schemes. In addition, labor and production are closely linked and would improve under those
scenarios, particularly for labor intensive sectors in developing economies and skilled labor
sectors in industrialized economies.
As seen, a main finding in the different scenarios analyzed is that APEC economies excluded
from any of the integration processes will benefit less or may even experience a negative
economic impact in certain areas. While those participating in TPP/CPTPP will benefit from
those agreements, those out of TPP/CPTPP may not. Similarly, if RCEP negotiations are
finalized and an agreement is implemented, those out of RCEP may not benefit.
TPP, CPTPP and RCEP are all possible pathways towards the FTAAP. Among these pathways,
studies find either the RCEP or TPP pathway to provide the largest benefits for APEC as a
whole. However, on closer evaluation of economies and sectors, it is clear that not all of them
will enjoy the same level of benefits due to a myriad of factors, such as the economic structure,
availability of production factors, market size, development levels and network of RTA/FTA
partners, among others.
While studies show some economies participating in TPP, CPTPP or RCEP may lose in terms
of trade, through a decline in exports, other economies will catch up by starting to enjoy same
preferential access to markets as those that had already been subject to preferential access due
to bilateral trade agreements implemented in the past; those participating economies will not
experience a decline in welfare, as the capital accumulation effect (i.e. increasing assets from
investments and profits) after the implementation of TPP, CPTPP or RCEP would offset the
negative effect by the reduced terms of trade.

Component 3: Market Access Commitments within the CPTPP
42
3 MARKET ACCESS COMMITMENTS WITHIN THE CPTPP
3.1 INTRODUCTION
This section aims to have a better understanding of the market access commitments of potential
FTAAP pathways. Among the pathways named in the Collective Strategic Study on Issues
Related to the Realization of FTAAP, the CPTPP is the only negotiation concluded as of May
2019. This section will analyze those market access commitments for goods agreed by the
CPTPP participating parties.
As background, the CPTPP agreement was signed by eleven economies26 on 8 March 2018 and
was later enforced on 30 December 2018 by seven economies27. This report has been structured
to first provide an overview of the general features of the CPTPP tariff liberalization schedule
including the number of tariff lines, base tariff rates, and staging categories, followed by an
analysis of the degree of liberalization agreed upon including full liberalization, partial
liberalization and exclusions.
3.2 RATIONALE
The CPTPP is the largest regional trade agreement of its kind that has brought together eleven
economies across the Asia-Pacific with members accounting for 14% of the global economy
(Ministry of Trade and Investment Singapore, 2019). Given its strong commitments towards
removing tariffs on almost 95% tariff lines, tariffs in the APEC region has been reduced
considerably (Rana & Ji, 2019).
While several studies have evaluated the potential economic impact of the agreement (as
consolidated in component 2 of this study) on members and the rest of the world, there has yet
to be a comprehensive study on the extent of improved market access provided to economies.
In response, this study carries out a tariff line analysis on the agreed commitments and
quantifies the depth of the tariff liberalization schedules for each CPTPP member.
3.3 MARKET ACCESS COMMITMENTS
3.3.1 OVERVIEW OF CPTPP TARIFF LIBERALIZATION
SCHEDULES
This section provides an overview of the CPTPP tariff liberalization schedule for each of its
members. An evaluation of these schedules provides insights into the breadth of liberalization
commitments and their likely impact. It is important to note that the tariff liberalization
schedules have been agreed using domestic HS product tariff lines in each CPTPP member at
the 8 or 10-digit level. While HS 6-digit codes (i.e. product sub-headings) are harmonized
across economies, those beyond 6-digits (i.e. product tariff lines) are not. As such, the total
number of tariff lines evaluated in this study are different across economies.
26 Australia; Brunei Darussalam; Canada; Chile; Japan; Malaysia; Mexico; Peru; New Zealand; Singapore; and
Viet Nam. 27 As of 14 January 2019.
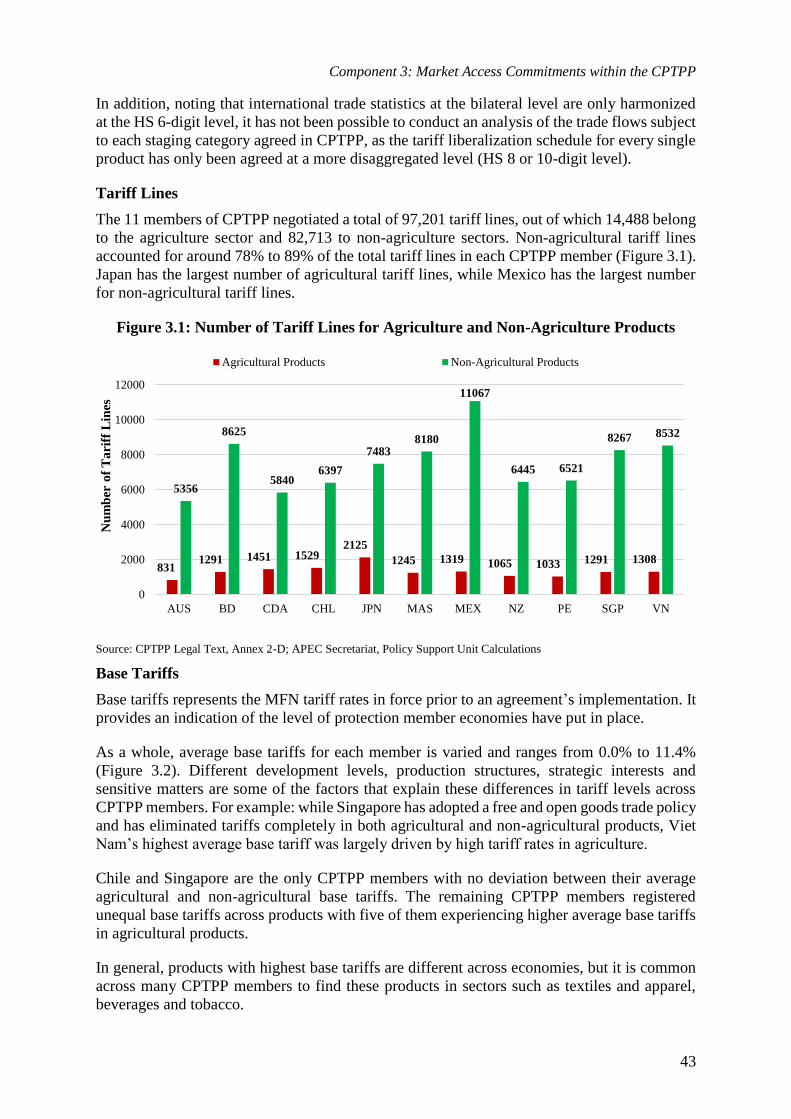
Component 3: Market Access Commitments within the CPTPP
43
In addition, noting that international trade statistics at the bilateral level are only harmonized
at the HS 6-digit level, it has not been possible to conduct an analysis of the trade flows subject
to each staging category agreed in CPTPP, as the tariff liberalization schedule for every single
product has only been agreed at a more disaggregated level (HS 8 or 10-digit level).
Tariff Lines
The 11 members of CPTPP negotiated a total of 97,201 tariff lines, out of which 14,488 belong
to the agriculture sector and 82,713 to non-agriculture sectors. Non-agricultural tariff lines
accounted for around 78% to 89% of the total tariff lines in each CPTPP member (Figure 3.1).
Japan has the largest number of agricultural tariff lines, while Mexico has the largest number
for non-agricultural tariff lines.
Figure 3.1: Number of Tariff Lines for Agriculture and Non-Agriculture Products
Source: CPTPP Legal Text, Annex 2-D; APEC Secretariat, Policy Support Unit Calculations
Base Tariffs
Base tariffs represents the MFN tariff rates in force prior to an agreement’s implementation. It
provides an indication of the level of protection member economies have put in place.
As a whole, average base tariffs for each member is varied and ranges from 0.0% to 11.4%
(Figure 3.2). Different development levels, production structures, strategic interests and
sensitive matters are some of the factors that explain these differences in tariff levels across
CPTPP members. For example: while Singapore has adopted a free and open goods trade policy
and has eliminated tariffs completely in both agricultural and non-agricultural products, Viet
Nam’s highest average base tariff was largely driven by high tariff rates in agriculture.
Chile and Singapore are the only CPTPP members with no deviation between their average
agricultural and non-agricultural base tariffs. The remaining CPTPP members registered
unequal base tariffs across products with five of them experiencing higher average base tariffs
in agricultural products.
In general, products with highest base tariffs are different across economies, but it is common
across many CPTPP members to find these products in sectors such as textiles and apparel,
beverages and tobacco.
8311291 1451 1529
2125
1245 1319 1065 1033 1291 1308
5356
8625
58406397
74838180
11067
6445 6521
8267 8532
0
2000
4000
6000
8000
10000
12000
AUS BD CDA CHL JPN MAS MEX NZ PE SGP VN
Nu
mb
er o
f T
ari
ff L
ines
Agricultural Products Non-Agricultural Products

Component 3: Market Access Commitments within the CPTPP
44
Figure 3.2: Average base tariffs (%) for CPTPP member economies
Source: CPTPP Legal Text, Annex 2-D; APEC Secretariat, Policy Support Unit Calculations
Staging Categories
Staging categories refers to the modalities that CPTPP member economies have agreed to phase
out their respective tariffs. As individual economies negotiate their own time frames and
various other considerations to reduce or eliminate tariffs taking into account different
sensitivities and interests, the number and types of staging categories differ across economies
in each trade negotiation (Estevadeordal , 1999). While staging categories are useful during
trade negotiations, agreeing on a large number of staging categories could be administratively
cumbersome and costly to manage during the implementation of trade agreements.
The CPTPP agreement includes a total of 194 staging categories across eleven economies.
There is significant disparity among members with regards to the number of staging categories,
ranging from just one by Singapore to 63 by Japan (Figure 3.3).
Figure 3.3: Number of staging categories for all products
Source: CPTPP Legal Text, Annex 2-D; APEC Secretariat, Policy Support Unit Calculations
2.8%
3.4%
6.5%
6.0%
5.4%
5.5%
7.4%
2.3%
5.0%
0.0%
11.4%
0% 2% 4% 6% 8% 10% 12% 14%
AUS
BD
CDA
CHL
JPN
MAS
MEX
NZ
PE
SGP
VN
Average Base Tariff (%)
All Products
3.0%
3.9%
3.5%
6.0%
3.5%
6.0%
5.6%
2.4%
4.7%
0.0%
10.3%
1.3%
0.0%
20.0%
6.0%
13.0%
2.6%
22.4%
1.7%
6.3%
0.0%
18.9%
0% 5% 10% 15% 20% 25%
AUS
BD
CDA
CHL
JPN
MAS
MEX
NZ
PE
SGP
VN
Average Base Tariff (%)
Agricultural Products Non-Agricultural Products
812
96
63
22 23
5 7
1
38
0
10
20
30
40
50
60
70
AUS BD CDA CHL JPN MAS MEX NZ PE SGP VN
Nu
mb
er o
f st
ag
ing
cate
go
ries
All Products

Component 3: Market Access Commitments within the CPTPP
45
In general, while agricultural products are subject to more staging categories than non-
agricultural products in the CPTPP, the situation is different at the individual economy level
(Figure 3.4). On the one hand, Chile; Japan; Malaysia; Mexico and Peru include more staging
categories in their tariff liberalization schedules for agricultural products. On the other hand,
the opposite occurs with Australia; Brunei Darussalam; Canada; New Zealand and Viet Nam,
as non-agricultural products are distributed across a greater number of staging categories.
At the individual economy level, Japan and Viet Nam register the largest number of staging
categories for agricultural and non-agricultural products, respectively.
Figure 3.4: Number of staging categories for agriculture and non-agriculture products
Source: CPTPP Legal Text, Annex 2-D; APEC Secretariat, Policy Support Unit Calculations
3.3.2 EXTENT OF TARIFF LIBERALIZATION
The market access commitments agreed at CPTPP can be categorized into four approaches: 1)
products are duty-free immediately after the CPTPP is put in force by a signatory party; 2)
products are subject to longer phase-out periods up to 21 years; 3) products subject to partial
liberalization only; and 4) products excluded from the tariff liberalization process. Figure 3.5
the liberalization progress from year 1 to 21 by showing the percentage of duty free tariff lines
offered by each CPTPP member. Overall, the majority of the products will be fully liberalized
by year 11 for most CPTPP members, even though a small amount of tariff lines will eliminate
tariffs in longer phase out periods.
25 4 5
60
20
15
3
7
1
23
811
8
3
107
14
5 41
27
0
10
20
30
40
50
60
AUS BD CDA CHL JPN MAS MEX NZ PE SGP VN
Nu
mb
er o
f st
ag
ing
ca
teg
ori
es
Agricultural Products Non-Agricultural Products

Component 3: Market Access Commitments within the CPTPP
46
Figure 3.5: Share of Duty-Free Tariff Lines by Each Year of CPTPP Agreement
Source: CPTPP Legal Text, Annex 2-D; APEC Secretariat, Policy Support Unit Calculations
Immediate Duty-Free Tariff Liberalization
Upon entry into force of the CPTPP, tariffs on a vast majority of products (86.1% of the tariff
lines from the 11 CPTPP parties) are immediately duty-free, with Singapore committing to
immediate 100% tariff elimination for all products and five other CPTPP members eliminating
tariffs on over 90% tariff lines (i.e. Australia; Brunei Darussalam; Canada; Chile and New
Zealand), as shown in Figure 3.6. Non-agriculture products take up a large share, ranging
across CPTPP members from 60.8% to 86.5% of their total tariff lines, while agriculture
products with immediate duty-free commitments account for from 4.0% to 16.8% of total tariff
lines across CPTPP members.
Figure 3.6: Share of duty-free tariff lines at CPTPP date of entry into force
Source: CPTPP Legal Text, Annex 2-D; APEC Secretariat, Policy Support Unit Calculations
0%
10%
20%
30%
40%
50%
60%
70%
80%
90%
100%
1 2 3 4 5 6 7 8 9 10 11 12 13 14 15 16 17 18 19 20 21
Sh
are
of
tari
ff li
nes
fu
lly
lb
era
lize
d
Years after entry into force
AUS BD CDA CHL JPN MAS
MEX NZ PE SGP VN Aggregate
13.4% 12.8% 16.8% 16.5%9.4% 12.0% 8.3% 14.0% 11.0% 13.5%
4.0%
79.8% 79.1%77.2% 77.2%
71.7%73.5%
68.1%
80.7%
70.0%
86.5%
60.8%
93.2% 91.9% 94.0% 93.7%
81.1%85.6%
76.4%
94.7%
81.1%
100.0%
64.8%
0%
20%
40%
60%
80%
100%
AUS BD CDA CHL JPN MAS MEX NZ PE SGP VN
Sh
are
of
tota
l ta
riff
lin
es (
%)
Agricultural Products Non-Agricultural Products
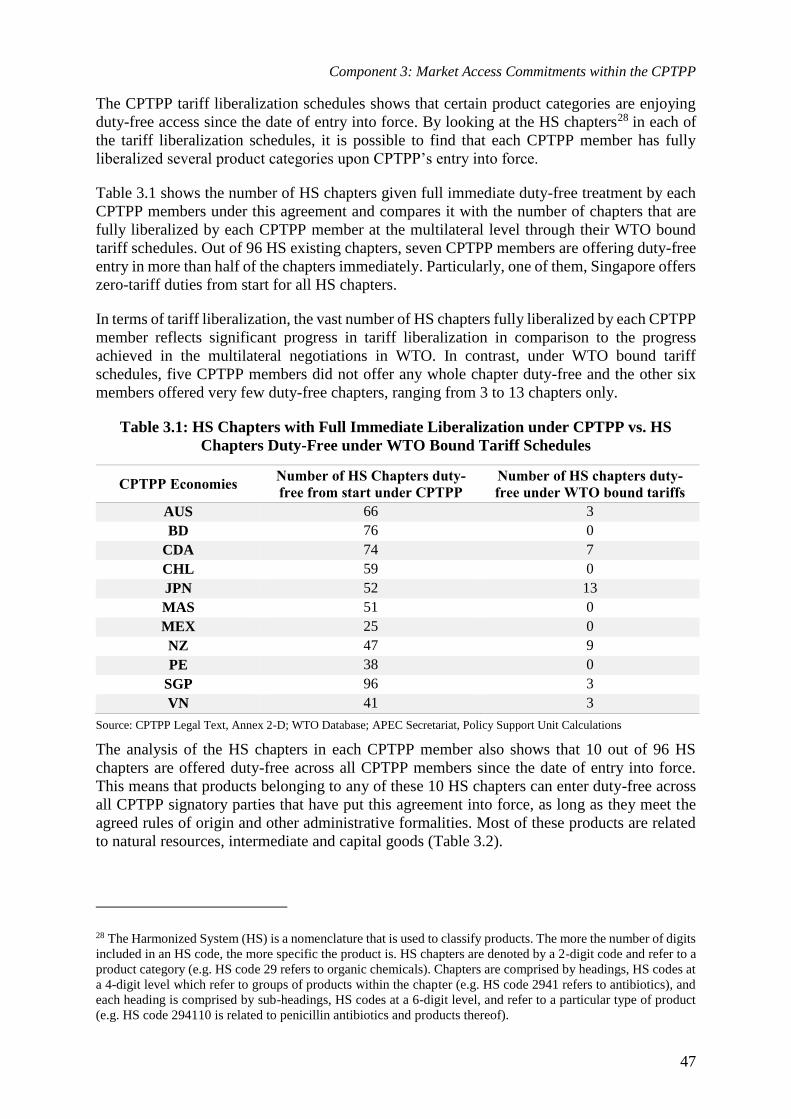
Component 3: Market Access Commitments within the CPTPP
47
The CPTPP tariff liberalization schedules shows that certain product categories are enjoying
duty-free access since the date of entry into force. By looking at the HS chapters28 in each of
the tariff liberalization schedules, it is possible to find that each CPTPP member has fully
liberalized several product categories upon CPTPP’s entry into force.
Table 3.1 shows the number of HS chapters given full immediate duty-free treatment by each
CPTPP members under this agreement and compares it with the number of chapters that are
fully liberalized by each CPTPP member at the multilateral level through their WTO bound
tariff schedules. Out of 96 HS existing chapters, seven CPTPP members are offering duty-free
entry in more than half of the chapters immediately. Particularly, one of them, Singapore offers
zero-tariff duties from start for all HS chapters.
In terms of tariff liberalization, the vast number of HS chapters fully liberalized by each CPTPP
member reflects significant progress in tariff liberalization in comparison to the progress
achieved in the multilateral negotiations in WTO. In contrast, under WTO bound tariff
schedules, five CPTPP members did not offer any whole chapter duty-free and the other six
members offered very few duty-free chapters, ranging from 3 to 13 chapters only.
Table 3.1: HS Chapters with Full Immediate Liberalization under CPTPP vs. HS
Chapters Duty-Free under WTO Bound Tariff Schedules
CPTPP Economies Number of HS Chapters duty-
free from start under CPTPP
Number of HS chapters duty-
free under WTO bound tariffs
AUS 66 3
BD 76 0
CDA 74 7
CHL 59 0
JPN 52 13
MAS 51 0
MEX 25 0
NZ 47 9
PE 38 0
SGP 96 3
VN 41 3
Source: CPTPP Legal Text, Annex 2-D; WTO Database; APEC Secretariat, Policy Support Unit Calculations
The analysis of the HS chapters in each CPTPP member also shows that 10 out of 96 HS
chapters are offered duty-free across all CPTPP members since the date of entry into force.
This means that products belonging to any of these 10 HS chapters can enter duty-free across
all CPTPP signatory parties that have put this agreement into force, as long as they meet the
agreed rules of origin and other administrative formalities. Most of these products are related
to natural resources, intermediate and capital goods (Table 3.2).
28 The Harmonized System (HS) is a nomenclature that is used to classify products. The more the number of digits
included in an HS code, the more specific the product is. HS chapters are denoted by a 2-digit code and refer to a
product category (e.g. HS code 29 refers to organic chemicals). Chapters are comprised by headings, HS codes at
a 4-digit level which refer to groups of products within the chapter (e.g. HS code 2941 refers to antibiotics), and
each heading is comprised by sub-headings, HS codes at a 6-digit level, and refer to a particular type of product
(e.g. HS code 294110 is related to penicillin antibiotics and products thereof).

Component 3: Market Access Commitments within the CPTPP
48
Table 3.2: List of HS Chapters with Full Immediate Liberalization Across All CPTPP
Parties
HS CHAPTER DESCRIPTION
05 Products of animal origin, not elsewhere specified or included.
06 Live trees and other plants; bulbs, roots and the like; cut flowers and ornamental
foliage.
26 Ores, slag and ash
31 Fertilizers
45 Cork and articles of cork.
46 Manufactures of straw, of esparto or of other plaiting materials; basketware and
wickerwork.
47 Pulp of wood or of other fibrous cellulosic material; recovered (waste and scrap)
paper or paperboard.
86 Railway or tramway locomotives, rolling-stock and parts thereof; railway or
tramway track fixtures and fittings and parts thereof; mechanical (including
electro-mechanical) traffic signalling equipment of all kinds.
88 Aircraft, spacecraft, and parts thereof.
97 Works of art, collectors' pieces and antiques.
Source: CPTPP Legal Text, Annex 2-D; APEC Secretariat, Policy Support Unit Calculations
The CPTPP tariff liberalization schedules also allow for the comparison of the percentage of
tariff lines with base tariff equal to zero vis-à-vis the percentage of tariff lines that are offered
duty-free after CPTPP’s date of entry into force. Since the share of tariff lines with base rate
equals to zero shows the amount of products that are already enjoying duty-free market access
prior to joining the CPTPP, comparing this number with the share of products subject to
immediate duty-free access under CPTPP by each party gives us some clues on the market
access gains and the level of commitments made during the CPTPP negotiation. For instance,
as shown in Table 3.3 , only 0.4% of the total tariff lines are set as duty free by Chile currently,
while upon entry into force of CPTPP, Chile will remove tariffs on 93.7% of total lines.
In general, substantial progress has been made in liberalizing trade in goods by all parties
through CPTPP. Nevertheless, such efforts are not uniform across economies and sectors
(Table 3.3). At the aggregate level, 54.1% of the tariff lines are already enjoying a base tariff
equal to 0% and 86.1% of the tariff lines are going to be duty-free from the date of entry into
force. In terms of extra effort to liberalize trade, this means that an additional 32% of the tariff
lines are fully liberalized from the start, thanks to the CPTPP negotiations.
Within agriculture and non-agriculture sectors, the additional efforts to fully liberalize in terms
of percentage of tariff lines are equal to 31.9% and 32%, respectively, which leads to duty-free
access of 77.8% of all agriculture tariff lines, and 87.5% of all non-agriculture tariff lines upon
entering into force of the CPTPP (Table 3.3).
Also, Table 3.3 provides an idea of the existing sensitivities in the CPTPP negotiation.
Regarding the agricultural sector, for Japan and Viet Nam, the percentage of those products
entering duty-free in their markets from the date of entry into force is below 50%, low in
comparison to the rest of CPTPP members. For the non-agricultural sector, Malaysia, Mexico,
Peru and Viet Nam are the CPTPP members giving immediate duty-free access to less than
90% of those products.

Component 3: Market Access Commitments within the CPTPP
49
Table 3.3: Percentage of Tariff Lines with Base Tariff = 0% vis-a-vis Percentage of
Tariff Lines with Duty-Free Access on CPTPP’s Date of Entry into Force
ALL PRODUCTS
CPTPP
Economies
Base Tariff = 0%
(share of total tariff
lines)
Duty Free on Day 1
(share of total tariff
lines)
Change as Share of
Total Tariff Line
AUS 47.5% 93.2% 45.7%
BD 75.8% 91.9% 16.0%
CDA 57.6% 94.0% 36.4%
CHL 0.4% 93.7% 93.3%
JPN 38.6% 81.1% 42.5%
MAS 64.7% 85.6% 20.9%
MEX 55.0% 76.4% 21.4%
NZ 58.3% 94.7% 36.3%
PE 54.2% 81.1% 26.8%
SGP 99.9% 100.0% 0.1%
VN 32.5% 64.8% 32.3%
Aggregate 54.1% 86.1% 32.0%
AGRICULTURAL PRODUCTS
CPTPP
Economies
Base Tariff = 0%
(share of total
agricultural lines)
Duty Free on Day 1
(share of total
agricultural lines)
Change as Share of
Total Agriculture
Tariff Line
AUS 73.4% 99.9% 26.5%
BD 97.8% 98.4% 0.6%
CDA 42.6% 84.3% 41.7%
CHL 0.0% 85.7% 85.7%
JPN 23.7% 42.5% 18.9%
MAS 71.3% 91.2% 19.8%
MEX 19.6% 77.7% 58.1%
NZ 64.9% 98.8% 33.9%
PE 34.3% 80.7% 46.5%
SGP 99.5% 100.0% 0.5%
VN 13.7% 30.4% 16.7%
Aggregate 45.9% 77.8% 31.9%
NON-AGRICULTURAL PRODUCTS
CPTPP
Economies
Base Tariff = 0%
(share of total non-
agricultural lines)
Duty Free on Day 1
(share of total non-
agricultural lines)
Change as Share of
Total Non-
Agriculture Tariff
Line
AUS 43.5% 92.2% 48.7%
BD 72.5% 90.9% 18.3%
CDA 61.3% 96.4% 35.1%
CHL 0.5% 95.7% 95.1%
JPN 42.9% 92.1% 49.2%
MAS 63.7% 84.7% 21.0%
MEX 59.2% 76.2% 17.0%
NZ 57.3% 94.0% 36.7%
PE 57.4% 81.1% 23.7%
SGP 100.0% 100.0% 0.0%
VN 35.3% 70.1% 34.7%
Aggregate 55.5% 87.5% 32.0%
Source: CPTPP Legal Text, Annex 2-D; APEC Secretariat, Policy Support Unit Calculations

Component 3: Market Access Commitments within the CPTPP
50
In analyzing the HS chapters with the largest number of tariff lines immediately liberalized by
individual CPTPP members, many of them are related to capital goods, such as HS chapters 84
and 85 corresponding to machinery and mechanical applications, and electrical machinery,
respectively (Table 3.4). In all CPTPP members, they appear as one of the top five chapters
with the larger numbers of duty-free tariff lines at the CPTPP’s date of entry into force.
Some HS chapters comprised of mostly intermediate goods also appear across all CPTPP
members among those with the largest number of tariff lines fully liberalized from CPTPP day
1. For example, organic chemicals (chapter 29). Likewise, Iron and steel (chapter 72) also
appears in many CPTPP members among one of the HS chapters with most duty-free tariff
lines after the agreement is put into force.

Component 3: Market Access Commitments within the CPTPP
51
Table 3.4: Top 5 Chapters with Most Duty-free Tariff Lines at Date of Entry (% of Total Tariff Lines)
AUS % BD % CDA % CHL % JPN % MAS % MEX % NZ % PE % SGP % VN %
1
84
Machinery
and
mechanical
apps
9.5
84
Machinery
and
mechanical
apps
11.0
84
Machinery
and
mechanical
apps
8.4
84 Machinery
and
mechanical
apps
8.0
84
Machinery
and
mechanical
apps
6.1
44 Wood
and articles
thereof 15.6
29 Organic
chemicals 13.5
84
Machinery
and
mechanical
apps
9.8
84
Machinery
and
mechanical
apps
9.6
84
Machinery
and
mechanical
apps
13.3
84
Machinery
and
mechanical
apps
9.9
2 29 Organic
chemicals 5.6
87 Vehicles
other than
railway 6.8
85
Electrical
Machinery 5.9
29 Organic
chemicals 7.1
29 Organic
chemicals 4.7
84
Machinery
and
mechanical
apps
6.2
84
Machinery
and
mechanical
apps
10.2
85
Electrical
Machinery 5.5
29 Organic
chemicals 9.1
85
Electrical
Machinery 8.3
85
Electrical
Machinery 4.7
3
85
Electrical
Machinery 5.1
85
Electrical
Machinery 6.4
29 Organic
chemicals 4.6
3 Fish and
crustaceans,
molluscs 6.4 52 Cotton 4.0
29 Organic
chemicals 4.1
85
Electrical
Machinery 7.3
29 Organic
chemicals 4.5
85
Electrical
Machinery 5.4
87 Vehicles
other than
railway 4.9
29 Organic
chemicals 4.1
4
48 Paper
and
paperboard 3.9
29 Organic
chemicals 4.1
3 Fish and
crustaceans 2.8
85 Electrical
Machinery 4.8
85
Electrical
Machinery 3.4
85
Electrical
Machinery 3.9
73 Articles
of iron or
steel 2.4
72 Iron and
steel 3.0
28
Inorganic
chemicals 3.7
5 3 Fish and
crustaceans 3.1
72 Iron and
steel 3.1
90 Optical
instruments 2.7
87 Vehicles
other than
railway 3.0
72 Iron and
steel 3.4
39 Plastics
and articles
thereof 3.3
72 Iron and
steel 2.4
39 Plastics
and articles
thereof 2.9
3 Fish and
crustaceans 2.9
3 Fish and
crustaceans 3.1
Source: CPTPP Legal Text, Annex 2-D; APEC Secretariat, Policy Support Unit Calculations

Component 3: Market Access Commitments within the CPTPP
52
Products Subject to 10-Year-or-Longer Phase Out Full Liberalization Period
Under the full liberalization regime, apart from the immediately liberalized products, tariffs on
the remaining products are to be phased out over periods of up to 21 years, varying across
economies and product categories. As shown in Figure 3.7, most products are completely
liberalized within the first few years of the agreement entering in force, while for more sensitive
products, the process could be extended to a much longer timeframe. Examining those products
that are subject to longer liberalization periods (from 10 years and above) and those that are
partially liberalized and excluded gives us an idea of the sensitivities faced by each of the
CPTPP members from the goods trade perspective in the negotiation process.
7 out of 11 CPTPP parties have tariff lines that will be fully liberalized only after 10 or more
years (Figure 3.7). However, most of these products come from five CPTPP parties (i.e. Japan;
Malaysia; Mexico; Peru and Viet Nam). Industrial products take up a major share, ranging from
4.6% to 18.4% of all tariff lines across these five CPTPP members.
Figure 3.7: Share of Tariff Lines Fully Liberalized after 10 or More Years
Source: CPTPP Legal Text, Annex 2-D; APEC Secretariat, Policy Support Unit Calculations
In order to determine whether these tariff lines subject to longer liberalization schedules are
concentrated in few product categories, this report looked at the numbers of HS chapters
containing tariff lines with this feature, For instance, sensitive products in Brunei are
concentrated in 3 HS chapters, while in Mexico, the products are dispersed in 70 different
chapters (Table 3.5).
0.0%
0.1% 1.5%0.0%
2.9%1.0% 1.3%
0.0%0.9%
0.0%2.1%
0.0%
0.0%
0.4%0.0%
5.1%
4.9%
18.4%
0.0%
12.5%
0.0%
4.6%
0.0%
0.1%1.9%
0.0%
8.0%
5.9%
19.6%
0.0%
13.4%
0.0%
6.7%
0%
2%
4%
6%
8%
10%
12%
14%
16%
18%
20%
AUS BD CDA CHL JPN MAS MEX NZ PE SGP VN
Agricultural Products Non-Agricultural Products

Component 3: Market Access Commitments within the CPTPP
53
Table 3.5: Number of HS Chapters Containing Tariff Lines Fully Liberalized After 10
or More Years
AUS BD CDA CHL JPN MAS MEX NZ PE SGP VN
0 3 11 0 37 23 70 0 44 0 22
Source: CPTPP Legal Text, Annex 2-D; APEC Secretariat, Policy Support Unit Calculations
Table 3.6 lists the top 5 chapters in each CPTPP party with the highest shares of tariff lines
subject to full liberalization only after 10 or more years. The slow-paced liberalization is mostly
prevalent in labor-intensive manufactures, agricultural products and products with negative
externalities.
In this regard, most of the sensitivities in labor-intensive manufactures were found in footwear,
textiles (e.g. knitted fabrics, woven fabrics and other textiles), apparel and clothing and carpets.
Among agricultural products, those with most sensitivities were sugars, milling products,
cotton, preparations of cereals, flour, starch and milk, raw hides and skins and miscellaneous
edible preparations. Products creating negative externalities like tobacco, alcoholic beverages
and arms have also been included under long liberalization periods.
In addition, some capital-intensive manufactures such as vehicles are also subject to long
liberalization periods. Usually, these products face a long-term liberalization period for a
number of reasons such as: 1) strategic considerations in order to protect and develop local
producers; 2) tax collection; and 3) discouraging the consumption of foreign products that are
considered luxury items.

Component 3: Market Access Commitments within the CPTPP
54
Table 3.6: Top 5 HS Chapters with Most Tariff Lines Fully Liberalized Only After 10 or More Years (as % of share within each
chapter)
BD % CDA % JPN % MAS % MEX % PE % VN %
1 21 Misc edible
preparations 13.2 24 Tobacco 94.1
42 Articles of
leather 100.0 24 Tobacco 100.0 52 Cotton 94.9 57 Carpets 100.0 24 Tobacco 100.0
2
36 Explosives;
pyrotechnic
products 6.3
17 Sugars and
sugar
confectionery 59.5 64 Footwear 78.1
22 Beverages,
spirits and
vinegar 83.3
60 Knitted and
crocheted
fabrics 89.3
61 Apparel and
clothing knitted
or crocheted 96.9
22 Beverages,
spirits and
vinegar 80.4
3
33 Essential
oils and
resionoids 4.8
11 Products of
milling industry 26.7
43 Furskins and
artificial fur 66.7
87 Vehicles
other than
railway 40.4
58 Special
woven fabrics 89.1 52 Cotton 93.8
17 Sugars and
sugar
confectionery 61.5
4
19 Prep. of
cereals, flour,
starch or milk 21.3
41 Raw hides
and skins 41.9 76 Aluminium 39.5
63 Other
textiles 88.9
62 Apparel and
clothing not
knitted and
crocheted
89.6
27 Mineral
fuels, mineral
oils 41.5
5 64 Footwear 18.8 24 Tobacco 41.7 93 Arms 36.4
61 Apparel and
clothing knitted
or crocheted 85.9 64 Footwear 86.7
87 Vehicles
other than
railway 39.4
Source: CPTPP Legal Text, Annex 2-D; APEC Secretariat, Policy Support Unit Calculations

Component 3: Market Access Commitments within the CPTPP
55
Partial Liberalization
A partial liberalization regime applies when economies decide not to offer fully duty-free
access to certain products at any point in time. In the case of the CPTPP, this has been
implemented through approaches such as: 1) only eliminating the ad valorem part of the duty
while the non-ad valorem component remains unchanged; 2) reducing the ad valorem duty
from base rate to a certain point and remains at that level; 3) tariff-rate quotas (TRQs), which
set duty-free quotas and a payment of a duty for imports above the quota; and 4) price bands,
in which an import duty is applicable to a product when its import price is lower than a
reference price.
9 out of 11 CPTPP members adopted such measures, targeting mostly agriculture products
(Table 3.7). Live animals, meat, dairy produce, cereals, cocoa, sugars, vegetables, fruits, nuts
are among those products affected by some CPTPP members’ partial liberalization schemes.
Table 3.7: Number of Tariff Lines Subject to Partial Liberalization
NUMBER OF TARIFF LINES
All
Products
% of all
tariff lines Agricultural
% of all
agriculture
tariff lines
Non-
Agricultural
% of all non-
agriculture
tariff lines
AUS 8 0.1% 0 0.0% 8 0.1%
CDA 98 1.3% 98 6.8% 0 0.0%
CHL 41 0.5% 41 2.7% 0 0.0%
JPN 365 3.8% 365 17.2% 0 0.0%
MAS 12 0.1% 12 1.0% 0 0.0%
MEX 99 0.8% 56 4.2% 43 0.4%
NZ 32 0.4% 0 0.0% 32 0.5%
PE 47 0.6% 47 4.5% 0 0.0%
VN 209 2.1% 13 1.0% 196 2.3%
Source: CPTPP Legal Text, Annex 2-D; APEC Secretariat, Policy Support Unit Calculations
Exclusions
Some products have been excluded by certain CPTPP parties from the tariff liberalization
process. The number of exclusions is very limited in terms of the total number of tariff lines
negotiated at CPTPP (Table 3.8). There are different ways to introduce exclusions, including:
1) bilaterally only, by keeping MFN rates; 2) to selected CPTPP parties by keeping custom
rates agreed in WTO multilateral negotiations; 3) to all CPTPP parties by keeping MFN rates.
Three economies include exclusion schemes in the CPTPP agreement and some examples of
excluded products are sugar, cheese, milk, poultry, beans, wheat, rice, flour, leather and articles
thereof, among others. Those products under the category of exclusions are the most sensitive
ones from each CPTPP member perspective.
Table 3.8: Tariff Exclusions under CPTPP
NUMBER OF TARIFF LINES PERCENTAGE OF TARIFF LINES
All
products Agriculture
Non-
Agriculture
All
products Agriculture
Non-
Agriculture
CHL 45* 45* 0 0.6% 0.6% 0.0%
JPN 305 253 52 3.2% 2.6% 0.5%
MEX 43** 43** 0 0.3% 0.3% 0.0%
Note: *Only for products from one party. ** Only for products listed from selected CPTPP parties
Source: CPTPP Legal Text, Annex 2-D; APEC Secretariat, Policy Support Unit Calculations

Component 3: Market Access Commitments within the CPTPP
56
3.4 RELATIONSHIP BETWEEN LIBERALIZATION PERIODS AND
BASE TARIFFS
To further explore the relationship between average base tariffs and the time required to achieve
full liberalization, an empirical estimation is carried out in this section. According to our
findings, governments are inclined to offer a liberalization period of 5 years to products with a
low base tariff (Figure 3.8). As base tariffs are higher, the liberalization period tends to be
longer. On average, an increase of the base tariff by 10 percentage points (e.g. tariff increasing
from 10% to 20%) means that full liberalization will take an additional 1.8 years.
Figure 3.8: Relationship between Average Base Tariff and Years to Full Liberalization
Source: CPTPP Legal Text, Annex 2-D; APEC Secretariat, Policy Support Unit Calculations
Within specific product categories, a positive relationship continues to exist between base
tariffs and the years required to achieve full liberalization (Figure 3.9). The results show that
agricultural products tend to be more sensitive than non-agricultural products to changes in
base tariffs and that this may affect the liberalization offered. To achieve full liberalization, 10
additional percentage points in the base tariff of an agricultural product means that full
liberalization will take an additional 2.06 years; while for a non-agricultural product, a similar
scenario would require an additional 1.64 years to reach full liberalization.
y = 18.11x + 5.18
R² = 0.33
0
5
10
15
20
25
0% 10% 20% 30% 40% 50% 60% 70% 80% 90% 100%
Yea
rs t
o f
ull
lib
era
liza
tio
n
Average base tariffs per staging category
All Products

Component 3: Market Access Commitments within the CPTPP
57
Figure 3.9: Relationship between Average Base Tariffs and Years to Full Liberalization
Source: CPTPP Legal Text, Annex 2-D; APEC Secretariat, Policy Support Unit Calculations
3.5 OBSERVATIONS
The analysis of the CPTPP tariff liberalization schedules brings some interesting observations
about the process. A negotiation process is not easy with different parties with diverse market
access interests, domestic sensitivities and development levels. The more parties involved, the
more complex the negotiation is. Being a process involving 11 parties, this required a lot of
creativity by creating several staging categories to liberalize trade among them.
In general, despite these caveats, it was possible for all parties involved to reach an outcome
that provides extensive immediate liberalization for a significant number of products.
Notwithstanding some cases of exclusions, partial liberalization and long-term liberalization
periods, the full implementation of the CPTPP will contribute to significant reduction of tariff
barriers among its members.
Faster liberalization is mostly found in sectors covering capital goods (e.g. machinery and
equipment) and intermediate products (e.g. chemicals, iron and steel). Slower liberalization,
partial liberalization and exclusions are more common in products that are labor-intensive (e.g.
textiles and apparel and footwear), agricultural products (e.g. milk, sugar, grains, meats and
leather), products creating negative externalities (e.g. tobacco and alcoholic beverages) and
certain industries considered as strategic by some of the participating parties (e.g. cars).
The analysis also shows a positive relationship between base tariffs and the time to full
liberalization. On average, agricultural products require longer liberalization periods than non-
agricultural as base tariffs increase.
Nonetheless, it is important to point out that the outcome obtained at the end of the CPTPP
negotiations involved a series of commitments on market access for both goods and services,
as well as obligations related to disciplines and rules. The final agreement was a result of a
balanced package, carefully negotiated through a process of exchange of concessions across
different sectors and areas.
y = 20.60x + 4.45
R² = 0.33
0
5
10
15
20
25
0% 20% 40% 60% 80% 100%
Yea
rs t
o f
ull
lib
era
liza
tio
n
Average base tariffs per staging category
Agricultural Products
y = 16.40x + 4.96
R² = 0.33
0
5
10
15
20
25
0% 20% 40% 60% 80% 100%
Yea
rs t
o f
ull
lib
era
liza
tio
nAverage base tariff per staging category
Non-Agricultural Products

Final Remarks
58
4 FINAL REMARKS
This report provides an overview of the progress made so far by APEC economies and the
possible impact of FTAAP pathways should APEC pursue them moving forward. Some of the
key takeaways are as follows:
Although significant progress has been made by APEC to reduce tariffs unilaterally, there
is still room for APEC economies to participate more actively to reduce tariffs in several areas.
Besides unilateral liberalization, APEC economies can use other strategies to reduce or
eliminate tariff barriers such as negotiating bilateral and regional RTA/FTAs, as well as
participating in multilateral and plurilateral agreements.
The FTAAP pathways examined in this study could bring significant benefit to APEC in
terms of income, welfare, trade and investment at the regional level. While the impact of a
prospective FTAAP by the pathways discussed could benefit APEC as a whole, the impact on
economies will differ depending on several factors including development level and economic
structure, among others. Also, it is clear that any economy that is excluded from the FTAAP
pathways or other strategies to reduce or eliminate tariff barriers could lose out. Tariff
reductions as a result of these regional trade agreements could benefit workers as it would allow
economies to better position themselves within global value chains.
The CPTPP provides strong evidence that it is possible to engage in a deep negotiated
liberalization process among a large number of parties. The CPTPP provides extensive
immediate liberalization for a significant number of products. The staging categories agreed
by the participating economies to address the variance in their sensitivities and their level of
economic development has made CPTPP a good example to show how creativity to find the
widest possible landing zone would enable APEC economies to drive ambitious tariff
liberalization towards the goal of deeper regional economic integration envisaged by FTAAP.

References
59
5 REFERENCES
Alexander, K., & Vladimir, S. (2017). Risks and Benefits for EAEU from various integration
scenarios in Asia-Pacific Region. Retrieved from
https://ideas.repec.org/a/rnp/ecopol/ep1713.html.
APEC. (2018). APEC's Bogor Goals Dashboard. Retrieved from
https://www.apec.org/Publications/2018/11/APEC-Bogor-Goals-Dashboard.
Cheong, I., & Tongzon, J. (2013). Comparing the Economic Impact of the Trans-Pacific
Partnership and the Regional Comprehensive Economic Partnership. Retrieved from
https://www.mitpressjournals.org/doi/abs/10.1162/ASEP_a_00218?journalCode=asep.
Chinese Taipei - Ministry of Finance. (n.d.). Trade Statistics Database. Retrieved May, 2019,
from http://web02.mof.gov.tw/njswww/webproxy.aspx?sys=100&funid=edefjsptgl
Ciuriak, D., Xiao, J., & Dadkhah, A. (2017). Quantifying the Comprehensive and Progressive
Agreement for Trans-Pacific Partnership. Retrieved from
https://papers.ssrn.com/sol3/papers.cfm?abstract_id=3100532.
Dasgupta, P., & Mukhopadhyay, K. (2017). The impact of the TPP on selected ASEAN
economies. Retrieved from
https://journalofeconomicstructures.springeropen.com/articles/10.1186/s40008-017-0086-7.
Dutt, P., Mitra, D., & Ranjan, P. (2009). International trade and unemployment: Theory and
cross-national evidence. Journal of International Economics.
Estevadeordal, A. (1999). Negotiating Preferential Market Access: The Case of NAFTA.
Retrieved from https://publications.iadb.org/en/publication/negotiating-preferential-market-
access-case-nafta
Felbermayr, G., Prat, J., & Schmerer, H. J. (2011). Trade and Unemployment: What Do the
Data Say? European Economic Review.
Gilbert, J. (2013). The Economic Impact of New Regional trading developments in the ESCAP
region. Retrieved from https://read.un-ilibrary.org/economic-and-social-development/the-
economic-impact-of-new-regional-trading-developments-in-the-escap-region_d1804dcf-
en#page1.
Gilbert, J., Furusawa, T., & Scollay, R. (2016). The economic impact of the Trans-Pacific
Partnership: What have we learned from CGE simulation? Retrieved from
https://www.unescap.org/resources/economic-impact-trans-pacific-partnership-what-have-
we-learned-cge-simulation-awp-no-157.
ICTSD. (2016). Trade Policies and Sustainable Development in the Context of Global Value
Chains.
International Monetary Fund. (n.d.). Direction of Trade Statistics. Retrieved March, 2019, from
http://data.imf.org/?sk=9D6028D4-F14A-464C-A2F2-59B2CD424B85

References
60
Jackson, J. K. (2016). The Trans-Pacific Partnership (TPP): Analysis of Economic Studies.
Retrieved from https://digitalcommons.ilr.cornell.edu/key_workplace/1547/.
Ji, X., Rana, P., Chia, W., & Chang, T.L. (2018). Trade policy options for ASEAN countries
and their regional dialogue partners. Retrieved from https://www.rsis.edu.sg/rsis-
publication/cms/wp308-trade-policy-options-for-asean-countries-and-their-regional-dialogue-
partners-preference-ordering-using-cge-analysis/#.XFksX1UzbIU.
Kawasaki, K. (2014). The relative significance of EPAs in Asia-Pacific. Journal of Asian
Economics. Retrieved from https://www.rieti.go.jp/jp/publications/dp/14e009.pdf.
Kee, H. L., Nicita, A., & Olarreaga, M. (2009). Estimating Trade Restrictiveness Indices.
Retrieved from http://siteresources.worldbank.org/INTRES/Resources/469232-
1107449512766/ecoj_2209.pdf
Lee, H., & Itakura, K. (2014). TPP, RCEP and Japan's Agricultural Policy Reforms. Retrieved
from https://ideas.repec.org/p/osp/wpaper/14e003.html.
Lee, H., & Itakura, K. (2017). U.S. Withdrawal from the Trans Pacific Partnership and the
Effects of Alternative Trade Integration Scenarios in the Asia-Pacific. Retrieved from
https://faculty.washington.edu/karyiu/confer/sea17/papers/Lee_Hiro.pdf.
Ministry of Foreign Affairs & Trade, New Zealand. Comprehensive and Progressive
Agreement for Trans-Pacific Partnership (CPTPP) Legal Text, Annex 2-D. Retrieved from
https://www.mfat.govt.nz/en/trade/free-trade-agreements/free-trade-agreements-in-
force/cptpp/comprehensive-and-progressive-agreement-for-trans-pacific-partnership-text-
and-resources/.
Ministry of Trade and Investment, Singapore. (2019). Comprehensive and Progressive
Agreement for Trans-Pacific Partnership: 7 Things you should know. Retrieved from
https://www.mti.gov.sg/-/media/MTI/improving-trade/multilateral-and-regional-
forums/CPTPP/CPTPP-7-things-you-need-to-know-070119.pdf
Miroudot, S., D. Rouzet and F. Spinelli (2013). Trade Policy Implications of Global Value
Chains: Case Studies.
Mukhopadhyay, K., & Thomassin, P. (2018). The impact of Trans-Pacific Partnership
agreement on the Canadian economy. The Impact of Trans-Pacific Partnership Agreement on
the Canadian Economy. Retrieved from https://link.springer.com/article/10.1186/s40008-017-
0102-y.
Nielson, J. (2017). Making Trade Work for All (No. 202). http://www.oecd.org/tad/making-
trade-work-for-all.pdf.
OECD (2015). Trade Policy Implications of Global Value Chains.
Petri, P., & Plummer, M. (2016). The Economic Effects of the Trans-Pacific Partnership: New
Estimates. Retrieved from https://piie.com/publications/working-papers/economic-effects-
trans-pacific-partnership-new-estimates.
Petri, P., Plummer, M. & Zhai, F. (2011). The Trans-Pacific Partnership and Asia-Pacific
Integration: A Quantitative Assessment. Retrieved from

References
61
https://www.eastwestcenter.org/publications/trans-pacific-partnership-and-asia-pacific-
integration-quantitative-assessment .
Petri, P., Plummer, M., Urata, S., & Zhai, F. (2017). Going it Alone in the Asia-Pacific:
Regional Trade Agreements Without the United States. Retrieved from
https://piie.com/publications/working-papers/going-it-alone-asia-pacific-regional-trade-
agreements-without-united.
Rahman, M. M., & Ara, L. A. (2015). TPP, TTP and RCEP: Implications for South Asian
Economies. Retrieved from
https://journals.sagepub.com/doi/abs/10.1177/1391561415575126.
Rana, P., & Ji, X. (2019). CPTPP: New Key Player in International Trade. Retrieved from
https://www.rsis.edu.sg/rsis-publication/cms/cptpp-new-key-player-in-international-
trade/#.XN4ZL1IzaUk.
Scollay, R. (2004). Preliminary Assessment of the Proposal for a Free Trade Area of the Asia-
Pacific. Retrieved from https://www.pecc.org/resources/2027-preliminary-assessment-of-the-
proposal-for-a-free-trade-area-of-the-asia-pacific?path=.
Sikdar, C., & Mukhopadhyay, K. (2017). Economy-wide impact of TPP: New challenges to
China. Retrieved from https://link.springer.com/article/10.1186/s40008-017-0082-y.
UNCTAD (United Nations Conference on Trade and Development). (2017). Key Statistics and
Trends in Trade Policy 2016.
UNCTAD (United Nations Conference on Trade and Development). (2018). Key Statistics and
Trends in Trade Policy 2018.
United States International Trade Commission. (2016). Trans-Pacific Partnership Agreement:
Likely Impact on the US Economy and on Specific Industry Sectors. Retrieved from
https://www.usitc.gov/publications/332/pub4607.pdf
World Bank. (2016). Potential macroeconomic implications of the Trans-pacific partnership.
Retrieved from http://pubdocs.worldbank.org/en/847071452034669879/Global-Economic-
Prospects-January-2016-Implications-Trans-Pacific-Partnership-Agreement.pdf.
World Trade Organization. (2017). World Trade Report 2017: Trade, Technology and Jobs.
World Trade Organization. (n.d.). Information Technology Agreement. Retrieved June 17,
2019, from https://www.wto.org/english/tratop_e/inftec_e/inftec_e.htm.
World Trade Organization. (n.d.). World Tariff Profiles. Retrieved from
https://www.wto.org/english/res_e/reser_e/tariff_profiles_e.htm.
World Trade Organization. Current Situation of Schedules of WTO Members. Retrieved from
https://www.wto.org/english/tratop_e/schedules_e/goods_schedules_table_e.htm.

Annex
62
6 ANNEX
A total of 17 studies were evaluated in this study with 15 studies including scenarios on TPP, 5 studies on CPTPP and 10 studies on RCEP.
GTAP
Dataset
Aggregated
Sectors
Aggregated
Regions
Relevant
Agreements
Evaluated
Main Assumptions
Alexander, K., & Vladimir,
S. (2017) 9 16 30 TPP & RCEP Tariff reduction assumed to be 100%
Cheong, I., & Tongzon, J.
(2013) 8 5 18 TPP & RCEP Tariff reduction assumed to be 100%
Ciuriak, D., Xiao, J., &
Dadkhah, A. (2017) 9 33 40 TPP & CPTPP
Tariff reduction is as stipulated within the actual TPP liberalization schedule.
Stylized straight-line tariff elimination schedules are developed based on actual
elimination schedule. Trailing liberalization beyond 2035 is not taken into
consideration
Agricultural products are assumed to face no Rule of Origin cost and a 100%
utilization rate. Textiles and clothing’s are assumed to have a high utilization
rate of 90%. Other industrial sectors utilization rate is assumed to be 80% where
utilization rates are phased in from a base of 60% by 5% each year
Services NTBs are converted into Ad-Valorem equivalents (AVE) based on the
effect of actual restrictions and the difference between bound commitments and
applied practice. It assumes that 25% of the calculated AVE is actionable.
FDI liberalization shock is based on a cross reference of CPTPP measures to
OECD’s Foreign Direct Investment Restrictiveness (FDIR) index for members.
Dasgupta, P., &
Mukhopadhyay, K. (2017) 9 28 13 TPP & CPTPP
Takes into consideration tariff and tariff-rate quotas from actual TPP
liberalization schedule
Tariff reduction is carried out only on selected sectors after considering most
commitments in the TPP
Gilbert, J. (2013) 7.1 35 15 RCEP Trade liberalization is modelled as complete removal of the applied tariffs on
merchandise trade
Gilbert, J., Furusawa, T., &
Scollay, R. (2016) 9 32 27
TPP, RCEP &
FTAAP
For the case of the TPP, an evaluation of different scenarios is carried out where
tariff is either reduced based on the actual TPP liberalization schedule or
completely eliminated
Tariff quotas are expanded as stipulated within the TPP agreement and are
included as equivalent tariff cuts that generate import expansion

Annex
63
For the case of RCEP and FTAAP, liberalization is modelled as a complete
elimination of tariffs between member economies.
Ji, X., Rana, P., Chia, W., &
Chang, T.L (2018) 9A 15 22
TPP, CPTPP &
RCEP
For TPP and CPTPP, tariffs are completely eliminated with carve-outs for
Canada, Japan, Mexico and Viet Nam; In terms of services, liberalization
includes those considered under USITC (2016)29
but with more extensive
liberalization carried out within communication, trade and other business
services industries; 1% decrease in import cost; and Rules of Origin is expected
to reduce gains by 25%.
For RCEP, tariffs are completely eliminated in Australia, Brunei Darussalam,
New Zealand and Singapore. While for China, Japan, Korea, Malaysia and the
Philippines, 95% of tariffs are eliminated. 90% in the remaining economies with
carve-outs; For services, liberalization in communication, transport and other
industries has been minimal based on current ASEAN+ agreements; 0.5%
reduction in import costs; and Rules of Origin is expected to reduce gains by
25%.
Kawasaki, K. (2014) 8.1 29 31 TPP, RCEP &
FTAAP
Tariff reduction assumed to be 100%
NTMs reduced by 50%
Spillover effects of NTM reduction to third party economy assumed to be 25%
Lee, H., & Itakura, K.
(2014) 8.1 32 22 RCEP
Tariff rates on commodities decline linearly to zero
Rice is excluded from trade liberalization.
NTBs on services and logistic time is assumed to fall by 20% respectively
29 USITC considers the impact of the TPP by converting service liberalization into tariff equivalents before reducing them. The paper considers the impact of : (1) commitments
to reduce or remove specific NTMs restricting trade in services through the evaluation of the service trade restrictiveness index (STRI); (2) adopting a negative list approach
for service liberalization by assuming it will generate larger gains within sectors that are innovative; (3) adopting measures which ensures the ability to transmit data across
borders as well as prohibit data localization measures. This is assumed to result in larger gains within sectors that are more digitally intensive.
The impact of the liberalization carried out in all three categories were weighted equally to evaluate the effect on cross-border trade.

Annex
64
Lee, H., & Itakura, K.
(2017) 9 29 23
FTAAP, TPP,
CPTPP & RCEP
Tariffs on commodities apart from rice, other grains, sugar, meats and dairy
products fall linearly to 0%
Tariff equivalents of NTBs in services are reduced by 20%
For selected agricultural products, tariffs will be reduced by: 2% for rice; 50%
for other grains (wheat, feed grains and other grains); 5% for sugar; 75% for
meats; and 5% for dairy products
Time cost of trade is assumed to fall by 20%
Productivity in agricultural and manufacturing sector will increase gradually
from 1% to 1.1% each year over a 10-year period.
For scenarios with FTAAP, by 2035, 80% of the FTAAP is assumed to have
been implemented
Mukhopadhyay, K., &
Thomassin, P. (2018) 9 28 13 TPP
Takes into consideration tariff and tariff-rate quotas from actual TPP
liberalization schedule
Tariffs assumed to be completely eliminated on selected sectors based on most
commitments within the TPP.
Petri, P., & Plummer, M.
(2016) 9 19 29 TPP
Takes into consideration actual TPP liberalization schedule.
Non-tariff barriers are adjusted based on the following:
o Only ¾ of non-tariff barriers are assumed to be subject to liberalization
o ½ of remaining barriers are considered actionable for services and ¾ are
considered actionable for goods.
o Share of actionable barriers eliminated for each service sector based mostly
on the commitments of the United States – Korea agreement
o 20% of reduction in NTBs and investment barriers apply to non-TPP partners
FDI is handled similarly to non-tariff barriers
Petri, P., Plummer, M. &
Zhai, F. (2011) 8 18 24 TPP & FTAAP
Across the different scenarios, tariffs were reduced between 91-93%; NTBs
affecting goods were reduced between 35-51%; NTBs affecting services were
reduced between 33-56%; FDI barriers were reduced between 35-59%;
preference utilization rates were assumed to be between 53-71%
Information on the tariff schedules of several FTAs was taken into account to
develop time-profiles of tariff reduction paths for TPP and FTAAP.
Petri, P., Plummer, M.,
Urata, S., & Zhai, F. (2017) 9 19 29
TPP, CPTPP &
RCEP
For RCEP, 85% elimination of tariffs; ¾ of NTB, agricultural, services, FDI
liberalization of recent ASEAN+1 agreements; and non-preferential NTB
reduction assumed to be 10%
For TPP, 99% of tariffs eliminated as negotiated within the TPP; adjusted
version of the Korea-United States Free Trade Agreement; and non-preferential
NTB reduction assumed to be 20%

Annex
65
For CPTPP, 99% of tariffs eliminated as negotiated within the TPP; adjusted
version of the Korea-United States Free Trade Agreement; and non-preferential
NTB reduction assumed to be 10%
Rahman, M. M., & Ara, L.
A. (2015) 8 17 10 TPP & RCEP
For the TPP, all economies are assumed to eliminated tariffs for each other
For the RCEP, all economies assumed to eliminated import tariffs
Sikdar, C., &
Mukhopadhyay, K. (2017) 9 14 22 TPP
Takes into consideration actual TPP liberalization schedule
Trade costs are expected to fall by 10%
World Bank. (2016) Not
indicated 19 29 TPP
Liberalization scenario considering tariff reduction under the actual TPP
liberalization schedule
Less than full utilization rate of preferential tariffs
Considers additional costs to meet rules of origin where the cost for 40% of
inputs are expected to rise by 10% of tariff reduction offered by the agreement
For goods, NTM’s were constructed based on estimates made by Kee, Nicita and
Olarreaga (2009)30
which was subsequently updated to 2012. For services,
estimates from Fontagne, Guillin and Mitaritonna (2011) were used 31
.
Three quarters of these NTMs are assumed to be trade impediments. For the
remaining NTMs, ¾ of those for goods are considered actionable while only ½
are considered actionable for services.
The reduction of these NTMs are based on the Korea and United States
agreement (which is seen to be similar to those of the TPP) with slight
modifications made
Spillover benefits from liberalization are assumed to be 20%
30 Kee, Nicita and Olarreaga (2009) created an index that evaluated the impact of trade policy on an economy’s own welfare, on its overall imports and the impact of trade
policies of other economies on each other’s exports.
31 Fontagne, Guillin and Mitaritonna (2011) evaluated the issues that impacted the estimation of tariff equivalents within services and provided estimates of tariff equivalents
for trade barriers within nine service sectors in 65 economies.
Copyright © 2022 FDOKUMEN