
Indonesia Developing Private Enterprise
220
Report No.9498-IND Indonesia Developing Private Enterprise May9, 1991 Country Department V Asia Regional Office FOR OFFICIALUSEONLY q ~~~~~~(9 0~~~~~ Dcmn o t W old Bank .~ ~ ~ ~ ~ ~ ~ ~ ~ ~ ~ ~ ~ ~ ~ ~ ~ ~~ ~ ~~~~~~~~~~~~~~~- This document has arest,ricted distribution and may be'used by recipients onlyin the performance of th*L o6flcial- juties,~ I'ts -contents may not otherwfse bedisclosed without World .,'k auth&iain 0k a ii 0 ~ ~ ~ ~ ~ ~ .,D.. i - . . . -. .i. Public Disclosure Authorized Public Disclosure Authorized Public Disclosure Authorized Public Disclosure Authorized Public Disclosure Authorized Public Disclosure Authorized Public Disclosure Authorized Public Disclosure Authorized
-
Upload
khangminh22 -
Category
Documents
-
view
1 -
download
0
Transcript of Indonesia Developing Private Enterprise

Report No. 9498-IND
IndonesiaDeveloping Private Enterprise
May 9, 1991
Country Department VAsia Regional Office
FOR OFFICIAL USE ONLY
q ~~~~~~(90~~~~~
Dcmn o t W old Bank
.~ ~ ~ ~ ~ ~ ~ ~ ~ ~ ~ ~ ~ ~ ~ ~ ~ ~~ ~ ~~~~~~~~~~~~~~~-
This document has arest,ricted distribution and may be'used by recipientsonly in the performance of th*L o6flcial- juties,~ I'ts -contents may not otherwfsebe disclosed without World .,'k auth&iain0k a ii
0 ~ ~ ~ ~ ~ ~ .,D..
i - . . . - . .i.
Pub
lic D
iscl
osur
e A
utho
rized
Pub
lic D
iscl
osur
e A
utho
rized
Pub
lic D
iscl
osur
e A
utho
rized
Pub
lic D
iscl
osur
e A
utho
rized
Pub
lic D
iscl
osur
e A
utho
rized
Pub
lic D
iscl
osur
e A
utho
rized
Pub
lic D
iscl
osur
e A
utho
rized
Pub
lic D
iscl
osur
e A
utho
rized

CURRENCY EOUIVALENTS
Before November 15. 1978 US$1.00 Rp.415
Annual Average 1979-88
1979 US$1.00 - Rp.623
1980 US$1.00 - Rp.627
1981 US$1.00 - Rp.6321982 US$1.00 - Rp.661
1983 US$1.00 Rp.909 la
1984 US$1.00 - Rp.1,026
1985 US$1.00 - Rp.1,111
1986 US$1.00 - Rp.1,283 /k1987 US$1.00 - Rp.1,644
1988 US$1.00 - Rp.1,686
1989 US$1.00 - Rp.1,770
1990 US$1.00 - Rp.1,843
May 6. 1991 Us$1.00 - Rp.1,941
FISCAL YEAR
Government - April 1 to March 31
Bank Indonesia - April 1 to March 31
State Banks - January 1 to December 31
/a On March 30, 1983 the Rupiah was devalued from US$1.00 - Rp.703 to
US$1.00 - Rp.970.
b On September 12, 1986 the Rupiah was devalued from US$1.00 - Rp.1,134
to US$1.00 - Rp.1,644.

FOR OFFICIAL USE ONLY
TITLE : Indonesia: Developing Private Enterprise
COUNTRY : Indonesia
REGION : Asia
SECTOR : Country Economic
REPORT TYP CLASSIFICATION mlm LANGUGE
ERA Official Use 05/91 English
PUBDATE : May 1991
ABSTRACT : This report describes Indonesia's efforts to build a morediverse and robust economy by implementing economicpolicieE and structural reforms intended to encourage thesound development of private enterprise. Chapter 1reviews progress to date in terms of economic performanceand living standards and identifies the ongoingchallenges in ensuring a healthy environment for adynamic private sector. These challenges includecontinued prudent macroeconomic management (Chapter 2),further reform of the structure of incentives,regulations and laws (Chapter 3), strengthening thefinancial system (Chapter 4), improving the publicsector's ability to complement and support privateenterprise (Chapter 5), and ensuring widespreadparticipation in the benefits of private sector growth(Chapter 6).
This document has a restricted distribution and may be used by recipients only in the performanceof their official duties. Its contents may no. otherwise be disclosed without World Bank authorization.

- -
INDQNESIAt DEVELOPING PRIVATE ENTERPRISE
Table of Contents
EXECUTIVE SUMMARY . . . . . . . . . . . . . . . . . . . . . . . . vii to xv
CHAPTER 1 - DEREGULATION AND THE PRIVATE SECTOR RESPONSE . . . . . 1
A. Introduction . . . . . . . . . . . . . . . . . . . 1
B. Policy Reforms for Private Sector Development . . 1The Private Sector . . . . . . . . . . . . . . 2Policy Environment . . . . . . . . . . . . . . 2
C. Effects of Policy Reforms . . . . . . . . . . . . . 4Macroeconomic Performance . . . . . . . . . . . 4Structural Change . . . . . . . . . . . . . . . 6Non-oil Manufacturing . . . . . . . . . . . . . 7Agriculture .... . . . . . . . . . . . . . . 13Financial Sector . . . . . . . . . . . . . . . 17Employment, Incomes and Poverty . . . . . . . 20
D. The Tasks Ahead .22
CHAPTER 2 - A MACROECONOMIC FRAMEWORK FOR GROWTH WITH STABILITY 25
A. Introduction . . . . . . . . . . . . . . . . . . 25
B. Recent Economic Developments ... . . . . . . . . 25Background .... . . . . . . . . . . . . . . 25Economic Developments During 1990/91 . . . . . 27
C. A Macroeconomic Strategy and Policy Framework forthe 1990s .... . . . . . . . . . . . . . . . 34
This report was prepared by a team led by James Harrison. The principalauthors were Donald Hanna, Vladimir Konovalov, Kyle Peters, Nicholas Prescottand Dennis Whittle. Sadiq Ahmed and Swati Ghosh made major contributions.Yasmine Hamid prepared the Statistical Annex and, together with Cyrus Talati,provided statistical support. The report also draws on background inputsprepared by Dipak Dasgupta, George Fane (c-^nsultant), David Hawes, GordonHunting, Andres Liebenthal, Samuel Lieberman, David Mead, A. Shanmugarajah,Tray Sinha, and Vinaya Swaroop.

- ii e
Page Ng.
D. Medium-Term Macroeconomic Projections . . . . . . . 38Growth Prospects . . . . . . . . . . . . . . . 38External Balance . . . . . . . . . . . . . . . 39Internal Balance . . . . . . . . . . . . . . . 43Sources of Growth and Implications for
Employment . . . . . . . . . . . . . . . . . 44Risks and Uncertainties . . . . . . . . . . . . 46
E. Public Resource Mobilization . . . . . . . . . . . 48Central Government's Non-oil Tax Effort . . . . 48Local Government Taxes . . . . . . . . . . . . 50
F. External Borrowing Pnd Debt Management . . . . . . 51
Chapter 3 - THE FRAMEWORK OF INCENTIVES. REGULATIONS AND LAWS . . 57
A. Introduction . . . . . . . . . . . . . . . . . . . 57
B. Trade Policy and Domestic Regulations . . . . . . . 57The Changing Pattern of Price Incentives . . . 57Directions for Future Reform . . . . . . . . . 64
C. Domestic Regulations . . . . . . . . . . . . . . . 66Domestic and Foreign Investment . . . . . . . . 66Labor Regulations . . . . . . . . . . . . . . 67Land Laws and Regulations . . . . . . . . . . . 68
D. The Legal Framework .. 68Companies Law .. 69Access to Legal Information . . . . . . . . . . 70Implementation .. 70
E. The Framework of Environmental Incentives . . . . . 70
CHAPTER 4 - THE STRATEGIC ROLE OF THE FINANCIAL SECTOR . . . . . . 75
A. Introduction .... . . . . . . . . . . . . . . . 75
B. The Role of the Financial System in PromotingPrivate Sector Development . . . . . . . . . . . 75
. Banking Performance in Promoting Development . . . 76Asset Growth .... . . . . . . . . . . . . . 76Maturity Structure . . . . . . . . . . . . . . 77Credit Allocation and Risk . . . . . . . . . . 78
D. Ensuring a Sound Financial System . . . . . . . . . 83Strengthening Prudential Supervision . . . . . 84Improving the Legal and Accounting Framework 87Technical and Managerial Expertise inFinancial Intermediaries . . . . . . . . . . 88
Improving the Depth and Diversity ofFinancial Instruments . . . . . . . . . . . . 89

* iii -
Rage No.
CHAPTER 5 - PUBLIC SECTOR SUPPORT FOR PRIVATE SECTOR DEVEWLPMEk.% 93
A. Changing Role of the Public Sector . . . . . . . . 93
B. Public and Private Provision of Infrastructure . . 94Introduction .... . . . . . . . . . . . . . 94Electric Power . . . . . . . . . . . . . . . . 96Telecommunications . . . . . . . . . . . . . . 97Transport .... . . . . . . . . . . . . . . . 99Water Resources . . . . . . . . . . . . . . . . 101
C. Efficient Demand Management for InfrastructureServices .... . . . . . . . . . . . . . . . . 103Introduction .... . . . . . . . . . . . . . 103Electric Power . . . . . . . . . . . . . . . . 103Telecommunications . . . . . . . . . . . . . 104Transport .... . . . . . . . . . . . . . . . 104Water Resources .... . . . . . . . . . . . . 105
D. Public Expenditure Priorities for InfrastructureExpansion .... . . . . . . . . . . . . . . . 106Introduction .... . . . . . . . . . . . . . 106Electric Power . . . . . . . . . . . . . . . . 107Telecommunications . . . . . . . . . . . . . . 108Transport .... . . . . . . . . . . . . . . . 109Water Resources ............... . 114
E. Recent Developments in Public Sector Management . 112Introduction .... . . . . . . . . . . . . . 112Public Enterprise Reform . . . . . . . . . . 112Civil Service Reform . . . . . . . . . . . . . 114
CHAPTER 6 -ENSURIN WIDESPREAD PARTICIPATION IN THE BENEFITSOF ECONOMIC GROWTH .... . . . . . . . . . . . . 117
A. Introduction .......... ............... . . . . i17
B. Trends in the Distribution of Growth . . . . . . . 117
C. Recent Government Efforts to EnsureEquitable Growth . . . . . . . . . . . . . . . 121
D. Level Playing Field Initiatives . . . . . . . . . . 122
E. Fiscal Policy Measures . . . . . . . . . . . . . . 128
ANNEX 1 - RECENT ECONOMIC DEVELOPMENTS . . . . . . . . . . . . . 131
ANNEX 2 - NOTE ON THE RESULTS OF THE 1990 CEJSUS . . . . . . . . 149
ANNEX 3 - TEE EXTERNAL ENVIRONMENT . . . .. . . . . . 151
ANNEX 4 - DEFINITIONS OF VARIOUS MEASURES OF TRADE PROTECTION . 155

- iv -
P-ap No.
STATIST'ICAL ANNEX . . . . . . . . . . . . . . . . . . . . . . . . . 157
MAP
Text Tables
Table No. Page No.
Chapter 1
1.1 Key Macroeconomic Indicators . . . . . . . . . . . . . . 51.2 Shares of GDP bv Industrial Category: 1983-1990 . . . . . 71.3 Significance of O'2 in the Economy 1981/82-1990/91 . . .1.4 Performance of Industrial MLEs in Indonesia:
Selected Periods .. 101.5 Industrial Output, Exports, Imports, by Factor
Intensity: Selected Periods . . . . . . . . . . . . . 111.6 Effective Protection in Indonesia . . . . . . . . . . . . 121.7 Shares of Industrial Value Added and Employment by
Region-Selected Years . . . . . . . . . . . . . . . . . 141.8 Growth in Agriculture 1975-1990 . . . . . . . . . . . . . 151.9 Agriculture Exports . . . . . . . . . . . . . . . . . . . 171.10 Indonesia: Structure and Growth of the Financial
Sector, 1982-90 .. 181.11 Trends in Real Wages, 1983-90 . . . . . . . . . . . . . . 21
h.apter 2
2.1 Key Macroeconomic Indicators . . . . . . . . . . . . . . 262.2 Balance of Payments, 1986/87-1990/91 . . . . . . . . . . 292.3 Central Government Budget, 1986/87-1991/92 . . . . . . . 332.4 Comparative Domestic Sales Prices for Petroleum
Products, 1990/91 . . . . . . . . . . . . . . . . . . . 382.5 Projections of Key Macroeconomic Indicators . . . . . . . 402.6 BalanLe of Payments Projections, 1990/91-2000/01 . . . . 412.7 Non-Oil Export Growth Projections . . . . . . . . . . . . 422.8 Savings-Investment Balances, 1981-2000 . . . . . . . . . 442.9 Growth and Composition of GDP, 1984-2000 . . . . . . . . 462.10 Tax Compliance Indicators . . . . . . . . . . . . . . . . 492.11 Actual and Potential Revenue of Main Categories of
Taxes, 1988/89 . . . . . . . . . . . . . . . . . . . . 492.12 External Capital Requirements and Sources . . . . . . . . 522.13 Medium - and Long-Term Debt Indicators, 1988-2000 . . . . 55
Chapter 3
3.1 Impact of Reform Packages on Import LicensingCoverage Since 1986 .59
3.2 Changes in the Tariff Schedule Since 1985 . . . . . . . . 593.3 Protection in Broad Economic Sectors, 1987 and 1990 . . . 613.4 Protection of Selected Agricultural Products . . . . . . 63

Page 12o,Chaoter 4
4.1 The Indonesian Stock and Bond Market, 1986-90 . . . . . 774.2 Commercial Bank Maturity Structure . . . . . . . . . . 784.3 Sectoral Shares in Credit and GDP . . . . . . . . . . . 794.4 Loan Loss Reserves and Provisions . . . . . . . . . . . 814.5 Bank Capital Adequacy . . . . . . . . . . . . . . . . . 82
Table No. Page No.
Chalptr 5
5.1 Power Demand auid PLN Sales in Java-Bali . . . . . . . . 965.2 PLN Investment and Financing Plan . . . . . . . . . . . 1075.3 PERUMTEL Development Plan . . . . . . . . . . . . . . . 1085.4 PERUNTEL Investment and Financing Plan . . . . . . . . 109
Cha2ggr 6
6.1 Expenditure Distribution, 1970-1987 . . . . . . . . . . 1186.2 Regional Distribution of Agriculture and Industry, 1988 120
Fig-ures
Fig=r No. Page No.
5Chapter 1
1.1 Non-oil & Oil Trade to GDP Ratios . . . . . . . . . . . . 91.2 Size Distribution of Industry 1986 . . . . . . . . . . . 101.3 Financial Assets .19
Chapter 2
2.1 Trends in Non-oil Trade .... . . . . . . . . . . . . . 282.2 Trends in Interesc Rates and Reserves . . . . . . . . . . 322.3 Trends in Monetary Aggregates . . . . . . . . . . . .32
Boxes
box No. Paae No.
Cha2&eK 1
1.1 Policy Reforms, 1983/84-1990/91 . . . . . . . . . . . . . 3
Chaoteor 3
3.1 Effects of the Clove Trading Monopoly . . . . . . . . . . 64

- vi -
ChaRt.e 5
5.1 Policy Framework for Private Sector Participation . . . 95
Chapter 6
6.1 Distributional Effects of Rattan Trade Policy . . . . . 1246.2 BAPEKSTA: Maintaining an "Anrus Length" Relationship
with the Private Sector . . . . . . . . . . . . . . 127

- vii -
EXECUTIVE SUMMARY
DEVELOPING PRIVATE ENTERPRISE
(i) As oil prices collapsed in the first half of the 1980s,Indonesia began a series of fundamental reforms to restructure the economy toreduce dependence on oil, then the source of 80% of export earnings and 70% ofbudget revenues. The Government realized that rapidly building a more diverseand robust production structure required that the energies of Indonesia'sbusinessmen, farmers and traders be unleashed to seize profitableopportunities to expand production and create new capacity in areas whereIndonesia could compete in the world market.
(ii) Two policy thrusts supported this strategy. First,macroeconomic policies restrained domestic demand through an austere monetaryand fiscal stance and established export competitiveness through two largediscrete devaluations. Second, structural reforms started to dismantle theweb of regulatory barriers and interventions that hampered competition andprivate initiative. Both sets of policies encouraged a more outward-orientedeconomic structure. This report documents the impact of this strategy andthen sets forth an agenda for sustaining and improving on what has beenachieved.
(iii) Chapter 1 provides evidence that this strategy is succeeding.The private sector has responded with rapid increases in output, particularlyin non-oil manufacturing and non-oil exports, sharply reducing dependence onoil. In exploiting the opportunities created by the reforms, producers firstused existing capacities more fully and reoriented them toward the exportmarket. More recentlv, private investment has increased sharply, creating newcapacity to sustain growth in non-oil output and exports into the future. Thederegulated financial sector has helped ensure a rapid flow of funds fromsavers to these investors, speeding the supply response. The evidencesuggests that production and exports have shifted into areas that makeproductive use of Indonesia's large pool of labor and natural resources. Moreimportantly, the strong growth in the non-oil economy created productive, newjob opportunities that reduced unemployment, raised real wages, increased realincomes and consumption, and contributed to a reduction in poverty.
(iv) The strong private sector supply response is already evidenteven though the impact of some reforms is only beginning and others are notyet complete. This response will support Indonesia's fundamental objective ofgenerating a pace and pattern of growth that will reduce poverty and raiseliving standards widely. Sustaining the dynamism of the private sector intothe 1990s will bring a new set of policy challenges:
* maintaining macroeconomic stability through the coordinated useof monetary, fiscal and exchange rate policies;
* accelerating the ongoing reforms in the framework ofincentives, regulations and laws to support non-oil exports andprovide greater competition on a level playing field;

- viii -
* strengther,ing mechanisms for managing risks in the financialsystem, especially prudential regulations and stpervision ofintermediaries to ensure continued sound growth;
* improving the ability of the public sector to complement andsupport private sector grewth, particularly in providingessential infrastructure services; and
* ensuring a widespread participation in the benefits of privatesector growth.
To sustain an adequate rate of growth while meeting these policy challengeswill call for substantial resources, including continued high levels offinancial support from the donor community. This report focuses on how thesechallenges can be met.
Growth with Stability
(v) To make substantial progress in raising living standards andreducing poverty, Indonesia should seek to maintain 6-7% annual growth in thenon-oil economy, or about 5-6% annual growth in GDP. This would imply, givenIndonesia's annual population growth of just under 2%, per capita GDP growthin the 3-4% p.a. range. Chapter 2 outlines a macroeconomic framework forrealizing such growth, with primary reliance on the private sector. Theprivate sector's potential contribution is demonstrated by the economy'srecent rapid growth: between 1987 and 1990, the non-oil economy grew by about7.8% p.a., with private fixed investment growing at 15.4% p.a.
(vi) Achieving 6-7% growth in the non-oil economy while maintainingmacroeconomic stability will call for prudent macroeconomic management.Developments during 1990 demonstrate how aggregate demand could expand,generating pressures on the balance of payments and inflation. Monetarypolicies in late 1989 and early 1990 reduced interest rates and contributedstrongly to a rapid expansion of credit to the private sector (up 58% in1990). The economy grew at a brisk pace, driven by a 20% expansion in privatesector investment and a surge in domestic liquidity. This resulted in a sharpincrease in aggregate demand, which was reflected in an acceleration in thedemand for imports and pressure on domestic prices, especially for non-tradedgoods. The rapid increase in non-oil imports, combined with a slowdown innon-oil export growth, caused the current account deficit to widen from 2% ofGDP in 1989/90 to 3.8% in 1990/91, despite the windfall from temporarily high($23/bbl) oil prices. The deceleration in non-oil exports resulted from threefactors--a substpntial drop in prices of most of Indonesia's primary commodityexports, several special factors limiting exports of particular products (themost notable being the sawn timber export tax), and the high domestic demandfor some products (e.g., cement) reducing quantities available for export.Despite the slowdown, the real growth of non-oil manufactured exports was arobust 15%. The rapid growth in private investment has been the main forcebehind the rise in non-oil imports, with imports of capital goods rising by50% and accounting for two-thirds of the total increase in imports. Much ofthis investment is expected to be in export capacity, in line with the rapidexpansion of profitable opportunities opened up by the structural reforms.Such investment should generate non-oil exports and improve the balance ofpayments over time. In this sense, the pressure on the current account

- ix -
represents the success of the deregulation policies in stimulating a widearray of investment opportunities. It is a success, however, that has createddemand pressures that need to be managed carefully to ensure continued growthwith stability.
(vii) A decline in foreign exchange reserves in the first half of1990 and early signs of higher inflation, provided a clear signal of thewidening non-oil trade gar and emerging demand pressures. The Governmentresponded promptly by tightening monetary 22ll&y, primarily by reducingsubsidizod, directed credits (liquidity credits) refinanced by Bank Indonesia(BI) and by increasing interest rates on Bank Indonesia Certificates (SBIs).This policy stance resulted in higher leposit and lending rates and arebuilding of official reserves in the second half of the year. Growth incredit to the private sector remained high, in part due to substantialoffshore borrowing by commercial banks, converted into rupiah through BI'sswap facility. Subsequent adjustments in the mechanism for setting the swaprate reduced the incentives for offshore borrowing. This, combined withtighter international capital markets, slowed the expansion bf commercial bankborrowing by the end of 1990. The Government took major additional steps inFebruary and March 1991 to tighten and improve the effectiveness of monetarypolicy. Following instructions from the Government, as the owner, publicenterprises converted about Rp.10 trillion of their deposits in Commercialbanks into SBIs. This was combined with a partially offsetting purchase ofcommercial bank debt instruments (SBPUs) by BI. This maneuver tightenedliquidity, caused real interest rates to rise into the 15-18% range, and senta clear signal to the business community that BI would seek to maintain atight monetary policy. BI also tightoned limits on use of swaps by banks anddiscorstinued short maturity swaps. In fiscal pol=c, the Government adopted acautious approach to the use of the windfall oil revenues that accrued during1990/91 following the Gulf crisis. The Government limited the impact of thewindfall on domestic demand art used it mainly to improve the budget balance,creating reserves against revenu, shortfalls in future years. Nevertheless,this prudent approach was insufficient to contain the demand pressuresgenerated during the year and reduce the non-oil trade gap. The challenge forthe coming year will be to put macroeconomic policies in place that willreduce demand pressures and return the economy to a sustainable growth path.
(viii) The monetary adjustments introduced in February 1991 are acentral element of the necessary policy adjustments. Trends in monetaryaggregates will need to be watched closely over the year to ensure themonetary stance is having the desired effect and that an adequate reservecushion is maintained. Given Indonesia's open capital account, the impact ofthese important monetary measures on demand is likely to be offset over timeby inflows of capital. Moreover, maintaining real interest rates at too higha level for an extended period could have unintended negative effects on thefinancial system and the economy at large. Consequently, these measures needto be supported by fiscal policies designed to contain the growth of aggregatedemand. Given the need to protect priority infrastructure investments tosupport private sector development and expenditure programs to meet the basicneeds of the poor, improvements in the fiscal balance could concentrate onrevenue mobilization measures, subsidy reductions and reassessment of largeinvestment projects other than essential infrastructure. Revenue mobilizationmeasures could seek continued improvements in tax administration combined withselective increases in those taxes unlikely to affect the poor. Removal of

subsidies and price adjustments could help improve the budget balance as wellas promote conservation and more efficient use of resources. As Indonesia'sexperience in 1983 indicates, a careful review of major projects includingthose of public enterprises and joint ventures, could identify opportunitiesfor short term savings at little long term cost. At the same time, continuedderegulation (discussed below) combined with appropriate exchange rateManaggement should maintain the incentives for non-oil exports, while measuresto conserve energy would sustain net oil exports.
(ix) As outlined in Chapter 2, the implementation of such policieswould be consistent with GDP growth of 5 to 6% over the next few years,somewhat below what has been achieved recently, but still above the REPELITA Vtarget of 5%. These policies would improve macroeconomic balances and wouldpreserve foreign exchange reserves and borrowing capacity to deal withpotential downside risks.
The Framework of Incentives. Regulations and Laws
(x) The surge in investment and imports and the deceleration innon-oil exports over the past year have added new urgency to structuralreform. To encourage exports, the remaining export barriers need to becarefully reexamined and reduced. Removing barriers to trade and entry isessential to ensure that the rapid surge in private investment flows intoareas in which Indonesia has a comparative advantage. Otherwise the economywill be burdened with high-cost enterprises that drain its vitality. Removalof these barriers will also increase competitive pressure, encouraging greaterefficiency. This is particularly important to prevent large firms fromexercising market power at the expense of rest of the economy. Whileagriculture is generally much less protected than manufacturing, there aresignificant exceptions caused by NTBs and export restrictions that could limitthe sector's ability to adjust flexibly to changing patterns of demand andsupply. The main directions for policy reforms in trade and investmentregulations include: reassessing and rationalizing export restrictions;removing the NTBs remaining in manufacturing (including agroindustries), andreassessing NTBs in agriculture; continuing tariff reforms, lowering thehighest rates into the 20-30% range; avd reducing the scope of the negativelist for investments and the list of products reserved for small scaleindustry.
(xi) A modern corporate legal framework is also essential for thesound, long-term development of the private sector. Much of the currentcommercial legal framework dates back to early colonial times. Making atransition to a rew framework will be a complex task, but one that offersmajor benefits: lower transactions costs by standardizing contracts andincreasing access to essential information; reduced barriers to entry andgreater mobility of private investment; predictable sanctions for infringementof rules; and a transparent, equitable mechanism for _- forcement of contractsand dispute settlement. Over the past year, an interministerial working grouphas been established to identify priorities and approaches to legal reform.The priorities indicated include: a framework of company laws, accounting andaudit requirements, and capital market regulations; strengthening courts andarbitration boards to deal effectively with the specialized needs o-commercial legal decisions and dispute settlement; and improved flows of legalinformation.

v xi -
(xii) Efficient, sustainable private sector development will requirea framework of environmental incentives and regulations that causes firms totake increasing account of the environmental costs that their behavior imposeson other firms and society at large. The three main areas for improving theframework of environmental regulations and incentives in Indonesia are waterand air pollution on Java, forestry management on the outer islands, and landuse management and planning nationwide. Progress has been made inestablishing an environmental agency (BAPEDAL), in initiating a process ofenvironmental impact assessments for all public and private sector projectsand in issuing industrial pollution standards. The main priorities now are tobuild the technical and implementation capacity of BAPEDAL and relatedagencies, and to develop market-based incentives to promote environmentalgoals, including pricing policies for energy and water.
Strengthening the Financial System
(xiii) The financial system has expanded rapidly following successivestages of deregulation that have made the system competitive, market-orientedand dynamic. Private sector intermediaries have shown especially stronggrowth. The system has responded to the financing .eeds of privateenterprises with a rapid increase in bank loans and equity finance from thestock market. At the same time, the large increase in the number of financialintermediaries and in the volume of their operations has strained theGovernment's regulatory capacity. Moreover, the intermediaries themselveshave had to manage unprecedented asset growth while lacking sufficient trainedstaff and well-developed internal controls, raising concerns about assetquality and risk in some cases. Chapter 4 analyses these issues andidentifies several priority areas for strengthening the financial sector'scapacity to manage risk, establishing a sound framework for future growth:
* deveiaRing the legal and regulatory framework, especially thelawo. now under preparation on banking, pensions, insurance andthe central bank, but also including commercial law andaccounting standards and reporting requirements;
* systematic supervision, including continued development of BI'ssupervision capacity and coordination with the Ministry ofFinance; further development of capital adequacy norms andother standards; improvements in the quality and availabilityof data on financial institutions and businesses; anddevelopment of private credit rating agencies to reinforce BI'sprudential supervision avd help private investors make informedchoices;
* strengthening technical and managerial caRacitg, in privatebanks through their own training programs and flexible hiringof expatriate staff to overcome shortages, and in the mainsupervisory agencies (BI, Ministry of Finance and BAPEPAM)through intensive training, expansion of staff, and improvedcompensation to develop a highly skilled cadre of experiencedstaff; and
* evolving new instrumen, including securitization of smallloan portfolios as an efficient way to increase financial flows

- xii -
to small firms, more flexible use of the SBI to supportvariable interest rate instruments, and the continued phasingout of liquidity credits to cr3ate more scope for market-basedterm lending instruments.
Public Sector Support for Primate Enterprise
(xiv) The Government's strategy to increase reliance on the privatesector, by removing direct bureaucratic controls and relying increasingly onindirect instruments and market forces to meet the needs of the economy,implies important changes in the public sector's role and effectiveness. Itsrole will shift from one that uses direct interventions to one that providesan enabling environment for sound privatA sector development. Such a shiftinvolves a broad agenda of issues, raT& v across macroeconomic and sectoralpolicy formulation, development and xr rntation of the framework ofincentives, regulations and laws, e-.i - ,vision of public goods and servicesthat generate the human capital aned 'al infrastructure essential forcontinued development of the private ,-;tL. From this broad agenda, Chapter5 focuses on physical infrastructure sert%es--power, telecommunications,transport and water supply--as critically important public sector activitiesin which supply constraints could slow the pace and efficiency of privatesector growth. Four main areas for action emerge from this analysis:
- there are high Driority needs for additional infrastructurecaRacity, particularly in power and telecommunications, toprovide an adequate level and quality of service to supportsustained development of the private sector;
- there is scope for improving the efficiency of supplv fromexisting capacity, drawing in some cases on private sectorcapacities. Important examples of measures to improve serviceefficiency include: increasing the operational autonomy andstrengthening organization and management of the publicsuppliers such as PLN (the national power utillty) and PERUNTEL(the national telecommunications utility); greater coordinationof PLN's grid with private captive generation capacity; andopening up selected telecommunications services to competitionwith the private sector;
* selective use of the private sector to finance, build and/oroperate infrastructure services may present importantopportunities to ease infrastructure supply constraints byaugmenting public sector financial and implementation capacity.Such arrangements can be complex and need to be approachedcautiously, however, to ensure that the public interest isserved and that the service provided is efficient and cost-effective. It will be important, therefore, to develop aregulatory framework and institutional procedures for designingand negotiating such arrangements and supervising theirimplementation; and
* anRrooriate gricing policies have an essential role to play inmanaging the demand for, and efficient allocation of,infrastructure services and in mobilizing the resources to

* xiii i
expand capacity as needed. More frequent, systematicadjustments in tariffs, especially for electricity, can avoidthe shocks that large, long-delayed increases place on usersand the financial stress such delays cause the utilities.Moreover, appropriate pricing policies for energy and water,for example, can also have strong positive environmentaleffects.
(xv) Meeting the needs for improved infrastructure services anddealing with the broader implications of increased deregulation for publicsector management highlight the importance of basic institutional reforms inthe public sector. Chapter 5 also discusses two important areas of ongoingreform in the public sector: public enterRrise reforms and civil servicereforms. The public enterprise reforms seek to increase efficiency of theenterprises providing essential public services while gradually divestingactivities that no longer need to remain in the public sector. The civilservice reforms seek to use an extensive program of job analysis andrestructuring to reorient the public sector to deal effectively with itschanging role in supporting private sector growth. Reforms in both publicenterprises and the civil service are complex and implementation will need tobe phased over time. Concentrating efforts on particular enterprises andministries would help maintain progress and develop experience that wouldsustain the reform efforts.
Ensuring Widespread ParticiRation
(xvi) A basic objective of the Government in developing privateenterprise has been to widen opportunities for the people at large by reducingvarious controls and barriers to entry and providing an appropriate incentivestructure. The data reviewed in Chapter 6 indicate that the benefits ofgrowth so far have been widespread, with increases in employment, real wages,and per capita incomes and consumption, resulting in a decline in theincidence of poverty. Moreover, there appears to have been an improvement inincome distribution up to 1987 (the most recent year for which data areavailable). It is important to recognize, however, that these very positiveresults will not come automatically in the future. They depend critically onthe pace and pattern of growth in the economy, which in turn depend onresource availability and the policy and regulatory framework set by theGovernment.
(xvii) To permit a widespread sharing in the benefits of growth, it isnecessary first for the economy to generate that growth. Chapter 2 charts astrategy for growth rapid enough to raise real per capita GDP from its presentlevel of about US$500 to over US$/00 by the end of the decade. For su2hgrowth to generate continued improvements in the living standards of the poorwill call for the sustained implementation of policies along two broaddimensions:
measures that promote a level Rlaying field so that firms facethe same types of competitive pressures and opportunitieswithin a transparent framework of incentives that continues toencourage a relatively labor-intensive pattern of growth.Important types of measures that support this kind of

* xlv -
environment include: (a) trade and investment deregulation toreduce distortions and entry barriers and to ensure largerfirms face effective competition to prevent abuse of marketpower; (b) strengthening the legal framework and accounting anddisclosure regulations; (c) improving access to credit forsmaller, newer firms; and (d) developing "arm's length"procedures for contracts, joint ventures, divestitures andother business relationships between the Government and theprivate sector; and
expenditure policies that provide for effective programs thatenhance the opportunities, productivity and quality of life ofthe poor, including especially human resource development,agricultural services, and local infrastructure development;and tax policies that improve tax administration and complianceand increase revenues from property taxes and the VAT on luxurygoods.
grow-th ProsRects and Resource Needs
(xviii) Prudent macroeconomic management, combined with continued,consistent implementation of Indonesia's reform agenda, will enable Indonesiato meet the emerging challenges outlined above and to continue a 6-7% annualgrowth in non-oil GDP in the medium term. Such growth would permit employmentto continue to rise rapidly enough to absorb the growing labor force at higherlevels of productivity and would enable continued reductions in poverty.Under this scenario, the non-oil current account balance would improvesubstantially during 1991/92 and in the medium term, reversing the trend ofthe past two years. Decliaing world oil prices and higher domestic oilconsumption, however, wlll lower net oil exports and offset this gaininitially, leading to a modest increase in the overall current account deficitin 1991/92 before it resumes its downward trend. External debt serviceindicators would rise slightly in 1991/92, reflecting the substantial increasein foreign borrowing by the private sector in 1990/91, which offsets acontinued decline in the public debt burden. With careful debt management andcontinued prudent borrowing, Indonesia's total debt burden would continue toease beyond 1991/92. This growth strategy, however, will continue to requiresubstantial resources to finance the rapid expansion of the private sector,especially in non-oil export production. The rapid growth of the privatesector over the past several years has also strained infrastructure capacity,generating substantial investment needs following the period of budgetausterity in the mid-1980s. Thus continued high levels of foreign capitalinflows will be needed as well as a sub,stantial increase in domestic resourcemobilization.
(xix) Much of the increase needed in foreign capital inflows willcome from higher levels of private borrowing and direct investment, continuingthe trends evident in 1990/91. Despite the larger role of private capitalflows, public medium- and long-term (MLT) borrowing will also need toincrease. The increase in public borrowing would be mainly import-relatedcredits and untied commercial credit. Nevertheless, disbursements of officialassistance would need to be about US$3.8 billion in 1991/92, the same level asin 1990/91. Provided an appropriate mix of assistance can be identified, andcommitments outside the IGGI remain at the same level, the necessary level of

xv -
IGGI disbursements could be obtained in 1991/92 from a commitment level ofUS$4.7-4.8 billion. The priorities for this assistance are mainly in twoareas: (i) investments in infrastructure and human resource development tosupport private sector development and economic growth; and (ii) investmentsin social and basic services to reduce further the incidence of poverty. Inaddition, given the investment needs of the private sector, it will beimportant to use mechanisms such as two-step operations and financial sectoroperations to channel resources to the private sector and to strengthen thefinancial system.
(xx) As noted, achieving the recommended level of disbursements willdepend on an appropriate mix of official assistance. An increase in projectaid disbursements can help, but in order to reach the recommended level ofofficial disbursements, a substantial share of new commitments will need to bein the form of relatively fast-disbursing operations, including sector loansand two-step operations. This level and mix of assistance will enableIndonesia to pursue its trade and other structural reforms with confidence,while it seeks to improve its external and internal macroeconomic balances.Over the medium term, as the current account deficit resumes its downwardtrend and the pipeline of project finance builds up, the share ofquick-disbursing finance could decline. Given the substantial uncertaintiesin the world economic outlook, including the possibility of oil pricesdeclining more than projected, Indonesia will need to maintain its substantialforeign exchange reserves and borrowing capacity. Moreover, the donorcommunity should be prepared to respond flexibly to support Indonesia'sdevelopment efforts in the event of adverse external shocks.

CHAPTER
DEREGULATION AND TIlE PRIVATE SECTOR RESPONSE
A. Introduction
1.01 Indonesia's policies for the private sector have dramrtically changedsince the early 1980s. The need to reduce the economy's dependence on oil andto tap the dynamic potential of the private sector provided the impetus forregulatory reform in Indonesia. The objectives of the reform strategy havebeen to promote efficiency and wider participation for the private sector ineconomic activities. This has been achieved by ensuring a more competitiveenvironment through lower barriers to entry for both domestic and foreignfirms and reform of public institutions (such as customs). The overallstrategy of deregulation has been supported by monetary, fiscal and exchangerate policies that managed domestic demand and established exportcompetitiveness. The economy has been re-oriented to a more outward--Jokinggrowth strategy. Major financial sector reforms have promoted the efficiencyof financial intermediation and the development of capital markets. Theeconomy has responded strongly to the Government's balanced adjustmentprogram, with the private sector taking the leading role.
1.02 The main focus of this Chapter is the supply response of the economyand the role of the private sector following deregulation. The expandedopportunities for the private sector in the economy are most noticeable in themanufacturing and financial sectors, where controls were initially the mostpervasive and deregulation has progressed furthest. The recent surge ininvestment in the private sector creates new opportunities and challenges. Itprovides Indonesia with the chance for impressive growth through the 1990s,but is also placing strains on the economy and on infrastructure. Ensuringthat investment is realized within a stable macroeconomic environment and isdirected towards productive activities are key challenges for the years ahead.This Chapter identifies the tasks ahead for policy making that are discussedmore fully in subsequent chapters. TIhase tasks include ensuring macroeconomicstability, further deregulation and legal reform, promoting a sound financialsystem, overcoming infrastructure bottlenecks and fostering widespreadparticipation in the benefits of growth.
B. Policy Reforms for Private Sector Development
1.03 The economy has responded strongly to the Government's balancedadjustment program. Macroeconomic balances improved, growth, investment andnon-oil exports increased substantially and the pace and pattern of growthenabled per capita incomes and consumption to rise and led to a significantreduction in the incidence of poverty. Fundamental structur'.l changes tookplace within the nor,-oil sector, and particularly manufacturing, providing themain engine of growth. Deregulation has prompted these changes andfacilitated a movement of resources towards those activities in whichIndonesia has a comparative advantage. In particular the manufacturing,agricultural and financial service sectors are either dominated by the privatesector or have exhibited dynamic changes following deregulation.

-2-
The Private Sector
1.04 The private sector accounts for the largest part of value-added inthe economy. It is estimated that about three quarters of non-oil economicactivity comes from the private sector. The vast bulk of this activity is bydomestic entrepreneurs. Foreign-owned firms account for only about 7-10% ofnon-oil GDP. Agricultural production has always been largely private,although the public sector is involved in estate crops and forestryoperations. In manufacturing, private firms have led the rapid expansion oftextiles and timber industries and their share of total manufacturing activityhas grown from about 82% in 1982 to 86% in 1990. Public enterprises areinvolved in food processing and capital-intensive activities such as basicchemicals, metals and cement. The public sector still accounts for themajority of activity in the financial sector, but its share has droppedsharply during the '.980s. The private sector dominates the construction,transport, trade and tourism and other services sectors.
Policy Environment
1.05 Policies towards the private sector have changed markedly in the pastdecade. For much of the 1970s and early 1980s the rapid increase in oilrevenues led to an expanded role of the public sector across large parts ofthe economy. The role of the public sector was seen to be important, amongother things, to balance the economic power of the large business groups, andto push industrial development into upstream and high-technology areas. Theexpanded role of the public sector, combined with a strong orientation towardthe domestic market and a philosophy of close guidance of the private sector,led to a proliferation of trade and investment restrictions. As a result, theregulatory environment for private sector activity became distorted and lesstransparent. The performance of supporting services, especially in thefinancial and transport sectors, was also constrained by regulatory controlsover competition and the dominance of public sector institutions.
1.06 Indonesia faced a sharp deterioration in the external environmentthat began in 1983, and intensified in 1986 due to declining oil prices andadverse currency fluctuations. The need to restore external balance whilerestructuring the economy to rely on less volatile sources of growth posed amajor challenge to macroeconomic policy making. The Government recognizedthat restructuring the economy was necessary to enable the private sector andnon-oil exports to play a much larger role in providing growth of employment,incomes and exports. The specific policy responses are summarized in Box 1.1and can be grouped under the following categories:
(a) Sound macroeconomic management based upon prudent monetary and fiscalpolicy. Budget austerity and more careful selection of projectssignificantly reduced the level of public investment, while taxreform measures boosted non-oil tax revenues and improved theefficiency of the tax system. Monetary policy was designed tocontain inflationary pressure and prevent capital flight. Theserestraints on domestic demand encouraged an outward orientation.

Box=1.J POLICY REFORMS, 1983184-1990191
Exchange rate - Rupiah devalued by 28X in March 1983.- Exchange rate made more flexible ince March 1983.- RupLah devalued by 31X in September 1986.- Nomnal exchange rate has depreciated against a falling US Dollar
ince September 1986, preventing appreciation of real effectiveexchange rate.
Fiscal nolLc, - Larbi capital- and import-intensive projects rephased in May 1983.- Major cutbacks La government real capital spending sinee 1983.- Tight control maintained since 1983 on the use of non-concestonal
import-related credits.- A major tax reform initiated, starting Ln January 1984.- Follow-up steps taken to strengthen tax administration,- Restraints on civil service employment and salaries.
Monetary andfinaeLal - A major financial reform initiated in June 1983, involvLng removal of
interest rate and credit ceilings for state bank operations andintroduction of nev inastruments of monetary control.
- A naw set of financial measures introduced in October and December1988, aimed at enha ncing financial sector efficiency and developingcapital markets.
- Improved monetary management to control lnflation.- Improved short-term monetary management to curb exchango rate
speculation.- Reduction in directed, subsidized credits starting in 1990.- Intense efforts to improve supervision of financial system, including
restructuring capital market regulations (1990).- Adopted new capital adequacy and provision standards in February 1991.
Trade policv - An across-the-board reduction in nominal tariffs implemented in March1985.
- Measures to provide Internationally-priced inputs to exportersannounced on May 6, 1986.
- Significant reduction in import licens1ng restrictions it.c:.edthrough a series of measures in October 1986, January and December1987 and November 1988.
- Steps taken in December 1987 to reduce the anti-export bias of tradepolicy by reducing regulatory restrictions for exporters.
- An across-the-board reduction in most nominal tariffs to a ceiling of40X in May 1990. The package also encompassed a further easing ofNTBs.
Othar regulatory reforms - Reorganization of customs, ports and shipping operations inApril 1985 to reduce freight costs and cut processing time.
- Steps taken through the May 1986, October 1986, January 1987 andDecember 1987 packages to reduce the investment and capacitylicensing requirements, relax foreign investment regulations, andreduce the role of the local content program.
- Substantial deregulation of maritim activities announced in November1988 to reduce costs and encourage private sector participation.
- Replacement of restrictive positive list of areas open for investmentwith short negative list in 1989.
- Initial steps towards Public Enterprise reform.- Deregulation extended to pharmaceutical and some agricultural
activities in the May 1990 package.

- 4 -
(b) ApproRriate exchange rate policy. Two major devaluations wereimplemented during the 1980s, and the flexibility of the exchangerate was increased through a more actively managed float. Inconjunction with prudent fiscal and monetary policies, these measuressupported significant real exchange rate depreciations that played akey role in boosting non-oil exports and reducing current accountdeficits.
(c) Improved incentives structure. Starting in 1985, the Governmentinitiated a series of trade and other regulatory reforms to supportdemand management policies and to enable a recovery of economicgrowth over the medium term. A key component has been several tradereform packages designed to make the economy more outward-looking.Complementary reforms have also been unuertaken in customs, ports andshipping operations. The investment process has been streamlinedwith the policy stance shifting from control to encouragement ofinvestment. These reforms are meant to increase competitive pressurein the economy, reducing opportunities for monopoly profit andrestrictions that had produced a 'high cost' economy.
(d) Reform of the financial system. Credit ceilings and interest ratecontrols on commercial banks were removed in 1983, increasing theflexibility of monetary management and improving credit allocation.A second round of financial measures was initiated in 1988, aimed atenhancing financial sector efficiency through easier entry andgreater competition and boosting capital markets. Reforms in 1990reduced the role of subsidized, directed credits and strengthened theframework for the capital market.
Tnese reforms have already begun to generate a strong supply response in theeconomy. This response is explored in the following sections.
C. Effects of Policy Reforms
1.07 Growth has picked up since the mid-1980s, partly due to the stronggrowth in non-oil exports. There has also been a marked increase in privateinvestment, and an even more rapid rise in inveatment approvals. Themanufacturing and banking sectors have grown particularly strongly. Thechange in the pattern of incentives resulting from both the macroeconomic andtrade/regulatory reforms has drawn resources into relatively labor-intensiveactivities in which Indonesia is competitive in the world market and this hasbeen the foundation for the strong supply response.
Macroeconomic Performance
1.08 Macroeconomic balances. The Government's fiscal, monetary andexchange rate management has been at the center of Indonesia's success inreducing internal imbalances and containing inflation (Table 1.1). Restraintson domestic demand combined with continued gradual nominal depreciations(about 5% p.a.) have preserved the competitive advantage of non-oil exportsachieved through the 1986 devaluation. The current account deficit wasbrought down to 2.6% by 1985 but rose again in 1986 when oil prices collapsed.

The current account deficit declined steadily through 1989/90, approaching 2%of GNP, reflecting a rapid growth of non-oil exports. As discussed in moredetail in Chapter 2, strong private sector investment demand drove a rapidincrease in non-oil imports in 1990/91. This, combined with slower non-oilexport growth caused a widening of the current account deficit. Indonesia'sdebt service ratio fell from a peak of 39.7% of exports in 1986 to 27.3% in1990 and it is projected to decline further in the medium-term. Theimplementation of cautious budgets, combined with strong non-oil revenuemobilization, caused th3 overall public sector deficit to decline from 3.8% in1986 to about 1% in 1989. In 1990 the overall public sector budget isestimated to be in surplus, reflecting windfall revenues from high oil pricesand also stronger than expected non-oil revenues. Budget austerity andappropriate monetary policy have contained inflation to less than 10% in theperiod since 1985.
Table 11k: RSY 1ACIOECONONIC INDICATORS JA(Growth rates. I p.a.)
1984 1985 1986 1987 1988 1989 1990Cest.)
Ecoonomic actlvityCDP 7.0 2.5 5.9 4.9 5.7 7.4 7.1Eon-oIl CDP 5.2 5.4 6.1 5.8 7.4 8.2 7.8
Fixed investment L517 -5 9 5 2L 6 Ll 10 "a1Public -7.2 1.2 -21.4 -7.7 11.4 6.8 9.6Prlvate -4.4 -12.3 10.9 10.1 9.7 16.8 19.9
nExtrnal tradcNon-oil exports 10.0 7.8 6.7 25.5 14.2 21.S 6.7Non-oil imports -8.7 -13.7 -14.7 5.5 8.0 18.9 25.4
Other indicatorcGNP/per capita 4.0 0.7 5.6 3.5 4.1 5.5 5.3Cons'uption per capita 2.0 1.6 2.5 2.0 2.5 4.0 6.0Current account/CIP (Z) -3.0 -2.6 -5.9 -2.6 -2.3 -2.0 -3.8Ien-oil exports/CODP (X) 8.1 8.6 8.7 10.0 11.1 12.3 12.7Eon-oil Imports/CDP (X) 18.9 17.1 13.7 12.7 12.9 13.7 15.3Domestic Inflation lk 9.1 4.7 5.8 9.6 9.3 6.3 7.9Debt servLce ratio (X) LI 21.3 24.6 39.7 34.8 34.4 31.6 27.3Overall budget balance (X CDP) 0.5 -3.0 -3.8 -2.8 -3.1 -1.3 1.8
LJ External trade and fiscal data are for fiscal years. Other indicators are for calendar years.L/ As meaured by consuer price inde (adjusted)./ Defined as the ratio of interest and amortisation payments of total MLT debt to exports of goods and
servLoes.
Soutees World Bank staff estimates.
1.09 Growth and trade. The effects of the Government's policies topromote private sector development are reflected clearly in growth in GDP andnon-oil exports. GDP growth averaged 5.5% p.a. between 1986-88 and hasaccelerated to 7.25% in the past two years. The non-oil sector has performedeven better and is growing at significantly higher levels since deregulationbegan in the mid-1980's. Non-oil exports have more than doubled fromUS$6.7 billion in 1986/87 to an estimated US$14.3 billion in 1989/90, anaverage increase of about 29% p.a. Much of this growth has come from adiversifying base of manufactured goods. Non-oil exports rose from 8.7% of

GDP in 1986 to 12.7% in 1990. The growth of non-oil exports slowed in 1990.Non-oil imports have also expanded in real terms, at a rate of about 14% p.a.on average over the period 1986 to 1990. Non-oil imports remained relativelyconstant as a share of GDP over the period 1986-89, but increased'ignificantly in 1990 partly due to a strong surge in private investment.
1.10 Investment. The deregulation measures together with soundmacroezonomic management, have encouraged a recovery of private sectorinvestment, which increased by 10.2% p.a. during 1986-88 and by 18.3% p.a.during 1989-90. This was a dramatic reversal of the stagnation experiencedduring earlier years. Much of the new investment has been directed towardsexport activities. There has been a marked change in the composition of fixedinvestment since deregulation commenced. Over the past 4 years the privatesector has accounted for about 60% of total fixed investment compared withabout 52% over the period 1975-83. This investment should be reflected in anincreasing share of the private sector in total economic activity over thecoming years. The positive effects of the Government's policies have had onprivate sector investment are further reflected in the recent surge inapprovals of both domestic and foreign private investment by the InvestmentAuthority (BKPMI. Domestic investment approvals rose by 34% in 1989 and over200% in 1990 to reach US$30 billion. Similarly after recording a sharp andsteady decline since 1983, foreign investment approvals in dollar termsincreased by 76% in 1987 and by a remarkable 300% in 1988. After a modestincrease in 1989, foreign investment approvals increased by 86% in 1990 toreach US$8.7 billion. There has been considerable investor interest across abroad range of manufacturing and service activities. Even if only part ofthese approvals are implemented, the figures indicate the widening productiveopportunities and pent up demand for investment in the economy.
Structural Change
1.11 Structural changes over the past decade are highlighted in Table 1.2.Over the period 1983-90 real GDP grew at an average of 5.8% p.a.. The non-oileconomy grew at an above average 6.6% p.a., a pace that caused its share ofGDP to increase from 78% in 1983 to 82% in 1990. The non-oil economyaccounted for the vast bulk of growth over the period. Both the traded andnon-traded goods sectors of the non-oil economy grew at roughly the samespeed. The non-oil traded goods sector increased its share of GDP from 34% in1983 to 35.8% in 1990. Within the non-oil traded goods sector, agriculture isstill the largest activity, although it has gradually declined in relativeimportance, having grown at 3.6% p.a. over the period. Agriculture nowaccounts for slightly less than one-fifth of GDP. However, agriculture is farfrom stagnant -- it is simply overshadowed by more rapidly expanding sectors.In particular, non-oil manufacturing has become the single most importantsource of economic growth for the economy. The sector grew by over 12% p.a.and accounted for about one-quarter of GDP growth over the period 1983-90.Given the high levels of investment in manufacturing over the past two years,and given the large volume of investment approvals, the sector is expected tobecome increasingly important in the economy.
1.12 The growing diversification of economic activity is seen in thedeclining relative importance of oil. Between 1983 to 1990 the oil sectorgrew at 2.7% p.a., with its share in GDP declining from about 22% to 18%. Theoil sector accounted for only 10% of GDP growth. The extent of the structural

transformation of the economy also may be seen in the trends highlighted inTable 1.3. Oil now contributes much less than half of budget revenues andtotal merchandise exports. Likewise the oil trade ratio (defined as the ratioof oil exports plus imports to GDP) declined continuously since the early1980's (see Figure 1.1). While the non-oil trade ratio also declined in thefirst half of the 1980s, it has recovered strongly since then. The risingnon-oil trade ratio indicates that deregulation clearly has led to anincreased importance of trade and a more open economy.
Table 1.2: SHARES OF GDP BY INDUSTRIAL CATECORYs 1983-1990(Constant 1983 priess)
Shares of CDP growth Rate (ann. avaj Contr. to GDP trowth1983 1990 1983-90 1983-90
(sat.)
Non-oil traded sector 34.0 35.8 6.6 39.7- Agriculture 22.8 19.7 3.6 13.3- Other mining 1.3 1.2 4.7 1.0- non-oil manufacturing 9.9 14.9 12.2 25.4
OilWLNG sector 22.3 18.2 2.7 9.5
Non-traded sector 43.7 46.0 6.5 50.8- Banking & finance 3.0 4.2 10.7 6.6- Electricity 0.4 0.6 12.6 1.1- Conatruction 5.9 5.7 5.3 5.3- Trade, hotels & restaurants 14.9 16.3 7.2 15.1- Transport 6 communication 5.3 5.4 6.1 5.3- Other 14.3 13.8 5.2 13.2
GOP 100. ,tOO 12.O LI l- Oil/gas sector 22.3 18.2 2.7 9.5- Non-oil/gas sector 77.7 81.8 6.6 90.5
Source: Central Bureau of Statistics and World Bank staff estimates.
1.13 The non-traded goods sector grew at 6.5% p.a., over the period 1983to 1990 and this has allowed it to expand its share of GDP from 43.7% in 1983to 46% in 1990. Within the non-traded sector the electricity and banking andfinance sectors grew fastest, driven in large part by private activity in thetraded goods sector. Each grew at over 10% p.a., but their contribution tooverall GDP was small because their shares of GDP are still relatively small.The growth of the banking sector has picked up since the deregulation packagein 1988. The electricity sector will need to continue rapid growth to servethe rapidly expanding manufacturing sector.
Non-oil Manufacturing
1.14 The incentives reform has reoriented the traded goods sector, andparticularly manufacturing, to a more outward-looking growth strategy. In themid-1980s the Government looked to the manufacturing sector to increase itsrole in the economy, provide increasing employment opportunities and expandexports. It is still too early to document fully the response ofmanufacturing to the changed policy environment. There are lags betweenpolicy changes and investment and again between investment and output andexports. Much of the data are either incomplete or not available after 1988

-8
Table 1.3: SIGNIFICANCE OF OIL IN THE ECONOMY,1981/82-1990/91
1981/82 1985/86 1990/91(est.)
Ratios of:Oil/LNG exports to totalmerchandise exports "Lg 81.9 68.0 44.9
Non-oil exports to non-oil imports .L 28.6 53.8 71.0Oil/LNG revenues to total revenues 70.6 57.1 44.2
La Goods only, in current dollars.
Source: World Bank staff estimates.
and affords little chance to catch the effects of the reform. Nevertheless,it is already apparent that the sector has responded to the challenge -- itsstrong growth since deregulation has been an important factor in ensuring thesuccess of Indonesia's adjustment program.
1.15 The key role of the private sector. The private sector dominates themanufacturing sector. Small and cottage establishments are predominantlyprivate sector and these employ two-thirds of all workers and produce about17% of value-added in manufacturing (see Figure 1.2).4/ The vast bulk ofoutput comes from medium and large scale establishments (MLEs). These arealso dominated by the private sector, which has accounted for between 80-85%of both value-added and employment in the MLE sector since the early 1980s.
1.16 The private sector has increased its role in MLEs over the 1980s.Initially this was because investment in public enterprises was cut back. Theprivate sector continued to increase its share of industrial activity in thepost-deregulation period, particularly in terms of value-added. The privatesector accounts for the vast bulk of labor-intensive activities (wearingapparel, footwear, furniture and non-metallic minerals) and resource-intensiveactivities such as wood and wood products. These activities have grownfastest and now provide most of Indonesia's non-oil exports.
/ According to definitions by the Central Bureau of Statistics: cottageestablishments employ fewer than 5 workers; small establishments employbetween 5 and 19 workers; and medium and large establishments employ 20 ormore workers. Complete surveys of the cottage and small establishmentshave been undertaken only in the census years 1974-75 and 1986. However,the methodology of the survey differs between these two years andconsequently it is difficult to estimate trends in growth in value-addedand employment. Data are more readily available on medium and large scaleestablishments as they are subject to annual industrial surveys, the mostrecent being for 1988.

-9-
Fi. 1.1 : NON-OIL & OIL TRADE TO GOP AfIlOS
30
2 5
20
1581182 95186 89190 90191
Soerce e WIDo Bask slall estimales
1.17 growth and *^rort. Manufacturing industry has been the primarytarget of deregulation since the mid-1980s and the private sector has been atthe leading edge of structural change and growth in recent times. A recentpilot survey of a sample of small and cottage establitalwents provides someinsight into developments in this sector since 1986,2/ The study indicatesthat the small sector in particular has been thriving rince deregulation, withthe number of establishments doubling between 1986 and 1989. Employment bythe small and cottage establishments has grown by almort 18% p.a. over thesame period.
1.18 Growth in the MLE manufacturing sector since th- early 1980s isoutlined in Table 1.4. Capital-intensive activities werb sharply reduced bythe cut in imports and public expenditure during the sta4i- ization period of1982-85 and this is reflected in a slowdown in value-added and employmentgrowth. The faster growth of manufacturing in the period 1985-88 reflects aswitch in resources both between and within sectors towards those labor-intensive activities in which Indonesia is internationally competitive. Thechange in the structure of the manufacturing sector had beneficial effects onexports, which increased from 15% of output in 1982-85 to 26% in 1985-88. Itis also encouraging that during the latter period the strongest growth inexports has been across a wide range of manufactured products.
2/ Department of Agriculture (with Central Bureau of Statistics), Pilot StudyAgro Industry, September 1990. The study was funded by a USAID grant(No. 497-0357).

- 10 -
FIG. 1.2: SIZE DISTRIBUTION OF INDUSITRY 1986
Viuadddpd EmWlimint
Cetite Cottage Smallsmall
Mediumf & avg.Mdum&lag
Sources COS &ad WO stafl estimaktes.
lable 14: PERFORMANCE OF INDUSTRIAL MLES IN INDONESIA:SELECTED PERIODS L
1982-85 1985-88
Growth rates %-Real value added 7.4 10.0* Employment 6.4 6.6
Exports/output ratio 15.0 26.0
a The value-added and employment data relate to medium and large scaleestablishments. There are slight differences between these data and thenational accounts due to differences in methodology.
& Exports include ;.hose from all categories of manufacturing industry,except for ISIC 3720 (non-ferrous metals) and 3540 (petrol and coalproduct.).
Source: World Bank staff estimates.

- 11 -
1.19 Resource allocation. The structure of output, exports and importshave all changed significantly over the period 1977-88 (see Table 1.5). Themain changes in the structure of output include the decline in the share ofresource-intensive activities with a corresponding increase in activitiesbased on unskilled labor and also technology (this largely encompasses thechemical industry). However, within the resource-intensive category, productsbased on timber resources have increased, while those based on agriculturehave declined. The increase in timber products reflects the growth of theplywood industry, which has benefitted from the implicit subsidy from the banon log exports in the early 1980s. Exports have also increasingly includedproducts using unskilled labor and timber resources. Imports oftechnology-based products have increased sharply over the period 1977-88. Themovement of resources towards timber and textile products is most noticeablein the period since deregulation. These shifts indicate a broad movement ofproduction into areas using Indonesia's abundant supplies of labor and naturalresources and a focus of imports on products using technology and skillsscarce in Indonesia.
Table 1.5: INDUSTRIAL OUTPUT, EXPORTS, IMPORTS, BY FACTOR INTENSITY:SELECTED PERIODS La
(in % of period total)
By Factor Intensity OutDut Exports Imports1977 1988 1977 1988 1977 1988
Resource Based 59.2 54.0 89.5 63.1 27.2 14.2- Agriculture 46.2 30.1 67.3 15.6 20.5 6.4- Timber products 4.6 16.0 4.8 32.5 2.2 3.7- Minerals 8.4 7.9 17.4 15.0 4.5 4.1
Unskilled Labor 22.9 26.2 1.8 22.9 9.6 10.7
Technology 6.9 10.7 4.3 6.8 28.6 40.5
Skilled Labor 11.0 9.0 4.5 7.2 34.5 34.6100.0 100.0 100.0 100.0 100.0 100.0
La Medium and large scale enterprises only.
Source: World Bank staff estimates.
1.20 There are a number of issues relating to ownership and industrialstructure that will have important implications for the development of themanufacturing sector as the structural reforms continue and deepen. Theseinclude remaining distortions in the incentives regime, the role of publicenterprises, the slow pace of expansion of medium-scale establishments andoverdevelopment on Java. These issues are briefly discussed in the followingsections.

- 12 -
1.21 Effective protection. The net effect of incentives such as tariffsand various subsidies in encouraging production activities may be measured bythe effective rate of protection (see Table 1.6 and Chapter 3). The variousestimates of protection indicate that despite substantial progress, non-oilmanufacturing is still relatively highly protected and the incentives regimecontinues to impart an anti-export bias. As a result, resources continue tobe drawn to what are high cost activities, including, in particular, the food,beverages and tobacco and the engineering sectors. The relatively high levelsof protection afforded the manufacturing sector lead to high costs throughoutthe economy. Protection is on a downward trend since deregulation, but thereis still considerable room for improvement in the incentives regime for thesector.
Table 1.6: EFFECTIVE PROTECTION IN INDONESIA
Output
Rp. billion NRP % ERP % RERP %
Non-oil manufacturing 39,363 13 59 43
Agriculture (excl. Forestry) 29,800 11 20 8
All tradeables 98,703 8 14 3
Non-oil tradeables 71,737 11 24 11
Import-competing 58,485 15 35 21
Export-competing 40,218 -1 -1 -11
Source: World Bank staff estimates. See Annex 4 for definitions of theseconcepts.
1.22 Public sector involvement in manufacturing. Public sectorinvolvement in manufacturing industry is significant in the morecapital-intensive and upstream activities such as basic metals (with two largeinvestments in steel and aluminium), fertilizers and cement. In 1988 thepublic sector (including joint ventures) accounted for some 17% of value-addedand 15t of employment generated by MLEs. This represents a slight declinefrom the shares achieved in 1982. In many cases public involvement inindustry is a carryover from past nationalizations (in the 1960s) and a driveto control the "commanding heights" of industry in the 1970s (facilitated byrevenue from the first oil boom). The continuing need for public enterprisesto engage in the production of traded goods needs to be reassessed in thecontext of public enterprise reform (for further details see Chapter 5).Government investment can crowd out potential private initiative in somemanufacturing industries. Moreover, some public enterprises, especiallyhigh-technology industries may have few linkages with the rest of industry andabsorb a significant proportion of skilled engineers, aggravating skillshortages throughout the economy.

- 13 -
1.23 Medium-scale establishments. The manufacturing sector ischaracter'zed by a relatively undeveloped network of medium-scalesubcontractors, due partly to a preference for larger scale establishments toundertake most production in-house. Possible reasons could include hightransaction costs between firms due to an undeveloped legal system and lack oftransport infrastructure and the inability of sub-contractors to deliver ontime. Most promotion schemes have largely been directed towards improvingaccess to credit. This is exemplified by the January 1990 guidelines fromBank Indonesia that commercial banks direct 20% of their lending to smallerenterprises (defined as having assets of less than Rp.600 million).Certainly access to credit does seem to be a constraint for new entrepreneurs,however, this may simply reflect the risk of default and subsequent servicecosts by banks. The most useful way to improve access to credit may be toenhance banking skills in loan appraisal and improve collection systems.Access to credit, especially in rural areas, appears to be related closely tothe presence of bank branches. Since deregulation there has been a rapidexpansion in bank offices and particularly in rural areas.
1.24 Regional balance. Given the concentration of population and economicactivity on Java, and the problems associated with overcrowding and pollution,increasing attention is being directed towards achieving a more evendistribution of development throughout the country. Means for securing thisobjective include the provision of funds for infrastructure in areas wheregrowth is to be encouraged, as well as various incentives to businessactivities. Recent trends in the pattern of regional industrial development,as indicated by value-added from medium and large establishments, are outlinedin Table 1.7.1/ Most industrial activity by MLEs is located on Java.However, there have been substantial changes since the mid-1980s. Since thenJava's share of industrial value-added accounted has declined from 76% in 1985to 72% in 1988. A number of factors account for this decline, includingshifts in population and the effect of the rapid growth in resource industriesin Sumatra and Kalimantan. There has also been a similar change in thecomposition of regional employment. The data also indicate that industrialactivity is generally more labor-intensive in Java and East Indonesia and moreresource-intensive in Sumatra and Kalimantan. On the surface, these trendspoint to reasonably broad-based industrial development over the past decadethat has, if anything, accelerated since the adjustment period in the early1980s.
Agriculture
1.25 Agriculture has been a major source of economic growth and emnloymentduring the past two decades, and its performance has made a significantcontribution to the impressive reduction of poverty over the period. Much ofthe growth in agriculture can be attributed to the increase in rice 'uctionmade possible by private farmers effectively adopting high yielding varLetiesof rice (HYV) supported by large public investments in irrigation andfertilizer subsidies. Agriculture has always been substantially a private
j/ These shares would not significantly change if small and cottage industrywere included. They would do so, however, if oil and gas were included.In this case the shares would be roughly as follows: 50% for Java; 26%for Sumatra; 21% for Kalimantan; and 3% for East Indonesia.

- 14
Thble 1.7: SHURES OF INDUSTRIAL VALUE ADDED AND EMPLOYMENS £6BY REGION-SELECTED YEARS
1977 1982 1985 1988Value- Employment Value- Employment Value- Employment Value- EmploymentAdded Added Added Added
Java 0.79 0.83 0.79 0.80 0.76 0.77 0.72 0.76
Sumatra 0.17 0.13 0.15 0.13 0.14 0.15 0.16 0.14
Kalimantan 0.02 0.02 0.04 0.04 0.06 0.06 0.09 0.06
East Indonesta lb 0.02 0.02 0.02 0.03 0.04 0.04 0.03 0.04
/ Medium and large establishments only.lb Includes Bali.
Source: Central Bureau of Statistics.
sector activity with a high degree of domestic competition and a relativelylow average level of protection (Table 1.6). Consequently, agriculture hasnot been subject to the same deregulatory pressures as the manufacturing andthe financial sector. For the future, it appears that growth in rice yieldsas well as demand for rice will slow, and growth will have to comeincreasingly from non-rice commodities, livestock and fisheries. TheGovernment will need to redirect resources to support non-rice based farmingsystems, especially in the Outer Islands. In particular, it will be necessaryto ease production controls and restrictions on trade of a number of crops,since these may be preventing the private sector from responding efficientlyto changing patterns of demand and emerging opportunities.
1.26 The _rivate sector. Private farmers and private estates areresponsible for nearly all agricultural output and employment. The privatesector produces over 98% of agricultural value added, and this share has beenrising slowly since the early 1980s as private investment has outpaced publicenterprise investment in agriculture. The private sector also provides thevast bulk of total agricultural employment. Public enterprises aresignificant only in plantations (estate crops), but even in this subsectortheir share has been falling steadily since 1S83. This is partly a result offinancial and management problems combined with a rapid increase in privatesector investment. There are also some large public enterprises in theforestry subsector.
1.27 The dynamism of Indonesia's small, private farmers, combined withGovernment support programs that encouraged the adoption of improvedtechnology, enabled the agriculture sector (excluding forestry) to grow at anaverage of over 4.5% p.a. from 1975-85 (Table 1.8). This growth was driven byrapid increases in rice production, which accounts for over 25% of agricultureGDP. The introduction of high-yielding varieties (HYVs), combined with heavyGovernment investments in irrigation and subsidies on fertilizer, helped raiserice yields and production by 4.1% p.a. and 5.7% p.a., respectively, over theperiod 1975-85.
1.28 Non-forestry agriculture sector growth slowed by about one third inthe latter half of the 1980s. This slowdown also reflected developments in

- 15 -
lable 1.8: GROWTH IN AGRICULTURE 1975-1990(% p.a. at constant 1983 prices)
Share in total1975-80 1980-85 1985-90 1975 1980 1985 1990
Farm food crops 4.4 4.4 2.5 66 67 66 62Farm non-food crops 9.1 4.7 3.7 12 14 14 15Estate crops -3.9 10.0 4.7 3 2 2 3Livestock 0.9 5.8 4.1 12 10 11 12Fishery 6.6 3.7 4.9 7 7 7 8
Total non-forestry 4.5 I 100 100 100 100Forestry 3.8 -12.1 5.9
Source: Central Bureau of Statistics and World Bank staff estimates.
rice production. By the time Indonesia achieved its goal of riceself-sufficiency in the mid-1980s, a large proportion of farmers (especiallyon Java) were already applying heavy doses of fertilizer and using HYVs onirrigated land. Consequently, growth in rice yields and production sloweddramatically -- to 1.5% and 2.6% p.a., respectively. This growth was enoughfor Indonesia to maintain trend self-sufficiency in rice, but it led to muchlower growth (3% p.a.) for non-forestry agriculture as a whole. All othersubsectors, witb the exception of fisheries, also showed lower growth in thesecond half of the 1980s. Nevertheless, estate crops, livestock, andfisheries continued to grow at over 4% p.a., and these subsectors contributeda much higher proportion of agricultural growth than during 1975-85.
1.29 Growtn in the forestry subsector over the past 15 years hasfluctuated in part due to export restrictions. The subsector grew by nearly4% p.a. from 1975-80, but export restrictions reduced demand and causedforestry value added to fall by a total of nearly 50% from 1980-85. As thedomestic processing industry for forest products was developed in the latterhalf of the 1980s, increased demand led to 6% p.a. growth in forestry output.The imposition of further export restrictions in 1990 pushed down growth tobelow 5%, however, and these restrictions may continue to slow growth in thefirst half of the 1990s.
1.30 There have been major programs to increase production of sugar andsoybeans with the objective of eliminating imports of these commodities. TheGovernment has mandated certain cropping patterns, subsidized inputs, andmaintained the domestic output prices of both commodities well above worldlevels. Sugar and soybean production have increased rapidly but these gainshave been made at substantial cost to the economy as a whole, since Indonesiais not currently a low cost producer of these crops. Not only have consumerspaid higher prices for both commodities,but sugar producers have also sufferedincome losses. Farmers required to produce sugar on irrigated land couldgenerate at least twice as much income if they were allowed to grow rice. Ifsubsidies were removed from input and output prices for these crops,

16 -
production would fall by an estimated 30-35%, as farmers shifted productioninto crops such as rice and corn which are more profitable and in whichIndonesia appears to have a comparative advantage.A/ Lower sugar andsoybean prices would benefit consumers.
1.31 During the 1980s, the Government launched a number of schemes topromote the development of tree crops, which are the only agronomically andenvironmentally sustainable crops in many areas of the Outer Islands.Indonesia has a strong comparative advantage in producing tree crops becauseof low labor costs. Unfortunately, problems with financing, cost recovery,project design, and management have limited the number of smallholders thathave benefitted from these programs, and these problems have temporarilybrought the smallholder tree crop programs nearly to a halt.5./ To date,only 15% of rubber smallholders and about 5% of coconut smallholders havereceived assistance from such programs. The Government is currentlyconsidering ways to address the financing and cost recovery problems, as wellas new approaches that would increase the number of smallholders that can bereached each year.
1.32 Agriculture has also been an important source of export earnings inthe 1980s, with revenues (excluding forestry) increasing by 11% p.a. from1981-88 (Table 1.9). At the height of the oil boom in 1980, agriculturecontributed only 9% of total exports, but almost half of non-oil exports.With the collapse of oil prices in the mid-1980s, agriculture's contributionto total exports more than doubled, to 21%. Although agriculture's share ofnon-oil exports fell due to the response of the manufacturing sector to theGovernment's deregulation measures, agricultural exports nevertheless providedan important "bridge" during the adjustment period of 1985-88 by growing atover 16% p.a.. A sharp drop in commodity prices caused agriculture'scontribution to fall substantially in 1989 and 1990.
1.33 Exports of primary forest products fell by nearly 25% over the decadedue primarily to two successive sets of trade restrictions. The first, a banon log exports, was phased in during the early 1980s, causing log exports tofall from about $500 million in 1981 to zero in 1985. The log export banprovided a heavy subsidy to the plywood industry, which strongly expandedexports (classified under manufacturing) over the 1980s. Sawn timber exportsalso increased from about $250 million in 1981 to about $600 million in 1989.In 1990, a prohibitive export tax on sawn timber reduced sawn timber exportsto almost zero, providing further protection to the wood products industries.
1.34 Effective protection. The various estimates of protection suggestthat agriculture is generally competitive and, if anything, is taxed by the
i/ See "National Food Crops Policy Model: Policy Applications" Research Briefno. 2, CARD/MOA, July 1989.
5/ The only exception is the PIR-Trans program, which is implemented by theprivate sector using subsidized government loans. The land planted isinitially owned entirely by estate companies, and it is unclear how muchof the land being planted in this program will eventually be turned overto smallholders.

* 17 -
Table 1.9: AGRICULTURE EXPORTS(US$ millions)
1981 1985 1988 1989 1990(est.)
Total Non-Forestry 1.978 2.592 4.063 3.616 3.389Rubber 770 714 1,236 1,005 942Palm Oil 79 170 313 295 271Coffee 343 659 572 490 403Shrimp 165 228 541 518 583
Total as % of:
Total exports 9 14 21 16 12Non-oil exports 48 41 33 26 21Agriculture GDP -a 10 13 21 18 15
Total Forestry A 752 369 79 1.080 575
,a Excludes forestry.Ab Includes sawn timber; excludes plywood.
Source: Bank Indonesia and World Bank staff estimates.
incentives regime compared to other non-oil traded goods activities (seeTable 1.6). However, the average levels of protection mask significantvariations, with high effective protection for some products such as soybeansand sugar indicating significant lack of competitiveness. Moreover non-tariffbarrier (NTBs) protection is common in agriculture and such restrictions allowhigher levels of protection if domestic costs increase.
Financial sector
1.35 Financial sector reforms have been a central element in theGovernments deregulation effort, reflecting the need to ensure the sectoreffectively mobilizes savings and provides investment resources. The reformshave been extensive, leaving Indonesia with one of the most dynamic and least-distorted financial sectors in the developing world. The removal of interestrate controls and relaxation of barriers to entry led to accelerated growth,especially by the private sector banks, more diversified products andservices, and greater competition and cost efficiency. The very rapidexpansion of the financial system is mobilizing the resources needed by theprivate sector to restructure the economy.
1.36 Asset growth. The rapid growth and changing structure of thefinancial sector are illustrated in Table 1.10 and Figure 1.3. Value-addedfor the sector grew by more than 10% p.a. between 1982 and 1990, whilefinancial sector assets grew by more than 20% p.a. The private sector has

- 18 -
been the dominant force behind these impressit. growth rates, expanding itsshare of the financial sector activity from 35% in 1982 to 42% in 1990.Developments in the financial rystem over this period can be divided into twoseparate periods corresponding to the first two major reform packages (seeBox 1.1). At the beginning of the first period (1982-88) the financial systemwas dominated by banking, which in turn was dominated by state commercialbanks (SCBs). The value of the banking system's assets as a ratio to GDP wasrelatively small, only 33% in 1982. In more financially developed countriesthis ratio was three to four times larger.
Table 1.10: INDONESIAt STRUCTURE AND GROWTH OF THE FINANCIAL SECTOR, 1982-90 /a
Asset GrowthNumber in Assets (Re. bln) (2 .as.) /b
1982 1988 1990 1982 1988 1990 1982-88 1988-90
Bank Indonesia 1 1 1 13,707 42,445 49,045 18.8 7.2Deposit money banks 118 111 166 17,105 65,693 135,992 22.4 36.4
State commercial banks 5 5 5 12,257 39,862 64,760 19.7 24.3Private foreign exchange banks /_c 10 12 23 1,168 10,189 37,311 36.1 64.9Foreign banks 11 11 26 1,172 3,215 9,777 16.8 55.6Other commercial banks /t, 60 51 80 720 4,972 10,823 32.2 38.9Development banks 29 29 29 1,336 5,046 10,247 22.1 35.4Savings banks LI 3 3 3 452 2,409 3,074 27.9 12.2
Nonbank financial institutions le 13 13 13 805 3,063 4,730 22.3 21.7Insurance companies 83 106 117 528 1,883 2,566 21.2 30.9Leasing companies 17 83 83 114 1,735 2,711 L 45.4 22.3Other credit institutions LA 5,808 5,783 5,994 86 637 856 33.4 14.8All institutions 6,040 6,097 6,374 32,345 115,456 195,900 21.2 26.4
Source: Bank Indonesia and World Bank staff estimates.
/a, Organized financial sectort end of period.lb Annual compound rates,Ic Includes five SCBs. The remainder are national private banks./d, National private banks undertaking only domestie currency business.le Nine investment finance, three development finance, and two other finance companies.If One state savings bank and two private savings banks.LI Village and rural banks./h Estimated.
1.37 The reform process dramatically altered this structure. The bankingsystem responded to the initial reforms freeing interest rates with a rapidexpansion -- assets grew at 21% p.a. between 1982 and 1988. As a share ofGDP, financial assets held by the banking system rose to 57% in 1988.Financial savings were spurred as well, with M2 growth at 22% p.a. (with thefastest growth in time deposits and savings accounts). The growth of thefinancial system was dominated by the private sector. Private banks grewtwice as fast as state commercial banks. Private commercial banks (PCBs)increased their share of deposit money bank assets from 9.5% in 1982 to ?.4% in1988.
1.38 The importance of PCBs was boosted further by the second round ofreforms in 1988-90 that focused primarily on reducing barriers to entry andspecial privileges for state banks. Once again, overall financial assetsresponded with a rapid expansion--26% p.a. between 1988 and 1990, and theirshare in GDP continued to climb, reaching 66% in 1990. This time the growth

- 19 -
FIG 1.3 FINANCIAI kggFTS
1 4 A. b,III,Ie40 -
20 .. .. t ...........
0-1982 199;0
NON BANK ~PRIVATE BANK ~STATE BANK
3omICS O B oo t11111.
of assets was based upon the creation of new banks. Since the lowering ofentry barriers, 40 new domestic banks and 15 new joint venture banks have beenestablished. No new state banks have been created. Meanwhile, branches ofbanks have also grown significantly, from 1640 in April 1988 to 2842 in March1990. These have chiefly been private bank branches, as branches of thesebanks were more tightly controlled under the old regulatory regime. Thebranches are particularly important in providing more even access tc .;reditand other services.
1.39 Product diversification. The financial sector reforms have alsosparked major innovations in the types of financial products and servicesavailable to borrowers and savers. The explosive growth in stocks, afteryears of stagnation, is a particularly important example, since non-debtfinance can help provide a more stable financial base for the rapidlyexpanding private sector. Since 1988, when deregulation removed manyrestrictions on the capital market, about Rp.12 trillion has been raised byover 100 companies, all of them private. This is equal to roughly a quarterof the increase in bank loans over the same period. Other newly popularproducts and services include domestic syndicated loans, mortgage and consumerloans, mutual funds, and a variety of attractive savings accounts.
1.40 GoMRetition anld cost efficiency. Competition among banks for loansand deposits has been keen in the past several years as evidenced by the rapidexpansion of branches and the wider array of products and services. Shrinkingbank profit margins also show increasing competitive pressures. Measures ofprofitability have all declined since 1982, with the sharpest drops at privatebanks. Competition has especially lowered fees and commissions. As banks

- 20 -
have lowered their spreads, they have promoted the use of the domesticfinancial system through reducing the costs to borrowers of a loan for anygiven payment to depositors. SCBs have been able to maintain theirprofitability by using their historical relations with public enterprises tolimit increases in interest expense, thereby widening their interest margin.Higher levels of debt write-offs, however, have brought their overall profitmargin in line with private banks. While growing competitive pressure hasreduced bank profit rates, it has also resulted in increased cost efficiencyuntil very recently. Non-interest operating costs dropped from 4.3% of totalassets in 1982 to 3.1% in 1989. In 1990, the increase in bank offices and theattendant overhead expenses these entail have boosted these costs to 3.8% oftotal assets. Still private banks have been better able to contain theincreases in non-operating costs than state banks.
1.41 The rapid expansion and the strong competition just described havecreated a new challenge: to consolidate this growth through strengthening thelegal, regulatory and human infrastructure of the financial system. Theincrease in the number of banks and financial intermediaries has complicatedthe regulatory responsibilities of the Government. At the same time,shortages of qualified staff, inadequate internal controls, as well as thesheer pace of asset growth, have, in some cases, generated concern about assetquality. As a result, as discussed in Chapter 4, there are intensive effortstv strengthen financial institutions and develop the framework of legislation,prudential regulation and supervision to deal more effectively with a modern,rapidly-growing financial sector.
Emplopnent. Incomes and Poverty
1.42 Overall, employment grew about 3% p.a. in the second half of the1980s, somewhat faster than the growth in the labor force. Labor intensityappeared to increase as the elasticity of employment rose with respect tooutput from 0.44 in 1976-82 to 0.67 in 1982-88. The changing pattern ofoutput and employment in agriculture and manufacturing was supported by: thedepreciation of the real exchange rate which improved the incentives fornon-oil eYports in both agriculture and manufacturing; decontrol of interestrates which helped to reduce the bias towards capital-intensive production;and trade deregulation which increased the efficiency of production while alsosignificantly reducing the bias against exports. The productive employment ofa rapidly growing labor force is a key issue for the 1990s. Indonesia'spopulation in 1990 reached 179 million and is growing at slightly less than 2%p.a..L/ Given current labor force participation and unemployment rates thistranslates into a demand for new jobs of over 2 million p.a. during the 1990s.With a productivity growth of 2%, the creation of these jobs would requirereal GDP growth of over 5% p.a..
1.43 The manufacturing sector employed slightly less than 7.0 millionworkers in 1990. About two-thirds of this labor force was employed in smalland cottage industries and the remainder (or some 2.4 million workers) inMLEs. The most important export-oriented activities, namely textiles andtimber products, accounted for the vast bulk of new jobs. The growth of these
i/ See Annex 2 for a discussion of the preliminary results of the 1990census.

- 21 -
labor-intensive activities has been stimulated by the reform in incentivessince the mid-1980s. Low labor costs have provided the foundation for therapid e-nansion of manufacturing industry. For example, in late 1988 theaverage aily wage of industrial production workers was Rp.2,800 (or about$1.66). The daily wage varied from Rp.2,187 for textile workers to Rp.4,150for workers in the base metal industry. Creating new jobs while increasingreal wages will require both growth and improvements in labor productivity.So far the private sector has shown a capacity to train workers as needed andproductivity could be expected to increase as labor moves into manufacturingfrom agriculture, or manufacturing capacity expands in the more productivesectors and as capital deepening takes place. The share of agriculture intotal employment fell from about 64% in 1971 to 55% in 1982, where it remainedthroughout the 1980s. Agriculture has thus continued to be the main source ofemployment in the economy, providing over 13 million new jobs during the lasttwo decades. Labor productivity in the sector as a whole has risen as well,at least through 1986. Labor productivitv appears to have fallen during 1987and 1988, however, due to a combination of slow agricultural growth (primarilybecause of the drought's effect on rice production) and rapid employmentgrowth.
1.44 The trends in real wages for unskilled agricultural and industrialworkers are shown in Table 1.11. Using wages for unskilled agriculturalworkers in Java as a proxy for wages of lower income groups, real wages forthese groups increased by 2.3% p.a. during 1983-90. The increase wasrelatively uniform across Java. These results are ronsistent with theavailable evidence from village surveys, and also are closely correlated withchanges in the incidence of poverty during the adjustment period. Inindustry, real wages increased by 3.4% p.a. during 1983-89. The evidenceindicates that this growth is still slower than increases in average laborproductivity.
Tale 1TREs TDS IN REAL {AGES, 1983-90(index numbers, 19839100)
Averaes GrowthRate tX D.&.
1983 1984 1985 1986 1987 1988 1989 1990 1983-90(eat.)
AMrixulturi I0D 04 4115.9 117.1 115.9 in.9 114.9 117.0 2.lWest Java 100.0 105.7 112.4 114.9 115.9 113.1 115.8 117.6 2.3Central Java 100.0 102.0 113.5 115.4 115.1 111.3 112.9 115.1 2.0Yogsyakarta 100.0 99.9 115.3 128.6 125.5 122.8 128.0 129.7 3.8Ea nt Java 100.0 108.4 121.2 119.5 115.6 113.3 114.6 116.8 2.2
Itndust 100.0 12LI 115.2 120.4 12L_3 IL8 122.4 n.. L3. la
La For 1983-89 only.
Source: Central Bureau of Statistics and World Bank staff ostimtes.
1.45 In general, the growth of the economy through the 1980s, andparticularly since deregulation, has been associated with rising livingstandards for the community. As outlined in Table 1.1, the growth in GNP percapita averaged about 3.6% p.a. in 1984-88, but has increased to about

- 22 -
5.4% p.a. in the past two years. Similarly, growth has occurred inconsumption per capita. A remarkable feature of Indonesia's adjustmentexperience has been the continued reduction of poverty in both urban and ruralareas.Z/ The success in reducing poverty is attributable partly to theconditions prevailing prior to the external shocks but chiefly to the natureand speed of the Government's policy response to the external shocks of themid-1980s. By improving overall economic efficiency, by shifting resourcesaway from inward-oriented, capital intensive public sector industrialactivities, and by protecting public expenditure priorities inpoverty-oriented sectors relative to other sectors, the reform program allowedIndonesia to make solid progress towards restoring financial stability whilesustaining a steady growth of consumption. The Indonesian experience offersclear evidence of the possibility of combining successful structuraladjustment with poverty reduction.
D. The Tasks Ahead
1.46 Indonesia has continued to grow strongly within a stablemacroeconomic policy framework despite large external shocks and considerableuncertainty in the world trading environment. Growth has been based upondynamic private sector activity in the non-oil sector, and in particular onthe manufacturing and financial sectors. The positive business environmenthas led to keen investor interest as it is clear there are widespreadprofitable opportunities in the economy. Taking full advantage of theinvestor interest will provide the foundation for impressive growth over thenext few years. However, the surge in private sector activity calls forcareful management across a broad range of policies. The following chaptersoutline the tasks ahead and these include:
- sustaining a stable macroeconomic framework to provide a soundenvironment for private sector development. Chapter 2 elaboratesthis issue and indicates that in the short run, economic managementwill need to ensure that the recent surge in investment activity doesnot place too much pressure on prices and the balance of payments.The longer run goal of macroeconomic policy remains the attainment ofsustained growth to enable continued poverty reduction, growth ofproductive employment opportunities and balanced regionaldevelopment;
* identifying and removing distortions in the incentive system toensure that the private sector develops in a competitive environment.Chapter 3 argues that further reductions in protection will helpensure that private investment be directed towards activities whereIndonesia is competitive. Also it is an opportune time to reassessthe framework of incentives for agriculture and renew the drive forderegulation. Non-oil export performance could be improved by areduction in the scope of export controls. Improving the regulatoryand legal framework will underpin market competition, remove factor
Z/ Indonesia: Strategy for a Sustained Reduction in Poverty, A World BankCountry Study, World Bank, 1990.

- 23 -
market rigidities, and establish a level playing field for privatesector firms. Finally Chapter 3 highlights the need to dealeffectively with environmental issues posed by the rapid developmentof the private secto..;
* ensuring a sound financial system that promotes financial disciplineby mobilizing and allocating resoturces according to prudentialfinancial criceria. Chapter 4 discusses the strategic role of thefinancial sector in ensuring the smooth flow of resources toefficient, competitive firms;
* the need for improvements in the efficiency and performance of thepublic sector as well as facilitating private sector participation inthe provision of infrastructure. Chapter 5 highlights thecomplementary roles of the public and private sectors in providingphysical infrastructure and identifies priority areas for programimprovements; and
* broadening the particiRation in the benefits of future economicgrowth. Chapter 6 outlines the measures that could help achieve thisobjective including: more equal access to economic opportunitiesthrough deregulation and more transparent decisions; directingincreased resources toward education and social services; andre-examining subsidy and regional development programs.

- 25 -
CHAPTER-2
A MACROECONOMIC FRAMEWORK FOR GROWTH WITH STABILITY
A. Introduction
2.01 Chapter 1 demonstrated the positive effects of the structural reformunderway in Indonesia since the mid-1980s. A strong private sector responseto the deregulation measures, combined with a reduced dependence on oilearnings is creating the basis for sustained growth in the 1990s. Sustaininggrowth rates in the range of 5-6% p.a. will be critical for meetingIndonesia's fundamental development challenge of raising living standards andreducing poverty. Continued skillful macroeconomic management will beessential in sustaining such growth. This chapter outlines a macroeconomicframework for Indonesia designed to meet these development challenges.Section B discusses recent economic developments. This analysis shows thateconomic growth during 1990/91 has put pressures on the balance of paymentsand prices. The Government is implementing measures, however, that shouldease these pressures and return the economy to a sustainable growth path.Section C outlines a macroeconomic framework which will reduce aggregatedemand pressures in the near term while providing the growth Indonesia needsto raise living standards, reduce poverty and ease the debt burden over themedium term. The medium-term prospects for growth based on this macroeconomicframework are then discussed in Section D. A review of policy options forenhancing public resource mobilization is contained in Section E. Section F
discusses the financing requirements for the medium-term macroeconomicscenario and a strategy for managing Indonesia's external debt.
B. Recent Economic Developments
Background
2.02 As noted in Chapter 1, the Indonesian economy was buffeted by aseries of external shocks during the 1980s, as the terms of trade deterioratedseverely, primarily due to the collapse of oil prices, and as the US Dollardepreciated. The Government responded effectively to the challenges posed bythese adverse developments by implementing, since 1983, a broad range ofadjustment measures including prudent fiscal policies, appropriate exchangerate management, supportive monetary and financial sector policies, andstructural reforms.l This adjustment program was successful in achievingmacroeconomic stability, maintaining economic growth, stimulating structuralchange and reducing poverty (see Table 2.1). A stable macroeconomic
1/ The nature of the external shock and the Government's adjustment programwere discussed in detail in the last two economic reports. See Indonesia:Strategy for Growth and Structural Change, Report No. 7758-IND, WorldBank, May 3, 1989 and Indonesia: Foundations for Sustained Growth, ReportNo. 8455-IND, World Bank, May 4, 1990.

- 26 -
Table 2.1s Key Macroeconomic Indicators J.
Estimated1975-83 1983-87 1988 1989 1990
Average growth rates (U nPalGDP 6.5 5.0 5.7 7.4 7.1Non-oil GDP 7.C 5.7 7.4 8.2 7.8Agriculture 3.5 3.3 4.7 4.3 2.5Manufacturtng 10.6 12.0 12.8 11.6 12.8Mining 6.8 3.4 4.8 11.0 4.1Construction 10.8 1.1 9.5 11.8 12.1Other Services 8.6 6.0 6.9 8.5 8.2
CNY 8.5 3.4 6.2 7.7 8.2Non-oil eXports 10.5 12.2 14.2 21.5 6.7Non-oil imports 13.8 -8.2 8.0 18.9 25.4Fixed investment 10.7 -3.7 10.3 13.0 16.2Public 12.6 -9.1 11.4 6.8 9.6Private 9.1 0.6 9.7 16.8 19.9
Consumption 8.9 4.0 4.3 5.9 7.9
Macroeconomie balances (SI LCurrent account/CNP -7.8 Ld -2.6 -2.3 -2.0 -3.8Non-interest current accountlOUP -6.0 Jd 1.9 2.1 2.2 0.1Overall public sector balanct/GDP -4.3 / -2.8 -3.1 -1.3 1.81MLT debt servicetexports 16.8 LA 34.8 34.4 31.6 27.3MLS debt/exports 127.6 234.5 218.1 185.8 183.1MLT debtIGNP 33.1 65.6 60.3 54.6 58.6
Strueture of the econom (I) lbNon-oil manufacturing/CDP 9.9 12.8 13.6 14.1 14.9Non-oil exports/non-oil imports 37.4 80.8 89.7 87.0 71.0Public savings/GDP 8.9 4.8 5.4 6.5 9.6National savings/IDP 21.0 19.1 19.8 21.4 21.4Fixed investment/GDP 25.1 19.2 20.0 21.2 22.9Private fixed investment/total fixed investment 52.1 59.0 57.7 61.4 63.0
Consumption/MDP 73.9 75.6 75.0 73.6 73.7Consumption/GNY 73.9 76.9 75.7 74.5 74.4
PricesOil prices (US/Ibbl) Lk 28.9 17.6 15.1 17.9 22.6Non-oil terms of trade (1983184-100) .k 100.0 96.3 101.1 95.9 92.0Domestie inflation (I p-a.) lg 16.2 7.9 9.3 6.5 7.9
JA Balance of payments an fiscal data are for fsocal years (starting April 1). other ndicators are forcalendar years.
Lk For last year of multi-year periods./c As measured by the consumer price index, with an adjustment for rice prices during 1987-89Id For 1982183.
Sources Central Bureau of Statistics and World Bank staff estimates.
environment was maintained by reducing the current account deficit;concurrently, the Government's fiscal and monetary management succeeded inlowering fiscal imbalances and domestic inflation. Despite the stringentadjustment measures, reforms of trade and industrial policy elicited a strongsupply response that fostered GDP growth averaging 5.5% between 1986-88, andthen accelerating to over 7% in 1989 and 1990. A remarkable feature of

- 27 -
the Indonesian adjustment experience has been the continued reduction in theincidence of poverty in both urban and rural areas.2!
Economic Developments During 1990/91 i/
2.03 Economic activity continued at a brisk pace during 1990. GDP growthis estimated at 7.1% with non-oil GDP rising by about 7.8%, indicating thatthe economy continued to respond strongly to the ongoing structural reforms(see Table 2.1). The driving force behind economic activity has been theprivate sector, particularly private investment demand, which grew by nearly20% in response to the widespread opportunities afforded by deregulation.Private consumption expenditures also increased sharply (7.9%) after severalyears of modest growth. These trends were accommodated by monetary and creditpolicies during 1989 and early 1990. Both Government consumption andinvestment also grew strongly in 1990, adding to pressures in the domesticeconomy. This surge in domestic demand translated into a rapid growth ofimports, mostly for investment goods, and was accompanied by a slowdown inexports, substantially diminishing the contribution of the external sector toGDP growth. Sectorally, growth in the non-oil manufacturing sectoraccelerated to 12.8% in 1990, providing a strong impulse to economic growth.As the exports of non-oil manufacturing goods slowed during 1990, growth inthis sector was driven by consumer goods industries and domestic constructionactivities.
2.04 Trends in inflation in 1990/91 suggest that the economy began toexperience capacity constraints arising from the surge in domestic economicactivities. The consumer price index (CPI) showed an average annual growthrate of 7.9% in 1990 compared with 6.3% in 1989; but, the CPI in December 1990was 9.9% higher than in December 1989, reflecting the rising trend ininflation during the year.A/ Moreover, the prices of non-traded goods,those most sensitive to domestic demand conditions, increased by 12.6% during1990 compared to 5.2% in 1989 (see Table 10, Annex 1). Inflation began toslow towards the end of fiscal year 1990/91. But, the Government remainsconcerned about the reemergence of inflationary pressures in the economy andwill continue to monitor trends in price levels closely.
2.05 Since Indonesia's economy is very open, much of the domestic demandpressure translated into pressure on the balance of payments during 1990/91.The non-oil trade deficit widened sharply (see Figure 2.1). This was partlydue to a slowdown in non-oil exports but mainly due to a rapid increase innon-oil imports. Non-oil export growth slowed due to three factors: a sharpdownturn in commodity prices; diversion of exports into the local market; andspecial factors, such as the emergence of capacity constraints in some
2. For further details, see Indonesia: Strategy for a Sustained Reduction inPoverty, A World Bank Country Study, World Bank, November 1990.
i/ Economic developments during 1990/91 are analyzed in greater detail in
Annex 1.
i/ The average annual rate of inflation is calculated as the percentagechange between the simple average of the monthly 27-city CPI in 1989 andthe average in 1990.

- 28 -
manufacturing activities, production difficulties (e.g. aluminum), and theimposition of a prohibitive export tax on sawn timber. On the other hand,non-oil imports rose rapidly, growing by about 25% in real terms. Capitalgoods accounted for two thirds of the increase in imports, reflecting therapid increase in private investment. A large proportion of capital goodimports was machinery, especially for textile and footwear exports. Consumergoods imports also began to grow rapidly, albeit from a small base. Althoughthe brisk pace of economic activity largely explains the surge in non-oilimports, accommodating monetary policy designed to lower interest rates inlate 1989 and early 1990 also contributed. Higher imports during 1990/91 werepartly offset by higher earnings from oil/LNG due to higher oil prices and oilproduction as a result of the Gulf crisis; the oil/LNG current account surplusimproved to US$5.9 billion in 1990/91, about US$2.0 billion higher than in1989/90 (see Table 2.2). Net non-oil service receipts remained at roughly thesame level as in 1989/90. Overall, the current account deficit widened toUS$3.8 billion (about 3.8% of GNP), roughly double the 1989/90 level.
2.06 There were important changes in the sources of financing for thecurrent account deficit. Gross public disbursements declined substantially toUS$4.9 billion in 1990/91; as a result, net disbursements were only slightlypositive. This reflects the fall in commitments of special assistance, asexpected, and a large decline in the use of commercial credits. A substantialincrease in private capital inflows was the main source of balance of payments
Fig. 2.1 Trends in Non-oil Trade la1989-1991
25 SS billions
20-
f ~~155 -10
1 2 3 4 5 6 7 8 9 10 1112 1 2 3 4 5 6 7 8 9 10 1112 1 21909 1990 1991
- Non -oil Exports -I Non-oil Importsla CumulatIBV Non-oli trade daLa tot tbe previous 12 months.
Source Cential Bureau of Statistics.

- 29 -
Table 2.2: BALANCE OF PAYMENTS, 1986/87-1990/91(US$ billion at current prices)
Actual Estimate1986/87 1987/88 1988/89 1989/90 1990/91
Merchandise exports (fob) 1L3. 18.3 .1.A 23. 28.1Oil & LNG 7.0 8.8 7.6 9.3 12.6Non-oil 6.7 9.5 12.2 14.3 15.5
Merchandise imports (cif) -12.8 -14.9 -16.2 .19.5 -26.0Oil & LNG -2.4 -3.1 -2.6 -3.1 -4.2Non-oil -10.4 -11.8 -13.6 -16.4 -21.8
Trade balance 0.9 3.4 3. A Li
Non-factor services (net) -1.5 -1.2 -1.2 -1.2 -0.7Interest payments (MLT) -2.5 -2.7 -3.0 -3.1 -3.1Other factor services andtransfers (net) -1.1 -1.4 -1.3 -1.6 -2.1
Current account balance -4.2 i L.9 -1.8 -3.8Oil/LNG current account 2.6 3.6 3.0 3.9 5.9Non-oil current account -6.8 -5.5 -4.9 -5.7 -9.7
Public MLT loans (net) LA Li . O.5Disbursements 5.2 6.0 7.3 6.1 4.9Principal repayments La -2.8 -4.2 -4.1 -4.6 -4.4
Other capital (net) -0.7 1.0 -1.6 0.3 7.4
Use of net foreign assets 2.5 -0.9 0.3 0.0 -4.1Use of official reserves 0.7 -1.0 0.6 -0.3 -3.4Use of comm. bank reserves 1.8 0.1 -0.3 0.3 -0.7
Mdemo items:Net official reserves (US$ bln.)/b 5.0 6.0 5.4 5.7 9.1
- Months of imports /c (4.1) (4.4) (3.3) (2.6) (3.9)Total net foreign assets
(US$ bln.) 10.0 10.9 Ld 10.6 10.6 14.7Current account/GNP (%) -5.9 -2.6 -2.3 -2.0 -3.8Non-interest current accountbalance (% of GDP) -1.7 1.9 2.1 2.2 0.1
MLT debt service/exports (%) Le 39.7 34.8 34.4 31.6 27.3
/a Includes prepayments of US$626 million in 1987/88, US$341 million in1988/89 and US$300 million in 1989/90.
/b Net official reserves are defined as gross official reserves minusoutstanding liabilities to the IMF and other short term liabilities.
/c Net official reserves in months of next year's expected imports (oil/LNGand non-oil) of goods.
Ld Excludes US$326 million of prepayments, committed during the year but notcompleted until June 1988.
Lg Debt service on public and private debt, excluding prepayments;denominator is gross exports of goods and services.
Source: Bank Indonesia and World Bank staff estimates.

- 30 -
financing during 1990/91. Data on financial commitments between the privatesector and offshore financial institutions indicate that disbursements ofprivate debt were about US$6 billion, which implies a doubling in the level ofprivate non-guaranteed debt during 1990.V/ This increase in privatenon-guaranteed debt largely reflects inflows related to private sectorinvestment. These private sector inflows were in sharp contrast to the past.While the majority of the inflow was related to private investment, state andprivate commercial banks borrowed substantially abroad in order to lend todomestic customers.§/ Much of the private foreign borrowing was swappedwith Bank Indonesia (BI), leading to a sharp increase in swaps outstandingwith BI. Higher private inflows and a reduction in the net foreign assets ofcommercial banks more than offset the decline in net public borrowing and thecurrent account balance. This allowed BI's net official reserves to increaseto US$9.1 billion, more than three months of next years' expected imports.However, about half of these reserves are swaps, which are a contingentliability of BI.
2.07 The Government took a number of important policy measures during1990/91 to curb demand pressures. These pressures were generated primarily bythe private sector's response to deregulation, but monetary policy actionsduring the previous fiscal year also contributed by expanding liquiditycredits and reducing interest rates. Signs of domestic demand pressuresemerged in the first quarter of 1990/91 through a loss of internationalreserves, emerging inflationary pressures, and a deterioration in the non-oiltrade balance. In the face of these trends, the Government began to tightenmonetary nolicy. The main instrument was a reduction in subsidized liquiditycredits, which had been announced in January 1990.17/ Liquidity creditsdecreased by Rp.3.8 trillion by end-December 1990 from their peak at end-March1990 and reserve money growth was restrained to 19% during 1990. The loss ofinternational reserves was quickly reversed by the higher domestic interestrates resulting from tighter monetary policy (see Figure 2.2).
2.08 A number of factors, however, limited the effectiveness of thetightening of monetary policy in slowing domestic demand. First, Indonesia'sopen capital account, in combination with the removal of restrictions onoffshore borrowing by domestic financial institutions and the availability ofinternational capital, generated large private capital inflows. The exchangerisk on tl'ese capital inflows also could be hedged on attractive terms throughBI's swap facility. Second, tax receipts, which are normally held at BI, andforestry fees were allowed to accumulate in the Government's accounts with thestate commercial banks. Third, the dynamics of the newly deregulated
l./ These disbursements are included in "other capital net" in Table 2.2.
i./ As indicated by the growth in credit, a portion of this lending,particularly from the private national banks, was for consumer loans andreal estate transactions, particularly in the first half of the fiscalyear.
2/ The Government also made efforts to increase the sales of SBIs (BIs moneymarket instruments), but the stock of SBIs outstanding actually declinedduring 1990, largely reflecting the BI's reluctance to allow SBI interestrates to rise to the levels needed to increase the stock outstanding.

- 31 -
financial sector contributed to excessive credit growth as private nationalbanks aggressively sought to expand their market share, often at the expenseof short-term profitability. This also led to dramatic changes in therelationships among monetary aggregates, complicating monetary management.Finally, expectations were that the monetary tightening would be short-livedand therefore, the private sector was slow in adjusting its activities. As aresult, domestic liquidity continued to grow rapidly, with broad money risingby 44% during 1990 and domestic credit to the private sector rising by 58%(see Figure 2.3).
2.09 The Government subsequently took steps to improve the effectivenessof monetary policy. The swap premium was adjusted to reflect more accuratelythe differential between domestic deposit rates and offshore rates. Thisreduced the incentive to arbitrage borrowing between on-shore and off-shoremarkets. Tax revenues were also required to be transferred to BI. TheGovernment tightened monetary policy further by requiring, in February 1991, amassive transfer of public enterprise deposits from the banking system intoSBIs. To offset the loss of deposits in the banking sector, BI purchasedSBPUs of various maturities from the banking system. The increased stock ofSBIs and the shorter-maturity SBPUs will give BI considerable flexibility toconduct monetary policy during 1991. In March 1991, the Government tookfurther steps to improve the effectiveness of monetary policy. These includedlimiting the use of the swap facility and reducing the net open position inforeign exchange from 25% of equity to 20%. It is expected that thesemeasures will lead to a significant slowdown in the growth of money andcredit. Nevertheless, trends in monetary aggregates will need to be monitoredcarefully to ensure that the monetary stance is having the desired effect.
2.10 Fiscal DoliCy in 1990/91 was conservative compared to previous years,despite the large increase in oil revenues. The 1990/91 budget would haveimplied a deficit of about 1.9% of GDP. Higher oil revenues combined with abetter non-oil revenue performance permitted a surplus of 2.0% of GDP (seeTable 2.3). Evidence of the Government's conservative budgetary stance wasthe decision to allocate Rp.2 trillion of the oil revenue windfall into areserve fund for development expenditures. Nevertheless, the conservativebudgetary stance was insufficient to constrain aggregate demand, primarilybecause private sector demand, especially investment demand, grew much morerapidly than expected. This suggests the need for cautious fiscal policy in1991/92 to complement the monetary policy measures taken in February and March1991. The 1991/92 Budget explicitly acknowledged the importantcomplementarity between fiscal and monetary policy, noting the need to improvethe balance of payments and to reduce inflationary pressures. It also notesthe need to reduce and, in time, eliminate the subsidies on domestic fuel andelectricity. The Budget assumed a US$19/barrel price of oil, which at thetime of the Budget Speech (January 1991) was a conservative assumption. Italso implied a decrease in net domestic expenditures from 2.2% of GDP in1990/91 to 1.2% in 1991/92. However, total expenditures were budgeted to riseby 18% compared to the 1990/91 Budget, with development expendituresincreasing by over 23%, resulting in a shift from a fiscal surplus to a

- 32 -
FIGURE 2.2:TRENDS IN INTEREST RATES AND RESERVES
U USC bibllonsj u
24-
16 -
6 7 8 9 10 '11 12 1 2 3 4 S 6 7 8 9 1 1 12 1less logo 1951
la 3 month State bank lime deposit
FIGURE 2.3;TRENDS IN MONETARY AGGREGATES
Ipercentage change yeag on yesrl
% annual change
l ~~~~~~~~Domestic ciedit growth/40 . . _ . ... .-. ......
40> - ~~Broad money growlh
O . ....................... ..............
6 7 8 9 10 11 12 1 2 3 4 5 6 7 8 9 10 11 12 1lgos 192C .2.
Source: Bank Indonesia

- 33 -
Table 2.3: CENTRAL GOVERNMENT BUDGET, 1986/87-1991/92(Rp. trillion at current prices)
Actual Estimate Bugte1986/87 1987/88 1988/89 1989/90 1990/91 1991/92
Revenue and grants 16.7 L1. 2.L 40.2Oil and LNG taxes 6.3 10.6 9.9 11.8 18.9 15.0Non-oil taxes 7.9 8.8 11.9 15.4 20.7 22.4Non-tax revenues /a 2.2 2.0 1.6 2.1 2.3 2.8Grants 0.3 0.4 0.5 0.7 0.8 0.0
Current expenditures 13.4 15.3 1.L 19.8 A. 24.8External interest 2.8 3.7 4.3 4.5 4.8 5.2Subsidies 0.9 1.4 1.0 1.5 4.0 1.4Other 9.7 10.2 11.5 13.8 15.2 18.2
Government savinas 3.3 6.5 1 1Q.2 18.7 .LA
Canital expenditures MiQ "A.6 11.6& ILI 16.9
Budget balance -3.5 -2.5 .-3.5 -.LA 4.0 -1.4
Financed by:External loans (net) 3.2 2.3 .21.5Disbursements 6.8 8.8 11.5 10.2 8.8 10.4Principal repayments 3.6 6.5 6.5 7.6 7.6 8.9
Asset drawdown.3 0.2 -1.5 .. O
Memo items (% of GDP):Non-oil taxes
(% of non-oil GDP) 9.3 8.6 10.0 11.2 12.9 12.2Government savings 3.0 5.0 4.8 5.9 9.5 6.9Budget balance -3.3 -1.9 -2.4 -0.8 2.0 -0.7Total expenditure 18.8 18.9 18.6 18.3 19.7 18.7Net domesticexpenditure lb 3.2 3.8 2.7 2.4 2.2 1.2
Primary balance /c -0.5 1.0 0.6 1.9 4.6 1.7
/a Includes domestic oil surplus in 1986/87.b Defined as the domestic content of expenditure less non-oil revenues./c Budget balance net of external interest payments.Ld Includes Rp.2.0 trillion allocated to reserves in the development budget.
Source: Ministry of Finance and World Bank staff estimates.

- 34 -
deficit. The Government, however, recognizes the need to avoid exacerbatingexisting demand pressures in the economy and plans to maintain a prudentfiscal policy stance.
2.11 Exchange rate management continued to be directed towards maintainingthe competitiveness of non-oil exports. After a small appreciation in thefirst half of 1990, the real effective exchange rate (REER) depreciated byalmost 7% in the twelve months ending in January 1991, as the Government hasmoved to maintain non-oil export competitiveness by accelerating thedepreciation of the Rupiah against the US Dollar.
2.12 In summary, recent economic developments can be characterized byrapid economic growth, higher inflation and a deteriorating non-oil tradebalance. Private sector demand, particularly investment demand, has been thedriving force behind this surge in economic activity, reflecting a vigorousresponse to the Government's deregulation policies of the last several years.Monetary and credit policies in late 1989 and early 1990 lowered domesticinterest rates and accommodated this rapid growth in demand. In response tothe emerging macroeconomic pressures, the Government has acted to slowaggregate demand. Monetary measures taken during 1990/91 raised interestrates and stopped the capital outflows experienced early in the fiscal year.Fiscal policy was restrained during 1990/91, with budgetary expend&-ures (netof the oil subsidy) contained at about the 1990/91 Budget levels despite asignificant increase in oil revenues and higher non-oil tax receipts.However, fiscal policy was insufficiently tight to ease inflationary pressuresand contain the deficit on the non-oil trade account. During 1991/92,macroeconomic policies need to ensure that higher inflation and adeteriorating non-oil trade balance do not erode the gains of the past severalyears in restoring macroeconomic stability, easing the debt burden, andreducing the economy's dependence on oil.
C. A Macroeconomic Strategy and Policy Framework for the 1990s.
2.13 Macroeconomic policy during the 1990s needs to support a sustained,rapid growth in nLon-oil GDP at around 6-7% p.a. to enable Indonesia to realizeits development objectives of increasing per capita incomes and reducingpoverty. The dramatic structural changes of the 1980s have positioned theeconomy to make progress towards achieving these development objectives duringthe 1990s. An important aspect of macroeconomic policy during the 1990s willbe to ensure that the growth path is consistent with macroeconomic stabilityso that Indonesia's sizeable debt burden is eased. In the 1980s, theGovernment demonstrated the ability to take firm and timely actions to restoremacroeconomic stability and this will be equally important during the 1990s.However, managing an economy in which the private sector has a larger and moreimportant role will be the key macroeconomic challenge of the 1990s.Structural changes have dismantled many of the Government's direct controlsover the economy, such as credit and interest ceilings, limits on offshoreborrowing, import restrictions, and industrial and investment regulations.Fundamental reforms of the financial sector have also changed the underlyingrelationships among monetary aggregates, complicating monetary management.Consequently, macroeconomic management will have to rely increasingly onindirect mechanisms. This implies the need for careful monitoring of economic

- 35 -
trends so that timely policy adjustments can be made, thereby avoiding costlyinterruptions in the growth process and maintaining the confidence of thebusiness community.
2.14 The emergence of inflationary pressures and a deteriorating non-oiltrade balance during 1990/91, coupled with the expected slowdown in the worldeconomy and uncertainties surrounding the oil price, require that decisiveactions be taken in the near term to ensure that the economy follows asustainable growth path. This will stabilize the economy with little cost tomedium-term growth and without undermining the confidence of the domestic andinternational community in Indonesia's macroeconomic prospects. Restoringmacroeconomic stability in the near term, while preserving the economy'smedium-term growth prospects, implies policy actions in three interrelatedareas: (a) a continuation of policies to support non-oil export growth;(b) monetary policy designed to complement fiscal policy and preserveIndonesia's international reserves; and (c) fiscal policies to dampenaggregate demand while preserving key expenditure priorities, particularly ininfrastructure. Given the substantial uncertainties in the world economicoutlook, including the possibility of oil prices declining more thanprojected, Indonesia will need to maintain its substantial foreign exchangereserves and borrowing capacity. This will provide Indonesia with theflexibility needed to respond to adverse external shocks.
2.15 Exort growth. A continuation of policies to support non-oil eZRortgrowth is central to Indonesia's macroeconomic strategy for the 1990s. Thisincludes maintaining a competitive exchange rate through coordinated fiscal,monetary and exchange rate policies. More reliance on monetary and fiscalpolicy to slow domestic inflation will help minimize inflation differentialsbetween Indonesia and its trading partners, thereby reducing the need fornominal adjustments of the exchange rate to maintain a competitive REER. Thiswould also reduce inflationary expectations. Domestically-imposedrestrictions on non-oil exports are an important factor behind the slow growthof non-oil exports in 1990/91. The prohibitive export tax on sawn timberalone has resulted in a net loss of more than US$500 million in exp0oa-receipts during 1990/91.j/ Other direct export restrictions, such as thoseon rattan and cement, and indirect export restrictions, such as thosecontained in some investment licenses, also have reduced non-oil exportsgrowth. Restoring non-oil export growth will require reducing the scope ofexport restrictions further.2/ Policies to conserve energy and slow thegrowth in domestic demand for oil products will help sustain net oil exportsin the medium-term.
2.16 Monetary policy. Given Indonesia's open capital account, domesticinterest rates are closely tied to international interest rates and exchangerate expectations. This limits the ability of monetary policy to influence
t/ If increased taxation on wood is desirable for environmental reasons, thiscould be accomplished more efficiently through an increase in the stumpagefee, as this does not discriminate between domestic and export activities.
2/ A continuation of the Government's deregulation policies will also beextremely important to non-oil competitiveness over the medium-term; thisis discussed extensively in Chapter 3.

- 36 -
interest rates except in the short term. An expansionary monetary policydesigned to achieve low domestic interest rates, as was attempted during 1990,will lead to higher inflation, capital outflows and balance of paymentsinstability. Conversely, efforts to contract demand through tight monetarypolicy will raise domestic irnterest rates, leading to capital inflows thatwill push down interest rates and offset the decline in domestic credit. Themovements of net foreign assets and domestic credit to the private sectorduring 1990/91 illustrate this process. In an open capital account, monetarypolicy is most effective in achieving a target level of foreign exchangereserves. Once that target is reached, fiscal and exchange rate policies areneeded to reinforce monetary policy. Lower domestic interest rates can onlybe sustaired in two ways: (i) through coordinated monetary and fiscal policiesthat result in lower inflation and dampen expectations of exchange ratederreciation, thereby reducing the margin between domestic and internationalinterest rates; and (ii) through the full implementation of financial sectorreforms and other measures that strengthen the financial sector, and improveefficiency, thereby reducing intermediation margins.
2.17 The conduct of monetary policy during 1990/91 pointed out severalareas for improvement. First, full information on monetary aggregates isavailable only after a three-month delay. This, to some extent, prevented theGovernment from making timely adjustments to monetary policy. Fastercollection and compilation of data from deposit money banks through anautomated bank reporting system would enhance the Government's ability toconduct monetary policy. Second, monetary policy needs to be bettercoordinated among the various Government departments. The Monetary Board orits Secretariat is well positioned to ensure effective coordination ofmonetary policy between Government departments and agencies and BankIndonesia. Third, the main monetary policy instrument of Bank Indonesia, theSBI, has not been effective in contracting base money for several reasons:(i) the maturity of SBIs was very short, only up to six months; (ii) there isno secondary market in sBIs; and (iii) the achievement of quantity targets forSBI auctions has been constrained by interest rate targets. The recenttightening of monetary policy in February and March 1991 has increasedsignificantly the stock of SBIs outstanding and lengthened the maturity ofSBIs to one year. However, for the SBIs to be an effective tool of monetarymanagement, a quantity target must be set and the SBI interest rate allowed torise until the target is reached.
2.18 The monetary adjustments introduced in February and March 1991 werean important step in achieving a tighter monetary policy stance in order toreduce pressures on the balance of payments and prices. Trends in monetaryaggregates will need to be watched closely over the year to ensure that themonetary stance is having the desired effect and that an adequate resezvecushion is maintained. In this regard, the continued implementation of theGovernment's policy to reduce liquidity credits will be essential. Finally,given the experience gained in the conduct of monetary policy since thereforms of October 1988 and the important capital adequacy standards and otherprudential norms recently introduced, it is an opportune time to assess thescope for modifying reserve requirements, including the possibility ofestablishing norms for bank liquidity.
2.19 Fiscal Polac. Monetary policy needs to be supplemented by a more

- 37 -
active use of fiscal policy. This will require raising revenues, reducingsubsidies, and curtailing other budget and off-budget expenditures. To beeffective in restraining demand, the resulting budgetary surplus will need tobe retained by increasing the Government's financial assets or spending onlyin ways that do not add to aggregate demand. (her the medium term, thecorrection of macroeconomic imbalances, coupled with improvements in publicresource mobilization will allow an expansion of capital spending in priorityareas.
2.20 Reducing budgetaxy subsidies will help to ease demand pressures andimprove resource allocation through better price signals. As PresidentSoeharto noted in the 1991/92 Budget speech,
wour oil resources are not excessive... .The price of fuel oilsconstitutes... a very important element in enhancing the efficient useof energy.... Consequently, from time to time, we must makeadjustments to energy prices, both for fuel oils and electric power.Although subsidies are still being provided in the 1991/92 DraftState Budget, gradually and conscientiously, we must reduce and, atthe right moment, stop them."
Regarding oil product prices, a rapid growth of domestic demand is reducingIndonesials exportable surplus, thereby contributing to the deterioration inthe balance of payments and bringing nearer the day when Indonesia becomes anet importer of oil. Moreover, at present oil prices, there is littleincentive for the efficient use of energy. Other Asian countries haverecognized the positive benefits of higher domestic fuel prices for energyefficiency, the balance of payments and the environment and have raised pricesto levels which are significantly higher than those prevailing in Indonesia(see Table 2.4). The situation is similar for electricity prices. Higherelectricity prices would help slow demand growth in the power sector. Thiswould result in slower growth in domestic oil consumption (since powergeneration accounts for a large share of domestic oil), lower investmentrequirements in power generation and higher public revenues. Finally, thesubsidy on fertilizer amounted to about Rp.660 billion in 1990/91.Adjustments to these prices will help to improve efficiency of resource use,while reducing demand pressures in the economy.
2.21 The Government's priorities in public resource mobilization need tobe intensified. Additional non-oil tax revenues could be generated throughimproving tax administration and selective rate increases, targeted towardsthe better off. Increasing these non-oil tax revenues is also likely to havea positive effect on income distribution, as well as helping to manageaggregate demand. Policies to strengthen the Government's resourcemobilization and to improve local government's finances are discussed inSection E below.
2.22 An important determinant of the Government's fiscal policy stance isthe level of Rublic expenditures both in the Budget and by public enterprises.The 1991/92 Budget appropriately places priority on expenditures in two keyareas: infrastructure (power, transport and telecommunications) to supportprivate sector development; and poverty-related sectors. These expenditurepriorities are critical to preserving the economy's medium-term growth

- 38 -
Table 2.4: COMPARATIVE DOMESTIC SALES PRICES FOR PETROLEUM PRODUCTS, 1990/91(Rp./liter)
Indonesia Malaysia Singapore Thailand Philippines Korea
Avgas 330 1,405 1,998 ... ...Avtur 330 280 785 ... ... ...Gasoline 450 741 1,222 768 1,352 1,000Kerosene 190 497 454 647 536 498ADO 245 455 499 623 536 480IDO 235 301 489 608 536 488Fuel oil 220 210 281 315 356 354
Average /a 267 475 594 611 664 565
- Weighted by Indonesia's estimated product mix for 1991/92. Excludes Avgasand Avtur.
Source: Ministry of Finance.
prospects and to maintaining the momentum on poverty reduction. Moreover,many expenditures plant..-d by public enterprises are designed to createinfrastructure and avoid the emergence of infrastructural bottlenecks thatcould be detrimental to the economy in the long run. However, given existingdemand pressures in the economy and the need to improve macroeconomicbalances, the overall public expenditure program (including publicenterprises) needs to be reviewed carefully. Those expenditures not directlyrelated to the Government's overall expenditure priorities may need to bereduced or rephased. In 1983, many large import- and capital-intensiveprojects were rephased resulting in rapid improvements in the balance ofpayments without adversely affecting economic growth. The sharpening ofexpenditure priorities which resulted was a key factor in the Government'sprogress on reducing poverty during 1983-88. Similarly, a sharpening ofpriorities in 1991/92 will allow the Government to focus expenditures in thecritical areas necessary to enhance the economy's long term growth prospects,while improving macroeconomic balances in the near term.
D. Medium-Term Macroeconomic Proiections
Growth ProsRects
2.23 This section provides illustrative macroeconomic projections based onthe World Bank's current forecast of the external environment (see Annex 3)and on the Government implementing the macroeconomic strategy as described inSection C. The correction of emerging macroeconomic imbalances will constrainaggregate demand in the short term. Both consumption and investment growthrates will decline. This in turn will lower growth in construction andservices sectors. Higher interest rates and a tighter fiscal policy stance

- 39
will also tend to slow the growth of output in the economy in the short termto about 5.7%. However, this is still a rapid rate of growth and is above thetarget set for REPELITA V. The agriculture sector is expected to return toits trend growth path, reversing the slowdown in 1990 and providing an impetusto non-oil GDP growth. Even so, non-oil GDP growth will slow to 6.0% p.a.during the next two years, as compared with an average of 8% over the past twoyears (see Table 2.5).
2.24 Over the medium term, as macroeconomic balance is restored, the rateof growth in the non-oil economy can rise and be sustained at around 7% p.a.This will be fuelled by improvements in productivity resulting from structuralreforms and a strong investment effort. Substantial buildups of productioncapacity in the agriculture and manufacturing sectors, as well as supportingimprovements in economic infrastructure are incorporated in the base caseprojections. This capacity creation will allow non-rice agriculture, non-oilmanufacturing and non-oil exports to provide the main stimuli to futuregrowth. Accordingly, fixed investment is projected to grow quite rapidly(about 8% p.a.), reaching around 27% of GDP by 2000, five percentage pointshigher than the 1990 level. To finance this increase at the same time thatthe current account deficit is being reduced, national savings will have togrow faster than investment. This will require effective public resourcemobilization combined with expenditure restraint. Structural change in theeconomy will continue, with the share of non-oil manufacturing increasing fromabout 15% of GDP in 1990 to nearly 24% in 2000.
External Balance
2.25 The balance of payments projections assume that the Government takesdecisive actions to correct the widening gap in the non-oil trade balance (seeTable 2.6). These actions include: measures to slow the growth of domesticfuel consumption to about 10% in 1991/92; coordinated fiscal and monetarypolicy to slow aggregate demand growth; and trade policies to stimulatenon-oil export growth. These actions are expected to constrain import growthin 1991/92, with non-oil imports increasing by only 1% in real terms. This,combined with an improvement in non-oil export growth, results in asubstantial improvement in the non-oil current account balance in 1991/92,which continues into the medium-term, reversing the trend of the past twoyears. Nevertheless, lower prices for oil exports and increased domestic oilconsumption offset these gains in 1991/92. Consequently, the current accountdeficit is projected to rise to US$4.3 billion in 1991/92 (about 4.1% of GNP)and decline only to US$4.1 billion in 1992/93 (about 3.6% of GNP). Financingcurrent account deficits of this magnitude while maintaining the level ofreserves will require additional efforts to mobilize quick-disbursing officialassistance, continuing inflows of private capital and commercial borrowing.
2.26 Over the medium term, the pressures on the balance of payments can beexpected to ease, as new export capacity comes on stream. In the basescenario, world demand for Indonesia's exports picks up and the demand forimports return to more normal levels. This is expected to reduce the currentaccount deficit steadily over the medium term, reaching 1.8% of GNP by theyear 2000. However, management of the balance of payments throughout the1990s will require a careful balancing between the growth required to absorbthe labor force at increasing levels of productivity and the need to achievefurther improvement in Indonesia's debt-servicing capacity.

- 40 -
Table 23: PROJECTIONS OF KEY MACROECONOMIC INDICATORS i
Estimated Projected1990 1991 1991-95 1995-2000
Average growth rates (% R.a.)GDP 7.1 5.7 5.6 5.9Non-oil GDP 7.8 6.0 6.6 7.0Agriculture 2.5 3.0 3.4 3.5Manufacturing 12.8 10.0 10.7 11.0Mining 4.1 5.0 5.7 6.0Construction 12.1 7.0 7.5 7.8Other services 8.2 5.8 6.2 6.3
GNY 8.2 4.7 6.2 6.6Non-oil exports 6.7 12.2 10.5 7.6Non-oil imports 25.4 1.0 8.1 6.9Fixed investment 16.2 6.5 7.9 8.6
Public 9.6 3.1 6.7 7.6Ptivate 19.9 8.3 8.5 9.1
Consumption 7.9 5.0 5.2 5.9
Macroeconomic Balances Current account/GNP -3.8 -4.1 -2.0 -1.8Non-interest current account/GNP 0.1 0.5 1.7 0.9Overall public sector balance/GDP 1.8 1.6 1.2 0.8MLT debt service/exports 27.3 31.2 25.9 19.9MLT debt/exports 183.1 177.2 145.2 110.0MLT debt/GNP 58.6 57.6 50.3 39.2
Structure of the economy LbNon-oil manufacturing/GDP 14.9 15.5 18.8 23.7Non-oil exports/non-oil imports 71.0 79.3 91.3 95.7Public savings/GDP 9.6 10.2 10.1 10.2National savings/GDP 21.4 20.8 24.3 27.3Fixed investment/GDP 22.9 23.3 24.8 27.5Private fixed investment/Total fixed investment 63.0 63.1 64.2 65.9
Consumption/GDP 73.7 74.0 71.1 69.2Consumption/GNY 74.4 74.6 72.2 70.2
PricesOil prices (US$/bbl) Lk 22.6 19.4 21.3 31.3Non-oil terms of trade (1983/84-100) & 92.0 92.4 97.5 98.4
/a Balance of payments and fiscal data are for fiscal years (startingApril 1). Other indicators are for calendar years.
/b For last year of multi-year periods.
Source: Central Bureau of Statistics and World Bank estimates.

- 41 -
Table 2.6: BALANCE OF PAYMENTS PROJECTIONS, 1990/91-2000/01(US$ billion)
Estimated Proiected1990/91 1991/92 1992/93 1993/94 1995/96 2000/01
Gross merchandiseexports (fob) 2L 3.1 323.3 4.L4 1.3Oil and LNG 12.6 11.1 9.7 10.4 11.7 15.2Non-oil 15.5 19.0 22.7 25.9 31.7 56.1
Gross merchandiseimports (cif) -26.0 -28.2 -30.4 -33.5 -39.2 -C7.1Oil and LNG -4.2 -4.2 -3.9 -4.4 -4.5 -8.5Non-oil -21.8 -24.0 -26.5 -29.1 -34.7 -58.6
Trade balance 2 1 1_9 2.0 4.2 4.2
Net non-factor services -0.7 -0.6 -0.4 -0.3 -0.3 -0.1MLT interest payments -3.1 -3.9 -4.0 -4.0 -4.2 -4.7Other factor servicesand transfers (net) -2.1 -1.7 -1.7 -2.0 -2.6 -3.5
Current account balance -3.8 -3.1 . -2L. -J4.1iOil/LNG current account 5.9 4.2 3.3 3.2 3.7 1.9Non-oil current account -9.7 -8.5 -7.4 -6.7 -6.6 -6.0
Public HLT loans (net) Q.5. Q0.5 1. L3Disbursements 4.9 5.3 5.3 6.4 7.2 10.4Principal repayments -4.4 -4.7 -4.8 -5.1 -4.4 -7.0
Other capital (net) 7.4 3.7 3.6 3.0 2.5 4.4Use of net foreignassets -4.1 0.0 0.0 -0.8 -2.4 -3.7
Memo items:Net official reserves(US$ bln)/a 9.1 9.1 9.1 10.5 13.7 31.0(in mons. ofimports) & (3.9) (3.6) (3.3) (3.4) (3.8) (5.0)
Total net foreignassets (US$ bln) 14.7 14.7 14.7 15.5 19.8 36.8
Current account/GNP (%) -3.8 -4.1 -3.6 -2.9 -2.0 -1.8Non-interest CA/GNP 0.1 0.5 0.7 1.2 1.7 0.9MLT debt service/exports (4) 27.3 31.2 30.9 29.6 25.9 19.9
La Net official reserves are defined as gross official reserves minusoutstanding liabilities to the IMF and other short term liabilities.
i Net official reserves in months of next year's expected imports (oil/LNGand non-oil) of goods.
Source: World Bank staff estimates.

- 42 -
2.27 Non-oil exports are projected to grow by 8% a. in real terms duringthe 1990s. This will require maintaining the compet 4veness of the exchangerate, and reducing the domestic cost of production rough continuedderegulation of trade policy, particularly a reduction in export restrictions,and other regulations and provision of supporting services. The prospects forIndonesia's non-oil exports remain bright despite the slowdown in 1990.First, in the near term, substantial export capacity in labor-intensive,non-oil manufacturing sectors is expected to come on stream, easing existingcapacity constraints. Capacity in existing export iilustries is beingexpanded and investments in new, manufacturing export industries are growingdramatically. Data obtained from the Investment Coordinating Board (BKPM) onrecent investment approvals for foreign and domestic investment also indicatethat these investment outlays are being directed into export-orientedactivities, particularly in textiles, footwear, agroprocessing and woodprocessing industries. Second, Indonesia's share of the market for mostmanufacturing products (excluding plywood and textiles) is still small,leaving room for expansion. Market access is also being enhanced since muchof the investment in non-oil manufacturing export capacity is from Korea,Taiwan and Japan, allowing Indonesia to raise its exports to these growingmarkets, as well as to take advantage of their market access and marketinginfrastructure in Europe and North America. Accordingly, the base caseassumes that although non-oil export growth will slow from the rate of thepast several years, their growth will still be robust (about 11% p.a.) in thenear term, and then slow to about 8% p.a. over the medium term (seeTable 2.7).
-Table 2.Z: NON-OIL EXPORT GROWTH PROJECTIONS(real growth rates, % p.a.)
Anctual Proiected1985/86- Estimat 1991/92 1992/93- 1996/971989/90 1990/91 1995/96 2000/01
Non-oil manufactures 23.6 17.4 10.9 13.3 8.4Textiles 28.2 24.5 20.0 14.5 9.0Plywood 19.1 7.0 0.0 3.2 2.0Other 24.0 19.4 11.0 16.9 9.9
Agriculture 8.6 -6.5 15.5 5.1 5.3
Metals and minerals 9.5 0.3 9.3 8.5 7.8
Total non-oil exports 14.9 6.5 _§
Source: Bank Indonesia and World Bank staff estimates.
2.28 There are several important implications of the base case scenariofor the external financing requirements and external debt (see Section F for afurt!ier discussion). First, Indonesia will continue to require substantial

- 43 -
amounts of official assistance to finance priority public investments insupport of higher economic growth and poverty reduction. Moreover, asubstantial portion of this official assistance will need to be in the form ofquick-disbursing, sector-type loans in order to ensure adequate disbursementsinto the balance of payments. Second, the projections assume a large inflowof private non-guaranteed capital, but at a lower level than 1990/91. Twofactors are important: (i) the projections incorporate some reduction in theavailability of private foreign capital flows to developing countries during1991/92; if flows are lower than projected, then the Government will need totake further measures to preserve its reserve position; and (ii) theindebtedness of the private sector increases substantially by the end of1991/92, which has implications for exchange rate management and the overalldebt service ratio. While the effect of this trend is expected to remainmanageable, Indonesia needs to monitor trends in private sector indebtednesscarefully as they can affect Indonesia's creditworthiness. Indeed, the debtservice indicators are projected to rise slightly in 1991/92, reflecting theincrease in private sector borrowing, which offsets a continued decline in thepublic debt burden. Finally, given the projected growth in non-oil exports,the debt service ratio for public and private medium- and long-term debt (MLT)declines from 27% in 1990 to below 20% in the year 2000. Similar declines arealso achieved in the Debt/Exports and Debt/GNP ratios, indicating animprovement in Indonesia's creditworthiness and borrowing capacity.
Internal Balance
2.29 Reducing the current account deficit to more sustainable levels overthe medium-term will require that savings, particularly private savings,increase from the depressed level of the early 1990s (see Table 2.8). Evenallowing for gains in economic efficiency, the rate of fixed investment willneed to expand from 23% of GDP currently to 27.5% of GDP by 2000 to supportthe projected growth rate. These trends imply that investment and saving willhave to grow faster than output and consumption. This expansion in investmentis particularly important given the low rates of investment, especially inpublic infrastructure, during the last half of the 1980s, and the need forcritical investments to support infrastructure (e.g., power,telecommunications, roads and ports). Substantial amounts of privateinvestment will also be required to create the capacity for non-oil exports,especially in the manufacturing sector. To achieve this projected expansionof private investment, further progress with trade and industrial sectorreforms, as well as improvements in the financial sector, will be essential toenhance the profitability of private investment. Macroeconomic policy willalso be important in maintaining an environment conducive to private sectorinvestment, as it affects expectations regarding exchange rates, interestrates and inflation. In order to finance this higher level of investmentactivity while reducing the current account deficit, national savings willneed to rise from 21% of GDP in 1990 to about 27% in 2000. Part of theincrease in national savings will be achieved through an increase in privatesavings to 17.1% of GDP in 2000 from 14.9% in 1989. Household savings areexpected to improve with sustained higher economic growth, while businesssavings will respond positively to higher profitability. However, thesefactors alone will be inadequate to achieve the required increases in nationalsavings; public savings will need to rise almost one percent of GDP from thealready high level of 1990. This will require a strong effort at public

- 44 -
resource mobilization because the higher oil revenues which contributed topublic savings in 1990 are unlikely to persist over the medium term (seeSection E).
2.30 The likely improvements in public resource mobilization will beadequate to allow a growth of real public investment of about 8% p.a. duringthe 1990s, which should be sufficient to achieve the Government's expenditurepriorities. Given the projected progress in resource mobilization, thisexpansion of public expenditures would allow a growing role for the privatesector while maintaining macroeconomic stability. To ensure thecomplementarity of public investment with private investment, the publicsector investment effort will need to focus on basic infrastructure (power,roads, and telecommunications) and essential social services (health, basiceducation, water supply and sanitation, and kampung improvement).lQ/
T_bl- 2,8 SavLngs-Investment Balances, 1981-2000 La(Z of GDP at current prices)
Annual Avr Estimt- roe ctlo1981-82 1983 1984 1985 1986 1987 1988 1989 1990 1995 2000
Gross domestic investment 29.5 27.0 25.3 24.0 23.0 22.5 22.2 23.5 24.6 26.4 29.0- Fixed investment 25.1 25.1 22.3 20.5 20.1 19.2 20.0 21.2 22.9 24.9 27.5- Change in stocks 4.4 1.9 3.0 3.5 2.9 3.3 2.2 2.3 1.7 1.5 1.5
Gross national savLngs 25.2 21.0 21.7 21.5 17.5 19.1 19.9 21.4 21.4 24.4 27.3Savings-investment gap Lk -4.3 -6.0 -3.6 -2.5 -5.5 -3.4 -2.3 -2.1 -3.2 -2.0 -1.7
Public sectorGross domestic investment /c 11.7 12.0 10.2 10.3 8.5 7.9 8.4 8.2 8.5 6.9 9.4Public savings 8.7 8.9 10.0 8.1 4.9 4.9 5.4 6.5 9.6 10.0 10.2Savings-investment gap -3.0 -3.1 -0.2 -2.2 -3.6 -3.0 -3.0 -1.7 1.1 1.1 0.8
Private sectorGross domestic investment 17.8 15.0 15.1 13.7 14.5 14.6 13.8 15.3 16.1 17.5 19.6
- Fixed investment 13.4 13.1 12.1 10.2 11.6 11.3 11.6 13.0 14.4 16.0 18.1- Change in stocks 4.4 1.9 3.0 3.5 2.9 3.3 2.2 2.3 1.7 1.5 1.5
Savings 16.5 12.1 11.7 13.4 12.6 14.2 14.5 14.9 11.8 14.4 17.1Savings-iavestment gap -1.3 -2.9 -3.4 -0.3 -1.9 -0.4 0.7 -0.4 -4.3 -3.1 -2.5
/a All data converted to calendar-year basis. As a result, the dta on the current account deficit andthe public sector deficit differ slightly vLth other tables.
lb The inverse of the current account deficit expressed in calendar years.LI Fixed investment only. Investment in stock chages is assumed to be financed by the private sector.
Source: Central Bureau of Statistics and World Bank staff estimtes.
Sources of Growth and Implications for Emoloyment
2.31 Non-oil GDP growth is expected to slow somewhat in the near term, butreturn to 7% over the medium-term. At the sectoral level, the primary impetusto economic growth is provided by the non-oil manufacturing sector. Thissector is projected to grow by about 10-11% p.a. during the 1990s, raisingmanufacturing's share of GDP to almost 24% by the year 2000. Given that theongoing program of trade and industrial deregulation will continue to open up
].Q/ Expenditure prioritieu to support private sector development arediscussed in Chapter 5.

- 45 -
profitable areas for efficient export industries which are relatively laborintensive, manufacturing growth will also make an important contribution toemployment growth. v/ Agricul&ure will increase by 3.5% p.a., the samepace as during the 1980s. The pattern of agricultural growth is likely tochange gradually over this period. Increases in rice production are likely todecelerate somewhat in the 1990s, while other activities, such as non-ricefood crops, smallholder tree crops, and other non-food farm activities willgrow more rapidly. However, this pattern of agricultural development needs tobe supported by policies that encourage farmers to raise their productivityand diversify their production within an efficient cropping system.12Nevertheless, agriculture's share of GDP can be expected to decline to about16% by 2000, although its role in employment creation, particularly off-Javawill continue to be significant. The constructiQn and services sectors willincrease in line with overall economic activity during the 1990s.Infrastructure-based services, such as telecommunications, electricity andtransport, will need to grow rapidly in the first half of the 1990s to avoidinfrastructural bottlenecks which could slow growth in the industrial andagricultural sectors. The contribution of the oil/LNG sector to theIndonesian economy is projected to remain constant until the late 1990s whenit is expected to decline gradually, although the increased pace ofexploration activities currently underway could push growth in this subsectorhigher.IJ/ If higher oil/LNG production is realized, GDP growth would behigher than currently projected with positive implications for the balance ofpayments.
2.32 This projected pace and pattern of economic activity, coupled withcomplementary specific programs and policies, should allow Indonesia to absorbits expanding labor force at higher levels of productivity and income. Whilea strong agricultural sector will be essential to absorb a large proportion ofthe incremental labor force, the manufacturing sector will need to play adynamic role in absorbing a much larger proportion of new employment than inthe past. Again, this underlines the importance of expanding manufacturedexports and maintaining the policies necessary to induce this expansion,including an incentive pattern consistent with labor-intensive growth. Theprojected rate of growth of output and investment will also spur productivitygrowth in the services sector. The projected level of economic activity is,
11/ Policies to stimulate robust, export-oriented, and labor-intensivegrowth in the non-oil manufacturing sector that are consistent with themacroeconomic scenario outlined in this section are discussed in detailin Chapter 3.
12/ Policies to effect this shift in the pattern of agricultural growthrequire a process of deregulation which will bring the pattern of inputand output prices more closely in line with world prices and whichreduce existing regulatory restrictions. These policies are alsodiscussed in Chapter 3.
I/ Current projections for the oil sector indicate that production(including condensates) will be maintained around 1.5 mbd. through 1997and then will decline to 1.4 mbd. by 2000. This is a significantincrease over the levels in last year's economic report, because of twoimportant new finds and higher output levels from existing fields.

46 -
therefore, likely to lead to improved earnings for workers currently engagedin low-wage activities, as well as to generate additional productiveemployment opportunities in the sector. Continued deregulation intransportation and other services, as well as a strengthening of financialservices, will be critical in this regard. Furthermore, the attitude of localgovernments towards service sector activities will also be important, asregulations and restrictions on informal traders and transportation couldinhibit growth in services, which would have an adverse effect uponemployment, particularly for the poor.
Table 2.9: GROWTH AND COMPOSITION OF GDP, 1984-2000 IL
Growth Rates (% p.a.1 Share in GDP /b1984-87 1988-90 1991-95 1996-2000 Estimate Projected
1990 2000
Non-oil GDP 5.7 7.8 6.6 7.0 81.8 89.5Agriculture 3.3 3.8 3.4 3.5 19.7 15.7Manufacturing 12.0 12.4 10.7 11.0 14.9 23.7Other services 5.3 8.2 6.3 6.5 47.2 50.1
Qil/LNG 2.8 2.5 1.5 -1.2 18.2 10.5
Total GDP 5.0 6.7 5.6 5.9 100.0 100.0
,a Based on revised National Accounts Statistics./b In 1983 prices.
Source: Central Bureau of Statistics and World Bank staff estimates.
Risks and Uncertainties
2.33 The macroeconomic scenario out'Lined above is subject to several risksand uncertainties. First, it assumes that the Government takes decisiveactions to slow domestic demand. Without these strong stabilization measures,macroeconomic balance could be undermined in the near term. Second, theassumptions regarding the external environment are subject to considerabledownside risks; the projected recovery in the world economy may notmaterialize while oil prices could fall significantly below projected levels,especially in the short term. These concerns are exacerbated by theuncertainties surrounding the GATT negotiations which could presage anincrease in protectionism in the industrialized countries. Finally, themedium-term projections discussed above assume considerable progress onimplementing policy reforms in trade and industrial policy, the legal systemand the financial sector. Without this progress, growth of non-oil exportscould be significantly lower, leading to slower growth and delaying progressin achieving Indonesia's fundamental development objectives. In general,therefore, Indonesia's medium-term prospects could be adversely affected bythree types of risks: (a) a deterioration in macroeconomic balances through

- 47 -
excessive expansion of the economy; (b) a deterioration in the externalenvironment; and (c) inadequate progress on measures to sustain private sectorgrowth over the medium term.
2.34 Macroeconomic balance. Without decisive measures to controlaggregate demand and reduce pressures on the balance of payments, the currentaccount deficit could widen significantly in 1991/92 leading to pressures onthe Government's reserves and necessitating higher levels of commercialborrowing. Several examples illustrate the importance of cautiousmacroeconomic management. First, the projections assume only 1% real growthin non-oil imports in 1991/92 (compared to 25% in 1990/91) as a result offiscal policy measures, coordinated with continued tight monetary policies.If imports grew at their long-term trend rate for 1985/86-1990/91, non-oilim,iports could grow by another US$3 billion in 1991/92. Second, theseprojections assume that restrictions on exports are reduced, yieldingadditional export receipts during 1991/92. Finally, the projections assumethat measures are taken to slow the growth in domestic fuel consumption toonly 10% (compa.red to a growth of 13% in 1990/91). Without this slowdown indomestic consumption growth, the surplus on the oil/LNG current account woulddecline and the oil surplus would be reduced further in future years,accelerating the time at which Indonesia becomes a net importer of oil. TheGovernment has already taken important measures in early 1991 to tightenmonetary policy, and other measures to contain aggregate demand are underconsideration. The measures already taken and the Government's successfulrecord in macroeconomic management indicate a high probability that anappropriate macroeconomic policy stance will be maintained.
2.35 Adverse external environment. A number of uncertainties cloud theoutlook for the external environment: world growth and trade could be slower;and oil prices could be lower than projected. A sharper decline of oil pricesto US$15, for example, would imply a loss of about US$1.5 billion in theoil/LNG current account projected for 1991/92 in Table 2.6. To protectagainst this risk in the short-run, the strategy outlined in Section Cmaintains Indonesia's foreign exchange reserves and borrowing capacity atrelatively high levels. Nevertheless, in the event of either an unexpectedlylarge decline in world economic activity or a rapid decline in oil prices, itwould be 'mportant to move quinkly using the full range of macroeconomicinstruments to ensure that th. e-urrent account deficit remains manageable.Macroeconomic measures outli:- in Section C would need to be accompanied byadditional measures to improve r.mpetitiveness and promote investment in thenon-oil tradeable sector. In the short term, economic growth would be lowerthan projected. However, growth could recover over the medium term, ifsupported by accelerated economic reforms. Under such circumstances it wouldbe important that the donor community stand ready to support the Government'sefforts with additional fast-disbursing assistance, or even renewed specialassistance. To protect against uncertainties in the external environment, theGovernment should consider various options to reduce its risks, e.g. forwardsales of oil products and more active external asset and liability management.
2.36 Policy reform. The scenario above assumes continued policy reformsin trade, industry and investment and a further strengthening of the financialsector. An alternative scenario, without adequate policy improvements, wouldresult in slower non-oil export growth over the medium term. Moreover,without an appropriate incentive framework, private sector investment could be

- 48 -
channelled into areas which are uneconomic. Similarly without determinedefforts to mobilize public resources, the Government will be unable to financethe investments in infrastructure required to support private sectordevelopment. The growth prospects of the economy over the medium term wouldbe adversely affected by policy slippage in any of these three areas.However, as long as the existing reform programs are producing the kinds ofpositive results in economic growth and poverty reduction seen to date, thereis little reason to expect a weakening in the Government's commitment topolicy reform.
E. Public Resource Mobilization
2.37 An important element in reconciling Indonesia's medium termdevelopment objectives with the need to reduce demand pressures in the economyin the near term is higher public resource mobilization. In addition tofinancing higher levels of public investment and dampening private sectordemand, there is also an important role for public resource mobilization,particularly tax policy, in helping to maintain an equitable pattern ofgrowth. Greater public resource mobilization will primarily involveincreasing non-oil tax revenues and reducing subsidies. In addition,enhancing local government resource mobilization, particularly the propertytax, is also important.
Central Government's Non-oil Tax Effort
2.38 Recent tax reforms, in conjunction with improvements in taxadministration, have been very successful in generating additional governmentrevenues. Between 1983/84 and 1990/91 non-oil tax revenues have increasedmore than four-fold. In terms of non-oil GDP, non-oil revenues have risenfrom 7% in 1983/84 to almost 13% in 1990/91. Inspite of these gains, the taxeffort in Indonesia remains low relative to other countries in Asia. Forexample, in 1988 the tax to GDP ratio for Thailand and Pakistan stood at 16.2%and 13.6% respectively.
2.39 The tax effort could be raised through either higher tax rates orimprovements in tax administration. Three factors argue for concentratingprimarily on improving tax administration. First, there is considerablenon-compliance. Actual non-oil tax revenues are still significantly belowtheir potential, (at the current statutory rates), 1_/ and filing ratiosare still low (see Table 2.10). Second, raising tax rates, in the face ofnon-compliance, is likely to lead to greater tax avoidance. Finally, lack of
i/ There are two indirect indicators of low compliance. First, only a smallpercentage of the personal tax revenue is paid by the self-employed.Since many individuals with high income would fall under this category,the share of the self employed in total personal income taxes .s small.Second, a large proportion of total company tax revenue is stillgenerated by public enterprises, suggesting that a significant part ofthe corporate sector still remains outside the tax system, although therehas been some improvement over the past years.

- 49 -
adequate and uniform enforcement may also lead to the application of de factotax rates that are inconsistent with the efficiency and equity goals of theoriginal tax reform.
Table 2,10: TAX COMPLIANCE INDICATORS
Registered TaxRayers (000's) Filing Ratios (011983 1987 1989 1990 1987 1988 1989
Personal income tax 322.7 674.5 703.1 856.0 63.0 75.6 72.4Corporate income tax 91.3 178.1 211.4 248.3 46.3 64.7 60.4Value added tax n.a. 75.9 134.2 149.9 42.0 43.9 43.2
Source: Ministry of Finance and World Bank staff estimates.
2.40 A useful benchmark for assessing the room for further progress in tax
administration is the ratio of actual to theoretical potential tax revenues.This ratio, the administrative efficiency ratio (AER), illustrates the scopefor increasing tax revenues through improved tax administration. InIndonesia, the AER is around 50% for the major non-oil taxes (seeTable 2.11).X2/ Therefore, there is still considerable leeway to raisenon-oil income taxes within the existing tax structure through furtherimprovements in tax administration.
Table 2.11: ACTUAL AND POTENTIAL REVENUE OF MAIN CATEGORIES OF TAXES,1988/89
(Rp. billion)
Actual PotentialTax Revenue Revenue La AER
Personal income tax 1,159 2,365 0.49Corporate income tax 2,348 4,515 0.52
Value-added tax 4,505 8,500 0.53
/a The theoretical tax potential is obtained by estimating the tax base ofeach particular tax and applying it to the corresponding statutory tax
rates.
Source: Ministry of Finance and World Bank staff estimates.
w/ The theoretical potential represents the maximum achievable revenuesunder the current tax structure. A realistic AER would probably be
around the range of 80-85%, even in industrial countries.

- 50 -
2.41 ImRrovin2 non-oil tax administration. Further progress in raisingCentral Government tax revenues requires the following actions:
* completing the reorganization of the Tax Directorate at the districtlevel by streamlining or eliminating the reporting function, as thenew payments control system is installed;
* increasing taxpayer regi :ation by cross checking the recipients ofGovernment payments and registered tax payers, or trade and industrydata and registered taxpayers;
* reducing under-reporting through regular tax audits. To date,significant progress has been made in the auditing of income taxes.This effort needs to be extended to the VAT, as the VAT is notnecessarily self-enforcing. Increasing the supply of trainedauditors is the most important step in this regard. This implies theneed for further budgetary support for training and a modification ofthe job rotation policy that now allows tax auditors to be assignedto non-auditing duties;
- reducing non-filing through full enforcement of penalties in cases ofnon-compliance. Currently, the penalty process tends to stop at theissuing of warning letters in most cases, with little follow-upthrough to confiscation and auctions of properties.
Local Government Taxes
2.42 The most important source of tax revenues for local governments isthe Property tax. The land and building tax (PBB)--Indonesia's property tax--was introduced in 1986 as a replacement for the old land tax (IPEDA) and thenet wealth tax (PKk). In line with the tax reform, it aimed to broaden thelocal government's tax base and simplify tax administration, as well aspromote equity through fiscal policy. The PBB is levied by the CentralGovernment. The Central Government is also responsible for the valuation ofproperty. Despite its relative importance for local government revenues inIndonesia, property taxes account for only a small proportion of localgovernment revenues. This stems primarily from two factors. First, theeffective legal rate of the property tax in Indonesia, at 0.1%, (5% tax rateon an assessment rate of 20% of estimated market value) is also among thelowest in the world. In the Philippines for example, the effective legal rateranges from 0.4% to 1.4%, while in Thailand and India the respective rates are0.8% and 2.6%. Second, tax administration is poor, particularly in urbanareas where the potential additional revenues from the urban property tax areestimated to be at least 62% higher than actual revenues.
2.43 Property taxes can play, therefore, a more important role infinancing the cost of local government services, as well as addressing theGovernment's equity concerns. The Government has been attempting to improvethe administration of the PBB through several pilot schemes. These pilotschemes are: (i) establishing a valuation standard for properties;(ii) improving staff training in property valuation; (iii) increasing propertyregistration; and (iv) introducing a new payments control system. The effectsof these pilot schemes are not fully reflected in PBB revenues and as furtherprogress is made in extending these pilot schemes, further increases in

- 51 -
property tax revenues can be expected. However, there is still considerableroom for increasing revenues even under the current system:
* Since the same tax ID number is now used for all Central Governmenttaxes, including the property tax, cross checking with CentralGovernment taxes needs to be undertaken.
* Better enforcement is needed. Although the PBB establishes cleardeadlines for payment and has well-defined penalties, enforcement isweak and sanctions are rarely used.1iU
* There is also a tendency to establish revenue targets for propertytaxes. If other indicators of tax administration performance such asnumber of registered properties, filing ratios etc., are included astargets, the incentives for improvements in tax administration wouldbe greatly enhanced.
These measures could lead to substantial gains in PBB revenues. However, ifthe property tax is to play a more appropriate role in the mobilization oflocal government resources, an increase in the effective legal rate will alsoneed to be considered. Additional revenue could easily be obtained throughhigher tax rates, without jeopardizing economic efficiency. In the mediumterm an increase in the effective rate to 0.15-0.20% could be considered.This would not require a change in the statutory rate, since an increase inthe official assessment ratio from 20% to 30-40% would achieve the increase ineffective rates.
2.44 There are also a large number of local taxes. fees. and user charges.The main provincial taxes are those on the ownership and transfer of vehicles,while the major district taxes are the hotel, restaurant and entertainmenttaxes. Of the plethora of other local taxes, many cost more to administerthan they yield in revenues. Some of these taxes also introduce distortionsand barriers to interprovincial trade (see Chapter 3) and have an adverseeffect upon income distribution (see Chapter 6). The Government is currentlyworking on reform proposals for the system of local taxes. This reform willseek to rationalize the local government tax structure by eliminating manyprovincial and district taxes, as well as introducing some new taxes to expandthe local government revenue base. The speedy finalization and implementationof this reform will be an important step in improving the finances of localgovernments.
F. External Borrowing and Debt Management
2.45 Projections of Indonesia's external capital requirements and sourcesare based on the macroeconomic scenario presented in Section D (seeTable 2.6). The persistence of large current account deficits during the nexttwo years and the need to protect Indonesia's international reserves willnecessitate higher levels of capital inflows. The gross financing requirement
i6/ In 1989/90 for example, actual revenues received from the urban PBBamounted to only 73% of total billings.

- 52 -
is projected to average US$11.2 billion over the next two years. Furthermore,once allowance is made for rising debt service requirements (both interest andprincipal repayments) and, over the medium term, the need to rebuild andmaintain adequate reserves (in relation to the growing import requirements),the annual financing requirement is projected to continue rising, averagingUS$13.0 billion during 1993/94-1995/96.
2.46 As discussed in last year's economic report, an important recentchange in the sources of external financing is the increasing share of privatecapital flows--in the form of direct foreign investment and disbursements ofprivate MLT loans. In 1990/91, preliminary data from banking sources indicatethat there were about US$ 6 billion in recorded debt agreements between theIndonesian private sector (including state banks) and offshore financialinstitutions; Indonesian banks accounted for about US$ 2.5 billion (of whichUS$ 1.5 billion was state banks), and non-bank institutions accounted for theremaining US$ 3.5 billion. This change reflects the surge in domestic andforeign private investment in Indonesia. Based upon recent trends in foreigninvestment approval, the macroeconomic projections assume that net privatecapital flows (excluding short-term trade credits) will total aboutUS$5 billion during 1991/92-92/93.1 This is a decline from 1990/91 dueprimarily to the anticipated slowdown in lending by international banks. Overthe medium term, private non-guaranteed debt and direct foreign investment areassumed to grow more slowly, but in line with future investment trends.
Table 12 EXTERNAL CAPITAL REQUInUENTS AND SOVRCES(annual averages in US$ billion)
Actual Iat1mt-d ProJ*cted1989/90 1990/91 1991192- 1993194- 1996/97-
1992/93 1995196 2000101
Reiremmtn Li ILI IL ILICurrent account deficit 1.8 3.8 4.2 3.2 3.6
(of whch interest payments) (3.1) (3.1) (3.9) (5.1) (4.4)Principal repayments 5.5 5.4 7.0 8.2 10.0Increase in not foreign assets 0.0 4.1 0.0 1.6 3.4
Sourcme 7A 3I h3l "Al 17i0Direct foreign investment 0.7 0.9 1.1 1.4 2.1Disbursemnt of private MLT loan 1.5 6.4 3.6 4.0 4.3Short-term and other capital (not) /a -1.0 1.1 1.2 0.8 1.4Disbursements of public MLT loans 1 L MS L8 9
of which:Project aid 2.2 2.5 3.8 4.2 4.6Special assistance Ib 1.7 1.3 - IA - -Others I< 2.2 1.1 1.5 2.6 4.6
La Includes errors and omissions, oil export credit, and valuation adjustments.Lk Fast-disbursing -.ogrm aid end local-cost finaing.La Import-related credits, untied courcial credits, and credits for LNG epansion, LPG and paraxylee
projects.Ld Disbursemnts of aooitments in previous years are included under project aid.
Sources World Blank staff etimates.
l/ These flows are estimated from d^:r ollected by Bank Indonesia on theplanned financing of foreign inveatment which indicate that about 228 isin the form of foreign equity, 67% in foreign debt and the remwinderfrom domestic sources.

- 53 -
2.47 These levels of private capital flows have several importantimplications for Indonesia's macroeconomic situation in the 1990s. First,rapid progress on removing the remaining distortions in the policy environmentis critical, in order to ensure that private capital flows are being used tofinance economically viable and export-oriented projects. Second, higherborrowings by the private sector and the quasi-public sector -- especiallyborrowings for large, capital- and import-intensive projects -- could "crowdout" the public sector from international capital markets, by either limitingthe access of the public sector to commercial credits or raising the spreads.Borrowing for a few such large projects could also crowd out a large number ofsmaller private sector projects. Third, the borrowings of state enterprises,particularly state banks, as well as of state enterprises in joint ventureswith the private sector need to be as closely monitored as Central Governmentdebt, as foreign borrowing under these arrangements could develop into publicsector liabilities (as could liabilities of the private sector under extremesituations). Guidelines and reporting requirements for these "public"enterprises need to be established and enforced rigorously. Finally, largeprivate capital inflows increase the vulnerability of the private sector toexchange risk, and thereby, raise the costs of employing the exchange rate asan instrument of macro management.
2.48 Despite the increasing importance of private capital flows,Indonesia's needs for development assistance remain substantial. Given theprojected increase in the current account deficit, disbursements of officialssistaNce will need to be maintained at about US$3.8 billion in 1991/92, thesame level as in 1990/91. Provided an appropriate mix of assistance can beidentified and commitments outside the IGGI remain at the same level, thelevel of IGGI commitments to Indonesia would need to be USS4.7-4.8 billion in1992192, slightly higher than pledged in 1990/91. The priorities for thisassistance are mainly in two areas: (i) investments in physical, financial andsocial infrastructure to support private sector development and economicgrowth; and (ii) investments in social and basic services to reduce furth.jrthe incidence of poverty. In addition, it will be important to strengthenmechanisms to channel aid funds to the private sector, such as two-stepoperations and financial sector operations. The change in the composition ofdevelopment assistance will require close cooperation among BAPPENAS, the lineagencies and the donor community. In this regard, the Government needs togive careful consideration to encouraging bilateral donors to cofinance theiroperations with multilateral institutions.
2.49 Maintaining the level of disbursements from official assistance willbe difficult. An increase in project aid disbursements can make up some ofthe gap. The pipeline of undisbursed project aid has increased due to higherco-i.ttnent levels in the past several years. Disbursement ratios can also beraised. But, the increase from project disbursements from these sources islikely to be small. Consequently, as recommended in last year's economicreport, faster-disbursing, sector-type operations will also be required. Thisfaster disbursing assistance will ensure that adequate foreign exchange isavailable for the private sector to invest in productive, export-orientedcapacity.
2.50 Since the decline in oil prices and the depreciation of the US Dollarversus other major currencies in the mid-1980s, special assistance, in theform of fast-disbursing program aid and local-cost financing, has played a

- 54 -
critical role in supporting Indonesia's adjustment and development strategy.Special assistance was designed to provide temporary support to Indonesiawhile it implemented policies to adjust the balance of payments and the budgetto external shocks, caused by lower oil prices and adverse exchange ratemovements, while removing trade and investment restrictions. The responsefrom IGGI members has been substantial, with disbursements of specialassistance totalling US$6.7 billion since 1986/87. Our projections assumethat no new commitments of special assistance are made in 1991/92, beyondthose already pledged. But in order to maintain the level of officialdisbursements, a substantial portion of new commitments, virtually the same asin 1990/91, will need to be in the form of relatively fast disbursingoperations, including sector-type loans and two-step operations. Moreover,the donor community should be prepared to respond flexibly in the event thatthe external environment, particularly oil prices, deteriorates substantiallyfrom that which is envisaged under the base case. This level and mix ofassistance will enable Indonesia to pursue its trade and other structuralreforms with confidence while it seeks to improve its external and internalmacroeconomic balances.
2.51 Indonesia has reduced its reliance on imDort-related credits inrecent years. This trend reflects the Government's decision in earlier yearsto reduce public investment in large, capital-intensive projects and to placestrict limits on the use of non-concessional credit under PresidentialInstruction No.8 of 1984. The projections presented in Section D assume thatnew commitments of import-related credits rise over the medium term,reflecting the emergence of opportunities for new investments. However, as inthe past, it will be important to review these proposals carefully, to ensurethat the projects warrant priority in the public investment program and thatthe financing arrangements are appropriate. Disbursements of untiedcommercial credits, which declined during the adjustment period, were lessthan US$100 million during 1990/91.11/ During 1991/92, new commitments areassumed to total only about US$ 0.5 billion to finance the increase in thecurrent account deficit in 1991/92. Indonesia will need to preserve its linesof commercial credit for use in case of adverse external shocks. Even withthe projected US$0.5 billion increase in commercial borrowing, Indonesia'sexposure to commercial banks will decline in 1991/92 as US$ 1.3 billion inrepayments are due. Over the medium term as Indonesia's external debt burdeneases, greater use of commercial credits is anticipated, especially sincethese credits are untied and therefore, can be used more flexibly than import-related credits.
2.52 Implications for external debt management. Despite the highercurrent account deficits, Indonesia's creditworthiness is expected to improvesignificantly over the medium term (see Table 2.13). Medium- and long-term(MLT) public and private external debt disbursed and outstanding (DOD) isprojected to rise from US$56.9 billion at end-1990 to an estimatedUS$60.1 billion at end-1991, an increase of about 6%. Reflecting the higherlevels of inflows of private capital, private non-guaranteed debt is estimated
1.8/ Indonesia's pipeline of undisbursed syndicated loans totalled aboutUS$2.0 billion at end 1990/91, an increase of US$ 0.3 billion reflectingexchange rate movements and the new commitment signed, but not drawn, inJuly 1990.

- 55 -
to total US$11.7 billion at end-1991. The total debt service ratio isexpected to incre?se to 31.2% in 1991. However, the public debt service ratiowill be lower, while the ratio for private non-guaranteed debt -ill be higher,reflecting the substantial private sector borrowing in 1990. The trend in thedebt ratios in the near term illustrates the need for Indonesia to exercisecaution in its balance of payments management, as larger financingrequirements will imply increases in Indonesia's indebtedness. Since most ofthe increase in borrowing over the past several years has been in the form ofofficial assistance, there has been a significant improvement in the overallmaturity and term structure of Indonesia's external public debt. Furthermoreover the medium term, a substantial improvement in all of the key debtindicators can be achieved. By the year 2000 Indonesia's debt service ratiois projected to decline to below 20% under the assumptions of the base casescenario. The ratios of DOD to GNP and exports also fall significantly overthe medium term.
Table 2.13: MEDIUM - AND LONG-TERM DEBT INDICATORS, 1988-2000(w%)
Actual Projected /a1988 1989 1990 1991 1995 2000
DOD/GNP 60.3 54.6 58.6 57.6 50.3 39.2Public 55.0 49.2 48.1 46.4 40.0 32.4Private 5.3 5.4 10.5 11.2 10.3 6.8
DOD/exports Lb 218.1 185.8 183.1 177.2 145.2 110.0Public 199.0 167.3 150.2 142.7 115.4 90.8Private 19.1 18.5 32.9 34.5 29.8 19.2
Debt service/exports Xb 34.4 31 27.3 31.2 25.9 19.9Public 29.0 26.6 22.7 22.4 15.2 13.2Private 5.4 5.0 4.6 8.8 10.7 6.7
Interest/exgorts A 13.8 j 11.9 10.1 11.4 8.5 5.9Public 12.0 10.2 8.6 8.6 6.1 4.4Private 1.8 1.7 1.5 2.8 2.4 1.4
/a Based on exchange rates of December 31, 1990.a Denominator is gross exports of goods and services./c Debt service excludes prepayments.
Source: Bank Indonesia and World Bank staff estimates.
2.53 The Government continues to handle the administration of its externaldebt payments in an efficient manner, with no significant errors or delays.However, two areas of debt management require attention. The priority is toestablish a unified debt reporting and analysis system, which can provideup-to-date and comprehensive information to policy makers on the status of

- 56 -
Indonesia's public external debt. Cutrently, there are at least four debtreporting systems in operation within the Central Government. Unifying andstreamlining debt reporting activities in one place will improve informationflows and thereby, help to guide more efficiently the Government's overallborrowing strategy. The system should also be expanded to include stateenterprises, such as Garuda, Pertamina and the state banks which are currentlyconsidered private. Second, given that private sector debt is increasingrapidly, there is also a need to monitor closely trends in privatenon-guaranteed debt, without impeding individual transactions.

- 57 -
CHAPTER 3
THE FRAMEWORK OF INCENTIVES. REGULATIONS AND LAWS
A. Introduction
3.01 Beginning in 1984, the Government embarked upon a concerted effort toreduce and simplify economic regulations in order to encourage the privatesector. Deregulation has gathered momentum over the past six years,culminating in a series of major reforms on trade policy, investment licensingand transport regulations. This Chapter argues that the momentum for reformshould be maintained, because it is important that future investments bedirected towards th.ose activities in which Indonesia has a comparativeadvantage. The need to stimulate non-oil exports calls for a reassessment andreduction of export controls. Deregulation could also reduce the scope forthe exercise of monopoly power by larger enterprises.
3.02 A well-functioning legal system would also promote competition byreducing legal barriers to entry and increasing mobility of privateinvestment. In this way the legal system would complement the deregulationtaking place in the incentives framework. Company law should better providefor the formation of limited liability companies and thereby improve access ofbusiness to risk capital. A proper accounting system would help to make thelegal system more effective and extend the operations of the capital market.The whole legal process could be made more effective with wider publicationsof laws, interpretations and decisions. The reform of land laws are ofparticular urgency as delays in obtaining clear title to land is becoming abottleneck for investors.
3.03 Natural resources are critical to Indonesia's development.Exploitation of some natural resource-intensive activities has adverselyaffected the environment and raised concerns about the sustainable use ofthese resources. Indonesia's key environmental concerns are: landdegradation; deforestation; inefficient use of water; and pollution. Somecorrective steps have been taken recently to reduce environmental degradation,particularly through regulatory instruments. However, environmentalobjectives could be better achieved through more extensive use of market-basedinstruments and fiscal policies (such as taxes, charges, subsidies, marketablepermits and ownership rights). Correcting the distortions in energy priceswould also result in a more environmentally sound pattern of energy productionand consumption.
B. Trade Policy and Domestic Lefulations
The Changing Pattern of Price Incentives
3.04 Since the mid-1980s, the Government has embarked on a series of tradeand deregulation measures to reduco the high cost of doing business inIndonesia and enhance the international competitiveness of domesticproduction. Those measures have supported demand management policies in

- 58 -
reducing macroeconomic imbalances and enablAd a recovery of economic growth.To maintain balance of payments stability the Government has adopted an activeexchange rate policy. Significant real exchange rate depreciations in 1983and 1986 played a key role in boosting non-oil exports and reducing thecurrent account deficit. A central component of economic strategy has beentrade reform. Between 1985-89, four major policy packages were introduced,addressing three principal areas: (a) non-tariff barriers (NTBs); (b)tariffs; and (c) duty-free inputs for exporters. In May 1990 the Governmentissued a new deregulation package which encompassed measures to reform thetrade regime further and streamline investment licensing procedures.
3.05 Non-tariff barriers. Trade policy reforms have been designed mainlyto move away from import licenses towards tariffs. The removal of NTBsthrough the various reform packages up to November 1988 reduced the share oftotal domestic production protected by import licensing from 41% in mid-1986to 29% by end December 1988 (see Table 3.1). The reduction in NTBs wasconcentrated in the manufacturing sector, where both nominal and effectiverates of protection were highest. The share of domestic manufacturingprotected by NTBs declined from 68% of production in 1986 to 45% in 1988.
3.06 The May 1990 package reduced NTB coverage by about 10%. Most of thechanges have taken place within manufacturing where the production coverageratio has been reduced to 33%. Very little change occurred in theagricultural sector. In the May 1990 reform the Government removed importlicensing restrictions on some 335 products, including non-metallic minerals,fertilizers, synthetic yarns and some machinery and electronic products. Theincidence of the remaining NTB protection varies across sectors. Over 60% ofNTB coverage is attributable to restrictions on imports of rice and riceproducts. For such products, import licensing has been used to achievedomestic distribution and food security objectives, and not necessarily toprotect domestic producers. After the May 1990 reforms, and excluding riceand rice milling, only about 10% of traded goods production benefits fromimport licensing protection. In the manufacturing sector, NTBs remainextensive within food, beverages and tobacco, engineering and paper products.In these sectors NTBs continue to protect over 30% of domestic production.
3.07 The removal of NTBs has increased competitive pressure on localindustry and improved the profitability of many exporting operations.Domestic producers can import inputs more easily, benefitting not only fromlower prices but also from more certain delivery times and improved quality.Such 'non-price' factors are crucial for export production and encouragedomestic producers of inputs to become more cost and quality conscious.Finally, the move towards tariffs based protection has greatly increased thetransparency of the trade regime.
3.08 Tariffs. In 1985, the tariff schedule was rationalized together withan across the board reduction in rates. This lowered the import-weightedtariff to 13%, and the production-weighted tariff to 19%. Between 1986 andMay 1990 there were few further improvements to the tariff schedule, exceptfor the almost complete elimination of specific rates of duty (see Table 3.2).However, this progress was partly offset by a proliferation of import tariffsurcharges and split tariff positions.
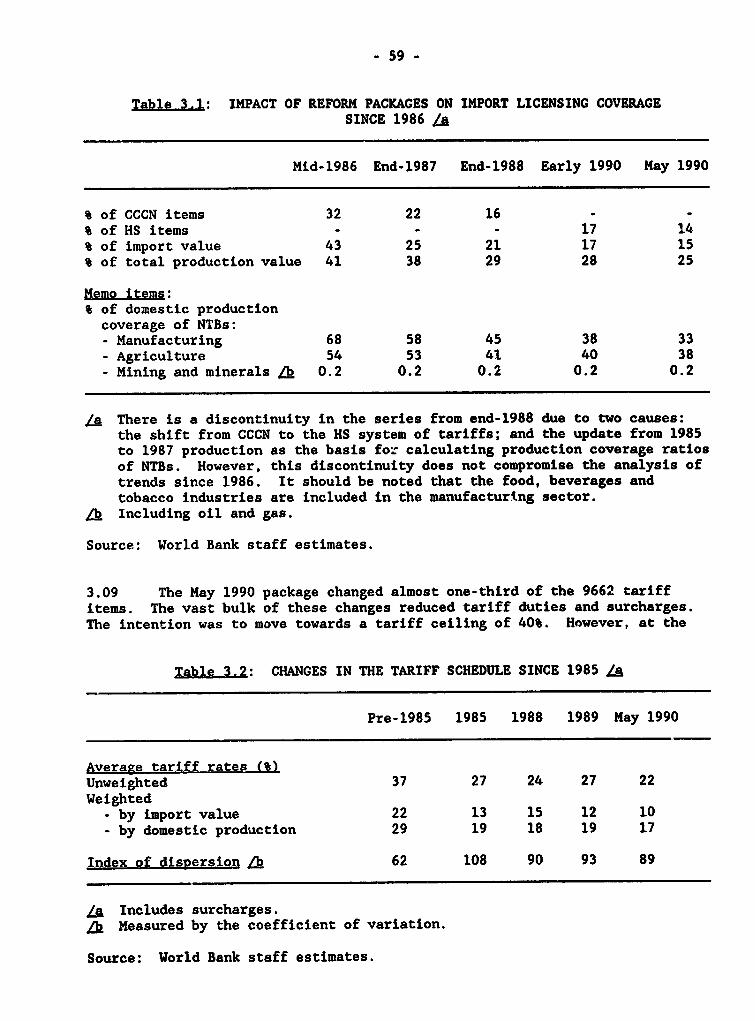
- 59 -
T_able3.1: IMPACT OF REFORM PACKAGES ON IMPORT LICENSING COVERAGESINCE 1986 Jg
Mid-1986 End-1987 End-1988 Early 1990 May 1990
% of CCCN items 32 22 16 - -
% of HS items - - - 17 14% of import value 43 25 21 17 15% of total production value 41 38 29 28 25
Memo items:% of domestic productioncoverage of NTBs:- Manufacturing 68 58 45 38 33- Agriculture 54 53 41 40 38- Mining and minerals Lb 0.2 0.2 0.2 0.2 0.2
/a There is a discontinuity in the series from end-1988 due to two causes:the shift from CCCN to the HS system of tariffs; and the update from 1985to 1987 production as the basis fo: calculating production coverage ratiosof NTBs. However, this discontinuity does not compromise the analysis oftrends since 1986. It should be noted that the food, beverages andtobacco industries are included in the manufacturing sector.
Lk Including oil and gas.
Source: World Bank staff estimates.
3.09 The May 1990 package changed almost one-third of the 9662 tariffitems. The vast bulk of these changes reduced tariff duties and surcharges.The intention was to move towards a tariff ceiling of 40%. However, at the
Table 3.2: CHANGES IN THE TARIFF SCHEDULE SINCE 1985 La
Pre-1985 1985 1988 1989 May 1990
Average tariff rates (W)Unweighted 37 27 24 27 22Weighted
- by import value 22 13 15 12 10- by domestic production 29 19 18 19 17
Index of dispersion fb 62 108 90 93 89
LA Includes surcharges.A& Measured by the coefficient of variation.
Source: World Bank staff estimates.

- 60 -
same time the tariffs on some lightly dutiable items were increased. Some ofthe changes focused on specific industries. For example, the structure ofprotection of the electronics industry was rationalized by lowering tariffs oninputs into the indubtry in order to encourage assembly operations inIndonesia. This is an example where tariff reductions could lead to increasedeffective protection. With this most recent reform, the import-weightedtariff has declined by almost a fifth to the current level of 10%. Theproduction-weighted tariff has also declined. Importantly, the index ofdispersion has now declined, which reverses a troublesome trend of earlieryears. This reversal is largely c1ue to the reduction in the tariff ceilingand also the reduction in the number of split tariffs.
3.10 Despite the progress made, there is still much to be done to increasecompetitive pressure on local industry. Some 468 items (or 5% of the total)are still subject to duties in excess of 40% and these exceptionssignificantly increase the average tariff levels. The highest rates of dutyare levied on transport equipment (cars, buses and motorcycles), footwear,handtools and meat products. The rates of duty on these products range from70% to 200%. Also the tariff changes to date have had the largest impact onthe manufacturing sector. Within manufacturing, reductions in tariff ratesfor textiles and leather, non-metallic, and wood and wood products areunlikely to have had much effect on effective rates of protection. This isbecause Indonesia is already generally competitive in these activities.
3.11 Surcharges have become an increasingly important source of distortionin the tariff regime. The number of surcharges has increased from 376 to 542as a result of the May 1990 package, in part to compensate for the eliminationof NTBs and reductions in tariffs. Surcharges provide a means formade-to-measure protection for specific firms or product lines, underminingthe effectiveness and transparency of the tariff reform by enabling selectedfirms to escape competitive pressures. Concerns about dumping have also beenused as a justification for surcharges, but they do not constitute anappropriate anti-dumping mechanism. Surcharges apply to whole commoditiesover a period of time whereas anti-dumping procedures constitute essentiallylegal actions by one party (for example, a firm) against another with respectto a particular shipment. Thus, the appropriate response to dumping is theimposition of specific penalties on a particular supplier rather than measuresthat apply to a broad commodity group. If dumping is indeed a significantproblem within certain industries, then the appropriate response is toestablish anti-dumping procedures aligned with GATT rules.l/ Wheresurcharges are used to allow a firm to adjust to the sudden removal ofprotection from a NTB or a very high tariff, they should be temporary with aclearly specified expiration date.
3.12 Effective rate of protection. The net effect of changes in tariffson the value-added of economic activities is captured by the concept of theeffective rate of protection (ERP). Estimates of ERPs across the traded goodssector are outlined in Table 3.3, which shows small reductions between 1987
1/ GATT principles require that duties only be imposed to the extent of anydumping margin and after it has been established that: (a) dumping hasoccurred; (b) injury has been caused or threatened to a domestic industry;and (c) there is a causal link between dumping and injury.

61 -
and 1990. Specifically between these two years the ERP for manufacturingdeclined from 688 to 59%, while that for agriculture fell from 16% to 15%.The real effective rate of protection (RERP), which takes into account the
Tablg 3.3: PROTECTION IN BROAD ECONOMIC SECTORS, 1987 AND 1990
Output NRP /1 RP / RERP 1/Industry sector (Rp billion) 1987 1990 1987 1990 1987 1990
Food crops 15768 9 11 18 20 6 8Estate & Other crops 6202 6 5 14 12 2 1Livestock 5306 22 21 33 31 19 18Forestry 1543 -17 -38 -20 -43 -29 -49Fishing 2525 12 12 15 16 3 4Oil & LNG 15397 0 0 -1 -1 -11 -11Non-oil mining 1031 1 3 0 1 -11 -9Food and tobacco 17984 14 14 122 124 99 102Textiles, cloth & footwear 4348 32 12 102 35 81 21Wood products 2812 2 -5 25 33 12 20Paper products 977 22 13 31 20 17 8Chemicals 3129 6 5 14 13 2 2Oil refining 11569 0 0 -1 -1 -12 -11Non-metal products 3065 17 14 57 49 40 34Basic metals 1823 7 6 13 10 1 -1Engineering 4929 40 38 152 139 126 115Other 297 40 26 124 79 101 61
Agriculture 31343 9 8 16 15 4 3Excl. forestry 27276 11 11 19 20 7 8
Manufacturing total 50932 13 10 39 33 24 20Excl. oil refining 39363 17 13 68 59 50 43
All tradeables 98703 9 8 16 14 4 3Exel. oil sector 71737 13 11 26 24 13 11
Import-competing LI 58485 17 15 39 35 24 21Export-competing e2 40218 -1 -1 -2 .1 -12 -11
Anti-trade bias of commercial policy LI 1987 - 41% 1990 - 36%Nominal wage effect of commercial policy 2 1987 - 12% 1990 - 11%
/1 The definitions of these concepts are outlined in Annex 4.iZ The dividing line between export- and import-competing sectors is whether
they involve exports of more or less than 20% of output.
Source: World Bank Staff estimates.

- 62 -
effect of trade policy on general prices, shows a similar pattern, with theRERP for manufacturing declining from 50% to 43% and that for agriculturedeclining from 4% to 3%.
3.13 While the movements in average protection rates for agriculture andfarming between 1987 and 1990 are only small, there have been significantchanges in protection of individual commodities. Since the agricultural traderegime is characterized primarily by direct controls rather than importtariffs and export taxes, many of these changes are due to movements in worldand domestic prices rather than to changes in trade policies. For example,the .ecovery in world prices for crude palm oil (CPO) raised the implicittaxation in the sector. This taxation arises from a Government scheme wherebyproducers are directed to sell a certain amount of output to refiners at a lowprice. This allocation price was substantially below the FOB price in 1990.
3.14 Average levels of protection can mask very large differences betweenvarious activities. For example, in manufacturing, food beverages andtobacco, engineering and other manufactured goods have ERPs well above theaverage. Agricultural activities are in general much less protected thanmanufacturing, but there are significant variations. Thus, despite the lowaverage protection rate in agriculture there remains substantial scope forimproving the incentive framework for many commodities. Within agriculture,several import-competing goods significantly benefit from the structure ofprotection while most export-competing goods are effectively taxed (seeTable 3.4).
3.15 Recent changes in agricultural incentives. Overall, the effects oftrade reform on agriculture have been mixed reflecting the main focus of thereforms on manufacturing. The May 1990 package extended deregulation to someagricultural products and this has been a positive development. Specificallythe package decontrolled cassia, nutmeg and tengkawang exports (previouslycontrolled by government-sanctioned marketing associations) and exports ofvegetables from North Sumatra. Until 1989/90, coffee exports were alsosubject to control by a marketing association, within a government-admirnistered scheme that allocated rights to export to International CoffeeOrganization (ICO) countries in proportion to exports to non-ICO countries.ICO quotas were suspended in July 1989, and the coffee marketing associationwas abolished in May 1990. Some of the restrictions on the size of poultryfarms were also lifted, allowing poultry producers to take advanteae ofeconomies of scale. In the fishery subsector, the Governmert began to allowthe leasing (but not purchase) of foreign vessels. Earlier reforms ofinternational trade in corn and pepper reinforced this deregulatory stance.
3.16 Other developments in agriculture, however, have led to increasedregulation in some areas. For example, in 1990, Government granted to aprivate consortium the exclusive rights to international and domestic trade incloves (Box 3.1). The 1986 ban on the export of raw rattan was extended tosemi-finished rattan in 1988, with a subsequent drop in the farmgate price ofup to 75% in some areas (Box 6.1). The ban on the export of logs, introducedin the early 1980s, was followed in March 1989 by an export tax on sawn logsof certain species, and the tax was raised to prohibitive levels in November1989. Since 1987, bans have also been imposed on the export of certain lowgrades of rubber and coffee. While the intention of these bans is to upgradequality and thus improve the image of the commodities on the world market, the

- 63 -
Toble 3,4s PROTECTION OF BZLZCTZD AGRICULTURAL PRODUCTS
Output NRP ERPIndustry sector (Rp billion) 1987 1990 1987 1990 1987 1990
X X X X X
Imoort-competing sectorof whichRice 7611 20 0 11 11 -1 0Corn 928 10 0 25 12 12 1Peanuts 566 46 30 63 45 44 30Soybeans 462 60 38 101 74 80 57Vegetables 2284 21 21 28 29 15 16Fruit 1608 28 25 31 28 17 1SSugarcane 576 33 35 90 93 70 74Brown sugar 413 33 35 69 78 51 60Tobacco 581 14 13 36 35 22 21Cloves 487 5 0 8 3 -3 -8Livestock 1293 15 1S 17 17 4 5Milk Livestock 105 100 0 600 -42 600 -47Poultry 1501 22 17 29 21 15 9Freshwater fish etc. 671 29 29 34 35 20 21Dried smoked fish 72t 2& 21 34 * 35 20 21
Avg. imDort-comoeting 23286 14 13 25 23 11 10
Exoort-comnetins sectorsof whichCassava 1343 0 33 1 35 -10 22Dried cassava 243 0 33 -1 39 -12 25Rubber 345 0 0 S 5 -6 -6Coconuts 884 0 0 3 3 -8 -7Coconut oil 319 0 0 -2 -2 -12 -12Palm oil 542 0 -7 9 -1 -3 -11Coffee 949 0 0 2 2 -9 -8Tea 239 0 0 2 2 -9 -8Nutmeg 38 -19 0 -19 3 -28 -8Wood and bamboo 1328 -18 -38 -21 -43 -30 -49Marine fish etc. 1133 0 0 -1 -1 -12 -11
Avs. exogrt-comoeting 8058 -4 -3 -4 -3 -14 -13
Source: World Bank staff estimates.
bans are unlikely to have the desired effect. There are well-defined nichesfor all grades of these products in t1.e world market and the effort should befocused on maintaining appropriate standards for each grade. Efforts toimpro,e quality control through bans may induce processors to mix these lowergrades into a final product that was previously of a higher quality, loweringthe proportion of exports in the higher quality grades. The allocation systemfor the EEC export quota for cassava, the production and import controls onsugarcane and sugar, and the import ban on soybean meal are otherinterventions in the agricultural trade regime that appear to distortincentives. The sugar c3ntrols raise costs to consumers and provide excessiveincentives to produce sugar, while the soybean meal ban has importantdownstream effects by raising livestock feed costs throughout the economy.
3.17 A recently introduced scheme to subsidize private sector timberplantations could prove both to be costly and to provide inappropriateincentives. Under the scheme, th. Government provides one-third of totalproject costs through a loan at zero interest. This is equivalent to asubsidy of over 25% of total costs and exceeds the size of the equitycontribution of the private partner. This subsidy has been justified on thegrounds that timber plantations developed on degraded land generate valuable
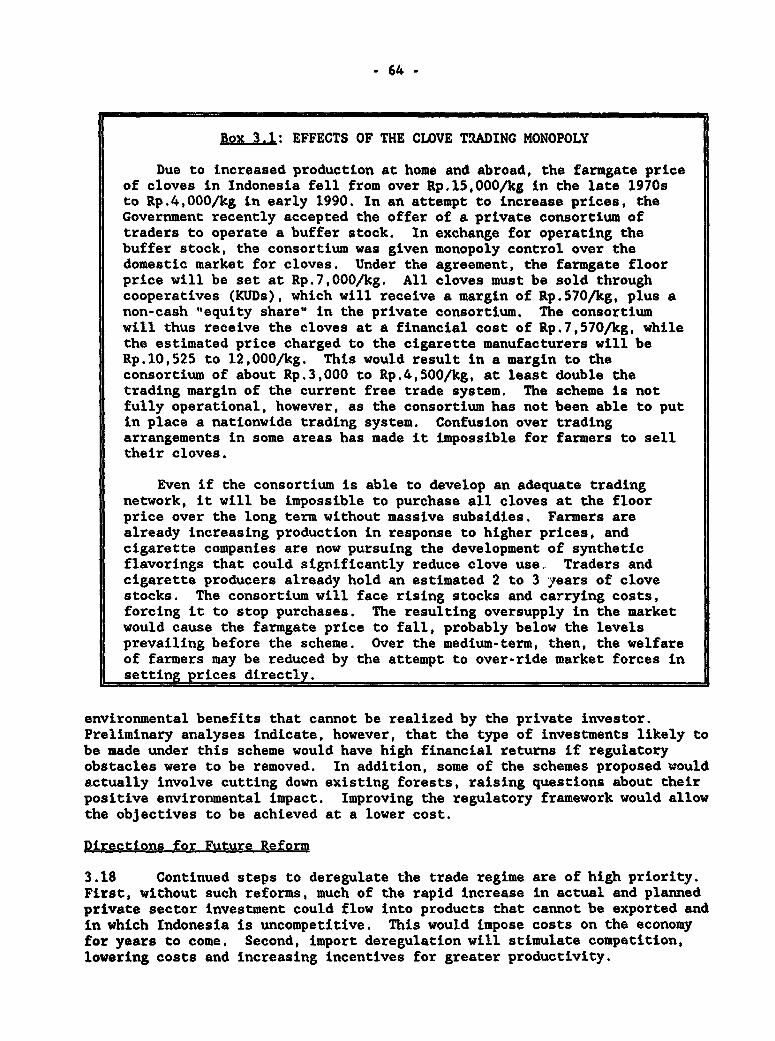
- 64 -
|Bex3.1: EFFECTS OF THE CLOVE TLADING MONOPOLY
Due to increased production at home and abroad, the farmgate priceof cloves in Indonesia fell from over Rp.15,000/kg in the late 1970sto Rp.4,000/kg in early 1990. In an attempt to increase prices, theGovernment recently accepted the offer of a private consortium oftraders to operate a buffer stock. In exchange for operating thebuffer stock, the consortium was given monopoly control over thedomestic market for cloves. Under the agreement, the farmgate floorprice will be set at Rp.7,000/kg. All cloves must be sold throughcooperatives (KUDs), which will receive a margin of Rp.570/kg, plus anon-cash "equity share" in the private consortium. The consortiumwill thus receive the cloves at a financial cost of Rp.7,570/kg, whilethe estimated price charged to the cigarette manufacturers will beRp.10,525 to 12,000/kg. This would result in a margin to theconsortium of about Rp.3,000 to Rp.4,500/kg, at least double thetrading margin of the current free trade system. The scheme is notfully operational, however, as the consortium has not been able to putin place a nationwide trading system. Confusion over tradingarrangements in some areas has made it impossible for farmers to selltheir cloves.
Even if the consortium is able to develop an adequate tradingnetwork, it will be impossible to purchase all cloves at the floorprice over the long term without massive subsidies. Farmers arealready increasing production in response to higher prices, andcigarette companies are now pursuing the development of syntheticflavorings that could significantly reduce clove use, Traders andcigarette producers already hold an estimated 2 to 3 years of clovestocks. The consortium will face rising stocks and carrying costs,forcing it to stop purchases. The resulting oversupply in the marketwould cause the farmgate price to fall, probably below the levelsprevailing before the scheme. Over the medium-term, then, the welfareof farmers may be reduced by the attempt to over-ride market forces insetting prices directly.
environmental benefits that cannot be realized by the private investor.Preliminary analyses indicate, however, that the type of investments likely tobe made under this scheme would have high financial returns if regulatoryobstacles were to be removed. In addition, some of the schemes proposed wouldactually involve cutting down existing forests, raising questions about theirpositive environmental impact. Improving the regulatory framework would allowthe objectives to be achieved at a lower cost.
Directions for Future Reform
3.18 Continued steps to deregulate the trade regime are of high priority.First, without such reforms, much of the rapid increase in actual and plannedprivate sector investment could flow into products that cannot be exported andin which Indonesia is uncompetitive. This would impose costs on the economyfor years to come. Second, import deregulation will stimulate competition,lowering costs and increasing incentives for greater productivity.

- 65 -
Competition will also prevent the larger domestic firms from exercising marketpower to earn excessive profits while imposing high costs on the rest of theeconomy. Third, the need to stimulate non-oil exports calls for areassessment and reduction of export controls as well as a rapid reduction inprotection, which still creates a high-cost economy and an anti-export bias.
3.19 Non-tariff imRort barriers. The Government has indicated that a mainpriority in this area is to remove re..aining NTBs in manufactuxing in the nearfuture. The focus will be on products with high levels of protection thatgenerate high costs to the economy and distort investment incentives. Removalof the manufacturing NTBs would reduce the coverage of NTBs from 25% ofproduction of tradeable goods to less than 20%.
3.20 Further substantial reduction in NTBs will call for reforms in theagricultural sector. Given the low average level of protection in the sectorand the strong competitive forces generated by millions of private farmers,the focus should be on removing interventions that prevent farmers from makingappropriate adjustments to changing market signals and that result in highcosts to consumers and downstream producers. The recent decontrol of importsof pepper and corn are steps in this direction. Other areas wherederegulation could offer significant benefits include removing NTBs on importsof sugar, wheat and soybean meal and removing area and production quotas onsugarcane. Where necessary, tariffs could replace NTBs. Food securityconcerns may make decontrol of rice trade difficult to consider and therelatively low level of distortions suggests the short-term gains may besmall. Conversely, Indonesia appears to produce adequate supplies of ricecompetitively, and this suggests that rice production can 'hold its owno sothat the need for intervention on the present scale may no longer be great.
3.21 Tariff reform. Some progress has recently been made in reducing theincidence of tariff duties and these are now largely within a ceiling of 40%.
The Government has indicated that it intends to reduce tariff levels in stagesso that only a few rates lie above a range of 20-30%. Higher rates would be
limited and temporary, allowing only a specified time for concerned activitiesto adjust to the tariff reduction in an orderly fashion. Such a reform wouldreduce the range of protection provided to different economic activities,lower the tax on domestic consumers, and remove the pressures to providespecial treatment.
3.22 In addition, the Government intends to "tidy up" the tariff scheduleby eliminating the remaining split tariff positions. The existing surchargesare also to be reviewed and it is expected that a substantial proportion of
them will be eliminated. Concerns about dumping may need to be addressedthrough an appropriate anti-dumping procedure aligned with GATT rules. Moregenerally, there continues to be a need for the Government to monitor how thereform program is proceeding and assess its effects in an economy-widecontext. This task could be best addressed by a unit within the Governmentable to provide quantitative information and analysis concerning the effectsof reform and represent the public interest in dealing with the inevitablelobbying for exceptions. Further, trade reform needs to be implemented withina balanced macroeconomic framework which takes into account adjustments in the
trade regime.

* 66 -
3.23 ExRort restrictions. The need to revitalize non-oil export growthcalls for a reassessment and reduction of the remaining export controls.Accordingly, the Government is undertaking a review of these restrictions.The priority areas for reassessment include:
* the export tax on sawn timber, the bans on rattan exports, and thelicensing of palm oil exports, 2/
* the export quota allocation procedures for cassava, and possiblyother products, by developing a quota auction system that would alsogenerate revenues for the budget,
* the bans on lower quality grades of commodities such as rubber andcoffee,
the ban on cement exports.
C. Lomestic Regulations
Domestic and Foreign Investment
3.24 To improve domestic incentives and the, regulatory er.ironment for theprivate sector, the Government combined trade reform with a series of otherregulatory measures over 1985-89. In investment licensing and the regulationof foreign direct investment, the policy stance has shifted sharply fromcontrol of investment to encouragement. In particular, the Governmentreplaced a long list of activities open to both domestic and foreigninvestment with a short list of activities that are closed. Investors havereported that investment applications are being processed and approvedspeedily on the basis of the negative list. Most new investment approvals aredirected towards export activities and the dramatic response is discussed inChapter 1.
3.25 In the May 1990 package, the Government has further deregulatedinvestment procedures in agriculture and the pharmaceutical industry. Inagriculture various restrictions in the poultry, livestock, and fisheriesindustries have been eased. In the poultry industry, the reform eliminatedthe restriction on the maximum farm size and eased limits on foreigninvestment. Likewise, in the livestock industry licensing has been reduced inscope, procedures simplified and licenses made permanent. To promote thefishing industry, certain licensing procedures have been delegated toprovincial authorities, while licensing requirements have been eliminated forsmall indigenous fishermen. At the same time, quality control procedures havebeen deregulated. For the pharmaceutical industry, the reform has eased
2. If the primary goal of the prohibitive export tax on sawn timber is toreduce deforestation, a more economically efficient means would be toincrease fees on the basis of trees felled in the natural forest. Thiswould avoid the adverse effects that the export tax has in providingprotection to domestic wood processing and wou.d not discourage export ofsawn timber produced from plantation-grown wood such as rubber.

- 67 -
licensing procedures for both production and distribution. In addition, theprocessing requirements for applications and registration of drugs have beensimplified. These changes comrlemcnt the reduction in levels of importprotection for pharmaceutical production and should facilitate increasedcompetition in the industry, leading to increased efficiency and lower healthcare costs. At the same time, the Government intends to supervise the qualitycontrol systems of the industry more tightly.
3.26 Although most fields of investment have been declared open todomestic and foreign private investment, there are still 165 sectors whereentry is restricted in the negative investment list. These restricted sectorsare concentrated in the metal products subsector (71 items); food, beveragesand tobacco subsector (44); wood products subsector (13); the chemicalssubsectors (13); and the paper subsector (6). In addition, there are a largenumber of production activities where entry is limited to small-scale domesticinvestors. Although these restrictions are not applied rigidly, they are asource of uncertainty and a potential barrier to new investment. Therestrictions are particularly important in the food and textiles sectors andcould prevent small firms growing into an efficient scale of operations.
3.27 The policy objective and criteria for selecting goods to be includedin the negative list could be re-examined. In general, there are likely to befew grounds apart from national security, for maintaining a negative list.With the adoption of the negative list, the capacity expansion license hasbecome redundant. Steps to reduce entry barriers that would also be moreconsistent with efficient investment could be to: reduce the number ofproducts restricted to the small-scale sector; raise the limits of thedefinition of a small industry; and permit foreign investment in thesmall-scale sector by reducing the minimum foreign investment requirement.
Labor Regulations
3.28 Labor markets in Indonesia are flexible and barriers to labormobility are low. The relatively smooth functioning of the labor wazet hasunderpinned the structural transformation of the economy and facilitated theexpansion of the activities in which Indonesia is competitive. Laborregulations are guided by the Basic Law of 1969, which covers among othermatters: hiring and retrenchment of workers; protection and supervision ofworkers; and employment of expatriate workers. These regulations are enforce'by the Department of Manpower (DEPNAKER) and labor inspections are carried outby 27 provincial and 170 district-level offices.
3.29 While seeking to protect workers, welfare, the Government has triedto implement these regulations flexibly. However, the business community'sconcern about the extended process of DEPNAKER approvals required for layoffsand dismissals has led companies to minimize the hiring of permanent labor andrely more on temporary workers. The Government has taken some steps to easethis prob'lem by abolishing requirements for permits for dismissing workers onprobation or on short-term contracts. Other initiatives to reform laborregulations include: abolishing the requirement for companies to obtainpermits in employing workers from 40 to 54 hours a week; decentralizing toregional offices approvals for employing workers in excess of 54 hours a '.$)ek;and allowing regional offices to approve night work for female workers. The

- 68 -
controls implied by these permits may be justified on safety and healthgrounds. However, labor regulations could be eased in the area of hiringexpatriate labor, particularly in the financial sector.
Land Laws and Regulations
3.30 Private enterprises face particularly difficult problems in acquiringland. Currently, there are over 300 sets of laws, regulations, decrees, andinstructions governing land acquisition. The mechanism to implement theseregulations is equally complex, often involving several different committees-nd levels of government for granting location permits, release of rights, andfor land investigations. This increases the administrative loal and delaysinvestments (delays average almost two years). Consideration might be givento simplifying regulations, and improving public access to them throughimproved cross-referencing and indexing of the regulations into a unified landdevelopment code. The land acquisition process could also be simplified bycombining the functions of the various committees and reducing the number ofsteps involved in the approval process.
3.31 The problem of land acquisition by private enterprises is also madedifficult by the lack of systematic land registration and titling. While theBasic Agrarian Law stated the Government policy of progressively registeringall land holdings, it is estimated that fewer than 30% of land holdings havebeen registered in the legal cadastre so far. This complicates and addsfurther risks to land acquisition by private enterprise, since a protractedsurvey of land title is needed at the time of land acquisition, with the riskof paying the wrong party for the land. Systematic and accelerated landregistration in the faster developing areas of the country should be carriedout as a matter of urgency. For this the Land Agency (BPN) needs to bestrengthened with improvements in procedures and training, supported byincreased funding and technical assistance.
D. The Legal Framework
3.32 Regulatory reforms to date have focused primarily on the core areasof trade and investment regulations. The Government has recognized, however,that other aspects of the regulatory framework -- including the legalframework and land laws -- have important effects on the pace and efficiencyof private sector development. Reforms in these areas will be complex andtime-consuming since they will require substantive revisions to laws,modifications of procedures and reorientation of institutions. However, theGovernment has taken some important initial steps to lay the groundwork forfurther reforms. For example it has set up a working group of the legaladvisors in the economic ministries to identify priorities and approaches tothe modernization of the corporate legal framework.
3.33 The principles of commerciL. law are that the legal system shouldprovide certainty, predictability and confidence. The key economic objectivesthat the legal framework would aim to achieve are: to reduce transactioncosts by providing standard contracts and increasing access to information; toreduce legal barriers to entry end mobility of private investment; to providefor sanctions for infringement of well-defined rules of market functioning;

- 69 -
and to provide mechanisms for dispute settlement. The following sectionsdiscuss the application of these principles to priority areas of commerciallaw reform.
Comnanies Law
3.34 A sound framework of company laws, accounting and audit requirements,and capital market regulations is essential for the development of anefficient corporate sector. Of critical importance is a modern company lawproviding for limited liability. A modern company law is important to guideeconomic conduct efficiently in a standard fashion and thereby lowertransaction costs for suppliers of risk capital. Procedures for forming alimited liability company could be relatively simple and quickly followed.Ease of entry helps to ensure market competition, ar.d will facilitateadaptation to changing market conditions by allowing the expansion of firmsinto new areas and products and withdrawal from others in a timely fashion.Under the existing law, formation of a limiteCT company may take over a yearand the procedures are complex and costly. Moreover, limited liabilitycompanies may be formed only for specific purposes and for defined timeperiods. This can cause great difficulty in adapting to market changes. Theexit of firms from an activity should also be subject to clear and fair rules.The law should facilitate changes in the structure of a company as the marketchanges, and rules about merger and acquisition should be clear. Although theBankruptcy Law of 1905 provides a framework for efficient exit, the perceptionis that implementation is difficult. The establishment of specialized courtsor specially-trained judges might provide a better mechanism to handle theseproblems.
3.35 Proper accounting of transactions is also fundamental to theeffi.cient operation of an economic system. Without proper accounting andauditing it is impossible to assess enterprise performance. The variousparticipants in business (such as shareholders, investors and creditors) needaccurate and adequate information on the operations of enterprises to enablethem to take decisions on investing funds and assessing risks posed by theenterprise. Additionally, separate capital market regulations that arecomprehensive, and efficiently implemented, will reduce the burdens on companylaw (for further details see Chapter 4). The basic company law framework canset out its main provisions in a simple standard form and use the capitalmarket regttlations and its regulatory agency to apply them to publiccompanies.
3.36 The most modern company, credit and contact laws would be of littleuse without means of enforcing their provisions, or of efficiently andpre.ictably resolving disputes about their meaning. Strengthening the courtsystem would provide a reliable dispute settlement system. Some measurescould be taken quickly, including better training and compensation to increasethe technical competence of judges handling complex commercial cases andestablishing specialized courts, or judges, to handle commercial disputes. Ona pilot basis, these efforts could be focused on district courts with a highconcentration of commercial activities so that measurable improvements can berealized in a relatively short time. Another method of resolving commercialdisputes is through arbitration. Arbitration often avoids the confrontationalaspects of a court trial and may encourage settlement by mediation andconsensus. Indonesia has well-defined procedures for arbitration, and an

- 70 -
arbitration board for the private sector. However, the quality of arbitratorscould be improved by including more people from technical and business fields.Additionally, the board could be more active in publicizing its rules andresponsibilities.
Access to Legal Information
3.37 Widely available publication of laws, interpretations and decisionswould help ensure the consistent application of laws. Inadequate legalinformation raises barriers to entry for private businesses (especially smallbusinesses less able to pay for a costly private search for legal information)and leads to inefficient economic transactions. Even experienced lawyersspend costly hours trying to unravel or assimilate details of regulations.The lack of transparency also burdens the government officials who must spendtime with the information-seekers. Better access to legal information wouldallow legislators, economic policy makers, and government officials to knowand master the existing laws and rules, helping them avoid inconsistencies andcontradictory policies.
3.38 Establishing official Indonesian translations of existing legal codeswould help address some of these problems. At present, major components ofthe formal legal system remain in Dutch, without an official Indonesianlanguage version. This is in itself a major impediment to a coherent economiclaw framework in Indonesia and results in problems of understanding andenforcement../ The distribution of existing publications (including opensale to allow for cost-recovery) could be improved, and consideration could begiven to publishing court decisions in the commercial area. In many countriesthere are registries which allow public access to important legal information.Although Indonesia has a number of registries, the public is often given onlylimited access to the information.
Imnlementation
3.39 Legislative actions to implement law reforms usually take a longtime. Host of the changes mentioned above, however, do not requirelegislative action. The working group of legal advisors could make an earlystart by developing a detailed action program, giving specific agencies theresponsibility for producing schedules for change. The private sector shouldbe closely involved.
E. The Framework of Environmental Incentives
3.40 It is increasingly recognized that economic development not only cancause--but can also be constrained by--environmental degradation. Theconstraint arises in large part because of "externalities", which arisebecause individuals and firms do not always have to pay for damages they
/ Unofficial translations remain in circulation today and are relied on tounderstand the Dutch codes. Although often excellent, they are frequentlydescriptive rather than precise, and more importantly, have never beenenacted as official Indonesian language versions of the Codes.

- 71 -
cause. The presence of externalities leads to economic behavior that isoptimal for individual producers but which decreases welfare and growth in theeconomy as a whole. A sound environmental framework involving a complementaryset of incentives and regulations is needed to make sure that individuals andfirms bear all the costs of their behavior.
3.41 An environmental incentives fra:mework for Indonesia needs to addressat least three areas in which externalities are reducing overall welfare: (a)water resource management (including industrial pollution) and air pollution,especially on Java; (b) forestry management on the outer islands; and (c) landuse managemen- and planning nationwide. Addressing these issues will requirea combination of different approaches, including: changes in policies andpricing; improved cross-sectoral coordination; and increased expenditure onpollution abatement. Greater use could be made of market-based incentivesbecause they can often achieve environmental cbjectives at a lower cost thandirect regulatory measures. Market-based incentives can also be easier forthe Government to administer.
3.42 In July 1990, the Government established a national EnvironmentalImpact Management Agency (BAPEDAL), which has a broad mandate to de,;ise andenforce all types of pollution control measures. This Agency is not yetstaffed, however, and discussions are still ongoing regarding its exact roleand powers. One of the major tasks facing the BAPEDAL will be to coordinateand make more manageable the environmental impact assessment (AM)AL)regulations, which require environmental impact analyses prior to thecommencement of all investment projects, both private and public. Because itis complex and requires substantial technical skills, the assessment processis fully operational only in the Ministries of Miiies and Energy, Public Works,and Industry. For private sector investments, responsibilities for reviewingenvironmental impact statements and stipulating required follow-up measuresare shared by a variety of central and regional agencies. However, shortagesof technical skills have meant that the screening process for private sectorinvestments is not yet effective.
3.43 Water and air pollution. Despite the formidable obstacles toimplementing the environmental impact assessment process, the Government hastaken steps to address some of the most severe pollution problems. The CleanRiver Program (PROKASIH), which got fully underway in 1990, aims atdramatically reducing waste flows of major industries in eleven provinces. Sofar over 300 factories in the Jakarta area alone have pledged to reducepollution levels by 50% in the next year. To support this program, a recentlyissued regulation defines the limits of pollution levels more clearly for awide range of industries. Under the regulation, these industries are requiredto install liquid industrial waste flow meters and to provide daily reports onwaste flows. Waste samples are to be analyzed each month at a government-appointed laboratory. The new regulation is an improvement over a similar oneissued three years earlier, because it specifies limits on total waste loadrather than limits on waste concentration alone, which could be met simply bydiluting the waste before discharge. While PROKASIH has succeeded in raisingthe consciousness of industry regarding the harm caused when waste is dumpeduntreated into rivers, it is important that such initiatives not be overlyambitious, either in geographical scope or in the degree of waste loadreduction sought. Government pollution control programs risk beingdiscredited unless they are both technically feasible and administratively

- 72 -
enforceable. Since the cost of pollution abatement can vary widely betweendifferent industries, Government should consider adopting over the longer terma system of market-based incentives. A well-designed effluent tax or chargewould be an important first step. Untreated sewage from domestic sources isalso a major source of water pollution, particularly in large cities.Regulations in this area need to be supplemented with effective, low-costprograms to provide safe disposal of sewage.
3.44 An emphasis on market-based incentives should also be coupled with areview of sectoral and macroeconomic policies that might affect theenvironment. An important example is the effect of current energy pricingpolicies on air pollution.4/ Fuel subsidies increase the use of the mostpolluting fuels, such as diesel and fuel-oil. Pricing fuels on the basis ofefficiency prices would not only improve energy efficiency, but it would alsopromote use of the more environmentally benign fuels, such as low-sulfur fuel,natural gas, LPG, and LNG. Full economic pricing of fuels could eventuallyinclude a separate surcharge over efficiency prices to cover the cost ofpollution damage caused by each fuel.
3.45 Water quality degradation can also be caused by inadequate supply anddemand management. Public water companies are often unable to provide areliable supply of clean water to many customers. In addition, the tariffstructure provides for a substantial cross-subsidy of domestic consumersfinanced by high tariffs on industrial and commercial consumption. Manyindustrial and commercial users therefore rely primarily on groundwater, whichis cheaper even though the firms have to invest in their own wells and pumps.However, overextraction of groundwater resources in many areas is leading tosalinization and land subsidence, both of which cause major economic losses.To curb these losses, three initiatives need to be pursued simultaneously: (a)a concerted effort to improve the reliability and quality of water suppliedthrot.gh the public systems; (b) an adjustment of tariff and fee structures tomake publicly supplied water more competitive with groundwater; and (c) muchmore vigorous collection of groundwater fees in congested areas.
3.46 Forestry and land management. Although Indonesia is well endowedwith natural resources, their proper management is essential to ensure asustained resource base for private sector development for the longer-term.For example, export-oriented industries such as wood products and fisheries,depend directly on natural resources. These resources can be exhausted ifthey are not properly managed. An appropriate incentive framework isessential to ensure that future development of the resource-based privateindustries is not endangered. Inappropriate forest and land resource pricingpolicies, in particular, have provided excessive stimulus forover-exploitation and degradation of the resource base.
3.47 In the forestry sector there are a number of incentive issues thatrequire attention. Despite recent increases in fees and rovalties, Governmentstill recovers less than 30% of the rents from trees removed from the naturalforest by private concessionaires, far lower than the 85-90% rent-recoverylevels achieved in parts of Malaysia. This results in enormous private
i/ See Indonesia: Energy Pricing Review, Report No. 8684-'I4D, World Bank,1990.

- 73 -
profits and lowers the incentives for efficient utilization of the wood. Inaddition, these fees should be charged on the basis of trees felled in theforest rather than at export or processing points, so that stronger incentivesare given for better utilization of the wood during logging, transportationand processing. Raising fees and basing them on the number of trees felledwould be a more appropriate way of conserving resources and assuring asustained supply of raw materials to private industries than the export bansand taxes now in place.
3.48 There is only a 20-year lease period on forest concessions. Thisshort tenure gives concessionaires little incentive to ensure regeneration ofthe logged forest, a process that takes 35 years or more. To promoteregeneration, one option might be to adopt a perpetual lease system, makingthe leases extendable every five years, contingent on satisfactory management.This would help keep the planning and investment horizon long enough to givean incentive for replanting. Allowing leases to be privately traded wouldalso give concessionaires the incentive to maintain the value of theconcession. To collect the information needed to evaluate concessionaireperformance, monitoring and inspection needs to be strengthened, a processthat the Ministry of Forestry has recently initiated.
3.49 The recently announced timber plantation scheme, which will be fundedby reforestation fees, could potentially make a major contribution to thereforestation effort. However, it appears that the scheme as currentlydesigned will provide large subsidies to firms establishing plantations,although little analysis has been done to show that these subsidies areneeded. Special care should also be taken to ensure that firms do mot cutdown existing natural forest areas under the scheme. The scheme thus needs tobe reviewed to ensure that the reforestation fund is not depleted onunproductive investments.
3.50 Thera are similar problems with pricing land use more generally. TheIndonesian Constitution of 1945 vests control of all the land in Indonesiawith the Government. In granting ownership or long-term lease rights to theprivate sector, the land is often undervalued and transferred at prices thatare far below market price. This leads to rent-seeking behavior and extensiverather than intensive use of land, which in turn increases demand for land andaccelerates environmental degradatior. Consideration should be given tocharging more appropriate market-relate4 prices to encourage betterutilization of land.

- 75 -
CHAPTER 4
THE STRATEGIC ROLE OF THE FINANCIAL SECTOR
A. Introductin
4.01 Maintaining growth and development in the private sector and theeconomy at large requires a complementary financial system capable ofproviding indispensable financial services and resources to growing markets asefficiently as possible. As shown in Chapter 1, Indonesia has progressed farin its efforts to stimulate the domestic financial system. This chapterexamines the connections between real and financial activity and the role ofthe private sector and highlights remaining challenges for the sounddevelopment of finance in Indonesia. The agenda stresses the need for betterpricing and management of risk. To meet this goal requires strengthenedsupervision, revamped legal and accounting structures, improved accountingstandards, increased disclosure of information, improved professional skillsand a more diverse menu of financial instruments.
B. The Role of the Financial System in Promoting Private Sector DeveloDment
4.02 An expanding role for the private sector will require development ofa broad array of financial services and intermediaries: commercial banksproviding working capital and long-term debt finance; venture capitalists andthe stock exchange contributing equity; insurance and pension funds supplyinglong-term funds; and leasing companies and securities houses offering alterna-tive financing options. Such a diversified financial system contributes tosavings, investment and growth by mobilizing greatPr amounts of financialsavings through offering instruments better suited to the needs of savers andtransforming the maturity and size of savings to fit the needs of investmentprojects. The financial system can contribute to economic stability by moreaccurately assessing, pricing and dispersing risks throughout the economy.The information and expertise available in financial institutions improvesrisk assessment. The profit motive promotes accurate pricing and lendingdecisions. Diversified portfolios lessen the risk to the intermediaries anddepositors of individual project failures.
4.03 For these favorable effects to flourish requires access to accurate,plentiful information and sound supervisory, legal and accounting frameworks.Indeed, one view of banking stresses that the key role of financial interme-diaries comes from the comparative advantage they develop in collectinginformation on borrowers and their projects and enforcing financialdiscipline.1/ Enhancing the role of financial intermediaries then becomessynonymous with improving banks' ability to collect and process informationand to enforce debt contracts. For this reason much of the discussion in the
See Eugene Fama, "What's different about banks?", American EconomicReview, Vol. 74, December 1985, pp 29-40.

- 76 -
rest of this chapter focuses on the need to improve the risk-assessment anddisciplinary role of financial institutions through improving the enablingenvironmint of the financial system.
4.04 A favorable enabling environment will lead to less credit rationing.At present, because of a lack of information and legal difficulties, it isoften in the bank's best interest to deny a potential borrower access to aloan at any price. Promoting a sounder basis for finance will therefore havethe added benefit of promoting efforts to extend credit to new or tradi-tionally underfinanced groups such as small and medium-sized borrowers.
4.05 As long as information and the legal environment are imperfect, bankswill have an incentive to ration credit to some risky borrowers. Borrowerswith a strong balance sheet--a relatively low debt-to-equity ratio--will beless likely to suffer from credit rationing since they will be better able toprovide collateral or use retained earnings in financing a project. This willlower the borrower's cost of capital since it lowers the risk to potentiallenders. In the aggregate, if firms have lower debt-to-equity ratios,investment will be promoted. This important link between financial capacityand real economic activity highlights -he need for expansion of equitymarkets, as well as loan markets, in developing a sound financial system andin promoting macroeconomic stability.
C. Banking Performance in Promoting DeveloRment
4.06 In sketching out the role of the financial system in promotingprivate sector development, three key areas are emphasized: (a) asset growth,(b) transforming the maturity of savings to match the needs of investmentprojects, and (c) allocating funds to high-return projects while appropriatelymanaging risk. This section examines how the Indonesian financial system hasprogressed in these three areas. Special emphasis is given to changes inrisks faced by the banking system.
Asset Gro_wth
4.07 As discussed in Chapter 1, there has a'ready been substantialprogress in increasing the amount of financial savings within the economy (seeTable 1.10). The ratio of M2 to GDP has risen from 18% in 1982 to 42% in1990. Lower spreads have allowed banks to attract more business into thefinancial system. Much of this growth has been concentrated in private banks,which have led the way in creating new products and in lowering costs (seeparagraphs 1.37-38). Since 1988, the equity market has awakened, providingequity finance to complement greater amounts of debt finance (see Table 4.1).This has helped to promote a healthier balance between debt and equity forover 130 companies that have listed shares.
4.08 Despite this phenomenal growth, there is further room for expansion.Analysis of a flow of funds in Indonesia shows that until 1988, 56% of publicand private enterprise investment was still financed out of retained earnings.In 1990, financiai savings--currency, demand deposits, quasi-money, and

- 77 -
securities--equaled only 62% of gross domestic savings. The ratio of M2 toGDP, dlthough growing quickly, is still below the levels of such neighboringcountries as Malaysia (68% in 1989) and Thailand (67% in 1989).
Iable 4.1: THE INDONESIAN STOCK AND BOND MARKET, 1986-90
Total Shares Share BondsNumber of Number of Value of Price Number of Value ofIssuers Companies Issues ,A Index Companies Issues/a
(Rp. bn) (1982-100) (Rp. bn)
1986 27 24 132.7 69.69 3 404.71987 27 24 132.8 82.58 3 535.71988 34 25 166.7 305.12 9 935.71989 89 67 3,998.7 399.69 22 1,535.21990 155 132 8,033.8 417.79 23 1,940.2
LA At offering price.
Source: BAPEPAM
4.09 The sheer pace of growth has created its own difficulties. Inbanking, the growing complexity due to new products, new banks and severalthousand new branches has stretched the supervisory resources of BankIndonesia. In the capital market, the flood of firms into the market hasstrained the supervisory agency, Bapepam. Burgeoning markets have stressedthe legal and regulatory structures underpinning them. Talented professionalstaff--bank managers, financial analysts, public accountants, lawyers--havebeen in great demand as banks and other financial institutions try simulta-neously to expand. This had led to a sharp acceleration in wages for experi-enced professionals. A key challenge today is to treat these growing pains sothat the financial markets continue to thrive.
Maturity Structure
4.10 Accompanying the rapid expansion of bank balance sheets was alengthening of deposit and credit maturities (see Table 4.2). On the creditside this has meant that loan maturities are somewhat better matched to theprofiles of investment projects. The lengthening of credit maturities,however, has occurred only at the private banks. State commercial banks(SCBs) and development banks have shortened the maturity of their credits,chiefly because of the declining importance of subsidized, directed(liquidity) credits in their portfolios. On the liability side, maturitieslengthened because of a fall in the importance of demand deposits relative totime deposits. This trend has been reversed, though, in recent years. The1986 devaluation, combined with the 1988 deregulation of savings deposits, haslead to a shortening of the average deposit maturity from the 1986 peak of 8.6months.

- 78 -
4.11 The modest lengthening in the maturity of credits, combined withshorter deposit maturities, implies an increasing maturity mismatch since1986. This has increased exposure of banks to interest rate risk. Some ofthis risk is hedged by the use of variable rate loans (see para. 4.50). Inorder to lessen this risk for the banking system further, longer term sourcesof funding are needed. One possibility is to offer firms such as insuranceand pension funds, which naturally have longer term liabilities, longer termbank deposits as assets.
Table 4.2: COMMERCIAL BANR MATURITY STRUCTURE(Billions of rupiahs end of period)
1983 1986 1988 1990 Maturity Weight(months)
3t%nk Credits< 3 months 1,829 1,991 2,354 3,495 1.53-6 months 1,787 3.443 5,392 5,057 4.56 mths - 1 ye: 4,438 11,237 18,866 43,753 91-3 years 1,604 2,092 3,731 8.778 24> 3 years 3,944 8,974 14,825 29,904 60unclassified 105 56 105 191 1.5
Total 13,707 27,793 45,273 91,178
Average Maturity (mths) /a 23.8 25.5 26.0 26.3
Bank FundsDemand Deposits 6,031 8,157 10,350 19,254 1Savings Deposits 584 1,387 2,174 9,662 1Toti.1 Rupiah Time Deposit 4,441 10,525 19,732 38,985
< 3 months 934 1,280 3,464 11,650 1.53-6 months 605 1,448 4,133 6,197 26 mths - 1 year 843 1,767 2,716 6,195 91-3 years 1,948 5,898 8,955 13,913 24unclassified 111 132 464 1.030 1.5
Total All Deposits /b 11,056 20,069 32,256 67,901
Average Maturity (mths) /a 5.8 8.6 7.8 7.3
Ratio of Credit to DepositMaturity 4.1 3.0 3.3 3.6
la Calculated by weighting the share of each maturity in total credit (deptsits)by he assumed maturity weight (the last column of the table).
lb This t,tal does not include forelgn exchange time deposits.
Source: Bank Tndonesia and World Bank staff estimates.
Credit Allocation and Risk
4.12 One of the central aims of financial deregulation was to improve theallocative efficiency of the banking system by eliminating ceilings on creditand interest rates and limiting directed credits. These moves were designedto allow resources to flow to high-return sectors of the economy, at pricesthat reflected the risk inherent in those sectors. To assess the effects ofthe reforms in this area, the section looks first at the sectoral allocationof credit, ane follows this with an analysis of changes in the riskiness ofbank lending.

- 79 -
4.13 The overall allocation of credit was not greatly affected by thereforms of 1983-88 (see Table 4.3), though the pattern roughly followedchanges in GDP. In part this may have been due to the continued importance ofliquidity credits during the period. Trade continued to receive about 30% ofall credit between 1982 and 1988. Manufacturing's share of credit rose toalmost one third at the expense of lending to mining. These changes mirroredmovements in value added over the period. The figures on value added sharecompared to credit share also show the relative credit intensiveness of tradeand manufactures compared to services and agriculture.
4.14 Since 1988 credit growth has accelerated most rapidly in services and"other", areas that have not seen a corresponding increase in value added.
Table 4.3: SECTORAL SHARES IN CREDIT AND GDP(percent)
Mbrch Dec.1982 1983 1984 1985 1986 1987 1988 1989 1990 1990
Share in Total Bank CreditAgriculture 8.7 9.0 8.7 7.4 8.2 8.0 8.4 9.5 8.4 7.6Mining 16.0 9.5 4.4 2.0 1.2 1.4 1.2 0.9 0.7 0.6Manufacturing 24.9 30.5 33.6 34.8 33.9 34.2 33.3 34.4 31.4 30.2Trade 31.4 30.7 32.6 32.9 32.2 30.7 30.8 32.2 31.9 31.5Services 14.2 15.1 15.9 17.5 17.1 15.3 16.5 16.7 16.6 18.4Others 4.8 5.1 4.9 5.3 7.4 10.3 c.; 6.4 11.1 11.7
Share in GDPAgriculture 24.1 22.8 22.7 23.1 24.1 23.3 24.1 23.4 23.1Mining 19.5 20.7 18.9 14.0 10.8 13.9 11.6 13.1 12.0Manufacturing 12.0 12.7 14.6 16.0 16.8 17.0 18.5 18.4 19.4Trade 15.9 14.9 14.9 15.9 16.7 16.8 17.3 17.0 17.0Serviees 24.8 25.0 24.8 26.9 27.5 25.2 24.6 24.6 25.1Others 3.7 3.9 4.1 4.1 4.2 3.9 3.8 3.5 3.4
Memo items: (trillion of Rp)Total Credit 10.2 12.8 15.0 18.7 22.1 27.3 32.7 45.5 71.5 97.2Total GDP /a& 62.4 77.6 89.7 96.8 102.5 124.5 139.4 166.3 189.9
/a 1990 GDP is a World Bank estimate.
Source: Bank Indonesia, Central Statistics Bureau.
This seems to be due to expanding home mortgages, car loans and other consumerfinance. Part of the increase in 1990 was in response to the Governmentdecree mandating that 20% of a bank's portfolio be lent to small borrowers.Most consumer loans satisfy the Government's criteria. There is also awidespread belief that the 1989/90 boom in property development was fueled bylending categorized as "other". Experience in other countries would supportthe view that lending for commercial real estate can be riskier than lendingto other sectors. Consumer lending also requires higher interest rate spreadsto cover the higher average losses in this line of business. For tnis reasonthe surge in lending to "other" could signal an increase in the riskiness ofbanks' portfolios that may require higher levels of provisions or equity tosafeguard bank soundness.

- 80 -
4.15 Allocative efficiency, loan pricinf and default risk. Looking atthe sectoral allocation of credit gives only a partial picture of the allo-cative effects of the banking reform. Increased lending to sectors that havelow returns, as measured by high loan default rates, is not an efficientallocation of credit. Efficient allocation requires that banks have anincentive to price their loans appropriately. However, until 1990, because ofthe predominance of liquidity credits with fixed interest rates and targetedmarkets, for many loans there was little scope or need for adequate loanpricing. Credit risks could be passed off to government insurance companiesat subsidized premiums, further lessening the incentive for banks to pricesuch loans adequately. This was particularly true of SCBs because of theimportance of liquidity credits in their portfolios. The recent scaling backof liquidity credits, couplsd with the strong growth in non-liquidity-creditloans, however, has allowed banks greater freedom in pricing their loans andin choosing borrowers. 0..e of the first reforms undertaken in 1983 eliminatedrestrictions on deposit interest rates. By altering bank cost of funds andthereby bank profitability, this has had profound effects on banks loanpricing. Both these changes should lead, a priori, to an improvement inbanks' management of default risk. Offsetting this, though, has been thepressure in the newly competitive market for banks to build market share byaggressively expanding their lending portfolios at the cost of underpricingloans. Some analysts have argued that the sheer speed of the growth incredit, 145% since 1988, has led to a weakening of credit quality which is notyet apparent.Z/
4.16 Determining which effect has predominated ot: pricing and allocativeefficiency is difficult. To answer this requires a judgement about changes inthe level of risk in bank portfolios and the adequacy of measures to zoverthat risk. One approach to this question is to look at how loan loss reservesand actual losses have behaved over recent years (see Table 4.4). Thesefigures show that loan loss reserves rose as a share of loans between 1982 and1989, while since then they have declined. The declining loan loss reservescould be evidence that bankers expect lower losses in the future. Write-offshave decreased when measured as a share of the interest margin which wouldseem to imply that lower losses are being experienced now.,J Both of theseindicators are consistent with increased allocative efficiency. Some of thesharpest declines in both ratios are in private foreign exchange banks.Private foreign exchange banks, however, have been subject to greater pres-sures to show improving profitability as many issued stock in the last twoyears. This may be taken as a response, then, to competitive pressures,rather than only a response to lessened default risk.
/ See Center for Policy Studies, The Indonesian Economy, Vol. 10:9, Septem-ber 1990.
]/ The interest margin has decreased as a share of assets so that write-offsas a percentage of loans have fallen as well. Some of this decline mayreflect the interaction of rapid asset growth and the limit on the taxdeductibility of provisions.

- 81 -
Iakli .J*A: LOAN LOSS RESERVES AND PROVISIONSi(percent)
1982 1988 1989 1990
Loan Loss Reserve/Total LoansState Banks 3.2 4.2 4.5 4.4Private FX B-nks 1.7 1.2 1.0 0.8Private Non-FX Banks 0.7 0.7 0.5 0.6All Banks 2.7 3.3 3.3 2.7
Provision Expense/Interest Margin JaState Banks NA 44.9 36.0 35.5Private FX Banks NA 20.7 16.3 18.1Private Non-FX Banks NA 17.1 16.7 13.4All Banks NA 29.2 28.2 22.3
Loan to Deposit Ratio bState Banks 1.34 1.40 1.32 1.28Private Banks 0.91 0.95 t..94 1.04All Banks 1.30 1.33 1.26 1.33
/a The interest margin is defined as the difference between interest incomeon loans and interest expense on deposits.
h Includes both Rupiah and foreign exchange deposits and loans.
Source: Bank Indonesia and World Bank staff estimates.
4.17 There are several reasons to treat any conclusions from Table 4.4cautiously. First, shortcomings ir. bank portfolio examinations and accountingstandards weaken the link between loan provisions and credit quality. Taxlaws limit loan loss reserve deductibility to 3% of loans for private banksand 6% for SCBs, restricting banks' interest in exceeding these levels. Allof these factors combine to reduce the usefulness of loan loss reserves as areflection of default risks. Finally, the fastest growth in credit has comein the last two years as the overall economy has grown strongly. Such r..ronggrowth would lower compan- loan defaults until economic growth slows, makingit appear tnat current levels of reserves are adequate based on recent experi-ence, but potentially inadequate in the future.
4.18 Capital is the traditional cushion for absorbing losses (afterspecific provisions). A higher equity base reduces the risk thatmismanagement by the bank of credit or other risks will lead to losses bydepositors. Higher amounts of capital also serve to dampen a bank's appetitefor risky projects since more of the bank owners' money is subject to loss.As a share of total assets, capital has risen for banks overall, particularlyafter 1988 (see Table 4.5). This is a healthy sign, but must be treatedcautiously since unrecognized losses in assets could wipe out some of the

- 82 -
general reserves now counted as part of capital. Some state commercial banksare under apitalized due to a combination of legal constraints on paid-incapital and division of profits and portfolio problems. However, for privateforeign exchange banks, capital asset ratios are also below their 1982 levels,despite the increases due to floating new issues. Since these banks have thelowest levels of loan loss reserves and have most aggressively expandedlending, some further increase would be prudent.
Table 4.5: BANK CAPITAL ASSET RATIO(Capital as a % of total assets)
1982 1988 1989 1990
State commeicial banks 3.3 2.8 2.9 2.4Private FX banks 9.0 5.1 6.2 7.2Private non-FX banks 14.2 7.6 9.4 11.7Foreign and joint venture banks 3.2 3.3 11.7 12.8All banks 5.5 4.9 5.6 6.0
Source: Bank Indonesia and World Bank staff estimates.
4.19 Risks from new operations. Besides managing credit or default risk,the opening up of other areas of financial intermediation to banks has addedto the risks they face. The difficulties of dealing with new markets areexacerbated by inexperienced staff exposing the bank to excessive risks.Providing new products and services, however, is critical to the bankingsectors role in supporting private sector growth. Managing the risks andopportunities of the new environment, both for banks and for regulators is amajor challenge (see section D). One step announced in March 1991 was tighterrestriction on margin trading in foreign exchange and the outlawing of banklending for stock market transations.
4.20 Liguidity risk. A more traditional component of risk to banks is thelikelihood of becoming temporarily illiquid. Illiquid banks jeopardize therole of the banking system in providing the means of payment for transactionsin the economy and the gains of a smoothly functioning payments mechanism. Tolessen this risk, a key element of the reforms has been aimed at strengtheningthe interbank money market to provide individual banks with liquidity to meettemporary shortfalls. Much progress has been made as the average weeklyvolume of lending has increased eight-fold since 1986. Maturities havelengthened to as long as one month, though the bulk of lending is stillovernight. Despite the growth the market remains shallow with quite volatilerates. Since the tightening of monetary policy in mid-1990, rates have rangedbetween 7% and 60% p.a., up from 7% to 25% in 1989. The major suppliers offunds are still the five SCBs who act as de facto market makers. However, inperiods where liquidity at SCBs is tight the interbank market can dry up.

83 -
4.21 The reduction of reserve requirements to 2% from 15% in October 1988had important implications for commercial banks, liquidity policies. At 2% ofthird party liabilities, required reserves are lower than prudential liquiditymanagement would warrant (6-8%). For this reason banks overall have held"excess" reserves since 1988, with the bulk of the excess accounted for bySCBs. The tight money policy implemented since May 1990 has decreased theexcess reserves held by the banking system to less than 2%. The tightermonetary policy has also led some banks to access BI's discount windows tomaintain needed liquidity when funds have become scarce in the Interbankmarket. Besides evidence of the direct effect of tightening liquidity, thismay also be evidence that some banks have been relying excessively on theinterbank market to fund their lending activities, leading to heightenedliquidity and interest rate risk.
4.22 Bank loan-to-deposit ratios also rema'l.a above the 70-80% levelusually considered prudent (see Table 4.4). Their level is higher than in1982 for most groups of banks. Such high levels make it difficult for banksto adjust to temporary illiquidity, in part because loans are not asmarketable as other assets. Levels are particularly high for the statecommercial banks because of their traditional funding through liquidity creditfrom Bank Indonesia (BI) ratner than deposits. A reduction in the loan-to-deposit ratio would help to improve bank soundness.
D. Ensuring a Sound Financial Syste
4.23 The comprehensive reforms undertaken by the Government have fosteredstrong growth in financial assets, improved loan maturities slightly, andallowed banks to allocate credit roughly in line with growth in value added.The reforms have also engendered two challenges. First, financial marketsneed to continue to grow to fulfill their role of supporting real investmentand growth. Second, the stability of the financial system and the overalleconomy require that this growth be based on sound institutions opuracingcompetitively under a transparent legal, regulatory and supervisory system.The mushrooming of financial assets and institutions is straining the capacityof the authorities to supervise and regulate markews. There is also evidencethat the growth is increasing risk at financial institutions. Meanwhile, thecapacity of financial institutions to continue to grow is hampered by thescarcity of qualified staff and management. The imperatives of sound andstable growth leave four printcipal items on the agenda:
* strengthening the prudential regulation of financial markets;
* enacting updated laws governing financial institutions and commercialrelations;
* bolstering managerial and technical expertise in financial institu-tions; and
* continuing to broaden the array of financial instruments available tothe public.

84 -
Strengthening Prudential Supervlsion
4.24 The rapid expansion of banks, branches and assets in the past twoyears has greatly expanded the scope of work for BI's supervision department.The sheer pace of the growth has led to concerns about the quality of somebank3s portfolios and the adequacy of their management. At the same time, theremoval of interest rate and credit controls has heightened the importance ofbanking supervision as a means of ensuring the soundness of banks. Somedifficulties have already surfaced with the failures of two small private non-foreign-exchange banks. Such events reflect the dynamism that is a normalpart of the growth and consolidation of a financial system. The challenge forthe supervisory authorities is to ensure that the process of failures andmergers strengthens the financial system, rather than undermining confidence.
4.25 Bank Indonesia has begun to respond to the new challenges. Thelatest development occurred in March 1991 when a new series of regulations onsupervision were announced. Important elements of the package include: newguidelines for capital adequacy linked to the Bank for International Settle-ments (BIS) standards; new levels of mandatory provisioning based on assetquality; new public reporting requirements; a prohibition on lending forsecurities trading and limits on margin trading in the foreign exchangemarket; limits on a bank's net open position and its swaps with BI to 20% ofequity; a tightening of lending limits to include on and off-balance sheetitems; minimum experience requirements for bank directors; minimum soundnessratings before opening new domestic or foreign branches. BI, with theassistance of the World Bank, the IMF and other agencies, has begun a compre-hensive program of staff training and systems improvement that will ensurethat the new regulations strengther the soundness of the financial system.
4.26 Examination procedures. Bfs examinations are also being revamped.The information used in and method of quantifying bank soundness has beenaltered. BI is training its staff to carry out an improved examinationcovering five basic areas including 4/: (a) a greater emphasis on thequality of management and management systems rather than accounting values andcompliance with regulations; (b) off-balance-sheet items; (c) an evaluation ofliquidity based on an appraisal of asset and liability managemer.t rather thansimply adherence to minimum reserve requirements; and (d) assessments ofportfolio quality based on the financial condition of borrowers rather thansimply the state of interest payments.
4.27 To cope with the burgeoning number of banks and branches, BI willconcentrate more heavily on off-site examinations, and target detailedexaminations to banks based on apparent riskiness. A prototype questionnairefor early detection of potentially unsound banks has been designed and testedon 10 banks. Further refinement and training are planned before it is used ona broad scale.
4.28 The type and timeliness of data required from banks for supervisionhas changed because of the new, deregulated marketplace. To meet the newneeds, BI has revised lts data collection and management system including more
4/ The five areas are those used in the US under the C.A.M.E.L. system:capital, assets, management, earnings and liquidity.

- 85 -
information on off-shore branches. Improvements in this will prove essentialin BI's efforts to adjust its procedures to the new banking environment. Thisis true not only for banking supervision, but also for the implementation ofmonetary policy. BI's new NBFI section is also preparing revised supervisionguidelines.
4.29 Effective supervisior will also require changes in the regulationsgoverning the interventions BI can make in banks once problems have beendiscovered. At present, BI's legal recourse is limited, making it difficultto tailor its response to the severity of the problem. One improvement madein the last package is the issuance of a decree authorizing BI to issue"cease-and-desist" orders to bank management for specific actions deemed toendanger the bank's soundness. Further improvements are platmed for inclusionin the revised Commercial Banking Law presented to Parliament in April 1991.
4.30 Promoting public oversight through greater disclosure. Just asimportant as expanding BI's capacity and authority in banking supervision, areefforts to devolve banking supervision onto the private suctor itself. Giventhat BI must now supervise some 11,000 institutions (including rural banks),every effort must be made to tap depositors' concern for preserving theircapital as a means of regulating bank behavior and enforcing marketdiscipline. The most important means of bringing this potentially powerfulinfluence to bear is to require greater disclosure of information on thefinancial status of banks and other financial intermediaries to the public.Only with such information can the public reasonably assess the soundness ofthese intermediaries and enforce market discipline. An effort in thisdirection has been made in the latest package of regulations that requires allbank and NBFIs to publish audited income and balance sheets. Extension ofthis requirement to all financial intermediaries, and its strengtheningthrough requiring ar. auditor opinion, would serve as an excellent next step inimproving the public's access to information. Not only would such informationimprove financial discipline, but, if extended to private liability companiesmore generally, it would also improve banks' credit allocation decisions andreduce the costs of such decisions. If banking is unique because of theinformation bankers develop on their clients, then publishing financialstatements will also serve to increase comfetition among banks and betweenbanks and other financial intermed'aries. As Minister Radius recently stated:
"To nurture and enhance this growth (of investment) we must move boldlyand quickly to ensure honesty, accuracy and objectivity in the disclosureof information . . ."51
4.31 Greater availability of accurate information on banks will not onlyserv3 to improve market discipline, it will also help to lessen the chancesthat the failure of one bank will provoke a general run on banks. In thepresent environment it is difficult for the public to assess the soundness ofany individual bank. Therefore, the failure of one bank could be treated asan indication of general malaise that could cause deposit runs at other banks.But with accurate information readily available, depositors will be able todistinguish between the particular and systemic problems of a bank. Better
lJ Speech by Minister Radius Prawiro to the South East Asia UniversltyAccounting Teachers Conference, January 21-23, 1991.

- 86 -
information on banks would also improve the usefulness of the interbank marketas a means of tracking the soundness of banks on a daily basis.
4.32 For private sector market discipline to be enforced, depositors mustfeel that their cap.tal, or at least the return on their deposits, is at risk.At present Indonesia has no deposit insurance, a fact that strengthensdepositors, incentives to watch over their funds. Although BI's efforts toavert bank runs through the merger of banks can lessen depositors' wariness,as it did in the US, cases in which large depositors suffer losses serve tostrengthen it. As mentioned above, perceptions of favoritism, or of being toobig to let fail, can undermine market discipline. In increasing reliance onmarket discipline imposed by depositors, then, BI must make every effort toavoid actions vnat give implicit or open-ended guarantees to depositors.
4.33 Market confidence is also increased by having banks with a strongcapital base. In this regard the announced move to the BIS standard iswelcome. Consideration could be given to mandating capital requirements forother areas of risk beyond credit risk, suce as positions taken in foreignexchange trading or risks due to maturity mismatch. Confidence would befurther heightened by including off-balance sheet items in the calculation ofcapital adequacy. In the case of the SCBs, the weak capital footing requiresprompt efforts to restore a stronger balance sheet. Recognizing this, BI hasbegun a portfolio audit of the SCBs as a first step in restoring the banks'capital footing.
4.34 For the private sector to bolster BI's own supervisory effortsthrough increased information, the quality of, as well as access to, informa-tion must be improved. Efforts in this area necessarily involve improvementsin accounting standards, and the quantity and quality of auditors (see fullerdiscussion below). Of critical importance for the banking system is theclarification of the rules governing accounting for accrued interest, interestpast due, and reserves against loan losses. To overcome .his obstacle, BI hasinitiated a joint effort with the Indonesian Accountants Association (IAI) toestablish accounting standards for banks. The new standards are scheduled tobe completed by the middle of 1992.
4.35 Supervisory regulation in the capital market. Stricter regulation ofthe capital markets is also critical to maintain the confidence of smallinvestors and eliminate opportunities for manipulation. This imperative hasbeen addressed in the last year by the issuance of new decrees governing thecapital market. One of the fundamental elements of these decrees is toreconstitute Bapepam as a supervisory agency with management of the stockexchange given over to the private sector. The new decrees require moredisclosure of information for issuing companies and intermediaries,strengthened minority rights, higher standards of professionalism for firmsoperating or connected to the stock market, and a more up-to-date transfer,payment and settlement system. To attract more investors to the market,regulations governing stock manipulation have been tightened and closed endmutual funds have been authorized. The challenges of the moment are toestablish private management of the Jakarta exchange, and to ensure Bapepam'sefficient operation in its newly strengthened supervisory role. Generalmarket discipline would also be bolstered if a credit rating company could be

- 87 -
established.§/ The creation of a company registry listing majorshareholders would help BI enforce lending limits, as well as increase theinformation available to potential investors in the stock market.
Improving the Legal and Accounting Framework
4.36 An integrated legal framework spelling out the scope and activitiesof BI, MOF and BAPEPAM and various financial intermediaries is important forcreating a stable financial system. As mentioned above, new decrees coveringthe capital markets have already been announced. Draft laws on commercialbanks, insurance companies, pension funds were submitted to Parliament inApril. These laws provide ground rules for the operation of these entities.It is also crucial that a draft law on BI be submitted as quickly as possibleso that BI's authority and ability to set and carry out monetary policy beclearly delineated.
4.37 The supervisory umbrella for all financial in3titutions needs to bereviewed to ensure that risks are being properly monitored and that thedifferent regulatory regimes are harmonized. The new capital market decree,for example, excludes banks and NBFIs from operating directly in the capitalmarkets. Their subsidiaries, however, can do so. To ensure that certainfinancial corporations do not shift risks between subsidiaries, Bapepam, BIand MOF will need to coordinate their supervisory efforts. Clear lines ofresponsibility will avoid unnecessary conflicts between agencies whileensuring that intermediaries are adequately supervised.
4.38 Commercial and credit law. Another key element of legal reform isthe commercial code. Modernizing commercial law is critical for advancing notonly the stable growth of the financial system, but also the growth of theprivate sector overall. A comprehensive and enforceable commercial code canhelp companies avoid the costs and uncertainties associated with the presentlegal framework. Of paramcunt importance for the financial system are lawsgoverning credit and security interests.2/
4.39 The credit laws and institutions in Indonesia suffer from a lack of(a) effective enforcement procedures; (b) acceptable security or collateraland standard, modern loan terms and documentation recognized by the laws; (c)accessible registration/information systems for property, credit and security;and (d) a modernized bankruptcy law and collection procedure. To overcomethese shortcomings requires:
(a) establishing an authoritative version of contract and credit laws inthe Indonesian language to assist the courts in defining and applyingthe ruias found in the Codes and to facilitate subsequent modifica-tion of the provisions; and
§/ Efforts to establish such an agency are being supported by an AsianDevelopment Bank loan.
2/ A security interest is the right to take ownership of some asset ifcertain conditions are met. It includes such things as mortgages andliens.

- 88 -
(b) establishing a simple, effective and readily accessible system ofsecurity registration. Such a system might cover collateral based ona personal filing system whereby rights, pledges, guarantoLs, fidu-ciary transfers of ownership and other securities would be registeredand recorded under the name of the borrower. The ability to extendcredit to small-scale and rural enterprises and to new enterprises indevelopment areas with high growth potential will in large partdepend on bringing increasingly more of the country's land under theland registration system. Much of the economic advantage currentlyenjoyed by urban groups can be traced to their longatanding access tocredit based on the hypothecation of registered land.
4.40 Auditing and accounting. The earlier discussion of prudentialregulation highlighted the importance of increasing the transparency andavailability of information on the financial system. This requires threerelated improvements in accounting and auditing:
* grounding modern accounting and auditing standards in an updatedcommercial law;
* improving examination and training standards for acsountants andauditors along with a body to enforce these standards; and
* increasing the number of qualified accounitants.
Current law generally requires only that firms maintain "adequate records",though banks are required to provide BI with audited annual accounts. TheIndonesian Institute of Accountants has developed some general accounting andauditing standards, but these are not mandatory. After passing the StateAccountancy Examination, there are no further mandatory training requirementsfor accountants, nor separate standards for auditors.
4.41 The general thrust of accounting reform needs to put the onus . c thegeneration of adequate financial statements on firms. To do this requires arevision of existing company law. This change will increase the demand foraccounting services. Although establishing detailed accounting standards istime-consuming, the process can be accelerated by the initial adoption of thestandards proposed by the International Accounting Standards Committee. Thesestandards are less intricate and may be more relevant in Indonesia than thoseof developed countries.
4.42 With the development of mandatory accounting requirements andstandards will come a need for a body to regulate the accounting professionand maintain accounting standard. A reconstituted IAI, given statutoryauthority for examinations, determining those eligible to give an auditopinion, and setting accounting standards, could fulfill this role.
Technical and Managerial Expertise in Financial Intermediaries
4.43 The rapid surge in the numbers of financial institutions has putsevere pressure on the market for skilled employeen. While the private sectorcan be expected to provide and finance training for staff, adequate oversightby BI, BAPEPAM and MOF will require that their staff training keep pace. Notonly training, but also levels of staffing and salaries will need to be

- 89 -
increased to cope with the demands of the burgeoning financial sector. Anexcellent example is the accounting industry. The financial system isseverely constrained by the lack of trained accountants operating in theprivate se-tor, only about 2000 for over 160,000 private sector firms.Strengthened accounting requirements will create a growing demand foraccountants. This will lead to more training programs and larger numbers ofstudents. To overcome the acute shortage of trained accountants in theprivate sector, however, regulations on hiring of foreign consultants cculd berelaxed.
4.44 Within private sector firms the need to improve skills has led to thecreation of new training programs. The Indonesian bankers association,Perbanas, for example, has developed a program in banking. After the muchpublicized difficulties of prominent banks in new areas, such as internationalforeign exchange trading, other banks have scaled back expansion plans,waiting for competent personnel before embarking in new areas. Furthertraining efforts may be spawned by the new BI regulation requiring that fivepercent of bank personnel expenditures be dedicated to training.
Iproving the DeRth and Diversity of Financial Instruments
4.45 Strengthening prudential supervision and solidifying the legalfoundations of the financial system will go far in improving the system'scoundness. These actions will also help to promote a further deepening andwidening of the system. Improved laws on credit, securities interests andbankruptcy, coupled with improved accounting information, for example, willlessen banks costs and promote credit expansion based on the finances of aproject rather than the influence of the borrower. The revised capitalmarkets regulations offer the potential investor greater protection from stockmanipulation and false claims. This should spark increasing activities byinstitutional and individual investors. A flourishing stock market will alsopromote venture capitalist by providing a liquid market for the sale of stocksof firms they have invested in.
4.46 Promoting leasing. Other improvements are possible to spur thedevelopment of new financial instruments or the expansion of existing ones.One such change already undertaken is a revision of the regulations governingthe operations of leasing companies. In the past year, the government hasexempted from VAT imported capital goods leased to export industries, allowingleasing companies to play a larger role in project finance. They have alsochanged the treatment of income derived from operating leases, decreasing thetax burden of leasing companies../ However, leasing companies still cannotraise money in the money market.
4.47 Further reduction in liguidity credits. Private sector expansion inthe financial system would also benefit from the further reduction ofliquidity credits. Despite last year's curtailment of the sectors eligible toreceive these credits, the stock of liquidity credits is likely to rise inthe coming year, though fall as a share of total credit. At pro ent, suchcredits are sometimes defended on equity grounds or because private banks will
L/ An operating lease is one in which the leasing company contract- tomaintain the equipment that it leases.

- 90 -
not lend in support of the sectors receiving liquidity credits. However, themere presenc- of subsidized liquidity credits--current rates of 17% for mostcategories are well below market rates--drives out private lending. Equitygoals can be reached through direct subsidies that would not distort creditallocation. If, in taie absence of liquidity credits, loans would not beforthcoming to particular sectors of the economy, gc-ernment resourcer wouldbe better spent addressing the factors constraining the provision of credit.In this fashion, once the difficulties are overcome, potentially far greaterresources would be available from the private sector than through theGovernment. A case in point is the planned expansion during the coming yearof liquidity credits to small-holders for estate crops through the PIR-Transprogram. Repayment performance under similar previous credit programs wasdismal. This is partly due to the long gestation period and fluctuatingyields and prices of many estate crops, which often make it difficult forsmall-holders to service large debts.2/ An expansion of liquidity creditsrisks a 3imilar fate. Besides these negative effects on private financialintermediation, the expansion of liquidity credits threatens to undermine theorderly control of monetary policy by BI by increasing the size of a non-discretionary component of base money.
4.48 Promoting small business lending. Another direct intervention on thepart of BI is designed to promote lending to small businesses and coopera-tives. This is the regulation requiring banks to place 20% of their lendingwith small businesses. This regulation has resulted in an increase in lendingto this sector with related improvements in employment and exports. It hasdone so at a cost, however. Because each bank is subject to the requirement,rather than the system overall, banks that would overwise focus on wholesaleand corporate business must restructure themselves to provide services to thissector. For all banks to do this simultaneously reduces the scope forerficiency gains through specialization. Some banks have attempted to meetthe requirement through agreements with rural banks (BPRs). While successfulfor the commercial banks, the availability of funds from _akarta has weakenedthe rural banks' incentives to mobilize savings locally. S,nce lending tosmall business is a priority of the Government, more targeted programs,combined with technical assistance to small businesses could achieve the sameaims at a lower cost. One promising but currently small-scale program is theBI-sponsored pilot project linking small savings groups through financialinstitutions established by Community Self-Help Coordination Organizations(Lembaga Pembina Swadaya Masyarakyat, LPSM). Another positive development isthe revival of inactive village banks.
4.49 Another alternative worth exploring is to allow the securitization ofbanks' small loan portfolios. At present, banks can sell their loans out-right, but cannot create securities from them. ican sales have been limited,however, both because of small banks' fears that they will lose good customersand large banks' fears that they will be sold poor loans. Loan securitizationcan avoid these problems. It entails pooling a group of small lcans andselling securities backed by the pooled loans. Buyers of the securities areprotected from the credit risk inherent in the pooled loans by a guaranteeoffered by another financial intermediary, often an insurance company or
2/ Repayment performance has also been affected by a number ofinstitutional, administrative and legal factors.

- 91 -
another bank. The guarantor evaluates the redit risk and charges the bankwho originally made the loans for the guarantee. The premium will roughlyequal the dxpected credit risk in the grouped small loans, otherwise theguarantor will stand to lose money. The small bank, then, benefits from nothaving to absorb the risk of large, unexpected losses since these wi.; be beborn by the guarantor. Securitized loans wiould allow the same overall amountof lending to small business with lower costs for the financial systemoverall, since the banks originating the loans could specialize. Smallerbanks would not need to fear losing clients, while larger banks would get asolidly performing asset.
4.50 Deegening the money market. As noted above, the maturity mismatch ofbanks has increased since 1983 (see Table 4.2). This has not translated fullyinto interest rate risk because of the use by commercial banks of variableinterest rate loans. However, variable rate loans tend to be set at six monthintervals, while many time deposits have one to three month maturities. Partof the difficulty in adjusting variable rates more frequently is the lack ofan adequate reference rate for determining loan rates. In many countries,commercial rates are pegged to the rate on some form of government paper. InIndonesia the central government's policy of avoiding domestic finance of itsdeficit means that no such paper is available. BI does issue the SertifikatBank Indonesia (SBI), a bill with one week, and one, three, six and twelvemonth maturities. This paper could provide a good basis for determining areference rate. Unfortunately, the secondary market in SBIs remainsthin.IQ/ Boosting sales of SBIs to the public would serve to increase theliquidity in this market and improve the SBI as a reference for pricingvariable rate loans. Furthermore, an active and liquid market in SBIs wouldprovide BI with the instrument it needs to affect the domestic component ofbase money. Given its positive benefits in reducing interest rate risk forbanks and improving the conduct of monetary policy, full attention should bepaid to overcoming the constraints to increasing the liquidity of the SBIsecondary market.
4.51 Deepening the interbank market will also help banks manage theirliquidlty more easily. To this end the Government has recently authorized theestablishment of market makers in the interbank market. Access to one of BI'sdiscount windows has been changed so that it requires no more than any othertransaction in the interbank market.
1Q/ The primary market has been greatly expanded by the recent purchase ofRp.10 trillion in 1 year SBIs by 12 public enterprises. While this moveallows BI greater flexibility in controlling base money, it does nothelp to create a secondary market in SBIs.

* 93 -
CHAPTER5
PUBLIC SECTOR SUPPORT FOR PRIVATE SECTOR DEVELOPMENT
A. Changing Role of the Public Sector
5.01 A greatly modernised and higher quality public sector is a centralingredient of Indonesia's development strategy based on a larger role for theprivate sector. Improving the quality of government embraces the oroad agendaof elements constituting the enabling environment necessary for the privatesector to function efficiently. Elements of this agenda are discussedthroughout this report. Chapter 2 argued the need for government to maintaina stable macroeconomic environment through coordinated management of fiscalpolicy, monetary policy and the nominal exchange rate. Chapter 3 reviewed therole of government in designing an appropriate framework of incentives, lawsand regulations which are essential for ensuring a stable and supportivebusiness climate, both for domestic and foreign investors. Chapter 4discussed public policy to strengthen the financial system as its importancein mobilizing and intermediating resources for the private sector expandsrapidly. Chapter 6 will discuss the government's special role in influencingthe distribution of income and reducing poverty. The public sector also has amajor role to play in providing public goods and services that are essentialinputs for sound private sector growth. These include the supply of physicalinfrastructure as well as social services that raise the quantity and qualityof human resources. This Chapter focuses on the priority need for expandingprovision of physical infrastructure since the rapid development of theprivate sector has already put strains on existing capacity. The Chapterconcludes by assessing progress in strengthening the public sector throughpublic enterprise and civil service reform.
5.02 Adequate infrastructure services are essential for sustaineddevelopment of the private sector and economic growth. These services affectthe cost of doing business and competitiveness in international markets.Power and water are essential inputs into production. Transport andtelecommunications systems are critical in linking production points withdomestic and foreign markets. Education and training services affect theproductivity of labourers and managers. If these physical and humaninfrastructure services are limited in quantity, low in quality and high incost, the growth of the private sector and the whole economy will suffer. Theadditional demand for infrastructure services emerging from Indonesia's paceand pattern of growth in the 1990s, combined with the backlog from past unmetdemand, presents a substantial policy challenge for the Government in terms ofdeveloping an efficient strategy for infrastructure provision. Manyinfrastructure services are recognised to be primarily the responsibility ofgovernment because an unregulated private market would not be able to providethem as efficiently. However there can be a greater role for the privatesector in providing some services that are traditionally public because oflimitations on the effectiveness of government intervention. Section Breviews the framework for public and private sector provision of physicalinfrastructure services in Indonesia, including power, telecommunications,transport and water resources. Section C discusses the complementary need forappropriate pricing policies for publicly provided infrastructure services to

. 94 -
help overcome the constraints of finance and inefficiency which impede thepublic sector in providing adequate infrastructure. Section D then examinesthe implications for public expenditure priorities of the additionalinvestment in infrastructure services needed to support private sectordqvelopment.
5.03 Improved public institutions are spsential for the public sector toadapt to Indonesia's changing development strategy. The moves towardsincreased deregulation, public enterprise reform and decentralisation haveimportant implications for the size, functions and structure of the publicsector and the civil service. For example, deregulation in trade, investmentand finance has eliminated many of the controlling and licensing functions ofa large number of civil servants. Similarly, moves towards decentralisationimply a shift in planning and implementation responsibilities to regionalgovernments. Furthermore, public enterprise reform, involving privatizationof some and enhanced autonomy for others remaining within the public sector,will reduce the need for operational control by supervising line ministries.These examples illustrate the new challenges for otganization and managementof the public sector implied by the major policy reforms now underway. Amajor long-texm task, therefore, will be to reassess and realign both the roleof institutions within the public sector and the skills and incentives neededfor the civil service to perform these changing functions. Against thisbackground, section E reviews recent developments in public enterprise andcivil service reform.
B. Public and Private Provision of Infrastructure
Introduction
5.04 The relative role for public and private provision of infrastructureservices differs from sector to sector. Public intervention is needed wheremarkets fail to provide appropriate levels of service at least cost becauseprivate competition is hindered. In the case of natural monopolies such aspower and telecommunications, efficient system expansion requires a few largeinvestments rather than a series of small ones. Economies of scale inproduction can create a technological barrier to entry of competitive privateproviders and efficient production requires a publicly owned or regulatedprivate monopoly. For public goods (such as urban roads) it may be impossibleor undesirable to identify and charge individual users and the private marketwould under-supply services that benefit society at large. But the governmentneed not spend scarce resources on activities (such as urban bus transport)that the private sector can do as well or better. Where competitive ownershipis not feasible, there may be scope for private involvement in some stages ofproduction. Although natural monopolies exist in power transmission anddistribution, generation can be done efficiently by smaller producers who cansell power through or to the public utility. In other infrastructure sectors,free market entry to qualified private contractors can be encouraged bycontracting out for construction (for example, of roads) or for operation andmaintenance (such as publicly-owned water supply systems). Initiatives suchas these require improvements in the regulatory framework and in institutionalcapability (see Box 5.1). One barrier to private investment is the risk thatprice controls or other government interventions will reduce returns. Another

- 95 -
lex S.l: POLICY FRAMEWORK FOR PRIVATE SECTOR PARTICIPATION
To help avoid potential bottlenecks constraining rapid privatesector growth, the Government is actively considering proposals forprivate investment in the provision of key infrastructure services.The potential benefits of private investment will depend criticallyon meeting the additiongli_y test of either providing neededinfrastructure capacity that would not otherwise be provided by thepublic sector, or providing infrastructure at lower investment andoperating costs, given the likely constraints on public sectorfinance, management skills and access to technology. These benefitsneed to be weighed carefully agains. the potential costs of privateinvestment:
* the higher cost of funds mobilized by private borrowing andequity inveetment;
* the financial risks of exposure to debt repayment, foreignexchange and profit guarantees likely to be sought by privateinvestors;
* the supply risks of non-performance in project completion andoperation by private contractors;
* the efficiency risks of inadequate coordination of the size,location and timing of private investments with the least-costexpansion plan for the sector.
Ensuring that private sector participation effectively servesthe public interest will require the development of a sound policyAframework that (a) provides for an appropriate balance between thebenefits and costs of private investment, and (b) presents atransparent basis for negoti.ation between the public sector andprivate investors. Key ele_..nts of this policy framework willinclude:
l * a high-level consensus on the ge-.eral objectives and scope ofprivate sector participation;
l * specification of an acceptable security and technical packagescovering the sharing of financial and implementation risks;
l * definition of the criteria for setting prices governing thesale of private infrastructure services;
l * specification of applicable laws and regulations, includingenvironmental and health protection;
l * specification of the investment approval process, includingcompetitive (or prequalified) bid tendering and evaluation;
l * preparation of detailed policy guidelines for private sectorparticipation in each of the infrastructure sectors based on awell-defined long-term investment program;
l * institutional procedures for designing, negotiating andsupervising these arrangements that provide the Governmentwith the financial, legal and technical skills to ensure thatthey serve the public interest.

- 96 -
may be the difficulty of designing and supervising contracts that ensureequitable risk sharing and efficient performance. Thus, these initiativescall for a shift in the role of government from being a producer to being aregalator.
Electric Power
5.05 During the 1970s and 1980s there was a rapid expansion in theavailability of power. The installed capacity of the state-owned NationalElectricity Corporation (PLN) grew from 0.5 gigawatts (GW) in 1970 to 9.0 GWin 1990, while sales grew from 1.6 terawatt-hours (TWh) to 26.9 TWh over thesame period. This expansion played a key role in accommodating the largeincrease in power demand from the fast-growing manufacturing sector, includingmany small enterprises. In the 1990s rapid growth in economic activity,especially manufacturing, implies a widening gap between the demand for powerand PLN's capacity to supply it. As shown in Table 5.1, power demand in Java-Bali is forecast to grow by over 50% from 1990/91 to 1994/95. At the sametime, the maximum feasible expansion in PLNs system would increase salescapacity by around 50%. Even with this augmented expansion program, the PLNpower supply deficit would rise fro, 8.5 Twh to 12.8 Twh. The private sectorwill need to play an important complementary role in making up this capacityshortage to avoid the economic disruptions associated with load shedding.
Table 5.1: POWER DEMAND AND PLN SALES IN JAVA-BALI(in Twh)
Demand PLN Sales CaptiveGeneration
1990/91 29.8 21.3 8.51991/92 33.5 24.0 9.51992/93 37.3 26.8 10.51993/94 41.2 29.6 11.61994/95 45.5 32.7 12.8
Source: World Bank staff estimates.
5.06 Private enterprise already plays an important role in the powersector in Indonesia. Private enterprises are actively involved in threeareas: captive power generation in industrial plants, small-scale powergeneration and distribution in rural areas, and in contracting out of PLNservices such as equipment installation and maintenance and customeradministration. By far the most important is the provision of captive powerin the industrial sector. Captive generation currently accounts for nearlyhalf the total installed capacity in Indonesia. About two-thirds ofindustrial power requirements are supplied througlh these captive power plants.Much of this captive capacity was installed in the late 1970s when PLNsuffered serious capacity shortages. Despite the rapid growth in PLN apacitysince then, captive generation capacity has continued to grow.

- 97 -
This growth reflects the inadequate reliability of PLN's power supply and itsinability to respond efficiently to new industrial load requirements.
5.07 A first option to strengthen private sector involvement is for PLN to
coordinate its grid with existing captive generation capacity. Recentestimates indicate that there is more than 1.0 OW of large captive generatorsthat could supply electricity to PLN's grid, improving PLN's reliability andcapacity to meet emergency loads. To take advantage of this surplus energysupply, PLN needs to expedite preparation of a policy framework fornegotiating power purchase agreements with the private sector. A key issue toresolve is pricing. Given that this capacity support would reduce PLNscapacity reserve requirements, it should be willing to pay the long-runmarginal cost of the capacity it avoids having to install at the relevantlocation. At the same time, PLN should encourage existing customers to usetheir existing captive generation capacity instead of the grid supply. Thiscan be done through tariff incentives, such as an exemption from the demandcharge for customers who agree to reduce their load requirements from the PLNgrid.
5.08 A second option is to encourage additional private investment in
captive power plants. In some industries where cogene.Ation of electric powerand steam is feasible, captive generation is more cost-effective thanlarge-scale grid supply. PLN could induce private firms to undertake morecogeneration by offering to purchase the electricity generated at its long-run
marginal cost. In addition, PLN needs to freeze new connections to industrialcustomers that are large enough to invest in efficient captive generation. Toencourage firms to install generators to support their own operations, thegovernment lifted import duties on large diesel generators in January 1991.More than 290 firms have since been licensed to import generators withcapacity exceeding 375 KVA.
5.09 A third option is to create incentives for the private sector tofinance, construct and operate dedicated power plants. So-called build-operate-transfer (BOT) schemes are being explored to encourage privatecontractors to own an equity interest in public sector projects. These offerseveral potential advantages: (a) additional resources to supplementconstrained budgetary resources; (b) more efficient design, construction andoperation of the plants; and (c) a useful private sector benchmark to assessthe efficiency of similar public sector projects. Offsetting these advantagesare the potential costs resulting from inequitable risk-sharing between the
government and the private sponsors, and from excessively complicated andlengthy negotiations between the parties. The Government has invited privateinvestors to establish new power stations and 44 companies have reportedlyexpressed interest in setting up plants with a total designed capacity of8.0 GW, including two coal-fired steam power units each with a design capacity
of 0.6 GW at Paiton (East Java). These proposals need to be evaluatedcarefully to ensure that they do offer real economic advantages compared to
traditional public investments (see Box 5.1).
Telecommunications
5.10 Telecommunications services are essential for a wide range of
information processing activities that support the productivity and

- 98 -
competiti-'..iess of business enterprises. Despite the expansion of Indonesia'stelephone network, from 210,000 lines in 1976 to 900,000 in 1989, it has notkept pace with the growth in demand. As a result, excess demand fortelecommunications services has emerged and the gap has widened over time from39% of available telephone lines in 1982 to 68% in 1988. For the greatmajority of the population access to telecommunications is very limited. Thecurrent telephone density in Indonesia is only 0.5 lines/100 people which lagsfar behind other ASEAN countries such as Thailand with 1.8 lines/100 andMalaysia with 7.3 lines/100. This acute shortage of subscriber lines causesserious congestion of the existing network with the result that a largeportion of call attempts fail. The low quality of service is compounded bypoor traffic and facilities management resulting in a high number of faultsper line and excessive time taken to correct defective lines. Major, well-designed investmants will be required to -.nlerate network expansion andimprove the quality of telecommunicatiot.- vices. These may not be feasiblewith the current orgarization and mana.weyw of the telecommunications sector.With telecommunications restructuring - etives now taking place in manycountries, it will be important to examh.. i.cther similar policy reforms oncompetition, regulation, market structure an-: ownership could improveperformance in Indonesia.
5.11 The government owns almost all telecommunications facilities and isthe monopoly provider of basic services. Domestic telecommunicatiotas servicesare provided by the state-owned enterprise PERUMTEL, and all internationaltelecommunications services are provided through state-owned PT. INDOSAT.Manufacturing of telecommunications equipment, is dominated by a third state-owned enterprise, (PT. Inti). However there is limited private sectorparticipation in providing services through revenue-sharing agreements withPERUMTEL. These include cellular mobile radio telephone services, andsatellite network telecommunications services. New telecommunicationslegislation passed in 1989 modified PERUMTEL's domestic monopoly to allowprovision of nonbasic services by private entities. A detailed regulatoryframework for private sector participation in these services is now underpreparation.
5.12 Improving the performance of PERUMTEL will be the key to improvingperformance of the telecommunication sector as a whole. Until recently,Government management of the sector has not given sufficient incentive toPERUMTEL's management. Indeed, the Government's close relationship withPERUMTEL has tended to blur accountability, and bureaucratic procedures havecontributed to delays in project approval and hindered long-term planning. Anessential measure to improve PERUMTEL's performance will, therefore, be toincrease its operational autonomy by changing its status to a corporation(along the lines of PT. INDOSAT) that would be allowed to retain earningssubject to the payment of dividends and taxes. This could constitute aninitial step towards partial privatisation by selling equity in the enterpriseto private investors. In the longer run, partial divestiture could mobiliseadditional private sector resources to overcome budgetary limitations infinancing rapid system expansion and quality improvements. However, aprerequisite for successful divestiture would be implementation of extensivemeasures to strengthen PERUMTEL's organization and management in order toimprove its efficiency and productivity.

- 99 -
5.13 PERUMTEL faces virtually no competition in the provision of networkservices and, therefore, has no compelling incentives to improve itsperformance. However, the Government has already recognised the merits ofpermitting competition in the provision of nonbasic services under the newtelecommunications law. These include all services except telephone, telex,telegraph and leased lines. This approach will require development of aregulatory capability that monitors PERUMTEL's costs and tariffs to ensurethat it does not cross-subsidise services that are subject to competition withprivate providers. It also calls for periodic review of the appropriateallocation of services between public sector monopolies and private sectorcompetitors. For eAample, cellular mobile radio could be considered as anonbasic service open for competitive provision by the private sector.
5.14 The Government is examining revenue-sharing arrangements (RSAs) asthe major option for expanding private sector participation. During 1990 theGovernment awarded RSA contracts to six companies for adding 425,000 lines tothe Jakarta network, under which the firms would receive the subscribers'installation charges and 70% of monthly service charges and telephone billsfor periods up to nine years. To ensure that this option leads to efficientexpansion of telecommunications services, it will be necessary for theGovernment to develop a policy framework that protects the public interest inkey areas of tendering, bid evaluation, contract design, technical inputs andfinancial structure associated with these arrangements (see Box 5.1). Therecent RSAs appear to impose a considerable managerial and financial burden onPERUMTEL. Future RSAs should be subject to stringent tests to ensure theyprovide genuine additionality which will relieve PERUMTEL of key financial andskills constraints, thus allowing it to focus its scarce resources on thesubstantial tasX of upgrading and accelerating development of basic telephoneservices.
5.15 Private sector participation can also be increased by contractingout. PERUMTEL has already made extensive use of local private consultants andcontractors for outside plant construction, construction of ducts,installation of primary and secondary cables, wiring of subscriber pi.emisesand maintenance of buildings. If carefully managed, subcontracting can lowerPERUMTEL's overhead costs and personnel requirements, especially for lineinstallation in the distribution network. However, the potential for costreductions depends critically on PERUMTEL's capacity to supervise thesearrangements. Future joint-venture arrangements are expected to increase theefficiency of sub-contracting firms through transfer of know-how, thusallowing PERUMTEL to achieve greater cost savings through reliance on privatesector suppliers. The range of contracting out could be further extended toinclude maintenance of all civil works relating to outside plant, specialservices such as telecom service shops, and the provision and maintenance ofpublic call boxes.
TransRort
5.16 During the 1980s the Central Government progressively transferredresponsibility for the management of revenue earning facilities and servicesfrom line departments to state enterprises, giving them more autonomy andaccountability to foster a more commercial orientation in providing services.More recently, the private sector has also been permitted to play a greatlyexpanded role, especially in operating transport services.
.

- 100 -
5.17 Transport infrastructure. Government continues to provide and managepublic goods (such as the public road network) and those which serve the basictransport needs of communities (such as bus terminals, medium and smallairports, small seaports and river terminals). Most other public sectorinfrastructure is now owned and managed by public enterprises, includingseaports, airports, toll roads, and ferry terminals. In addition, governmentalso provides regulatory services which have an important bearing on howefficiently infrastructure and services are used.
5.18 The private sector role in the provision of transport infrastructurehas traditionally been limited to own-use facilities such as specialindustrial ports and private roads and airstrips, but this is now changingrapidly. Private consortia have demonstrated their capacity to participate inmajor infrastructure projects, notably through the construction and operationof toll roads and urban bus terminals under BOT arrangements. The first tollroad involving private sector participation is now in operation while thefirst privately developed bus terminal is being constructed in Jakarta.Recently a private consortium confirmed its intention to construct a majorbridge to link Surabaya with Madura. Following the recent deregulation ofindustrial estate development many private companies are proposing toconstruct inland container depots and cargo distribution centers which promiseto support more efficient operation of the seaports. The Government is nowconsidering increased private participation in the major seaports and airportsby permitting the responsible public corporations to participate in jointventures or joint operations with private partners. The objectives of thesearrangements are to reduce demands on the budget, to speed derelopment of newfaailities and to manage existing assets more efficiently. An importantco.acern is to avoid arrangements which would enable the private partner tomalke large guaranteed profits while leaving the public sector to shoulder therisks (see Box 5.1).
5.19 TransDort services. Public enterprises remain a major provider ofrevenue-earning transport services. In land transport these include freightand passenger rail services and urban bus services. In maritime transport,there are three state-owned shipping lines which operate deep sea generalcargo services, inter-island general cargo and passenger services, and bulkand other specialized services. In air transport, Garuda is the sole operatorof long-haul scheduled international services and, together with its daughtercompany Merpati, is the dominant operator of scheduled domestic services.
5.20 The private sector has dominated provision of road transport servicesexcept for the principal urban bus services in major cities. Small and mediumsized private companies, cooperatives and individuals provide all road freightservices, most interurban bus services, and all secondary and tertiary urbanroad passenger services. In Jakarta, one large private company operates urbanbus services while several private firms provide taxi services. The privatesector is also the main provider of inland waterway transport services andshares the provision of inter-island ferry services. In future there will beopportunities for private sector participation in the railways, includingcommercial development of station areas and other inner city land assets, andinvestments in rolling stock. In maritime transport, the role of the privatesector shipping lines has grown steadily during the 1980s, with the exceptionof the rapidly growing inter-island passenger market. Private companies havetraditionally provided stevedoring services under the "landlord port" system,

- 101
while Inpres 4/85 has permitted the emergence of a freight forwarding industrywhich is also dominated by private companies. In air transport, privateoperators have until recently played only a minor role in the provision ofdomestic scheduled services but have long been important operators ofsecondary, tertiary and specialized air charter services. Recent decisions toadmit an additional domestic scheduled carrier (Sempati) and to allow privateairlines to use jet aircraft on the longer domestic routes have enabled theprivate airlines to compete more actively with state-owned Garuda and Merpati.
Water Resources
5.21 The development of Java's water resources has been a major factorsupporting Indonesia's economic growth. Although most of Java is well endowedwith rainfall, most of its rivers are less than 50 km long. Very shallowcatchments combined with deforestation cause a rapid runoff of surface waterresulting in downstream water shortages in coastal areas during the dryseason. In addition, pollution in the downstream areas of almost all thenorth coast rivers has seriously reduced the availability of raw water ofadequate quality for municipal and industrial purposes. Hence, continueddevelopment of several large cities is now dependent on their ability to findalternative sources of water. Under these circumstances, the allocation ofsurface water and groundwater for agricultural and industrial use is an issueof growing importance.
5.22 Java has total surface water flows of about 170 billion cubic meters(Bim3) annually, but firm water resources (minimum flows in a dry year) areonly about 78 Bin. Publicly-provided irrigation water for agriculture is byfar the largest user of surface water, requiring about 60 Bm3 annually orthree-quarters of the firm water flows. Demand started to climb sharply inthe mid-1970s when high-yielding varieties of rice were introduced on a largescale. Future water requirements in the year 2010 are projected at about 88Bm', suggesting that shortages could rise to 10 Bm3 in a dry year. Two-thirdsof this water shortage could be eliminated by increasing the efficiency ofwater used for irrigation. Average efficiencies on larger schemes in Javabarely exceed 30%, although these systems are designed for efficiencies of50%. Part of the problem is due to underfunding of operation and maintenance(06M). To improve efficiency, the Government has initiated an "efficient" O&Mprogram, which involves special maintenance follwed by much higher O0Mexpenditures. By 1991, this program had been extended to 1.7 million ha outof a total of 4.4 million ha of publicly managed irrigated area. TheGovernment has also turned over about 20,000 ha of small irrigation schemes towater users associations (WUAs), reflecting a long-term policy of turning overto WUAs all irrigation schemes under 500 ha. These measures should provide apowo-ful incentive for farmers to improve O&M and thus improve efficiency.
5.23 Water use by publicly-supplied municipal piped water systems (mainlyfrom rivers and springs) is minor at about 2.25 Bm3 or 3% of the water usedfor agriculture, but its importance is growing. Despite these lowrequirements, urban and industrial pollution are reducing the quality of rawwater supply and competition for watbr in the dry season is already intense inurban areas like Bandung, Jakarta and Surabaya. Urban and industrial wateruse is expected to grow at high rates (between 7-9% p.a.), reflecting rapidurban population and industrial growth. Unaccounted-for-water (water lost

- 102 -
from piped systems or used without payment) accounts for around 40% ofmunicipal water supply, and major efficiency improvements will be needed tomeet this future demand.
5.24 Groundwater extraction, mainly by the private sector for its own use,is about 8.7 Bmi3 per year, or 10% of firm water flows. However, becausegroundiwater is relatively safe and convenient, it is the major source of waterin cities that have polluted surface waters. In Jakarta, private groundwaterextraction provides about four times as much water as the municipal pipedwater supply. This massive withdrawal has caused saline intrusion intoshallow aquifers, which presents a serious problem since shallow wells are animportant source of water for domestic use by the poor. Most industries relyon groundwater. In West Java around 65% of industrial water is drawn fromprivate wells and another 25% is private extractions from rivers and lakes.Only 10% of industrial water use comes from town or city water systems.However, with the worsening of water pollution in the river systems and tOdeterioration of groundwater quantity and quality in some areas, futureindustrial water supply needs will have to be met from expansion of municipalpiped systems.
5.25 Efficient water resource use to meet growing future demands willrequire more effective management both of surface and groundwater resourcesthrough better coordination between and strengthening of the public sectoragencies involved. Many different public institutions are responsible forproviding and regulating irrigation, municipal piped water supply, andgroundwater use. The Ministry of Public Works (MPW) is charged with overallplanning, development and management of surface water resources. Within MPW,the Directorate General of Water Resources Development (DGWRD) plays the majorrole. Its Directorate of Irrigation works with staff from the Ministries ofAgriculture and Home Affairs, the Provincial Irrigation Services andIrrigation Committees and the local farmers, Water Users Associations todevelop, operate and maintain irrigation systems. The Directorate General ofPublic Works (DGCK) is in charge of nationwide planning and design ofmunicipal piped water systems for household and industrial use. DGCK isresponsible for constructing new public water systema (BPAMs) and supervisingtheir operation before their transformation into semi-autonomous waterenterprises (PDAMs) which are wholly owned by local governments. TheDirectorate of Environmental Geology in the Ministry of Mines and Energy isresponsible for managing groundwater resources and issuing licenses forgroundwater abstraction. However, many private users circumvent theselicensing requirements, and aquifers are being overdrawn. This reflectsjurisdictional problems in relation to municipalities, inadequate enforcementavz;.lority and limited staff. This complex institutional structure hamperseffective planning and regulation of public and private provision of waterresources.

- 103 -
C. Efficient Demand Management for Infrastructure Services
Introduction
5.26 While the rapid pace of private sector growth generates a demand forexpanding infrastructure services, it is equally important to ensure that thisdemand is moderated by appropriate prices so that the available infrastructureis used efficiently. The role of the public sector in formulating appropriatepricing policies is critical to ensure efficient demand management ofinfrastructure services. This efficiency goal requires that the prices thatguide the decisions of producers and consumers reflect the marginal costs ofproduction. Unsatisfied demand at these efficiency prices indicates a need toexpand production by making it clear that users are willing to pay for theexpansion. In some infrastructure sectors, such as power andtelecommunications, system expansion requires lumpy investments. Settingprice to short-run marginal cost can result in unacceptable price instabilityand long-run marginal cost provides a smoother approximation. User chargesare also a potentially important source of revenue. Raising user charges tolevels closer to long-run marginal supply costs can help to finance expansionof services. Social objectives of poverty reduction and equitabledistribution of income also influence public utility pricing but often resultin subsidized services for the better-off. If public utility pricing is usedto address distributional objectives, proper targeting of subsidies to reachthe poor is a critical part of designing the pricing policy. This sectionreviews the current pricing policies for electric power, telecommunications,transport and water resources in Indonesia in light of these efficiency,revenue and equity objectives.
Electric Power
5.27 Pricing policy plays a critical role in managing electricity demandto ensure that the available supply is efficiently allocated among useru.Meeting this economic efficiency objective requires the power tariff to signalto consumers the economic cost of electricity supply. If demand remainsunsatisfied at these efficiency prices, it is clear that system expansion isappropriate. The long-run marginal cost of supply (LRMC) varies significantlydepending on the location, voltage level, time of day and consumption patternof the user. These cost differentials need to be signalled to consumersthrough the level and structure of the power tariff. In Indonesia, powertariffs are regulated by the Government, but there is no automatic and regularlinkage between tariff adjustments, marginal supply costs and demand growth.Power tariffs were last raised, by 25% on average, on April 1, 1989. Underthe new tariff the average revenue generated per Kwh sold was estimated to beabout 13% below LRMC in 1989/90.
5.28 This departure from the efficiency price benchmark resulted in atotal economic subsidy of about Rp.600 billion in 1989/90. Most of thesubsidy is channelled to residential consumers but only about one-twentieth ofthis actually benefits poor consumers, while the rest encourages excessiveconsumption by the better-off. The remaining tariff subsidy is channelled tosmall industrial customers, but this is unlikely to contribute to the creationof new enterprises or expansion of existing ones. The cost of electricityaccounts for only a small proportion of production costs and hardly affects

- 104 -
investment decisions. The Government has already recognised the inefficiencyof such subsidies by phasing out subsidised credits for promoting small-scaleindustry.
5.29 These considerations suggest the need for careful review of the leveland structure of the power tariff. In the past, tariff adjustments have beenimplemented only after prolonged delays. This has reduced PLN's earnings andcapacity to finance system expansion to serve the unmet demand, and it hasprevented the effective use of pricing policy to manage the growth of demand.It will be important, therefore, to adjust the power tariff to reflect changesin PLN's costs (for example, fuel prices, inflation and the exchange rate,adjusted for efficiency improvements). A system of regular tariff adjustmentsusing agreed criteria would result in frequent small changes and avoid thestress and risks of delay associated with a large tariff increase. Highertariffs would also provide an important improvement in the incentives for theprivate sector to supply captive power to the PLN grid, since these prices arepresently governed by the administered power tariff.
Telecommunications
5.30 The Government announced important changes in the level and structureof telephone tariffs on October 8, 1990 in order to strengthan the financialperformance of PERUNTEL to fund system expansion in the face of growing unmetdemand. First, telephone installation charges were raised substantially tomoderate the excess demand for new services. For Jakarta the installationcharge was doubled from Rp.500,000 to Rp.l million. An additional measurethat could be considered is to reserve a significant portion of new lines forcustomers willing to pay a higher installation fee in exchange for priorityservice within one month. Second, monthly subscription charges had been lowcompared with costs and with charges in other countries. These were raised toencourage subscribers with low utilisation to terminate telephone services sothey can be reallocated to customers who value the service more highly. ForJalarta, the subscription fee was nearly tripled, from Rp.3,500 to Rp.10,000per month. Third, the charge for local calls was raised from Rp.75 to Rp.100per three minutes to bring it into line with marginal cost.-. Fourth, thecharge for long-distance calls over 1,000 km was lowered from kp.2,250 toRp.2,000 per minute in view of the low marginal costs of accommodating theadditional long-distance traffic. Given the congestion problems on thetelephone network it would be appropriate in future to differentiate thetariff structure to reflect peak and off-peak use for local as well as forlong-distance service.
5.31 These improvements in the level and structure of telecommunicationscharges are appropriate and an integral part of the telecommunicationsinvestment strategy to manage demand growth and finance a rapid expansion ofthe telephone network. It will be important to undertake a regular review andrevision of telecommunications tariffs in order to avoid larger and moresensitive rate changes that would otherwise be required at longer intervals.
Transport
5.32 Transport pricing policy is most complex for road use. Facilitiessuch as ports and airports have well-defined tariffs which users must paydirectly to use their services but, except for toll roads, there is no directpricing mechanism linked to road use. Because direct road user charges arenot feasible, other indirect taxes are applied to reflect user costs. These

- 105 -
include the gasoline tax and provincial government fees for vehicleregistration and ownership transfer. These taxes are imperfect substitutesfor road user chargas because tax incldence varies among users and may notreflect actual road user patterns and the economic costs they impose. Thus,annual lump sum charges overtax infrequent road users who cross-subsidizefrequent road users. Fuel taxes are a closer approxlmation to an efficientroad user charge because they vary with distance travelled which is onedeterminant of economic costs. However, they do not reflect other importantdeterminants such as the type of vehicle used, the size and distribution ofthe load carried, and the route and timing of road use.
5.33 In Indonesia the publicly regulated prices of motor fuels and otherroad user taxes have not been based on the efficiency objective of signallingto users the road infrastructure costs imposed by operation of their vehicles.This distorts the pattern of demand for different transport modes. Hostimportantly, some traffic is attracted to road which could be transported moreeconomically by other modes such as rail, and road transport operators areencouraged to purchase those type of vehicles (notably medium-sized two-axletrucks) which are most easily overloaded and hence cause heavy damage to roadpavements. The Government will need to restructure the road user taxationsystem to promote efficient transport use. Such a system could reduce thecost of meeting rising transport demands, in particular by inducing truckersto take efficient investment and operating decisions. This will meaneliminating the present pricing distortion under which medium and heavy truckslmpose around 40% of total road infrastructure costs but generate revenuesthat recover only about 4% of those costs. This will require actions to:(a) raise the subsidised price of diesel not only to cover its economic costsbut also to include a road user tax component; and (b) to restructure theannual registration fee for commercial vehicles to reflect their road damagingpotential and size rather than age and engine capacity as at present.
Water Resources
5.34 Although urban industrial and household use of water is still smallcompared to agriculture, these water requirements are growing and will imposeincreasing pressures on the traditional claims of irrigated agriculture.Within urban areas, the use of publicly supplied piped water versus privatelyextracted groundwater also poses important tradeoffs. Pricing policy willhave to play an increasingly important role in resolving the choices among theuses of scarce water resources in Indonesia.
5.35 &griculture. A large part of the future water shortage could beeliminated by improving the efficiency of water use in irrigation. Theeconomic costs of capturing, delivering and distributing irrigation water,including the opportunity costs of diverting water from industrial use, arelarge. Farmers who do not appreciate these costs are likely to waste water,reducing productivity and economic growth. Publicly provided irrigationfacilities cover over 80% of the lrrigated area and this irrigated water isgenerally not priced. As a result, irrigation water is the most heavilysubsidised agricultural input amounting to over Rp.l.0 trillion per year. TheGovernment has initiated a program of imposing an irrigation service fee on700,000 ha of publicly lrrlgated land over the next four years. Thisrepresents an important first step in establishing an appropriate pricingregime for irrigation water. However, these lump sum fees are not linked to

- 106 -
the volume of water used. Thus, while system efficiency will be improvedthrough better maintenance, appropriate economic incentives for efficientwater use still remain to be put in place. Over the medium term it may befeasible to charge for bulk sales of water to irrigation schemes, but thiswill require further development of the river basin allocation and managementconcept.
5.36 Industry. Private groundwater extraction is the major source ofindustrial water use. In principle, licenses are issued for groundwaterextraction, the rate of extraction is metered, and charges on water use arelevied by the municipality. In practice, groundwater use is not adequatelyregulated. Unlicensed wells are common and tariffs are both low andundercollected. This underpricing of groundwater leads to considerable wasteby private industrial users. This is a serious problem in coastal areas whereaquifers cannot adequately recharge, so current use lowers the water table andincreases the future cost of groundwater extraction. Proper design andcollection of groundwater charges is, therefore, a critical issue in pricingwater resources.
5.37 The tariff structure for publicly supplied piped water ischaracterized by a high surcharge levied on industrial and commercial usersand a subsidy for residential users. This tax on industrial and commercialconsumers is appropriate to mobilise resources needed to expand piped water.However, there is a clear risk that these high rates reinforce the incentivetowards inefficient private extractior. of underpriced groundwater in areaswhere groundwater is scarce. In these areas it is critical, therefore, tocomplement the municipal tariff structure with strict enforcement ofappropriate prices for private groundwater extraction. In addition, theresidential subsidy fails to meet the intended equity objective because it ispoorly targeted. It disproportionately benefits the better-off consumers whocan afford to pay the high lump sum connection charge and who also consumewater more heavily than low income users. These considerations indicate aclear need to redesign the piped water tariff structure. To serve the equityobjective, the residential subsidy would be better targeted only at lifelineconsumption levels of piped water, and the rest of the subsidy reallocated toexpand provision of public standpipes serving the poor.
D. Public Expenditure Priorities for Infrastructure Expansion
Introduction
5.38 Private sector participation and improved pricing policies can playan important role in mobilising resources and managing the demand forinfrastructure services. Nevertheless, the public sector will continue tohave an important role in providing and financing expansion of infrastructuresystems to sustain rapid private sector growth. This section examinesselected issues in setting public expenditure priorities in the keyinfrastructure sectors of power, telecommunications, transport and waterresources.

- 107 -
Electric Power
5.39 The rapid growth in private sector power demand calls for asubstantial investment program to expand PLN's capacity. The large resourcerequirements raise important questions about the future financing strategy.As s.own in Table 5.2, power investment is projected to rise to Rp.19 trillionin 19S9/90-1993/94 and then to triple to Rp.66 trillion in 1994/95-1998/99.In the past, only a small proportion of PLN's investment program was self-financed by internal cash generation (about 14% during REPELITA IV), with theremainder funded through the budget. About half of these funds are governmentborrowings from multilateral and bilateral sources, onlent to PLN atsubsidised interest rates with the government carrying the foreign exchangerisk, and the rest contributed in the form of government equity.
Table 5.2: PLN INVESTMENT AND FINANCING PLAN(at current prices)
1989/90-1993/94 1994195-1998/99Rp.billion Percent Rp.billion Percent
Investment 18,799 100 65,768 100
Financed by:Internal cash generation 5,023 27 19,123 29Borrowing 9,593 51 42,545 65Equity 4,183 22 4,100 6
Source: World Bank staff estimates.
5.40 Given the growing size of PLN's future investment requirements, thisfinancing strategy will need to change in order to reduce PLN's dependence onconstrained public resources while ensuring adequate expansion. Three majorelements would underlie this change in strategy. First, the power tariffneeds to be adjusted periodically to reflect the economic cost of supply. In1989/90 the average revenue per Kwh was about 13% below LRMC. The financingplan in Table 5.2 assumes that tariffs are adjusted in line with changes innominal LRMC so that the self-financing ratio rises to around 30%. A secondstep to reduce PLN's need for government subsidies would be to target subsidypayments on clearly defined social objectives such as financing the ruralelectrification program. Implicit subsidies channelled through subsidized on-lending of government borrowings are not appropriate and can be phased out.These measures could limit the Government's equity contribution to aroundRp.4 trillion in both 1989/90-1993/94 and 1994/95-1998/99, and imply thatPLN's borrowing requirements would rise to about Rp.10 trillion in 1989/90-1993/94 and about Rp.43 trillion in 1994/95-1998/99. As a third step, theGovernment will need to enable PLN to explore ways of borrowing the remainderfrom the domestic capital market through the sale of bonds to institutionalinvestors or issuing capital stock.

- 108 -
Telecommunica', -U
5.41 PERUMTEL has proposed a long-term investment plan that would achievea ratio of 1.34 lines per 100 population by the end of REPELITA VI. The costof this plan assumes a much lower average unit cost (Rp.3.7 million orUS$2,050 per line added) that would be realized if PERUMTEL adopts: (a) cost-effective technology, (b) a competitive procurement and financing strategy,and (c) an integrated system approach in project implementation. Targets andcosts are summarised in Table 5.3. Although implementation of the plan wouldnot reduce the absolute size of the waiting list, there would be a substantialrelative improvement in that about 49% of total demand would be met in 1994,compared with 34% in 1989. Most important, the quality of service and accessto service would be vastly improved.
lable 53.: PERUMTEL DEVELOPMENT PLAN
1984/85-1988/89 1989/90-1993/94 1994/95-1998/99
Added lines (million) 0.25 0.90 1.10
Density (lines/l0O)La 0.45 0.95 1.34
Investment requirement(Rp. trillion atconstant prices) 1.30 3.20 3.90
La At the end of each five-year period.
Source: PERUMTEL and World Bank staff estimates.
5.42 Table 5.4 shows the estimated investment requirements and outlines apossible sector financing plan. This assumes that: (a) the foreign costs ofinvestments would average 40% of total costs, (b) PERUMTEL would self-financea minimum of 40% of the total investment costs, (c) local bank borrowing wouldbe maintained at current levels, and (d) subscriber bond financing would beintroduced later in REPELITA V and would ultimately provide about 1.2% of localcost financing in REPELITA VI. This plan is based on the premise that foreigncosts will continue to be met by government onlending of foreign loans andgrants.

- 109 -
Table 5.4: PERUMTEL INVESTMENT AND FINANCING PLAN(at constant 1989/90 prices)
1984/85-1988/89 1289/90-1993/94 1994/95-1998/99Rp. Rp. % Rp. t
trillion trillion trillion
Investment 1.44 100 3.20 100 3.90 100
Financed-by:Internal cash generation 0.32 22 1.49 47 1.67 43External borrowing 0.67 47 1.28 40 1.56 40Domestic borrowing 0.45 31 0.43 13 0.67 17
Source: World Bank staff estimates.
Transgort
5.43 There are no simple indicators to assess the adequacy of existingtransport infrastructure capacity or to relate future development requirementsto projected economic growth. A starting point in assessing futureexpenditure priorities is REPELITA V which reflects government's spendingpriorities for individual subsectors. The plan projects development budgetexpenditures on road, land, sea and air transport of Rp.23.7 trillion atcurrent prices.
5.44 Interurban roads. The geometry and pavement of key interurban roadlinks have been improved to a satisfactory condition and appropriatemaintenance programs have been put in place. During the coming years, themain challenges will therefore increasingly shift to: (a) providing additionalcapacity in those corridors, principally on Java, where traffic volumes arencw approaching capacity and where heavy freight traffic will necessitatefurther pavement strengthening; and (b) upgrading provincial and othernational links that have not recently undergone betterment. There are severaloptions for providing the additional road capacity needed in the denselytrafficked trunk corridors, ranging from the widening of existing roadscoupled with the construction of urban by-passes through to the constructionof a strategic network of restricted access toll roads. In order to makeprivate sector participation in toll roads more attractive to potentialinvestors, the Government intends to maintain existing trunk roads in asatisfactory physical condition but to allow them to become congested.
5.45 District roads. The current level of spending on district roads iscommensurate with the absorptive capacities of local governments and theircontractors, and is providing improved access to rural communities at areasonably rapid rate. In the medium terdb, there seems to be no need toincrease the level of real expenditure, although progressively larger sharesof the total will need to be allocated to m4intaining those roads that have

- 110
recently been improved. Continued efforts will also be needed to developfurther the capacities of district level agencies to plan and implement theirroad programs.
5.46 Urban transport. Expenditures on urban roads and other publictransport infrastructure and services will need to increase iapidly in thecoming years. Such spending needs to be combined with effective trafficrestraint measures to slow the growth in demand for private transport tomanageable levels. Such measures could also reduce air pollution, which is anincreasingly important problem in big cities. Estimates for the Jabotabekregion indicate an investment requirement of around US$3 billion at currentprices over the next twenty years to provide a basic network of segregatedbusways and light rail lines to serve existing major corridors. 'In those withsignificant land development potential, there are opportunities to secureefficient private sector participation that should reduce demands on thebudget. Additional investments will be needed in the Jabotabek region toprovide more road capacity in some inner city corridors, to construct grade-separated intersections at heavily congested junctions, and to open up newperipheral areas for efficient development. In other major cities, increasedroad investments will also be needed to open up new areas on the peripheries.
5.47 During the 1980s, the government invested large sums in providing thepublic bus corporations with new buses needed to maintain and increase thesize of their fleets. This investment has .iot been effective. Althoughinitiatives to improve performance of these corporations are in progress,opportunities for improving services by allowing competition from private buscompanies need to be considered. Many competent private companies havealready expressed interest in operating city buses.
5.48 Railways. The public railway corporation (PJKA: has recently changedits status to a perum and will need to streamline its operations and imploveits efficiency. A major priority is to reduce the bacidtg of deferredmaintenance and asset r:eplacement of its locomotive fleet, much of which isinoperable or operating below capacity and prone to in-service failure as aresult of shortages of basic spare parts. In addition, minior investments inrollingstock are needed to serve high potential markets. Expendituresapproaching US$400 million would be required in these ar ns over the comingfive years. Other investments in railway system capacitN expansion can bedeferred until the operational performance and financial co.ndition of the newperum has improved significantly.
5.49 Maritime transport. The rapid increase in non-oi. exports has beenreflected in very strong growth in throughputs at Java's main general cargoports, and particularly in the movement of containers through Tanjung Priok,where the tonnage of international containerized cargos increased at anaverage rate of 24% pa from 1986 to 1989. This caused mounting congestion atthe container terminal during 1990. Providing additional capacity at this andother large general cargo ports in Java and Sumatra will account for the majorproportion of all port investments in the medium term. There will also be aneed for continuing government funding of the development and rehabilitationof small ports in more remote areas, particularly eastern Indonesia, althoughthe annual cost of such projects will be small. Before undertaking these

- Ill 1
investments, improved approaches for the planning and design of small portprojects need to be established. Required expansion of shipping services aswell as shipbuilding and repair services can be left to the private sector.
5.50 Air transgort. The second phase of Jakarta's new internationalairport is nearing completion and major capacity expansi.on projects areunderway at Bali and Balikpapan. Once these projects are complete, there willbe a need for continuing investments to add capacity at certain other majorairports, although some of the proposals have been driven by very highprojections of tourism development and require review. A government decisionto permit private sector participation in the development and management ofairport facilities would also serve to reduce demands on the budget.
Water Resources
5.51 Agriculture. The main choices in setting public expenditurepriorities for irrigation are the balance between new system development andcompletion of existing schemes, and between new investment and O&M.REPELITA V targets include 500,000 hectares of new irrlgation area, 334,000hectares of irrigation rehabilitation and upgrading, and 444,000 hectares ofswamp area rehabilitation. However, several studies have indicated that riceself-sufficiency could be maintained with a less ambitious expansion of theirrigation network than that foreseen for the REPELITA V period. Moreover, byplacing priority on completion of existing command areas instead ofconstruction of entirely new systems, the cost of expanding irrigated area canbe reduced. A substantial amount of investment on rehabilitation andupgrading (R&U) is needed to restore the irrigation infrastructure to itsdesigned state and to achieve the substantial improvements in efficiency ofwater use which are required. In general, however, R&U will not be effectiveunless followed by efficient operation and maintenance (O&M) activities, whichare necessary to prevent the infrastructure from deteriorating once again.O&M of irrigation systems is under-funded in Indonesia. Total expenditures onO&M were only about Rp.69 billion in 1989/90, or 0.3% of the Rp.25 trillionvalue of the irrigation capital stock. Economic returns to incrementalexpenditures on O&M are very high, usually more than 50%. A nationwideprogram of efficient O&M would require annual expenditures of only Rp.175billion, but increased expenditures should be phased in as the irrigationinfrastructure is rehabilitated to its designed standards. Appropriate usercharges levied on farmers based on the quantity of water used would financeO&M costs and encourage farmers to use scarce water more efficiently.Recently adopted measures indicate important progress towards this objective(see para. 5.22).
5.52 Non-agriculture. REPELITA V sets ambitious plans to expand andprotect the public water supply. Physical targets include: (a) expansion ofwater production capacity from 51,000 to 65,000 liters/second; (b) piped-waterdistribution increased from 32% to 47% of the urban population; (c) access ofthe rural populatlon to nublicly supplied ground or surface water raised from30% to 600. These targets assume that a great deal of the existing privateground and surface water supply would be replaced with public piped systems.If these quantity targets are achieved at the expense of ensuring properquality of project design, implementation and O&M, and without carefulanalysis of the effective demand for piped watex, the resulting infrastructurewill remain underutilized and deteriorate quickly. To prevent this, local

- 112 -
Governments will need to assume increasing responsibilities for projectselection and management in accordance with local priorities. PDAMs will alsoneed to generate sufficient funds to operate and maintain existing systemsproperly and to repay loans undertaken for system expansion. Appropriatedesign and enforcement of the municipal water tariff structure (includinggroundwater charges) will, tharefore, be a critical complement to the publicinvestment program. To improve the quality of the raw water and thus reducetreatment costs, larger expenditures and low-cost approaches are also neededfor sanitation and sewerage programs.
E. Recent Developments in Public Sector Management
Introduction
5.53 The changing role of the public sector towards enabling greaterreliance on private sector development cails for major improvements in thequality of government services. This Chapter illustrates the complex andinterrelated policy agenda facing the Government in meeting the challenge ofproviding adequate infrastructure to sustain private sector growth, includlng:shaping a policy framework for private sector participation that protects thepublic interest, formulating efficient pricing policies for infrastructureservices, and designing and implementing high quality public investmentprograms. The ability of the Government to address this agenda depends on theeffectiveness of its constituent parts, the central and regional governmentsand public enterprises, and on the administrative capabilities of thesegovernment institutions. This section reviews recent developments in publicsector management aimed at improving public enterprise efficiency and reformof the civil service.
Public Enterprise Reform
5.54 The Government has been developing a policy framework for the longer-term reform of PEs based on Presidential Decree No.5 in October 1988. Withthe development of the economy and the recent deregulation measures, thenumber and range of enterprises that need to remain under government ownershiphave declir.ed. Accordingly, the two major objectives of the longer-termreform program for PEs are to: (a) introduce organisational and managerialreforms in enterprises that will remain in the public sector to improve theirefficiency and reduce their burden on scarce public resources; and (b) divestenterpfises that need not remain under public ownership, in a phased andorderly manner.
5.55 In preparation for these reforms, two ministerial decrees issued inJune 1989 set out the financial performance criteria for public enterprisesand outlined a number of options to improve their efficiency and productivity.Using financial data from 1985-88, some 189 enterprises were classified intofour categories; very sound, sound, less sound and unsound. Based on the typeof good or service involved and these financial indinators, a set of corporaterestructuring strategies has been jointly decided on by the Ministry ofFinance (MOF), the line ministries and the various enterprises. These rangefrom change in legal status of the firm, to sale of equity on the bourse, toliquidation. This initial design for restructuring was accompanied by

- 113 -
instructions to the PEs to prepare five-year corporate plans and annual workprograms for use by the management of the PEs, the line ministries and theMOF. In addition, the roles for PE management, line ministries and the MOFhave been defined more clearly. Thus, routine management for most PEs will bethe responsibility of the Boards of Directors (BODs). The interventions ofthe technical ministries and the MOF will be done in the context of approvingan annual work program and a five-year corporate plan.
5.56 The Government is now proceeding with a phased implementation of itsreform strategy. As a first step, some of the options have been implementedselectively, including change in the legal status of six enterprises tofacilitate commercial operation, the establishment of management contracts forfour PEs, the merger of six PEs, Joint ventures for two PEs, and the sale orliquidation of ten PEs. Furthermore, significant changes in the compensationpackage and accountability for PE directors have been introduced, aimed atenhancing performance through better incentives and instituting betteraccountability for poor performance. A merit pay system for employees hasbeen tied to that of the directors. Efforts are also underway to improvestaffing flexibility by separating PE employees from the civil service.Together, the new salary structure, the clarified roles of the PE management,MOF and line ministries, and the five year corporate plans and annual workprograms, constitute the nucleus of an improved system of accountability andcontrol of PEs. At the same time, deregulation measures should expose publicenterprises to increasing competition by reducing barriers to imports andinvestment.
5.57 In parallel with steps to improve the performance of PEs that willremain in the public sector, the Government is pursuing a policy of gradualdivestiture and privatization. There are two main elements in this strategy.First, the Government is actively seeking ways in which the private sector caninvest in and operate a wider range of infrastructure services, includingpower, telecommunications and ports. The Government has recognized that indeveloping specific proposals in this area, it is important to take account ofthe public interest to ensure the arrangements are efficient and cost-effective. Consequently, the Coordinating Minister for Economic Affairs(EKUIN) is coordinating work to develop guidelines and review specificproposals. A second element of the Government's privatization strategy is todivest enterprises that need not remain under public ownership. This would beachieved through sale of shares in the stock market as well as throughoutright sale to the private sector. The Government has taken a cautiousapproach in implementing this policy in view of important practicaldifficulties that remain to be resolved. These include: (a) the transparentdefinition of rules for divestiture to ensure fairness in valuation andbidding;' (b) minimizing the burden on government of compensation forretrenchment: and (c) improving the capacity of the stock market to handleeffectively large sale of PE shares. However, 52 companies have beenidentified as potential candidates for issuing shares in the stock market, andpreparations are underway to allow three cement companies and a sugar estateto float shares in the stock market in the near future.

- 114 -
Civil Service Reform
5.58 The rcorientation of the public sector towards managing privatesector growth requires different skills from the civil service and a changedset of incentives. Middle-level staff involved in routine controlling andlicensing functions will need to be replaced with highly skilled professionalscapable of working on policy analysis, monitoring and regulation in support ofprivate sector activities. Recognizing this, the Government has embarked on aprocess of civil service reform led by the Ministry for the Utilisation ofState Apparatus (MENPAN). The focus of this process is on clarification oftasks and responsibilities through a wide-ranging job analysis initiative.The generalized adoption of job analysis is expected to support a government-wide streamlining of organizational structures and size, together with animprovement in management and technical skills.
5.59 MENPAN expects job analysis to serve as a vehicle for reducing thesize of the bureaucracy. First, careful specification of tasks andresponsibilities should result in a better fit between workers and theirassignments by drawing attentiun to public employees who are underemployed andeligible for reassignment. Secondly, job analysis implies a thorough mappingof the functions and activities of work units as well as agencies as a whole.This procedure should identify the extent to which staff who performedassorted regulatory tasks and other activitics have been made redundant byderegulation.
5.60 Improving pay and incentives systems is required to attract skilledprofessionals to the civil service. Educational attainment and skill levelsremain low on average. In 1989, only 11% of Indonesia's civil servants had atleast a bachelor's degree, compared to 5% in 1975. Base salaries andallowances have remained low, while a complex system of supplementary paymentshas emerged. For example, those holding "structural" positions with mainlyadministrative duties, get regular allowances and have better access to otherforms of supplementary income, including project-related honoraria, per diempayments, housing, training and other allowances. The proposed remedy is tocreate functional positions and career streams using job analysis. Functionalpositions would carry clearly specified allowances tied to skill andperformance and consolidate the various supplementary payments and benefits.This approach would introduce more competitive promotion procedures andopportunities. Currently, promotion within grades is semi-automatic andlargely a function of elapsed time. Compared to those working in provincialand district offices, employees of central government agencies have greaterpromotion opportunities si.nce central service has four rather than threegrades four additional steps in the extra grade and many more structuralpositions. Limited scope for advancement is one of the factors that makerecruitment of good staff outside Jakarta difficult. When the functionalposition structure is in place, individuals in different functional jobs "I.earn numerical credits for their work contribution, professionalism andperformance. Promotion within an explicit career structure and receipt oflarger functional allowances will follow once sufficient credits have beenaccumulated.
5.61 By tackling key civil service reform issues of size, skill andcompensation the MENPAN job analysis initiative promises to help prepare thegovernment for the management challenges of the 1990s. MENPAN has pursued its

- 115 -
administrative agenda vigorously. More than twenty ministries or independentagencies have assigned staff to be trained in job analysis and follow-up staffwork. Most agencies have completed at least one round of job analysis, whilethe number of approved functional positions has been growing. Despite thesedetermined efforts, Indonesia's current civil service reform is still in itsinitial phase. Only one-quarter of the newly defined positions have beenrecognized through budgetary allocations. Without the funding required tocover the salary increments and allowances tied to each position, the new jobdescriptions and task roles are likely to remain abstractions. Moreover, ahuge number of civil servants (almost two million) remain to be included inMENPAN's planned blanket coverage of job analysis and functionalclassification. Although expectations should be realistic given the dauntingsize of the task, the potential benefits of this civil service reform effortare great.

- 117 -
CHAPTE6Li
ENSURING WIDESPREAD PARTICIPATION IN THE BENEFITS OF ECONOMIC GROWTH
A. Introduction
6.01. An important objective of the Government in developing privateenterprise has been to widen opportunities for Indonesians to share in thebenefits of economic growth. The evidence presented in Chapter 1 shows thatthe process of structural change in the economy has resulted in employment andreal income growth in the poorest income groups and a dramatic decline in theincidence of poverty. Furthermore, trends in income distribution (availablethrough 1987) also indicate that income growth in lower income groups has beenmore rapid than in upper income groups. Nevertheless, concerns have arisenabout the distributional effects of rapid private sector growth in theindustrial and modern sectors. One area of concern is the role ofconglomerates, which accumulated a large amount of market power during theperiod when the economy was heavily regulated. These large corporate groupswere better placed to take advantage of the opportunities afforded in theperiod following deregulation. A second area of concern is regionaldisparities in the growth process, as certain areas of the country have lowerincomes and a higher incidence of poverty. These are legitimate concerns.However, appropriate measures can ensure that future growth continues to bewidely shared throughout all segments of society. Two types of initiativeswill be important: (i) a determined continuation of the Government'sderegulation policies to create a level playing field, thereby exposing largefirms to greater competition; and (ii) tax and expenditure measures thatensure that taxation policy is fair and that public expenditures enhance theproductivity and quality of life of the poorest members of society.
6.02. Section B of this chapter reviews the evidence regarding recenttrends in the distribution of the benefits of economic growth. Section Coutlines recent Government efforts to promote a wider participation ineconomic development. Section D discusses initiatives that would help levelthe playing field through further trade and industrial deregulation, legalreform, more equal access to credit, and a transparent interaction between theGovernment and private sector. Section E considers fiscal policy initiativesthat would improve the fairness of the Government's taxation policies andwould ensure that public expenditures are directed into areas, such as uplandagriculture and human resource development, that enhance the quality of lifeand the productivity of the poor.
B. Trends in the Distribution of Growth
6.03. A key goal of the New Order Government has been to ensure anequitable pattern of economic growth. As noted by President Soeharto in thepresentation of the 1991/92 Draft Budget:
*From the very onset we realized that equitable distribution withoutgrowth will only mean sharing poverty. Growth without equitabledistribution means sharing injustice."

- 118 -
Beginning with the first five-year development plan, the Government's programsand policies have been directed towards achieving broad-based economic growth.The primary focus of its strategy was to improve the productivity of the ruraleconomy and in particular, to attain rice self-sufficiency. During theturbulent 1980s, the Government undertook prompt macroeconomic adjustmentmeasures and comprehensive structural reforms that encouraged the growth oflabor-intensive manufacturing while protecting agriculture and the ruralsector. These development policies have done a remarkable job in ensuringthat the benefits of economic development were widely shared. One aspect ofthis is the trend in the incidence of poverty. In 1976, 40% of thepopulation, about 54 million people, were in poverty; by 1987, the incidenceof poverty had been reduced to only 17%, about 30 million people.1/
6.04. Other indicators also show considerable progress. The share ofconsumption expenditures by the poorest quintile of the population hasincreased from 6.9% in 1970 to 9.2% in 1987 (see Table 6.1)../ The share ofconsumption by the poorest quintile in Indonesia is also comparatively high:in the Philippines, the lowest quintile accounts for only 5.5% of consumptionexpenditures; in Malaysia, only 4.6%; in Sri Lanka, only 4.5%; and in India,
Table 6.1: EXPENDITURE DISTRIBUTION, 1970-1987(% of total expenditure)
Decile 1970 1978 1980 1981 1984 1987
Lowest 2.83 2.81 3.28 3.53 3.43 3.72Second 4.11 4.48 4.44 4.72 4.56 5.48Third 5.46 4.59 5.40 5.90 5.58 5.67Fourth 6.29 6.25 6.43 6.29 7.18 6.00Fifth 7.34 6.71 7.63 7.48 7.64 7.82Sixth 8.71 8.05 8.32 8.14 7.64 7.82Seventh 10.07 9.63 9.91 10.92 10.26 10.88Eighth 12.24 12.14 12.32 10.92 11.74 10.95Ninth 15.47 14.86 14.44 14.55 14.91 14.61Tenth 27.47 30.48 27.83 27.56 27.06 27.04
Gini Coefficient 0.35 ia 0.38 0.34 0.33 0.33 0.32
Source: 1970: Early estimates by World Bank staff; 1978-1987: Statir ihIndonesia. 1989, Central Bureau of Statistics.
L& Estimated from decile-level data.
1/ See Indonesia: StrategX For a Sustained Reduction in Poverty, on. cit..
/ These expenditure data are drawn from The National Socioeconomic Survey(SUSENAS). There are concerns about the completeness and accuracy of theSUSENAS sample among higher income groups; as a result, income andexpenditures in the higher income classes may be somewhat understated.See ibid., Annex 1.

- 119 -
only 8.l%.2/ Indonesia's low and declining level of inequality is alsoevident from the Gini coefficient, which has fallen from 0.38 in 1978 to 0.32in 1987._4/ Finally, per capita income growth averaged 3.7% p.a. during1984-87, the period of economic adjustment. Per capita incomes rose morerapidly in rural areas than in urban areas during this period. As indicatedby ,hese trends, Indonesia's growth path during the past two decades (andparticularly during the 1980s), benefitted lower income groups and therelatively poorer rural areas. Thus, income inequality was reduced during thetwo decades since the beginning of the New Order Governmen:.
6.05. Since 1987, it appears that poverty has continued to decline and thatincome growth has remained strong. Growth in the non-oil manufacturing sectorhas been robust during 1987-1990, averaging about 12% p.a.. Real wages forunskilled labor in the non-oil manufacturing sector have also increasedslightly since 1987 (see Table 1.11), and employment has continued to expand.Similarly in the agricultur- sector, real incomes for unskilled laborers havegrown in Java. These tre ' -ggest that real incomes in the poorest incomegroups has continued to ex' ; n the late 1980s.
6.06. Despite these gains, two important areas of concern have begun toemerge about the potential effect upon income distribution of the rapid growthof the private sector. One area of concern has been conglomerates. A numberof the large companies that benefitted from government-sanctioned monopolieson production and trade in the period before deregulation have experiencedrapid growth in the late 1980s. Initially, these firms were better placedthan other companies in terms of capital and personnel to take advantage ofthe opportunities presented by the newly deregulated environment. Thesecompanies had accumulated considerable market power from the inward-looking,import-substituting industrial strategy pursued by Indonesia during the late1970s and early 1980s.
6.07. One measure of this market power, which was established before theperiod of deregulation, is the level of output concentration in the non-oilmanufacturing sector, as measured by the share of output produced by the fourlargest firms (CR4). In 1985, about 30% of domestic output was produced byextremely concentrated industries (i.e., a CR4 above 70%), and another 30% wasproduced by highly concentrated industries (i.e., a CR4 above 40%).5-/ Theseratios indicate that concentration was high in the non-oil manufacturingsector. Moreover, the concentration ratios probably underestimate theconcentration of market power since these data apply to plants rather thancompanies or ownership groups. This concentration of market power resulted in
2./ See World Development Report 1990, The World Bank, Oxford UniversityPress, 1990, Table 30, pp. 236-237.
£/ The Gini coefficient measures aggregate income inequality and can varyfrom 0 (perfect equality) to 1 (perfect inequality). A decline in theGini coefficient, therefore, indicates a decline in income inequality.
2/ World Bank staff estimates. Note that these data include publicenterprises. Since public enterprises tend to dominate the sectors inwhich they operate (e.g. steel, cement, fertilizer), these CR4 ratios mayoverstate somewhat the market power concentrated in the hands of theprivate sector.

- 120 -
supernormal profits in the period prior to deregulation and led to aconcentration of assets. A second measure of the harket power concentrated inthe hands of the conglomerates is the turnover generated by these firms. In1988, the turnover of the ten largest company groups in Indonesia was roughlyequivalent to 15% of GNP.§/ Howeve , it is important to note that thisconcentration is not necessarily high by international standards. Theturnover of the ten largest company groups in K1orea was equivalent to 67% ofGNP in 1984,2/ and large corporate groups in Japan and Taiwan also accountfor a significant share of GNP.
6.08. A second area of concern is regional disparities. Income disparitiesstill exist across different areas of Indonesia. In particular, the easternareas of Indonesia have lower income levels and higher incidences of povertythan the rest of Indonesia, although in many eastern areas the rate of growthof incomes was abovs the national average during the 1980s. These incomedisparities are the result of regional variations in agricultural andindustrial production and employment. Java is much more heavilyindustrialized than most of the Outer Islands (see Table 6.2). Even thoughJava accounts for only 60% of employment (and population), it contributesabout three-quarters of industrial value-added and employment. With theexception of Kalimantan, the industrial output and employment shares of theOuter Island regions are much lower than their overall employment andpopulation shares.
Table 6js Regional Distribution of Agriculture and Industry. 1988(X share of total)
alue nad x alovment Pl tionAgri- Industry Lk Total LA Agri- Industry Lk Total Lg
culture culture
Sumatra 25 16 19 23 14 19 20Java 53 72 64 54 76 61 60Kalimantan 7 9 6 5 5 5Other eastern are"s 15 3 11 18 4 15 15
Total IndonMsi& }QQ 100 1a 100 121 ;01
J. Current terno. *xcludes *i1 and ga.Lb Medium and large-scale only excludes oil and gas.Le All sectors, excluding oil and a".ld All sectors, including oil mnd gas.
Source: Central Bureau of Statistics and World Bank staff estimates.
i/ This measure exaggerates the conglomerates' share of economic activity,because it includes inputs purchased from other firms, but it does give anindication of the size and importance of these large company groups in theeconomy. See Hal Hill "Ownership in Indonesia: Who Owns What and Does ItMatter", Indonesia Assessment 1990, Hal Hill and Terry Hull eds.,Australian National University, Canberra, 1990.
7/ See Alice H. Amsden, Asia's Next Giant, Oxford University Press, New York,1989, Chapter 5.

- 121 -
6.09. The limited industrial development of the eastern areas of Indonesiais especially evident. That region's share of national industrial value-addedhas been relatively constant and amounted to only 3% in 1988 despite the factthat the region accounts for 15% of Indonesia's total employment andpopulation. The scale of activity is typically smaller than the nationalaverage and nearly all exports are resource-based. Also, foreign investorshave shown little interest in the eastern areas of Indonesia. This pattern ofregional concentration primarily reflects several factors: (i) the relativelysmall labor market with a low level of skills; (ii) distance from productmarkets for inputs and outputs; (iii) the better availability ofinfrastructure and supporting industries on Java and Sumatra, and (iv) theregulatory regime, which requires frequent contact with Central Governmentofficials and therefore places a premium on easy access to major urban areas.
6.10. These are legitimate areas of concern. However, trends in theincidence of poverty and income distribution since the period of deregulationindicate that promoting efficient private sector development is a powerful wayof achieving sustained income growth in the poorest income groups. This isevident from the growth of small and cottage industries over the past severalyears.3f/ It is also evident from trends in real wages and employment amongunskilled workers. As noted in Chapter 2, careful macroeconomic managementcombined with structural reforms would lead to 3-4% p.a. growth in GNP percapita during the 1990s, and this should be sufficient to generate substantialimprovements in the living standards of the poor.
6.11. Such a result, however, is not guaranteed. Policies that promoteprivate sector development and encourage the widest possible participation inthe growth process are necessary to ensure a broad-based, labor-intensivepattern of growth. Therefore, appropriate actions need to be taken by theGovernment to ensure that Indonesia continues to achieve a pace and pattern ofgrowth that results in sustained increases in the real incomes of lower incomegroups. Exposing the Indonesian corporate sector to greater domestic andinternational competition can reduce their market power and eliminate theirsupernormal profits. Removing constraints on regional development and labormobility will also help to lower regional income disparities, althoughregional variations are likely to remain because of different resourceendowments.
C. Recent Government Efforts To Ensure Equitable Growth
6.12. The Government has responded to these concerns by taking initiativesin several areas to help promote the widest possible participation in economicgrowth. First, the Government has intensified its efforts in the past twoyears to reduce the incidence of poverty and promote development in therelatively disadvantaged regions of the country. Spending through the INPRESprogram has been increased, and some adjustment has been made to theallocation formula to improve the regional equity aspects of the system.There has also been increased spending in health and education, withadditional outlays provided for rehabilitating primary schools, expanding the
I/ See Pilot Stud! Agro Industry, Department of Agriculture, September 1990,Executive Report II.

- 122 -
rural health center network and providing more adequate levels of O&M forhospitals. A program for the development of integrated zones has beenestablished to concentrate development funds and programs in poor, isolatedand border areas. This has been supplemented by a poverty fund to financeprojects for village infrastructure or income generating projects in poorvillages.
6.13. In addition to these fiscal policy measures, the Government has alsoissued two directives intended to foster a more equitable distribution of thegains of development. First, the Government called on large business groupsto sell 25% of their shares to employee and associated cooperatives. Afollow-up set of guidelines states that companies are expected to helpcooperatives finance the purchase of these shares. Second, the Governmentestablished a guideline that banks must place 20% of their lending with smallbusinesses, as part of the reform of liquidity credits announced in Jantuary1990.2/ A promising new initiative is the effort to revitalize 1,300inactive village banks (BKDs) that have the potential to reach very smallborrowers with little collateral in relatively remote areas.
6.14. These measures demonstrate the Government's recognition of the needto foster an equitable sharing of the benefits of deregulation and growth.Over the longer term, two types of initiatives are likely to be important:
* continued ceregulation to provide the proper incentives for broad-based growth and other measures to ensure a level playing field;and
* fiscal measures to ensure the achievement of the equity objectivesof the tax system and a more equitable pattern of publicexpenditures.
These are discusEed in the two following sections.
D. Level Playinf Field Initiatives
6.15. Promoting equitable participation in economic growth requires, as afirst step, an incentive framework that encourages continued labor-intensiveand export-oriented growth. The features of such a framework are described inChapters 2 and 3. In addition to the broad incentive framework, however, itis important to make sure that all actors in the economy are treated fairly,and that small or nascent entrepreneurs are not iLnadvertently handicapped byGovernment institutions or policies that favor larger firms or particularregions of the country. To address these concerns, level playing fieldinitiatives need to be taken in four broad areas: (a) trade policy; (b) thelegal and accounting framework; (c) credit; and (d) the interface between theGovernment and the private sector.
6.16. Trade and Investment Policy. One of the most powerful influences onthe distribution of gains from growth is trade and investment policy. The
2/ This does not apply to foreign banks. They are required to extend 50% oftheir lending for export-oriented projects.

- 123 -
Government's deregulation measures in these areas have wldened opportunitiesand fostered wage and employment growth among unskilled laborers. Thecombination of lower tariffs, and fewer non-tariff barriers has alsodramatically reduced the ability of protecte4 industries and privilegedtraders tc nake supernormal profits. In doing so, it has lowered prices todomestic co..sumers and increased prices paid to many producers of exportgoods, especially small farmers. To facilitate investment in the OuterIslands, the Ministry of Industry and the Investment Coordinating Board havealso recently simplified their licensing procedures by transferring part oftheir authority to regional offices.
6.17. A number of distortions in trade and investment policy still hinderequity goals, however. For example, a number of sectors are still closed tonew investment, Pnd in many of these sbctors a small number of firms,sometimes public enterprises or large conglomerates, control a large part ofthe domestic market. Sectors closed to investment (e.g. food and beverages)also tend to be more highly protected from international competition by eithernon-tariff barriers or high tariffs. In thG most extreme cases (e.g., thesteel, automotive, and some electrical equipment industries), imports arebanned altogether or can be undertaken only by those firms that also producethe goods domestically. In other cases, such as palm oil refining, investmentrestrictions have prevented the development of refinery capacity in the OuterIslands, where it would be more efficient.
6.18. Moreover, several recent policy measures run counter to the generalthrust of the Goverrnent's deregulation program and mat_ have adverse effectson equity and income distribution. The ban on exports of raw and semi-processed rattan in mid-1988 has reduced incomes of farmers in several OuterIsland provinces (see Box 6.1). The prohibitive export tax on sawn timber,levied in late 1989, has driven a number of small saw mills out of business.The recent creation of a monopoly on domestic clove trading (see Box 3.1 inChapter 3) is likely to hurt small farmers in the medium-to-long term. Anumber of other export restrictions (e.g. on palm oil and low-grade coffee andrubber) also may reduce the incomes of small farmers. These restrictionstypically reduce the farmgate price of crops grown on the Outer Islands whilelowering input costs to manufacturers on Java, thereby aggravating inter-regional disparities as well.
6.19. The development of the Outer Island economies is also impeded by alarge number of local-level regulations and restrictions on economic activity,particularly inter- and intra-provincial trade. For example, both the CentralGovernment as well as many provincial governments levy taxes on the movementof copra. "Customs" fees on rattan in West Kalimantan ports increasetransport costs to Java by 200%. If buffalo are moved across kabupatenborders by truck in South Sulawesi, a large fee must be paid to the provincialgovernment. Consequently, many traders move their buffalo by foot, causinglong delays and significant weight loss. Cattle cannot be exported directlyfrom East Timor, but must be trans-shipped through Java, which increases costsand also shifts value added to Java. Such impediments to trade add to thenatural distance and infrastructure constraints in the Outer Islands, makingit difficult for remote regions to exploit their comparative advantage.
6.20. Local governments technically are required to get the approval of theCentral Government prior to imposing taxes on the movements of commodities.In some cases local governments can bypass this requirement by referring to

124
Box 6.1: DISTRIBUTIONAL EFFECTS OF RATTAN TRADE POLICY
To encourage the growth of the local rattan furnitureindustry, the Government has banned all exports of raw and semi-finished rattan products. By providing heavy protection to therattan manufacturing industry, the bans have led to higher output andexport of finished rattan products, but the bans have also had aregressive impact on income and regional distribution. The furnituremanufacturers who benefit from the export restrictions are mostlybased in Jakarta and Surabaya and are owned by large investors. Bycontrast, those hurt by the restrictions have primarily been low-income farmers and traders on the Outer Islands, particularlySulawesi, Kalimantan, Sumatra, and Nusa Tenggara Barat.
Case studies carried out in 1990 in West and CentralKalimantan indicate that, following the 1988 ban on semi-finishedrattan, the farmgate price of rattan fell by 24% to 68% in fcurvillages, decreasing farmers, total income by about 35%. In one ofthe villages, an estimated 70%-90% of all farmers have ceasedharvesting rattan due to the low prices. The fall in demand andfarmgate prices has also hurt local traders and processors. Tradersin two of the villages have gone out of business altogether, andthose in the other villages are trading much lower volumes thanbefore. Most local processors have also gone bankrupt or are rumulingat far below capacity. One of the largest processors saw a declineof 50-80% in orders from Java and laid off over 1,000 (out of a total1,200) workers, many of them women. The only processor operating atfull capacity is one owned by a major rattan furniture manufactureron Java.
the charges as administrative service "fees," which can be imposed on theauthority of the provincial governor. In practice, however, many of thesefees are set at levels much higher than the actual cost of services rendered,making them valuable sources of official and unoificial revenue. TheGovernment is aware of this problem and has sent directives to provincialauthorities instructing them to reduce certain local trade barriers. Therevenue structure of local governments is also being reviewed, and draftlegislation to reform the existing system is being prepared. From an equitystandpoint, it will be important that reforms to the existing system eliminatetaxes and fees that hinder inter- and intra-provincial trade while maintaining(and preferably increasing) resource mobilization by local governments.
6.21. Legal and Accounting Framework. There has been some discussion inIndonesia regarding a possible anti-trust law to prevent excessiveconcentration and "unfair" trade practices. Experience in other countriesindicates that anti-trust laws are difficult to devise and administer, sincewhat constitutes "excessive" concentration and "unfair" trade practices variesby industry and is hard to define precisely. Firms in some industries must befairly large to achieve economies of scale. In any case, effective

* 125 -
administration of a complex anti-trust law requires a sophisticated and well-functioning court system. In the absence of such a court system, the lawmight actually prove counterproductive if its enforcement were undulyinfluenced by the more powerful economic actors or if it were used against newentrants only. In the short-to-medium term, further deregulation of trade andinvestment policy, as discussed above, is a much more promising approach topreventing excessive concentration and monopoly pricing. More basic reformsof the legal and accounting system would be essential prerequisites beforeattempting to design anti-monopoly legislation in Indonesia.
6.22. The discussion of the legal and accounting framework in Chapter 3concludes that major reforms are needed to ensure the efficient development ofthe private sector. Such reforms would also promote equity. A strengthenedlegal system would promote a level playing field by improving the balance ofeconomic power between small and large firms. For example, large firms oftenhave the ability to enforce agreements through economic sanctions, somethingthat smaller firms usually cannot do. Smaller firms' uncertainty over theirability to enforce contracts through the court system substantially increasestransaction costs. These costs not only reduce profitability, but they makeit difficult for smaller firms to expand rapidly, since the breach by acustomer of a single large contract can lead to bankruptcy. To the extentthat the lack of an enforceable contract law increases transactions costs forlarge firms as well, they have an incentive to avoid subcontracting to smallerfirms.
6.23. Larger firms also have better access to information through theirnetworks of business connections. Smaller firms and individuals are forced torely on limited public information, and the accuracy of available informationis often questionable. More comprehensive disclosure and standardizedaccounting rules would improve the quantity and quality of public information,thus reducing risk to smaller firms.
6.24. Devising and enforcing appropriate environmental standards can alsohave a positive impact on the wel£are of the lower income classes, who areoften disproportionately affected by pollution and other environmentaldegradation. For example, the poor depend heavily on untreated water sourcesfor drinking, cooking, and bathing, and the current levels of water pollutionin rivers--especially in urban areas--already threaten the health (and,consequently, labor productivity) of many poor families. Without enforcementof appropriate effluent standards, the situation will deteriorate further. Inrural areas, the poorest families are often located in fragile upland areas ornear forests. Soil erosion, caused by poorly defined property rights, anduncontrolled commercial forest exploitation can significantly affect theincome and welfare of these families.
6.25. Credit. An improved legal framework would also help equalize accessto the credit market in Indonesia, which is important because of the role ofcredit in accumulating assets and increasing future income. The range ofinstruments that can be used as collateral for loans in Indonesia is extremelylimited, and neither land titling nor property registration is well developed.In the absence of enforceable credit agreements, banks reduce their risk tothe extent possible by relying on personal and corporate guarantees and on thereputation and business links of borrowers. Larger, well-established firmsthus enjoy easier access to credit than smaller firms and new entrants, whichare either denied credit or face much higher interest charges.

- 126 -
6.26. Past attempts to target low-income borrowers with subsidized loanshave failed in Indonesia as almost everywhere else in the world. Defaultrates have been high and many of the benefits have accrued to higher-incomeborrowers, who have been able to influence the allocation of the limitedsubsidized funds. Recognizing this, the Government has been phasing outsubsidized credit programs in favor of schemes such as BRIPs highly successfulKUPEDES program, which provides small loans at market interest rates whilekeeping transaction costs to a minimum. While most subsidized credit programshave now been eliminateA, several remain. These programs tend to impede thedevelopment of viable, market-based term-lending instruments for theactivities involved. In addition, some programs in the estate crops andforestry sectors provide substantial credit subsidies to relatively largefirms. These programs should be re-examined to see whether their objectivescould be met at a lower cost.
6.27. The rapid increase in the number of bank branches following the 1988banking reforms should help reduce transaction costs by bringing banks closerto potential customers. The added competition in the banking sector as awhole should also induce more lending to small-scale firms. Another way ofencouraging more small-scale lending would be to allow banks that specializein small loans to securitize and sell some of these loans to other banks.This would enable the banking sector as a whole to meet the Government's 20%small-loan guideline while maintaining the efficiency benefits of bankspecialization. The new initiative to revitalize the village banks also hasthe potential to increase lending and deposi; services to small borrowers.This initiative would be facilitated by an improved regulatory framework thatclarified supervision responsibilities and set out specific guidelines for therevival of inactive banks and the eventual establishment of new ones. A keyto the financial viability of the village banks will be providing them theability to mobilize voluntary savings at positive real interest rates. Thepromotion of credit unions may also hold promise for extending financialservices to small borrowers and depositors. There are almost 1,500 creditunions in Indonesia, and many of them have been successful in making loans forhousing and education. Currently these credit unions are recognized only asfoundations (yayasan), because they generally are too small to meet theminimum capital standards set for financial institutions. It may beworthwhile to consider flexible application of these standards to creditunions so that they can profit from better integration with the rest of thefinancial sector.
6.28. Government-grivate sector interface. Although the role of the publicsector in the economy has been declining, it still accounts for about 40% oftotal fixed investment in the economy each year. The awarding of Governmentcontracts can thus have a major effect on the distribution of income andassets and the perception of equity. The Government has taken steps tostreamline and rationalize its procurement procedures, and written guidelinesare quite strict regarding the minimum number of bidders, evaluation criteria,etc. Implementation of these guidelines has been uneven, however, withsmaller firms sometimes complaining that larger companies are able toinfluence shortlists and evaluation procedures. In some cases, directappointments of contractors have been made for large projects. Strong effortsare needed to ensure that the Government maintains an "arm's-length"relationship with the private sector to ensure an equal opportunity for allqualified bidders. The duty drawback scheme, administered by BAPEkSTA, is an

- 127 -
excellent example of how governments can maintain such a relationship with theprivate sector (see Box 6.2).
Box 6.2: BAPEKSTA:
MAINTAINING AN "ARM'S LENGTH" RELATIONSHIP WITH THE PRIVATE SECTOR
An important factor in Indonesia's export performance in thepast five years has been the duty exemption and drawback scheme forexporters, which was redesigned by the Government in 1986, and isadministered by BAPEKSTA. The current scheme demonstrates howgovernment agencies, by insulating themselves from private sectorpressure, can ensure that a program's objectives are met. The mainadministrative features of the scheme include: (a) no direct contactbetween BAPEKSTA staff and exporters; (b) minimal staff discretion inthe evaluation process; and (c) a commitment to evaluate allapplications within a fixed period. These procedures promoteefficiency as well as fair treatment of all exporters.
Prior to the current scheme, the regulations on dutyexemptions were complex and subject to lengthy negotiation withofficials at three Government agencies. Under the current scheme, theregulations are relatively simple and well publicized, and allapplications are handled expeditiously by a single agency. To applyfor duty relief, an exporter submits an application form and a smallnumber of documents either by mail or in person at a special window.Exporters are encouraged to submit the application on a computerdiskette using a special software program provided free. The clerkswho receive the documents only issue receipts; they are not involved inevaluating the applications, which are reviewed by staff members whonever come into contact with the exporters. If exporters havequestions, special staff not involved in the evaluation process comedownstairs or speak to the exporter by phone.
Computers are used to check the application and to calculatethe duty exemption. Staff members verify only the documents thatcannot be computerized. If the application is incomplete or otherwiseunacceptable, BAPEKSTA informs the exporter in writing (usually bytelex or fax). Contact by phone can be made only as a last resort, bydesignated higher-level officials, in accordance with strictguidelines; contact in person is never allowed. When the applicationis in order, payment is transferred directly into the exporter's bankaccount.
6.29. A related issue concerns joint ventures between public enterprises(PE) and the private sector. Although such joint ventures have the potentialto increase efficiency and may also provide an interim step towardprivatization of some PEs, care should be taken to ensure that large

- 128 -
influential firms do not get special treatment. Vigorous competition needs tobe encouraged through negotiation with several potential private partners, allof whom must be provided with full information about the proposed venture,including an accurate valuation of the PE assets involved. The regulatoryenvironment applying to each joint venture should also be thoroughly reviewedto make sure that the private partner does not benefit unfairly from specialprivileges accorded to the PE. A procedural framework is needed to addressthese issues in an orderly and consistent manner for all joint venture andprivatization activities.
6.30. Given the need to expand infrastructure and services to accommodaterapid growth, the Government is looking at ways to increase private provisionof public goods. As discussed in Chapter 5, there are many areas where theGovernment can effectively subcontract certain infrastructure investment andservices to the private sector. This type of subcontracting typicallyinvolves very large projects or complex, long-term service agreements,however, and thus special care needs to be taken to ensure that financialarrangements do not enable the chosen private firms to make supernormalprofits at the expense of the Government and public (see Box 5.1).
6.31. One common theme that applies to all level playing field initiativesis transparency. The potential for an equitable distribution of benefits inany area is significantly enhanced when decisions on legal cases, tradelicenses, franchises, tenders, joint ventures, etc. are made in a transparentfashion. Even when decisions are made on the basis of strict guidelines,failure to keep the public fully informed may lead to perceptions ofunfairness. Maximum effort is needed to make decisions in accordance withclear criteria and then to publish the results of these decisions regularly.For example, one way to increase transparency in the allocation of tradelicenses and quotas would be to use an auction system. This would reduce bothadministrative discretion and the supernormal profits that often accrue underthe existing allocation schemes. It would also raise Government revenue.
E. Fiscal Policy Measures
6.32. Fiscal policy is an important tool of the Government to help ensure amore equitable distribution of income and assets. Over time, fiscal policymeasures can help move the distribution of income and assets gradually in thedesired direction and can be used to help meet the needs of the poor. Twoareas are especially important: (i) taxation policy, particularly thepersonal income tax and the property tax; and (ii) expenditure policies inhuman resources development, agriculture, and transfers to local governments.
6.33. Taxation Rolicy. The Government undertook a comprehensive and far-reaching reform of the tax system during the mid-1980s. In addition toimproving the efficiency of Indonesia's tax system, the tax reform of the mid-1980s was also designed to improve the equity of the system. Since theimplementation of these tax reforms, the Government has concentrated onimproving tax administration. However, further improvements in taxadministration are needed to ensure that the equity goals of the tax reformare fully realized. First, while significant improvements in income taxcompliance, both personal and corporate, have been achieved, compliance ratesremain low. For the personal income tax, estimates for 1988/89 indicate that

- 129
only about half of potential tax revenues are collected. In particular,non-compliance for the personal income tax is relatively high in the group ofself-employed with high incomes. Regarding the corporate income tax, a largeproportion is paid by public enterprises. This suggests that a significantpart of the private corporate sector remains outside the tax system. This issupported by the fact that only about half of the registered corporatetaxpayers filed returns in 1989. Second, our analysis of the property taxindicates that compliance is also low in the relatively wealthier urban areasand for commercial pioperties. Therefore enforcing compliance with theexisting tax system will ensure that the equity goals of the tax system arerealized and will generate revenues that could be directed toward improvingthe welfare of lower income groups. In addition to improving compliance, the
equity of the existing tax system could be enhanced further by raising luxurytax rates and the effective rate of property taxation, as well as reviewingthe role of capital gains and inheritance taxes.
6.34. The role of tax incentives should be assessed carefully. TheGovernment has recently taken several measures to promote investment in theeastern areas of Indonesia. Firms will be allowed to carry forward tax lossesfor eight years instead of the usual five. They will also be given a fiftypercent rebate on the property tax for eight years and in East Timor, atemporary reduction on duties on imported goods. The benefits and costs ofsuch tax incentives, including the potential loss of local governmentrevenues, should be carefully reviewed. In the meantime, removing localrestrictions and levies on trade is likely to have a greater effect onpromoting development in the Outer Islands.
6.35. Expenditure policies. Expenditure priorities can be enhanced inthree areas: (i) human resource development; (ii) the agricultural sector;and (iii) transfers to local governments. Human resource development improvesthe immediate well-being of the poorest members of society and increases their
capacity to take advantage of the wider opportunities created by privatesector development. It also enhances the growth prospects of the economy byproviding a pool of skilled labor upon which private industry can draw.Progress in human resource development requires a long-term commitment to
making education, health care, family planning and basic social services--water supply, sanitation, and other related infrastructure--accessible to all
levels of society. In urban areas, increased funding for the KampungImprovement Program (KIP) could be an important vehicle for improving deliveryof these service;s to the poor.
6.36. The Government emphasized the importance of improving human resourcedevelopment in REPELITA V. Improvements in this area would involve threebasic thrusts. First, it would direct public expenditures towards thesesectors and also slant the allocation of funds within these sectors towardsthe poor by emphasizing, for example, preventive over curative health care,basic education over higher education, and water supply and sanitation overlarge urban transit systems. Second, institutional changes may be needed toensure that delivery systems are effective in reaching the poor. Third,community groups could be more actively involved in the planning andimplementation of these social programs, in order to increase participationand to reach lower-income groups more effectively.
6.37. Aericultural development programs can also be a powerful tool for
improving equity. The Government's rice intensification program was closely

- 130 -
correlated with the dramatic decline in poverty from 1976-84, and detailedanalysis of the period 1984-87 reveals that 60-70% of the decline in povertycame from households primarily engaged in agriculture. About half of allremaining poor households are still in the agriculture sector, however. Thesehouseholds tend to have very small landholdings or be landless, to cultivate avariety of secondary food crops or be fishermen, and to be located inresource-poor or remote areas. A large proportion of these households havenot been reached by Government extension efforts, since the focus ofagricultural support services has been mostly on irrigate'd rice cultivation,which is not economically viable in most of the areas where the poorestfarmers reside.
6.38. Given their meager resource base, these poor households needeventually to move out of the agricultural sector altogether. In the short-to-medium term, however, their incomes could be improved through enhancedGovernment efforts to target research and extension efforts to the particularcircumstances of these households. The complexity and heterogeneity of uplandand Outer Island farming systems presents a major challenge to the currentstructure of agricultural support services. The Government has already begunto establish a network of rural extension centers that would provide advice ondifferent types of crops as well as livestock and fishing. However, theresearch system needs substantially more resources, as well as a fundamentalreorientation of programming and administration, before it will be able todevelop viable technical packages that can be extended to low-income farmers.
6.39. As part of the Government's overall strategy, measures will be neededto stimulate income-generating activities and employment, particularly inpoorer areas. Central Government transfers to local governments, particularlythe INPRES program, are an important vehicle to create employmentopportunities in these depressed areas. These programs, which have been amajor factor in the poverty reduction achieved in the past two decades, havecreated social and physical infrastructure and provided O&M funding, usinglocal labor and materials in labor-intensive construction projects.Concentrating and augmenting Central Governments transfers, particularly theINPRES, in the relatively disadvantaged areas--a process which the Governmentinitiated in the 1990/91 Budget--would contribute positively to incomedistribution in three ways. First, these programs will directly provideemployment to unskilled and semiskilled workers at low wages in low incomeareas. Second, these programs will be an important factor in fosteringeconomic growth in those areas where private sector activity is relativelysmall and the ability of local governments to generate their own resources isextremely limited. Finally and more importantly, physical and socialinfrastructure will be created in these areas. Further refinements to theallocation criteria, particularly for the INPRES programs, may be warrantedgiven Indonesia's changed economic structure, in order to achieve Indonesia'sequity and regional development objectives effectively. As a greater share oftransfers are devoted to low income areas, the effectiveness of theseresources can be enhanced by improving local administrative capacity and bygranting local officials more flexibility in the use of these funds.

- 131 - Annex 1Page 1
RECENT ECONOMIC DEVELOPMENTS
Economic Activity
1. Indonesia's gross domestic product grew by over 7% in 1990 for thesecond straight year (Table 1). Slower growth in the agriculture and miningsectors was offset by higher growth in manufacturing and continued strongperformance in oil/LNG construction, and other services. The manufacturingsector, which constitutes only 15% of GDP, contributed more than 25% of thegrowth in the economy.
Table 1: GROWTH IN SECTORAL VALUE ADDED, 1975-1990 /a(% p.a. at 1983 prices)
SectorShares
Average in 19901975-83 1983-86 1987 1988 1989 1990 (% of GDP)
Oil/LNG Sectors 22 3.3 1], 6 .Q6 4.1 4.1 18.Oil & gas 0.3 0.3 -0.1 -3.5 4.8 2.7 13.8LNG & refined oil 14.9 20.0 8.3 9.7 1.7 8.6 4.4
Non-Oil Sectors 70 5.6t 7.4 8.2 7.8 8I.8Agriculture 3.5 3.7 2.1 4.7 4.3 2.5 19.7Mining 6.8 2.2 7.0 4.8 11.0 4.1 1.2Manufacturing 10.6 12.2 11.4 12.8 11.6 12.8 14.9Construction 10.8 0.1 4.2 9.5 11.8 12.1 5.7Other services 8.6 5.8 6.4 6.9 8.5 8.2 40.3
Gross DomesticProduct (GDP) i_L ILI 4.9 Z 7.4 2_I 1QL0.
LA In 1989, CBS released new GDP estimates for the years 1983-1988. Theseries prior to 1983 has not been revised, however, so the average growthrate for 1975-83 is derived using the 1983 production level from the oldseries, which is at constant 1973 prices.
Source: Central Bureau of Statistics (CBS) and World Bank staff estimates.
2. The oil/LNG sector continued growing by about 4% in 1990. However,the composition of this growth changed. In 1989, growth was due primarily toincreased production of crude oil and natural gas, with low growth in both therefinery and LNG subsectors. In 1990, oil fields were already running nearcapacity, so crude oil production could be increased only slowly, despite thelifting of OPEC quotas in August. However, production increased substantiallyin the first quarter of 1991. Natural gas production increased rapidly in thesecond half of the year as several pipelines came into operation. Refineryproduction increased by over 10% for the year, as throughput was increased to

- 132 - Annex 1Page 2
meet growing domestic demand for fuels. The March 1990 inauguration of afifth LNG train in Bontang, East Kalimantan made possible 6% growth in LNGoutput for the year.
3. Growth in the non-oil sector was sustained at about 8%, despite lowergrowth in agriculture. The surge in investment following deregulationcontinues to be reflected in the expansion of the manufactuxin sector, whichgrew by nearly 13% in 1990. The footwear and textile industries grew rapidlyand exported most of their additional output. Automobile production alsoincreased sharply in response to high domestic demand. Production of basicchemicals rose substantially as well.
4. Growth in the construction sector remained high, reflecting the boomin commercial property development as well as continued investment in the roadnetwork. Growth in this sector may have been constrained, however, by ashortage of both expertise and raw materials, including cement. Otherservices also continued to expand rapidly. Growth in the banking sector wasslower than in 1989, the year following the reforms, but it still exceeded12%, as banks expanded credit rapidly in a bid to gain market share. Overalleconomic growth, combined with the expanding road network, led to 9% growth inboth trade and transportation. Value added in hotels and restaurants was up8% but would have been substantially higher if tourist arrivals had not beenadversely affected by the Gulf Crisis.
5. Growth in agriculture, which makes up one-fifth of total GDP, fellfrom 4.3% in 1989 to 2.5% in 1990. The biggest factor in this slowdown waslower growth in rice production, which accounts for over one-quarter ofagricultural GDP. Adverse weather conditions, pest attacks, and a December1989 harvest that included some areas that would normally have been harvestedin January 1990, combined to reduce rice output growth to 1%, compared to over5% in 1989. Production of corn was up over 9%, and intensified extensionefforts for soybeans, combined with the Government's policy of maintainingproducer prices well above world levels, helped production grow by over 5%.By contrast, production of cassava fell by 9% after several years of rapidgrowth, as Indonesia's EC quota finally became binding. Sweet potatoproduction also fell by over 12%.
6. Growth in many non-food crops was also slow, especially onsmallholder farms. Production of tea was down 7%, and rubber output grew lessthan 5%, reflecting an aging tree stock, the continuing lack of an effectivereplanting scheme, and lower prices. By contrast, the maturing of private oilpalm estates planted in the second half of the 1980s made possible growth ofover 16%. Copra also performed well (10% growth), rebounding from theprevious year's 3% production decline.
7. Fishery output continued to grow at 5%, the average for five years.This growth continues to come mostly in captive fisheries, as exploitation ofmarine and open inland fisheries have neared or exceeded sustainable levels inmany areas. Shrimp production, in particular, continued to rise despite lowerworld prices. Growth in the livestock subsector accelerated from 5% in 1989to 7% in 1990, with poultry production continuing to expand rapidly. Forestryproduction growth slowed from nearly 7% in 1989 to about 4.5% in 1990. Amajor factor in the decline was the imposition of a prohibitive export tax inlate 1989 on sawn timber.

- 133 - Anex 1
Page 3
8. Income and Expenditure. Gross National Income (GNY) rose by about 84in 1990, as GDP growth remained high and oil prices rose substantially due tothe Gulf Crisis (Table 2). Consumption and investment were also higher in1990. Government consumption rose by over 6.5% as higher world oil prices ledto a much larger subsidy on domestic fuel prices. A 10% pay raise forGovernment employees also took effect in January 1990. Private consumptionincreased by about 8%, which was facilitated by rapid growth in domesticcredit. Fixed investment growth was the fastest of the decade. Higher oilrevenues allowed Government and public enterprises.to increase capitalspending by almost 10%, and the continuing effects of deregulation led tonearly 20% growth in private investment.
Table 2: INCOME AND EXPENDITURE, 1975-1990(at 1983 prices)
Growth rates (% R.a._ 1990Average Average Share in1975-83 4a 1983-86 1987 1988 1989 1990 L: GDP (%)
Consum=tion gL9 4.1 3.9 4.3 5.9 7.9 ALI- Public 8.5 3.6 -3.7 2.6 6.6 6.6 8.8- Private 11.9 4.2 5.1 4.6 5.8 8.1 60.9
Fixed investment 10.7 -5.7 2.6 10.3 13.0 16.2 21.- Public 12.6 b -9.6 -7.7 11.4 6.8 9.6 7.2- Private 9.1 A -2.4 10.1 9.7 16.8 19.9 13.9
GDP 6.5 la 4.9 5.7 7.4 ZA 10Q.0GNP 6.4 5.5 5.4 6.0 7.4 7.2 96.7GNY 8.5 2.5 5.9 6.2 7.7 8.2 90.4
La 1975-83 average is at 1973 prices.A& 1978-82 only, and at 1983 prices./c Preliminary.
Source: Central Bureau of Statistics and World Bank staff estimates.
Ih-c Balance of Payments
9. Since Indonesia's economy is very open, much of the domestic demandpressure translated into pressure on the balance of payments during 1990/91,when the non-oil trade deficit widened sharply. Non-oil export growth slowedmarkedly because of: a sharp downturn in commodity prices; diversion ofexports into the local market; and some special factors, such as the emergenceof capacity constraints in some manufacturing activities, productiondifficulties (e.g. aluminum), and the imposition of a prohibitive export taxon sawn timber. Non-oil imports rose rapidly. Capital goods imports showedthe largest increase, reflecting the rapid rise in private investment. But

- 134 - Annex
Page 4
Table 3: BALANCE OF PAYMENTS, 1986/87-1990/91(US$ billion at current prices)
Actual Estimated1986/87 1987/88 1988/89 1989/90 1990/91
Merchandise exports (fob) 1LI Z.3 19.8 236Oil & LNG 7.0 8.8 7.6 9.3 12.6Non-oil 6.7 9.5 12.2 14.3 15.5
Merchandise imports (cif) -12.8 -14.9 -16.2 -19.5 L26.0Oil & LNG -2.4 -3.1 -2.6 -3.1 -4.2Non-oil -10.4 -11.8 -13.6 -16.4 -21.8
Trade balance 0.9 3.L 2.LJL
Non-factor services (net) -1.5 -1.2 -1.2 -1.2 -0.7Interest payments (MLT) -2.5 -2.7 -3.0 -3.1 -3.1Other factor services andtransfers (net) -1.1 -1.4 -1.3 -1.6 -2.1
Current account balance -4.2 -1.9 -1.9 -1.8 -3.8Oil/LNG current account 2.6 3.6 3.0 3.9 5.9Non-oil current account -6.8 -5.5 -4.9 -5.7 -9.7
Public MLT loans (net) LA Li ill 0.5Disbursements 5.2 6.0 7.3 6.1 4.9Principal repayments /a -2.8 -4.2 -4.1 -4.6 -4.4
Other capital (net) -0.7 1.0 -1.6 0.3 7.4
Use of net foreign assets 2.5 -0.9 0.3 00 -4.1Use of official reserves 0.7 -1.0 0.6 -0.3 -3.4Usie of comm. bank reserves 1.8 0.1 -0.3 0.3 -0.7
Memo items:Net official reserves(US$ bln.)Lk 5.0 6.0 5.4 5.7 9.1
- Months of imports /c (4.1) (4.4) (3.3) (2.6) (3.9)Total net foreign assets(US$ bln.) 10.0 10.9 -d 10.6 10.6 14.7
Current account/GNP (%) -5.9 -2.6 -2.3 -2.0 -3.8Non-interest current accountbalance (% of GDP) -1.7 1.9 2.1 2.2 0.1
MLT debt service/exports (%) /e 39.7 34.8 34.4 31.6 27.3
La Includes prepayments of US$626 million in 1987/88, US$341 million in1988/89 and US$300 million in 1989/90.
4L Net official reserves are defined as gross official reserves minusoutstanding liabilities to the IMF and other short term liabilities.
ic Net official reserves in months of next year's expected imports (oil/LNGand non-oil) of goods.
Ld Excludes US$326 million of prepayments, committed during the year but notcompleted until June 1988.
La Debt service on public and private debt, excluding prepayments;denominator is gross exports of goods and services.
Source: Bank Indonesia and World Bank staff estimates.

- 135 - Annex IPage 5
consumer goods imports also continue to grow rapidly, albeit from a smallbase. Although the brisk pace of economic activity and private sectorinvestment largely explain the surge in non-oil imports, monetary policy inlate 1989 and early 1990 also accommodated these trends. The higher importbill was partly offset by higher earnings from oil/LNG due to higher oilprices and oil production as a result of the Gulf crisis. The oil/LNG currentaccount surplus improved to US$5.9 billion in 1990/91, about US$2.0 billionhigher than in 1989/90. Net non-oil service receipts remained at roughly thesame level as 1989/90. The overall effect of these factors was that thecurrent account deficit widened to US$3.8 billion (about 3.8% of GNP), roughlydouble the 1989/90 level.
10. There were important changes in the sources of financing of thecurrent account deficit during 1990/91. Gross public disbursements declinedto US$4.9 billion in 1990/91, substantially lower than in 1989/90. As aresult, net disbursements were only slightly positive. This primarilyreflected a fall in special assistance and a large decline in the use ofcommercial credits. A substantial increase in private capital inflows was themain source of balance of payments financing during 1990/91. Data onfinancial commitments between the private sector and offshore financialinstitutions indicate that disbursements of private debt were aboutUS$6.0 billion, which implies a doubling of the level of private non-guaranteed debt during 1990.1/ This increase in private non-guaranteeddebt and the rapid growth in capital imports reflected the strong investmentdemand discussed earlier. While the majority of the inflow was related toprivate investment, state and private national banks both borrowedsubstantially abroad in order to lend to domestic customers.2/ Much ofthe private foreign borrowing was swapped with Bank Indonesia (BI), leading toa sharp increase in swaps outstanding with BI. Higher private inflows and areduction in the net foreign assets of commercial banks more than offset thedecline in public debt flows and the current account balance. This allowedBI's net official reserves to increase to US$9.1 billion, 3.9 months of nextyears, expected imports. However, about half of these reserves are swaps,which are a contingent liability of Bl.
11. Exorts. Due to the Gulf Crisis, crude oil prices averaged aboutUS$23/barrel in 1990/91, compared to US$18/barrel in 1989/90. Prior to thecrisis, prices had fallen to under US$15, but the August invasion of Kuwaitcaused prices to double, with prices peaking at nearly US$35 inOctober. The cessation of hostilities in the Gulf in late February broughtthe price down below US$20. The lifting of OPEC quota restrictions in Augustallowed Indonesia to increase its oil exports (including refined products) by6%, to about 369 million barrels in fiscal year 1990/91, with much of thegrowth coming in early 1991. The combination of higher prices and higher
j/ These disbursements show up both in direct borrowing overseas by privatefirms (shown as other capital (net)) and direct borrowing overseas bybanks which is shown under use of commercial bank reserves in thebalance of payments.
2.1 A portion of this lending, particularly from the private national banks,was for consumer loans and real estate transactions, particularly in thefirst half of the fiscal year.
- 136 - Annexl
Page 6
quantities increased oil export revenues by 33%, to US$8.3 billion for thefiscal year. Export revenues from LNG and LPG rose by about 42%, reflectingboth price and volume gains.
12. In 1990/91, non-oil export revenues grew in nominal terms by 8.5%,only about half as fast as the previous year and a third as fast as theaverage over the last two years. The poorest performance was in agriultuAralexports, where a prohibitive export tax on sawn timber caused sawn timberexports to fall by 95% in real terms and about US$500 million (87%) in nominalterms. Exports of other non-manufactured timber products were up slightly,but total export revenues from timber products were down about US$450 millionfor the year. The Gulf Crisis disrupted exports of tea, which fell over 20%in both real and nominal terms. Declining prices for rubber and oil palmcaused export revenues to fall slightly, despite strong growth in exportvolumes. The only major commodity that showed increased export revenues wasshrimp, which was up by 14%. Shrimps now contribute 15% of total agriculturalexport revenues, compared to less than 7% in 1982/83.
13. Total export volumes of minerals and metals changed little from theprevious year, but lower prices caused a 15% drop in export earnings innominal terms. A contractual dispute and production problems reduced exportvolumes of aluminum by 35%, which, together with lower prices, caused exportrevenues to fall by over 40%. Nickel prices fell by nearly 50%, which morethan offset the 12% increase in export volumes.
14. The only category of exports that grew significantly in 1990/91 wasmanufactured goods, which now make up two-thirds of total non-oil exports(versus about one-fourth in 1983/84). Export revenues in 1990/91 were upnearly 25% (US$2.0 billion), but this growth rate was still well below the 36%average rate achieved over the previous two years. Higher unit valuescontributed much of the revenue increase in 1990/91, but volumes were also up15%. Textile export revenues continued to grow rapidly (36%), as Indonesiasuccessfully exploited a number of non-U.S. markets. Plywood exports grew byabout US$400 million (17%).
15. Growth in exports of many "other" manufactured goods sloweddramatically or was even negative in 1990 (Table 5). The main reason for thisslowdown was a diversion of production to the rapidly expanding domesticmarket, especially the construction sector. Exports of iron, steel, and metalproducts were down about 40%, while exports of cement fell 25% in response toa surge in demand in the domestic market, which caused shortages toward theend of the year. But there were several exceptions to the general trend.Large increases in capacity allowed footwear exports to more than double tonearly US$500 million. The heavily protecte&furniture sector also increasedits exports by more than 50%. Exports by the emerging plastics sector were up30%.

- 137 - AnPage 7
Zeble 4: NON-OIL MERCHANDISE EXPORTS, 1983/84-1990/91
Value at current prices Growth in volume terms(USS million) (% g.a)
Actual Estimate 1983/84- 1987/88- 1990/911983/84 1987/88 1989/90 1990/91 1987/88 1989/90 (est.)
AgriulturAalcommodities 3,095 3.852 4.497 3.964 4.0Timber products 582 627 1,024 575 -2.6 -6.6 -52.3Rubber 984 1,055 952 942 1.1 0.8 5.0Coffee 506 497 448 403 -2.1 20.0 -0.3Palm oil 92 214 279 271 26.0 15.7 15.0Tea 156 119 176 136 3.6 8.3 -23.5Shrimp 206 368 513 583 19.9 20.0 7.0Rattan 87 162 0 0 13.0 -100 -
Others 483 811 1,105 1,053 6.5 16.4 -7.6
Minerals & metals 800 1,ll2 1.551 J 1.320 1 6.4 0.Tin 309 143 208 170 -2.6 9.0 4.8Gold - 308 218 240 - -8.9 3.5Aluminum 165 245 267 152 7.9 2.9 -35.0Copper 89 186 321 295 11.0 8.4 0.0Nickel 170 146 373 252 -12.9 9.5 11.7Others 67 83 163 212 -7.3 66.6 34.7
Manufacturedgoods 1.484 4.538 8.445 1Q.447 26.7 31.5 15.3
Textiles 365 t,.,95 2.421 3,282 28.8 36.9 27.5Plywood/panel products 579 1,834 2,430 2,845 24.2 15.0 8.0
Others 540 1,509 3,594 4,320 27.8 42.0 12.0
Total non-oil*3201M S 3Z9 9.502 14.493 15.732 18.6 6.
Source: Bank Indonesia and World Bank staff e2timates.
16. Imports. Non-oil imports grew by about 35% in current terms in1990/91 (Table 6). The most rapid growth was in imports of capital goods,reflecting the continuing response of investors to deregulation. Capitalgoods imports increased almost 60% and contributed two-thirds of the totalincrease in imports. A large proportion of capital good imports wasmachinery, especially for textile and footwear exports. Imports ofintermediate goods grew relatively slowly, partly as a result of the slowdownin non-oil exports.

- 138 - ,Page 8
Table St MUJOR ITS4S WITHIN *OTNU MAIW ACTURED EXKPRT8, 1985-90(US$ million at current prices)
AVg.AnnualAotual G 1g&Jaio Orowth Rata
Products 1985 1986 1987 1988 1N89 1990 1985-90(Z)
Ceramics 0.5 1.2 4.5 14.1 28.6 25.4 128.5Plastics 1.5 12.5 24.7 56.1 77.6 102.4 119.6Sandal, Shoes 8.2 8.8 23.5 82.6 220.4 488.8 93.3Furniture 7.1 9.2 27.2 69.7 153.3 241.0 84.9Other articles ofbasic metal 5.4 1.6 17.4 56.9 90.2 69.1 75.9
Irontsteel 34.2 69.5 196.0 296.2 452.8 271.3 67.6Glass & its product 8.3 12.7 30.7 93.7 91.5 93.0 61.6Rubber products 7.5 11.3 24.2 48.8 72.8 69.5 57.5Paper & its products 20.9 31.8 95.8 138.2 168.3 137.3 51.7Cement 21.5 39.8 56.1 75.6 128.4 96.4 43.0Ptocessed food 56.7 81.5 105.9 139.2 237.4 249.7 33.2Matting 13.3 19.4 47.2 76.4 48.1 36.1 29.4Other 93.8 122.7 91.9 240.7 311.7 382.0 27.2Leathte 6 its product 37.5 43.9 53.8 77.6 84.0 76.0 17.5Fertilizer 80.0 127.3 86.0 134.1 165.4 171.7 15.6Animl feod 90.8 97.8 113.2 147.5 128.7 132.1 7.2Pharmactutical products 6.5 7.0 9.4 15.4 8.0 8.9 4.4
Total of maior itm 4293.5 703.9 1007.7 1762.6 2467.3 2650.5 3A8
Sources Central Bureau of Statistics nd World Bank staff estimates.
Tble 6: NON-OIL MERCLANIO8 IMPOP. 8, 1983184-1990191 lc
Value at current prices Growth Ln current prices(US8 million) X( R.-.)
Actual Estimaea 1983184- 1987188- 1989190-1983184 1987188 1989190 1990191 1987188 1989190 1990191 (est.)
HaMaglurinm 8.79 10.263 14.542 20L022 Li 19.0 S7.7Consumer goods 1,225 1,062 1,599 2,182 -3.5 22.7 36.5Intermdiate goods 3,305 4,343 6,573 7,717 7.1 23.0 17.4Capital goods 4,264 4,860 6,371 10,123 3.3 14.5 58.9
hmigulture An 754 1.12 1.231 22.S 9.
Mining 211 21 294 221 8L1 LA 1Qf*
Zgtal 92.59 11.229 15.96L 21.391 *l
LA Import date from the Central Bureau of Statistics differ slightly from Bank Indonesta data, which areusod in the balnes of payments.
Sources Central Bureau of Statistics and World Bank staff estimates.

Anex1Page 9
As much of the new investment has been in export-oriented industries,intermediate good imports can be expected to grow rapidly in the near future.Growth in consumer imports was over 35%, with especially large increases inautomotive products. Nevertheless, consumer goods imports remained a smallproportion of total imports and contributed only about a tenth of the totalincrease in imports for the year.
17. Capital flows and debt. In aggregate, public MLT disbursementsdeclined by US$1.2 billion, resulting primarily from a substantial decline inthe use of commercial credits (about US$1.1 billion), and lower disbursementsof special assistance (about US$0.4 billion). Repayment of principal alsodeclined, by about US$0.2 billion. Therefore, net disbursements of public MLTwere only US$0.5 billion, a significant decline from previous years. Animportant change occurred in capital flows during 1990/91, as inflows ofprivate capital, both private non-guaranteed debt and direct foreigninvestment, increased substantially. The total debt service ratio fell from31.3% in 1989/90 to 27.3% in 1990/91, reflecting higher total export earnings,particularly higher oil prices.
18. Disbursements of project aid, primarily from the IGGI, increased byabout US$0.2 billion to US$2.4 billion in 1990/91 and accounted for more thanone half of public MLT disbursements. Given the need to maintaindisbursements of official assistance in order to finance higher currentaccount deficits in the near term, it will be important to ensure anappropriate pace of project disbursements. Identifying methods to speed theprocessing of disbursement applications could help in raising projectdisbursements. Such measu: 3s could also help ensure smooth projectimplementation.
19. The provision of sgecial assistance, in the form of fast-disbursingprogram aid and local-cost financing, again made a significant contribution tofinancing the current account deficit. Out of a total of US$1.3 billion inspecial assistance pledged at the 1990 IGGI meeting, actual commitmentsamounted to US$1.1 billion. Total disbursements of special assistance duringthe 1990/91 fiscal year, however, were about US$1.3 billion, reflecting carry-overs from commitments made in previous years. This brings totaldisbursements of special assistance over the past four years toUS$6.7 billion. Special assistance has continued to play a valuable role inhelping the Government push ahead with its trade deregulation measures and infacilitating the recovery of private investment and economic activity. It hasalso enabled Indonesia to improve the term structure of its external debt,while maintaining confidence in financial markets about the viability of theGovernment's adjustment program.
20. There has been a decline in the use of import-related credits inrecent years, with disbursements falling from a peak of US$2.1 billion in1983/84 to an average of about US$600 million in the last two fiscal years.This trend reflects the Government's decision to reduce public investment inlarge capital-intensive projects and to place strict limits on the use of non-concescional financing under Presidential Instruction No.8 of 1986 (INPRES 8).Disbursements of untied commercial credits totalled less than US$0.1 billionin 1990/91, a substantial decline from the previous year, when disbursementstotalled about US$1.2 billion. Undisbureed lines of commercial credits roseto about US$2.0 billion at the end of March 1991, reflecting changes in

- 140 - exne
Page 10
exchange rates and the new commercial credit signed during the fiscal year,but not disbursed.
21. Other capital flows i/ were significantly positive. Privatcapital inflows increased significantly during 1990/91. Direct foreigninvestment flows during 1990/91 are estimated at about US$0.9 billion,reflecting the surge in private investment activity particularly from foreigninvestors. Data on private non-guaranteed debt agreements between theIndonesian private sector and offshore financial institutions indicate thatdisbursements of private debt were at least US$6 billion. Roughly half ofthese transactions were with the Indonesian banking sector, including statebanks.V/ The remaining private non-guaranteed borrowings were byIndonesian private sector companies and many of these transactions wererelated to investment activities. These large private capital inflows were insharp contrast to previous years. The inflows of private capital more thanoffset the higher current account deficit. This resulted in a significantincrease in net official reserves from US$5.7 billion in 1989/90 to anestimated US$9.1 billion in 1990/91. However, a significant portion of netofficial reserves are swaps, which are a contingent liability of BI.
22. Indonesia's stock of public and private MLT external debt outstandingrose significantly, from US$48.5 billion at end 1989 to an estimatedUS$56.9 billion at end 1990. Public debt rose 7% to US$46.7 billion,including US$28.9 billion of assistance from the IGGI. Private non-guaranteeddebt outstanding rose to US$10.2 billion at end-1990. Total MLT debt paymentswere US$8.5 billion in 1990 roughly the same level as in 1989. Due to higherexport earnings, the debt service ratio declined from 31.6% in 1989 to 27.3%in 1990. As discussed in Chapter 2, the debt service ratio and other debtindicators are also projected to decline over the medium term.
Budgetary Develogments
23. The Central Government Budget for 1990/91 conservatively assumed anaverage oil price of US$16.50/barrel, lower than the average price for 1989/90of US$17.90. To offset the loss of oil/LNG revenues, the Budget projected an18% increase in non-oil taxes. As shown in Table 7, the stronger non-oil taxeffort was budgeted to allow the Government to finance a higher level of totalexpenditure while maintaining a cautious fiscal stance by holding the budgetdeficit below 2.0% of GDP. The actual revenue outcome is estimated to bebetter than expected, primarily because of much higher oil revenues, but alsobecause non-oil taxes were higher than budgeted. This additional revenueenabled the Government to undertake a sizeable expansion in total spendingwhile running a budget surplus instead of a deficit. Thus, the overall budgetbalance is estimated to have run a surplus of 2.0% of GDP, while the primarybudget balance (net of external interest payments) ran a surplus of 4.6%.
./ As defined in Table 3, other capital flows are a residual item, includingdirect foreign investment, oil/LNG export credits, all private capitalflows, valuation adjustments, and errors and omissions.
i/ BI does not classify borrowing by state banks as public debt.

- 141 - Annex I1Page 11
Table 7: CENTRAL GOVERNMENT BUDGET, 1989/90-1991/92(Rp. trillion at current prices)
1988/89 1989/90 1990/91 1991/92Actual Budget Estimate Budget
Revenues and grants 23.2 3. _42.6 40.2Oil/LNG 9.9 11.8 10.8 18.9 15.0
Non-oil taxes 11.9 15.4 18.2 20.7 22.4
Non-tax revenue La 1.6 2.1 2.6 2.3 2.8
Grants 0.5 0.7 0.0 0.8 0.0
Current expenditures IL. 1. 21, 24.0 24.8External interest 4.3 4.5 5.2 4.8 5.2
Subsidies 1.0 1.5 0.8 4.0 1.4
Other 11.5 13.8 15.7 15.2 18.2
Government savings 7.1 1. 9.9 18.7 15.4
CaRital expenditures 10.6 I. 13. 14.l7 16.9
Budget balance -.35 -1.4 .7L2 4.0
Financed by:External loans (net) 5.O 3.7 1 5
Disbursements 11.5 10.2 11.3 8.8 10.4
- Project aid Al (5.9) (5.1) (7.3) (6.2) (8.8)
- Other /C (5.6) (5.1) (4.0) (2.6) (1.5)
Amortization 6.5 7.6 7.6 8.2 8.9
Asset drawdown -1.5 -1.2 0.O -5.2 /d C_O
Memo items (as % of GDP)Revenues and grants 16.2 17.5 16.1 21.2 18.0
Non-oil taxes /e 10.0 11.2 11.3 12.9 12.2
Government savings 4.8 5.9 5.0 9.5 6.9
Budget balance -2.4 -0.8 -1.9 2.0 -0.7
Total expenditure Lf 18.6 18.3 17.9 19.7 18.7
Net domestic expenditure /g 2.7 2.4 0.9 2.2 1.2
Primary balance /h 0.6 1.9 0.8 4.6 1.7
GDP (Rp. trillion) 147.4 172.1 -- 196.0 221.0
,/a Includes domestic oil surilus in 1989/90 (Budget)a Includes import-related credits./c Includes program loans, rupiat, suppol;t and commercial borrowing.
Ld Includes Rp.2.0 trillion allocated to reserves in the development budget.
ae As % of non-oil GDP.I£ Current plus capital.La Domestic content of expenditure less non-oil revenues.ih Budget balance net of external interest payments.
Source: M'nistry of Finance and World Bank staff estimates.

- 142 - Annex 1Page 12
This surplus offset the decline in financing from net external loansdisbursements (which were Rp.2.5 trillion lower than budgeted), and allowedthe Government to build up its assets by Rp.5.2 trillion.
24. Revenues. Oil/LNG revenues in 1990/91 are estimated to have exceededthe Budget target by 75% (Rp.8.1 trillion), largely because of the steep risein world oil prices in the wake of the Gulf crisis, which averagedUS$23/barrel. Non-oil taxes were also 14% higher than budgeted. Income taxreceipts exceeded the Budget target (increasing by 45% over the previousyear), while VAT and import duties were also significantly higher (by 28% and51%, respectively, over the previous year) because of the rapid growth in non-oil imports. The property tax also exceeded the Budget target, but its yieldremains well below potential.
25. Expenditures. Central Government current expenditures in 1990/91 areestimated to have grown by 21% (Rp.4.2 trillion) over the previous year,mainly because of higher subsidies. Despite the 18% average increase indomestic oil prices implemented on May 25, 1990, oil subsidy paymentsballooned to Rp.3.4 trillion, compared to Rp.0.7 trillion last year. Thisreflected a combination of higher crude oil prices and rapid growth indomestic consumption, which raised the subsidy requirement in 1990/91 toRp.2.6 trillion.5/ In addition, arrears amounting to Rp.0.8 trillion werepaid to Pertamina for shortfalls in subsidy payments made in the previous twoyears. This was slightly offset by a small decrease in the fertilizer subsidy(from Rp.760 billion to Rp.660 billion) resulting from the retail priceincrease implemented in October 1990. The main additional factor underlyingthe rise in current expenditure compared to 1989/90 was the 10% pay increasefor Government employees that became effective in January 1990. This resultedin an increase of Rp.1.4 trillion in payments for Central and RegionalGovernment personnel.
26. The level of capital expenditure in 1990/91 is estimated to beRp.14.7 trillion, higher than the Budget target of Rp.13.6 trillion. This wasmade possible by the Rp.8.8 trillion increase in government savings, whichmore than offset the large decline in net loans relative to the Budget target.As a result, real capital spending rose significantly. However, it remainslower than the level of real capital expenditure achieved in 1985/86.
27. The 1991/92 Budget. In presenting the new Budget, the Presidentaffirmed the Government's commitment to prudent macroeconomic management,noting the need to coordinate fiscal policy with monetary policy to improvethe balance of payments and reduce inflationary pressures. The fiscal stanceadopted in the Budget attempted to reflect these policy concerns by preservingflexibility in the face of uncertainties in the world oil market. At thetime, the Budget assumption of an average oil price of US$19/barrel (aroundUS$4 lower than the likely average for 1990/91 and slightly lower than theWorld Bank's projected price of US$19.4 for 1991/92) appeared conservative.In order to help offset the projected decline in oil/LNG revenue, theGovernment continued to emphasize the need for non-oil revenue mobilization.Together with a budgeted level of net foreign assistance of Rp.1.5 trillion,
./ Oil consumption volume is projected to total 33.6 million kiloliters,or 10% higher than the level of 30.5 assumed in the 1990/91 Budget.

- 143 -Annexl1Page 13
these revenue targets would allow the Government to finat a higher level of
capital spending in real terms to support its infrastrvc :e development and
poverty alleviation objectives. Based on these assumptr .s, the overall
budget balance would switch back to a deficit of -0.7% . GDP (from a surplusof 2.0% oi GDP in 1990/91). Nevertheless, the overall fiscal stance of the
Budget would tighten, with net domestic expenditure projected to fall to 1.2%
of GDP (from 2.2% in 1990/91), and the primary balance would remain in surplus
at 1.7% of GDP. However, continued strong private sector demand indicates a
need to reduce expenditures and increase revenues further
28. The 1991/92 Budget projects a large drop in oil/LNG revenues compared
to the 1990/91 outcome because of the lower oil price assumption. The non-oil
tax targets proposed in the Budget anticipate an increase of 8% over the level
realized in 1990/91. While this is much slower than the 34% increase in non-
oil tax revenues that was achieved in 1990/91, it will need to be realized in
a year of slower projected growth in imports and GDP.
29. Almost none of the budgeted increase in spending over the expectedoutcome in 1990/91 is for current expenditures. This reflects theGovernment's intention to preserve flexibility in the face of oil priceuncertainties. Civil service pay scales have not been adjusted, but outlays
on salaries are expected to rise because of structural increases and new
hiring. This will be financed by reallocating current expenditure from
subsidies, which are budgeted to fall because of the lower oil price. TheBudget assumes no increase in the domestic sales price of petroleum products,
resulting in an oil subsidy of Rp.1.2 trillion.
30. The Budget calls for an increase in capital spending ofRp.2.2 trillion over the level expected for 1990/91. The broad policypriorities outlined for development expenditure in the Budget are consistentwith REPELITA V. The main features include: (a) strengthening infrastructure
support for private sector development, reflected in rising sector shares for
energy and roads (from 31.5% to 32.7%); (b) sustained support for human
resource development for poverty alleviation (22.1%); and (c) a further shiftof resources into regional development transfers (12.7%). However, the levelof development expenditures needs to be carefully reviewed in order to avoid
putting additional pressure on the balance of payments and prices.
Money and Prices
31. Monetary golicy. As in past years, the goals of monetary policy were
to maintain an adequate level of international reserves and to controldomestic inflation. Rapid expansion in the monetary base in late 1989, whichresulted from efforts to ease domestic interest rates, led to pressures onboth international reserves and domestic prices during the first half of 1990.In response to these events, BI moved in May 1990 to tighten domestic monetary
policy, by reducing liquidity credits and subsequently moving governmentaccounts from commercial banks to BI. Interest rates responded quickly to the
new policy, with the SBI rate increasing almost four percentage points between
May and June. International reserves at BI also recovered quickly. Since May
1990, BI has persisted in its efforts to maintain a tight domestic monetary

- 144 -Annex 1Page 14
stance. Reserve money growth has been slowed from an annualized rate of over30% in April 1990 to less than 20% for the calendar year (Table 8).
Table Si FACTORS AFFECTING MONEY SUPPLY AND LIQUIDITY,1986-90
(Billions of Rupiah)
ChaRae in Yeat End Stocks lb X Chance in Stocks lbChanges in 1986 JA 1987 Ls 1988 1989 1990 1987 IS 1985 1989 1990
Net foreign assets 1,850 2,452 -549 409 -2,171 15.3 -3.0 2.3 -11.9Use of Governmentdeposits 470 1,529 -248 -1,176 -3,877 -2.2 -S.3 -16.4 -46.4Credit to publicenterprises 227 729 659 1,444 -921 12.2 9.8 19.6 -10.1
Credit to privatesector 4,547 6,245 11,069 22,132 35,809 28.1 38.9 56.0 58.1
Net other assets -2,586 -4,731 -3,314 -6,102 -2,915 -62.5 -27.0 -39.1 -13.4Broad money (M2) 4,508 6,224 8,113 16,707 25,925 22.5 23.9 39.8 44.2
Narrow money (MI) 1,573 1,008 1,707 5,722 3,705 8.6 13.5 39.8 18.4- Currency 898 444 464 1,180 1,668 8.3 8.0 18.9 22.5- Demand deposits 675 564 1,243 4,542 2,037 8.9 18.0 55.8 16.1Time & saving deposits
(QM) 2,935 5,216 6,406 10,985 22,220 32.6 30.2 39.8 57.6Rupiah liquidity id 3,180 5,883 6,416 15,301 19,337 25.5 22.2 43.3 38.2Reserve money 1,373 8S8 -490 1,909 1,921 11.0 -5.7 23.3 19.0
Memo itemstM21GDP ratio 28.3 29.6 31.8 34.9 42.6QMIGDP ratio 16.4 18.5 20.9 22.8 30.4
La Includes effeot of exchange rate adjustment on September 12, 1986.Lk December vs. previous December.le Excludes recording adjustment on unused coamercial loans amounting to Rp. 1,725 billion, which were
previously shown as 'net sovernment deposits" but since September 1987 shown as Bank Indonesia assetsand moved to 'net other assets'.
Jd Excludes foreLgn currency deposits.
Sources Bank Indonesia.
32. The tightening of reserve money by BI was less effective in slowingcredit growth and reducing aggregate demand. Domestic credit over the yeargrew at an annual rate of 50%, with credit to the private sector growing atalmost 60% p.a. The pace of growth slowed somewhat toward the end of theyear. Sectors with the fastest growing shares of credit were Services and"Other", which appears to reflect the increase in consumer finance and growthin real estate investment. Some of the growth in these sectors is the resultof banks' attempts to comply with a guideline that 20% of their portfolio bein small loans.
33. The minimal impact of BI's actions on domestic credit can beattributed to Indonesia's open capital account. In response to tighterdomestic liquidity, commercial banks expanded off-shore borrowing to fund

- 145 -
Page 15
their operations, thus avoiding a sharp curtallment in credit. This wasreflected in the decline in net foreign assets shown in Table 8. Official netforeign assets expanded sharply, but this effect was offset by the expansionof commercial bank borrowing.i/ Excess reserves were also drawn down,allowing further credit expansion.
34. The growth of credit was mirrored in expanding levels of M1 and K2,resulting in a higher money multiplier. M1 grew at 18% over the year, adecline from the 40% growth rate of the previous year. M2 growth, however,continued to accelerate, reaching 44% for the year.
35. SBIs (central bank notes) and SBPUs (commercial bank paper), designedto be the chief instruments of monetary control, until recently played only aminor role. SBIs contracted over calendar year 1990, while the stock of SBPUsat BI dried up in March 1990. In a bid to tighten the money supply andincrease the importance of the SBI and the SBPU, GOI ordered 12 publicenterprises (PEs) to move Rp.8 trillion from their deposits in commercialbanks into SBIs in March 1991. PEs actually converted about Rp.10 trillioninto SBIs. Banks that lost deposits were partially compensated through thesale of SBPUs to BI. These steps drove interest rates up sharply, which inturn generated strong capital inflows, followed by some easing of interestrates from their peak in March 1991 (Table 9). Since the SBPUs are of shortermaturity than the 12-month SBI, BI will be able to control the domesticcomponent of base money through decisions on the timing of SBPU repurchases.While this development will facilitate monetary policy, further efforts areneeded to expand the secondary market in SBIs so that such mandatedtransactions will not be necessary in the future.
it' In the monetary accounts, medium- and long-term borrowing by commercialbanks by convention has been considered as a liability in calculatingtheir net foreign asset position. For BI, medium- and long-term debt isexcluded. In constructing the BOP accounts, BI has changed thisconvention so that MLT borrowing is excluded from commercial bank netforeign assets as well. This change is not reflected in the monetaryaccounts, however.

- 146 - Anex I
Page 16
Table 9: INTEREST RATES OF COMMERCIAL BANKS, 1985-90 /A
December Jun Dec Mar1985 1986 1987 1988 1989 1990 1990 1991 Lb
Nominal deposit rates "State banks 16.0 14.7 17.3 18.2 17.2 15.5 19.4 25.4Private banks 17.8 16.2 19.3 20.3 18.8 17.5 21.3 26.0All Banks 16.9 15.4 18.4 19.0 17.7 16.3 20.4 25.6
Real deposit rates /cState banks 13.3 2.7 4.5 11.3 11.6 3.1 11.1 15.0Private banks 15.0 4.0 6.2 13.3 13.1 4.9 12.8 15.6All banks 14.1 3.3 5.5 12.0 12.1 3.8 12.0 15.2
Nominal lending rates i_State banks 15.3 18.5 20.0 20.2 19,7 18.2 20.8 n.aPrivate FX banks 24.2 23.0 23.6 23.8 21.7 20.0 22.9 n.aAll banks 22.1 21.1 22.1 22.3 21.0 19.8 23.0 28.2
Real lending rates /cState banks 12.6 6.1 6.9 13.2 14.0 5.5 12.4 n.aPrivate FX banks 21.3 10.1 10.1 16.6 15.9 7.1 14.4 n.aAll banks 19.2 8.4 8.7 15.1 15.2 7.0 14.5 17.6
Memo items (Annual Avg.) 1985 1986 1987 1988 1989 1990LIBOR /e 8.6 6.9 7.3 8.1 9.3 8.4Domestic inflation LE 4.7 5.8 9.5 9.3 6.3 7.9Inflation differentialbetween Indonesia 5.2 8.7 6.5 5.3 1.4 4.3and USA L&
La For Rupiah transactions, excluding liquidity credit program. Rates showninclude all outstanding loans or time deposits, not marginal rates.
Lb Average rates on six-month time deposits.le Rate calculated using a moving average of annualized semester inflation as
a proxy for expected inflation. Expected inflation in March 1991 assumedto be 9.0%.
i_ Average nominal rates on working capital. Because of long creditmaturities, the average shown responds slowly to current rates on offerand thus the lending rates cannot be compared directly to deposit rates.
Lft London Interbank Offered Rate on 6 month US Dollar deposits./f CPI 27-cities.ig US WPI inflation less Indonesian adjusted CPI-27 inflation.Lb Unweighted average rate currently on offer.
Source: Bank Indonesia and IMF International Financial Statistics, and WorldBank staff estimates.

- 147 - ftn] IPage 17
Domestic Inflation
36. As mentioned above, inflation as measured by the 27-city CPI 1/rose from 6.3% in 1989 to 7.9% in 1990.1/ Inflation was particularly rapidin May through October. This rise in inflation was due to excess aggregatedemand, which is reflected in the increase in nontraded goods inflation from5.2% in 1989 to 12.6% in 1990.2/ Nontraded goods price inflation wasrunning at over 20% p.a. in the first half of the year prior to the tighteningof monetary policy, substantially increasing the relative profitability ofproduction for the domestic market. This helps explain some of the slowdownin export growth experienced during the year.
37. Indicators of price inflation for the poor in Indonesia show asomewhat harsher impact of inflation relative to other groups in 1990. Theindex of 9 Essential Commodities for urban and rural areas, which rose moreslowly than general inflation in 1989, both show an acceleration of inflationto levels higher than the general CPI in 1990. The same is true of theFarmer's Consumption Index, though to a much lesser extent. The impact on thepoor, however, was mitigated by the fact that rice prices rose only 5.9%.
' The introduction of a new CPI in 1990 substantially improved the availableprice information. Based on a larger market basket and extended to allregional capitals, the new 27-city CPI provides a more comprehensivemeasure of consumer price inflation. The introduction of the new index,however, does create some technical difficulties in presenting time serieson inflation. In this report the two indices have been spliced byupdating the CPI-17 index numbers with the CPI-27 inflation rates.
WX Except where otherwise specified, this report calculates inflation ratesby comparing period averages of the CPI index; this gives greater weightto the past than does a month-on month method. The 1990 inflation rate onDecember-to-December basis was 9.9% .
2/ Because of Indonesia's open capital and trade accounts, prices ofnontraded goods are much more nensitive to domestic monetary policy thanare prices of traded goods. Prices for traded goods are closely linked tointernational prices and movements in the rupiah exchange rate, whereasnontraded goods are by definition not subject to internationalcompetition, and thus increases in demand spill over into higher pricesrather than greater imports.

- 148 - AnegDLIPage 18
Table 10: DOMESTIC INFLATION INDICATORS, 1985-90(% change in yearly average)
1985 1986 1987 1988 1989 1990
General IndicatorsCPI-27 cities /a 4.7 5.8 9.5 9.3 6.3 7.9WPI i 5.4 8.5 18.9 10.0 £ 7.4 6.4Non-oil GDP deflator 6.6 7.1 12.1 7.9 8.0 6.2
Specific IndicatorsCPI-Jakarta -a 4.7 5.5 9.6 8.0 6.5 7.0KFM-K3 Ld 4.2 -2.0 10.6 3.9 -1.9 n.aNine essential commodities- Urban A 2.4 5.4 6.7 13.4 5.0 8.9- Rural Zf -1.1 11.8 12.9 17.1 5.9 8.6Farmers household consumption Lg 0.6 9.2 12.3 12.0 7.5 8.1
Proximate IndicatorsImport goods prices Lh 5.3 8.4 22.7 11.5 X 8.5 7.4Non-oil export goods prices Lb 1.0 13.0 30.8 7.6 6.6 0.4Urban rice prices Li- 2.6 -10.6 11.8 36.4 4.1 5.9Non-traded goods prices ii 7.0 3.7 6.4 4.7 5.2 12.6
LA Revised estimates from 1987-89 reflecting adjusted rice prices forJakarta. Spliced to the CPI-17 by updating the old index numbers with theinflation rates of the CPI-27. Splicing begins in April 1990.
Lb Excluding exports of oil and gas.La Revised estimate reflecting adjusted import prices.Ad Physical Minimum Requirements index for 3-child family; weighted average
for 26 province (excluding East Timor).Se Component of CPI-27 cities index.LZ Unweighted average of Java and Madura and Outer Island.Ig Component of Farmers' Terms of Trade index rebased last year to 1983 -
100; weighted average for Yogyakarta and West, Central and East Java.Lb Component of WPI.Li Weighted average of urban medium-quality rice prices in 14 provincial
capitals.Li Constructed from components of the CPI. 1990 based only on Jakarta.
Spliced in the same fashion as the CPI-27.
Source: Central Bureau of Statistics and World Bank staff estimates.

- 149 - Annex 2Page 1
NOTE ON THE RESULTS OF THE 1990 CENSUS
1. The 1990 Census showed that population growth in Indonesia was much
slower than projected in the second half of the 1980s.1/ The Census put thetotal population at 179.3 million in October 1990, which implies that the
population grew at slightly under 2.0% p.a. over the past decade. During thesecond half of the decade, however, growth was only 1.8% p.a., compared to a
projected rate of 2.1% p.a. This compares with growth of 2.2% p.a. in thefirst half of the 1980s, 2.4% p.a. in the 1970s, and 2.1% p.a. in the 1960s.The slowing population growth in 1980s reflects not only declining fertilityrates, but also a slower decline in mortality rates, which had fallen rapidlyin the 1970s. Indonesia thus appears to be progressing steadily through thedemographic transition. Population growth rates did increase in a number of
provinces, but since detailed fertility data are not yet available, it is
difficult to determine to what extent migration has been responsible for
faster growth in those areas.
2. During the second half of the 1980s, population growth on Java (1.5%
p.a.) was much slower than off-Java (2.2% p.a.). There was a wide variationamong provinces in both groupings, however. Riau (5.5% p.a.) was the fastest
growing province, and a number of other provinces in Sumatra and Kalimantangrew faster than 4% p.a. Growth in West Java was not only higher than thenational average but actually increased, from 2.3% during 1981-83 to 2.8%during 1985-90. This high growth was due largely to migration induced by theaccelerating industrial development of the BOTABEK cities of Bogor,Tanggerang, and Bekasi.2/ By contrast, the census shows that populationgrowth in Jakarta fell from almost 4% p.a. to under 1% p.a. Althoughpopulation growth undoubtedly did slow in the late 1980s as employmentopportunities shifted toward the BOTABEK area, the magnitude of the declinemay be overstated because of the many inhabitants of Jakarta who lack official
residency permits. An even more dramatic decline in population growth wasrecorded for Lampung (0.3% p.a.), which had been a major transmigrationdestination and had grown by 5% p.a. for several decades. The decline was due
to a combination of factors, including Government's decision to halt sponsoredtransmigration to the province, the opening of a new road to Bengkulu (which
induced migration especially to urban areas of that province), and migration
to the industrial centers of West Java.
3. In 1990, Indonesia remained largely a rural society, with nearly 70%of the population living outside urban areas. However rapid urbanization has
taken place over the past decade (Statistical Annex Table 1.4). During thei980s, Indonesia's urban population grew by 5.4% p.a., with rates of 9-13% 'nseveeral provinces. Rural population grew by only 0.8% p.a., with the ruralpopulation of Java virtually unchanged over the decade. The rural population
in the Outer Islands grew faster (1.7% p.a.), with growth exceeding 3% p.a. in
1/ Statistical Annex Table 1.1 shows the 1990 population breakdown byprovince. The breakdowns by age group and employment are not yetavailable.
2/ If these cities are excluded, the growth rate for West Java is much closerto that for the rest of Java.

- 150 - Annex 2
Page 2
a number of provinces. Urban and rural population trends reflect acombination of factors, including fertility rates, migration, andreclassification of areas from rural to urban..I/ Assessing the contributionof these individual factors will be possible when the necessary data are madeavailable within the next year.
j' Areas are classified as urban or rural based on a standardized evaluationprocess that takes into account population density, the percentage ofhouseholds engaged in agriculture, and the availability of facilities suchas schools, hospitals, paved roads, and electricity. The criteria andweights were the same for both the 1980 and 1990 censuses.

- 151 - &nnx 3Page 1
The External Environment
1. A major objective of the Government's adjustment program has been toimprove the economy's capacity to withstand external shocks. During the1980's, the economy's dependence on oil was substantially reduced and theexport base was expanded from a reliance on a small group of resource-basedcommodities to a broad range of agricv ural, mining and manufacturingproducts. Even so, events during 1990 illustrate the continued vulnerabilityof the Indonesian economy to changes in the world economy, as the economicslowdown in industrialized countries depressed commodity prices anduncertainties surrounding the crisis in the Gulf led to wide fluctuations inoil prices and exchange rates, as well as a decline in tourism receipts.Table 1 summarizes the key external assumptions underlying Indonesia's medium-term prospects during the decade of the 1990s.
Table Is SELECTED INDICATORS OF INTERNATIONALECONOMSC ACTIMVTY, 1990-2000
tinated SProiseted la Growth Rate (X o.a.)1990 1991 1992 1995 2000 1990- 1991- 1996-
1991 1996 2000
Economic activityG-S growth (Z p.a.) /b 2.7 2.3 2.9 3.0 2.9 2.5 2.9 3.1
Price indices (1985-100)Commodity prices in 75.5 69.2 70.7 73.1 79.3 -10.3 1.4 1.6constant dollars /a
Manufacturing unit values 147.2 160.5 162.3 170.4 204.9 7.6 2.0 3.7in current dollars
OI Drices (USSLbarrel)In 1983 dollars /4 lI 16.8 13.0 11.4 13.5 16.5 0.8 1.6 4.0In current dollars LI 22.6 19.4 17.3 21.3 31.3 4.1 3.6 7.9
Interest rates (X)
LIBOR 1£ 8.5 8.5 8.0 7.0 6.4Real interest rate La 4.6 2.8 5.5 4.0 3.2
L_ End of period./b Weighted average of real growth rates for USA, UK, Japan, France and Germany.la Nominal price index for 33 commodities (excluding energy) deflated by the World Bank's C-5 manufacturing
unit value (tM) index.Id Deflated by MUV index.le Prices are for the IndonesLan fiscal year (April 1 - March 31).If Six-month US$ London Interbsnk Offered Rate (LIBOR).L& LIBOR deflated by the changos in the US GNP deflator.
Source: World Bank staff estimates.
2. During 1985-90, economic activity in the G-5 countries 1/ expandedby 3.4% p.a., leading to a rapid growth in world trade. In the near term,economic activity in the G-5 is expected to slow down considerably, averagingonly 2.3% in 1991. This implies that the growth in world trade will slow to
/ The G-5 countries are the five leading industrialized economies: France,Germany, Japan, the United States, and the United Kingdom.

- 152 - Anngx 3Page 2
less than 5% in 1991 from about 5.5% in 1990. Over the medium term, however,the industrial economies are expected to expand at around 3% p.a., aftertaking into account productivity improvements and a high investment rate sincethe mid-1980s which will lead to about a 6% p.a. increase in world trade.Real interest rates are expected to decline over the medium term to 4.0% in1995 and 3.2% in 2000, substantially lower than the average (5.4%) for theprevious decade. The rate of inflation, as measured by the manufactured unitvalue index (MUV),2/ is expected to average 3.4% p.a. for the 1990s, thesame rate as the 1980s.
3. Crude oil prices rose dramatically during 1990/91, averagingUS$22.6/barrel. ThA short term outlook for oil prices remains highlyuncertain, due to uncertainty surrounding the resumption of Kuwait and Iraqioil production and, consequently, a rationalization of production levelswithin OPEC. The World Bank's forecast for oil pricec during 1991/92 assumesa crude oil price of US$19.4/barrel, slightly above the level projected by theGovernment in the 1991/92 Budget. This assumption is, however, subject toconsiderable downside risk, us international oil stocks and production levelsare at historical highs, implying that oil prices could fall significantly inthe near term. Over the medium term, however, the real oil price is expectedto increase by 2.7% p.a. during the 1990s. Even so, the real oil price in2000 is expected to be only about 50% of the 1980 level.
4. The short-term outlook for non-oil commodity prices remainspessimistic, although some recovery from the depressed levels of 1990 isexpected in 1991. This trend combined with the large increase expected in theKUV index, about 9% in 1991, implies that the non-oil terms of trade willimprove only slightly in 1991, remaining very low in historical terms. Themedium-term outlook for non-oil export prices is better, but import prices areexpected to keep pace. As a result, the non-oil terms of trade is projectedto show an improvement of less than 1% p.a. during the 1990s (see Table 2).Even after including oil, Indonesia's terms of trade can be expected toimprove by only 1.5% p.a.
5. Projected lower oil prices and the expected sluggish performance ofthe world economy in the near term imply that Indonesia will face a difficultexternal environment in 1991 and possibly, 1992. Furthermore, there is asignificant risk of even lower oil prices in 1991, adding to the difficulty ofmacroeconomic management in the near term. Over the medium term, the externalenvironment is expected to be more favorable, as economic growth in theindustrialized countries is sustained at about 3% p.a. and real interest ratesdecline. This will help, Indonesia to sustain the higher levels of growthduring the 1990s, which were achieved during the late 1980s.
2.! The Unit Value Index of Manufactured Exports to developing country markets(MUV index) from the G-5 industrialized countries is expressed in USDollars and is a measure of the US Dollar inflation faced by developingcountries in the export and import of manufactured products to and fromthe industrialized countries.

- 153 - Annex.3Page 3
Table2s INDONESA'S TERMS oF TRADED 1989190-2000101(1983184-100)
-Rato a growth { -1989190 1990191 1991192 1995196 2000101 1990191- 1995196- 1990191-
1995196 2000101 2000101
Exoort orile indexTotal exports 90.7 101.7 102.X 122.2 164.7 3.7 6.2 4.9Non-oil exports 120.7 122.7 133.9 142.9 183.7 4.1 4.1 4.1
Import nrt.o indexTotal imports 126.6 134.2 146.0 154.8 187.4 2.9 5.9 3.4Mon-oil imports 125.8 133.4 145.0 153.9 186.7 2.9 3.9 3.4
Terms of trade indexTotal 71.7 75.8 70.1 78.9 87.9 0.8 2.2 1.5Non-oil 95.9 92.0 92.4 97.5 98.4 1.2 0.2 0.7
Sources World Bank staff estimate.

- 155 - Annex 4Page 1
DEFINITIONS OF VARIOUS MEASURES OF TRADE PROTECTION
The Nominal Rate of Protection (NRP)
1. The NRP of a sector is defined as the average ad valorem tariff, inpercent, on the output of the sector; or, in cases in which non-tariff barriersare important, the tariff which would have the same price raising effect as thenon-tariff barrier. Where non-tariff barriers are important, NRPs are estimatedfrom price comparisons as follows:
NRP - 100 x (PD-PW)/PW,
where PD is the actual domestic wholesale price in rupiahs and PW is the "borderprice" in US dollars, converted to rupiahs at the current exchange rate. Theborder price is the c.i.f. price for import competing goods and the f.o.b. pricefor export-competing goods.
The Effective Rate of Protection (ERP)
2. The ERP measures the percentage change in value-added due to Governmenttrade and subsidy policies. It is defined as the excess of value-added (VAD)under existing policies over value-added under free trade.
ERP - 100 x (VAD - VAW)/VAj
The Anti-Trade Bias of Government Policy
3. Protection to import-competing sectors tends to reduce trade bothdirectly (by import substitution) and also indirectly (by drawing factors fromexport-competing sectors into import-competing sectors). In contrast, protectionto export-competing sectors tends to increase trade both directly (by expandingexports) and also indirectly (by drawing resources out of import-competingsectors into export-competing sectors). Therefore policy can be said to bebiased against trade if import-competing sectors are more heavily protected thanexport-competing sectors.
4. The anti-trade bias of Government policy can be clarified by an example:in 1990 the average ERP for all import-competing sectors was 32.9 percent, whilethat for all export-competing sectors was -3.7 percent. The negative number forexport competing sectors means that they are taxed by the system of incentivesand would receive an average ERP that is less than one. The anti-trade bias ofpolicy was therefore 38 percent, since 1.329/(1 - .0377) - 1.38.
Exchange Rate Adjustment and Real Effective Protectio
5. In the economy such as Indonesia's, in which tariffs and non-tariffbarriers on imports are much more important than export taxes, commercial policyraises the general level of all prices, corresponding to any given nominalexchange rate. The main defect of the ERP as a measure of protection is that it

- 156 - Annex 4Page 2
includes this general price raising effect, which has no protective consequencesat all, with the genuinely protective effects of changes in relative prices. Ameasure of protection which iLs free from this defect is the real effective rateof protection.
6. The RERP of a sector is defined as the average percentage excess ofactual value added in the sector, deflated by the wage rate, over estimated treetrade value added, deflated by the free trade wage rate. The estimates reportedin this report are derived on the assumption that the wage in rupiahs is directlyproportional to the conswuer price deflator in rupiahs. This means that theRERPs measure the percentage increases in value added in the various sectors dueto Government policy, relative to the policy-induced increase in the averagelevel of prices, as measured by the consumer price deflator.
7. An example may help to clarify the concept of the RERP. It is estimatedthat Government policies raised value added (in rupiahs) in estate and othercrops by 12 percent relative to what it would have been at the same nominalexchange rate under free trade; however, these policies also raised the rupiahwage corresponding to any given nominal exchange rate (and, by assumption, theconsumer price deflator in rupiahs) by 11 percent. Therefore the real protectionin 1990 received by the sector estate and other crops was only 1 percent, not 12percent. In some cases the ERP for a sector may be positive, giving theimpression that Government policies assist the sector, when their real effect isto disadvantage it. For example, in 1990 the ERP for tea was 2 percent, i.e. itsvalue added in rupiahs was increased by 2 percent by Government policies (suchas the fertilizer subsidy); but, since Government policies also increased thegeneral level of prices by 11 percent their real effect was to disadvantage thetea sector. This is shown by the negative RERP for tea of -8 percent. Undercertain strong simplifying assumptions, including the assumption that labor isthe only mobile domestic factor, RERPs correctly predict the direction "'fresource movements, in the sense that sectors with positive (negative) RERPs areexpanded (contracted) by Government policy, relative to free trade.

- 157 -
INDONESIA
COUNTRY ECONOMIC REPORT
STATISTICAL ANNEX La
List of Tables
Population and Employment
1.1 Population and Growth Rates by Province, 1930-19901.2 Distribution of Population by Age Group and Sex, 1961-19851.3 Employment by Main Industry, 1971-19851.4 Population Distribution by Province and Urban & Rural, 1980-1990
National Income Accounts
2.1 Gross Domestic Product by Industrial Origin at Current Market Prices,197q-1989
2.2 Gross Domestic Product by Industrial Origin at Constant 1983 MarketPrices, 1979-1989
2.3 Expenditure on GDP at Current Market Prices, 1979-19892.4 Expenditure on GDP at Constant 1983 Market Prices, 1979-19892.5 Distribution of GDP at Current Market Prices, 1979-19892.6 Distribution of GDP at Constant 1983 Market Prices, 1979-1989
International Trade & Balance of Payments
3.1 Balance of Payments, 1978/79-1990/913.2 Non-oil Exports, 1984/85-1989/903.3 Value of Exports by Principal Country of Destination, 1978-19903.4 Value of Imports by Principal Country of Origin, 1978-1990
External Debt & Capital Flows
4.1 Summary of External Debt Data, 1980-19904.2 External Public Debt Outstanding as of December 31, 19904.3 Service Payments, Commitments, Disbursements and Outstanding Amounts of
External Public Debt, 1980-19974.4 Development Assistance Flows, 1985-1989
Public Finance
5.1 Central Government Budget Summary, 1978/79-1991/925.2 Central Government Receipts, 1978/79-1991/925.3 Central Government Expenditures, 1978/79-1991/925.4 Development Expenditures, 1978/79-1991/925.5 Development Expenditures by Sector, 1978/79-1991/925.6 Project Aid by Sector, 1978/79-1991/92
i« With the exception of the tables on External Debt, the Statistical Annexis a compilation of official data from Government 3ources. In someinstances, these data may differ from data in the main text and Annex 1due to different Bank definitions and methodologies in construction the
statistical series.

- 158 -
Monetary Statistics
6.1 Money Supply, 1974-19906.2 Changes in Factors Affecting Reserve Money Supply, 1974-19906.3 Consolidated Balance Sheet of the Monetary System, 1980-19906.4 Banking System Credits by Economic Sector, 1980-19906.5 Banking Credits Outstanding in Rupiah and Foreign Exchange by Group of
Banks, 1980-19906.6 Investment Credits by Economic Sector, 1980-19906.7 Outstanding Bank Funds in Rupiah and Foreign Exchange by Group of Banks,
1982-19906.8 Interest Rates on Deposits at Commercial Banks, 1978-1990
Agricultural Statistics
7.1 Principal Agricultural Products by Subsectors, 1978-19897.2 Production of Major Crops by Type of Estate, 1979-19897.3 Rice-Area Harvested, Production and Yield, 1974-19897.4 BULOG Rice Program, 1978/79-1990/917.5 Area Covered Under Rice Intensification Programs, 1974-1989
Industrial Statistics
8.1 Index of Manufacturing Production by Selected Industry Group, 1986-19908.2 Production of Minerals, 1974-19908.3 Crude Oil Production by Company, 1980-19908.4 Petroleum Product Supply and Demand, 1980-19908.5 Domestic Sales of Petroleum Products, 1980-1990
Prices
9.1 Consumer Price Index, 1979-19909.2 Indonesia Wholesale Price Index, 1983-19909.3 Domestic Prices of Petroleum Products, 1980-1990
Investment Statistics
10.1 Approved Foreign Investment by Sector, 1977-199010.2 Approved Domestic Investment by Sector, 1977-1990

- 159 - Statistical AnnexTable 1.1
INDONESIA
COUNTRY ECONOMIC REPORT
Population And Growth Ratos by Prov_neS, 1930.1990
Region Population ('000) Average growlh rate (% p.a.)1930 1901 /a 1971 /a 18o0 1985 1990 193041 1961-71 1971-80 IO9805 1985.90
Java 41L71tl 03.059 760 9,270 99.852 107.574 1.3 19 2.0 1.8 3.5DKI Jakarta 811 2,973 4,579 8,503 7,885 6,254 4.3 4.4 4.0 3.9 0.9West Java 10,580 17,015 21,624 27,454 30.830 35,381 1.7 2.1 2.7 2.3 2.8Central Java 13,700 18,407 21,877 25,373 20,945 28.522 1.0 1.7 1.7 1.2 1.1Di Yogiakarta 1,559 2,241 2,489 2,751 2,930 2,913 1.2 1.1 1.1 1.3 -0.1East Java 15,050 21,823 25,517 29,188 31,262 32.504 1.2 1.0 1.5 1.4 0.8
Sumatra 8a255 157S9 20,809 28.017 32.o03 30.455 2L 2 3.4 S. 1 L2Lampung 36l 1,668 2,777 4,025 5,905 0.006 5.1 5.2 5.8 5.0 0.3Bengkulu 323 400 519 768 943 1,179 0.7 2.5 4.5 4.2 4.6South Sumatra 1,378 2,773 3,441 4.630 5.370 6,277 2.3 2.2 3.4 3.0 3.2Riau 493 1,235 1,642 2,1609 2,548 3,306 3.0 2.9 3.1 3.3 5.3Jambi 245 744 1,006 1,446 1,745 2,016 3.0 3.1 4.1 3.8 2.9West Sumatra 1,910 2,319 2,793 3,407 3,698 3,999 0.6 1.9 2.2 1.7 1.6North Sumatra 2,542 4,s95 6,622 8,361 9,422 10,2568 2.2 2.9 2.0 2.4 1.7Aceh 1,003 1,629 2,009 2,011 2.972 3,416 1.6 2.1 3.0 2.6 2.8
Kalimontan 2.170 4.102 5.155 0.723 7.722 9.110 2.1 2. S.0 2.8 3.4West Kalimanton 802 1,581 2,020 2,488 2,819 3,239 2.2 2.5 2.3 2.5 2.8Central Kalimantan 203 497 702 954 1,318 1,390 2.9 3.5 3.5 3.2 4.5South Kalimantan 836 1,473 1,699 2,005 2,273 2,598 1.8 1.4 2.2 1.9 2.7East Kalimanton 329 551 734 1,218 1,512 1,877 1.7 2.9 5.8 4.4 4.4
Sulawesi 4231 7.079 8,528 10.409 11,554 12.521 1.7 1.9 2.2 2.1 1.6Central Sulowesi 390 093 914 1,290 1,511 1,711 1.9 2.8 3.9 3.2 2.5North Sulawesi 748 1,310 1,719 2,115 2,313 2,479 1.8 2.8 2.3 1.8 !.4Soulh Sulawesi 2,e57 4,517 5,181 0,002 60610 6,982 1.7 1.4 1.8 1.7 1.1Southeast Sulawesi 436 559 714 942 1,120 1.350 0.8 2.5 3.1 3.5 3.8
Cther slands 4.219 7.100 8 30 11.07L 12.316 130,61 1.7 2.0 2.8 2.2 2.1Bali 1,101 1,783 2,120 2,470 2,049 2,778 1.6 1.7 1.7 1.4 1.0West Nusa Tenggara 1,010 1,808 2,203 2,725 2,995 3,370 1.9 2.0 2.4 1.9 2.4East Nusa Tenggara 1,344 1,987 2,295 2,737 S.001 3,269 1.2 1.6 2.0 2.3 1.3Maluku 579 790 i,os9 1,410 1,609 1,856 1.0 3.3 2.9 2.7 2.9Irian Jaya 179 758 923 1,374 1,371 10641 4.8 2.0 2.7 3.2 3.7East Timor n.a n. n.a 555 631 748 n.a n.a n.a 2.6 3.5
T o t a I Indonesia s00593 97.085 119 147.490 1s4.047 179.322 1.5 2.1 2.4 2.2 1.8
/a Indudes adiustment for the exclusion of rural Iran Jaya.
Source: Central Bureau of Statistics, Population Census Reports, 1961, 1971, 1980 and 1990;Statistical Yearbook Of Indonesia, 1984; and SUPAS 1985.

I4DONESU
COUNTRY ECONOMIC REPORT
Dstbution of Pofulaion by A4. Ghoup and Sex 1961-1985 /a
('000)
1961 1971 19 80 19 85Age Group NIes Females Toal Males Femeks otai Males Females Total Moles Femaks Totl
0-4 8,629 8,649 17,178 9,675 9,560 19,235 10,872 10,422 21,294 11,008 10,643 21,5515-9 7,744 7,701 15,445 9,593 9,302 18,895 10,889 10,446 21,335 11,379 10,739 22,11810-14 4,353 3,892 8,245 7,406 6,875 14,281 9,179 8,525 17,704 10,783 10,113 20,89615-19 3,865 3,905 7,770 5,627 5,779 11,406 7,552 7,806 15,358 8,335 8,232 16,56720-24 3,480 4,373 7,853 3,627 4,461 8,088 6,010 7,055 13,065 6,385 7,903 14,28825-34 7,392 8,610 16,002 7,722 9,226 16,948 9,685 9,920 19,605 12,026 12,442 24,46835-44 5,765 5,406 11,171 7,062 7,119 14,181 7,876 8,172 16,048 8,538 8,485 17,02345-54 3,587 3,511 7,098 4,360 4,213 8,573 5,761 5,856 11,617 6,418 6,514 12,93Z65-64 1,913 1,865 3,778 2,224 2,373 4,597 3,297 3,354 6,651 4,150 4,474 8,62465+ 1,183 1,245 2,428 1,450 1,539 2,989 2,200 2,593 4,793 2,619 2.954 5,573Unknown 60 57 117 7 8 15 11 i 20 4 3 7
Total 47.871 49.214 97.086 68.753 60.6 119.208 73.332 74.158 147A490 81.645 82.402 164.047
Peroentane distribudon
0-4 17.8 17.6 17.7 16.5 15.8 16.1 14.8 14.1 14.4 13.5 12.8 13.15-9 16.2 15.6 15.9 16.3 15.4 15.9 14.8 14.1 14.5 13.9 13.0 13.510-14 9.1 7.9 8.5 12.6 11.4 12.0 12.5 11.5 12.0 13.2 12.3 12.715-19 8.1 7.9 8.0 9.6 9.6 9.6 10.3 10.6 10.4 10.2 10.0 10.120-24 7.3 89 8.1 6.2 7A 6.8 8.2 9.5 8.9 7.8 9.6 8.725-34 15.4 17.5 16.5 13.1 15.3 14.2 13.2 13.4 13.3 14.7 15.1 14.935-44 12.0 11.0 11.5 12.0 11.8 11.9 10.7 11.0 10.9 10.5 10.3 10.445-64 7.5 7.1 7.3 7.4 7.0 7.2 7.9 7.9 7.9 7.9 7.9 7.9 ' cA
SDft56-64 4.0 3.8 3.9 3.8 3.9 3.9 4.5 4.5 4.5 5.1 5.4 5.365+ 2.5 2.5 2.5 2.6 2.5 2.5 3.0 3.6 3.2 3.2 3.6 3.4Unknown 0.1 0.1 0.1 0.0 0.0 0.0 0.0 0.0 0.v 0.0 0.0 0.0
Tock 100.0 100.0 100.0 100.0 100.0 100.0 100.0 100.0 100.0 100.0 100.0 100.0
/a Da afor 1990 are not avAble.
Soure : Cntra Bureau of Siuis, Ceo"u Reps, 1961, 1971, 1980, cnd 1990; btecens PpAution Survey, 1985.

INDONESIA
COUNTRY ECONOMIC REPORT
EmRlovsnut by Mam Indudryr. 1971-1985 /a /b
1971 1980 1982 1985main Indusiy million % million % million % milion %
Aiculkre, oesaty, huing & lahey 26.5 64.2 28.0 64.8 31.6 54.7 34.1 54.6
Mning and quaoyng 0.1 0.2 0.4 0.7 0.4 0.7 OA 0.7
Manufadnng 2.7 6.5 4.4 8.6 6.0 10.4 5.8 9.3
Electuiciy, gs & ater 0.0 0.1 0.1 0.2 0.1 0.1 0.1 0.1
Comudion 0.7 1.6 1.6 3.1 2.2 3.7 2.1 3.4
Whol"ak and retal Iade & reants 4.3 10.3 6.6 12.9 8.6 14.8 9.4 15.0
Trspoptnk, sorge & conmnniinsw 1.0 2.3 1.6 2.9 1.8 3.1 2.0 3.1
Finae, insuance, eal este & 0.1 0.2 0.2 0.4 0.1 0.2 0.3 0.4
essw semce Pak srvic 4.1 10.0 7.7 15.1 7.1 12.3 8.3 13.3 g'
Othen 1.9 4.8 0.7 1.4 0.0 0.0 0.1 0.1
TOtal 41.3 100.0 51.2 100.0 57.8 100.0 62.5 100.0
/a Rees to popdion 10 yaon of age and above who war.d duing ih week prious to e
/b Dat for 1990 ae not available.
Souc: Cetral Bueau of Staisic, Stil Yeabook of hInoneIa, 1975, 1982, 1985.
F'toI-rt_ @.
m '-I
'-

- 162 - Statistical AnnexTable 1.4
INDO-NESIA
COUNTRY ECONOMIC REPORT
Pouulation Distribution by Provlnce and Urban & Rural. 1980-1990
1980 1990 Growth Rates ( paRegion Urban Rural Urban Rural Urban Rural
Java 22.926.377 68.290.59S 88.835.297 69.182.666 5.28 0.00DKI Jakarta 6,071,748 408,906 8,222,516 0 3.08 0.00West Java 5,770,868 21,678,972 12,208,176 23,170,307 7.78 0.67Central Java 4,756,007 20,611,337 7,694,539 20,822,247 4.93 0.10DI Yogyakarta 607,267 2,142,861 1,294,066 1,618,566 7.88 (2.77)East Java 5,720,487 23,448,617 8,916,011 23,671,557 4.54 0.06
Sumatera .488 22.514.439 9.293.747 27.128.789 5.42 1.88Lampung 576,872 4,047,366 747,327 6,266,782 2.62 2.65Bengkulu 72,492 695,496 240,192 938,759 12.73 3.04South Sumatra 1,267,009 3,360,710 1,839,492 4,438,453 3.80 2.82Riiau 588,212 1,575,684 1,047,464 2,233,592 6.94 3.55Jambi 182,846 1,261,630 432,727 1,681,327 9.00 2.28West Sumatra 433,120 2,973,012 807,983 3,190,694 6.43 0.71North Sumatra 2,127,436 6,223,514 3,638,832 6,613,479 6.61 0.61Aceh 233,501 2,377,027 539,740 2,875,663 8.74 1.92
Kalimantan 1.441.300 5.275.596. 2.506.657 6.596.249 5.69 2.26West KalLmantan 416,923 2,067,968 642,989 2,592,377 4.43 2.29Central Kalimantan 98,257 865,919 246,249 1,160,612 9.58 3.00South Kalimantan 440,901 1,622,326 702,960 1,893,697 4.78 1.66East Kalimantan 485,219 729,383 915,469 959,663 6.55 2.78
Sulawesi 1.654.190 8.746.S58 2.761.021 9.750.142 5.26 1.09Central Sulawesi 116,472 1,169,056 281,134 1,422,196 9.31 1.98North Sulawesi 364,607 1,760,215 564,795 1,913,151 4.76 0.84South Sulawesi 1,096,076 4,963,489 1,686,443 6,295,146 4.40 0.66Southeast Sulawesi 88,036 853,598 229,649 1,119,649 10.06 2.75
Other Islands 1.342.474 9.659.008 2,494.449 11.150.256 6.89 1.45Bali 363,336 2,106,388 734,237 2,043,119 7.29 (0.30)West Nusa Tenggara 383,421 2,340,257 582,180 2,789,619 4.26 1.77East Nusa Tenggara 205,467 2,531,531 372,242 2,895,677 6.12 1.36Maluku 152,944 1,265,607 362,438 1,498,649 8.71 1.79Irian Jaya 237,316 869,976 395,131 1,233,966 6.23 3.66East Timor 0 566,350 68,221 689,336 0.00 2.18
T o t a I Indonesia 32.845.829 114.48S.994 6S.891.171 128.808.02 6.86 0.79
Source: Central Bureau of Statistics

- 163 - Statistical AnnexTable 2.1
INDONESIA
COUNTRY ECONOMIC REPORT
Gros Domestic Producd by IndustdIq OrTein a Currn Market Prices, 1979-19S9 Ia~~~ {~Rp. billion)
1
1979 1980 1981 1982 1 1983 1984 1985 1986 1987 1988 1989 /b
Ariculture 84 11,726 1098 15.002 1 17.90 20.420 22.513 24.871 29.116 34.193 s8.998Farm food crops 4,774 0.103 7,826 9,162 1 11,057 12,692 13.860 158085 17,540 21,124 24,187Farm non-food crops 1,614 1,924 2,048 1,915 1 2,295 2,789 2,979 8,534 4,140 4,.89 4,784Estate crops 278 303 294 270 1 875 598 715 690 978 1,160 1,257LIvestock products s89 1,191 1,478 1,611 1 1,754 2,084 2,427 2,640 3S015 s,545 4,070Foresr.y 1,292 1,412 1,077 990 1 994 89o 938 1,001 1.247 1,448 1,733Fishery 028 793 976 1,114 1 1,220 1,878 1.595 1,921 2,196 2,528 2,96e
Mining and ouarrvinp 8.800 11.2S8 13.218 12.153 1 10.107 10.938 18.571 1I.50 17.267 17.182 21.730OU & natural gas 6,541 10,010 12.673 11,048 1 15,103 15,917 12.584 10,502 15,079 15.525 19,453Other 324 62s 544 505 1 1,004 1.021 987 1,001 1,287 1,637 2,277
4003 oo .SW 7.067 7.482 1 9.89s 18.113 15.503 17.185 21.150 26.253 3o.573Refinery oll 97 94 18O 155 1 859 1.018 1.864 1,915 1.820 2,026 2,148'L,G 582 1,198 1,282 1,615 1 1,871 2,707 2,424 1,969 2,097 2,949 8,281other 8,824 5,061 5,605 5,712 1 7,600 9,894 11,216 18.301 17.233 21,278 25,144
Elactriity, mss & water 180 231 292 341 I 314 854 8sB n47 747 80 1.008
conrstrction 1.945 2.582 asoo .769 4.597 4.757 5-L 5.314 7 7.169 8.884
Trade 5.608 7.323 8781 9.947 1 11.541 13435 15.417 17.122 21.04a 24.379 28.814Retai & wholesae trade 4,800 6,814 7,586 8,567 1 9,933 11,871 12,962 14,285 17,561 20,869 23.957Hotels & restaurants So0 1.009 1.94 1,880 I 1,608 2,068 2,455 2,88N 8,487 3.91 4,857
Transort & comunications 1.66 2.211 2.a70 .14 1 4,98 5.01 0J.0 0.407 7M.S 8.140 ss08Tranport 1.568 2,060 2,182 2,942 1 3.69 4.611 5,s58 5,770 6.630 7,227 s8o.6CommurIcations 118 150 188 222 1 404 440 582 637 804 912 1,025
Baning,etc. ao680 924 1,408 1.78 I 2.as 8.058 S. 4.037 4.795 5.322 6.551
OwneablD of dwefllns 960 1.228 1.494 1.731 1 2.56 2.57S 2775 2.976 a.349 a.7s0 4.155
Publc admam. & defence 2.e9 3.225 4.203 4.706 1 5.712 6.470 7.925 £,307 8 912 .448 11.174
other serices 1.48 1.872 2as 2.3a9 I .001 L.718 asss 4.15 4.90a 5.351 5.857
Oroes bomestic Product _4.840 48.914 58.127 62.476 I 77.676 39. L s9 102.688 1247 . 166.329
/a In 1989, Guernment released a revised national account ses for the perIod 1963-1988. Since the 1978-1982 serieshas not yet been revbed, It Is not directy comparable with the 1988-108l series
/b Preliminary fpures.
Source: Central Bureau of Statics.

- 164 - Statistical AnnexTable 2.2
IN&NESCOUNTRY ECONOMiC REPORT
Gros Domsk Prouct by Industvw a Constat 1983 Marke Prie 1979-1989 /a
1979 1980 l981 1982 1 1983 1984 1985 1986 1987 1988 1989 /b
15.249 16.203 17.270 17.407 1 I7Z.60 18.513 10,300 19.799 20 224 21.109 22I00Farm food crops 8,838 9,061 10,039 10,726 1 11.057 11.080 11,980 12,267 12.415 13.974 13.440Fam non-food crops 1,860 2,050 2,219 2,274 1 2,295 2,349 2,576 2.581 2,093 2,8s5 2.998Estaecrope 290 Si7 343 S S 1 375 446 511 562 565 578 60?uvestock prodts 1,414 1,588 1,034 1,703 I 1,754 1,890 2,037 2.064 2,111 2,212 2,324Forety 1,790 1,620 1.296 1i165 I 94 8a4 851 s88 968 1.013 1.083Jehery 1.046 1,110 1,139 1,167 1 1,220 1,253 1,341 1,418 1.472 1,557 1,626
Ming & 1a 6.093 10^078 100 a o 13.876 I 16.107 17.120 15.480 16.309 16.3o 1-5.8s9 16.727Ol & natural ps 15,590 15,525 15,767 13,249 I 15,106 16,187 14,513 15,237 15.219 14.6091 15,393Other 502 553 573 027 1 1,004 933 968 1,072 1.140 1,201 1,S3
m _i3tu!12 5.952 7S 7.878 7.973 I 8 12.079 18.431 j4,078 16.26 18,182 Ij3sReflney yol 173 IS 170 142 I 350 Ot2 767 927 9ss 981 9o9LNG 1,230 LO.7U 1,712 1,782 I 1,871 2,790 2,919 2,s23 8.233 3,s55 3,065Other 4,549 5,447 5,997 0,049 I 7.606 8,663 9,746 10,828 12,064 18,607 15,181
EDetridty. as and waer S12 201 4a2 21 3S1 4 261 4S0 495 N9 n o
n 326 .S AW so se 4 .3409 4.597 J.s4 4.508 4.,009 C 5.259 5.878
Trade SAW 10.303 10l968 11,803 I 11.541 11.811 12 s . 14.a50 15.057 M7.sOetail & Wholee trade 7.520 8,819 9,436 10,057 I 9,023 10,028 10,412 11.238 12,005 13.035 14,407.t £ rt 1,387 1,484 1.532 1,540 i,6e0 1,783 1,987 2,161 2,351 2.621 2,824
Transnort & co caon .670 2.1i1 ascs fs"O l 4.008 4.443 4.487 4.e69 4. 5.212 5.067Trport 2,51 2s,m 3,o03 3,270 3,694 4,006 4,032 4,178 4,34 4,626 5,007Comunlcalon 137 IS8 226 263 I 404 435 455 490 54s w8e 6S
uw*h- GM 1.15i9 1.20S 1.762 2.079 2.S5 ;LA a20 Lin_ a.os9 Lilt L..
ownesiofd 1.573 1.8 3I 19.29 821.3 L_ 2.3450 5us 2.1104. Liii. 2.8
Puic edmin. & detencea 3.7 jL05 4i3 5. I 5.7s2 1 .5.997 0.455 L.t02 !.1ii7 83 97
o c 2.581 2e3s 2.792 2.a51 3.001 3.117 3.180 J,s 3.422 Ls7 3716
GM Do2 sic Pct §LeU, 0072 ZIR. 71._ I 77.676 s.7 02 90_081 sss 107_ "M
/a In I96, Government relesd a revised national aoum series for the period 19318. Since the 1978198 serisaba not yet been reisd, It is not diectly comparae with t 1983-18 sries
lb Preimnay figures.
Soure: Centa Bureau of Sg .taL

COUN ECONOMICO
Ezxsgodi. on GMP at Currnt Market Pm. 1979-1989 /a(Rp. bgllon)
1979 1980 1981 1982 1 1983 1984 1986 1986 1987 1988 1989 /b
Private consumption 19,516 25,596 32,294 37,924 1 47,063 64,067 57,201 63,355 71,989 81,045 88,752
Government consumpon 3,277 5,148 6,452 7,229 1 8,077 9,122 10,893 11,529 11,764 12,756 15,698
Gross Sied iwesUment 7,668 10,550 14,135 15,822 1 19,468 20,136 22,367 24,782 30,980 36,803 45,650
Changes In stock Ic 2,166 1,345 3,189 1,584 1 2,847 3,406 4,837 4,243 8,166 7,922 12,122
Exprt of goodsan Inonhct^r services 10,003 16,162 16,177 15,103 1 19,846 22,99 21,534 20,010 29,874 34,666 42,503
I 0'
Less: Imports of goods and I U
nonfactor servoies 7,791 9,886 14,119 15,186 1 19,625 19,845 19,835 21,036 27,956 31,171 38,395
Grow Domec Product 8484Q0 4814 58127 62A476 1 77.676 8OMA 9fA997 102.688 124.817 142.02£ 1MA380
/a In 1989, Govemment released a revied national account series for the period 1983-1988. Sinoe the 1978-1982 series
has not yet been revied, it is not direcy comparable with the 1983-1988 series.
/b Premhn figures./c ResiduaL S rt
Souwee: Central Bureau of Statistics. CDid

INDONESIA
COUNTRY ECONOMNC REPORT
Expon on GDP at Condant 1983 Market Prices. 1979 - 19899/a(Rp. billion)
1979 1980 1981 1982 1 1983 1984 1985 1986 1987 1988 1989 /b
P.toe osnmipon 32,491 36,037 39,699 42,172 I 47,063 48,942 49,448 50,530 62,200 54,225 56,476
Guemmed commnpion 5,767 6,801 7,567 8,291 1 8,077 8,353 8,991 9,241 9,226 9,924 10,965
Gross ibd iweitme 12,382 15,646 17,659 18,740 I 19,468 18,297 19,616 21,422 22,597 25,201 28,568
Chgn in sdoc kc 27 (3,077) 6,475 3,239 1 2,847 4,452 e,641 6,333 5,049 1,075 1,230
Epyodfgoods andnodaIr sWAM 24,458 26,182 21,163 19,242 1 19,846 21,145 19,495 22,460 25,745 26,016 27,851
Lemr hnpos of goodd nJocAn servies 13,625 14,866 20,010 20,323 1 19,625 18,151 19,109 19,906 20,289 16,604 17,768
Gnrss Domedit Produet 01G50 f6,72a 7IJ6a 7161 1 77.676 s3,07 9fi082 90.081 94.18 99js 107.321l
/a I 1989, Govowe released a reved noiwl acont senes For dhe pod 1983-198& Sice the 1978-1982 seriehas ncd yet bwen ed, b is n d y comparoble wih Ihe 1983-1988 wrIes
/b Pre_nary ligrs./C Re.sidua
Sowce: Crullureou cf Statvtcs
t~rt
4'- a
x
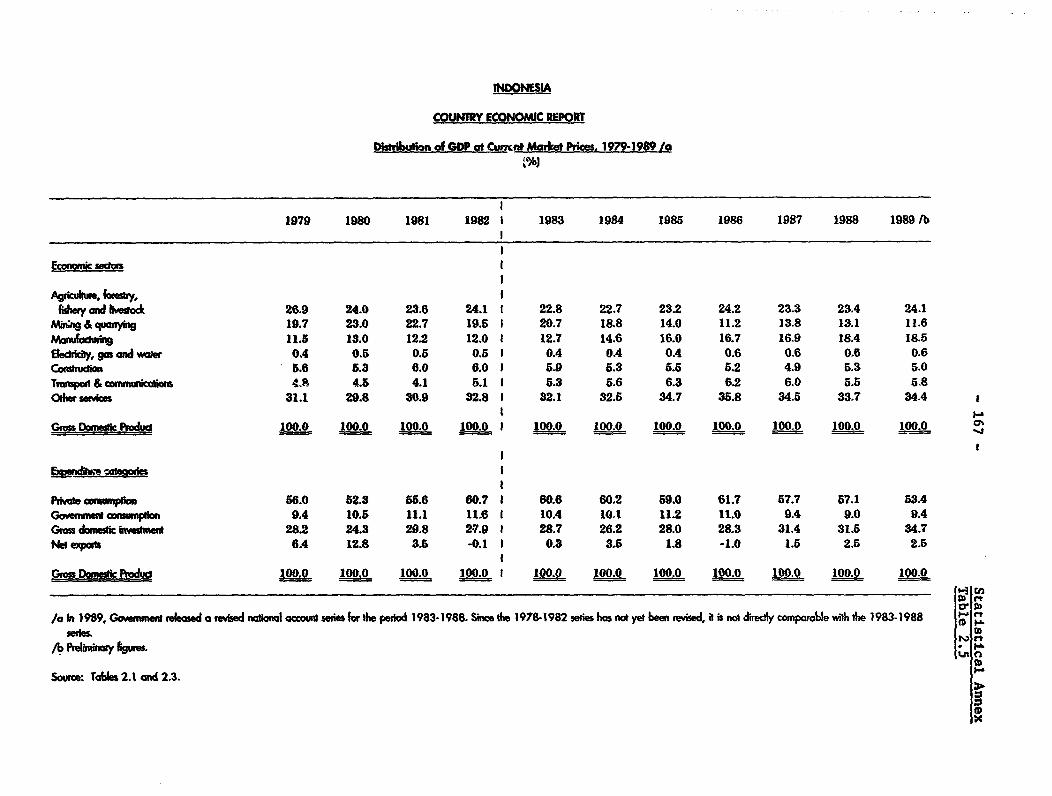
INDONES
COUNIRY ECONOMIC REPORT
Ditwution of GOP at Cufntu Market Prices, 1979-1989 /a
1979 1980 1981 1982 1 1983 1984 1985 1986 1987 1988 1989 lb
Eanomc seosn1
fihet and ietock 26.9 24.0 23.6 24.1 1 22.8 22.7 23.2 24.2 23.3 23.4 24.1Minkg&qqnyuna 19.7 23.0 22.7 19.5 1 20.7 18.8 14.0 11.2 13.8 13.1 11.6Manuhduu9 11.5 13.0 12.2 12.0 1 12.7 14.6 16.0 16.7 16.9 18A 18.5Edeiciy, go nd w wow 0.4 0.5 0.5 0.5 I 0.4 OA OA 0.6 0.6 0.6 0.6CoetJwdbin 5.6 5.3 6.0 6.0 I 5.9 5.3 5.5 5.2 4.9 5.3 5.0Tmnqxm & conmekAomS 4 4.5 4.1 5.1 1 5.3 5.6 6.3 6.2 6.0 5.5 5.8Othe lIMOS 31.1 29.8 30.9 32.8 1 32.1 32.5 34.7 35.8 34.6 33.7 34.4 a
Gs Dm i Pd 100.0 100.0 100.0 100.0 I 100.0 100.0 100.0 100.0 100.0 100.0 100.0
Pdrve omumplon 56.0 52.3 55.6 00.7 1 60.6 60.2 59.0 61.7 57.7 67.1 53.4GownwmtcoemampIn 9.4 10.5 11.1 11.6 I IOA 10.1 11.2 11.0 9.4 9.0 9.4Grss domeck iwtedn 28.2 24.3 29.8 2-7.9 1 28.7 26.2 28.0 28.3 31.4 31.5 34.7Ne aexox 8A 12.8 3.6 -0.1 1 0.3 3.5 1.8 -1.0 1.5 2.5 2.5
GrEss DMeic Pd 100.0 100.0 100.0 100.0 I 100.0 100.0 100.0 100.0 100.0 100.0 _10.0
/a in t989, Gowerme elased a revd nationl account sedes for th pedoo 1983-1988. Shne te 1978q1982 series has not yet been evised, it is no diely cmprble with the 1983-1988seris.sr
/b Prelbnmy .ums.
Soure: TaUes2.1 and2.3.

INDONESIA
COUNTRY ECONOMIC REPORT
Didlbutlon of GDP a* Constan 1983 Market Prices. 1979 - 1989 /a(%N
1979 1980 1981 1982 1 1983 1984 1986 1986 1987 1988 1989 /b
Econaoic Sedkn I
-. bdy. Iiory ond winock 24.8 24A 24.1 24A I 22.8 22.3 22.7 22.0 21.4 21.2 20.6
Mhrk & quanuh 26.2 24.F 22.8 19.4 1 20.7 20.6 18.2 18.1 17.3 16.9 15.6Mm9 hdwig 9.7 10.9 11.0 11.2 1 12.7 14.5 15.8 16.3 17.2 18.2 18.5sedcdy, gas and wer 0.4 0.5 0.5 0.6 I OA OA OA 0.5 0.5 0.5 0.6
Conbuidbn 5.3 6.8 6.1 6.2 1 5.9 5.3 6.3 5.1 5.1 6.3 5.5Tnrqxd & wwnmunicI 4.3 4A 4.6 5.0 1 5.3 5A 5.3 5.2 5.2 6.2 5.3Othe SWAms 29.3 29.9 30.8 33.3 1 32.1 31.5 32.3 32.8 33.3 33.7 34.0
Gras Denude t'mdud 100.0 100.0 100.0 100.0 I 100.0 100.0 100.0 100.0 100.0 100.0 100.000
Pihke. c%unpmn 62.8 64.0 55.5 59.1 1 60.6 58.9 58.1 56.1 65.2 54.3 52.6Gwineti cmummipn 9.4 10.2 10.6 11.6 I IOA 10.1 10.6 10.3 9.8 9.9 10.2Gka domes'mo krramert 20.2 18.8 32.3 30.8 1 28.' 27A 30.9 30.8 29.2 26.3 27.8Nd wqaxb 17.6 17.0 1.6 -1.6 I 0.3 3.6 0.5 2.8 5.8 9.5 9.4
Gra Danedic Pwduct 100.0 100.0 100.0 100.0 I 100.0 100.0 100.0 100.0 100.0 100.0 100.0
/a h 1989, GvwnueS relesd a rvsed naknad aco mis for hde prokd 1983.1988. SIne he 1978-1982 sefies ha not yet been rvised, i is ndo diety comparabl with e 1983-1988 sofe .
A eknina gW
Source: Tabes 2.2 and 2.4.
X

CW ECONOMW EO
Bobne of PftMmL 1978/79 1990/91(W$ mnA
I9M79 197I S0 198601 196142 I98S 19S 84 19SVS5 IW8016 19867 108788 1088 19894S0 1004I /c
1. Not ell exnzr s L 785 e oB 9,545 8 L379 5 6016 5845 4," 4 1.420 2= 1535 2 A'1 M-.
L Not LNGexnmbrs 25 667 M 1.3 1.378 1.355 1.971 2.119 1.158 1.426 LUS 1.60 2"
S. Non-an exuxb (net) -5165 .4777 470 *12551 -14205 .115 4 -795 465 -547 4019 -5510 -03
xpora fob 3.979 6,171 5.587 4,170 3,028 ,S267 5907 6,175 6.731 9,502 12.184 14.493 15.364
Import.. dt -7143 9028 -11837 -14561 -I1524 .14340 -12321 -11186 -10285 -11763 -13586 -16478 -21270
Secms (n _et) .1601 . 1920 -2220 2160 -2309 2543 -2770 -2944 -2981 .3206 .3517 -3525 -3518
4. (Mrt L is LII3) 1-II S -7029 4151 -1968 -1S2 -45 1707 -1850 109 -2527
5. dMM 1dubt n mol 2.101 Le 2 a21 511OII &M7L 1519 &M 547 4s7s .588 5.516 5.137 1
IOM low7 2.7 2.406 2.415 2o0 4,255 3,160 2,751 3.978 4,368 5.468 4.608 5.060 I-F
Pp aid 04 239 l18 50 21 84 52 38 48 20 23 6 0 *
PR d1 1,473 1.908 226 2.65 3884 4,171 3,37 2,713 3.90 4.338 S,445 4.692 5,060
OD 814 1,306 123 m i.se I'm02 1.442 13 1'02 2807 3a973 4.107 4.444
Non-ODA 65 892 9 1,369 I2 2.26s 1.605 1.581 .996 1,531 13472 s58 6le
Nom-M 534 453 278 1,106 2.106 1.3 330 681 1,494 207 1,120 818 77
C hIIn 0 0 0 0 0 0 0 0 0 0 0 0 0
6. 432 t2 415 40 02 :1L -1129 1644 2129 -300 M 376 3666 -4225
7. O l5e42 -1312 -361 1.140 1.75 J.L1 499 52 IJ 1.709 -211 7 Lou
Dbee i _vegineu 27 217 140 142 311 193 245 no9 253 S44 K 722 1059
Oil 75 -1237 48 791 1.322 nA AA u. u. UA ua
o6mm 198 -292 384 207 162 998 2S 273 980 les -796 -147 3,99 a CDI-' Ft
8. Ta L (4 UmreM* 6 s56 3 s ass (1.159) MM 759 M 524 1528 755 806 MA
9. Erronw Miandi oo 42 -1256 .1165 -2050 .2121 247 -91 -4 -1262 57 -142 -558 341
10. M oust mwe.nsuib -94 -1628 -2674 9S 3O -2070 467 -0 738 1585 e73 24 -2784
/c n wo! ClioX
sowus Bon I I, udn

.
QOWRY ECONOMI C
Non - o Exos. 1984/8S 1989/90
Ve SS mio0) Voue (V00 tora)
1i98e 198is isS16 1987S88 luom loiom 1985MM ISs 18@87 s1 7/88 I9SMS S9iO
MS. 3.635 4.493S .74 GIM2 0.97
rwim 1,167 1,217 1,586 2,401 2,694 3,454 5,201 4,670 5,309 6,578 7,S38 7,524
a. Log 15 a 0 0 0 0 1,223 79 0 0 0 0
b. Pywo 607 848 1,160 1,851 2,005 2,430 2,105 2.495 2,959 3,840 4,381 5,051
c. Sawo tbwr 320 340 321 486 592 no 1,780 2,017 1,600 1,872 2,093 1,737
d. Oder 1 16 105 127 197 425 84 79 750 857 H4 736
tubbier 66 714 749 1,037 1,220 952 1,0U 1,082 1.062 1,187 1,220 1,217
pakn ad 95 170 114 214 313 270 175 504 560 703 SW8 943
caG 1S ues 753 4o9 577 448 s4s 2" 3s0 m 2S sss
Tea 211 134 106 119 137 176 91 102 03 08 11o 115
Tob 44 55 72 47 43 44 23 21 24 20 20 17
Pepper 66 8 152 58 14" 94 34 25 33 36 53 44
Cpra aco 18 35 84 41 43 51 213 433 348 384 335 460
Tapiota 31 42 52 03 154 97 418 534 439 s63 1,368 1,297
CIOM 906 O 90 162 37 0 101 92 116 135 30 0 I
Hkies 40 37 45 5s 68 60 2 a 30 6 4 4 I
Odin fod 98 3n i22 15 202 245 748 84 1,338 2,122 1,224 1,121 O
A* W 'pr 219 274 3go 4se 630 774 87 100 132 104 245 ON
of 4J*""sp 1.85 228 207 352 541 81S 44 52 53 s6 91 131
Odw 155 14 221 234 218 200 US 3 n n u na
#&mel 775 799 719 1.112 1.556 1.551
rm 252 248 156 143 165 213 22 23 24 22 24 26
Cpr 12 138 144 16 238 321 242 270 271 200 318 341
Nlkw 121 130 112 152 A8 373 955 043 1,288 1,456 1,502 1,058
Aluinm 205 223 201 245 301 267 155 219 177 151 124 164
GrnIe 9 8 8 6 6 8 1,30o 1,104 I,m m 860 0971
Odlen 53 40 S8 379 407 3s0 n.s 65,546 na n.A na D- a Oft
M &uhd 1.460 1.739 1.519 2.26 S.701 5.s1
T061e 418 677 713 1,128 1,571 2,171 n. 111 na n n.e n.9 . l
Hanfia'a~ 6lie 30 So 67 184 250 na 26 n.a Us n na MA
0 edsic app. 134 109 45 55 105 173 nu. J na na na na
Canemw 14 23 47 54 as 128 516 955 2,012 2,316 3,316 & 00S
Nam 31 109 97 117 Ise 165 208 1,047 1,212 1,2B6 1.011 1,701
ObeM 757 892 585 1,205 1,619 3,084 na 2,494 na na na Da
LJndrued~~~~~~ed ~0 0 0 0 0 0 0 0 0 0 0 0
Takll Non IS " MM O.173 6.731 9502 12.184 14 403
So5mc: B I hidneua based on PMB Epw Dedallon Fohml.

NONESLA
COUNTRY ECONOMIC REPORT
Value of Exfods hi Prye l Countr' of Destination, 1978-1990
(US5$ migion)
Countries 1978 1979 1980 1981 1982 1083 1984 1985 1986 1987 1988 1969 1990/A
Asean 1.478 2.233 3.054 3.415 3.499 3.476 2.487 1.982 1.515 1.703 2.079 2429 1.985
Maksi 21 60 07 75 59 5S 98 77 82 94 184 220 193
UIciland is 38 33 35 26 49 98 el 83 87 151 234 157
Plippines 198 165 181 411 293 242 166 199 108 71 87 149 119
Sinapr 1,241 1,964 2,771 2,894 3,121 3,128 2,126 1,426 1,239 1,449 1.653 1,818 1.506
Brunei 0 0 0 0 0 0 0 0 2 3 4 8 8
Ibning 43 98 152 135 145 182 261 348 345 420 554 549 524
jgpan 4.586 7.192 12.042 11.950 11.193 9.078 10353 8,594 6.04 7.393 8.018 9.321 a87
Other Asia 631 807 802 805 970 801 1.254 1.475 1,170 1.869 2.415 2.934 3.116
Aflka 37 32 56 37 57 79 140 16O 179 150 272 217 160
USA 2 71 1 4 42 450 4040 902 349 074 497 2.798
Can1ada 30 28 28 22 19 28 4q 46 60 101 106 118
Ote America 76 43t 956 LO 929 1.015 1.03 826 182 48 47 50 76 a
AwrdlOl 107 190 338 447 674 28 275 149 IN9 810 293 387 324
OiierOceania 7 52 ic 211 278 264 236 81 83 43 3 19 6
EEC 874 1.173 I.3 1.083 894 953 1.030 I.11 40 I.541 2.152 2.3 &M
U,,a.d *gm F54 89 142 131 126 199 166 191 197 212 349 384 400
N_kh d 55 398 415 347 205 28 332 392 45S 493 646 651
Weot Geimany 226 338 369 239 253 252 246 255 334 NI1 456 493 5s
itwnk & Luemur is 8 i 25 is 20 3S 0 $ 45 S G 09 17 173 m 175
Fmne 54 77 127 52 77 53 49 71 03 1O2 1e4 200 22
Dalxm 40 43 40 is 10 4 6 3 O 13 20 StS 41 et"
t&wI I O I O O t 4 2 2 7 17 22 215 0
* ~~~~~~~~~12Ct 210 254 168 142 120 1t57' 1522 1522 1m 221 2t4 219 rtm
Clemc 0 03 1 3 3 4 St
Patu 9 e o o e~~~~~~~~~~~~~~~~~0 ol ' 7 10 21t 24 IS w ct
Spai O O O O O O O O 5 78 eoD 107
Sovid Urion 52 55 73 SO 22 50 S9 78 S2 82 38 100 71
ot~~~~~~~~~~~~~ils i9110 15 2 l87 102 14S 2 M t 19 174 1St I" 171 145
Tdal 11.043 I5.50 2Lll50 25,6 22.328 21,4 A Oa587 14&05 17.13O 19.219 I 2D X/ctebnmaikdmer 1990.
/Ia na.
Italy 126 2102r4 168 14B120 1675o1521s5 222 234 21

COUNRY ECONOMC REPOIt
Value of ImWoN" by InCw Cov ef Of in. 1978-1990(US5$ mMiin)
Countnes 1978 1979 1980 1981 1982 1983 1984 A 1985 19 1987 1988 in 1990 b
Amon 652 839 1.350 1.702 3.202 3.915 I 962 1.121 1.244 5.305 I. 1.184
akIoiao 22 35 36 60 56 60 86 52 50 139 276 369 223
Th oiand 101 219 288 146 199 209 55 48 72 75 96 210 147
Philippines 78 49 90 253 228 12 15 23 iA 82 36 63 53
Singapore 453 536 936 1,243 2,819 3,463 1,791 8s 969 947 896 1,122 781
9wnew 0 0 0 0 0 0 0 0 1 0 1 2 0
142 102 139 68 87 6s 8s 53 94 104 133 179 231
2.016 2.103 3.413 3J8 4 279 3.793 a sX 2.0U 3.128 %5" 3.383 3.767 4.195
As______ 995 1.249 M92 MM _2 .452 2.220 2. 1.727 1.81 1.924 3,= sen
Alica 69 132 130 252 202 135 171 I6O 103 153 201 202 158
USA 8S2 7 I. 1.409 1.795 2.417 2"S 2.WO 1.721 1.483 1iA4 1.73B 2.218 2.007
anadoa 83 73 97 102 138 188 319 198 214 30S 274 311 S45
Ol Amriwc 77 56 111 26 16 129 19 191 174 211 224 455 454 N
Ah0ab 218 223 378 302 SO5 402 372 461 413 463 58 92 9SS
OdterOceaflba 36 43 70 98 90 72 78 89 71 80 9s 98 99
EC 1IW7. 1.074 1.445 22G0 2.656 2.234 2&M 5 .700 1.790 2 2.510 2.5S 3.189
Ulited rAt all 208 198 261 547 445 364 297 300 342 S25 340 30 3n
Ndklan 140 119 110 20S 185 2S7 206 215 I1N 316 28 248 4n2
Wesd German y9 402 a8s 90S 1193 741 ON 077 719 e 8S7 9N 1171
Beugirn & Lue^n 33 e3 56 86 97 124 102 101 so 142 159 167 179
Fiwrce 166 143 236 344 571 591 432 284 281 392 465 406 547
Demaik 60 19 12 14 54 21 20 18 26 2 22 31 53
Irekld 2 2 3 4 4 8 8 9 4 6 6 8 11 ' '
taly S9 67 76 9B 104 125 113 101 144 237 248 348 23 ID 2
G em 0 0 0 0 3 4 0 0 2 3 S 5 I r
Paougat O 0 0 0 0 0 0 2 6 3 2 5
Spin 0 0 0 0 0 0 0 0 66 129 82 123 W Ft
S$*VtWUi L 15 14 20 41 39 25 12 3 5 16 45 51 _4
287 269 274 412 663 64 490 36 435 s10 494 611 636
Toga UN 7.203 10.834 13!272 16.85m 16352 3 10.2 10.719 12.370 134 16.360 iL7 .
/a Snce 1984, aU,dw vcWieo4 pF dea1 s in de ad ecor./b6 wary4.Oober 1990.
Saw C*al Buewa of Stiic

- 173 - Statistical AnnexTable 4.1
I1NDONESIA
COUNTRY ECONOMIC REPORT
Bummri of Exteral Debt D°taO 1f80-90 g
1980 1981 1982 1983 1984 1985 1986 1987 1988 1989 1990
External debt data (USS milhloat
Disbursed ani outstandins debt(DOD) L 13.377 1S.90 lS.318 21.494 2Z7Q 26768 3Z628 40.899 41247 41.203 427
BilateralVmultilateral 8.608 10.096 10,913 11,818 12,177 15,053 18,559 24,782 26,S45 28,256 32Z452Other Lc 4,769 5,813 7,405 9,676 10,063 11,714 14,069 16,117 14,702 12,947 11,823
Total debt outstandin. includingundisbursed (TDO) 21.302 26.953 32.008 35.28 3 2 42.761 50.063 60.421 60.093 59.707 64.2S5
Bilateral/multilateral 14.100 17,705 19,326 20,546 21,486 25,336 29,454 37,310 38,957 41,305 46,275Other /& 7,002 9,248 12,682 14,741 14,856 .7,425 20.609 23,111 21.1t6 18,402 18,010
Commitments 4.101 4.951 7.070 5.677 4.816 4.627 4.103 S997 6.S7 7.04S S.870Bilateral/multilateral 2,251 2,157 2,593 2,24 2,745 2,42i 2,004 4,785 4,782 5,632 4,851Other /c 1,850 279S 4,477 3,393 2,071 2,206 2,099 1,202 1,27S 1,413 1,019
Gross disbursements 1.888 Z672 3.951 4.979 3.S6 356 424 S.4A8 6.439 o.4SS 4.611BilateraUmultilateral 826 1,362 1,59S 1,737 1,911 1,641 1,904 3,692 4,287 4.274 4,005Other /L 1,062 1,310 Z,356 3,242 1,953 1,928 2340 1,766 2,U12 2,211 606
Net disbursements 5S4 1.618 Z.847 3.689 22 !2 t.622 2.02 '-Oi 2.142 506Bilateral/multilateral 555 985 1,126 1,186 1,342 1,026 1,011 2,541 2,951 2,899 2402Other Lc -1 633 1,721 Z,503 922 213 611 .489 -950 -7S7 -1896
Net resource transfers -216 628 1.715 2.4S6 63S 403 .449 -221 *526 -360 -2034Bilateral/multilateral 259 654 732 733 776 330 85 1,460 1,642 1,504 800Other le *475 .26 983 1723 -141 .733 -535 -1680 -2167 -1864 *2S34
Public debt service 2.103 045 2.36 23 3. 3.2 4694 .679 6. 6.84S 6b64Amortization 1,329 1.054 1.104 1,290 1.600 2,i0 2622 3,406 4,439 4,343 4,10SInterest 774 991 1,132 1,233 1.629 1,643 2,072 2,273 2,S26 2,501 2,540
Public debt service 2.103 2.04S 2.2 Z23 32 3.972 4.694 SA79 6.96S 6.845 6.645Bilateral/multilateral 567 708 8$63 1,004 1,135 1,311 1,819 2,232 2,645 2,770 3,204Other L! 1,536 1,336 1373 1,519 2,093 2,661 Z,875 3,447 4,320 4,075 3,440
Disbursement ind.cators M
Undisbursed debt/TDO /b 37 41 43 39 39 37 35 32 31 31 31Bilateral/multilateral 40 43 44 42 43 41 37 34 32 32 30Other L 32 37 42 34 32 33 32 30 30 30 34
Gross disbursements/commit. 46 54 S6 8 80 77 103 79 106 92 nBilateral/mullilateral 37 63 62 76 70 68 95 77 90 76 83Other & 57 47 53 96 94 87 III 147 169 156 59
Gross disbursements/undisburseddebt and commitments /d 19 21 24 3 24 24 Z2 28 32 S
Bilateralt/multilateral 12 14 14 16 16 13 iS 21 25 23 21Other L 32 21 24 38 28 24 27 22 28 32 S
Net disbursemnts/gross disbs. 29 61 7 74 S9 35 38 31 33 11Biiateralmultilateral 67 72 71 68 70 63 53 69 69 68 60Other & 0 48 73 77 47 11 26 -28 -44 -34 -313
Net resource transfers/cross disbs. -11 23 43 49 16 -11 -11 *4 *8 *6 t44Bilateranmultiateral 31 4S 46 42 41 20 4 40 38 35 20Other l! *45 -2 42 53 -7 -38 -23 .95 -101 -84 468
La Data in thi sector refer to public medium and long term loans. Loans with a maturity of leus than one year, credits for LNS expansion, LPO and paraxyleneprojects, and gants are not included.
/! End of year./C Supplier' credits, loans from financal institutioao, export credits, bonds and nationalization only.d OGross disbursements as a percentage of undisbursed debt (TDO-DOD) at beginning of year plus commitments durig the year.
Sourwe IBRD Debtor Repornbg System, based on data provided by Bank Indonesia.

- 174 - Statistical AnnexTable 4.2
INDONESIA Page 1 of 2
COUNTRY ECONOMIC REPORT
External Public Debt Outetandina as of December 31. 1990(USS '000)
Type of creditor/ Debt outstanding Major reportedcreditor country Disbursed Undisbursed Total new commitments
Jan 1-Dec 31 1990
Suppliers' CreditsFinland 10,808 3,051 13,859 0France 38 38 0Japan 2,661,129 2,214,227 4,875,356 202,933Korea, Republic of 9,79S * 9,79S 0Pakistan 5,073 5,073 0Switzerland 1,258 1,258 0Yugoslavia 1,383 - 1,383 0
Total suppliers' credits 2.689.484 2.217.278 4.906.762 202.933
Financial InstitutionsFrance 129,319 10,355 139,674 0Germany, Fed. Rep. of 5,239 5,239 0Hong Kong 954,370 1,220,417 2,174,787 400,000Italy 2,68S - 2,68S 0Japan 3,199,385 758,729 3,958,114 0Multiple Lenders 281,250 - 281,250 0Netherlands 2,869 2,869 0Singapore 114,202 114,202 0United Kingdom 270,710 192,800 463,510 0United States 505,439 270,000 775,439 0
Total financial institutions S.465.470 2.4S2.301 7.917.769 400.00
BondsGeimany, Fed. Rep. of 200,803 200,803 0Kuwait 6,864 6,864 0Netherlands 17,751 - 17,751 0Switzerland 82,500 82,500 0United Kingdom 88,100 88,100 0United States 300,000 300,000 0
Total bonds 696,019 0 696.019 0
NationalizationNetherlands 133,491 - 133,491 0
Total nationalization 133.491 _ 133.491 0
Multilateral LoansAsian Dev. Bank 3,138,614 2,397,904 5,536,518 89S,185EEC 4,297 - 4,297 0IBRD 9,542,263 4,367,008 13,909,271 1,56S,200IDA 842,438 842,438 0Intl. Fund A,r. Dev. (IFAD) 44,176 75,117 119.293 0Islamic Dev. Bank 691 * 691 0Nordic Invest. Bank 26,000 49,300 7S,300 10,800
Total multilateral loans 13.598,480 6.889.329 20.487.808 2,471.18S

- 175 - Statistical AnnexTable 4.2
INDONESIA Page 2 of 2
COUNTRY ECONOMIC REPORT
External Public Debt Outstandina *e of December 31. 1990(US$ '000)
Type of creditor/ Debt outstanding Major reportedcreditor country Disbursed Undisburmed Total new commitments
Jan 1-Dec 31 1990
Bilateral LoansAustralia 273,683 223,242 496,925 188,892Austria 57,138 28,121 85,259 0Belgium 100,283 1,378 101,661 0Brunei 100,000 100,000 0Bulgaria 995 995 0Canada 339,260 76,525 41S,78S 8,627China 26,901 26,901 0Czechoslovakia 33,173 33,173 0Denmark 30,710 - 30,710 0Egypt, Arab Republic of 1,433 - 1,433 0France 708,888 336,330 1,04S,218 45,750German Dem. Rep. 27,281 27,281 0Germany, Fed.Rep.of 1,947,364 883,476 2,830,840 276,038Hungary 8,275 - 8,275 0India 18,651 4,521 23,172 0Italy 53,616 36,346 89,962 0Japan 10,821,334 4,398,056 15,219,390 1,640,682Korea, Republic of 0 12,480 12,480 0Kuwait 73,582 58,956 132,538 0Netherlands 1,155,608 161,273 1,316,881 95,790New Zealand 1,046 - 1,046 0Other 20,000 * 20,000 0Pakistan 3,483 - 3,483 0Poland 46,595 46,595 0Romania 6,680 - 6,680 0Saudi Arabia 76,109 73,019 149,128 0Spain 128 33,S74 33,702 10,600Switzerland 286 39,081 39,367 0United Arab Emirates 5,015 1,713 6,728 0United Kingdom 49,480 69,680 119,160 0United States 2,365,039 495,459 ;2,860,498 113,769USSR 445,655 445,655 0Yugoslavia 55,849 . 55,849 0
Total bilateral loans 18.853.541 6.933.230 25.786.769 2.380.147
Export CreditsAustria 139,337 48,090 187,427 3S,252Belgium 118,998 127,088 246,086 S,65SFrance 854,279 725,285 1,579,564 107,259Germany, Fed.Rep.of 226,692 49,576 276,268 30,553Japan 191,353 73,488 264,841 58,154Netherlands 275,279 145,548 420,827 7,232Norway 4,297 - 4,297 0Singapore 6,143 6,143 0Sweden 179,649 * 179,649 0Switzerland 70,121 30,315 100,436 0United Kingdom 772,514 318,096 1,090,610 171,889
Total export credits 2.838,663 1.517.486 4.356.147 415.995
Total external public debt 4.717 20.00 L§2L
Source: IBRD Debtor Reporting System, based on data provided by Bank Indonesia.

INDONESIA
COUNTRY ECONOMIC REPORT
Service Paymnents. Commitments. Disbursements and Ouitnding Amounts of Exterrai Public Debt
(USS '000)
Debt outstanding at Transactions during period Other aCanges
end of periodDisbursed Including Comnmit- Disbur;e- Service Payments Cancel- Adjust-
only Undisbursed ments ments Prncipal Interest Total lations ment /a
Actual
1980 15,021,487 24,502,044 4,277,373 2,550,505 939,185 823,138 1,762,323 118,261 .19,644
1981 15,908,458 26,953,145 4,951,129 2,672,429 1,054,106 990,708 2,044,814 163,286 -1,669,042
1982 18,317,545 32,007,959 7,069,817 3,951,336 1,104,100 1,132,291 2,236,391 7,043 -903,858
1983 21,493,904 35,287,509 5,676,879 4,979,024 1,289,872 1,233,096 2,522,968 197,669 -909,788
1984 22,239,783 36,342,169 4,816,038 3,863,539 1,599,633 1,628,812 3,228,445 25,234 -2,136,511 £
1985 26,767,503 42,761,302 4,626,913 3,568,931 2,329,754 1,642,524 3,972,278 514,889 4,636,864
1986 32,628,322 50,062,964 4,103,343 4,244,394 2,621,963 2,071,669 4,693,632 183,468 6,003,750
1987 40,899,085 60,421,449 5,986,887 5,458,030 3,405,766 2,272,912 5,678,678 638,080 8,415,444
1988 41,247,150 60,092,914 6,056,892 6,439,036 4,438,606 2,526,007 6,964,613 508,737 -1,438,083
1989 41,202,745 59,706,875 7,044,817 6,485,156 4,343,281 2,501,407 6,844,688 291,576 -2,795,998
1990 44,275,147 64,284,765 5,870,260 4,611,108 4,105,296 2,539,615 6,644,912 636,S98 3,449,925
Projected
1991 45,003,6i5 55,922,461 - 5,12k ,782 4,398,989 2,797,251 7,196,240 3962,025 -1,289
1992 44,619,521 51,501,227 - 4,037,106 4,421,236 2,749,030 7,170,267 - 3
1993 42,69,476 46,840,933 - 2,737,269 4,660,315 2,605,926 7,266,241 - 20
1994 40,477,197 42,896,418 - 1,725,240 3,944,520 2,384,670 6,329,190 - 4
1995 37,869,152 39,183,223 - 1,105,161 3,713,205 2,199,223 5,912,428 - 10 .e u
1996 35,304,454 35,853,681 - 764,873 3,329,571 2,011,626 5,341,197 - 29 X 0
1997 32,503,491 32,672,315 - 380,476 3,181,439 1,833,793 5,015232 - 73 tS
.1- rtw n
a Thi column show the amount of arithmetic imbalances in the amount outstanding, including undisbursed, from one year to the net lhe most
common causes of imbalance are changes in exchange rates and transfers of debts from one category to another in the table.
Source: IBRD Debtor Reporting Sgstem, based on data provided by Bank Indonesa

- 177 - Statistical AnnexTable 4.4
s2Nl ONESIA.
DEVELOPMENT ARSISTANCZ PLOWS. IflMS0 /a(US$ mIion)
1005 e108 10n? l0s 1080COUNTRES Comm. /b Dib. /c Comm. /b Disb. /c Comm. /b Dlab. /c CoMM /b DBab. /c ComnL /b DBab. /e
Gros Net Gross Net Grow Not Grow Not Gos Net
IGGI embeMe:AUSRALIA 56.6 40.8 46.8 42.1 42.0 42.0 2.2 48.2 48.2 84.0 71.7 71.7 106.2 88.1 83AUSTRIA 0.6 0.5 0.5 0.2 0.2 0.2 17.6 0.6 0.6 19.2 10.5 6.0 20.7 15.7 4.4
BELGCIW 2.3 4.7 3.4 5.6 13.4 11.3 7.1 6.6 5.8 11.9 13.3 6.3 10.7 10.7 10.7
CANADA 12.3 35.9 34.1 54.2 54.2 52.1 37.6 45.4 42.0 es.0 43.3 40.1 81.7 38.4 234
FRANCE 26.0 27.7 20.6 8.3 40.0 30.2 46.7 43.5 37.3 187.2 67.6 57.1 218.0 116.3 10.0
GERMANY 136.7 120.0 86.9 44.8 I83.0 126.1 120.0 140.4 61.8 ISI.4 100.2 07.6 170.4 158.0 S54IrAtY 19.0 1.4 1.2 15.7 12.1 11.8 3.9 18.8 10.4 8.1 28 1.3 48.4 21.2 1T.5
JAPAN 098.8 282.8 101.3 165.6 337.1 10.8 1.336.3 041.1 707.3 1.701.0 1.264.T 084. 1465.2 ;,'07.1 1.145.3
NErERLAND 43.2 70.8 56.6 102.3 108.8 00.6 17 165.0 140.3 254.6 186.5 156.2 222.2 101.0 161.5
- ' ZEALAND 1.4 1.5 1.5 1.2 2.1 2.4 *.' 2.1 2.1 S.4 23 2.3 2.2 2SPAIN * *Z .S3.0SW -2ERLAND 5.5 6.0 6.0 20.0 0.7 9.7 16. 7.4 7.4 .8.3 28.4 28.4 7.0 21.4 21A.
UNITED KINGDOM 25.6 41.2 38.0 9.4 10.9 7.3 23.3 14.5 10.4 2.5 21.7 17.2 4S.2 18.2 14.5
UNITED STATES 108.2 101.0 43.0 106.7 104.0 46.0 124.2 e0.0 26.0 70.6 86.0 2O 64.4 07.0 31.0
Other DAC cnmtrles:DENMARK 11.3 0.0 (0.2) 0.1 0.2 (0.2) 0.8 0.3 1.1 0.5 3.4 11.6 11.1FENLAND 4.5 1.4 1.4 5.3 1.4 1.4 1.7 1.8 1.8 s8 3.3 l3 0.6 5.8 5.8MRELAND . 0.1 0.1 0.1NORWAY 1.6 1.7 1.6 4.6 4.2 4.2 3 . 0.8 0.6 2.2 20 1.2 0.5SWEDEN - . . . .
ARAB COUNTRES s 2 13 5 12 24 7 SL3 121 to Mt ILl.. 10.7 27. _- o L 5.L
82!BXOIhL 14111 ThU. 5 J. 612.9 8 502 7 9 825.3 1.076.8 A1457.11- ll63310 0 2.023.6 1506.9 2.557.0 L2.2 L3 1.705A
AS.D.B. 203.1 186.2 139.6 457.3 205.3 170.0 570.8 353.1 300.0 564.4 520.9 469.6 507.5 701.2 631.7
.E.C. 0.3 8.0 8.6 24.0 7.3 7.8 37.2 0.3 0.3 2.9 8.3 8s 1.3 14.9 14.8
8RD 1,068.1 738.6 611.3 082.1 810.1 579.5 1,418.0 1.350.9 1,004.1 1,066.0 1.647.9 1,219.3 S 2,7.4 1,256.4 783.4
MDA . 38.4 32.7 . 18.1 12.4 '4.4 8.7 1.3 (4.8) 1.1 (7.0)
IFAD 12.8 13.3 12.1 0.2 17.6 13.2 I3.7 .6.9 15.6 0.3 12.2 10.8 _ I.6 10.1
U.N. kGENCS 93.0 341 34.1 43.9 402o 40. 0 2. , 2 L9 4UA9 47.5 4002 4010 SSI. iL M&lUNDP 14.3 14.3 15.6 15.6 . 21.2 21 1 - 3o.0 20.6 19.1 19.1
UNTA . 4.6 4.6 3.0 3.6 5.1 51 3.7 3.7 . 5.2 5.2
UNICEF - 7.6 7.6 0.3 9.3 . 10.5 10.5 - 11.9 0 11 11.3 11.3
UNEWA . . . . .
WYP - 4.4 4.4 9.0 9.0 5.2 5.2 - 2.7 2.7 7.7 7.7
UNICR - 3.2 3.2 2.5 2.5 2.0 2.9 1.7 1.7 - 2 2.0OTHER UL7T.ATERAL 5.9 5.9 4.0 4.0 * S.3 5.3 * 6.7 6.7 8.S 8.
ARAB AGENCIES 7.4 0.3 0.0 .3 4.3 , 0.2 (1.0) - 0.3 (1.4) (1.0)
1.S3916 1.005.5 S44.4 15507.5 1.L076 83s.8 2.css 1010 L3.0 1.081.7 8L247.2 L1742.0 s.e6s s A s s141
trL ,2S04 ~~1763. UILL 2.121.3 2.071.3 1.450.1 4.056,,,, J6 4202.5s SJ;,,Sb25
o 5.2163. hJiL&Wl.L
Ia Czae year./b Commltments./c Diabursements.
Sourer: OECD: *sographical Dtstribution of FIaal Flown to Developing Cowutriee; World nk. Debtor Reporting System

INDONESIA
COUNlRY ECONOMIC REPORT
Cntral Govement Budet Summary, 1978/791991/92
Actual Budge1978/79 1979/80 1980/1 1981/82 1982/3 1983/84 198445 1985/88 198/87 198743 198849 1989/90 1990/91 199142
1. Domeskc revenues 4,260 6.697 10,227 12,213 12,418 14,433 15,906 19,253 16.141 20,803 23,004 28,740 31,584 40,184
2. Rotine epndtu /a 2,744 4,062 5,800 6,978 6,996 8,412 9,429 11,952 13,559 17,482 20,739 24,331 26,648 30,558
3. Governmet savna 1.2) 1.522 2.635 4427 5.235 .021 6477 7.301 2.581 3.322 2.265 4.40 4.938 96
4. Developmen apenditures 2,556 4,014 5,916 6,940 7,360 9,899 9,952 10,873 8,332 9,477 12,251 13,834 16,225 19,998
S. Blabnce (3-.) (1.033) (1.379) (1.489) (1.705) (1.938) (3.8781 (3.475) (3.572) (5.751) (.156) (9.985) 420 (11.20) (10.372)
Financed by.
6. Prgram aid 48 65 64 45 1S 15 69 69 1,958 728 2,041 1.007 2,885 1.538
7. Proed aid 987 1,310 1,430 1,064 ,925 3,868 3.409 3.503 3,795 5,430 7,950 8.422 8,404 8834
8. Chanre in balances= nx'easej (2) (2) (5) (4) (2) (4) (3) (1) (2) (2) (5) (4) (0) 0
/a Indudes debt sexne payent.
Suc: Minit of Fiance.
I-3 Enrtort
Urttne
01I.-
X9

NDONESIA
COUNTRY ECONOMIC REPORT
Central g60rnm LReobt. 1978/79 . 1991/92(Rp billion)
Actual Budget
I1.,?g 19790 198091 198i1 lo2 982/m 1983s4 I4 19 I45 1985/9 86/87 1987/88 1988/89 1989/90 1990/91 1991/92
Tos n inome 29 5.129 as 10.100 10.010 11.606 12.847 .,025 8.798 12.98 139901 17t30 17a919 23.669
hcome taxu122 148 164 207 289 399 451 675 2.271 2,663 3,949 ,488 6,516 8,021
Cupame tax /b a 227 297 448 s59 675 757 1,670 I,638
Coparoa ta ' ad /b 2,309 4,260 7,320 8,628 8,170 9,520 10,430 11,144 6,338 10,047 9,527 11,252 10,783 15.009
Wabhidng tax /b 233 291 434 513 642 62s
FE /pr tax /c 3 71 87 95 105 132 157 168 190 275 424 590 620 839
Odi /d 43 62 78 99 129 1s6 138
Tam an doffmkJ amsumSion 491 537 738 888 1.187 1.392 1.510 3.479 5.156 4.719 6.187 !7A 9.025 10.790
Saks/ edd km 221 192 266 3l 477 575 e67 2,327 2,900 3,390 4,505 5.837 6.25 8.224
Exdses 253 328 438 544 620 773 873 944 1,056 1,106 1.390 1,477 1,911 2,215
Other adq ewes /e0 0 0 0 0 0 0 0 1,010 0 0 0 0 0
Mlscelaneouslevies 17 19 29 33 41 44 0 208 190 223 292 276 289 351
Tomsan Intalonal kade 887 843 48 sm 835 916 s2 658 1.039 1.122 1.348 1.759 2 s 2.695
295 317 i44 s36 522 557 530 607 960 938 1,192 1,587 1,972 2,574
Wses "x on voft /f 129 137 195 223 231 255 241
6pautax 166 389 305 128 83 104 91 51 79 184 156 172 106 121
Nonrm Miph91 187 16S 336 436 S20 687 1.492 1.147 1.977 1.569 2.002 2,so 2.831
Domestic _mumJe J 6.697 10.227 12.213 I2418 14.438 15.906 19.253 16.141 20 8D3 2 8.O04 28740 31.584 40.184
PMOMM2d funds 1.056 1.381 1.494 1.709 IJMO 3. 82 3.478 _.573 5.752 §.158 9.91 94 11290 10.372
nmco. aid 48 65 64 45 15 15 6s 69 1.958 728 2,041 1,007 2,895 1,538
Poet dd /9 987 1,316 1,430 1,664 1,925 3,868 3,409 3,503 3,795 5,430 7,950 8a422 8404 8,834
Total renesuies 5.202 ao7s 11.731 122 Js 18.315 19.384 22ss 21S 289L 32.995 SS916 42.7S 50.55S
ta S 1986/87 induded In kiconm tax.hb SIne 1984/85, withoding to, tmixted as eparde caegy and combined wfh income tCDC rt
/c Si enuy 1986, Ipeda replacd by ban and buildig taDL a 0D
/d clawfication dcnged to der tax _ied in mrisr4oneous las vwh coit of oiher toes and damp duA.
Aebd d ahdd^sbn a 0aseeme lu RAs brIn i977/78 (see fable 5.3).if Sie 1984/85 daS laion c d to value.added tX and tax wi klAay oods./9 Inudes commerdcia baki ad sppl: ' adits for dvelopmet pot. ds.
Source: Minishy of finance.
0

INDONESIA
COUNTRY ECONOMIC REPORT
Cmntral Gavernme Ebc e. 1978/79 - 1991/92(Rp. bilrion)
Actul Budget
197879 197940 196041 198142 198243 1934 19844S 1985 198647 198748 198l89 1989/90 199091 1991/92
P afsmw ewwxqm L.OD12 1.420 20 2Z 2.418 2.757 3.047 4.018 4.311 4.017 4.98 0.202 8.90 7.753
Wage" and sandes 700 1,054 1,483 1.680 1,749 1,996 2,207 3.073 3,330 3,561 3833 4,826 5.487 e.08s
Rike cow*nc 133 18 0 252 253 290 346 407 402 400 451 518 588 636 769
Food alwonce 51 110 193 241 255 261 271 300 288 299 327 373 381 43B
Oiiet 34 47 61 80 79 88 90 161 177 176 185 243 216 267
E2telmal 24 29 34 43 46 so 72 82 110 130 135 171 190 215
matelitll azpelts 420 569 671 922 1.041 1.057 1.183 1.367 1.366 I.32 1.492 1.702 1.721 2.201
Dometc 398 540 6 891 1,007 1,007 1,134 1.310 1.294 1,239 1,378 1.509 1,568 2.038
Eaermal 21 29 33 32 S4 s0 49 58 73 90 114 133 153 162
Sbsidies to em / 522 670 978 1.209 1.315 1.547 1.83 2.s 2.s50 2.816 3.038 3.50 477 4.0
kioniya 2n 25 34 4 43 42 0 0 0 0 0 0 0 0
Oilr ion 500 645 942 1,16 1272 1.505 I,'m3 2,489 2,650 2,816 3.038 3,50 4,227 4,660 1
DeW Ent! PC" 535 6S4 785 931 1.225 2.103 2.777 a 5 .058 82 10.940 11.939 12M98 4 14,81 co
9 .7 31 16 20 30 39 20 0 39 78 149 245 251 °
Edni 526 648 754 918 1,295 2,073 2,737 s.as 5.058 8,1Bi 10,863 11,790 12,739 14,130 1
odw "Wombr m2 719 1.345 1.037 997 948 540 754 174 515 271 923 807 I-303
ood 144 125 282 224 1 0 0 0 29 0 0 0 0 0
Odaibeldy l97 535 1,022 1,316 962 928 507 374 0 0 0 0 627 1,187
Ouhers/b 25 59 42 97 34 20 33 380 145 515 271 92 ISO 37
Rn 3 _ 2.74 4.o$2 SAN0 a" S.J 8,412 9.429 11952 13.559 17!42 20.739 24.s31 26.60 30.558
Dewknien eeiLe 2.45 4.014 5.916 o. !7.38 9099 9.952 10873 sa2 9,477 12.251 1S34 16225 19.99s
Takl me ike 5.299 a 7 11L7 13.918 14S586 18.31 1 19.381 21.91I a 32.s990 s3815 42.973 50.558 lb
/a Sine 194/854 J S , b n"vk6d hb w p-s e ndjyas wthwq /s regpon . t
/b Thi e bo , dew u e tvui . to PFERTAMINA (1976/77 . Rp. 31.0 blUan, 1977/78 Rp. 8 P3ERARMNA skud (1979/80 - Rp. 81.0 bilion) and expendiures an
de gera eedion 11976/77 - Rp. 37.0 blion, 1981/82 - Rp. 81.0 bCbon, 1985/86 - Rp. 40.0 billon. t
/c For ddc see Tabls 5.4 and 5.5.
Soe M qe'. of Fin.X

COUNTRY ECONOMIC REPORT
De _LO ,ndums 1978/79 - 1W/92(Rp. bilion)
Adual sudwe1978/79 197940 1980/81 1912 1982JSS 198I 1984S5 198546 198047 1987/48 19889 1989f90 1990/91 1991/92
1. Dcet 8~~~~~~~~S31 1.480 2.=S 2 t25 3.201 S.220 3.474 L4047 2.a004 2.113 1.801 2.509 4.310 0.447
2. GQwfd WR elt2|tsI182 219 337 448 535 539 540 575 56S 656 714 700 1.058 1.4S5SubsbcHo to i 87 101 167 215 253 253 253 287 293 290 334 324 486 594
Subdesb io b 71 87 119 163 194 194 195 189 18S 203 267 270 392 591Subhid etoA 9 es 24 31 51 71 88 92 93 99 86 102 112 112 181 250
3. Sedoni MI&S DlBWa176 252 377 585 4 771 824 754 721 451 429 466 1.274 1.843Plitxly a ob 7112 156 250 375 207 549 S72 526 490 193 131 100 370 522Health 27 30 50 79 so 87 65 111 108 74 99 122 189 209MmAbs 1 12 3 6 5 11 26 4 12 3 3 3 3 3
Ro ai36 41 49 70 SO 59 S1 43 31 16 17 16 33 75ROach 0 13 26 55 42 65 101 70 7 164 ISO 225 679 975
4. M b 63 71 67 95 105 132 157 168 171 223 344 478 503 679 X
5. hIm i o and EasgTor 10 7 6 7 6 5 4 7 7 0 0 0 0
Totl 12. Trnm to lcal 4o31 49Os N43 54 I.g 1134 190 1.44S 1.S26 1.s0 1.467 1.4 1,486 1.61 2 3a957
6. Far z y 3 1?S5 284 37 420 324 732 477 4. 756 200 278 155 173
7. Goment a*al pabdtgon (PAP) 129 253 477 481 337 s92 336 412 ss 336 125 141 75 95
8.om 75 291 386 565 327 449 475 511 514 515 6 765 _4 to r.
VI ft
(oj. ,Total ( -8) L seli 5.27 5t .435 e.o 6.543 7ts70 4_s3t 5.04 4.301 s.s43 7.S21 3j.u J z
9. PIh dd /a 987 1.316 1.40 1.O4 1.925 s ss .400 S5so 3.79s 4.4=s 7J= &422 M.04 as83 o
TebliI 11 . 9) 2s 4.014 5.91t fMQ 7t sW 9.9s2 10.8t3 a 2 90.477 251 13.7 ISMS 19.098
/a For 1987/88 elhdg pre dd in Rupicb./b Lan ad Bdln kwi - tas frim Cntral Goverme to all g rmenw1t (PEDA pdor to December 1985).
Sworc Ah*hyt of Fha-ce.

- 182 - ~~Statistical AnnexTab le 5. 5
N~~~~~~~~~~~~~~~~~~~~~~~~~~ N XII 3a
_ ! - ! -
!~~ I X a |
8 G O U - l. _ I_ ~ ~ ~~- -q l g| G{
g 8 | | G " i N C I
ij ! {a a a a " a a | 8 g 1 j~~ | | igaffi| || | 1
fit '!IIIiIPIIiI ii i i ! t I

hN4DONESIA
COUNIW ECONOMIC REPORT
Prolec Aid by Sodor, 1978/79 1991192(Rp. billion)
Actual Budget
1978/79 1979/80 1980/81 1981/82 1982/83 1983184 1984/85 1985i86 1986/87 1987/88 1988/89 1989/90 1990/91 1991/92
Agricultue and Irigation 135 155 223 136 101 155 472 180 237 576 1,087 1,675 1,756 1,924
Industry and mning 199 307 226 581 734 1,051 671 668 632 267 327 492 564 597
Electric power 208 267 265 308 506 1,182 653 1,172 791 769 1,783 1,400 1,3S4 1,692
T1sPGrtaion and tourism 250 192 308 264 332 889 601 688 729 845 1,424 2,003 1,376 1,419
Manpower and bansmigration 12 23 31 31 15 45 76 36 123 62 98 174 63 67 1
Regiona development 8 18 24 17 3 7 1 8 25 4 45 308 245 171 A
Education 35 43 50 37 24 211 180 59 346 718 1,236 1,303 992 934
Population & Health 22 34 36 34 24 37 78 56 100 38 99 143 61 56
H°sg and water supply 18 28 33 22 21 51 84 77 139 273 400 560 512 614
General pubec seerces 54 175 154 180 83 152 255 186 257 350 382 641 734 727
Govenment capialpartciaon 33 34 36 28 47 45 160 203 185 168 213 280 128 144 3 X
Otbers /a 14 60 45 29 35 42 179 171 231 355 855 549 589 590
Total prodct aid /b 987 1.316 1.430 1.664 1.925 3867 3.409 3503 3.795 4A23 7.950 9.526 8A04 8 tn n_' n
/a Since 1979/80 incudes natural resouroes development and environment.
hb Includes cmmadal credits for development programs/projects.
Sourwe. Miistry ot Finance.

- 184 - Statistical AnnexTable 6.1
INDONESIA
COUNTRY ECONOMIC REPORT
Money Supply. 1974 - 1990(Rp. billion)
End of Total Currency Demand deposits Change over perlodAmount (%) Amount (%) Amount (%)
1974 937 494 53 443 47 268 401975 1,250 625 50 625 50 313 331976 1,603 781 49 822 51 353 281977 2,006 979 49 1,027 51 403 251978 2,488 1,240 50 1,248 50 482 241979 3,385 1,552 46 1,833 54 897 361980 4,995 2,153 43 2,842 57 1,610 481981 6,486 2,557 39 3,929 61 1,491 301982 7,121 2,934 41 4,187 59 635 101983 7,569 3,333 44 4,236 56 448 61984 8,581 3,712 43 4,869 57 1,012 131985 10,104 4,440 44 5,664 56 1,523 181986 11,677 5,338 46 6,339 54 1,S73 161987 12,685 5,782 46 6,903 54 1,008 91988 14,391 6,246 43 8,146 57 1,707 131989 20,114 7,426 37 12,688 63 5,722 401990 23,819 9,094 38 14,725 62 3,705 18
Source: Bank Indonesia.

- 185- Statistical AnnexTable 6.2
.ui~~~~~~~~~~~~~~~~~~~~.a11t sAg;a^wRa*nsa1111
W~~~1 I Ja1hfl%!slag§!d
| ] ̂ftt^fi2R|g§t!"pg 111kl|11t j-9 Aa mas 1 44 A U
l e| MUB %z R $ 5 %% i t t|a

INDONESIA
COUNTRY ECONOMIC REPORT
Consolidated Balance Sheet of the Monetarv System. 1980-1990(Rp. billion)
bndopeaio 1980 1981 1982 1983a 1984 1985 1986/b 1987 1988 1989 1990
Neta fo mist 6-419 6.811 SS 6 U37 1236 14.119 1589 133 1784 1829 j6j1
Dautloak it 37 SA51 8 9.744 10-4 143*5 19.323 2 3 62131 93.142
Chimmi ubhgsetoCtw t -3,619 -4,330 4193 -5,739 -9,098 -9319 -8798 -8366 -7036 8309 -12202
aaon ollcl aeifimandp*blo enterprssm 35S5 4,247 499 5,040 5,230 6,034 5,993 6,725 7,381 8,82S 7,904
Oovernmaaz-blokodw aoount -396 -360 -252 -240 -116 -52 -81 -84 -66 -40 -24co
and idhedamhu 43 6.094 9312 10A6S3 142 17.662 22;20 28.454 3523 61,655 97!464
Loans 4,107 S,844 7,99 10,184 13,550 16,392 20,409 26,072 365M02 55933 90,109
Oddreaiun 232 250 317 499 779 1,270 1,800 2,S82 3,021 ;,722 735S
Asmao - rablbiis 10,398 12,462 14,411 18581 22,713 28,444 35,312 45,162 57686 80,424 109,?64
IVmpt deposIt 365 298 300 242 218 268 402 424 684 632 1,048
Net otber iem 2,342 2,448 3,036 3,676 4,S58 S,29 7,651 11,277 15,688 21,087 23,586
Moaadm r 7.691 9.716 11.07S 14.663 I 3S3 27.Z661 338 41.998 8.0 84630
Moner 4,99S 6,485 7,121 7,56 8,581 10,104 11,677 12,685 14,392 20,114 23,819 0i b
Conq 2,1S3 2,557 2,934 3,333 3,712 4,440 S,338 5,782 6,246 7,426 9,094 t
D nd dpts 2,842 3,928 4,187 4,236 4,869 5,664 6,339 6,903 8,146 12,688 14,25S
Qusmon 2,696 3,231 3,954 7,094 9,3S6 13,049 15,984 21,200 27,606 38,591 60,811 . -
la Idescbangeu ingfrmD the banrate adjustment oMarch 30,1V83 rSom Rp. 702.50 to Rp. 9 70p rUSS.
/b Inlude can rdting othe uangerate adjustmat on September 12,1986 frm Rp 1,134 to Rp 1,644 per USS.
SowR Bnk Indonmi&

INDONESIA
COUNTRY ECONOMIC REPORT
Banking System Cedit by Economi Sector. 1980-1990 l(RR. billion)
SectOrS 1980 1981 1962 198311 1964 1965 1%6/8 1967 19S8 1989 1990
Aarlculture 539 813 1.025 L226 1318 L6S6 2W7 2656 3.610 35 7.176
In mplah 539 A13 1,5 1,226 1318 1,656 2,097 2,30 3,572 5.214 6,664
In Ibeign exchange 0 0 0 0 0 0 0 26 38 69 292
Mlnina b 1.693 1472 806 34 259 394 35 444 S91 61s
In ruplah 1,S67 1,693 ,472 8 384 2S 394 372 424 456 S70
In foregn exchange 0 0 0 0 0 0 0 13 20 135 45
Manufactudnh industy /c 2.213 2.762 3.9 S1D7 6.667 7.M 9..O 1lQ917 14.956 203 3Q1
In upiah 1,826 2,376 3,429 4,595 6,205 7,069 8S39 10,SO 1394 17,654 202
In forein exchange 367 366 494 612 462 523 166 409 962 2679 5,500
Trade id 1.976 3.0 4 5.132 634 7255 ft3 1IQ247 S 20.109 2
In fuplah 1,970 3,046 4,009 4,781 6,299 7,214 8,32S9 106S 13.682 19342 27,267 F
In foreign exchange 6 16 120 3SI 4( 41 70 162 206 767 2,470
Sevio rendorina Industry IQ 2% S LS67 2277 3.169 4.183 4345 5.460 t 10,424 1797
In mplah 939 1,3S2 1,860 2253 3,068 4,047 4,U3 JS1 6,917 9,60 149
In foreign exchange 7 3 7 24 81 136 215 309 465 824 2,f94
Others 333 444 606 651 "I LJU 3.1872 1 m 686 IL76
In wpiah 331 444 606 651 929 1210 2,156 3143 3,667 6,709 11,197
In forign exchange 2 0 0 0 2 3 6 44 54 157 m72
In mpbh 7,472 9,7S4 12,401 14,312 1 21454 2n94S 31,J69 4Z2S5 5t,975 SW,163
In foreign exchange 402 405 62. 9S7 S90 703 457 963 1,745 483 1t3
la Cibt outstning end of pedod. Includes inv ent crdt, WK and KMKP. EBcudes i rbank mcrdtcrdit to centrd govrm ment and to noresidents, and foreign exchange component of project CD dP
/b incude creditob PERTAMINAfor rpymntof foreign bow Sinco Mach 1979, crdi tin fog xchangel b
PERTAMiNA has been converted to mpiah creib.ts/c Prcesing of agriouura producta b classiied under manudfing indusby accordg tb Inbmailonal Stanard o
Industrial Casficaton #SIC 1968). Stwing 1980, crecGdt for constuction whibh were proul Included inmanufacuring industry are now included In servioe-rendering kidusry.
/d Includes cedtb for food procure.ient and hote projets. 1
As Cdisb for electricity, gas and w.ter supply aro inluded In ssenorendedng industry osebr. It Includes foreign exchange revaluation amouning to Rp. 251 bIllon./g Icludes revaluaion adJuent due to the devaluaion of September12, 1986.
Source: Bank Indonesia.

INDONESIA
COUNTRY ECONOMIC REPORT
Banina Credils Oustndina in RwbLh and Foregn Exchanae by Group of Banks. 1901990 /a
(Rp. billion)
1980 1981 1982 1983/b 1984 1985 1986/c 1987 1988 1989 1990
Bank Irndxnesidirect crmdis d A45 2.649 870 23s8 964 1.144 I 1 696 718
In rupiad 2,454 2,649 2,771 2,356 870 964 1,144 1,347 1,547 696 718
In foegn exchange 0 0 0 0 0 0 0 0 0 0 0
State commerdial banks le 4. MA 8.031 9.787 13.34S IS:374 17.7B2 21.676 28631 39" SSA6
In fl4plh 3,954 5,S23 7,474 8,910 12,959 14,92S 17,711 21,22S 27,614 37,151 50648
In foreign exchange 341 358 557 877 386 449 71 451 1,017 2,428 S,178
National Private BanksIft 711 1.1 CD5 .5 .4 A3 11 01 41
NaScnwaS Fbismba E3auhos/f 7ll 1AD81 1!i54 2.294 3S52 4.746 6;27 fL43 IIJO 2U216 3V7WS
In rupqiAl 705 1,069 1,534 2,279 3,480 4,631 6,061 8f175 11,536 18,95S 31,458
In foreign exhan 6 12 20 1S 72 115 211 248 374 1,261 3R17
EcnvikDn E32u1kos 414 S48 666 862 1.046 1073 I;4 1.406 1.913 3.115 6.177
In n4,iph 3s9 513 622 767 914 934 1,029 1,122 1,559 2,173 3039
In foreign exhange ss 35 44 95 132 139 175 284 3S4 942 3,138
Toted 7m 374a ?O.tS am02 JIMZ9 1lum 22;s i23S 6L669.9
In h 7,472 9,7S4 12,401 14,312 18,223 21,454 2S,945 31,869 42;ZS6 58U975 85863
In forgn exchange 402 405 621 987 590 703 4S7 983 1,745 4,631 11,833
0)rt
/a Credits outancdng at end of period. Includes rnvesm entcets, K and KMP. Excdudes itrbank redit, cdts tD b
Central GoveWnmeit and to non-residents, and foreign exane component of projec aid.
lb Includes foreign xhange revaluation amountng to Rp. 251.0 billion.
/c Includes revaluation adument due to deauaton on September1, 1986. 1
/d Excludes Ikut credits, indudes crets to Pertamina for repayment for forign borfwlng.
/e Includes stat development bank and liquidity credits.
/n Includes liqidity cedits National pivate banks refer to natonal prite commerci banks and regonal deveopment banks,
Souce: Bank Indonesia

INDONESIA
COUNTRY ECONOMIC REPORT
Investment Credits by Economic Sector. 1980-1990 la(Rp. billion)
End of period 10so 1981 1982 1983 1984 1985 1986 1987 1988 1989 1990
Credits sooroVed lb 1.675 1.96 2&79 3.900 4%9 S98 7!966 9U814 135!0 I 26.450
Agriculture 277 340 467 734 809 1,402 2.274 2,54 3.393 5,009 6,11
Mining s 40 54 57 179 229 363 382 495 481 50
Manufacturing industvy 911 911 1,369 1983 2,374 2,765 3,253 3.540 S,182 7.615 10,742
Trade 53 87 134 129 237 277 369 355 536 1,012 2,298
Service rendering lndustqy 422 516 641 986 866 1,173 138 2900 3,788 4,021 4,914
Others 7 12 14 11 44 52 69 53 106 125 1.183
Credits outstandinalb 12 1.436 2 L8 3M S.471 6.486 ? 10422 14M292 2
Agriculture 137 202 322 477 555 948 1,292 1,60 2,284 3,35 4,520
Mining 2 26 34 49 178 224 367 342 372 358 373
Manufacturing Industry 820 741 1,09S 1,35 2,102 2,781 3,098 3,567 4,817 6,424 8,920
Trade 41 73 120 115 168 396 443 435 632 1,22 2157
SerVice renderng Industry 289 390 519 S76 770 1'm 1,215 Im60 2,249 3010 4.307
Othems 7 4 9 9 29 24 71 41 68 121 4S7
/a Excludes investment crts frm Bank Indonesia; Includes -tate Development Bank and Local Development Banks.Data with the same cdassIficatIon pilor to 1980 are not aw Ae.
/b Excudes Small Scale Investment Credits, Investment credits to the Central Govenrnent and foreign exchange components of project ald
Source: Bank Indonesia
Ota
-'t1* D.
X

INDONESIA
COUNTRY ECONOMIC REPORT
Outstanding Bank Funds In Rupiah and Foreian Exchange by Group of Banks. 1982-1990
(Rp. billion)
1982 1983 1984 1985 1986 1987 1988 1989 1990
Deposits
State Banks 6,169 8,381 10,035 12,916 15,193 18,111 257 29,731 40,638
Private Banks 1,284 2,119 3,020 4,550 5,435 8,040 11,167 19,655 33,951
Regional Development Banks 411 498 700 825 797 954 1,300 1,674 2,550
Foreign Banks 1,004 1,398 1,743 1,83 2,86 2,226 2.513 3,315 6,016
Total 8868 12396 15.498 20Q174 23.511 29331 37.510 54375 83.155
Share in Total Deposits
State Banks 69.6 67.6 64.8 64.0 64.6 61.7 60.1 54.7 489
Private Banks 14.5 17.1 19.5 22.6 23.1 27A 298 36.1 40.8
Regional Development Banks 4.6 4.0 45 4.1 3.4 3.3 35 3.1 31
Foreign Banks 113 113 112 93 8.9 7.6 6.7 6.1 72
Total 100.0 100. 100.0 100.0 100.0 100.0 100.0 100.0 100.0
Annual Growth Rate In Deposits
State Banks 2.2 30.6 18.0 252 162 17. 21.8 27.7 15.5
Private Banks 40.0 50.1 35.4 41.0 17. 392 32.9 56.5 36.6
Regional Development Banks 16.1 192 34.0 16.4 -3.4 1&0 30.9 253 23.1
Foreign Banks 272 33.1 22.1 7.7 6.5 65 122 27.6 35.5
Total 102 33.5 22.3 264 22.1 22.1 24.6 37.1 25.1 C X
/a Total funds are the sum of demand, time and savings deposits. Figures differ from the monetary survey because these include
Central Govemment accounts. Rural credit banks are excluded. _ .a
Source: Bank Indonesia.
.

INDONEEIA
COUNTRY ECONOMIC REPORT
Inlerat Rates on Deosits at Commercial Banks. 1978-1960 laP-8)
Time DepositsTABANAS TASKA Cetifi-
End of Demand Savings Savings cate of State Bank PteNationalBank a
Prlod Depost Depos Deposits D-posits Lethan 3 6 12 24 Lestban 3 6 12 24
lb Jc Id IC 3 l m os ifosQtaom s MOB 3moSK tas mos ao ao
19786 14.3 6-15 9.0 7.6 - 69 9.0 12-IS 12.8 125 S.6 17.2 20.7
1979 13 6.15 9.6 9.8 10.6 S.1 6.0 9.0 12-IS 1.2 16.7 16.3 19.6 19.
19W 163 6.15 9.0 10.2 7.2 S2 6.0 9.0 12.1 14.2 16.1 17.8 201 193
1981 183 6.15 9.0 10.9 12.1 102 690 9.0 125 ISA 17.4 17.9 19.4 19.
1962 183 6-1S 9.0 12.5 7.7 6 6.0 9.0 12IS 16.9 17.1 1L5 193 I8&
19S3/b 1.8.3 12-15 9.0 ISA 14.4 14.8 13. 17.5 125 1&7 17.4 1&S 19.7 193
1984 183 12-1S 9.0 16.5 lS.1 17.1 17.2 1&7 17.2 19.8 20.7 20.7 20.4 210
1985 1.1.3 1215 9.0 14.S 13.4 14.6 16.0 17.8 18.3 14S 159 17 19. 213
1986 1.83 12-15 90 14.0 133 142 14. tS.2 16.0 14.8 tSS 162 17.3 20.1
1987 83 tS.0 90 15.6 tS.$ 17. r.3 170 17.4 173 186 19.3 19.1 19.9
198S Lg83 tS.0 9.0 15.9 15.8 18t 18.4 16.7 1.8 202 20.1 20e3 20.2 20.9
1969 a uns 16.3 15.1 162 17.2 187 t18 17.0 I8. 1&8 19.7 2R5
1990 a a.s as 15.9 20.5 '07 2Q7 20S 20. 20.9 21.3 23 21.2 2.0
/s Wgibted aage rate ofdlteren at seleed bas . r
lb From M?mb 1983.3% for moum abowv Rp. 50 msillon. tS% for Rp. Ito S mRi sonand indMidually determined toramourslestbsm Rp. I milia on.k TABANAS orTabugan Pwmbaunan Nasionar (Nation l DeWlopmet Sxang) is an ordinoysavingswoue smored bytBth
Tabung Ntpre (9ate Saing Ban*)and offered byall tate owned and some prvate natio commercidal band& poet woffes. Until June .19S3: 15% iar smonm ofRp. 200l00 or km 6% above Rp. 20 0From June 1983: 113% for Rp I * t
milion orle 12% Ow morethan Rp. I mllioL Fromn Jl 119S7to November 19S9: 15% for all denomiatonLa beeafter kl to b desenedon.Id TASKA orrTabuanstanBalIedg im(1 red7lneDeposaits) an andiaydmedepokstssponsoredbyBsTsbT a .u
NeVarae o crd bythe same kitt degcibed In (c) aboveIC Mdpoin otrae for As Month$ rates.:.NT One montb tIme depostsraed as rqres ve ::ratk Ectlnnsuy l97& 1S for Rp. 25mlrwenorles 12% for me than Rp.Smilon for 24 moeth Sate Batime deposi.8
lb CeiUnontlmedeposter rateatlateeba rmoed onJue 1. 19S3. X
12% lgl mbimum rate ttlginJune t963 for 24motate AButi depoi
Source: Bank Indonesia.

INDONESIA
COUNTRY ECONOMIC REPORT
Pgida AaIadhwl Products by Substor. 1978.1989('000 tonA,
Product 1978 1979 1980 1981 1982 1983 1984 1985 1986 1987 1988 1989 /a
Food cropsRice /b 17,525 17,872 20,163 22,286 22,837 35,302 38,134 39,033 39,726 40,078 41,676 44,726Corn 4,029 3,606 3,991 4,609 3,235 5,087 5,288 4,330 5,920 5,165 6,652 6,213Cassava 12,902 13,751 13,726 13,301 12,988 12,103 14,167 14,037 13,312 14,356 15,471 17,091Sweet potatn 2,083 2,194 2,079 2.094 1,676 2,213 2,156 2,161 2,091 2,013 2,163 2,126Soya beans (sheLed) 617 680 653 704 521 536 769 870 1,227 1,161 1,270 1,301Groundnuts (sheled) 446 424 470 475 437 460 635 528 642 533 589 615
FbheriesSaltwater fish 1,227 1,318 1,395 1,408 1,4W0 1,682 1,713 1,822 1,923 2,017 2,170 2,272Freshwater fish 420 430 456 506 524 633 548 573 807 653 711 754
Meat and dsiAMeat 475 486 571 596 629 650 742 808 860 9SG 937 1,008Eggs 151 164 269 275 297 319 355 370 432 452 443 464Mmk/c 62 72 78 86 117 143 179 192 220 235 266 326
Cash cropsRubber 884 898 1,020 963 900 1,007 1,033 1,066 1,109 1,130 1,176 1,256Pahn oil 532 642 701 748 884 970 1,147 1,243 1,350 1,506 1,800 1,879Coconut/copra 1,575 1,582 1,759 1,812 1,718 1,604 1,750 1,920 2,114 2,075 2,139 2,085Coffee 223 228 285 295 281 305 315 311 339 380 386 423Tea 91 125 106 110 94 110 126 127 136 126 137 153Cloves 22 35 39 40 32 41 49 42 55 58 61 72Pepper 46 47 37 39 34 46 46 41 40 49 56 60Tobaco 81 87 116 118 106 109 108 161 164 113 116 106 t cnCane sugar 1,516 1,601 1,831 1,700 1,627 1,628 1,810 1,899 1,894 2,176 1,918 2,047 toCoNon/d 1 1 6 10 13 14 12 45 53 48 39,731 38,374
-JtForestry e P&.aTeakwood 475 495 613 578 692 718 758 777 798 689 725 725 _Other Umber 26,256 25,520 21,702 14,024 13,236 24,180 27,716 24,277 27,403 28,256 28,485 19,789
/a Prelmnazy figures./b Paddy producton starting 1983./c In milon of lites.Id In tons.Ie In '000 cubic meters.
Source Supplmnent to the Presidens Report to ParlIment, August 16,1990.

- 193 - Statlitlcal AnnexTable 7.2
COUNTRY ECONOMIC REp
Prduudhon of Maln Croms Type of d Est. 197I 198I
Product 1979 l080 t08l 1082 1085 1984 3085 1986 1087 1088 1ow /A
Small i'odeoRube ale 705 740 586 673 704 720 763 705 830 901Coconut/copra 1,561 1,737 1,789 1,707 1.500 1,757 1,905 2,008 2,055 3.117 2,05Coffee 209 2es 276 262 287 2Sl 288 316 36s 32 3S4Cloves 35 so 40 32 40 48 41 53 57 50 70Teo 17 21 22 17 23 24 S0 31 25 t 44Sugar 498 749 1.864 1.373 1.249 1,307 1.450 1.417 1.744 1.499 1.625Tobacco 73 101 103 97 0oo 104 156 150 110 113 103Pepper 47 37 s3 34 46 40 41 40 40 50 60Cotton I 6 10 IS 14 1s 45 53 48 40 se
Palm ll o 0 0 0 0 0 0 0 0 0 0Palm kemel 0 0 0 0 0 0 0 0 0 0 0
PrNrob estatesRube 112 III 114 125 183 121 124 150 135 143 140Coconut/copra 21 22 23 11 14 is 15 16 20 22 S7coffee 8 0 6 6 8 9 10 1o 8 10 12lvovs 0 0 0 0 1 1 1 2 1 2 2
Teo 16 17 18 16 17 IS 17 18 21 23 a5Sugar 73 114 11 72 S8 as 106 106 109 103 102Tobacco 0 0 0 0 0 0 0 0 0 0 0Pepper 0 0 0 0 0 0 0 0 0 0 0Cotton 0 0 0 0 0 0 0 0 0 0 0Palm oll 168 202 206 285 260 320 330 s3s 3S 435 471Palm kerel 23 S3 S7 47 68 60 71 73 76 S7 94
Qg!5wnt eslatesRubber 170 186 192 18 201 208 211 1U0 200 104 206Coconut/copr 0 0 0 0 0 0 0 0 0 0Coee 11 IS IS IS 10 IS IS 13 13 14 17Cloves 0 0 0 0 0 0 0 0 0 0 0Teo 92 68 70 61 70 84 80 87 80 88 84Sugaar 1,030 968 220 182 291 330 S4S 371 323 S81 320Tobacco 14 IS 15 0 s 4 5 5 3 S SPepper 0 0 0 0 0 0 0 0 0 0 0Cotton 00 0 0 0 0 0 0 0Palm oil 474 499 542 509 713 S81 S04 065 1,154 1,365 1.408Palm e6nel 85 90 98 110 eS 178 187 103 243 273 282
TotalLber 898 1,002 1,046 so0 1.007 1.03I 1.055 1,100 1.130 1.176 1.25S
Coconut/copra 1,582 1,7509 1,812 1,718 1,604 1,750 1.020 2,114 2.075 2ass 2.085Cofee 228 285 295 281 305 315 3ll 3ss s3o 386 423claom 35 30 40 82 41 49 42 55 5U 61 72Teo 125 106 110 I4 1o l 127 136 126 IS7 15SSugar 1.601 1.831 1,700 1,627 1,628 1,810 1.800 1,894 2,176 1,0198 2,047Tobacco 87 11 118 106 109 108 161 164 113 le 106Pepper 47 37 39 34 46 46 41 40 49 50 60Colton 1 6 10 Is 14 12 45 53 48 40 39Palm dil 642 701 748 884 9B2 1,147 1.243 1,350 1.506 1,800 1.870Palmk11 108 126 135 157 166 247 258 2060 s3 360 376
/a Preliminary figures.
Source: Supplement to President's Repot to Padiament, Augud 16, 1990.

- 194 - Statistical AnnexTable 7.3
INDONESIA
COUNTRY ECONOMIC REPORT
Rlce . Area Harvested. Prodmucton and Yield. 1974 1989
Area Average Paddy RiceYeor horvested yield output output /a
('000 ha) (tons/ha) ('000 tons) ('000 tons)
1974 8,509 2.64 22,464 15,276
1975 8,495 2.63 22,831 15,185
1976 8,368 2.78 23,301 15,846
1977 8,360 2.79 23,347 16,878
1978 8,929 2.89 26,772 17,525
1979 8,850 2.97 26,283 17,872
1980 9,005 3.29 29,652 20,163
1981 9,382 3.49 32,774 22,286
1982 8,988 3.74 33,584 22,837
1983 9,162 3.86 35,302 24,006
1984 9,764 3.91 38,134 26,933
1986 9,902 3.97 39,033 28,542
1986 9,98R 4.00 39,726 26,784
1987 9,923 4.04 40,078 27,253
1988 10,090 4.13 41,676 28,340
1989 10,531 4.25 44,726 29,072
/a Estimated on the basis of a conversion factor of 0.68 from
paddy into rice for the years prior to 1989, and a factor
of 0.66 for the years 1989 and following.
Source: Central Bureau of Statistics.

WDONESA
COUNTRY ECONOMIC REPOIT
BULOG Rie Pren. 1978179 - 1990191
1978/79 1979/80 1980/81 1981/82 1982/83 1983/84 19W86 1985/86 1986/87 1987/88 1988/89 1989/90 Ic 1990/91 /g
Begini sdack 459 708 888 1,242 1,623 1,046 1,455 2,432 2,172 1,867 755 1,086 1,576
Dasnedi Frocureurw 881 431 1,635 1,952 1,933 1,196 2,382 1,953 1,647 1,216 1,801 2,243 2,000
Wmpat 1.268 2.680 i1.213 437 56 1.115 187 0 41 79 316 150 0
P1-480 304 363 101 46 0 65 64 0 0 0 0 0 0
Oherfood/e 15 327 198 48 0 140 0 0 41 79 315 150 0
Comnada 949 1,900 914 343 56W 910 133 0 0 0 0 0 0
TOW e2S308 9.719 9.794 3 .B 335 4.024 4 385 3.860 3.161 2.871 3.479 3676
D i /a 1.862 2.89 2A480 2.014 2.972 1.872 .612 2.186 1.167 2.372 1.768 1.875 1,898
Govemmud 608 666 649 806 1,320 1,373 1,368 1,414 1,498 1,625 1,512 1,542 1,560 Qn
Seateashpses 106 90 89 95 105 89 59 77 94 97 106 100 114
MUtks mpFmailns IF 1,032 2,036 1,628 1,033 1,618 399 69 277 176 640 142 60 200
Ohsm /d 106 42 114 80 29 11 116 418 200 110 8 173 24
LOOK 46 8 12 26 46 28 22 27 26 34 17 28 28
End dock 708 806 1,242 1,591 1,045 1,465 2,432 2,172 1,867 755 1,086 1,576 1,650
Amnarwndum IeRice poduktn /b 17,325 17,872 20,163 22,286 22,837 24,006 25,933 26,642 27,014 27,23 28,340 29,!96 28,902
/a Sine Jm 1982, oa maims have . fied Ic h knd; fmnndy, sw|plurlm revd food abwuan. in mney.t
/b On adar yw bad.. V. I.
/C Priioa fiurs b /d hdAdx eqd of 95,O000 k in 1984/85 cnd 400,000 km in 1985/86, 173,750 kmisn 1986/d7
and 100,000 ks in 1987/88./e In 1987/88, he fgue shr fe loamns/IInclde sea sas af reued pces of wbmaa twdard rie of 130,000 os in 1985/86 and
150,000 bm in 1986/87.
So5c WIOG (Badan ULn tagiks/Slate Logisk Boa.

- 196 - Statistical AnnexTable 7.5
INDONESIA
COUNtRY ECONOMIC REPORT
Area Covered Under Rice lntensi0fcation Programs. 1974-1989('000 ha)
Year BIMAS INMAS Total Of which/a /b INSUS /c
1974 2,676 1,048 3,724 0
1975 2,683 1,957 3,640 0
1976 2,424 1,189 3,613 0
1977 2,059 2,181 4,240 0
1978 1,960 2,888 4,848 0
1979 1,571 3,462 5,023 0
1980 1,374 4,142 5,616 1,080
1981 1,384 4,802 6,186 1,706
1982 1,296 5,047 6,343 2,945
1983 1,308 5,387 6,695 3,477
1984 434 6,936 7,369 3,806
1985 200 7,461 7,661 4,100
1985 258 7,533 7,791 4,480
1987 A.. na, 8,035 4,922
1988 u.S u.a 8,283 5,837
1989 ua uA 8,713 6,413
/a BIMAS - Bimbingan massal (Ms rice plantin guidance progrm)./b INMAS a Intenuftiks massal (Mma intensiecadon progam)./c INSUS - Intenslflsi khusus (Special Intensificatin program).
Soure: Supplement to the President's Report to Parlament, August 16, 19O.

- 197 - Statistical AnnexTable 8.1
INDONESIA
COUNTRY ECONOMIC REPORT
index of Manufactudng Produdion by Se6dtd Indswl Groupi 198.1990 /a(1983- 100)
Code ofIndustry Descrption /b 1988 1987 1988 1989 1900/cGroup
31121 Condensed and dried milk, creameryand processed butter, fresh andpreserved cream (6) 87.5 94.0 123.3 122.5 141.7
31330 Malt liquor and malt (5) 94A 113.2 118A 117.2 131.331420 Clove cigarettes (80) 147A 168.5 177.7 198.2 227.731430 Other cIgarettes (13) 78.8 81.1 79.2 78.2 81.232111 Yarn and thread (53) 129.9 130.5 169.0 196.2 263A32112 Weaving miUs (except jute weAving products (409) 130.7 144.3 172.9 188.0 224.832114 Batik (66) 95.8 81.8 83.9 111.1 141.832130 KnittIng miUls (73) 219.2 233.3 239.8 312.8 378.132400 Footwear (32) 113.1 91.6 111.2 184.9 208.233113 Plywood (40) 139.3 192.7 242.1 268.2 244.634111 Paper manufacture (aUl kinds) (23) 159.2 159.7 242.0 251.5 292.135110 Basic chemicals (except ferilzer) (50) 119.0 166.4 139.0 152.9 172.335120 Fertilzer (10) 166.0 121.8 129.7 144.0 155.335210 Paint, vanish, and lcquers (25) 135.6 126.5 91.2 129.9 161.335232 Matches (8) 108.7 142.3 175.5 154A 163.535510 Tyres and tubes (22) 109.5 79.2 109.7 141.2 175.638210 Glass and glass productA (21) 178.0 149.3 124.6 145.2 170.636310 Cement (7) 144A 150.9 149.8 198.1 192A37100 Basic Iron and steel industries (16) 154.9 147.1 167A 199.0 287.838130 Structurl metal products (59) 110.2 118.7 125.7 180.6 199.038312 Drycel batteries (7) 123.9 115.5 168.6 166.3 189.238320 Radio, TVs, cassettes, other communicaton
equipment and apparatus (23) 90.6 86.9 118.1 163.9 182.938430 Motor vehicles assembly and manufacure (23) 114.7 126.8 115.8 132.5 188.338440 Motor cycles and three wheel motor vehicles,
assembly and manufactue (11) 98.0 81.3 76.8 106.0 98.7
Genoeral indet128.4 143.5 142 184.1 211I.
/a The anmnal ftgB shown here are calculated as the average of quarterly indices./b Figures in bracet"( ) indicate the number of establishments covered in tlat group./c Average of three quarters; very prelmay.
Source: Central Bureau of statstics.

INDONESIA
COUNTRY ECONOMIC REPORT
Produdlon of Minertals 1974.1990
Tin Copper ore Nikel Iron sand Natural
Year Pektreum concentrate concenfrate ore Bau,de Coal concentrate Gold /a Silver /a gas
WmIn bbb) (OOO ton) (kg) (kg) (mo)
1974 502.0 25.7 212.6 878.9 1,290.1 156.2 365.2 265.3 6,464.6 202.2
1975 477.0 25.3 201.3 801.1 992.6 206A 353.0 330.7 4,754.7 222.2
1976 560.0 23A 223.3 1,102.0 940.3 182.9 292.3 355.2 3,397.5 312.1
1977 615.0 26.9 189.1 1,302.5 1,301A 230.6 311.5 255.9 2,831.9 542.8
1978 597.0 27.4 180.9 1,256.5 1,007.7 264.2 233.3 253.9 2,506A 820.1
1979 680.0 29.4 188.8 1,551.9 1,051.9 278.6 79.9 170.0 1,644.6 998A I
1980 677.0 32.5 186.1 1,537A 1,249.1 338.0 62.9 247.C 2,196.0 1,045.7 %O
1981 584.8 36A 188.5 1,543.2 1,203A 392.8 86.6 1L :'. 10.2 1,123.8
1982 488.2 33.8 223.7 1,640.9 700.2 588.0 144.6 9.9 ; v 9 1,111.9
1983 490.5 26.6 206.0 1,278.0 777.9 648.2 132.9 2,391.5 35,473.1 1,186.4
1984 616.5 23.2 190.3 1,066.8 1,003.2 1,468.2 83.0 2,247.1 38,794.7 1,606.7
1985 483.8 21.8 223.4 961.9 830.5 1,491.7 130.9 2,619.4 38,327.3 1,580.0
1986 507.2 24.0 251.2 1,633.1 64&8 1,726A 152.3 3,303.5 46,596.0 1,628.9 e
1987 479.0 26.1 259.8 1,825.7 635.3 1,887.0 194.0 3,752.8 50,485A 1,731.1 ( '
1988 484.7 30.6 294.7 1,733.2 505.8 2,854.5 202.8 4,730.9 61,538.0 1,852.6
1989 5142 31.3 331.5 2,020.9 862.3 4,563.1 142.7 5,239.3 62,395.9 1,926.2
1990 tb 128.2 7.0 84.8 469.5 284.0 1,817.6 37.3 2,050.1 17,142.8 527.3
/a SnMe 1983, production of gold and sliver Incudig priate enterprise.
/b Fist quarr 1990.
Soure. Central Bue of Statstics.

INDONESIA
COUNTRY ECONOMIC REPORT
Crude Oil Production by Company. 1980-1990('000 bbls)
Production AverageContract of work sharing daily
PERTAMINA LEMIGAS Cahtex C & T Stanvac Subtotal contract Total output
1980 29,891 205 258,325 2,046 11,578 271,949 274,971 577,016 1,577
1981 29,615 175 255,515 1,799 13,141 270,455 284,693 584,838 1,602
1982 27,375 195 175,928 1,422 13,214 190,564 270,055 488,189 1,338
1983 /a 26,947 233 191,307 1,411 11,766 204,484 286,384 518,048 1,419
1984 31,002 203 - 1,533 4,372 6,906 513,652 550,762 1,505
1985 30,071 170 - 1,358 5,130 6,488 453,190 489,919 1,342
1986 29,328 193 - 1,228 6,085 7,313 478,078 514,912 1,411
1987 26,775 210 - 1, 36 8,354 9,590 475,854 512,429 1,404
1988 24,789 /b - 1,368 13,413 14,781 451,941 491,511 1,343 , "
1989 25567 /b - 2,044 13,233 15,277 473,341 614,186 1,409 rt
1990 24,695 /b - 3,211 10,564 13,775 415,943 454,413 1,245 /c
/a Sice May 1983, contrwt of work data have been consoldated./b Since 1988, Lemigas data have been included in Peramina.Ic November and DeVmber reconcliaoL
x
Source Miidstry of Mines and Energy, Dirwctore Generd Oi & Gas.

- 200 - Statistical AnexTable 8. 4
| 1 a "1 R {| 1 ;1 3 g} N I - I
U~ i *1 a a1
~~~ -1 al t 2l ; 1 I5
I a-~~~~a -I - -1"Ffs
. U8|v 1i|6|Et
21 1 | °"iqNj qq j|"; |FN2
_ s _ i q Yl ;| z 8| @ g91 k | N X|
ilit$ili:Xll jIN

COUNW ECONOMUC
Do_b Sols of Pdrolim Poduds. 1980.1990 /a1^0O bl)
1980 1981 1982 1983 1984 1985 1986 1987 1988 1989 1990 /b
Akitan gm 130 110 103 83 73 66 63 56 60 60 60
Awkwn hxbo 4,355 4,869 4,899 3,686 4,374 4,442 3,806 4,199 4,445 4,286 4,576
handwn goamab 466 392 238 247 523 738 1,024 1,431 1,838 2,461 1,045
RgUqw gOMa* 23,321 25,648 25,709 24,380 24,909 26,206 27,083 29,048 30,855 33,199 38,950
Kwcui. 48,976 52,497 51,778 48,224 45,213 43,964 43,618 43,352 44,664 43,601 49,607
PR t dbs 40,116 44,737 48,918 49,790 48,567 47,682 47,421 54,075 59,143 64,508 73,257 I
hbihi dua 7,820 9,391 9,311 9,978 10,285 10,329 8,855 8,319 8,809 9,516 10,793
Fud dc 15,739 17,687 19,341 21,149 23,625 22,863 18,004 19,054 18,097 18,329 26,020
TOW 140.031 1665231 160Q297 167.537 157.6B 1669 280 149.874 168.634 167911 178949 203.308
/a rbdug kudal g -lb ad shidar pmduac/b PhiowliaL
'10
Scum: MhUiy of #mb and Energ, Md=aar Genea 04 and Gm. 0lt
Sib

- 202 - Statistical AnnexTable 9.1
INDONESIA
COUNTRY ECONOMIC REPORT
Consumer Price Index. 1979 - 1990 /a(April 1977 - March 1978 = 100)
End of Foodstuff Housing Clothing Others Total Chonge (%)
1979 141.1 140.9 168.2 137.7 143.1 21.8 /b
1980 166.6 168.7 190.8 159.1 167.6 16.0
1981 179.3 182.3 198.2 168.8 179.8 7.1
1982 192.7 209.8 205.0 189.3 197.9 9.7
1983 212.7 238.1 214.0 221.5 221.5 11.5
1984 226.A 270.0 220.6 246.5 241.6 8.8
1985 230.9 289A 228.0 259.7 252.2 4.3
1988 263.9 302.9 250.4 275.0 275.3 9.2
1987 296.1 321A 270.4 297.9 300.8 9.3
1988 320.1 335.4 280.0 307.4 317.6 5.6
1989 /c 104.1 109.6 108.1 105.7 106.4 6.1
1990 /e 111.5 128.9 113.4 118.6 117.0 9.9
/a The consumer price Index for Indoneda haa been used commencIng March 1979 to replacethe Jakarta cost of ldivng Index.
/b Percentage change of CPI for the period January through December 1979 using the rate ofnrase of the Jakarta cost of livlng Index for perMod Juary through
March 1979./c Using new base period (April 1988-March 1980 - 100).
Source: Central Bureau of Statistics.

INDONESIA
COUNTRY ECONOMIC REPORT
Indonese Wholesale Prie Index. 1983.1990 La(1983 = 100)
Sectors /b 1983 1984 1986 1986 1987 1988 1989 1990
Agriculure (44) 100 113 118 128 145 163 177 191
NUning & quarrying (6) 1oo 109 117 125 *32 143 156 169
Manufacuring (140) 100 103 115 123 143 156 166 176
Imports (53) 100 113 119 129 158 164 178 191
Empg& (381 o100 111 112 85 118 118 131 159
Exduding petroleum (34) 100 114 115 130 170 183 195 195
Petroleum (4) 100 112 113 73 103 99 112 148
General index (2811 100 111 116 116 142 149 162 178
General indax excludingexports (243) 100 111 117 127 149 160 173 186 5 "
0 rt
General index excluding " rd
exports of petroleum (224) 100 110 116 125 146 161 172 182tw 0
/a This new index replaces the previous WPI based on 1975.Figures show the average for year.
/b Figures within brackets "( )" indicate the number of itemsrepresented in that sector.
Source: Central Bureau of satistics.

COUNTRY ECONOMIC R
Domesti Pries of Petrolem Products.1980.1990Rp./B"
1980 /a 1981 1982 /b 1983 /c 1984 /d 1985 /e 1986 1987 1988 1989 199b if
Aviaion gms 10 150 240 300 300 330 250 260 250 250 330
Aviaion turbo 150 150 240 300 300 330 250 250 260 250 330
Premium gasoline 220 220 360 400 400 440 440 440 440 440 /8
Regular gasoline 150 150 240 320 350 385 386 386 385 385 450
Kerosene 38 38 60 100 150 165 165 165 165 156 190
Moordiesel 53 53 86 145 220 242 200 200 200 200 245
Industrial diesel 45 46 75 125 200 220 200 200 200 200 235
Fuel il 45 45 15 125 200 220 200 200 2C0 200 220IDt
/a From May 1980./b Price inaeased on January 1. . n/c Price increased on January 7./d Price inaeased on January 12./e Pice increased on April 1, due to the applkaion of 10% VAT./f Price inceased on May 25./g Discntinued.
Source: Ministiy of Mines and Energy, Diredorate General Oil and Gas.

INDONESIA
COUNR ECONOMIC REPORT
A eDD Foroian Inveshme*n by Sedor, 1977-1990 /a(USS million)
Secr 1977 1978 1979 1960 1961 1982 1963 1984 1985 19S8 1987 1988 1989 1990
21 3 16 56 25 9 10 0 9 120 117 8 122 117
fE ft 29 39 12 6 115 32 7 0 0 0 5 26 4 20
fisLeM 3 23 21 3 22 3 21 0 11 4 12 46 47 20
Minalln & 201 38 66 3 29 0 0 0 0 0 0 0 0 116
327 276 1.158 771 834 1.120 2.615 1.002 687 537 852 3SW 240 522
Focd 8 6 61 14 41 6 83 77 a 34 54 231 223 99
Tedibs & Iear 71 115 34 76 139 20 12 1 7 9 118 213 581 1.684
Wood & woodpdudS 0 1 a 11 124 5 13 0 0 32 45 104 106 218
Paper & papoduds 1O 0 11 2 49 0 722 0 25 47 109 1.50 211 730
Chemica & ibbe 49 26 34 282 230 217 183 90 338 294 209 1,544 2.512 11o
Not -nmetalbcml b 98 20 77 222 20 57 50 0 3 0 251 30 184 125 0
1sc mews t8 10 501 0 85 3 8# 609 65 39 7 61 108 82
Meal producs 73 92 45 163 141 706 716 210 244 O2 57 129 292 40
Oa*M 0 7 0 1 0 0 1 9 0 0 3 10 30 291
Coniwciion I 5 I _ 49 11 44 17 122 65 42 2 16 n7Trade & hoe 7 10 3 39 0 17 7B 8K 0 0 196 405 98 874
Whdb tadeo 0 0 0 0 0 0 0 0 o 0 0 0 0
Hoels 7 10 3 39 0 17 78 04 0 196 406 98 874
Tmen & ommulaom 0 0 0 25 0 0 0 4 70 212 3 5 8Ns
0rtRelesht* ad bmieuvie 20 4 44 0 18 204 S08 0 29 25 20 117 181 902 H t
Tol 09 397 1.320 912 1.091 1.397 2.82 1.107 859 S 1.457 -434S5 4g9 8.5 .rt
/a Wende Capal krient. Amount reprmeV oginml approai phu epaniom mnu caneUal..
Souc: kumen Caoodntinw Bocrd (BKPN).

INDONESIA
COUNTRY ECONOMIC REPORT
Aporoved Domeslic Investmern by Sedor. 1977-1990 /<(Rp billion)
Secor 1977 1978 1979 1980 1981 1982 1983 1984 1985 1986 1987 1988 1989 1990
Aariculiure. fisherisand lestock 49 100 39 30 60 62 681 277 899 1.879 2.885 2.698 3.418 6,435
N%ft 64 59 80 115 175 93 149 19 37 21 640 487 252 593
minim 0 18 33 55 13 52 578 8 38 89 290 111 94 147
ManukdkOq 401 531 580 1.093 1.306 1.419 3.792 1.332 1.632 1.842 5.518 9.747 12.931 43.240
Te*Els 75 168 61 162 195 110 104 127 97 263 1,289 2,309 3,563 12,612
Chemkols 99 103 141 57 193 205 766 272 928 773 2,047 3,039 4,062 12,643
Edrkical goods 0 0 0 0 0 0 0 0 0 0 0 0 0 0
Oher manuacurng 228 261 378 874 918 1,104 2,922 933 607 806 2,183 4,399 5,307 17,985 1
Construdion 0 3 5 4 8 16 195 67 270 74 50 31 146 87
Hotels 4 12 13 10 64 76 255 214 412 17 139 537 1.265 4.974.
Realetae 35 15 6 16 5 74 204 31 267 169 174 846 936 1.790
C*b¢ /b 20 24 18 35 70 157 1.151 1 295 325 569 460 651 2.614
Total 574 762 77 1i35 1J691 1U49 7~ a AR-~ T_ 6 762 774 1.368 1.691 1.9494 70-06 184 3.750 -4.417 10.2665 14.916 19.694 59.878
/a Figues fer to intended capital inestments, and rpresent originol approvals plus apprvedexpansion minvs acellations. Or 0)
/b Inndudes transpodaion sewor.*I.'.c
Source: Invesmn CooraKng oard.* 0
x

IBRD 205 14R-SIo THAILAND '° 11W li5 ., 12W l x> idW id; lie.K -,
3 > , PHILIPPININES
\ 13 MALAYSIA "BRUNEIAt \S' /' ' 2R P'vie
..odd.Mr12 MALAYSIA j 17 / ,@.Ao-
...C-SINGAPORE .t"'L%)' Pro*c. Coundorls
.-.-.-----.--- /*i ,5 ,3n4aru _,_,], -z . HAAHERA HEInRot.iooil onhdorlo.K KA L AN AN N2
in 14 ~~~~~~~~ ~~~~ ~~~~~~~~~~~~~~~~~~SA.dh,to < 18----10 ~~~ L1ANSKA 15 WAN1 SOLd ct1 1 -1
10 A~~~~~~~~~~~2 S;A
1 D. K. JAKARTA 9 RA PalogroyO SCALA WESI ' I -s2 AW ARAT plmo"i
3 JAWATENGAH 7 l 16YA4D.,. VOOVAKARTA Ml.kf) . "t.-.2 ir2
&mA¾ -JRA JY 5 JAWATIMuR Bbngkolu' ,, ' B.ni.Ufn A.bon 26r SENGKULU 6 ka 0UMAVERASELATAN J , jg .n1I9 RIAIU Tnainkarong Sea12JMA
Banda Sea isII SUMATERA BARAT JAKARTA9
12 SUMATERAUTARA -. ;
14 KAtLIMANTAN oARAT 3 ,15 KALIMANTAN TENGAH oda --- ADO 213 KALIMANTANSELATAN e euij Th(
is SULAWEStUTARA 2 5 I14.BLAWES UTAA Vwa.flr-T- SW RMA2o KA IMA LTAN TIU4AA ~ ~ ~ 1 r" ~ ~ 20 SULAWESI TENGLATA 4 --- < tU ,2
z,02i NULAWEA TENGARA A ,,, i eP K 0 100 200 nOO 400 C00 16°3NAUSBATENGGARA ClARAT 2D an223-TIMOR
_____________-10- 94 NUSATENGGARATIMURMIE25 MALUKU n/f o7. .
10 200 000 400 NO OM 200 0402, IRIAN JAYA RUMBA -_ 24 n 27so TIMORTIMUR
) _ ,, KILOMETERS
FEBRUARY 1991