INDIVIDUAL AND ORGANIZATIONAL EFFECTS OF KNOWLEDGE PRODUCTION: A MULTI-LEVEL STUDY
252
1 INDIVIDUAL AND ORGANIZATIONAL EFFECTS OF KNOWLEDGE PRODUCTION: A MULTI-LEVEL STUDY A dissertation written by Simon J.D. Schillebeeckx, To the partial fulfilment of the Doctoral Degree in Management At Imperial College London, Business School 2011 – 2014 Under the supervision of Professor Gerry George
Transcript of INDIVIDUAL AND ORGANIZATIONAL EFFECTS OF KNOWLEDGE PRODUCTION: A MULTI-LEVEL STUDY
1
INDIVIDUAL AND ORGANIZATIONAL EFFECTS OF KNOWLEDGE
PRODUCTION: A MULTI-LEVEL STUDY
A dissertation written by Simon J.D. Schillebeeckx,
To the partial fulfilment of the Doctoral Degree in Management
At Imperial College London, Business School
2011 – 2014
Under the supervision of
Professor Gerry George
2
ABSTRACT
This dissertation investigates individual and organizational effects of
knowledge production in three chapters. I depart from the notion that both
interpersonal collaboration between and within organizations as well as
recombination of knowledge components are instrumental in the production of
new knowledge.
The first chapter investigates the origins of collaborative knowledge
production in plastics electronics. Using survey data, I explore how individual
and organizational characteristics drive collaboration preferences. I avoid
looking at established collaborations because these bias collaboration
determinants. I find that resource provisioning and social similarity influence
preferences and that these effects are moderated by collaboration experience
and organizational objectives. Additionally, the study suggests that individuals
facing an aspiration gap are more favourable towards collaboration, and
proposes that relational capability, in the form of networking skills, openness,
and information will moderate this relationship.
The second chapter looks at the recombination of knowledge
components. Using patent data from US semiconductor firms, we explore how
firms build on old knowledge components to create new patented inventions.
The findings suggest that familiarity of components contributes to innovative
success but that adding novelty to familiar combinations is on average even
more successful. We also find that the effects of different types of knowledge
3
recombinations are moderated by the time in between these collaborations as
well as by the search for non-domain specific knowledge.
The final chapter posits that the search for knowledge components and
the search for collaboration partners should not be understood as two isolated
determinants of invention. I submit that finding knowledge components
(objects) or knowledgeable partners (holders) can be construed as alternative
solutions to the same knowledge problem and describe a process model of
invention as escalating recombinant search. The dissertation ends with a
reflexive conclusion on the contributions made in these three chapters.
4
Table of Contents Table of Tables………………………………………………………………………………..7
Table of Figures……………………………………………………………………………….8
Table of Chapter Three Propositions and Assumptions…………………………..…9
Declaration of Originality………………………………………………………………….10
Copyright Declaration………………………………………………………………………11
Acknowledgements………………………………………………………………………….12
Foreword….....………………………………………………………………………………..13
I – Chapter One: Why do We Collaborate and With Whom? A Study of
Preferences in the Plastics Electronics Sector ................................................. 20
I - 1: Abstract ............................................................................................. 20
I - 2: Introduction ....................................................................................... 21
I - 3: Theory: Organizational Determinants of Collaboration Preferences ...... 26
I - 3.1: Matching Preferences for Collaboration ......................................... 29
I - 4: Research Methods .............................................................................. 34
I - 4.1: Context and Sample ...................................................................... 34
I - 4.2: Conjoint Analysis .......................................................................... 36
I - 4.3: Dependent Variable: Preference Score for Collaboration Scenario .. 38
I - 4.4: Independent Variables .................................................................. 41
I - 4.5: Regression Methods ...................................................................... 44
I - 5: Results and Discussion ...................................................................... 46
I - 5.1: Link to the Second Study .............................................................. 53
I - 6: Theory and Hypotheses: Aspirations and Collaborations ..................... 56
I - 6.1: Relational Capability as Moderator ................................................ 57
I - 7: Methods and Measures ....................................................................... 62
I - 7.1: Explanatory Variables and Controls .............................................. 64
I - 8: Discussion of Results ......................................................................... 66
I - 8.1: An Empirical Investigation of Model Fit ......................................... 71
I - 9: Discussion .......................................................................................... 75
II – Chapter Two: Old Technologies as Templates for New Inventions ............. 81
II - 1: Abstract ............................................................................................ 81
II - 2: Introduction ...................................................................................... 82
5
II - 3: Theory and Hypotheses ..................................................................... 85
II - 3.1: Subtraction, Reconfiguration, Addition, and Replacement ............ 87
II - 3.2: Renewed versus Recycled Inventions ............................................ 89
II - 3.3: The Effect of Temporal Lapse ....................................................... 90
II - 3.4: The Effect of External Search ....................................................... 94
II - 4: Data and Methods ............................................................................. 96
II - 4.1: Data Sources ............................................................................... 98
II - 4.2: Variables ................................................................................... 100
II - 5: Analysis .......................................................................................... 107
II - 6: Results ............................................................................................ 110
II - 6.1: Limitations ................................................................................ 119
II - 7: Discussion ...................................................................................... 121
III – Chapter Three: Invention as a Process of Escalating Recombinant Search
................................................................................................................... 124
III - 1: Introduction ................................................................................... 124
III - 2: Deconstructing Search ................................................................... 127
III - 2.1: How? Search as Process............................................................ 130
III - 2.2: What/Who am I Looking for? Object Search or Holder Search ... 132
III - 2.3: Who am I? Defining the Searcher .............................................. 137
III - 2.4: The Recombinant Search Process in Time ................................. 139
III - 3: Knowledge-Based Theory and Barriers to Recombination ................ 151
III - 3.1: Knowledge Articulation ............................................................. 155
III - 3.2: Knowledge Flow ........................................................................ 161
III - 3.3: Knowledge Absorption .............................................................. 169
III - 4: Escalating the Inventing Unit ......................................................... 172
III - 4.1: The Inventor ............................................................................. 176
III - 4.2: The Team.................................................................................. 179
III - 4.3: The Firm ................................................................................... 181
III - 4.4: The Inter-Organizational Collaboration ..................................... 185
III - 4.5: Open Innovation ....................................................................... 189
III - 4.6: Overview of Escalation .............................................................. 192
III - 5: Escalating Recombinant Search ...................................................... 195
III - 5.1: Knowledge Structure ................................................................ 196

6
III - 5.2: Ingression Costs ....................................................................... 201
III - 5.3: Towards a Framework of Escalating Knowledge Recombination . 207
III - 6: Conclusion ..................................................................................... 213
IV – Chapter Four: Contributions to and Reflections on Knowledge .............. 215
IV - 1.1: Contributions to University – Industry Collaboration Research.. 223
IV - 1.2: Contributions to Behavioural Foundations of Strategy .............. 224
IV - 1.3: Contributions to Methods: Conjoint Analysis and Beyond ......... 227
IV - 1.4: Contributions to Recombination Research ................................ 230
IV - 1.5: Implications for Managers ......................................................... 232
V – References ............................................................................................. 236
7
Table of Tables
Table I-1: Scenario Characteristics and Number of Occurrences ..................... 39
Table I-2: Stepwise GLS Regression with Random Effects ............................... 47
Table I-3: Robustness Checks ........................................................................ 48
Table I-4: Cumulative Probit Model: Stepwise Analysis ................................... 70
Table I-5: Empirical Investigation of Model Fit ................................................ 73
Table I-6: MEB, MQE and AQE for Alternative Regression Models .................. 75
Table II-1: Correlation Matrix and Descriptive Statistics ............................... 109
Table II-2: Negative Binomial Regressions Examining the Relationship between
Recombinations and Impact ......................................................................... 111
Table II-3: Negative Binomial Regressions Comparing the Impact of Inventions
that Rely only on the Original Components (Recycled Inventions) versus
Inventions that Introduce New Components (Renewed Inventions). .............. 113
Table II-4: Negative Binomial Regressions Comparing the Impact of the Four
Processes (Subtraction, Reconfiguration, Addition and Replacement) of
Recombining Inventions ............................................................................... 117
Table III-1: Focal Variables in Escalating Recombinant Search Process ........ 145
Table III-2: Overview Knowledge Articulation, Flow, and Absorption ............. 155
Table III-3: Barriers to Knowledge Recombination ........................................ 176
Table III-4: Ingression Costs and Knowledge Structure ................................. 209
8
Table of Figures
Figure I-1: Marginal Effect of Seeking R&D on Collaboration Preferences ....... 52
Figure I-2, a-d: - The Influence of Aspirations and Relational Capability on
Collaboration Preferences .............................................................................. 67
Figure I-3: Variability of Predictions of Aspiration Models ............................... 74
Figure I-4: Model Fit for Cumulative Link Models and Ordinary Least Squares
..................................................................................................................... 75
Figure II-1: The Effect of Temporal Lapse ..................................................... 115
Figure II-2: The Effect of External Search ..................................................... 115
Figure III-1: Invention as a Process of Escalating Recombinant Search ......... 148
Figure III-2: Graphic Representation of Escalation of the Inventing Unit ....... 194
Figure III-3: The Universe as Metaphor for the Knowledge Structure ............ 207
9
Table of Chapter Three Propositions and Assumptions
III-a: Assumption 1: Sufficient Condition for Search ..................................... 128
III-b, Assumption 2: Costs for Object and Holder Search .............................. 137
III-c, Propositions 1 to 4: Deviating from search-as-outcome (SOA) assumptions
................................................................................................................... 142
III-d, Assumption 3a: Key Driver of Escalation ............................................. 149
III-e, Assumption 3b and Propositions 5-7 regarding Marginal Value of
Components ................................................................................................ 150
III-f, Costs associated with Knowledge Flow .................................................. 169
III-g, Proposition 8: Knowledge Absorption ................................................... 172
III-h, Proposition 9: Escalation versus Articulation, Flow, and Absorption .... 174
III-i, Propositions 10a-f: A Break-Down of Proposition 9 by Invent Unit ........ 192
III-j, Reconceptualization and Extension of the Formulas ............................. 205
10
DECLARATION OF ORIGINALITY
I, Simon Schillebeeckx, hereby confirm that I am the sole author of this
dissertation. While all knowledge, especially academic knowledge, builds
extensively on the work of others, I have been as rigorous as I could in
adequately referencing the sources of the ideas that inspired me along the way.
While the words in this dissertation are my own, I formally acknowledge
that the first chapter is using data that were given to me by Dr. Zella King from
Reading University. Various drafts of this chapter have been submitted for
review at Research Policy and Strategic Management Journal (SMJ), so that this
chapter has benefited from the advice of anonymous reviewers as well the
editors of those journals. Additionally, the framing of the argumentation has
been guided by Gerry George as well as by Sankalp Chaturvedhi, who are both
co-authors on the recent second round submission at SMJ.
The second chapter is currently being reworked for second round
submission at the Academy of Management Journal. It is joint work with Tufool
Alnuaimi and Gerry George. A short version of this chapter has been published
before at the Academy of Management Proceedings, following the selection of
the manuscript at the 2014 annual meeting.
All mistakes and confusion in writing, analysis, and argumentation are
obviously my own.

11
COPYRIGHT DECLARATION
The copyright of this thesis rests with the author and is made available
under a Creative Commons Attribution Non-Commercial No Derivatives licence.
Researchers are free to copy, distribute or transmit the thesis on the condition
that they attribute it, that they do not use it for commercial purposes and that
they do not alter, transform or build upon it. For any reuse or redistribution,
researchers must make clear to others the licence terms of this work.

12
ACKNOWLEDGEMENTS
It has been noted before that a dissertation is an individual and often
lonely endeavour: Six months into the process about 99.5% of people on earth
have no idea what you’re doing anymore and about one year later that number
rises to 100%, generally including the main author.
While I cannot say I have not been lost at times, I did not experience the
last three years as a lonely journey. I have had the good fortune to end up in a
place with fantastic people who have, at various moments in time, been
beacons of light guiding my way.
First and foremost, I owe eternal gratitude to my supervisor, mentor, and
friend Gerry George who took a (calculated?) risk when offering me a position.
Without his guidance, support, and the occasional office whiskey, I would not
be anywhere near where I am today, professionally nor personally. Thank you
for believing in me, having my back when I felt pressed against the wall, being
optimistic and inspirational, and for many other small and big things.
I also want to thank my family for encouraging me to follow my own
dreams, to dream big, and to have faith that everything will turn out for the
best, even at times when I lost sight of that conviction.
I owe a lot to the friends I made here in London: Andrea, Andreas,
Andres, Antoine, Anupa, Birgit, Caterina, Charlotte, Chris, Cleo, Dmitry, Jan
(x2), Jamie, Lien, Leslie, Oleg, Paul, Sam, and all those I’m forgetting. You are
awesome. May the wine sampler be with us forever!
Then, I want to thank my co-authors Tufool, Mark, Sankalp, Nilay, Priti,
and Rahul who have been a pleasure to work with, and many other great
colleagues with whom I have not yet had the pleasure of working. Maybe in the
future Nelson, Markus, Paola, Anne, Yuri, Andreas…?
And I cannot forget Professor Andy Crane, who was kind enough to meet
with me before I started my PhD, to talk me out of other options, and tell me to
go to Imperial College. He could not have been more right!
13
FOREWORD
How will we as a society evolve? How do we deal with the big societal
challenges? How do we make our lives a bit easier, a bit better? No matter
which important question you ask, a managerial reply could often be ‘through
innovation’. As the economy forces itself through “gales of creative destruction”
(Schumpeter, 1942), the obsolete get weeded out, and new inventions take
centre stage, until the next wave comes. It is this process of entrepreneurial
discovery, not the invisible hand of the market that drives economic progress
(Kirzner, 1997).
The study and practice of management, strategy, entrepreneurship, and
innovation, is the study and practice of how individuals, teams, and firms defy
the invisible hand. If the basic models of economics were accurate
representations of reality – which not even economists claim they are – then
there would be no need for managers, entrepreneurs, or strategic decisions,
because in a world of perfect information, equitable distribution of resources,
equal access to opportunities, zero transaction costs, clearly defined property
rights, no market power, perfect factor mobility, and so on, managerial,
entrepreneurial, and decision-making services could be traded in the market
without any difficulty. The market would fulfil its role as the ultimate mediator
perfectly and the firm would be a fiction, not a fact (Williamson, 1975). Yet this
is clearly not the world we live in. Firms are extremely important tools in the
process of invention because they facilitate knowledge integration, knowledge
application, and knowledge absorption by being an organizational home for
14
ideas and their development (Grant, 1996; Kogut and Zander, 1992, 1996;
Zander and Kogut, 1995).
Within this broad subdomain of the social sciences, the generation of new
and successful ideas is of fundamental importance. The study of innovation
and invention is principally preoccupied with the questions “What are good
ideas?”; “Where does novelty come from?”, “What is and who appropriates the
value of invention?”, “What are the drivers of invention?” and “How is invention
organized”? Despite the famous, proverbial, Newtonian apple, and our tendency
to believe in individual strokes of brilliance that change a generation, most
evidence suggests that good ideas are co-created, that they need to be
recombined or as Johnson (2011) stated, “have sex”. It is the recombination of
the familiar into something new or the addition of a novel component to a few
known ones that generates great success (Boyd and Goldenberg, 2013a,
2013b). It is the happy coincidence or the openness to serendipity that leads to
a Eureka moment for the right person at the right time (Denrell et al., 2003).
As Newton (1676) wrote “if I have seen further, it is by standing on the
shoulders of giants”. It is therefore no surprise that inventor teams are more
likely to generate high impact inventions and that they are less likely to face
particularly poor outcomes, when liken to lone inventors (Singh and Fleming,
2010). A recent study has shown that teams are especially creative when
diverse team members are actively trying to see the problem at hand through
the eyes of others via perspective taking (Hoever et al., 2012). It is the bringing
together of people in collaborations, alliances, partnerships, or in physical
spaces that enables ideas or half-hunches to mingle, and in doing so leads to
15
both marginal improvements and breakthrough inventions (Johnson, 2011;
Schumpeter, 1942). “The recombination of different technologies to generate
radical innovations has been viewed as the holy grail of innovation research
since the first half of the 20th century” (Gruber, Harhoff, and Hoisl, 2013, p.
837).
Innovation requires this complex combination of tangible and intangible
resources, of people with the right attitude, the right capabilities, and the
willingness to act, and often of different organizations that straddle scientific
domains and break out of their boundaries to collaborate with known or
emerging goals in mind. In a famous quote, George Bernard Shaw (1903, p.
134) stated that “The reasonable man adapts himself to the world: the
unreasonable one persists in trying to adapt the world to himself. Therefore all
progress depends on the unreasonable man”. It is this willingness and ability to
challenge the status quo that inventors have in common, and it is their work,
their process, their collaborators, and their success that I am studying.
Much like the process of invention, the production of academic
knowledge builds on the combined work of the many that came before me and
hopefully many will build on this work in the future. This dissertation will focus
on three aspects of the generation of new ideas.
Firstly, I will look at how preferences to collaboratively generate new
ideas are influenced by both organizational and individual characteristics. I
find that different funding sources and interpersonal similarity have an
important influence on the determinants of collaboration preferences. Also,
prior collaborative experience moderates the importance of the funding sources
16
whereas the purpose of the collaboration moderates both resource provisioning
and similarity. In a subsequent study, I focus on individuals’ aspirations and
how they are moderated by networking skills, knowledge, and openness in the
determination of collaboration preferences. While this relation might seem self-
evident, very little management research so far has paid attention to individual
characteristics in the process of collaboration. Moreover, the few papers that
have looked at this, have focused either on interpersonal qualities such as trust
and affect (Casciaro and Lobo, 2008), or at scientific capabilities, i.e. the
objective focal knowledge a person possesses that is needed in the
collaboration. While trust and scientific capabilities clearly matter, an exclusive
focus on these aspects downplays the importance of professional
characteristics. I argue and find that these more generic characteristics
influence individuals’ predisposition towards collaboration above and beyond
the influence of their scientific knowledge and what we know about the type
and objective of the collaboration. In doing so, I contribute to the literature on
the antecedents of collaborative generation of inventions. By taking a micro-
foundational approach and focusing on individual characteristics and
individual preferences, this study underwrites the importance of behavioural
aspects in collaborative invention.
Secondly, I investigate how firms combine old and new knowledge
components to generate high impact inventions. It is common knowledge that
firms recombine old ideas to generate new inventions (Fleming, 2001). Given
that invention requires complex coupling of markets and technologies, it is
prone to failure. Inventors make mistakes or get overtaken in the rat race to
17
create high impact inventions. While overall, radical breakthroughs are often
the result of distant coupling of completely novel ideas, most successful
inventions occur closer to home; in more familiar waters one might say (Boyd &
Goldenberg, 2013a). The idea that we have to think outside the box to generate
new inventions, obfuscates the fact that thinking inside the box can be a very
fruitful endeavour. Biologist Jennifer Owen spent 30 years researching her own
small garden in a Leicester, England. During that time, she and her husband
identified 2,673 different species, 20 of which had never been seen in the UK
and 4 of which had not yet been discovered. She acknowledges that with more
time and additional expertise, the total tally could have reached about 8,000
(Brown, 2010). There is richness in familiarity.
However, while thinking inside the box can spark diverse findings,
eventually one is bound to approach the knowledge frontier. Thus knowing the
box and only the box is likely to lead to non-benign competency traps
(Siggelkow and Levinthal, 2005). Hence, ever since March (1991), academics
have been researching the highly elusive balance between exploitation and
exploration. And while the relevant contingencies and the necessary trade-offs
are still debated (e.g. Hoang and Rothaermel, 2010; Uotila et al., 2009), what
seems clear is that across time, firms will need a bit of both to survive and
thrive. An associated stream of literature looks at how firms recombine
knowledge components to generate new inventions (Fleming, 2001; Fleming,
2002; Katila, 2002; Katila and Ahuja, 2002), building on the Schumpeterian
notion of recombination (Schumpeter, 1934).
18
In this joint work with Dr. Tufool Al-Nuaimi and Prof. Gerry George, we
unpack how firms recombine knowledge components in different ways to
generate new patented inventions. We posit that firms re-cycle and re-new old
ideas and that the result of these combinatory processes fare differently in the
market. Both recycling and renewing existing combinations result in higher
impact than using virgin combinations while time between two inventions and
distant search moderate the success of recycled and renewed inventions in
unexpected ways.
In the third and final chapter, I develop a model of invention as a process
of escalating recombinant search. The question I am trying to solve is the
following: How does invention happen from an evolutionary perspective? Two
aspects of the previous empirical studies inspire this question. In the first
study, the implicit assumption is that collaboration beyond the boundaries of
the organization is the answer to the problemistic search for knowledge. In the
second chapter, the search for knowledge occurs by the firm’s inventors and is
directed towards accessing information that is somehow objectively out there.
While these two processes seem to be logically intertwined, the search for
collaborators can bring about new information, and the search for information
can connect the searcher with individuals or organizations that control the
needed information. Hence, if search is the driving force behind both the
integration of new knowledge components and the integration of new
collaborators, how does this realization affect the process of invention?
I argue that invention can be understood as a process in which the unit
of invention escalates over time. Every escalation increases the number of

19
people directly involved in the inventive process, from individual over team and
firm to potentially dyadic collaborations or even open innovation. This
escalation has as key purpose to increase the knowledge absorption the group
of inventors can manage, while at the same time generating problems around
knowledge flow and increasing the importance of knowledge articulation. The
final chapter aims to unfold this complex evolutionary process.
20
I – CHAPTER ONE: WHY DO WE COLLABORATE AND WITH WHOM? A STUDY OF
PREFERENCES IN THE PLASTICS ELECTRONICS SECTOR
I - 1: Abstract
We examine individual collaboration preferences of corporate and academic
members of a UK-based Knowledge Transfer Network. Using conjoint analysis,
we provide insights into the relative importance of various characteristics of
potential collaborations in determining preferences. In doing so, we avoid the
bias of sampling on actual collaborations and thus improve understanding of
the actual drivers of collaborations. We present two separate empirical studies.
The first study interprets individuals’ responses as organizational choices and
finds that research funding and similarity are key predictors of collaboration
preferences. We find that both are moderated by the purpose of the
collaboration and that prior experience also matters differently depending on
the type of funding.
The second study uses a subset of the dataset for which we have additional
information on respondents. We hypothesize and find that individuals facing an
aspirational gap (either positive or negative) are more favourable to
collaboration in general and that relational capability, with proxies network
information, networking skills, and networking openness, moderates these
aspirational effects in complex ways.
These two studies contribute to our understanding of the drivers of
collaboration formation. Our finding that both organizational and individual
idiosyncrasies determine preferences suggests more multi-level research could
further develop our knowledge about interorganizational relationships.
21
I - 2: Introduction
Collaborations between and within industry and universities are critical
for innovation. Interorganizational relationships are increasingly important
sources of competitive advantage (Dyer and Singh, 1998), and firms that draw
from university research are known to foster economic growth (Mueller, 2006).
However, opportunities to form collaborative partnerships are unequally
distributed across organizations (Ahuja, 2000b; Mitsuhashi and Greve, 2009).
The network literature suggests that being part of a network increases the
chances of forming a tie with a member within that network, especially when
these networks are dense (Goerzen, 2007; Schilling and Phelps, 2007).
Structural positions within a network are found to be important in tie
establishment, as well as spatial proximity and collocation (Narula and
Santangelo, 2009; Stuart, 1998).
We study collaboration within a UK-based plastic electronics knowledge
transfer network (KTN). Plastic electronics is an emerging industry in which
innovations in solution-based chemistry and materials science are brought
together to create lightweight, robust, and disposable electronic devices on
flexible surfaces. New product development in plastic electronics spans the
disciplines of chemistry, physics, and engineering, as well as the electronics,
printing and chemicals industries, requiring partnerships that have not been
observed before. Research has shown that especially when the knowledge base
of an industry is complex and expanding, as is the case in this study, the locus
of innovation tends to be found in learning networks (Powell, Koput, and
Smith-Doerr, 1996). Additionally, this novel context provides an interesting
22
extension to research that has largely focused on US biotechnology and
pharmaceutical collaborations (McKelvey, Alm, and Riccaboni, 2003).
Even within established learning networks, differences between SMEs,
large organizations, and universities are likely to affect chances of tie formation.
We know that the institutional norms of the academic and the commercial
spheres diverge (Dasgupta and David, 1994), yet there is also evidence that
universities increasingly patent their own research and are willing to license
technologies which, in combination with businesses’ reliance on external R&D,
implies that the divide between open and commercial science has somewhat
narrowed (Mowery et al., 2001; Thursby and Kemp, 2002; Thursby and
Thursby, 2002). This tendency is also evident in the growing literature on
university entrepreneurship, intellectual property protection, and research-
based spinoffs (Clarysse et al., 2007; Lockett and Wright, 2005; Mustar et al.,
2006; Rothaermel, Agung, and Jiang, 2007; Vohora, Wright, and Lockett,
2004). Nonetheless, it is unlikely that the apparent convergence between
industry and universities has truly eliminated barriers to collaborate (Bruneel,
D’Este, and Salter, 2010; Siegel et al., 2003). Barriers are likely to persist and
to affect organizations with different resources differentially.
Fontana, Geuna, and Matt (2006) found that the propensity to forge
university – industry collaborations depends on firm size, while Santoro and
Chakrabarti (2002) conclude that size influences the task-orientation of
collaborations with universities, with smaller firms focusing on core technology
and larger firms on non-core technological competencies. Also, despite SMEs’
lack of R&D self-sufficiency, they are less inclined to work with research
institutes than larger organizations (Tether, 2002; Woolgar et al., 1998). In
23
addition to such general tendencies, SMEs are known to have lower slack
resources (George, 2005) and to face liabilities of size when they enter in
collaborative relationships (Rao, Chandy, and Prabhu, 2008). Therefore, SMEs
are in general less selective when choosing partners to collaborate with and
tend to stay more local (De Jong and Freel, 2010; Narula, 2004). Besides
organization size, it has been shown that experience with collaboration shields
organizations from behavioural and outcome uncertainties, inherent in
collaborations (Inkpen and Tsang, 2005). Also, prior partners are often favoured
for future interactions, although this is not always an optimal choice (Goerzen,
2007). Various characteristics of an organization will thus influence the
likelihood of establishing a partnership. The same characteristics will
correspondingly determine a potential partner’s preference of establishing a tie
as well. Thus, tie formation is not only about who you are but also about who
wants to partner with you (Mindruta, 2013; Mitsuhashi and Greve, 2009).
Most of the current research is based on existing partnerships, which
makes it difficult to know whether established knowledge regarding focal
organization characteristics that drive collaboration reflect actual preferences of
that organization or are the consequence of selection through the matching
process. Stuart and Sorenson (2007) thus argued that much extant work on
collaboration antecedents suffers from positive selection bias. Using insights
from matching theory (Jovanovic, 1979; Logan, 1996), the formation of inter-
organizational partnerships has previously been construed as a selective
matching process or an assignment game, in which each player ranks others
and forms a tie with the most desirable partner who is also available (Mindruta,
2013; Mitsuhashi and Greve, 2009). Matching theory asserts that, to
24
understand the determinants of relationships that are entered into voluntarily,
it is necessary to consider the characteristics and resources that each potential
partner values in all other potential partners (Logan, 1996). To better
understand the desired match characteristics, we look at preferences for
collaboration before the establishment of an actual tie.
Ranking potential partners on the basis of preferred characteristics is
fundamental to matching theory. Preference ordering has been examined in the
choice of marriage partners, entrepreneurial ties, and employment
relationships (Ferris and McKee, 2005; Logan, Hoff, and Newton, 2008; Vissa,
2011) but has not explicitly addressed technology development collaborations
that suffer from high outcome uncertainty and potential for opportunism
(Wathne and Heide, 2000). High uncertainty in collaborations is exemplified in
frequent failures to create value, for instance due to unrecognized transaction-
specific investments (Madhok and Tallman, 1998) such as establishing
common ground (Bechky, 2003; Okhuysen and Bechky, 2009).
We investigate how resource provisioning (in the form of research
funding) and similarity influence a respondent’s preference for a potential
match and investigate the moderation effects of prior experience and
collaboration purpose. As research funding is being put forward by
governments and commercial organizations to stimulate growth in the plastic
electronics industry, investigating the effectiveness of different sources of
research funding in influencing match preferences has relevance for
policymakers.
This work offers various contributions to the literature. To the best of our
knowledge, no prior research has looked at preference ordering of desired
25
matches, which responds to demands for more work on the understudied
origins of partner selection, alliance formation, and collaboration (Li et al.,
2008; Stuart and Sorenson, 2007) and overcomes the ex post selection bias
inherent in much research that focuses on established alliances and
collaborations (Mindruta, 2013). We find that both resource provisioning and
similarity have a positive impact on collaboration preferences but with some
important contingencies. Who provides the funding matters a great deal:
partner funding is preferred over government funding and both are preferred
over no funding and self-funding. This preference is reinforced by prior
collaboration experience. However, when the focal firm is seeking to establish
an R&D partnership the relative influence of funding diminishes. Further, we
find that while similarity has a positive impact on preferences, this linear
relationship is moderated by the objective of the partnership (R&D or not).
Finally, the method of conjoint analysis (Green, Krieger, and Wind, 2001),
which is common in marketing, has had limited use in innovation studies (for
an exception see, Riquelme & Rickard (1992)). In both studies we use the
conjoint method in slightly different ways and analyze the data with different
regression techniques. We submit this method could be very useful in future
research that aims to understand strategic decision-making and trade-offs.
One of the key weaknesses of this approach is what behavioral strategists
have called “mental scaling”, which refers to assuming organizational actions or
decisions necessarily correspond with the ones of individuals (Powell, Lovallo,
and Fox, 2011). As our theorizing is rooted in organizational theories while our
data consists of survey responses from individuals, we implicitly assume that
what goes for the individual also goes for the organization. While this has been
26
done before (e.g. Gupta and Sapienza, 1992), we acknowledge the limitations
this puts on our work.
The second part of this chapter turns this weakness into strength. Using
a subsample of the same collaboration data for which we have additional
information, we theorize and investigate how individual characteristics will
affect collaboration preferences, while we control for organization- and
collaboration-specific effects. Because this second part builds on aspiration
theories, focuses on the individual, rather than the organization, and uses
some different operationalizations of data, we refrain from integrating it
completely with the first part. To maintain the logical flow of theoretical
argumentation, this chapter is thus split into two separate parts with their own
theory development, empirical analysis, and results discussion. The findings
are jointly discussed at the end of the chapter.
I - 3: Theory: Organizational Determinants of Collaboration
Preferences
Matching theory has moved from the laboratories of experimental
psychology (Herrnstein, 1961, 1970) into marketing research like consumer
brand choices (e.g. Foxall and James, 2003; Foxall and Schrezenmaier, 2003).
The key characteristic of this branch of matching theory is that a specific
reinforcement influences the choice behaviour of subjects so that at
equilibrium the subject distributes its responses in proportion to the patterns
of rewards obtained by their consequences. Almost in parallel, a similar
matching theory emerged from a mathematical treatise to optimize partner and
college allocations (Gale and Shapley, 1962) which had a significant influence
on research about employer-employee relationships (Jovanovic, 1979; Logan,
27
1996). Here, two actors seek a match based on their preferences about the
other’s resources. Therefore, this theory differentiates between the
determinants and the consequences of choice (does the ego want to match with
the alter?) and those of opportunity (is the alter interested in matching with the
ego?) (Logan, 1996). Both the non-exclusive matching theory of Herrnstein
(1961, 1970) in which the subject can constantly alter its choices to optimize
the outcome and the exclusive matching theory of Gale and Shapley (1962) in
which a single choice must be made between ‘mutually-excluding alternatives’
thus share the disposition that choice or preference is subject to some kind of
reinforcement, either through an exogenous characteristic (e.g. brand
appreciation) or through an endogenous match criterion (e.g. similarity). Our
research builds on both traditions as we look into non-exclusive preferences
(matches are not established) for and from network members that could
collaborate.
Recently, matching theory has been introduced to management in
studies of alliances (Mitsuhashi and Greve, 2009), the selection of outside
CEOs (Fahlenbrach, Low, and Stulz, 2010), entrepreneurial tie formation
(Vissa, 2011) and university-firm collaboration (Mindruta, 2013). These studies
have started to write on the blank slate matching theory provides in order to
improve understanding of the resources and characteristics that drive partner
selection and match quality. Mitsuhashi and Greve (2009) found that
compatibility of observable resources, and market complementarity drive
alliance formation in the shipping industry and that matches that score high
on both characteristics improved firm performance. Vissa (2011) extended
28
research on entrepreneurial tie formation, and found that both task
complementarity – the overlap between the actor’s current task priorities and
the resources potentially available from the partner – and social similarity are
important matching criteria that influence tie formation intentions and actual
match formation. Beyond matching theory, empirical research that looks at
alliance formation has found that specific characteristics of the focal
organization such as resource endowments, network positions, and prior
familiarity inspire the formation of a tie (Ahuja, 2000b; Geringer, 1991; Gulati
and Gargiulo, 1999).
Implicit in most alliance research is the idea that the beneficial
characteristics sought for in a partnership or collaboration, are transparent in
existing matches. This is not necessarily self-evident. Existing matches may be
mismatches based on incorrect assumptions or information asymmetry, or may
be construed by lack of alternative. Fahlenbrach et al. (2010) for instance found
that CEOs are more likely to become board members of other firms if those
firms are geographically close and similar with regards to governance, financial,
and investment policies, but failed to find evidence of positive impact of these
board interlocks on performance or on returns from acquisitions. Goerzen
(2007) found that prior experience with a specific partner increases the
likelihood of entering into another collaboration with this partner, but that
such collaborations experience inferior performance. There is thus evidence
that existing matches are not automatically beneficial for the partners. This
might be explained by cognitive limitations and local search (Cyert and March,
1963; Simon, 1947), but could also be explained by the two-sided market
29
dynamics of match formation: the decision to tie with a partner is
fundamentally constrained by the decisions of all the other partners to
establish a match as well (Mindruta, 2013). Looking at existing matches to
retrospectively understand underlying preferences – by interpreting match
antecedents as drivers of tie formation – results thus in a biased sample.
Given that ex-post matches are not self-evident proof of ex-ante desired
partner combinations, it is valuable to investigate pure preferences. To do this,
we require information about desired matches and their characteristics. This is
relevant to better understand what resource-constrained organizations such as
SMEs that frequently cannot afford to be picky when it comes to available
partners, are actually looking for in terms of partners (Narula, 2004). Matching
theory is particularly useful for such research because the theory implies that
people or organizations will be ranked on the basis of their perceived value to
the seeking actor (Gale and Shapley, 1962). Despite its importance in the
formation of inter-organizational relationships, relatively little attention has
been devoted to partner selection (Li et al., 2008). Therefore, extending our
understanding of which characteristics augment matching preferences is
relevant to improve our broader understanding of firms’ relational behaviour.
I - 3.1: Matching Preferences for Collaboration
Matching theory requires the existence of “inspection characteristics”
that enable an actor to rank preferences without experiencing them. Such
characteristics have been described in job matching research as online and
offline search attributes (Lippman and McCall, 1976), and in marketing as
experience and inspection goods (Hirshleifer, 1973; Nelson, 1970). As
30
collaboration preference formation occurs before the partners have experience
with working together, they have to build their preferences using cognitive
rather than experiential logics (Gavetti and Levinthal, 2000). We investigate two
such inspection characteristics that influence matching preferences: resource
provisioning and similarity.
I - 3.1.1: Resource Provisioning
Resource provisioning in the form of research funding between parties is
likely to affect tie formation (Lee, 2000). Funding has been shown to be a
primary reason for universities to collaborate with industry (Meyer-Krahmer
and Schmoch, 1998) and economic rationality in general dictates a preference
for funding inflow over outflow, ceteris paribus. Our empirical context allows
for funding to be provided by the partner (P) or the government (G), as well as
collaborations in which the respondent’s organization self-funds the
collaboration, including the partner’s expenses (S) or collaborations with no
funding (N). It seems intuitive to assume that respondents would rank their
funding preference as follows: P > G > N > S1 with the preference for partner
funding over government funding explained by the relative absence of
associated bureaucracy and perhaps a higher commitment by the partner as a
consequence of cash investment.
However, this rationale is likely to be influenced by the objective of the
collaboration. While firms are increasingly looking outside their boundaries to
build technological capabilities by accessing patents, know-how, equipment, or
1 This does not mean partner funding is higher than government funding in monetary terms.
We do not make any claims about the amount of funding as our survey did not enquire about
this. We use the ‘greater than’ (>) symbol merely to reflect preferences.
31
materials generated as a result of the partner’s R&D activity (Chesbrough,
2003; Hung and Tang, 2008; Laursen and Salter, 2006), such activities are
characterized by high uncertainty as the outcomes of exploratory technology-
oriented R&D are very difficult to anticipate (Shah and Swaminathan, 2008).
Firms seeking external sources of R&D are typically required to invest financial
and other complementary resources in order to secure the partner’s
cooperation. Additionally, firms that provide funding are likely to be in a better
state to control the outcomes of the partnership and appropriate the knowledge
that is being developed. This leads to the following hypothesis:
Hypothesis 1: The positive relationship between resource
provisioning and collaboration preferences (P > G > N > S) will be
weakened when organizations are seeking to develop R&D
partnerships.
We argue that organizations with prior collaboration experience will be
more susceptible to resource provisioning and propose three supporting
arguments. Relational capabilities, built up from prior experience of
collaboration, compensate for behavioral uncertainty and facilitate knowledge
integration (Powell et al., 1996; Tzabbar, Aharonson, and Amburgey, 2012).
Organizations with such capabilities are better at establishing common ground
and leverage the latent value in partnerships (Bechky, 2003; Dyer and Singh,
1998; Kale, P., Singh, H., and Perlmutter, H., 2000). Therefore, having prior
experience is likely to make organizations less interested in self-funding
collaborations (they can extract value anyway) and more favorably disposed
towards having someone else pay. This effect is strengthened when positive
prior experience (e.g. through collaboration with high status or high quality
organization) is associated with higher status within the network so that
32
organizations that have such experience might be more desirable partners and
feel a sense of entitlement (Lin, Yang, and Arya, 2009). In essence, such
organizations are more worthy collaborators and hence entitled to be
benefactors of funding. However, when prior experience is negative, for instance
because costs spiral out of control, organizations will be less willing to provide
funding. Because we cannot assess the quality of prior experience, we cannot
hypothesize about the main effect of this variable. Regardless, prior
experience’s contingent effect on resource provisioning is likely more
predictable. We thus state:
Hypothesis 2: The positive relationship between resource provisioning and
collaboration preferences (P > G > N > S) will be strengthened when
organizations have prior collaboration experience.
I - 3.1.2: Partner Similarity
Homophily refers to the idea that similar actors will be drawn to each
other (Lincoln and McBride, 1985), which suggests that similarity will increase
the likelihood of tie formation and preference for a specific partner. Vissa (2011)
extended research on entrepreneurial tie formation, and found that social
similarity influences both tie formation intentions and actual match formation.
At the organizational level, Das and Teng (2000) theorized that resource
similarity is positively associated with alliance performance while empirical
research showed that status similarity (Chung, Singh, and Lee, 2000) and
technology similarity (Rothaermel and Boeker, 2008) increase the likelihood of
tie formation. Similar third party connections are also indicative of shared
attitudes, and increase the likelihood of social sanction if a partner behaves
opportunistically (Burt, 1987; Granovetter, 1985; Reagans and McEvily, 2003).
33
Following a planned behavior rationale (Ajzen, 1991), it seems likely that
similarity will positively influence collaboration preferences as well. It is
important to note here that we measure similarity at the individual level. Vissa
(2011) for instance measured similarity in caste, language, and occupation. We
construct a similarity measure using a combination of inspection
characteristics that network members can easily find out about each other. It is
our contention that interpersonal similarity creates assumed rapport between
individuals which would make them more favorable towards collaboration.
Within organizations, there is some support for this notion as Casciaro and
Lobo (2008) found that interpersonal affect and trust affect partner choice.
However, this positive effect is likely to be attenuated when organizations
are aiming to develop R&D partnerships. Despite differences in institutional
norms and associated culture clashes in university-industry collaborations,
and the difficulties with combining knowledge across distant scientific domains
(Bechky, 2003; Fleming and Sorenson, 2004), establishing ties between
dissimilar organizations and individuals is likely to be beneficial when seeking
to develop R&D partnerships. Inter-institutional knowledge flows have been
found to be of great importance in emerging research fields (Heinze and
Kuhlmann, 2008) and collaboration between partners with different knowledge
bases has greater payoff potential (Grant and Baden-Fuller, 2004; McFadyen
and Cannella, 2004), and is more likely to generate high value innovations
(Ahuja and Lampert, 2001; Fleming, 2001).
Moreover, it has been shown that performance of heterogeneous teams in
scientific alliances is higher than that of homogenous teams and that initial
heterogeneity can be overcome in due time, hence lowering barriers to
34
collaborate (Porac et al., 2004). Rothaermel and Hess (2007) suggested that
more research should look at interactions between individual and
organizational characteristics. They for instance found important interactions
between individual quality measures of scientists and organizational alliances
and R&D spending. Staying close to the data, our key contention is thus that
while people have a preference to deal with similar others, when it comes to the
generation of complex knowledge (R&D projects), they will be more willing to
accept social dissimilarity than when it comes to other kinds of collaborations
(operational, marketing, sales). This leads to the following hypothesis:
Hypothesis 3: The positive relationship between similarity and
collaboration preferences will be weakened when organizations are
seeking to develop R&D partnerships.
I - 4: Research Methods
I - 4.1: Context and Sample
We collected data2 from participants in a technology network serving the
needs of the plastic electronics industry in the UK. At the time of the study, the
network was one of approximately twenty Knowledge Transfer Networks (KTNs)
funded by the UK Government. The KTNs’ objective is to improve the UK’s
innovation performance by increasing the breadth and depth of technological
knowledge, by facilitating knowledge flows between UK-based businesses and
universities, and by accelerating the rate at which this process occurs
(Technology Strategy Board, 2012). The KTN we studied supported
organizations developing plastic electronics technology for displays and
lighting, including small and medium-sized enterprises, original equipment
2 Data collection and survey design were done by Professor Zella King from Reading University.
All analysis and the construction and selection of variables were done by me.
35
manufacturers and universities. Between its inception in Spring 2005 and
December 2008, the KTN organized 87 events, including seminars, partnering
workshops, tutorials and dissemination events. Membership of the KTN was
free so that barriers to join were low. In October 2008, the focal KTN had
approximately 800 members from 500 organizations listed in its database,
including a strong representation of senior executives from corporations. Its
membership was comprised as follows: 64% from companies, 20% from
universities, with the remainder made up of consultancies, government, and
other business support organizations.
While we could have opted to conduct this research in multiple KTNs, our
theoretical framing is contingent on within-network dynamics. As these
dynamics might be very different in other networks due to differences in mutual
knowledge around collaboration (Bechky, 2003; Fleming, 2004; Kotha et al.,
2013), we chose to limit ourselves to one KTN within which we were able to get
a high response rate. Besides, investigating multiple KTNs would cause
problems of construct validity as we would have had to tailor survey designs to
each individual KTN.
Invitations to fill in an electronic survey were issued to 667 members of the
KTN (all members with valid email addresses) in November 2008. After two
email reminders, responses were received from 201 members, a response rate
of 30%, by the end of December 2008. In the beginning of the survey,
respondents were asked to indicate their job roles to identify whether they were
managers, scientists, or engineers who were in a position to exercise discretion
over choice of collaboration partner. Of the 201 respondents, 50 were in
36
technology transfer or business development roles and 151 were in research-
related roles. Analysis of non-response using t-tests suggested that
respondents were significantly more likely to have attended events organized by
the network (69% of respondents had attended events, compared with 53% in
the whole population p ≤ 0.001), were more likely to have prior experience of
collaborative R&D (53% of respondents compared with 40%; p ≤ 0.001) and
were more likely to work for universities than companies (32% worked for
universities, as opposed to 22% in the population as a whole). This non-
response analysis suggests that the findings may reflect a bias toward those
with a greater motivation for finding collaborative partners, which would
decrease the variance in our data. However, the range and frequency of
responses to the question regarding collaboration scenarios (cf. infra) did not
reflect such an upward bias in any obvious way. Moreover, given that the
purpose of the study is to identify characteristics affecting preferences amongst
those who are actively seeking collaborations, this positive bias in the
responses probably reflects an actual higher commitment to the opportunities
offered by the network.
I - 4.2: Conjoint Analysis
To test the hypotheses, we needed an analytical approach that could
extend beyond a simple ranking of preferences and help examine how
preferences are weighted when they potentially compete with one another. We
chose to use conjoint analysis a method that is fairly new to innovation studies
(but see Riquelme and Rickards (1992) for an exception).
37
Conjoint analysis is a measurement technique that originated in the
fields of mathematical psychology and psychometrics and can assist
researchers in sorting out a product’s multidimensional attributes (Green and
Wind, 1975). Typically, conjoint analysis is used in marketing research to
expose preference structures underlying consumer buying decisions as it has
great potential for measuring trade-offs between multi-attribute products and
services (Green et al., 2001; Green and Srinivasan, 1990). The method is based
on the premise that preferences can best be determined by asking consumers
to judge products defined by combinations of attributes, rather than by judging
single attributes one at a time. By systematically varying attributes of the
product/collaboration and observing how respondents react to the resulting
profiles/scenarios, researchers can deduce the importance of each individual
attribute/element.
Despite its prominence in marketing research, “conjoint measurement’s
potential is not limited to consumer applications” (Green and Wind, 1975). The
method is suitable in situations of multi-attribute decision-making and is
especially useful for studying perceptions and judgements of respondents
(Riquelme and Rickards, 1992). Conjoint analysis is suitable because
respondents were not asked to rate or rank match characteristics explicitly;
instead they were asked to rate scenarios that consisted of a bundle of
characteristics, enabling us to examine how potential competition between
match characteristics is resolved. Although tailored routines exist for analysing
conjoint data (such as SPSS conjoint), conjoint analysis is a special case of
GLM.
38
Common method variance might be a problem in this sample because all
but one variable stem from the same survey. Although various methods exist to
account for common method bias (Lindell and Whitney, 2001; Podsakoff and
Organ, 1986; Podsakoff et al., 2003), a recent simulation study has shown that
all these methods actually deliver less accurate results than those without
corrections (Richardson, Simmering, and Sturman, 2009). Importantly,
Siemsen, Roth, and Oliveira (2010) reported that including more independent
variables from the same survey reduces common method variance and that
interaction effects are never artefacts of common method variance because they
are always attenuated. Therefore, we followed the advice of Conway and Lance
(2010) and refrained from using any statistical method to diminish common
method variance.
I - 4.3: Dependent Variable: Preference Score for Collaboration Scenario
We examine differences between respondents’ preference scores of
different scenarios for exploratory collaboration. Before being shown the
scenarios, respondents worked through a series of questions about exploratory
collaboration. After indicating their job role and their company’s expertise, they
were asked to indicate what type of partnership would be most useful, and to
identify the nature of expertise they would want a possible partner organization
to contribute to such a project. Then, they were presented with the following
introductory text:
“Assume that you are looking for a partner to help with exploring future
commercial opportunities and/or to help develop your research or
39
technology for the future. I will refer to these projects as exploratory
projects.”
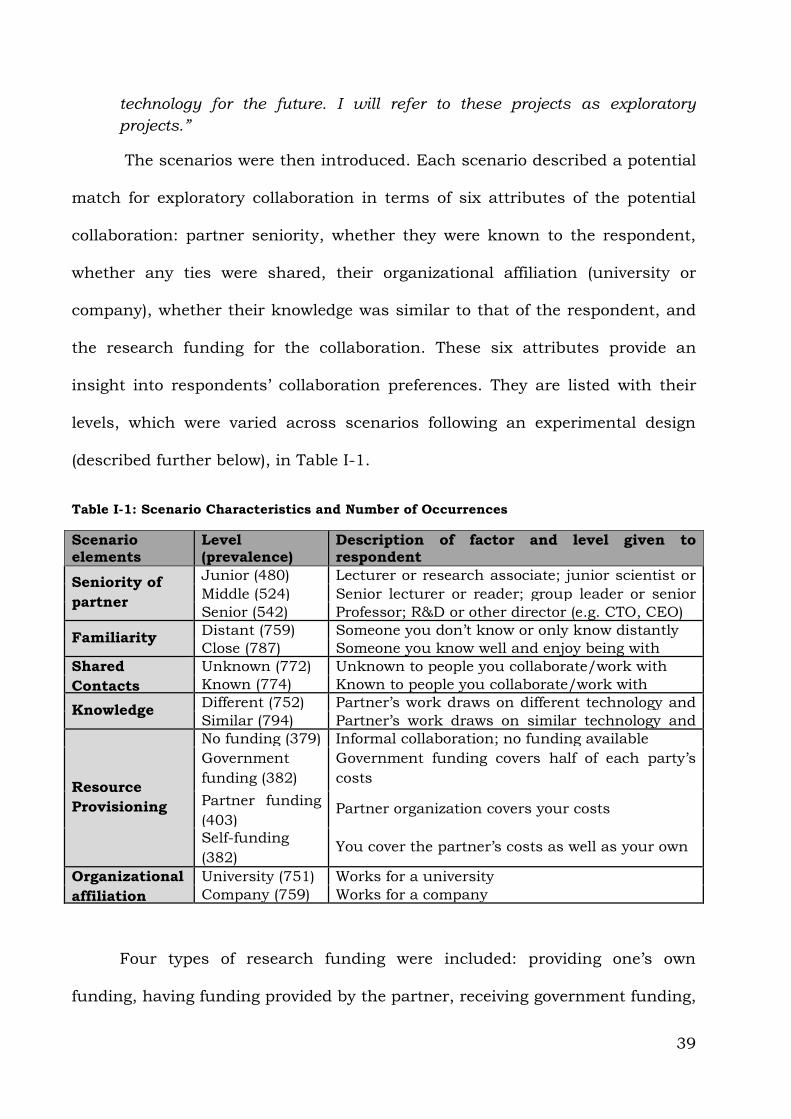
The scenarios were then introduced. Each scenario described a potential
match for exploratory collaboration in terms of six attributes of the potential
collaboration: partner seniority, whether they were known to the respondent,
whether any ties were shared, their organizational affiliation (university or
company), whether their knowledge was similar to that of the respondent, and
the research funding for the collaboration. These six attributes provide an
insight into respondents’ collaboration preferences. They are listed with their
levels, which were varied across scenarios following an experimental design
(described further below), in Table I-1.
Table I-1: Scenario Characteristics and Number of Occurrences
Scenario elements
Level (prevalence)
Description of factor and level given to respondent
Seniority of
partner
Junior (480) Lecturer or research associate; junior scientist or
engineer Middle (524) Senior lecturer or reader; group leader or senior
scientist Senior (542) Professor; R&D or other director (e.g. CTO, CEO)
Familiarity Distant (759) Someone you don’t know or only know distantly
Close (787) Someone you know well and enjoy being with
Shared
Contacts
Unknown (772) Unknown to people you collaborate/work with
Known (774) Known to people you collaborate/work with
Knowledge Different (752) Partner’s work draws on different technology and
science from yours Similar (794) Partner’s work draws on similar technology and
science to yours
Resource
Provisioning
No funding (379) Informal collaboration; no funding available
Government
funding (382)
Government funding covers half of each party’s
costs
Partner funding
(403) Partner organization covers your costs
Self-funding
(382) You cover the partner’s costs as well as your own
Organizational
affiliation
University (751) Works for a university
Company (759) Works for a company
Four types of research funding were included: providing one’s own
funding, having funding provided by the partner, receiving government funding,
40
and an informal arrangement where no funding was available. Of these, the
highest level of control over the objectives of the collaborative project would be
where the respondent’s organization funded the collaboration and the lowest
where the partner funded it. Each respondent was presented with a set of eight
scenarios, preceded by the following introductory text:
“Now imagine that you’ve identified several different companies or
universities who could provide you with the expertise you requested on the
previous screens. I’d now like to ask you what type of person you would
find worth collaborating with, in different types of funding arrangement.
The ideal partner is not always available so it is often necessary to make
compromises in choosing collaborators. On the following screen, I’m going
to ask you to evaluate how worthwhile you would find it to collaborate in
different scenarios”.
Hence, every scenario provided a combination of one type of funding, three
types of similarity (shared contacts, prior familiarity and knowledge) and two
focal attributes (partner seniority and organizational affiliation). These last two
were recoded as measures of similarity based on information provided by the
respondents about their own seniority and organization. Scenarios were rated
by 3 (due to incomplete responses) up to 8 different respondents (mean 7.7).
This rating provided our dependent variable. Although some scenarios were
only rated a few times, this is not a problem for the conjoint method. Hybrid
forms such as the ones we used have been found to compare favourably with
traditional full profile models (Riquelme and Rickards, 1992). As the goal of
conjoint analysis is to compare the relative importance of each specific attribute
in the context of variations of all other relevant attributes, what really matters
to the explanatory power of the model is how many times each attribute was
judged individually.
41
In our design, every attribute value appeared minimally 379 times. Given
that there were 192 different scenarios (4 x 2 x 2 x 3 x 2 x 2), a full factorial
design in which respondents were presented with all possible permutations of
match characteristics and levels would require them to rate 192 scenarios. This
would have vastly decreased response rate and would have placed excessive
cognitive strain on the data-supplying capabilities of respondents (Green,
Goldberg, and Montemayor, 1981). In our study, the 192 scenarios were
divided into 24 blocks of eight scenarios (using a ‘confounded blocks’ design)
and each respondent rated one block of eight, a number suggested by Green et
al. (1981). 201 respondents rated a total of 1546 scenarios. The mean value
across all 1546 scenarios was 4.78, with minimum 0 and maximum 10.
I - 4.4: Independent Variables
We use inspection-based measures that are observable at low cost
(Gavetti and Levinthal, 2000), because such measures can easily be used in the
search for a potential partner.
Resource Provisioning. We enter 3 dummies for resource provisioning
with partner as default option. This variable is derived straight from the
scenario characteristics in which funding can be provided by the partner, the
government, by the organization for whom the respondent works, or in which
no funding is provided.
Similarity. Similarity matters to collaboration and collaboration intention
(Vissa, 2011) but similarity is not a simple construct as individuals who are
very similar in one respect can be very dissimilar in others. However, if
individuals indeed prefer similar others, it seems likely that different aspects of
similarity will be implicitly weighed together resulting in some kind of similarity
42
score. We construct a similarity index (between 0 and 5) summing dummies for
(1) similar knowledge, (2) same organizational affiliation3 (university or
company), (3) shared contacts, (4) same seniority level, and (5) prior familiarity.
Seeking R&D. Respondents were asked what expertise they would want a
collaboration partner to contribute. They were given a choice of nine options,
such as ‘researches/develops materials, technology or equipment for plastic
electronics’ and ‘manufactures and uses displays and lighting products’. The
list of options was derived from interviews with members of the KTN, developed
in consultation with industry experts, and refined in response to a pilot test of
the survey. Those who selected one of the first three options (seeking a partner
who is researching and/or developing technology for plastic electronics,
displays or lighting) were deemed to be seeking a research capability. 80
respondents (39.80%) were classified as seeking R&D.
Prior collaboration. A dataset from the UK Government’s Technology
Strategy Board was used to determine whether each organization had
previously participated or was currently participating in a government-funded
collaborative R&D project in a technology area relevant to plastic electronics.
We obtained data on all projects funded as a result of invitations issued
between April 2004 and Spring 2007, within programs that addressed plastic
electronics, advanced composite materials and structures, and other disruptive
technologies in electronics and displays. Spring 2007 was an appropriate end
point because there is typically a year’s lag between the call being issued and
the project getting started. Of the projects funded in the Spring 2007 call, the
3 Leaving organizational affiliation out (because it is not strictly an interpersonal measure) and
adding it as a separate control did not significantly change the results.
43
earliest started in January 2008, and the latest in June 2008. These projects
would have been running for less than a year before the questionnaire was
issued in November 2008. Of the 201 respondents, 93 (46%) worked for
organizations that had been (were) involved in government-funded collaborative
R&D projects.
On the individual level, I add controls for relative respondent seniority.
Respondents were asked to self-classify their role using a range of options. 23
respondents were working as lecturers, research associates and junior
scientists in companies and were coded as Junior (11.44%). The 62
respondents who were senior lecturers or readers in universities or group
leaders in companies were coded as Middle (30.85%). 66 university professors
and R&D or other Directors were coded as Senior (32.84%). For respondents
with hybrid roles, spanning both universities and companies, background
research was conducted to determine from public sources which category
represented their primary role. 50 respondents were not in research-oriented
roles. 26 (12.94%) of them were in technology development roles and 24
(11.94%) were categorized as others. Using this information, I classified the
relative seniority of the respondent vis-à-vis the seniority of the partner in the
scenario.
On the organizational level, I control for organization type (Fontana et al.,
2006; Laursen and Salter, 2004). Each organization was coded to indicate
whether it was a university, a large company (with over $50m in sales and/or
500 employees), or a small company (less than $50m in sales and less than
500 employees). Of the 201 respondents, 115 (57.21%) worked in SMEs, 33
44
(16.42%) worked for large organizations and 53 (26.37%) worked for
universities. Additionally, there are dummy controls for whether the
organization has own R&D activities, and whether the organization has any
international operations. These variables came directly from the survey.
I - 4.5: Regression Methods
As stated above, conjoint analysis is a special form of the general linear
model (GLM). GLM regressions are considered robust and useful as they control
for unobserved heterogeneity caused by the unique characteristics of the
respondents that might influence the dependent variable. Furthermore, as the
effect of these unique individual characteristics might be random, I use a
random effects model. Using individual fixed effects did not change the essence
of our findings although all individual control variables naturally disappeared
from the model. The Hausman test resulted in a Chi2 score of 14.80 (p =
0.2526) which means the null hypothesis of no systematic differences in the
coefficients could not be rejected. In this case, the random effects betas are
more efficient and hence I report those.
As a prelude to the next section in which I analyse these data with
specific attention to individual characteristics, it is important to note that the
random nature of the individual effects suggests that there is indeed
unexplained variance in the individuals that is not captured by the explanatory
variables in this model. When using fixed or random effects, grouped around
the scenarios rather than the individuals, the Hausman test is significant (Chi2
45
= 82.49; p ≤ 0.001) meaning that fixed effects models need be used because the
betas in the random effects model are inconsistent.
I use the XTREG (generalised least squares) command in Stata 12 to test
the three hypotheses. I start with a baseline model of control variables (model
1) and random effects grouped around the individual respondents. Then I test
the three hypotheses consequentially in models 2, 3, and 4 after which I test all
hypotheses together in model 5. Finally, model 6 splits the similarity construct
up in three discrete variables (high, medium, and low) and tests for significance
again. The results of this stepwise procedure are summarized in table I-2.
I test six alternative specifications of the model as robustness checks.
Firstly, I show the fixed effects regression results for the full model and I repeat
the random effects regression but this time with clustering of the errors around
scenarios. While the latter seems to be an obvious choice, there is some recent
evidence on the Stata forum that there might actually be an error in the
calculation of degrees of freedom when clustering errors4 especially when using
fixed effects. Furthermore, I ran the full model also using a maximum
likelihood estimator (Stata command: xtreg DV IVs, mle nolog), a restricted
maximum likelihood estimator (Stata command: xtmixed DV IVs, vce(cluster
id), and the specific Stata command for complex survey sampling designs
(svyset, psu (clustervariable) /// svy: regress DV IVs) as well as for a tobit
regression with clustering around respondents. Table I-3 shows these results.
4 http://www.statalist.org/forums/forum/general-stata-discussion/general/5807-areg-and-
xtreg-fe-with-cluster-option-which-one-is-better
46
I - 5: Results and Discussion
Table I-2 shows the results of random-effects GLS regression. Juniors and
business developers exhibit higher preferences for collaborations. There is no
significant difference between SMEs and large organizations, but university
respondents are on average slightly more favourable towards collaboration.
Additionally, there seems to be a clear preference for working together with a
more experienced partner. Thus, juniors want to work with people who are
further ahead on the career track and so do mediors. This can likely be
explained by the associated learning benefits. Organizational and collaboration
control variables are not significant in and of their own. For resource
provisioning, the initial assumption that P > G > S > N, seems to hold.
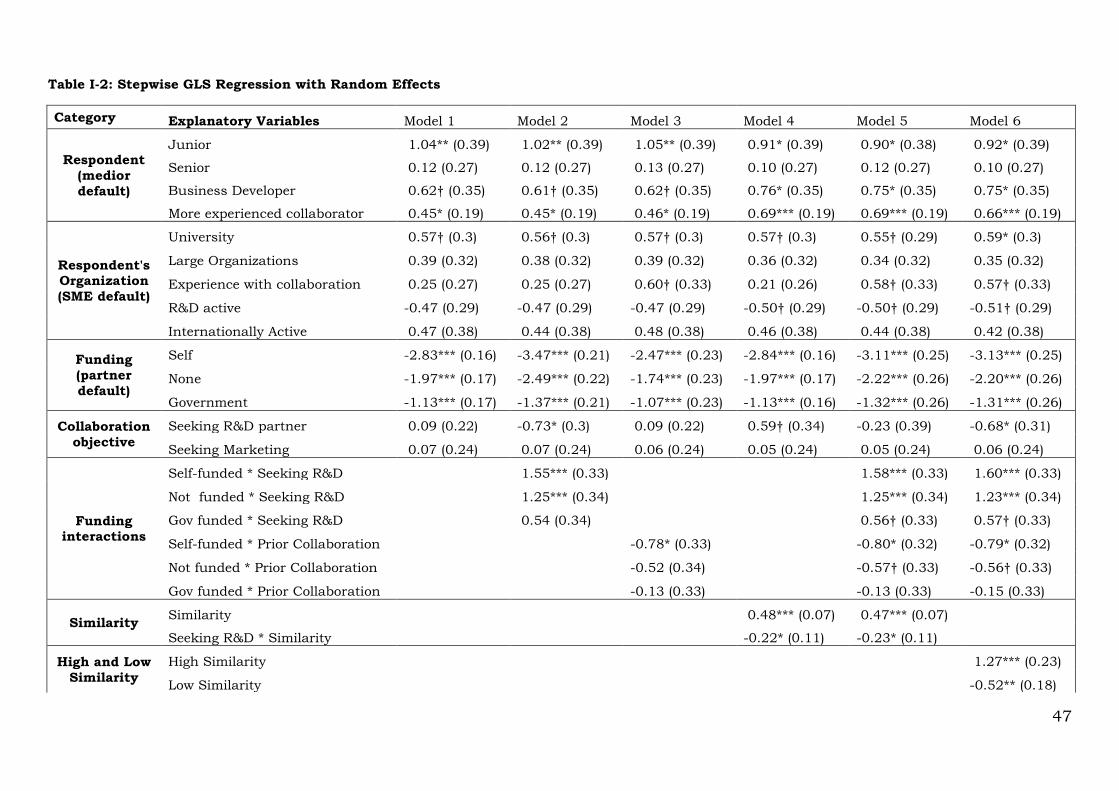
47
Table I-2: Stepwise GLS Regression with Random Effects
Category Explanatory Variables Model 1 Model 2 Model 3 Model 4 Model 5 Model 6
Respondent
(medior
default)
Junior 1.04** (0.39) 1.02** (0.39) 1.05** (0.39) 0.91* (0.39) 0.90* (0.38) 0.92* (0.39)
Senior 0.12 (0.27) 0.12 (0.27) 0.13 (0.27) 0.10 (0.27) 0.12 (0.27) 0.10 (0.27)
Business Developer 0.62† (0.35) 0.61† (0.35) 0.62† (0.35) 0.76* (0.35) 0.75* (0.35) 0.75* (0.35)
More experienced collaborator 0.45* (0.19) 0.45* (0.19) 0.46* (0.19) 0.69*** (0.19) 0.69*** (0.19) 0.66*** (0.19)
Respondent's Organization
(SME default)
University 0.57† (0.3) 0.56† (0.3) 0.57† (0.3) 0.57† (0.3) 0.55† (0.29) 0.59* (0.3)
Large Organizations 0.39 (0.32) 0.38 (0.32) 0.39 (0.32) 0.36 (0.32) 0.34 (0.32) 0.35 (0.32)
Experience with collaboration 0.25 (0.27) 0.25 (0.27) 0.60† (0.33) 0.21 (0.26) 0.58† (0.33) 0.57† (0.33)
R&D active -0.47 (0.29) -0.47 (0.29) -0.47 (0.29) -0.50† (0.29) -0.50† (0.29) -0.51† (0.29)
Internationally Active 0.47 (0.38) 0.44 (0.38) 0.48 (0.38) 0.46 (0.38) 0.44 (0.38) 0.42 (0.38)
Funding
(partner
default)
Self -2.83*** (0.16) -3.47*** (0.21) -2.47*** (0.23) -2.84*** (0.16) -3.11*** (0.25) -3.13*** (0.25)
None -1.97*** (0.17) -2.49*** (0.22) -1.74*** (0.23) -1.97*** (0.17) -2.22*** (0.26) -2.20*** (0.26)
Government -1.13*** (0.17) -1.37*** (0.21) -1.07*** (0.23) -1.13*** (0.16) -1.32*** (0.26) -1.31*** (0.26)
Collaboration
objective
Seeking R&D partner 0.09 (0.22) -0.73* (0.3) 0.09 (0.22) 0.59† (0.34) -0.23 (0.39) -0.68* (0.31)
Seeking Marketing 0.07 (0.24) 0.07 (0.24) 0.06 (0.24) 0.05 (0.24) 0.05 (0.24) 0.06 (0.24)
Funding interactions
Self-funded * Seeking R&D 1.55*** (0.33) 1.58*** (0.33) 1.60*** (0.33)
Not funded * Seeking R&D 1.25*** (0.34) 1.25*** (0.34) 1.23*** (0.34)
Gov funded * Seeking R&D 0.54 (0.34) 0.56† (0.33) 0.57† (0.33)
Self-funded * Prior Collaboration -0.78* (0.33) -0.80* (0.32) -0.79* (0.32)
Not funded * Prior Collaboration -0.52 (0.34) -0.57† (0.33) -0.56† (0.33)
Gov funded * Prior Collaboration -0.13 (0.33) -0.13 (0.33) -0.15 (0.33)
Similarity Similarity 0.48*** (0.07) 0.47*** (0.07)
Seeking R&D * Similarity -0.22* (0.11) -0.23* (0.11)
High and Low
Similarity
High Similarity 1.27*** (0.23)
Low Similarity -0.52** (0.18)
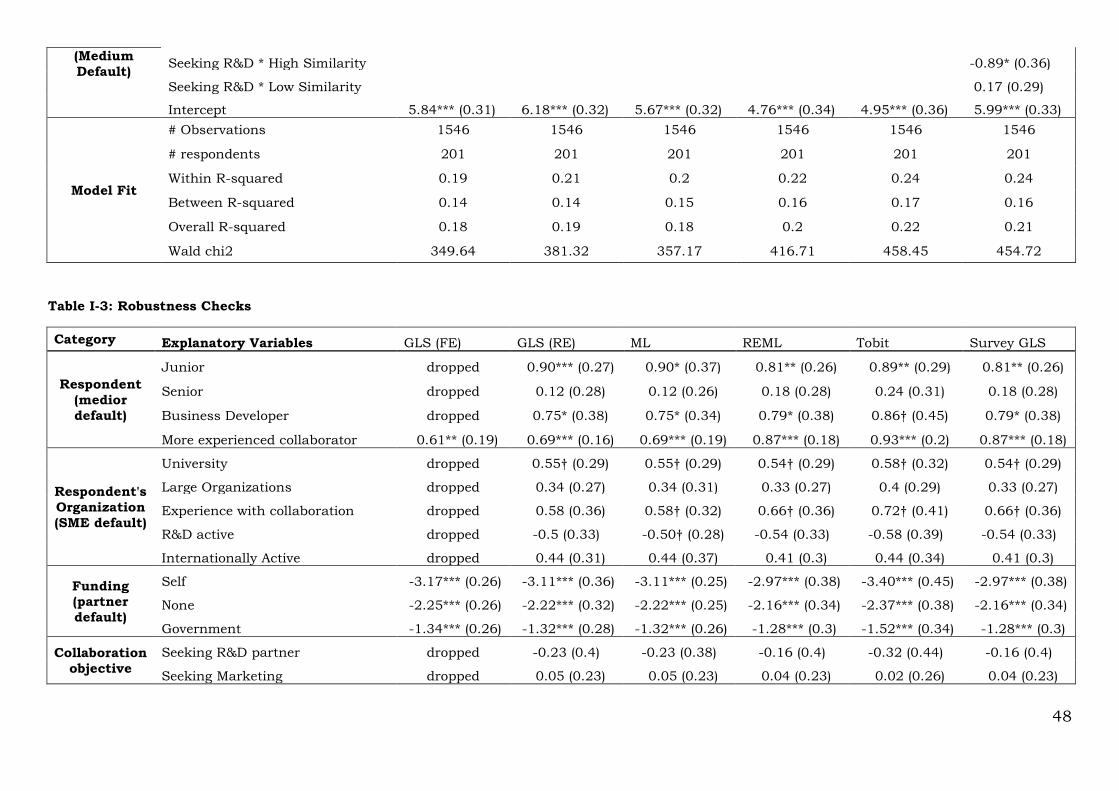
48
(Medium
Default) Seeking R&D * High Similarity -0.89* (0.36)
Seeking R&D * Low Similarity 0.17 (0.29)
Intercept 5.84*** (0.31) 6.18*** (0.32) 5.67*** (0.32) 4.76*** (0.34) 4.95*** (0.36) 5.99*** (0.33)
Model Fit
# Observations 1546 1546 1546 1546 1546 1546
# respondents 201 201 201 201 201 201
Within R-squared 0.19 0.21 0.2 0.22 0.24 0.24
Between R-squared 0.14 0.14 0.15 0.16 0.17 0.16
Overall R-squared 0.18 0.19 0.18 0.2 0.22 0.21
Wald chi2 349.64 381.32 357.17 416.71 458.45 454.72
Table I-3: Robustness Checks
Category Explanatory Variables GLS (FE) GLS (RE) ML REML Tobit Survey GLS
Respondent
(medior
default)
Junior dropped 0.90*** (0.27) 0.90* (0.37) 0.81** (0.26) 0.89** (0.29) 0.81** (0.26)
Senior dropped 0.12 (0.28) 0.12 (0.26) 0.18 (0.28) 0.24 (0.31) 0.18 (0.28)
Business Developer dropped 0.75* (0.38) 0.75* (0.34) 0.79* (0.38) 0.86† (0.45) 0.79* (0.38)
More experienced collaborator 0.61** (0.19) 0.69*** (0.16) 0.69*** (0.19) 0.87*** (0.18) 0.93*** (0.2) 0.87*** (0.18)
Respondent's
Organization
(SME default)
University dropped 0.55† (0.29) 0.55† (0.29) 0.54† (0.29) 0.58† (0.32) 0.54† (0.29)
Large Organizations dropped 0.34 (0.27) 0.34 (0.31) 0.33 (0.27) 0.4 (0.29) 0.33 (0.27)
Experience with collaboration dropped 0.58 (0.36) 0.58† (0.32) 0.66† (0.36) 0.72† (0.41) 0.66† (0.36)
R&D active dropped -0.5 (0.33) -0.50† (0.28) -0.54 (0.33) -0.58 (0.39) -0.54 (0.33)
Internationally Active dropped 0.44 (0.31) 0.44 (0.37) 0.41 (0.3) 0.44 (0.34) 0.41 (0.3)
Funding (partner
default)
Self -3.17*** (0.26) -3.11*** (0.36) -3.11*** (0.25) -2.97*** (0.38) -3.40*** (0.45) -2.97*** (0.38)
None -2.25*** (0.26) -2.22*** (0.32) -2.22*** (0.25) -2.16*** (0.34) -2.37*** (0.38) -2.16*** (0.34)
Government -1.34*** (0.26) -1.32*** (0.28) -1.32*** (0.26) -1.28*** (0.3) -1.52*** (0.34) -1.28*** (0.3)
Collaboration
objective
Seeking R&D partner dropped -0.23 (0.4) -0.23 (0.38) -0.16 (0.4) -0.32 (0.44) -0.16 (0.4)
Seeking Marketing dropped 0.05 (0.23) 0.05 (0.23) 0.04 (0.23) 0.02 (0.26) 0.04 (0.23)
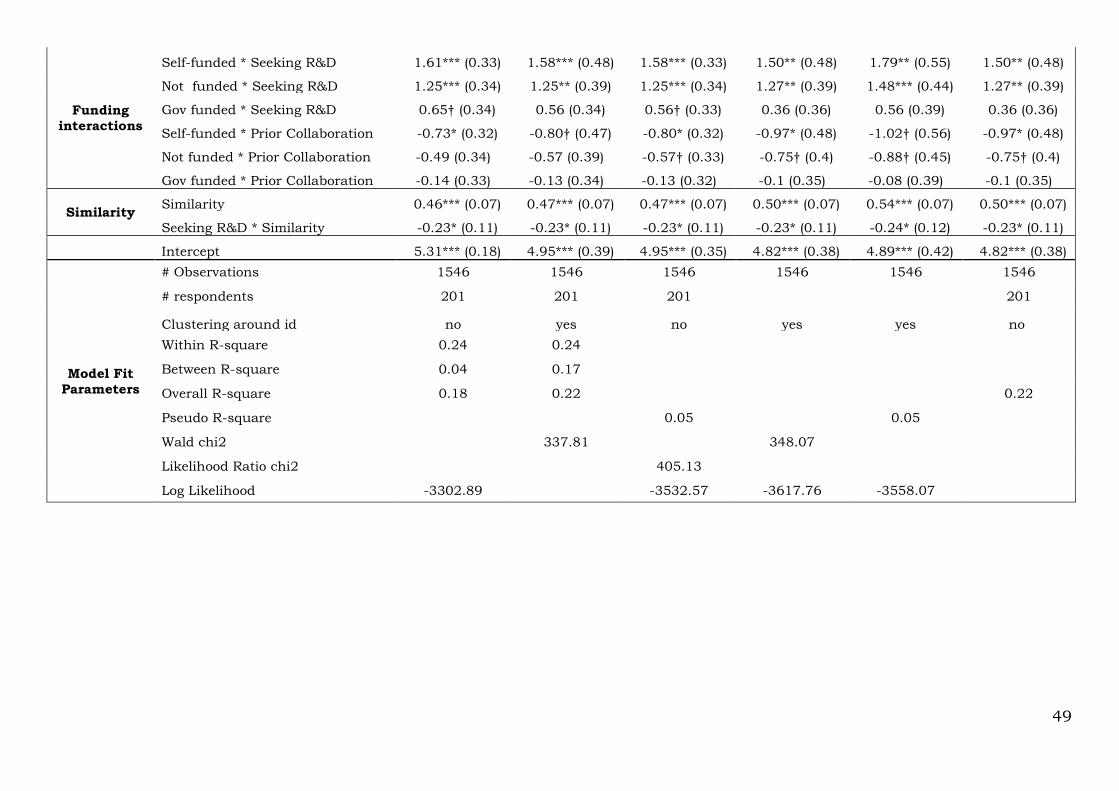
49
Funding
interactions
Self-funded * Seeking R&D 1.61*** (0.33) 1.58*** (0.48) 1.58*** (0.33) 1.50** (0.48) 1.79** (0.55) 1.50** (0.48)
Not funded * Seeking R&D 1.25*** (0.34) 1.25** (0.39) 1.25*** (0.34) 1.27** (0.39) 1.48*** (0.44) 1.27** (0.39)
Gov funded * Seeking R&D 0.65† (0.34) 0.56 (0.34) 0.56† (0.33) 0.36 (0.36) 0.56 (0.39) 0.36 (0.36)
Self-funded * Prior Collaboration -0.73* (0.32) -0.80† (0.47) -0.80* (0.32) -0.97* (0.48) -1.02† (0.56) -0.97* (0.48)
Not funded * Prior Collaboration -0.49 (0.34) -0.57 (0.39) -0.57† (0.33) -0.75† (0.4) -0.88† (0.45) -0.75† (0.4)
Gov funded * Prior Collaboration -0.14 (0.33) -0.13 (0.34) -0.13 (0.32) -0.1 (0.35) -0.08 (0.39) -0.1 (0.35)
Similarity Similarity 0.46*** (0.07) 0.47*** (0.07) 0.47*** (0.07) 0.50*** (0.07) 0.54*** (0.07) 0.50*** (0.07)
Seeking R&D * Similarity -0.23* (0.11) -0.23* (0.11) -0.23* (0.11) -0.23* (0.11) -0.24* (0.12) -0.23* (0.11)
Intercept 5.31*** (0.18) 4.95*** (0.39) 4.95*** (0.35) 4.82*** (0.38) 4.89*** (0.42) 4.82*** (0.38)
Model Fit
Parameters
# Observations 1546 1546 1546 1546 1546 1546
# respondents 201 201 201 201
Clustering around id no yes no yes yes no
Within R-square 0.24 0.24
Between R-square 0.04 0.17
Overall R-square 0.18 0.22 0.22
Pseudo R-square 0.05 0.05
Wald chi2 337.81 348.07
Likelihood Ratio chi2 405.13
Log Likelihood -3302.89 -3532.57 -3617.76 -3558.07
50
We know that large firms often engage in university-industry
collaborations to share costs, which indicates that resource constraints on
R&D are not unique to SMEs (Veugelers and Cassiman, 2005). We find
support for hypothesis 1: when organizations are seeking to develop R&D
partnerships the negative effects of resource provisioning (relative to
partner) are attenuated, although the interaction effect with government
funding is not always significant. Respondents are less averse to self-
funding collaborations when they aim to develop specific R&D capabilities or
acquire technical knowledge. We can infer that when trying to develop R&D
collaborations, organizations are more willing to cough up the necessary
funds because that will allows them to maintain more control over the
partnership, the direction the research takes, and the IP it produces.
We also find partial support for the second hypothesis in model 3. We
had argued that prior collaboration experience would strengthen the effects
of resource provisioning. While the variable for prior collaboration itself is
weakly positive and significant (b = 0.58, p ≤ 0.10), it is clear this effect is
driven largely by the interaction terms as prior experience is not significant
in model 1. The interaction effects with resource provisioning are negative,
although always insignificant for government funding and in about 50% of
the cases insignificant for no funding as well (see table I-3). This provides
some support for the status-appropriation argumentation as respondents
from organizations with collaboration experience seem to believe they can
extract value from collaborations and are hence less inclined to provision
financial resources. However, their preference for engaging in collaborations
51
that are supported by others is somewhat increased as they can still create
and appropriate value without running the risk of losing scarce financial
resources.
While we did not hypothesize it explicitly, we suggested that similarity
would have a positive effect on respondents’ preferences to collaborate and
we indeed find a significant effect of similarity in model 4 (b = 0.48, p ≤
0.001). Hypothesis 3 proposed that this effect would be attenuated for
organizations seeking to develop R&D partnerships, which is supported in
model 4 (b = -0.22, p ≤ 0.05). The effect is not strong enough to overthrow
the positive effect of similarity though, which indicates the difficult balance
of optimizing levels of similarity when engaging in partnerships. Figure I-1
below shows the marginal effects for different levels of similarity and seeking
R&D versus seeking no R&D. At low levels of similarity, those seeking R&D
have a higher collaboration preference but as similarity increases, the
enthusiasm for engaging in an R&D project falls. Respondents who are
seeking marketing or operational collaborations are more willing to work
with very similar others.
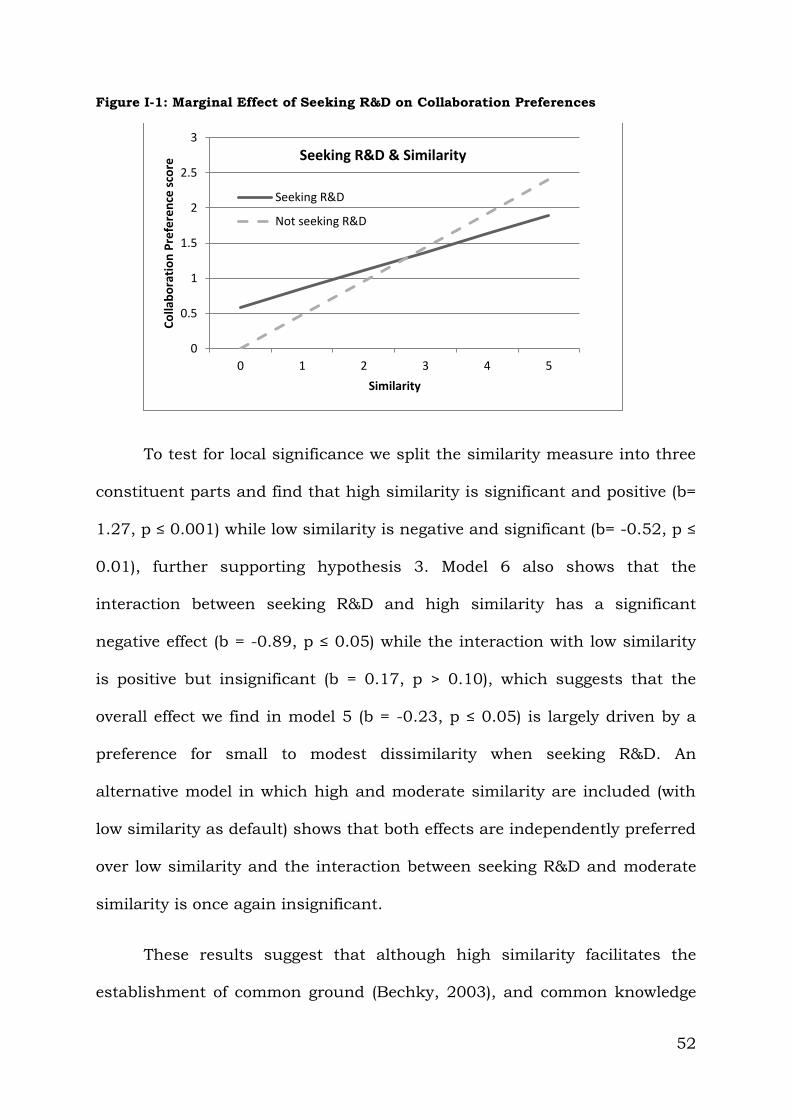
52
Figure I-1: Marginal Effect of Seeking R&D on Collaboration Preferences
To test for local significance we split the similarity measure into three
constituent parts and find that high similarity is significant and positive (b=
1.27, p ≤ 0.001) while low similarity is negative and significant (b= -0.52, p ≤
0.01), further supporting hypothesis 3. Model 6 also shows that the
interaction between seeking R&D and high similarity has a significant
negative effect (b = -0.89, p ≤ 0.05) while the interaction with low similarity
is positive but insignificant (b = 0.17, p > 0.10), which suggests that the
overall effect we find in model 5 (b = -0.23, p ≤ 0.05) is largely driven by a
preference for small to modest dissimilarity when seeking R&D. An
alternative model in which high and moderate similarity are included (with
low similarity as default) shows that both effects are independently preferred
over low similarity and the interaction between seeking R&D and moderate
similarity is once again insignificant.
These results suggest that although high similarity facilitates the
establishment of common ground (Bechky, 2003), and common knowledge
0
0.5
1
1.5
2
2.5
3
0 1 2 3 4 5
Co
llab
ora
tio
n P
refe
ren
ce s
core
Similarity
Seeking R&D & Similarity
Seeking R&D
Not seeking R&D
53
facilitates coordination and knowledge transfer (Grant, 1996), respondents
see clear advantages in some social dissimilarity in the production of ideas.
With regards to knowledge specifically, we know that very dissimilar
knowledge can be counterproductive in collaboration (Gilsing et al., 2008;
Wuyts et al., 2005). The conclusion seems to be that even when it comes to
interpersonal characteristics, high social similarity is not ideal for
innovativeness. Respondents appear to realise that people who are too
similar to each other are unlikely to be helpful in the generation of new
ideas.
I - 5.1: Link to the Second Study
In the 4th season of the popular TV series House MD, the lead
character Dr. House organizes a competition to determine who will join his
diagnostics team. One older candidate excels in finishing House’s sentences
and thinking along the same lines as House does. Eventually, House decides
to fire him because the team would not benefit from someone else who
thinks too much like House himself. This simple example of popular culture
exemplifies that individual differences in focal knowledge and ways of
thinking contribute to innovative thinking, which is required in House’s
department of diagnostic medicine. However, who eventually makes the
team is not strictly a result of knowledge and divergent, lateral, or analogical
thinking. Besides hospital politics, there is a clear element of social,
interpersonal fit as well. Our findings regarding interpersonal similarity
indicate that soft aspects of potential partnerships are important
determinants of preferences. While this may not come as a surprise, what
54
does come as a surprise is that the existing literature on collaborative
knowledge creation has remained largely silent on these topics. The implicit
assumption seems to have been that we can either not say anything about
individual differences and how they influence decision-making, or that it is
pointless to talk about differences because people behave rationally when it
comes to business decisions and thus do not let their idiosyncratic
preferences guide them. However, this study suggests that belief is perhaps
unfounded.
Given the critical role played by individuals in collaboration decisions,
we use a subsample of the previous data to study how individual attributes
shape preferences to form organizational partnerships, above and beyond
scenario characteristics. Taking account of individual preferences shifts the
dialog to the behavioral roots of strategy. To our knowledge, only one recent
study has investigated tie formation intentions or preferences and that
study found that existing ties form a poor proxy for tie formation intention
(Vissa, 2011). This topic has largely escaped scholarly attention, an
omission rooted in the implicit assumption that individuals are
homogeneous, malleable beings that are randomly distributed into
organizations, thus suppressing “questions regarding [individuals’]
motivation, preferences, [and] abilities” (Felin and Foss, 2005, p.450 - italics
added).
Existing literature on individual antecedents to collaboration has
acknowledged that economic relations are often “embedded in social
relations of friendship and trust between people” (Kilduff and Brass, 2010,
55
p. 324). As such, research has focused on dyadic characteristics of
collaborations such as individual homophily (Vissa, 2011) or interpersonal
trust and affect (Bierly and Gallagher, 2007; Casciaro and Lobo, 2008).
Additionally, researchers investigated how to access domain knowledge
through high profile partners, for instance through alliances with star
scientists (Hess and Rothaermel, 2011). Within the broader literature on
inter-organizational relations, there is some consensus that firm, partner,
task, institutional, dyadic-relational, and network characteristics all matter
(Bierly and Gallagher, 2007; Geringer, 1991; Hitt et al., 2000; Li et al.,
2008). However, if existing ties are indeed the successful results of matching
processes (Gale and Shapley, 1962), deriving antecedents of tie formation ex
post (i.e. from a biased sample) can only partially illuminate the actual
motives and preferences to establish collaborations.
In order to understand the origins of tie formation and hence the
origins of inter-organizational knowledge generation, we investigate how
individuals’ professional aspirations drive collaboration preferences. Our
exploration of the micro-foundations of strategy, helps “to better understand
the origins and the level of intentionality of aspirations in organizational
practice” (Shinkle, 2012, p. 442). We study how individual characteristics
shape collaboration preferences using a subsample of the same respondents
as before for which we have additional information. Using the conjoint
analysis data as controls, we analyze how individual aspirations shape
collaboration propensities with cumulative link models. We operationalize
56
the dependent variable slightly differently to increase the model accuracy
which in turn warrants the new methodology.
Our findings suggest that when aspirations are moderate,
interpersonal and focal knowledge characteristics are the main drivers of
collaboration. However, when the aspirational gap is positive or negative,
relational capability (networking skills, openness, and network knowledge)
significantly moderates the aspiration-preference relationship.
I - 6: Theory and Hypotheses: Aspirations and Collaborations
Decision-makers typically evaluate outcomes with reference to
aspirations determined by historical or peer results (Greve, 2002; Shinkle,
2012). Facing an aspiration gap (above or below the reference point)
influences the intensity and choice of behaviors (Ansoff, 1979; Cyert and
March, 1963). The behavioral theory of the firm argues that when people (or
organizations) fall below an aspiration level they take more risks and engage
in problemistic search in order to catch-up, while those that are ahead
become either risk-averse in order to maintain their position or use their
resource excess to engage in risky, and often wasteful, slack search (Cyert
and March, 1963; Leonard-Barton, 1992; Levinthal and March, 1981; March
and Shapira, 1987), although behavior likely changes at positive (cushioning
effect) or negative (threat-rigidity) extremes (Hu, Blettner, and Bettis, 2011;
Jeffrey, Onay, and Larrick, 2010; Miller and Chen, 2004). Gaba and
Bhattacharya (2012) for instance found that firms are more (less) likely to
launch a corporate venture capital unit when innovation performance is
57
below (above) social aspirations. At the interorganizational level, Eisenhardt
and Schoonhoven (1996) argued that the logic of alliance formation is based
on both social opportunities, such as experienced management teams, and
strategic needs, such as vulnerable strategic positions. Because
organizational theory “frequently discusses organizational aspirations as a
managerial-level construct” (Shinkle, 2012, p. 424), this logic likely
resonates at the individual level as well.
We follow social comparison theory (Festinger, 1954) in understanding
an aspiration level as an evaluation of one’s own ability at a moment in time.
Festinger (1954) suggests that the existence of a discrepancy in abilities will
instigate action to reduce this discrepancy so that those who are behind
catch up while those who are ahead are likely “to devote considerable time
and effort to trying to improve the performance of the others in the group to
a point where at least some of them are close, but not equal to, [them]” (p.
127). Additionally, the theory posits that people who are doing worse than
their peers are likely to be more persistent than those who are doing better.
In organizational jargon, it means that problemistic search is more intense
than slack search. We therefore hypothesize:
Hypothesis 4: Divergence from social aspirations will increase an
individual’s propensity to collaborate. This effect will be stronger when
the aspiration gap is negative than when it is positive.
I - 6.1: Relational Capability as Moderator
In his review of the aspirations literature, Shinkle (2012) stated that
“the moderators of the aspiration-consequence relationship are
58
understudied” (p. 418). When an ability’s relevance to immediate behavior
increases, pressure toward reducing discrepancy with relevant others
augments (Festinger, 1954). Thus, individuals will use relevant capabilities
to close an aspirational gap. Siegel (1957) argued that individuals are
concerned with the subjective likelihood of failure when they aim to
maximize expected utility. Similar constructs regarding success probability
are found in goal-setting theory (Locke and Latham, 2002, 2006), valence-
instrumentality-expectancy theory (Vroom, 1964), and social cognitive
theory (Bandura, 2012). Self-efficacy (i.e. task-specific confidence) for
instance has been found to stimulate entrepreneurial intentions (Boyd and
Vozikis, 1994). Thus, capabilities that can affect the subjective likelihood of
collaborative success are likely to moderate the aspiration-preference
relationship. Moving beyond previously studied 1-to-1 relational aspects like
interpersonal trust and affect (Casciaro and Lobo, 2008), we posit that an
individual’s generic one-to-many relational capability will affect collaboration
preferences. This echoes recent findings in network research that claim that
an actor’s network position is likely to be endogenous, and driven by
performance (Lee, 2010) – e.g. networks seem to be formed around high
performing scientists (Zucker and Darby, 2006) – or by aspects of
personality such as self-monitoring (Oh and Kilduff, 2008). We test whether
this one-to-many relational capability, consisting of networking skills,
networking openness, and network information, indeed affects collaboration
preferences.
59
I - 6.1.1: Networking Skills and Networking Openness
Positive moderation of the aspiration-preference relation occurs when
a capability increases the probability of a successful outcome (Siegel, 1957)
or enhances the perceived behavioral control over the success of the
outcome (Ajzen, 1991).
In the popular sitcom ‘The Big Bang Theory’, four researchers are
depicted as socially awkward, furthering the stereotype that (many)
scientists are inept at human interaction and networking. There is an
element of truth to this stereotype as evidenced by studies that show that
people in the natural sciences, mathematics, and engineering score on
average higher on the autism-spectrum quotient (Baron-Cohen et al., 2001).
While networking skills may thus be rather rare amongst researchers, those
who possess good networking skills are likely to believe this capability will
enhance their chances of successful collaborations (see e.g. Gulati (1999) for
support at the organizational level).
In general, working with familiar people is preferred over working
with strangers, as prior experience in collaborating allows the development
of interorganizational routines and builds trust and mutual knowledge (Dyer
and Singh, 1998; Gulati, 1995). This is especially important when
collaborating across organizational and knowledge boundaries where
common ground is often missing (Bechky, 2003; Dasgupta and David,
1994). However, this reliance on the familiar is not always the optimal
choice because firms with a high propensity to enter into repeated
relationships have lower performance, especially under technical
60
uncertainty (Goerzen, 2007). Familiarity among interorganizational
collaborators also creates shared mind-maps, reducing the creation of real
novelty. In association with a reduction in information asymmetry, shared
mind-maps potentially facilitate unwanted knowledge transfer so that
collaborating with strangers is often preferred when the goal is
breakthrough innovations (Li et al., 2008). Networking openness or the
willingness to work with strangers and networking skills can then be
assumed to improve perceived behavioral control over the collaboration
outcome.
Individuals who are trailing behind their peers are likely to be more
willing to engage in collaborations which are inherently uncertain (Baum et
al., 2005). Networking openness and skills will amplify this proclivity
because they lower perceived risk. On the flip side, individuals who are
ahead of their peers are generally risk averse (Kahneman and Tversky, 1979)
but want to help their distant peers come closer to them, much like a
supervisor does with a PhD student (Festinger, 1954). This suggests that
‘leaders’ will want to collaborate when they perceive collaboration as safe,
i.e. when they are open and skillful, but be averse to collaboration when
they lack the needed capabilities. So while the effects for ‘slackers and
leaders’ point in the same direction, they are likely to be less pronounced for
leaders due to their risk-averseness. This leads to the following hypotheses
Hypothesis 5: Networking skill positively reinforces the effect of an
aspiration gap on general collaboration propensity
Hypothesis 6: Networking openness positively reinforces the effect of an
aspiration gap on general collaboration propensity
61
I - 6.1.2: Network Information
Negative moderation of the aspiration-preference relationship will
occur when the perceived behavioral control over the outcome decreases
(Ajzen, 1991). We refer to network information broadly as how aware an
individual is about other participants in the network. Individuals with high
network information are probably well-connected (centrality) and might have
a lower propensity to engage in collaborations because of (1) the dark side of
social capital (Gargiulo and Benassi, 1999); (2) the higher likelihood of
repeat ties (Gulati and Gargiulo, 1999); and (3) the possibility of network
extension via partner referrals (Gulati, 1999). For instance, against the
authors’ hypotheses, firms do not extend their network when facing firm-
specific uncertainty (Beckman, Haunschild, and Phillips, 2004). At the risk
of mental downscaling, it seems likely that these effects are most important
when network information is high, because individuals then have – in theory
- access to alternatives.
At the individual level, we know that centrality in an awareness
network improves performance (Cross and Cummings, 2004). Hence,
individuals with high network information might have access to other ways
than collaborations to further their career, which could also reduce their
proclivity to collaborate. Especially leaders that have a lot of information
about network members are likely to be very selective in their partner
choice. When network awareness allows them to differentiate between high
and low quality partners, their collaboration preferences are likely to be
more tailored than those with less knowledge about other actors.
62
Additionally, the perceived opportunity costs for selecting an unknown
partner are on average greater when you have a lot of information about the
potential partners in the pool. While having more information will make
slackers pickier as well, their position of strategic need does not afford them
the same selectivity as leaders. In other words, slackers’ risk-taking
tendency will force them to favor collaborations more than leaders but
network information will attenuate this main effect. This leads to the final
hypothesis:
Hypothesis 7: Network information negatively moderates the effect of
aspiration gap on general collaboration propensity.
I - 7: Methods and Measures
We are using a subsample of the original dataset for which we have
extra information about the respondents. The subsample consists of a total
of 947 observations from 120 respondents. We rescale the initial preference
score (which ranked between 0 and 10) to a narrower range between 0 and 4
as follows: 0 (0,1); 1 (2,3); 2 (4,5) ; 3 (6,7) ; and 4 (8,9,10). We chose this
partitioning because it provided the most equitable distribution but other
ways to partition did not alter the findings. Using a narrower range
improved the model fit but the results were not drastically different for the
original ratings.
For the analysis of the data we use a cumulative link model (CLM),
also known as an ordered logit/probit model with flexible thresholds
(Christensen, 2013). The core reasons for using this estimation method are:
(1) it does not assume normal distribution of the response variable
(collaboration preference) which otherwise biases the standard errors; (2) all
63
predicted values will be discrete and within the permissible range (unlike
GLS); and (3) the cardinal distance between the ordered ratings is not
necessarily the same. This is appropriate when one does not want to assume
for instance that the “mathematical” difference between “completely
disagree” and “disagree” is necessarily the same as the one between
“neutral” and “agree”. The rescaling we did provides additional support for
using cumulative logit models because the mean difference between our new
0 and 1 (distance = 2) is indeed mathematically different from the mean
distance between 3 and 4 (distance = 2.5).
The results of cumulative link models need to be interpreted with
care. In essence, the CLM regression with flexible thresholds assigns
threshold values that serve as ‘inflection points’. Below the inflection point,
the model assigns the observation (i.e. the row in a matrix) to one discrete
value of the response and above the inflection point to the next. With flexible
thresholds, it is possible that the distance between the consecutive inflection
points is not the same. For example, the CLM could assign the following 4
threshold values -0.5, 0.2, 1.5, and 2.3 which would mean that below the -
0.5 value, the model predicts the response to be 0 (minimal collaboration
preference). Between -0.5 and 0.2, the model assigns observation to
response 1 and so on until all values above 2.3 will be assigned to response
4. In this way, the CLM makes discrete predictions for the response variable
(collaboration preference), given the values of the explanatory variables. In
doing so, it avoids the pitfalls of GLS regressions that potentially create
negative fitted values.
64
We used the probit link which is recommended when “the model is
interpreted with reference to a latent variable” (Christensen, 2013, p. 9), in
our case collaboration preference. Because CLM covariates are signal-to-
noise ratios, adding an extra explanatory variable can inflate the betas of all
parameters, which makes these models particularly susceptible to
overfitting. We had to balance this risk of coefficient inflation with the
benefits additional controls generate regarding the reduction of common
method variance. As robustness checks, we used simple OLS as this is less
susceptible to coefficient inflation as well as GLS and CLM with scenario-
fixed effects and spherical errors around individuals and organizations. This
did not change the results’ significance. As discussed below, for the
construction of the graphs we use the results from the OLS regression.
I - 7.1: Explanatory Variables and Controls
Aspiration gap. We coded aspiration gap based on the following
question: “Compared with people you consider peers in your chosen field,
how successful has your career been? Would you say that you are ahead /
level / behind your peers?” We coded this respectively as 1 (ahead - positive
gap), 2 (level - no gap), 3 (behind - negative gap). While this coding imposes
equidistance between the aspiration levels, it is important to note that the
results are comparable when using dummies for low/medium/high
aspirations as well as for a 1, 0, -1 coding.
Networking skills. We used the mean of six items measuring self-
perceptions of networking skills. The item responses range from -3 (strongly
disagree) to +3 (strongly agree) Likert-type scale. Sample questions are “I
65
very often see opportunities for collaboration between people”, and “I always
try to forge connections between people dealing with similar issues”, etc. The
factor analysis with promax rotation of these six items revealed a single
factor. The reliability (Cronbach’s alpha) of this scale was 0.82.
Network information and Networking openness. A subset of
respondents (131/201) with stated knowledge domain preferences was
presented with six different names of network members with expertise in
their chosen domain. Respondents were asked how well they knew the
person (between 0 and 10) and whether they would want to collaborate with
that person (hovering the mouse over the name showed a short bio of the
person in question). We define network information as the sum of the
responses to how well respondents knew the six members. Then, we coded
every response on knowledge/preference that was above (below) the
respective mean as 1 (0) and summed the number of times the actor
preference was above the mean while the actor knowledge was below the
mean. We call this networking openness (between 0 and 6 theoretically, but
0 to 5 in the data). The correlation between these variables is -0.32
Control variables. At the individual level, we control for job experience
(number of years in current organization) and the number of years worked
before current job. We also construct a factor that captures the relative
seniority between the person in the scenario (junior, medior, or senior) and
the respondent, which results in a down/same/up match (respondent is
more/as/less senior respectively) as well as an unknown category for ties
with non-research oriented respondents. We further include the five other
66
scenario variables, whether the respondent’s organization is R&D active,
internationally active, and has previous experience with government-funded
projects. Finally, we control for respondent organization type, and the kind
of collaboration the respondent’s organization is interested in (marketing,
operational, technological, none) and include (non-reported) dummies for
the knowledge domain the respondent reported to be seeking to insulate
knowledge domain specific effects (e.g. different number of individuals
within a specific domain affecting the likelihood knowing the members).
I - 8: Discussion of Results
Hypothesis 4, finds support in Model 1 (b1 = -0.94, b2 = 0.29, both p
≤ 0.01), however the difference between positive and no aspiration gap is
insignificant (t-test = -0.33, p = 0.74) suggesting that leaders and those level
with peers do not differ significantly with regards to collaboration
preferences. A negative aspiration gap however clearly increases an
individual’s propensity to collaborate. Figure I-2a thus depicts a ‘falling L-
shape’ rather than a V-shape.
Figures I-2:a-d represent the percentage change in collaboration
propensity relative to no aspiration gap at the mean of the focal variable
with all non-focal variables except the intercept set to zero. Importantly,
these figures are based on the betas from the simple OLS regression rather
than the betas from the CLM regressions. Because the CLM regression
results in a discrete prediction (e.g. assign observation 352 to category y = 2)
based on the use of threshold values (e.g. when the predicted value is below
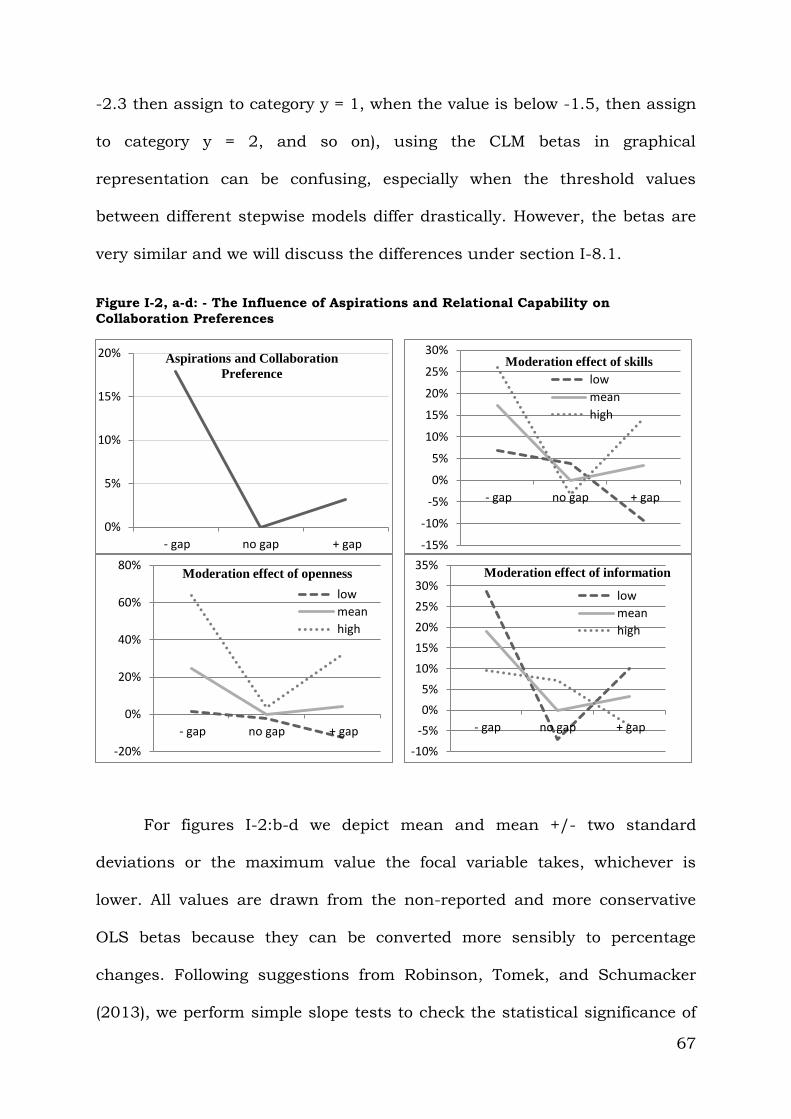
67
-2.3 then assign to category y = 1, when the value is below -1.5, then assign
to category y = 2, and so on), using the CLM betas in graphical
representation can be confusing, especially when the threshold values
between different stepwise models differ drastically. However, the betas are
very similar and we will discuss the differences under section I-8.1.
Figure I-2, a-d: - The Influence of Aspirations and Relational Capability on
Collaboration Preferences
For figures I-2:b-d we depict mean and mean +/- two standard
deviations or the maximum value the focal variable takes, whichever is
lower. All values are drawn from the non-reported and more conservative
OLS betas because they can be converted more sensibly to percentage
changes. Following suggestions from Robinson, Tomek, and Schumacker
(2013), we perform simple slope tests to check the statistical significance of
0%
5%
10%
15%
20%
- gap no gap + gap
Aspirations and Collaboration
Preference
-15%
-10%
-5%
0%
5%
10%
15%
20%
25%
30%
- gap no gap + gap
Moderation effect of skills
low
mean
high
-20%
0%
20%
40%
60%
80%
- gap no gap + gap
Moderation effect of openness
low
mean
high
-10%
-5%
0%
5%
10%
15%
20%
25%
30%
35%
- gap no gap + gap
Moderation effect of information
low
mean
high
68
the slopes and found significant t-tests for all 3 interaction effects (p ≤
0.001).
Hypothesis 5 suggested networking skills positively moderate the
aspiration-gap - preference relationship. Model 2 shows significant
interaction terms (b1 = -1.09 and b2 = 0.27 and p ≤ 0.01 for both). Figure I-
2b shows that at mean skills, the falling L shape is maintained, whereas at
high skills we see a V-shape emerge. The preference gap is slightly bigger for
a positive aspiration gap, suggesting leaders are more sensitive to the
moderation effect of networking skills. Their general risk-averseness makes
leaders thus averse to collaborations when they have low networking skills,
and favorable otherwise. Importantly, networking skills do not predetermine
the aspiration gap as the means for being behind, level, or ahead of peers
are 1.59/1.63/1.61, and the difference between them is statistically
insignificant. Hypothesis 5 cannot be rejected.
Hypothesis 6 proposed a positive interaction between networking
openness and aspiration gap. Model 3 shows support for this hypothesis (b1
= -1.22 and b2 = 0.32, both p ≤ 0.05) so that individuals with high openness
who face an aspiration gap have higher collaboration preferences. Figure I-
2c shows the effects are very similar to the skills moderation but more
pronounced. The moderation effect is stronger with a negative aspiration
gap: A highly open slacker is about 75% more favorable toward collaboration
than a closed leader.
Finally, hypothesis 7 posited that network information would
negatively moderate the aspiration-gap - performance relationship and the
69
results in Model 4 confirm the hypothesis (b1 = 0.26 and b2 = -0.07, both p
≤ 0.05). Slackers know, on average, more people in the network with
statistically significant differences in the mean (9.66 > 8.78 > 7.61). Figure I-
2d exhibits the familiar falling L-shape for mean information but the V-
shape is now found for low information. The figure also shows that slackers
remain more positively predisposed toward collaboration such that a high
information slacker is about as favorable to collaboration as a low
information leader. Hypothesis 7 cannot be rejected.
We followed social comparison theory (Festinger, 1954) in arguing that
those who are ahead of their peers will help others catch-up a little, but not
enough to become competitors. Our data give some credence to this
mechanism: senior leaders are more willing to work with junior (but not
medior) partners than senior respondents who consider themselves to be
level with their peers (one-sided Welch test, p = 0.04864). We do not find
this difference for medior respondents. Thus, senior leaders are more willing
to help juniors catch up than both medior leaders and other seniors who are
level with peers.
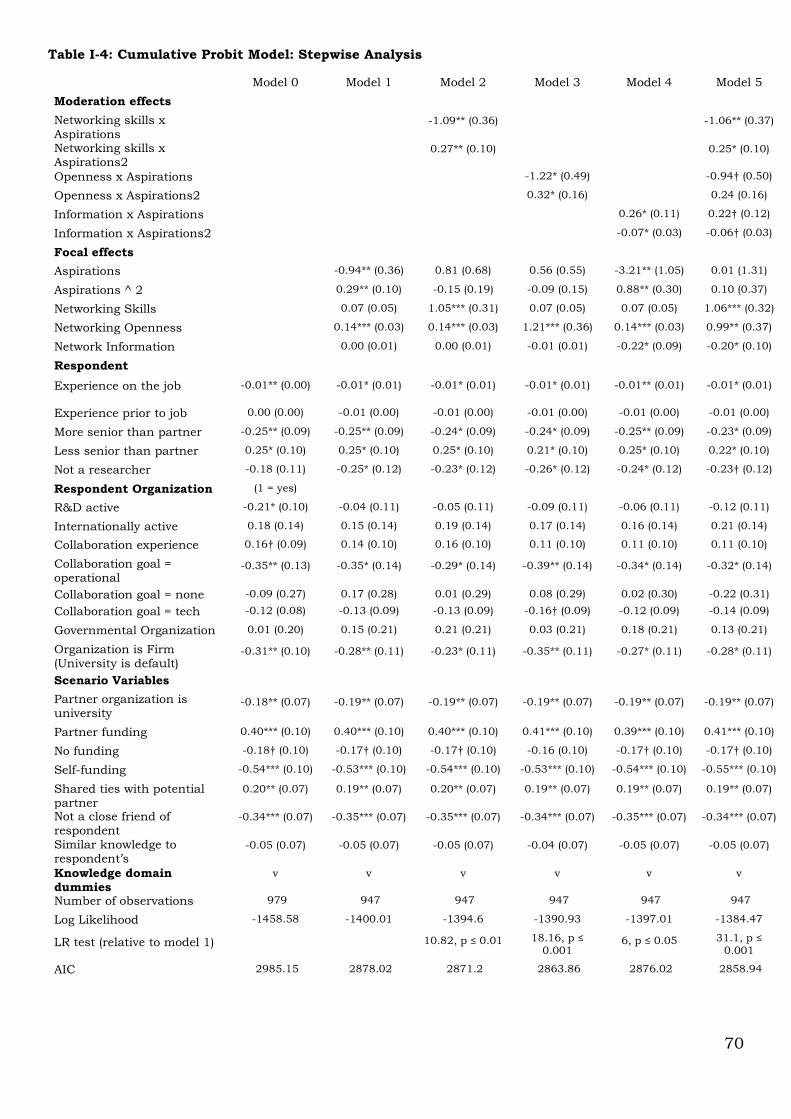
70
Table I-4: Cumulative Probit Model: Stepwise Analysis
Model 0 Model 1 Model 2 Model 3 Model 4 Model 5
Moderation effects
Networking skills x Aspirations
-1.09** (0.36)
-1.06** (0.37)
Networking skills x Aspirations2
0.27** (0.10)
0.25* (0.10)
Openness x Aspirations
-1.22* (0.49)
-0.94† (0.50)
Openness x Aspirations2
0.32* (0.16)
0.24 (0.16)
Information x Aspirations
0.26* (0.11) 0.22† (0.12)
Information x Aspirations2
-0.07* (0.03) -0.06† (0.03)
Focal effects
Aspirations
-0.94** (0.36) 0.81 (0.68) 0.56 (0.55) -3.21** (1.05) 0.01 (1.31)
Aspirations ^ 2
0.29** (0.10) -0.15 (0.19) -0.09 (0.15) 0.88** (0.30) 0.10 (0.37)
Networking Skills
0.07 (0.05) 1.05*** (0.31) 0.07 (0.05) 0.07 (0.05) 1.06*** (0.32)
Networking Openness
0.14*** (0.03) 0.14*** (0.03) 1.21*** (0.36) 0.14*** (0.03) 0.99** (0.37)
Network Information
0.00 (0.01) 0.00 (0.01) -0.01 (0.01) -0.22* (0.09) -0.20* (0.10)
Respondent
Experience on the job -0.01** (0.00) -0.01* (0.01) -0.01* (0.01) -0.01* (0.01) -0.01** (0.01) -0.01* (0.01)
Experience prior to job 0.00 (0.00) -0.01 (0.00) -0.01 (0.00) -0.01 (0.00) -0.01 (0.00) -0.01 (0.00)
More senior than partner -0.25** (0.09) -0.25** (0.09) -0.24* (0.09) -0.24* (0.09) -0.25** (0.09) -0.23* (0.09)
Less senior than partner 0.25* (0.10) 0.25* (0.10) 0.25* (0.10) 0.21* (0.10) 0.25* (0.10) 0.22* (0.10)
Not a researcher -0.18 (0.11) -0.25* (0.12) -0.23* (0.12) -0.26* (0.12) -0.24* (0.12) -0.23† (0.12)
Respondent Organization (1 = yes)
R&D active -0.21* (0.10) -0.04 (0.11) -0.05 (0.11) -0.09 (0.11) -0.06 (0.11) -0.12 (0.11)
Internationally active 0.18 (0.14) 0.15 (0.14) 0.19 (0.14) 0.17 (0.14) 0.16 (0.14) 0.21 (0.14)
Collaboration experience 0.16† (0.09) 0.14 (0.10) 0.16 (0.10) 0.11 (0.10) 0.11 (0.10) 0.11 (0.10)
Collaboration goal = operational
-0.35** (0.13) -0.35* (0.14) -0.29* (0.14) -0.39** (0.14) -0.34* (0.14) -0.32* (0.14)
Collaboration goal = none -0.09 (0.27) 0.17 (0.28) 0.01 (0.29) 0.08 (0.29) 0.02 (0.30) -0.22 (0.31)
Collaboration goal = tech -0.12 (0.08) -0.13 (0.09) -0.13 (0.09) -0.16† (0.09) -0.12 (0.09) -0.14 (0.09)
Governmental Organization 0.01 (0.20) 0.15 (0.21) 0.21 (0.21) 0.03 (0.21) 0.18 (0.21) 0.13 (0.21)
Organization is Firm (University is default)
-0.31** (0.10) -0.28** (0.11) -0.23* (0.11) -0.35** (0.11) -0.27* (0.11) -0.28* (0.11)
Scenario Variables
Partner organization is university
-0.18** (0.07) -0.19** (0.07) -0.19** (0.07) -0.19** (0.07) -0.19** (0.07) -0.19** (0.07)
Partner funding 0.40*** (0.10) 0.40*** (0.10) 0.40*** (0.10) 0.41*** (0.10) 0.39*** (0.10) 0.41*** (0.10)
No funding -0.18† (0.10) -0.17† (0.10) -0.17† (0.10) -0.16 (0.10) -0.17† (0.10) -0.17† (0.10)
Self-funding -0.54*** (0.10) -0.53*** (0.10) -0.54*** (0.10) -0.53*** (0.10) -0.54*** (0.10) -0.55*** (0.10)
Shared ties with potential partner
0.20** (0.07) 0.19** (0.07) 0.20** (0.07) 0.19** (0.07) 0.19** (0.07) 0.19** (0.07)
Not a close friend of respondent
-0.34*** (0.07) -0.35*** (0.07) -0.35*** (0.07) -0.34*** (0.07) -0.35*** (0.07) -0.34*** (0.07)
Similar knowledge to respondent’s
-0.05 (0.07) -0.05 (0.07) -0.05 (0.07) -0.04 (0.07) -0.05 (0.07) -0.05 (0.07)
Knowledge domain dummies
v v v v v v
Number of observations 979 947 947 947 947 947
Log Likelihood -1458.58 -1400.01 -1394.6 -1390.93 -1397.01 -1384.47
LR test (relative to model 1) 10.82, p ≤ 0.01 18.16, p ≤
0.001 6, p ≤ 0.05 31.1, p ≤
0.001
AIC 2985.15 2878.02 2871.2 2863.86 2876.02 2858.94
71
I - 8.1: An Empirical Investigation of Model Fit
Cumulative link models are particularly useful when trying to assign a
group of observations to particular ordinal categories and you do not want
to assume that the difference between the different ordered categories is
necessarily equivalent. This could be for instance categories of income, of
disease gravity, of insurance premiums and so on (Agresti, 2002;
Christensen, 2013). Clearly, the value of such model needs to be assessed
by the number of correct assignments and the number of wrong
assignments. Additionally, gaining insight in how wrongly some
observations get assigned is relevant.
Because most goodness of fit measures in the commonly used
software packages assume continuous data, I devised a simple method to
compare the actual model fit between different model specifications, that
would only allow to compare the CLM predictions (which are based on
maximum likelihood in R) in a sensible way but also allow to compare those
predictions with the results of OLS and other regressions. I present three
very simple measures to better understand model fit for CLM regressions.
1) Model estimation bias (MEB) is a measure for the model’s general
tendency to either overestimate or underestimate the ordered category
to which the observation need be assigned. It is calculated as the sum
of the difference between the model’s predicted response values and
the actual values divided by the number of observations. It thus
represents the average error on the prediction. MEB takes a positive
72
value when the model on average overestimates and a negative value
otherwise:
a. MEB = ∑ (ŷ - y) / N
2) Maximum and Average Quadratic Error (MQE and AQE) compare the
sum of squared errors to the maximum (average) error. The MQE is
always between 0 and 1. The closer to 1, the better the model predicts
against the maximum error. The AQE takes the average of the
quadratic errors without taking into account the sample probability of
error occurrence. So if the discrete quadratic error can be either
0,1,4,9, or 16 as is the case in the second part of this chapter, then
the uniform error is eu = (0 + 1 + 4 + 9 + 16)/5 = 6. If the AQE takes
negative values the model fit is extremely poor as the average error of
the predicted value exceeds the uniform error. The closer the statistic
gets to 1, the better the model fit. For out-of-sample prediction the
uniform error should be replaced with the within sample error taking
into account the probability of occurrence. As within sample error
should be smaller than the out-of-sample errors, the statistic will
generally be negative and the higher (closer to zero) the statistic, the
better the model fit
a. MQE = 1 – (∑ (y – ŷ)2 / max[∑ (y – ŷ)2] * N)
b. AQE = 1 – (∑ (y – ŷ)2 / eu * N)
3) Variability is calculated simply as the probability of a specific discrete
gap between observation and prediction which can be graphically
represented to both show normality of errors as well as to provide a
sensible way of visually assessing model fit.
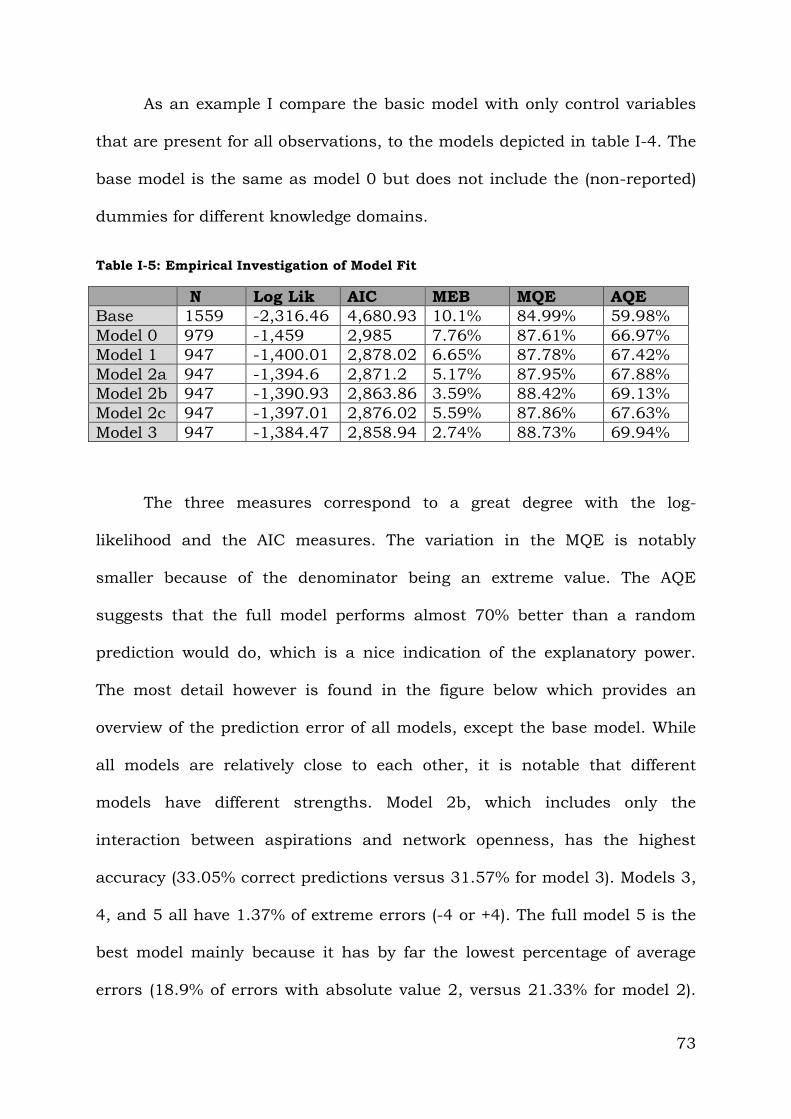
73
As an example I compare the basic model with only control variables
that are present for all observations, to the models depicted in table I-4. The
base model is the same as model 0 but does not include the (non-reported)
dummies for different knowledge domains.
Table I-5: Empirical Investigation of Model Fit
N Log Lik AIC MEB MQE AQE
Base 1559 -2,316.46 4,680.93 10.1% 84.99% 59.98%
Model 0 979 -1,459 2,985 7.76% 87.61% 66.97%
Model 1 947 -1,400.01 2,878.02 6.65% 87.78% 67.42%
Model 2a 947 -1,394.6 2,871.2 5.17% 87.95% 67.88%
Model 2b 947 -1,390.93 2,863.86 3.59% 88.42% 69.13%
Model 2c 947 -1,397.01 2,876.02 5.59% 87.86% 67.63%
Model 3 947 -1,384.47 2,858.94 2.74% 88.73% 69.94%
The three measures correspond to a great degree with the log-
likelihood and the AIC measures. The variation in the MQE is notably
smaller because of the denominator being an extreme value. The AQE
suggests that the full model performs almost 70% better than a random
prediction would do, which is a nice indication of the explanatory power.
The most detail however is found in the figure below which provides an
overview of the prediction error of all models, except the base model. While
all models are relatively close to each other, it is notable that different
models have different strengths. Model 2b, which includes only the
interaction between aspirations and network openness, has the highest
accuracy (33.05% correct predictions versus 31.57% for model 3). Models 3,
4, and 5 all have 1.37% of extreme errors (-4 or +4). The full model 5 is the
best model mainly because it has by far the lowest percentage of average
errors (18.9% of errors with absolute value 2, versus 21.33% for model 2).
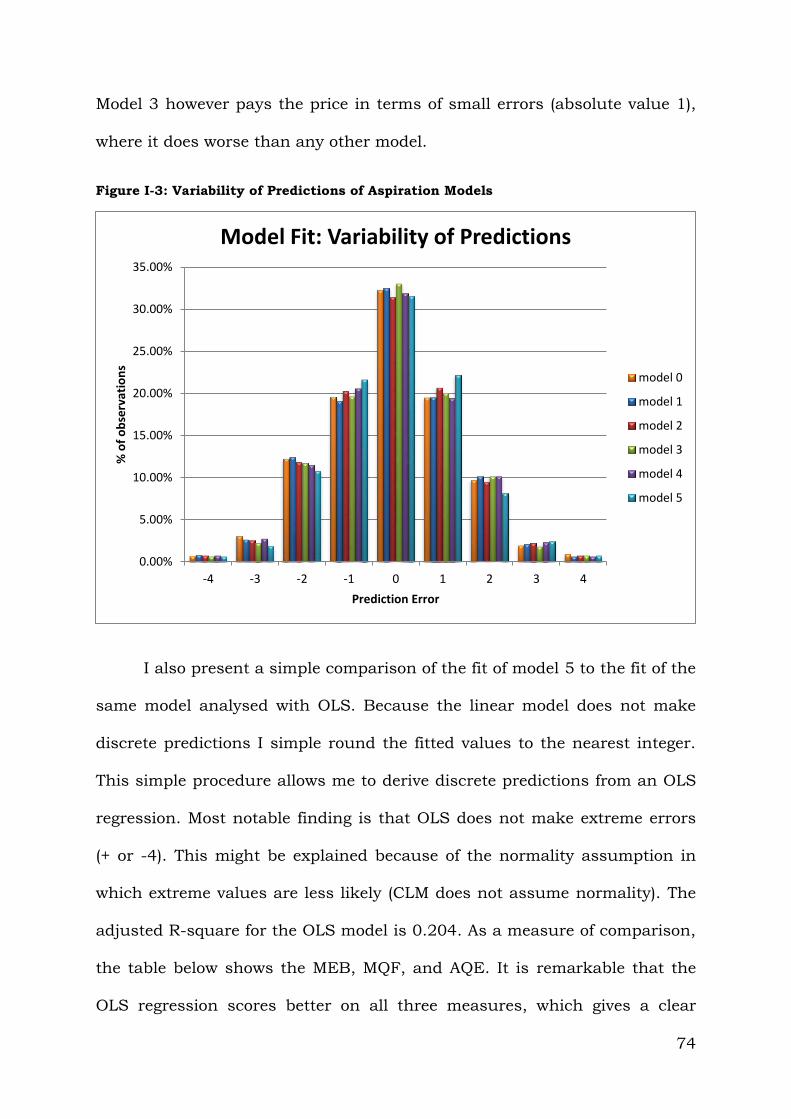
74
Model 3 however pays the price in terms of small errors (absolute value 1),
where it does worse than any other model.
Figure I-3: Variability of Predictions of Aspiration Models
I also present a simple comparison of the fit of model 5 to the fit of the
same model analysed with OLS. Because the linear model does not make
discrete predictions I simple round the fitted values to the nearest integer.
This simple procedure allows me to derive discrete predictions from an OLS
regression. Most notable finding is that OLS does not make extreme errors
(+ or -4). This might be explained because of the normality assumption in
which extreme values are less likely (CLM does not assume normality). The
adjusted R-square for the OLS model is 0.204. As a measure of comparison,
the table below shows the MEB, MQF, and AQE. It is remarkable that the
OLS regression scores better on all three measures, which gives a clear
0.00%
5.00%
10.00%
15.00%
20.00%
25.00%
30.00%
35.00%
-4 -3 -2 -1 0 1 2 3 4
% o
f o
bse
rvat
ion
s
Prediction Error
Model Fit: Variability of Predictions
model 0
model 1
model 2
model 3
model 4
model 5
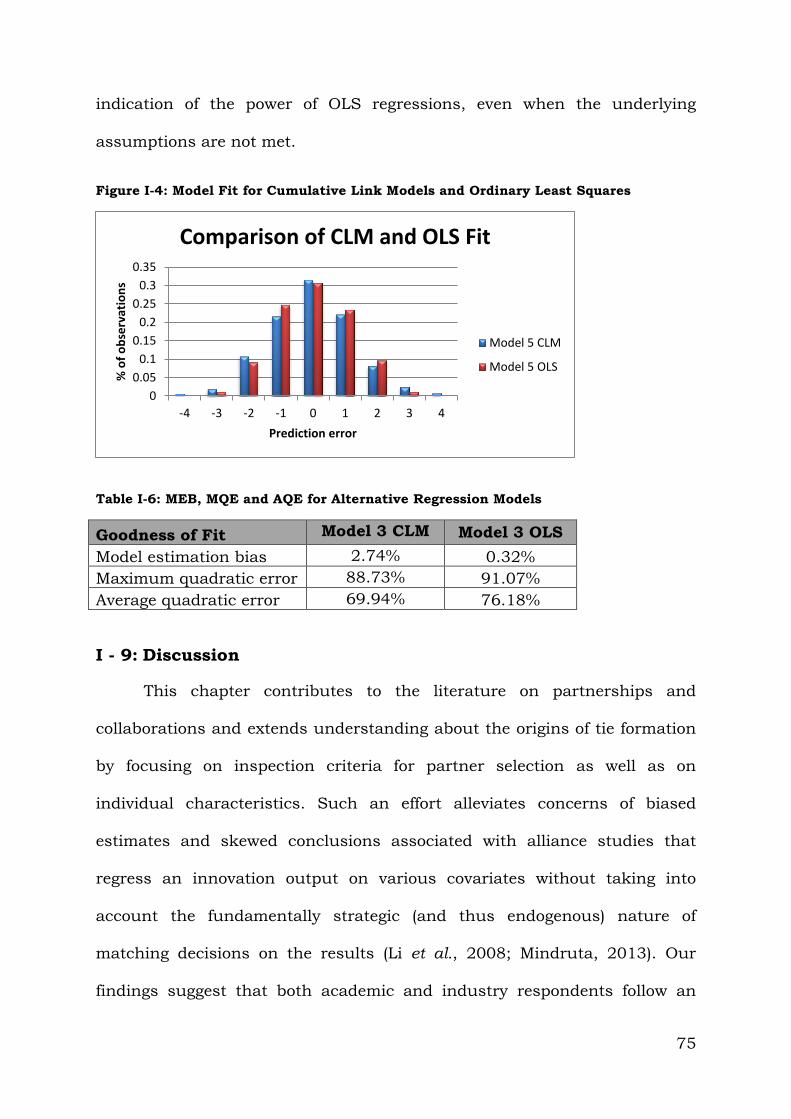
75
indication of the power of OLS regressions, even when the underlying
assumptions are not met.
Figure I-4: Model Fit for Cumulative Link Models and Ordinary Least Squares
Table I-6: MEB, MQE and AQE for Alternative Regression Models
Goodness of Fit Model 3 CLM Model 3 OLS
Model estimation bias 2.74% 0.32%
Maximum quadratic error 88.73% 91.07%
Average quadratic error 69.94% 76.18%
I - 9: Discussion
This chapter contributes to the literature on partnerships and
collaborations and extends understanding about the origins of tie formation
by focusing on inspection criteria for partner selection as well as on
individual characteristics. Such an effort alleviates concerns of biased
estimates and skewed conclusions associated with alliance studies that
regress an innovation output on various covariates without taking into
account the fundamentally strategic (and thus endogenous) nature of
matching decisions on the results (Li et al., 2008; Mindruta, 2013). Our
findings suggest that both academic and industry respondents follow an
0
0.05
0.1
0.15
0.2
0.25
0.3
0.35
-4 -3 -2 -1 0 1 2 3 4
% o
f o
bse
rvat
ion
s
Prediction error
Comparison of CLM and OLS Fit
Model 5 CLM
Model 5 OLS
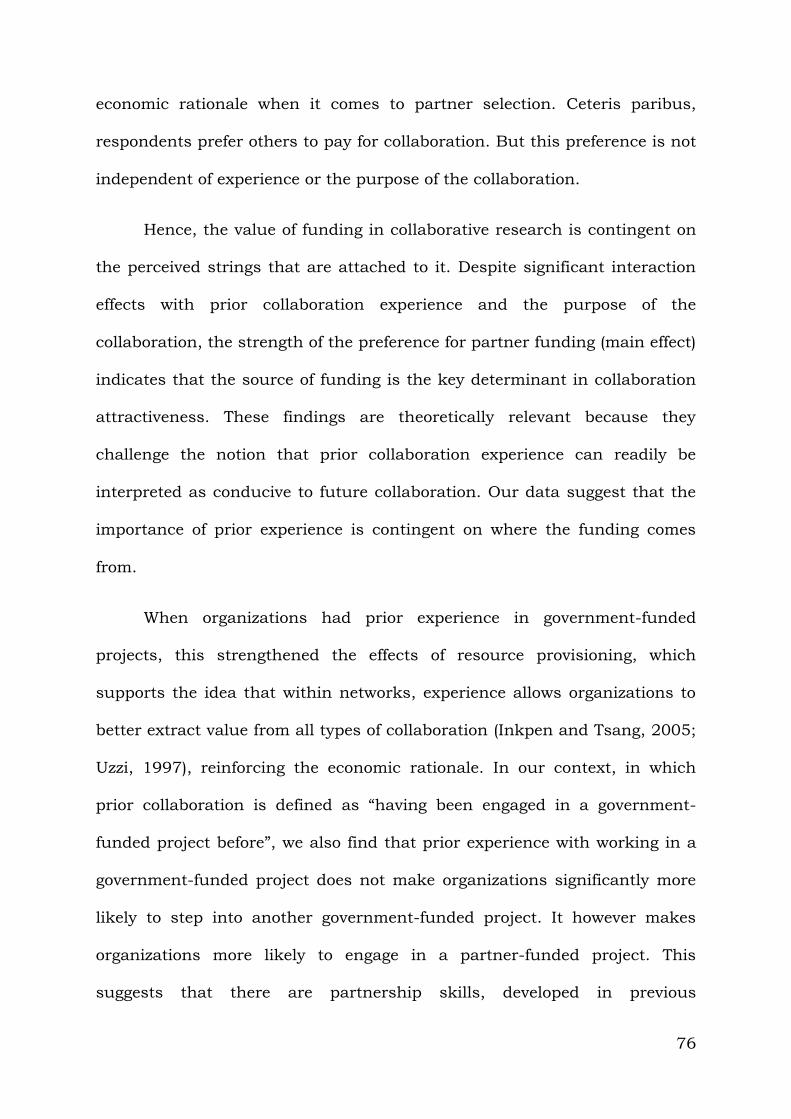
76
economic rationale when it comes to partner selection. Ceteris paribus,
respondents prefer others to pay for collaboration. But this preference is not
independent of experience or the purpose of the collaboration.
Hence, the value of funding in collaborative research is contingent on
the perceived strings that are attached to it. Despite significant interaction
effects with prior collaboration experience and the purpose of the
collaboration, the strength of the preference for partner funding (main effect)
indicates that the source of funding is the key determinant in collaboration
attractiveness. These findings are theoretically relevant because they
challenge the notion that prior collaboration experience can readily be
interpreted as conducive to future collaboration. Our data suggest that the
importance of prior experience is contingent on where the funding comes
from.
When organizations had prior experience in government-funded
projects, this strengthened the effects of resource provisioning, which
supports the idea that within networks, experience allows organizations to
better extract value from all types of collaboration (Inkpen and Tsang, 2005;
Uzzi, 1997), reinforcing the economic rationale. In our context, in which
prior collaboration is defined as “having been engaged in a government-
funded project before”, we also find that prior experience with working in a
government-funded project does not make organizations significantly more
likely to step into another government-funded project. It however makes
organizations more likely to engage in a partner-funded project. This
suggests that there are partnership skills, developed in previous
77
collaborations, that are transferable to other projects without the
government, and potentially that the experience with government-funded
projects is not that positive.
When seeking R&D capabilities, willingness to fund increased
significantly. This indicates that the origin of resource flow is of importance
to organizations, which suggests that resources (e.g. funding) are not simply
objectively compared based on their primary function (i.e. providing money
for collaboration) but that respondents take into account associated
resource externalities associated with the resource source in the formation
of preferences. The attenuating influence is stronger for partner funding
than for government funding, which supports the importance of exerting
control over R&D collaborations. When partners are funding an exploratory
research project, they are more likely to maintain control over the resources
so that it becomes harder for the focal organization to develop or access the
desired technological capabilities. When governments fund projects, this
effect is weaker. Unfortunately, the nature of our data does not allow us to
delve deeply into the exact mechanism at play. A sensible explanation could
be related to the bureaucracy associated with government funding or even
simply the increasing coordination and communication costs (Zander and
Kogut, 1995) when a third player (focal organization, partner, and
government) gets involved. Alternatively, respondents could expect that
government funding would be lower or that it involves a lower commitment
of the partnering organization.
78
This begs larger theoretical questions about drivers and
characteristics of resource exchange (Chi, 1994). For example, is resource
complementarity a strictly objective matter of resource fit or is there a
subjective, interpretative component that is rooted in preferences or
differences in quality of resource management (Castanias and Helfat, 2001;
Sirmon, Hitt, and Ireland, 2007)?
Our findings also suggest that social similarity is an important factor
in the formation of preferences. Importantly, the significance of our
composite measure for similarity that combined organizational type, shared
ties, prior familiarity, similar knowledge, and same level of seniority implies
that respondents might implicitly balance various kinds of similarity to
assess how valuable partnerships could be. We find that high similarity is
less preferred when aiming to set up an R&D partnership which suggests
that despite the difficulties of straddling organizational and individual
differences in collaboration, being too similar is perceived to reduce the
likelihood of exploratory success.
While previous research has found that SMEs in general suffer from
liabilities of size in the establishment of ties (Fontana et al., 2006; Narula,
2004), this seems to be driven more by two-sided matching problems than
by collaboration preferences. However, a more granular test of similarity
measures (not reported) showed that SMEs have a distinct preference for
collaboration with other companies (and hence not with universities) which
does limit their collaboration opportunity space. This contributes to
research that typically focuses only on university-industry collaborations
79
(Hanel and St-Pierre, 2006; Santoro and Gopalakrishnan, 2001) without
taking into account the choice between academic and commercial partners.
For SMEs, this finding also confirms, despite common beliefs, that SMEs do
not join KTNs to work with universities (Woolgar et al., 1998).
The second part of this chapter focused on individual aspiration,
determined by relative career position, and the moderating effects of
networking skills, openness, and information. Our findings suggest that
individual characteristics matter in the formation of collaboration
preferences and are thus likely to affect actual tie formation as well. We find
that individuals with high networking skills and high openness are more
prone to collaboration when they face a positive or negative aspiration gap,
but that these capabilities were a lot less important in the absence of an
aspiration gap. Clearly motivation to achieve (either catching up or staying
ahead) is instrumental in understanding strategic decisions. Our findings in
this way provide support for recent contributions from psychology to the
networking literature that argue that structural positions cannot explain
everything about tie formation because brokerage needs to be understood
both as a position within a network and as a process (Kilduff and Brass,
2010; Oh and Kilduff, 2008).
Broadly speaking, our findings on the relation between aspiration-gap
and performance echo psychological theories (Festinger, 1954; Kahneman
and Tversky, 1979; Lewin et al., 1944; Vroom, 1964). Collaboration
preference is higher when facing a negative aspiration gap, suggesting that
individuals who are trailing behind their peers are more willing to engage in,
80
inherently risky, collaborations than those who are level or ahead of their
peers. This finding has broader relevance in the literature on antecedents of
collaboration and partner selection (Hitt et al., 2004; Hitt et al., 2000; Li et
al., 2008). It suggests that controlling for organizational needs (Eisenhardt
and Schoonhoven, 1996) and thus aspirations is perhaps more important
than we have assumed so far. Additionally, we provide more evidence that
talking about partner selection as a one-sided process denies the logical fact
that partners are also selecting you (Mindruta, 2013).
More research on explaining the gap between partnering intention and
tie formation, like the work of Vissa (2011), can be especially useful for
managers. While it is rather self-evident that some potential partners will
lack the necessary knowledge or skills to be suitable matches in an
organization’s search for knowledge, the notion that complementary
relational capabilities (both at the individual and the organizational level)
can influence partnering intentions and perhaps partnering likelihood is
important. This fits in the broader stream of research that looks at how
individuals (Gale and Shapley, 1962) or organizations (Graebner and
Eisenhardt, 2004) can court others into relationships.
Taken together, our findings about the effects on seeking technological
capability, prior collaborative experience, social similarity, and aspirations
on network members’ collaboration preference make a contribution to the
literature on how partners are selected for collaboration, addressing Hitt et
al.’s (2000) call for research on the contingent nature of selection criteria.
81
II – CHAPTER TWO: OLD TECHNOLOGIES AS TEMPLATES FOR NEW
INVENTIONS
II - 1: Abstract
In this study, we explore how old technologies can be recombined to
generate new inventions. We consider four ways by which old technologies
can serve as templates: subtraction, reconfiguration, addition, and
replacement. Subtraction removes at least one component from a previous
combination while reconfiguration preserves a previously used combination
of components. Addition introduces new components to a familiar
combination and replacement captures those inventions in which some
components are added while others are removed. The study’s findings
suggest that re-using previous combinations results in superior inventions.
However, not all prior technologies are equally useful. Inventions that
recombine components from recently developed technologies were found to
have a higher impact. We also show that these inventions are more valuable
when a firm is aware of, and is able to absorb external knowledge. We test
these ideas using patent data from the US semiconductor industry.
82
II - 2: Introduction
Ever since March’s (1991) seminal work on exploitation and
exploration, an impressive amount of research has investigated the
influence of, and the tensions between the two concepts (Andriopoulos and
Lewis, 2009; He and Wong, 2004; Lavie and Rosenkopf, 2006; Rothaermel
and Deeds, 2004). If we define inventing as finding a valid solution to a
current problem through the combination of existing components
(Schumpeter, 1934), then exploration, in this context, occurs when
inventors combine components that they have not used before or which
have not been previously combined together (Fleming, 2001; March, 1991).
Exploitation is the opposite scenario, and occurs when previously combined
components are re-used. Although there are a number of different ways that
internal resources can be re-used, most studies group all exploitative
activities into a single category, and theorize that, in tandem, these result in
the same outcome (one exception is Katila and Ahuja, 2002). Our first
contribution lies in differentiating between the ways in which firms can
exploit their own prior technologies, and then in comparing the benefits and
drawbacks of each of these different types of recombinations.
Novel inventions can emerge when a firm re-uses an existing
combination of technological components in two ways: by recycling or by
renewing the combination. Recycling a prior invention is when only
components from that invention are re-used, and this can occur through
subtraction or reconfiguration. Invention by subtraction refers to the
removal of a component from an original invention – a process that can lead
83
to a number of different products (Boyd and Goldenberg, 2013a, 2013b).
One example is Sony’s Walkman. Sony’s initial objective was to create a
recording device with a stereo function. However, by the time the stereo
function was included, there was not enough space for the recording
function and the experiment was deemed a failure. This soon changed,
because Sony’s chairman realized that the device, after the removal of the
recording functionality, could serve a new purpose for mobile music
listening (Boyd and Goldenberg, 2013b; Koruna, 2004). Reconfiguration
differs in that the same components which appear in an old technology also
appear in the new one, but where the new technology functions differently.
As with subtraction, reconfiguration can also lead to new inventions
(Henderson and Clark, 1990). Consider, as an example, the history of razors
and shaving. In 1903, King C. Gillette received a patent for a safe razor with
a single disposable blade. Single-blade razors rapidly penetrated the market,
and remained popular for decades since the invention. Much later, in 1971,
Gillette introduced the double-blade razor (TRAC II). The components in the
new technology resembled those in the predecessor, with the main difference
being that one of the components appears twice (Boyd and Goldenberg,
2013b). In this example of reconfiguration, the same components were
configured differently in order to generate a superior invention.
Unlike recycling which only relies upon the original components,
renewal refers to the case when a new component is introduced, which can
lead to the generation of substantially different technologies. Renewal can
occur by addition, which is when an invention is generated by adding new
84
component(s) to existing combinations. Improvements in word processing
software illustrate how new products arise through addition. In the past,
including mathematical equations to texts prepared in a word processor
required a number of cumbersome steps, such as leaving white space for the
equation, printing the document, and then manually including the equation.
Later, code for typing equations became available, and its addition to older
word processing software has extended the functionality of these
technologies. Another technique in which new components are introduced to
a combination that has been used before is replacement. As the name
suggests, replacement refers to substituting existing components with
different ones, and this too is a viable technique for generating new
inventions. A case in point is the improvement in efficiency of the transistor
when semiconductor devices were developed by replacing tap water with
distilled water.
The above examples of inventions demonstrate how a firm’s old
technologies can serve as templates for the generation of new technologies.
Building on previous studies that have explored similar questions (Fleming,
2001; Fleming, 2002; Henderson and Clark, 1990), we will begin by showing
that recycled and renewed inventions are, on average, more valuable than
inventions in which new components are combined for the first time. This
result, which is driven in part by the knowledge that becomes available
when similar tasks are repeated, is more pronounced for renewed
inventions. This finding is surprising because although experiential learning
enhances the exploitation of prior inventions, we theorize and find that
85
renewed inventions, which are less familiar than recycled inventions to their
owners, typically have a higher impact.
Next we examine how two distinctive factors influence the outcome of
re-using old technologies; namely, the amount of time that elapses until a
firm re-uses a technology and the scope of external search. The former,
coined temporal exploration (Nerkar, 2003), has a negative impact on
recombining, as organizations can only recall – and hence, can only benefit
from – more recent experiences. Next, by examining the influence of external
search, we show why it is important for firms to be able to monitor
developments that occur in their environments and, when necessary, absorb
external knowledge (Cohen and Levinthal, 1990).
The contributions of this study are as follows. We extend the literature
on exploitation and exploration, by describing the four different ways which
facilitate the generation of new inventions from old ones. We also contribute
to the literature on organizational learning by simultaneously considering
the effect of time. Specifically, our study highlights the importance of prior
experiences (in combining technological components), but also shows how
these experiences are not persistent, but rather diminish over time. Finally,
we also contribute to the extensive literature on search (Cyert and March,
1963) by demonstrating how external search complements exploitation
efforts.
II - 3: Theory and Hypotheses
Product innovation requires complex coupling between the sometimes
divergent needs of markets and technologies (Freeman, 1982 in Dougherty,
86
1992). Therefore, firms that attempt to innovate must make design choices,
many of which fail. For the select group of products that make it to market,
some persist and are later remembered as great successes while others
come and go without a trace. As theories of innovation take the
epistemological stance that knowledge recombination is a critical driver of
invention and innovation (Galunic and Rodan, 1998), we wonder what types
of recombinations result in inventions with a higher impact?
We develop our theory along three central ideas. Firstly, the
knowledge-based view has argued that firms exploit their combinative
capabilities to create and respond to market and technological opportunities
(Grant, 1996; Kogut and Zander, 1992, 1996; Zander and Kogut, 1995). New
knowledge is created by recombining existing components (Basalla, 1988;
Schumpeter, 1939), and it is this recombination of “conceptual and physical
materials” that creates novelty (Nelson and Winter, 1982). Secondly,
although breakthrough innovations are the result of distant search, the
outcome of these activities is often highly variable and uncertain (Fleming,
2004). Therefore, even though it is rare for inventions in which search is
constrained to be as valuable as breakthroughs, the impact of the majority
of these is more consistent. Thirdly, firms exhibit considerable variation as
to how they exploit internal knowledge repositories (Katila and Ahuja, 2002;
March, 1991). We discuss four different types of recombination techniques
which involve the exploitation of familiar knowledge, and then go on to
investigate the influence of both time and external search.
87
II - 3.1: Subtraction, Reconfiguration, Addition, and Replacement
Previous literature has defined an invention as the outcome of one of
two processes: one in which new components are combined or where
previously combined components interact with one another in a new way
(Henderson and Clark, 1990; Schumpeter, 1939). Following this dichotomy,
we describe invention as either the outcome of re-using old combinations,
which we define as recombination, or as combining components that have
not been combined before.
We propose three theoretical arguments for why recombinations will
have a stronger impact than completely novel configurations of resources.
First, a firm is more familiar with the processes of re-using and refining
components that it combined before. Past combinative experience presents
firms with vital information regarding which combinations have failed
previously, allowing them to avoid similar errors (Fleming, 2001). By
contrast, this insight is unavailable when entirely new combinations are
being developed, leading the firm to experiment. Inevitably, the outcome of
experimentation is risky and uncertain, and this can hurt the output of
innovation (March, 1991).
A second line of reasoning is the expense that is associated with
assimilating knowledge (Hitt et al., 1996), which is typically high for
inventions, as these rely on tacit and sticky knowledge (Szulanski, 1996).
When a firm is combining new components for the first time, it would need
to experiment with various combinations, only some of which would be
successful. This process, which is both costly and time-consuming, places
88
the firm at a comparative disadvantage in the race to invention because of
time compression diseconomies (Dierickx and Cool, 1989). Although
recombining components is also time-consuming (Koruna, 2004), this
process is relatively more efficient. Recombinative inventions build on a
firm’s experience; and this reduces the coordination and communication
costs of transmitting the knowledge that is necessary for generating the new
invention (Kotha, George, and Srikanth, 2013).
Adding to the second point, the firm does not operate in isolation from
its competitors. While the firm is combining novel resources for the first
time, it is possible that these resources have already been exploited to some
degree by the competition. Because knowledge is non-entropic, in that it
grows through repeated use, the firm that attempts to combine resources for
the first time would be rather lucky if it manages to find a combination that
is superior to those found by competitors, ceteris paribus. While ‘beginner’s
luck’ is not impossible – Biogen’s blockbuster drug interferon beta-la for
instance built on no internal patents (George, Kotha, and Zheng, 2008) –
such stories are a consequence of positive selection bias. In general, “chance
favours the connected mind” (Johnson, 2011) and these ‘connections’ are a
consequence of experience and hard work. Therefore, firms that are more
familiar with specific resources bear lower knowledge assimilation costs, and
are more likely to find a useful solution while experiencing fewer problems.
For these reasons, we hypothesize that:
Hypothesis 1: The impact of a firm’s invention that re-uses a
combination from a previous invention (i.e., inventions by subtraction,
89
reconfiguration, addition or replacement) is higher than the impact of
inventions that strictly combine new components.
II - 3.2: Renewed versus Recycled Inventions
Recombinations include both recycled inventions which are generated
through subtraction and reconfiguration, and renewed inventions which are
generated by addition and replacement. In arriving at hypothesis 1, we
argued that as a result of familiarity, recombinations have a higher impact
than inventions comprising of entirely new combinations. A firm will have at
least some experience and familiarity with the knowledge embedded in
recycled and renewed inventions. However, the extent of familiarity is
naturally less for renewed inventions, as these involve the introduction of
new components. Whereas this may suggest that renewed inventions will
attain a lower impact, there are at least three arguments which lead us to
believe that this is not the case.
Firstly, the number of possible combinations is more limited when a
firm re-uses the same components (reconfiguration) or subsets of the same
components (subtraction). Of course, innovations that arise from
reconfiguration and subtraction can have “great competitive consequences”
(Henderson and Clark, 1990), but over time, a firm will exhaust all useful
combinations (Fleming, 2001). Tied to this argument, the focal firm is not
the only one innovating in the same technological domain. As an industry
approaches the technological frontier, the intrinsic potential for new
recombinations along the same trajectory becomes increasingly constrained
(Dosi, 1982, 1988). In such a situation, the probability of detecting novel
90
combinations diminishes (Galunic and Rodan, 1998), simply because there
is less novelty to detect.
Thirdly, if the firm constrains itself to recycled inventions, it would
need to search deeply in order to discover new opportunities, but depth is
limited by the latent technological potential as argued above. In comparison,
the ability to replace or add new components permits one to conduct a
broader search. Previous studies have found that there is an inverted-U
relationship between search depth and the outcome of inventive efforts. As
search depth increases to moderate levels, the ability to exploit familiar
combinations adds certainty to the outcome of the inventive process (George
et al., 2008). Additionally, Katila and Ahuja (2002) found a positive
interaction effect between search depth and scope with regards to new
product introductions in the market for robotics. This suggests that
combining both depth and scope enhances innovation. Since the inclusion
of new components broadens the search scope without compromising the
firm’s familiarity with the previously used (sub) combination, it enhances
the probability of detecting novel combinations. Taken together, these
arguments suggest that:
Hypothesis 2: The impact of recycled inventions (i.e., those generated
through subtraction or reconfiguration) is lower than the impact of
renewed inventions (i.e., those generated by addition or replacement).
II - 3.3: The Effect of Temporal Lapse
The literature exhibits an interesting debate as to whether old
knowledge can still be valuable for invention and innovation. Katila (2002)
showed that this question does not have a simple answer. Rather, her
91
findings suggested that the usefulness of old knowledge depends on its
source. Where a firm exploits internal knowledge, the age of such knowledge
was found to have a curvilinear (inverted-U) relationship with the number of
new innovations that are introduced. The results of this study were
supplemented shortly after, in a study by Nerkar (2003). Whereas Katila’s
(2002) work was concerned with the effect of search time on the quantity of
innovations, Nerkar (2003) explored its effect on the quality of innovations.
The results showed that recent knowledge improves the impact of the
resulting inventions; but the study did not distinguish between internal and
external knowledge. Building on these studies, we will argue that immediacy
in re-using a combination improves the impact of the resulting inventions.
In the course of a firm’s existence, it accumulates a large body of
knowledge, information and insights surrounding its inventive activities. For
instance, the information could be about the equipment needed to combine
certain components, or even a record of the failed experiments that an
inventive team faced before arriving at a useful invention. When it comes to
creating a new invention, having access to this body of prior knowledge is
vital. It allows inventors to repeat techniques that have proved successful,
and avoid combinations that have previously failed; thus making the current
inventive process more efficient and less risky. The caveat is that
organizations forget. In other words, important knowledge relating to a firm’s
inventive activities depletes over time (Argote, Beckman, and Epple, 1990).
Since firms forget older knowledge, inventors that build on more
recent experience are better able to avoid failure, and thus, generate new
92
combinations more efficiently (Nerkar, 2003). While all firms are prone to
forgetting vital knowledge, their accumulated knowledge does not deplete at
the same rate. Firms which invest in sophisticated knowledge management
systems are better able to store and retrieve prior knowledge, and do so with
higher fidelity than when these systems are absent. There are two popular
approaches to managing knowledge within an organization: the knowledge
can be codified and saved in databases, or the firm can ensure that there
are channels in place that allow the individuals that have generated the
knowledge to directly communicate with those who want to use it (Hansen,
Nohria, and Tierney, 1999). The latter method, defined as personalization, is
often more important for inventive knowledge, as this type of knowledge is
challenging to codify (Ahuja, Lampert, and Novelli, 2013). However,
individuals are only employed by a firm for a limited amount of time. Once
they leave, it is not always possible to maintain channels that are conducive
to the flow of tacit knowledge. Thus, even with personalization-intensive
techniques, older knowledge dissipates over time.
Apart from organizational memory, another factor that is influenced
by time, and which influences the impact of the resulting inventions, is the
ability to generate a useful combination. The entire premise of this paper is
that old combinations can be re-used to generate new inventions. However,
if one were to only rely on a limited number of components then, over time,
the potential for generating valuable combinations decreases (Kim and
Kogut, 1996). Fleming explains (2001): “If semiconductor inventors restricted
their usage to their original materials of aluminum and bipolar transistors,
93
progress in the field would have halted long ago.” Thus, when an inventor or
a firm is constrained in terms of the availability of components, the most
valuable combinations are likely to be developed early on (Fleming, 2001). At
a later stage, the potential to do is exhausted because of developments made
within the firm, as well as by competitors outside it.
Hypothesis 3a: Increasing the amount of time it takes to re-use a
combination from a previous invention (i.e., inventions by subtraction,
reconfiguration, addition or replacement) lowers the impact of these
inventions.
Following immediately from the discussion that lead up to Hypothesis
3a, we argue that recombinations in which new components are introduced
(renewed inventions) suffer more when the amount of time it takes to re-use
the necessary combination increases. We argued previously that inventors
are less familiar with combinations in which new components are included.
The lack of familiarity increases inventive risk and consequently, it also
increases the chances of producing knowledge with more problems (Fleming,
2001). By contrast, because inventors are more familiar with the
combination of components in recycled inventions, the inventive uncertainty
in these processes are lowered. If the intention is to refine a combination
that has been last used in the more distant past, the likelihood of obtaining
useful information is lower than if the combination was just recently used.
In other words, utilizing older knowledge increases inventive uncertainty;
which would be more detrimental for renewed inventions, which are innately
more uncertain. Our hypothesis follows logically:
Hypothesis 3b: Increasing the amount of time it takes to re-use a
combination lowers the impact of renewed inventions (i.e. addition or
94
replacement) more than recycled inventions (i.e., subtraction and
reconfiguration).
II - 3.4: The Effect of External Search
External knowledge resources are a priori not idiosyncratic to the
firm. Because firm-idiosyncratic resources are instrumental in creating
competitive advantage (Barney, 1991), turning external knowledge into a
valuable resource requires absorptive capacity (Cohen and Levinthal, 1990).
As argued by Henderson and Clark (1990) in the context of architectural
innovation, the existing knowledge base of the firm creates filters on the
interpretation of the environment (see also Daft and Weick, 1984). Thus,
information that is available in the environment becomes valuable only if
firms have the resources to assimilate this information in such a way that it
creates new idiosyncratic resources for the firm. Once absorbed, a firm can
benefit from a superior ability to generate impactful innovations (e.g.
Amabile, 1988; George et al., 2008). Therefore, even when a firm is
recombining components, it can still draw on technological knowledge from
the environment in which it operates as “inventors can draw on others’
knowledge and experience in addition to their own” (Fleming, 2001).
In the context of recombinative inventions, we expect that the extent
to which a firm assimilates knowledge from its external environment would
positively relate to the impact of these inventions. A firm that focuses only
on re-using internal knowledge risks missing out on opportunities to learn
from external technological developments. The resulting innovations would
not incorporate what is considered to be “cutting edge” technologies. A direct
outcome of bringing such products to market is that customers will not view
95
these firms as innovators, which will ultimately reduce the perceived value
of these products, as well as subsequent inventive endeavours (Nerkar,
2003).
In addition, the geographical scope of search is also richer for firms
which are aware of, and attempt to absorb knowledge from their
environment (Phene, Fladmoe‐Lindquist, and Marsh, 2006). Previous work
has shown that search scope has a positive linear effect on product
innovation (Katila and Ahuja, 2002). In other words, even when a firm’s new
invention entails re-using components, there is an advantage to scanning
the external environment, and absorbing relevant knowledge. This is
because external knowledge increases not only the number of problems that
can be solved (Fleming and Sorenson, 2004), but also the number of
solutions to each of these problems (March, 1991). Inevitably, having a
variety of solutions increases the chances of finding one that is superior. As
such, we hypothesize that:
Hypothesis 4a: The extent of external search that is conducted to re-use
a combination from a previous invention (i.e., inventions by subtraction,
reconfiguration, addition or replacement) increases the impact of these
inventions.
A different advantage of external search is that it introduces novelty to
the firm’s knowledge base, and thus enhances its diversity. Inclusion of
external knowledge sources and technologies reduces the influence of
competency traps and core rigidities (Leonard-Barton, 1992; Levinthal and
March, 1993). Recall that these risks are heightened with excessive search
depth, as it leads to diminishing returns to recombination efforts. Since
96
recycled inventions are associated with deeper searches, we suggested that
the risk of falling into competency traps would be higher for these types of
inventions. However, because this risk is mitigated as the scope of external
search increases, we expect that external search would have a higher
positive effect on recycled inventions than on renewed inventions. Stated
differently, the difference in impact between recycled inventions and
renewed inventions diminishes as the scope of external search increases.
Hypothesis 4b: Increasing the extent of external search increases the
impact of recycled inventions (i.e. subtraction, reconfiguration) more
than renewed inventions (i.e. addition or replacement).
II - 4: Data and Methods
We use patent and patent citation data to examine the different
techniques that lead to generating inventions, and how these techniques
could lead to inventions that vary in their technological importance. We
envisage invention as the end result of finding a solution to a predetermined
problem. Since patented inventions are essentially solutions to problems
that differ from those that have been solved before (Katila, 2002; Walker,
1995), they are suitable for answering research questions that relate to how
individuals and organizations invent and innovate. Furthermore, patent
documents provide detailed information on a number of aspects pertaining
to the invention and the inventive process, one of which is especially
important for our study.
Patent documents list technological classes and subclasses, the latter
of which constitute a much finer identification of the technologies used in
inventions. A number of prior studies have used patent subclasses as a
97
proxy for the technological components in an invention to measure
mechanisms such as the recombination of technological components and
the relationship between components (Fleming, 2001; Fleming and
Sorenson, 2001, 2004; Sorenson, Rivkin, and Fleming, 2006). Similarly, we
use technological subclasses to examine if a firm generates new inventions
using components that are present in its older technologies. A final
important feature of this data source is the availability of patent citation
data.
Citations capture the flow of knowledge, or technological information,
between patents (Hall, Jaffe, and Trajtenberg, 2001, 2005; Jaffe,
Trajtenberg, and Henderson, 1993). Previous studies have divided citations
into internal citations and external citations, and these have been used as a
proxy for the geographic scope of search (e.g., Katila, 2002; Katila and
Ahuja, 2002; Phene, Fladmoe-Lindquist and Marsh, 2006; Rosenkopf and
Nerkar, 2001). Analogously, we use citation data to capture the extent to
which a firm searches for knowledge outside its boundaries during the
invention process.
The empirical setting for this study is the US semiconductor industry.
We chose a single industry context because dominant paradigms of things
that work are likely to exist within the same industry but differ across
industries (Kaplan, Murray, and Henderson, 2003). To minimize the
variations that would be invoked by considering different industry
paradigms, a single industry setting is most appropriate for our research
question. Furthermore, in comparison to firms in other industries, US
semiconductor firms have been noted to have exceptionally high invention
98
rates, as well has high propensities to patent most of these inventions,
especially since the 1980s (Hall and Ziedonis, 2001; Stuart, 2000).
Therefore, patents serve as an appropriate proxy for invention in this
specific context. In addition, R&D is central to the day-to-day activities of
many semiconductor firms (Lahiri, 2010; Mathews and Cho, 1999; Park,
Chen, and Gallagher, 2002), during which these firms rely on both internal
and external sources of knowledge (Appleyard, 1996; West, 2002). The
diversity of knowledge sources that feeds into subsequent inventive efforts is
likely to facilitate the generation of inventions that are derived from
combinations of components that are available internally, combinations of
only external components, and yet other combinations which bring together
both internal and external components. Thus, we expected to observe a wide
variety of ways in which components could be arranged to generate new
inventions.
II - 4.1: Data Sources
To test our hypotheses, we utilized a dataset which comprises of 83,786
patents assigned to 159 firms. These patents spanned the time period 1990-
2004. This period is sensible because it excludes exogenous variation
following a number of important institutional changes in the 1980s (Hall
and Ziedonis, 2001; Mody and Wheeler, 1986). The final data sample was
compiled in the following steps. We began by combining the list of US
semiconductor firms used in Hall and Ziedonis (2001) with all other US
semiconductor firms that are available on COMPUSTAT (SIC code = 3674).
This additional source was required since Hall and Ziedonis (2001) only
99
consider firms which were active between 1975 and 1995, whereas our data
extends to 2004. To ensure that no major semiconductor firm was left out of
our dataset, we supplemented that list with those firms listed on the annual
publication by iSuppli Corporation which ranks semiconductor firms.
Following these methods, we compiled a list of 171 US semiconductor firms,
all of which have a COMPUSTAT record. We limited ourselves to US firms to
avoid variation from different institutional contexts and patenting behaviour
that would have been hard to control for in a meaningful way (e.g. Cohen et
al., 2002; Mathews and Cho, 1999)
Next, we retrieved the patents assigned to these firms by comparing
our list of 171 firms to the 247,309 assignees that were granted a USPTO
patent during the time-period 1975-2008. A simple name-matching
algorithm would have not been accurate because of the various ways in
which many firms are named on a patent document. For example, the firm’s
name may appear in full (International Business Machines), or as an
acronym (IBM), or may refer to one of the subsidiaries (IBM India). The
following two steps were implemented to ensure that each firm’s patents
were aggregated as accurately as possible. Firstly, we used the unique
numerical identifiers5 available from the NBER patent project which groups
unique firms. Secondly, we used the Directory of American Firms Operating
in Foreign Countries, which lists each variation in the names of the
subsidiaries associated with US firms. These variations were compared
5 This data is available from two sources: https://sites.google.com/site/patentdataproject/Home and http://www.nber.org/patents/.
The first source is used for the purpose of this research as it is a more up to date version.
100
against the 247,309 assignees that were granted a USPTO patent during the
time period spanning 1975 and 2008.
Following the aforementioned steps we identified the firms that had
been granted at least one USPTO patent between 1975 and 2008. We then
excluded patents that were applied for prior to 1990; which provides us with
a window that can be used to derive some of our key variables which rely on
the patenting histories of firms. In addition, we also excluded patents that
were applied for after 2004 to avoid right censoring of the data. Thus, our
main sample spanned the time period 1990 and 2004, and contained
patents assigned to 159 firms.
II - 4.2: Variables
II - 4.2.1: Dependent Variable
Impact. The number of forward citations that a patent receives was used to
construct our main dependent variable, impact. Forward citations reflect the
number of times that subsequent patented inventions build on the
knowledge and/or technical information that is present in the focal patent.
In this study, we use the number of citations to capture the impact, or the
value, of the invention. This is in line with a large number of management
studies, as the number of patent citations has been shown to be correlated
with the economic importance of inventions and expert evaluation of their
value (Albert et al., 1991; Hall et al., 2005; Jaffe, Trajtenberg, and Romer,
2002).
101
II - 4.2.2: Independent Variables
Recombination. Our first hypothesis examines the difference in
impact of inventions that recombine components that have appeared
together in one of the firm’s previous inventions versus those that don’t.
Thus, recombination takes a value of 1 if a patent contains at least two
components that appeared together in at least one of the firm’s previous
inventions, and a value of 0 otherwise. We measure recombination using the
following steps. First, we identify the patents whose components have the
largest degree of overlap with the focal patent. Overlap is simply measured
as the number of components that appear in both the focal patent and the
prior patents from the firm’s patent portfolio. In cases where more the one of
the previous patents have the same degree of overlap, we choose the most
recent one of these, as this would represent the patent that a firm is most
familiar with (Fleming, 2001).
Recycled inventions. Our definition for recombination is broad, and
includes different types of combinations. We narrow it down by defining four
different ways in which new inventions can use sets or subsets of
components that have appeared together in previous technologies. Recycled
inventions comprise the first two of these, namely subtraction and
replacement. Subtraction refers to inventions that are generated by
removing components from a previous combination. Reconfiguration, on the
other hand, refers to the cases when the exact same combination of
components has been used before. We group these because in both cases,
102
the firm is familiar with all the components in the invention (Fleming, 2001).
Both of these variables are binary variables.
Renewed inventions. The second two variables that fall under the
category of recombination are addition and replacement. Addition is a binary
variable that takes a value of 1 when a new component is added to a
combination of components that has been used before, and 0 otherwise.
Replacement refers to an invention in which some of the components in the
original combination have been replaced by different components.
Collectively, we refer to these as renewed inventions because in both cases a
new component is introduced, and this makes the process of arriving at the
invention less familiar (Fleming, 2001).
Temporal lapse. This refers to the amount of time (in number of
years) that has elapsed between the last time that a combination was used
and the current invention. We measure this lapse in two steps. Where an
invention recombines components that have been used together before
(Recombination = 1), we identify the most recent invention made by the focal
firm from which the components were recombined. Temporal lapse is then
measured as the number of years between the application dates of the focal
patent and its predecessor. For patents which do not recombine previously
used components, we repeat the same methods using the entire sample of
semiconductor patents. Thus, absent recombination, temporal lapse
measures the number of years it takes a firm to re-create a combination that
was developed in a competing firm. In 2,422 cases (=2.89%), we found that a
combination was never used before. To account for this, temporal lapse took
103
a value of 0, but we included a dummy variable (entirely new invention) to
capture these cases in our empirical models.
External search. Even when generating new inventions involves
reusing components from previous inventions, a firm may still rely on ideas
and technological advances made outside its boundaries. External search
captures this phenomenon by specifically measuring the extent to which a
firm utilizes external knowledge in the focal patent. Following other studies
(Almeida and Phene, 2004; Katila, 2002), this variable is constructed by
counting the number of times that a focal patent cites prior patents that are
assigned to other (i.e., external) firms. 401 of the patents in our database (=
0.48%) contained no references. Naturally, external search takes a value of 0
in these cases, but this differs from when a patent cites prior art but makes
no references to external firms. To distinguish between the two, we included
a dummy variable (no references) in all our regression models.
II - 4.2.3: Control Variables
Team size. Patents developed by teams composed of a larger number
of inventors have been shown to receive more forward citations (Singh and
Fleming, 2010). This variable can also influence the dependent variable, as
larger teams may possibly be able to retrieve more knowledge. Therefore, the
influence of team size is controlled for by constructing a variable that counts
the number of inventors that are listed on each focal patent.
Technological maturity is calculated as the ratio of backward
citations the focal patent makes to prior art to the number of claims that it
104
makes (Hoetker and Agarwal, 2007; Lanjouw and Schankerman, 2003).
Mature technologies are typically easier to understand (Sørensen and
Stuart, 2000), which makes retrieval more straightforward from the
perspective of the originating firm. However, mature technologies may also
be less desirable in the marketplace when compared to emerging
technologies (Hoetker and Agarwal, 2007), thereby making the original firm
less inclined to retrieve the knowledge used to leverage that technology by
an external party.
Range of technologies combined. Innovations that combine a wider
range of technologies can have an impact that differs from that of
innovations that do not (e.g. Argyres and Silverman, 2004; Jaffe et al., 2002;
Singh, 2008). Prior studies have also indicated that international teams are
likely to assimilate knowledge that is more technologically diverse than if the
team was composed of inventors from a single geographic location (e.g.
Boschma, 2005; Rosenkopf and Nerkar, 2001). Technological diversity is
calculated by first computing the proportion, pi, of a patent’s backward
citations that are in the technological class i. Technological diversity is then
calculated as follows:
21 i
i
p
The minimum value of Technological diversity is 0, and occurs if all
backward citations belong to the same technological class. The maximum
value is contingent on the number of unique classes, and occurs when the
backward citations are uniformly distributed across the unique classes. It
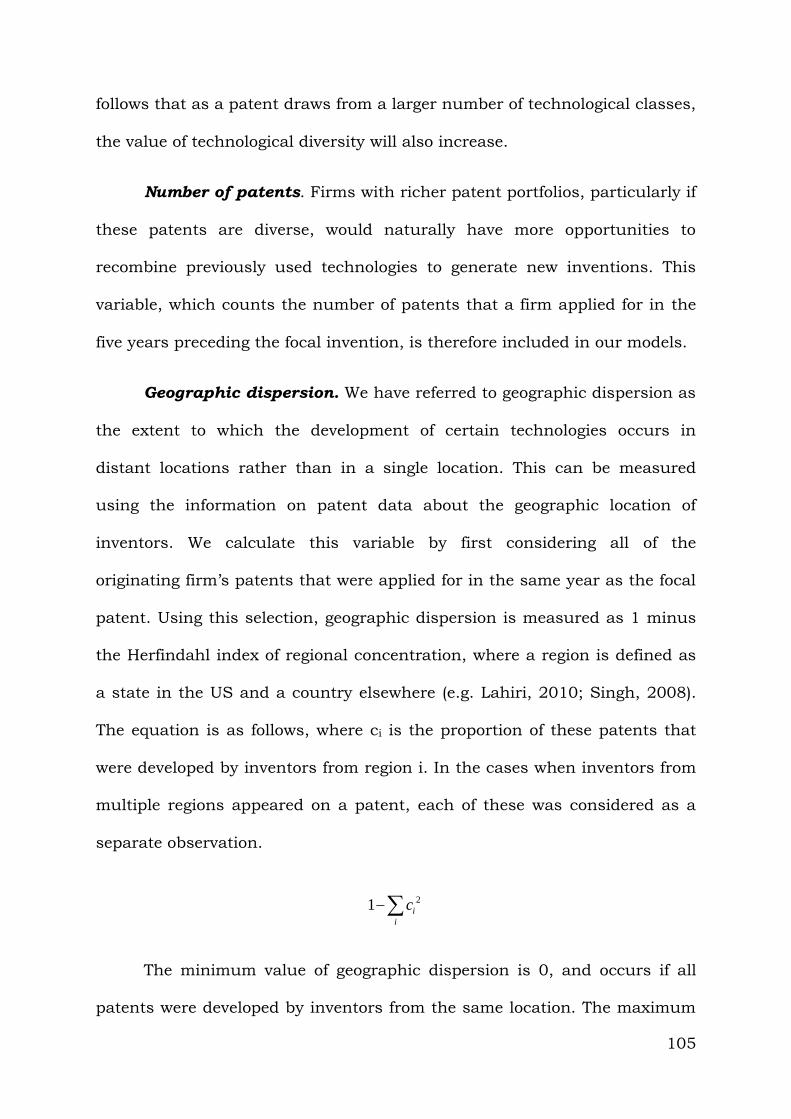
105
follows that as a patent draws from a larger number of technological classes,
the value of technological diversity will also increase.
Number of patents. Firms with richer patent portfolios, particularly if
these patents are diverse, would naturally have more opportunities to
recombine previously used technologies to generate new inventions. This
variable, which counts the number of patents that a firm applied for in the
five years preceding the focal invention, is therefore included in our models.
Geographic dispersion. We have referred to geographic dispersion as
the extent to which the development of certain technologies occurs in
distant locations rather than in a single location. This can be measured
using the information on patent data about the geographic location of
inventors. We calculate this variable by first considering all of the
originating firm’s patents that were applied for in the same year as the focal
patent. Using this selection, geographic dispersion is measured as 1 minus
the Herfindahl index of regional concentration, where a region is defined as
a state in the US and a country elsewhere (e.g. Lahiri, 2010; Singh, 2008).
The equation is as follows, where ci is the proportion of these patents that
were developed by inventors from region i. In the cases when inventors from
multiple regions appeared on a patent, each of these was considered as a
separate observation.
21 i
i
c
The minimum value of geographic dispersion is 0, and occurs if all
patents were developed by inventors from the same location. The maximum
106
value is contingent on the number of distinct locations, and the patents are
uniformly distributed across all regions. Specifically, if the number of
locations is equal to N, then the maximum value for geographic dispersion =
1-1/N.
Firm age. This variable is calculated as the number of years between
the application date of the firm’s very first patent with the USPTO and the
application year of the focal patent. It is included as a control variable to
account for the possibility that older firms have richer patent stocks from
which components can be recombined, as well as more experience at
recombining these components.
Firm Size. Larger firms, which employ more R&D personnel, are
likely to have superior capabilities in terms of recombining previously used
technologies. We account for this counting the number of unique inventors
which have applied for a patent during the year in which the focal patent
was applied for. We used the inventor database, which identifies unique
USPTO inventors and matches them to their respective patents (Lai et al.,
2011), to retrieve this variable.
Year dummies. As a final control variable, we include year dummies,
which reflect the application date of the focal patent. Year dummy variables
are included to account for the differences in the number of citations that
patents from different years are expected to receive (Hall et al., 2001).
107
II - 5: Analysis
Statistical analysis. The unit of analysis is the patent, and our
dependent variable of impact is a count variable. Poisson regressions are
often used to analyse count data. However, an assumption of the Poisson
distribution is that the mean and the standard deviation equate, which is
typically violated in analyses which consider patent citations, as these are
often overdispersed. Therefore, we use negative binomial regressions, which
relax the assumption that the mean and the standard of the dependent
variable are equal to one another; making them better suited for our
analyses. To determine whether to use a random effects or fixed effects
model, we implemented a Hausman (1978) specification test. The result of
the test was insignificant (p > 0.05); meaning that a random effects model is
consistent and efficient.
Data analysis. The descriptive statistics and the correlation matrix
for the variables used in this study are displayed in Table II-1. The
correlation coefficients between the variables are low enough so that it does
not raise issues of multicollinearity.
The statistics relating to the processes by which components are
recombined reveal an interesting description of the process of invention. The
mean value of the variable recombination is 0.69, which means that the
majority of firm’s patents (69%) recombine components that have been
previously used together. Of these patents, approximately 28%, 4%, 5% and
63% result from subtraction, reconfiguration, addition and replacement.

108
Thus, the bulk of inventions which re-use previous components are
generated through replacement and subtraction.
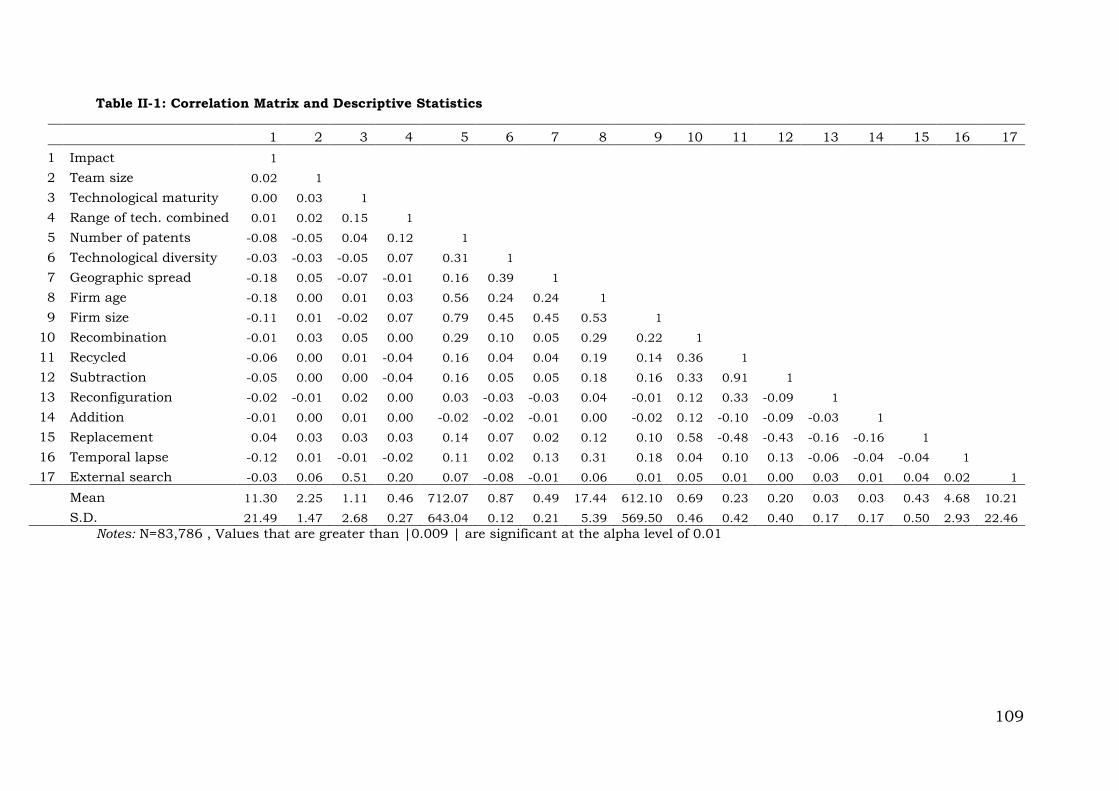
109
Table II-1: Correlation Matrix and Descriptive Statistics
1 2 3 4 5 6 7 8 9 10 11 12 13 14 15 16 17
1 Impact 1 2 Team size 0.02 1
3 Technological maturity 0.00 0.03 1 4 Range of tech. combined 0.01 0.02 0.15 1
5 Number of patents -0.08 -0.05 0.04 0.12 1
6 Technological diversity -0.03 -0.03 -0.05 0.07 0.31 1 7 Geographic spread -0.18 0.05 -0.07 -0.01 0.16 0.39 1
8 Firm age -0.18 0.00 0.01 0.03 0.56 0.24 0.24 1 9 Firm size -0.11 0.01 -0.02 0.07 0.79 0.45 0.45 0.53 1
10 Recombination -0.01 0.03 0.05 0.00 0.29 0.10 0.05 0.29 0.22 1 11 Recycled -0.06 0.00 0.01 -0.04 0.16 0.04 0.04 0.19 0.14 0.36 1
12 Subtraction -0.05 0.00 0.00 -0.04 0.16 0.05 0.05 0.18 0.16 0.33 0.91 1 13 Reconfiguration -0.02 -0.01 0.02 0.00 0.03 -0.03 -0.03 0.04 -0.01 0.12 0.33 -0.09 1
14 Addition -0.01 0.00 0.01 0.00 -0.02 -0.02 -0.01 0.00 -0.02 0.12 -0.10 -0.09 -0.03 1 15 Replacement 0.04 0.03 0.03 0.03 0.14 0.07 0.02 0.12 0.10 0.58 -0.48 -0.43 -0.16 -0.16 1
16 Temporal lapse -0.12 0.01 -0.01 -0.02 0.11 0.02 0.13 0.31 0.18 0.04 0.10 0.13 -0.06 -0.04 -0.04 1 17 External search -0.03 0.06 0.51 0.20 0.07 -0.08 -0.01 0.06 0.01 0.05 0.01 0.00 0.03 0.01 0.04 0.02 1
Mean 11.30 2.25 1.11 0.46 712.07 0.87 0.49 17.44 612.10 0.69 0.23 0.20 0.03 0.03 0.43 4.68 10.21
S.D. 21.49 1.47 2.68 0.27 643.04 0.12 0.21 5.39 569.50 0.46 0.42 0.40 0.17 0.17 0.50 2.93 22.46
Notes: N=83,786 , Values that are greater than |0.009 | are significant at the alpha level of 0.01
110
II - 6: Results
We test the first of our hypotheses in Table II-2, which presents the
results of the regression for the full sample of patents. Column 1 presents
the baseline model, which includes the control variables. Next, column 2
introduces two of the explanatory variables: temporal lapse and external
search. Column 3 tests hypothesis 1 by introducing the variable:
recombination. Recall that recombination is the broader category which
distinguishes between all inventions that are generated by re-using existing
components and those that do not. In later models, narrower subcategories
will be introduced. The coefficient on recombination is positive and
significant (b = 0.085, p < 0.001), meaning that the expected impact of
patents that use any of the four recombination types is 8.9% higher than
those which do not. This result corroborates hypothesis 1.
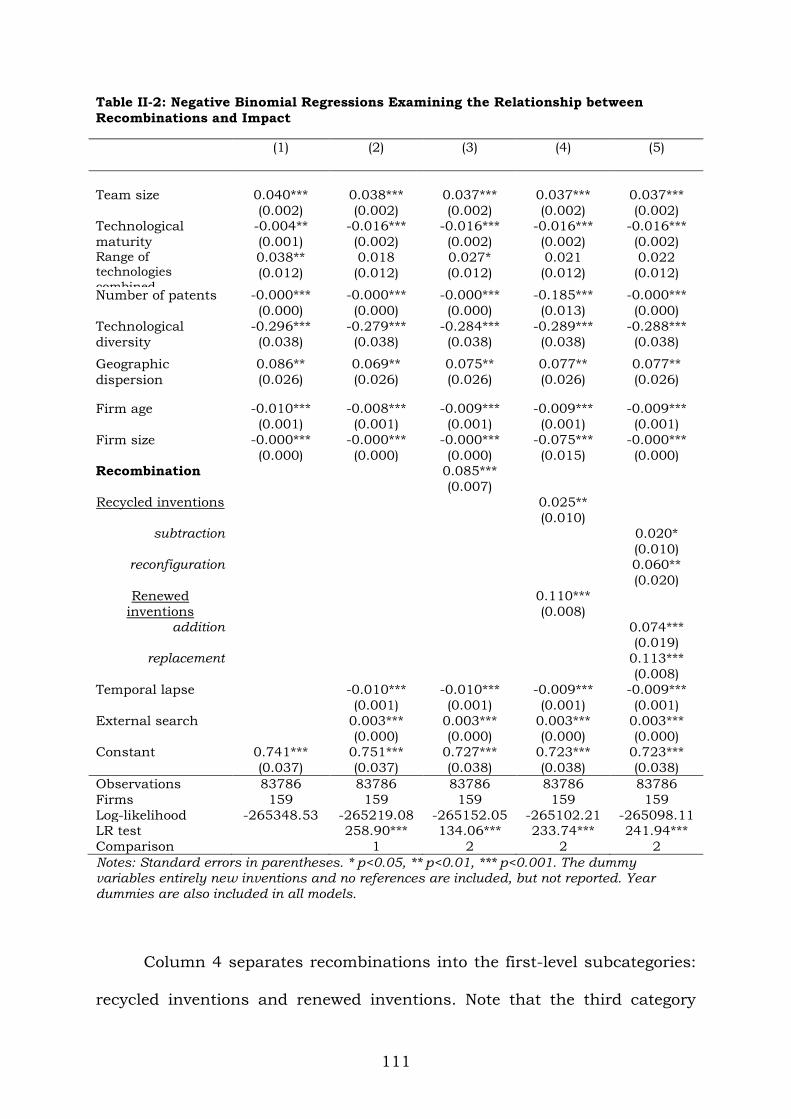
111
Table II-2: Negative Binomial Regressions Examining the Relationship between
Recombinations and Impact
(1) (2) (3) (4) (5)
Team size 0.040***
(0.002)
0.038***
(0.002)
0.037***
(0.002)
0.037***
(0.002)
0.037***
(0.002) Technological
maturity
-0.004**
(0.001)
-0.016***
(0.002)
-0.016***
(0.002)
-0.016***
(0.002)
-0.016***
(0.002) Range of
technologies
combined
0.038**
(0.012)
0.018
(0.012)
0.027*
(0.012)
0.021
(0.012)
0.022
(0.012)
Number of patents -0.000***
(0.000)
-0.000***
(0.000)
-0.000***
(0.000)
-0.185***
(0.013)
-0.000***
(0.000)
Technological
diversity
-0.296***
(0.038)
-0.279***
(0.038)
-0.284***
(0.038)
-0.289***
(0.038)
-0.288***
(0.038)
Geographic
dispersion
0.086**
(0.026)
0.069**
(0.026)
0.075**
(0.026)
0.077**
(0.026)
0.077**
(0.026)
Firm age -0.010***
(0.001)
-0.008***
(0.001)
-0.009***
(0.001)
-0.009***
(0.001)
-0.009***
(0.001)
Firm size -0.000***
(0.000)
-0.000***
(0.000)
-0.000***
(0.000)
-0.075***
(0.015)
-0.000***
(0.000) Recombination
0.085***
(0.007)
Recycled inventions
0.025**
(0.010)
subtraction
0.020*
(0.010) reconfiguration
0.060**
(0.020)
Renewed
inventions
0.110***
(0.008)
addition
0.074*** (0.019)
replacement
0.113***
(0.008)
Temporal lapse
-0.010***
(0.001)
-0.010***
(0.001)
-0.009***
(0.001)
-0.009***
(0.001)
External search
0.003*** (0.000)
0.003*** (0.000)
0.003*** (0.000)
0.003*** (0.000)
Constant 0.741***
(0.037)
0.751***
(0.037)
0.727***
(0.038)
0.723***
(0.038)
0.723***
(0.038)
Observations 83786 83786 83786 83786 83786
Firms 159 159 159 159 159
Log-likelihood -265348.53 -265219.08 -265152.05 -265102.21 -265098.11 LR test 258.90*** 134.06*** 233.74*** 241.94***
Comparison 1 2 2 2
Notes: Standard errors in parentheses. * p<0.05, ** p<0.01, *** p<0.001. The dummy variables entirely new inventions and no references are included, but not reported. Year dummies are also included in all models.
Column 4 separates recombinations into the first-level subcategories:
recycled inventions and renewed inventions. Note that the third category
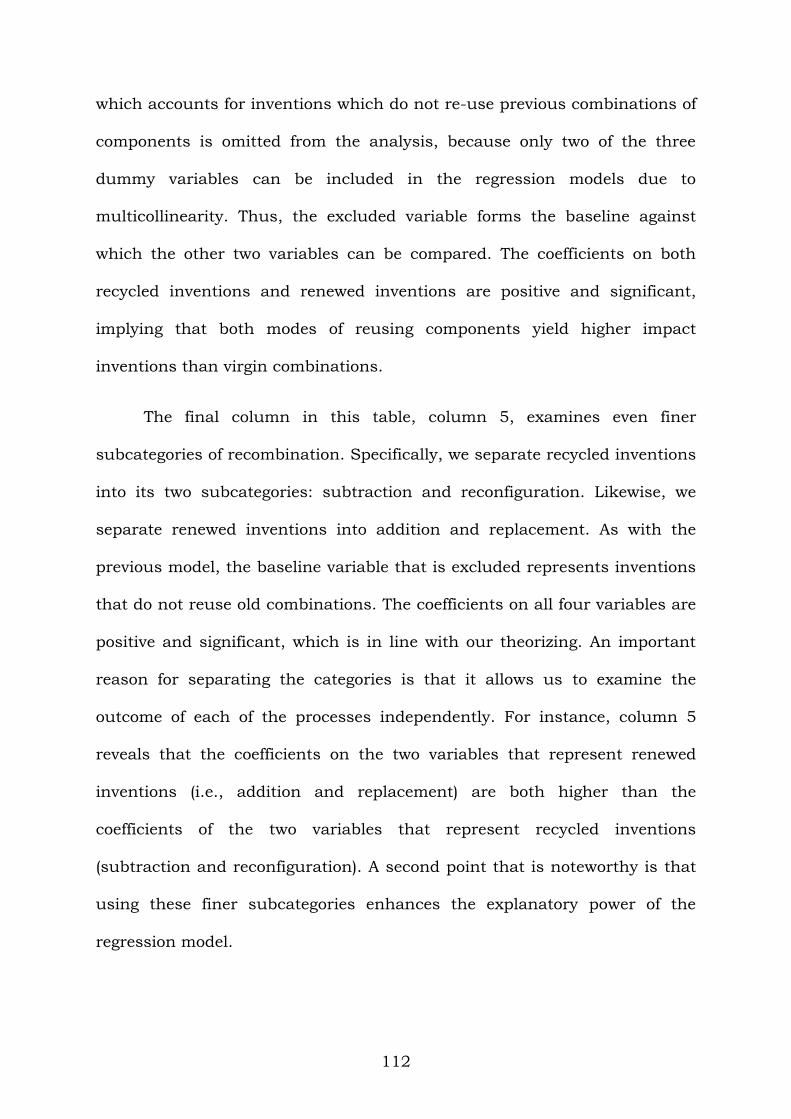
112
which accounts for inventions which do not re-use previous combinations of
components is omitted from the analysis, because only two of the three
dummy variables can be included in the regression models due to
multicollinearity. Thus, the excluded variable forms the baseline against
which the other two variables can be compared. The coefficients on both
recycled inventions and renewed inventions are positive and significant,
implying that both modes of reusing components yield higher impact
inventions than virgin combinations.
The final column in this table, column 5, examines even finer
subcategories of recombination. Specifically, we separate recycled inventions
into its two subcategories: subtraction and reconfiguration. Likewise, we
separate renewed inventions into addition and replacement. As with the
previous model, the baseline variable that is excluded represents inventions
that do not reuse old combinations. The coefficients on all four variables are
positive and significant, which is in line with our theorizing. An important
reason for separating the categories is that it allows us to examine the
outcome of each of the processes independently. For instance, column 5
reveals that the coefficients on the two variables that represent renewed
inventions (i.e., addition and replacement) are both higher than the
coefficients of the two variables that represent recycled inventions
(subtraction and reconfiguration). A second point that is noteworthy is that
using these finer subcategories enhances the explanatory power of the
regression model.
113
Table II-3: Negative Binomial Regressions Comparing the Impact of Inventions that
Rely only on the Original Components (Recycled Inventions) versus Inventions that
Introduce New Components (Renewed Inventions).
(1) (2) (3) (4)
Team size 0.033***
(0.003)
0.032***
(0.003)
0.032***
(0.003)
0.032***
(0.003) Technological maturity -0.006***
(0.002)
-0.015***
(0.002)
-0.015***
(0.002)
-0.015***
(0.002)
Range of technologies
combined
0.054***
(0.015)
0.034*
(0.015)
0.035*
(0.015)
0.034*
(0.015)
Number of patents -0.171***
(0.014)
-0.191***
(0.014)
-0.190***
(0.014)
-0.190***
(0.014)
Technological diversity -0.401*** (0.055)
-0.350*** (0.055)
-0.351*** (0.055)
-0.353*** (0.055)
Geographic dispersion 0.151***
(0.036)
0.129***
(0.036)
0.129***
(0.036)
0.130***
(0.036)
Firm age -0.012***
(0.002)
-0.009***
(0.002)
-0.009***
(0.002)
-0.009***
(0.002)
Firm size -0.088*** (0.018)
-0.074*** (0.018)
-0.075*** (0.018)
-0.075*** (0.018)
Recycled -0.093***
(0.009)
-0.088***
(0.009)
-0.142***
(0.017)
-0.150***
(0.017)
Temporal lapse
-0.012***
(0.002)
-0.015***
(0.002)
-0.015***
(0.002) Temporal lapse x Recycled
0.012***
(0.003)
0.011***
(0.003)
External search
0.002***
(0.000)
0.002***
(0.000)
0.002***
(0.000)
External search x Recycled
0.001**
(0.000) Constant 0.916***
(0.055)
0.895***
(0.055)
0.911***
(0.055)
0.916***
(0.055)
Observations 58011 58011 58011 58011
Firms 137 137 137 137
Log-likelihood -182319.328 -182229.502 -182281.025 -182218.754
LR test 179.65*** 14.49 *** 7.00** Comparison 1 2 3
Standard errors in parentheses. * p<0.05, ** p<0.01, *** p<0.001. Standard errors in parentheses. * p<0.05, ** p<0.01, *** p<0.001. The dummy variable no references is
included, but not reported. Year dummies are also included in all models.
The empirical analysis in Table II-3 only considers inventions which
reuse existing combinations (i.e., recombination = 1). Therefore, 58,011
patents belonging to 137 firms are retained in this analysis. We drop all
other patents in order to test the remaining hypotheses, as these compare
the impact of inventions that are recycled to those which are renewed. The
results in the previous table (Table II-2) showed us that there was a
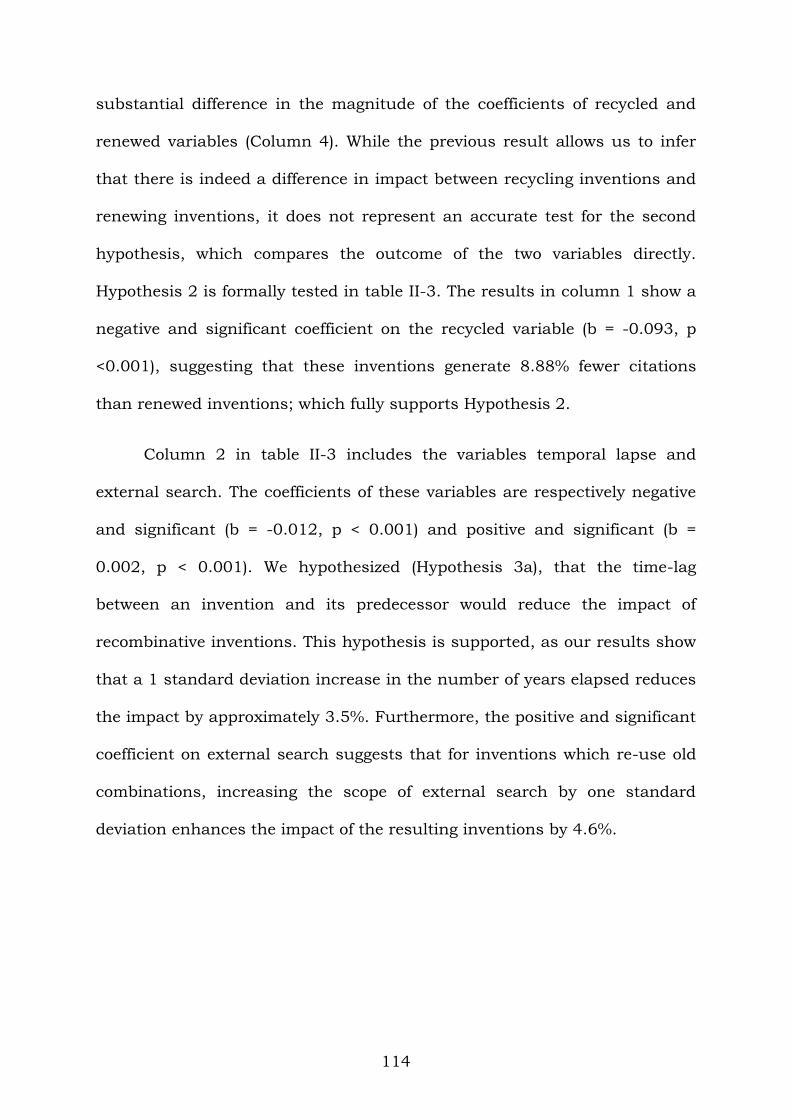
114
substantial difference in the magnitude of the coefficients of recycled and
renewed variables (Column 4). While the previous result allows us to infer
that there is indeed a difference in impact between recycling inventions and
renewing inventions, it does not represent an accurate test for the second
hypothesis, which compares the outcome of the two variables directly.
Hypothesis 2 is formally tested in table II-3. The results in column 1 show a
negative and significant coefficient on the recycled variable (b = -0.093, p
<0.001), suggesting that these inventions generate 8.88% fewer citations
than renewed inventions; which fully supports Hypothesis 2.
Column 2 in table II-3 includes the variables temporal lapse and
external search. The coefficients of these variables are respectively negative
and significant (b = -0.012, p < 0.001) and positive and significant (b =
0.002, p < 0.001). We hypothesized (Hypothesis 3a), that the time-lag
between an invention and its predecessor would reduce the impact of
recombinative inventions. This hypothesis is supported, as our results show
that a 1 standard deviation increase in the number of years elapsed reduces
the impact by approximately 3.5%. Furthermore, the positive and significant
coefficient on external search suggests that for inventions which re-use old
combinations, increasing the scope of external search by one standard
deviation enhances the impact of the resulting inventions by 4.6%.
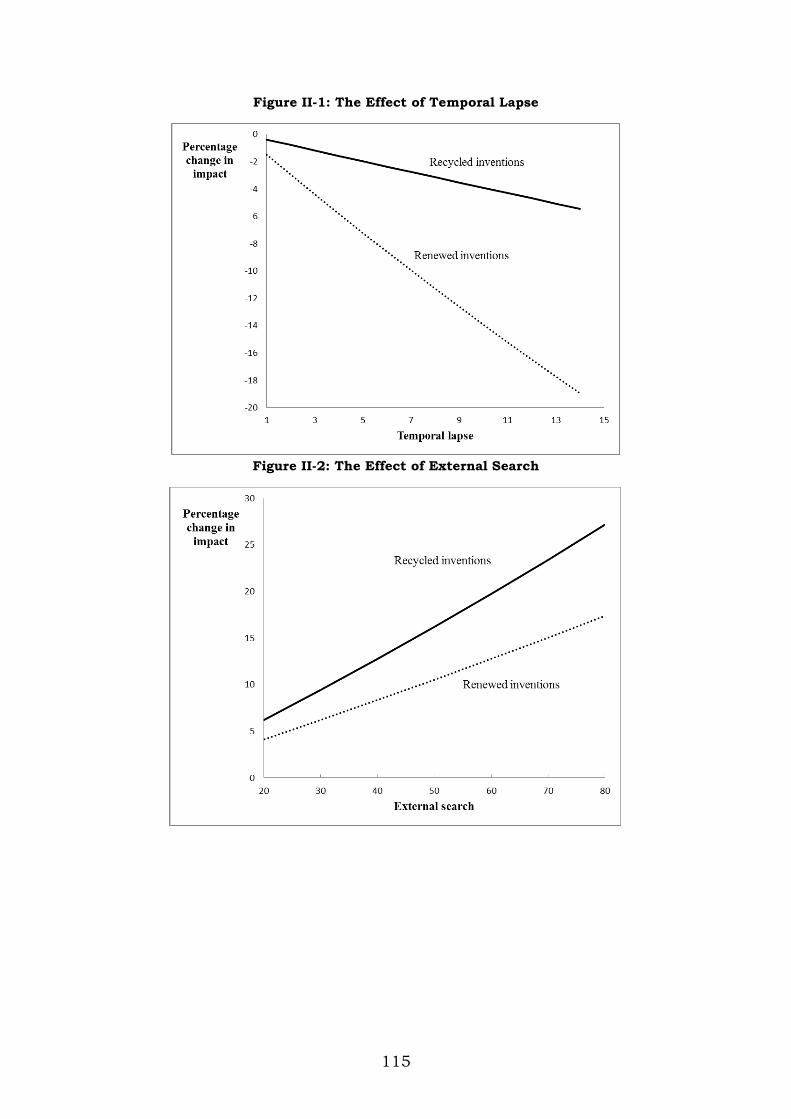
115
Figure II-1: The Effect of Temporal Lapse
Figure II-2: The Effect of External Search
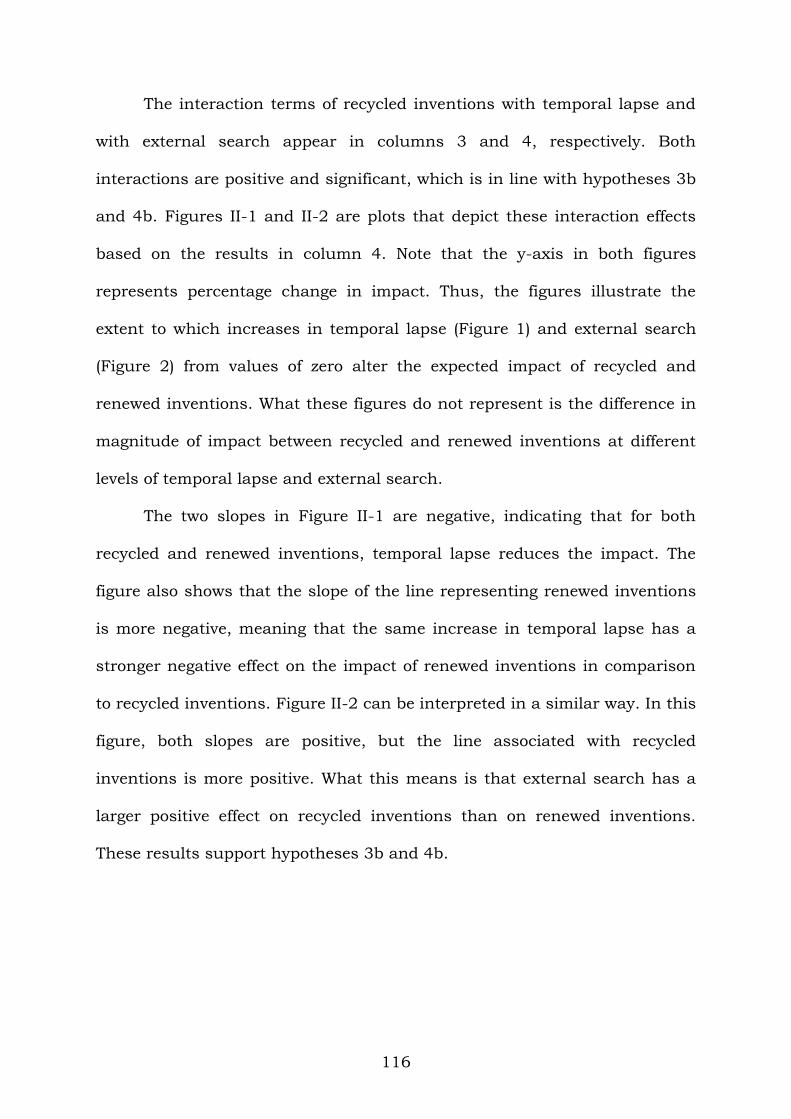
116
The interaction terms of recycled inventions with temporal lapse and
with external search appear in columns 3 and 4, respectively. Both
interactions are positive and significant, which is in line with hypotheses 3b
and 4b. Figures II-1 and II-2 are plots that depict these interaction effects
based on the results in column 4. Note that the y-axis in both figures
represents percentage change in impact. Thus, the figures illustrate the
extent to which increases in temporal lapse (Figure 1) and external search
(Figure 2) from values of zero alter the expected impact of recycled and
renewed inventions. What these figures do not represent is the difference in
magnitude of impact between recycled and renewed inventions at different
levels of temporal lapse and external search.
The two slopes in Figure II-1 are negative, indicating that for both
recycled and renewed inventions, temporal lapse reduces the impact. The
figure also shows that the slope of the line representing renewed inventions
is more negative, meaning that the same increase in temporal lapse has a
stronger negative effect on the impact of renewed inventions in comparison
to recycled inventions. Figure II-2 can be interpreted in a similar way. In this
figure, both slopes are positive, but the line associated with recycled
inventions is more positive. What this means is that external search has a
larger positive effect on recycled inventions than on renewed inventions.
These results support hypotheses 3b and 4b.
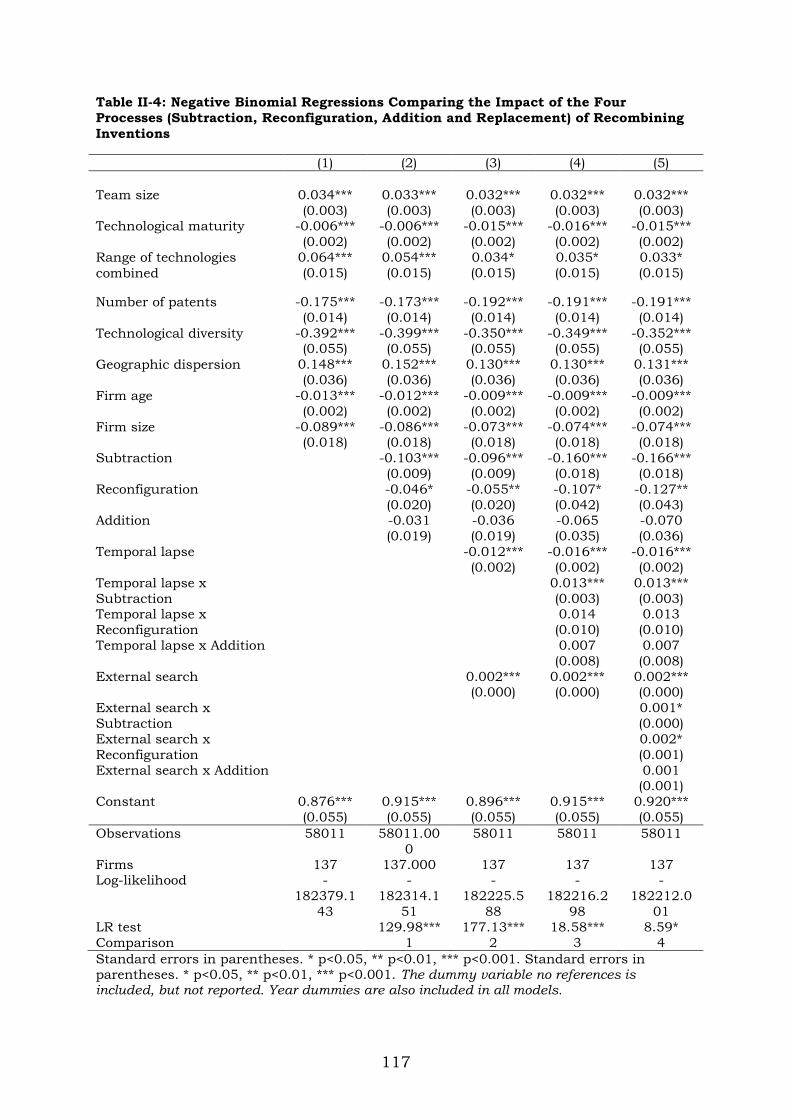
117
Table II-4: Negative Binomial Regressions Comparing the Impact of the Four
Processes (Subtraction, Reconfiguration, Addition and Replacement) of Recombining
Inventions
(1) (2) (3) (4) (5)
Team size 0.034***
(0.003)
0.033***
(0.003)
0.032***
(0.003)
0.032***
(0.003)
0.032***
(0.003) Technological maturity -0.006***
(0.002)
-0.006***
(0.002)
-0.015***
(0.002)
-0.016***
(0.002)
-0.015***
(0.002)
Range of technologies
combined
0.064***
(0.015)
0.054***
(0.015)
0.034*
(0.015)
0.035*
(0.015)
0.033*
(0.015)
Number of patents -0.175***
(0.014)
-0.173***
(0.014)
-0.192***
(0.014)
-0.191***
(0.014)
-0.191***
(0.014)
Technological diversity -0.392*** (0.055)
-0.399*** (0.055)
-0.350*** (0.055)
-0.349*** (0.055)
-0.352*** (0.055)
Geographic dispersion 0.148***
(0.036)
0.152***
(0.036)
0.130***
(0.036)
0.130***
(0.036)
0.131***
(0.036)
Firm age -0.013***
(0.002)
-0.012***
(0.002)
-0.009***
(0.002)
-0.009***
(0.002)
-0.009***
(0.002)
Firm size -0.089*** (0.018)
-0.086*** (0.018)
-0.073*** (0.018)
-0.074*** (0.018)
-0.074*** (0.018)
Subtraction
-0.103***
(0.009)
-0.096***
(0.009)
-0.160***
(0.018)
-0.166***
(0.018)
Reconfiguration
-0.046*
(0.020)
-0.055**
(0.020)
-0.107*
(0.042)
-0.127**
(0.043) Addition
-0.031
(0.019)
-0.036
(0.019)
-0.065
(0.035)
-0.070
(0.036)
Temporal lapse
-0.012***
(0.002)
-0.016***
(0.002)
-0.016***
(0.002)
Temporal lapse x
Subtraction
0.013***
(0.003)
0.013***
(0.003) Temporal lapse x
Reconfiguration
0.014
(0.010)
0.013
(0.010)
Temporal lapse x Addition
0.007
(0.008)
0.007
(0.008)
External search
0.002*** (0.000)
0.002*** (0.000)
0.002*** (0.000)
External search x
Subtraction
0.001*
(0.000)
External search x
Reconfiguration
0.002*
(0.001)
External search x Addition
0.001 (0.001)
Constant 0.876***
(0.055)
0.915***
(0.055)
0.896***
(0.055)
0.915***
(0.055)
0.920***
(0.055)
Observations 58011 58011.00
0
58011 58011 58011
Firms 137 137.000 137 137 137 Log-likelihood -
182379.1
43
-
182314.1
51
-
182225.5
88
-
182216.2
98
-
182212.0
01
LR test 129.98*** 177.13*** 18.58*** 8.59*
Comparison 1 2 3 4
Standard errors in parentheses. * p<0.05, ** p<0.01, *** p<0.001. Standard errors in parentheses. * p<0.05, ** p<0.01, *** p<0.001. The dummy variable no references is included, but not reported. Year dummies are also included in all models.
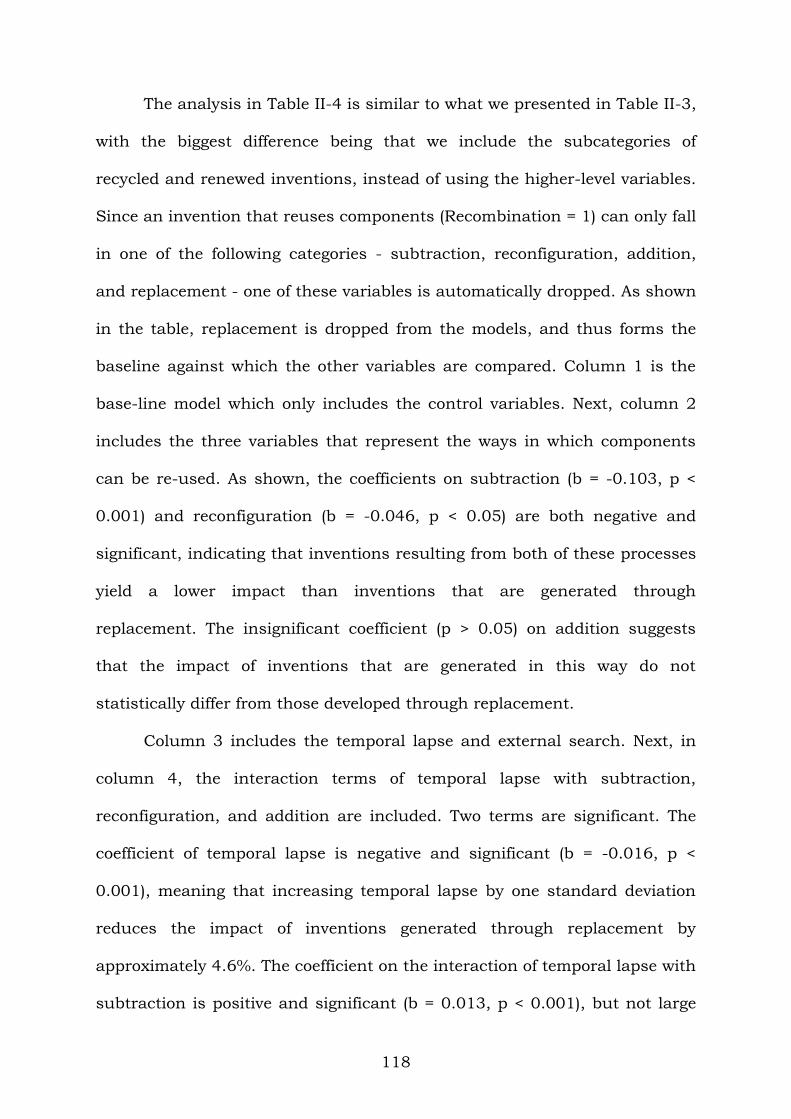
118
The analysis in Table II-4 is similar to what we presented in Table II-3,
with the biggest difference being that we include the subcategories of
recycled and renewed inventions, instead of using the higher-level variables.
Since an invention that reuses components (Recombination = 1) can only fall
in one of the following categories - subtraction, reconfiguration, addition,
and replacement - one of these variables is automatically dropped. As shown
in the table, replacement is dropped from the models, and thus forms the
baseline against which the other variables are compared. Column 1 is the
base-line model which only includes the control variables. Next, column 2
includes the three variables that represent the ways in which components
can be re-used. As shown, the coefficients on subtraction (b = -0.103, p <
0.001) and reconfiguration (b = -0.046, p < 0.05) are both negative and
significant, indicating that inventions resulting from both of these processes
yield a lower impact than inventions that are generated through
replacement. The insignificant coefficient (p > 0.05) on addition suggests
that the impact of inventions that are generated in this way do not
statistically differ from those developed through replacement.
Column 3 includes the temporal lapse and external search. Next, in
column 4, the interaction terms of temporal lapse with subtraction,
reconfiguration, and addition are included. Two terms are significant. The
coefficient of temporal lapse is negative and significant (b = -0.016, p <
0.001), meaning that increasing temporal lapse by one standard deviation
reduces the impact of inventions generated through replacement by
approximately 4.6%. The coefficient on the interaction of temporal lapse with
subtraction is positive and significant (b = 0.013, p < 0.001), but not large
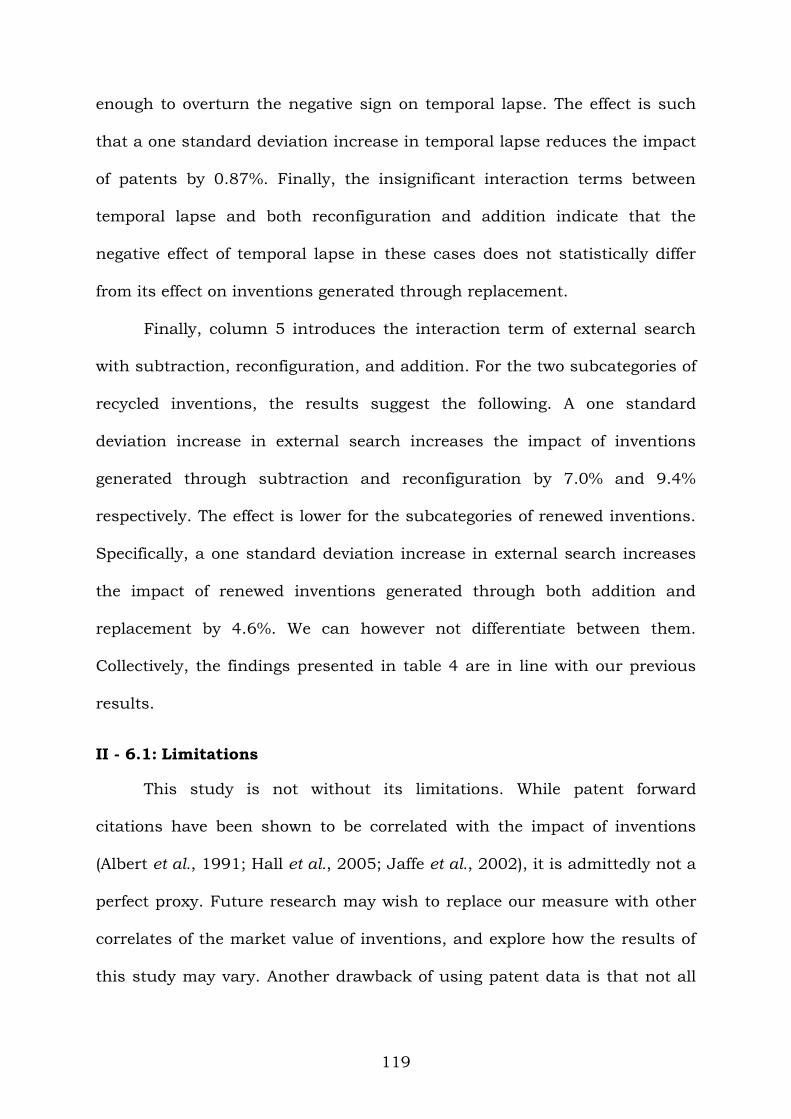
119
enough to overturn the negative sign on temporal lapse. The effect is such
that a one standard deviation increase in temporal lapse reduces the impact
of patents by 0.87%. Finally, the insignificant interaction terms between
temporal lapse and both reconfiguration and addition indicate that the
negative effect of temporal lapse in these cases does not statistically differ
from its effect on inventions generated through replacement.
Finally, column 5 introduces the interaction term of external search
with subtraction, reconfiguration, and addition. For the two subcategories of
recycled inventions, the results suggest the following. A one standard
deviation increase in external search increases the impact of inventions
generated through subtraction and reconfiguration by 7.0% and 9.4%
respectively. The effect is lower for the subcategories of renewed inventions.
Specifically, a one standard deviation increase in external search increases
the impact of renewed inventions generated through both addition and
replacement by 4.6%. We can however not differentiate between them.
Collectively, the findings presented in table 4 are in line with our previous
results.
II - 6.1: Limitations
This study is not without its limitations. While patent forward
citations have been shown to be correlated with the impact of inventions
(Albert et al., 1991; Hall et al., 2005; Jaffe et al., 2002), it is admittedly not a
perfect proxy. Future research may wish to replace our measure with other
correlates of the market value of inventions, and explore how the results of
this study may vary. Another drawback of using patent data is that not all
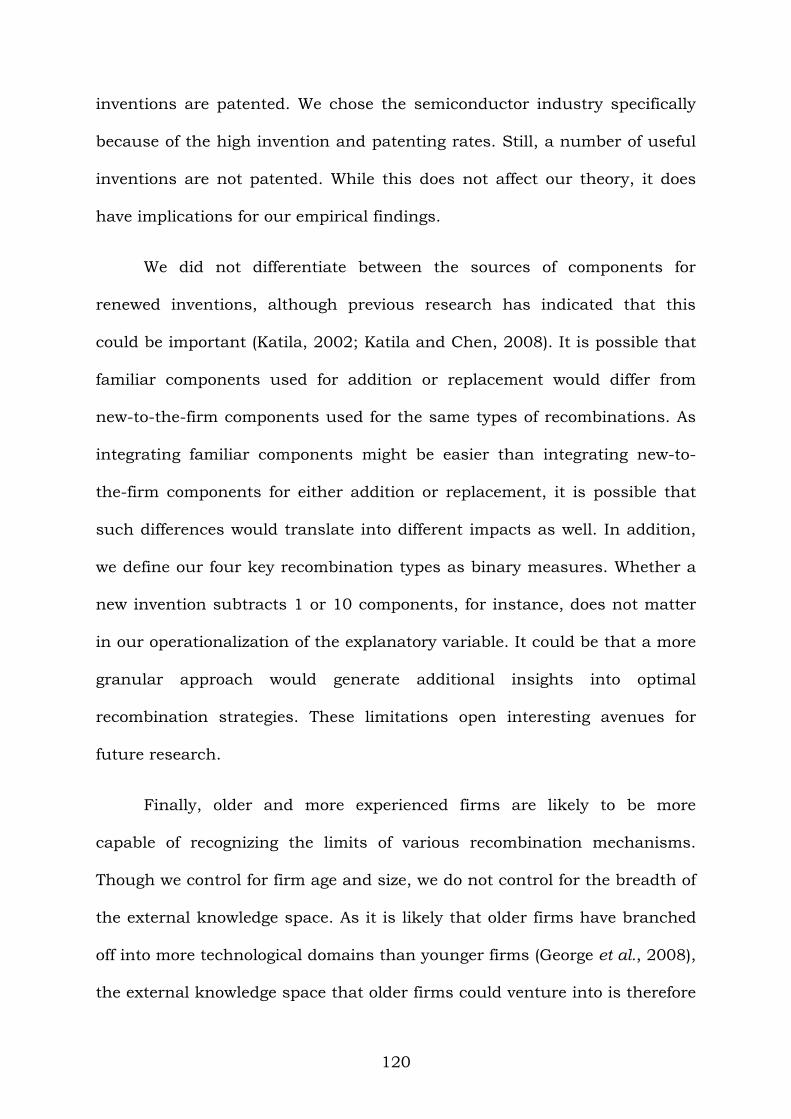
120
inventions are patented. We chose the semiconductor industry specifically
because of the high invention and patenting rates. Still, a number of useful
inventions are not patented. While this does not affect our theory, it does
have implications for our empirical findings.
We did not differentiate between the sources of components for
renewed inventions, although previous research has indicated that this
could be important (Katila, 2002; Katila and Chen, 2008). It is possible that
familiar components used for addition or replacement would differ from
new-to-the-firm components used for the same types of recombinations. As
integrating familiar components might be easier than integrating new-to-
the-firm components for either addition or replacement, it is possible that
such differences would translate into different impacts as well. In addition,
we define our four key recombination types as binary measures. Whether a
new invention subtracts 1 or 10 components, for instance, does not matter
in our operationalization of the explanatory variable. It could be that a more
granular approach would generate additional insights into optimal
recombination strategies. These limitations open interesting avenues for
future research.
Finally, older and more experienced firms are likely to be more
capable of recognizing the limits of various recombination mechanisms.
Though we control for firm age and size, we do not control for the breadth of
the external knowledge space. As it is likely that older firms have branched
off into more technological domains than younger firms (George et al., 2008),
the external knowledge space that older firms could venture into is therefore
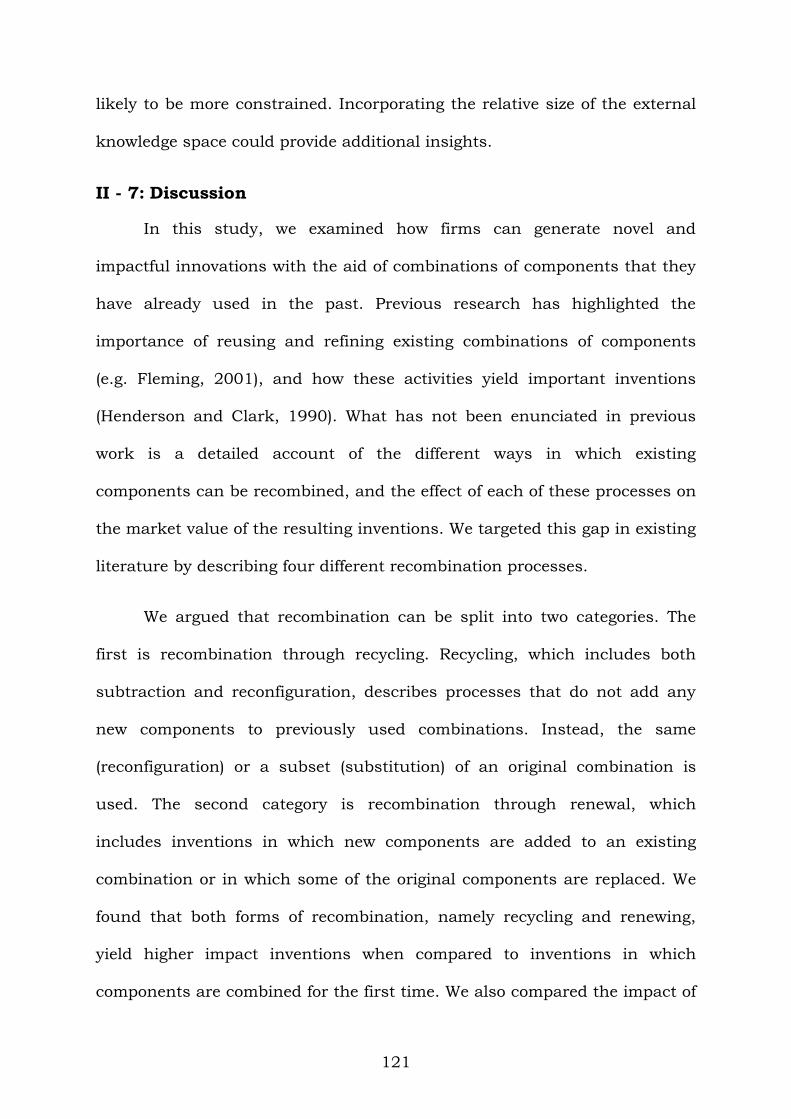
121
likely to be more constrained. Incorporating the relative size of the external
knowledge space could provide additional insights.
II - 7: Discussion
In this study, we examined how firms can generate novel and
impactful innovations with the aid of combinations of components that they
have already used in the past. Previous research has highlighted the
importance of reusing and refining existing combinations of components
(e.g. Fleming, 2001), and how these activities yield important inventions
(Henderson and Clark, 1990). What has not been enunciated in previous
work is a detailed account of the different ways in which existing
components can be recombined, and the effect of each of these processes on
the market value of the resulting inventions. We targeted this gap in existing
literature by describing four different recombination processes.
We argued that recombination can be split into two categories. The
first is recombination through recycling. Recycling, which includes both
subtraction and reconfiguration, describes processes that do not add any
new components to previously used combinations. Instead, the same
(reconfiguration) or a subset (substitution) of an original combination is
used. The second category is recombination through renewal, which
includes inventions in which new components are added to an existing
combination or in which some of the original components are replaced. We
found that both forms of recombination, namely recycling and renewing,
yield higher impact inventions when compared to inventions in which
components are combined for the first time. We also compared the impact of
122
recycled inventions to renewed inventions, and found that the impact of
inventions resulting from the former process is on average lower.
Next, we examined how two factors can deter or enhance a firm’s
recombination efforts. The first of these is the temporal lapse between the
current combination and the last time that combination was used in the
firm. We found that the impact of invention suffers as the amount of time
elapsed between an invention and its predecessor increases; an effect which
is more pronounced for renewed inventions. The second factor we
considered was the extent of external search, which was found to have a
positive effect on the impact of recombinative inventions. We also compared
the effect across the different recombination categories, and found that
external search has a larger positive effect on recycled inventions than on
renewed ones.
Overall, our findings indicate that firms recombine technological
knowledge components in different ways and with different likelihood of
success. Yet, as is often the case when peeking into a black box, what you
find raises more questions than it provides answers. Like most previous
quantitative research, we have implicitly assumed that the recombination
process has zero duration. The invention occurs simply at the moment (even
year) of the patent application. The entire process of search that happens
before that date has been condensed into a single moment in time.
Moreover, while our findings on external search are significant and
defensible, one could argue that external search is either antecedent to or
concurrent with the recombination process and that it could both shape the
123
combination of knowledge components as well as affect how they are
integrated. Once again, this suggests that while we somewhat opened up the
black box of recombination by looking at various types of recombinations
and their innovative impact, we have at best lifted the lid of the underlying
processes that drive the production of knowledge and the creation of
successful new ideas, embodied in products or patents.
The final chapter in this dissertation looks to theoretically address
some of these shortcomings of quantitative empirical research. In it, I
develop a model of invention as a process of escalating recombinant search.
It tackles some of the shortcomings of both the first and second chapter by
acknowledging both collaboration and component recombination as integral
aspects of the process of invention. The final chapter however is conceptual
and theoretical and the emerging ideas developed in this chapter have not
been submitted to empirical testing. It is my hope that it will lay the
foundations for future research on recombination and collaboration in
invention.
124
III – CHAPTER THREE: INVENTION AS A PROCESS OF ESCALATING RECOMBINANT
SEARCH
Every act is a source of knowledge to others (Lachman, 1956, p. 32)
III - 1: Introduction
Invention is fundamentally a process of knowledge integration and
recombination that, if successful, results in the production of new knowledge
(Nelson and Winter, 1982). While some have argued that invention cannot be
modelled at all, Magee opined that the “theoretical study of creativity and
invention is possible because what it aims to model is the process, not the fruit,
of idea generation” (2005, p. 31). In this chapter, I propose an evolutionary
perspective of knowledge recombination in which individuals exploit early stage
ideas or “half-hunches” (Johnson, 2011), by recombining them with other ideas
extracted from a socially-constructed and technologically constrained
knowledge structure through both object search (search for information out
there) as well as holder search (search for knowledge holders who become
integrated in the inventive unit). I explicate these two forms of search because I
contend both engender different challenges and because their distinction has
been subsumed in the literature. I posit that object and holder search are
mutually reinforcing, complementary, and iterative processes, and that the
search for knowledge holders is an integral yet often neglected part of the
search for information.
Because valuable knowledge is often controlled by individuals and
because that knowledge is not perfectly appropriable (in that an individual
125
loses her monopolistic power over the use of the information when it is
communicated or articulated), information holders often need to be integrated
within the organization or the inventive unit in order to access the desired
information (Arrow, 1962; Grant, 1996). This inclusion of the information
holder in the inventive team is necessary because of the indivisibility of the
information and the person holding it. As argued by Arrow (1962, p. 615): “No
amount of legal protection can make a thoroughly appropriable commodity of
something so intangible as information”. Thus the combination of increasingly
specialized individuals and indivisible and imperfectly appropriable knowledge
provide the building blocks of an evolutionary process in which the unit of
invention escalates over time through search. This evolutionary escalation
process is accompanied by the emergence of recombination problems
associated with knowledge articulation, flow, and absorption.
This escalation process forces us to reconsider some commonly held
implicit assumptions in the literature. Following in the footsteps of the multi-
level study conducted by Rothaermel and Hess (2007), I contend that the focal
level of analysis is not independent of other potential levels of analysis and that
not all the variance of outcomes is attributable to a single focal level (with the
other levels assumed to be largely homogenous). Thus, the escalation process
forces us to recognise that the unit of invention evolves over time. Rothaermel
and Hess “not only demonstrate heterogeneity across levels of analysis, but also
interdependence with alternate levels of analysis” (2007, p. 914). Because I
start at the individual level, the evolutionary perspective offered here follows
calls towards more attention to micro-foundations of dynamic capabilities and
126
of strategy research in general (Abell, Felin, and Foss, 2008; Barney and Felin,
2013; Coff and Kryscynski, 2011; Felin and Foss, 2005; Felin et al., 2012). The
second part of chapter one also responded to this call.
This chapter is split into five sections. I first unpack the search construct
focusing on three problematic assumptions that are implicit in much of the
search literature, namely the stability of the searching unit, the equivalence of
what is found with what is searched, and the lack of agency attributed to the
objects of search. I conclude that invention should be understood as a process
of escalating recombinant search in which the evolution of the inventive unit is
determined by search for both information and knowledge holders in a
recursive manner. This section ends with an overview of the argumentation of
the next three sections and depicts a model representation of the process of
escalating recombinant search. I then go on to discuss some frequent problems
associated with recombination and the inventive process more generally,
focusing on knowledge articulation, flow, and absorption.
In the next part, I tie these three recombination problems to different
units of analysis. I postulate that articulation, flow, and absorption will create
higher or lower barriers to invention depending on the unit of analysis, and
review some recent findings regarding barriers to individual, team, department,
firm, alliance, and open invention. Then, I integrate the previous three parts
into a framework on inventive search. I propose that both the knowledge
structure (i.e. the multidimensional landscape that reflects the socially
constructed knowledge architecture) and idiosyncratic ingression costs (the
costs faced by the evolving unit of invention to navigate the knowledge
127
structure and access specific pieces of information) will define how, where, and
when an inventive unit searches and how it evolves throughout the search
process. I summarize those aspects that make the knowledge structure
intrinsically more or less complex and pay attention to the relationship between
knowledge flow, knowledge absorption, and ingression costs.
The overarching proposition is that those facing low ingression costs,
relative to others who aim to solve similar problems, are more likely to come up
with high quality solutions, will be able to move faster, and will create more
consistent inventions (lower outcome variability). However, to achieve
breakthroughs, inventive units will need the audacity to navigate the complex
knowledge structure and overcome high ingression costs, and combine these
efforts with knowledge they can access at lower ingression costs.
III - 2: Deconstructing Search
Invention requires the recombination of familiar knowledge to create new
products or processes that sometimes make current capabilities and skills
obsolete; something known as creative destruction (Schumpeter, 1942). Thus,
in the course of economic progress, “new knowledge is acquired gradually…
often painfully, and always at some cost” (Lachman, 1956, p. 28). However,
before knowledge can be integrated and recombined it must be located, which
explains why behavioural theorists and evolutionary economists have described
R&D projects and other inventive efforts as search processes (Cyert and March,
1963; Nelson and Winter, 1977; Nelson and Winter, 1982). In general, “the
thrust of much of the literature is that organizations will initiate focused search
when (1) a problem is recognized and (2) some heuristic assessment of the
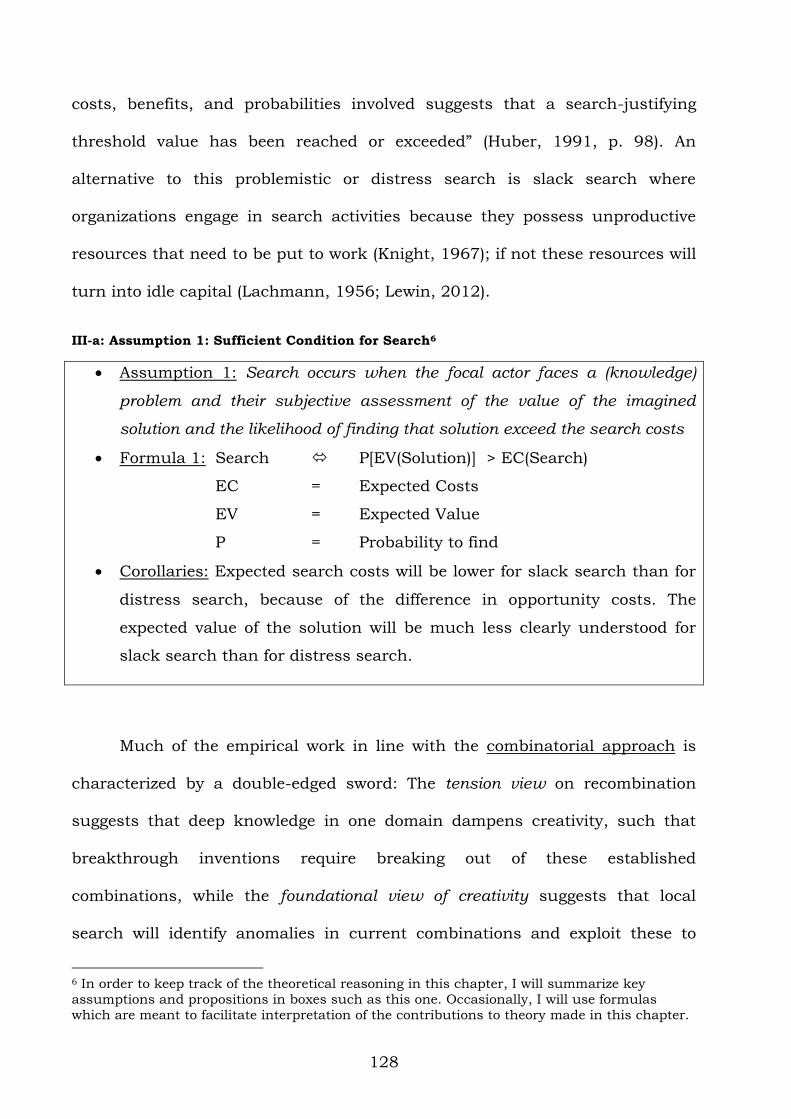
128
costs, benefits, and probabilities involved suggests that a search-justifying
threshold value has been reached or exceeded” (Huber, 1991, p. 98). An
alternative to this problemistic or distress search is slack search where
organizations engage in search activities because they possess unproductive
resources that need to be put to work (Knight, 1967); if not these resources will
turn into idle capital (Lachmann, 1956; Lewin, 2012).
III-a: Assumption 1: Sufficient Condition for Search6
Assumption 1: Search occurs when the focal actor faces a (knowledge)
problem and their subjective assessment of the value of the imagined
solution and the likelihood of finding that solution exceed the search costs
Formula 1: Search P[EV(Solution)] > EC(Search)
EC = Expected Costs
EV = Expected Value
P = Probability to find
Corollaries: Expected search costs will be lower for slack search than for
distress search, because of the difference in opportunity costs. The
expected value of the solution will be much less clearly understood for
slack search than for distress search.
Much of the empirical work in line with the combinatorial approach is
characterized by a double-edged sword: The tension view on recombination
suggests that deep knowledge in one domain dampens creativity, such that
breakthrough inventions require breaking out of these established
combinations, while the foundational view of creativity suggests that local
search will identify anomalies in current combinations and exploit these to
6 In order to keep track of the theoretical reasoning in this chapter, I will summarize key
assumptions and propositions in boxes such as this one. Occasionally, I will use formulas
which are meant to facilitate interpretation of the contributions to theory made in this chapter.
129
produce breakthroughs (Kaplan and Vakili, 2014; Weisberg, 1999). A purely
combinatorial approach however downplays the inherent innovativeness of
reusing old ideas in different ways as it fails to identify a mechanism of how old
knowledge components get recycled into new ideas that can be fitted to other
components (Magee, 2005).
In this light, Katila and Ahuja (2002) find that moderate search depth
increases new product introductions because on the one hand, deep search
increases predictability, reduces the likelihood of errors, facilitates routine
development, and boosts the ability to identify valuable knowledge while on the
other hand, excessive depth can let the firm run against the technological
frontier and generates rigidity and competency traps. The debate as to whether
local (deep) or distant (broad / scope) search is more conducive to innovation
as well as how the age of sought knowledge affects innovation impact and
under which contingencies, is still open (e.g. Katila, 2002; Nerkar, 2003). In a
similar vein, in the second chapter, I found that inventions that build on
knowledge recombinations (familiar components) do better than those that
build on new-to-the-firm combinations and that those inventions that add new
components to familiar combinations have even higher impact. I also found
that building on old combinations negatively affects impact.
Besides the combinatorial perspective, the bounded rationality approach
propagated by most researchers interested in search depends on a poorly
understood search process that is assumed to be local, stochastic, and based
on routines (Magee, 2005). Nelson & Winter (1982) for instance argue that
“success in receiving and building on complex knowledge depends crucially on
130
access to the original recipe, which serves as a template” (p. 119 – 120). Some
argue scientific research (i.e. original recipe) serves as a map in the
combinatorial search process of inventors, because it eliminates fruitless paths
of research and exposes promising technological trajectories (Fleming and
Sorenson, 2004). Alternatively, having access to diverse problem-solving
techniques is argued to be an important source of coming up with new
solutions as well (Amabile, 1988). However, exactly how organizations or
individuals go about this search for knowledge components, templates, or
recipes remains rather poorly understood.
Although more research into the mechanisms that inspire creativity is
undoubtedly needed, I leave that to those on the cross-section of psychology
and management (e.g. Csikszentmihalyi and his concept of ‘flow’). My focus is
on three reasons why our understanding of inventive search is still partial at
best, despite many decades of research: our focus on search as an outcome,
rather than as a process; our attention to search for information, rather than
search for knowledge holders; and our implicit assumption that the searcher or
searching unit does not evolve as a direct consequence of the search process.
III - 2.1: How? Search as Process
Within the managerial literature, the process of recombinant search for
invention remains understudied. Despite some recent empirical contributions
(Anand, Gardner, and Morris, 2007; MacAulay, Steen, and Kastelle, 2014),
most of what we know about search processes stems either from the
foundational works (Cyert and March, 1963; Nelson and Winter, 1982), from
work on information seeking (e.g. Kuhlthau, 1991), or from historical accounts
131
of individual inventors (Gorman and Carlson, 1990; Maggitti, Smith, and
Katila, 2013). Gorman and Carlson (1990) for instance described invention as a
process in which mental models are combined with mechanical representations
that serve as tangible artefacts of (a part of) the inventor’s mental model. These
mental models can both constrain or enable invention as the cases of Reis, Bell,
and Edison regarding the invention of the telephone show (Gorman and
Carlson, 1990). Maggitti et al. (2013) state that “while research in the
organizations literature has focused on the search terrain, search context, and
the importance of search at the organizational level, there has been less
attention to the actual search processes and the underlying routines that
organizations or individual organization members use to search” (p. 91, italics
added).
The scarcity of work on search as a process is overshadowed by the
abundance of work in which search is used and operationalized as an outcome
of an undisclosed (assumed) process. Quantitative research that uses patent or
network data as proxies for search falls within this outcome-oriented branch,
as does chapter two (Ahuja and Katila, 2001; Fleming, 2001; Fleming and
Sorenson, 2001, 2004; George et al., 2008; Katila, 2002; Katila and Ahuja,
2002). Not only are citations often added by USPTO or EPO officials, so that it
is hard to imply active knowledge search on behalf of the focal organization
(Giuri et al., 2007), but even if all cited patents are indeed within the knowledge
base of the organization, they clearly represent a found body of knowledge.
More generally, while the common meaning of the word search is ‘try to
find something by looking or otherwise seeking carefully and thoroughly’
132
(Google definitions), what most empirical research on search focuses on is not
search per se but what has been found. Whereas to find is likely to require
antecedent search (or to be open to serendipitous discovery (Denrell, Fang, and
Winter, 2003)), it is likely that much search behaviour (e.g. search for
information embodied in patents, phone calls made to knowledge holders,
informal conversations in the hallway that might lead you to take a new look at
something, or suggestions received by colleagues over lunch) is not necessarily
seen as direct contributions to the invention.
Consider the process of writing an academic paper. No matter how much
we try to acknowledge ideas from those upon whose work we build, we can
hardly say that our extensive academic referencing is in any way a complete
reflection of the search process we engage in to bring a manuscript into
existence. Many things we searched for did not pan out, some citations are
added pro forma, and other information sources are forgotten or omitted. Thus,
talking about ‘search’ when using only what is found, denies the existence of
failed efforts, inefficient search processes, or erroneous findings that get
reconsidered over time. The literature on search thus has a clear success bias.
III - 2.2: What/Who am I Looking for? Object Search or Holder Search
For as far as I know, the search literature has not clearly differentiated
between what I will call object search7 and holder search. Object search is any
form of search directed towards information or other resources that can be
extracted from a knowledge repository without direct consent from or prolonged
7 Object search is more commonly known as information search but I chose to avoid that
denominator because of the ambiguity around the meaning of the word information in the
context of the knowledge-based view.
133
involvement with a knowledge owner. Thus, information that is publicly
available or can be accessed via the internet, libraries, or via patenting agencies
in codified form stems from object search. Kuhlthau (1990, p. 361) defines the
process of object search as “the user’s constructive activity of finding meaning
from information in order to extend his or her state of knowledge on a
particular problem or topic” and as a form of “sense-making within a personal
frame of reference”. Importantly, object search does not change the searching
entity.
Holder search on the other hand is the search for a partner (be it an
individual within the firm, an independent researcher, or another organization)
who might join the invention process or who at least has discretion with
regards to her willingness to share information. This type of search often leads
to escalation in that the entity involved in the invention process evolves: from
an individual, to a team, to a firm, to an alliance, and potentially to a form of
open innovation. In most cases, holder search is inevitable: “the specificity of
the individual knowledge structure compels inter-personal interactions”
(Ancori, Bureth, and Cohendet, 2000, p. 275), and because of the
appropriability concerns, both within and between firms, this interaction often
results in some form of integration (Arrow, 1962; Grant, 1996). Thus, object
search is about enlarging the information and knowledge available to the unit
of invention, while holder search is about interacting with others who have
agency, and about enlarging the unit itself.
In the context of entrepreneurship, attention has been paid to holder
search. Ruef, Aldrich, and Carter (2003) found that homophily and strong
134
network ties are predictors of entrepreneurial team formation and Aldrich and
Kim (2007) underlined the importance of familiarity and local clusters in
finding entrepreneurial team members. Clarysse and Moray (2004) discuss how
the required qualities of a CEO for an entrepreneurial team evolve over time so
that changes in strategic needs drive turnover in nascent entrepreneurial
teams.
While these examples are indicative of local search tendencies and
exhibit the importance of team fit, they also exemplify two fundamental
differences between object and holder search: Firstly, holder search is always
susceptible to the agency of the holder because not everyone I want to work
with wants to work with me (Gale and Shapley, 1962; Jovanovic, 1979;
Mitsuhashi and Greve, 2009). Holder search is thus a multi-agent assignment
game in which collaborations are explicitly negotiated between partners that
bring complementary resources and skills to the table (Mindruta, 2013).
Secondly, while both object and holder search can result in the need for
unlearning (Hedberg, 1981 in Huber, 1991) or in the creative destruction of
capabilities and skills that are no longer useful (Schumpeter, 1942), only holder
search inherently includes ‘baggage’. By this I mean that the integration of a
specific knowledge holder in an entrepreneurial team or inventive unit is a
more challenging exercise than fitting a new piece of knowledge into an existing
puzzle. The integration of a new individual changes the puzzle as the person
comes with additional, potentially undesirable, knowledge, habits, skills,
routines, and mental maps that can cause frictions.
135
Thus, while object search is an acquisition process where you get the
knowledge you want or less (e.g. if the knowledge is poorly coded, very tacit, or
if you lack absorptive capacity to understand it), holder search is a negotiation
process in which you almost always get more than you bargained for. Hence,
object search is strictly about knowledge domain fit, while holder search is
about total fit, including soft aspects that are outside the focal knowledge
domain. Holder search will thus relate to problems commonly studied in the
invention/innovation literature and in the theory of the firm around mutual
knowledge (Kotha et al., 2013), opportunism and goal alignment (Williamson,
1975) and resource access (Eisenhardt and Schoonhoven, 1996).
In the behavioural theory of the firm, it is acknowledged that boundedly
rational individuals search for knowledge to “move the bounds of their
rationality” (Foss, 2009, p. 16). However, if Grant and Baden-Fuller (2004) are
correct that due to the increasing marginal costs of knowledge integration,
alliancing is less about knowledge acquisition than about knowledge access, we
must acknowledge that search can be about both adding brain power
(acquiring knowledge) as well as adding brains (accessing knowledge). Both
processes are fundamental to invention.
Moreover, invention is inherently a risky endeavour with uncertain
outcomes for increasingly specialised organizations and individuals (Arrow,
1962; Cyert and March, 1963; March and Shapira, 1987). It is thus not
surprising that when it comes to new product development or other inventive
effort, many firms are not able to keep up with the ever increasing complexity,
speed of technological progress and high dispersion of knowledge, so that they
136
“depend on external innovation partners to build products within acceptable
budgets, timelines, and financial risk” (Kotha and Srikanth, 2013, p. 41).
Increasing the knowledge stock by integrating new members is known in
the learning literature as grafting (Huber, 1991). This grafting is most
commonly studied from an organizational perspective with reference to the
establishment of mergers, joint ventures, or other types of interorganizational
relationships. Somewhat surprisingly, the organizational literature on partner
selection has rarely explicated that selection requires antecedent search but
has focused on (static) focal firm, interfirm, partner firm, institutional, and
network characteristics (Hitt et al., 2004; Hitt et al., 2000; Li et al., 2008;
Parmigiani and Rivera-Santos, 2011; Shah and Swaminathan, 2008). Only
recently the management literature has begun to acknowledge that some kind
of matching (Mitsuhashi & Greve, 2009; Mindruta, 2013) needs to occur
because the partner has agency (unless perhaps in the case of hostile
takeovers). Rothaermel and Boeker (2008) for instance find that both
complementarities and similarities increase the probability of alliance formation
between pharmaceutical and biotech firms. Such findings lead Sorenson and
Stuart (2007) to argue that much research on partner choice antecedents
suffers from selection bias because partner selection requires the partner’s
approval. Thus, holder search requires different skills than object search
because the potential partner needs to be convinced, or courted (Graebner and
Eisenhardt, 2004).
137
III-b, Assumption 2: Costs for Object and Holder Search
The previous discussion implies that object and holder search are both crucial
in the search for knowledge not controlled by the inventive unit. Because both
processes require different skills, the costs associated with them are different.
Therefore:
Assumption 2: The costs associated with object search (the search for
information out there) are determined by the required search effort,
whereas the costs associated with search for knowledge holders are more
complex
Formula 2: EC(Search) = EC(Object Search) + EC(Holder Search)
When a knowledge holder gets included in the inventing unit (escalation), part
of the value of a successful invention will be appropriated by that holder, either
in the form of direct monetary rewards that need to be split within the team, or
in the form of appreciation and career prospects, or according to negotiated
agreements in the case of a multi-organizational team.
Thus, the expected costs of holder search do include 1) the effort of finding her,
2) the potential difficulties of matching with her, 3) the coordination difficulties
associated with escalation (see III – 3.2 and III – 4), and 4) the appropriation of
part of the value of the future solution by the holder.
III - 2.3: Who am I? Defining the Searcher
Most of what we know about search is rooted in either organizational
learning theory or behavioural theory of the firm and therefore it is chiefly
related to organizational search. Cyert and March (1963) and Knight (1967)
discussed search as a consequence of either slack or distress. Later research
has complemented these organizational perspectives by investigating
organizational aspirations and learning from failure (Baum and Dahlin, 2007),
and how aspirations influence risk taking in partner selection (Baum et al.,
2005). The general idea behind these studies is that organizations will adapt
138
their search behaviour (e.g. the balance between exploitation and exploration
(March, 1991)), when performance deviates from socially or historically
determined aspirations. Much of these aspiration studies are rooted in
individual psychology constructs that are attributed to the organization.
Mathematical models of managerial (i.e. individual) perspectives on risk-taking
behaviour in relation to aspirations have for instance been used to discuss
organizational behaviour (March and Shapira, 1987; Miller and Chen, 2004).
When it comes to environmental scanning (another form of search), both
macro (organizational) and micro (individual) studies have been conducted. The
former focus chiefly on “enhancing strategic management effectiveness”,
whereas micro studies are mainly interested in “boundary-spanning personnel
as sensors of the organization’s environment” (Huber, 1991, p. 97 – 98). In
general however, there is a dearth of attention to studies that explicate how
individual search unfolds (Maggitti et al., 2013). This omission has hardly been
addressed over the last 25 years. While alliances have been construed as a
means to overcome organizational tendencies to search locally (Rosenkopf and
Almeida, 2003), studies of how alliances or other interorganizational
relationships search and whether their search behaviour differs from
organizations are to my knowledge absent from the literature.
The same goes for teams. Despite increasing recognition that teams form
the core inventive unit in the knowledge economy (Jones, 2009; Wuchty, Jones,
and Uzzi, 2007) and despite recent experimental findings that team formation
of scientists in the same institutional environment is still subject to
considerable frictions (Boudreau et al., 2014), how teams search and how
139
individuals form inventive teams remains poorly understood. Boudreau et al.
(2014) even suggested that the “formation and execution of collaborations may
be considered as representing altogether different kinds of coordination
problems – one of joint production and the other of matching” (p. 4-5). I will
further develop and extend this notion under section III-3.2
The lack of attention paid to individual, team, and alliance search and
the even scarcer attention paid to search processes at different levels of
analysis is surprising. More than 50 years ago, Arrow already argued that
“there is really no need for the firm to be the fundamental unit of organization
in invention” (Arrow, 1962, p. 624). Never has that statement rung more true
than now that the costs of executing collaborations have been lowered
significantly by technological progress (Agrawal and Goldfarb, 2008; Ding et al.,
2010). While this is undoubtedly so, tie formation remains subject to
considerable individual, cultural, and institutional barriers (Boudreau et al.,
2014; Vissa, 2011). Importantly, most research on the search process has
assumed a stable searching unit. I however submit that the searching unit
escalates as a direct consequence of the search process.
III - 2.4: The Recombinant Search Process in Time
The previous three subsections can be summarized as follows: while
significant attention has been paid to the concept of search ever since the
seminal work of Cyert and March (1963), we still know rather little about 1) the
evolution of the searching unit over time8, 2) the actual process of search
8 An exception is the process study of practice embedding in consulting firms, which will be discussed later in some detail (Anand et al., 2007)
140
conducted by different units of analysis9, and 3) the complicated relationship
between search for knowledge that is “out there for the taking” versus search
for knowledge holders who need to be integrated in the inventive unit to some
degree. Given that search for knowledge requires both accessing of information
and matching with other individuals, invention can understood as a search
process in which the inventive unit escalates over time through internal and
potentially external grafting.
For instance, Raymond Kurzweil, inventor of the synthesizer, stated that
“projects very quickly get complex enough that different people’s expertise is
required” (in Maggitti et al., 2013, p95). It is interesting to note that Maggitti et
al. (2013) did not include the escalation of the inventive unit, from the
individual to a team or even to an entire organization, as an essential element
of the invention process. While ideas indeed “occur first in the minds of
individuals” (Magee, 2005, p. 31), often for an idea to materialize it needs to
enter spaces where ideas can mingle and interact with half-hunches of other
people so that something truly novel can be created (Johnson, 2011). When
talking about the conceptual difference between search for solutions and
search for information about existing solutions, Huber (1991, p. 99) recognised
that “various forms of search might have different antecedents or might be
carried out by different types of organizational units or with different types of
search processes”. While this falls short of saying that the searching inventive
unit is likely to evolve over time, it does add weight to the idea that how and
9 See MacAulay et al. (2014) who make this point in their discussion on search behaviour when
the local environment is not benign
141
where an inventing unit searches is dependent on the type of knowledge one
wants to acquire and some idiosyncratic aspects of the inventing unit.
In his influential contribution on theory-building, Whetten (1989)
suggested that good theory contains an explanation of what (the focal
variables), how (the relations and causality between the factors), why
(underlying dynamics), and who, where, and when (boundaries to the theory’s
generalizability). It is however not self-evident that when merely provides
boundary conditions to the theoretical development: time may be a crucial part
of the theoretical explanation (George and Jones, 2000). My deconstruction of
search as a construct cannot be complete as long as the time-component is
neglected. Consider patent data based studies such as the one presented in
chapter two. Causality in such research is based on rather simplistic time
dynamics: the invention occurs at time t = 0 and the impact of the invention is
measured across a future time period, controlling for year effects. Moderation
and mediation can be included if the variable happens before, simultaneous
with, or after the invention but before the response variable ends. Yet, the
alleged moment of invention is dependent on many firm-specific factors (see
e.g. Criscuelo, Sharapov, and Alexy (2014)). Additionally, that time-stamp does
not capture what happened before, it provides merely a successful end-point.
Thus, the implicit assumption that invention happens at a specific instant in
time downplays the importance of the antecedent process. Mitchell and James
(2001) suggest in this regard that most empirical research fails to appropriately
acknowledge that independent and response variables have durations and
might change over time.
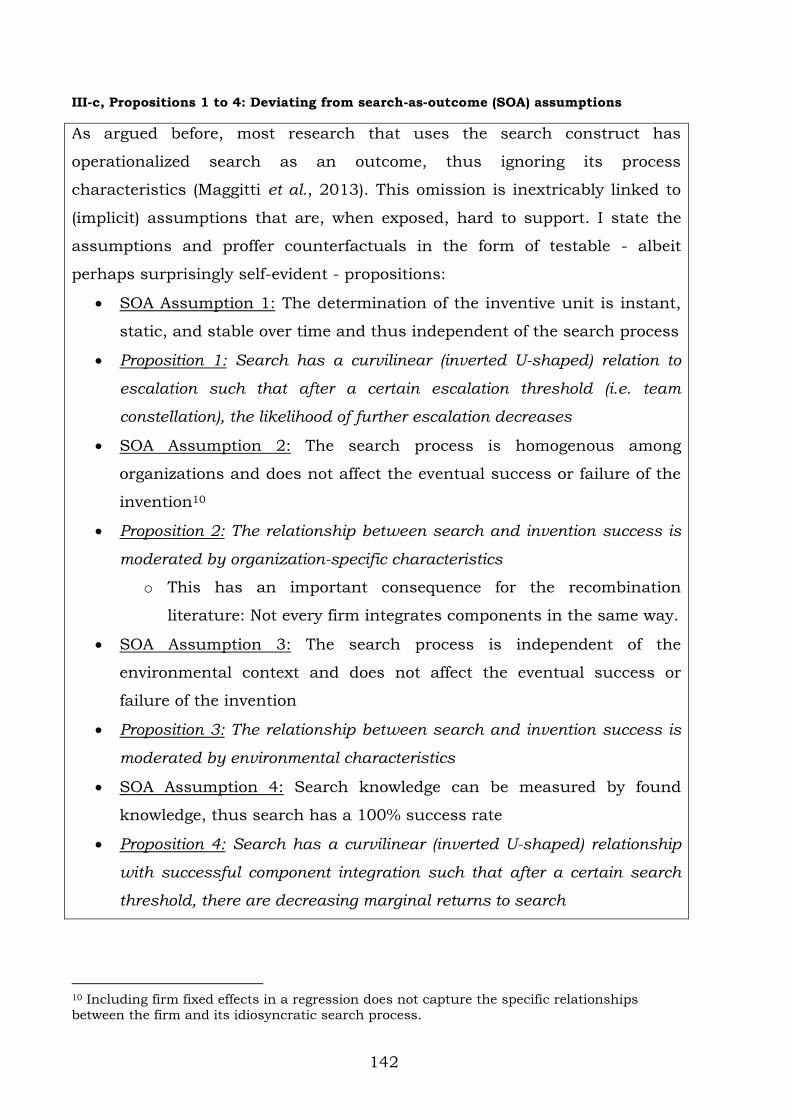
142
III-c, Propositions 1 to 4: Deviating from search-as-outcome (SOA) assumptions
As argued before, most research that uses the search construct has
operationalized search as an outcome, thus ignoring its process
characteristics (Maggitti et al., 2013). This omission is inextricably linked to
(implicit) assumptions that are, when exposed, hard to support. I state the
assumptions and proffer counterfactuals in the form of testable - albeit
perhaps surprisingly self-evident - propositions:
SOA Assumption 1: The determination of the inventive unit is instant,
static, and stable over time and thus independent of the search process
Proposition 1: Search has a curvilinear (inverted U-shaped) relation to
escalation such that after a certain escalation threshold (i.e. team
constellation), the likelihood of further escalation decreases
SOA Assumption 2: The search process is homogenous among
organizations and does not affect the eventual success or failure of the
invention10
Proposition 2: The relationship between search and invention success is
moderated by organization-specific characteristics
o This has an important consequence for the recombination
literature: Not every firm integrates components in the same way.
SOA Assumption 3: The search process is independent of the
environmental context and does not affect the eventual success or
failure of the invention
Proposition 3: The relationship between search and invention success is
moderated by environmental characteristics
SOA Assumption 4: Search knowledge can be measured by found
knowledge, thus search has a 100% success rate
Proposition 4: Search has a curvilinear (inverted U-shaped) relationship
with successful component integration such that after a certain search
threshold, there are decreasing marginal returns to search
10 Including firm fixed effects in a regression does not capture the specific relationships
between the firm and its idiosyncratic search process.
143
When discussing the net value of collaborations, Singh and Fleming
(2010, p. 53) ask themselves “would a particular set of inventors be more likely
to invent a breakthrough if they collaborated from the start or if they worked
alone and then pooled their efforts at the end”? The authors emphasize that
“this question strikes as particularly important for future work, both from a
theoretical and a normative perspective” (p. 53) and suggest that for instance
administrative costs of collaboration could influence the optimal timing of
starting to work together. The process model I propose aims to shed some light
on this important question.
Mitchell and James (2001) argue that ignoring time becomes more
problematic when the underlying dynamics reflect “cyclical recursive causation”
(p. 534) and that more difficult dynamics including mediation and moderation
can easily be conceived of but are rarely tested. Imagine the following scenario:
a single inventor attempts to recombine some components to create an
invention but fails. After his failure, he invites his colleague to help him. He
discusses with her his previous attempts and together they revisit the evidence.
Eventually, both manage to create the new invention. Hence, from an outcome
perspective, one could look at the result and argue that team size contributes
to innovation (Singh and Fleming, 2010). A step further would be to
acknowledge that team size will be mediated by the combined absorptive
capacity of the individuals (and some other dynamics that facilitate their
internal coordination). Yet, ignoring the process and the time the initial
inventor spent trying to recombine various components paints an erroneous
picture. Invention does not happen at a discrete moment in time!
144
A similar case can be made for moderation. Mitchell and James (2001)
suggest that when testing the hypothesis “X leads to Y moderated by Z”, X
should happen at time t0 while Y happens later at time t2. The moderator Z can
either be assumed to be relatively time-invariant and different for different
organizations, or to occur at time t0 or at any moment between t0 and t2. It is
even conceivable that the moderator itself ‘takes time’ or that the time at which
the moderator became time-invariant matters. Exactly when (and how long) Z
‘happens’ potentially affects the strength of the moderation. Consider a
moderation effect explored by George et al. (2008). These authors argue and
find that breadth of technological capabilities (“the sum of technical classes in
which a firm had applied for patents” (p. 1460)) moderates the effect of
insularity (“the degree to which prior innovations within the same technological
domain help generate new innovation” (p. 1458)) on the innovation impact of
the firm. While they do not explore it, it is conceivable that the timing at which
the firm patented different inventions in different technical classes would
influence the moderation. Take an extreme example in which three firms score
exactly the same on the moderator, but one firm patented all those inventions
at least 10 years, ago, another one has consistently patented in many of those
classes over the last 10 years, and the third one has patented in all those
classes exactly one year ago. I would expect different results depending on the
timing of the moderator.
In order to develop my process model, I simplistically stylize the final
objective of the invention process as inventive success (an invention has been
made) or inventive failure (the search process is halted before an invention is
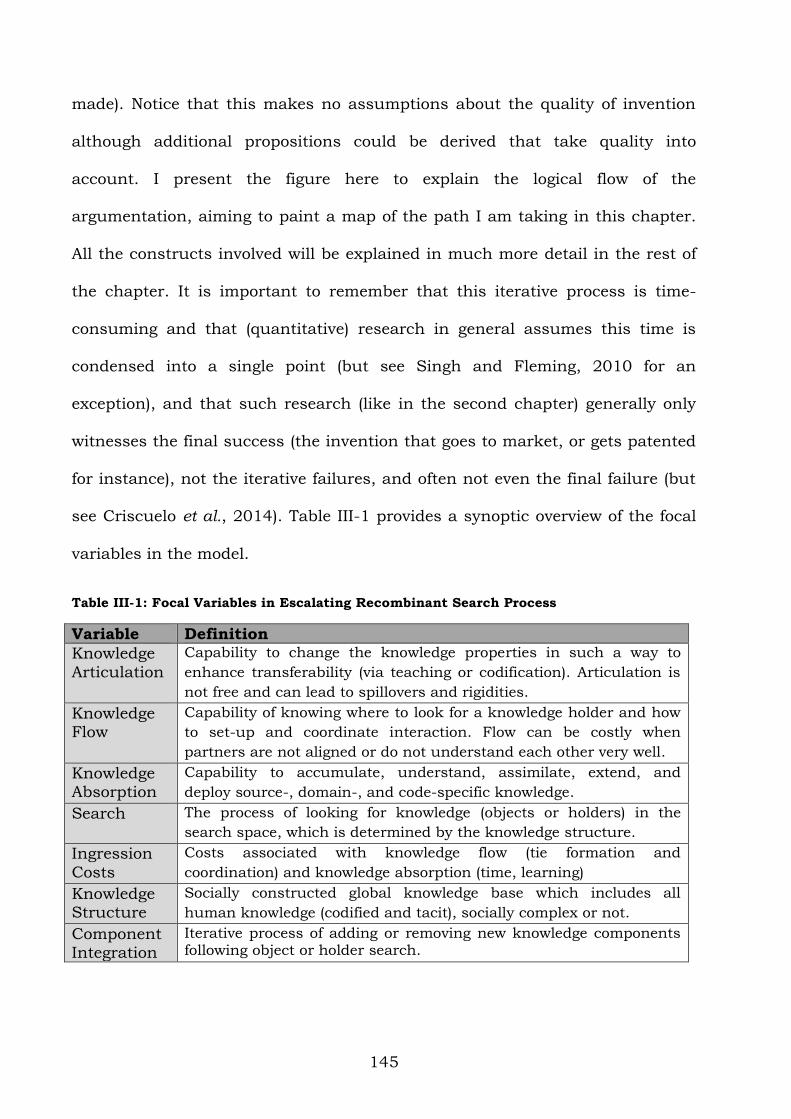
145
made). Notice that this makes no assumptions about the quality of invention
although additional propositions could be derived that take quality into
account. I present the figure here to explain the logical flow of the
argumentation, aiming to paint a map of the path I am taking in this chapter.
All the constructs involved will be explained in much more detail in the rest of
the chapter. It is important to remember that this iterative process is time-
consuming and that (quantitative) research in general assumes this time is
condensed into a single point (but see Singh and Fleming, 2010 for an
exception), and that such research (like in the second chapter) generally only
witnesses the final success (the invention that goes to market, or gets patented
for instance), not the iterative failures, and often not even the final failure (but
see Criscuelo et al., 2014). Table III-1 provides a synoptic overview of the focal
variables in the model.
Table III-1: Focal Variables in Escalating Recombinant Search Process
Variable Definition
Knowledge
Articulation
Capability to change the knowledge properties in such a way to
enhance transferability (via teaching or codification). Articulation is
not free and can lead to spillovers and rigidities.
Knowledge Flow
Capability of knowing where to look for a knowledge holder and how
to set-up and coordinate interaction. Flow can be costly when
partners are not aligned or do not understand each other very well.
Knowledge Absorption
Capability to accumulate, understand, assimilate, extend, and
deploy source-, domain-, and code-specific knowledge.
Search The process of looking for knowledge (objects or holders) in the
search space, which is determined by the knowledge structure.
Ingression
Costs
Costs associated with knowledge flow (tie formation and
coordination) and knowledge absorption (time, learning)
Knowledge Structure
Socially constructed global knowledge base which includes all
human knowledge (codified and tacit), socially complex or not.
Component Integration
Iterative process of adding or removing new knowledge components following object or holder search.
146
I propose the process unfolds as follows, (see figure III-1): The knowledge
base of the inventing unit (IU) consists of three capabilities: knowledge
articulation, knowledge flow, and knowledge absorption. These three capabilities
evolve with every escalation of the unit of invention and can turn into rigidities
or obstacles if the escalation is not managed properly. If a gap in the knowledge
base is uncovered (or if the IU has slack resources) the IU initiates a search
process (1). This search process has three potential outcomes. The IU finds an
object that contains the desired knowledge (2a), a knowledge holder (2b), or
does not find any useful answer and gets lost in the knowledge structure (2c).
The knowledge structure is the socially constructed knowledge base that
contains all knowledge that is embodied in objects (artefacts, components,
data, information, tools, capital) or holders (individuals who hold more or less
tacit information); see III-5.1.
If search is successful and the desired knowledge component is found,
the process evolves towards an iteration of component integration. This can be
the consequence of a found object that gets deployed (3a – the learning
trajectory) or of a knowledge holder who gets integrated with the inventing unit
and assists in the component integration (3b – escalation path). Which path
will be chosen will be discussed later. The quality with which the object is
deployed is determined by the IU’s capacity to absorb knowledge so that the
relationship between a found object and an integrated component is moderated
by knowledge absorption (4a). On the flip side, the quality of integration of a
new knowledge holder will be chiefly determined by the costs associated with
147
knowledge flow. These costs will thus moderate the relationship between a
found knowledge holder and component integration (4b).
The learning cycle will then contribute to the knowledge base by
increasing the brainpower of the existing IU (5a) whereas the escalation process
will lead to a new individual (or team/firm) joining the inventive search process
hence adding brains to the knowledge base. The model does not presume that
the entire knowledge base of the newly added holder gets neatly integrated with
the former IU. Information can be withheld or the new member can be
unfamiliar with the IU’s shared mental maps, so that limitations in mutual
knowledge or deliberate secrecy will limit the free transfer of knowledge (e.g.
Ahuja et al., 2008), hence the dotted line. Eventually, the iterative knowledge
component integration can result in either a failure or a success (6) which will
add new knowledge to the IU’s knowledge base (7).
The ingression costs are the idiosyncratic costs incurred by the escalating
inventing unit to be able to deploy a knowledge component; these can be the
consequence of learning (knowledge absorption) or escalation (knowledge flow)
(Grant and Baden-Fuller, 2004) – see III-5.2]. These two constructs are linked
to the unit of invention’s initial knowledge base. The reason why they are joined
here under one name is because they can basically serve as substitutes.
Knowledge about where to find knowledge holders presumes some awareness of
their knowledge and hence constitutes an element of what Postrel (2002, p.
305) calls trans-specialist understanding, whereas the knowledge absorption is
similar to Postrel’s concept of specialist capability. Both forms of knowledge can
serve as substitutes in the invention process (Postrel, 2002).
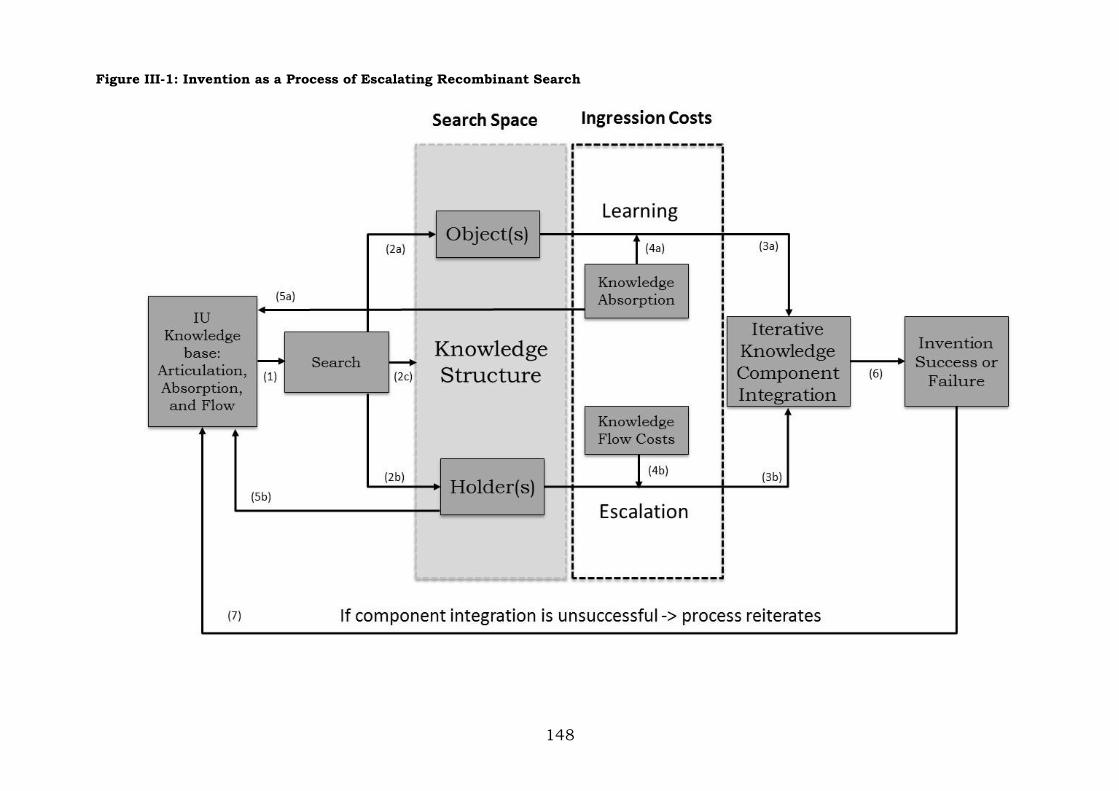
148
Figure III-1: Invention as a Process of Escalating Recombinant Search
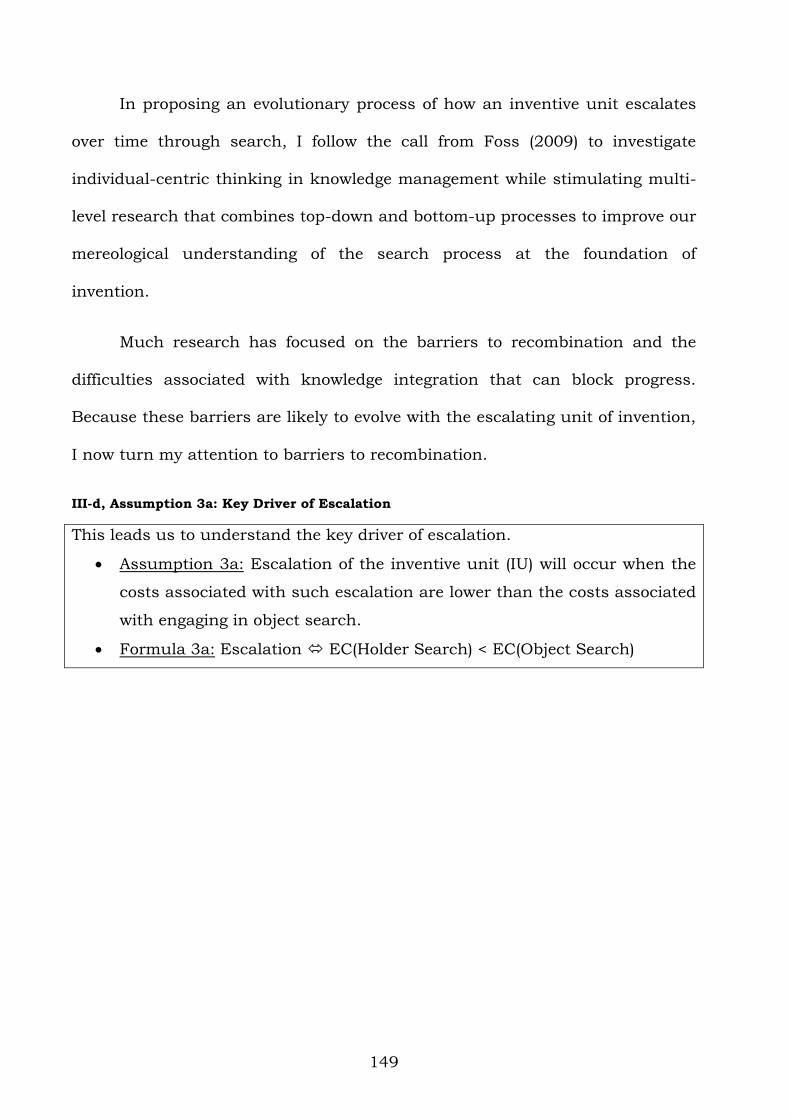
149
In proposing an evolutionary process of how an inventive unit escalates
over time through search, I follow the call from Foss (2009) to investigate
individual-centric thinking in knowledge management while stimulating multi-
level research that combines top-down and bottom-up processes to improve our
mereological understanding of the search process at the foundation of
invention.
Much research has focused on the barriers to recombination and the
difficulties associated with knowledge integration that can block progress.
Because these barriers are likely to evolve with the escalating unit of invention,
I now turn my attention to barriers to recombination.
III-d, Assumption 3a: Key Driver of Escalation
This leads us to understand the key driver of escalation.
Assumption 3a: Escalation of the inventive unit (IU) will occur when the
costs associated with such escalation are lower than the costs associated
with engaging in object search.
Formula 3a: Escalation EC(Holder Search) < EC(Object Search)
150
III-e, Assumption 3b and Propositions 5-7 regarding Marginal Value of Components
Yet, if we aim to understand the process of escalating recombinant search, we
need to acknowledge that decisions are not necessarily made based on a
holistic perspective of the outcome of the search process. Because search can
be erroneous and because recombination requires the complex integration of
various components, it may be more sensible to think in terms of adding new
knowledge components one by one. This then leads to the following assumption
and associated proposition:
Assumption 3b: The inventive unit will aim to minimize the marginal cost
of including a new knowledge component
Formula 3b: MV(component) > min(MC(object search), MC(holder search))
Proposition 5: Knowledge components will be added to an invention as
long as the marginal value of adding a new component exceeds the
marginal cost of object search or the marginal cost of holder search,
whichever is lower
When cycling back to the earlier mentioned distinction between slack and
distress search (Knight, 1967), it has been argued that for rather small and
negative deviations from aspiration levels, risk-taking tends to increase, while
for positive deviations the evidence is less clear-cut, especially around the
extremes (Hu et al., 2011; Leonard-Barton, 1992). If these findings around
deviations from historical and social aspirations are true, it seems likely that
risk-prone inventions will be those in which MV(component) is the determinant
of choice, while risk-averse inventions are those where the net marginal value is
minimal. Building on proposition 2, I propose:
Proposition 6: Inventive units engaging in risk-prone search will first add
the knowledge component with the highest marginal value or will add
many components at once, temporarily ignoring marginal costs
Proposition 7: Inventive units engaging in risk-averse search will first add
the knowledge component with the lowest net marginal value
151
III - 3: Knowledge-Based Theory and Barriers to Recombination
"The path of economic progress is strewn with the wreckage of failures.
Every business man knows this, but few economists" (Lachman, 1956, p.
46)
Knowledge-based theory (KBT) as advanced by Grant (1996) states that
the fundamental organizational task is knowledge application, whereas
knowledge creation is perceived to be more an individual task. The task of
management is essentially the facilitation of coordination that enables
knowledge integration. This task extends beyond organizational boundaries as
both organizational economics and organization theory recognize that
interorganizational relationships can be used to access valuable resources such
as knowledge through co-exploration and co-exploitation activities (Parmigiani
and Rivera-Santos, 2011).
There are three reasons why knowledge often needs to be integrated
within organizational boundaries (Grant, 1996). First, the transferability of
knowledge is impeded when knowledge is tacit rather than explicit or codified.
In the former case, teaching knowledge to others is significantly harder, which
is why knowledge might dissipate over time or vanish with employee turnover.
Thus codification decreases a firm’s dependence on unique knowledge holders
and facilitates the diffusion of knowledge within the organizational boundaries.
Second, the receipt of knowledge depends on the absorptive capacity of
the receiver (Cohen and Levinthal, 1990; Zahra and George, 2002). Even if
knowledge is not tacit, whether or not some other entity (individual, team,
division, or competitor) will be able to acquire the knowledge is subject to how
much the other already knows and how much more knowledge he/she is able
152
to digest and at which speed. In the alliance literature for instance it has been
argued that the faster learning partner can control and dominate the
relationship (Hamel, 1991).
Third, the appropriability of knowledge is problematic. If knowledge is
unique, its objective value can only be assessed once the knowledge has been
communicated which undermines the negotiation power of the knowledge
holder (Arrow, 1962; Inkpen and Beamish, 1997). The non-rivalrous and public
good nature of knowledge assures that everyone can resell it without losing it
after having been exposed to it (Grant, 1996). Thus, individuals have an
incentive to hold on to their knowledge to ensure or enhance their position
within the organization and to influence the allocation of knowledge rents in
their favour. This creates uncertainty under which resource value is subjective
(Kraaijenbrink, Spencer, and Groen, 2010; Schmidt and Keil, 2013), as
managers may be unable to form accurate expectations (Foss et al., 2008) or
are unable to adequately estimate the future value of a combination (Koruna,
2004). Such expectations or estimates are essentially driven by proprietary
information about the value creation potential of a resource. The more tacit the
knowledge, the more this proprietary information belongs to the knowledge
holder.
In a study of knowledge-based innovation, Anand et al. (2007) for
instance find that “owning” a new practice is a crucial determinant of career
potential in consulting firms. This is likely to negatively impact an
organization’s innovative performance and its capacity to extract value from
knowledge. The organization will only gain sustainable advantage from valuable
153
knowledge held by an individual if the organization possesses complementary
resources that increase the value of that individual’s knowledge (Coff, 1999).
Else, the individual will appropriate most of the rents. This absence of
knowledge flow is not necessarily in the best interest of the individual either,
especially when she is not able to fully exploit that knowledge.
Thus, Grant (1996) concludes that knowledge often needs to be
integrated within firm boundaries to facilitate transferability, augment
absorptive capacity, and solve the appropriability problem but at the same time
he admits that the firm does not provide a perfect solution either. The
organization does not eliminate coordination problems. It merely attenuates
them. Koruna (2004) for instance lists at least nine barriers to recombination
that cause frictions and coordination costs within the organization: knowledge
dispersion, diverging frames of reference, intra-organizational boundaries,
status of disciplines, engineer syndrome, not-invented-here syndrome,
knowledge tacitness, language, and cognitive limits. Also, industry
characteristics such as speed of knowledge development (Appleyard, 1996) as
well as context-dependent resource interdependencies and strategic
considerations (Almeida and Phene, 2004) will influence the probability of
cross-organizational knowledge sharing.
Most of these barriers exist because humans are boundedly rational and
have limited cognitive capacity (Simon, 1978) so that omniscience is out of
reach and specialization is our de facto reality. Because invention increasingly
requires bridging different scientific domains (Jones, 2009), the specialized
knowledge structure ‘imposes’ collaboration and thus various forms of
154
integration. This need for specialization brings about challenges associated with
invention as a process of escalating recombinant search as suggested before
(e.g. Grant, 1996; Koruna, 2004).
Grant’s (1996) reasoning exhibits two distinct trade-offs: From the
perspective of the firm (Grant’s focal unit of analysis) the benefits of escalation
[lower dependence on unique knowledge holders, easier and faster knowledge
flow by making messages digestible and by stimulating absorptive capacity],
need to be weighed against the costs of escalation [frictions and coordination
costs, risks of negative spillovers]. However, from the perspective of the
inventor/decision-maker who needs to make the choice whether or not to
escalate the unit of invention his/her downsides [e.g. loss of bargaining
position because knowledge will need to be shared (Arrow, 1962), codification
and coordination efforts], need to be compared to their upsides [e.g. higher
absorptive capacity, better chance of finding a successful outcome, aligning
with firm incentives…]. My evolutionary perspective suggests that the
escalation process will be determined by the trade-off faced by the inventing
unit, not the one faced by the firm.
I will summarize the key challenges under three interrelated headings:
knowledge articulation (How do I make clear what I need?), knowledge flow
(How does knowledge transfer between entities?), and knowledge absorption
(Can I absorb the knowledge I find or that is shared with me?). These three
problems entail opportunities for invention, but bear within them risks and
inherent difficulties. Although the lines between them are very malleable and
somewhat artificial to draw, I will discuss them as separate items in the
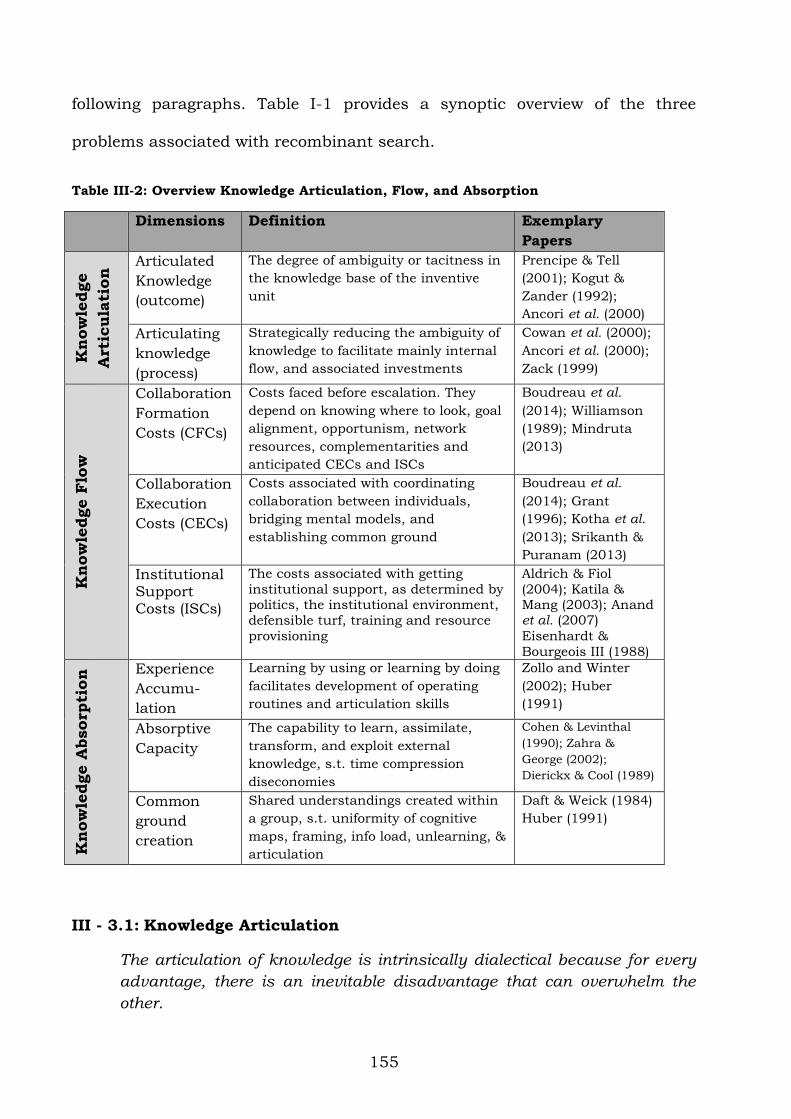
155
following paragraphs. Table I-1 provides a synoptic overview of the three
problems associated with recombinant search.
Table III-2: Overview Knowledge Articulation, Flow, and Absorption
Dimensions Definition Exemplary
Papers
Know
ledge
Art
icula
tion
Articulated
Knowledge
(outcome)
The degree of ambiguity or tacitness in
the knowledge base of the inventive
unit
Prencipe & Tell
(2001); Kogut &
Zander (1992);
Ancori et al. (2000)
Articulating
knowledge
(process)
Strategically reducing the ambiguity of
knowledge to facilitate mainly internal
flow, and associated investments
Cowan et al. (2000);
Ancori et al. (2000);
Zack (1999)
Kn
ow
ledge F
low
Collaboration
Formation
Costs (CFCs)
Costs faced before escalation. They
depend on knowing where to look, goal
alignment, opportunism, network
resources, complementarities and
anticipated CECs and ISCs
Boudreau et al.
(2014); Williamson
(1989); Mindruta
(2013)
Collaboration
Execution
Costs (CECs)
Costs associated with coordinating
collaboration between individuals,
bridging mental models, and
establishing common ground
Boudreau et al.
(2014); Grant
(1996); Kotha et al.
(2013); Srikanth &
Puranam (2013)
Institutional Support Costs (ISCs)
The costs associated with getting
institutional support, as determined by politics, the institutional environment,
defensible turf, training and resource
provisioning
Aldrich & Fiol
(2004); Katila & Mang (2003); Anand et al. (2007)
Eisenhardt &
Bourgeois III (1988)
Kn
ow
ledge A
bsorp
tion
Experience
Accumu-
lation
Learning by using or learning by doing
facilitates development of operating
routines and articulation skills
Zollo and Winter
(2002); Huber
(1991)
Absorptive
Capacity
The capability to learn, assimilate,
transform, and exploit external
knowledge, s.t. time compression
diseconomies
Cohen & Levinthal
(1990); Zahra &
George (2002);
Dierickx & Cool (1989)
Common
ground
creation
Shared understandings created within
a group, s.t. uniformity of cognitive
maps, framing, info load, unlearning, &
articulation
Daft & Weick (1984)
Huber (1991)
III - 3.1: Knowledge Articulation
The articulation of knowledge is intrinsically dialectical because for every
advantage, there is an inevitable disadvantage that can overwhelm the
other.
156
Articulated knowledge relates to the degree of ambiguity of knowledge
and articulating knowledge is the combination of processes by which
individuals and organizations attempt to manage the balance between
codification and tacitness. Both are relevant to the definition of problemistic
search as well as to the knowledge available to the articulator.
III - 3.1.1: Articulated Knowledge
There are both advantages and disadvantages to codified knowledge. On
the one hand, codified knowledge is easier to store and retrieve as well as more
reliable, which makes it easier to transfer (Kogut and Zander, 1992). In
particular, codification can transform knowledge into a commodity that can be
traded in markets, which can substitute for internally developed knowledge11
(Prencipe and Tell, 2001). Also, codified knowledge can more easily be
maintained in organizational memory and reduces organizational dependence
on key individual knowledge holders (Prencipe and Tell, 2001). Additionally,
specific forms of codification have additional benefits such as protection from
imitation in the case of patenting but this comes at the price of disclosure.
On the other hand, clearly articulated knowledge is more susceptible to
leakage and spillovers. Deng (2008) for instance estimated the value of
knowledge spillovers in the semiconductor sector at between 0.6 and 1.2
million dollar per citation. Kogut and Zander (1992, p. 384) describe the fact
the codification also induces imitation as a “fundamental paradox”. While in
11 Codification and commodification are however not the same thing. Codified internal operating procedures have no value outside the firm so are not a commodity; alternatively after-sales
services for complex goods are often not codified, but still commodified, and driver schools
teach both codified knowledge (procedures) and tacit knowledge (practice and experience acquisition) (Ancori et al., 2001, p. 258).
157
some cases knowledge can be deliberatively revealed as a strategic choice
(Alexy, George, and Salter, 2013), in many other cases the cost of IP theft and
unwanted knowledge dissipation are staggering (Friel, 2006). Whereas the
resource-based view suggests that valuable, rare, hard-to-imitate, and non-
substitutable resources are sources of competitive advantage (Barney, 1991),
when it comes to tacitly held knowledge, these characteristics can also drive a
wedge between competitive advantage and superior rents because the
knowledge holder can bargain away the rents (Coff, 1999). Whether or not the
knowledge is socially complex (i.e. embedded in interpersonal relations), path-
dependent (due to the unique historical conditions under which the firm came
to own the knowledge), and/or susceptible to time compression diseconomies,
will determine to which entity (the firm or the knowledge owner) the rents will
accrue (Barney, 1991; Dierickx and Cool, 1989).
Additionally, some authors question the value of codified knowledge more
generally, suggesting that the most important aspects of knowledge cannot be
explicitly codified. Nelson and Winter (1982, p. 73) wrote that the “knowledge
that underlies skilful performance is in large measure tacit knowledge, in the
sense that the performer is not fully aware of the details of the performance and
finds it difficult or impossible to articulate a full account of those details”. Thus
whether or not all knowledge is codifiable and whether such codification makes
economic sense depends on the epistemological stance of the author (Ancori et
al., 2000).
Finally, besides codification, organizations can articulate knowledge in
other ways. Little attention has however been paid to how organizations teach
158
their employees about existing procedures and routines (but think about
McDonalds University) or to how employees learn by observing behaviour.
Jensen et al. (2007, p. 682) for instance talked about how training and
education systems also embody knowledge in people and perhaps in artefacts.
Using a questionnaire, Zander and Kogut (1995) found that both teachability
and codifiability (correlation = 0.02) of manufacturing capabilities in Swedish
firms contribute independently to internal knowledge transfers but not to
imitation by other firms which confirms the importance of teaching as a form of
articulation and provides support for the notion of stickiness (Szulanski, 1996;
von Hippel, 1994). From an outcome perspective, the benefits of articulation are
thus contingent on the likelihood of expropriation of the codified knowledge by
competitors.
III - 3.1.2: Articulating Knowledge
Rather “little research has addressed how firms achieve the desired level
of knowledge ambiguity that enables them to prevent unwanted leakage and
promotes purposeful transfer processes” (Van Wijk, Jansen, and Lyles, 2008, p.
844, italics added). The literature on knowledge management argues that
organizations increasingly try to (and need to) make their knowledge more
explicit and codified internally so that it can flow faster and more accurately
within organizational boundaries. However, “appropriately explicating tacit
knowledge so it can be efficiently and meaningfully shared and reapplied,
especially outside the originating community, is one of the least understood
aspects of knowledge management” (Zack, 1999).
159
Our scarce understanding of how organizations articulate or enable the
articulation of knowledge is important because Zollo and Winter (2002) argue
there is intrinsic value in the process itself because articulation improves
understanding of the knowledge and thusly enhances absorptive capacity
(Cohen and Levinthal, 1990). Yet much money is also spent on the prevention
of knowledge exodus, e.g. by investing in knowledge architectures and
expensive knowledge management systems (Droege and Hoobler, 2003) so that
one has to consider the articulation pay-offs explicitly. Moreover, codification or
routinization – both as process and as outcome - can imply rigidity, stifle
development of new ideas especially in contexts of change, and can never
completely replace non-algorithmic judgement (Prencipe and Tell, 2001). These
problems will be exacerbated in high-velocity environments, in which rigidity
will be a cause for failure.
III - 3.1.3: Articulation Contingencies
Hansen et al. (1999) acknowledge that different firms will have
idiosyncratic preferences for or against knowledge articulation. These
preferences will be influenced by the ease and risks associated with
codification. Nelson and Winter (1982) argued in this light that incentives to
articulate (regarding personal and overall costs) as well as accumulated
experiential skills will matter a great deal. Besides idiosyncratic aspects,
context in its temporal, spatial, cultural, and social dimensions need be
considered in any discussion of knowledge articulation (Cowan et al., 2000, p.
225). Stable contexts benefit more from codification but in these contexts
codification is not in the best interests of the firm as long as the firm can keep
160
tacit knowledge in house thereby capturing private information rents (Cowan et
al., 2000). Dynamic contexts can suffer from overcodification when
organizations become better at assimilating knowledge that suits their existing
codification scheme (frame of reference), hence blinding out those aspects that
do not fit the current schemes (Henderson & Cockburn, 1990), something
known in psychology as confirmation bias. Additionally, institutional
differences may make articulation more or less desirable. E.g. the recent jail
sentence for the Japanese man who created a 3D printed gun (Vincent, 2014),
following the release of initial 3D firearm blueprints in the USA (Hern, 2013)
which was also met by public outrage but eventually kick-started the
emergence of firms making 3D printed guns (Embley, 2013). Thus, knowledge
articulation can be dialectical both as a process and as an outcome and its
effect is contingent on a variety of factors.
In summary, the benefits of codification are contingent upon
environmental characteristics such as velocity and the likelihood of knowledge
spill-overs. On the one hand, there are clear benefits to codification as it
improves learning (Zollo and Winter, 2002) and facilitates information-sharing
within the organization (Zack, 1999). Articulated problems can also be searched
in the environment so one could posit a positive relation between articulation-
driven search and innovative success. However, in hypercompetitive
environments, industry frameworks are not based on historic content but on
the process of adaptive sense-making so that organizations act based on
idiosyncratic beliefs, rather than based on shared industry recipes (Bogner and
Barr, 2000). In such environments, clear articulation of user needs and thus
161
accurate estimations regarding expected value of solutions will be difficult.
Additionally, time and financial investments in codification face high
opportunity costs. Codification will then be less likely and without clearly
articulated problems, searching in the knowledge space becomes potentially
detrimental, which provides some support for proposition 3.
III - 3.2: Knowledge Flow
The single biggest problem in communication is the illusion that it has
taken place (George Bernard Shaw)
Knowledge flow is “the aggregate volume of know-how and information
transmitted per unit of time” (Schulz, 2001, p. 663). In this transmission it is
important to ask if the sender will rout the information to the receiver, with
what delay and with what distortion (Huber, 1991). Clearly, there are
challenges associated with distribution of information so that “the idea of
effortless ‘knowledge transfer’ is normally misleading and a ‘prepared mind’
helps a lot when it comes to absorbing codified knowledge” (Jensen et al., 2007,
p. 681). Despite these challenges, enabling knowledge flow is of utmost
important to performance. Schilling and Phelps (2007) found that firms that
occupy densely clustered network positions benefit from easier communication
and collaboration because of high information transmission capacity which
boosts innovative output. Grigoriou and Rothaermel (2014) built micro-
foundations for such findings by arguing that individual networks of inventors
across firms provide a better way of looking at potential information
transmission. They found that star integrators with big reach and star
connectors who bridge structural holes contribute significantly to firm
innovation. Thus, overcoming barriers to knowledge flow is critical in the
162
escalating recombinant search process of invention. These findings exemplify
that knowledge flow as a capability includes knowledge of on whose door to
knock for information.
Kogut and Zander (1992) argued that a firm’s ability to replicate
knowledge in different parts of the organization (i.e. an efficient articulation-
flow-absorption loop) will determine the firm’s growth potential to a great
extent. However, they also acknowledged that the more efficient this replication
loop becomes, the higher the risk of competitive imitation. Van Wijk et al.’s
(2008) meta-analytic review of knowledge transfer antecedents and
consequences shows that flow enhances both innovativeness and firm
performance. They find that knowledge ambiguity decreases flow, while
organizational characteristics (size and absorptive capacity) enhance it.
Network characteristics such as centrality, tie strength, and trust also
positively influence knowledge transfer while similarity in vision, systems and
culture have a weak, positive effect as well. These findings exemplify how hard
it is to disentangle effects of articulation, flow, and absorption. When focusing
purely on flow, three types of costs emerge that determine its likelihood and
reliability: collaboration formation costs, collaboration execution costs, and
institutional support costs.
III - 3.2.1: Collaboration Formation Costs
For both agency theory (Eisenhardt, 1989a; Ross, 1973) and transaction
cost economics (Williamson, 1975, 1989) goal divergence between self-
interested individuals is a primary problem of organizational design. Incentive
alignment (agency theory & TCE) and integration of different entities into a new
163
organization to facilitate governance (TCE) are the proposed solutions to
overcome the risk of opportunistic behaviour. Hence incentive and goal
misalignments can create cooperative failures so that the escalation process
(and thus the invention) halts (Williamson, 1981). Importantly, these theories
presume that finding the potential partner is not problematic. This could be
rooted in the implicit assumption evident in most work on search and the
behavioural theory of the firm, namely that the search environment is benign
(MacAulay et al., 2014). I include this knowledge of where to look as a
fundamental part of the knowledge flow capability. This capability will first and
foremost affect the likelihood of tie formation.
Additionally, as described in section III - 2.2 and in more detail in
Chapter I, matching theory (Gale and Shapley, 1962) posits that the searcher’s
resources and capabilities need to match with the favoured partner’s needs
before a match comes into existence. Thus, specific firm and partner
capabilities will determine the likelihood of alliance formation (Mindruta, 2013).
Vissa (2011) showed that individual tie formation intentions are driven by
social similarity and task complementarity and that these aspects also drive
actual tie formation. Ahuja (2000b) showed that technical, commercial, and
social capital all influence the likelihood of establishing linkages and in another
paper he demonstrated that firms with a more central network position
(number of direct and indirect ties) and those who span fewer structural holes
(as suggested by Coleman) are more innovative as well (Ahuja, 2000a). Finally,
research has shown that prior experience with partnering increases the
164
likelihood of partnering again, although not always with beneficial
consequences (Goerzen, 2007).
I am not suggesting these drivers will not play a role during the
collaboration [they can all resurface, especially with every unit escalation], but
in first instance they are most likely to affect the likelihood of the formation of
collaboration. Additionally, expected collaboration execution costs will influence
whether collaborations come into existence as well. Kotha et al. (2013) found
that anticipated within-team coordination costs, measured by science distance,
negatively influence the likelihood of setting up a collaboration in the form of
licensing and that this effect is attenuated by experience.
Collaboration formation costs thus determine the likelihood of grafting
(Huber, 1991) and are driven by incentive (goal) alignment, perceived risks of
opportunistic behaviour, network resources (including partner-specific
experience), complementarities and similarities, and anticipated collaboration
execution and institutional support costs.
III - 3.2.2: Collaboration Execution Costs
Once the inventive unit has escalated to at least two people and the
collaboration formation process is (temporarily) halted, new problems arise
because “even in the absence of goal conflict, coordination is not a trivial issue”
(Grant, 1996, p. 120). Within the firm, effective coordination is a prerequisite
for knowledge integration. Yet “calling for coordination without specifying just
what it means is simply a lazy way of passing off problems to someone else”
(Simon, 1991, p. 39). Thus, coordination requires 1) rules and directives to
165
regulate individual interaction, 2) sequencing and thus modularity to avoid
specialist clashes, 3) routines, and 4) meetings to allow for group problem
solving (Grant, 1996). Because individuals own the knowledge that is
responsible for most of the added value a firm creates, hierarchical structures
are ill-suited to facilitate tacit knowledge exchange because only the knowledge
owners can deploy the knowledge. Thus, decision-making need be decentralized
when decisions require access to this tacit knowledge and can be centralized
when the knowledge source is accessible statistically (Grant, 1996).
Whenever any of these four requirements fails, coordination costs
increase with all the ensuing negative consequences on knowledge flow. In their
qualitative study of team collaboration in software services offshoring, Srikanth
and Puranam (2013) find that ongoing communication is essential to maintain
flow, whereas modular approaches seem to fail even in comparatively simpler
maintenance contracts due to environmental change, echoing problems
anticipated by March and Simon (1958) regarding coordination by feedback and
coordination by plan. This failure of modularity is perhaps not surprising.
Recall that von Hayek (1945) already argued that markets are great because
they simplify decision processes as they allow actors to act independently from
one another. In other words, when it comes to the exchange of pre-defined and
stable outcomes, markets are assumed to be superior to firms. If modularity
would work, these ‘simple’ maintenance contracts would not be executed within
an organization but by many independent individuals who trade in markets
with each other.
166
Coordination is known to be easier when the collaborators possess
mutual knowledge because this common ground facilitates interpersonal
communication (Durnell Cramton, 2001). In an international business plan
competition for students, Durnell Cramton (2011) identified five sources of
mutual knowledge failure: context of, distribution of, salience of, and speed of
access to information as well as the interpretation of temporary non-
communication.
Others have added to these findings by arguing that in a professional
setting, tacit coordination mechanisms can be used to maintain common
ground in dispersed collaborations within an organization with a recognized
authority but that such tacit mechanisms fail between organizations because of
lack of common ground (Srikanth and Puranam, 2013), or because of lack of
shared identity the enables the resolution of coordination problems through
procedural authority (Kogut and Zander, 1996). Also the findings of Kotha and
Srikanth (2013) regarding Boeing’s efforts to increase visibility of actions in its
disaggregated value chain support the importance of authority in the
knowledge-based view. While collaborating firms may build common ground
over time (Mayer and Argyres, 2004), the absence of a clear authority structure
is likely to cause permanent frictions in the long run.
III - 3.2.3: Institutional Support Costs
Institutional support costs are determined by inter- and intra-
organizational politics, institutional environments, and the relative difficulties
to obtain organizational support for innovation. We know that power games are
linked to centralized decision-structures, are often orchestrated by stable, non-
167
issue specific coalitions, and are detrimental to performance (Eisenhardt and
Bourgeois, 1988). The two main drivers for this poorer performance (diversion
of attention and limitations to information flow) can easily be linked to
innovation as well: (Eisenhardt and Bourgeois, 1988). Politics will thus raise
institutional support costs. Entrepreneurs on the onset of a new industry face,
besides normal pressures associated with entrepreneurship, additional
challenges associated with cognitive and sociopolitical legitimacy (Aldrich and
Fiol, 1994). The authors propose that “encompassing symbolic language and
behaviors” (p. 652), “internally consistent stories” (p. 653), “convergence around
a dominant product/service design” (p. 655), “collective action” (p. 656),
“linkages with established educational curricula” (p. 661) and “collective
marketing and lobbying efforts” (p. 663) will all contribute to legitimacy
creation. These six12 propositions all imply that coherent articulation and
sufficient flow within and between institutional entrepreneurs is instrumental
to their chances of success.
In other contexts, it has been shown repetitively that being part of
clusters contributes to innovation, even in the increasingly globalized
knowledge economy (Baptista and Swann, 1998; Porter, 2000), which also
provides support for the importance of the institutional environment. Finally,
changes in the legal environment (e.g. with regards to patent protection) or the
institutional support infrastructure influence the timing of collaboration, such
that a reduction of the risk of appropriation by a partner accelerates
collaborative R&D projects (Katila and Mang, 2003). Finally, Anand et al. (2007)
show that delineating the boundaries of new practices (defensible turf) and
12 Aldrich and Fiol (1994) actually make eight propositions, but two are less relevant here.
168
finding organizational support by removing barriers to acceptance by internal
power holders, leveraging existing clients, co-opting gatekeepers, as well as
training and resource provisioning, are instrumental to get new ideas accepted
within the organization. All these actions require efforts on behalf of the
inventing unit and thus result in costs that need to be borne. This perspective
obviously assumes that the individuals coming up with the new practice are
not in a very powerful position. When the new practice is promoted by the
organizational leaders, coercive implementation might require different
processes (Canato, Ravasi, and Phillips, 2013). They found that implementing a
culturally dissonant practice over time changes both the practice and the
culture of the organization (Canato et al., 2013).
In summary, knowledge flow is instrumental to invention, but entails
costs that will influence how well an inventing unit is equipped to find the right
partner and manage the collaboration. Furthermore, Eisenhardt (1989b) has
shown that in high velocity environments, the speed of information flow (e.g.
integration of multiple decisions; active conflict resolution; simultaneous and
fast consideration of alternatives; real time information) is instrumental to
decision-making and to performance. Similarly, Srikanth and Puranam (2013)
found that ongoing communication and constant, direct feedback are
instrumental to project success. We can thus conclude that a positive
relationship between knowledge flow and innovative performance exists which
will be stronger in high-velocity environments. This provides some additional
support for proposition 3. However, as I argued before, in such high velocity
environments, codification is highly problematic because the associated
169
opportunity costs are significant. Additionally, the collaboration formation costs
will be higher in such environments where it is often difficult to identify a
possible partner, especially without prior experience. For instance, looking at
the (biased) sample of established contracts, Carson, Madhok, and Wu (2006)
find that opportunism is higher under high market and technological volatility,
characteristics associated with high-velocity environments. This provides some
limitations to the freedom to search. Following from the above reasoning and
propositions 1 and 3, it then seems likely that the process of unit escalation is
likely to halt before crossing organizational boundaries (which drastically
increases flow costs) and that this is especially so when the industry velocity is
high.
III-f, Costs associated with Knowledge Flow
Formula 4: EC(Holder Search) = CFC + CEC + ISC
CFC = Collaboration Formation Cost
CEC = Collaboration Execution Cost
ISC = Institutional Support Cost
III - 3.3: Knowledge Absorption
The gift of fantasy has meant more to me than my talent for absorbing
positive knowledge (Albert Einstein)
Knowledge absorption captures how an inventing unit comes to embody
specific knowledge. It entails three learning mechanisms: experience
accumulation, absorptive capacity, and the development of shared
understandings and common ground. Zollo and Winter (2002) propose that
experience accumulation through learning by doing or using, provides a central
learning process by which operating routines are assumed to develop. A part of
170
this experience accumulation results in the capability to articulate knowledge,
which exemplifies how entangled both processes are. As the authors state,
…“firms learn systematic ways to shape their routines by adopting an
opportune mix of behavioral and cognitive processes, by learning how to
articulate and codify knowledge, while at the same time they facilitate the
accumulation and absorption of experiential wisdom” (Zollo and Winter, 2002,
p345). Additionally, the accumulation of knowledge over time enhances the
firm’s absorptive capacity (Cohen and Levinthal, 1990). As stated before, the
articulation of knowledge itself is likely to have intrinsic value because it
improves understanding of knowledge which in turn can increase knowledge
absorption.
Secondly, knowledge absorption includes absorptive capacity which can
be understood as the ability to learn, assimilate, or borrow external
information, not strictly by doing or using, and exploit that knowledge for
innovative purposes (Cohen and Levinthal, 1990). Similar to Zahra and George
(2002), I understand absorptive capacity as an overarching capability that
captures knowledge acquisition, assimilation, transformation, and exploitation.
However, to remain consistent with my theorizing, I interpret the absorptive
capacity not at the level of the firm but at the level of the escalating inventive
unit. Knowledge absorption is sensitive to time compression diseconomies
(Dierickx and Cool, 1989) so that inventing units that need to catch up quickly
and develop coordination mechanisms rapidly will face disadvantages in the
absorption of knowledge when liken to units that have had more time to
develop these mechanisms.
171
Finally, individual knowledge absorption (together with articulation) is
also a driver for the creation of common ground and mutual knowledge. In the
words of Daft and Weick (1984) interpretation is “the process of translating
events and developing shared understandings and conceptual schemes” (p.
286). The ease with which such shared interpretation of new information and
knowledge within an inventing unit is absorbed, is determined by the
uniformity of the member’s cognitive maps, the framing and rich portrayal of
the information, the information load, and the amount of unlearning each
member has to do (Huber, 1991, p. 102). I will not delve into the question of
when individual sense-making acts constitute a macro [or meso] social
phenomenon (Phillips, Sewell, and Jaynes, 2008). I am simply assuming that
both absorption and articulation will be necessary to create mutual knowledge
between individuals, without worrying about the exact timing when individual
knowledge becomes mutual knowledge. Thus, the creation of common ground
depends on the capabilities associated with knowledge absorption as well as
knowledge flow, because the common ground is specific to both the interaction
between partners (knowledge flow) as well as the focal knowledge domain(s)
that need be made intelligible to the other (knowledge absorption).
In summary, knowledge articulation, flow, and absorption are three
interacting processes that have a complex relation to innovative outcomes. The
evolution towards increasing articulation, which facilitates flow and builds
absorption, entails both risks and opportunities (Zack, 1999). From an
organizational perspective however, it is vital to remember that knowledge and
practices often remain difficult to imitate even within organizational
172
boundaries. Szulanski (1996) found that internal stickiness can be caused by
1) the recipient’s lack of absorptive capacity (knowledge absorption failure), 2)
causal ambiguity (knowledge articulation failure) and 3) a bad relationship
between source and recipient, which relates to trust and coordination issues
(knowledge flow failure). Von Hippel (1994) as well argued that codification
might indeed lower costs of transmission of knowledge in general, but if the key
competitive advantage resides in the tacit or sticky counterpart, the codification
effort will result in low benefits. Dosi (1988, p. 1131) made a similar point when
he stated that “information about what other firms are doing spreads quite
quickly, however, the ability to produce or replicate innovative results is much
more sticky”.
III-g, Proposition 8: Knowledge Absorption
Postrel (2002) suggests that specialized capability (which requires high
knowledge absorption within the focal domain) and knowledge about the
capabilities of others or trans-specialist knowledge (which lowers costs
associated with holder search) are substitutes for one another so that “the
desirability of knowledge integration depends mostly upon the relative costs of
acquiring the two types of knowledge” (p. 304). I have implicitly assumed this in
formula 2: EC(Search) =EC(Object Search) + EC(Holder Search).
Given what we now know about knowledge absorption, I can posit the
following:
Proposition 8: The higher the knowledge absorption of the inventing unit,
the lower the likelihood of escalation
III - 4: Escalating the Inventing Unit
“Market in the true economic sense, means a process of exchange and
allocation reflecting the transmission of knowledge” (Lachman, 1956, p.
38).
173
To what extent articulation, flow, and absorption are important problems
in the recombinant search process that is invention, depends to a great extent
on the unit of invention. Mutual knowledge deficits and other collaboration
execution costs associated with knowledge flow as well as codification
difficulties typical for knowledge articulation are of little concern when the
inventive unit is a single inventor. Similarly, cognitive dissonance (the ability to
maintain two contradictory ideas in one’s mind), over-specialization,
information overload, and other problems associated with knowledge
absorption are more likely to trouble a single inventor than a group of
individuals working in a joint venture.
These examples suggest that the ownership structure and the number of
individuals involved in an inventive project are likely to influence both the
problems encountered in the inventive process as well as the outcomes. In
order to shed some light on the tenuous relationship between the structural
escalation of the unit of invention and the barriers to invention, I discuss five
different entities that are commonly studied in invention-related research: the
inventor, the team, the firm, the dyadic alliance, and one-to-many open
innovation. While these entities are not uniform (teams can transcend
organizational boundaries or can be geographically dispersed, firm sizes differ
greatly, there is plethora of different interorganizational collaboration formats),
nor discrete (the boundaries of a firm or a dyadic collaboration are ill-defined),
nor exhaustive (a division, department, network, or community of practice
serve as alternative entities), I chose these five as exemplary and instructive
categories.
174
My overarching hypothesis is that knowledge articulation, flow, and
absorption all play their part in the spiralling escalation process of invention
but that their relative importance, as to the barriers they form, will evolve along
with the escalation of the inventing unit. The reason for this escalation is
similar to what Eisenhardt and Schoonhoven (1996) described as resource
needs. It are the resource, cognitive, and/or temporal limitations acknowledged
by a lower entity that faces a knowledge problem that forces that entity to
search for solutions. In the Carnegie tradition, search processes influence the
structure of production as search is the driving force in the establishment of
new-to-the-firm capabilities in line with organizational goals (Cyert and March,
1963; MacAulay et al., 2014). Analogously, holder search can alter the
structure of the inventing entity as the problem is escalated to a higher level
where it gets (re)socialized and interpreted and where it has to cope with
different problems of articulation, flow, and absorption. Yet, object search can
halt this escalation process when sufficient information or knowledge is found
to be available ‘out there’ that can be absorbed without integrating the
knowledge owner(s).
III-h, Proposition 9: Escalation versus Articulation, Flow, and Absorption
Every phase in the escalating recombinant search processes has particular
challenges. This leads to a simple proposition:
Proposition 9: The barriers imposed by the costs and difficulties associated
with knowledge articulation, knowledge flow, and knowledge absorption
will change with every escalation of the unit of invention

175
The following table provides a synoptic overview of the strength of
barriers to invention across the different inventive units (from very low (--) to
very high (++). With barriers, I refer to those elements of knowledge integration
that will be most challenging for the inventive unit relative to the other units
and relative to the other elements. Details of the table are discussed under the
following five sections.
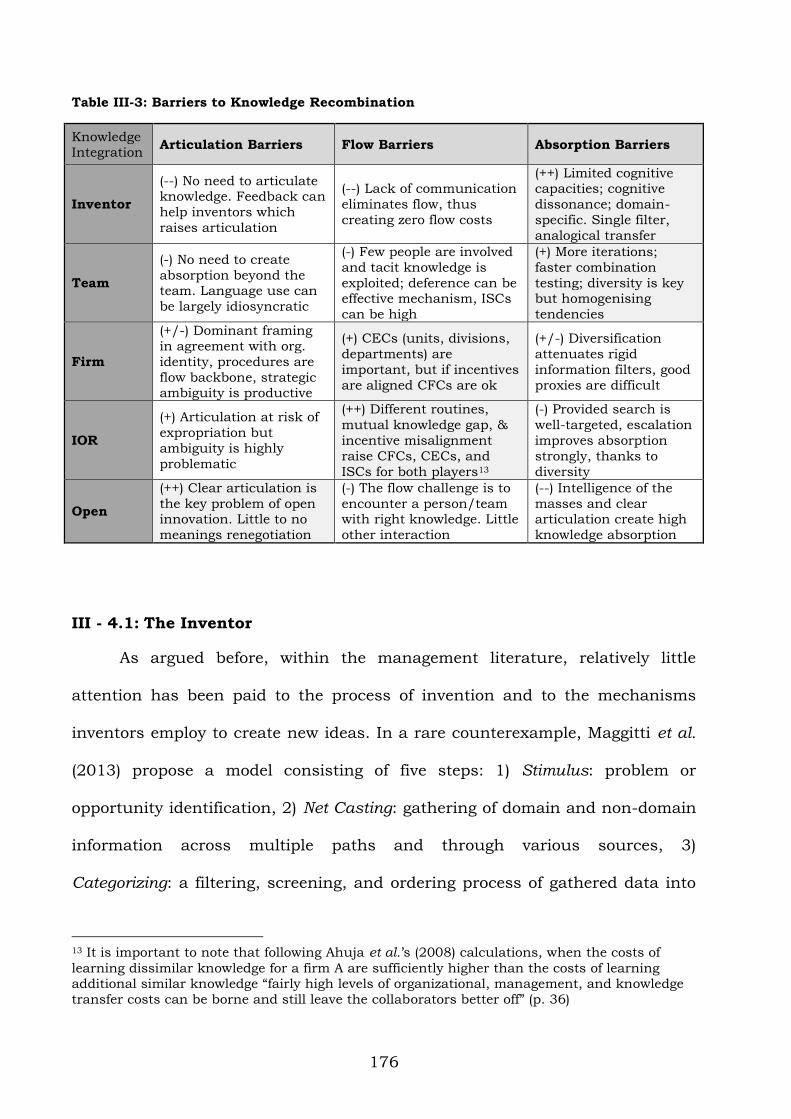
176
Table III-3: Barriers to Knowledge Recombination
Knowledge Integration
Articulation Barriers Flow Barriers Absorption Barriers
Inventor
(--) No need to articulate knowledge. Feedback can
help inventors which
raises articulation
(--) Lack of communication
eliminates flow, thus
creating zero flow costs
(++) Limited cognitive capacities; cognitive
dissonance; domain-
specific. Single filter,
analogical transfer
Team
(-) No need to create
absorption beyond the team. Language use can
be largely idiosyncratic
(-) Few people are involved
and tacit knowledge is
exploited; deference can be effective mechanism, ISCs
can be high
(+) More iterations;
faster combination
testing; diversity is key but homogenising
tendencies
Firm
(+/-) Dominant framing
in agreement with org.
identity, procedures are
flow backbone, strategic ambiguity is productive
(+) CECs (units, divisions,
departments) are
important, but if incentives
are aligned CFCs are ok
(+/-) Diversification
attenuates rigid
information filters, good
proxies are difficult
IOR
(+) Articulation at risk of
expropriation but
ambiguity is highly
problematic
(++) Different routines,
mutual knowledge gap, &
incentive misalignment
raise CFCs, CECs, and
ISCs for both players13
(-) Provided search is
well-targeted, escalation
improves absorption
strongly, thanks to
diversity
Open
(++) Clear articulation is
the key problem of open innovation. Little to no
meanings renegotiation
(-) The flow challenge is to
encounter a person/team with right knowledge. Little
other interaction
(--) Intelligence of the
masses and clear articulation create high
knowledge absorption
III - 4.1: The Inventor
As argued before, within the management literature, relatively little
attention has been paid to the process of invention and to the mechanisms
inventors employ to create new ideas. In a rare counterexample, Maggitti et al.
(2013) propose a model consisting of five steps: 1) Stimulus: problem or
opportunity identification, 2) Net Casting: gathering of domain and non-domain
information across multiple paths and through various sources, 3)
Categorizing: a filtering, screening, and ordering process of gathered data into
13 It is important to note that following Ahuja et al.’s (2008) calculations, when the costs of
learning dissimilar knowledge for a firm A are sufficiently higher than the costs of learning additional similar knowledge “fairly high levels of organizational, management, and knowledge
transfer costs can be borne and still leave the collaborators better off” (p. 36)
177
structured information, “the integration of new information obtained by net
casting into the existing knowledge structures (schema) of the inventors” (p.
94), 4) Linking: Integration of ideas across disciplines to arrive at 5) Discovery:
testing and validating. These stages are continually revisited and re-evaluated
so that feedback (influenced by system complexity, search context, and
searcher knowledge and experience) allows for adjusting previous knowledge
and categories.
From this description, it seems evident that these five steps need not only
apply to individual inventors but are probably used by larger inventive units as
well. Singh and Fleming (2010) argue that isolated inventors will in general 1)
“lack multiple and (to varying degrees) uncorrelated filters”, 2) “uncover fewer
potential problems”, and 3) “develop more poor ideas” (p. 44). Gruber et al.
(2013) find that individual characteristics of the inventor affect the breadth of
knowledge recombination spanning technological boundaries. Scientists and
individuals with a doctoral degree score significantly higher on technological
recombination breadth.
The implication seems to be that for individual inventors, knowledge
absorption is the key bottleneck to be successful. Due to the cognitive
limitations they face, they are worse at recombining knowledge components
which results in poorer quality inventions14. The fact that natural scientists
and those with a PhD do better than others (e.g. engineers) supports the
importance of absorbing broader and more complex knowledge bases. This
14 In the popular sitcom, “The Big Bang Theory”, the common scorn and derision faced by
engineer Howard Wollowitz from theoretical physicist Sheldon Cooper about his field being so
inferior, seem to carry some weight in the process of recombinant search.
178
talent is likely to be correlated with advanced studies in more complex sciences
(Gruber et al, 2013). In a study of inventors’ rate of invention, breakthrough
probability, and breakthrough rate, Conti et al. (2014) found that inventors who
were productive in the past have a higher invention rate and higher
breakthrough rate but a lower likelihood of breakthroughs than those who have
not been productive in the past15. This finding, though not restricted to isolated
inventors, further supports the idea that those with a high rate of invention
create cognitive bottlenecks such that the likelihood of being really innovative
decreases. As Singh and Fleming (2010) suggested, insulated inventors spend
less time iterating through sequential stages of the recombinant search process
with a view to improve their ideas.
Unlike for teams, this constraint on acquiring new knowledge or the
natural tendency to resolve cognitive dissonance by homogenizing conflicting
ideas (Festinger, 1962), limits the individual’s innovative potential and hence
stimulates the escalation of the inventing unit. I refrain from delving deeply into
the mechanisms employed by the inventor to come to new ideas. Magee (2005)
suggested that analogical transfer, which “occurs when information and
experiences from one known situation are retrieved and utilized in the search
for the solution to an entirely different situation” (p33), serves as a cognitive
mechanism by which recombinant search can create novelty. The study of the
exact mental and cognitive processes that stimulate creative thinking within an
individual are better left to psychologists and neuroscientists. I will not go into
them in the rest of this dissertation.
15 This is not a study of lone inventors. Controls for co-inventors are included in the regression
analysis.
179
III - 4.2: The Team
Patent studies suggest that team size contributes to innovation impact
(Alnuaimi, Opsahl, and George, 2012a). Singh and Fleming (2010) for instance
find that larger teams are more likely to create high impact (top 5%)
innovations thanks to cycling quicker through a large number of new
combinations and because greater diversity makes teams more efficient at
radical recombination. Additionally, teams are also less likely to produce low
impact innovation thanks to higher total effort as well as quicker yet more
rigorous selection of ideas (Singh and Fleming, 2010). These effects are
mediated by both diversity of team member experience and the size of the
members’ extended social network. Alnuaimi, Singh, and George (2012b) build
on this work and find that geographically dispersed teams are likely to possess
more diverse collective knowledge which will increase the range of potential
inventions.
However, there are limitations to the benefits of team size. Curral et al.
(2001) found that large teams have poorer team processes with regards to
participation, innovation support, emphases on quality, clarity of objectives,
and commitment to objectives. This is echoed in the economic concept of
decreasing marginal productivity of labour. Additionally, how team members
reach out to each other when they are searching for additional information is
important. Recently, researchers have become interested for instance in
deference and how it influences team work (Fragale et al., 2012). Joshi and
Knight (in press) found that dyadic deference (the matching of one person’s
knowledge domain with that of another) is a critical determinant of the team’s
180
research productivity. When deference is based on social affinity or inspection-
based characteristics (Gavetti and Levinthal, 2000) that are poor proxies for
expertise and decision power such as gender and ethnicity, productivity suffers,
while deference based on task contributions boosts research output.
Thus, while larger teams are able to absorb more knowledge, the
escalation of the unit of invention also creates problems around flow and
articulation. It is important to explicate that size in itself merely increases
processing power and not necessarily diversity of ideas. A team of ten 100%
identical individuals is unlikely to be much more innovative than a single
individual. Size serves as a proxy for diversity. Therefore, while teams within
organizational boundaries can have very diverse backgrounds, the period they
have been institutionalized by their current organization increases
homogeneity. There is some evidence from team research that heterogeneous
teams have higher performance (Bowers, Pharmer, and Salas, 2000) and that
the composition of and interaction within top management teams affects
learning (Nadolska and Barkema, 2014).
Yet heterogeneity in top management is also a determinant of higher
turnover, which implies that employee similarity is likely to be higher within
than between organizations (Wiersema and Bantel, 1993; Wiersema and Bird,
1993). What really matters is to have diverse individuals with different
perspectives collaborating. Hoever et al. (2012) found that one key process by
which diverse teams outperform other teams when it comes to creativity is by
taking each other’s perspective, which is argued to stimulate information
exchange and elaboration. It does not seem impossible that this team process
181
could stimulate analogical thinking at the individual level. In another context,
Nadolska and Barkema (2014) suggested that diverse (top management) teams
will be more inclined to share experiences, have comprehensive debates, and
search for more information from outside the team to resolve any lingering
debates. The authors argue that while such interaction may be time-consuming
it will be performance-enhancing and find that teams with tenure and or
educational diversity strengthen the positive effect of acquisition experience on
acquisition success (Nadolska and Barkema, 2014). In a third study, Barkema
and Shvyrkov (2007) found that tenure diversity increased the likelihood of
strategic novelty but that this effect fades over time as team members become
institutionalised into their organizational environment. The exact opposite was
found for strong social fault lines that create a divide within the team.
Thus while overall team size seems to be beneficial for inventive output,
size is really a proxy for diversity of opinions and perspectives within the team.
This diversity will obviously be greater than for an individual, as too much
diversity within an individual would create cognitive dissonance (Festinger,
1962). The diverse team will have higher knowledge absorption but at the cost
of higher knowledge flow challenges. Especially when subgroups are being
formed within a team, the effects can be very negative.
III - 4.3: The Firm
According to the knowledge-based view, the firm can be understood as an
institution that integrates individuals’ specialized knowledge for productive
purposes (Grant, 1996). The fundamental difference between the firm and the
market is exactly that firms are better than markets at sharing and transferring
182
knowledge of individuals because firms create an identity that supports
coordination and dialogue that facilitate information exchange and the
discovery of solutions (Kogut and Zander, 1992, 1996). Specifically, the firm
can be understood “as competing on the speed by which knowledge is created
and communicated” (Zander and Kogut, p. 87). However, the discussion on
knowledge flow (III - 3.2) has shown that even within an organization such as
the firm, knowledge is not perfectly and instantaneously available to everyone
who wants access to it. Because the firm is such a highly contested concept
(Alvarez and Barney, 2007; Cyert and March, 1963; Demsetz, 1988; Kim and
Mahoney, 2010; Williamson, 1975), it is no surprise that this elusive concept is
often poorly suited to capture the complex drivers of innovation.
Simply looking at some very common firm constructs in empirical
research shows that firm size has been found to be positively (Katila, 2002;
Yayavaram and Ahuja, 2008), negatively (Gruber et al., 2013; Miller, Fern, and
Cardinal, 2007) or not (Hall and Ziedonis, 2001; Katila and Chen, 2008) related
to measures of innovation, often depending on whether a separate absorptive
capacity proxy (R&D investment, R&D over sales, or patent stock) is included.
That proxy tends to be positive and significantly related to innovation. For a
more detailed discussion on firm size and innovation as well as contingencies of
scope and access to external knowledge, see Ahuja, Lampert, and Tandon
(2008, p. 22 – 51). Firm age has been found to have positive (Lahiri, 2010), U-
shaped (Kotha et al, 2011), or no (Phene et al., 2006) effects on innovative
outcomes. Sørensen and Stuart (2000) even found a negative effect of age on
patent citations in the semiconductor industry, whereas they found no effect on
183
biotech patent citations (yet a positive effect when R&D is included) and no
effect in biotech non-self-citations (yet an inverted U-shaped effect when R&D
is included). Kotha et al. (2011) found in the biotech sector that branching into
new technological niches impacts differently on firms depending on their age:
older firms are more productive but younger firms have higher impact when it
comes to innovation. Also the firm’s origin and whether or not it is diversified
are determinants of innovative performance though not always significantly or
in the same direction (Katila and Ahuja, 2002; Katila and Chen, 2008;
Yayavaram and Ahuja, 2008)).
When it comes to flow, the evidence suggests that many barriers exist
within the firm. Argyres (1996) found that more innovative firms typically have
fewer divisional boundaries, while Miller et al. (2007) found that exploiting
interdivisional knowledge has a more positive impact on innovation than both
intra-divisional and extra-organizational knowledge. Departments create
different thought worlds within an organization so that sense-making across
departments is rather difficult. Organizational product routines seem to
separate rather than integrate these thought worlds so that both inhibit the
development of knowledge (Dougherty, 1992). Similarly, Jansen, Van Den
Bosch, and Volberda (2006) found that while centralization is detrimental to
exploration and formalization supports exploitation, interconnectedness of
different units within the firm positively influences both forms of innovation.
More generally, Henderson and Clark (1990) proffered that over time,
organizations develop information filters and communication channels that
limit the free flow of knowledge and hence constrain the range of knowledge
184
domains a firm explores and can absorb. They also suggested that firm
knowledge may reside in different sub-unit islands, the boundaries between
which make recombination or flow very difficult (Henderson and Clark, 1990).
This suggests that structural aspects of the organization are likely to influence
knowledge flow in important ways. If Grant (1996) is indeed right that firms are
chiefly institutions for knowledge integration, the firm should optimize its
structure as to maximize knowledge flow. But Amin and Cohendet (2000, in
Ancori et al., 2000) issue caution: When the governance of competencies is
devoted to the optimal coordination of knowledge within the organizational
boundaries, the mechanisms for governing resource allocations and adaptation
to the environment might suffer.
This cannot be disentangled from the problem of articulation. While
articulation of routines and practices enhances the ease of knowledge transfers
in the firm, it risks constraining creative thinking. In Wittgenstein’s words “we
cannot step out of our language with language” or “the limits of my language
means the limits of my world”. The direct implication is that the tools
organizations use to communicate, affect their ability to create novel ideas: “It
follows that if the codification does not leave enough room for ambiguity and
interpretation, it creates inertia in the production of knowledge” (Ancori et al.,
2000, p. 273). Thus, organizations that become increasingly dependent on their
routinized knowledge run the risk of myopia and associated competency traps,
path-dependence, and superstitious learning (Levinthal and March, 1993).
In summary, while overall, the firm as a unit of invention will be better at
knowledge absorption than a team, the firm is more likely to struggle with
185
articulation and flow. The escalation of size can hamper communication and
flexibility, but does add additional resources and organizational support upon
which inventors can rely (Anand et al., 2007). Using survey results, Jansen et
al. (2006) found that while unit and branch size (with units < branches) had no
effect on a unit’s exploitative innovation, larger branch size increased
explorative innovation while this effect was partially offset by the size of the
unit.
III - 4.4: The Inter-Organizational Collaboration
Knowledge flow is crucial to successful innovation, but collaboration
formation costs and collaboration execution costs are expected to raise higher
barriers between than within organizations. The effect of institutional support
costs is ambiguous because such support is often directed toward collaboration
(see Chapter I) but still two teams need to gain institutional support within
their organization as well, which makes the effect hard to predict.
Organizational economists assume bounded rationality, opportunism, and
asset specificity will stimulate hybrid forms when they are more efficient than
markets or when firms need to obtain access to complementary resources that
need be integrated (Barney and Hesterly, 2006). Organizational theories
propose that partnering occurs to reinforce (latent) relationships with a view to
gaining power, reputation and legitimacy building, and accessing social capital
(Parmigiani and Rivera-Santos, 2011). When it comes to inter-organizational
collaborations, the purpose of the hybrid organization is often more important
than form-based attributes (Parmigiani and Rivera-Santos, 2011).
186
The influence of inter-organizational collaborations on invention can be
either direct (i.e. the collaborators create new inventions) or indirect (i.e. one or
both organizations learn and become more successful innovators in the future).
Much research focuses on the indirect aspects and uses either a network
perspective or focuses on single inter-firm linkages. For such single linkages,
Ahuja et al. (2008, p. 32) state that “under very general and reasonable
conditions [i.e. increasing returns to scale, knowledge complementarity, and
public good nature of shared knowledge], collaboration should have a positive
impact on innovative output”.
In their review of knowledge transfer, Van Wijk et al. (2008) found that
network centrality and the number of relations significantly contributed to
interorganizational knowledge flow but only very weakly to intra-organizational
knowledge exchange. The authors concluded that because “knowledge within
firms is likely to be less diverse, the structural characteristics of a unit’s
network are apparently less critical”. Nonetheless, interfirm collaborations are
not a perfect substitute for internal knowledge development. Ahuja et al. (2008,
p. 33) submit four key arguments of why the pooling of R&D to collaboration
does not transfer in its entirety to the collaborating entities: 1) “additional
coordination, monitoring, and management costs”, 2) difficulty of internalizing
the joint R&D, 3) “duplication of research efforts”, and 4) strategic behaviour
such as sharing poor researchers or deliberately maintaining progress
ambiguity. Thus “a unit of R&D done outside the firm may contribute less to
the firm’s knowledge base than a comparable unit conducted inside the firm”.
187
From a network perspective, Phelps (2010) finds that when firms have
technologically diverse alliance partners, they are more likely to engage in
exploratory innovation, especially when the network is closed. By looking at
established connections, the involved firms had already overcome the
collaboration formation costs (and thus self-selected out of specific
collaborations with those who are too different from them), thereby facilitating
flow. Additionally, Rosenkopf and Almeida (2003) showed that while firms are
overall less likely to build on distant knowledge, this negative effect is
attenuated when firms ally with or when they hire inventors from distant
partners. This suggests that after collaboration formation, knowledge is likely to
flow, regardless of initial differences in knowledge base. Therefore, better access
to more diverse partners is likely to stimulate knowledge absorption, as the firm
gets exposed to more different ideas, which will contribute to exploratory
innovation16. However, access to and experience with collaborating with others
is only really beneficial when it sets you apart from the competition. Hoang and
Rothaermel (2005) found that when it comes to R&D performance,
pharmaceutical firms, unlike their biotech counterparts do not benefit from
alliance experience. This could be explained because pharmaceuticals are too
far down the learning curve, they lack ways to truly absorb the potential
knowledge transfers when working with innovative biotech companies, or they
miss the motivation to learn because these alliances are less critical for their
survival than for biotech firms (Phelps, 2010). Routines, organizational
complexity, motivational deficit, and size of the big pharma firms create higher
16 Notice as well that the focal firm selects diverse partners in the first place. This choice can be
reminiscent of higher absorptive capacity or willingness to work around collaboration execution
costs.
188
structural barriers to learning in big pharma than in the small biotech firms
where individual and organizational learning are often virtually identical (Hoang
and Rothaermel, 2005).
Phelps’ (2010) findings also support that flow is easier in a closed
network where the firms’ partners also partner with each other, than in an
open network: closure facilitates the emergence of common ground and reduces
the likelihood of opportunism and stimulates trust. Kogut (1989) found that
JVs are more viable when partners have multiple ties with each other, with a
view to facilitate reciprocity. Building on that finding, Park and Russo (1996)
showed that JVs between direct competitors were more likely to fail, as were
JVs with a large number of partners. Facilitating flow between competitors is
hard because transferred knowledge can be used against the partner in the
market. Hence, the alignment of incentives can be problematic which raises the
risks of opportunism, even after the establishment of the collaboration. When
the number of partners increases, articulation becomes more problematic
because many different mental maps, corporate cultures, and knowledge
domains need to be bridged in order to develop shared understanding. Kale,
Singh, and Perlmutter (2000) then show that trust – which emerges after an
initial period of ambivalence (Gulati and Sytch, 2008) - and relational capital
create a positive basis for knowledge exchange.
Preceding Phelps (2010), Sampson (2007) finds that alliances are better
for innovation when partner technological diversity is moderate17. While Ancori
17 While this might seem to counter the work of Phelps (2010), consider this important
difference that Phelps does not mention. Sampson (2007) looks at diversity of the partner at the
dyad level. Firms that are too different will find flow too difficult and those that are too similar
189
et al. (2000) still argued that some knowledge ambiguity is required for the
organization to maintain creative, Van Wijk et al. (2008, p. 841) find that
knowledge ambiguity is significantly less problematic within than between
organizations. Within an organization, ambiguity can generally be resolved
faster, either through authority or through other tacit coordination
mechanisms (Srikanth & Puranam, 2013). Consistent with earlier reasoning,
Sampson (2007) also finds that when the focal firm maintains authority in the
alliance, the effects of working with highly diverse partners strongly improve.
This suggests that lowering coordination execution costs can offset the
problems of working with diverse partners.
III - 4.5: Open Innovation
Despite the complex network structure typical for open innovation, the
problems associated with flow are of less importance in 1-to-many open
collaborations than at the level of the dyadic collaboration. As argued by Alexy
et al. (2013, p. 271) “selective revealing strategies may also succeed under
adverse conditions of high partner uncertainty and high coordination costs and
when known partners are unwilling to collaborate”.
In the context of open innovation, Henkel (2006) found that firms disclose
more when they need external support and Clarkson and Toh (2010) advocated
will not teach each other much. The inverted U makes sense. Phelps (2010) however looks at the focal firm’s network diversity. Hence some firms will be very distinct while others will be
rather similar. Because Phelps (2010) uses an average measure (p. 899) the effect of extremes is
already attenuated, hence finding a linear effect unlike the hypothesized curvilinear one. In
addition, the self-selection away from excessively diverse firms that Phelps mentions in the
discussion (p. 905) exacerbates this effect. This is consistent with the idea that collaboration formation costs can lead to the not-formation of a collaboration, which affects the results.
Additionally, Sampson focuses on all innovations and Phelps (2010) focuses on exploratory
innovations. This will reinforce the linear effect he found.
190
the potential deterrence benefits of revealing, while Alexy et al. (2013) discuss
four archetypes of selective revealing. None of these authors touch upon the
articulation and codification question. Nonetheless, in open innovation, a
commonly understood language or a transparent and knowable codebook is
essential. In other words, when selectively revealing, how knowledge is
articulated and codified will have a great impact on the likelihood of successful
engagement with external innovators. Unlike within a team, firm or alliance,
the articulation process is unlikely to be in a constant state of flux as the
involved members renegotiate its meaning. On the flipside, while articulation
clarity is instrumental to get results, over-articulation (excessive disclosure)
can have severe downsides when external firms learn valuable lessons from the
disclosure without any reciprocity.
Given its importance in selective revealing, it is noticeable that
articulation has not yet been discussed in any depth in the literature on open
innovation. This provides an interesting avenue for future research in contexts
in which revealing is common but where the codebook is less clear than in the
case of Linux (Henkel, 2006) or patent re-examinations (Clarkson and Toh,
2010). Examples could be crowdsourcing websites like www.openideo.com and
www.ideaconnection.com or internal corporate sites that take the function of a
collaborative idea-bus. Darren Carroll, CEO of InnoCentive, describes the
importance of articulation as a key skill for his company: “They [our scientists]
find ways to describe problems in a manner that is general enough to attract a
broad audience, but yet is specific enough that it provides enough information
to actually get a solution” (Allio, 2004, p. 5). Also, open source networks such
191
as StackOverflow (for computer coding) have a very clear blueprint for how to
ask a good question18 which exemplifies the importance of articulation in these
open collaborative contexts.
Finally, selective revealing lowers costs of current and future knowledge
absorption as the “future knowledge production and spillovers [of partners who
take in the revealed knowledge] will be of higher value to the focal firm” (Alexy
et al., 2013, p. 271). This is not to say that firms will not need absorptive
capacity to reap the revealing‘s benefits, but simply that the induced
isomorphism facilitates future absorption because it moulds the externally
produced knowledge in accordance to the firm’s needs (Alexy et al., 2013).
Much like open source software, selective revealing thus provides a platform
upon which others can build knowledge, using a language that is understood
by the firm, and made available to those who want to engage with the firm.
18 For R-related problems: http://stackoverflow.com/questions/5963269/how-to-make-a-
great-r-reproducible-example
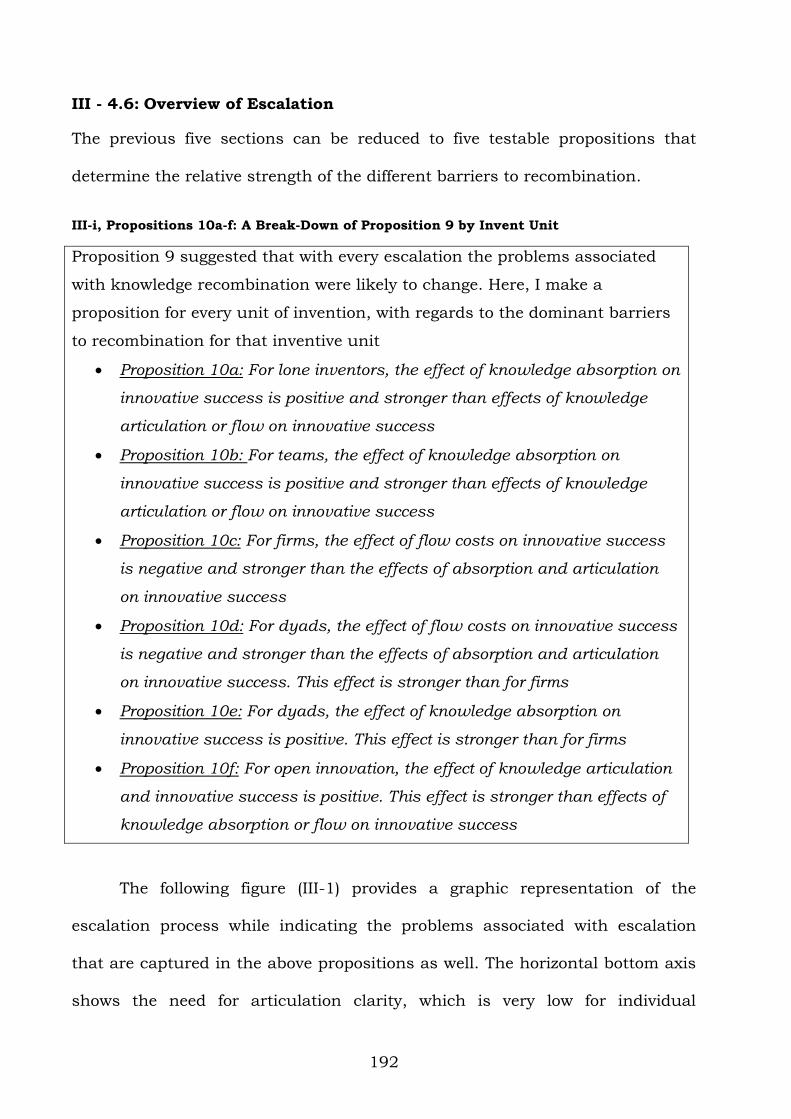
192
III - 4.6: Overview of Escalation
The previous five sections can be reduced to five testable propositions that
determine the relative strength of the different barriers to recombination.
III-i, Propositions 10a-f: A Break-Down of Proposition 9 by Invent Unit
Proposition 9 suggested that with every escalation the problems associated
with knowledge recombination were likely to change. Here, I make a
proposition for every unit of invention, with regards to the dominant barriers
to recombination for that inventive unit
Proposition 10a: For lone inventors, the effect of knowledge absorption on
innovative success is positive and stronger than effects of knowledge
articulation or flow on innovative success
Proposition 10b: For teams, the effect of knowledge absorption on
innovative success is positive and stronger than effects of knowledge
articulation or flow on innovative success
Proposition 10c: For firms, the effect of flow costs on innovative success
is negative and stronger than the effects of absorption and articulation
on innovative success
Proposition 10d: For dyads, the effect of flow costs on innovative success
is negative and stronger than the effects of absorption and articulation
on innovative success. This effect is stronger than for firms
Proposition 10e: For dyads, the effect of knowledge absorption on
innovative success is positive. This effect is stronger than for firms
Proposition 10f: For open innovation, the effect of knowledge articulation
and innovative success is positive. This effect is stronger than effects of
knowledge absorption or flow on innovative success
The following figure (III-1) provides a graphic representation of the
escalation process while indicating the problems associated with escalation
that are captured in the above propositions as well. The horizontal bottom axis
shows the need for articulation clarity, which is very low for individual
193
inventors and very high for open innovation as argued above. Note that I
suggest that articulation can be spread over a large space. Van Wijk et al.
(2008) found that knowledge ambiguity is more damaging to interfirm
collaborations than to intrafirm collaborations. Srikanth and Puranam (2013)
found similar problems suggesting that clear communication is instrumental to
innovative success. On the other hand the strategic importance of not putting
all your cards on the table will play a big part as well, because the risk of
expropriation is always higher when crossing organizational boundaries.
Additionally, the costs of clear articulation might not outweigh the associated
benefits.
The vertical axis represents knowledge absorption. The overarching
realisation is that unit escalation increases the capacity to absorb more and
more information. The downward pointing arrows reflect the average distance
from a component in the knowledge structure (cf. infra), which analogously
decreases with ‘added brains’, while the thickness of the arrows indicates the
bandwidth and filter diversity through which object search can occur
(Henderson and Clark, 1990; Kogut and Zander, 1992). Finally, the shading of
the rectangles reflects the problems associated with flow, which increase from
individual up to the dyad and then dissipate into the open innovation network
where articulation clarity is the crucial challenge.
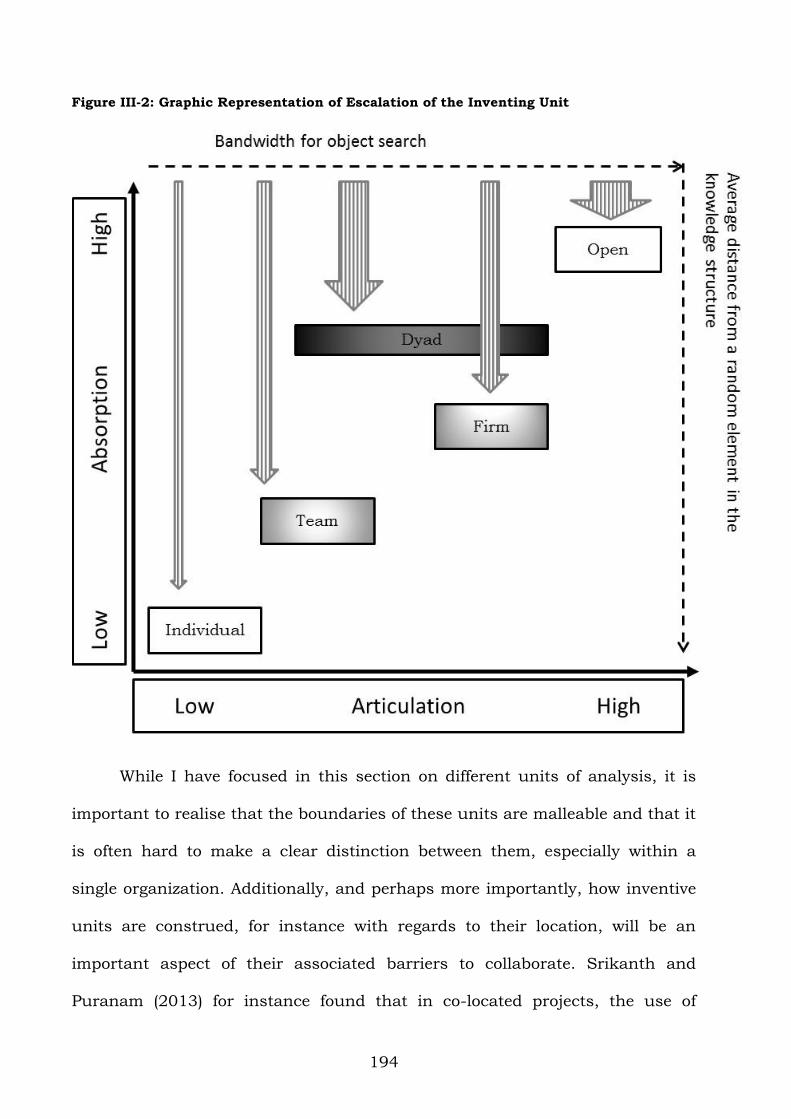
194
Figure III-2: Graphic Representation of Escalation of the Inventing Unit
While I have focused in this section on different units of analysis, it is
important to realise that the boundaries of these units are malleable and that it
is often hard to make a clear distinction between them, especially within a
single organization. Additionally, and perhaps more importantly, how inventive
units are construed, for instance with regards to their location, will be an
important aspect of their associated barriers to collaborate. Srikanth and
Puranam (2013) for instance found that in co-located projects, the use of
195
specific coordination mechanisms is independent of crossing organizational
boundaries, whereas in distributed projects, teams of the same firm rely heavily
on tacit coordination mechanisms, which is not possible for inter-organizational
teams.
Thus organizational boundaries in and of themselves are insufficient
delimiters of problems associated with invention. While escalating recombinant
search will increase the number of people involved in the inventive unit, other
aspects such as geographical proximity will also influence coordination costs
(Srikanth and Puranam, 2013). Additionally, as the examples on open invention
have shown, the potential number of individuals with whom to interact is itself
not responsible for changes in the barriers to invention. What matters more is
how closely-knit the established ties need to be and how much one can
structure the knowledge (or the knowledge problem) in order to minimize future
coordinative effort. To take these aspects into account I propose a simple two
by two framework in the next section.
III - 5: Escalating Recombinant Search
Agrawal and Goldfarb (2008, p. 1578) argue that a “researcher deciding
whether to add a collaborator to a project will do so if the benefit exceeds the
cost such that the returns from collaboration are positive for both parties” and
find that changes in the knowledge structure (e.g. because of a technology
shock) affect the returns to collaboration differently for different researchers.
Building on this work, Ding et al. (2010) submit that the benefits of novel IT
infrastructure accrue more to women and to those working in non-elite
institutions. These recent findings lead to two fundamental questions that
196
relate to the problem of escalating recombinant search: 1) What are the
elements of the cost/benefit trade-off in the decision-making process of the
researcher who considers adding a collaborator to the inventive unit? 2) What
constitutes the knowledge structure? I first discuss the knowledge structure
(determined by knowledge articulation), then turn attention to what I call
ingression costs (a combination of knowledge flow and knowledge absorption,
which are potential substitutes (Postrel, 2002)). Finally, I discuss how the
balance between knowledge structure and ingression costs affects the
likelihood of specific escalations.
III - 5.1: Knowledge Structure
Until now, I have not yet discussed what knowledge is and how we ought
to think about it. While many economists have basically equalled knowledge
with information that can be transferred and sold in knowledge markets, others
have pointed out that even the most (if not all) codified forms of knowledge
maintain a tacit component (Ancori et al., 2000). I lean more towards the latter
group and hold that knowledge is probably never 100% codified. If this is true,
a tacit component (e.g. knowledge to use) remains an element of every piece of
embodied knowledge. As such, the process of invention can be understood as
the process of knowledge embodiment into an artefact that, once created, does
not necessitate the creator’s knowledge for the artefact to be useful. This
embodiment is fundamentally the outcome of an articulation process that is
undertaken by the joint actions of individuals, organizations, universities, and
governments responsible for the creation of a knowledge structure.
197
Lewin and Baetjer (2011) argue in this regard that the knowledge aspect
of any capital good is more fundamental than the ‘incidental’ physical aspect.
The ability to use a hammer (i.e. to understand and deploy its function) for
instance does not require understanding of the knowledge embodied in the tool
itself (how to melt the iron into shape, how to make the shape’s curvature, how
to attach the materials together…). There is thus a clear distinction between
the physical embodiment of the knowledge (which is a manifestation of the
knowledge of how to design and make an artefact) and the knowledge of how to
use that embodiment to accomplish a function, which is idiosyncratic to the
entity that aims to access and deploy to the artefact. “Capital goods, then, are
embodied knowledge of how to accomplish productive purposes” (Lewin and
Baetjer, 2011, p. 344). The traditional view of the organization as an
information-processing machine shows that embodied knowledge is present in
processes as well. Factory workers need not understand what their colleagues
are doing, nor have any clear idea of the eventual outcome of the production
process to be able to fulfil their own tasks (Nonaka and Toyama, 2003).
The knowledge structure can then be understood as globally amassed
embodied knowledge. This knowledge can be embodied in artefacts, processes,
data, information, routines, but also in the bodies of knowledge holders who
keep knowledge at varied levels of articulation. The extent to which knowledge
has been codified or remains tacit, whether the knowledge landscape (Fleming
and Sorenson, 2004; March, 1991) is easy or hard to navigate with many or few
local optima, whether the knowledge sources are geographically concentrated
or dispersed (Jaffe et al., 1993), public or private (Hicks, 1995), and the degree
198
of specialization determine the objective complexity of the knowledge structure.
In general, the more complex the knowledge structure, the more tacit it is, the
more local optima exist in the landscape, the more private connections are
necessary to grasp it, and the more treacherous its pitfalls. Following Demsetz
(1988) and Postrel (2002), the degree of specialization is determined by inherent
complementarities in learning of specific components. Some knowledge objects
are (more) easily learnt together than others, and those that are highly
complementary drive specialisation. The higher the complementarities between
knowledge components, the more difficult it is to access the knowledge without
prerequisite knowledge and the higher the time compression diseconomies
(Dierickx and Cool, 1989). I thus propose that the knowledge structure is
objectively out there although it is socially constructed and technologically
constrained.
Yet it is exactly the process of social construction that creates a
knowledge structure that has some exogenous (i.e. independent of the searcher)
stability. As argued by Cowan, David, and Foray (2000), “in an important
sense, the progress of research involves – and requires – the stabilization of
meanings, which is part of the social process through which the stabilization of
beliefs about the reliability of knowledge comes about” (p. 247). While I opine
that idiosyncratic differences in ingression costs (costs to obtain and exploit
knowledge, cf. infra) will define how easy or hard it is for some specific unit of
invention to access the knowledge, I also proffer that the knowledge structure
can be investigated as if it were a real multidimensional landscape that exists
‘out there’ while acknowledging that it is being constantly co-created and
199
reshaped by knowledge holders who infuse it with new ideas, information,
codified and tacit knowledge as well as place themselves at multiple positions
on the playing field. Thus, “the social construction of knowledge not only relies
on how existing knowledge is shared, but includes also the process through
which knowledge is obtained” (Ancori et al., 2000, p. 279), because both
aspects of flow (sharing of knowledge) and absorption (obtaining knowledge),
will have a direct influence on how and whether new ideas get articulated.
This echoes Lachman’s understanding of capital structure as “always in
the process of being formed, a process continually interrupted by unexpected
change” (1956, p. 82). There are many parallels between knowledge structure
and Lachman’s perspective on capital structure. Lachman (1956) argues that
like most capital goods, knowledge cannot be understood as a simple stock
because “knowledge is as refractory to quantification as capital is” (p. 7).
Knowledge also “lacks a natural unit of measurement” because of its
heterogeneity (p. 12), so that one “must regard the stock of capital, not as a
homogenous aggregate but as a structural pattern” (p. 14), that is characterized
by heterogeneity in use, and thus multiple specificity which in turn implies
complementarity and capital [knowledge] combinations so that the
combinations form the elements of the capital [knowledge] structure (p. 22).
Multiple typologies of knowledge have been created before. Spender
(1996) for instance differentiates between individual and social knowledge and
between explicit and implicit knowledge. Ancori et al. (2000) differentiate four
layers of the knowledge structure: crude knowledge, consisting of stimuli and
messages, knowledge of how to use knowledge, which affects knowledge
200
integration and action, knowledge about how to transmit knowledge, which
requires insight in the receiver, as well as “mastery of codes of codes and/or
languages”, and finally knowledge about how to manage knowledge, which
presupposes “the ability to modify even drastically the context of production
and exchange of knowledge” (p. 266 – 268).
Both Spender (1996) and Ancori et al. (2000) construe their framework of
knowledge upon a specific knowledge holder, respectively the firm, and the
individual. Cowan et al. (2000) however build more on the idea of an existing
and available knowledge structure that individuals can access differentially.
The authors differentiate between three knowledge zones: articulated (and thus
codified), unarticulated, and unarticulable. They argue that the last one is of
little interest to the social sciences and the second one needs to be split up in
unarticulated knowledge for which the codebook has been displaced (“within
the group context the codebook is not manifest” (p. 232)), which will come to
rely on search, and unarticulated knowledge for which there is no codebook. In
the absence of a codebook, a situation with no disagreements will create “a
stabilized uncodified knowledge, collective memory, convention” (p. 233),
whereas disagreements will either need to be settled via procedural authority if
it exists, alternatively we enter the terrain of the guru (Cowan et al., 2000). My
operationalization of the knowledge structure as objectively out there but
subjectively accessible by the escalating inventive unit is in this regard similar
to Cowan et al. (2000).
201
III - 5.2: Ingression Costs
Because information asymmetries are fundamental to markets (von
Hayek, 1945; Denrell et al., 2003) actors are unequally aware of where
information resides or who controls specific knowledge (Kirzner, 1997). Even if
this was not true, “prior experiences, personality traits and familiarity guide
how people perceive new knowledge that they are exposed to, [so that] it is
highly unlikely that two individuals will conceptualize and embody knowledge
in exactly the same way” (Alnuaimi et al., 2012b, p. 947). Such subjective
interpretations yield “provisional judgments, to be confirmed by later
experience; imperfect knowledge capable of being perfected” (Lachman, 1956, p.
31). Therefore, depending on the knowledge complexity and the focal knowledge
domain (this can be envisaged as a small cube within figure III-2, cf. infra), how
easy or hard it will be for a specific IU (inventive unit) to obtain the desired
knowledge will depend on the IU’s idiosyncratic characteristics.
For example, with regards to individual characteristics we know that
inventors in the EU are less likely to be female, are around 45 years old with
more than 75% chance of having attended university and about 25% chance of
having a PhD (the latter two vary rather strongly by sector and country) (Giuri
et al., 2007). Organization type matters as well because in general firms are
more focused on appropriation of knowledge and hence on patenting and
secrecy, whereas governmental organizations or universities are more keen on
knowledge generation and hence more open to collaboration regardless of
appropriation (Giuri et al., 2007), although the divide between private and
202
public science is becoming smaller (Mowery et al., 2001; Thursby and Thursby,
2002).
Given that the IU evolves through the inclusion of new knowledge
holders, the way the IU perceives and accesses the knowledge structure evolves
with every escalation. That is of course the key purpose of the escalation of the
IU, to be able to gain access to specific knowledge elements more easily. It is
therefore hard (of not impossible) to provide a succinct (let alone exhaustive)
list of what affects the ingression costs of the IU. As I attempted to clarify in
section III-4, every escalation brings with it changes in the capacity of the IU to
facilitate knowledge articulation, flow, and, absorption while at the same time
mounting or raising barriers to the efficiency of these three processes as the
flip-side of the medal: The relative barriers imposed by the ingression costs in
accessing knowledge will be determined by the relative costs associated with
flow and absorption19.
Absorption. The capacity to accumulate and absorb knowledge is widely
agreed to be an important factor in the inventive process (Cohen and Levinthal,
1990; Zahra and George, 2002). I underline the source-specific nature of
knowledge absorption because inventors access different sources for invention
(e.g. customers, patent literature, scientific literature, competitors…) and might
differ in their ability to extract value or interpret information from different
sources [e.g. due to differences in relational skills (see chapter I, part 2), or
19 Notice that articulation still matters in this context but chiefly with reference to the match
between the idiosyncratic articulation of the IU and the way the knowledge is articulated in the
knowledge structure. This ability to articulate is, as I proposed before (section I-3.1 and I-3.3)
determined by knowledge absorption.
203
network structure and composition (see Phelps, 2010; Grigoriou and
Rothaermel, 2014)]. Additionally, knowledge absorption is domain-specific. High
absorptive capacity in pharmaceuticals does not necessarily influence one’s
ability to acquire biotech knowledge or to benefit from collaborations with
biotech organizations (Hoang and Rothaermel, 2005). Finally, knowledge
absorption is also code-specific. If the entire knowledge structure consists of
elements that are not intelligible to the IU because it either lacks the codebook,
or because the codebook does not exist (in terms of Cowan et al., 2000) then
regardless of the source and the domain, the knowledge will not be able to be
absorbed. This is a key problem of internationalization where the organization
might possess abundant domain- and source-specific knowledge and the
knowledge structure might be very simple and transparent, but the lack of
cultural filters or linguistic capabilities (literally not understanding the
language) disable absorption to occur in any meaningful way.
Flow. The effectiveness of escalation is chiefly determined by costs
associated with knowledge flow (with open innovation as an exception).
Whether or not collaborations come into existence will depend to a great extent
on the collaboration formation costs (which include the expected collaboration
execution costs) and the ability to secure institutional support for the
collaboration. The likelihood of finding partners who want to work with you, the
bargaining power and unique resources held by the IU, the incentive structures
within the organization(s) for collaborative invention will all influence search
motivation. Yet, “little research in the management domain has looked at the
issue of incentive structures for innovation” (Ahuja et al., 2008, p. 59). Giuri et
204
al. (2007) show that inventors are motivated more by social (prestige,
satisfaction) and organizational benefits than by individual money or career
progress and while social desirability could have influenced the answers of the
surveyed inventors, “creativity, the search for knowledge, and the ability to
show that something is possible, can be personally enticing” (p. 1113). As Dan
Pink argued in his famous TED talk about the art of motivation, what really
motivates people is not the monetary rewards neoclassical economists put their
faith in; behavioural economists have shown that autonomy, mastery, and
purpose matter a great deal more (Pink, 2011).
Additionally, the size of the problem and the imagined components that
will need to be integrated to find a satisfactory solution will influence how
significant expected collaboration execution costs will be. The more distant the
components are in the knowledge structure, the higher the expectation of
finding little mutual knowledge upon which to build a successful collaboration
(Kotha et al., 2013). "The formation of expectations is nothing but a phase in
this continuous process of exchange and transmission of knowledge…
[Expectations] reflect an attempt at cognition and orientation in an imperfectly
known world” (Lachman, 1956, p. 33). The bigger the size of the problem, the
more people are likely to be integrated, in order to create sufficient problem-
solving capacity. While this will in general increase absorption, the problems
associated with flow will increase accordingly.
In summary, Ahuja et al. (2008, p. 68) pointed out that “few studies have
examined the costs of recombination as a determinant of innovation practices
and outcomes”. I propose that ingression costs could serve as a good proxy for
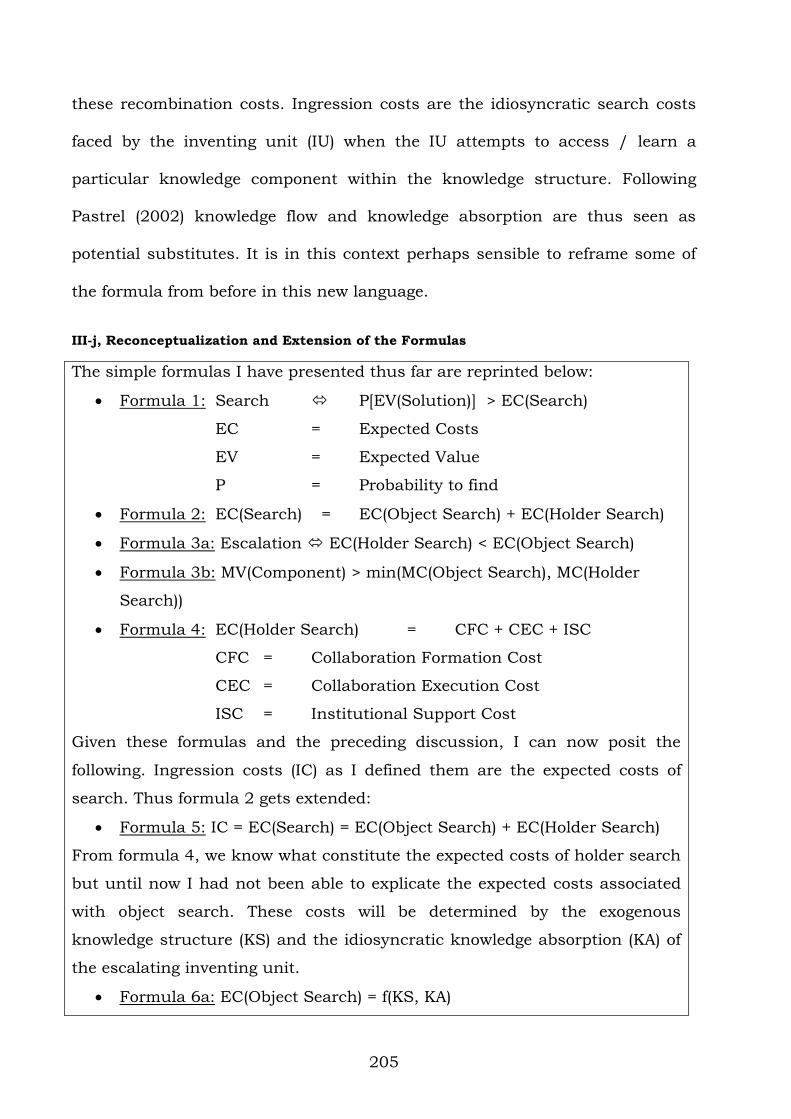
205
these recombination costs. Ingression costs are the idiosyncratic search costs
faced by the inventing unit (IU) when the IU attempts to access / learn a
particular knowledge component within the knowledge structure. Following
Pastrel (2002) knowledge flow and knowledge absorption are thus seen as
potential substitutes. It is in this context perhaps sensible to reframe some of
the formula from before in this new language.
III-j, Reconceptualization and Extension of the Formulas
The simple formulas I have presented thus far are reprinted below:
Formula 1: Search P[EV(Solution)] > EC(Search)
EC = Expected Costs
EV = Expected Value
P = Probability to find
Formula 2: EC(Search) = EC(Object Search) + EC(Holder Search)
Formula 3a: Escalation EC(Holder Search) < EC(Object Search)
Formula 3b: MV(Component) > min(MC(Object Search), MC(Holder
Search))
Formula 4: EC(Holder Search) = CFC + CEC + ISC
CFC = Collaboration Formation Cost
CEC = Collaboration Execution Cost
ISC = Institutional Support Cost
Given these formulas and the preceding discussion, I can now posit the
following. Ingression costs (IC) as I defined them are the expected costs of
search. Thus formula 2 gets extended:
Formula 5: IC = EC(Search) = EC(Object Search) + EC(Holder Search)
From formula 4, we know what constitute the expected costs of holder search
but until now I had not been able to explicate the expected costs associated
with object search. These costs will be determined by the exogenous
knowledge structure (KS) and the idiosyncratic knowledge absorption (KA) of
the escalating inventing unit.
Formula 6a: EC(Object Search) = f(KS, KA)
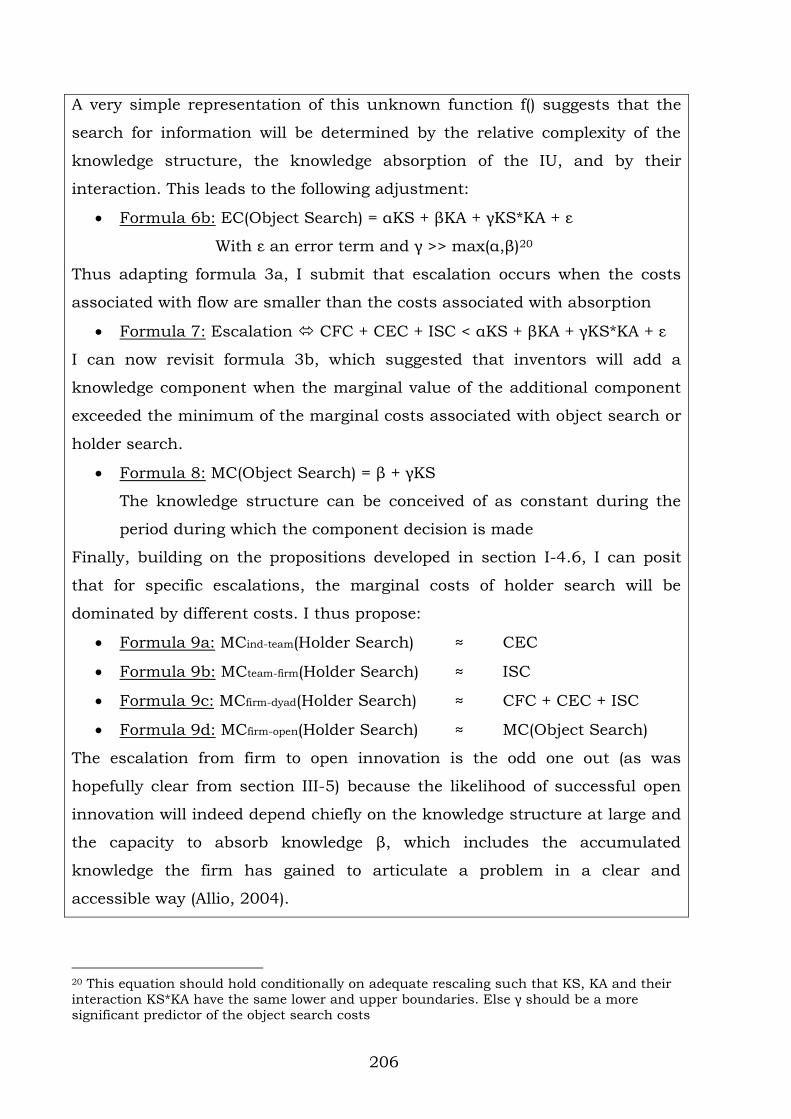
206
A very simple representation of this unknown function f() suggests that the
search for information will be determined by the relative complexity of the
knowledge structure, the knowledge absorption of the IU, and by their
interaction. This leads to the following adjustment:
Formula 6b: EC(Object Search) = αKS + βKA + γKS*KA + ε
With ε an error term and γ >> max(α,β)20
Thus adapting formula 3a, I submit that escalation occurs when the costs
associated with flow are smaller than the costs associated with absorption
Formula 7: Escalation CFC + CEC + ISC < αKS + βKA + γKS*KA + ε
I can now revisit formula 3b, which suggested that inventors will add a
knowledge component when the marginal value of the additional component
exceeded the minimum of the marginal costs associated with object search or
holder search.
Formula 8: MC(Object Search) = β + γKS
The knowledge structure can be conceived of as constant during the
period during which the component decision is made
Finally, building on the propositions developed in section I-4.6, I can posit
that for specific escalations, the marginal costs of holder search will be
dominated by different costs. I thus propose:
Formula 9a: MCind-team(Holder Search) ≈ CEC
Formula 9b: MCteam-firm(Holder Search) ≈ ISC
Formula 9c: MCfirm-dyad(Holder Search) ≈ CFC + CEC + ISC
Formula 9d: MCfirm-open(Holder Search) ≈ MC(Object Search)
The escalation from firm to open innovation is the odd one out (as was
hopefully clear from section III-5) because the likelihood of successful open
innovation will indeed depend chiefly on the knowledge structure at large and
the capacity to absorb knowledge β, which includes the accumulated
knowledge the firm has gained to articulate a problem in a clear and
accessible way (Allio, 2004).
20 This equation should hold conditionally on adequate rescaling such that KS, KA and their
interaction KS*KA have the same lower and upper boundaries. Else γ should be a more
significant predictor of the object search costs
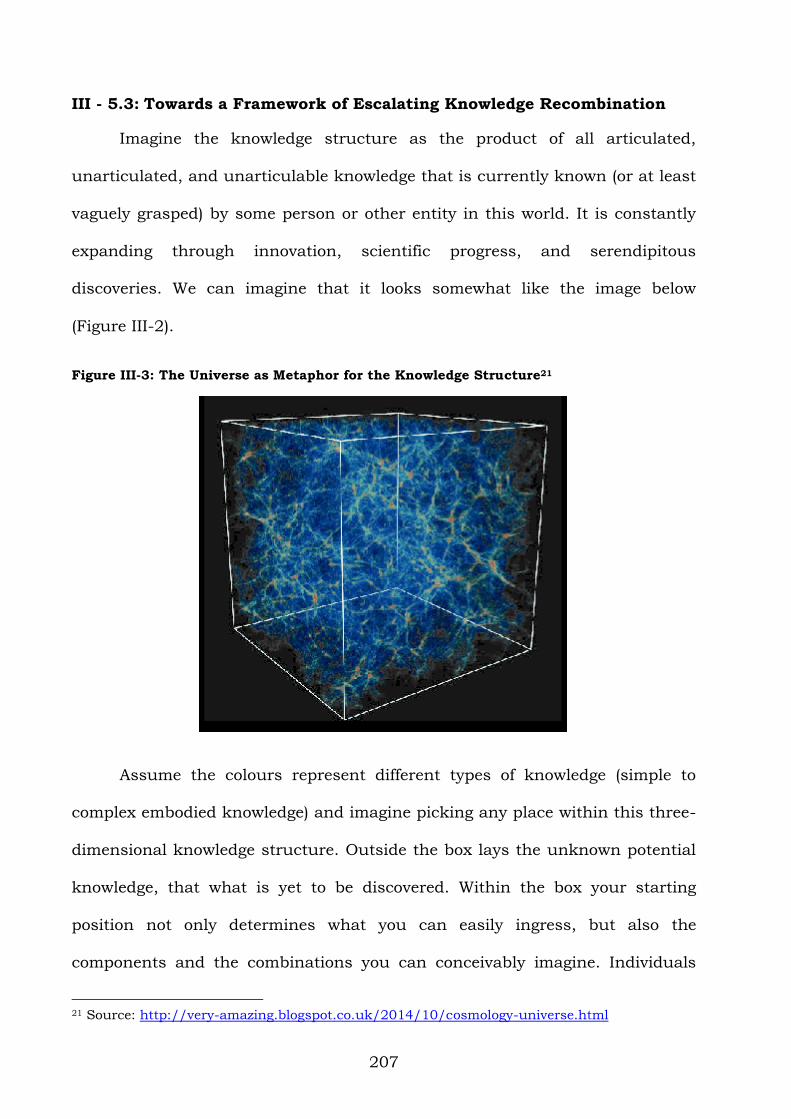
207
III - 5.3: Towards a Framework of Escalating Knowledge Recombination
Imagine the knowledge structure as the product of all articulated,
unarticulated, and unarticulable knowledge that is currently known (or at least
vaguely grasped) by some person or other entity in this world. It is constantly
expanding through innovation, scientific progress, and serendipitous
discoveries. We can imagine that it looks somewhat like the image below
(Figure III-2).
Figure III-3: The Universe as Metaphor for the Knowledge Structure21
Assume the colours represent different types of knowledge (simple to
complex embodied knowledge) and imagine picking any place within this three-
dimensional knowledge structure. Outside the box lays the unknown potential
knowledge, that what is yet to be discovered. Within the box your starting
position not only determines what you can easily ingress, but also the
components and the combinations you can conceivably imagine. Individuals
21 Source: http://very-amazing.blogspot.co.uk/2014/10/cosmology-universe.html
208
tend to be highly specialized so it is rare that an individual occupies multiple
different places within the knowledge structure. Such a person would be a
knowledge structural hole, someone who is, to use an analogy of quantum
mechanics, present at multiple distinct places at the same time. An example
would be an electrical engineer with an advanced degree in medicine, or an
anthropologist with excellent coding skills.
In this conceptualization, the knowledge to access embodied knowledge
elements and the knowledge to use those elements form part of the ingression
costs (i.e. the idiosyncratic costs of the focal entity, determined by knowledge
flow costs [access] and the entity’s knowledge absorption [use]).
In summary, I posit that the knowledge articulation of the entire global
community creates a socially constructed knowledge structure that consists of
embodied knowledge. Inventors, scientists, firms, universities, governments,
and philosophers co-create that knowledge structure by embodying knowledge
into objects or embody the knowledge themselves. The table below captures
this notion and differentiates between ingression costs and objects or holders in
the knowledge structure. I want to emphasize that in the time-consuming
process of escalating recombinant search, the decision whether to integrate a
new component from the knowledge structure (via either object or holder) is
taken on a component-by-component basis, such that the proposed process
iterates many times before an invention is eventually ‘finished’.
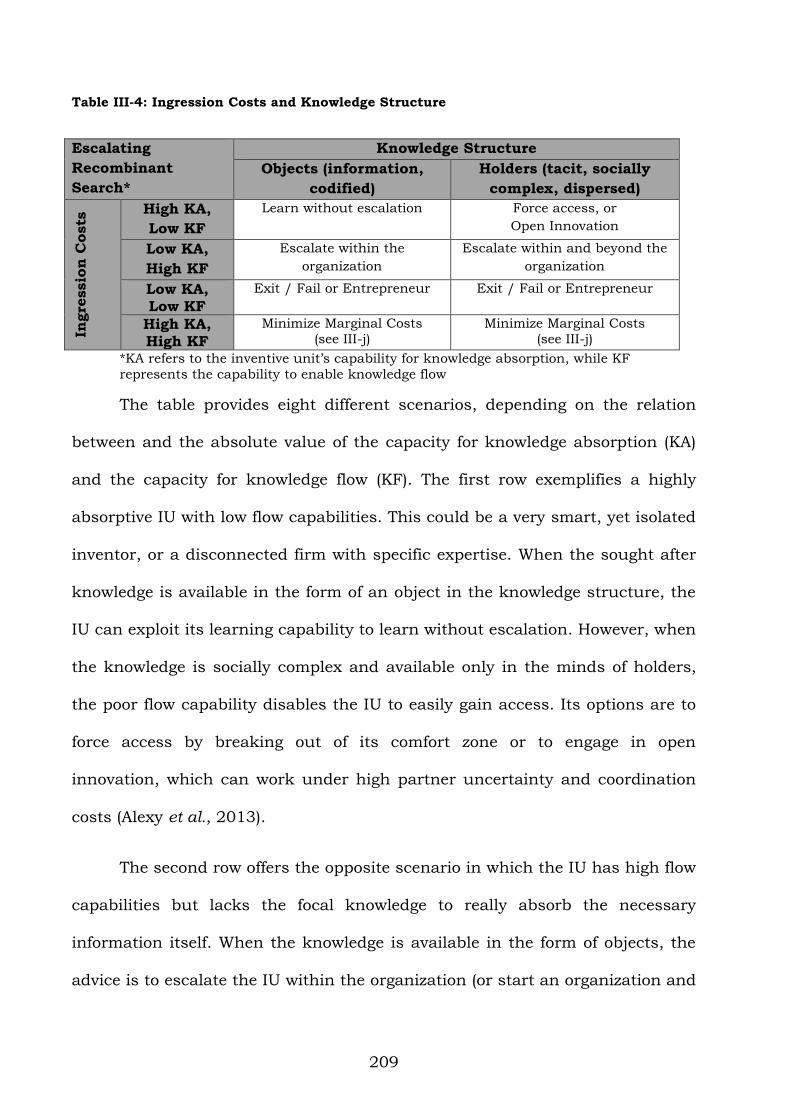
209
Table III-4: Ingression Costs and Knowledge Structure
Escalating
Recombinant
Search*
Knowledge Structure
Objects (information,
codified)
Holders (tacit, socially
complex, dispersed)
Ingre
ssio
n C
osts
High KA,
Low KF
Learn without escalation Force access, or
Open Innovation
Low KA,
High KF
Escalate within the
organization
Escalate within and beyond the
organization
Low KA, Low KF
Exit / Fail or Entrepreneur Exit / Fail or Entrepreneur
High KA, High KF
Minimize Marginal Costs
(see III-j)
Minimize Marginal Costs
(see III-j)
*KA refers to the inventive unit’s capability for knowledge absorption, while KF
represents the capability to enable knowledge flow
The table provides eight different scenarios, depending on the relation
between and the absolute value of the capacity for knowledge absorption (KA)
and the capacity for knowledge flow (KF). The first row exemplifies a highly
absorptive IU with low flow capabilities. This could be a very smart, yet isolated
inventor, or a disconnected firm with specific expertise. When the sought after
knowledge is available in the form of an object in the knowledge structure, the
IU can exploit its learning capability to learn without escalation. However, when
the knowledge is socially complex and available only in the minds of holders,
the poor flow capability disables the IU to easily gain access. Its options are to
force access by breaking out of its comfort zone or to engage in open
innovation, which can work under high partner uncertainty and coordination
costs (Alexy et al., 2013).
The second row offers the opposite scenario in which the IU has high flow
capabilities but lacks the focal knowledge to really absorb the necessary
information itself. When the knowledge is available in the form of objects, the
advice is to escalate the IU within the organization (or start an organization and
210
hire an expert). Note that the fact that the information is objectively available
does not disallow the option to escalate and find a holder who already owns the
information. The lower flow costs are, the higher the likelihood of rapid
escalation here. I do suggest that escalating beyond the organizational
boundaries is probably not the best idea. Despite high knowledge flow
capabilities, the IU’s lack of knowledge about the focal domain makes it ill-
suited to find the optimal partner in the first place, which will also influence a
potential bargaining process. Because the knowledge is relatively simple and
available in the knowledge structure without necessary interaction with others,
the likelihood of making a good deal outside the organizational boundaries is
rather slim. If necessary, hiring an expert in the organization is a better option.
When the knowledge is controlled by specific holders, the advice is to escalate,
also beyond organizational boundaries. The IU’s flow capabilities will assist in
the process but once beyond organizational boundaries, the relational
capabilities (and potential complementary assets in other related domains) will
determine the benefits of the invention. Much of the pharmaceutical-biotech
collaborations fall in this quadrant.
The third row offers the situation in which the IU is lacking both
capabilities hence acquiring or accessing the desired knowledge is highly
problematic. The advice is to exit and if not, the risk of failure is very high.
However, this is a situation not unfamiliar to wannabe entrepreneurs. The
entrepreneurial solution to this problem is to learn more and to become better
networked, as entrepreneurs stretch their own resources to become better at
things they do not know and develop their networks along the way. If the
211
entrepreneur succeeds in developing either the knowledge absorption or the
knowledge flow, the problem will move to a different quadrant and the solution
might be different. The key determinant here will be commitment to overcome
alleged insurmountable barriers, something entrepreneurs are known to do.
The final row presents the situation in which both knowledge flow and
knowledge absorption capabilities are high for the IU. The advice is to minimize
the marginal costs of knowledge ingression which can mean either absorb
(slightly more likely for objects) or escalate (slightly more likely for holders) but
it will depend on the constitution of the IU. As suggested at the end of section
III-5.3, the marginal costs associated with holder search will depend on the
unit of analysis. They will be chiefly determined by collaboration execution
costs when an individual aims to escalate to a team, by institutional support
costs when the team plans to escalate to a firm, by all flow costs when a dyad
needs to be formed and by the knowledge structure if open innovation is on the
agenda. The latter is however a less likely scenario because the focal
organization would basically abstract from its high flow capability. Once the
escalation to a different unit has occurred, it is likely that further escalation
within those boundaries (e.g. adding team members, including additional firm
divisions) will face rather low escalation costs when additional knowledge needs
to be acquired.
In general, socially complex knowledge cannot easily be extracted from its
owners. It is frequently tacit so that it requires some form of interaction with
others to access it. However, to what extent IUs find it easy or hard to access
specific complex knowledge depends in the IU’s idiosyncratic capabilities. IUs
212
might find it relatively easy to access socially embedded knowledge in a
network of information in which they perform a brokerage function or are in
central positions with wide reach (Grigoriou and Rothaermel, 2014). Hence
what matters is not strictly whether the knowledge is socially complex or not,
but whether the IU occupies a space in the knowledge structure that permits
exploiting these complex resources by accessing the relevant holders.
Giuri et al. (2007) for instance find that in Europe, universities and
public research labs are scarcely used knowledge holders. However, the
scientific literature is a much valued and used source of creative inspiration
(Fleming and Sorenson, 2004). As they argue “the links with universities or
public research labs require effort and investment in establishing relationships”
whereas the “scientific literature is readily available provided that one has the
required absorptive capacity” (Giuri et al., 2007, p. 1117). So for an IU that
does not build bridges to those complex sources, the tacit knowledge from
universities and research labs remains inaccessible, whereas the scientific
literature is to a great extent available in embodied objects (published papers).
In summary, an IU can develop necessary R&D skills or focus on network
resources as an alternative strategy. Ahuja et al. (2008) convincingly showed
that the ratio of costs for internal development of distant versus similar
technology is the key determinant of whether or not collaboration makes sense
(p. 35 – 38). Extending their perspective, I propose that inventive units do not
simply consider the cost of internal development but look at the total ingression
costs of acquiring a new knowledge component. Even if they realise no other
entity possesses the needed component, collaboration can still be the best
213
option if a willing partner can be found who is much better placed to turn an
unfamiliar piece of knowledge into a familiar component. Such a partner can
then help the focal IU integrate that new component into the problem-solving
endeavour. Of course, such collaborations come with high risk, especially when
it comes to appropriation. Hence whether an IU will go it alone or include
another holder will be determined by the trade-off in ingression costs of flying
solo versus collaborating. I hope future research will further unpack and test
the importance of specific ingression costs in predicting the escalation of the
unit of invention.
III - 6: Conclusion
This chapter conceptualised the inventive process as a process of
escalating recombinant search. Following recent contributions from Rothaermel
and colleagues (Grigoriou and Rothaermel, 2014; Rothaermel and Boeker,
2008; Rothaermel and Hess, 2007), I propose an evolutionary model of search
in which the inventing unit escalates over time through search so that the final
unit of invention is the result of an iterative search process for knowledge
components. This means that multi-level studies in which multiple levels of
invention (e.g. individual, team, firm, and/or network) are needed to better
understand the differences in innovative output.
I proposed that 1) search as process is an understudied phenomenon, 2)
the searcher is assumed to be stable and non-changing, and 3) the object of
search can have agency (a knowledge holder), which commonly holds for
knowledge that is tacitly controlled by individuals, or that is dispersed within a
complex knowledge structure. These realisations infused an evolutionary
214
perspective in which the inventing unit escalates from a single individual with a
half-hunch to a larger entity in an iterative fashion, constantly changing the
relative importance and the barriers imposed by knowledge articulation,
knowledge flow, and knowledge absorption. I submitted that one can
understand escalating recombinant search as a process that aims to navigate
the knowledge structure at minimal ingression costs and in doing so creates an
engine for escalating the inventing unit. These ingression costs are determined
by the inventing unit’s idiosyncratic capabilities to facilitate knowledge flow,
and absorption.
215
IV – CHAPTER FOUR: CONTRIBUTIONS TO AND REFLECTIONS ON KNOWLEDGE
Reflecting on the contributions to knowledge of this dissertation on
“individual and organizational effects of knowledge production”, I can only be
reminded of and humbled by Aristotle’s statement in his book “On the Heavens,
Manual of Greek Mathematics”:
“It is not once nor twice but times without number that same ideas make their
appearance in the world” (Aristotle, c. 330 BC)
In the world of management, this idea has itself been recycled and
reinvented by amongst others Schumpeter (1942), Nelson and Winter (1982),
and those more current authors in the field of recombination (Katila, Ahuja,
Fleming, Singh, Nerkar, Yayavaram, Kaplan, Vakili, …). However, as Magee
(2005) argued, a strictly combinatorial approach ignores the creativity required
to repackage old ideas into new ones by reapplying them to new and previously
unimagined fields of enquiry. I can only hope that to some extent this
dissertation passes that bar.
I have proposed that invention can be understood as a process of
escalating recombinant search, in which the sought knowledge can be provided
by knowledge objects that are accessible in the knowledge structure or by
knowledge holders who can be integrated within the inventing unit. I proffer
that these two processes are iterative and interdependent so that the evolution
of the searching unit should ideally be studied in conjunction with the search
for information. Empirically however, such a study requires data that are not
easily accessible so I have not yet been able to test the model I am proposing.

216
However, the two empirical studies I did conduct were instrumental in my
ability to conceive of the invention process in the way I did. Conducting first a
study on collaboration and then a study of recombination gave rise to some
cognitive dissonance. While both studies clearly have their own identities, there
was a bigger picture lurking behind the scene that had escaped me. As is often
the case, the whole is more than the sum of its parts. That is exactly the
creativity needed in component combination and I think my personal search
process in combination with the foundational building blocks underlying the
two first chapters provide some qualitative evidence for my third chapter. I was
of course not allowed to escalate the unit of invention, although discussions
with Gerry and some other colleagues surely helped in the articulation of my
ideas. Whether or not I succeeded in making them entirely clear to anyone is
still to be seen, but I have at least some hope that this dissertation is an
intelligible document with some valuable insights.
Building on earlier work in matching theory and preference rating (Gale
and Shapley, 1962; Herrnstein, 1961), I investigated how individual
characteristics influence collaboration preferences. Improving our
understanding regarding collaboration preferences is fundamental to capturing
joint knowledge production. While most extant research has looked at existing
collaborations and derived antecedents to collaboration ex post (Stuart and
Sorenson, 2007), this line of reasoning is subject to positive selection bias
because only established collaborations are considered (Mindruta, 2013).
Criscuelo et al. (2014) make a similar point about the selection bias inherent in
217
the research on patenting: only patented inventions are considered so there is
heavy trimming on the negative outcome side.
While the ex post rationalization of organizational similarities or
complementarities may indeed provide fruitful ground to explain why particular
forms of joint knowledge production are successful, they do not necessarily
shed light on what enables joint knowledge production in the first place. In this
light, Boudreau et al. (2014) suggested that the dynamics underlying the
formation of ties might consist of entirely different elements than those
determining the success of such collaborations. My first chapter has tried to
illuminate those determinants of joint knowledge production ex ante, i.e. before
any collaboration comes into existence. The conjoint analysis methodology
allowed me to expose respondents to various hypothetical scenarios and deduce
the important elements within those scenarios that affect their preferences.
Although the relationship between individual preferences and actual
organizational behaviour is not straightforward (Powell et al., 2013), the
formation of inter-organizational (and intra-organizational) partnerships is
fundamentally a process that involves human interaction.
I found that individual aspirations as well as an individual’s relational
capability were crucial determinants of that person’s general predisposition
towards collaboration and thus towards joint knowledge production. Perhaps
these results are unsurprising, but within management research at least, our
main attention has been to the domain knowledge of the individual, e.g. to what
extent a scientist is a star researcher in his or her field (Hess and Rothaermel,
2011; Zucker and Darby, 2006). The findings suggest that at the individual
218
level, idiosyncratic complementary resources and attitudes are drivers of
collaborative preferences and potentially success as well (see Hess and
Rothaermel, 2011; Singh and Fleming, 2010). This challenges the primacy of
domain knowledge and absorptive capacity in much organizational research.
My process model suggests, following Postrel (2002) and Ahuja et al.
(2008), that an actor’s capability to learn and assimilate knowledge could be
substituted by an actor’s capability to locate and collaborate with knowledge
holders. This raises important questions about the contingencies that affect
how both capabilities will influence invention results. We know from Tsai
(2001) that two-directional interorganizational network centrality increases a
unit’s knowledge productivity and that this effect is strengthened by the unit’s
absorptive capacity. From an individual’s perspective, this raises questions
about what to invest in? If both becoming a domain expert (knowledge
absorption) and becoming a central network figure (knowledge flow) serve as
partial substitutes in invention, how does one have to allocate its time and
resources optimally and under what contingencies? It seems probable that the
optimal choice will involve some kind of threshold behaviour such that a
minimum of either absorption or flow is necessary to succeed. Depending on
the career stage, different thresholds might form stair-like functions rather
than simple linear models.
Investigating such questions will require more complex methods such as
spline functions or potentially tree models with random forests (Gareth et al.,
2013; Hastie, Tibshirani, and Friedman, 2008), something I have been
experimenting with in the last year. Methodologically, this dissertation
219
reintroduced conjoint analysis to innovation studies. I believe this is a valuable
method / research design to add to the management field’s arsenal and will
discuss its merits in some more detail in a subsection later.
Focusing on recombination, the second chapter suggests that innovative
success is rooted in a combination of familiar combinations and unfamiliar
components that are added, subtracted, reconfigured, or replaced. These four
methods underline the importance, not only of knowledge component
recombination in the invention process, but also of the linkages between
different components that have been used together in the past. In my process
model, combinations of components have not been explicitly included. This is
not to say that they are not important. Much recent research has focused on
such recombinations or coupling of knowledge components and found
combination-specific experience has an impact on innovation (e.g. Fleming,
2001; Fleming and Sorenson, 2001; Yayavaram and Ahuja, 2008; Yayavaram
and Chen, 2013). Also Eisenhardt (1989b) suggested that in fast paced
environments, decision-makers that considered multiple alternatives at once
were more likely to succeed. There is thus little doubt that combinations
matter.
Within the recombinant search process I proposed, the engine of search
is the inventing unit’s current knowledge base. Both failed and successful
previous combinations are an important part of this knowledge base. Also, it
could be argued that frequently used combinations behave as an individual
component within the inventor’s mind. Gorman and Carlson (1990) for instance
stated that Edison had various mental maps that served as guidelines to his
220
thinking: “Edison liked to use a double-action pawl to convert rectilinear
motion to rotary motion and he employed such pawls in inventions ranging
from his stock tickers to his first motion picture machine” (p. 141). This is the
kind of constructive tinkering with existing combinations Magee (2005) was
talking about when he proposed analogical thinking as a mechanism that
drives creativity. I thus submit that familiar combinations become an integral
part of the inventor’s knowledge base. They can be challenged when new
knowledge holders join the inventing unit, disconfirmed by object search, or
potentially fall through the cracks when attempting to integrate the familiar
combination with new components, leading to processes such as replacement
or subtraction as described in the second chapter.
The empirical findings in the semiconductor industry also suggested that
the time between consecutive inventions (the combination-recombination
pathway) mattered. The temporal lapse between two consecutive inventions has
a negative influence on the impact of the recombination (recycled or renewed
invention). Before considering the duration of the invention process this finding
initially puzzled me. I had assumed this effect would be curvilinear (inverted U-
shaped) because of the need for learning in between two inventions. In the
extreme case, a negative linear effect suggests that the highest impact for a
recombination will be for the one that is applied for one day after the original
patent. When thinking about this in a quantitative way (assuming, as patent
research does, that the entire invention process is condensed into a single
moment in time), this finding is hard to swallow. A grace period between two
consecutive inventions that build upon one another should be beneficial to the
221
learning curve, much like the submission and resubmission of a manuscript in
the academic publication process.
The process model however suggests an alternative explanation. First,
the timing of the submission of the patent is subject to orchestrating
organizational support for the invention (Criscuelo et al.¸2014). Additionally,
the timing of the submission does not teach us anything about the duration of
the antecedent iterative search process. Understanding invention as a process
clarifies that both patents are likely the outcome of overlapping and iterative
search projects in which various inventors within the semiconductor firm
combine and recombine knowledge components in various ways. Hence, the
learning is concurrent and two sequential and related inventions can be
offspring of the same project, with the one who gets submitted first the most
important one that near the end of the invention process gains most attention
from the inventors involved. This reasoning is consistent with the theoretical
argumentation I made in the first chapter around how individuals will develop
higher preference for collaboration when they have higher perceived
behavioural control of the outcome (Siegel, 1957). When inventors have more
faith in one trajectory than in another, they will pursue the favourite pathway
more rigorously and with more urgency. Hence, the first patent could be the
first merely because of this selection process.
The process model provides also an additional rationale for why renewed
inventions would fare worse (as found in chapter two). The specific component
combination gets tested and retested several times until a satisfactory outcome
is found that results in a patent application. An alternative iteration trajectory
222
that was temporarily benched (because it was less promising) used a similar
combination with an additional component (renewed inventions in chapter two).
After the filing of the initial patent, the alternative trajectory is finished and
submitted to the USPTO as well, perhaps mainly to protect the initial patent.
Such a patent is more negatively affected by temporal lapse than a recycled
invention. The more time evolves, the more the renewed invention components
get experimented with which could improve the quality, but the inventors also
risk losing track of the benefits of the initial combination as organizational
memory dissipates or as experimentation breaks the linkages that made the
initial invention successful. Staying closer to the original invention (recycling
invention in chapter two) is presumably simpler cognitively and the knowledge
about that original invention dissipates more slowly over time.
Future research could then investigate whether the negative effect of time
on recombination is reinforced by inventor overlap. This would provide support
for a process-based hypothesis in which inventors select which invention to
push through first and in which cognitive overlap diminishes attention to the
second follow-up invention. A curvilinear prediction could be made using a
learning-based hypothesis, i.e. inventors learn from previous inventions and
some time in between two consecutive inventions will prove beneficial to
invention until after some period the time in between two consecutive
inventions annihilates the learning benefits. Such a hypothesis would be
consistent with literature that (implicitly) presumes that the invention happens
at the time of the patent application rather than during an unknown period
before.
223
After this short discussion of the key insights in this dissertation, I
review five specific contributions I believe this dissertation makes. The first
three stem chiefly from chapter one, the second two from chapter two, and
ideas from the third chapter pop up in all five.
IV - 1.1: Contributions to University – Industry Collaboration Research
I have extended research on collaboration between commercial
organizations and universities (Geisler, 1995). Such research typically focuses
on why firms collaborate with universities (e.g. Hanel and St-Pierre, 2006) or
why universities collaborate with firms (Santoro and Gopalakrishnan, 2001) or
why academic scientists collaborate with each other (Bozeman and Corley,
2004), but very little research has investigated why and under what
circumstances, firms prefer to ally with other firms or with universities and vice
versa. Also, most research in the university-industry intersection focuses on
large firms, with some exceptions (e.g. Fontana et al., 2006; Hadjimanolis,
2006). The research extends this field in three ways. Firstly, by not only
focusing on large organizations we increase understanding of the drivers of
SME collaboration preferences. I did not find any notable differences between
smaller and larger organizations but I did find that overall university
respondents are more favourable towards collaboration within the knowledge
transfer network than firms are. Secondly, by introducing matching theory and
especially preference rating to university-industry collaborations I extend the
theoretical framing of the field beyond the more common resource-based and
institutional perspectives (Boardman, 2009). Thirdly, the chosen approach laid
bare some differences between drivers of collaborative R&D projects. As the
224
research design invited firm and university respondents to rate scenarios that
included collaboration with either organization type, it provided some insights
into preferences for institutional similarity.
Despite the common belief that firms join knowledge transfer networks to
collaborate with universities, I found in an unreported regression that
institutional similarity is a significant predictor of preferences for firm
respondents but not for university respondents who seem to be indifferent
between collaborating with either a firm or another university. Preference for
institutional similarity was especially strong for SMEs as they drove the
similarity effect completely. This adds to research that compares the relative
preference of firms over universities as collaboration partners. Bercovitz and
Feldman (2007) for instance found that firms prefer to work with universities
rather than other firms when conflicts over intellectual property are likely. Also,
the finding confirms that SMEs are indeed less interested in collaborating with
universities (Woolgar et al., 1998). Further research should delve deeper and
investigate for which specific collaboration goals firms prefer firms over
universities and vice versa.
IV - 1.2: Contributions to Behavioural Foundations of Strategy
The assumption in strategy has often been that we cannot say anything
about individual preferences, which explains the lack of research on how
individuals make choices that shape networks (Kilduff and Brass, 2010) and
strategic action (Felin and Foss, 2005). Thus, most research on the antecedents
of collaboration and collaborative knowledge production has ignored
collaborator characteristics. I theorized that individual aspirations influence
225
collaboration preferences (in a U-shaped form) and that relational capability,
captured by networking skills, openness, and network information, affect an
individual’s perceived probability of success which in turn will affect the
individual’s preference (Siegel, 1957). In doing so, relational capability
dimensions moderate the aspiration-gap – preference relationship.
Behavioral strategists have argued that strategic decision-making
matters exactly because differences between individuals perpetuate
organizational heterogeneity (Bromiley, 2009; Levinthal, 2011). Recent
attention turned to behavioral and psychological foundations of dynamic
capabilities (Abell et al., 2008; Hodgkinson and Healey, 2011; Winter, 2012).
The second part of the first chapter adds to the behavioral foundations of
collaboration. Especially within sciences, complementary relational capability
may be a crucial component in the process of collaborative knowledge
production and can partially compensate for partner quality and dyadic trust.
In the terminology of the process model proposed in chapter three, knowledge
flow capabilities regarding coordination execution and formation could partially
offset an initial lack of mutual trust and knowing where to look or network
information can compensate for inferior capabilities regarding domain
knowledge. Future research could disentangle the importance of trust versus
openness or domain expertise (high knowledge absorption) versus networking
skills (see for instance Grigoriou and Rothaermel (2014) and Gruber et al.
(2013)).
It is not self-evident to extend individual preferences to a higher level of
analysis. Powell et al. (2011) argued that behavioral researchers must avoid the
226
trap of simplistic “mental scaling” in which an organization’s actions
correspond to an individual’s decisions. How much aspirations, relational
capability, and preferences contribute to actual collaborations is a matter for
future longitudinal research. My ambition was to show that the complex
aspiration-gap – capability - preference relation is likely to play a significant
role in determining whether scientific collaborations come into existence in the
first place. Chapter three provides an evolutionary perspective that could be
interpreted as complex mental scaling, in which the actions of one individual
with a hunch escalate into team, firm, dyadic, or open forms of knowledge
production.
Turning preference into action faces three obstacles: (1) Not every
organization wants to work with your organization (Mindruta, 2013); (2)
Internal power dynamics can affect the likelihood of a specific person setting up
a collaboration; and (3) Preference mismatches abound. The significant signs
for respondents being respectively more (b = -0.23, p ≤ 0.05) or less (b = 0.22, p
≤ 0.05) senior than a potential partner (Model 5, table I-4) suggest that much of
the research findings on similarity are likely to be a consequence of a dynamic
in which people only want to work with someone who is as at least as “good” as
them. This could inspire future research on homophily and similarity. Is what
we observe a consequence of preferences or a consequence of negative selection
in the partner pool? Additionally, Phillips, Tracey, and Karra (2013) suggest a
third option: homophily can be a strategic rather than subconscious process. In
their entrepreneurial case study, they found that entrepreneurs can
deliberately exploit potential homophily through engaging in narrative identity
227
work based on varied sources of similarity. Whether an ego’s homophilous ties
are strategically designed, the consequence of subconscious preference, or
determined by negative partner selection is likely to impact how and whether
such ties affect innovative output.
IV - 1.3: Contributions to Methods: Conjoint Analysis and Beyond
My co-authors and I are among the first to use conjoint analysis in
innovation studies (Riquelme and Rickards, 1992). This method allows for the
weighing of complex match characteristics, embedded in different scenarios
(Green, 1984; Green et al., 1981; Green et al., 2001; Green and Srinivasan,
1978, 1990; Green and Wind, 1975). In doing so, it explicitly incorporates
important interactions between different attributes in a not necessarily linear
way. Unlike the individual attributions of characteristics’ importance, the
conjoint approach compares and weighs more realistic scenarios to derive
actual preferences. This methodology thus provides a novel way of investigating
preferences, perceptions and judgements of companies that could prove fruitful
in different managerial fields.
The results of the conjoint analysis demonstrate a more complex
interdependency among preferences than has previously been identified,
suggesting that it is not only important to take various attributes into account
in predicting network members’ preferences, but also to consider the weighting
of these attributes in the preference function. However, the method has some
drawbacks as well. It is for instance important to note that our findings in the
first part of chapter I are dominated by research funding. Implicit in the
methodology of conjoint analysis, is the belief that people are able to weigh
228
different attributes of a focal object or scenario (Green et al., 2001). When one
of the attributes appears to be non-compensatory, in that it forms a threshold
(Riquelme and Rickards, 1992), this has a severe impact on the appreciation of
the other characteristics. Future research that uses conjoint analysis could
improve granularity of findings by developing scenarios in which specific
attributes that are expected to be non-compensatory, are excluded or analysed
differently. This would allow for greater variance amongst the compensatory
attributes.
As hinted at before, regression models are generally ill-suited to
incorporate discrete choice behaviour because they presume linearity. In other
words, it is hard to find a regression that is able to untangle the following
statement: if A happens, then I care about B and C; if A does not happen, B
still matters a little bit, C does not matter at all but D becomes crucial. While
two-way and three-way or even more complex interactions are possible and
increasingly used, the complications in interpretation and the methodological
accuracy of such interactions is questionable. Tree models provide an
interesting method that has so far escaped management scholars’ attention.
The tree model branches on the variable that explains the highest variance in
the response and splits the sample accordingly. This process repeats itself until
a specific tree length is obtained that has an acceptable error rate. The three
can afterwards be pruned to ensure better out-of-sample fit if necessary, or
alternative methods such as boosting and random forests can be used to
increase the explained variation. Such models are potentially useful for
decision-making if one presumes decisions are made based on threshold
229
behaviour. Within management, the likelihood that the occurrence of a specific
event affects which strategic variables matter does not seem farfetched. It is my
hope to look further into these possibilities in the future.
In the second part of chapter one, I use conjoint analysis in a novel way.
By explicitly controlling for all scenario aspects and focusing on the individual’s
propensity to collaborate, I managed to explain some of the individual random
effect variance found in the first part of this chapter. In this way I used conjoint
analysis not to delve into product (or scenario) attributes as it is commonly
used (Green et al., 2001) but to expose individual predispositions that are
transparent in the attributed ratings but do no stem from the product (or
scenario) attributes. This could be a meaningful way of using the methodology
in marketing, innovation, and entrepreneurship research in the future, when
the goal is to expose individual (fixed effects) characteristics that impact on
intentions, decision-making, and actions.
I also proposed some new and simple metrics to analyse the goodness of
fit for models with count variables as response variables. The measures showed
high correlation with established measures such as AIC but are, in my eyes,
more meaningfully interpreted as they specifically serve to explain deviations
from count variables. Graphic representation of errors is something that is
rather uncommon in managerial research. No single paper I read in the course
of the PhD has graphically represented errors (except perhaps for logit models)
while this is often a much more intuitive way to judge model fit than an AIC,
Log Likelihood or even adjusted R-square statistic. Another research project on
patent data in the pharmaceutical sector has taught me how difficult it is to
230
appropriate control for time- and firm-specific effects when using such
(negative binomial) data. Researchers could improve methodological rigour,
especially in panel data sets by providing a scatterplot of the errors and
explaining how they solved (or tried to solve) the tendency of errors to trend
upward or downward in such settings.
IV - 1.4: Contributions to Recombination Research
Chapter two contributes to the literatures on organizational learning and
to the resource-based view of the firm. While a focus on the benefits and
drawbacks of both exploration and exploitation has persisted ever since
March’s (1991) seminal work, different forms of exploitation and their
implications have received relatively less attention (Katila and Ahuja, 2002).
Exploitation can be beneficial because opportunities exist for firms to combine
existing components to generate new inventions (Schumpeter, 1939), and these
solutions can at times outperform explorative efforts (Henderson and Clark,
1990). A contribution to this stream of literature is the differentiation between,
and description of four different ways in which a firm can exploit its existing
knowledge resources to generate valuable inventions; namely subtraction,
reconfiguration, addition, and replacement.
The study also extends work on experiential learning. Previous efforts in
conducting certain tasks allow firms to later benefit from their accumulated
experiences for learning new and related knowledge (Bruneel, Yli‐Renko, and
Clarysse, 2010; Cohen and Levinthal, 1990). Because recombination involves
the re-use of combinations, a firm can draw on its prior knowledge to generate
new innovations. The submitted research findings suggest that when it comes
231
to recombinative inventions, more recent experiences are favourable. Also, the
regression analysis suggests that efficacy of learning from experience varies
with the inventive activities (recycling or renewing). As discussed above, the
interpretation of these findings is contingent on the assumptions made about
the importance of the inventive process. I have provided some alternative
suggestions in the beginning of this final chapter.
Apart from experiential learning, the chapter also contributes to the
literature on vicarious learning. The outcomes of vicarious learning and
experiential learning on innovation are often examined in separation. However,
this study demonstrates how the two complement one another. Specifically, the
findings on search show that a firm that absorbs more knowledge from the
environment in which it operates generates combinative inventions with greater
value. Thus, even when a firm uses its previously accumulated knowledge as a
base for generating new inventions, it can benefit from being aware of
technological advances that take place externally, and from being able to learn
from these advances. Furthermore, the extent to which experiential learning
and vicarious learning complement one another varies according to the
different types of recombinations.
In the process model, vicarious learning is an outcome of object search
that inspired the iterative reintegration of components. As discussed above, the
process model presented is not entirely consistent with the reasoning suggested
in chapter two. In that way it exactly exemplifies the process of invention:
knowledge components get recombined and alter the perception of how they
work together. If this new perception becomes validated over time, a previous
232
theory gets falsified. However, as Mitchell and James (2001) point out, the field
of management has been particularly bad at falsification of theories. While
some theories fare better than others most review papers suggest that support
for a specific theory is found in about 50% of published papers, which clearly
provides a biased sample of research (success bias).
The process model has been a pure thought exercise, a combination of
knowledge components deduced and derived during a three year long process
of immersion into the wonderful world of management scholarship. It has not
been tested so it has no place in confirming or disconfirming any theory. This is
why I left the second chapter unaltered after completing the final chapter;
perhaps hoping that this artefact that I entrust the knowledge structure with
would somehow reflect the cognitive dissonance in my own mind.
IV - 1.5: Implications for Managers
Finally, I believe this dissertation offers a number of insights that are
noteworthy from a managerial perspective. When it comes to generating new
and creative ideas, innovators and managers are often asked to think outside
the box, and this detracts attention from thinking “inside the box” (Boyd and
Goldenberg, 2013a, 2013b). This study offers insight into how firms and
inventors can generate useful inventions by finding inside-the-box solutions,
and the importance of doing so. Specifically, I showed how four different
knowledge combinations can transform old inventions into new inventions, and
how each of these lead to more valuable inventions than if a firm were to invent
using a combination of components that it is unfamiliar with.
233
The results of the influence on temporal lapse and external search offer
other managerial implications. Specifically, they suggest that while prior
experience is important, there is a tendency for organizations to forget
experiences that were accumulated in the distant past, and this negatively
influences innovation. This finding emphasizes the importance of investing in
knowledge management systems that allow a firm to efficiently retrieve and
reuse knowledge and insights from its prior inventions (Ahuja et al., 2013;
Garud and Nayyar, 1994; Hansen et al., 1999). Finally, the study also
emphasized the importance of external search, even for inside-the-box
innovations; making it important for firms to invest in R&D and other related
activities which have been shown to enhance absorptive capacity and adding to
the consensus that finding a balance between exploitation and exploration is
important to create value (Gupta, Smith, and Shalley, 2006). As argued by
Posen and Levinthal (2012), depending on the conditions of the environment in
which the firm operates, environmental change can be a call to greater to
adaptation and to renewed focus on existing capabilities.
With regards to the first and the third chapter, the main implications are
for managers and researchers who are engaged in knowledge production.
Although it might be a bridge too far to suggest that collaboration preferences
automatically translate in collaborations; it seems less farfetched to argue that
collaboration preferences will increase the likelihood of future collaborations.
Also, while the escalating recombinant search model I proposed did not
explicitly include aspirations, I did talk about how slack and distress search
influence associated costs. Hence, collaboration preferences might be evident in
234
knowledge flow capabilities. Findings in chapter one suggested that these
relational capabilities did correlate to preferences so this seems a reasonable
position to take. Therefore, preferences are likely to affect the costs associated
with holder search and perhaps influence the knowledge flow capabilities as
well (people are often better at what they like doing).
If so, the advice seems to be that to do well, two complementary
pathways exist. Individuals can become domain experts and become attractive
partners because of their high knowledge absorption, or can become relational
stars whose main capability is interconnecting (see Grigoriou and Rothaermel,
2014). The best trajectory will be correlated with an individual’s idiosyncratic
preferences, which is something to be cheerful about. Postrel (2002) suggested
that both can serve as substitutes in the knowledge production process. As
long as there are enough specialists, there will be a need for connectors. As
such, he suggested that the knowledge-based view, the foundational theory
that underlies much of what I have written in this dissertation, suggests that
management is concerned with “selecting, operating, and governing, islands of
shared knowledge in a sea of mutual ignorance” (p. 304).
Thus, managers either have to be those individuals who navigate the
ocean and bring specialists together, or be smart enough to realize that a room
full of incredible smart researchers does not make an invention. Breaking the
departmental, divisional, and domain barriers down is not easy (see Boudreau
et al., 2014) but it is probably not necessary. As long as there are people who
can slip through the walls and connect distant ideas using analogical thinking
(Magee, 2005) or any other mechanism that instills creativity, invention will

235
continue to happen and Jones’ (2009) burden of knowledge is not that
problematic, because it is also that burden that pushes us deeper into
understanding new and exciting things about the world at large.
Finally, while I have not formally attempted that, I have implied that it
could be possible to mathematically devise a heuristic that helps in making the
optimal decision for the invention unit. While turning knowledge absorption
and knowledge flow costs into actual numbers is undoubtedly a challenging
endeavour, there might be smarter people than me interested in trying. I would
welcome such endeavors. Perhaps more importantly, the process model has
some normative implications. Managers can assess to the best of their ability
the skillsets of their co-workers and see whether knowledge absorption,
articulation, or flow capabilities are most present and most absent and adjust
their hiring policies or internal training and education programs to give their
organization the best chance to succeed in the future.
236
V – REFERENCES
Abell P, Felin T, Foss N. 2008. Building micro-foundations for the routines, capabilities, and performance links. Managerial and Decision Economics 29(6): 489-502. Agrawal AK, Goldfarb A. 2008. Restructuring research: Communication costs and the democratization of university innovation. American Economic Review 98(4): 1578-1590. Agresti A. 2002. Categorical Data Analysis. John Wiley & Sons: Hoboken, New Jersey.
Ahuja G. 2000a. Collaboration networks, structural holes, and innovation: A longitudinal study. Administrative Science Quarterly 45(3): 425-455. Ahuja G. 2000b. The duality of collaboration: Inducements and opportunities in the formation of interfirm linkages. Strategic Management Journal 21(3): 317-343. Ahuja G, Katila R. 2001. Technological acquisitions and the innovation performance of acquiring firms: A longitudinal study. Strategic Management Journal 22(3): 197-220. Ahuja G, Lampert CM. 2001. Entrepreneurship in the large corporation: A longitudinal study of how established firms create breakthrough inventions. Strategic Management Journal 22(6‐7): 521-543. Ahuja G, Lampert CM, Novelli E. 2013. The Second Face of Appropriability; Generative Appropriability and its Determinants. Academy of Management Review 38(2): 248 - 269. Ahuja G, Lampert CM, Tandon V. 2008. 1 Moving Beyond Schumpeter: Management Research on the Determinants of Technological Innovation. The Academy of Management Annals 2(1): 1-98. Ajzen I. 1991. The theory of planned behavior. Organizational behavior and human decision processes 50(2): 179-211. Albert MB, Avery D, Narin F, McAllister P. 1991. Direct validation of citation counts as indicators of industrially important patents. Research Policy 20(3): 251-259. Aldrich HE, Fiol CM. 1994. Fools rush in? The institutional context of industry creation. Academy of Management Review 19(4): 645-670. Aldrich HE, Kim PH. 2007. Small worlds, infinite possibilities? How social networks affect entrepreneurial team formation and search. Strategic Entrepreneurship Journal 1(1-2): 147-165. Alexy O, George G, Salter A. 2013. Cui Bono? The Selective Revealing of Knowledge and its Implications for Innovative Activity. Academy of Management Review 38(2): 270-291. Allio RJ. 2004. CEO interview: the InnoCentive model of open innovation. Strategy & Leadership 32(4): 4-9. Almeida P, Phene A. 2004. Subsidiaries and knowledge creation: The influence of the MNC and host country on innovation. Strategic Management Journal 25(8‐9): 847-864. Alnuaimi T, Opsahl T, George G. 2012a. Innovating in the periphery: The impact of local and foreign inventor mobility on the value of Indian patents. Research Policy 41(9): 1534-1543. Alnuaimi T, Singh J, George G. 2012b. Not with my own: long-term effects of cross-country collaboration on subsidiary innovation in emerging economies versus advanced economies. Journal of Economic Geography 12(5): 943-968. Alvarez SA, Barney JB. 2007. The entrepreneurial theory of the firm. Journal of Management Studies 44(7): 1057-1063.
237
Amabile TM. 1988. A Model of Creativity and Innovation in Organizations. In Research in Organizational Behavior. Staw BM, Cummings JN (eds.), JAI: Greenwich, CT. Anand N, Gardner HK, Morris T. 2007. Knowledge-based innovation: emergence and embedding of new practice areas in management consulting firms. Academy of Management Journal 50(2): 406-428. Ancori B, Bureth A, Cohendet P. 2000. The economics of knowledge: the debate about codification and tacit knowledge. Industrial and Corporate Change 9(2): 255-287. Andriopoulos C, Lewis MW. 2009. Exploitation-exploration tensions and organizational ambidexterity: Managing paradoxes of innovation. Organization Science 20(4): 696-717. Ansoff I. 1979. Strategic Management. Macmillan: London. Appleyard MM. 1996. How does knowledge flow? Interfirm patterns in the semiconductor industry. Strategic Management Journal 17: 137-154. Argote L, Beckman SL, Epple D. 1990. The persistence and transfer of learning in industrial settings. Management Science 36(2): 140-154. Argyres N. 1996. Capabilities, technological diversification and divisionalization. Strategic Management Journal 17(5): 395-410. Argyres NS, Silverman BS. 2004. R&D, organization structure, and the development of corporate technological knowledge. Strategic Management Journal
25(8‐9): 929-958. Arrow K. 1962. Economic welfare and the allocation of resources for invention. In The Rate and Direction of Inventive Activity: Economic and Social Factors. Universities-National Bureau (ed.), Princeton University Press: Princeton. Bandura A. 2012. On the functional properties of perceived self-efficacy revisited. Journal of Management 38(1): 9-44. Baptista R, Swann P. 1998. Do firms in clusters innovate more? Research Policy 27(5): 525-540. Barkema HG, Shvyrkov O. 2007. Does top management team diversity promote or hamper foreign expansion? Strategic Management Journal 28(7): 663-680. Barney J, Felin T. 2013. What are microfoundations? The Academy of Management Perspectives 27(2): 138-155. Barney JB. 1991. Firm Resources and Sustained Competitive Advantage Journal of Management 17(1): 99-120. Barney JB, Hesterly W. 2006. Organizational Economics: Understanding the Relationship between Organizations and Economic Analysis. In The SAGE handbook of organization studies. Sage Publishing: UK. Baron-Cohen S, Wheelwright S, Skinner R, Martin J, Clubley E. 2001. The autism-spectrum quotient (AQ): Evidence from asperger syndrome/high-functioning autism, malesand females, scientists and mathematicians. Journal of Autism and Developmental Disorders 31(1): 5-17. Basalla G. 1988. The evolution of technology. Cambridge University Press: Cambridge, New York. Baum JA, Dahlin KB. 2007. Aspiration performance and railroads' patterns of learning from train wrecks and crashes. Organization Science 18(3): 368-385. Baum JA, Rowley TJ, Shipilov AV, Chuang Y-T. 2005. Dancing with strangers: Aspiration performance and the search for underwriting syndicate partners. Administrative Science Quarterly 50(4): 536-575. Bechky BA. 2003. Sharing meaning across occupational communities: The transformation of understanding on a production floor. Organization Science 14(3): 312-330.
238
Beckman CM, Haunschild PR, Phillips DJ. 2004. Friends or strangers? Firm-specific uncertainty, market uncertainty, and network partner selection. Organization Science 15(3): 259-275. Bercovitz JEL, Feldman MP. 2007. Fishing upstream: Firm innovation strategy and university research alliances. Research Policy 36(7): 930-948. Bierly PE, Gallagher S. 2007. Explaining alliance partner selection: fit, trust and strategic expediency. Long Range Planning 40(2): 134-153. Boardman PC. 2009. Government centrality to university-industry interactions: University research centers and the industry involvement of academic researchers. Research Policy 38(10): 1505-1516. Bogner WC, Barr PS. 2000. Making sense in hypercompetitive environments: A cognitive explanation for the persistence of high velocity competition. Organization Science 11(2): 212-226. Boschma R. 2005. Proximity and innovation: a critical assessment. Regional studies 39(1): 61-74. Boudreau KJ, Brady T, Ganguli I, Gaule P, Guinan E, Hollenberg A, Lakhaini KR. 2014. A Field Experiment on Search Costs and the Formation of Scientific Collaborations, Working Paper
Bowers CA, Pharmer JA, Salas E. 2000. When member homogeneity is needed in work teams a meta-analysis. Small group research 31(3): 305-327.
Boyd D, Goldenberg J. 2013a. Inside the Box. Profile Books: London, UK. Boyd D, Goldenberg J. 2013b. Think Inside the Box. In Wall Street Journal. Online ed. Boyd NG, Vozikis GS. 1994. The influence of self-efficacy on the development of entrepreneurial intentions and actions. Entrepreneurship Theory and Practice 18(4): 63-63. Bozeman B, Corley E. 2004. Scientists’ collaboration strategies: implications for scientific and technical human capital. Research Policy 33(4): 599-616. Bromiley P. 2009. The behavioral foundations of strategic management. John Wiley & Sons. Bruneel J, D’Este P, Salter A. 2010. Investigating the factors that diminish the barriers to university–industry collaboration. Research Policy 39(7): 858-868. Bruneel J, Yli‐Renko H, Clarysse B. 2010. Learning from experience and learning from others: How congenital and interorganizational learning substitute for experiential learning in young firm internationalization. Strategic Entrepreneurship Journal 4(2): 164-182. Burt RS. 1987. Social contagion and innovation: Cohesion versus structural
equivalence. American Journal of Sociology 92(May): 1287-1335. Canato A, Ravasi D, Phillips N. 2013. Coerced Practice Implementation in Cases of Low Cultural Fit: Cultural Change and Practice Adaptation During the Implementation of Six Sigma at 3M. Academy of Management Journal: amj. 2011.0093. Carson SJ, Madhok A, Wu T. 2006. Uncertainty, opportunism, and governance: The effects of volatility and ambiguity on formal and relational contracting. Academy of Management Journal 49(5): 1058-1077. Casciaro T, Lobo MS. 2008. When competence is irrelevant: The role of interpersonal affect in task-related ties. Administrative Science Quarterly 53(4): 655-684. Castanias RP, Helfat CE. 2001. The managerial rents model: Theory and empirical analysis. Journal of Management 27(6): 661-678. Chesbrough H. 2003. The logic of open innovation: Managing intellectual property. California Management Review 45(3): 33-58.
239
Chi T. 1994. Trading in strategic resources: Necessary conditions, transaction cost problems, and choice of exchange structure. Strategic Management Journal 15(4): 271-290. Christensen RHB. 2013. Analysis of ordinal data with cumuulative link models - estimation with the R-package ordinal. Chung SA, Singh H, Lee K. 2000. Complementarity, status similarity and social capital as drivers of alliance formation. Strategic Management Journal 21(1): 1-22. Clarkson G, Toh PK. 2010. ‘Keep out’ signs: the role of deterrence in the competition for resources. Strategic Management Journal 31(11): 1202-1225. Clarysse B, Moray N. 2004. A process study of entrepreneurial team formation: the case of a research-based spin-off. Journal of Business venturing 19(1): 55-79. Clarysse B, Wright M, Lockett A, Mustar P, Knockaert M. 2007. Academic spin-offs, formal technology transfer and capital raising. Industrial and Corporate Change 16(4): 609-640. Coff R, Kryscynski D. 2011. Drilling for micro-foundations of human capital–based competitive advantages. Journal of Management(Special Issue): 1 - 16 Coff RW. 1999. When competitive advantage doesn't lead to performance: The resource-based view and stakeholder bargaining power. Organization Science 10(2): 119-133. Cohen WM, Goto A, Nagata A, Nelson RR, Walsh JP. 2002. R&D spillovers, patents and the incentives to innovate in Japan and the United States. Research Policy 31(8): 1349-1367. Cohen WM, Levinthal DA. 1990. Absorptive capacity: a new perspective on learning and innovation. Administrative Science Quarterly 35(1): 128-152. Conway JM, Lance CE. 2010. What reviewers should expect from authors regarding common method bias in organizational research. Journal of Business and Psychology 25(3): 325-334. Cowan R, David PA, Foray D. 2000. The explicit economics of knowledge codification and tacitness. Industrial and Corporate Change 9(2): 211-253. Criscuelo P, Sharapov D, Alexy O. 2014. Lifting the Veil on Patents and Inventions: Working Paper. Cross R, Cummings JN. 2004. Tie and Network Correlates of Individual Performance in Knowledge-Intensive Work. Academy of Management Journal 47(6): 928-937. Curral LA, Forrester RH, Dawson JF, West MA. 2001. It's what you do and the way that you do it: Team task, team size, and innovation-related group processes. European Journal of Work and Organizational Psychology 10(2): 187-204. Cyert RM, March JG. 1963. A behavioral theory of the firm. Englewood Cliffs, NJ 2.
Daft RL, Weick KE. 1984. Toward a model of organizations as interpretation systems. Academy of Management Review 9(2): 284-295. Das TK, Teng BS. 2000. A resource-based theory of strategic alliances. Journal of Management 26(1): 31-61. Dasgupta P, David PA. 1994. Toward a new economics of science. Research Policy 23(5): 487-521. De Jong JPJ, Freel M. 2010. Absorptive capacity and the reach of collaboration in high technology small firms. Research Policy 39(1): 47-54. Demsetz H. 1988. The theory of the firm revisited. Journal of Law, Economics, & Organization 4(1): 141-161. Deng Y. 2008. The value of knowledge spillovers in the US semiconductor industry. International Journal of Industrial Organization 26(4): 1044-1058. Denrell J, Fang C, Winter SG. 2003. The economics of strategic opportunity. Strategic Management Journal 24(10): 977-990. Dierickx I, Cool K. 1989. Asset stock accumulation and sustainability of competitive advantage. Management Science 35(12): 1504-1511.
240
Ding WW, Levin SG, Stephan PE, Winkler AE. 2010. The Impact of Information Technology on Academic Scientists' Productivity and Collaboration Patterns. Management Science 56(9): 1439-1461. Dosi G. 1982. Technological paradigms and technological trajectories: a suggested interpretation of the determinants and directions of technical change. Research Policy 11(3): 147-162. Dosi G. 1988. Sources, procedures, and microeconomic effects of innovation. Journal of Economic Literature 26(3): 1120-1171. Dougherty D. 1992. Interpretive barriers to successful product innovation in large firms. Organization Science 3(2): 179-202. Droege SB, Hoobler JM. 2003. Employee turnover and tacit knowledge diffusion: a network perspective. Journal of Managerial Issues 15(1): 50-64. Durnell Cramton C. 2001. The mutual knowledge problem and its consequences for dispersed collaboration. Organization Science 12(3): 346-371. Dyer JH, Singh H. 1998. The relational view: Cooperative strategy and sources of interorganizational competitive advantage. Academy of Management Review 23(4): 660-679. Eisenhardt KM. 1989a. Agency theory: An assessment and review. Academy of Management Review 14(1): 57-74. Eisenhardt KM. 1989b. Making fast strategic decisions in high-velocity environments. Academy of Management Journal 32(3): 543-576. Eisenhardt KM, Bourgeois LJ. 1988. Politics of strategic decision making in high-velocity environments: Toward a midrange theory. Academy of Management Journal 31(4): 737-770. Eisenhardt KM, Schoonhoven CB. 1996. Resource-based view of strategic alliance formation: Strategic and social effects in entrepreneurial firms. Organization Science 7(2): 136-150. Embley J. 2013. First ever metal 3D printed gun manufactured in the US. In The Independent. The Independent: online. Fahlenbrach R, Low A, Stulz RM. 2010. Why do firms appoint CEOs as outside directors? Journal of Financial Economics 97(1): 12-32. Felin T, Foss NJ. 2005. Strategic organization: A field in search of micro-foundations. Strategic Organization 3(4): 441. Felin T, Foss NJ, Heimeriks KH, Madsen TL. 2012. Microfoundations of routines and capabilities: Individuals, processes, and structure. Journal of Management Studies 49(8): 1351-1374. Ferris JS, McKee M. 2005. Matching candidates with academic teams: A case for academic tenure. International Review of Law and Economics 25(2): 290-310.
Festinger L. 1954. A theory of social comparison processes. Human Relations 7(2): 117-140. Festinger L. 1962. Cognitive dissonance. Scientific American 207(4): 91-107. Fleming L. 2001. Recombinant uncertainty in technological search. Management Science 47(1): 117-132. Fleming L. 2002. Finding the organizational sources of technological
breakthroughs: the story of Hewlett‐Packard's thermal ink‐jet. Industrial and Corporate Change 11(5): 1059-1084. Fleming L. 2004. Research - Perfecting cross-pollination. Harvard Business Review 82(9). Fleming L, Sorenson O. 2001. Technology as a complex adaptive system: evidence from patent data. Research Policy 30(7): 1019-1039. Fleming L, Sorenson O. 2004. Science as a map in technological search. Strategic
Management Journal 25(8‐9): 909-928.
241
Fontana R, Geuna A, Matt M. 2006. Factors affecting university–industry R&D projects: The importance of searching, screening and signalling. Research Policy 35(2): 309-323. Foss N. 2009. Alternative research strategies in the knowledge movement: From macro bias to micro‐foundations and multi‐level explanation. European Management Review 6(1): 16-28. Foss NJ, Klein PG, Kor YY, Mahoney JT. 2008. Entrepreneurship, subjectivism, and the resource‐based view: toward a new synthesis. Strategic Entrepreneurship Journal 2(1): 73-94. Foxall GR, James VK. 2003. The behavioral ecology of brand choice: How and what do consumers maximize? Psychology and marketing 20(9): 811-836. Foxall GR, Schrezenmaier TC. 2003. The behavioral economics of consumer brand choice: Establishing a methodology. Journal of Economic Psychology 24(5): 675-
695. Fragale AR, Sumanth JJ, Tiedens LZ, Northcraft GB. 2012. Appeasing equals lateral deference in organizational communication. Administrative Science Quarterly 57(3): 373-406. Friel CS. 2006. High Cost of Global Intellectual Property Theft: An Analysis of Current Trends, the TRIPS Agreement, and Future Approaches to Combat the Problem. Wake Forest Intellectual Property Law Journal 7(2): 212 - 250. Gaba V, Bhattacharya S. 2012. Aspirations, innovation, and corporate venture capital: A behavioral perspective. Strategic Entrepreneurship Journal 6(2): 178-199. Gale D, Shapley LS. 1962. College admissions and the stability of marriage. American Mathematical Monthly 69(1): 9-15. Galunic DC, Rodan S. 1998. Resource Recombinations in the Firm: Knowledge Structures and the Potential for Schumpeterian Innovation. Strategic Management Journal 19: 1193 - 1201. Gareth J, Witten D, Hastie T, Tibshirani R. 2013. An Introduction to Statistical Learning with Applications in R, Springer: New York Heidelberg Dordrecht London. Gargiulo M, Benassi M. 1999. The dark side of social capital. In Corporate Social Capital and Liability. Leenders RTA, Gabbay SM (eds.), Springer. Garud R, Nayyar PR. 1994. Transformative capacity: Continual structuring by intertemporal technology transfer. Strategic Management Journal 15(5): 365-385. Gavetti G, Levinthal D. 2000. Looking forward and looking backward: Cognitive and experiential search. Administrative Science Quarterly 45(1): 113-137. Geisler E. 1995. Industry–university technology cooperation: a theory of inter-organizational relationships. Technology Analysis & Strategic Management 7(2): 217-229.
George G. 2005. Slack resources and the performance of privately held firms. Academy of Management Journal 48(4): 661-676. George G, Kotha R, Zheng Y. 2008. Entry into insular domains: A longitudinal study of knowledge structuration and innovation in biotechnology firms. Journal of Management Studies 45(8): 1448-1474. George JM, Jones GR. 2000. The role of time in theory and theory building. Journal of Management 26(4): 657-684. Geringer JM. 1991. Strategic determinants of partner selection criteria in international joint ventures. Journal of International Business Studies 2(1): 41-62. Gilsing V, Nooteboom B, Vanhaverbeke W, Duysters G, Van Den Oord A. 2008. Network embeddedness and the exploration of novel technologies: Technological distance, betweenness centrality and density. Research Policy 37(10): 1717-1731. Giuri P, Mariani M, Brusoni S, Crespi G, Francoz D, Gambardella A, Garcia-Fontes W, Geuna A, Gonzales R, Harhoff D. 2007. Inventors and invention processes in Europe: Results from the PatVal-EU survey. Research Policy 36(8): 1107-1127.
242
Goerzen A. 2007. Alliance networks and firm performance: The impact of repeated partnerships. Strategic Management Journal 28(5): 487-509. Gorman ME, Carlson WB. 1990. Interpreting invention as a cognitive process: The case of Alexander Graham Bell, Thomas Edison, and the telephone. Science, Technology & Human Values 15(2): 131-164. Graebner ME, Eisenhardt KM. 2004. The seller's side of the story: Acquisition as courtship and governance as syndicate in entrepreneurial firms. Administrative Science Quarterly 49(3): 366-403. Granovetter M. 1985. Economic action and social structure: The problem of embeddedness. American Journal of Sociology 91(3): 481-510. Grant RM. 1996. Toward a knowledge-based theory of the firm. Strategic Management Journal 17(Winter): 109-122. Grant RM, Baden-Fuller C. 2004. A knowledge accessing theory of strategic
alliances. Journal of Management Studies 41(1): 61-84. Green PE. 1984. Hybrid models for conjoint analysis: An expository review. Journal of Marketing Research: 155-169. Green PE, Goldberg SM, Montemayor M. 1981. A hybrid utility estimation model for conjoint analysis. The Journal of Marketing 45(1): 33-41. Green PE, Krieger AM, Wind Y. 2001. Thirty years of conjoint analysis: Reflections and prospects. Interfaces 31(3): S56-S73. Green PE, Srinivasan V. 1978. Conjoint analysis in consumer research: issues and outlook. Journal of consumer research 5(2): 103-123. Green PE, Srinivasan V. 1990. Conjoint analysis in marketing: new developments with implications for research and practice. The Journal of Marketing 54(4): 3-19. Green PE, Wind Y. 1975. New ways to measure consumers' judgments. Harvard Business Review(July-August): 107 - 117. Greve HR. 2002. Sticky aspirations: Organizational time perspective and competitiveness. Organization Science 13(1): 1-17. Grigoriou K, Rothaermel FT. 2014. Structural Microfoundations of Innovation The Role of Relational Stars. Journal of Management 40(2): 586-615. Gruber M, Harhoff D, Hoisl K. 2013. Knowledge recombination across technological boundaries: scientists vs. engineers. Management Science 59(4): 837-851. Gulati R. 1995. Does familiarity breed trust? The implications of repeated ties for contractual choice in alliances. Academy of Management Journal 38(1): 85-112. Gulati R. 1999. Network location and learning: The influence of network resources and firm capabilities on alliance formation. Strategic Management Journal 20(5): 397-420. Gulati R, Gargiulo M. 1999. Where do interorganizational networks come from?
American Journal of Sociology 104(5): 1439-1493. Gulati R, Sytch M. 2008. Does familiarity breed trust? Revisiting the antecedents of
trust. Managerial and decision economics 29(2‐3): 165-190. Gupta AK, Sapienza HJ. 1992. Determinants of venture capital firms' preferences regarding the industry diversity and geographic scope of their investments. Journal of Business Venturing 7(5): 347-362. Gupta AK, Smith KG, Shalley CE. 2006. The interplay between exploration and exploitation. Academy of Management Journal 49(4): 693-706. Hadjimanolis A. 2006. A case study of SME–university research collaboration in the context of a small peripheral country (Cyprus). International Journal of Innovation Management 10(01): 65-88. Hall BH, Jaffe AB, Trajtenberg M. 2001. The NBER patent citation data file: Lessons, insights and methodological tools, National Bureau of Economic Research. Hall BH, Jaffe AB, Trajtenberg M. 2005. Market value and patent citations. RAND Journal of economics 36(1): 16-38.
243
Hall BH, Ziedonis RH. 2001. The patent paradox revisited: an empirical study of patenting in the US semiconductor industry, 1979-1995. RAND Journal of economics 32(1): 101-128. Hamel G. 1991. Competition for competence and interpartner learning within international strategic alliances. Strategic Management Journal 12(S1): 83-103. Hanel P, St-Pierre M. 2006. Industry–University collaboration by Canadian manufacturing firms. The Journal of Technology Transfer 31(4): 485-499. Hansen M, Nohria N, Tierney T. 1999. What’s your strategy for managing knowledge. Harvard Business Review(March-April): 55-69. Hastie T, Tibshirani R, Friedman J. 2008. The Elements of Statistical Learning, Data Mining, Inference, and Prediction, Springer: New York Heidelberg Dordrecht London. Hausman JA. 1978. Specification tests in econometrics. Econometrica: Journal of the Econometric Society 46(6): 1251-1271. He Z-L, Wong P-K. 2004. Exploration vs. exploitation: An empirical test of the ambidexterity hypothesis. Organization Science 15(4): 481-494. Heinze T, Kuhlmann S. 2008. Across institutional boundaries?: Research collaboration in German public sector nanoscience. Research Policy 37(5): 888-899. Henderson RM, Clark KB. 1990. Architectural innovation: the reconfiguration of existing product technologies and the failure of established firms. Administrative Science Quarterly 35(1): 9-30. Henkel J. 2006. Selective revealing in open innovation processes: The case of embedded Linux. Research Policy 35(7): 953-969. Hern A. 2013. A gun made on a 3D printer has been fired – let's look at this in perspective. In The Guardian. The Guardian: online. Herrnstein RJ. 1961. Relative and absolute strength of response as a function of frequency of reinforcement. Journal of the experimental analysis of behavior 4(3): 267. Herrnstein RJ. 1970. On the law of effect. Journal of the experimental analysis of behavior 13(2): 243. Hess AM, Rothaermel FT. 2011. When are assets complementary? Star scientists, strategic alliances, and innovation in the pharmaceutical industry. Strategic Management Journal 32(8): 895-909. Hicks D. 1995. Published papers, tacit competencies and corporate management of the public/private character of knowledge. Industrial and Corporate Change 4(2): 401-424. Hirshleifer J. 1973. Where are we in the theory of information? The American Economic Review 63(2): 31-39.
Hitt MA, Ahlstrom D, Dacin MT, Levitas E, Svobodina L. 2004. The institutional effects on strategic alliance partner selection in transition economies: China vs. Russia. Organization Science 15(2): 173-185. Hitt MA, Dacin MT, Levitas E, Arregle JL, Borza A. 2000. Partner selection in emerging and developed market contexts: Resource-based and organizational learning perspectives. Academy of Management Journal 43(3): 449-467. Hitt MA, Hoskisson RE, Johnson RA, Moesel DD. 1996. The market for corporate control and firm innovation. Academy of Management Journal 39(5): 1084-1119. Hoang H, Rothaermel FT. 2005. The effect of general and partner-specific alliance experience on joint R&D project performance. Academy of Management Journal 48(2): 332-345. Hoang H, Rothaermel FT. 2010. Leveraging internal and external experience: exploration, exploitation, and R&D project performance. Strategic Management Journal 31(7): 734-758.
244
Hodgkinson GP, Healey MP. 2011. Psychological foundations of dynamic capabilities: reflexion and reflection in strategic management. Strategic Management Journal 32(13): 1500-1516. Hoetker G, Agarwal R. 2007. Death Hurts, but it isn't fatal: the postexit diffusion of knowledge created by innovative companies. Academy of Management Journal 50(2): 446-467. Hoever IJ, Van Knippenberg D, van Ginkel WP, Barkema HG. 2012. Fostering team creativity: Perspective taking as key to unlocking diversity's potential. Journal of Applied Psychology 97(5): 982 - 996. Hu S, Blettner D, Bettis RA. 2011. Adaptive aspirations: performance consequences of risk preferences at extremes and alternative reference groups. Strategic Management Journal 32(13): 1426-1436. Huber GP. 1991. Organizational learning: The contributing processes and the literatures. Organization Science 2(1): 88-115. Hung SW, Tang RH. 2008. Factors affecting the choice of technology acquisition mode: An empirical analysis of the electronic firms of Japan, Korea and Taiwan. Technovation 28(9): 551-563. Inkpen AC, Beamish PW. 1997. Knowledge, bargaining power, and the instability of international joint ventures. Academy of Management Review 22(1): 177-202. Inkpen AC, Tsang EWK. 2005. Social capital, networks, and knowledge transfer. Academy of Management Review 30(1): 146-165. Jaffe AB, Trajtenberg M, Henderson R. 1993. Geographic localization of knowledge spillovers as evidenced by patent citations. the Quarterly journal of Economics 108(3): 577-598. Jaffe AB, Trajtenberg M, Romer PM. 2002. Patents, citations, and innovations: A window on the knowledge economy. MIT press. Jansen JJ, Van Den Bosch FA, Volberda HW. 2006. Exploratory innovation, exploitative innovation, and performance: Effects of organizational antecedents and environmental moderators. Management Science 52(11): 1661-1674. Jeffrey SA, Onay S, Larrick RP. 2010. Goal attainment as a resource: The cushion effect in risky choice above a goal. Journal of Behavioral Decision Making 23(2): 191-202. Jensen MB, Johnson B, Lorenz E, Lundvall BÅ. 2007. Forms of knowledge and modes of innovation. Research Policy 36(5): 680-693. Johnson S. 2011. Where good ideas come from: The seven patterns of innovation. Penguin Books. Jones BF. 2009. The burden of knowledge and the “death of the Renaissance man”: is innovation getting harder? The Review of Economic Studies 76(1): 283-317.
Joshi A, Knight A. in press. Who defers to whom and why? Dual pathways linking demographic differences and dyadic deference to team effectiveness. Academy of Management Journal: amj. 2013.0718. Jovanovic B. 1979. Job matching and the theory of turnover. The Journal of Political Economy 87(5): 972-990. Kahneman D, Tversky A. 1979. Prospect theory: an analysis of decision under risk. Econometrica 47(2): 30. Kale P, Singh H, Perlmutter H. 2000. Learning and protection of proprietary assets in strategic alliances: Building relational capital. Strategic Management Journal 21(3): 217 - 237. Kale P, Singh H, Perlmutter H. 2000. Learning and protection of proprietary assets in strategic alliances: Building relational capital. Kaplan S, Murray F, Henderson R. 2003. Discontinuities and senior management: Assessing the role of recognition in pharmaceutical firm response to biotechnology. Industrial and Corporate Change 12(2): 203-233.
245
Kaplan S, Vakili K. 2014. The Double-Edged Sword Of Recombination In Breakthrough Innovation. Strategic Management Journal early view. Katila R. 2002. New product search over time: past ideas in their prime? Academy of Management Journal 45(5): 995-1010. Katila R, Ahuja G. 2002. Something old, something new: A longitudinal study of search behavior and new product introduction. Academy of Management Journal 45(6): 1183-1194. Katila R, Chen EL. 2008. Effects of search timing on innovation: The value of not being in sync with rivals. Administrative Science Quarterly 53(4): 593-625. Katila R, Mang PY. 2003. Exploiting technological opportunities: the timing of collaborations. Research Policy 32(2): 317-332. Kilduff M, Brass DJ. 2010. Organizational Social Network Research: Core Ideas and Key Debates. Academy of Management Annals 4(1): 317-357. Kim D-J, Kogut B. 1996. Technological platforms and diversification. Organization Science 7(3): 283-301. Kim J, Mahoney JT. 2010. A strategic theory of the firm as a nexus of incomplete contracts: a property rights approach. Journal of Management 36(4): 806-826. Kirzner IM. 1997. Entrepreneurial discovery and the competitive market process: An Austrian approach. Journal of Economic Literature 35(1): 60-85. Knight KE. 1967. A descriptive model of the intra-firm innovation process. Journal of Business 40(4): 478-496. Kogut B. 1989. The stability of joint ventures: Reciprocity and competitive rivalry. The Journal of Industrial Economics 38(2): 183-198. Kogut B, Zander U. 1992. Knowledge of the firm, combinative capabilities, and the replication of technology. Organization Science 3(3): 383-397. Kogut B, Zander U. 1996. What firms do? Coordination, identity, and learning. Organization Science 7(5): 502-518. Koruna S. 2004. Leveraging knowledge assets: combinative capabilities–theory and practice. R&D Management 34(5): 505-516. Kotha R, George G, Srikanth K. 2013. Bridging the Mutual Knowledge Gap: Coordination and the Commercialization of University Science. Academy of Management Journal 56(2): 498-524. Kotha S, Srikanth K. 2013. Managing a global partnership model: Lessons from the Boeing 787 ‘Dreamliner’program. Global Strategy Journal 3(1): 41-66. Kraaijenbrink J, Spencer J, Groen A. 2010. The Resource-Based View: A Review and Assessment of its Critiques. Journal of Management 36(1): 349-372. Kuhlthau CC. 1991. Inside the search process: Information seeking from the user's perspective. JASIS 42(5): 361-371.
Lachmann LM. 1956. Capital and its Structure. Ludwig von Mises Institute. Lahiri N. 2010. Geographic distribution of R&D activity: how does it affect innovation quality? Academy of Management Journal 53(5): 1194-1209. Lai R, D’Amour A, Yu A, Sun Y, Torvik V, Fleming L. 2011. Disambiguation and co-authorship networks of the US Patent Inventor Database. Harvard Institute for Quantitative Social Science, Cambridge, MA 2138. Lanjouw JO, Schankerman M. 2003. Enforcement of patent rights in the United States. National Academies Press. Laursen K, Salter A. 2004. Searching high and low: What types of firms use universities as a source of innovation? Research Policy 33(8): 1201-1215. Laursen K, Salter A. 2006. Open for innovation: The role of openness in explaining innovation performance among UK manufacturing firms. Strategic Management Journal 27(2): 131-150. Lavie D, Rosenkopf L. 2006. Balancing Exploration and Exploitation in Alliance Formation. Academy of Management Journal 49(4): 797-818.
246
Lee JJ. 2010. Heterogeneity, brokerage, and innovative performance: Endogenous formation of collaborative inventor networks. Organization Science 21(4): 804-822. Lee YS. 2000. The sustainability of university-industry research collaboration: An empirical assessment. The Journal of Technology Transfer 25(2): 111-133. Leonard-Barton D. 1992. Core capabilities and core rigidities: A paradox in managing new product development. Strategic Management Journal 13(S1): 111-125. Levinthal D, March JG. 1981. A model of adaptive organizational search. Journal of Economic Behavior & Organization 2(4): 307-333. Levinthal DA. 2011. A behavioral approach to strategy—what's the alternative? Strategic Management Journal 32(13): 1517-1523. Levinthal DA, March JG. 1993. The myopia of learning. Strategic Management Journal 14(S2): 95-112.
Lewin K, Dembo T, Festinger L, Sears PS. 1944. Level of Aspiration. In Personality and the behavior disorders. Hunt JM (ed.), Ronald Press: Oxford. Lewin P. 2012. Hayek and Lachmann and the Complexity of Capital. In The Elgar Companion to Hayek. Garrison R (ed.), Edward Elgar: Cheltenham. Lewin P, Baetjer H. 2011. The capital-based view of the firm. The Review of Austrian Economics 24(4): 335-354. Li D, Eden L, Hitt MA, Ireland RD. 2008. Friends, acquaintances, or strangers? Partner selection in R&D alliances. Academy of Management Journal 51(2): 315-334. Lin ZJ, Yang H, Arya B. 2009. Alliance partners and firm performance: Resource complementarity and status association. Strategic Management Journal 30(9): 921-940. Lincoln JR, McBride K. 1985. Resources, homophily, and dependence: Organizational attributes and asymmetric ties in human service networks. Social Science Research 14(1): 1-30. Lindell MK, Whitney DJ. 2001. Accounting for common method variance in cross-sectional research designs. Journal of Applied Psychology 86(1): 114-121. Lippman SA, McCall J. 1976. The economics of job search: A survey. Economic Inquiry 14(2): 155-187. Locke EA, Latham GP. 2002. Building a practically useful theory of goal setting and task motivation: A 35-year odyssey. American Psychologist 57(9): 705. Locke EA, Latham GP. 2006. New directions in goal-setting theory. Current directions in psychological science 15(5): 265-268. Lockett A, Wright M. 2005. Resources, capabilities, risk capital and the creation of university spin-out companies. Research Policy 34(7): 1043-1057.
Logan JA. 1996. Opportunity and choice in socially structured labor markets. American Journal of Sociology 102(1): 114-160. Logan JA, Hoff PD, Newton MA. 2008. Two-sided estimation of mate preferences for similarities in age, education, and religion. Journal of the American Statistical Association 103(482): 559-569. MacAulay S, Steen J, Kastelle T. 2014. The Search Environment is Not Benign: Reassessing the Social Risks of Intra-Organizational Search Working Paper. Madhok A, Tallman SB. 1998. Resources, transactions and rents: managing value through interfirm collaborative relationships. Organization Science 9(3): 326-339. Magee GB. 2005. Rethinking invention: cognition and the economics of technological creativity. Journal of Economic Behavior & Organization 57(1): 29-48. Maggitti PG, Smith KG, Katila R. 2013. The complex search process of invention. Research Policy 42(1): 90-100. March JG. 1991. Exploration and exploitation in organizational learning. Organization Science 2(1): 71-87.
247
March JG, Shapira Z. 1987. Managerial perspectives on risk and risk taking. Management Science 33(11): 1404-1418. Mathews JA, Cho DS. 1999. Combinative capabilities and organizational learning in latecomer firms: The case of the Korean semiconductor industry. Journal of World Business 34(2): 139-156. Mayer KJ, Argyres NS. 2004. Learning to contract: Evidence from the personal computer industry. Organization Science 15(4): 394-410. McFadyen MA, Cannella AA. 2004. Social capital and knowledge creation: Diminishing returns of the number and strength of exchange relationships. Academy of Management Journal 47(5): 735-746. McKelvey M, Alm H, Riccaboni M. 2003. Does co-location matter for formal knowledge collaboration in the Swedish biotechnology–pharmaceutical sector? Research Policy 32(3): 483-501. Meyer-Krahmer F, Schmoch U. 1998. Science-based technologies: University–Industry interactions in four fields. Research Policy 27(8): 835-851. Miller DJ, Fern MJ, Cardinal LB. 2007. The use of knowledge for technological innovation within diversified firms. Academy of Management Journal 50(2): 307-325. Miller KD, Chen W-R. 2004. Variable organizational risk preferences: Tests of the March-Shapira model. Academy of Management Journal 47(1): 105-115. Mindruta D. 2013. Value creation in university - firm research collaborations: A matching approach. Strategic Management Journal 34(6): 644-665. Mitchell TR, James LR. 2001. Building better theory: Time and the specification of when things happen. Academy of Management Review 26(4): 530-547. Mitsuhashi H, Greve HR. 2009. A matching theory of alliance formation and organizational success: Complementarity and compatibility. Academy of Management Journal 52(5): 975-995. Mody A, Wheeler D. 1986. Technological evolution of the semiconductor industry. Technological Forecasting and Social Change 30(3): 197-205. Mowery DC, Nelson RR, Sampat BN, Ziedonis AA. 2001. The growth of patenting and licensing by US universities: an assessment of the effects of the Bayh–Dole act of 1980. Research Policy 30(1): 99-119. Mueller P. 2006. Exploring the knowledge filter: How entrepreneurship and university–industry relationships drive economic growth. Research Policy 35(10): 1499-1508. Mustar P, Renault M, Colombo MG, Piva E, Fontes M, Lockett A, Wright M, Clarysse B, Moray N. 2006. Conceptualising the heterogeneity of research-based spin-offs: A multi-dimensional taxonomy. Research Policy 35(2): 289-308. Nadolska A, Barkema HG. 2014. Good learners: How top management teams affect the success and frequency of acquisitions. Strategic Management Journal 35(10): 1483 - 1507. Narula R. 2004. R&D collaboration by SMEs: New opportunities and limitations in the face of globalisation. Technovation 24(2): 153-161. Narula R, Santangelo GD. 2009. Location, collocation and R&D alliances in the European ICT industry. Research Policy 38(2): 393-403. Nelson P. 1970. Information and consumer behavior. The Journal of Political Economy 78(2): 311-329. Nelson RR, Winter SG. 1977. In search of a useful theory of innovation. In Innovation, Economic Change and Technology Policies. Springer. Nelson RR, Winter SG. 1982. An Evolutionary Theory of Economic Change. The Belknap Press of Harvard University Press: Cambridge, Massachusetts. Nerkar A. 2003. Old is gold? The value of temporal exploration in the creation of new knowledge. Management Science 49(2): 211-229.
248
Nonaka I, Toyama R. 2003. The knowledge-creating theory revisited: knowledge creation as a synthesizing process. Knowledge management research & practice 1(1): 2-10. Oh H, Kilduff M. 2008. The ripple effect of personality on social structure: self-monitoring origins of network brokerage. Journal of Applied Psychology 93(5): 1155. Okhuysen GA, Bechky BA. 2009. Coordination in Organizations: An Integrative Perspective. The Academy of Management Annals 3(1): 463-502. Park SH, Chen R, Gallagher S. 2002. Firm resources as moderators of the relationship between market growth and strategic alliances in semiconductor start-ups. Academy of Management Journal 45(3): 527-545. Park SH, Russo MV. 1996. When competition eclipses cooperation: An event history analysis of joint venture failure. Management Science 42(6): 875-890. Parmigiani A, Rivera-Santos M. 2011. Clearing a path through the forest: A meta-review of interorganizational relationships. Journal of Management 37(4): 1108-1136. Phelps CC. 2010. A longitudinal study of the influence of alliance network structure and composition on firm exploratory innovation. Academy of Management Journal 53(4): 890-913.
Phene A, Fladmoe‐Lindquist K, Marsh L. 2006. Breakthrough innovations in the US biotechnology industry: the effects of technological space and geographic origin. Strategic Management Journal 27(4): 369-388. Phillips N, Sewell G, Jaynes S. 2008. Applying critical discourse analysis in strategic management research. Organizational Research Methods 11(4): 770 - 789. Phillips N, Tracey P, Karra N. 2013. Building entrepreneurial tie portfolios through strategic homophily: The role of narrative identity work in venture creation and early growth. Journal of Business venturing 28(1): 134-150. Pink DH. 2011. Drive: The surprising truth about what motivates us. Penguin. Podsakoff PM, Organ DW. 1986. Self-reports in organizational research: Problems and prospects. Journal of Management 12(4): 531-544. Podsakoff PM, Podsakoff NP, MacKenzie SB, Lee J-Y. 2003. Common method bias in behavioral research: A critical review of the literature and recommended remedies. Journal of Applied Psychology 88: 879 - 903. Porac JF, Wade JB, Fischer HM, Brown J, Kanfer A, Bowker G. 2004. Human capital heterogeneity, collaborative relationships, and publication patterns in a multidisciplinary scientific alliance: A comparative case study of two scientific teams. Research Policy 33(4): 661-678. Porter ME. 2000. Location, competition, and economic development: Local clusters in a global economy. Economic development quarterly 14(1): 15-34.
Posen HE, Levinthal DA. 2012. Chasing a moving target: Exploitation and exploration in dynamic environments. Management Science 58(3): 587-601. Powell TC, Lovallo D, Fox CR. 2011. Behavioral strategy. Strategic Management Journal 32(13): 1369-1386. Powell WW, Koput KW, Smith-Doerr L. 1996. Interorganizational collaboration and the locus of innovation: Networks of learning in biotechnology. Administrative Science Quarterly 41(1): 116-145. Prencipe A, Tell F. 2001. Inter-project learning: processes and outcomes of knowledge codification in project-based firms. Research Policy 30(9): 1373-1394. Rao RS, Chandy RK, Prabhu JC. 2008. The fruits of legitimacy: Why some new ventures gain more from innovation than others. Journal of Marketing 72(4): 58-75. Reagans R, McEvily B. 2003. Network structure and knowledge transfer: The effects of cohesion and range. Administrative Science Quarterly 48(2): 240-267. Richardson HA, Simmering MJ, Sturman MC. 2009. A tale of three perspectives: Examining post hoc statistcial techniques for detection and correction of common method variance. Organizational Research Methods 12(4): 762-800.
249
Riquelme H, Rickards T. 1992. Hybrid conjoint analysis: An estimation probe in new venture decisions. Journal of Business Venturing 7(6): 505-518. Robinson CD, Tomek S, Schumacker RE. 2013. Tests of Moderation Effects: Difference in Simple Slopes versus the Interaction Term. Multiple Linear Regression Viewpoints 39(1): 16-25. Rosenkopf L, Almeida P. 2003. Overcoming local search through alliances and mobility. Management Science 49(6): 751-766.
Rosenkopf L, Nerkar A. 2001. Beyond local search: boundary‐spanning, exploration, and impact in the optical disk industry. Strategic Management Journal 22(4): 287-306. Ross SA. 1973. The economic theory of agency: The principal's problem. The American Economic Review 63(2): 134-139. Rothaermel FT, Agung SD, Jiang L. 2007. University entrepreneurship: a taxonomy of the literature. Industrial and Corporate Change 16(4): 691-791. Rothaermel FT, Boeker W. 2008. Old technology meets new technology: complementarities, similarities, and alliance formation. Strategic Management Journal 29(1): 47-77. Rothaermel FT, Deeds DL. 2004. Exploration and exploitation alliances in biotechnology: A system of new product development. Strategic Management Journal 25(3): 201-221. Rothaermel FT, Hess AM. 2007. Building dynamic capabilities: Innovation driven by individual-, firm-, and network-level effects. Organization Science 18(6): 898-921. Ruef M, Aldrich HE, Carter NM. 2003. The structure of founding teams: Homophily, strong ties, and isolation among US entrepreneurs. American sociological review 68(2): 195-222. Sampson RC. 2007. R&D alliances and firm performance: the impact of technological diversity and alliance organization on innovation. Academy of Management Journal 50(2): 364-386. Santoro M, Chakrabarti A. 2002. Firm size and technology centrality in industry– university interactions. Research Policy 31: 18. Santoro MD, Gopalakrishnan S. 2001. Relationship dynamics between university research centers and industrial firms: Their impact on technology transfer activities. The Journal of Technology Transfer 26(1): 163-171. Schilling MA, Phelps CC. 2007. Interfirm collaboration networks: The impact of large-scale network structure on firm innovation. Management Science 53(7): 1113-1126. Schmidt J, Keil T. 2013. What makes a resource valuable? Identifying the drivers of firm-idiosyncratic resource value. Academy of Management Review 38: 206-228. Schulz M. 2001. The uncertain relevance of newness: Organizational learning and knowledge flows. Academy of Management Journal 44(4): 661-681. Schumpeter JA. 1934. The theory of economic development: An inquiry into profits, capital, credit, interest, and the business cycle. University of Illinois at Urbana-Champaign's Academy for Entrepreneurial Leadership Historical Research Reference in Entrepreneurship. Schumpeter JA. 1939. Business Cycles. Cambridge University Press. Schumpeter JA. 1942. Capitalism, socialism and democracy. Routledge. Shah RH, Swaminathan V. 2008. Factors influencing partner selection in strategic alliances: The moderating role of alliance context. Strategic Management Journal 29(5): 471-494. Shaw GB. 1903. Man and Superman: "A Comedy and A Philosophy". Brentano's: London, UK.
250
Shinkle GA. 2012. Organizational Aspirations, Reference Points, and Goals Building on the Past and Aiming for the Future. Journal of Management 38(1): 415-455. Siegel DS, Waldman DA, Atwater LE, Link AN. 2003. Commercial knowledge transfers from universities to firms: improving the effectiveness of university–industry collaboration. The Journal of High Technology Management Research 14(1): 111-133. Siegel S. 1957. Level of aspiration and decision making. Psychological review 64(4): 253-262. Siemsen E, Roth A, Oliveira P. 2010. Common method bias in regression models with linear, quadratic, and interaction effects. Organizational Research Methods 13(3): 456-476. Siggelkow N, Levinthal DA. 2005. Escaping real (non-benign) competency traps: Linking the dynamics of organizational structure to the dynamics of search. Strategic organization 3(1): 85-115. Simon HA. 1947. Administrative Behavior: A study of decision-making processes in adminstrative organization. MacMillan: Chicago, IL. Simon HA. 1978. Rationality as process and as product of thought. The American Economic Review 68(2): 1-16. Simon HA. 1991. Organizations and markets. The Journal of Economic Perspectives: 25-44. Singh J. 2008. Distributed R&D, cross-regional knowledge integration and quality of innovative output. Research Policy 37(1): 77-96. Singh J, Fleming L. 2010. Lone inventors as sources of breakthroughs: Myth or reality? Management Science 56(1): 41-56. Sirmon DG, Hitt MA, Ireland RD. 2007. Managing firm resources in dynamic environments to create value: Looking inside the black box. Academy of Management Review 32(1): 20. Sørensen JB, Stuart TE. 2000. Aging, obsolescence, and organizational innovation. Administrative Science Quarterly 45(1): 81-112. Sorenson O, Rivkin JW, Fleming L. 2006. Complexity, networks and knowledge flow. Research Policy 35(7): 994-1017. Spender JC. 1996. Making knowledge the basis of a dynamic theory of the firm. Strategic Management Journal 17(S2): 45-62. Srikanth K, Puranam P. 2013. The firm as coordination system: evidenmce from software services offshoring. In Faculty & Research Working Paper. Insead (ed.), Insead Singapore. Stuart TE. 1998. Network positions and propensities to collaborate: An investigation of strategic alliance formation in a high-technology industry. Administrative Science Quarterly 43(3): 668-698. Stuart TE. 2000. Inter-organizational Alliances and the Performance of Firms: A Study of Growth and Innovation Rates in a High-Technology Industry. Strategic Management Journal 21(8): 791-811. Stuart TE, Sorenson O. 2007. Strategic networks and entrepreneurial ventures. Strategic Entrepreneurship Journal 1(3-4): 211 - 227. Szulanski G. 1996. Exploring internal stickiness: Impediments to the transfer of best practice within the firm. Strategic Management Journal 17: 27-43. Technology Strategy Board. 2012. Technology Strategy Board - Driving Innovation. http://www.innovateuk.org/ (24/10/2012 2012). Tether BS. 2002. Who co-operates for innovation, and why: an empirical analysis. Research Policy 31(6): 947-967. Thursby JG, Kemp S. 2002. Growth and productive efficiency of university intellectual property licensing. Research Policy 31(1): 109-124.
251
Thursby JG, Thursby MC. 2002. Who is selling the ivory tower? Sources of growth in university licensing. Management Science 48(Special Issue on University Entrepreneurship and Technology Transfer): 90 - 104. Tsai W. 2001. Knowledge transfer in intraorganizational networks: Effects of network position and absorptive capacity on business unit innovation and performance. Academy of Management Journal 44(5): 996-1004. Tzabbar D, Aharonson BS, Amburgey TL. 2012. When does tapping external sources of knowledge result in knowledge integration? Research Policy 42(2): 481 - 494. Uotila J, Maula M, Keil T, Zahra SA. 2009. Exploration, exploitation, and financial performance: analysis of S&P 500 corporations. Strategic Management Journal 30(2): 221-231. Uzzi B. 1997. Social structure and competition in interfirm networks: The paradox of embeddedness. Administrative Science Quarterly 42(1): 35-67.
Van Wijk R, Jansen JJ, Lyles MA. 2008. Inter‐and Intra‐Organizational Knowledge Transfer: A Meta‐Analytic Review and Assessment of its Antecedents and Consequences. Journal of Management Studies 45(4): 830-853. Veugelers R, Cassiman B. 2005. R&D cooperation between firms and universities. Some empirical evidence from Belgian manufacturing. International Journal of Industrial Organization 23(5): 355-379. Vincent J. 2014. Japanese man jailed for two years for creating 3D printed guns In The Independent. online ed.: London. Vissa B. 2011. A matching theory of entrepreneurs' tie formation intentions and initiation of economic exchange. Academy of Management Journal 54(1): 137-158. Vohora A, Wright M, Lockett A. 2004. Critical junctures in the development of university high-tech spinout companies. Research Policy 33(1): 147-175. von Hayek FA. 1945. The use of knowledge in society. The American Economic Review 35(4): 519-530. Von Hippel E. 1994. “Sticky information” and the locus of problem solving: implications for innovation. Management Science 40(4): 429-439. Vroom VH. 1964. Work and motivation. Wiley: Oxford, England. Walker RD. 1995. Patents as scientific and technical literature. Scarecrow Press Metuchen, NJ. Wathne KH, Heide JB. 2000. Opportunism in interfirm relationships: Forms, outcomes, and solutions. The Journal of Marketing 64(4): 36-51. Weisberg RW. 1999. Creativity and Knowledge: A Challenge to Theories. In Handbook of creativity. Sternberg RJ (ed.), Cambridge University Press: Cambridge, UK.
West J. 2002. Limits to globalization: organizational homogeneity and diversity in the semiconductor industry. Industrial and Corporate Change 11(1): 159-188. Whetten DA. 1989. What constitutes a theoretical contribution? Academy of Management Review 14(4): 490-495. Wiersema MF, Bantel KA. 1993. Top Management Team Turnover as an Adaptation Mechanism - The Role of the Environment. Strategic Management Journal 14(7): 485-504. Wiersema MF, Bird A. 1993. Organizational demography in Japanese firms: Group heterogeneity, individual dissimilarity, and top management team turnover. Academy of Management Journal 36(5): 996-1025. Williamson OE. 1975. Markets and hierarchies, analysis and antitrust implications: A study in the economics of internal organization. Free Press: New York. Williamson OE. 1981. The economics of organization: The transaction cost approach. American Journal of Sociology 87(3): 548-577. Williamson OE. 1989. Transaction cost economics. Handbook of industrial organization 1: 135-182.
252
Winter SG. 2012. Capabilities: Their origins and ancestry. Journal of Management Studies 49(8): 1402-1406. Woolgar S, Vaux J, Gomes P, Ezingeard JN, Grieve R. 1998. Abilities and competencies required, particularly by small firms, to identify and acquire new technology. Technovation 18(8): 575-592. Wuchty S, Jones BF, Uzzi B. 2007. The increasing dominance of teams in production of knowledge. Science 316(5827): 1036-1039. Wuyts S, Colombo MG, Dutta S, Nooteboom B. 2005. Empirical tests of optimal cognitive distance. Journal of Economic Behavior & Organization 58(2): 277-302. Yayavaram S, Ahuja G. 2008. Decomposability in knowledge structures and its impact on the usefulness of inventions and knowledge-base malleability. Administrative Science Quarterly 53(2): 333-362. Zack MH. 1999. Managing codified knowledge. Sloan Management Review 40(4): 45-58. Zahra SA, George G. 2002. Absorptive capacity: A review, reconceptualization, and extension. Academy of Management Review 27(2): 185-203. Zander U, Kogut B. 1995. Knowledge and the speed of the transfer and imitation of organizational capabilities: An empirical test. Organization Science 6(1): 76-92. Zollo M, Winter SG. 2002. Deliberate learning and the evolution of dynamic capabilities. Organization Science 13(3): 339-351. Zucker LG, Darby MR. 2006. Movement of star scientists and engineers and high-
tech firm entry. In Working Paper Series. National Bureau of Economic Research.