indigenous marine species in New Zealand
89
Targeted surveillance for non- indigenous marine species in New Zealand Design report for Lyttelton MAF Biosecurity Technical Paper No: 2018/65 Prepared for MAF Biosecurity New Zealand by Kate Willis, Don Morrisey, Graeme Inglis, Olivia Johnston, Chris Woods and Lisa Peacock (NIWA Ltd) ISBN No: 978-1-98-857103-4 ISSN No: 2253-3923 September 2008
-
Upload
khangminh22 -
Category
Documents
-
view
2 -
download
0
Transcript of indigenous marine species in New Zealand
Targeted surveillance for non-indigenous marine species in New Zealand
Design report for Lyttelton
MAF Biosecurity Technical Paper No: 2018/65 Prepared for MAF Biosecurity New Zealand by Kate Willis, Don Morrisey, Graeme Inglis, Olivia Johnston, Chris Woods and Lisa Peacock (NIWA Ltd) ISBN No: 978-1-98-857103-4 ISSN No: 2253-3923 September 2008
Disclaimer
While every effort has been made to ensure that the information in this publication is
accurate, the Ministry of Agriculture and Forestry does not accept any responsibility or
liability for error or omission of fact, interpretation or opinion that may be present, nor for the
consequences of any decisions based on this in formation.
Any view or opinions expressed do not necessarily represent the official view of the Ministry
of Agriculture and Forestry.
The information in this report and any accompanying documentation is accurate to the best of
the knowledge and belief of the National Institute of Water and Atmospheric Research Ltd
(NIWA) acting on behalf of the Ministry of Agriculture and Forestry. While NIWA has
exercised all reasonable skill and care in the preparation of information in this report, neither
NIWA nor the Ministry of Agriculture and Forestry accept any liability in contract, tort or
otherwise for any loss, damage, injury or expense, whether direct, indirect or consequential,
arising out of the provision of information in this report.
Requests for further copies should be directed to:
Publication Adviser
MAF Information Bureau
P O Box 2526
WELLINGTON
Telephone: 04-894 0100
Facsimile: 04-894 0300
© Crown Copyright - Ministry of Agriculture and Forestry
i
Contents Page
Objectives 1
Target Species 1
Stakeholder engagement and governance 2
Identifying responsibilities within the survey area 2
Obtaining permits to conduct surveillance fieldwork 2
Governance 2
MAF Biosecurity New Zealand 2
NIWA 3
Existing information on the survey location 3
Existing information on marine pests 6
Biophysical conditions 14
Habitat types within the survey area 14
Identification of vector parameters 16
Imports and exports 17
Shipping movements and ballast discharge patterns in the Port of Lyttelton 19
Possible vectors for introduction of non-indigenous species 21
Assessment of the risk of new introductions to the port 21
Assessment of translocation risk for introduced species found in the port 21
Local constraining factors on surveillance success 23
Port security issues 25
Selection of sampling methods for target species 25
Habitat associations and life histories of the target organisms 25
Selecting life stages to target 25
Sampling methods 26
Surveillance for non-target species 30
Timing of sampling activity 30
Determination of sampling effort 31
Spatial allocation of sampling effort 32
Sample labelling and processing 34
Sample labelling 35
Sample processing 35
ii
Sample reporting and despatch to MITS 36
Data entry and archiving 37
Acknowledgements 37
References 38
Appendices 41
Appendix 1: Letter sent to stakeholders. 41
Appendix 2: Summaries of the habitat associations and life histories of the target species. 43
Northern Pacific seastar (Asterias amurensis) 43
Asian clam (Potamocorbula amurensis) 47
Chinese mitten crab (Eriocheir sinensis) 50
European green crab (Carcinus maenas) 57
Mediterranean fanworm (Sabella spallanzanii) 61
Aquarium weed (Caulerpa taxifolia) 63
Clubbed tunicate (Styela clava) 67
Appendix 3. Experts contracted to review the habitat summaries and sampling methods for
the target species 75
Appendix 4. Results of hydrodynamic modelling 76
Appendix 5: Sampling data sheets 79
MAF Biosecurity New Zealand Surveillance design report for Lyttelton 1
Objectives The primary objective of the targeted marine surveillance programme is:
To detect incursions of the target organisms at the identified locations.
The secondary objectives of the targeted marine surveillance programme are:
To detect incursions of non-target non-indigenous or cryptogenic species not
previously recorded in New Zealand,
To detect incursions of established non indigenous or cryptogenic species which are
exhibiting invasive characteristics (i.e. range extensions of established organisms).
The targeted marine surveillance programme must meet the primary objective. Surveillance
should be designed and undertaken with the purpose of maximising the likelihood of
successful “containment” of the incursion through providing sufficiently detection to
maximise the range of management options available, i.e. vector management and local
control etc. The secondary objectives should be considered when designing and undertaking
the surveillance programme to increase the likelihood that these will be achieved within the
existing design or through minor additions/modifications to this design (these will need to be
clearly identified and approved).
TARGET SPECIES
MAF Biosecurity New Zealand has currently identified seven marine organisms which are
listed on the unwanted organisms register. These are the:
1. Clubbed tunicate, Styela clava
2. Northern Pacific seastar, Asterias amurensis
3. European shore crab, Carcinus maenas
4. Aquarium weed, Caulerpa taxifolia
5. Mediterranean fanworm, Sabella spallanzanii
6. Chinese mitten crab, Eriocheir sinensis
7. Asian Clam, Potamocorbula amurensis
An additional three organisms have been identified that are not currently listed as unwanted
organisms and are currently known to be established in New Zealand’s coastal waters.
Knowledge of changes in the distribution of these organisms is of interest for current and
potential future management purposes. Within the survey design for the primary organisms,
opportunities should be explored for detecting these secondary organisms. These organisms
include:
8. Asian Date Mussel, Musculista senhousia
9. Eudistoma elongatum
10. Didemnum sp.1
Note: the target organism list may be subject to change by MAF BNZ during the course of the
surveillance programmes. Inclusion of additional target species may be considered by
MAFBNZ.
1 Representative samples of Didemnum species will be collected and submitted to MITS for future reference. Further identification to species
will not be undertaken as part of this programme. The samples will be made available by MAF where these are required for approved
purposes.
2 Surveillance design report for Lyttelton MAF Biosecurity New Zealand
Stakeholder engagement and governance
IDENTIFYING RESPONSIBILITIES WITHIN THE SURVEY AREA
Stakeholder groups with jurisdiction or responsibility within the surveillance location are
listed in Table 1.
Table 1 List of stakeholder groups with jurisdiction or responsibility within the surveillance location.
Node/Facility Responsible group Contact name
Commercial trading port Port of Lyttelton (03-328 8198)
Paula Allen (Marine and Security Manager)
Commercial marina Port of Lyttelton (03-328 8198)
Phil Fraser (Marina Manager)
Local authority marina Christchurch City Council (03 941 8999)
Paul Cunneen (Marina Manager)
Fisheries regulator Ministry of Fisheries, Canterbury (03 393662)
Peter Hyde (District Compliance Officer)
Local authority Harbour Master Environment Canterbury (03 3653828)
Tony Whitely (Harbour Master)
OBTAINING PERMITS TO CONDUCT SURVEILLANCE FIELDWORK
Contact has been made with all the organisations listed in Table 1 during previous surveys of
the port and a letter (see Appendix 1) has been sent to each summarising the purpose of the
surveillance programme and, where required, requesting permission to sample. To date,
permission has been granted whenever requested and all stakeholders have indicated that their
cooperation will continue in the future.
GOVERNANCE
MAF Biosecurity New Zealand
MAF Biosecurity New Zealand is the lead agency in New Zealand's biosecurity system. It is
tasked with a "whole of system" leadership role, encompassing economic, environmental,
social and cultural outcomes. It also has international trade and animal welfare
responsibilities.
Biosecurity activities protect the economy, environment and people of New Zealand from the
risks and consequences of the introduction of damaging risk organisms, or mitigate the effects
of risk organisms that are already present. Biosecurity surveillance plays a vital role in
supporting a wide range of these activities.
The targeted marine surveillance programme is administered and funded by MAF BNZ's
Biosecurity Surveillance Group. Queries relating to this programme should be directed to
MAFBNZ.
The MAFBNZ contact person for all marine biosecurity surveillance activity is Brendan
Gould (phone 04 894 0548, fax 04 894 0736, email [email protected]).
Alternatively, the Biosecurity Surveillance Group Manager can be contacted at the following
email address: [email protected].
MAF Biosecurity New Zealand Surveillance design report for Lyttelton 3
Postal Address:
MAF Biosecurity New Zealand
PO Box 2526
Wellington
NIWA
NIWA has been contracted by MAF Biosecurity New Zealand to design and deliver the
surveillance programme to the required specifications.
The NIWA project leaders and contact persons for the targeted surveillance programme are
Don Morrisey (NIWA PO Box 893 Nelson, phone 03 548 1715, fax 03 548 1716, email
[email protected]) and Graeme Inglis (NIWA PO Box 8602, Riccarton, Christchurch,
phone 03 348 8987, fax 03 348 5548, email [email protected]).
Graeme Inglis and Don Morrisey were also responsible for the design of the programme, with
inputs from Isla Fitridge, Oliver Floerl, Nick Gust, Olivia Johnston, Marie Kospartov, Crispin
Middleton, Sheryl Miller, John Oldman, Lisa Peacock, Helen Roulston, Matt Smith, Kate
Willis and Chris Woods. This team also collated existing data.
Field work was carried out by a large team of NIWA staff (over 40 individuals), with
additional support from commercial divers from Northern Underwater Technical Services and
Southern Aqua Adventures where necessary. Field teams were led by a core of NIWA staff
experienced in targeted surveillance: Niki Davey, Olivia Johnston, Crispin Middleton, Sheryl
Miller, Don Morrisey, Kate Neill, Lisa Peacock, Matt Smith and Chris Woods. During
fieldwork, field teams were generally divided into two groups, each in a separate boat and
each including at least one person with previous experience of surveillance. All field team
members are under the authority of the field team leader during field work and in
communication by telephone or VHF radio. Field team leaders refer to the project leaders as
required.
NIWA’s Chief Scientist for Biodiversity and Biosecurity, Don Robertson, can be contacted at
Existing information on the survey location Table 2 lists individuals and groups with local knowledge of the surveillance location.
4 Surveillance design report for Lyttelton MAF Biosecurity New Zealand
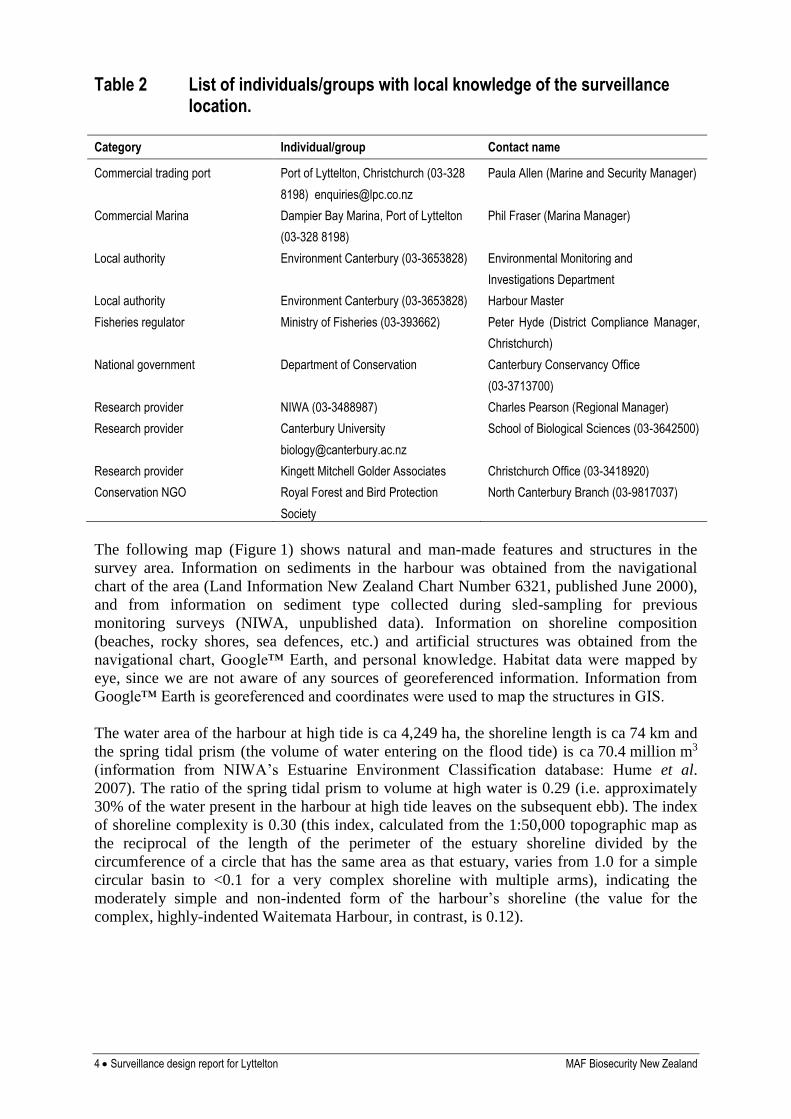
Table 2 List of individuals/groups with local knowledge of the surveillance location.
Category Individual/group Contact name
Commercial trading port Port of Lyttelton, Christchurch (03-328
8198) [email protected]
Paula Allen (Marine and Security Manager)
Commercial Marina Dampier Bay Marina, Port of Lyttelton
(03-328 8198)
Phil Fraser (Marina Manager)
Local authority Environment Canterbury (03-3653828) Environmental Monitoring and
Investigations Department
Local authority Environment Canterbury (03-3653828) Harbour Master
Fisheries regulator Ministry of Fisheries (03-393662) Peter Hyde (District Compliance Manager,
Christchurch)
National government Department of Conservation
Canterbury Conservancy Office
(03-3713700)
Research provider NIWA (03-3488987) Charles Pearson (Regional Manager)
Research provider Canterbury University
School of Biological Sciences (03-3642500)
Research provider Kingett Mitchell Golder Associates Christchurch Office (03-3418920)
Conservation NGO Royal Forest and Bird Protection
Society
North Canterbury Branch (03-9817037)
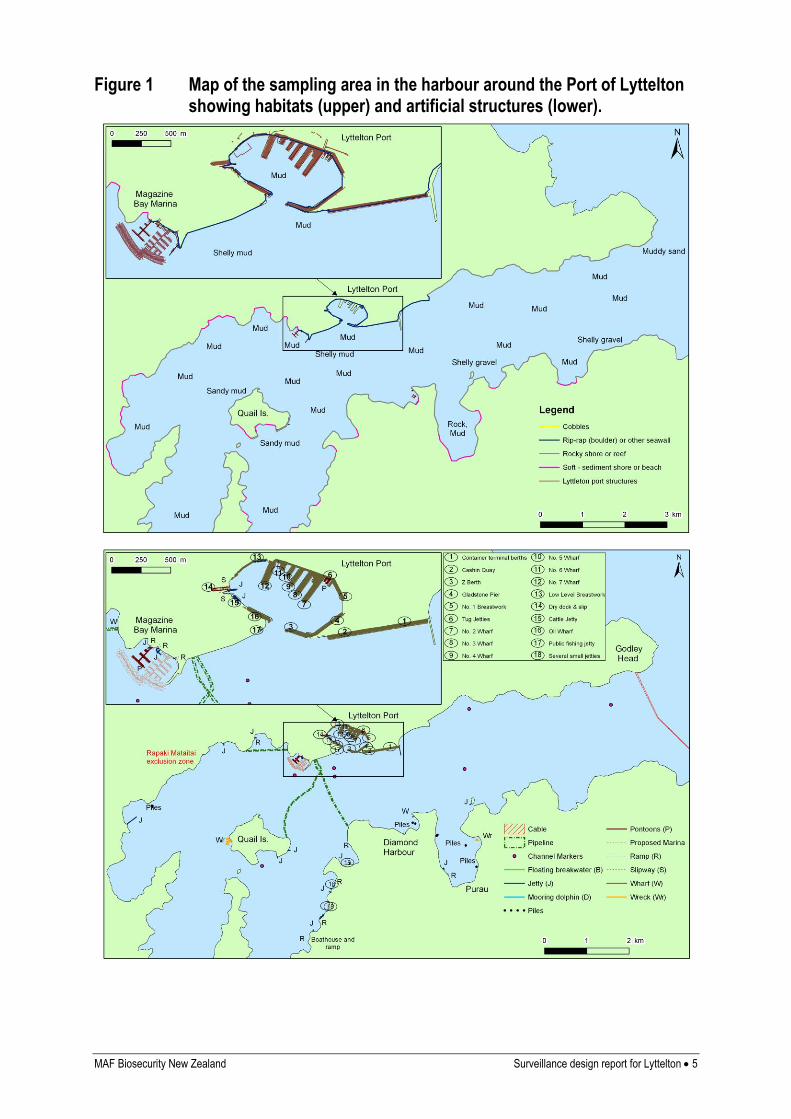
The following map (Figure 1) shows natural and man-made features and structures in the
survey area. Information on sediments in the harbour was obtained from the navigational
chart of the area (Land Information New Zealand Chart Number 6321, published June 2000),
and from information on sediment type collected during sled-sampling for previous
monitoring surveys (NIWA, unpublished data). Information on shoreline composition
(beaches, rocky shores, sea defences, etc.) and artificial structures was obtained from the
navigational chart, Google™ Earth, and personal knowledge. Habitat data were mapped by
eye, since we are not aware of any sources of georeferenced information. Information from
Google™ Earth is georeferenced and coordinates were used to map the structures in GIS.
The water area of the harbour at high tide is ca 4,249 ha, the shoreline length is ca 74 km and
the spring tidal prism (the volume of water entering on the flood tide) is ca 70.4 million m3
(information from NIWA’s Estuarine Environment Classification database: Hume et al.
2007). The ratio of the spring tidal prism to volume at high water is 0.29 (i.e. approximately
30% of the water present in the harbour at high tide leaves on the subsequent ebb). The index
of shoreline complexity is 0.30 (this index, calculated from the 1:50,000 topographic map as
the reciprocal of the length of the perimeter of the estuary shoreline divided by the
circumference of a circle that has the same area as that estuary, varies from 1.0 for a simple
circular basin to <0.1 for a very complex shoreline with multiple arms), indicating the
moderately simple and non-indented form of the harbour’s shoreline (the value for the
complex, highly-indented Waitemata Harbour, in contrast, is 0.12).
MAF Biosecurity New Zealand Surveillance design report for Lyttelton 5
Figure 1 Map of the sampling area in the harbour around the Port of Lyttelton showing habitats (upper) and artificial structures (lower).
6 Surveillance design report for Lyttelton MAF Biosecurity New Zealand
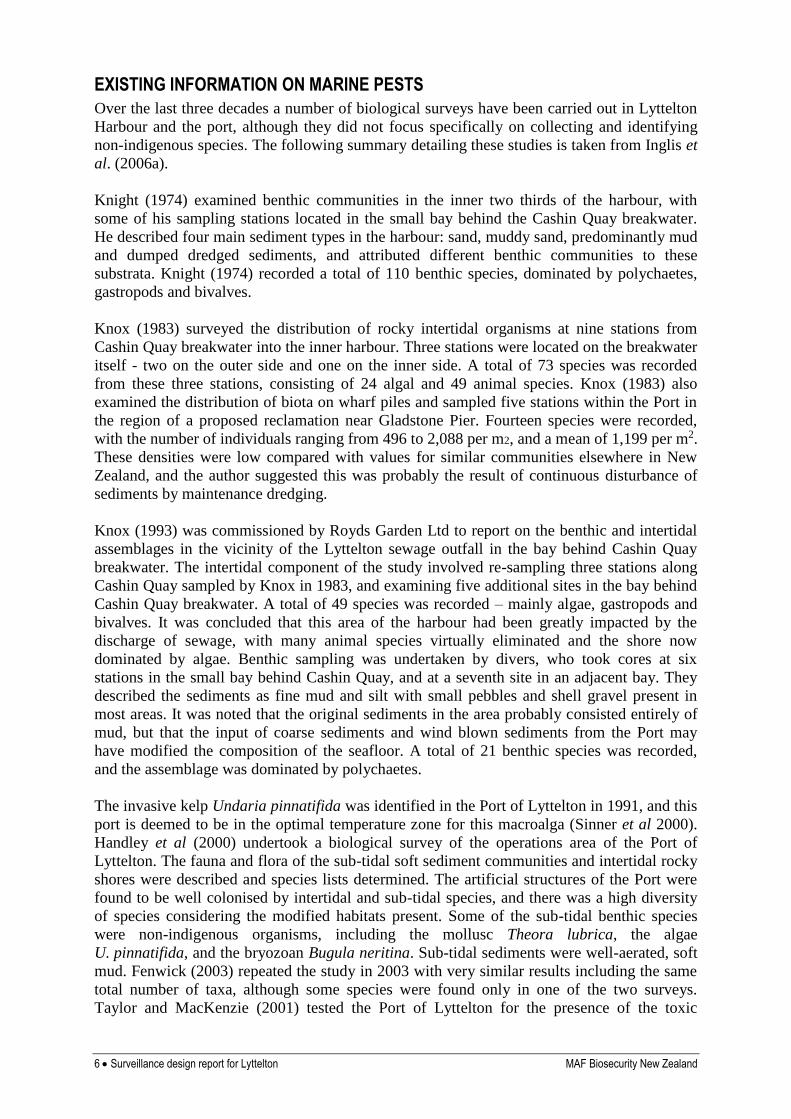
EXISTING INFORMATION ON MARINE PESTS
Over the last three decades a number of biological surveys have been carried out in Lyttelton
Harbour and the port, although they did not focus specifically on collecting and identifying
non-indigenous species. The following summary detailing these studies is taken from Inglis et
al. (2006a).
Knight (1974) examined benthic communities in the inner two thirds of the harbour, with
some of his sampling stations located in the small bay behind the Cashin Quay breakwater.
He described four main sediment types in the harbour: sand, muddy sand, predominantly mud
and dumped dredged sediments, and attributed different benthic communities to these
substrata. Knight (1974) recorded a total of 110 benthic species, dominated by polychaetes,
gastropods and bivalves.
Knox (1983) surveyed the distribution of rocky intertidal organisms at nine stations from
Cashin Quay breakwater into the inner harbour. Three stations were located on the breakwater
itself - two on the outer side and one on the inner side. A total of 73 species was recorded
from these three stations, consisting of 24 algal and 49 animal species. Knox (1983) also
examined the distribution of biota on wharf piles and sampled five stations within the Port in
the region of a proposed reclamation near Gladstone Pier. Fourteen species were recorded,
with the number of individuals ranging from 496 to 2,088 per m2, and a mean of 1,199 per m2.
These densities were low compared with values for similar communities elsewhere in New
Zealand, and the author suggested this was probably the result of continuous disturbance of
sediments by maintenance dredging.
Knox (1993) was commissioned by Royds Garden Ltd to report on the benthic and intertidal
assemblages in the vicinity of the Lyttelton sewage outfall in the bay behind Cashin Quay
breakwater. The intertidal component of the study involved re-sampling three stations along
Cashin Quay sampled by Knox in 1983, and examining five additional sites in the bay behind
Cashin Quay breakwater. A total of 49 species was recorded – mainly algae, gastropods and
bivalves. It was concluded that this area of the harbour had been greatly impacted by the
discharge of sewage, with many animal species virtually eliminated and the shore now
dominated by algae. Benthic sampling was undertaken by divers, who took cores at six
stations in the small bay behind Cashin Quay, and at a seventh site in an adjacent bay. They
described the sediments as fine mud and silt with small pebbles and shell gravel present in
most areas. It was noted that the original sediments in the area probably consisted entirely of
mud, but that the input of coarse sediments and wind blown sediments from the Port may
have modified the composition of the seafloor. A total of 21 benthic species was recorded,
and the assemblage was dominated by polychaetes.
The invasive kelp Undaria pinnatifida was identified in the Port of Lyttelton in 1991, and this
port is deemed to be in the optimal temperature zone for this macroalga (Sinner et al 2000).
Handley et al (2000) undertook a biological survey of the operations area of the Port of
Lyttelton. The fauna and flora of the sub-tidal soft sediment communities and intertidal rocky
shores were described and species lists determined. The artificial structures of the Port were
found to be well colonised by intertidal and sub-tidal species, and there was a high diversity
of species considering the modified habitats present. Some of the sub-tidal benthic species
were non-indigenous organisms, including the mollusc Theora lubrica, the algae
U. pinnatifida, and the bryozoan Bugula neritina. Sub-tidal sediments were well-aerated, soft
mud. Fenwick (2003) repeated the study in 2003 with very similar results including the same
total number of taxa, although some species were found only in one of the two surveys.
Taylor and MacKenzie (2001) tested the Port of Lyttelton for the presence of the toxic
MAF Biosecurity New Zealand Surveillance design report for Lyttelton 7
blooming dinoflagellate Gymnodinium catenatum, and did not detect any resting cysts
(sediment samples) or motile cells (phytoplankton samples).
The following summary detailing non-indigenous species in Lyttelton is taken from the report
detailing the second baseline biological survey of the Port of Lyttelton in November 2004
(Inglis et al. 2006a).
In the two baseline surveys undertaken in March 2002 and November 2004, 18 non-
indigenous species were recorded in the first survey and 23 non-indigenous species were
recorded in the second survey.
A total of 269 species or higher taxa were identified from the second baseline survey of the
Port of Lyttelton. This collection consisted of 151 native, 23 non-indigenous species (Table 3)
and 55 cryptogenic species2 (Table 4), with the remaining 40 taxa being made up of
indeterminate species. In comparison, 245 taxa were recorded from the first survey of the port
in March 2002, comprising 147 native species, 18 non-indigenous species (Table 3), 38
cryptogenic species (Table 4) and 42 indeterminate species. Of the 16 locations surveyed
throughout New Zealand (13 ports and three marinas) during the first baseline surveys, the
Port of Lyttelton had the highest diversity of non-indigenous species.
The 23 non-indigenous species (NIS) recorded in the second baseline survey of the Port of
Lyttelton included 2 annelid worms, 5 bryozoans, 2 hydroids, 5 crustacea, 1 mollusc, 4
phycophytes, 1 poriferan and 3 ascidians (Table 3). Nine species found in the second survey
were not recorded during the first baseline survey in March 2002 (Table 3). These were: the
polychaetes Polydora hoplura and Spirobranchus polytrema, the amphipod Crassicorophium
bonnellii, the hydroids Monotheca pulchella and Symplectoscyphus subdichotomus, the alga
Polysiphonia senticulosa, the sponge Halisarca dujardini and the ascidians Ascidiella aspersa
and Styela clava. Only three NIS recorded in the first survey (the bryozoan Tricellaria
inopinata, the crab Cancer gibbosulus and the alga Polysiphonia subtilissima) were not
recorded in the second survey. Each of these species was present in only a single sample in
the first baseline survey.
Three of the NIS (the amphipod Crassicorophium bonnellii, the ascidian Styela clava, and the
polychaete worm Spirobranchus polytrema) were new records for New Zealand.
Spirobranchus polytrema was recorded for the first time during the first baseline port surveys
of Dunedin, Napier and Wellington. Styela clava was identified for the first time in New
Zealand from Viaduct Harbour in 2005, but the collection from Lyttelton pre-dates that
finding. Styela clava has since been shown to be more widespread. This was the first record of
Crassicorophium bonnellii in New Zealand.
The repeat survey of the Port of Lyttelton recorded 269 species or higher taxa, including 23
non-indigenous species. Although many species also occurred in the first, March 2002
baseline survey, the degree of overlap was not high. Around 43% of the native species, 39%
of non-indigenous species, and 56% of cryptogenic species recorded during the repeat survey
were not found in the earlier survey. This is not simply attributable to the greater sampling
effort in the second survey. The species assemblage in each survey was characterised by high
diversity, a comparatively large proportion of uncommon species, and patchy local
2 A species whose status as native or introduced is unknown. Category 1 cryptogenic species are those previously recorded from New
Zealand whose identity as either native or non-indigenous is unclear. Includes species that may have been introduced to New Zealand before scientific records began and those newly-described species exhibiting invasive behaviour in New Zealand but for which there are no known
records outside the New Zealand region. Category 2 cryptogenic species are those newly-discovered species for which there is insufficient
information to determine whether New Zealand lies within their native distribution.
8 Surveillance design report for Lyttelton MAF Biosecurity New Zealand
distributions that are typical of marine biota. As a consequence, the estimated numbers of
undetected species were comparatively high. In the first baseline survey seven of the 18 non-
indigenous species (38%) were each found in only a single sample. The increased sampling
effort in the second survey improved the rate of recovery of two of these species (Theora
lubrica and Jassa slatteryi), but the other five species were either undetected in the second
survey (three species) or were again found in just a single sample. Furthermore, of the nine
non-indigenous species that were detected only in the second survey, four (44%) were present
in only a single sample. This makes it difficult to determine if the new records in the second
survey represent incursions that occurred after the first survey or, rather, are species that were
present, but undetected during the first survey due to their sparse densities or distribution.
Similarly, the absence of the non-indigenous bryozoan Tricellaria inopinata, the Japanese
cancer crab Cancer gibbosulus, and the red alga Polysiphonia subtilissima in the second
survey could be explained either by sampling error or local extinction after the first baseline
survey.
Five of the non-indigenous species recorded only in the second survey, Ascidiella aspersa,
Halisarca dujardini, Monotheca pulchella, Symplectoscyphus subdichotomus and Polydora
hoplura, had been present in New Zealand for more than 30 years (>100 years in the case of
A. aspersa) and had either been recorded previously from Lyttelton Harbour (A. aspersa, M.
pulchella) or were known from other nearby ports (H. dujardini, S. subdichotomus, P.
hoplura) (Cranfield et al. 1998; Vervoort and Watson 2003). Each of these species was
present in fewer than five samples. Therefore, it seems likely that they were present in
Lyttelton during the first survey, albeit at low densities, and were not detected during the
survey because of their rarity. The remaining three species, Spirobranchus polytrema,
Crassicorophium bonnellii, and Polysiphonia senticulosa, had only recently been described
from New Zealand, had relatively limited national distributions and were new records for
Lyttelton Harbour. Although the evidence was only circumstantial, these three species
probably represented new incursions. Similarly, two of the three non-indigenous species that
were not recorded in the second survey, T. inopinata and P. subtilissima, had been recorded in
other studies from Lyttelton Harbour (Gordon and Mawatari 1992; Cranfield et al. 1998) and
were likely to have been present, but undetected during the repeat survey. The third, C.
gibbosulus, was a new record for New Zealand, with only a single specimen being recovered
from Lyttelton Harbour.
The primary target species Styela clava was not recorded during the first baseline survey in
March 2002, but was found in the Port of Lyttelton on Gladstone Pier during the second
survey in November 2005, and is now widespread in the port area and Magazine Bay Marina.
Undaria pinnatifida was included in the list of target species in previous phases of the
programme and was recorded during both baseline surveys and subsequent target-species
surveillance surveys. As discussed above, it has been present in the Port of Lyttelton since at
least 1991. Of the secondary target species, only Didemnum spp. has been recorded in the
baseline and subsequent target-species surveillance surveys.
MAF Biosecurity New Zealand Surveillance design report for Lyttelton 9
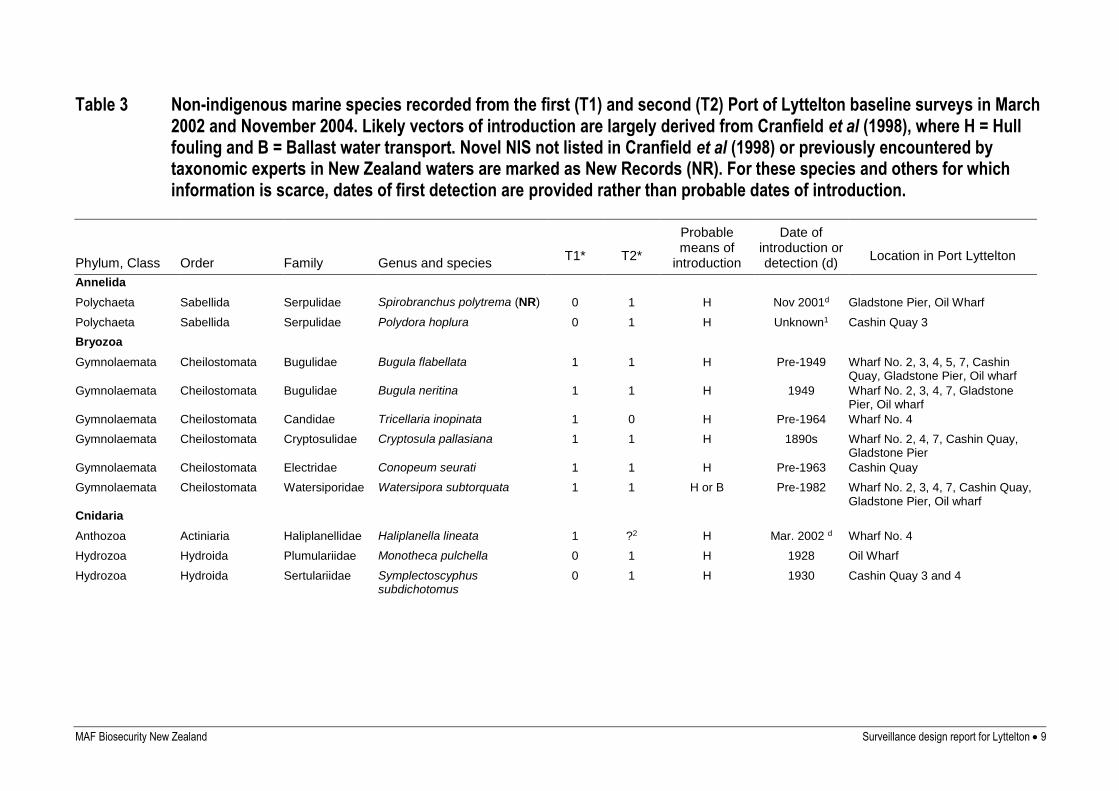
Table 3 Non-indigenous marine species recorded from the first (T1) and second (T2) Port of Lyttelton baseline surveys in March 2002 and November 2004. Likely vectors of introduction are largely derived from Cranfield et al (1998), where H = Hull fouling and B = Ballast water transport. Novel NIS not listed in Cranfield et al (1998) or previously encountered by taxonomic experts in New Zealand waters are marked as New Records (NR). For these species and others for which information is scarce, dates of first detection are provided rather than probable dates of introduction.
Phylum, Class Order Family Genus and species
T1*
T2*
Probable means of
introduction
Date of introduction or detection (d)
Location in Port Lyttelton
Annelida
Polychaeta Sabellida Serpulidae Spirobranchus polytrema (NR) 0 1 H Nov 2001d Gladstone Pier, Oil Wharf
Polychaeta Sabellida Serpulidae Polydora hoplura 0 1 H Unknown1 Cashin Quay 3
Bryozoa
Gymnolaemata Cheilostomata Bugulidae Bugula flabellata 1 1 H Pre-1949 Wharf No. 2, 3, 4, 5, 7, Cashin Quay, Gladstone Pier, Oil wharf
Gymnolaemata Cheilostomata Bugulidae Bugula neritina 1 1 H 1949 Wharf No. 2, 3, 4, 7, Gladstone Pier, Oil wharf
Gymnolaemata Cheilostomata Candidae Tricellaria inopinata 1 0 H Pre-1964 Wharf No. 4
Gymnolaemata Cheilostomata Cryptosulidae Cryptosula pallasiana 1 1 H 1890s Wharf No. 2, 4, 7, Cashin Quay, Gladstone Pier
Gymnolaemata Cheilostomata Electridae Conopeum seurati 1 1 H Pre-1963 Cashin Quay
Gymnolaemata Cheilostomata Watersiporidae Watersipora subtorquata 1 1 H or B Pre-1982 Wharf No. 2, 3, 4, 7, Cashin Quay, Gladstone Pier, Oil wharf
Cnidaria
Anthozoa Actiniaria Haliplanellidae Haliplanella lineata 1 ?2 H Mar. 2002 d Wharf No. 4
Hydrozoa Hydroida Plumulariidae Monotheca pulchella 0 1 H 1928 Oil Wharf
Hydrozoa Hydroida Sertulariidae Symplectoscyphus subdichotomus
0 1 H 1930 Cashin Quay 3 and 4
10 Surveillance design report for Lyttelton MAF Biosecurity New Zealand
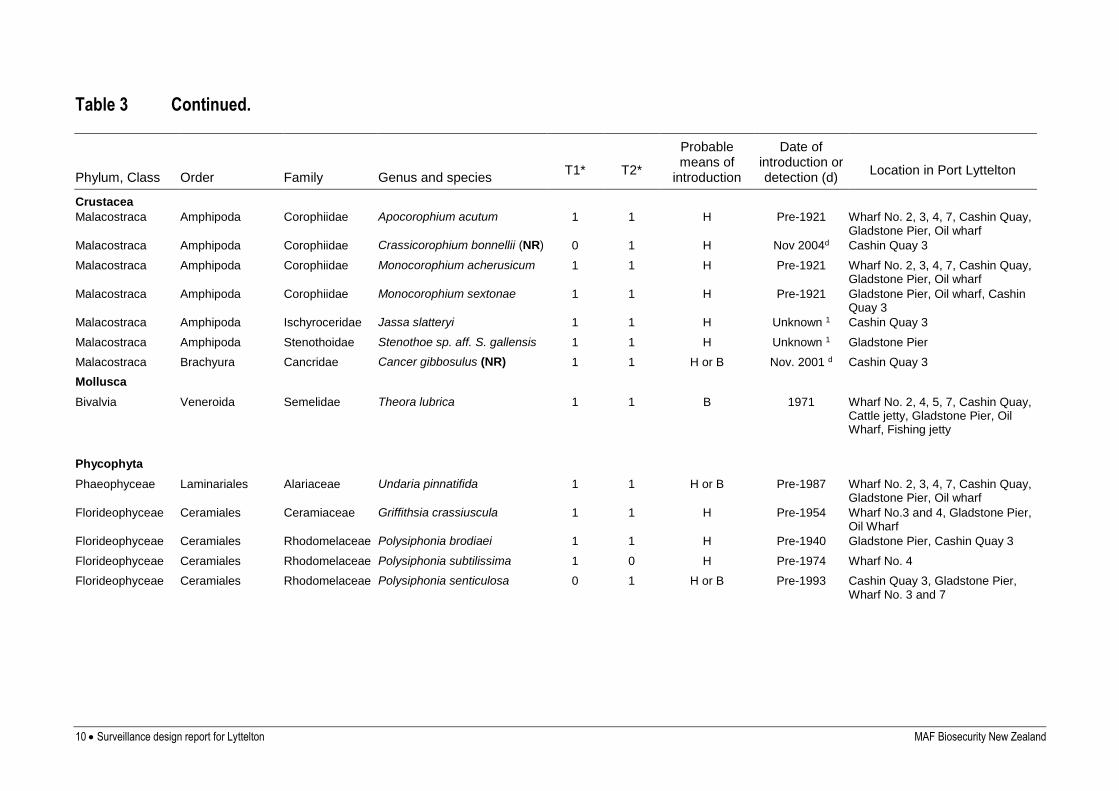
Table 3 Continued.
Phylum, Class Order Family Genus and species
T1*
T2*
Probable means of
introduction
Date of introduction or detection (d)
Location in Port Lyttelton
Crustacea
Malacostraca Amphipoda Corophiidae Apocorophium acutum 1 1 H Pre-1921 Wharf No. 2, 3, 4, 7, Cashin Quay, Gladstone Pier, Oil wharf
Malacostraca Amphipoda Corophiidae Crassicorophium bonnellii (NR) 0 1 H Nov 2004d Cashin Quay 3
Malacostraca Amphipoda Corophiidae Monocorophium acherusicum 1 1 H Pre-1921 Wharf No. 2, 3, 4, 7, Cashin Quay, Gladstone Pier, Oil wharf
Malacostraca Amphipoda Corophiidae Monocorophium sextonae 1 1 H Pre-1921 Gladstone Pier, Oil wharf, Cashin Quay 3
Malacostraca Amphipoda Ischyroceridae Jassa slatteryi 1 1 H Unknown 1 Cashin Quay 3
Malacostraca Amphipoda Stenothoidae Stenothoe sp. aff. S. gallensis 1 1 H Unknown 1 Gladstone Pier
Malacostraca Brachyura Cancridae Cancer gibbosulus (NR) 1 1 H or B Nov. 2001 d Cashin Quay 3
Mollusca
Bivalvia Veneroida Semelidae Theora lubrica 1 1 B 1971 Wharf No. 2, 4, 5, 7, Cashin Quay, Cattle jetty, Gladstone Pier, Oil Wharf, Fishing jetty
Phycophyta
Phaeophyceae Laminariales Alariaceae Undaria pinnatifida 1 1 H or B Pre-1987 Wharf No. 2, 3, 4, 7, Cashin Quay, Gladstone Pier, Oil wharf
Florideophyceae Ceramiales Ceramiaceae Griffithsia crassiuscula 1 1 H Pre-1954 Wharf No.3 and 4, Gladstone Pier, Oil Wharf
Florideophyceae Ceramiales Rhodomelaceae Polysiphonia brodiaei 1 1 H Pre-1940 Gladstone Pier, Cashin Quay 3
Florideophyceae Ceramiales Rhodomelaceae Polysiphonia subtilissima 1 0 H Pre-1974 Wharf No. 4
Florideophyceae Ceramiales Rhodomelaceae Polysiphonia senticulosa 0 1 H or B Pre-1993 Cashin Quay 3, Gladstone Pier, Wharf No. 3 and 7
MAF Biosecurity New Zealand Surveillance design report for Lyttelton 11
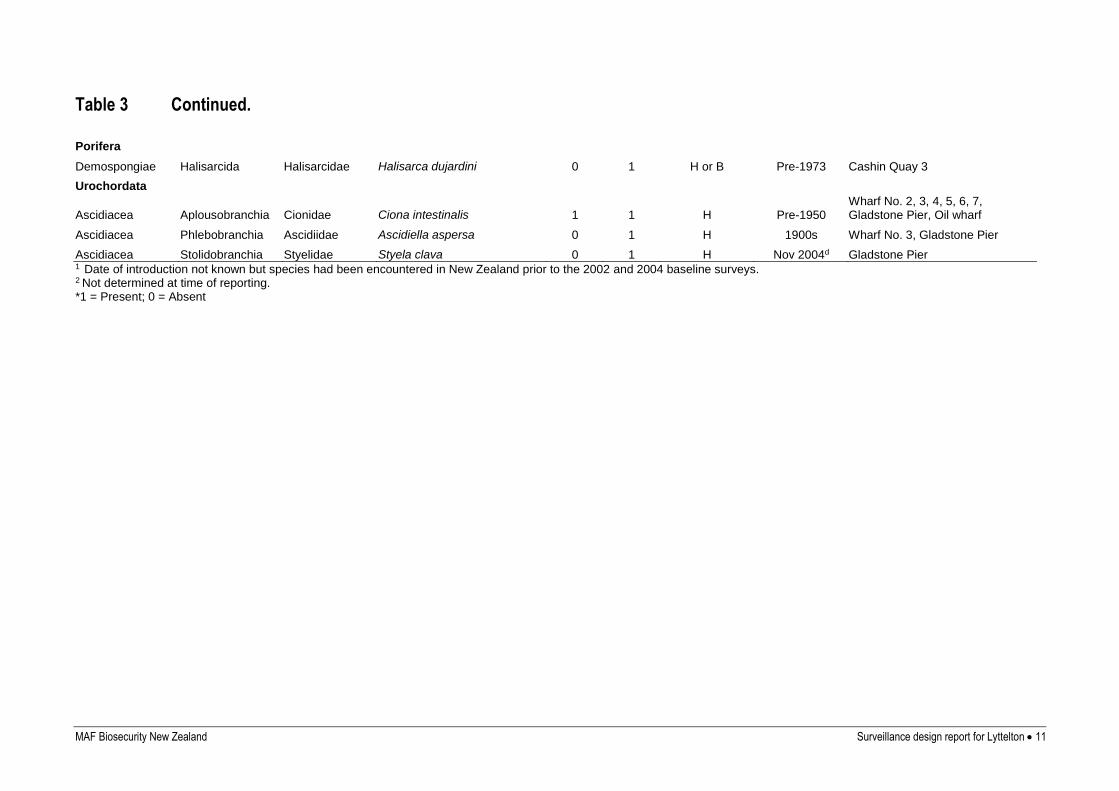
Table 3 Continued.
Porifera
Demospongiae Halisarcida Halisarcidae Halisarca dujardini 0 1 H or B Pre-1973 Cashin Quay 3
Urochordata
Ascidiacea Aplousobranchia Cionidae Ciona intestinalis 1 1 H Pre-1950 Wharf No. 2, 3, 4, 5, 6, 7, Gladstone Pier, Oil wharf
Ascidiacea Phlebobranchia Ascidiidae Ascidiella aspersa 0 1 H 1900s Wharf No. 3, Gladstone Pier
Ascidiacea Stolidobranchia Styelidae Styela clava 0 1 H Nov 2004d Gladstone Pier 1 Date of introduction not known but species had been encountered in New Zealand prior to the 2002 and 2004 baseline surveys. 2 Not determined at time of reporting. *1 = Present; 0 = Absent
12 Surveillance design report for Lyttelton MAF Biosecurity New Zealand
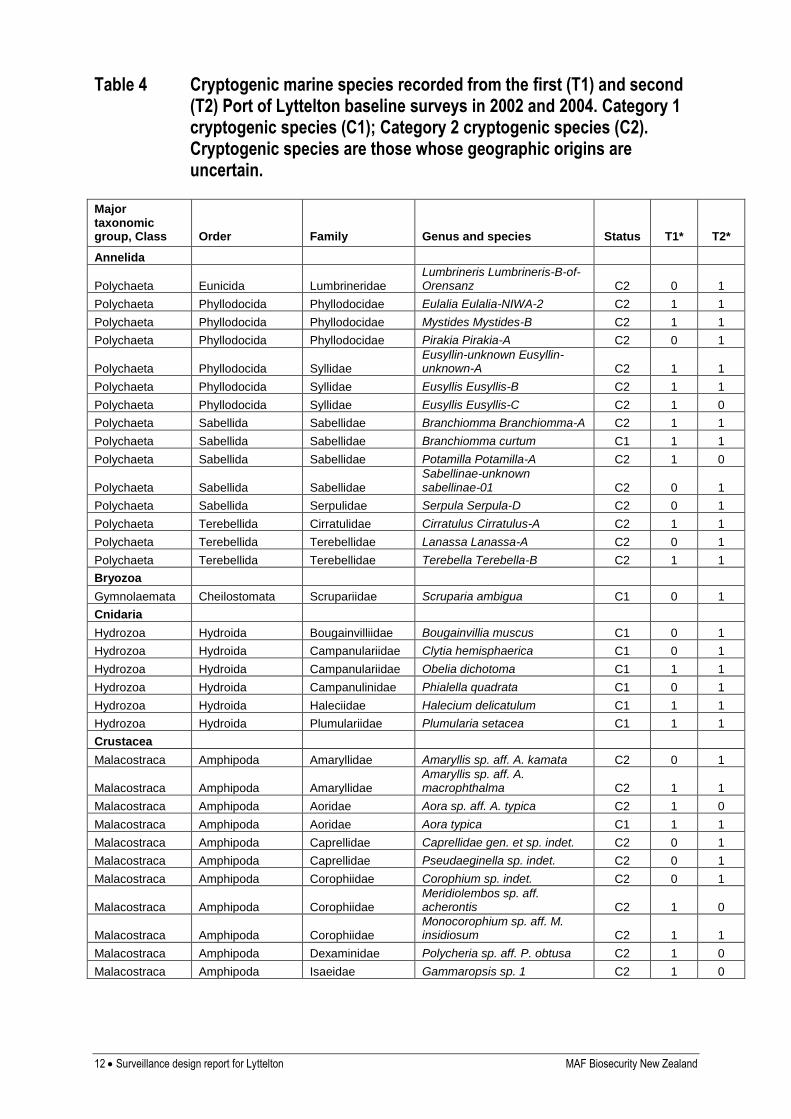
Table 4 Cryptogenic marine species recorded from the first (T1) and second (T2) Port of Lyttelton baseline surveys in 2002 and 2004. Category 1 cryptogenic species (C1); Category 2 cryptogenic species (C2). Cryptogenic species are those whose geographic origins are uncertain.
Major taxonomic group, Class Order Family Genus and species Status T1* T2*
Annelida
Polychaeta Eunicida Lumbrineridae Lumbrineris Lumbrineris-B-of-Orensanz C2 0 1
Polychaeta Phyllodocida Phyllodocidae Eulalia Eulalia-NIWA-2 C2 1 1
Polychaeta Phyllodocida Phyllodocidae Mystides Mystides-B C2 1 1
Polychaeta Phyllodocida Phyllodocidae Pirakia Pirakia-A C2 0 1
Polychaeta Phyllodocida Syllidae Eusyllin-unknown Eusyllin-unknown-A C2 1 1
Polychaeta Phyllodocida Syllidae Eusyllis Eusyllis-B C2 1 1
Polychaeta Phyllodocida Syllidae Eusyllis Eusyllis-C C2 1 0
Polychaeta Sabellida Sabellidae Branchiomma Branchiomma-A C2 1 1
Polychaeta Sabellida Sabellidae Branchiomma curtum C1 1 1
Polychaeta Sabellida Sabellidae Potamilla Potamilla-A C2 1 0
Polychaeta Sabellida Sabellidae
Sabellinae-unknown sabellinae-01 C2 0 1
Polychaeta Sabellida Serpulidae Serpula Serpula-D C2 0 1
Polychaeta Terebellida Cirratulidae Cirratulus Cirratulus-A C2 1 1
Polychaeta Terebellida Terebellidae Lanassa Lanassa-A C2 0 1
Polychaeta Terebellida Terebellidae Terebella Terebella-B C2 1 1
Bryozoa
Gymnolaemata Cheilostomata Scrupariidae Scruparia ambigua C1 0 1
Cnidaria
Hydrozoa Hydroida Bougainvilliidae Bougainvillia muscus C1 0 1
Hydrozoa Hydroida Campanulariidae Clytia hemisphaerica C1 0 1
Hydrozoa Hydroida Campanulariidae Obelia dichotoma C1 1 1
Hydrozoa Hydroida Campanulinidae Phialella quadrata C1 0 1
Hydrozoa Hydroida Haleciidae Halecium delicatulum C1 1 1
Hydrozoa Hydroida Plumulariidae Plumularia setacea C1 1 1
Crustacea
Malacostraca Amphipoda Amaryllidae Amaryllis sp. aff. A. kamata C2 0 1
Malacostraca Amphipoda Amaryllidae Amaryllis sp. aff. A. macrophthalma C2 1 1
Malacostraca Amphipoda Aoridae Aora sp. aff. A. typica C2 1 0
Malacostraca Amphipoda Aoridae Aora typica C1 1 1
Malacostraca Amphipoda Caprellidae Caprellidae gen. et sp. indet. C2 0 1
Malacostraca Amphipoda Caprellidae Pseudaeginella sp. indet. C2 0 1
Malacostraca Amphipoda Corophiidae Corophium sp. indet. C2 0 1
Malacostraca Amphipoda Corophiidae Meridiolembos sp. aff. acherontis C2 1 0
Malacostraca Amphipoda Corophiidae Monocorophium sp. aff. M. insidiosum C2 1 1
Malacostraca Amphipoda Dexaminidae Polycheria sp. aff. P. obtusa C2 1 0
Malacostraca Amphipoda Isaeidae Gammaropsis sp. 1 C2 1 0
MAF Biosecurity New Zealand Surveillance design report for Lyttelton 13
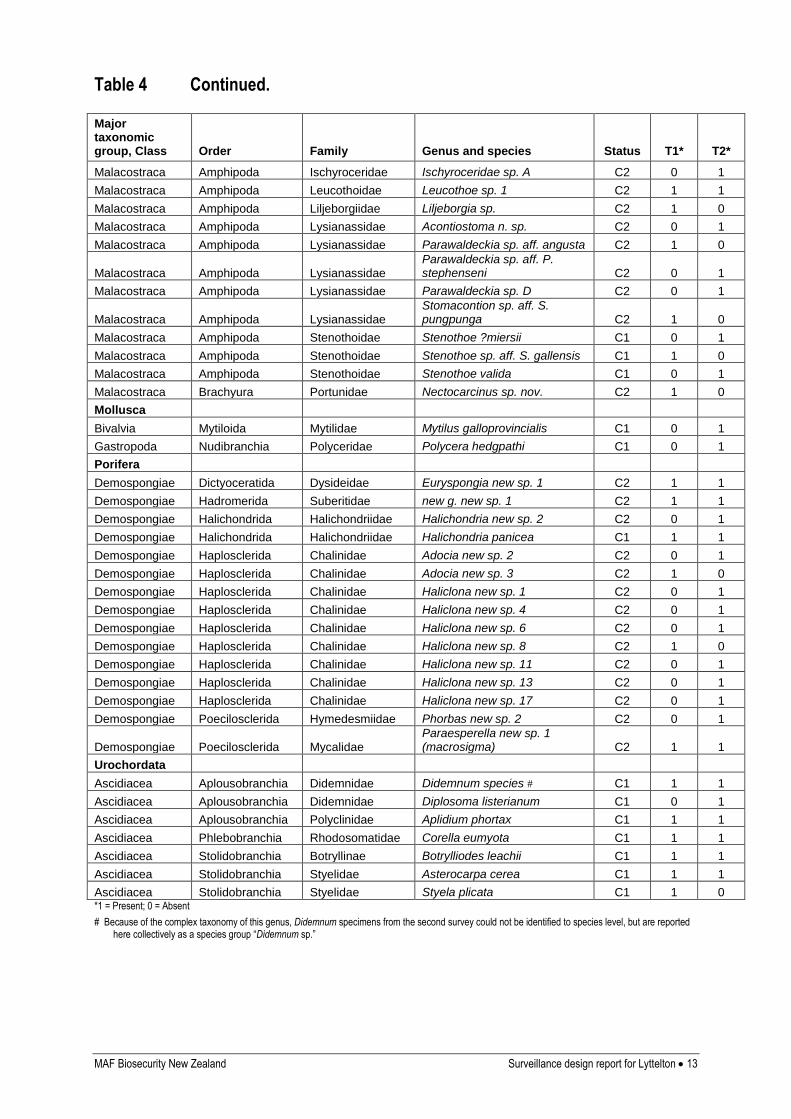
Table 4 Continued.
Major taxonomic group, Class Order Family Genus and species Status T1* T2*
Malacostraca Amphipoda Ischyroceridae Ischyroceridae sp. A C2 0 1
Malacostraca Amphipoda Leucothoidae Leucothoe sp. 1 C2 1 1
Malacostraca Amphipoda Liljeborgiidae Liljeborgia sp. C2 1 0
Malacostraca Amphipoda Lysianassidae Acontiostoma n. sp. C2 0 1
Malacostraca Amphipoda Lysianassidae Parawaldeckia sp. aff. angusta C2 1 0
Malacostraca Amphipoda Lysianassidae Parawaldeckia sp. aff. P. stephenseni C2 0 1
Malacostraca Amphipoda Lysianassidae Parawaldeckia sp. D C2 0 1
Malacostraca Amphipoda Lysianassidae Stomacontion sp. aff. S. pungpunga C2 1 0
Malacostraca Amphipoda Stenothoidae Stenothoe ?miersii C1 0 1
Malacostraca Amphipoda Stenothoidae Stenothoe sp. aff. S. gallensis C1 1 0
Malacostraca Amphipoda Stenothoidae Stenothoe valida C1 0 1
Malacostraca Brachyura Portunidae Nectocarcinus sp. nov. C2 1 0
Mollusca
Bivalvia Mytiloida Mytilidae Mytilus galloprovincialis C1 0 1
Gastropoda Nudibranchia Polyceridae Polycera hedgpathi C1 0 1
Porifera
Demospongiae Dictyoceratida Dysideidae Euryspongia new sp. 1 C2 1 1
Demospongiae Hadromerida Suberitidae new g. new sp. 1 C2 1 1
Demospongiae Halichondrida Halichondriidae Halichondria new sp. 2 C2 0 1
Demospongiae Halichondrida Halichondriidae Halichondria panicea C1 1 1
Demospongiae Haplosclerida Chalinidae Adocia new sp. 2 C2 0 1
Demospongiae Haplosclerida Chalinidae Adocia new sp. 3 C2 1 0
Demospongiae Haplosclerida Chalinidae Haliclona new sp. 1 C2 0 1
Demospongiae Haplosclerida Chalinidae Haliclona new sp. 4 C2 0 1
Demospongiae Haplosclerida Chalinidae Haliclona new sp. 6 C2 0 1
Demospongiae Haplosclerida Chalinidae Haliclona new sp. 8 C2 1 0
Demospongiae Haplosclerida Chalinidae Haliclona new sp. 11 C2 0 1
Demospongiae Haplosclerida Chalinidae Haliclona new sp. 13 C2 0 1
Demospongiae Haplosclerida Chalinidae Haliclona new sp. 17 C2 0 1
Demospongiae Poecilosclerida Hymedesmiidae Phorbas new sp. 2 C2 0 1
Demospongiae Poecilosclerida Mycalidae Paraesperella new sp. 1 (macrosigma) C2 1 1
Urochordata
Ascidiacea Aplousobranchia Didemnidae Didemnum species # C1 1 1
Ascidiacea Aplousobranchia Didemnidae Diplosoma listerianum C1 0 1
Ascidiacea Aplousobranchia Polyclinidae Aplidium phortax C1 1 1
Ascidiacea Phlebobranchia Rhodosomatidae Corella eumyota C1 1 1
Ascidiacea Stolidobranchia Botryllinae Botrylliodes leachii C1 1 1
Ascidiacea Stolidobranchia Styelidae Asterocarpa cerea C1 1 1
Ascidiacea Stolidobranchia Styelidae Styela plicata C1 1 0 *1 = Present; 0 = Absent
# Because of the complex taxonomy of this genus, Didemnum specimens from the second survey could not be identified to species level, but are reported here collectively as a species group “Didemnum sp.”
14 Surveillance design report for Lyttelton MAF Biosecurity New Zealand
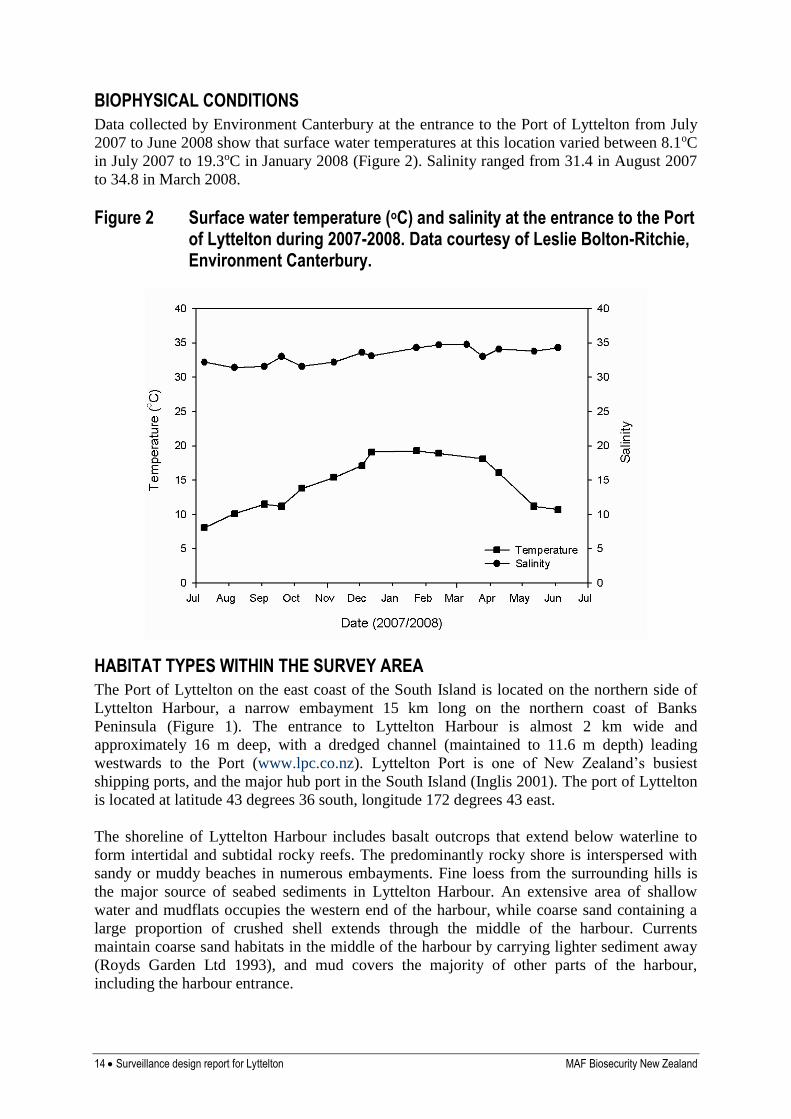
BIOPHYSICAL CONDITIONS
Data collected by Environment Canterbury at the entrance to the Port of Lyttelton from July
2007 to June 2008 show that surface water temperatures at this location varied between 8.1oC
in July 2007 to 19.3oC in January 2008 (Figure 2). Salinity ranged from 31.4 in August 2007
to 34.8 in March 2008.
Figure 2 Surface water temperature (oC) and salinity at the entrance to the Port of Lyttelton during 2007-2008. Data courtesy of Leslie Bolton-Ritchie, Environment Canterbury.
HABITAT TYPES WITHIN THE SURVEY AREA
The Port of Lyttelton on the east coast of the South Island is located on the northern side of
Lyttelton Harbour, a narrow embayment 15 km long on the northern coast of Banks
Peninsula (Figure 1). The entrance to Lyttelton Harbour is almost 2 km wide and
approximately 16 m deep, with a dredged channel (maintained to 11.6 m depth) leading
westwards to the Port (www.lpc.co.nz). Lyttelton Port is one of New Zealand’s busiest
shipping ports, and the major hub port in the South Island (Inglis 2001). The port of Lyttelton
is located at latitude 43 degrees 36 south, longitude 172 degrees 43 east.
The shoreline of Lyttelton Harbour includes basalt outcrops that extend below waterline to
form intertidal and subtidal rocky reefs. The predominantly rocky shore is interspersed with
sandy or muddy beaches in numerous embayments. Fine loess from the surrounding hills is
the major source of seabed sediments in Lyttelton Harbour. An extensive area of shallow
water and mudflats occupies the western end of the harbour, while coarse sand containing a
large proportion of crushed shell extends through the middle of the harbour. Currents
maintain coarse sand habitats in the middle of the harbour by carrying lighter sediment away
(Royds Garden Ltd 1993), and mud covers the majority of other parts of the harbour,
including the harbour entrance.
MAF Biosecurity New Zealand Surveillance design report for Lyttelton 15
Lyttelton Harbour has a mean tidal range of 1.67 m (neap tides) to 1.94 m (spring tides), and a
mean tidal velocity of 0.22 m per sec. The tidal circulation observed in the harbour is not
completely documented, however, it is known that large-scale tidal ‘gyres’ exist in the eastern
half of the harbour, turning clockwise on ebb and counter-clockwise on flood tides. A
clockwise eddy forms on ebb tide behind the Cashin Quay breakwater, so that velocities
during flood and ebb are persistently westward along the shore and southward along the
breakwater (Spigel 1993). The mean volume of water in Lyttelton Port itself has been
calculated at 4.7 million m3 (Knox, 1983). During a mean spring tide approximately 838,272
m3 of this water is exchanged, which equates to a mean volume exchange of 18%. On a mean
neap tide the volume exchanged is 729,122 m3, or around 16% (Royds Garden Ltd 1992).
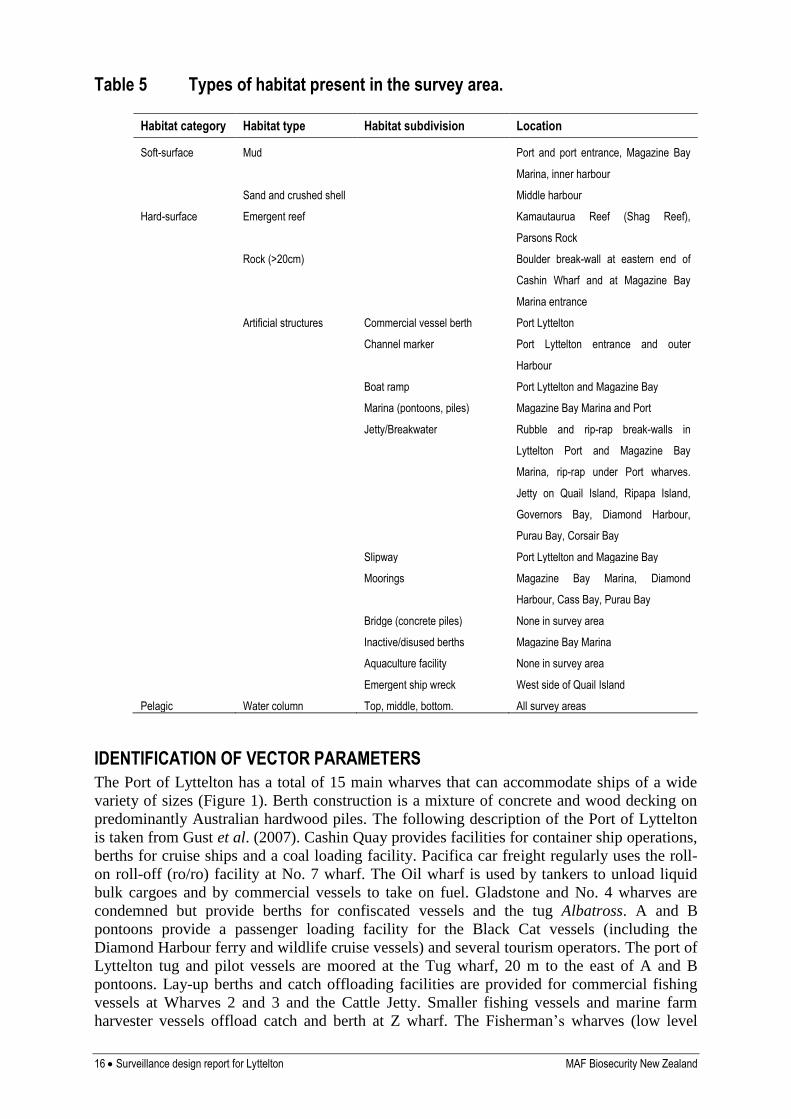
Types of habitat present in the Port of Lyttelton and the surrounding areas are listed in
Table 5. Given that much of the available habitat for incoming non-indigenous species is
represented by artificial substrata within the port, calculation of habitat area/volume is not
feasible within the present project – there are almost certainly no data on numbers of piles,
marina pontoons, etc for the whole port and the available habitat area is structurally extremely
complex.
16 Surveillance design report for Lyttelton MAF Biosecurity New Zealand
Table 5 Types of habitat present in the survey area.
Habitat category Habitat type Habitat subdivision Location
Soft-surface Mud Port and port entrance, Magazine Bay
Marina, inner harbour
Sand and crushed shell Middle harbour
Hard-surface Emergent reef Kamautaurua Reef (Shag Reef),
Parsons Rock
Rock (>20cm) Boulder break-wall at eastern end of
Cashin Wharf and at Magazine Bay
Marina entrance
Artificial structures Commercial vessel berth Port Lyttelton
Channel marker Port Lyttelton entrance and outer
Harbour
Boat ramp Port Lyttelton and Magazine Bay
Marina (pontoons, piles) Magazine Bay Marina and Port
Jetty/Breakwater Rubble and rip-rap break-walls in
Lyttelton Port and Magazine Bay
Marina, rip-rap under Port wharves.
Jetty on Quail Island, Ripapa Island,
Governors Bay, Diamond Harbour,
Purau Bay, Corsair Bay
Slipway Port Lyttelton and Magazine Bay
Moorings Magazine Bay Marina, Diamond
Harbour, Cass Bay, Purau Bay
Bridge (concrete piles) None in survey area
Inactive/disused berths Magazine Bay Marina
Aquaculture facility None in survey area
Emergent ship wreck West side of Quail Island
Pelagic Water column Top, middle, bottom. All survey areas
IDENTIFICATION OF VECTOR PARAMETERS
The Port of Lyttelton has a total of 15 main wharves that can accommodate ships of a wide
variety of sizes (Figure 1). Berth construction is a mixture of concrete and wood decking on
predominantly Australian hardwood piles. The following description of the Port of Lyttelton
is taken from Gust et al. (2007). Cashin Quay provides facilities for container ship operations,
berths for cruise ships and a coal loading facility. Pacifica car freight regularly uses the roll-
on roll-off (ro/ro) facility at No. 7 wharf. The Oil wharf is used by tankers to unload liquid
bulk cargoes and by commercial vessels to take on fuel. Gladstone and No. 4 wharves are
condemned but provide berths for confiscated vessels and the tug Albatross. A and B
pontoons provide a passenger loading facility for the Black Cat vessels (including the
Diamond Harbour ferry and wildlife cruise vessels) and several tourism operators. The port of
Lyttelton tug and pilot vessels are moored at the Tug wharf, 20 m to the east of A and B
pontoons. Lay-up berths and catch offloading facilities are provided for commercial fishing
vessels at Wharves 2 and 3 and the Cattle Jetty. Smaller fishing vessels and marine farm
harvester vessels offload catch and berth at Z wharf. The Fisherman’s wharves (low level
MAF Biosecurity New Zealand Surveillance design report for Lyttelton 17
breastworks) provide ca. 20 berths for a day fleet of small fishing vessels (11 to 16 m) and
three to four fishing charter and tourism boats. The inner harbour pile moorings provide
approximately 70 berths for recreational and charter vessels ranging in size from 7 to 15 m.
The Lyttelton Dry Dock opens into the Port basin and provides the only dry dock facility in
the South Island. A haul-out facility and small boat ramp are also located next to the dry dock.
Vessels that are unable to berth in the port immediately on arrival may anchor 1.5 nautical
miles northeast of Godley Head in 16.5 m of water. Alternative anchorage for vessels of 8.5
m draught or less is available in Camp Bay in 11 m of water. Pilotage is compulsory on
vessels over 500 GRT or over 40 m LOA, unless they have pilot exemption (www.lpc.co.nz).
Maintenance dredging within the shipping area has been ongoing in the port for around 40
years, with approximately 500,000 to 1 million m3 of spoil removed annually. This spoil is
deposited on-shore on the northern side of the Harbour from Gollans Bay up to the Heads to
aid in wave refraction away from the port (Neil McLennan, Lyttleton Port Company, pers
comm.). In the 2007 financial year, over 925,000 tonne of spoil was dredged from the main
channel (www.lpc.co.nz).
Capital works conducted in the Port area since March 2002 have not included any changes to
in-water structures, except the demolition of the B Jetty and its replacement in late 2005. The
B Jetty, located near the tug jetties and used for public ferries, had consisted of approximately
40 wooden piles and was replaced by a new floating jetty anchored with four steel piles (N.
McLennan, pers comm.). In terms of ongoing and future development, the Lyttleton Port
Company is focusing on increasing productivity and efficiency of the ports current berth
space. Coal facilities and the oil wharf are being upgraded and four new straddle cranes have
been purchased to improve service levels and reduce shipping turnaround times
(www.lpc.co.nz).
The following description of the recreational marina located approximately 1 km southwest of
the port at Magazine Bay is taken from Gust et al. (2007). The marina originally consisted of
a wooden pile jetty with five fingers and a range of floating pontoons that provided berths for
vessel up to 15 m in length. The marina was severely damaged in a southerly storm in 2000.
All that remains of the former marina is a series of concrete piles to the southeast of the main
jetty. The damaged pontoons were removed ashore and some of the intact ones were
transferred to the Port of Lyttelton where they are used as a passenger loading facility for
ferries and tourism vessels and as a work platform between Z wharf and Gladstone Pier. The
marina company is in receivership and the jetty has fallen into disrepair in several sections.
There are plans to develop the marina to accommodate around 400 berths. A small pontoon
(25 x 4 m) has been constructed by the Naval Point Yacht Club and is used to rig and board
small sailing dinghies. There is a public boat ramp further to the southeast near a rocky break
wall.
Imports and exports
The Port of Lyttelton is the main conduit for Canterbury’s export and import activity. In 2003,
the Port of Lyttelton shipped 60% of Canterbury’s and 8% of New Zealand’s total
merchandise exports and handled 67% of Canterbury’s and 6% of New Zealand’s total
merchandise imports (www.lpc.co.nz).
The Port is currently the largest export gateway for coal in New Zealand, with over 2 million
tonnes moving through the port each year. It also handles a wide variety of cargoes, including
petroleum, fertiliser, gypsum, conventional break-bulk, vehicles, farm machinery, fishing and
other cargoes.
18 Surveillance design report for Lyttelton MAF Biosecurity New Zealand
In the 2004-2005 financial year, the numbers of containers through the container terminal
increased by 10%, from 161,200 TEU3 to 177,400 TEU, consisting of 91,620 TEU for
imports, 81,110 TEU for export and the remaining for trans-ships, empties and other
movements. Total international and domestic containers through the port grew 3% from
202,800 TEU to 208,600 TEU (Lyttelton Port Company 2005).
The volumes and value of goods imported and exported through the Port of Lyttelton are
summarised below. These data describe only cargo being loaded for, or unloaded from,
overseas ports and do not include domestic cargo (Statistics New Zealand 2006a). Also
available from Statistics New Zealand (2006b) was a breakdown of cargo value by country of
origin or destination and by commodity for each calendar year; we analysed the data for the
period 2002 to 2005 inclusive (i.e. the period between the first and second baseline surveys).
Imports
Both the weight and value of overseas cargo unloaded at the Port of Lyttelton has increased
each year since the 2002 first baseline survey, with 1.5 million tonnes gross weight valued at
$2,304 million being unloaded in the year ended June 2005 (Statistics New Zealand 2006a).
This represents an increase in weight of 24% and in value of almost 11% compared to the
year ending June 2002. Overseas cargo unloaded at the Port of Lyttelton accounted for around
8% both by weight and by value of the total overseas cargo unloaded at New Zealand’s
seaports.
The Port of Lyttelton imported cargo in 96 different commodity categories between 2002 and
2005 inclusive (Statistics New Zealand 2006b). The dominant commodities by value imported
at the Port of Lyttelton during this time were vehicles (21% of total value of imports), boilers,
machinery and mechanical appliances (10%), mineral fuels, oils, and products (8%), plastics
and plastic articles (5%), and paper and paperboard and articles thereof (5%). These five
commodities ranked among the top five imports each year from 2002 to 2005, with vehicles
ranking first each year. Machinery ranked second and mineral fuels and oils ranked third each
year, except in 2005 when their ranks were reversed. Plastics ranked fourth and paper ranked
fifth each year, except in 2003 when their ranks were reversed (Statistics New Zealand
2006b). Major import commodities by volume, in contrast to value, were reported by the
Lyttelton Port Company (2005) to have included fuel (1.1 million tonnes), fertiliser (400,000
tonnes), food and beverage (53,000 tonnes imported), and motor vehicles (51,800 vehicles)
during the 2004-2005 financial year.
The Port of Lyttelton received imports from 152 countries of initial origin4 between 2002 and
2005 inclusive (Statistics New Zealand 2006b). During this time, most imported cargo by
value came from Australia (29%), Japan (20%) and the People’s Republic of China (11%).
These rankings were consistent each year. Singapore ranked fourth each year except in 2002
when it was replaced by Germany, and the USA ranked fifth each year (Statistics New
Zealand 2006b).
Exports
In the year ending June 2005, the Port of Lyttelton loaded 3.1 million tonnes of cargo for
export (Statistics New Zealand 2006a). This represented a 0.2% decline on the previous year
but an increase of 5.5% compared to the year ending June 2002. The value of this cargo
3 TEU = twenty foot equivalent unit. This is a standard size of container and a common measure of capacity in the container logistics business. 4 The country of initial origin is not necessarily the country that the ship carrying the commodity was in immediately before arriving at the
Port of Lyttelton.

MAF Biosecurity New Zealand Surveillance design report for Lyttelton 19
declined almost 22% since the year ending June 2002, with a value of $2,264 million in the
year ending June 2005. For the financial years ending June 2002 to 2005, overseas cargo
loaded at the Port of Lyttelton accounted for 12 to 14% by weight and 9 to 10% by value of
the total overseas cargo loaded at New Zealand’s seaports.
The Port of Lyttelton exported cargo in 94 different commodity categories between 2002 and
2005 inclusive (Statistics New Zealand 2006b). The dominant commodity categories by value
loaded at the Port of Lyttelton for export during this time were wool and animal hair (13%),
dairy produce, bird’s eggs, natural honey and other edible animal products (12%), meat and
edible meat offal (10%), fish, crustaceans, molluscs and other aquatic invertebrates (9%) and
confidential items (8%). The same five commodities ranked in the top five each year. Dairy
and wool ranked first or second each year except in 2005, when Confidential items ranked
first with wool ranking second and dairy third. Meat ranked third each year and fish fourth,
except in 2005 when they ranked fourth and fifth respectively. Confidential items ranked fifth
each year except 2005 (Statistics New Zealand 2006b). Major export commodities by volume
are similar to those ranked by value, and were reported by the Lyttelton Port Company (2005)
to have included coal (2.1 million tonnes), fish (110,000 tonnes), meat (60,000 tonnes of beef,
lamb and venison), wool (60,000 tonnes) and timber (19% of all containerised exports) during
the 2004-2005 financial year.
The Port of Lyttelton loaded cargo for export to 154 countries of final destination5 between
2002 and 2005 inclusive (Statistics New Zealand 2006b). During this time, the Port of
Lyttelton exported most of its overseas cargo by value to Australia (27%), Japan (13%) and
the People’s Republic of China (11%). These rankings were the same each year, and are
similar to the trends for imports at this port
Shipping movements and ballast discharge patterns in the Port of Lyttelton
Since June 2005, vessels have been required to comply with the Import Health Standard for
Ships’ Ballast Water from All Countries (http://www.biosecurity.govt.nz/imports/non-
organic/standards/ballastwater.htm). No ballast water is allowed to be discharged without the
express permission of a MAF (Ministry of Agriculture and Forestry) inspector. To allow
discharge, vessel masters are responsible for providing the inspector with evidence of:
discharging ballast water at sea (200 nm from the nearest land, and at least 200 m depth); or
demonstrating that ballast water is fresh (2.5 ppt sodium chloride); or having the ballast water
treated by a MAF-approved treatment system. According to Inglis (2001), a total volume of
354,670 m3 of ballast water was reported discharged in the Port of Lyttelton in 1999, with the
largest country-of-origin volumes of 153,376 m3 from Japan, 45,396 m3
from Australia,
36,073 m3 from Taiwan, and 77,887 m3
unspecified.
In the 2007 financial year, the Port of Lyttelton received a total of 1,193 ship visits, including
364 container ships, 94 car ships, 42 coal ships and 38 cruise liners (www.lpc.co.nz). The
total number of ship visits fell by 3.9% compared to 2006, when 1,242 ships visited. The main
reason for the down turn in 2007 was the reduction in fishing vessels, with 48,956 tonnes
handled compared to 59,600 tonnes in 2006.
To gain a more detailed understanding of international and domestic vessel movements to and
from the Port of Lyttelton between 2002 and 2005 inclusive, we analysed a database of vessel
movements generated and updated by Lloyds Marine Intelligence Unit (LMIU), called
‘SeaSearcher.com’. Drawing on real-time information from a network of Lloyd's agents and
other sources around the world, the database contains arrival and departure details of all ocean
5 The country of final destination is not necessarily the country that the ship carrying the commodity goes to immediately after departing
from the Port of Lyttelton; it is the final destination of the goods.
20 Surveillance design report for Lyttelton MAF Biosecurity New Zealand
going merchant vessels larger than 99 gross tonnes for all of the ports in the baseline surveys.
The database does not include movement records for domestic or international ferries plying
scheduled routes, small domestic fishing vessels or recreational vessels. Cruise ships, coastal
cargo vessels and all other vessels over 99 gross tonnes are included in the database. The
database therefore gives a good indication of the movements of international and domestic
vessels involved in trade. The results of the search are summarised below (further details are
available in Inglis et al. 2006a).
International vessel movements
Based on an analysis of the LMIU database, there were 654 vessel arrivals to the Port of
Lyttelton from overseas ports between 2002 and 2005 inclusive. These came from 44
different countries represented by most regions of the world. The greatest number of overseas
arrivals during this period came from the following areas: Australia (201), Pacific Islands
(141), the northwest Pacific (107) and Japan (76). The previous ports of call for 19 of the
international arrivals were not stated in the database. Vessels arriving from Australia came
mostly from ports in Victoria (81 arrivals), Queensland (54) and New South Wales (29). The
major vessel types arriving from overseas at the Port of Lyttelton were bulk / cement carriers
(206 arrivals), container ships and ro/ro (133) and general cargo (126).
According to the LMIU database, during the same period 979 vessels departed from the Port
of Lyttelton to 44 different countries, also represented by most regions of the world. The
greatest number of departures for overseas went to Australian ports as their next port of call
(323 movements) followed by Japan (228), East Asian seas (142) and the northwest Pacific
(135). The major vessel types departing to overseas ports from the Port of Lyttelton were
container ships and ro/ro (324 movements), passenger / vehicle / livestock carriers (229), and
bulk / cement carriers (210).
Commercial shipping arriving in the port of Lyttelton from overseas comes predominantly
from temperate regions of the North West Pacific (40%; in particular Japan, Korea and China)
and southern Australia (29%); environments which are broadly compatible with those in
Lyttelton Harbour. In addition, relative to other ports in New Zealand, Lyttelton has a high
trade volume of bulk cargoes, including exports of coal, wool, dairy products and timber, and
imports of minerals and mineral fuels (Statistics New Zealand 2004). This is reflected in the
relatively high volume of ballast that is discharged in Lyttelton Harbour. According to Inglis
(2001), Lyttelton received the second highest (after Port Taranaki) volume of reported ballast
discharge (354,670 m3) of New Zealand ports, which came predominantly from Japan (44%),
Australia (13%), Taiwan (10%) and South Korea (7%). Shipping from these regions presents
an on-going risk of introduction of new NIS to Lyttelton Harbour.
Domestic vessel movements
The LMIU database contains movement records for 3,291 vessel arrivals to the Port of
Lyttelton from New Zealand ports between 2002 and 2005 inclusive. These arrived from 17
different ports in both the North and South Islands. The greatest number of domestic arrivals
during this period came from Wellington (784 arrivals), Auckland (517 arrivals), Tauranga
(434 arrivals), Lyttelton (ie. closed-loop trips; 313 arrivals), and Napier (293 arrivals).
Container ships and ro/ro’s were by far the dominant vessel type arriving at the Port of
Lyttelton from New Zealand ports (1336 arrivals) followed by passenger / vehicle / livestock
carriers (501 arrivals), general cargo vessels (484 arrivals), tankers (256 arrivals) and bulk /
cement carriers (251 arrivals).
During the same period, the LMIU database contains movement records for 2,923 vessel
departures from the Port of Lyttelton to 19 New Zealand ports in both the North and South
MAF Biosecurity New Zealand Surveillance design report for Lyttelton 21
Islands. The most domestic movements departed the Port of Lyttelton for Wellington (613
movements), Nelson (494 movements), Dunedin (464), Lyttelton (ie. closed-loop trips; 313
departures) and New Plymouth (270). Container ships and ro/ro’s dominated the vessel types
leaving the Port of Lyttelton on domestic voyages (1142 departures), followed by general
cargo vessels (515 movements), passenger / vehicle / livestock carriers (346 arrivals) and bulk
/ cement carriers (249 movements).
Possible vectors for introduction of non-indigenous species
The non-indigenous species found in the Port of Lyttelton baseline surveys are thought to
have arrived in New Zealand via international shipping. They may have reached the Port of
Lyttelton directly from overseas or through domestic spread (natural and/or anthropogenic)
from other New Zealand ports. Likely vectors of introduction are largely derived from
Cranfield et al. (1998) and expert opinion. They suggest that only one of the 27 NIS (4%)
probably arrived via ballast water, 21 species (78%) were most likely to be associated with
hull fouling, and five species (18%) could have arrived via either of these mechanisms.
Assessment of the risk of new introductions to the port
Many non-indigenous species introduced to New Zealand ports by shipping do not survive to
establish self-sustaining local populations. Those that do, often come from coastlines that
have similar marine environments to New Zealand. For example, approximately 80% of the
marine NIS known to be present within New Zealand are native to temperate coastlines of
Europe, the northwest Pacific, and southern Australia (Cranfield et al. 1998).
Between 2002 and 2005, there were 654 vessel arrivals from overseas to the Port of Lyttelton.
The greatest number of these came from Australia (201, including 138 from southeastern
Australia), the Pacific Islands (141), the northwest Pacific (107, predominantly from China,
Korea, Russia and Taiwan) and Japan (76). With the exception of the Pacific Islands, most of
this trade is with ports from other temperate regions that have coastal environments similar to
New Zealand’s. Vessels from the Pacific Islands also present less of a risk not just because of
differences in coastal environments, but also because most of these vessels are passenger
vessels (cruise liners), general and container cargo vessels, which typically discharge
relatively small volumes of ballast water. Bulk carriers and tankers that arrive empty carry the
largest volumes of ballast water. In the Port of Lyttelton these came predominantly from
Australia (85 visits), the northwest Pacific (58 visits), Japan (53 visits) and East Asian seas
(24 visits). Smaller, slower moving vessels, such as barges and fishing boats, tend to carry a
greater density of fouling organisms than faster cargo vessels. In the port of Lyttelton, these
also came predominantly from Australia, Japan and the northwest Pacific.
Shipping from southern Australia, the northwest Pacific (predominantly China, Korea, Russia
and Taiwan) and Japan present the greatest risk of introducing new non-indigenous species to
the Port of Lyttelton. Because of the relatively short transit time, shipping originating in
southern Australia (particularly Victoria and Tasmania) carries, perhaps, the greatest overall
risk. Furthermore, six of the eight marine pests on the New Zealand Register of Unwanted
Organisms are already present there (Carcinus maenas, Asterias amurensis, Undaria
pinnatifida, Sabella spallanzanii, Caulerpa taxifolia, and Styela clava). The native range of
another two species, Eriocheir sinensis and Potamocorbula amurensis, is the north western
Pacific, including China and Japan.
Assessment of translocation risk for introduced species found in the port
Between 2002 and 2005, vessels departing from the Port of Lyttelton travelled to 19 ports
throughout New Zealand. Wellington, Nelson, Dunedin and New Plymouth were the next
ports of call for the most domestic vessel movements from Lyttelton. Although many of the
22 Surveillance design report for Lyttelton MAF Biosecurity New Zealand
non-indigenous species found in the second survey of the Port of Lyttelton had been recorded
at other locations throughout New Zealand, they were not detected in all of the ports
surveyed. Therefore, there is a risk that species established in the Port of Lyttelton could be
spread to other New Zealand locations.
Of particular note are the two species present in Lyttelton that are on the New Zealand
Register of Unwanted Species: the invasive alga Undaria pinnatifida and the club-shaped
ascidian, Styela clava. Undaria pinnatifida has been present in New Zealand since at least
1987 and had spread through shipping and other vectors to 11 of the 16 ports and marinas
surveyed during the baseline surveys (the exceptions being Opua, Whangarei Port and
Marina, Gulf Harbour Marina and Tauranga Port). It was absent from the Ports of Taranaki
(New Plymouth) and Tauranga, however, mature sporophytes were discovered in the Port of
Taranaki during the second baseline port survey in March 2005. Isolated sporophytes were
also discovered independently on rocky reefs near the Port of Tauranga by Environment Bay
of Plenty, and since the baseline surveys, the alga has been recorded on wharf piles in the
port. LPG / LNG tankers and general cargo regularly travel between Lyttelton and the Port of
Tauranga and, to a much lesser extent, ports north of Auckland where U. pinnatifida has not
yet become established. There is, therefore, a risk that it could be spread to these locations by
shipping from Lyttelton.
At the time of the baseline surveys, Lyttelton Harbour was one of only two locations outside
the Hauraki Gulf where Styela clava is known to be present, the other being Tutukaka Marina
(Gust et al. 2006). This species is considered a significant pest of aquaculture (particularly
long-line mussel culture) and there is concern about the potential for it to spread to important
mussel growing areas in the Marlborough Sounds and Coromandel. Although there are
relatively few vessel movements between the Ports of Lyttelton and Picton (in the
Marlborough Sounds), there is regular traffic from Lyttelton to nearby Nelson and Wellington
by a range of vessel types. Because they are fouling organisms, the risk of translocating
Undaria pinnatifida and S. clava is highest for slow-moving vessels, such as yachts and
barges, and vessels that have long residence times in port. There is one mussel barge
operating in the Port of Lyttelton (servicing Banks Peninsula mussel farms) that does
periodically travel to, and from, Havelock (in the Marlborough Sounds). In the Port of
Lyttelton, cargo and bulk (including fuel) carriers, recreational craft, and seasonal fishing
vessels that are laid up for significant periods of time pose a particular risk for the spread of
these species.
Several other species recorded during the second baseline survey were only recorded from the
Port of Lyttelton or had relatively restricted distributions nationwide and could, therefore, be
spread from Lyttelton to other locations. These include the amphipods Crassicorophium
bonnellii, Jassa slatteryi and Monocorophium sextonae, the hydroid Symplectoscyphus
subdichotomus, and the alga Polysiphonia senticulosa. Information on the ecology of these
species is limited, but none is known to have potential for significant impacts.
The small Japanese cancrid crab, Cancer gibbosulus, which was recorded from Lyttelton
during the first baseline survey, was not found during the second survey. Only a few
specimens were recovered from Lyttelton, Timaru and Wellington during the first port
baseline surveys and it was not recovered from any of these locations during the second
surveys. It is unclear whether this was due to sampling error as a consequence of very small
population densities in each port, or because the initial populations that were discovered were
not viable. In either case, there is probably only a small risk of translocation given the levels
of abundance.
MAF Biosecurity New Zealand Surveillance design report for Lyttelton 23
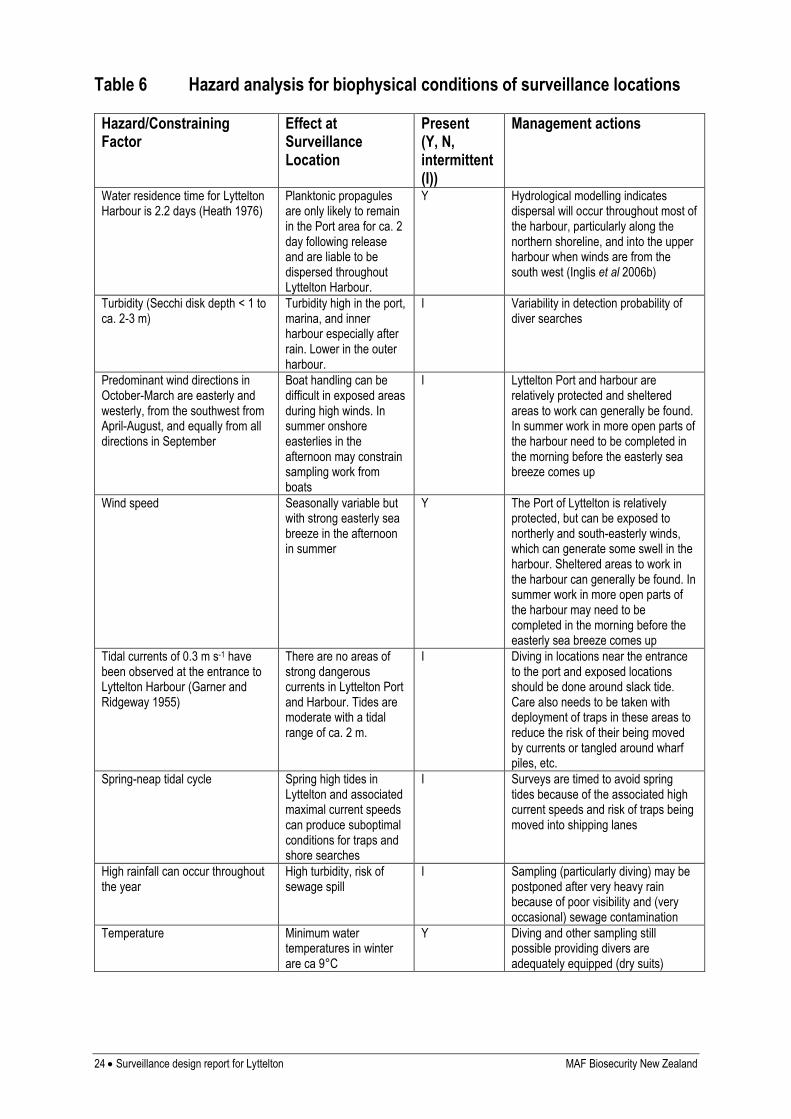
LOCAL CONSTRAINING FACTORS ON SURVEILLANCE SUCCESS
Local factors likely to constrain sampling, including those representing hazards to the field
team members, are listed in Table 6, together with management options to mitigate them.
24 Surveillance design report for Lyttelton MAF Biosecurity New Zealand
Table 6 Hazard analysis for biophysical conditions of surveillance locations
Hazard/Constraining Factor
Effect at Surveillance Location
Present (Y, N, intermittent (I))
Management actions
Water residence time for Lyttelton Harbour is 2.2 days (Heath 1976)
Planktonic propagules are only likely to remain in the Port area for ca. 2 day following release and are liable to be dispersed throughout Lyttelton Harbour.
Y Hydrological modelling indicates dispersal will occur throughout most of the harbour, particularly along the northern shoreline, and into the upper harbour when winds are from the south west (Inglis et al 2006b)
Turbidity (Secchi disk depth < 1 to ca. 2-3 m)
Turbidity high in the port, marina, and inner harbour especially after rain. Lower in the outer harbour.
I Variability in detection probability of diver searches
Predominant wind directions in October-March are easterly and westerly, from the southwest from April-August, and equally from all directions in September
Boat handling can be difficult in exposed areas during high winds. In summer onshore easterlies in the afternoon may constrain sampling work from boats
I Lyttelton Port and harbour are relatively protected and sheltered areas to work can generally be found. In summer work in more open parts of the harbour need to be completed in the morning before the easterly sea breeze comes up
Wind speed Seasonally variable but with strong easterly sea breeze in the afternoon in summer
Y The Port of Lyttelton is relatively protected, but can be exposed to northerly and south-easterly winds, which can generate some swell in the harbour. Sheltered areas to work in the harbour can generally be found. In summer work in more open parts of the harbour may need to be completed in the morning before the easterly sea breeze comes up
Tidal currents of 0.3 m s-1 have been observed at the entrance to Lyttelton Harbour (Garner and Ridgeway 1955)
There are no areas of strong dangerous currents in Lyttelton Port and Harbour. Tides are moderate with a tidal range of ca. 2 m.
I Diving in locations near the entrance to the port and exposed locations should be done around slack tide. Care also needs to be taken with deployment of traps in these areas to reduce the risk of their being moved by currents or tangled around wharf piles, etc.
Spring-neap tidal cycle Spring high tides in Lyttelton and associated maximal current speeds can produce suboptimal conditions for traps and shore searches
I Surveys are timed to avoid spring tides because of the associated high current speeds and risk of traps being moved into shipping lanes
High rainfall can occur throughout the year
High turbidity, risk of sewage spill
I Sampling (particularly diving) may be postponed after very heavy rain because of poor visibility and (very occasional) sewage contamination
Temperature Minimum water temperatures in winter are ca 9°C
Y Diving and other sampling still possible providing divers are adequately equipped (dry suits)
MAF Biosecurity New Zealand Surveillance design report for Lyttelton 25
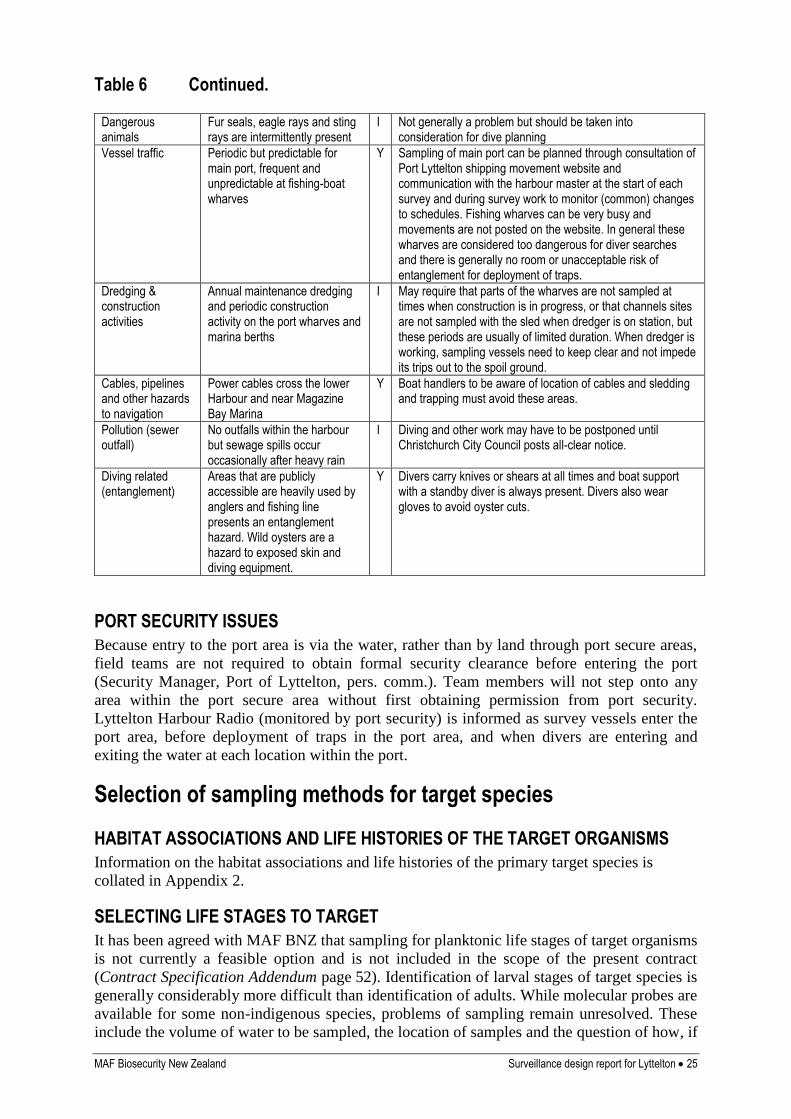
Table 6 Continued.
Dangerous animals
Fur seals, eagle rays and sting rays are intermittently present
I Not generally a problem but should be taken into consideration for dive planning
Vessel traffic Periodic but predictable for main port, frequent and unpredictable at fishing-boat wharves
Y Sampling of main port can be planned through consultation of Port Lyttelton shipping movement website and communication with the harbour master at the start of each survey and during survey work to monitor (common) changes to schedules. Fishing wharves can be very busy and movements are not posted on the website. In general these wharves are considered too dangerous for diver searches and there is generally no room or unacceptable risk of entanglement for deployment of traps.
Dredging & construction activities
Annual maintenance dredging and periodic construction activity on the port wharves and marina berths
I May require that parts of the wharves are not sampled at times when construction is in progress, or that channels sites are not sampled with the sled when dredger is on station, but these periods are usually of limited duration. When dredger is working, sampling vessels need to keep clear and not impede its trips out to the spoil ground.
Cables, pipelines and other hazards to navigation
Power cables cross the lower Harbour and near Magazine Bay Marina
Y Boat handlers to be aware of location of cables and sledding and trapping must avoid these areas.
Pollution (sewer outfall)
No outfalls within the harbour but sewage spills occur occasionally after heavy rain
I Diving and other work may have to be postponed until Christchurch City Council posts all-clear notice.
Diving related (entanglement)
Areas that are publicly accessible are heavily used by anglers and fishing line presents an entanglement hazard. Wild oysters are a hazard to exposed skin and diving equipment.
Y Divers carry knives or shears at all times and boat support with a standby diver is always present. Divers also wear gloves to avoid oyster cuts.
PORT SECURITY ISSUES
Because entry to the port area is via the water, rather than by land through port secure areas,
field teams are not required to obtain formal security clearance before entering the port
(Security Manager, Port of Lyttelton, pers. comm.). Team members will not step onto any
area within the port secure area without first obtaining permission from port security.
Lyttelton Harbour Radio (monitored by port security) is informed as survey vessels enter the
port area, before deployment of traps in the port area, and when divers are entering and
exiting the water at each location within the port.
Selection of sampling methods for target species
HABITAT ASSOCIATIONS AND LIFE HISTORIES OF THE TARGET ORGANISMS
Information on the habitat associations and life histories of the primary target species is
collated in Appendix 2.
SELECTING LIFE STAGES TO TARGET
It has been agreed with MAF BNZ that sampling for planktonic life stages of target organisms
is not currently a feasible option and is not included in the scope of the present contract
(Contract Specification Addendum page 52). Identification of larval stages of target species is
generally considerably more difficult than identification of adults. While molecular probes are
available for some non-indigenous species, problems of sampling remain unresolved. These
include the volume of water to be sampled, the location of samples and the question of how, if
26 Surveillance design report for Lyttelton MAF Biosecurity New Zealand
the probe gives a positive result, the location (and size) of the source population can be
identified. At present, therefore, although these methods may potentially provide
presence/absence information on target species, they are of little practical use for managing
any incursions detected. A critical part of operationalising molecular probes for field based
sampling is testing their specificity for the target organism. That is, although a gene sequence
may have been identified for a pest species, we cannot use it reliably in field surveys until its
sensitivity to other, related native species has been tested.
SAMPLING METHODS
In comparison to surveys for agricultural pests, survey methods for invasive marine
organisms are still relatively undeveloped. Most studies of marine pests have used
conventional ecological survey techniques, such as baited traps (Veldhuizen and Stanish
1999, Yamada et al. 2001, Thresher et al. 2003), diver surveys (Currie et al. 2000), benthic
grab (Carlton et al. 1990), or sled samples (Parry and Cohen 2001). These methods are
relatively non-specific and can be labour-intensive, limiting the number of locations that can
be searched effectively. A documented process for the selection of sampling methods and
allocation of sampling effort for the target species was developed at the start of the previous
phase of the programme (Inglis et al. 2006b) and included information on the biology and
behaviour of the target organisms and sampling methods used for the same or similar species
in other parts of their range. Sensitivity (referred to in previous reports as the “efficiency” of
the survey method), cost-effectiveness, feasibility and consistency with safe field-working
practice were also evaluated in selecting methods, although in most cases the actual
sensitivity of the method has not been quantified.
To decide on appropriate sampling methods for each of the target species, we reviewed
published information on methods that had been used previously to sample each species and
asked experts working on the species in its native or introduced range to comment on the
utility of the methods we had proposed for surveillance monitoring (see Appendix 3). The
criteria used to select survey methods were:
effectiveness at capturing the target species when it is present,
cost and ease of sampling,
minimal impact on native marine environments and species, and
safety of field personnel, the general public and property.
Since the purpose of the surveillance programme is detection, not enumeration, techniques in
which the presence or absence of the target species could be determined rapidly within a
sample were selected, allowing a comparatively large number of locations to be sampled on
each survey. Baited box traps were used to sample adult crabs (i.e. Carcinus maenas and
Eriocheir sinensis) and Whayman-Holdsworth starfish traps were used to catch asteroids and
other large benthic scavengers. Baited traps do not sample juvenile and subadult E. sinensis
effectively because these life stages have a largely herbivorous diet. They were therefore
sampled with artificial shelters (“crab condos”) designed for surveys of E. sinensis in San
Francisco Bay. An Ocklemann epibenthic sled was used to sample soft sediment habitats for
Potamocorbula amurensis, Sabella spallanzanii, Asterias amurensis and Caulerpa taxifolia.
Divers searched for S. spallanzanii, C. maenas, A. amurensis and Styela clava around piles,
floating pontoons and other artificial structures in port and marina environments, and on
intertidal and shallow subtidal reefs that were identified as high risk by the dispersal
modelling. Timed visual searches for target species were made of intertidal rocky and sandy
shorelines.
We considered that the methods selected for the previous phase of this programme (see
Table 7) were successful and appropriate, and proposed that they be used in the present study,
MAF Biosecurity New Zealand Surveillance design report for Lyttelton 27
subject to discussion and approval from MAF BNZ. This was accepted by MAF BNZ, as
stated in the Contract Specification Addendum (page 51). Note that it has been agreed with
MAF BNZ that sampling for planktonic life stages of target organisms is not currently a
feasible option and is not included in the scope of the present contract (Contract Specification
Addendum page 52).
The minimum size of organism retained by the various trapping and sledding methods in
governed by the size of mesh used. In the case of the crab (box) traps the netting covering the
trap has a 1.3-cm mesh, that on the starfish traps is 2.6 cm and the bag inside the epibenthic
sled has a 2-mm mesh.
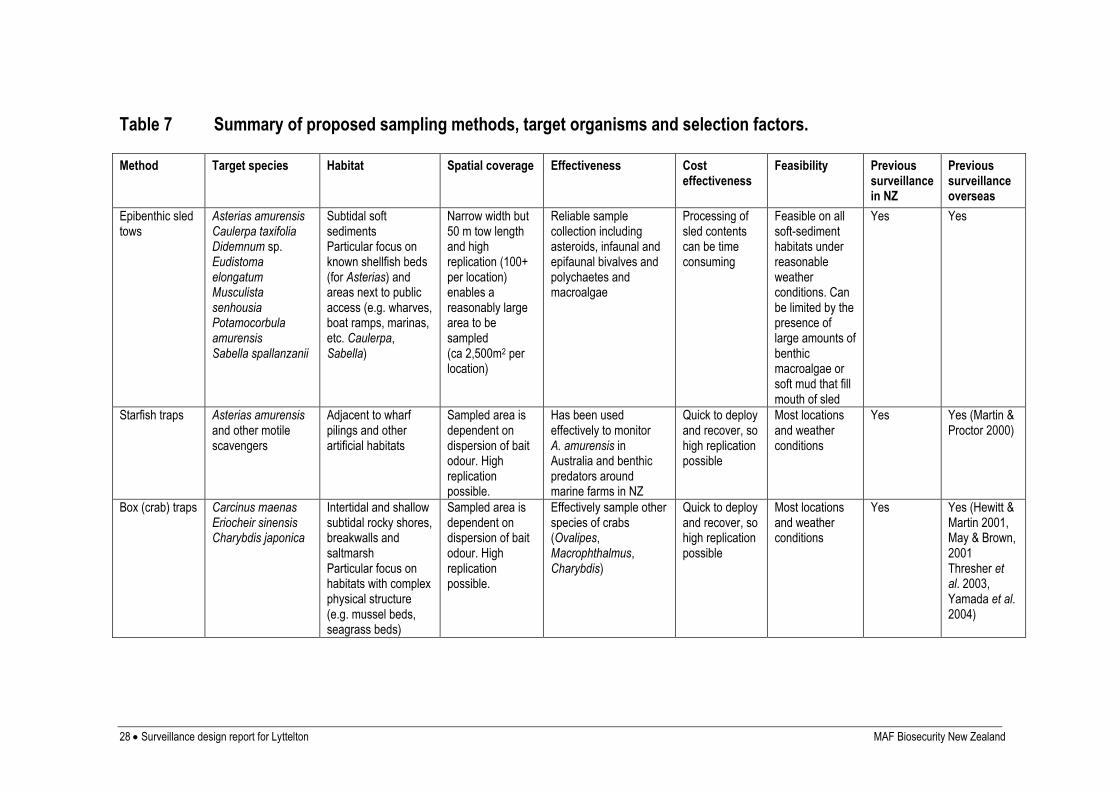
28 Surveillance design report for Lyttelton MAF Biosecurity New Zealand
Table 7 Summary of proposed sampling methods, target organisms and selection factors.
Method Target species Habitat Spatial coverage Effectiveness Cost effectiveness
Feasibility Previous surveillance in NZ
Previous surveillance overseas
Epibenthic sled tows
Asterias amurensis Caulerpa taxifolia Didemnum sp. Eudistoma elongatum Musculista senhousia Potamocorbula amurensis Sabella spallanzanii
Subtidal soft sediments Particular focus on known shellfish beds (for Asterias) and areas next to public access (e.g. wharves, boat ramps, marinas, etc. Caulerpa, Sabella)
Narrow width but 50 m tow length and high replication (100+ per location) enables a reasonably large area to be sampled (ca 2,500m2 per location)
Reliable sample collection including asteroids, infaunal and epifaunal bivalves and polychaetes and macroalgae
Processing of sled contents can be time consuming
Feasible on all soft-sediment habitats under reasonable weather conditions. Can be limited by the presence of large amounts of benthic macroalgae or soft mud that fill mouth of sled
Yes Yes
Starfish traps Asterias amurensis and other motile scavengers
Adjacent to wharf pilings and other artificial habitats
Sampled area is dependent on dispersion of bait odour. High replication possible.
Has been used effectively to monitor A. amurensis in Australia and benthic predators around marine farms in NZ
Quick to deploy and recover, so high replication possible
Most locations and weather conditions
Yes Yes (Martin & Proctor 2000)
Box (crab) traps Carcinus maenas Eriocheir sinensis Charybdis japonica
Intertidal and shallow subtidal rocky shores, breakwalls and saltmarsh Particular focus on habitats with complex physical structure (e.g. mussel beds, seagrass beds)
Sampled area is dependent on dispersion of bait odour. High replication possible.
Effectively sample other species of crabs (Ovalipes, Macrophthalmus, Charybdis)
Quick to deploy and recover, so high replication possible
Most locations and weather conditions
Yes Yes (Hewitt & Martin 2001, May & Brown, 2001 Thresher et al. 2003, Yamada et al. 2004)
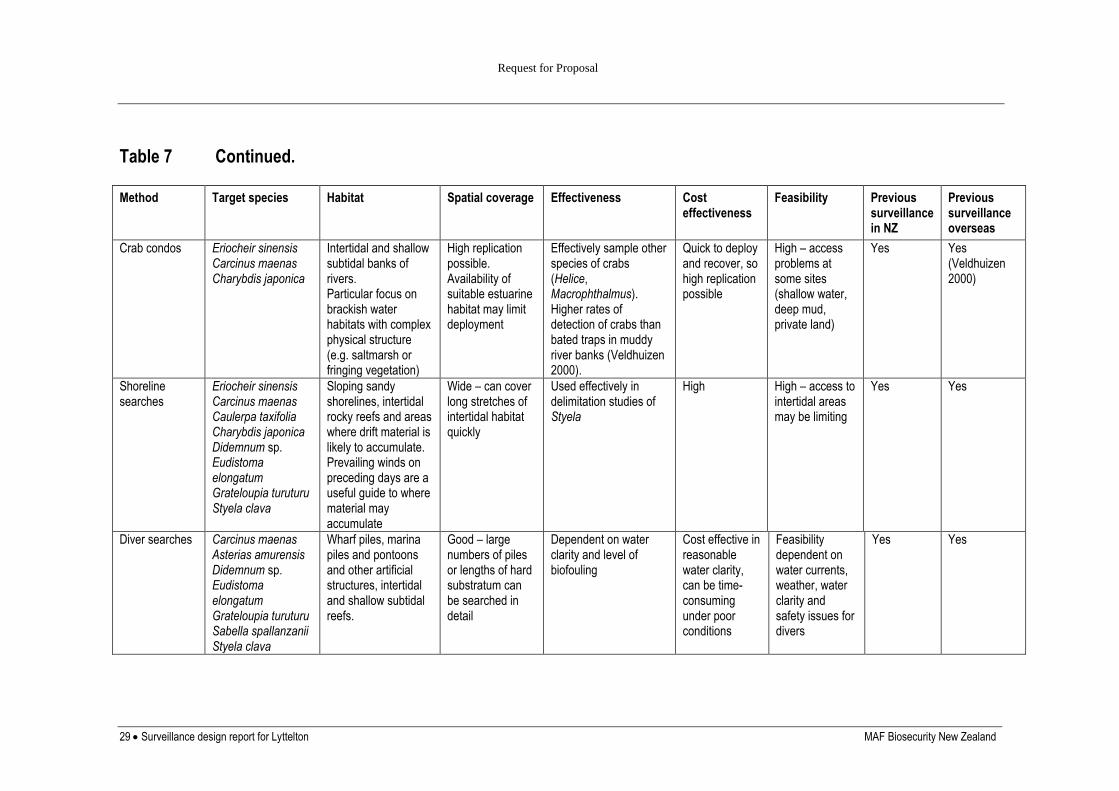
Request for Proposal
29 Surveillance design report for Lyttelton MAF Biosecurity New Zealand
Table 7 Continued.
Method Target species Habitat Spatial coverage Effectiveness Cost effectiveness
Feasibility Previous surveillance in NZ
Previous surveillance overseas
Crab condos Eriocheir sinensis Carcinus maenas Charybdis japonica
Intertidal and shallow subtidal banks of rivers. Particular focus on brackish water habitats with complex physical structure (e.g. saltmarsh or fringing vegetation)
High replication possible. Availability of suitable estuarine habitat may limit deployment
Effectively sample other species of crabs (Helice, Macrophthalmus). Higher rates of detection of crabs than bated traps in muddy river banks (Veldhuizen 2000).
Quick to deploy and recover, so high replication possible
High – access problems at some sites (shallow water, deep mud, private land)
Yes Yes (Veldhuizen 2000)
Shoreline searches
Eriocheir sinensis Carcinus maenas Caulerpa taxifolia Charybdis japonica Didemnum sp. Eudistoma elongatum Grateloupia turuturu Styela clava
Sloping sandy shorelines, intertidal rocky reefs and areas where drift material is likely to accumulate. Prevailing winds on preceding days are a useful guide to where material may accumulate
Wide – can cover long stretches of intertidal habitat quickly
Used effectively in delimitation studies of Styela
High High – access to intertidal areas may be limiting
Yes Yes
Diver searches Carcinus maenas Asterias amurensis Didemnum sp. Eudistoma elongatum Grateloupia turuturu Sabella spallanzanii Styela clava
Wharf piles, marina piles and pontoons and other artificial structures, intertidal and shallow subtidal reefs.
Good – large numbers of piles or lengths of hard substratum can be searched in detail
Dependent on water clarity and level of biofouling
Cost effective in reasonable water clarity, can be time-consuming under poor conditions
Feasibility dependent on water currents, weather, water clarity and safety issues for divers
Yes Yes
30 Surveillance design report for Lyttelton MAF Biosecurity New Zealand
SURVEILLANCE FOR NON-TARGET SPECIES
The secondary objectives of the programme are:
To detect incursions of non-target non-indigenous or cryptogenic species not
previously recorded in New Zealand
To detect incursions of established non-indigenous or cryptogenic species that are
exhibiting invasive characteristics (i.e. range extensions of established organisms).
This objective will be addressed opportunistically. This is inevitable given the taxonomic
range of potential new non-indigenous or cryptogenic species and of established non-
indigenous or cryptogenic species that might exhibit invasive characteristics. The diversity of
specialist taxonomic skills required to identify this range of taxa is unlikely to be present in
any one field team, and collection of all potential material for laboratory identification is
beyond the scope of this project. In the previous phase of the targeted surveillance programme
we identified a suite of non-target, non-indigenous species known to occur in New Zealand
(two of which, Musculista senhousia and Didemnum sp. are now included in the list of
secondary target species) that were consistently recorded when encountered during surveys
(see Inglis et al. 2006b and Morrisey et al. 2007). In the present phase, we will retain this
suite of species, to be recorded along with the target species whenever encountered. These
records will be assessed against the criteria of Chapman & Carlton (1991):
Sudden appearance in the surveillance location6
Has the species spread subsequently
Association with, or dependency on, non natural dispersal mechanisms
Strong association with artificial substrate7
Tendency towards monoculture or high local abundance
Restricted distribution (e.g. only near a likely point of pest introduction by human
activities)
Rapid increase in abundance
Disjunctive global distribution
Are natural dispersal mechanisms inadequate to reach New Zealand
Genetic or morphological isolation from most similar species distribution elsewhere in
the world.
Note that any one of these triggers may immediately indicate an unknown invasive species,
however others, such as abundance or distribution, may only become apparent after further
surveillance.
TIMING OF SAMPLING ACTIVITY
In the absence of suitable methods of sampling planktonic life stages (see above), sampling is
done biannually, in summer (November to March) and winter (May to September) at each
location to account for possible changes in abundance of adults of the target species. Adults of
all of the primary target species are perennial and likely to be present throughout the year.
Timing of sampling is constrained by the need to sample all eight locations (ten during the
first round of sampling, when Picton and Opua are also sampled) within each summer and
winter period (each survey takes at least a week, with a week in between surveys to allow
equipment to be sent on to the next location).
6 assumes prior knowledge of taxa in surveillance location. 7 assumes comparable sampling of artificial and natural substrata has occurred.
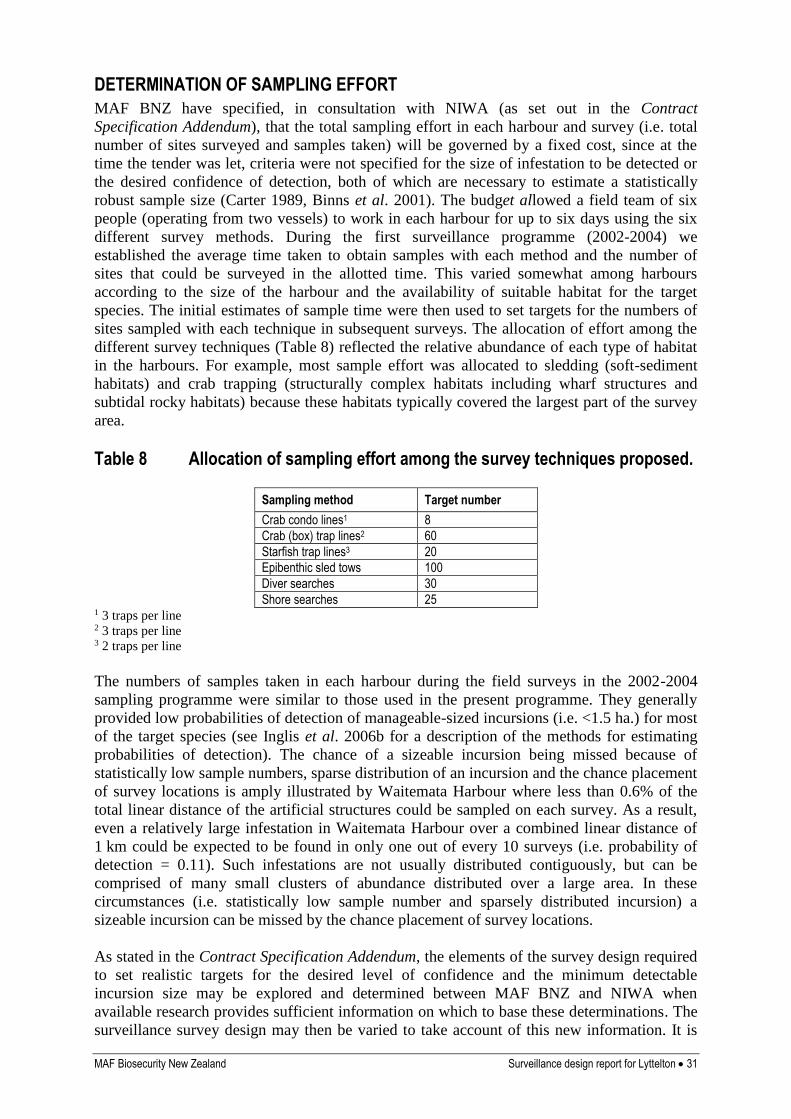
MAF Biosecurity New Zealand Surveillance design report for Lyttelton 31
DETERMINATION OF SAMPLING EFFORT
MAF BNZ have specified, in consultation with NIWA (as set out in the Contract
Specification Addendum), that the total sampling effort in each harbour and survey (i.e. total
number of sites surveyed and samples taken) will be governed by a fixed cost, since at the
time the tender was let, criteria were not specified for the size of infestation to be detected or
the desired confidence of detection, both of which are necessary to estimate a statistically
robust sample size (Carter 1989, Binns et al. 2001). The budget allowed a field team of six
people (operating from two vessels) to work in each harbour for up to six days using the six
different survey methods. During the first surveillance programme (2002-2004) we
established the average time taken to obtain samples with each method and the number of
sites that could be surveyed in the allotted time. This varied somewhat among harbours
according to the size of the harbour and the availability of suitable habitat for the target
species. The initial estimates of sample time were then used to set targets for the numbers of
sites sampled with each technique in subsequent surveys. The allocation of effort among the
different survey techniques (Table 8) reflected the relative abundance of each type of habitat
in the harbours. For example, most sample effort was allocated to sledding (soft-sediment
habitats) and crab trapping (structurally complex habitats including wharf structures and
subtidal rocky habitats) because these habitats typically covered the largest part of the survey
area.
Table 8 Allocation of sampling effort among the survey techniques proposed.
Sampling method Target number
Crab condo lines1 8
Crab (box) trap lines2 60
Starfish trap lines3 20
Epibenthic sled tows 100
Diver searches 30
Shore searches 25 1 3 traps per line 2 3 traps per line 3 2 traps per line
The numbers of samples taken in each harbour during the field surveys in the 2002-2004
sampling programme were similar to those used in the present programme. They generally
provided low probabilities of detection of manageable-sized incursions (i.e. <1.5 ha.) for most
of the target species (see Inglis et al. 2006b for a description of the methods for estimating
probabilities of detection). The chance of a sizeable incursion being missed because of
statistically low sample numbers, sparse distribution of an incursion and the chance placement
of survey locations is amply illustrated by Waitemata Harbour where less than 0.6% of the
total linear distance of the artificial structures could be sampled on each survey. As a result,
even a relatively large infestation in Waitemata Harbour over a combined linear distance of
1 km could be expected to be found in only one out of every 10 surveys (i.e. probability of
detection = 0.11). Such infestations are not usually distributed contiguously, but can be
comprised of many small clusters of abundance distributed over a large area. In these
circumstances (i.e. statistically low sample number and sparsely distributed incursion) a
sizeable incursion can be missed by the chance placement of survey locations.
As stated in the Contract Specification Addendum, the elements of the survey design required
to set realistic targets for the desired level of confidence and the minimum detectable
incursion size may be explored and determined between MAF BNZ and NIWA when
available research provides sufficient information on which to base these determinations. The
surveillance survey design may then be varied to take account of this new information. It is
32 Surveillance design report for Lyttelton MAF Biosecurity New Zealand
expected that opportunities for continued improvement will be explored and implemented
where appropriate and agreed to during the course of this contract. Determining an
appropriate level of sampling requires explicit consideration of the following:
(1) the minimum size of incursion that is required to be detected by the survey (the
“design prevalence”);
(2) how confident the manager wishes to be that an incursion of that size or greater will
be detected (the. “confidence of detection”), since absolute confidence is not possible
(Cannon 2002; Cameron 2002; Venette et al. 2002; Inglis et al. 2006b; Hayes et al.
2005);
(3) intuitively, it seems obvious that smaller incursions might be contained more easily
than larger ones, but there is little guidance in the literature about how big (or small)
such a target should be;
(4) resources available.
SPATIAL ALLOCATION OF SAMPLING EFFORT
Allocation of sampling effort in the present programme follows the strategy used in previous
programmes (Inglis et al. 2006b, Morrisey et al. 2007). Survey plans were developed for each
sampling method and harbour based on the known distribution of habitat for the target species
and outputs from the hydrodynamic modelling. We originally anticipated combining the
predictive habitat models with the outputs from the plume dispersal simulations in each
harbour to identify risk zones in each harbour (the habitat and hydrodynamic modelling are
described by Inglis et al. 2006b). The area of each habitat in each risk zone (the “search area”)
could then be determined and detection limits estimated quantitatively for each zone.
However, the major constraint to achieving this was the limited availability of spatially
explicit data on the key environmental variables needed to project the predicted habitat
distributions in each harbour. Instead, we allocated sampling effort based predominantly on
the results of the hydrodynamic modelling and our existing knowledge of the distribution of
habitats in each harbour, with highest priority given to suitable habitat for the target species
within the predicted dispersion plume. Each harbour was subdivided into large strata (3-4 per
harbour) that reflected broad environmental gradients (e.g. head/entrance of the harbour) and
the concentrations of particles simulated in the hydrodynamic modelling (Appendix 4).
Generally, ~60% of locations surveyed were allocated to the stratum where moderate to high
weighted mean concentrations of simulated particles were predicted, with the remainder
distributed among the remaining strata.
Because marine organisms are typically aggregated in their spatial distribution, they tend to
be absent from, or in comparatively low abundance at most locations and in large densities in
relatively few places (Gray 2002). This pattern is even more extreme for the small founder
populations of introduced species, which, at least initially, are likely to be absent from most
areas and to occur in aggregations at relatively few locations (Gaston 1994). For example,
during the initial stages of its invasion of Port Phillip Bay, Australia, the seastar Asterias
amurensis was found at only two out of more 70 locations surveyed in the bay (Garnham
1998). This pattern of distribution – locally abundant, but geographically restricted founder
populations – suggests that, in most instances, the probability of detection within locations
where the species is present is likely to be greater than its expected rarity among locations.
Since eradication and control efforts are likely to be most successful when infestations are
relatively localised, surveys that optimise the number of locations surveyed will stand the best
chance of detecting founding populations with aggregated distributions (Green & Young
1993). Thus, given limited resources, surveying a relatively large number of discrete locations
using rapid sampling techniques is likely to be more effective than intensive searches of a few
key locations (although there will be a point at which the survey sensitivity is compromised
MAF Biosecurity New Zealand Surveillance design report for Lyttelton 33
by under-sampling at each location). This basic assumption - the need to sample a large
number of survey locations in each harbour - formed the foundation for our choice of survey
methods.
Within each harbour, a grid was overlain on the areas to be sampled in GIS (10-m grid-cell
size for highest risk areas, such as wharves and marinas, and 50-m grid-cell size in other
areas: Fig. 3). The individual locations surveyed within each habitat type and stratum were
then dispersed uniformly across the grids. Sampling locations were offset by one grid cell for
each subsequent survey, so that no location will be sampled more than once over the course of
the surveillance programme. These predetermined locations were exported from GIS as map
coordinates and loaded into GPS units to allow the field teams to locate positions in the field.
Where a preassigned location could not be sampled because of constraints such as the depth
of water, presence of a vessel on a berth, or source of danger to the field team (such as areas
of high vessel movement), a new location was chosen (referring to maps of past sampling
locations to ensure that locations were not inadvertently resampled) and its location recorded
and later mapped in GIS.
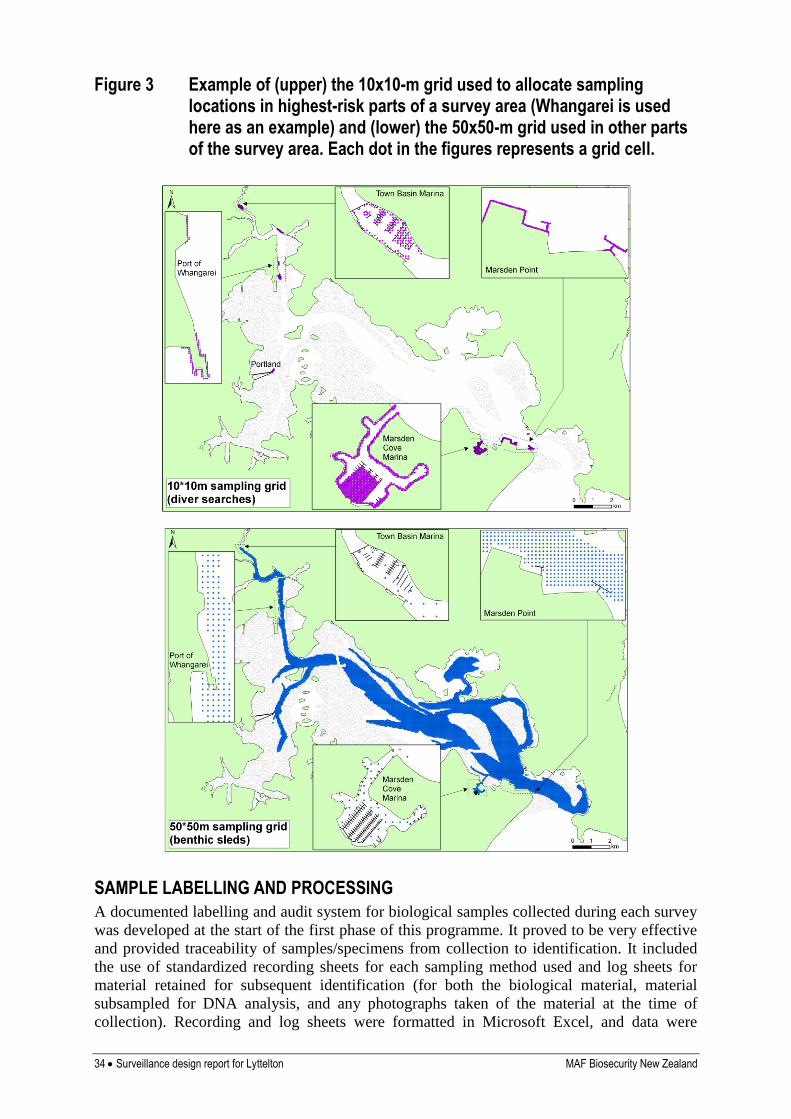
34 Surveillance design report for Lyttelton MAF Biosecurity New Zealand
Figure 3 Example of (upper) the 10x10-m grid used to allocate sampling locations in highest-risk parts of a survey area (Whangarei is used here as an example) and (lower) the 50x50-m grid used in other parts of the survey area. Each dot in the figures represents a grid cell.
SAMPLE LABELLING AND PROCESSING
A documented labelling and audit system for biological samples collected during each survey
was developed at the start of the first phase of this programme. It proved to be very effective
and provided traceability of samples/specimens from collection to identification. It included
the use of standardized recording sheets for each sampling method used and log sheets for
material retained for subsequent identification (for both the biological material, material
subsampled for DNA analysis, and any photographs taken of the material at the time of
collection). Recording and log sheets were formatted in Microsoft Excel, and data were
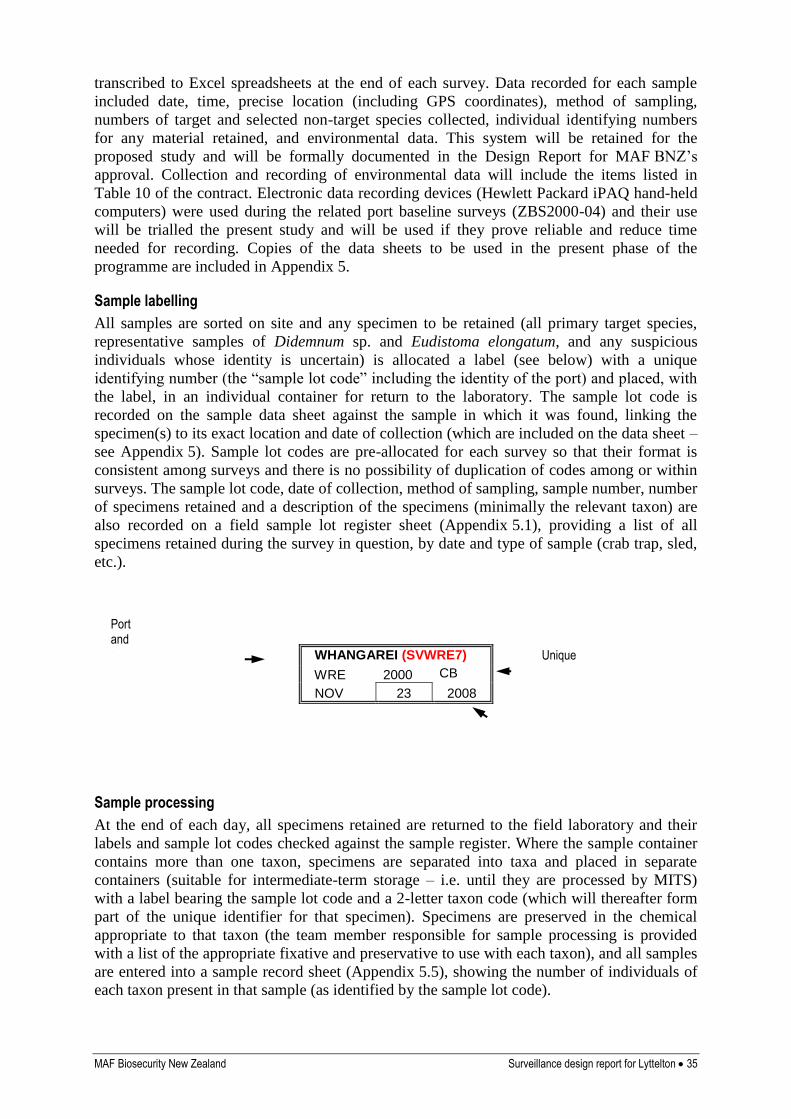
MAF Biosecurity New Zealand Surveillance design report for Lyttelton 35
transcribed to Excel spreadsheets at the end of each survey. Data recorded for each sample
included date, time, precise location (including GPS coordinates), method of sampling,
numbers of target and selected non-target species collected, individual identifying numbers
for any material retained, and environmental data. This system will be retained for the
proposed study and will be formally documented in the Design Report for MAF BNZ’s
approval. Collection and recording of environmental data will include the items listed in
Table 10 of the contract. Electronic data recording devices (Hewlett Packard iPAQ hand-held
computers) were used during the related port baseline surveys (ZBS2000-04) and their use
will be trialled the present study and will be used if they prove reliable and reduce time
needed for recording. Copies of the data sheets to be used in the present phase of the
programme are included in Appendix 5.
Sample labelling
All samples are sorted on site and any specimen to be retained (all primary target species,
representative samples of Didemnum sp. and Eudistoma elongatum, and any suspicious
individuals whose identity is uncertain) is allocated a label (see below) with a unique
identifying number (the “sample lot code” including the identity of the port) and placed, with
the label, in an individual container for return to the laboratory. The sample lot code is
recorded on the sample data sheet against the sample in which it was found, linking the
specimen(s) to its exact location and date of collection (which are included on the data sheet –
see Appendix 5). Sample lot codes are pre-allocated for each survey so that their format is
consistent among surveys and there is no possibility of duplication of codes among or within
surveys. The sample lot code, date of collection, method of sampling, sample number, number
of specimens retained and a description of the specimens (minimally the relevant taxon) are
also recorded on a field sample lot register sheet (Appendix 5.1), providing a list of all
specimens retained during the survey in question, by date and type of sample (crab trap, sled,
etc.).
WHANGAREI (SVWRE7)
WRE 2000 CB
NOV 23 2008
Sample processing
At the end of each day, all specimens retained are returned to the field laboratory and their
labels and sample lot codes checked against the sample register. Where the sample container
contains more than one taxon, specimens are separated into taxa and placed in separate
containers (suitable for intermediate-term storage – i.e. until they are processed by MITS)
with a label bearing the sample lot code and a 2-letter taxon code (which will thereafter form
part of the unique identifier for that specimen). Specimens are preserved in the chemical
appropriate to that taxon (the team member responsible for sample processing is provided
with a list of the appropriate fixative and preservative to use with each taxon), and all samples
are entered into a sample record sheet (Appendix 5.5), showing the number of individuals of
each taxon present in that sample (as identified by the sample lot code).
Port and survey code (showing ‘sv’ for surveillance, abbreviated port name, and survey round – ‘7’ indicating Winter 08
Unique sample number (WRE2000) and taxon code (‘CB’ indicates crab)
Date of collection
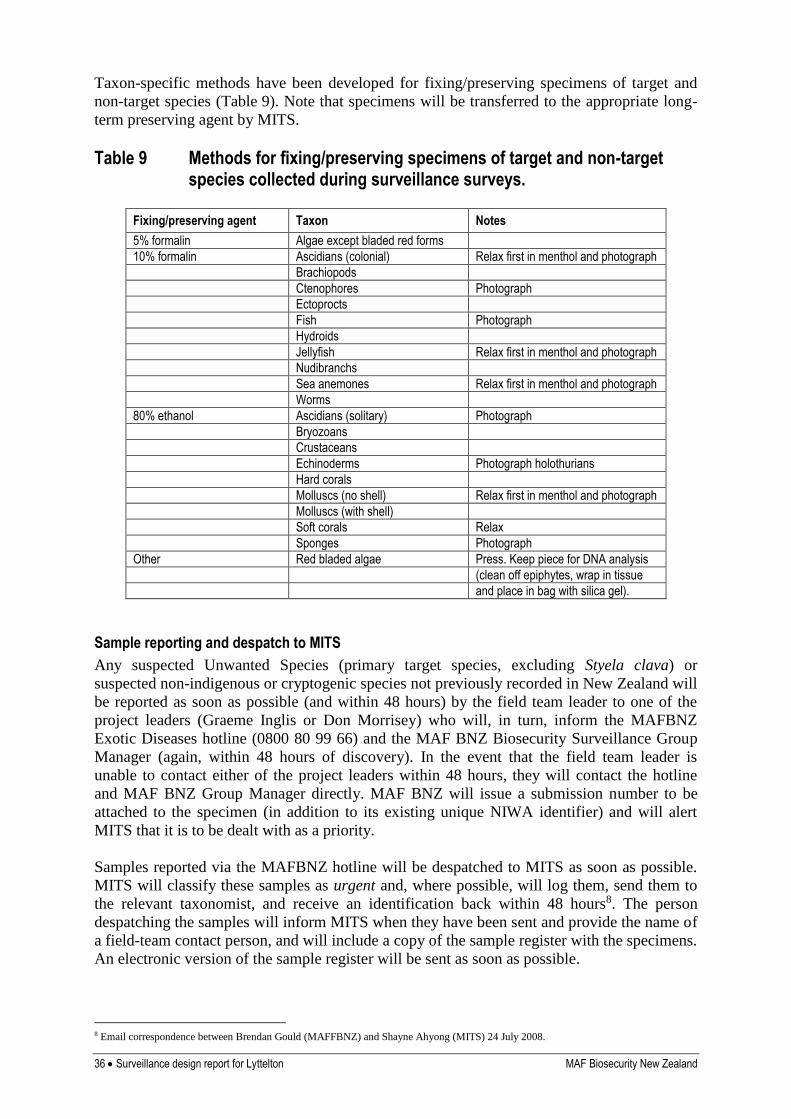
36 Surveillance design report for Lyttelton MAF Biosecurity New Zealand
Taxon-specific methods have been developed for fixing/preserving specimens of target and
non-target species (Table 9). Note that specimens will be transferred to the appropriate long-
term preserving agent by MITS.
Table 9 Methods for fixing/preserving specimens of target and non-target species collected during surveillance surveys.
Fixing/preserving agent Taxon Notes
5% formalin Algae except bladed red forms
10% formalin Ascidians (colonial) Relax first in menthol and photograph
Brachiopods
Ctenophores Photograph
Ectoprocts
Fish Photograph
Hydroids
Jellyfish Relax first in menthol and photograph
Nudibranchs
Sea anemones Relax first in menthol and photograph
Worms
80% ethanol Ascidians (solitary) Photograph
Bryozoans
Crustaceans
Echinoderms Photograph holothurians
Hard corals
Molluscs (no shell) Relax first in menthol and photograph
Molluscs (with shell)
Soft corals Relax
Sponges Photograph
Other Red bladed algae Press. Keep piece for DNA analysis
(clean off epiphytes, wrap in tissue
and place in bag with silica gel).
Sample reporting and despatch to MITS
Any suspected Unwanted Species (primary target species, excluding Styela clava) or
suspected non-indigenous or cryptogenic species not previously recorded in New Zealand will
be reported as soon as possible (and within 48 hours) by the field team leader to one of the
project leaders (Graeme Inglis or Don Morrisey) who will, in turn, inform the MAFBNZ
Exotic Diseases hotline (0800 80 99 66) and the MAF BNZ Biosecurity Surveillance Group
Manager (again, within 48 hours of discovery). In the event that the field team leader is
unable to contact either of the project leaders within 48 hours, they will contact the hotline
and MAF BNZ Group Manager directly. MAF BNZ will issue a submission number to be
attached to the specimen (in addition to its existing unique NIWA identifier) and will alert
MITS that it is to be dealt with as a priority.
Samples reported via the MAFBNZ hotline will be despatched to MITS as soon as possible.
MITS will classify these samples as urgent and, where possible, will log them, send them to
the relevant taxonomist, and receive an identification back within 48 hours8. The person
despatching the samples will inform MITS when they have been sent and provide the name of
a field-team contact person, and will include a copy of the sample register with the specimens.
An electronic version of the sample register will be sent as soon as possible.
8 Email correspondence between Brendan Gould (MAFFBNZ) and Shayne Ahyong (MITS) 24 July 2008.
MAF Biosecurity New Zealand Surveillance design report for Lyttelton 37
All other specimens are then submitted to MITS as soon as possible, and within a week of
completion of fieldwork (this allows for travel back to base from remote ports, completion of
sample logging, packaging and despatch). If despatch is likely to be delayed beyond a week,
MITS and the project leader(s) are to be informed of the delay and advised of the likely date
of despatch. This allows for samples to be held until all sampling is completed when this is
not possible within the main block of field work, so that all samples from the survey can be
despatched together. The person despatching the samples will inform MITS when they have
been sent and provide the name of a field-team contact person, and will include a copy of the
sample register with the specimens. An electronic version of the sample register will be sent
as soon as possible. MITS will treat these samples as priority and aim for a 1-week
turnaround (from receipt of sample to receipt of identification).
All shipments will need to be accompanied by dangerous-goods documentation appropriate to
the preserving chemicals used.
Contact and delivery details for MITS
Delivery details:
Serena Cox
NIWA Marine Invasives Taxonomic Service
NIWA
301 Evans Bay Parade
Greta Point
Wellington
NEW ZEALAND
Contact details:
Phone: 04-386-0300 (ext 7364)
Special Requirements:
Please provide MITS with as much advance notice of the dates of fieldwork as possible, to
allow preparation.
Data entry and archiving
Data recorded on the field sheets are entered into an Excel spreadsheet (designed in the same
format as the datasheets) and checked (not by the same person who entered them).
Coordinates of all sampling locations are then mapped in GIS (ArcView) and all data are
imported to a Microsoft Access database for final storage. All files are stored on the project
server at NIWA’s Greta Point, Wellington campus and are backed up daily. GIS data are
currently georeferenced to WGS84 but will be converted to NZGD2000 before being
provided to MAFBNZ, along with the Access database.
Acknowledgements Thanks to John Carter for preparation of maps, Rachel Haskew and John Oldman for
hydrodynamic modelling, John Carter and Helen Roulston for development of sample-
allocation grids, Shane Ahyong, Serena Cox, Isla Fitridge and Andrew Hosie for development
of the sample-processing protocols, and Isla Fitridge for help with preparation of data sheets.
Isla Fitridge, Oli Floerl and Nick Gust are acknowledged for their contributions to the species
summaries (Appendix 2). Thanks to Chris Woods for reviewing an earlier version of this
report.
38 Surveillance design report for Lyttelton MAF Biosecurity New Zealand
References Binns, M.R.; Nyrop, J.P.; Van Der Werf, W. 2000. Sampling and monitoring in crop
protection. CABI Publishing, New York. 281 pp.
Cameron, A. 2002. Survey Toolbox for Aquatic Animal Diseases: A Practical Manual and
Software Package. Australian Centre for International Agricultural Research.,
Canberra. 376 pp.
Cannon, R.M. 2002. Demonstrating disease freedom – combining confidence levels.
Preventative Veterinary Medicine 52: 227-249.
Carlton, J.T., Thompson, J.K., Schemel, L.E., Nichols, F.H. 1990. Remarkable invasion of
San Francisco Bay (California, USA) by the Asian clam Potamocorbula amurensis.
1. Introduction and dispersal. Marine Ecology Progress Series 66: 81-94.
Carter, P.C.S. 1989. Risk assessment and pest detection surveys for exotic pests and diseases
which threaten commercial forestry in New Zealand. New Zealand Journal of
Forestry Science 19: 353-374.
Chapman, J.W., Carlton, J.T. 1991. A test of criteria for introduced species: the global
invasion by the isopod Synidotea laevidorsalis (Miers, 1881). Journal of Crustacean
Biology 11: 386-400.
Cranfield, H.; Gordon, D.; Willan, R.; Marshall, B.; Battershill, C.; Francis, M.; Glasby, G.;
Read, G. 1998. Adventive marine species in New Zealand. NIWA Wellington
Technical Report No. 34.
Currie, D.R., McArthur, M.A., Cohen, B.F. 2000. Reproduction and distribution of the
invasive European fanworm Sabella spallanzanii (Polychaeta: Sabellidae) in Port
Phillip Bay, Victoria, Australia. Marine Biology 136: 645-656.
Fenwick, G. 2003. Port of Lyttelton ecological monitoring: May 2003. Prepared for
Environment Canterbury. Christchurch, National Institute of Water & Atmospheric
Research Ltd.
Garner, D.M.; Ridgeway, N.M.1955. A note on tidal circulation in Lyttelton Harbour. N.Z.
Journal of Science and Technology B37 1: 47-53.
Garnham, J. 1998. Distribution and impact of Asterias amurensis in Victoria. Pages 18-21 in
Goggin, L. C. (ed.s). Proceedings of a meeting on the biology and management of
the introduced seastar Asterias amurensis in Australian waters. Technical Report No.
15. Centre for Research on Introduced Marine Pests, CSIRO Division of Marine
Research., Hobart, Australia.
Gaston, K. J. 1994. Rarity. Chapman & Hall, London, UK. 205 pp.
Gordon, D.; Mawatari, S. 1992. Atlas of marine fouling bryozoa of New Zealand Ports and
Harbours. Miscellaneous Publications of the New Zealand Oceanographic Institute
Vol 107. New Zealand Oceanographic Institute.
Gray, J.S. 2002. Species richness of marine soft sediments. Marine Ecology Progress Series
244: 285-297.
Green, R.H.; Young, R.C. 1993. Sampling to detect rare species. Ecological Applications 3:
351–356.
Gust, N., Inglis, G., Peacock, L., Miller, S., Floerl, O., Hayden, B., Fitridge, I., Hurren, H.,
Johnston, O. 2006. Rapid nationwide delimitation surveys for Styela clava. NIWA
Christchurch Client Report No. CHC2006-024, prepared for MAF Biosecurity New
Zealand, February 2006, 81p.
Gust, N., Inglis, G., Floerl, O., Peacock, L., Denny, C., Forrest, B. 2007. Assessment of
population management trial options for Styela clava at three locations. NIWA
Christchurch Client Report No. CHC2007-094, prepared for MAF Biosecurity New
Zealand, July 2007, 186 p.
Handley, S.; Fenwick, G.; Alcock, N. 2000. Port of Lyttelton Biological Survey, February
2000. Prepared for Environment Canterbury. National Institute of Water and
Atmospheric Research Ltd, Nelson.
MAF Biosecurity New Zealand Surveillance design report for Lyttelton 39
Hayes, K. R., Cannon, R., Neil, K., Inglis, G. 2005. Sensitivity and cost considerations for the
detection and eradication of marine pests in large commercial ports. Marine Pollution
Bulletin 50: 823-834.
Heath, R.A. 1976. Broad classification of New Zealand inlets with emphasis on residence
times. New Zealand Journal of Marine and Freshwater Research 10: 429-444.
Hewitt, C., Martin, R. 2001. Revised protocols for baseline surveys for introduced marine
species – survey design, sampling protocols and specimen handling. CRIMP
Technical Report No. 22, Centre for Research on Introduced Marine Pests, Hobart.
Hume, T.M., Snelder, T., Weatherhead, M., Liefting, R. 2007. A controlling factor approach
to estuary classification. Ocean & Coastal Management 50: 905-929.
Inglis,G. 2001. Criteria for selecting New Zealand ports and other points of entry that have a
high risk of invasion by new exotic marine organisms. Final research report for
Ministry of Fisheries research project ZBS2000/01A, objectives 1 & 2. NIWA,
Wellington. 27 pp.
Inglis, G., Gust, N., Fitridge, I., Floerl, O., Woods, C., Hayden, B., Fenwick, G. 2006a. Port
of Lyttelton: Baseline survey for non-indigenous marine species (Research Project
ZBS2000/04). Biosecurity New Zealand Technical Paper No: 2005/01. Prepared for
the BNZ Post-clearance Directorate 64 pp. + Tables and Appendices.
Inglis, G., Hurren, H., Gust, N., Oldman, J., Fitridge, I., Floerl, O., Hayden, B. 2006b.
Surveillance design for early detection of unwanted exotic marine organisms in New
Zealand. Biosecurity New Zealand Technical Paper No. 2005-17, Wellington,
prepared by NIWA, April 2006.
Knight, G.S. 1974. Benthic community structure in Lyttelton Harbour. New Zealand Journal
of Marine and Freshwater Research 8: 291-306.
Knox, G.A. 1983. The ecological impact of proposed reclamation in inner Lyttelton Harbour.
Estuarine Research Unit, Department of Zoology, University of Canterbury,
Christchurch.
Knox, G.A. 1993. The benthic and intertidal ecology of the area in the vicinity of the
Lyttelton sewage outfall. In: Lyttelton sewage treatment and disposal Information to
support resource consent applications by Banks Peninsula District Council, Vol 2 -
Appendices. Royds Garden Ltd, Christchurch.
Lyttelton Port Company. 2005. Annual Report 2005. Lyttelton, Lyttelton Port Company.
Martin, R.; Proctor, C. 2000. Tasmanian Marine Farm Monitoring Project, Centre for
Research on Introduced Marine Pests, CSIRO, Hobart, Tasmania.
May, J.T.; Brown, L.R. 2001. Chinese mitten crab surveys of San Joaquin River Basin and
Suisun Marsh, California, 2000. Open-File Report 01-396 Prepared for the U.S.
Geological Survey in Cooperation with the Interagency Ecological Program.,
Sacramento, California. 25 pp.
Morrisey, D., Peacock, L., Inglis, G., Floerl, O. 2007. Surveillance for early detection of
unwanted exotic marine organisms in New Zealand: summer 2005-2006. MAF BNZ
Research Project ZBS2001/01. MAF BNZ Technical Paper No. 2007/02, prepared by
NIWA, Nelson, December 2007, 171 pp.
Parry, G.D., Cohen, B.F. 2001. The distribution, abundance and population dynamics of the
exotic seastar Asterias amurensis during the first three years of its invasion of Port
Phillip Bay (incorporating a report on the Bay Pest Day, 2 April 2000). Marine and
Freshwater Resources Institute Report no. 33. Marine and Freshwater Resources
Institute, Queenscliff.
Royds Garden Ltd. 1992. Lyttelton and Diamond Harbour sewage discharges: Assessment of
effects on the environment. Prepared for Banks Peninsula District Council. Royds
Garden Ltd, Christchurch.
Royds Garden Ltd. 1993. Lyttelton sewage treatment and disposal. Information to support
40 Surveillance design report for Lyttelton MAF Biosecurity New Zealand
resource consent applications by Banks Peninsula District Council. Royds Garden
Ltd, Christchurch.
Sinner, J.; Forrest, B.; Taylor, M. 2000. A strategy for managing the Asian kelp Undaria:
final report. Cawthron Report 578, 119 pp. Prepared for Ministry of Fisheries.
Spigel, R.H. 1993. Flushing capability of Lyttelton Harbour: Review of existing knowledge
and recommendations for future work. In: Lyttelton sewage treatment and disposal.
Information to support resource consent applications by Banks Peninsula District
Council, Vol 2 - Appendices. Royds Garden Ltd, Christchurch.
Statistics New Zealand. 2004. Overseas Cargo Statistics.
http://www2.stats.govt.nz/domino/external/pasfull/pasfull.nsf/7cf46ae26dcb6800cc2
56a62000a2248/4c2567ef00247c6acc256f16000eb4a4?OpenDocument, accessed
12/05/05.
Statistics New Zealand 2006a. Overseas cargo statistics - information releases.
http://www.stats.govt.nz/products-and-services/info-releases/oseas-cargo-info-
releases.htm accessed 8/12/06.
Statistics New Zealand 2006b. Exports and Imports Tables.
http://www.stats.govt.nz/products-and-services/table-builder/table-builder-exports-
imports.htm accessed 8/12/06.
Taylor, M.; MacKenzie, L. 2001. Delimitation survey of the toxic dinoflagellate
Gymnodinium catenatum in New Zealand. Cawthron Report 661, 12 pp. Prepared for
Ministry of Fisheries.
Thresher, R.E.; Proctor, C.; Ruiz, G.M.; Gurney, R.; MacKinnon, C.; Walton, W.; Rodriguez,
L.; Bax, N. 2003. Invasion dynamics of the European shore crab, Carcinus maenas,
in Australia. Marine Biology 142: 867-876.
Veldhuizen, T.C. 2000. Gear type selection for the Chinese Mitten Crab habitat use study.
IEP Newsletter 13(1): 10.
Veldhuizen, T.C., Stanish, S. 1999. Overview of the life history, distribution, abundance and
impacts of the Chinese mitten crab, Eriocheir sinensis California Department of
Water Resources, Environmental Services Office, Sacramento, California, USA
(http//www.anstaskforce.gov).
Venette, R.C.; Moon, R.D.; Hutchison, W.D. 2002. Strategies and statistics of sampling for
rare individuals. Annual Reviews in Entomology 47: 143-174.
Vervoort, W., Watson, J. 2003. The marine fauna of New Zealand: Leptothecata (Cnidaria:
Hydrozoa) (Thecate Hydroids). NIWA Biodiversity Memoir 119. Wellington,
NIWA.
Yamada, S.B., Kalin, A., Hunt, C. 2001. Growth and longevity of the European green crab,
Carcinus maenas, in the Pacific northwest. (Unpublished manuscript).
Yamada, S.B.; Kalin, A.; Hunt, C.E.; Dumbauld, B.R.; Figlar-Barnes, R.; Randall, A. 2004.
Growth and persistence of a recent invader Carcinus maenas in estuaries of the
northeastern Pacific. Biological Invasions 7: 309-321.
www.lpc.co.nz: Lyttelton Port Company website. Accessed 16 July 2008.
MAF Biosecurity New Zealand Surveillance design report for Lyttelton 41
Appendices
APPENDIX 1: LETTER SENT TO STAKEHOLDERS.
Fields highlighted in yellow are replaced with appropriate text for each survey at each
location.
------------
Targetted surveillance for non-indigenous marine species in New
Zealand,
PORT NAME MONTH YEAR
We propose to carry out this survey during the period INSERT DATES. The work will
cover the whole of the harbour, including INSERT NAMES OF PORT/WHARF AREAS
TO BE SAMPLED.
Background to the survey
The survey is being done by NIWA with funding from Ministry of Agriculture and
Forestry Biosecurity New Zealand (MAF BNZ), and repeats the surveillance work done
in 2002-2004 at ports around the country. This project provides surveillance for a group
of potentially invasive marine animals and plants that MAF BNZ believes present a
significant threat to New Zealand. One of them – the sea squirt Styela clava – is already
present in New Zealand, and in this case the project will monitor its spread). These
surveys will be repeated at six-monthly intervals.
Sampling methods
We will be sampling by setting traps for crabs and starfish, dredging for animals on the
seabed using a small (1-m wide mouth) scallop dredge, and diving to inspect wharf piles,
walls and rocky shores. All access to port areas will be from the water, using vessels of
4-6 m length, equipped with VHF radio. We will inform PORT NAME Harbour Radio
whenever we enter and leave port areas. INSERT NAME OF ANY MARINAS TO BE
SAMPLED will be accessed by boat or from the shore (pontoons). NIWA staff will not
board any boat berthed in the marina at any time. ADD INFORMATION RELEVANT
TO ANY OTHER STAKEHOLDERS THIS WILL BE SENT TO
Crab and starfish traps will be deployed on lines with anchors and a marker buoy
for periods of 24 hours. Buoys bear NIWA’s name and contact telephone number.
All traps will be deployed away from shipping lanes and will only be deployed on
berths when the notice of shipping movements on the INSERT NAME OF PORT
AUTHORITY website indicates that the berth will be empty during the period of
deployment. We will contact PORT NAME Harbour Radio just prior to
deployment to confirm that there have been no changes to advertised shipping
movements. Traps in marinas will be placed so that they do not interfere with the
movements of vessels. If there is any doubt about deployment we will contact the
Marina Manager.
Dredging and diving around port areas will also avoid shipping lanes, and diving
on wharf piles and walls will be timed to avoid shipping movements or the
presence of ships on berths. A support boat showing a dive flag will accompany
the divers. Again, we will confirm with PORT NAME Harbour Radio prior to
42 Surveillance design report for Lyttelton MAF Biosecurity New Zealand
starting to sample. In the marina a surface observer with a dive flag (either in a
boat or on the pontoons) will monitor the diver and warn vessels that there is a
diver in the water.
We are very grateful to PORT NAME, the marinas and their staff for their cooperation
with this project. If you have any questions regarding any aspects of the work, please do
not hesitate to contact:
The field-team leader, ADD YOUR NAME, DDI AND EMAIL,
NIWA programme leaders
Don Morrisey, telephone 03-545-7744, email [email protected]
Graeme Inglis telephone 03-348-8987, email [email protected]
or
MAF BNZ contact
Brendan Gould telephone 04 819 0548, email [email protected]
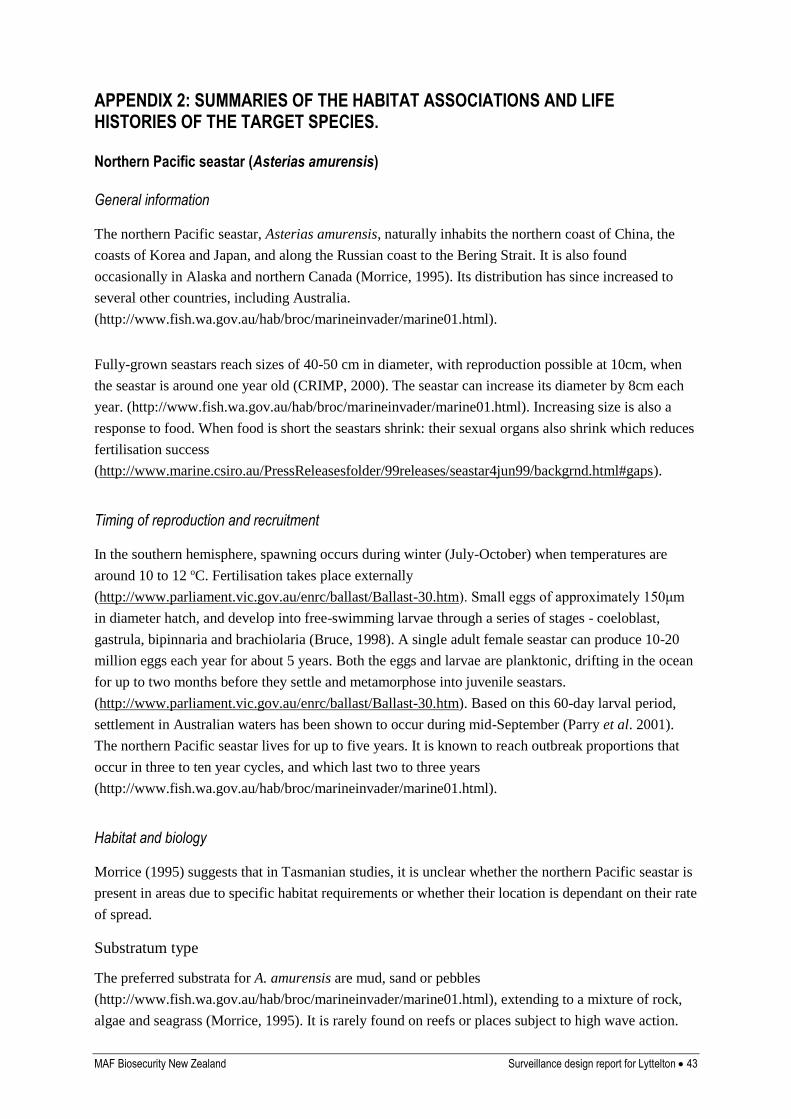
MAF Biosecurity New Zealand Surveillance design report for Lyttelton 43
APPENDIX 2: SUMMARIES OF THE HABITAT ASSOCIATIONS AND LIFE HISTORIES OF THE TARGET SPECIES.
Northern Pacific seastar (Asterias amurensis)
General information
The northern Pacific seastar, Asterias amurensis, naturally inhabits the northern coast of China, the
coasts of Korea and Japan, and along the Russian coast to the Bering Strait. It is also found
occasionally in Alaska and northern Canada (Morrice, 1995). Its distribution has since increased to
several other countries, including Australia.
(http://www.fish.wa.gov.au/hab/broc/marineinvader/marine01.html).
Fully-grown seastars reach sizes of 40-50 cm in diameter, with reproduction possible at 10cm, when
the seastar is around one year old (CRIMP, 2000). The seastar can increase its diameter by 8cm each
year. (http://www.fish.wa.gov.au/hab/broc/marineinvader/marine01.html). Increasing size is also a
response to food. When food is short the seastars shrink: their sexual organs also shrink which reduces
fertilisation success
(http://www.marine.csiro.au/PressReleasesfolder/99releases/seastar4jun99/backgrnd.html#gaps).
Timing of reproduction and recruitment
In the southern hemisphere, spawning occurs during winter (July-October) when temperatures are
around 10 to 12 oC. Fertilisation takes place externally
(http://www.parliament.vic.gov.au/enrc/ballast/Ballast-30.htm). Small eggs of approximately 150μm
in diameter hatch, and develop into free-swimming larvae through a series of stages - coeloblast,
gastrula, bipinnaria and brachiolaria (Bruce, 1998). A single adult female seastar can produce 10-20
million eggs each year for about 5 years. Both the eggs and larvae are planktonic, drifting in the ocean
for up to two months before they settle and metamorphose into juvenile seastars.
(http://www.parliament.vic.gov.au/enrc/ballast/Ballast-30.htm). Based on this 60-day larval period,
settlement in Australian waters has been shown to occur during mid-September (Parry et al. 2001).
The northern Pacific seastar lives for up to five years. It is known to reach outbreak proportions that
occur in three to ten year cycles, and which last two to three years
(http://www.fish.wa.gov.au/hab/broc/marineinvader/marine01.html).
Habitat and biology
Morrice (1995) suggests that in Tasmanian studies, it is unclear whether the northern Pacific seastar is
present in areas due to specific habitat requirements or whether their location is dependant on their rate
of spread.
Substratum type
The preferred substrata for A. amurensis are mud, sand or pebbles
(http://www.fish.wa.gov.au/hab/broc/marineinvader/marine01.html), extending to a mixture of rock,
algae and seagrass (Morrice, 1995). It is rarely found on reefs or places subject to high wave action.
44 Surveillance design report for Lyttelton MAF Biosecurity New Zealand
However, a benthic habitat is not essential - in Tasmania, both adults and juveniles have been recorded
attached to scallop longlines, mussel and oyster lines, salmon cages and spat bags
(http://www.fish.wa.gov.au/hab/broc/marineinvader/marine01.html). Research has shown that
substratum seems important for the induction of settlement and metamorphosis - brachiolaria have
shown high rates of settlement on non-geniculate coralline algae, followed by rock and mud. Sand and
mussel shell did not induce settlement well. Bacterial cover on mussel lines, accompanied by the fine
algae that grows on the ropes, may also provide a very attractive settlement surface (Morris &
Johnson, 1998).
Food preferences
The seastar is a predator of many organisms but has a particular preference for shellfish
(http://www.fish.wa.gov.au/hab/broc/marineinvader/marine01.html). Other prey include sponges,
crustaceans, polychaetes and fish (http://www.parliament.vic.gov.au/enrc/ballast/Ballast-30.htm), as
well as tunicates, bryozoans and echinoderms (Morrice, 1995).
Physiological tolerances (range and preferences)
Temperature
The seastars prefer water temperatures of between 7 and 10 oC in their natural range
(http://www.fish.wa.gov.au/hab/broc/marineinvader/marine01.html), but can tolerate a range of 5 –
20oC. In Japan, water temperatures above 20oC limit the seastars’ range, with adults losing weight and
larvae dying above this temperature (Morrice, 1995, Bruce, 1998). The survival of larvae is
temperature dependant, with the optimal range being between 8 to 16 oC (Bruce, 1998). However,
adult seastars have been shown to adapt to warmer temperatures of up to 22 oC in countries outside
their natural range, such as Australia
(http://www.fish.wa.gov.au/hab/broc/marineinvader/marine01.html).
Depth
The seastar is mainly found in sublittoral to subtidal areas, but can also be present at depths of
up to 200m
(http://www.fish.wa.gov.au/hab/broc/marineinvader/marine01.html). In Australia, it occurs in the
intertidal zone down to a depth of 25m (CRIMP, 2000). Parry & Cohen (2001) have observed that in
some parts of Port Philip Bay, the density of the seastar decreases at depths of <15 metres. Morrice
(1995) states that in the northern Pacific, the seastar inhabits deeper water in the summer and moves
into shallower water in the winter. This may be to survive summer temperatures and to move between
areas.
Salinity
Little research appears to have been conducted on salinity tolerances of the northern Pacific seastar,
but adults seem to be restricted to salinities above 28 psu (Morrice, 1995). In general, the seastar is
sensitive to any changes in salinity and as a result is unlikely to tolerate fluctuating salinities
(http://www.fish.wa.gov.au/hab/broc/marineinvader/marine01.html).
Optimal salinity for larval survival is 32 psu. The larvae become adversely affected by 10 minute
exposures to salinities <17.5 psu and do not survive exposures to salinities <8.55 psu, when extensive
cellular damage has been found to occur (Bruce, 1998).
MAF Biosecurity New Zealand Surveillance design report for Lyttelton 45
Route of introduction
The most likely route is as seastar larvae contained in the ballast water of international vessels,
although research suggests that ‘sea chests’ are another potential method of transport (Dodgshun &
Coutts, 2002). Juvenile seastars found on mussel lines in Port Philip Bay, Australia, indicate a further
risk of spread (Garnham, 1998).
Methods of sampling
Parry & Cohen (2001) used a 2.7 m wide peninsula scallop dredge, covered by 25mm mesh to
sample Asterias. Estimates of field densities were based on the number of seastars collected in
a 60 second tow at a speed of 5.7 +_ 0.3 knots. The average tow length was around 170 m
(Parry & Cohen, 2001).
Whayman/Holdsworth seastar traps have been designed to catch Asterias. Traps with a mesh
size of 26mm catch more seastars than larger mesh (65mm) traps. Most seastars are caught
within the first 24-48 hours. Pilchards are the more attractive bait but only for short soak times
(24-48 hours). The traps effectively fish an area of approximately 30m2 (Martin, 1998).
Vertical distribution of larval asteroids can be measured using vertical tows of a 100μm free-
fall plankton net with a 500mm diameter mouth and 5m in length. A choking bridle closes the
net when hauled. Vertical tows are undertaken to depths of 5m, the depth at which the net
completely submerges, or 15m. A small float can be tied to the end of the plankton net by 10m
of fine line – when this submerges, the net has reached the appropriate depth of 15m (Parry et
al, 2001).
Literature cited
Bruce, B. 1998. A summary of CSIRO studies on the larval ecology of Asterias amurensis. In:
Goggin, C. Louise (Ed.). Proceedings of a meeting on the biology and management of the
introduced seastar Asterias amurensis in Australian waters. Centre for Research on Introduced
Marine Pests (CRIMP) Technical Report no. 15.
Centre for Research on Introduced Marine Pests (CRIMP). 2000. Marine Pest Information Sheet 4 –
Northern Pacific Seastar (Asterias amurensis). CRIMP and CSIRO Marine Research.
Dodgshun, T, Coutts, A. 2002. Ships’ sea chests: a “side door” for marine pests? Cawthron Institute.
Garnham, J. 1998. Distribution and impact of Asterias amurensis in Victoria. In: Goggin, C. Louise
(Ed.). Proceedings of a meeting on the biology and management of the introduced seastar Asterias
amurensis in Australian waters. Centre for Research on Introduced Marine Pests (CRIMP)
Technical Report no. 15.
Martin, R. 1998. Control of seastars by physical removal. In: Goggin, C. Louise (Ed.). Proceedings of
a meeting on the biology and management of the introduced seastar Asterias amurensis in
46 Surveillance design report for Lyttelton MAF Biosecurity New Zealand
Australian waters. Centre for Research on Introduced Marine Pests (CRIMP) Technical Report no.
15
Morrice, MG. 1995. The distribution and ecology of the introduced northern Pacific seastar, Asterias
amurensis (Lutken), in Tasmania. Final Report to the Australian Nature Conservation Agency Feral
Pests Program Number 35. Tasmanian Museum and Art Gallery.
Morris, A, Johnson, C. 1998. Fertilisation and recruitment dynamics of Asterias amurensis. In:
Goggin, C. Louise (Ed.). Proceedings of a meeting on the biology and management of the
introduced seastar Asterias amurensis in Australian waters. Centre for Research on Introduced
Marine Pests (CRIMP) Technical Report no. 15.
Parry, GD, Black, KP, Hatton, DN, Cohen, BF. 2001. Factors affecting the distribution of the exotic
seastar Asterias amurensis during the early phase of its invasion of Port Phillip Bay. 1.
Hydrodynamic factors. Marine and Freshwater Resources Institute Report No. 38. Marine and
Freshwater Resources Institute, Queenscliff.
Parry, GD, Cohen, BF. 2001. The distribution, abundance and population dynamics of the exotic
seastar Asterias amurensis during the first three years of its invasion of Port Phillip Bay
(incorporating a report on the Bay Pest Day, 2 April 2000). Marine and Freshwater Resources
Institute Report no. 33. Marine and Freshwater Resources Institute, Queenscliff.
MAF Biosecurity New Zealand Surveillance design report for Lyttelton 47
Asian clam (Potamocorbula amurensis)
General information
The Asian clam, Potamocorbula amurensis, is a native of estuaries from southern China (22o N
latitude) to southern Siberia (53o N) and Japan (Cohen & Carlton, 1995). However, it has extended its
range to establish abundant populations in California, USA, particularly San Francisco Bay. Asian
clams are euryhaline at all stages of development, and reach settlement 17-19 days after fertilisation
(Nicolini & Penry, 2000).
Timing of reproduction and recruitment
Field studies in San Francisco Bay suggest that the clam spawns throughout the year, although site-
specific seasonal reproduction appears to be related to food supply (Parchaso & Thompson 2002). The
eggs are negatively buoyant, so fertilisation and initial development occur in more saline bottom
waters. It takes 48 hours for development to the straight hinged larval stage through several life phases
– fertilised egg, two-cell stage, four-cell stage, blastula, trochophore). At 17 – 19 days after
fertilisation, the bivalve settles at a shell length of approximately 135 μm. Newly settled clams can
reproduce within a few months (Nicolini & Penry, 2000). Juvenile clams studied in San Francisco Bay
had a mean shell length of 1.7 mm. By the time they were under a year old, shell length was
approximately 11 mm (Cohen & Carlton, 1995). Adults generally reach a length of 20 – 30 mm (NZ
Ministry of Fisheries, 2001).
Studies in San Francisco Bay have shown that the clam displays a complex picture of patchy
recruitment in space and time, which is expected for an invasive eurytopic species (Carlton et al.
1990). The zone of greatest recruitment shifts dramatically with changes in flow - high riverine
outflow conditions may reduce clam densities, but the clams are quick to repopulate brackish water
habitats when high flows abate (Peterson, 1998).
Habitat and biology
Substratum type
The Asian clam is pervasive with regard to habitat. It can invade environments which are nearly
freshwater, creeks and sloughs, intertidal sand-mud flats, and on a wide range of subtidal soft
bottomed substrata - flocculant mud, coarse sand, peat and hard clay (Carlton et al, 1990). It typically
sits with one-third to one-half of its length exposed above the sediment surface. (Cohen & Carlton,
1995). It has been found in very high densities in the benthic layer in the majority of San Francisco
Bay estuary, at up to 48,000 individuals.m-2 (Peterson, 1998). Research in laboratory aquaria has
shown that its behaviour can lead to the formation of depressions in the underlying substrate, which
can significantly disturb sediment layers to a depth of about 1cm. The highly altered, complex surface
left behind may cause difficulties for other mobile and sedentary infauna, thus allowing the clam to
dominate (Carlton et al, 1990).
48 Surveillance design report for Lyttelton MAF Biosecurity New Zealand
Feeding
Potamocorbula amurensis is an efficient suspension feeder (Thompson et al, 1991). Examination of
faeces from specimens collected in San Francisco Bay show that the clam ingests both planktonic and
benthic diatoms. It also filters bacterioplankton as well as phytoplankton, though at lower efficiency,
and assimilates both with high efficiency. Laboratory experiments have shown that the bivalve can
also readily consume certain copepod nauplii (Kimmerer et al 1994). Other research suggests it may
feed on the larvae of other benthic organisms (Cohen & Carlton, 1995).
Physiological tolerances (range and preferences)
The Asian clam is one of the few species of bivalves able to tolerate virtually any salinity, withstand
tropical or cold temperate waters and survive in polluted environments. Research in San Francisco
Bay suggests that the Asian clam has spread rapidly, irrespective of sediment type, water depth and
salinity (Thompson et al. 1991). The following information highlights the wide range of physiological
tolerances that this species displays.
Temperature
Their latitudinal range in Asia suggests that Asian clams can survive a temperature range of 0 – 28oC
(Cohen & Carlton, 1995). There is very little information for P. amurensis, but data for the similar
Chinese corbulid P. laevis (found at approximately the same latitude as San Francisco Bay) suggest
that gametogenesis requires water temperatures ranging from 12 – 23oC. Reproductively active P.
amurensis have been seen in San Francisco Bay in water temperatures ranging from 6 – 23oC
(Parchaso and Thompson 2002). Fertilised eggs of P. laevis are shed at temperatures of between 16
and 20oC. Growth rates are greatest when water temperatures are between 22 and 28oC. Growth rates
decline below 17oC, and growth ceases below 11.8oC (Carlton et al, 1990).
Depth
The clams live both subtidally and intertidally (Cohen & Carlton, 1995), but primarily subtidally
(Carlton et al, 1990).
Salinity
The Asian clam can survive in a range of salinities from almost freshwater (< 1 psu) to full-strength
seawater (32 – 33psu) (Cohen & Carlton, 1995, Carlton et al, 1990,
http://www.fish.wa.gov.au/hab/broc/marineinvader/marine08.html) but long-term survival of adults is
highest at salinities from 5 to 25 psu (Nicolini & Penry, 2000). Spawning and fertilisation can occur at
salinities from 5 – 25 psu, with a maximum at about 10 – 15 psu. Eggs and sperm can tolerate at least
a 10-psu step increase or decrease in salinity. Studies have shown that fertilisation and initial
development tend to occur in the more saline bottom waters of San Francisco Bay. Embryos of two
hours old have been shown to tolerate salinities from 10 – 30 psu, and at 24 hours old they can tolerate
the same wide range of salinities that adult clams can. However, any rapid changes in salinity may
adversely affect larval growth (Nicolini & Penry, 2000).
MAF Biosecurity New Zealand Surveillance design report for Lyttelton 49
Route of introduction
The initial introduction of the Asian clam to San Francisco Bay seems to have been as veliger larvae
transported in ballast water by trans-Pacific cargo ships. The clams’ ability to tolerate wide changes in
salinity suggests it can survive incomplete oceanic exchanges of ballast water (Nicolini & Penry,
2000). The infaunal habitat of the clam suggests that it did not arrive as a fouling organism (Carlton et
al, 1990).
Methods of sampling
Carlton et al. (1990) described a combination of sampling devices that were used to sample
Potamocorbula, including a modified Van Veen grab, a Ponar grab and a Van Veen grab, that
sampled between 0.05 and 0.1 m2 of sediment. Samples were sieved through screens of 0.5
mm to 1mm mesh size. Between 3 to 5 replicate grabs were taken at each sampling station.
Peterson (1998) describes an extensive survey for Potamocorbula in San Francisco Bay using
a Ponar grab.
Literature cited
Carlton, J.T., Thompson, J.K., Schemel, L.E., Nichols, F.H. 1990. Remarkable invasion of San
Francisco Bay (California, USA) by the Asian clam Potamocorbula amurensis. 1. Introduction and
dispersal. Marine Ecology Progress Series 66: 81-94.
Cohen, A.N, Carlton, J.T. 1995. Nonindigenous aquatic species in a United States estuary: a case
study of the biological invasions of the San Francisco Bay and delta. A report for the United States
Fish and Wildlife Service, Washington DC and the National Sea Grant College Program,
Connecticut Sea Grant (NOAA Grant number NA36RG0467).
Kimmerer, W., J.E. Gartside, and J.J. Orsi. 1994. Predation by an introduced clam as the likely cause
of substantial declines in zooplankton in San Francisco Bay. Marine Ecology Progress Series
113:81-93.
NZ Ministry of Fisheries, 2001. Beware invaders of the deep: A guide to identifying marine pests in
New Zealand’s Waters. Information booklet produced by the Ministry of Fisheries, in collaboration
with the Cawthron Institute and NIWA.
Nicolini, M.H., Penry, D.L. 2000. Spawning, fertilisation, and larval development of Potamocorbula
amurensis (Mollusc: Bivalvia) from San Francisco Bay, California. Pacific Science 54: pp 377-
388.
Parchaso, F., Thompson, J.K. 2002. Influence of hydrologic processes on reproduction of the
introduced bivalve Potamocorbula amurensis in Northern San Francisco Bay, California. Pacific
Science 56(3): 329-345.
50 Surveillance design report for Lyttelton MAF Biosecurity New Zealand
Peterson, H. 1998. Results of the 1995 Potamocorbula Spatial Distribution Survey. California
Department of Water Resources. In Abstracts from the Eighth International Zebra Mussel and
Other Nuisance Species Conference, Sacramento California, March 16-19, 1998.
Thompson, J.K., Schemel, .L.E, Nichols, S.J. 1991. An Asian bivalve, Potamocorbula amurensis,
invades San Francisco Bay with remarkable speed and success. Journal of Shellfish Research, 10:
259.
Chinese mitten crab (Eriocheir sinensis)
General Information:
The Chinese mitten crab Eriocheir sinensis is a burrowing crab native to mainland China and coastal
rivers and estuaries of the Yellow Sea. It is a palm-sized greyish- brown grapsid crab with small white
pincers protruding from hairy brown claws. The native range of the mitten crab extends from the
southern border of North Korea (40oN latitude) to Hong Kong (22 oN). It has established introduced
populations in Vietnam, northern Europe and the west coast of America. The first specimens to be
found in Europe were reported from near Hamburg in Germany 1912 (Panning 1939). Since then,
mitten crabs have spread from Finland to the Atlantic coast of southern France and to the UK, Russia,
Holland, Belgium, the Czech republic, Denmark, Sweden, France, Poland and Portugal and Spain. The
first reported occurrence of the mitten crab in North America was in the Detroit River in 1965 by the
city of Windsor, Canada. Later, in 1973, commercial fishermen netted several crabs in Lake Erie near
Erieau and Port Stanley, Ontario, Canada (Nepszy & Leach, 1973). In June 2006 a specimen was
caught in Chesapeake Bay (SERC 2004). On the west coast, it was first reported from San Francisco
Bay in 1992 where it has since become well-established (Halat & Resh 1996). Ballast water
introductions have been blamed, but speculation also exists about possible deliberate release into the
U.S.A.
Eriocheir sinensis is a catadromous species that lives most of its life in freshwater environments.
Mature males and females migrate during late summer to tidal estuaries where they mate and spawn.
Adults (Maximum body size 10-cm carapace width, but more commonly between 5 and 8 cm) are
capable of very long distance migrations e.g. over 1000km in the Yangtze River (Cohen & Carlton
1995). After mating the females are thought to continue seaward, over-wintering in the deeper water
and returning to brackish water in the spring to hatch their eggs (Panning 1939). The movement of
crabs to deeper water and the timing of egg hatching/larval release is temperature dependent. Winter
temperatures are much colder in Europe than San Francisco, which is probably why crabs there move
to deeper water and why hatching is delayed until spring. In the San Francisco Estuary, preliminary
data indicate that the adult crabs remain in the spawning areas (~ 20ppt) and hatching occurs in
November/December and again in March. The timing of hatching varies yearly depending upon winter
water temperatures. Settled juvenile crabs gradually move upstream into brackish (1-5 psu) and fresh
water to complete the life cycle.
Mitten crab ‘plagues’ of extreme numbers have been reported from Germany in the mid 1930’s
(Panning 1939) and in the Netherlands in 1981 (Ingle, 1986). Adults are capable of emerging from
water and crossing dry land when migrating.
MAF Biosecurity New Zealand Surveillance design report for Lyttelton 51
Timing of reproduction and recruitment
Crabs mature at different ages according to locality. Maturity has been reported at ages of 3 to 5 years
in Europe (Panning 1939), 1 to 2 years in China (Cohen & Carlton 1995) and 2 to 3 years in California
(Veldhuizen and Stanish 1999. Each female produces from 250,000 to 1 million eggs, which hatch in
late spring or early summer. In laboratory culture, the larval period lasts for 1 –2 months and the
larvae develop through five zoeae and a megalopa stage (Kim & Hwang 1995). After the final larval
moult the juvenile crab settles to the bottom in late spring and begins its migration upstream (Panning,
1939; Ingle, 1986; Anger, 1991). Experiments indicate that complete development of larvae is not
possible in rivers or in brackish estuarine conditions (Anger 1991).
Habitat and Biology:
Substratum type
The normal habitat of the juveniles is the bottoms and banks of brackish and freshwater rivers and
estuaries, individuals prefer hard bottoms and areas covered with submerged plants (Nepzy & Leach
1973). Older juveniles are found in a diversity of habitats including silt, gravel, and open unvegetated
stream channels. In freshwater habitats of San Francisco Bay, E. sinensis is most common in areas
with steep, vegetated banks that are high in clay content. Burrows are concentrated underneath the root
profile of the aquatic macrophytes lining the banks, which mainly consists of Scirpus (Halat & Resh
1996). Submerged aquatic vegetation is an important component to the habitat. It provides cover and
high concentrations of invertebrates (Veldhuizen 2000).
In Asia and Europe mitten crabs live in burrows dug in river banks or in rice paddies in coastal areas
(Cohen & Carlton 1995). Young mitten crabs are found in tidal freshwater areas and usually burrow in
banks and levees between high and low-tide marks. Optimal rearing habitat for juveniles is areas with
still or slow velocity water, a stable water depth, low turbidity, and warm temperatures (ranging from
20oC to 30oC, with optimal growth at 24oC to 28oC) (Veldhuizen 2000). Mitten crabs apparently do
not burrow as extensively in non-tidal areas. Older juveniles are found further upstream than young
ones and both adults and juveniles can move hundreds of km.
In China, recently settled juvenile mitten crabs are harvested during spring tides in late May and June
when they congregate over sandy bottom areas in water of 1 to 3 0/00 (Hymanson et al. 1999)
Food preferences
The mitten crab is known to be predominantly an omnivorous, opportunistic feeder, although feeding
habits change as they mature. Juvenile crabs mainly eat vegetation (Halat & Resh 1996) primarily
filamentous algae (Veldhuizen & Stanish 1999). As they mature they also prey on small invertebrates,
especially worms and clams so that adults and juveniles are considered omnivorous
(http://www.wsg.washington.edu). Gut content analysis of crabs in the San Francisco Bay area
revealed a high proportion of vegetative matter, with low amounts of invertebrates, regardless of the
size of the crab or the habitat from which it was captured (Rudnick et al. 2000).
Vegetation type
Juveniles were observed taking cover in floating vegetation, especially water hyacinth in the USA
(Hieb & Veldhuizen 1998). An ongoing study by Veldhuizen is currently assessing habitat
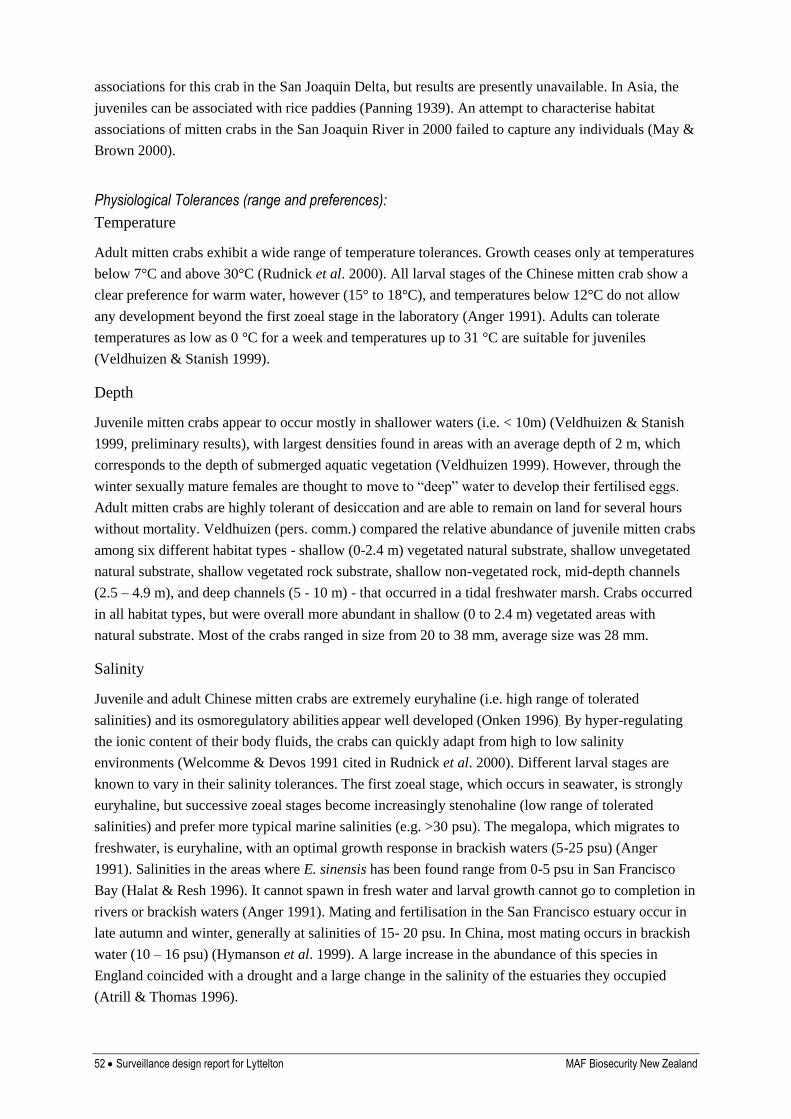
52 Surveillance design report for Lyttelton MAF Biosecurity New Zealand
associations for this crab in the San Joaquin Delta, but results are presently unavailable. In Asia, the
juveniles can be associated with rice paddies (Panning 1939). An attempt to characterise habitat
associations of mitten crabs in the San Joaquin River in 2000 failed to capture any individuals (May &
Brown 2000).
Physiological Tolerances (range and preferences):
Temperature
Adult mitten crabs exhibit a wide range of temperature tolerances. Growth ceases only at temperatures
below 7°C and above 30°C (Rudnick et al. 2000). All larval stages of the Chinese mitten crab show a
clear preference for warm water, however (15° to 18°C), and temperatures below 12°C do not allow
any development beyond the first zoeal stage in the laboratory (Anger 1991). Adults can tolerate
temperatures as low as 0 °C for a week and temperatures up to 31 °C are suitable for juveniles
(Veldhuizen & Stanish 1999).
Depth
Juvenile mitten crabs appear to occur mostly in shallower waters (i.e. < 10m) (Veldhuizen & Stanish
1999, preliminary results), with largest densities found in areas with an average depth of 2 m, which
corresponds to the depth of submerged aquatic vegetation (Veldhuizen 1999). However, through the
winter sexually mature females are thought to move to “deep” water to develop their fertilised eggs.
Adult mitten crabs are highly tolerant of desiccation and are able to remain on land for several hours
without mortality. Veldhuizen (pers. comm.) compared the relative abundance of juvenile mitten crabs
among six different habitat types - shallow (0-2.4 m) vegetated natural substrate, shallow unvegetated
natural substrate, shallow vegetated rock substrate, shallow non-vegetated rock, mid-depth channels
(2.5 – 4.9 m), and deep channels (5 - 10 m) - that occurred in a tidal freshwater marsh. Crabs occurred
in all habitat types, but were overall more abundant in shallow (0 to 2.4 m) vegetated areas with
natural substrate. Most of the crabs ranged in size from 20 to 38 mm, average size was 28 mm.
Salinity
Juvenile and adult Chinese mitten crabs are extremely euryhaline (i.e. high range of tolerated
salinities) and its osmoregulatory abilities appear well developed (Onken 1996). By hyper-regulating
the ionic content of their body fluids, the crabs can quickly adapt from high to low salinity
environments (Welcomme & Devos 1991 cited in Rudnick et al. 2000). Different larval stages are
known to vary in their salinity tolerances. The first zoeal stage, which occurs in seawater, is strongly
euryhaline, but successive zoeal stages become increasingly stenohaline (low range of tolerated
salinities) and prefer more typical marine salinities (e.g. >30 psu). The megalopa, which migrates to
freshwater, is euryhaline, with an optimal growth response in brackish waters (5-25 psu) (Anger
1991). Salinities in the areas where E. sinensis has been found range from 0-5 psu in San Francisco
Bay (Halat & Resh 1996). It cannot spawn in fresh water and larval growth cannot go to completion in
rivers or brackish waters (Anger 1991). Mating and fertilisation in the San Francisco estuary occur in
late autumn and winter, generally at salinities of 15- 20 psu. In China, most mating occurs in brackish
water (10 – 16 psu) (Hymanson et al. 1999). A large increase in the abundance of this species in
England coincided with a drought and a large change in the salinity of the estuaries they occupied
(Atrill & Thomas 1996).
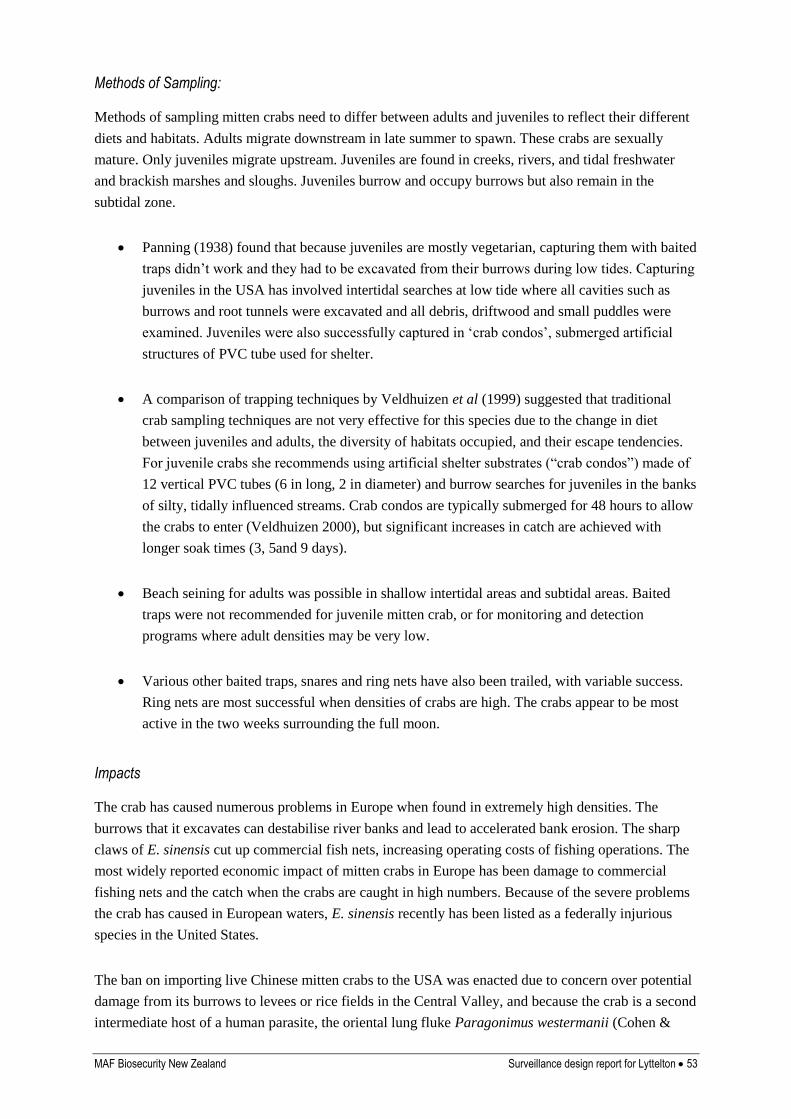
MAF Biosecurity New Zealand Surveillance design report for Lyttelton 53
Methods of Sampling:
Methods of sampling mitten crabs need to differ between adults and juveniles to reflect their different
diets and habitats. Adults migrate downstream in late summer to spawn. These crabs are sexually
mature. Only juveniles migrate upstream. Juveniles are found in creeks, rivers, and tidal freshwater
and brackish marshes and sloughs. Juveniles burrow and occupy burrows but also remain in the
subtidal zone.
Panning (1938) found that because juveniles are mostly vegetarian, capturing them with baited
traps didn’t work and they had to be excavated from their burrows during low tides. Capturing
juveniles in the USA has involved intertidal searches at low tide where all cavities such as
burrows and root tunnels were excavated and all debris, driftwood and small puddles were
examined. Juveniles were also successfully captured in ‘crab condos’, submerged artificial
structures of PVC tube used for shelter.
A comparison of trapping techniques by Veldhuizen et al (1999) suggested that traditional
crab sampling techniques are not very effective for this species due to the change in diet
between juveniles and adults, the diversity of habitats occupied, and their escape tendencies.
For juvenile crabs she recommends using artificial shelter substrates (“crab condos”) made of
12 vertical PVC tubes (6 in long, 2 in diameter) and burrow searches for juveniles in the banks
of silty, tidally influenced streams. Crab condos are typically submerged for 48 hours to allow
the crabs to enter (Veldhuizen 2000), but significant increases in catch are achieved with
longer soak times (3, 5and 9 days).
Beach seining for adults was possible in shallow intertidal areas and subtidal areas. Baited
traps were not recommended for juvenile mitten crab, or for monitoring and detection
programs where adult densities may be very low.
Various other baited traps, snares and ring nets have also been trailed, with variable success.
Ring nets are most successful when densities of crabs are high. The crabs appear to be most
active in the two weeks surrounding the full moon.
Impacts
The crab has caused numerous problems in Europe when found in extremely high densities. The
burrows that it excavates can destabilise river banks and lead to accelerated bank erosion. The sharp
claws of E. sinensis cut up commercial fish nets, increasing operating costs of fishing operations. The
most widely reported economic impact of mitten crabs in Europe has been damage to commercial
fishing nets and the catch when the crabs are caught in high numbers. Because of the severe problems
the crab has caused in European waters, E. sinensis recently has been listed as a federally injurious
species in the United States.
The ban on importing live Chinese mitten crabs to the USA was enacted due to concern over potential
damage from its burrows to levees or rice fields in the Central Valley, and because the crab is a second
intermediate host of a human parasite, the oriental lung fluke Paragonimus westermanii (Cohen &
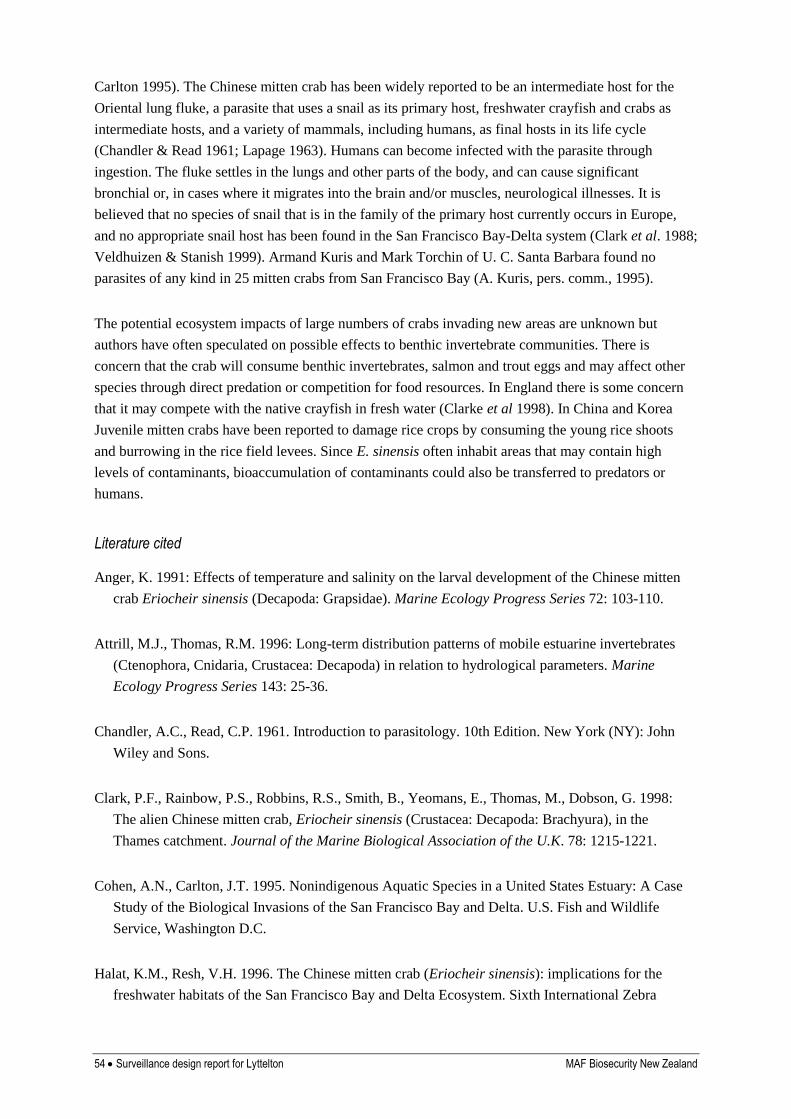
54 Surveillance design report for Lyttelton MAF Biosecurity New Zealand
Carlton 1995). The Chinese mitten crab has been widely reported to be an intermediate host for the
Oriental lung fluke, a parasite that uses a snail as its primary host, freshwater crayfish and crabs as
intermediate hosts, and a variety of mammals, including humans, as final hosts in its life cycle
(Chandler & Read 1961; Lapage 1963). Humans can become infected with the parasite through
ingestion. The fluke settles in the lungs and other parts of the body, and can cause significant
bronchial or, in cases where it migrates into the brain and/or muscles, neurological illnesses. It is
believed that no species of snail that is in the family of the primary host currently occurs in Europe,
and no appropriate snail host has been found in the San Francisco Bay-Delta system (Clark et al. 1988;
Veldhuizen & Stanish 1999). Armand Kuris and Mark Torchin of U. C. Santa Barbara found no
parasites of any kind in 25 mitten crabs from San Francisco Bay (A. Kuris, pers. comm., 1995).
The potential ecosystem impacts of large numbers of crabs invading new areas are unknown but
authors have often speculated on possible effects to benthic invertebrate communities. There is
concern that the crab will consume benthic invertebrates, salmon and trout eggs and may affect other
species through direct predation or competition for food resources. In England there is some concern
that it may compete with the native crayfish in fresh water (Clarke et al 1998). In China and Korea
Juvenile mitten crabs have been reported to damage rice crops by consuming the young rice shoots
and burrowing in the rice field levees. Since E. sinensis often inhabit areas that may contain high
levels of contaminants, bioaccumulation of contaminants could also be transferred to predators or
humans.
Literature cited
Anger, K. 1991: Effects of temperature and salinity on the larval development of the Chinese mitten
crab Eriocheir sinensis (Decapoda: Grapsidae). Marine Ecology Progress Series 72: 103-110.
Attrill, M.J., Thomas, R.M. 1996: Long-term distribution patterns of mobile estuarine invertebrates
(Ctenophora, Cnidaria, Crustacea: Decapoda) in relation to hydrological parameters. Marine
Ecology Progress Series 143: 25-36.
Chandler, A.C., Read, C.P. 1961. Introduction to parasitology. 10th Edition. New York (NY): John
Wiley and Sons.
Clark, P.F., Rainbow, P.S., Robbins, R.S., Smith, B., Yeomans, E., Thomas, M., Dobson, G. 1998:
The alien Chinese mitten crab, Eriocheir sinensis (Crustacea: Decapoda: Brachyura), in the
Thames catchment. Journal of the Marine Biological Association of the U.K. 78: 1215-1221.
Cohen, A.N., Carlton, J.T. 1995. Nonindigenous Aquatic Species in a United States Estuary: A Case
Study of the Biological Invasions of the San Francisco Bay and Delta. U.S. Fish and Wildlife
Service, Washington D.C.
Halat, K.M., Resh, V.H. 1996. The Chinese mitten crab (Eriocheir sinensis): implications for the
freshwater habitats of the San Francisco Bay and Delta Ecosystem. Sixth International Zebra
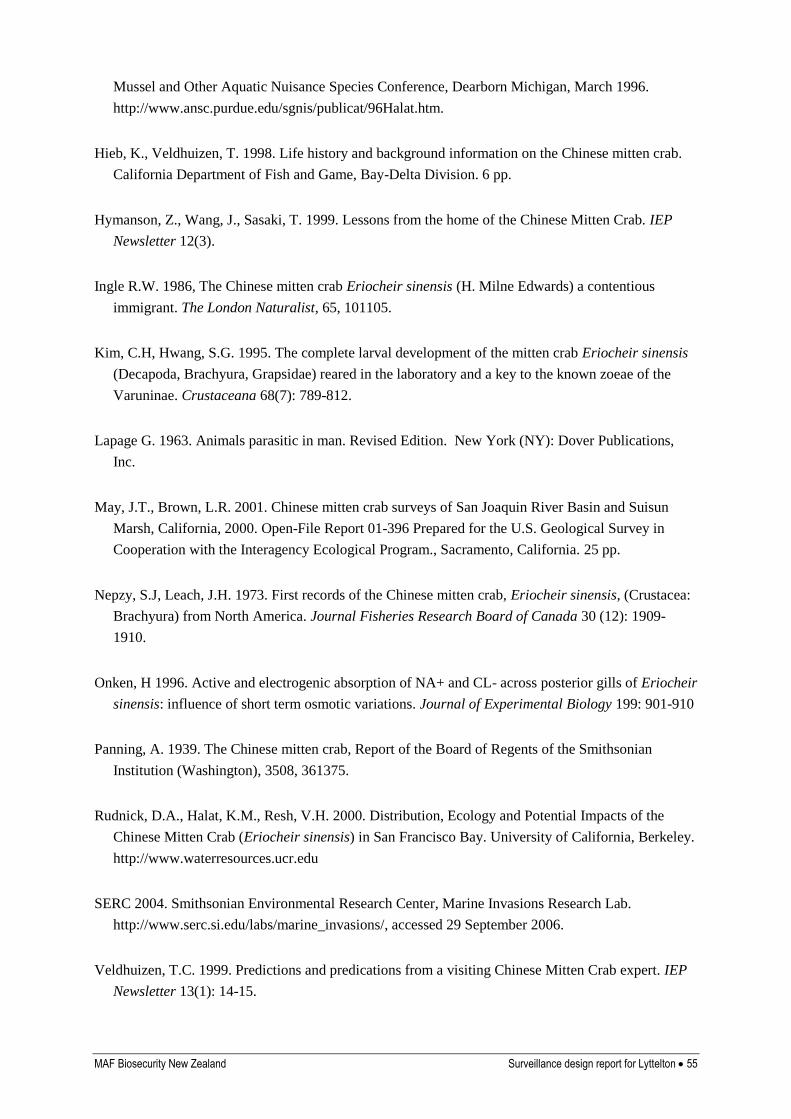
MAF Biosecurity New Zealand Surveillance design report for Lyttelton 55
Mussel and Other Aquatic Nuisance Species Conference, Dearborn Michigan, March 1996.
http://www.ansc.purdue.edu/sgnis/publicat/96Halat.htm.
Hieb, K., Veldhuizen, T. 1998. Life history and background information on the Chinese mitten crab.
California Department of Fish and Game, Bay-Delta Division. 6 pp.
Hymanson, Z., Wang, J., Sasaki, T. 1999. Lessons from the home of the Chinese Mitten Crab. IEP
Newsletter 12(3).
Ingle R.W. 1986, The Chinese mitten crab Eriocheir sinensis (H. Milne Edwards) a contentious
immigrant. The London Naturalist, 65, 101105.
Kim, C.H, Hwang, S.G. 1995. The complete larval development of the mitten crab Eriocheir sinensis
(Decapoda, Brachyura, Grapsidae) reared in the laboratory and a key to the known zoeae of the
Varuninae. Crustaceana 68(7): 789-812.
Lapage G. 1963. Animals parasitic in man. Revised Edition. New York (NY): Dover Publications,
Inc.
May, J.T., Brown, L.R. 2001. Chinese mitten crab surveys of San Joaquin River Basin and Suisun
Marsh, California, 2000. Open-File Report 01-396 Prepared for the U.S. Geological Survey in
Cooperation with the Interagency Ecological Program., Sacramento, California. 25 pp.
Nepzy, S.J, Leach, J.H. 1973. First records of the Chinese mitten crab, Eriocheir sinensis, (Crustacea:
Brachyura) from North America. Journal Fisheries Research Board of Canada 30 (12): 1909-
1910.
Onken, H 1996. Active and electrogenic absorption of NA+ and CL- across posterior gills of Eriocheir
sinensis: influence of short term osmotic variations. Journal of Experimental Biology 199: 901-910
Panning, A. 1939. The Chinese mitten crab, Report of the Board of Regents of the Smithsonian
Institution (Washington), 3508, 361375.
Rudnick, D.A., Halat, K.M., Resh, V.H. 2000. Distribution, Ecology and Potential Impacts of the
Chinese Mitten Crab (Eriocheir sinensis) in San Francisco Bay. University of California, Berkeley.
http://www.waterresources.ucr.edu
SERC 2004. Smithsonian Environmental Research Center, Marine Invasions Research Lab.
http://www.serc.si.edu/labs/marine_invasions/, accessed 29 September 2006.
Veldhuizen, T.C. 1999. Predictions and predications from a visiting Chinese Mitten Crab expert. IEP
Newsletter 13(1): 14-15.
56 Surveillance design report for Lyttelton MAF Biosecurity New Zealand
Veldhuizen, T.C. 2000. Gear type selection for the Chinese Mitten Crab habitat use study. IEP
Newsletter 13(1): 10
Veldhuizen, T.C., Stanish, S. 1999. Overview of the life history, distribution, abundance and impacts
of the Chinese mitten crab, Eriocheir sinensis California Department of Water Resources,
Environmental Services Office, Sacremento, California, USA (http//www.anstaskforce.gov)
MAF Biosecurity New Zealand Surveillance design report for Lyttelton 57
European green crab (Carcinus maenas)
General information
The European green crab, Carcinus maenas, is native to the Atlantic, Baltic and North Sea coasts of
Europe, but has established populations outside this range on the Atlantic and Pacific coasts of North
America, in South Africa, and Australia. Green crabs produce planktonic larvae that pass through six
developmental stages – a prezoea, 4 zoeal stages, and a megalopa – before metamorphosis to the
benthic, juvenile crab phase. The crabs themselves grow through 18 to 20 moult cycles before
reaching maximum size and terminal anecdysis (Parry et al. 1996). In its native range, the green crab
can live up to 5 years and males reach a size of 86 mm carapace width. In western North America,
adult males can be up to 92 mm carapace width within 2 years (Grosholz & Ruiz 1996).
Timing of reproduction and recruitment
Green crabs mate after the females moult, usually between spring and autumn. In warmer waters,
females carry eggs for around four months. Egg-bearing females tend to migrate into deeper water
during winter and prezoeae hatch from the eggs predominantly in spring
(http://www.wa.gov/wdfw/fish/ans/greencrab.htm). The prezoeae pass through four zoeal stages in the
plankton before moulting into the megalopal stage. Megalopae appear in early-mid summer and
metamorphose and settle into the juvenile crab phase in late summer (Parry et al. 1996). The average
development time for C. maenas larvae varies with temperature. At 10oC development takes around 75
days, and at 25oC it can take as little as 13 days (Parry et al. 1996). The timing of settlement is related
to the number of months in which water temperatures are below 10oC. In cooler waters, settlement
occurs in late summer. In warmer waters, megalopae can begin to settle in late autumn (Yamada et al.
2001). Settlement occurs predominantly at night around the time of high tide (Zeng et al. 1997).
Habitat and biology
Substratum type
In its native range, the Green Crab, Carcinus maenas, occurs on both hard (rocky) and soft intertidal
and shallow subtidal habitats in semi-exposed soft-sediment bays (Moksnes 2002). In Europe, eastern
North America, Australia and South Africa, green crabs occur in protected embayments and on
moderately exposed rocky shores. In western North America green crabs occur only in sheltered
embayments and only in soft-sediment environments (Grosholz & Ruiz 1996). A recent survey of the
distribution of C. maenas in southern Australia found crabs in a range of soft-sediment habitats in low
energy embayments. Substratum type, depth and water quality were all poor predictors of its presence
and abundance in traps set in these habitats (Thresher et al. 2003).
Post larvae (megalopae) settle and metamorphose predominantly in shallow (< 1 m) sheltered or semi-
exposed areas that have some form of structured habitat that provides shelter from predators (e.g.
seagrass, macroalgae, mussels, shell debris, etc). Small crabs are often found in close proximity to
vegetation such as beach grass, reeds, and eelgrass, although they also occur in exposed areas such as
bare mud. Larger crabs do not need vegetative cover. In Sweden, young crabs are concentrated in
greatest densities within structurally complex habitats, such as mussel beds, shell debris, seagrasses
58 Surveillance design report for Lyttelton MAF Biosecurity New Zealand
and filamentous algae. Much smaller densities occur in adjacent sand or mud. Densities of juvenile
crabs (2nd – 9th instar) are significantly greater in mussel beds and shell habitats (mean = 206 crabs.m-
2) than in eelgrass (45 crabs.m-2), filamentous green algae (24 crabs.m-2) or sand (13 crabs.m-2).
Settlement of megalopae occurs predominantly to structurally complex habitats such as filamentous
algae (231 settlers.m-2), eelgrass (159 settlers.m-2) and mussel beds (114 settlers.m-2), rather than to
open sand (4 settlers.m-2), but larger animals redistribute themselves among these habitats. Indeed,
adult crabs are highly mobile and are capable of foraging over large areas (km to 10’s km).
Food preferences
Green crabs are omnivorous. Adult crabs feed predominantly on bivalves (rank = 1), small crustaceans
(rank = 2) and smaller numbers of polychaetes and green algae (rank = 3 to 4) (Grosholz & Ruiz
1996).
Physiological tolerances (range & preferences)
Temperature
Carcinus maenas can tolerate a wide range of temperatures. In its native and introduced ranges,
animals can tolerate average summer water temperatures of 22oC and average winter temperatures of 0
oC, although adult mortality has been recorded at sustained winter temperatures of 0 oC or below
(Cohen et al. 1995). Crabs stop moulting and drastically reduce their activity below 10oC, and stop
feeding when temperatures are below 7oC (Yamada et al. 2001). Successful embryonic development
occurs at temperatures between 11 and 25 °C.
Depth
Green crabs are found predominantly in the mid-intertidal zone, between about 1.3 m to 1.7 m above
datum, and shallow subtidal, although adults have been recorded as deep as 60 m (Cohen et al. 1995).
Juveniles (0-1+ age, 1-20 mm carapace width) are found mainly < 1 m water depth (Moksnes 2002).
In Bodega Harbour, California, green crabs were caught between +0.7m and 1.4 m above mean lower
low-water, with crabs being most abundant at +1.2 m (Grosholz & Ruiz 1995: see Figure 3). Parry et
al. (1996) and Thresher et al. (2003) report greatest catches of adult C. maenas in water depths < 10
m. However, in Sweden, subadults and adults are found commonly between 0.1 to 20 m depth
(occasionally to 60 m).
Salinity
Green crabs tolerate a wide range of salinity, but appear to prefer more saline areas (Proctor 1997).
Adults reside in water from 4 psu to 34 psu. Populations breed successfully at salinities down to at
least 13 psu, although larvae may only settle at salinities above 17 psu (Cohen et al. 1995). Survival of
eggs to larval stages occurs at salinities between 26 and 39 psu and larval development may be
prevented at < 13 psu (http://www.wa.gov/wdfw/fish/ans/greencrab.htm). In the laboratory, adult
Carcinus prefer salinities of 22-41 psu, but can tolerate maximum salinities of up to 54 psu (Cohen et
al. 1995).
MAF Biosecurity New Zealand Surveillance design report for Lyttelton 59
Methods of sampling
Standard baited minnow traps (cylindrical with inverted cone entrances of ~ 57 mm) are set
near the edge of vegetation or along mud/peat banks, generally far from the low tide drainage
channels. Set 5-10 traps with openings perpendicular to the incoming tide with a rock in the
trap to hold it in place, and possibly a rock "cradle" made in the substrate to keep the traps
from being moved by wave action (http://www.pac.dfo-
mpo.gc.ca/ops/fm/shellfish/Green_Crab/FIND.HTML).
Shore searches along the high tide wrack line where storm driven vegetation accumulates for
exuviae of molting crabs. This is most profitable in areas with some vegetation intertidally or
subtidally, as molting crabs prefer to have cover available during this vulnerable process
(http://www.pac.dfo-mpo.gc.ca/ops/fm/shellfish/Green_Crab/FIND.HTML).
Yamada et al. (2001) compared 4 types of traps for catching Carcinus: unbaited pitfall traps,
minnow traps, fish traps and box traps deployed in intertidal and shallow subtidal
environments. In high intertidal areas, pitfall traps were successful for sampling crabs < 45
mm carapace width. Folding traps and box traps successfully caught crabs > 40 mm. The box
traps typically yielded larger catches than other types and caught crabs in their second or third
summer.
Thresher et al. (2003) used collapsible box traps (62 cm x 42 cm x 20 cm) to survey
populations of C. maenas in southern Australia. Traps were typically baited with oily fish and
deployed over night for 15-24 hours. Average catch rates from a single overnight set were
occasionally as high as 44 crabs.trap-1.
Literature cited
Cohen, A.N., Carlton, J.T., Fountain, M.C. 1995. Introduction, dispersal and potential impacts of the
green crab Carcinus maenas in San Francisco Bay, California. Marine Biology 122: 225-237.
Grosholz, E.D., Ruiz, G.M. 1995. Spread and potential impact of the introduced European green crab,
Carcinus maenas, in central California. Marine Biology 122: 239-247.
Grosholz, E.D.,. Ruiz, G.M. 1996. Predicting the impact of introduced marine species: lessons from
the multiple invasions of the European green crab, Carcinus maenas. Biological Conservation 78:
59-66.
Moksnes, P.-O. 2002. The relative importance of habitat-specific settlement, predation and juvenile
dispersal for distribution and abundance of young juvenile shore crabs, Carcinus maenas L.
Journal of Experimental Marine Biology and Ecology 271: 41-73.
Parry, G.D., Lockett, M.M., Crookes, D.P., Coleman, N., Sinclair, M.A. 1996. Review by species,
Pages 7-34 in Mapping and distribution of Sabella spallanzanii in Port Phillip Bay. Final Report to
60 Surveillance design report for Lyttelton MAF Biosecurity New Zealand
Fisheries Research and Development Corporation (FRDC Project 94/164), Department of
Conservation and Natural Resources, Victoria, Australia.
Proctor, C. 1997. Spatial correlations between C. maenas abundance and elements of the Tasmanian
marine benthic community. Page 43, In: Proceedings of the first International Workshop on the
Demography, Impacts and Management of Introduced Populations of the European Green Crab,
Carcinus maenas. Centre for Research on Introduced Marine Pests, Hobart, Tasmania.
Thresher, R., Proctor, C., Ruiz, G., Gurney, R., MacKinnon, C., Walton, W., Rodriguez, L., Nax, N.
2003. Invasion dynamics of the European shore crab, Carcinus maenas, in Australia. Marine
Biology 142: 867-876.
Yamada, S.B., Kalin, A., Hunt, C. 2001. Growth and longevity of the European green crab, Carcinus
maenas, in the Pacific northwest. (Unpublished manuscript).
Zeng, C., Naylor, E., Abello, P. 1997. Endogenous control of timing of metamorphosis in megalopae
of the shore crab Carcinus maenas. Marine Biology 128: 299-305.
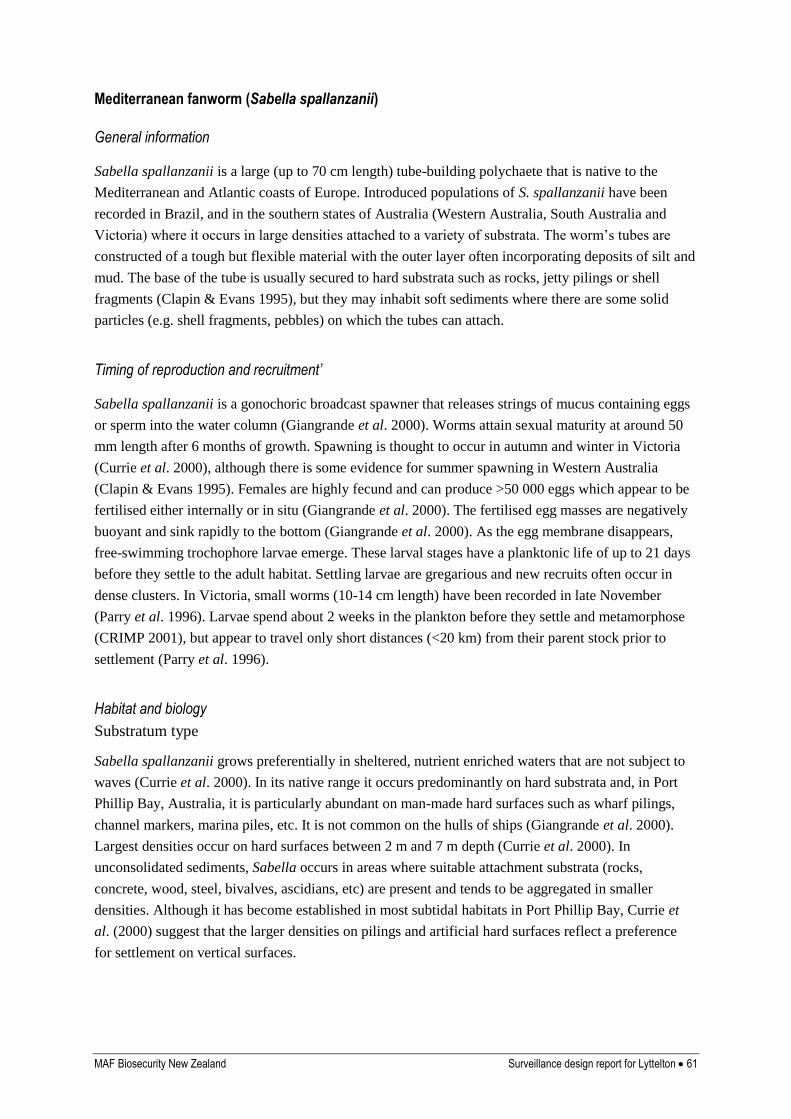
MAF Biosecurity New Zealand Surveillance design report for Lyttelton 61
Mediterranean fanworm (Sabella spallanzanii)
General information
Sabella spallanzanii is a large (up to 70 cm length) tube-building polychaete that is native to the
Mediterranean and Atlantic coasts of Europe. Introduced populations of S. spallanzanii have been
recorded in Brazil, and in the southern states of Australia (Western Australia, South Australia and
Victoria) where it occurs in large densities attached to a variety of substrata. The worm’s tubes are
constructed of a tough but flexible material with the outer layer often incorporating deposits of silt and
mud. The base of the tube is usually secured to hard substrata such as rocks, jetty pilings or shell
fragments (Clapin & Evans 1995), but they may inhabit soft sediments where there are some solid
particles (e.g. shell fragments, pebbles) on which the tubes can attach.
Timing of reproduction and recruitment’
Sabella spallanzanii is a gonochoric broadcast spawner that releases strings of mucus containing eggs
or sperm into the water column (Giangrande et al. 2000). Worms attain sexual maturity at around 50
mm length after 6 months of growth. Spawning is thought to occur in autumn and winter in Victoria
(Currie et al. 2000), although there is some evidence for summer spawning in Western Australia
(Clapin & Evans 1995). Females are highly fecund and can produce >50 000 eggs which appear to be
fertilised either internally or in situ (Giangrande et al. 2000). The fertilised egg masses are negatively
buoyant and sink rapidly to the bottom (Giangrande et al. 2000). As the egg membrane disappears,
free-swimming trochophore larvae emerge. These larval stages have a planktonic life of up to 21 days
before they settle to the adult habitat. Settling larvae are gregarious and new recruits often occur in
dense clusters. In Victoria, small worms (10-14 cm length) have been recorded in late November
(Parry et al. 1996). Larvae spend about 2 weeks in the plankton before they settle and metamorphose
(CRIMP 2001), but appear to travel only short distances (<20 km) from their parent stock prior to
settlement (Parry et al. 1996).
Habitat and biology
Substratum type
Sabella spallanzanii grows preferentially in sheltered, nutrient enriched waters that are not subject to
waves (Currie et al. 2000). In its native range it occurs predominantly on hard substrata and, in Port
Phillip Bay, Australia, it is particularly abundant on man-made hard surfaces such as wharf pilings,
channel markers, marina piles, etc. It is not common on the hulls of ships (Giangrande et al. 2000).
Largest densities occur on hard surfaces between 2 m and 7 m depth (Currie et al. 2000). In
unconsolidated sediments, Sabella occurs in areas where suitable attachment substrata (rocks,
concrete, wood, steel, bivalves, ascidians, etc) are present and tends to be aggregated in smaller
densities. Although it has become established in most subtidal habitats in Port Phillip Bay, Currie et
al. (2000) suggest that the larger densities on pilings and artificial hard surfaces reflect a preference
for settlement on vertical surfaces.
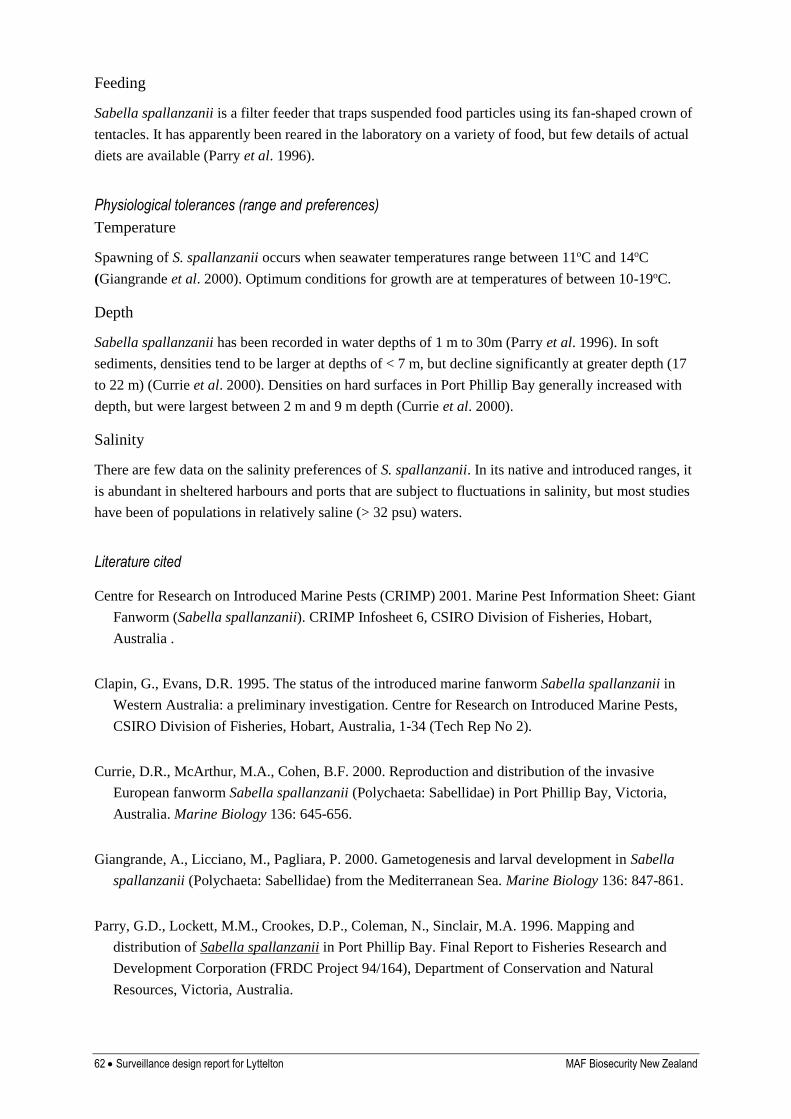
62 Surveillance design report for Lyttelton MAF Biosecurity New Zealand
Feeding
Sabella spallanzanii is a filter feeder that traps suspended food particles using its fan-shaped crown of
tentacles. It has apparently been reared in the laboratory on a variety of food, but few details of actual
diets are available (Parry et al. 1996).
Physiological tolerances (range and preferences)
Temperature
Spawning of S. spallanzanii occurs when seawater temperatures range between 11oC and 14oC
(Giangrande et al. 2000). Optimum conditions for growth are at temperatures of between 10-19oC.
Depth
Sabella spallanzanii has been recorded in water depths of 1 m to 30m (Parry et al. 1996). In soft
sediments, densities tend to be larger at depths of < 7 m, but decline significantly at greater depth (17
to 22 m) (Currie et al. 2000). Densities on hard surfaces in Port Phillip Bay generally increased with
depth, but were largest between 2 m and 9 m depth (Currie et al. 2000).
Salinity
There are few data on the salinity preferences of S. spallanzanii. In its native and introduced ranges, it
is abundant in sheltered harbours and ports that are subject to fluctuations in salinity, but most studies
have been of populations in relatively saline (> 32 psu) waters.
Literature cited
Centre for Research on Introduced Marine Pests (CRIMP) 2001. Marine Pest Information Sheet: Giant
Fanworm (Sabella spallanzanii). CRIMP Infosheet 6, CSIRO Division of Fisheries, Hobart,
Australia .
Clapin, G., Evans, D.R. 1995. The status of the introduced marine fanworm Sabella spallanzanii in
Western Australia: a preliminary investigation. Centre for Research on Introduced Marine Pests,
CSIRO Division of Fisheries, Hobart, Australia, 1-34 (Tech Rep No 2).
Currie, D.R., McArthur, M.A., Cohen, B.F. 2000. Reproduction and distribution of the invasive
European fanworm Sabella spallanzanii (Polychaeta: Sabellidae) in Port Phillip Bay, Victoria,
Australia. Marine Biology 136: 645-656.
Giangrande, A., Licciano, M., Pagliara, P. 2000. Gametogenesis and larval development in Sabella
spallanzanii (Polychaeta: Sabellidae) from the Mediterranean Sea. Marine Biology 136: 847-861.
Parry, G.D., Lockett, M.M., Crookes, D.P., Coleman, N., Sinclair, M.A. 1996. Mapping and
distribution of Sabella spallanzanii in Port Phillip Bay. Final Report to Fisheries Research and
Development Corporation (FRDC Project 94/164), Department of Conservation and Natural
Resources, Victoria, Australia.
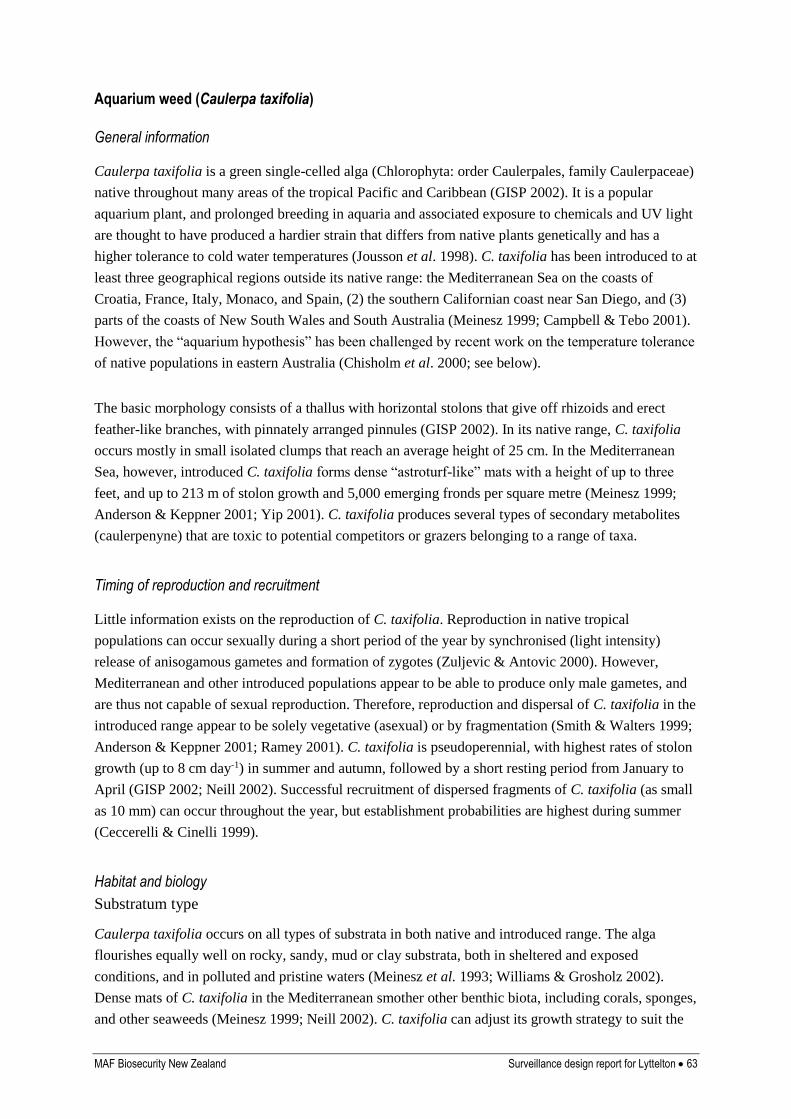
MAF Biosecurity New Zealand Surveillance design report for Lyttelton 63
Aquarium weed (Caulerpa taxifolia)
General information
Caulerpa taxifolia is a green single-celled alga (Chlorophyta: order Caulerpales, family Caulerpaceae)
native throughout many areas of the tropical Pacific and Caribbean (GISP 2002). It is a popular
aquarium plant, and prolonged breeding in aquaria and associated exposure to chemicals and UV light
are thought to have produced a hardier strain that differs from native plants genetically and has a
higher tolerance to cold water temperatures (Jousson et al. 1998). C. taxifolia has been introduced to at
least three geographical regions outside its native range: the Mediterranean Sea on the coasts of
Croatia, France, Italy, Monaco, and Spain, (2) the southern Californian coast near San Diego, and (3)
parts of the coasts of New South Wales and South Australia (Meinesz 1999; Campbell & Tebo 2001).
However, the “aquarium hypothesis” has been challenged by recent work on the temperature tolerance
of native populations in eastern Australia (Chisholm et al. 2000; see below).
The basic morphology consists of a thallus with horizontal stolons that give off rhizoids and erect
feather-like branches, with pinnately arranged pinnules (GISP 2002). In its native range, C. taxifolia
occurs mostly in small isolated clumps that reach an average height of 25 cm. In the Mediterranean
Sea, however, introduced C. taxifolia forms dense “astroturf-like” mats with a height of up to three
feet, and up to 213 m of stolon growth and 5,000 emerging fronds per square metre (Meinesz 1999;
Anderson & Keppner 2001; Yip 2001). C. taxifolia produces several types of secondary metabolites
(caulerpenyne) that are toxic to potential competitors or grazers belonging to a range of taxa.
Timing of reproduction and recruitment
Little information exists on the reproduction of C. taxifolia. Reproduction in native tropical
populations can occur sexually during a short period of the year by synchronised (light intensity)
release of anisogamous gametes and formation of zygotes (Zuljevic & Antovic 2000). However,
Mediterranean and other introduced populations appear to be able to produce only male gametes, and
are thus not capable of sexual reproduction. Therefore, reproduction and dispersal of C. taxifolia in the
introduced range appear to be solely vegetative (asexual) or by fragmentation (Smith & Walters 1999;
Anderson & Keppner 2001; Ramey 2001). C. taxifolia is pseudoperennial, with highest rates of stolon
growth (up to 8 cm day-1) in summer and autumn, followed by a short resting period from January to
April (GISP 2002; Neill 2002). Successful recruitment of dispersed fragments of C. taxifolia (as small
as 10 mm) can occur throughout the year, but establishment probabilities are highest during summer
(Ceccerelli & Cinelli 1999).
Habitat and biology
Substratum type
Caulerpa taxifolia occurs on all types of substrata in both native and introduced range. The alga
flourishes equally well on rocky, sandy, mud or clay substrata, both in sheltered and exposed
conditions, and in polluted and pristine waters (Meinesz et al. 1993; Williams & Grosholz 2002).
Dense mats of C. taxifolia in the Mediterranean smother other benthic biota, including corals, sponges,
and other seaweeds (Meinesz 1999; Neill 2002). C. taxifolia can adjust its growth strategy to suit the
64 Surveillance design report for Lyttelton MAF Biosecurity New Zealand
type of substratum available. For example, in the San Diego population, upright fronds developed
adventitious rhizoids and stolons when lying on sediments, and stolons when entwined within existing
algal canopy (Williams & Grosholz 2002).
Food preferences
Caulerpa taxifolia occurs in both polluted and nutrient-poor (e.g. the Mediterranean) habitats
(Meinesz 1993). The rhizoid system is used to take up major nutrients from the substratum (Anderson
& Keppner 2001), and the extensive biomass of C. taxifolia mats acts as a vast nutrient trap (P and N)
(Yip 2001). Non-native populations of C. taxifolia lack severe nutrient (P and N) limitation (Delgado
et al. 1996), which may be an important factor enabling it to out-compete native macrophytes.
Physiological tolerances (range & preferences)
Temperature
Mediterranean (introduced) populations of C. taxifolia have a temperature range of 9 – 32.5 0C. Some
reports claim observation of live plants at 5 0C (Makowka 2000). Survival without growth occurs at
temperatures of 10 – 12.5 0C; frond and stolon development commence at 15 and 17.5 0C,
respectively, with optimum growth occurring at 25 0C (Gillespie et al. 1997; Komatsu et al. 1997).
The lower temperature tolerance limit is thought to occur only in introduced strains, and to have
developed during decades of aquarium-breeding. It is common opinion that C. taxifolia within the
native range do not grow in water colder that 20 0C (Meinesz & Boudouresque 1996). However, recent
research from eastern Australia showed that native populations are able to survive temperatures of 11 0C for a period of four weeks, and that a temperature of 13 0C is sufficient to maintain existing tissue
biomass (Chisholm et al. 2000). Maximum growth occurs at > 20 0C (Komatsu et al. 1997).
Depth
Dense mats of C. taxifolia commonly occur at depths of 1 – 30 m, but the alga is known to occur down
to a depth of ~ 100 m (Meinesz 1999; Anderson & Keppner 2001; Yip 2001). See “Light” (below) for
more information.
Salinity
No specific information on C. taxifolia’s salinity tolerance range exists in the literature. Populations in
the San Diego area were sampled at 34 psu (Williams & Grosholz 2002). Congeners of C. taxifolia are
able to grow at salinities of 10 – 40 psu (C. racemosa; Carruthers et al. 1993) and 15 – 50 psu (C.
lentillifera; Liao & Cheng 1989).
Light
Stolon and frond growth occur at very low light levels (27 mol m-2 s-1); the optimal light intensity
ranges from 88 to 338 mol m-2 s-1 (Mediterranean population; no upper irradiation limit established;
Komatsu et al. 1997). Other studies report highest growth rates at an irradiance of 75 mol m-2 s-1
(Gillespie et al. 1997). C. taxifolia’s annual productivity pattern is less affected by fluctuations in light
and temperature than what has been reported from endemic seaweeds (Gacia et al. 1996).
Photosynthetic assays suggest depth limits for colonisation at 80 m (clear water) and 50 m (turbid
water) (Gacia et al. 1996). Mediterranean C. taxifolia’s maximum photoautotrophic growth limit was
determined as 24 m during winter. Although this correlates reasonably with the distribution of dense
MAF Biosecurity New Zealand Surveillance design report for Lyttelton 65
populations on the Monaco coastline, the limit is greatly inferior to the maximum reported depth of ~
100 m, and implies significant heterotrophic carbon acquisition at depths much greater than 24 m
(Chisholm & Jaubert 1997).
Methods of sampling
There appears to be no single “best” sampling method for C. taxifolia due to its occurrence on a range
of substrata. Sampling methods that have been used to detect Caulerpa and estimate its abundance
include visual transects, video transects, quadrat surveys (hard and soft substrata), grab samples (soft
bottom) or sled samples (soft bottom).
Literature cited
Anderson, L.W.J., Keppner, S. 2001. Caulerpa taxifolia: marine algal invader provokes quick
response in U.S. water. Aquatic Nuisance Species Digest 4(2): 1, 21-23.
Campbell, T. S., Tebo, M. 2001. Killer algae, Caulerpa taxifolia. Institute for Biological Invasions.
Invader of the Month. Available online at: http://invasions.bio.utk.edu/invaders/Caulerpa.html.
Carruthers, T.J.B., Walker, D.I., Huisman, J.M. 1993. Culture studies on two morphological types of
Caulerpa (Chlorophyta) from Perth, Western Australia, with a description of a new species.
Botanica Marina 36(6): 589-596.
Chisholm, J.R.M., Jaubert, J.M. 1997. Photoautotrophic metabolism of Caulerpa taxifolia
(Chlorophyta) in the NW Mediterranean. Marine Ecology Progress Series 153: 113-123.
Chisholm, J.R.M., Marchioretti, M., Jaubert, J.M. 2000. Effect of low water temperature on
metabolism and growth of a subtropical strain of Caulerpa taxifolia (Chlorophyta). Marine
Ecology Progress Series 201: 189-198.
Gacia, E., Rodriguez-Prieto, C., Delgado, O., Ballesteros, E. 1996. Seasonal light and temperature
responses of Caulerpa taxifolia from the northwestern Mediterranean. Aquatic Botany 53(3-4):
215-222.
Gillespie, R.D., Meinesz, A., Critchley, A.T. 1997. Growth responses of Caulerpa taxifolia
(Ulvophyceae, Chlorophyta) from the South African aquarist trade. A potential invasive of South
African coastal waters. South African Journal of Botany 63:480-483.
GISP 2002. Global Invasive Species Database. Available online at:
http://www.issg.org/database/species/ecology.asp?si=115&fr=1&sts=sss
Jousson, O., Pawlowski, J., Zaninetti, L., Meinesz, A., Boudouresque, C.F. 1998. Molecular evidence
for the aquarium origin of the green alga Caulerpa taxifolia introduced to the Mediterranean Sea.
Marine Ecology Progress Series 172: 275-280.
66 Surveillance design report for Lyttelton MAF Biosecurity New Zealand
Komatsu, T., Meinesz, A., Buckles, D. 1997. Temperature and light responses of alga Caulerpa
taxifolia introduced into the Mediterranean Sea. Marine Ecology Progress Series 146: 145-153.
Liao, I.-C., Cheng S.H. 1989. Studies on the salinity tolerance and growth of Caulerpa lentillifera at
different salinities and substratum types. Proceedings of the 2nd Asian Fisheries Forum, Tokyo. Pp.
399-402.
Makowka, J. 2000. Monterey Bay National Marine Sanctuary Fact Sheet: Caulerpa taxifolia. Report
to the Monterey Bay National Marine Sanctuary.
Meinesz, A. 1999. Killer Algae. Chicago University Press, Illinois. 360 pp.
Meinesz, A., Boudouresque C.F. 1996. On the origin of Caulerpa taxifolia in the Mediterranean Sea.
Sciences de la vie 319: 603-613.
Meinesz, A., de Vaugelas, J., Hesse1, B., Mari, A. 1993. Spread of the introduced tropical green alga
Caulerpa taxifolia in northern Mediterranean waters. Journal of Applied Phycology 5: 141-147.
Neill, K., 2002. Caulerpa taxifolia: an accident waiting to happen? Seafood New Zealand, March
issue, pp. 81-84.
Ramey, V. 2001. Caulerpa taxifolia. Available online at:
http://aquat1.ifas.ufl.edu/seagrant/cautax2.html.
Smith, C.M., Walters, L.J. 1999. Fragmentation as a strategy for Caulerpa species: fates of fragments
and implications for management of an invasive weed. Marine Ecology 20: 307-319.
Williams, S.L., Grosholz, E.D. 2002. Preliminary reports from the Caulerpa taxifolia invasion in
southern California. Marine Ecology Progress Series 233: 307-310.
Yip, M. 2001. Essay on Caulerpa taxifolia. Available online at:
http://www.sbg.ac.at/ipk/avstudio/pierofun/ct/caulerpa.htm.
Zuljevic, A., Antolic, B. 2000. Synchronous release of male gametes of Caulerpa taxifolia
(Caulerpales, Chlorophyta) in the Mediterranean Sea. Phycologia 39: 157-159.
MAF Biosecurity New Zealand Surveillance design report for Lyttelton 67
Clubbed tunicate (Styela clava)
General information
The clubbed tunicate, Styela clava, is a solitary ascidian native to the northwest Pacific from the Sea
of Okhotsk, southern Siberia, Japan, Korea and the coast of China south to Shanghai (Millar 1970,
Cohen 2005). It has a club-shaped body, up to 160 mm long, with a distinct stalk and basal disc with
which it attaches to the substratum. Small individuals (<30 mm) may lack a stalk (Lützen 1999). The
body wall (test) is leathery and variable in colour (commonly brown-white, yellow-brown or red-
brown), with conspicuous tubercles on the upper part and longitudinal ridges on the stalk.
Like all ascidians, Styela clava is hermaphroditic (but not self-fertile) and gametes are shed into the
water column. The “tadpole” larvae peculiar to ascidians are planktonic and hatch from the eggs after
ca 12 hr, although the duration of this period varies with egg size and water temperature (Svane &
Young 1989, cited in Bourque et al. 2005). The larvae are active for a similar period before settling to
the substratum (Holmes 1969, cited in Holmes 1976, Minchin et al. 2006). The larvae do not feed and
at first tend to swim upwards, though this behaviour later reverses (Millar 1970).
In those species of ascidians that have been studied, life-spans are generally 12-20 months, although
some may live for several years (Millar 1970). Minchin et al. (2006) stated that the size of individual
Styela clava (75-180 mm) collected in Ireland “suggests that they were between one and two years
old”, although they did not give any reason for this conclusion. Individuals that settled in the Limfjord,
Denmark in mid-August grew to 17-48mm by the end of October (Lützen 1999), after which growth
ceased during the colder months. Considerable mortality of smaller individuals also occurred during
winter. Survivors reached lengths of 50-75 mm by June and became fully mature, spawning in July
and August at 75-95 mm. Many small (12-40-mm-long) individuals were also present in early and
mid-summer, representing late settlers from the previous year. These, and some of the larger
individuals, probably survive a second winter to reach a length of 110-120 mm and reproduce for a
second time aged 1.75-2 years old. The lifespan of individuals in southern England was found to be
shorter, only rarely exceeding 15 months (Holmes 1969, cited in Lützen 1999). Death may results
from senescence, predation or adverse environmental conditions. Reported predators of juvenile Styela
clava include gastropods (Mitrella lunata in eastern North America) and fish (NIMPIS 2002).
The first recorded occurrences of Styela clava outside its native range were at Newport Bay (1932)
and Elkhorn Slough (1935, a single specimen and no longer present at this site), both in California
(Cohen 2005). It subsequently spread along the Pacific coast of North America, north as far as Puget
Sound (collected in 1998) and Vancouver Island (collected in 1994) and south as far as Baja California
(collected at Ensenada in 2000). On the east coast of North America, it was collected in Massachusetts
in 1970, New York in 1972, Connecticut, Maine, New Hampshire and Rhode Island in the 1980s and,
more recently, in New Brunswick and Prince Edward Island (1998) (Cohen 2005).
Styela clava was recorded in southwest England in 1953 (Carlisle 1954, Houghton & Millar 1960,
both cited in Eno et al. 1997) and has since spread to northwest England, southwest Scotland and
southern Ireland (collected 1972: Minchin & Duggan 1988). It has also been found in France (1968),
68 Surveillance design report for Lyttelton MAF Biosecurity New Zealand
the Netherlands (1974), Denmark (1978-1979), Germany (1997), Portugal (2003) and Spain (2004)
(Lützen 1999, Cohen 2005, Davis & Davis 2005).
The first record of Styela clava in Australia was in 1972 in Port Phillip Bay, Victoria (Holmes 1976)
and in 1977 it was reported from Sydney Harbour, New South Wales (Cohen 2005). It was first
recorded in New Zealand in the Viaduct Harbour, Auckland in August 2005 and there appear to be
well-established populations in the Waitemata Harbour, Hauraki Gulf and Firth of Thames (Gust et al.
2006a). More localised populations have also been found in Lyttelton Port, Lyttelton Marina,
Tutukaka and Opua Marinas (Northland) (Gust et al. 2006a and b) and Nelson Port (Morrisey et al.
2006).
Timing of reproduction and recruitment
Reproduction is usually restricted to warmer seasons in ascidians living in temperate and cold seas
(Millar 1970). Holmes (1969, cited in Holmes 1976) reported that Styela clava bred throughout all but
the coldest 2-3 months in southern England, with a marked peak of settlement in mid-late summer
(late July-early September). A similar pattern of settlement was observed in the Limfjord, Denmark
(Lützen & Sørensen 1993, cited in Lützen 1999). Monthly sampling of S. clava in southern Ireland
(Parker et al. 1999) showed gametogenesis (presence of ripe gametes in the gonads) from February-
November, with a peak in August-October, and spawning in September-October (when average water
temperatures were 15.2oC (±0.4 SD) – 14.1oC (±1.3 SD)).
Spawning in ascidians generally occurs in response to a period of light following a period of darkness
(Svane & Young 1989, cited in Bourque et al. 2005). The rapidity of response to this period of light
varies among species and, therefore, not all species spawn at the same time of day. Time of spawning
may also vary among populations of the same species from different locations (Bourque et al. 2005).
In Styela plicata, the duration of the light period required to stimulate spawning decreases with
increase in the preceding period of darkness (West & Lambert 1976, cited in Bourque et al. 2005).
Light intensity may also affect the duration of the light period prior to spawning (Forward et al. 2000,
cited in Bourque et al. 2005). Bourque et al. (2005) found that concentrations of larvae of Styela clava
in the upper 1-m of the water column at a field location in Prince Edward Island, eastern Canada,
peaked around noon. They pointed out, however, that timing of peak concentrations of larvae may
vary among locations and over time at the same location, in response to factors such as day-length,
water temperature and light intensity. Cohen 2005 and ISSG Global Invasive Species Database 2006
indicate that Styela clava is only able to spawn at water temperatures above 15oC and salinities above
25-26 psu (no sources are given for this information).
Larvae of Styela clava do not usually travel more than a few centimetres by active swimming
(Minchin et al. 2006). Consequently they tend to congregate close to the parent population, although
they can be passively dispersed over distances covered by 1-2 tidal excursions (equivalent to the
duration of the larval period). Larvae are negatively buoyant but negatively geotactic and positively
phototactic, particular at higher hydrostatic pressures, and consequently tend to settle near the water
surface (Davis 1997, cited in Minchin et al. 2006). Suitable conditions for establishment occur in
sheltered localities with salinities of >22 psu and temperatures ≥16oC for several weeks (Minchin et al.
2006). Individuals apparently reach maturity at 3-10 months (Cohen 2005).
MAF Biosecurity New Zealand Surveillance design report for Lyttelton 69
Habitat and biology
Styela clava occurs in low wave-energy environments and sheltered embayments from the upper
sublittoral zone to at least 25 m depth (ISSG Global Invasive Species Database 2006). It is especially
abundant 10-200 cm below the sea surface (Lützen 1999), and the fact that it has been recorded up to
30 cm above the level of extreme low water of spring tides in southern England (Holmes & Coughlan
1975, cited by Lützen 1999) suggests that it is able to withstand a degree of regular exposure to air. It
can apparently survive for up to 3 days out of water under cool, damp conditions (Lützen & Sørensen
1993, cited in Minchin et al. 2006). Based on a survey of the distribution of S. clava in harbours of the
Southern Californian Bight, Lambert & Lambert (2003) noted that the species was consistently more
abundant closer to the entrances to bays, where water currents were stronger and that it differed from
S. plicata in this respect.
Substratum type
Natural substrata for attachment of Styela clava include rocks, the blades of macroalgae and the shells
of live and dead bivalves (Lützen 1999, NIMPIS 2002, Bourque et al. 2005). S. clava is also found on
a range of artificial structures, including floating pontoons, tyre fenders, vessels, buoys and anchors,
and diverse materials, including concrete, cement, wood, ropes and the steel or fibreglass hulls of
vessel (Bourque et al. 2005, Gust et al. 2005, 2006a, ISSG Global Invasive Species Database 2006,
Minchin et al. 2006). In a survey of harbours in southern California, Fay & Johnston (1971, cited in
Lambert & Lambert 2003) recorded Styela clava only on floats and pilings and not on any natural
substrata.
According to Holmes (1976), Styela clava colonises only those surfaces bearing a well-developed
epibiota. It can attach to larger individuals of its own species and individual S. clava may be
extensively fouled with smaller tunicates of their own or other species, algae, sponges, hydroids and
bryozoans (Lützen 1999, Cohen 2005, Minchin et al. 2006).
On natural substrata, such as rocks or bivalve shells, Styela clava is reported to reach population
densities of 50-100 m-2 (Lützen 1999). On artificial substrata, however, much higher densities have
been reported (500-1500 m-2: Holmes 1976, NIMPIS 2002).
In New Zealand Styela clava has been found attached to floating pontoons, wooden pier piles,
suspended mooring lines and vessel hulls (Gust et al. 2006a). It has also been reported attached to
dead bivalve shells on a muddy shore in the Tamaki Estuary, Auckland (Chris Hickey, NIWA, pers.
comm.).
Food preferences
Styela clava is a suspension feeder, feeding on suspended, particulate matter, such as phytoplankton,
zooplankton and organic detritus, filtered from water pumped through its branchial sac.
70 Surveillance design report for Lyttelton MAF Biosecurity New Zealand
Physiological tolerances (range and preferences)
Temperature
Styela clava is reportedly able to tolerate temperatures ranging from –2 to 23oC (Minchin et al. 2006).
Holmes (1969, cited in Holmes 1976) described a population living in southern England, where water
temperature raged from 2-23oC, and breeding in all but the coldest 2-3 months of the year. On the
Pacific coast of North America it has been found at water temperatures ranging from 11-27oC (Cohen
2005). Larvae are able to survive temperatures from 10 - 30oC (Boothroyd et al. 2003).
Parker et al. (1999) reported no evidence of gametogenesis in individuals sampled in early February in
southern Ireland, when the water temperature was 3-4oC, but small numbers of ripe gametes in
individuals sampled in the middle of the same month, when the temperature had risen to 8oC. There
was evidence that gonad maturation occurred at temperatures below 8oC. Gametogenesis and
spawning peaked in August-October, when water temperatures ranged from 14-18oC.
Depth
The reported depth range for Styela clava ranges from just above the level of extreme low water of
spring tides (in southern England: Holmes & Coughlan 1975, cited by Lützen 1999) to at least 25 m
(NIMPIS 2002). Lützen (1999) described S. clava as a “predominantly littoral species, which is
especially abundant 10-200 cm below the sea surface in areas without tides or when attached to
floating objects….The species may extend to depths of 15-25 m…but a record of 40 m depth…is
probably exceptional”.
Salinity
Styela clava appears to avoid areas with estuarine conditions (Lützen 1999). Sims (1984, cited in
Lützen 1999) found that Californian specimens showed poor vital functions after 3-d immersion in
26.5 psu seawater. This corresponds with Lambert & Lambert’s (2003) observation of die-offs of
S. clava on floating structures in southern California after heavy rain (followed by rapid
recolonisation). They also cited an earlier study (MacGinitie 1939) in the same area that found
complete mortality of S. clava below a sharp halocline that formed at a depth of ca 2.2 m following
heavy rain. Below this depth there was no evidence of any mortality. Individuals can, however,
survive shorter periods of salinity as low as 8 psu, presumably by closing their siphons (Sims 1984,
cited in Lützen 1999).
Other populations of Styela clava may be more tolerant of lower salinities than those studied in
California. In the eastern Limfjord (Denmark), populations exist in salinities averaging 26-28 psu,
with decreases to <20 psu for periods of several days (Lützen 1999). Individuals experimentally
exposed to stepwise decreases in salinity from 31-18 psu showed >50% survival for 40 d (at 12oC) and
50% survival when the salinity was further reduced to 16 psu (Lützen & Sørensen 1993, cited in
Lützen 1999). Lützen (1999) cited a report that larvae of S. clava from the Sea of Japan were able to
complete metamorphosis at salinities of 20-32 psu, but that <18 psu was “deleterious” (no definition
given). Cohen (2005) stated that adult S. clava die in salinities <10 psu, but did not give a source for
this information.

MAF Biosecurity New Zealand Surveillance design report for Lyttelton 71
In summary, salinity tolerance of adults and larvae appears to extend as low as 18 psu for extended
periods (and much lower for short periods), but may be dependent on the salinity regime to which the
population has previously been exposed.
Route of introduction
Styela clava may have reached the Pacific coast of North America as fouling on ships’ hulls, but it
may also have been introduced as fouling on imported live oysters (Cohen 2005). It is known to occur
on oysters (Crassostrea gigas) in Japanese oyster farms, and oysters from Japanese farms were
transplanted to Elkhorn Slough (California) in 1929-1934, roughly coincident with its date of first
detection in California (1932). From Elkhorn Slough it could have been transported to other parts of
California as fouling on coastal shipping or via further transfer of oyster stock (including its recent
appearance in Humboldt Bay: Cohen 2005).
The introduction of Styela clava to southern England is commonly ascribed to fouling on naval vessels
returning from the Korean War in 1952 (Minchin & Duggan 1988, cited in Minchin et al. 2006),
having acquired fouling in the Yellow Sea. It is likely to have spread from the original site of
introduction to other parts of the United Kingdom and continental Europe on coastal shipping or,
locally, by dispersal of eggs and larvae (Lützen 1999). It has also been suggested that S. clava reached
the Danish coast, where it was first recorded on an oyster bed in the Limfjord, attached to oysters
imported from the English Channel and re-laid in the Limfjord (Lützen 1999). Oyster spat imported
from Japan in the 1970s, or transplanted within the English Channel region, may have contributed to
the establishment of Dutch and French populations (Lützen 1999).
Given the distances involved, the introduction of Styela clava to Australia and New Zealand is likely
to have occurred via fouling on ships’ hulls, either from its native range or from introduced
populations in Europe or North America. In view of the disjunct distribution of S. clava in New
Zealand’s North and South Islands, several inoculation events may have occurred (Gust et al. 2006a).
Research is currently underway to determine the genetic relationships among populations of S. clava
in New Zealand.
Minchin et al. (2006) noted that S. clava tend to be stripped from ships’ hulls at speeds above ca 5 kt,
unless they occur in more protected habitats such as sea-chests, thruster tubes, or in the lee of
stabilisers and other structures on the hull. Lützen (1999) also described S. clava as rheophobic (i.e.
avoiding strong currents), reducing the likelihood of individuals surviving as fouling on exposed parts
of the hulls of rapid vessels in continuous service. Attachment to drifting macroalgae provides another
potential means of dispersal. Lützen (1999) stated that fronds of Sargassum muticum (a macroalga
introduced to Europe from Asia in the early 1970s) with Styela clava attached are often washed up on
shores in the Limfjord. Fronds become detached from their holdfasts towards the end of the growth
cycle and can float for “considerable distances”.
Davis & Davis (2004) suggested that a combination of transport mechanisms, including translocation
on oyster shell, dispersal on flotsam such as drift macroalgae, fouling on vessel hulls, transport of eggs
and larvae in ballast water, and fouling of sea-chests are probably required to explain the present
distribution of S. clava. Davis (2005) suggested that sea-chests were potentially of greatest importance
72 Surveillance design report for Lyttelton MAF Biosecurity New Zealand
because they offer a means of transport for established colonies of individuals, and translocated
colonies are more likely to establish new populations than a single inoculum of larvae.
Slow-moving and towed vessels are particularly likely mechanisms of introduction, because of the
reduced likelihood of individuals being removed from the hull by water currents during transit. Such
vessels may also spend longer periods moored in ports of origin and destination than vessels in
continuous service. Specimens of S. clava found on vessels in New Zealand have been on a tug
(Lyttelton), recreational launches and yachts (Auckland, including one that subsequently travelled to
Waikawa Marina, Picton, where it was found to harbour a single individual) and fishing vessels
(Nelson) that had been berthed for long periods of time (possibly months in one case, years in
another). Of these, recreational vessels are perhaps the most likely to have been the vector of
inoculation in the ports where they were found, as the other types of vessel tend to spend most of their
time in their home port.
Methods of sampling
Lambert & Lambert (2003) sampled harbours by examining the sides and bottom edges of
pontoons and vessels in marinas, manually removing clumps of fouling organisms to arms’
depth, and recovering 5-m long ropes deployed 4 years previously.
Minchin et al. (2006) sampled floating pontoons, supporting piles and quay walls by feeling
for specimens by hand, or by scraping adhered biota from the surfaces.
Gust et al. (2005, 2006a,b) employed above-water searches from shore or boat to detect
S. clava on pontoons, pilings, breakwalls, buoys, heavily-fouled vessels and mooring lines.
Submerged ropes were pulled up and examined. Selection of vessels to search was based on a
risk-profiling approach based on empirical relationships between level of fouling and
probability that the fouling assemblage includes solitary ascidians.
Gust et al. (2005, 2006a,b) also used in-water diver searches of the undersides of pontoons,
wharf piles and breakwalls. For safety reasons, and because previous studies had shown that
70% of all S. clava detected were found within this depth, searches were confined to the upper
5 m of the water column.
The probability of S. clava being detected by searchers when it is present can be estimated for
each type of substratum in a given harbour. These estimates require information on the
proportion of the total area of the substrate searched and the sensitivity of the search method
under prevailing environmental conditions, particularly water clarity (Gust et al. 2006a,b).
Sensitivity, the ability of the searchers to detect S. clava when present, can be determined by
searches for experimentally-deployed mimics of the organism. Details of the methods are
given in Gust et al. (2006a,b).
MAF Biosecurity New Zealand Surveillance design report for Lyttelton 73
Literature cited
Boothroyd, F.A., MacNair, N.G., Landry, T., Locke, A., Davidson, T.J. 2002. Dealing with an aquatic
invader: the clubbed tunicate (Styela clava) in Prince Edward Island waters. 19th Annual Meeting
of the Aquaculture Association of Canada, 17-20 September 2002, Charlottetown, Prince Edward
Island, Canada.
http://www.aquacultureassociation.ca/ac02/abstracts/FIMF%20non%20indigenous%20species.htm,
accessed 4 August 2006.
Bourque, D, MacNair, N., LeBlanc, A., Landry, T., Miron, G. 2005. Preliminary study of the diel
variation of ascidian larvae concentrations in Prince Edward Island. Canadian Technical Report of
Fisheries and Aquatic Sciences No. 2571, 16pp.
Cohen, Andrew N. 2005 Guide to the Exotic Species of San Francisco Bay. San Francisco Estuary
Institute, Oakland, California, USA. www.exoticsguide.org, accessed 4 August 2006.
Davis, M. 2005. Predicting successful invasions of non-indigenous species. American Society of
Limnology and Oceanography Summer Meeting 9-24 June 2005, Santiago de Compostela, Spain.
http://aslo.org/meetings/santiago2005/abstracts/621.htm, accessed 11 August 2006.
Davis, M., Davis, M. 2004. The role of man-aided dispersal in the spread of the immigrant Styela
clava Herdman, 1882. Journal of Marine Science and Environment 1: 18-24.
Davis, M.H, Davis, M.E. 2005. Styela clava (Tunicata: Ascidiacea) – a new addition to the fauna of
the Portuguese coast. Journal of the Marine Biological Association of the U.K. 85: 403-404.
Eno, N.C., Clark, R.A., Sanderson, W.G. 1997. Non-native marine species in British waters: a review
and directory. Joint Nature Conservation Committee, Peterborough, United Kingdom, 135pp.
ISSG Global Invasive Species Database 2006. IUCN/SSC Invasive Species Specialist Group
http://www.issg.org/database, accessed 4 August 2006.
Gust, N., Floerl, O., Inglis, G., Miller, S., Fitridge, I., Hurren, H. 2005. Rapid delimitation survey of
Styela clava in the Viaduct Harbour and Freemans Bay, Auckland. NIWA Christchurch Client
Report No. CHC2005-147, prepared for MAF Biosecurity New Zealand, November 2005, 45pp.
Gust, N., Inglis, G., Peacock, L., Miller, S., Floerl, O., Hayden, B., Fitridge, I., Hurren, H., Johnston,
O. 2006a. Rapid nationwide delimitation surveys for Styela clava. NIWA Christchurch Client
Report No. CHC2006-024, prepared for MAF Biosecurity New Zealand, February 2006, 81pp.
Gust, N., Peacock, L., Inglis, G., Miller, S., Floerl, O., Woods, C., Anderson, O. 2006b. Delimitation
surveys for Styela clava at six locations. NIWA Christchurch Client Report No. CHC2006-125,
prepared for MAF Biosecurity New Zealand, August 2006, 53pp.
74 Surveillance design report for Lyttelton MAF Biosecurity New Zealand
Holmes, N. 1976. Occurrence of the ascidian Styela clava Herdman in Hobsons Bay, Victoria: a new
record for the southern hemisphere. Proceedings of the Royal Society of Victoria 88: 115-116.
Lambert, C.C., Lambert, G. 2003. Persistence and differential distribution of nonindigenous ascidians
in harbors of the Southern Californian Bight. Marine Ecology Progress Series 259: 145-161.
Lützen, J. 1999. Styela clava Herdman (Urochordata, Ascidiacea), a successful immigrant to north
west Europe: ecology, propagation and chronology of spread. Helgoländer Meeresuntersuchungen
52: 383-391.
Millar, R.H. 1970. British ascidians. Synopses of the British Fauna No. 1, The Linnean Society of
London/Academic Press, London, 92pp.
Minchin, D., Davis, M.H., Davis, M.E. 2006. Spread of the Asian tunicate Styela clava Herdman 1882
to the east and south-west coasts of Ireland. Aquatic Invasions 1: 91-96.
Minchin, D., Duggan, C.B. 1988. The distribution of the exotic ascidian, Styela clava Herdman, in
Cork Harbour. Irish Naturalists Journal 22: 388-393.
Morrisey, D., Bradley, A., Brown, S., Cairney, D., Davey, N., Peacock, L., Rodgers, K. 2006. Rapid
survey for Styela clava in the Slipway Basin, Nelson Port. NIWA Nelson Client Report No.
NEL2006-009, prepared for MAF Biosecurity New Zealand, September 2006, 16pp.
NIMPIS 2002. Styela clava species summary. National Introduced Marine Pest Information System.
Hewitt, C.L., Martin, R.B., Sliwa, C., McEnnulty, F.R., Murphy, N.E., Jones, T., Cooper, S (Eds).
Web publication http://crimp.marine.csiro.au/nimpis, accessed 4 August 2006.
Parker, L.E., Culloty, S., O’Riordan, R.M., Kelleher, B., Steele, S., Van der Velde, G. 1999.
Preliminary study on the gonad development of the exotic ascidian Styela clava in Cork Harbour,
Ireland. Journal of the Marine Biological Association of the U.K. 79: 1141-1142.
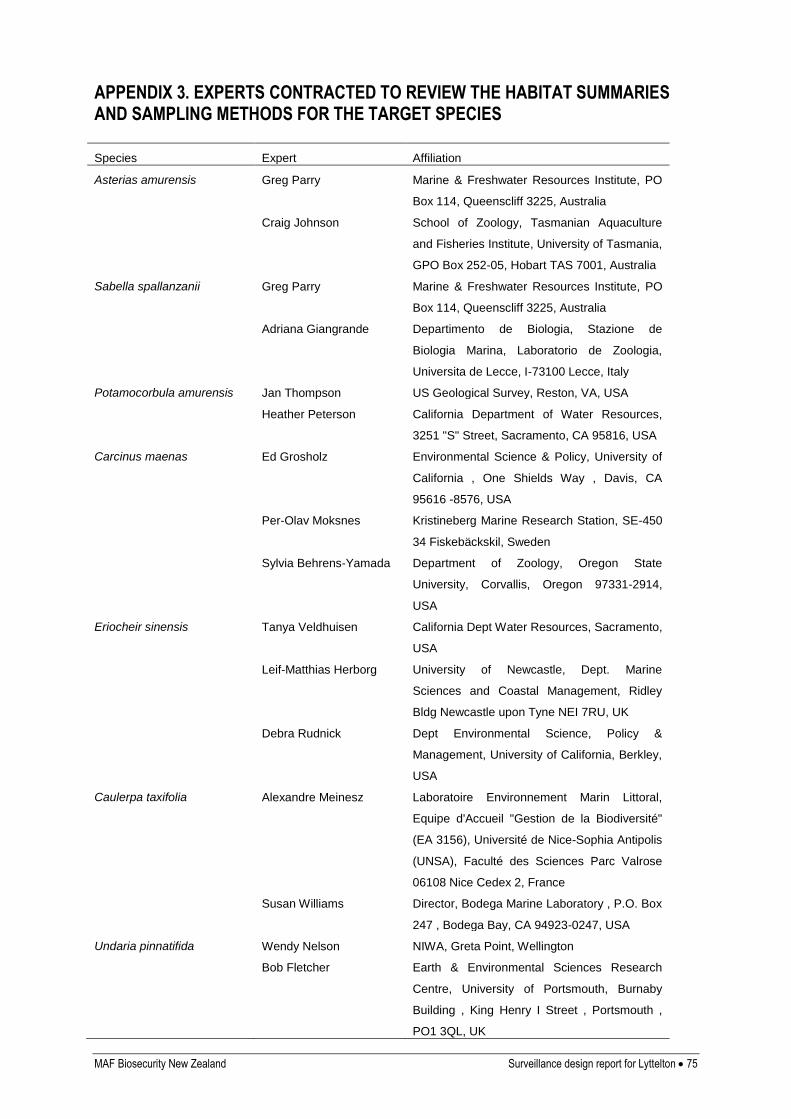
MAF Biosecurity New Zealand Surveillance design report for Lyttelton 75
APPENDIX 3. EXPERTS CONTRACTED TO REVIEW THE HABITAT SUMMARIES AND SAMPLING METHODS FOR THE TARGET SPECIES
Species Expert Affiliation
Asterias amurensis Greg Parry Marine & Freshwater Resources Institute, PO
Box 114, Queenscliff 3225, Australia
Craig Johnson School of Zoology, Tasmanian Aquaculture
and Fisheries Institute, University of Tasmania,
GPO Box 252-05, Hobart TAS 7001, Australia
Sabella spallanzanii Greg Parry Marine & Freshwater Resources Institute, PO
Box 114, Queenscliff 3225, Australia
Adriana Giangrande Departimento de Biologia, Stazione de
Biologia Marina, Laboratorio de Zoologia,
Universita de Lecce, I-73100 Lecce, Italy
Potamocorbula amurensis Jan Thompson US Geological Survey, Reston, VA, USA
Heather Peterson California Department of Water Resources,
3251 "S" Street, Sacramento, CA 95816, USA
Carcinus maenas Ed Grosholz Environmental Science & Policy, University of
California , One Shields Way , Davis, CA
95616 -8576, USA
Per-Olav Moksnes Kristineberg Marine Research Station, SE-450
34 Fiskebäckskil, Sweden
Sylvia Behrens-Yamada Department of Zoology, Oregon State
University, Corvallis, Oregon 97331-2914,
USA
Eriocheir sinensis Tanya Veldhuisen California Dept Water Resources, Sacramento,
USA
Leif-Matthias Herborg University of Newcastle, Dept. Marine
Sciences and Coastal Management, Ridley
Bldg Newcastle upon Tyne NEI 7RU, UK
Debra Rudnick Dept Environmental Science, Policy &
Management, University of California, Berkley,
USA
Caulerpa taxifolia Alexandre Meinesz Laboratoire Environnement Marin Littoral,
Equipe d'Accueil "Gestion de la Biodiversité"
(EA 3156), Université de Nice-Sophia Antipolis
(UNSA), Faculté des Sciences Parc Valrose
06108 Nice Cedex 2, France
Susan Williams Director, Bodega Marine Laboratory , P.O. Box
247 , Bodega Bay, CA 94923-0247, USA
Undaria pinnatifida Wendy Nelson NIWA, Greta Point, Wellington
Bob Fletcher Earth & Environmental Sciences Research
Centre, University of Portsmouth, Burnaby
Building , King Henry I Street , Portsmouth ,
PO1 3QL, UK
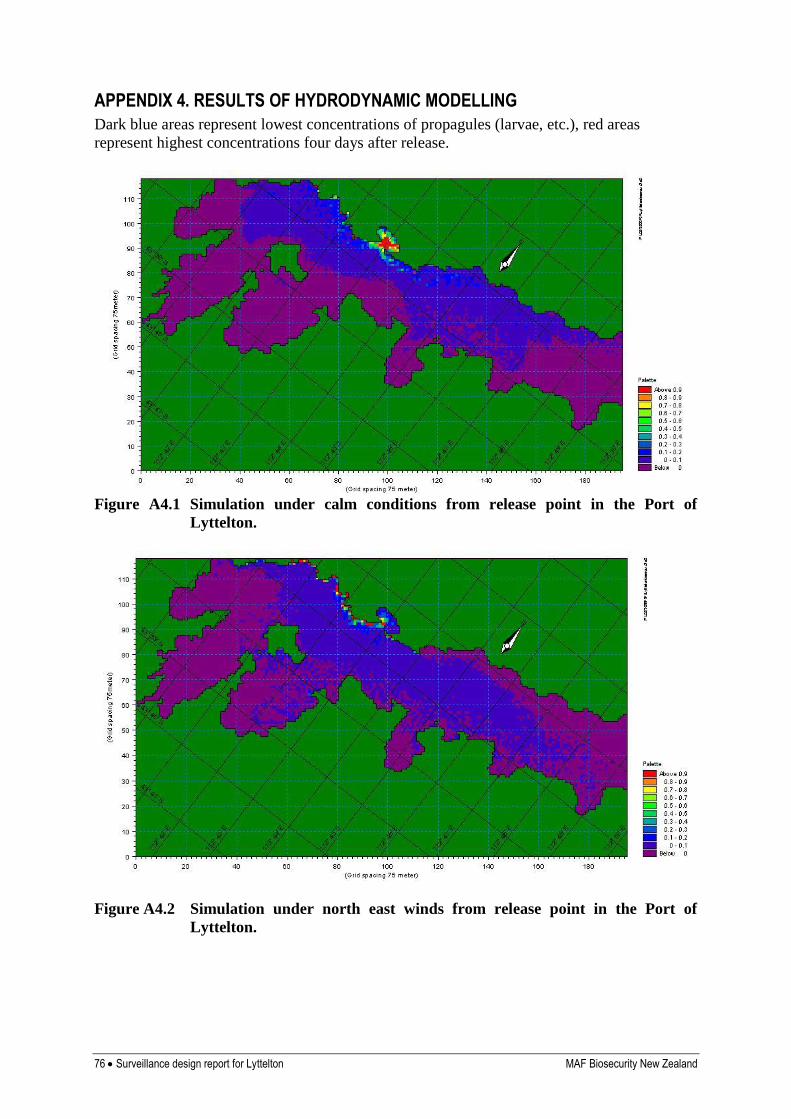
76 Surveillance design report for Lyttelton MAF Biosecurity New Zealand
APPENDIX 4. RESULTS OF HYDRODYNAMIC MODELLING
Dark blue areas represent lowest concentrations of propagules (larvae, etc.), red areas
represent highest concentrations four days after release.
Figure A4.1 Simulation under calm conditions from release point in the Port of
Lyttelton.
Figure A4.2 Simulation under north east winds from release point in the Port of
Lyttelton.
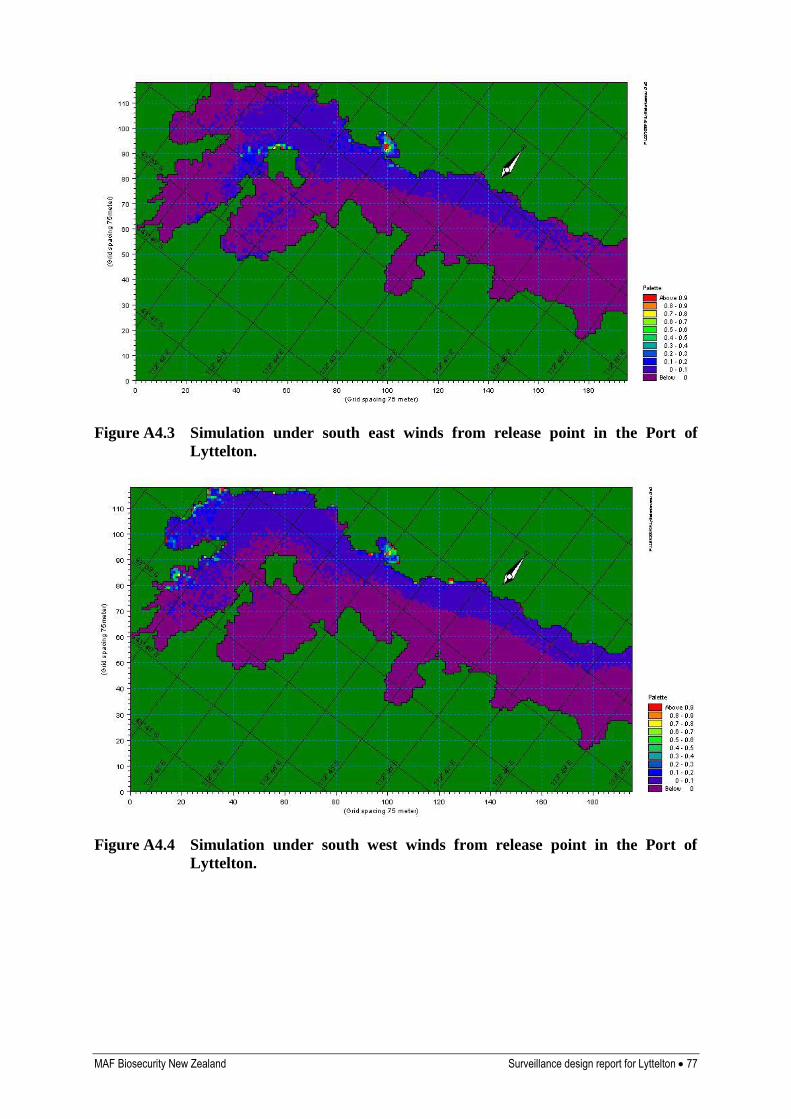
MAF Biosecurity New Zealand Surveillance design report for Lyttelton 77
Figure A4.3 Simulation under south east winds from release point in the Port of
Lyttelton.
Figure A4.4 Simulation under south west winds from release point in the Port of
Lyttelton.
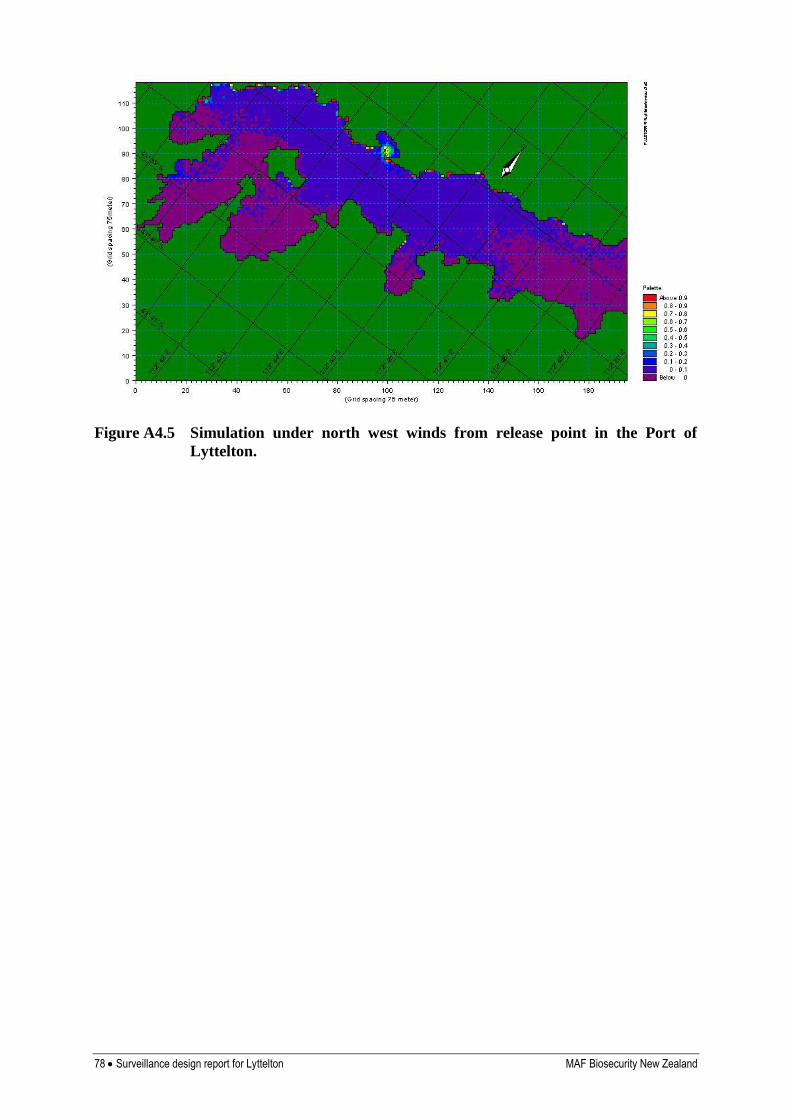
78 Surveillance design report for Lyttelton MAF Biosecurity New Zealand
Figure A4.5 Simulation under north west winds from release point in the Port of
Lyttelton.
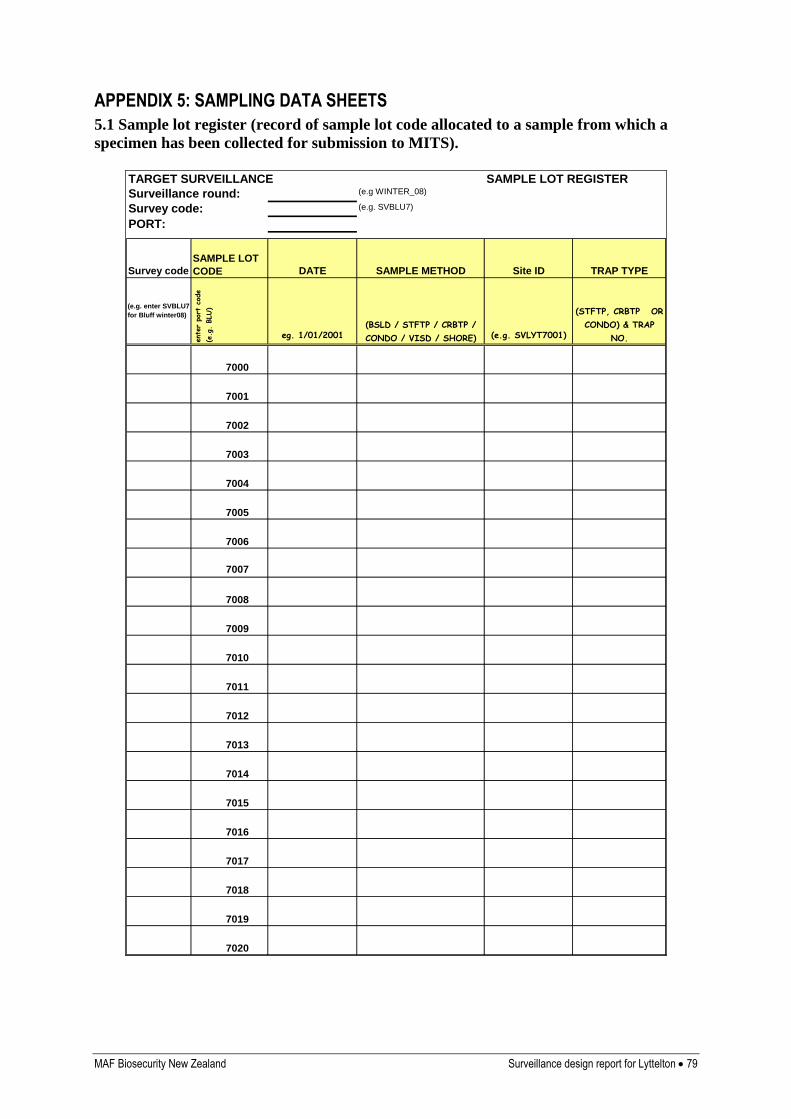
MAF Biosecurity New Zealand Surveillance design report for Lyttelton 79
APPENDIX 5: SAMPLING DATA SHEETS
5.1 Sample lot register (record of sample lot code allocated to a sample from which a
specimen has been collected for submission to MITS).
TARGET SURVEILLANCE SAMPLE LOT REGISTER
Surveillance round: (e.g WINTER_08)
Survey code: (e.g. SVBLU7)
PORT:
Survey code DATE SAMPLE METHOD Site ID TRAP TYPE
eg. 1/01/2001 (e.g. SVLYT7001)
7000
7001
7002
7003
7004
7005
7006
7007
7008
7009
7010
7011
7012
7013
7014
7015
7016
7017
7018
7019
7020
(e.g. enter SVBLU7
for Bluff winter08)
SAMPLE LOT
CODE
ent
er
port
cod
e
(e.g
. BLU)
(BSLD / STFTP / CRBTP /
CONDO / VISD / SHORE)
(STFTP, CRBTP OR
CONDO) & TRAP
NO.

80 Surveillance design report for Lyttelton MAF Biosecurity New Zealand
5.2 Image register (record of identity of specimen that has been photographed to aid identification).
TARGET SURVEILLANCE IMAGE REGISTER
Surveillance round & survey code: (e.g WINTER08 & SVBLU7)
PORT:
DATE IMAGE NO.
SAMPLE LOT
CODE TAXA NOTES
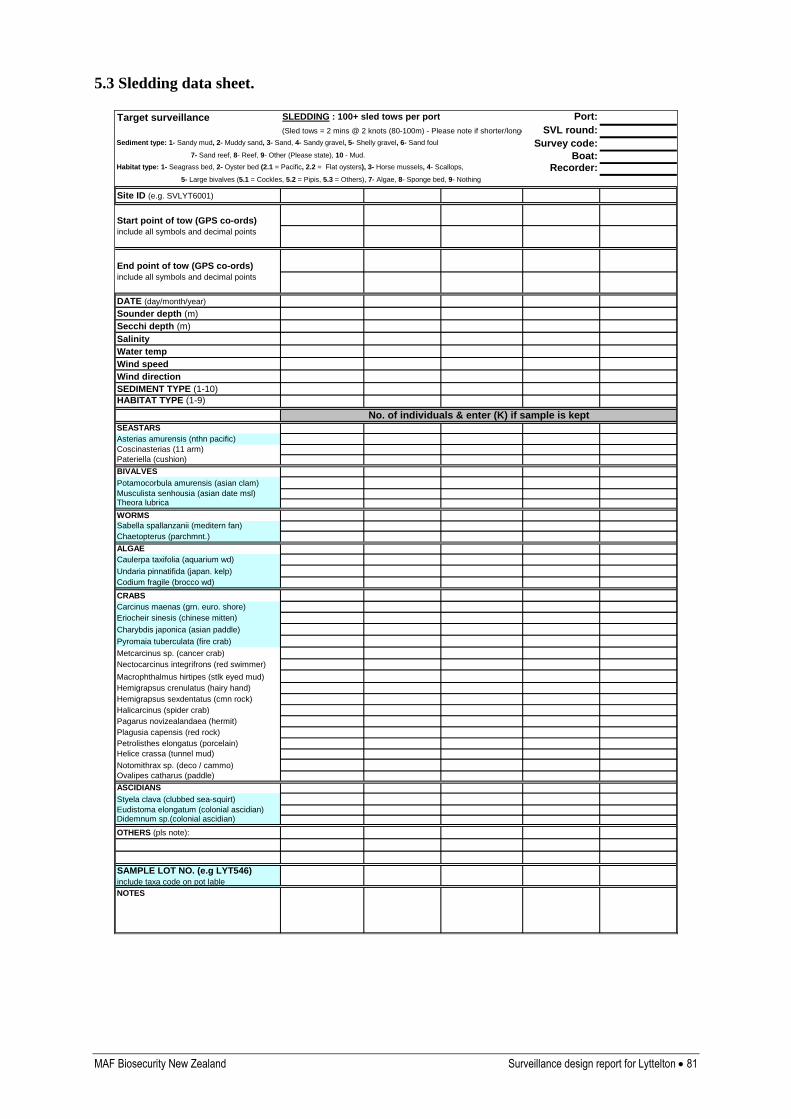
MAF Biosecurity New Zealand Surveillance design report for Lyttelton 81
5.3 Sledding data sheet.
Target surveillance SLEDDING : 100+ sled tows per port Port:
(Sled tows = 2 mins @ 2 knots (80-100m) - Please note if shorter/longer) SVL round:Sediment type: 1- Sandy mud, 2- Muddy sand, 3- Sand, 4- Sandy gravel, 5- Shelly gravel, 6- Sand foul Survey code: 7- Sand reef, 8- Reef, 9- Other (Please state), 10 - Mud. Boat:Habitat type: 1- Seagrass bed, 2- Oyster bed (2.1 = Pacific, 2.2 = Flat oysters), 3- Horse mussels, 4- Scallops, Recorder: 5- Large bivalves (5.1 = Cockles, 5.2 = Pipis, 5.3 = Others), 7- Algae, 8- Sponge bed, 9- Nothing
Site ID (e.g. SVLYT6001)
DATE (day/month/year)
Sounder depth (m)
Secchi depth (m)
Salinity
Water temp
Wind speed
Wind direction
SEDIMENT TYPE (1-10)
HABITAT TYPE (1-9)
SEASTARS
Asterias amurensis (nthn pacific)
Coscinasterias (11 arm)
Pateriella (cushion)
BIVALVES
Potamocorbula amurensis (asian clam)
Musculista senhousia (asian date msl)Theora lubrica
WORMS
Sabella spallanzanii (meditern fan)
Chaetopterus (parchmnt.)
ALGAE
Caulerpa taxifolia (aquarium wd)
Undaria pinnatifida (japan. kelp)
Codium fragile (brocco wd)
CRABS
Carcinus maenas (grn. euro. shore)
Eriocheir sinesis (chinese mitten)
Charybdis japonica (asian paddle)
Pyromaia tuberculata (fire crab)
Metcarcinus sp. (cancer crab)
Nectocarcinus integrifrons (red swimmer)
Macrophthalmus hirtipes (stlk eyed mud)
Hemigrapsus crenulatus (hairy hand)
Hemigrapsus sexdentatus (cmn rock)
Halicarcinus (spider crab)
Pagarus novizealandaea (hermit)
Plagusia capensis (red rock)
Petrolisthes elongatus (porcelain)
Helice crassa (tunnel mud)
Notomithrax sp. (deco / cammo)
Ovalipes catharus (paddle)
ASCIDIANS
Styela clava (clubbed sea-squirt)
Eudistoma elongatum (colonial ascidian)Didemnum sp.(colonial ascidian)
OTHERS (pls note):
SAMPLE LOT NO. (e.g LYT546)
include taxa code on pot lable
Start point of tow (GPS co-ords)
include all symbols and decimal points
End point of tow (GPS co-ords)
include all symbols and decimal points
No. of individuals & enter (K) if sample is kept
NOTES
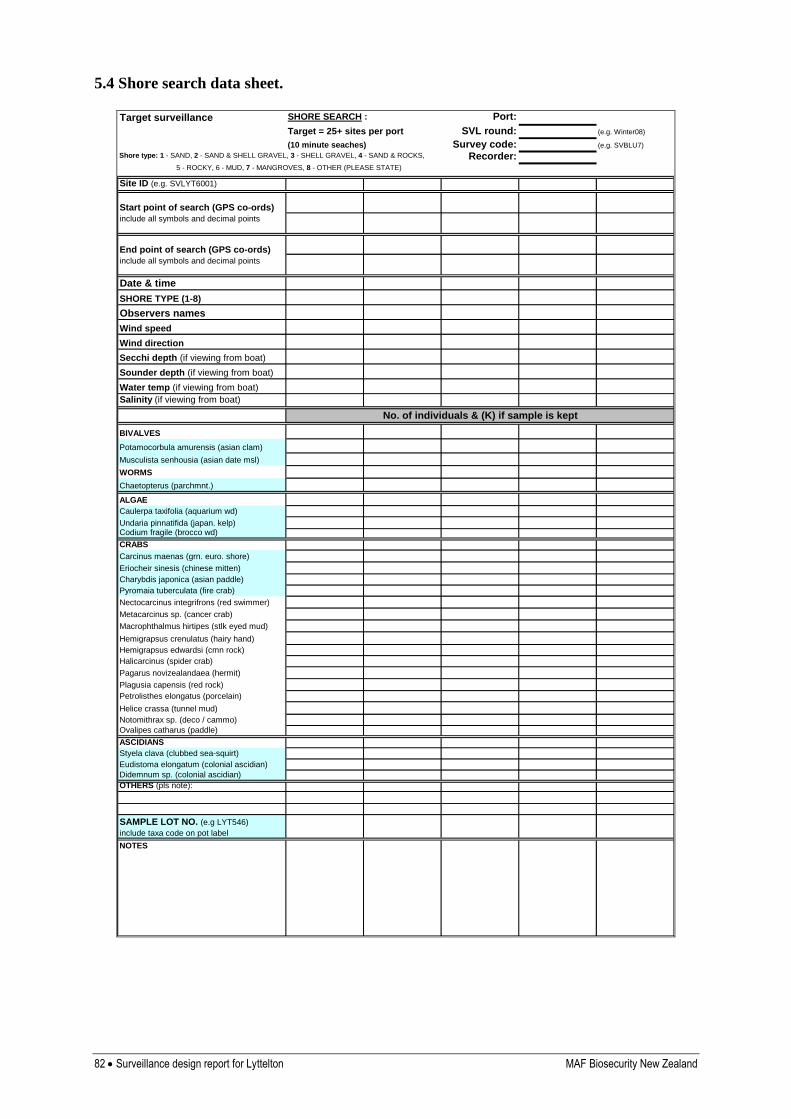
82 Surveillance design report for Lyttelton MAF Biosecurity New Zealand
5.4 Shore search data sheet.
Target surveillance SHORE SEARCH : Port:
Target = 25+ sites per port SVL round: (e.g. Winter08)
(10 minute seaches) Survey code: (e.g. SVBLU7)
Shore type: 1 - SAND, 2 - SAND & SHELL GRAVEL, 3 - SHELL GRAVEL, 4 - SAND & ROCKS, Recorder: 5 - ROCKY, 6 - MUD, 7 - MANGROVES, 8 - OTHER (PLEASE STATE)
Site ID (e.g. SVLYT6001)
Date & time
SHORE TYPE (1-8)
Observers names
Wind speed
Wind direction
Secchi depth (if viewing from boat)
Sounder depth (if viewing from boat)
Water temp (if viewing from boat)
Salinity (if viewing from boat)
BIVALVES
Potamocorbula amurensis (asian clam)
Musculista senhousia (asian date msl)
WORMS
Chaetopterus (parchmnt.)
ALGAE
Caulerpa taxifolia (aquarium wd)
Undaria pinnatifida (japan. kelp)Codium fragile (brocco wd)
CRABS
Carcinus maenas (grn. euro. shore)
Eriocheir sinesis (chinese mitten)
Charybdis japonica (asian paddle)
Pyromaia tuberculata (fire crab)
Nectocarcinus integrifrons (red swimmer)
Metacarcinus sp. (cancer crab)
Macrophthalmus hirtipes (stlk eyed mud)
Hemigrapsus crenulatus (hairy hand)
Hemigrapsus edwardsi (cmn rock)
Halicarcinus (spider crab)
Pagarus novizealandaea (hermit)
Plagusia capensis (red rock)
Petrolisthes elongatus (porcelain)
Helice crassa (tunnel mud)
Notomithrax sp. (deco / cammo)
Ovalipes catharus (paddle)
ASCIDIANS
Styela clava (clubbed sea-squirt)
Eudistoma elongatum (colonial ascidian)
Didemnum sp. (colonial ascidian)
OTHERS (pls note):
SAMPLE LOT NO. (e.g LYT546)
include taxa code on pot label
Start point of search (GPS co-ords)
include all symbols and decimal points
End point of search (GPS co-ords)
include all symbols and decimal points
No. of individuals & (K) if sample is kept
NOTES
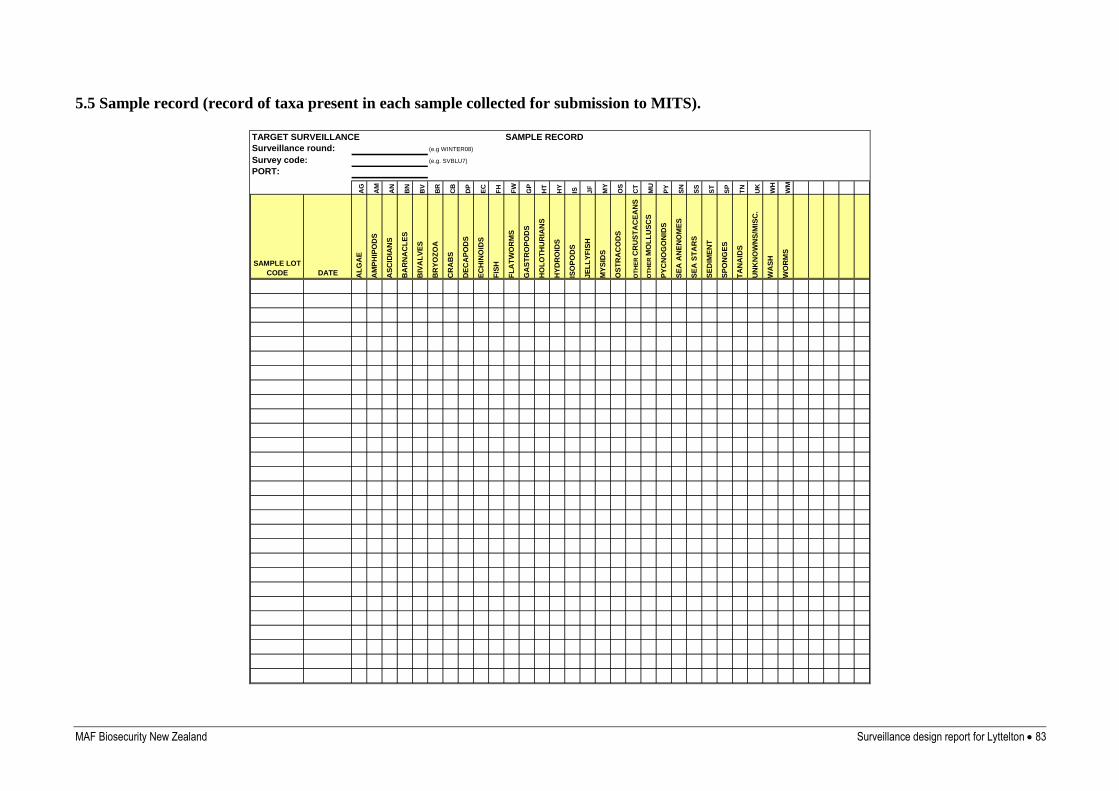
MAF Biosecurity New Zealand Surveillance design report for Lyttelton 83
5.5 Sample record (record of taxa present in each sample collected for submission to MITS).
TARGET SURVEILLANCE SAMPLE RECORD
Surveillance round: (e.g WINTER08)
Survey code: (e.g. SVBLU7)
PORT:
AG
AM
AN
BN
BV
BR
CB
DP
EC
FH
FW
GP
HT
HY
IS JF
MY
OS
CT
MU
PY
SN
SS
ST
SP
TN
UK
WH
WM
SAMPLE LOT
CODE DATE AL
GA
E
AM
PH
IPO
DS
AS
CID
IAN
S
BA
RN
AC
LE
S
BIV
AL
VE
S
BR
YO
ZO
A
CR
AB
S
DE
CA
PO
DS
EC
HIN
OID
S
FIS
H
FL
AT
WO
RM
S
GA
ST
RO
PO
DS
HO
LO
TH
UR
IAN
S
HY
DR
OID
S
ISO
PO
DS
JE
LL
YF
ISH
MY
SID
S
OS
TR
AC
OD
S
OT
HE
R C
RU
ST
AC
EA
NS
OT
HE
R M
OL
LU
SC
S
PY
CN
OG
ON
IDS
SE
A A
NE
NO
ME
S
SE
A S
TA
RS
SE
DIM
EN
T
SP
ON
GE
S
TA
NA
IDS
UN
KN
OW
NS
/MIS
C.
WA
SH
WO
RM
S
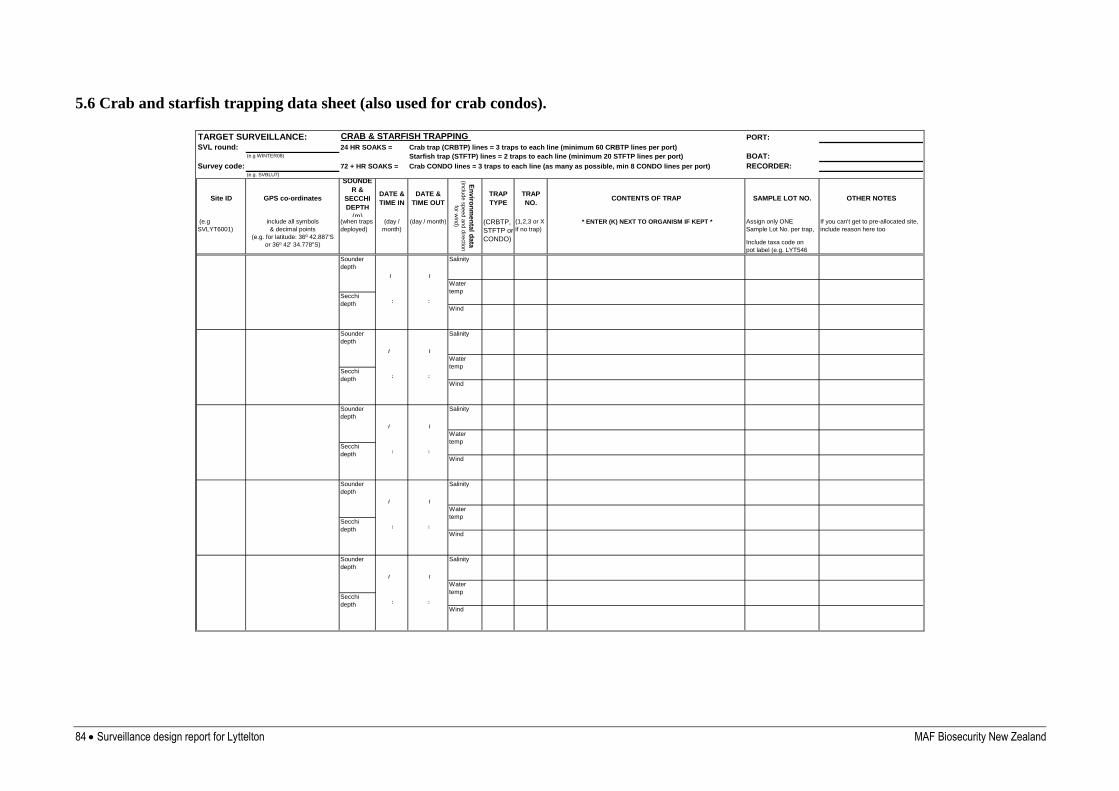
84 Surveillance design report for Lyttelton MAF Biosecurity New Zealand
5.6 Crab and starfish trapping data sheet (also used for crab condos).
TARGET SURVEILLANCE: CRAB & STARFISH TRAPPING PORT:
SVL round: 24 HR SOAKS = Crab trap (CRBTP) lines = 3 traps to each line (minimum 60 CRBTP lines per port) (e.g WINTER08) Starfish trap (STFTP) lines = 2 traps to each line (minimum 20 STFTP lines per port) BOAT:
Survey code: 72 + HR SOAKS = Crab CONDO lines = 3 traps to each line (as many as possible, min 8 CONDO lines per port) RECORDER:(e.g. SVBLU7)
Site ID GPS co-ordinates
SOUNDE
R &
SECCHI
DEPTH
(m)
DATE &
TIME IN
DATE &
TIME OUT
TRAP
TYPE
TRAP
NO. CONTENTS OF TRAP SAMPLE LOT NO. OTHER NOTES
/ /
: :
/ /
: :
/ /
: :
/ /
: :
/ /
: :
Water
temp
Wind
Salinity
Water
temp
Wind
Salinity
Secchi
depth
Sounder
depth
Secchi
depth
Salinity
Water
temp
Wind
Salinity
Water
temp
Wind
Salinity
Sounder
depth
En
viro
nm
en
tal d
ata
(in
clu
de
sp
ee
d a
nd
dire
ctio
n
for w
ind
)
Sounder
depth
Secchi
depth
Sounder
depth
Water
temp
Wind
Secchi
depth
Sounder
depth
Secchi
depth
(e.g
SVLYT6001)
(when traps
deployed)
(day /
month)
(day / month)include all symbols
& decimal points
(e.g. for latitude: 36º 42.887'S
or 36º 42' 34.778"S)
Assign only ONE
Sample Lot No. per trap,
Include taxa code on
pot label (e.g. LYT546
If you can't get to pre-allocated site,
include reason here too(CRBTP,
STFTP or
CONDO)
(1,2,3 or X
if no trap)
* ENTER (K) NEXT TO ORGANISM IF KEPT *
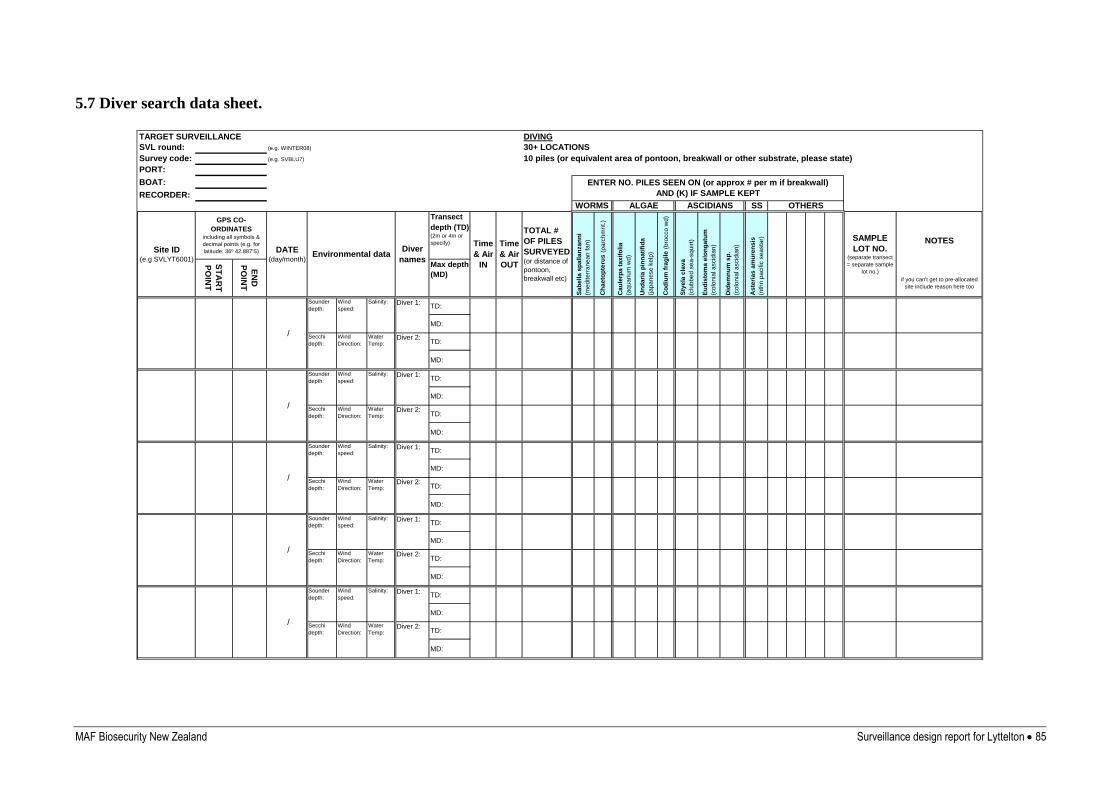
MAF Biosecurity New Zealand Surveillance design report for Lyttelton 85
5.7 Diver search data sheet.
TARGET SURVEILLANCE DIVING
SVL round: (e.g. WINTER08) 30+ LOCATIONS
Survey code: (e.g. SVBLU7) 10 piles (or equivalent area of pontoon, breakwall or other substrate, please state)
PORT:
BOAT:
RECORDER:
SS
TD:
MD:
TD:
MD:
TD:
MD:
TD:
MD:
TD:
MD:
TD:
MD:
TD:
MD:
TD:
MD:
TD:
MD:
TD:
MD:
Wind
speed:
Wind
Direction:
Wind
speed:
Wind
Direction:
Wind
Direction:
Wind
speed:
Wind
Direction:
Wind
speed:
Secchi
depth:
Water
Temp:Diver 2:
Sounder
depth:
Salinity: Diver 1:
/
Secchi
depth:
Water
Temp:Diver 2:
/
Sounder
depth:
Salinity: Diver 1:
Diver 2:
Diver 1:
/
Secchi
depth:
Water
Temp:Diver 2:
Diver 1:Sounder
depth:
Salinity:
Sounder
depth:
Salinity:
Secchi
depth:
Water
Temp:
Wind
Direction:
Time
& Air
OUT
Secchi
depth:
TOTAL #
OF PILES
SURVEYED (or distance of
pontoon,
breakwall etc)
Diver 2:Water
Temp:
Salinity:Wind
speed:Diver 1:
Transect
depth (TD) (2m or 4m or
specify)
Max depth
(MD)
DATE (day/month)
Time
& Air
IN
Sounder
depth:
Environmental data
ENTER NO. PILES SEEN ON (or approx # per m if breakwall)
AND (K) IF SAMPLE KEPT
Co
diu
m f
rag
ile
(b
rocco
wd
)
Aste
ria
s a
mu
ren
sis
(nth
n p
acific
se
asta
r)
Sty
ela
cla
va
(clu
bb
ed
se
a-s
qu
irt)
Eu
dis
tom
a e
lon
ga
tum
(co
lon
ial a
scid
ian
)
Ch
ae
top
teru
s (
pa
rch
mn
t.)GPS CO-
ORDINATES including all symbols &
decimal points (e.g. for
latitude: 36º 42.887'S)
ST
AR
T
PO
INT
EN
D
PO
INT
/
OTHERS
Diver
names
ASCIDIANS
Did
em
nu
m s
p.
(co
lon
ial a
scid
ian
)
WORMS ALGAE
if you can't get to pre-allocated
site include reason here too
NOTES Site ID
(e.g SVLYT6001)
Sa
be
lla
sp
all
an
za
nn
i
(me
dite
rra
ne
an
fa
n) SAMPLE
LOT NO. (separate transect
= separate sample
lot no.)
Cau
lerp
a t
ax
ifo
lia
(aq
ua
riu
m w
d)
Un
da
ria
pin
na
tifi
da
(ja
pa
ne
se
ke
lp)
/