Indigenous ecological calendars define scales for climate change and sustainability assessments
21
SPECIAL FEATURE: CASE REPORT Weaving Indigenous and Sustainability Sciences to Diversify Our Methods (WIS2DOM) Indigenous ecological calendars define scales for climate change and sustainability assessments Ferdouz V. Cochran 1 • Nathaniel A. Brunsell 1 • Aloisio Cabalzar 2 • Pieter-Jan van der Veld 2 • Evaristo Azevedo 3 • Rogelino Alves Azevedo 4 • Roberval Arau ´ jo Pedrosa 3 • Levi J. Winegar 1 Received: 6 October 2014 / Accepted: 8 April 2015 Ó Springer Japan 2015 Abstract Identifying appropriate temporal and spatial boundaries for assessments of human–environment sys- tems continues to be a challenge in sustainability science. The livelihood of Indigenous peoples in the northwestern Brazilian Amazon are characterized by complex ecological management systems entwined with sociocultural practices and sophisticated astronomical and ecological calendars. Sustainability of fisheries and bitter manioc production, key elements of food systems and economic activities in this region, depend on cyclic high river levels for fish spawning as well as periods of dry days for preparation of agricultural fields. Since 2005, participatory research has been underway between Indigenous communities of the Tiquie ´ River and the Brazilian Socio-environmental Insti- tute (ISA). Indigenous agents of environmental manage- ment (AIMAs) keep notebooks of ethno-astronomical, ecological, and socio-economic observations of the annual cycles, and some of them have reported that river levels and dry periods have become more irregular in some years. To investigate how these possible climatic changes may impact the sustainability of resources, we share knowledge from the Tukano ecological calendar with methodology for examining changes in precipitation and river levels and their interactions at multiple timescales. Our collaboration indicates that high spatial and temporal variability in pre- cipitation patterns and river levels may complicate climate change and sustainability analyses. However, combining results from participatory research with novel methods for climate analysis helps identify a 4-day trend in precipita- tion that may impact agroecosystem management. Indige- nous participation in systematic data collection and interpretation of results is essential for distinguishing be- tween socio-economic and climate forcings and evaluating climate impacts. Continued efforts to bridge Indigenous and Western knowledge systems are vital for sustainable environmental management in Indigenous territories and other regions where traditional management may be chal- lenged in the context of global climate change. Keywords Northwest Amazon Á Tukanoan Indigenous peoples Á Ecological calendar Á Climate services Á Temporal scales Á Knowledge coexistence Introduction Providing climate services for sustainable livelihoods in remote Indigenous communities is an emerging justice is- sue. Indigenous peoples and their knowledge are not ref- erenced in the United Nations Framework Convention on Climate Change (UNFCC) or in the Kyoto Protocol and only marginally mentioned in the Intergovernmental Panel on Climate Change (IPCC) Fourth Assessment Report Handled by Andrew Kliskey, University of Idaho, USA. & Ferdouz V. Cochran [email protected] Aloisio Cabalzar [email protected] 1 Department of Geography, University of Kansas, 1475 Jayhawk Blvd, Lawrence, KS 66045-7613, USA 2 Instituto Socioambiental, Av. Higieno ´polis, 901, SL30, Sa ˜o Paulo, SP 01238-001, Brazil 3 Associac ¸a ˜o das Comunidades Indı ´genas do Me ´dio Tiquie ´ (ACIMET), c/o FOIRN, Av. Alvaro Maia, 79, Centro, Sa ˜o Gabriel da Cachoeira CEP: 69750000, Brazil 4 Associac ¸a ˜o da Escola Indı ´gena Tukano Yupuri (AEITY), c/o FOIRN, Av. Alvaro Maia, 79, Centro, Sa ˜o Gabriel da Cachoeira CEP: 69750000, Brazil 123 Sustain Sci DOI 10.1007/s11625-015-0303-y
Transcript of Indigenous ecological calendars define scales for climate change and sustainability assessments
SPECIAL FEATURE: CASE REPORT Weaving Indigenous and Sustainability Sciences toDiversify Our Methods (WIS2DOM)
Indigenous ecological calendars define scales for climate changeand sustainability assessments
Ferdouz V. Cochran1 • Nathaniel A. Brunsell1 • Aloisio Cabalzar2 •
Pieter-Jan van der Veld2 • Evaristo Azevedo3 • Rogelino Alves Azevedo4 •
Roberval Araujo Pedrosa3 • Levi J. Winegar1
Received: 6 October 2014 / Accepted: 8 April 2015
� Springer Japan 2015
Abstract Identifying appropriate temporal and spatial
boundaries for assessments of human–environment sys-
tems continues to be a challenge in sustainability science.
The livelihood of Indigenous peoples in the northwestern
Brazilian Amazon are characterized by complex ecological
management systems entwined with sociocultural practices
and sophisticated astronomical and ecological calendars.
Sustainability of fisheries and bitter manioc production,
key elements of food systems and economic activities in
this region, depend on cyclic high river levels for fish
spawning as well as periods of dry days for preparation of
agricultural fields. Since 2005, participatory research has
been underway between Indigenous communities of the
Tiquie River and the Brazilian Socio-environmental Insti-
tute (ISA). Indigenous agents of environmental manage-
ment (AIMAs) keep notebooks of ethno-astronomical,
ecological, and socio-economic observations of the annual
cycles, and some of them have reported that river levels
and dry periods have become more irregular in some years.
To investigate how these possible climatic changes may
impact the sustainability of resources, we share knowledge
from the Tukano ecological calendar with methodology for
examining changes in precipitation and river levels and
their interactions at multiple timescales. Our collaboration
indicates that high spatial and temporal variability in pre-
cipitation patterns and river levels may complicate climate
change and sustainability analyses. However, combining
results from participatory research with novel methods for
climate analysis helps identify a 4-day trend in precipita-
tion that may impact agroecosystem management. Indige-
nous participation in systematic data collection and
interpretation of results is essential for distinguishing be-
tween socio-economic and climate forcings and evaluating
climate impacts. Continued efforts to bridge Indigenous
and Western knowledge systems are vital for sustainable
environmental management in Indigenous territories and
other regions where traditional management may be chal-
lenged in the context of global climate change.
Keywords Northwest Amazon � Tukanoan Indigenous
peoples � Ecological calendar � Climate services � Temporal
scales � Knowledge coexistence
Introduction
Providing climate services for sustainable livelihoods in
remote Indigenous communities is an emerging justice is-
sue. Indigenous peoples and their knowledge are not ref-
erenced in the United Nations Framework Convention on
Climate Change (UNFCC) or in the Kyoto Protocol and
only marginally mentioned in the Intergovernmental Panel
on Climate Change (IPCC) Fourth Assessment Report
Handled by Andrew Kliskey, University of Idaho, USA.
& Ferdouz V. Cochran
Aloisio Cabalzar
1 Department of Geography, University of Kansas, 1475
Jayhawk Blvd, Lawrence, KS 66045-7613, USA
2 Instituto Socioambiental, Av. Higienopolis, 901, SL30,
Sao Paulo, SP 01238-001, Brazil
3 Associacao das Comunidades Indıgenas do Medio Tiquie
(ACIMET), c/o FOIRN, Av. Alvaro Maia, 79, Centro,
Sao Gabriel da Cachoeira CEP: 69750000, Brazil
4 Associacao da Escola Indıgena Tukano Yupuri (AEITY),
c/o FOIRN, Av. Alvaro Maia, 79, Centro,
Sao Gabriel da Cachoeira CEP: 69750000, Brazil
123
Sustain Sci
DOI 10.1007/s11625-015-0303-y
(Smith and Sharp 2012). For the creation of the IPCC Fifth
Assessment Report, Alexander et al. (2011) explored ways
in which Indigenous knowledge (IK) could be incorporated
with Western scientific knowledge (WK) into climate
change assessments, particularly through links between
climate-related narratives and remotely sensed data. By
bridging IK and WK systems in areas with limited instru-
mental records, they uncovered ways in which global cli-
mate change has already impacted human-environment
systems, particularly in the northern high latitudes
(Alexander et al. 2011). Through the co-production of
knowledge, defined as a collaborative process with various
knowledge sources to create a systems-oriented under-
standing of a specified problem (Armitage et al. 2011), an
improved comprehension of climate change impacts can be
achieved (Nakashima et al. 2012; Riedlinger and Berkes
2001; Salick and Ross 2009; Tyler et al. 2007).
In the context of global climate change, the bridging of
IK and WK systems is essential for the forward-thinking,
justice framework proposed by Whyte (2013), where sys-
tems of responsibilities (relational responsibilities that en-
able livelihoods) respond appropriately to climate change
by supporting collective continuance or tribal adaptive
capacity. Since climate change threatens collective con-
tinuance of Indigenous communities, new systems of re-
sponsibilities may emerge or be amended to cope with
environmental change and the introduction of new scien-
tific and technological systems. Governments, non-gov-
ernmental decision-makers and scientists are responsible
for sheltering and, when appropriate, amending persisting
and emerging systems of responsibility. According to
Whyte (2013, p. 528), ‘‘institutions that do not shelter the
exercise of the responsibilities leave tribes in positions of
greater vulnerability vis-a-vis climate change impacts…’’
Climate services provide climate information to deci-
sion-makers to ‘‘facilitate climate-smart decisions that re-
duce the impact of climate-related hazards and increase the
benefits from benign climate conditions’’ (Hewitt et al.
2012, p. 831). McNie (2013) argues that co-production of
climate information may increase trust and social capital
for ‘‘useful’’ climate services. This can be achieved with
early and iterative communication with stakeholders, for-
mal or informal research methods to identify stakeholders’
needs, and maintenance of social capital to enable infor-
mation exchanges (McNie 2013). Since this type of prob-
lem-driven research requires tremendous time, funding and
resource allocations, it may be helpful to initiate col-
laborations with boundary organizations (Guston 2001) and
leverage research that is already underway, especially
considering the urgency of climate change mitigation and
adaptation efforts.
The Socio-environmental Institute (ISA), a Brazilian
non-governmental organization (www.socioambiental.org)
that supports Indigenous peoples’ rights, has undertaken
numerous research projects in the Upper Rio Negro during
the past 20 years in partnership with the Federation of
Indigenous Organizations of the Rio Negro (http://www.
foirn.org.br). Through these collaborations, it has been
possible since 2005 to organize a network of researchers
and knowledge holders among various Indigenous com-
munities of the remote Tiquie River, focusing on envi-
ronmental management activities (Cabalzar 2010). As part
of this effort, Indigenous agents of environmental man-
agement (AIMAs) have recorded their observations of the
annual cycle to document the Tukano ecological calendar.
The annual calendar covers cycles of fish, amphibians,
birds, mammals, insects, plants, daily work in agriculture,
fishing, gathering, and hunting, rituals and festivals, pre-
vention and cure of diseases, diet and behaviors. Daily life
in communities is the experience of these cycles and pro-
cesses that are related to the organization of socio-eco-
nomic activities and rituals (Cabalzar 2013).
The case study in this paper attempts to deliver useful
climate services for sustaining Indigenous livelihoods by
leveraging results from participatory research of the
Tukano ecological calendar to identify spatial and temporal
scales for evaluating climate change and sustainability. Our
main query is: What are appropriate spatial and temporal
scales for assessing climate change impacts and sustain-
ability in the Tiquie basin? To answer this question, we
consider the benefits of bridging IK on the Tukano eco-
logical calendar with a WK analysis of precipitation and
river levels at different scales (Berkes et al. 2006).
Berkes et al. (2006) discuss the need for investigating
issues of scale and knowledge systems together for envi-
ronmental sustainability. Sustainability science necessitates
studying human–environment interactions across multiple
temporal and spatial scales through the co-production of
knowledge and collaborations between scientists, decision-
makers, and stakeholders (Clark and Dickson 2003; Kates
2011). If our study is successful in identifying relevant
scales of importance for monitoring climate change and
sustainability through the coexistence of IK and WK, it
may contribute to the theory that bridging multiple
knowledge systems and scales builds adaptive capacity and
reduces climate change impacts and vulnerability (Berkes
et al. 2006).
Appropriate spatial and temporal boundaries for
monitoring and assessing climate change and sustainability
in human-environment systems are difficult to identify
(Mayer 2008). Furthermore, the decoupling of policy ac-
tions from sustainability targets, such as reducing climate
change impacts, is often attributed to the discrepancies
between spatial and temporal scales and is the cause of an
ever-widening sustainability gap (Fischer et al. 2007). This
study endeavors to reduce that gap by bridging aspects of
Sustain Sci
123

IK and WK systems. Although various Indigenous astro-
nomical and ecological calendars have been documented
around the world (Sanchez-Cortes and Chavero 2011; Le-
fale 2003; Petheram et al. 2010), temporal scales for cli-
mate and sustainability assessments have yet to be defined
with Indigenous calendars.
Indigenous calendars constitute native ways of knowing
or IK, which according to Winona LaDuke (1994, p. 127) is
‘‘the culturally and spiritually based way in which Indige-
nous peoples relate to their ecosystems.’’ Across disciplines,
attempted ‘‘integration’’ of IK and WK has resulted in
widespread difficulties (Casimirri 2003; Johnson and Mur-
ton 2007; Mazzocchi 2008; Nadasdy 1999; Raymond et al.
2010) primarily owing to the lack of common ground for
evaluating these distinct knowledge systems. According to
Wood (1999), IK systems are often ‘‘polyrhetorical, em-
phasizing multiple shifting and context-specific meanings
with overlapping and elastic realities,’’ whereas WK systems
are ‘‘monorhetical, which privileges objective, ideally
mathematical, analytical-reductionist, linear…’’ realities
(Johnson and Murton 2007; p. 123). These differences result
in diverse understandings of time and connections between
cause and effect, due primarily to the nature-culture divide or
the removal of spirituality from Western scientific inquiry
and the separation of supernatural, human, and biophysical
worlds (Johnson and Murton 2007).
IK is usually incorporated into WK research through
questionnaires, semi-directive interviews, collaborative
field projects, and facilitated workshops (Huntington
2000). Problematic integration of IK with WK occurs when
(1) IK is used as mere ‘‘data’’ to inform Western resource
management, (2) WK is used to validate IK, and (3) IK
research is conducted based on WK research questions and
methods and collected, translated, and interpreted by
Western researchers (Casimirri 2003). These problems
often arise when IK is obtained through social science
methods before being incorporated into multidisciplinary,
scientific analyses (Huntington 2000).
Acknowledging that this last point may pertain to our
research, we instead aim for coexistence of the two
knowledge systems (Ball and Janyst 2008; Johnson 1992).
In the Upper Rio Negro, the question of knowledge pro-
duction has been discussed with an effort to (1) recognize
the importance and scope of IK, and (2) promote sym-
metrical relations between Indigenous and non-Indigenous
researchers, respecting the characteristics and skills of each
and developing intercultural research programs. Long-term
initiatives like this require the identification of common
ground for communication, often an arduous task consid-
ering the cultural and linguistic differences. To facilitate
communication, we focus on the commonalities between
IK and WK systems, which include the importance of place
or ‘‘localness’’ (Johnson and Murton 2007), the shared
concept of ecosystems (Lertzman 2010), and the collection
of empirical observations (Roberts 1996). In addition, to
approach non-linear realities of IK, our study selects WK
methods that identify non-linear sources of change. Berkes
(2013, p. 27) has found that ‘‘the two paradigms can best be
considered together by combining knowledge in a col-
laborative way around a particular topic.’’ By concentrating
on the topic of spatial and temporal scale, we attempt to
overcome challenges of knowledge ‘‘integration’’ and offer
instead the opportunity for IK and WK to coexist. Coex-
istence follows the recommendations from the WIS2DOM
workshop to ‘‘allow each paradigm to occupy their own
separate intellectual space while building bridges between
them for dialogue’’ (Johnson et al. 2013).
The Western researchers involved in this project have
lived or worked in the Upper Rio Negro for over 30 years,
cumulatively. In 2013, the AIMAs invited the lead author
to a workshop to discuss climate change and the Tukano
calendar, which provided context for research engagement
(Ball and Janyst 2008). Permission was granted for a cli-
mate analysis of the region and for use of the 2005–2008
results of the participatory research pertaining to the cal-
endar. The addition of climate science perspectives reini-
tiated a phase of collaborative problem framing and team
building, a step referred to as Phase A by Lang et al.
(2012). The collaboration between ISA and the AIMAs
was already long term, and AIMAs continued to retain full
decision-making authority in relation to IK use, an essential
aspect of power relations in the coexistence of IK and WK
(Brewer and Kronk Warner 2015; Nadasdy 1999). Never-
theless, the non-Indigenous researchers of this project ac-
knowledged their position of power, based on their funding
and institutional connections, and continue to make every
effort to communicate on even ground and follow ethical
research practices as outlined in Ball and Janyst (2008).
To illustrate the iterative mechanisms of the co-pro-
duction of knowledge, its exchange and use between IK
and WK spheres, a gear system is used as an example in
Fig. 1. Hence, this paper comprises two distinct stages of
analysis: (1) the receipt of IK by Western researchers
through participatory research (Fig. 1d), and (2) a Western
climate analysis that provides new output information
(Fig. 1e) for potential climate services in Indigenous ter-
ritories. After a brief overview of the study region, the case
study’s pertinence to Indigenous agroecosystems and
fisheries, and the climate of northwestern Amazonia,
methodologies used in the participatory research are sum-
marized and new methodologies for joining qualitative and
quantitative data and conducting the climate analysis are
presented. Results are discussed to better define temporal
and spatial scales and improve ongoing climate change and
sustainability assessments in the ecoregion of the Tiquie
River within the larger Amazon Basin.
Sustain Sci
123

Fig. 1 a As long as both IK and WK gears remain of equal size,
weight and speed, determined by the equal size, weight, and speed of
the two drive gears (in this case, participatory research and climate
analysis) that are powering them, IK and WK can continue to mesh
without clashing. b, c If either of the drive gears gets too big and
overpowers the system it will cause IK and WK gears to clash and
break, unless the bigger gear slows down or the smaller gear speeds
up. Either way, as long as there are two drive gears, there will be no
output production of knowledge to propel the system forward. d, e In
order to move forward, either the participatory research or the climate
analysis must take turns being the power source in an iterative cycle
to provide the other with output knowledge
Sustain Sci
123

Study region
The Tiquie River is located in the upper, northwestern part
of the Rio Negro basin in Brazil and Colombia (Fig. 2). Its
headwaters are in Colombia, and it traverses the western
extent of the Guiana Shield draining an area of 5700 km2.
The river runs 374 km of which 321 km are within the
Indigenous Territory of the Upper Rio Negro [Terra
Indıgena (TI) Alto Rio Negro] in the state of Amazonas,
Brazil. The Tiquie is an affluent of the Uaupes River,
which drains into the Rio Negro, the largest tributary of the
Amazon River.
Currently, 21 % of the Amazon region is occupied and
recognized for exclusive use by Indigenous peoples. In
Brazil this area is 22 % of federal lands, while in Colombia
it exceeds 50 % (RAISG 2012). The communities of Pari-
Cachoeira and Pirarara Poco along the Tiquie River and
Taracua at the junction of the Tiquie River with the Uaupes
River parallel the equator from west to east and are located
within the TI Alto Rio Negro, federally recognized as an
Indigenous territory in 1998. With an area of 8 million ha,
it is home to approximately 26,000 people from 20 major
ethnic groups. The population of the Tiquie is estimated to
be about 4,000, most of which come from two linguistic
groups: the Tukano Oriental, including the Tukano, De-
sana, Tuyuka and Miriti-tapuya, and the Maku, namely the
Hupda and Yuhupda. The language of the Tukano, whose
population is prevalent, is used as a lingua franca
throughout the Tiquie basin. In this paper, words in Por-
tuguese are denoted in lower case italics, while words in
Tukano are capitalized.
Case study
While anthropogenic climate change and associated in-
creased temperatures are expected to accelerate processes
of the hydrological cycle in places like the humid tropics,
observations that contribute to the understanding of re-
sulting human-environment interactions and impacts are
Fig. 2 Region of case study in the state of Amazonas, Brazil and within the Indigenous Territory (TI) of the Alto Rio Negro. Close up of the
Tiquie River and Uaupes River with communities by size (courtesy ISA)
Sustain Sci
123

lacking (Wohl et al. 2012). Analyses of precipitation
variability from gauge, satellite, reanalysis, and models of
the Rio Negro basin have been conducted (Getirana et al.
2010, 2011; Juarez et al. 2009), and Getirana et al. (2011)
conclude that gauge-based data are the most representative
of actual precipitation. Since the northwestern Amazon is
an area where there are low correlations for rainfall var-
iations between datasets from the Climate Prediction
Center (CPC), Global Precipitation Climatology Center
(GPCC), Tropical Rainfall Measuring Mission (TRMM),
and Global Precipitation Climatology Project (GPCP)
(Getirana et al. 2010, 2011; Juarez et al. 2009), the po-
tential of high spatial and temporal variability in this region
may complicate climate change and sustainability analyses.
Therefore, Indigenous participation in the research process
is essential for evaluating impacts and distinguishing be-
tween socio-economic and climate forcings.
Given the importance of agroecosystems and fisheries
production in the Tiquie basin, identifying timescales that
relate to the slash-and-burn practice and fish reproduction
and migration cycles is key to evaluating sustainability in
this region. With the temporal framework of the Tukano
ecological calendar documented by the AIMAs from 2005
to 2008, an observation-driven assessment is initiated. We
combine indicators of ecological knowledge, precipitation,
and river levels with cross-disciplinary methodologies for
examining changes across different sites at multiple
timescales.
Agroecosystems
Indigenous populations are finely attuned to the limitations
of the Rio Negro black-water basin possessing profound
knowledge of sustainable land-use practices that have been
employed for centuries (Moran 1991). Bitter manioc
(Manihot esculenta Crantz) is one of the few crops that can
be grown in the extremely acidic and nutrient-poor soils of
the region. Although it is drought tolerant, going into
dormancy and regaining its leaves when soil moisture re-
turns, bitter manioc must be cultivated on higher ground to
avoid waterlogging (Moran 1991; Fraser 2010). This is the
primary reason why flooded forests are avoided for agri-
cultural use in the Rio Negro basin (van der Veld 2014).
A high level of biodiversity of bitter manioc is both a
biophysical and a socio-economic indicator of sustainable
agroecosystems in the Upper Rio Negro (Emperaire and
Peroni 2007). Since dry periods are necessary for drying
out and burning agricultural plots, one of the few threats to
the cultivation of bitter manioc is increased precipitation
events which may alter possibilities for the slash-and-burn
practice and hence, the sustainability of these agroecosys-
tems. In recent years, there have been reports that dry
periods have became more irregular, making it difficult for
local families to plan their agricultural activities.
In the Tiquie basin, areas for cultivation usually range
between an average of 0.3 ha and a maximum of about
1 ha. van der Veld (2014) found that the average number of
plots per family was 2.5 with the average combined area of
cultivation on all plots totaling 0.7 ha. Plots cleared from
primary forests are typically larger (Cardoso 2010), though
rare along the Tiquie (van der Veld 2014). While smaller
plots of forest regrowth, known as capoeira, that are closer
to dwellings are rotated to fulfill immediate family needs,
larger primary or secondary mature forest plots are farther
away and require the help of younger men to clear.
According to the Tukano ecological calendar, the times
for clearing primary or mature secondary forest may occur
anywhere between September and December, with clearing
occurring usually two to several months before burning.
Clearing of capoeira or forest regrowth can occur year
round. In the annual cycle, burning may begin at the end of
August with 3–4 days of direct sun necessary to dry out
and burn a capoeira plot and 1 week or more required to
dry out and burn a primary or mature-forest plot. Although
the slash-and-burn agriculture of Indigenous peoples has
been criticized as a contributing factor to greenhouse gas
emissions (Palm et al. 2003), for every small parcel of
forest Indigenous peoples clear and burn, there is a much
larger area of secondary forest they manage that grows and
captures carbon in the process.
Fisheries
Most of the population of the Tiquie basin lives in riverside
fishing communities. Indigenous peoples of the basin
practice many forms of fishing—some occur only at certain
times during the annual cycle and are specific to certain
locations (like waterfalls and narrow, flooded channels of
the rivers). The placement of fish traps is guided by a de-
tailed knowledge of riverine geography and the ecology of
fish species. The traps can be placed against or with the
flow of water and can be fixed or placed and removed in
accordance with river conditions.
Flooded forest areas, such as igapos, are a river’s main
source of productivity through the mechanism of flood pulses
(Bayley 1995). These are important feeding areas for fish
(Junk et al. 1997), where fruits, flowers, insects, etc. are
readily found at the water surface. Several studies (Goulding
et al. 1988; Chernela 1994) have highlighted the interrela-
tionship between the fish life cycle, fruit trees from river-
banks and igapos, and the regime of ebbs and flows. The rise
of the river and the full flooding of the igapos facilitate the
access of these resources by fish, and some traps are placed in
channels or igapos to catch fish during ebbs and flows.
Sustain Sci
123

The lower course of the Tiquie River is characterized by
floodplains, igapos, and oxbow lakes. In the middle Tiquie,
these features are intertwined with higher riverbanks and
upland forests in areas known as terra firme. In the upper
course of the river, abrupt steep banks and areas of rapids
and waterfalls predominate. The relief represented by wa-
terfalls and rapids—in places like Pari-Cachoeira—serves
as a barrier to the dispersal of many fish species.
The biological cycle of fish is closely related to fluc-
tuations in river level, many phenological cycles, and other
processes of the Tukano ecologial calendar. In the Tiquie,
different intensities of fish migrations and gatherings for
reproduction occur throughout the entire river. When the
flood season is well defined, the river grows and remains
high for a prolonged period from April on, and the fish
migrate in greater numbers. Otherwise, migrations are
rather weak and the abundance of fish in the other months
of the year is also lower. Reproduction occurs between
November and April, especially during the months of
January and March.
Climate change in Northwestern Amazonia
The climate of the Amazon basin is influenced by large-
scale circulations and oscillations, namely the El Nino
Southern Oscillation (ENSO) and the Pacific Decadal Os-
cillation (PDO), and sea surface temperatures (SST) in the
tropical Atlantic which can influence the displacement of
the Intertropical Convergence Zone (ITCZ). A 3–4 year
peak in Amazon basin rainfall and Amazon River dis-
charge has been attributed to ENSO cycles, while a
24–28 year oscillation is attributed to the PDO with more
precipitation seen in the Amazon basin between 1945 and
1976 and less between 1977 and 2000 (Marengo 2007).
The active phase of the Madden-Julian Oscillation can also
result in intense rainfall events in northern Amazonia
(Waliser et al. 2012).
During the past decade, different parts of the Amazon
basin have suffered extreme drought and flood events
(Potter et al. 2011; Marengo et al. 2008, 2011). The
droughts of 2005 and 2010 are two such events that have
been well documented (Potter et al. 2011; Marengo et al.
2008). The drought in 2005 was attributed to the combi-
nation of an anomalously warm North Atlantic, a decrease
in the moisture transport of the northeast trade winds in the
summer season, and a corresponding decrease in convec-
tion and rainfall in that region (Marengo et al. 2008).
An overall intensification of the hydrological cycle in
Amazonia since 1990 may be associated with increased
SST in the tropical Atlantic (Gloor et al. 2013). In north-
western Amazonia, this increase is primarily occurring in
the rainy season. In total, an excess of 80 mm per month
was seen comparing the decades of 1981–1990 to
2000–2009 (Gloor et al. 2013).
Northwestern Amazonia has been identified as the highest
precipitation center throughout the Amazon Basin with
3600 mm/year (Marengo 2007). Within this area, the Rio
Negro basin exhibits interannual and subseasonal variability
and the potential for rapid changes and high magnitude
events. In both 2009 (Marengo et al. 2011) and 2012
(Satyamurty et al. 2013), record flood levels were recorded in
Manaus port, where the Rio Negro meets the Amazon River.
Satyamurty et al. (2013) found that interannual rainfall
variability in the Rio Negro basin has increased since 1970
with an average positive trend of 10 cm/year. The Rio Negro
has the highest rate of runoff of all the Amazon tributaries
corresponding to 4.36 mm/day (Marengo 2004).
In a comparison between observations of river discharge
and simulations from an enhanced version of the Dynamic
Global Vegetation and Hydrology Model LPJmL for
1961–1990 and projections for 2070–2099, flooding dura-
tion in parts of northwestern Amazonia was found to in-
crease by 3 months and shift by 3 months. The probability
of three consecutive years with high precipitation, based on
applying model results from 24 GCMs from the IPCC-
AR4, also increased by 25 % in this study (Langerwisch
et al. 2013). These potential shifts in precipitation fre-
quency and magnitude could have grave implications not
only for the Indigenous populations of northwestern
Amazonia, but also for areas downriver in central and
eastern Amazonia. In addition, areas in southern Brazil are
directly affected by patterns of atmospheric moisture
transport from Amazonia (Marengo 2007).
Methods
Considering the complexity in the co-production of
knowledge and the delivery of climate services to fit users’
needs, a conceptual framework is conceived for the
bridging of IK and WK to identify relevant spatial and
temporal boundaries to reduce climate change impacts and
vulnerability. This framework considers the importance of
coexistence of IK and WK to evaluate and monitor envi-
ronmental change. It employs novel, cross-disciplinary
methodologies to combine qualitative and quantitative data
and identify non-linear changes.
Participatory research
In 2005, a series of meetings and workshops on environ-
mental management were conducted by Tiquie River as-
sociations, involving significant participation of Indigenous
leaders and community residents (from Brazil and
Sustain Sci
123

Colombia) with support and advice from ISA, which has
maintained a permanent team of advisors and researchers
in the area since 1998. Cross-community agreements for
environmental management were discussed for strength-
ening Indigenous governance of their territories. In these
workshops, it was clear the multiplicity of factors associ-
ated with the dynamics of life cycles and the history of
relations with the environment, both biological and socio-
cosmological. One of the strategies of action was to start a
team of researchers and community workers, selected by
their communities to maintain, monitor and stimulate ac-
tivities related to environmental management. These re-
searchers and workers became known as Indigenous agents
of environmental management (AIMAs). The objective of
the participatory research between AIMAs and ISA re-
searchers was to promote IK, allied with WK, for under-
standing environmental and climate monitoring of the
region by recording astronomical, ecological and socio-
economic observations and improving environmental
governance of this important biome (Cabalzar 2010).
An AIMA is one form of community worker, working for
best management practices, the collection of information and
research. They are residents of the communities, of different
age groups and levels of primary and secondary education.
The number of AIMAs along the Tiquie River is between
twenty and thirty. The AIMAs, like all residents of the
communities, are involved in daily work and dedicated in
part to research activities. As of 2014, there are five houses
with solar energy, computers, and meeting space to support
research in different communities. The AIMAs participate in
training programs and the exchange of knowledge through
workshops coordinated with ISA. They receive a stipend
proportional to their participation and training, plus some
working tools and fuel required for travel.
The AIMAs were given notebooks, pens, and drawing
materials and a list of suggestions for observations and
recordings, such as (1) rainfall, (2) river level or ebbs and
flows for navigation conditions, (3) season name in the
Indigenous language, (4) phenology of important plants—
cultivated and wild fruits and flowers—that are ripe and
being consumed by people, fish and animals, (5) fish cy-
cles—migration, diet, reproduction, and fisheries manage-
ment, (6) reproduction and behavior of mammals and birds,
and (7) reproduction of insects and amphibians (e.g. flight
of ants, spawning frogs, appearance of edible caterpillars,
etc.). AIMAs were also advised to write daily, but each had
complete freedom to do as they could and write in the
language of their choice (Portuguese, Tukano, Tuyuka,
Hupda, Yuhupda). Some who were former students of
Catholic missions had learned to write only in Portuguese,
while the younger AIMAs attended new Indigenous
schools and had learned how to write in their language with
recently developed alphabets.
Observations were recorded in communities along the
Tiquie, which means that several AIMAs could have been
recording simultaneously within the same or neighboring
communities. This overlap in data recording limits possi-
bilities of gaps that might occur with AIMAs who live in
multiple communities or travel regularly throughout the
region.
The concern to collectively systematize the information
gathered daily led to quarterly workshops starting in 2006,
bringing together the AIMAs with ISA researchers. In
these workshops, lasting 1–2 weeks, daily observations are
shared and a timeline is made for each region of the river.
AIMAs carry out organization and analysis of data under
the supervision of Elders or IK holders and ISA re-
searchers. Elders are invited to discuss relevant issues from
various points of view, and these discussions generate in-
formation for management and future research. At the end
of the workshop, notebooks are collected to be scanned,
typed, edited, systematized, and summarized for the de-
scription and analysis of the annual cycle.
In this study, annual cycles from November 2005 to
October 2008 (Fig. 3) were compiled from fifty notebooks
comprising more than 400 edited and typed pages. Most of
these records were kept by Tukano and Desana AIMAs in
the middle stretch of the Tiquie between Pirarara Poco and
Pari-Cachoeira (Fig. 2). If there was discrepancy regarding
the identification of constellations or seasons in the nota-
tions of the AIMAs, in each case, the predominant con-
stellation or season was decided based on a query to other
materials, such as illustrations and notes of discussions
between AIMAs and Elders at workshops.
Rain and river gauge stations
To begin evaluating climate change in the region, we utilized
precipitation and river level data in conjunction with the
Tukano ecological calendar. Precipitation and river gauge
stations in the Rio Negro basin are installed and monitored by
the National Geological Survey and the National Water
Agency—Agencia Nacional de Aguas (ANA). These sta-
tions have been increasing since 1980, and observations are
recorded by people hired in the local communities.
In general, gauge-based data are subject to observation
errors, including systematic bias and random error, and data
reporting from remote stations can be sporadic. However,
since (Getirana et al. 2011) concluded that gauge-based data
are the most representative of actual precipitation for this
area, precipitation datasets from ANA stations at Pari-Ca-
choeira (0.252�N, 69.784�W, 1980-present), Pirarara Poco
(0.14�N, 69.21�W, 1992-present), and Taracua (0.131�N,
68.541�W, 1961-present) were used for this study. ANA
river level data at Pari-Cachoeira (0.25�N, 69.785�W,
Sustain Sci
123

1980-present), Cunuri (0.21�N, 69.38�W, 1982-present),
and Taracua (0.13�N, 68.54�W, 1977-present) were also
examined. Although Taracua is not on the Tiquie River, it
was included in the study to offer an example of precipitation
at the mouth of the Tiquie and to give a river level compar-
ison from the larger basin of the Uaupes.
All precipitation and river level data, except for river
levels prior to certain dates, are Level 1 data processed and
made available on the ANA website (http://www.ana.gov.
br/PortalSuporte/frmSelecaoEstacao.aspx). River levels
prior to August 2006 for Pari-Cachoeira, September 2006
for Cunuri, and January 2008 for Taracua are Level 2,
which constitute organized raw data. Time series of pre-
cipitation starting in November of 1962 for Taracua, 1982
for Pari-Cachoeira, and 1992 for Pirarara Poco and all
continuous through October 2012 are plotted in Fig. 5
along with river level time series from November 1982
through October 2012. Missing values for precipitation in
Pari-Cachoeira (10.50 %), Pirarara Poco (0.90 %), and
Taracua (1.86 %) were filled with zeros to have a con-
tinuous time series for the wavelet multiresolution analysis,
while missing values for river levels at Pari-Cachoeira
(6.39 %), Cunuri (0.54 %), and Taracua (0 %) were filled
by linear interpolation. The only missing data during the
2005–2008 period occurs for precipitation at Pirarara Poco
from November 23 to 27, 2007.
Classification trees
In an effort to join the results of the Tukano ecological
calendar with the rainfall and river level data, we used a
classification tree approach. Classification trees use
numerical techniques for exploring data and provide a
graphical representation that can be used for description
and prediction of complex processes or patterns. Given
combinations of explanatory variables (i.e. constellation,
river level, precipitation, dry days), classification trees re-
peatedly split data into more homogenous groups to get at
the response variable (season). In other words, a group can
be characterized by the distribution of the response vari-
able, total observations in a group, and the values of the
explanatory variables. Within a classification tree, splitting
criteria can be defined with common indices, like the in-
formation entropy index and the Gini index, taking into
account the proportion of the absences and presences in a
group (De’ath and Fabricius 2000).
To explore defining variables of seasons witnessed during
2005–2008, classification models were created using the
rpart library in the R statistical software (Therneau et al.
2010). Categorical data of seasons and constellations were
combined with numerical data for precipitation, river level,
and consecutive days without precipitation at Pirarara Poco.
The initial formula was Seasons = 0.64 Constellations (as-
tro) ? 0.31 River Levels (river) ? 0.01 Precipitation
(ppt) ? 0.04 Dry Days (dry_days), but was then simplified
to Seasons = 0.18 Precipitation ? 0.82 Dry Days to get at a
classification that gave importance to days without pre-
cipitation. Dry days were defined through quartiles for all
2005–2008 precipitation data, with everything below the
50 % quartile value of 1.8 mm/day considered no pre-
cipitation. This threshold was selected because 42 % of days
had 0 mm of precipitation, while 4 % had less than 1 mm,
and 3 % had between 1 and 1.8 mm. Splits in the classifi-
cation tree were based on the Gini index, where the largest
category is typically separated in a split.
Fig. 3 Example of the ecological calendar of the Tiquie based on
constellations in Table 1 and seasons observed and recorded by the
AIMAs from 2005 to 2008. Precipitation (mm) and river level (cm)
data are from Agencia Nacional de Aguas (ANA). White areas in the
season panel represent times with no observations
Sustain Sci
123

Wavelet multiresolution analysis
Once we examined defining variables for seasons in the
Tukano calendar during 2005–2008, a longer-term analysis
was applied to identify relevant timescales of precipitation
and river level variance. Wavelet multiresolution analysis
(WMRA) is a powerful tool that can identify changes oc-
curring over time based on contributions from each fre-
quency (or period) of a time series. It is a technique that
can be applied across disciplines and has gained popularity
in applications for hydrology and the geosciences (Kumar
and Foufoula-Georgiou 1997; Ruddell and Kumar 2009;
Stoy et al. 2009; Brunsell 2010; Cochran and Brunsell
2012). The reader is referred to Torrence and Compo
(1998) for original equations, but a brief outline is provided
here.
The basic idea of the analysis technique is to break
down a time series (e.g. precipitation or river level) into a
series of different timescales such as daily, weekly, sea-
sonal, annual, etc. This decomposition allows us to analyze
various components of the data that are not easily ascer-
tained from the original data set. For example, if the annual
scale is becoming more important, this would be reflected
through an increase in the power (or variance) at the annual
timescale.
In this study, wavelet renderings of precipitation and
river level time series were examined at each scale of de-
composition for temporal variations. This decomposition of
the original data is conducted through the dilation (ex-
pansion and contraction) and translation (shifting along in
time) of a ‘‘mother’’ wavelet, such as the Morlet wavelet
used in this study. The wavelet analysis is ideal for the
analysis of non-stationary signals because it exhibits a
‘‘zoom-in’’ capability that allows for the identification of
brief, high-frequency events and low-frequency variability
simultaneously (Lau and Weng 1995).
For the time series of precipitation and river level, the
continuous wavelet transform (wt) function is applied
from the biwavelet library in R (Gouhier and Grinsted
2014). The normalized, bias-corrected power is computed
and plotted using the method described by Liu et al.
(2007). The continuous wavelet transform results in a
wavelet power at each point in time for each scale
considered in the analysis (e.g. Fig. 7). These colorful
plots illustrate a full range of time series information that
can be examined either across temporal scale at a single
point in time, or across time at a single scale. The dotted
white lines denote the cone of influence (COI) outside of
which results are unreliable due to edge effects near the
beginning and end of the time series. The black lines
outline the areas of 95 % significance obtained from a
regular v2 test.
By examining the results at a specific point in time,
we can tell the relative contribution of low-frequency
(i.e. annual) and high-frequency (i.e. daily) cycles to the
observed precipitation or river level at that time. By
examining a single timescale through time (e.g. Fig. 8),
we are able to quantify how the overall contribution of
that timescale is changing over time. The trends of the
wavelet power time series can also be examined and
plotted about the mean of the time series at selected
scales (Fig. 9).
The purpose of this analysis was to investigate the role
of changes in different time scales. For example, if there is
a regularly occurring cycle at the 4-year timescale (e.g.
ENSO), we would expect to see periods of high power
followed by a period of low power at the 4-year timescale
in a fairly predictable cycle. If, however, there was an
intensification of the hydrological cycle occurring at the
4-year timescale, we would expect to see a trend in the
power as time progressed. Here, we quantified the trends at
selected scales to quantify to what extent there has been an
observable intensification in the precipitation and river
level datasets. In addition, we utilized the scale information
at each time to examine how the relative contribution has
changed in selected periods.
In addition to examining the variability in a single time
series, wavelet analysis also allows for quantifying the
interaction between two time series. This provides useful
information concerning which time series is leading the
other and to what extent the time series are in phase with
one another. Here, the wavelet coherence transform (wtc)
was computed between precipitation and river level time
series using the method described by Veleda et al. (2012)
to calculate the bias-corrected cross-wavelet power. On the
wtc plots, arrows pointing down signify that precipitation
leads river level by p/2.
Results and discussion
Tukano ecological calendar
For the Indigenous peoples of the northwestern Amazon,
knowledge and management practices are linked over an-
nual cycles. As they describe the annual cycles, IK holders
of the Tiquie reference astronomical constellations, most of
them at the celestial equator. Each constellation has a
narrative associated with an episode of the creation of the
world. The constellation considered in each period is one
that is setting in those days in the early evening when it is
already visible at dusk (Cabalzar 2010).
There are ten principal constellations, shown in Table 1
and Fig. 3, plus a variable number of other less significant
Sustain Sci
123

ones for the identification of wet periods. Most of the
constellations are named after animals, some are tools, and
the Pleiades are sometimes represented as a group of stars
or a figure. The larger constellations, like the jararaca
snake and the jaguar, are divided into several parts to im-
prove time measurement.
The calendar emphasizes the hydrological cycle (pre-
cipitation and above all the fluctuations in the level of the
river and its tributaries), fish life cycles (especially species
from genus Leporinus), and agricultural activities. The
cycle of constellations is combined with events, like the
rising of the rivers and the flooding of the surrounding
forest, called Poero in the Tukano language, and short dry
periods that last between 4 days to approximately 2 or
3 weeks, known as Kuma in the Tukano language. There-
fore, ‘‘seasons’’ are roughly differentiated into two cate-
gories: wet periods and dry periods (we use the term
‘‘seasons’’ as synonymous with ‘‘periods’’ throughout this
paper, although neither word may have meaning beyond
our Western context). Wet periods are characterized by
heavy rain and days without ebb of the river, while dry
periods are characterized by sunny days and ebb of the
river. While wet periods are named according to the con-
stellation setting in the early evening, dry periods are
mostly named according to a phenological occurrence,
such as the ripening of cultivated fruits like peach palm,
cucura, umari, abiu, and inga. As an example, the wet
period Yai Poero is named after the jaguar constellation,
Yai, while the dry period Mere Kuma is named after the
inga fruit.
The Tukano year begins with the fall of the constellation
of the jararaca snake, Ana. This astronomical phenomenon
happens in the second week of November in the Gregorian
calendar, which is why in this study the annual cycle starts
in November.
While the constellations can serve as a fixed temporal
framework, the seasons that accompany them are based on
phenomena and biological cycles that can vary a few days
to a few weeks, from year to year. Therefore, the seasons
are not predictable throughout the annual cycle, and some
seasons may be absent in a given year. This is evident in
the annual cycles documented for 2005–2008 shown in
Fig. 3.
2005–2008 data and classification trees
In this study, one way in which the Tukano calendar and
climate data of precipitation and river levels are joined is
through the use of classification trees. Based on data of
constellations, river levels, precipitation, and consecutive
dry days that occurred during the sample period of
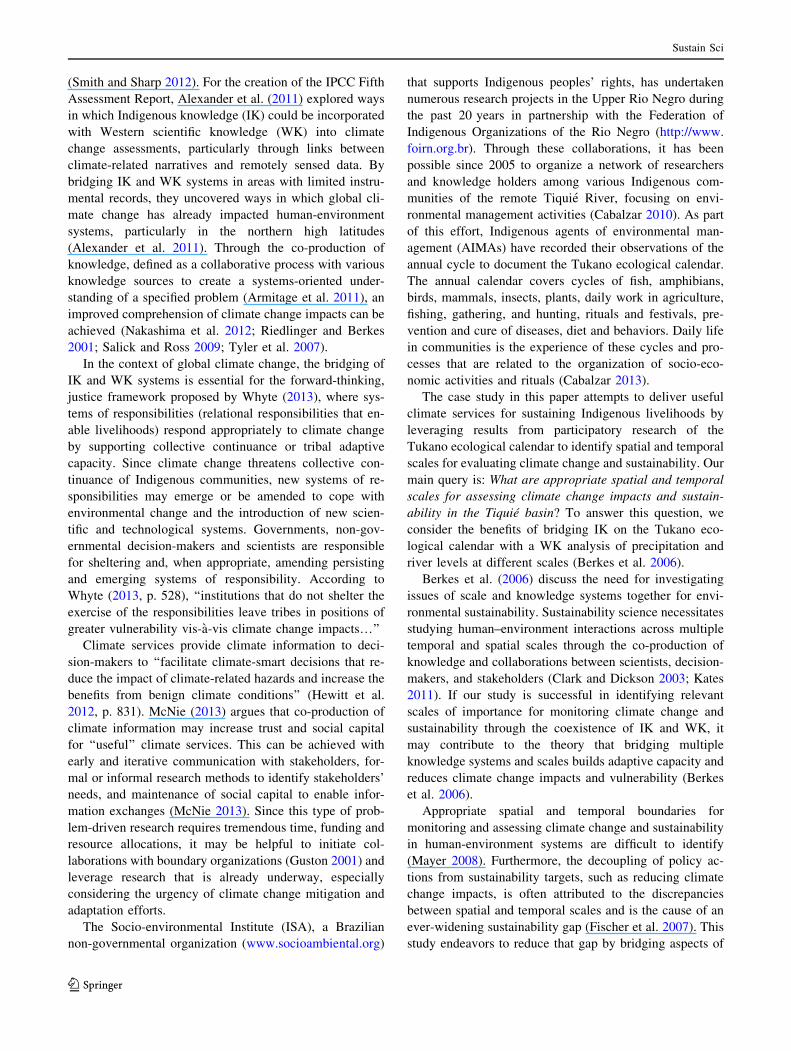
2005–2008, the classification tree shown in Fig. 4a at-
tempts to determine seasons recorded by the AIMAs. Of
the 32 seasons represented across all 3 years, only 11 of the
most prominent across the 3-year sample were defined in
the classification tree for Pirarara Poco (Fig. 4a).
Referring back to Fig. 3, we can see the distribution of
the 32 seasons in 2005–2008 and annual variations. The
classification trees help us to summarize this data by
pulling out the most prominent seasons and their defining
constellations and river level thresholds. For example,
prominent wet periods for Pirarara Poco include: Dahsiu
Poero which occurs under the Dahsiu constellation when
the river is greater than or equal to 416 cm, Sio Yahpu
Poero which occurs under the constellation of Sio Yahpu
with river levels higher than 686 cm, Yurara Poero which
occurs under the Yhe constellation with river levels greater
than 480 cm, and Nokoatero Poero which occurs under the
constellation of Wai Kahsa. One of the strongest dry pe-
riods at Pirarara Poco, with as many as 5 (2006), 15 (2007),
and 7 (2008) consecutive dry days during our sample pe-
riod is Ure Kuma, occurring under the constellations of
Pamo, Muha and Dahsiu. In 2008, Ure Kuma occurred
only under the constellation of Pamo. Mere Kuma with up
to 9 consecutive dry days occurs under the constellation of
Ana when the river level is less than 651 cm. Two short dry
periods with up to 4 or 5 consecutive dry days are Use
Kuma occurring under the constellations of Nokoatero and
Yai, and Hia Kuma under the constellations of Ana, Sio
Yahpu, and Yhe with river levels below 480 cm and above
or equal to 525 cm in our sample period.
Given our 3 years of data for seasons, precipitation
amounts in Pirarara Poco and consecutive dry days, our
classification model clearly identifies 3.5 as the number of
consecutive days without precipitation that differentiates a
dry season like Ure Kuma from a wet season like Sio
Yahpu Poero. This corresponds with knowledge of
Table 1 Primary constellations in the Tukano calendar and the date they start to set on the horizon at 20:30 h (reference point is Sao Pedro,
0.27�N, 69.97�W)
Constellations
Ana (jararaca
snake)
Pamo
(armadillo)
Muha
(jacunda fish)
Dahsiu
(shrimp)
Yai
(jaguar)
Nokoatero
(Pleiades)
Wai Kahsa
(fish rack)
Sio Yahpu
(adze)
Diaoyo
(otter)
Yhe
(heron)
Nov 8 Jan 8 Feb 15 Feb 21 Mar 27 Apr 23 May 3 May 22 Aug 19 Sep 2
Sustain Sci
123
Indigenous agroecosystems where a period of 3–4 days is
needed to dry out small capoeira plots for burning. The
percentages in Fig. 4b (92 % for Sio Yahpu Poero and 8 %
for Ure Kuma) give us an indication of how infrequent a
period of 3.5 consecutive days with no precipitation is
during a 3-year period.
Overall, the role of constellations in defining wet seasons
known from participatory research is evident in the classi-
fication tree for the 3-year sample. However, the classifica-
tion tree does not provide for a clear classification of all wet
and dry seasons. This may be due to the inherent variation in
seasons from year to year as well as the lack of incorporation
of phenological data, which as the participatory research has
identified are essential for distinguishing dry seasons.
Therefore, the fact that we have used these criteria: season
name, constellation name, river level, precipitation, and
consecutive dry days, does not necessarily mean they are the
ones that define constancy in the Tukano ecological calen-
dar. A limitation of this analysis is that we still have not
included data for phenological cycles and other ecological or
astro = Ana,Dahsiu,Diaoyo,Muha,Nokoatero,Pamo,Wai Kahsa,Yai,Yhe
astro = Ana,Diaoyo,Nokoatero,Wai Kahsa,Yai,Yhe
astro = Wai Kahsa
astro = Ana,Diaoyo,Nokoatero,Yai
astro = Ana
river >= 651
astro = Diaoyo
river < 480
astro = Dahsiu
river >= 416
river < 686
river >= 525
Nokoatero Poero6%
Ana Pihkoro Poero3%
Mere Kuma13%
Hia Yunari Kuma4%
Use Kuma10%
Hia Kuma9%
Yurara Poero7%
Dahsiu Poero9%
Ure Kuma2%
Ure Kuma12%
Hia Kuma7%
Sararo Kuma1%
Sio Yahpu Poero17%
yes no
a
dry_days < 3.5
Sio Yahpu Poero92%
Ure Kuma8%
yes nob
Fig. 4 Classification trees for a Seasons = 0.64 Constellations
(astro) ? 0.31 River Levels (river) ? 0.01 Precipitation
(ppt) ? 0.04 Dry Days (dry_days), and b Seasons = 0.18
Precipitation (ppt) ? 0.82 Dry Days (dry_days) at Pirarara Poco
using data corresponding to seasons illustrated in Fig. 3.
Sustain Sci
123

socio-cultural phenomena that might also influence the se-
quence of seasons. Nevertheless, the classification trees
suggest that river levels play a role in distinguishing between
wet and dry seasons and that consecutive dry days only seem
to influence the distinction between a wet and dry season
when constellations or river levels are not considered.
Although this may not reflect reality, it highlights the com-
plexity of the Tukano ecological calendar and begs the
question of how representative this 3-year sample period is of
the interannual variability for the region.
Examining Scales with wavelet analysis
Long-term time series of precipitation and river levels al-
low us to examine the spatial and temporal differences as
well as the interannual variability in these records (Fig. 5).
Wavelet analysis was used to quantify the temporal chan-
ges at each site, thus facilitating an analysis of the indi-
vidual timescales across sites.
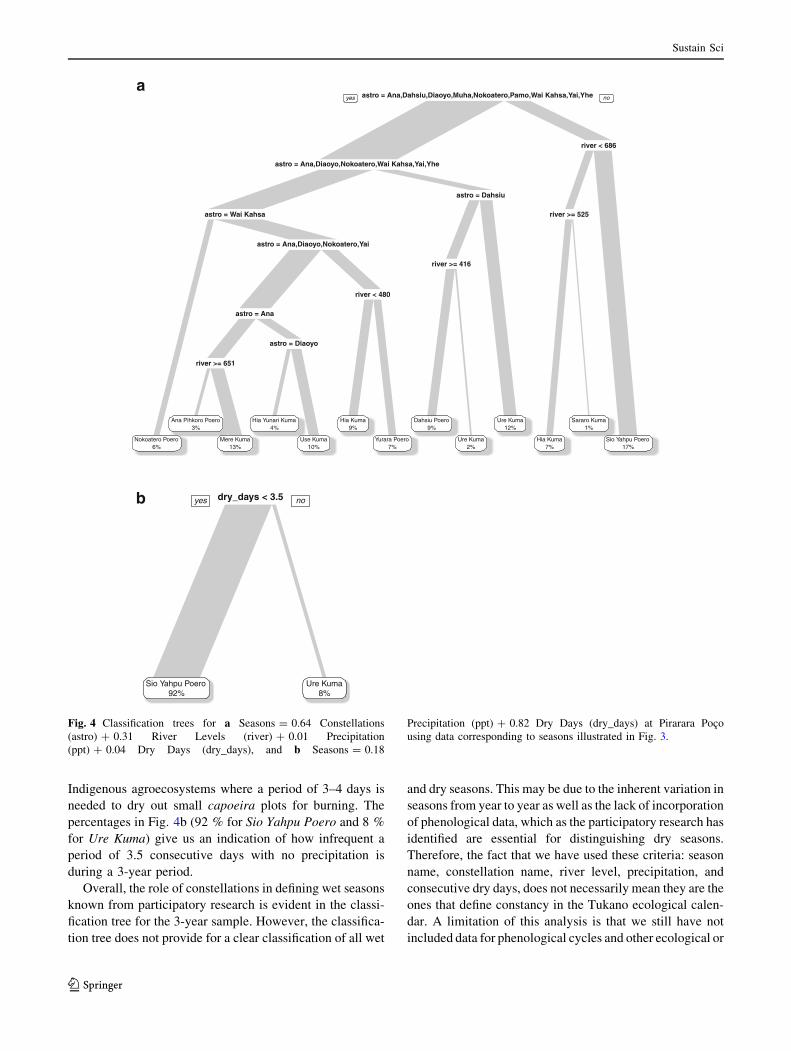
The average wavelet spectra for precipitation shown in
Fig. 6a give us a way of looking at the wavelet power
1982 1988 1993 1998 2003 2008 2012
0
50
100
150
200
Time
PP
T (
mm
)
a
1982 1988 1993 1998 2003 2008 2012
200
400
600
800
1000
1200
Time
Riv
er (
cm)
b
1992 1996 2000 2004 2008 2012
0
50
100
150
200
Time
PP
T (
mm
)
c
1982 1988 1993 1998 2003 2008 2012
200
400
600
800
1000
1200
Time
Riv
er (
cm)
d
1962 1971 1979 1987 1995 2003 2011
0
50
100
150
200
Time
PP
T (
mm
)
e
1982 1988 1993 1998 2003 2008 2012
800
1000
1200
1400
1600
Time
Riv
er (
cm)
f
Fig. 5 Time series of precipitation at a Pari-Cachoeira, c Pirarara Poco and e Taracua, and river levels at b Pari-Cachoeira, d Cunuri and
f Taracua
Sustain Sci
123
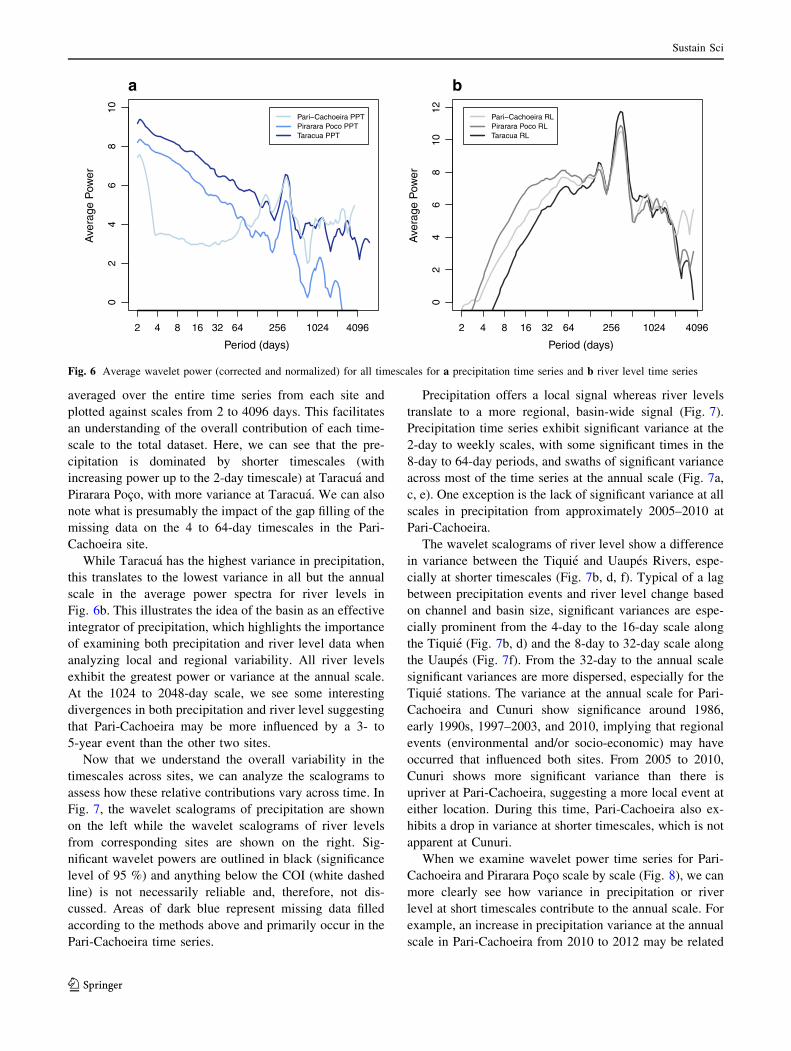
averaged over the entire time series from each site and
plotted against scales from 2 to 4096 days. This facilitates
an understanding of the overall contribution of each time-
scale to the total dataset. Here, we can see that the pre-
cipitation is dominated by shorter timescales (with
increasing power up to the 2-day timescale) at Taracua and
Pirarara Poco, with more variance at Taracua. We can also
note what is presumably the impact of the gap filling of the
missing data on the 4 to 64-day timescales in the Pari-
Cachoeira site.
While Taracua has the highest variance in precipitation,
this translates to the lowest variance in all but the annual
scale in the average power spectra for river levels in
Fig. 6b. This illustrates the idea of the basin as an effective
integrator of precipitation, which highlights the importance
of examining both precipitation and river level data when
analyzing local and regional variability. All river levels
exhibit the greatest power or variance at the annual scale.
At the 1024 to 2048-day scale, we see some interesting
divergences in both precipitation and river level suggesting
that Pari-Cachoeira may be more influenced by a 3- to
5-year event than the other two sites.
Now that we understand the overall variability in the
timescales across sites, we can analyze the scalograms to
assess how these relative contributions vary across time. In
Fig. 7, the wavelet scalograms of precipitation are shown
on the left while the wavelet scalograms of river levels
from corresponding sites are shown on the right. Sig-
nificant wavelet powers are outlined in black (significance
level of 95 %) and anything below the COI (white dashed
line) is not necessarily reliable and, therefore, not dis-
cussed. Areas of dark blue represent missing data filled
according to the methods above and primarily occur in the
Pari-Cachoeira time series.
Precipitation offers a local signal whereas river levels
translate to a more regional, basin-wide signal (Fig. 7).
Precipitation time series exhibit significant variance at the
2-day to weekly scales, with some significant times in the
8-day to 64-day periods, and swaths of significant variance
across most of the time series at the annual scale (Fig. 7a,
c, e). One exception is the lack of significant variance at all
scales in precipitation from approximately 2005–2010 at
Pari-Cachoeira.
The wavelet scalograms of river level show a difference
in variance between the Tiquie and Uaupes Rivers, espe-
cially at shorter timescales (Fig. 7b, d, f). Typical of a lag
between precipitation events and river level change based
on channel and basin size, significant variances are espe-
cially prominent from the 4-day to the 16-day scale along
the Tiquie (Fig. 7b, d) and the 8-day to 32-day scale along
the Uaupes (Fig. 7f). From the 32-day to the annual scale
significant variances are more dispersed, especially for the
Tiquie stations. The variance at the annual scale for Pari-
Cachoeira and Cunuri show significance around 1986,
early 1990s, 1997–2003, and 2010, implying that regional
events (environmental and/or socio-economic) may have
occurred that influenced both sites. From 2005 to 2010,
Cunuri shows more significant variance than there is
upriver at Pari-Cachoeira, suggesting a more local event at
either location. During this time, Pari-Cachoeira also ex-
hibits a drop in variance at shorter timescales, which is not
apparent at Cunuri.
When we examine wavelet power time series for Pari-
Cachoeira and Pirarara Poco scale by scale (Fig. 8), we can
more clearly see how variance in precipitation or river
level at short timescales contribute to the annual scale. For
example, an increase in precipitation variance at the annual
scale in Pari-Cachoeira from 2010 to 2012 may be related
02
46
810
Period (days)
Ave
rage
Pow
er
Pari−Cachoeira PPTPirarara Poco PPTTaracua PPT
a
2 4 8 16 32 64 256 1024 4096
02
46
810
12
Period (days)
Ave
rage
Pow
er
Pari−Cachoeira RLPirarara Poco RLTaracua RL
b
2 4 8 16 32 64 256 1024 4096
Fig. 6 Average wavelet power (corrected and normalized) for all timescales for a precipitation time series and b river level time series
Sustain Sci
123

more to an increase in 4-day power than 16-day power
(Fig. 8a). This is confirmed in Fig. 9a, where we examine
the wavelet power time series trend and how it differs from
the mean (red dashed line). For 2010–2012, the 4-day trend
is far above the mean compared to the 16-day trend, which
implies that the anomaly in the 4-day trend is contributing
most to the annual increase in variance in those years.
River levels at both Pari-Cachoeira and Cunuri tend to
have higher trends prior to 2000 and lower trends after
2000 at shorter timescales. While this switch in Tiquie
River level trends could be related to PDO (Marengo
2007), it could also be indicative of regional influences
related to sea surface temperatures in the tropical Atlantic
as discussed by Gloor et al. (2013). A low trend in river
level variance below the mean at Pari-Cachoeira from 2006
to 2011 is seen at the 4- and 16-day scales (Fig. 9b). This
low variance indicates consistent high or consistent low
river levels at these timescales. Given that the fluctuations
in river levels throughout the year determine times of fish
migration and reproduction, alterations in these patterns
Fig. 7 Wavelet transforms (wt) of precipitation at a Pari-Cachoeira, c Pirarara Poco and e Taracua, and river levels at b Pari-Cachoeira,
d Cunuri and f Taracua
Sustain Sci
123

could impact the sustainability of fisheries and influence
household food security.
The results from Figs. 8 and 9 show how we can narrow
down changes occurring to relevant timescales, in this case
those related to wet and dry periods known through the
Tukano ecological calendar. Although it is difficult to
pinpoint in what season or under what constellation chan-
ges may be occurring based on our 3-year sample, we know
that the 4-day scale is important for distinguishing between
wet and dry periods and for the agricultural practice of
slash-and-burn. Therefore, if we look at the increase in
variance of 4-day precipitation occurring at Pirarara Poco
starting in 2008 and Pari-Cachoeira starting in 2010
(Fig. 9a, c), we can speculate that this increase could im-
pact agroecosystems. An increase in variance of pre-
cipitation every 4 days could affect both capoeira and
mature forest agricultural plots, whereas a change in 8-day
or 16-day variance might only affect mature forest plots.
To examine the interactions between the precipitation
and river levels at corresponding stations, we inspect the
wavelet coherence transforms in Fig. 10. Precipitation and
river levels show strong correlations at the annual scale at
Time
Pow
er
050
0015
000
4−Day
010
0030
00
16−Day
050
015
00
64−Day
010
030
0
1984 1986 1988 1990 1992 1994 1996 1998 2000 2002 2004 2006 2008 2010 2012
362−Day
a
Time
Pow
er
020
040
060
0 4−Day
050
015
00
16−Day
010
0030
00
64−Day
1000
3000
1984 1986 1988 1990 1992 1994 1996 1998 2000 2002 2004 2006 2008 2010 2012
362−Day
b
Time
Pow
er
050
0015
000 4−Day
050
010
00
16−Day
050
100
200 64−Day
020
4060
80
1994 1996 1998 2000 2002 2004 2006 2008 2010 2012
362−Day
c
Time
Pow
er
050
100
150
4−Day0
5001
000
16−Day
010
0030
00
64−Day
500
1500
3000
1984 1986 1988 1990 1992 1994 1996 1998 2000 2002 2004 2006 2008 2010 2012
362−Day
d
Fig. 8 Wavelet power (corrected and normalized) for 4-day, 16-day, 64-day, and 362-day (annual) timescales for precipitation at a Pari-
Cachoeira and c Pirarara Poco, and for river levels at b Pari-Cachoeira and d Cunuri
Sustain Sci
123

all sites except for during the years of 2002–2006 at Pari-
Cachoeira (partially due to missing data) and at Taracua,
and for 2004–2008 at Pirarara Poco. This period of time
happens to coincide with the 2005–2008 records of the
AIMAs for the Tukano ecological calendar, which indi-
cates that the seasons described in those years may not be
representative of the long-term trend. The low trend in
river level at Pari-Cachoeira from 2006 to 2011 that ac-
companies the lower trend in precipitation at all scales
during that same time is observable in the wavelet
coherence transforms (Fig. 10a). Although the arrows
pointing downwards indicate that precipitation leads river
levels at all sites, it is important to keep in mind that the
Cunuri river-gauge station is upriver from the precipitation
measurements at Pirarara Poco.
Times when precipitation is decoupled from river levels
at nearby stations may imply a socio-economic forcing,
such as the creation of a dam, versus a climatic one, such as
changes in the tropical Atlantic SST, MJO, ENSO or PDO.
In addition, although deforestation in the Tiquie is very
Time
Tren
d
050
015
00
4−Day
020
040
060
0
16−Day
020
060
0
64−Day
010
030
0
1984 1986 1988 1990 1992 1994 1996 1998 2000 2002 2004 2006 2008 2010 2012
362−Day
a
Time
Tren
d
010
2030
40
4−Day
010
030
050
0 16−Day
050
010
00
64−Day
1000
2500
1984 1986 1988 1990 1992 1994 1996 1998 2000 2002 2004 2006 2008 2010 2012
362−Day
b
Time
Tren
d
400
800
4−Day
100
200
300
400 16−Day
020
4060
80
64−Day
020
4060
80
1994 1996 1998 2000 2002 2004 2006 2008 2010 2012
362−Day
c
Time
Tren
d
510
15
4−Day
100
300
16−Day
500
1000
64−Day
1000
2000
3000
1984 1986 1988 1990 1992 1994 1996 1998 2000 2002 2004 2006 2008 2010 2012
362−Day
d
Fig. 9 Trends from wavelet power (corrected and normalized) for 4-day, 16-day, 64-day, and 362-day (annual) timescales for precipitation at
a Pari-Cachoeira and c Pirarara Poco, and for river levels at b Pari-Cachoeira and d Cunuri
Sustain Sci
123

minimal compared to other parts of the Amazon basin,
Spracklen et al. (2012) have found that the passage of air
over extensive areas of forest over a period of days can
produce at least twice the amount of precipitation as air
that passes over deforested areas. This is due in part to the
role of forests in precipitation and evaporation recycling
ratios, which van der Ent et al. (2010) estimate to be up to
28 % of precipitation and 48 % of evaporation annually for
the Amazon region. Consequently, deforestation patterns
throughout the Amazon could create changes in rain pat-
terns over forested areas, such as the Tiquie basin.
Conclusions
Throughout the Tiquie basin, high spatial and temporal
variability in precipitation and river levels are likely to
complicate climate change and sustainability analyses. In
an initial attempt to address this complexity, Western re-
searchers have attempted to bridge Indigenous and Western
knowledge systems to provide climate services for
sustainable livelihoods and orient future research. Using
methodology that could be employed with other Indige-
nous or non-Indigenous astronomical and ecological cal-
endars, timescales of relevance for evaluating and
monitoring sustainability in agroecosystems and fisheries
have been identified.
With wavelet analysis, we have isolated a recent trend in
the increase of precipitation variance at the 4-day scale at
Pirarara Poco. This scale, also identified by the classifica-
tion trees, is important to the slash-and-burn practice in
Indigenous agroecosystems for bitter manioc production,
since 3–4 days of sun are needed to dry out and burn small
capoeira plots and 7–10 days are needed to dry out and
burn larger plots of primary or secondary mature forest.
Future research could explore climate change and socio-
economic impacts to precipitation at this 4-day scale and
why changes may be occurring at Pirarara Poco and, to a
lesser extent, at Pari-Cachoeira.
Precipitation and river level trends in variance remained
low at Pari-Cachoeira from 2005 to 2010. Since river levels
give us a more regional indication of precipitation, there
Fig. 10 Wavelet coherence transform (wtc) between precipitation and river levels at a Pari-Cachoeira stations, b Pirarara Poco and Cunuri
stations, and c Taracua stations
Sustain Sci
123

may be a greater possibility of a climatic forcing influ-
encing this period of time. Wavelet coherence transforms
can be used to further explore teleconnections with SST in
the tropical Atlantic, MJO, ENSO, and PDO.
Incorporation of phenological data may improve
definitions of dry periods in the Tukano calendar, par-
ticularly since the naming of these seasons is so tightly
coupled to phenological processes. The tremendous un-
dertaking of sorting through and summarizing the AIMAs
notes is a slow process, yet it results in a wealth of
knowledge that may not be captured by instrumentation.
On the other hand, instrumentation for georeferencing of
data collected by AIMAs could facilitate future evaluations
of spatial and temporal variability.
Our methodology and use of long-term data help us see
that recorded observations of the Tukano ecological cal-
endar for 2005–2008 occur during a time where there was
relatively low variance in precipitation and river level at
the annual scale, which is not characteristic of the long-
term trend in the region. What is currently available in the
2005–2008 record of the Tukano calendar is indicative of
its future utility for climate change and sustainability
assessments in Indigenous territories. Essential to these
assessments is the continued Indigenous participation in
systematic data collection and interpretation of results for
distinguishing between socio-economic and climate forc-
ings and evaluating climate impacts.
Efforts to bridge Indigenous and Western knowledge
systems are vital for sustainable environmental manage-
ment in Indigenous territories and other regions where
traditional management and systems of responsibilities
may be challenged in the context of global climate change
(Berkes et al. 2006; Whyte 2013). Climate change is a not
only a justice issue for Indigenous peoples, but also for
ribeirinhos, caboclos, and other traditional peoples in
Brazil and around the world who depend on land or
riverine systems for their livelihoods. This study con-
tributes to theoretical and conceptual frameworks for
bridging diverse knowledge systems by leveraging the
work of boundary organizations (Guston 2001) and ad-
dressing the coexistence of diverse knowledge systems and
varying spatial and temporal scales together (Berkes et al.
2006).
While the coexistence of IK and WK systems in this
study identified relevant timescales, it remains unclear
whether this climate information will be useful in sup-
porting collective continuance or Indigenous adaptive ca-
pacity and reducing climate change impacts and
vulnerability. It is our hope that the methodology employed
has resulted in knowledge that can be more easily incor-
porated into the Tukano cultural systems (Davis 2006).
Since the delivery of climate services must go beyond peer-
reviewed publication (McNie 2013), our findings will soon
be translated to Portuguese and Tukano. Results will be
disseminated in oral, written, and visual formats and dis-
cussed at workshops to build adaptive capacity and support
emerging systems of responsibilities in Tiquie communi-
ties. Yet, ‘‘integration’’ of WK with IK will only occur if
AIMAs and their communities decide the information from
the Western climate analysis is useful for planning agri-
cultural and fisheries activities.
Acknowledgments Funding for participatory research was provided
by the Gordon and Betty Moore Foundation, Instituto Arapyau,
Projeto Demonstrativo de Povos Indıgenas (PDPI) do Ministerio do
Meio Ambiente, and Rainforest Foundation Norway. We gratefully
acknowledge the work of the 15 AIMAs of the Tiquie who recorded
their observations during 2005–2008, particularly the team coordi-
nators Evaristo Azevedo, Rogelino Alves Azevedo, and Roberval
Araujo Pedrosa. We also appreciate the long-time work of ISA and
the Programa Rio Negro Socioambiental researchers, specifically
Aloisio Cabalzar and Pieter-Jan van der Veld, along with colleagues
Walmir Thomazi Cardoso and Melissa Oliveira. F.V. Cochran addi-
tionally thanks the Bohnstengl Endowment Fund and the IGERT
C-CHANGE NSF080152 program for funding and interdisciplinary
training. This paper is dedicated to Jean-Pierre Vuillomenet
(1937–2014), an aficionado and resident of the Upper Rio Negro since
1968.
References
Alexander C, Bynum N, Johnson E, King U, Mustonen T, Neofotis P,
Oettle N, Rosenzweig C, Sakakibara C, Shadrin V, Vicarelli M,
Waterhouse J, Weeks B (2011) Linking indigenous and scientific
knowledge of climate change. Bioscience 61:477–484
Armitage D, Berkes F, Dale A, Kocho-Schellenberg E, Patton E
(2011) Co-management and the co-production of knowledge:
learning to adapt in Canada’s Arctic. Glob Environ Change
21:995–1004
Ball J, Janyst P (2008) Enacting research ethics in partnerships with
indigenous communities in Canada: ‘‘Do it in a Good Way’’.
JERHRE 3:33–51
Bayley PB (1995) Understanding large river-floodplain ecosystems.
Bioscience 45(3):153–158
Berkes, F (2013) Bridging Sustainability and Indigenous Science.
Workshop paper in: Weaving Indigenous and Sustainability
Sciences: Diversifying our Methods (WIS2DOM) Workshop.
National Science Foundation Arctic Social Sciences Program,
Appendix 3, pp 27–32
Berkes F, Reid WV, Wilbanks TJ, Capistrano D (2006) Bridging
scales and knowledge systems. In: Bridging scales and knowl-
edge systems: Concepts and applications in ecosystem assess-
ment. Millennium ecosystem assessment and Island Press,
Washington, DC
Brewer JP II, Kronk Warner EA (2015) Guarding Against Exploita-
tion: Protecting Indigenous Knowledge in the Age of Climate
Change. University of Kansas, School of Law Working Paper.
Available at SSRN: http://ssrn.com/abstract=2567995
Brunsell NA (2010) A multiscale information theory approach to
assess spatial-temporal variability of daily precipitation. J Hydrol
385(1–4):165–172
Cabalzar A (2010) Manejo do Mundo: conhecimentos e praticas
indıgenas dos povos do Rio Negro. Sao Paulo: Instituto
Socioambiental and Sao Gabriel da Cachoeira: Federacao das
Organizacoes Indıgenas do Rio Negro
Sustain Sci
123

Cabalzar A (2013) Organizacao socioespacial e predomınios linguıs-
ticos no rio Tiquie. In: Epps, P and Stenzel, K. (Org) Upper Rio
Negro: cultural and linguistic interaction in Northwestern
Amazonia. 1ed. Rio de Janeiro: Museu do Indio FUNAI, Museu
Nacional, pp 129–162
Cardoso TM (2010) O Saber Biodiverso: praticas e conhecimentos na
agricultura indıgena do baixo rio Negro. Universidade Federal
do Amazonas, Manaus
Casimirri G (2003) Problems with integrating traditional ecological
knowledge into contemporary resource management. XII World
Forestry Congress, Quebec City
Chernela JM (1994) Tukanoan fishing. National Geographical
Research and Exploration 10
Clark WC, Dickson NM (2003) Sustainability Science: The Emerging
Research Program. Proc Natl Acad Sci USA 100(14):8059–8061
Cochran FV, Brunsell NA (2012) Temporal scales of tropospheric
CO2, precipitation, and ecosystem responses in the central Great
Plains. Remote Sens Environ 127(C):316–328
Davis M (2006) Bridging the Gap or Crossing a Bridge? In: Bridging
scales and knowledge systems: Concepts and applications in
ecosystem assessment. Millennium ecosystem assessment and
Island Press, Washington, DC, pp 143–163
De’ath G, Fabricius K (2000) Classification and regression trees: a
powerful yet simple technique for ecological data analysis.
Ecology 81(11):3178–3192
Emperaire L, Peroni N (2007) Traditional management of agrobio-
diversity in Brazil: a case study of Manioc. Hum Ecol
35(6):761–768
Fischer J, Manning AD, Steffen W, Rose DB, Daniell K, Felton A,
Garnett S, Gilna B, Heinsohn R, Lindenmayer DB, MacDonald
B, Mills F, Newell B, Reid J, Robin L, Sherren K, Wade A
(2007) Mind the sustainability gap. Trends Ecol Evol
22(12):621–624
Fraser JA (2010) The Diversity of Bitter Manioc (Manihot Esculenta
Crantz) Cultivation in a Whitewater Amazonian Landscape.
Diversity 2(4):586–609
Getirana ACV, Bonnet MP, Rotunno Filho OC, Collischonn W,
Guyot JL, Seyler F, Mansur WJ (2010) Hydrological modelling
and water balance of the Negro River basin: evaluation based on
in situ and spatial altimetry data. Hydrol Process
24(22):3219–3236
Getirana ACV, Espinoza JCV, Ronchail J, Filho OCR (2011)
Assessment of different precipitation datasets and their impacts
on the water balance of the Negro River basin. J Hydrol
404(3–4):304–322
Gloor M, Brienen RJW, Galbraith D, Feldpausch TR, Schongart J,
Guyot JL, Espinoza JC, Lloyd J, Phillips OL (2013) Intensifi-
cation of the Amazon hydrological cycle over the last two
decades. Geophys Res Lett 40(9):1729–1733
Gouhier T, Grinsted A (2014) biwavelet: Conduct univariate and
bivariate wavelet analyses, R package version 0.17.3 edn
Goulding M, Carvalho M, Ferreira E (1988) Rio Negro: Rich Life in
Poor Water. SPB Academic Publishing, The Hague
Guston DH (2001) Boundary organizations in environmental policy
and science: an introduction. Sci Technol Hum Values
26:399–408
Hewitt C, Mason S, Walland D (2012) The global framework for
climate services. Nat Clim Change 2:831–832
Huntington HP (2000) Using traditional ecological knowledge in
science: methods and applications. Ecol Appl 10(5):1270–1274
Johnson M (1992) LORE: Capturing Traditional Environmental
Knowledge. Dene Cultural Institute and the International
Development Research Centre, Hay River
Johnson JT, Murton B (2007) Re/placing native science: indigenous
voices in contemporary constructions of nature. Geogr Res
45:121–129
Johnson JT, Louis RP, Kliskey A (2013) Weaving Indigenous and
Sustainability Sciences: Diversifying our Methods (WIS2DOM)
Workshop. National Science Foundation Arctic Social Sciences
Program, pp 1–116
Juarez RIN, Li W, Fu R, Fernandes K, Cardoso ADO (2009)
Comparison of precipitation datasets over the tropical South
American and African Continents. J Hydrometeorol 10:289–299
Junk WJ, Soares MGM, Saint-Paul U (1997) The Central Amazon
floodplain: ecology of a pulsing system. Springer, Berlin,
pp 385–408
Kates RW (2011) What kind of a science is sustainability science?
Proc Natl Acad Sci 108:19449–19450
Kumar P, Foufoula-Georgiou E (1997) Wavelet analysis for geo-
physical applications. Rev Geophys 34(4):385–412
LaDuke W (1994) Traditional Ecological Knowledge and Environ-
mental Futures. Colo. J. Int’l Envtl. L. & Pol’y 5, p 127
Lang DJ, Wiek A, Bergmann M, Stauffacher M, Martens P, Moll P,
Swilling M, Thomas CJ (2012) Transdisciplinary research in
sustainability science: practice, principles, and challenges.
Sustain Sci 7(S1):25–43
Langerwisch F, Rost S, Gerten D, Poulter B, Rammig A, Cramer W
(2013) Potential effects of climate change on inundation patterns
in the Amazon Basin. Hydrol Earth Syst Sci 17(6):2247–2262
Lau K, Weng H (1995) Climate signal detection using wavelet
transform: how to make a time series sing. Bull Am Meteorol
Soc 76(12):2391–2402
Lefale P (2003) Seasons in Samoa. Water Atmos 11(2):10–11
Lertzman DA (2010) Best of two worlds: traditional ecological
knowledge and Western science in ecosystem-based manage-
ment. BC J Ecosyst Manag 10(3):104–126
Liu Y, San Liang X, Weisberg RH (2007) Rectification of the bias in
the wavelet power spectrum. J Atmos Ocean Technol
24:2093–2102
Marengo JA (2004) Characteristics and spatio-temporal variability of
the Amazon River Basin Water Budget. Clim Dyn 24(1):11–22
Marengo JA (2007) Tropical rainforest responses to climate change,
chapter climate change and hydrological modes of the wet
tropics. Springer, Berlin, pp 236–268
Marengo JA, Nobre CA, Tomasella J, Oyama MD, Sampaio de
Oliveira G, de Oliveira R, Camargo H, Alves LM, Brown IF
(2008) The Drought of Amazonia in 2005. J Clim 21(3):495–516
Marengo JA, Tomasella J, Soares WR, Alves LM, Nobre CA (2011)
Extreme climatic events in the Amazon basin. Theor Appl
Climatol 107(1–2):73–85
Mayer AL (2008) Strengths and weaknesses of common sustainability
indices for multidimensional systems. Environ Int
34(2):277–291
Mazzocchi F (2008) Analyzing knowledge as part of a cultural
framework: the case of traditional ecological knowledge.
Environ J 36(2):39–57
McNie EC (2013) Delivering climate services: organizational strate-
gies and approaches for producing useful climate-science
information. Wea Clim Soc 5:14–26
Moran EF (1991) Human adaptive strategies in amazonian blackwater
ecosystems. Am Anthropol 93:361–382
Nadasdy P (1999) The Politics of Tek: Power and the ‘‘Integration’’ of
Knowledge. Arctic Anthropol 36(�):1–18
Nakashima DJ, Galloway McLean K, Thrulstrup HD, Ramos Castillo
A, Rubis J (2012) Weathering uncertainty: traditional knowledge
for climate change assessment and adaptation. UNESCO, Paris
Palm C, Tomich T, van Noordwijk M, Vosti S, Gockowski J, Alegre
J, Verchot L (2003) Mitigating GHG emissions in the humid
tropics: case studies from the Alternatives to Slash-and-Burn
Program (ASB). Environ Dev Sustain 6:145–162
Petheram L, Zander KK, Campbell BM, High C, Stacey N (2010)
‘Strange changes’: Indigenous perspectives of climate change
Sustain Sci
123

and adaptation in NE Arnhem land (Australia). Glob Environ
Change 20(4):681–692
Potter C, Klooster S, Hiatt C, Genovese V, Castilla-Rubio JC (2011)
Changes in the carbon cycle of Amazon ecosystems during the
2010 drought. Environ Res Lett 6(3):034024
RAISG (2012) Amazonia 2012. Areas Protegidas, Territorios Indıge-
nas: http://raisg.socioambiental.org/
Raymond CM, Fazey I, Reed MS, Stringer LC, Robinson GM, Evely
AC (2010) Integrating local and scientific knowledge for
environmental management. J Environ Manag 91:1766–1777
Riedlinger D, Berkes F (2001) Contributions of traditional knowledge
to understanding climate change in the Canadian Arctic. Polar
Rec 37:315–328
Roberts M (1996) Indigenous knowledge and western science:
perspectives from the Pacific. R Soc N Z Misc Ser 50:69–75
Ruddell BL, Kumar P (2009) Ecohydrologic process networks: 2.
Analysis and characterization. Water Resour Res 45(3):1–14
Salick J, Ross N (2009) Traditional peoples and climate change
(Introduction to Special Issue). Glob Environ Change
19:137–139
Sanchez-Cortes MS, Chavero EL (2011) Indigenous perception of
changes in climate variability and its relationship with agricul-
ture in a Zoque community of Chiapas, Mexico. Clim Change
107:363–389
Satyamurty P, da Costa CPW, Manzi AO, Candido LA (2013) A
quick look at the 2012 record flood in the Amazon Basin.
Geophys Res Lett. doi:10.1002/grl.50245
Smith HA, Sharp K (2012) Indigenous climate knowledges. WIREs
Clim Change 3:467–476
Spracklen DV, Arnold SR, Taylor CM (2012) Observations of
increased tropical rainfall preceded by air passage over forests.
Nature 489(7415):282–285
Stoy PC, Richardson AD, Baldocchi DD, Katul GG, Stanovick J,
Mahecha MD, Reichstein M, Detto M, Law BE, Wohlfahrt G,
Arriga N, Campos J, McCaughey JH, Montagnani L, KTP U,
Sevanto S, Williams M (2009) Biosphere-atmosphere exchange
of CO2 in relation to climate: a cross-biome analysis across
multiple time scales. Biogeosciences 6:2297–2312
Therneau TM, Atkinson B, Ripley B (2010) rpart: Recursive
partitioning, R package version 3.8 edn
Torrence C, Compo GP (1998) A practical guide to wavelet analysis.
Bull Am Meteorol Soc 79(1):61–78
Tyler NJC, Turi JM, Sundset MA, Strøm Bull K, Sara MN, Reinert E,
Oskal N, Nellemann C, McCarthy JJ, Mathiesen SD, Martello
ML, Magga OH, Hovelsrud GK, Hanssen-Bauer I, Eira NI, Eira
IMG, Corell RW (2007) Saami reindeer pastoralism under
climate change: applying a generalized framework for vul-
nerability studies to a sub-arctic social–ecological system. Glob
Environ Change 17:191–206
van der Ent RJ, Savenije HHG, Schaefli B, Steele-Dunne SC (2010)
Origin and fate of atmospheric moisture over continents. Water
Resour Res 46(9):1–12
van der Veld P-J (2014) A agricultura indıgena do Alto e Medio Rio
Negro. AGRARIA. In Review
Veleda D, Montagne R, Araujo M (2012) Cross-wavelet bias
corrected by normalizing scales. J Atmos Ocean Technol
29(9):1401–1408
Waliser DE, Moncrieff MW, Burridge D, Fink AH, Gochis D,
Goswami BN, Guan B, Harr P, Heming J, Hsu H-H, Jakob C,
Janiga M, Johnson R, Jones S, Knippertz P, Marengo J, Nguyen
H, Pope M, Serra Y, Thorncroft C, Wheeler M, Wood R, Yuter S
(2012) The ‘‘Year’’ of tropical convection (May 2008–April
2010): climate variability and weather highlights. Bull Am
Meteorol Soc 93(8):1189–1218
Whyte KP (2013) Justice forward: tribes, climate adaptation and
responsibility. Clim Change 120:517–530
Wohl E, Barros A, Brunsell N, Chappell NA, Coe M, Giambelluca T,
Goldsmith S, Harmon R, Hendrickx JMH, Juvik J, McDonnell J,
Ogden F (2012) The hydrology of the humid tropics. Nat Clim
Change 2(9):655–662
Wood H (1999) Displacing Natives: the Rhetorical Production of
Hawai‘i Pacific Formations. Rowman and Littlefield Publishers,
Lanham
Sustain Sci
123