INDICATORS OF SOCIO-NATURAL CHANGE: SCIENTIFIC MEANING AND CONTEXTUAL INTERPRETATION
26
1 Journal of Environmental Assessment Policy and Management Vol. 5, No. 1 (March 2003) pp. 1–26 © Imperial College Press INDICATORS OF SOCIO-NATURAL CHANGE: SCIENTIFIC MEANING AND CONTEXTUAL INTERPRETATION T. OXLEY Department of Environmental Science & Technology Imperial College London, SW7 2AX, UK [email protected] M. LEMON * and P. JEFFREY † * International Ecotechnology Research Centre † School of Water Sciences Cranfield University, MK43 0AL, UK Received 30 October 2002 Revised 6 February 2003 Accepted 6 February 2003 This paper addresses the disparity and conflict between scientific meaning and the contextualised interpretation of (predominately) empirical indicators. This disparity arises due to the difficulty that the scientific community experiences when attempting to communicate with the political and planning community whose perspective remains outside the scope of both the indicator and the tools used. We suggest that for empirical science to be communicated effectively to a policy oriented audience it must be transformed through both theoretical and virtual contexts. The significance of this approach is that at every stage communication becomes possible through a common negotiated reference point, or set of reference points. We highlight a mismatch between the science and the response, emphasising the value of an integrative approach to assessing environmental change and the need for accessible decision support tools in formulating responses to changes in the human-environmental balance. We propose a framework which directly addresses the perceptual, empirical, theoretical and virtual dimensions of indicators and through which the conflicts between the science and the interpretation of socio-natural change may be overcome. Keywords: Socio-natural indicators; integrative framework; communication; perceptions; contextualisation; policy relevance.
Transcript of INDICATORS OF SOCIO-NATURAL CHANGE: SCIENTIFIC MEANING AND CONTEXTUAL INTERPRETATION

1
Journal of Environmental Assessment Policy and ManagementVol. 5, No. 1 (March 2003) pp. 1–26© Imperial College Press
INDICATORS OF SOCIO-NATURAL CHANGE: SCIENTIFICMEANING AND CONTEXTUAL INTERPRETATION
T. OXLEYDepartment of Environmental Science & Technology
Imperial College London, SW7 2AX, [email protected]
M. LEMON* and P. JEFFREY†*International Ecotechnology Research Centre
†School of Water SciencesCranfield University, MK43 0AL, UK
Received 30 October 2002Revised 6 February 2003Accepted 6 February 2003
This paper addresses the disparity and conflict between scientific meaning and thecontextualised interpretation of (predominately) empirical indicators. This disparity arisesdue to the difficulty that the scientific community experiences when attempting tocommunicate with the political and planning community whose perspective remains outsidethe scope of both the indicator and the tools used.
We suggest that for empirical science to be communicated effectively to a policyoriented audience it must be transformed through both theoretical and virtual contexts.The significance of this approach is that at every stage communication becomes possiblethrough a common negotiated reference point, or set of reference points. We highlight amismatch between the science and the response, emphasising the value of an integrativeapproach to assessing environmental change and the need for accessible decision supporttools in formulating responses to changes in the human-environmental balance.
We propose a framework which directly addresses the perceptual, empirical, theoreticaland virtual dimensions of indicators and through which the conflicts between the scienceand the interpretation of socio-natural change may be overcome.
Keywords: Socio-natural indicators; integrative framework; communication; perceptions;contextualisation; policy relevance.
00125.p65 03/12/2003, 12:12 PM1
2 T. Oxley, M. Lemon & P. Jeffrey
Introduction
Human-environmental interactions are fundamental to the evolution of both thenatural and cultural environments we observe around us. Some of the moreproblematic changes that occur are those which appear to happen suddenly and/or unexpectedly, resulting in significant shifts in the balance of the human andnatural systems affected. Traditional scientific methods for addressing such shiftsin the human-environmental balance involve the identification and monitoring ofsuitable indicators of these changes. These indicators are usually, and appropriately,based upon “hard” science, but tend to be contextualised within tight disciplinaryboundaries. Examples of such indicators may include soil or water salinisation,groundwater depletion, river water quality (eutrophication etc.), agro-chemicalpollution, and many more.
Generally, one would expect indicators to be employed to identify potentiallydeteriorating situations, although counterintuitive situations are common. In anideal world, indicators can be used to determine the “state” of the environment,and contemporary scientific methods can subsequently be used to supportappropriate responses to the perceived problem. This process may involve theuse of conceptual models (interpretation of the indicator) and technological tools(e.g. simulation models) or “experts” to identify an appropriate response. In thecase of groundwater depletion, industry approved computer simulation packagessuch as Modflow may be used to model and proscribe responses, such asaugmentation from other sources.
The problem we encounter here is not that these indicators or tools areinappropriate to help assess any set of given human-environmental dynamics, butthat there exists a conflict between their scientific meaning and contextualinterpretation when the knowledge gained is communicated to decision takerswhose perspective remains outside the scope of both the indicator and the toolsused.
It is clear that human-environmental changes are the result of multiple causality,involving complex interacting processes that may be operating at diverse spatialand temporal scales. It is therefore necessary to maintain both a multi-disciplinaryperspective and an integrative approach to the identification, observation andresponse to ecological (or other) indicators. The conflict noted above alludes tothe “problem” of scientists communicating with policy makers; it is where theperceptual and empirical domains coincide (see Fig. 1). This paper suggests thatempirical science outcomes are difficult to communicate directly to a policyaudience, and should instead be transformed through both theoretical and virtualcontexts for effective communication. This problem is not new, and as Hammond
00125.p65 03/12/2003, 12:12 PM2

Indicators of Socio-natural Change3
(1978) noted, “… policy making by scientists is no more precise than policy-making by politicians, economists, or diplomats”. The issue revolves aroundpolicy makers’ desire to base their decision making upon scientific methods andfindings. Without the aid of relevant information, however, they invariably resortto a more intuitive mode of decision making, whereas the scientist relies uponan analytical mode of thought. Hammond clarified the contrasting modes of
Fig. 1. The perceptual, empirical, theoretical and virtual components (domains) of the framework,with “negotiated” indicators representing the common reference point for communication of scienceto policy makers. The outer rings describe, firstly, how these domains relate to Hammond’s modesof thought (from the analytical through the experimental to the intuitive). The second ring showshow these domains support historical memory and the projection of futures (see Fig. 2), and theouter ring suggests their utility for communication and/or decision support. Reference is made tothese rings in Figs. 3 and 9.
00125.p65 03/12/2003, 12:12 PM3

4 T. Oxley, M. Lemon & P. Jeffrey
thought into six distinct categories, and in reality a combination of these modesare utilised during the decision making process:
(1) TRUE EXPERIMENT (Analytical) — Empirical Science(2) HYBRID EXPERIMENT — Statistical Method(3) QUASI-EXPERIMENT (Weakly Analytical) — Simulation Modelling(4) AIDED JUDGMENT — Decision Support Tools(5) INTUITIVE JUDGMENT (Data Known)(6) INTUITIVE JUDGMENT (Data Unknown)
However, as noted by Hammond, the scientist, when required to advise policymakers without appropriate tools or data, “… will resort to the incompetent (sic)cognitive activity of Mode 6”. We would suggest that informed judgment ispossible, where data is both known and understood.
The following sections lead the reader through the four domains identified inFig. 1, revolving around a central focus of an “indicator”, and use the exampleof farming dynamics and aquifer denudation in the Argolid Valley, Greece, toelucidate the process of communicating scientific knowledge to the policycommunity. The significance of this approach, for the purposes of science/policyinteraction, is that communication becomes possible through a common(negotiated) reference point. What we are highlighting is a mismatch between thescience and the response to changing socio-natural environments, emphasisingthe value of an integrative approach to assessing those changes, and the need foraccessible decision support tools in formulating responses to changes in thehuman-environmental balance. Such an approach directly addresses the perceptual,empirical, theoretical and virtual dimensions of indicators, and suggests aframework whereby the conflict between the science and the interpretation maybe overcome.
Figure 1 highlights the overlap between these four domains and Hammond’s“modes” of thought. Modes I to III move from the analytical domain of empiricalscience where indicators tend to be measurable, to the experimental (theoretical)domain which utilises mathematical modelling and simulation techniques revolvingaround abstractions of the measurable indicator. Modes IV to VI, however, arerelated to the virtual domain where decision support tools become prevalent,interpretations can be judgemental, and indicators may be visualised; and to theperceptual domain which relies more upon intuitional interpretations of the visualindicator in relation to the notional indicator negotiated at the outset.
These four domains can be disaggregated further when we examine how theyrelate to other features of the science/policy interface such as historical memory,projected futures, communication and decision support.
00125.p65 03/12/2003, 12:12 PM4
Indicators of Socio-natural Change5
Historical Memory & Projected Futures
In human-environmental interactions it is often possible to observe the co-evolutionof two or more processes which could result in the collapse of an ecosystem (e.g.the sudden demise of a thriving population, or increased ecological vulnerabilityin the face of major anthropogenic perturbations). Non-linear or discontinuouschanges of this type are inherently problematic to assess and understand throughthe use of empirical indicators that are rooted within disciplinary boundaries.Non-linear changes may have the characteristics of a time-bomb (Stigliani, 1991),where a long-term accumulative process provides the conditions for a short-termtrigger to dramatically, and unexpectedly, change the state of the “system” inquestion. Such dynamics have been clearly described in a number of contexts (terMeulen et al., 1992) and models have been developed which indicate the proximityand magnitude of such changes (Oxley, 2000).
Perceptions can also display non-linearities over time with multiple historicalmemories of environmental change being projected towards expected futures andanticipated responses to those futures (Green & Lemon, 1996). The relationshipbetween environmental processes and human perceptions and responses isrepresented schematically in Fig. 2. It is the combination of historical knowledgeand the current state or trend of natural processes (as reflected by indicators)which enables us to project potential change into the future, and thus adapt ourresponses to these changes. However, our perceived future may follow a contrastingtrajectory to that observed in reality (i.e. we may be wrong). This discrepancymay often be accounted for by differences in the perceptions and/or expectationsof the observer. Whether a phenomenon is actually perceived as unexpected isdependent upon the “appreciative system” retained by the individual (Vickers,1983). What is very clear, however, is that when environmental change is apparent,humans can, through inappropriate intervention, turn “damage” into disaster.1
It is important to highlight the distinctions between changes in the physicalenvironment (“physical emergence”), changes in human knowledge about theenvironment (“knowledge emergence”), and changes in perceptions (“perceptualemergence”) (Hadfield, 1997; Hadfield & Seaton, 1999). Our inability to “know”about emergent phenomena does not preclude us from learning from them andthereby expanding the knowledge base upon which we can draw for dealing withfuture uncertainty. Indicators may highlight physical emergence, but their context
1“Nearly all systems which include human beings are unstable and their instability is nearly alwaysthe unwilled result of man’s actions, monstrously multiplied in power by technology but notcorrespondingly informed by increased understanding” (Vickers, 1980).
00125.p65 03/12/2003, 12:13 PM5

6 T. Oxley, M. Lemon & P. Jeffrey
and what we can learn from them relate to perceptual and knowledge emergence,respectively.
As was found in the Argolid Valley (Lemon, 1999), the perceptions of farmers,their cultural predispositions and the environmental constraints within whichthey operate can highlight the way in which perceptions may affect theenvironment. For example, if a virus kills a crop some farmers, or subsequentgenerations, may remember this danger, either individually or through collectivesocial memory, and never replant the crop even if it is the most profitable (Blatsou,1999; Lemon & Blatsou, 1999; Winder et al., 1998). We can, therefore, observethe differing effects and perspectives of human actions (each operating on theirown spatial and temporal scales) upon the environment, and perceive thecomplexity of these socio-natural interactions and potential non-linear responsesby both the human and natural environments. The utility of social enquiry for the“measurement” of natural phenomena is in providing the socio-cultural contextwithin which the empirical science must be communicated.
Fig. 2. A conceptual view of human perceptions and responses to environmental change based aroundhistorical memories and perceived futures. This abstract representation only shows two possibletrajectories, whereas in reality there will be multiple perceptions and multiple environmentalphenomena; the purpose here is to suggest how such trajectories may converge or diverge, and thatour objective, by keeping a tight focus (using indicators), is to keep both perceptions andenvironmental phenomena following similar trajectories.
00125.p65 03/12/2003, 12:13 PM6
Indicators of Socio-natural Change7
Human perceptions and responses are clearly crucial to understanding human-environmental dynamics, but equally complex can be the effects of space andtime involved both within and between human and natural processes. In all suchcontexts — whether agricultural, industrial, social or environmental — there area variety of indicators that could be identified and used to assess the nature ofthe observable change. Such indicators may reflect the “state” of an environmentalphenomenon (e.g. groundwater salinity), but knowledge of the state does notnecessarily help identify causes of the change or communicate the science.
Communication of science to policy audiences
The problems of ensuring that both the top-down and bottom-up processes ofanalysis are complementary, rather than in conflict, inhibits communication ofthe science behind “empirical” indicators to policy audiences. This potential forconflict emerges directly from the perceptions of the observers (stakeholders,scientists, policy makers etc.) which “intrude” upon the identification, specification,perceived significance, and interpretation of indicators. Consequently, considerationmust be given to the contribution that social enquiry can make to the study ofnatural phenomena, with a particular emphasis on how it can provide useful, butlow resolution, “measurements” of those phenomena.
Simulation modelling is also central to the communication of human-environmental dynamics. Elsewhere a mechanism has been suggested by whichnon-linear phenomena can be represented to reflect the qualitative characteristicsof the processes involved, the temporalities inherent in the phenomena, and themagnitude and proximity of the resultant effects (Oxley & Allen, 2000; Oxley,2000). Several recent contributions comprehensively encompasses social, culturaland political processes within the broad spatio-temporal spectrum of anenvironmental process, and provides an implementation of both the quantitativeand qualitative aspects of socio-natural dynamics evident in farming communities(Oxley et al., 2002; Lemon, 1999). This framework encompasses each of thethree key interfaces between concepts of sustainability and policy relevantinformation described by Park & Seaton (1995):
(i) Interpretation of the concept of sustainability at an ecological level;(ii) Linking of ecological processes to attitudes and behaviours of agents (farmers);(iii) Linking of actions and perceptions of agents of change to policy issues.
We have highlighted the potential for conflict between the scientific meaning andthe contextual interpretation of “empirical” indicators. We have also introducedand noted the significance of non-linear phenomena and the perceptions of decisiontakers and others in understanding the message behind changes to such indicators.
00125.p65 03/12/2003, 12:13 PM7
8 T. Oxley, M. Lemon & P. Jeffrey
The nature of this conflict, and of the potential to misinterpret the meaning ofscientific indicators, arises because the indicators, which are based upon hardscience, present their messages in a “bottom-up” manner, whereas societalresponses, based upon a variety of policy mechanisms, are inherently “top-down”.
The important issues refer to the purpose of indicators, how we can drawupon them to communicate the “state” of the environment and subsequently topromote appropriate behavioural responses. The latter issue is, in itself, dependentupon perceptions, values, and the appreciative systems of the “stakeholders”.
The perceptual, empirical and theoretical (mathematical modelling) aspects ofthe science being communicated have already been introduced. The final elementaddressed by this paper is the virtual. It is the utilisation of simulation baseddecision support tools to facilitate communication of the dynamics emergingfrom mathematical models and the data to the “end-user” or policy maker.
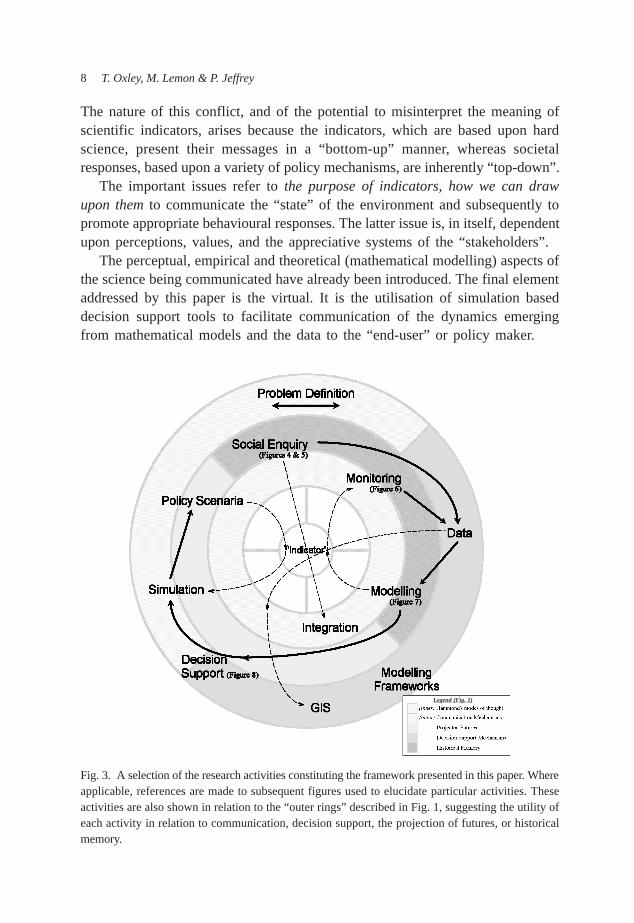
Fig. 3. A selection of the research activities constituting the framework presented in this paper. Whereapplicable, references are made to subsequent figures used to elucidate particular activities. Theseactivities are also shown in relation to the “outer rings” described in Fig. 1, suggesting the utility ofeach activity in relation to communication, decision support, the projection of futures, or historicalmemory.
Legend (Fig. 1)
00125.p65 03/12/2003, 12:13 PM8

Indicators of Socio-natural Change9
The example presented describes the successful integration of human, naturaland mathematical components into an interactive simulation tool.
For the purpose of elucidating this framework we concentrate on the specificproblem of aquifer depletion and salination in the Argolid Valley. There are avariety of research activities that combine to make up the framework and aselection of these are highlighted in Fig. 3.
We follow this example from the initial social enquiry activities, through datacollection (monitoring) and modelling, to a decision support system whichfacilitates the exploration of alternative policy scenaria. At each stage we notethe nature of relevant shortcomings or benefits within the given domain (seeFig. 1); we highlight the relationship of the information gained with regards tothe indicator acting as a focus for communication (in this example, aquiferdepletion).
Social Enquiry and the Measurement of Natural Phenomena
In the Argolid Valley, Greece, there has been significant depletion and denudation(salinisation) of the groundwater that provides the main source of irrigation waterfor agriculture in the region. There are two obvious (and simple) indicators thatcould be used to describe the situation and suggest trends in the state of theaquifer; both of which are useful for management of agriculture: the depth of thewater table, and the salinity of the accessible water.
A variety of responses may be observed to mitigate the indicated trends:drilling deeper boreholes, recharging the aquifer from less saline sources, switchingto non-irrigated or salt-tolerant crops, etc. Such responses have occurred andhave been reported elsewhere (see, for example, Lemon, 1999; Poulouvassilis &Giannoulopolos, 1999; Giannoulopolos, 2000). The success of drilling newboreholes or augmenting the aquifer from alternative sources has been variedbecause of the diverse perceptions and responses of local stakeholders. It isimportant to understand the perceptions of local stakeholders since it is perceptionwhich will inform the response.
To the local farmers it came as a surprise to find that their previously“inexhaustible” water supply became rapidly salinated due to over abstractioncombined with several years of low rainfall. The initial trigger for this discontinuityin the supply of useable water may have been the introduction of price supporton certain irrigated crops (oranges) which consequently replaced the traditionallygrown un-irrigated crops (olives, tobacco etc.). The political structures providingthis price support would never have conceived of such effects upon aquifersalinisation, and if they had been more informed, their response would emergefrom a perspective which may be incompatible with that of the local “stakeholders”.
00125.p65 03/12/2003, 12:13 PM9

10 T. Oxley, M. Lemon & P. Jeffrey
The conflict between scientific information and its contextual interpretationis clear.
The potential value of data about natural phenomena which can been acquiredthrough social enquiry is often neglected by the natural sciences and undervaluedby the social sciences. Such data invariably makes a number of assumptions thatmay not be readily acceptable to proponents of traditional scientific enquiry (i.e.the use of approximate data). It is, however, seen as supplementary and not inconflict with such a paradigm. There is a clear distinction between data thatprovides some measurement of the extent to which natural phenomena havechanged and scientific enquiry which is intent upon establishing the nature ofthose phenomena and the relationship between them. For example, informationabout the amount of salt in ground water in different places and at different timesdoes not inform about the impact of salt upon various soil types and croppingregimes, nor does it inform about the possible causes of the salinisation.
Having made this distinction it is necessary to focus upon the characteristicsof monitoring or the measurement of natural phenomena. “Good science” wouldassume that this is accurate to the nth degree and is undertaken according tostandard scientific procedures, often requiring the employment of considerabletechnical expertise and accompanying technology. This traditional scientific modelshould be capable of providing an accurate picture about the state of a particularphenomenon at any one time, however it has a number of limitations that restrictits value for informing policy. Firstly, technical and personnel constraints limitthe number of measurements that can be undertaken, at any one time or overtime. Secondly this restricts the ability to obtain information about spatial variation.These limitations mean that it is often impractical to provide data aboutthe variation within an area and between areas. Finally, once a natural processhas been identified as significant it is often impossible to obtain historical dataabout it.
Therefore, a complementarity can be identified between the acquisition ofrelatively few, accurate (assuming scientific proficiency) measurements whichcannot readily inform about how that transformation contributes to the widerpicture and some other way of collecting and presenting data. The latter maycompromise accuracy but can inform in a more responsive manner and over abroader canvas (see Conway, 1985).
A basic assumption underpins the use of social enquiry techniques for thispurpose. This is that the key actors in any system not only respond to the systemas they see it but that they also have a reasonable understanding of the degreeof change in the natural world within which they operate. For example, a farmerwill often be able to inform fairly accurately about the amount of water he or sheuses, the changing flows and salt content of that water and the depth at whichit is accessed (see Table 1).
00125.p65 03/12/2003, 12:13 PM10

Indicators of Socio-natural Change11
The use of such data from a sample of farmers is crucial to developing anhistorical picture of qualitative and quantitative change over temporal and spatialscales which would not be possible from the more recent technical measurementof individual bore-holes (see Fig. 4). It is of course essential that some technicalmeasurement is undertaken to validate, or otherwise, the data obtained fromrespondents.
While Fig. 4 indicates the qualitative and quantitative decline in ground waterfor the area as a whole prior to 1995 it does not represent a spatial analysis ofthis decline. As irrigated agriculture expanded there was a lowering of the aquiferwith respect to sea level. Excessive pumping caused salinisation problems due to
Table 1. Sample data from field interviews.
Interview Village Year Depth Initial Current FailureNumber Opened Metres Flow Flow Type
(m3/hr) (m3/hr)
100 1 1990 50 40 40 no change
35 2 1974 120 0 0 no flow
2 13 1968 160 90 90 too salty
86 4 1980 200 40 0 no flow
Fig. 4. Failures in wells/boreholes derived from interview data (from Lemon et al., 1994).
0
50
100
150
200
250
300
350
400
1915 1925 1935 1945 1955 1965 1975 1985 1995
Year drilled
Dep
th (
m)
dry when drilled dry since drilled too salty now
00125.p65 03/12/2003, 12:13 PM11

12 T. Oxley, M. Lemon & P. Jeffrey
Fig. 5. Estimated changes in the salt content of aquifers by zone (based on data collected frominterviews) [from Lemon et al., 1998].
the intrusion of sea water. Figure 5 presents this variation in salt content throughtime and across the study area.
This emphasises how social enquiry is able to give us a perspective of theseindicators from the viewpoint of local stakeholders (farmers), and it provides anidea of their potential responses to these indicators and other related factors.There are many other influences upon farmers’ responses to change — social,cultural, economic etc. — for which indicators can be defined, and the complexityof the systems in question emphasises the importance of a multidisciplinary andintegrative approach.
In each of these representations of the indicator (aquifer level /salinity) thereare uncertainties and the data must be treated with caution. Firstly, for example,farmers may not be entirely honest about their water consumption, thus distortingthe accuracy of the data. However, such data, although of poor resolution, helpsto triangulate the problem and may identify areas where monitoring studies wouldbe useful. This data by itself provides a perspective from the stakeholder (farmer)which can be linked to the science, but emerges from their historical memoriesrather than accurate historical records — i.e. it emerges from the perceptualdomain (see Fig. 1). In itself it provides little understanding of the causes ofaquifer depletion and salination, but it does represent a state of the environmentwhich the farmers respond to. In order to expand on this perceptual view of theindicator we must move into the empirical domain and collect measurable datarelating to the condition of the aquifer.
00125.p65 03/12/2003, 12:13 PM12

Indicators of Socio-natural Change13
Thus, data describing the aquifer level and salinity were also obtained throughempirical measurements (Fig. 6). Qualitatively these data reflect the salinityestimations shown in Fig. 5, confirming the validity of both datasets. The precisionand spatial resolution of these empirical data are clearly better than the socialenquiry data. These data, however, cannot capture the temporal dimension ofsalinity changes (see Fig. 4) since they represent only a single snapshot in time.
With these perceptual and empirical data available, we can move into the“theoretical” domain (see Figs. 1 & 3) where these empirical data (plus additionalsnapshots) can be used to validate models of the various dynamics. These modelsshould encompass both the natural and human contexts. To this end aquifer
Fig. 6. Empirical measurements of the chloride content (ppm) of the aquifer in the Argolid Valley(Autumn 1997) [from Poulouvassilis & Gianoulopoulos 1999].
00125.p65 03/12/2003, 12:13 PM13

14 T. Oxley, M. Lemon & P. Jeffrey
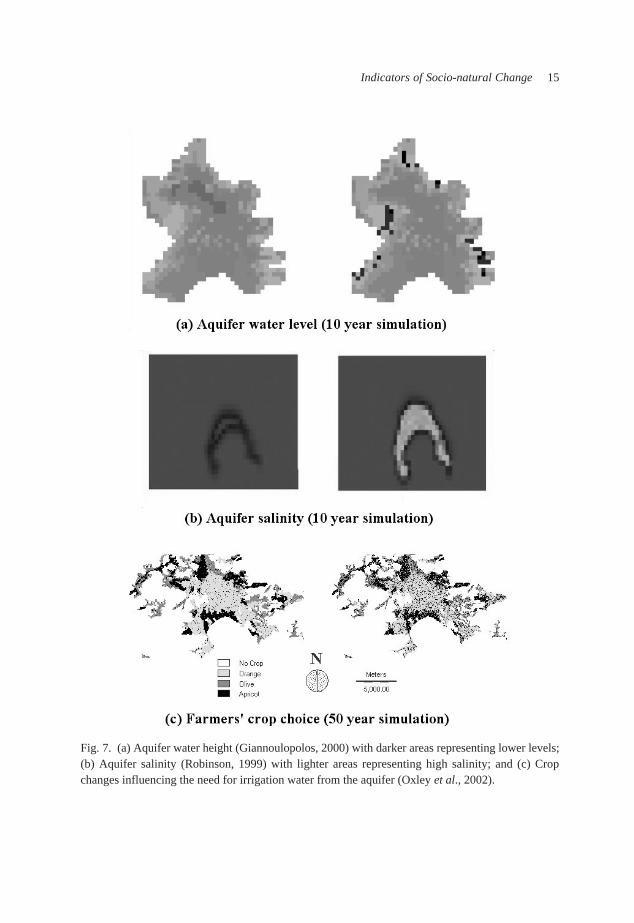
models were developed (Giannoulopolos, 2000; Robinson, 1999) alongside modelsof the farmers’ crop choice decisions (Winder et al., 1998; Oxley et al., 2002),the latter emerging directly from the social enquiry activities. In Fig. 7 we showthe nature of the output of these models in relation to the aquifer level andsalinity, and changing crop distributions after 10–50 simulated years. Figure 7(a)shows the effects of current irrigation practices on the water levels in the aquifer.It can be seen that where the greatest pressures from irrigation exist around theedge of the valley, the water levels are significantly reduced (dark areas) in theaquifer after 10 years, leading potentially to both boreholes drying up and aquifersalination (see Fig. 7(b)) (Lemon, 1999; Lemon et al., 1994; Poulovassilis &Giannoulopoulos, 1999). Finally, Fig. 7(c) shows how the distribution of cropsmay vary over 50 years, thus also affecting the irrigation pressures on the aquifer.
The models transform the empirical and social enquiry data into a form whichallows projections into the future to be made. However, at this stage most modelsoperate in a “research” mode, and must be transformed into “policy” modelsthrough integration, adaptation and/or rebuilding — before they are able to respondto and interact with each other and simulate policy scenaria defined to address,in this example, aquifer depletion and salination (Oxley et al., 2003).
Thus we can observe the indicator from three contrasting perspectives; eachproviding a different representation that is compatible with the alternative contextsor domains from which these perspectives emerge (see how the activities notedin Fig. 2 map onto the domains in Fig. 1). The key point emphasised here is theconsistency between the domains as they all revolve around a common referencepoint. Figures 5, 6 and 7(b) can be interpreted as perceptual, empirical andtheoretical representations of aquifer salinity within this socio-natural context.
The potential variety of responses to changes in these indicators, when placedin context, becomes clear. Direct responses, such as aquifer augmentation fromalternative sources (karstic springs etc.) or controls imposed upon abstraction forirrigation, may be expected to address this problem of a denuded resource whenusing empirical measurements and hydrological models (see Figs. 6 and 7(a)).However, when observed within the context of complex human responses, conflictemerges between these “hard” (empirical) indicators and the “soft” (social enquiry)indicators noted above. The observable effect of these direct responses may notbe as expected if the human context is ignored.
Furthermore, the possibility that the initial trigger for this deterioration mayhave been the introduction of European Union price support on orange productioncannot be discounted. The accession of Greece to the EU, and the availability ofprice support on oranges, coincided with a rapid deterioration in the aquifer. Thiscontext must be taken into consideration to ensure a reasonable interpretation ofthe emerging dynamics and the specification of appropriate remedial responses.
00125.p65 03/12/2003, 12:13 PM14
Indicators of Socio-natural Change15
Fig. 7. (a) Aquifer water height (Giannoulopolos, 2000) with darker areas representing lower levels;(b) Aquifer salinity (Robinson, 1999) with lighter areas representing high salinity; and (c) Cropchanges influencing the need for irrigation water from the aquifer (Oxley et al., 2002).
00125.p65 03/12/2003, 12:13 PM15

16 T. Oxley, M. Lemon & P. Jeffrey
The cultural context is equally significant since the introduction of price supportdoes not necessarily result in equivalent responses from different communities.For example, in the Marina Baixa (Spain), where the same price support isavailable, local Nispero farmers resist the temptation of subsidies since it isrecognised that it would distort a market which serves them well (Mata, 1999;Mata & Lemon, 1998).
However, the significance of these indicators (with respect to behaviouralresponses) and the verification of any suggested trends in the human-environmentalbalance, can only be comprehensively understood within the context of the socio-cultural environment, related policy instruments, and natural and meteorologicalprocesses.
Virtual Simulations & Communication
The examples presented above involve hydrological indicators which have theirown spatio-temporal and socio-cultural characteristics. They can provideinformation about the detailed dynamics of the “state” of a system at a varietyof conceptual levels. However, in order to communicate their meaning effectivelyto policy makers, land managers, local stakeholders, and others, these sameindicators must be located within a context which makes them accessible andcomprehensible. It is often stakeholders who are required to respond to changesin the human-environmental balance with suitable policy and behaviouralresponses. If they cannot do this, then both the science and the indicators usedwill have failed to achieve the “desired” response.
The ability to make the process useful to stakeholders requires an integrativemethodology, dynamic simulation tools, and a medium for communicating thescientific findings in an accessible way. This process of integration, and thedevelopment of decision support tools, is not trivial. This was discovered byEngelen and others (2000) whose main objective was to show the feasibility ofintegrating a set of conceptually and technically diverse research models to producea policy model (decision support tool) that was accessible to local stakeholders.This process of technical integration highlighted two significant problems (Oxleyet al., 2003):
(1) Difficulties in intra-disciplinary communication between scientists, modellers,local stakeholders, and policy makers; and
(2) Resistance to the simplifications of the science which are unavoidable in thiscontext of integrative modelling.
The problems with intra-disciplinary communication have been reported elsewhere(van der Leeuw, 1998; van der Leeuw & Garenne-Marot, 1999; Winder & van
00125.p65 03/12/2003, 12:13 PM16

Indicators of Socio-natural Change17
der Leeuw, 1997), with successful communication requiring the use of a commondialogic framework spanning the disciplinary boundaries.
The problems arising from attempts to transform existing research modelsinto integrated policy models revolves around the unavoidable simplification ofsome of the (representations of ) science. Both scientists and modellers becomevery defensive when their work requires simplification in order to accommodateall the other necessary components of an integrative methodology. From theperspective of a virtual simulation environment such conflict is counterproductive,primarily because models can only ever be a gross simplification of the realworld, and the process of model development must continually take account ofthe trade-offs necessary to create an appropriate balance between reality, generalityand precision. A dynamic computer model is “essential for understanding reality,[but] should not be confused with reality itself.” (Levins, 1966).
The outcome of this integration of a variety of models within a state-of-the-art simulation environment has been (Oxley & Lemon, 2003):
(i) The development of a suite of integrated policy models addressing climate,surface and sub-surface hydrology, natural vegetation, agronomic activities,socio-economic influences and land-use dynamics;
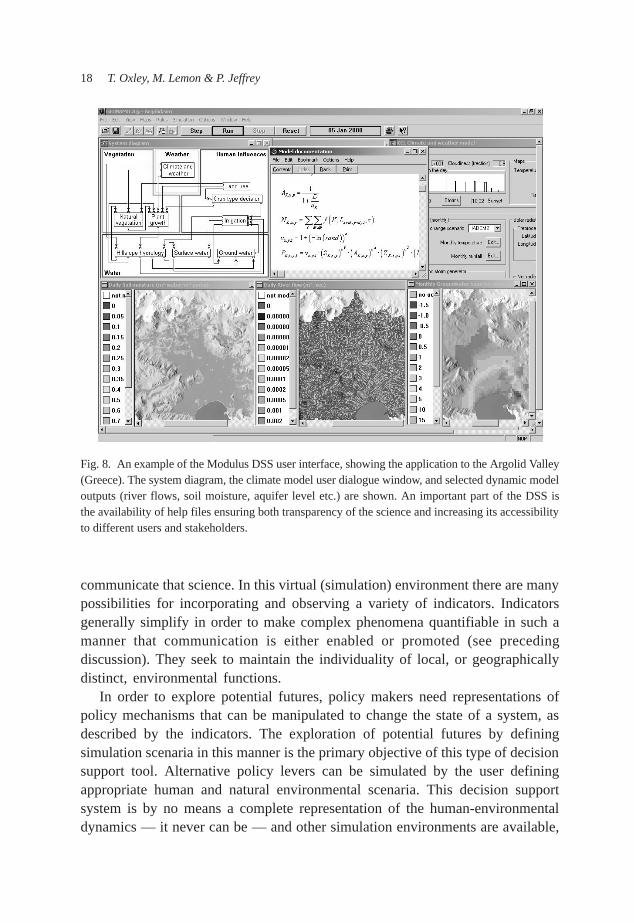
(ii) The provision of a user-friendly dialogic interface which allows policy makersto define appropriate scenaria for examining a variety of policy options. Anexample of this interface, showing user dialogic, model and help windows,and the Modulus DSS system diagram is given in Fig. 8;
(iii) The simulation of policy scenaria showing the potential utility of the decisionsupport tool in selected contexts; and
(iv) The involvement of end-users in workshops to review the potential for suchdecision support tools in exploring sustainable futures.
Each of these points is critical to the use of integrative modelling in the explorationof potential pathways towards sustainable land-use decisions, management andbehaviour; pathways which are not always compatible. The models themselvesprovide the simulation “engine” or dialogic interface that is necessary to assistthe end-users in scenario generation and interpretation. The ability to simulatepolicy scenaria that are relevant to the socio-natural context of the particularenvironment is crucial. This reflects the importance of local stakeholders beinginvolved in both the development and use of the model. People who know thecharacteristics of the region will respond in complex ways to different policyinstruments. They are, therefore, key to the development of sustainable pathwaysor perhaps more realistically the identification of unsustainable ones.
Within this integrative “engine” are policy models based upon hard empiricalscience together with the mathematical representation of indicators selected to
00125.p65 03/12/2003, 12:13 PM17
18 T. Oxley, M. Lemon & P. Jeffrey
communicate that science. In this virtual (simulation) environment there are manypossibilities for incorporating and observing a variety of indicators. Indicatorsgenerally simplify in order to make complex phenomena quantifiable in such amanner that communication is either enabled or promoted (see precedingdiscussion). They seek to maintain the individuality of local, or geographicallydistinct, environmental functions.
In order to explore potential futures, policy makers need representations ofpolicy mechanisms that can be manipulated to change the state of a system, asdescribed by the indicators. The exploration of potential futures by definingsimulation scenaria in this manner is the primary objective of this type of decisionsupport tool. Alternative policy levers can be simulated by the user definingappropriate human and natural environmental scenaria. This decision supportsystem is by no means a complete representation of the human-environmentaldynamics — it never can be — and other simulation environments are available,
Fig. 8. An example of the Modulus DSS user interface, showing the application to the Argolid Valley(Greece). The system diagram, the climate model user dialogue window, and selected dynamic modeloutputs (river flows, soil moisture, aquifer level etc.) are shown. An important part of the DSS isthe availability of help files ensuring both transparency of the science and increasing its accessibilityto different users and stakeholders.
00125.p65 03/12/2003, 12:13 PM18
Indicators of Socio-natural Change19
accessible, and able to provide similar virtual decision support tools (Muetzelfeldt& Taylor, 1998; Muetzelfeldt, 2000).
Any exploration of sustainable futures will require the simulation andinterpretation of carefully defined policy scenaria, observing changes based uponhard science communicated through a virtual environment based around bothempirical and complex theoretical indicators, and using a communication mediumthat is accessible to the observer or user.
An Integrative Framework
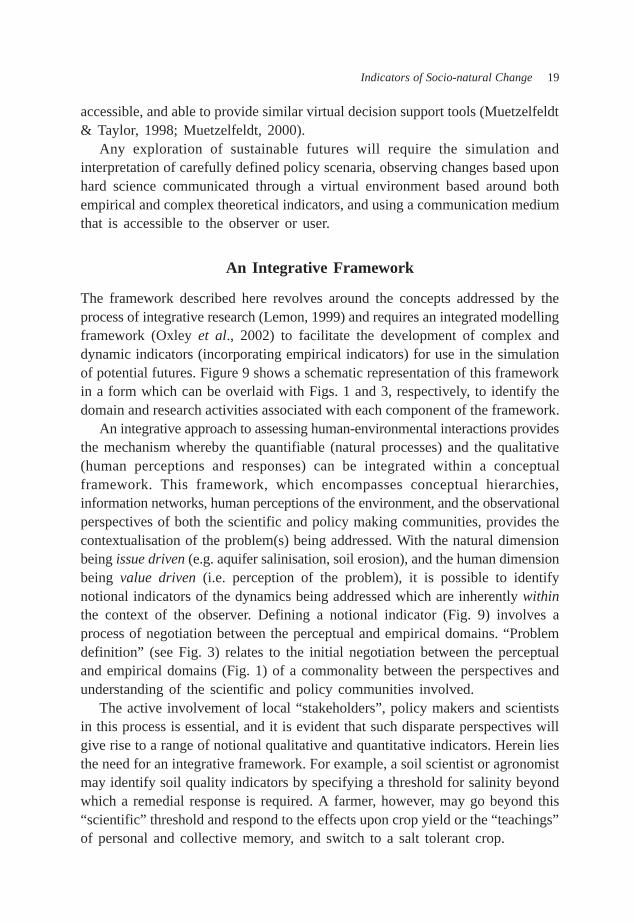
The framework described here revolves around the concepts addressed by theprocess of integrative research (Lemon, 1999) and requires an integrated modellingframework (Oxley et al., 2002) to facilitate the development of complex anddynamic indicators (incorporating empirical indicators) for use in the simulationof potential futures. Figure 9 shows a schematic representation of this frameworkin a form which can be overlaid with Figs. 1 and 3, respectively, to identify thedomain and research activities associated with each component of the framework.
An integrative approach to assessing human-environmental interactions providesthe mechanism whereby the quantifiable (natural processes) and the qualitative(human perceptions and responses) can be integrated within a conceptualframework. This framework, which encompasses conceptual hierarchies,information networks, human perceptions of the environment, and the observationalperspectives of both the scientific and policy making communities, provides thecontextualisation of the problem(s) being addressed. With the natural dimensionbeing issue driven (e.g. aquifer salinisation, soil erosion), and the human dimensionbeing value driven (i.e. perception of the problem), it is possible to identifynotional indicators of the dynamics being addressed which are inherently withinthe context of the observer. Defining a notional indicator (Fig. 9) involves aprocess of negotiation between the perceptual and empirical domains. “Problemdefinition” (see Fig. 3) relates to the initial negotiation between the perceptualand empirical domains (Fig. 1) of a commonality between the perspectives andunderstanding of the scientific and policy communities involved.
The active involvement of local “stakeholders”, policy makers and scientistsin this process is essential, and it is evident that such disparate perspectives willgive rise to a range of notional qualitative and quantitative indicators. Herein liesthe need for an integrative framework. For example, a soil scientist or agronomistmay identify soil quality indicators by specifying a threshold for salinity beyondwhich a remedial response is required. A farmer, however, may go beyond this“scientific” threshold and respond to the effects upon crop yield or the “teachings”of personal and collective memory, and switch to a salt tolerant crop.
00125.p65 03/12/2003, 12:13 PM19

20 T. Oxley, M. Lemon & P. Jeffrey
Fig. 9. An integrative framework for communication using indicators as a focus, and whichovercomes the conflicts between the scientific meaning of indicators and their contextualinterpretation. The framework is also shown in relation to the “outer rings” described in Fig. 1,suggesting how each element of the framework relates to communication, decision support, theprojection of futures, and/or historical memory.
Legend (Fig. 1)
The necessity of identifying this notional indicator is to provide a tangible andcontextualised focus for subsequent assessments that may involve empirical andcomplex integrated socio-natural indicators. From this basis models can bedeveloped and/or integrated which are based upon appropriate mathematicalrepresentations, with all the omissions and assumptions being clearly identifiedto reflect the context of the problem. Within such a simulation environment bothsimple and complex indicators (Determinable Indicator — Fig. 9) can be specifiedmathematically and used as the focus for observing simulations of the human-environmental dynamics in question. Overlaying Figs. 9 and 1 we have movedfrom the empirical, through the theoretical (mathematical models) to a virtual(simulation) context whilst maintaining a consistent focus.
00125.p65 03/12/2003, 12:13 PM20

Indicators of Socio-natural Change21
Mathematical modelling, itself being driven by empirical data, provides thebasis for virtual simulations of policy scenaria within an interactive decisionsupport environment such as that described above. Interpretation of the emergentdynamics of this virtual system will be through the observation of indicators (e.g.aquifer salinity and level (Figs. 6, 7(a) and 7(b)) that have been contextualisedwithin each of the four domains discussed in this paper. Through this process the“scientific meaning” emerging from the empirical domain has been translatedthrough both the theoretical and virtual domains, facilitating communication to,for example, a policy audience operating from an intuitive perspective and basedin the perceptual domain.
Contextual interpretation of the emergent dynamics using a common set ofindicators in this manner will not only ease communication, but will also providethe observer with an increased understanding of the apparent connectivity of thedisparate processes involved. This framework does not discount the utility ofempirical indicators, but emphasises the need to place them in an appropriatecontext to achieve the “desired” anthropic response. This framework allows avariety of notional indicators to be assimilated prior to model specification, thusavoiding the use of overcomplicated scientific mechanisms that may be inaccessibleto the observer (user), provoking them to resort to a “rule-of-thumb” that mayhave served well in the past, as observed by Hammond (1978).
The framework described in this paper is by no means all-encompassing, butit does provide a mechanism through which the communication of science topolicy makers can be facilitated. It highlights the utility of social science inadducing causalities underlying complex environmental changes and identifyingtheir politico-economic contexts, moving towards a political ecology approach aspremised by “critical realists” such as Bhaskar (1997). Broadening the perspectivein this way the reader may also benefit from examining complementary conceptualframeworks developed by Wilson and Bryant (1998) and Tilzey (2002).
Conclusions
The problem addressed by this paper is the disparity and conflict between thescientific meaning, and contextualised interpretation, of (predominately) empiricalindicators. This disparity arises out of the difficulty that the scientific communityexperiences when attempting to communicate the science to the politicalcommunity. The key issues addressed by this paper include:
• Relationships between historical memory and projected futures, noting thedegree to which perceptions (Green & Lemon, 1996) and “appreciative” systems(Hadfield & Seaton, 1999) influence our future in the absence of empiricaldata;
00125.p65 03/12/2003, 12:13 PM21

22 T. Oxley, M. Lemon & P. Jeffrey
• Modes of thought involved in decision making, showing how Hammond’s (1978)six “modes of thought” can be mapped onto integrative research activities(Lemon, 1999) and overcome some of the problems found in communicatingscience to a policy audience;
• Multiple perspectives of indicators of socio-natural change, concentrating onaquifer denudation (Lemon, 1999; Poulouvassilis & Gianoulopoulos, 1999),emerging from the different domains identified in Fig. 1;
• Communication of science to policy audiences, by following a pathway throughthis framework resulting in a DSS contextually encompassing the key dynamicsand which is accessible to a policy audience (Engelen et al., 2000; Oxleyet al., 2002).
The mechanism by which we have shown that scientific meaning (in its empiricalcontext) may be communicated to policy audiences is through a framework basedupon four perspectives of a common point of reference: an indicator or set ofindicators. The perspectives, each of which provides an alternativecontextualisation of the indicator, are the perceptual, the empirical, the theoretical,and the virtual. The benefits and shortcomings of the knowledge emerging fromthe four domains as we progress through the research activities described abovecan be summarised as follows:
The integration of the perceptual, empirical, theoretical and virtual dimensionsof indicators provides a mechanism whereby scientific information can beeffectively communicated to a policy audience. There is always a commonreference point about which intra-disciplinary communication can revolve, andwe have shown that:
• Social enquiry data can contextualise the indicator within its socio-culturalperspective;
• Problem definition (notional indicators) will occur through negotiation betweenthe perceptual and empirical domains;
• Empirical data (monitoring) will drive the mathematical representations of therelevant processes (modelling);
• Complex integrative indicators can be developed within a theoreticalenvironment driven by empirical data;
• Integration of models and data into decision support and GIS systems providesthe “engine” for simulating potential futures; and
• Policy scenaria can be simulated in a user-friendly environment based withinthe negotiated boundaries from which the notional indicator emerged.
The entire process, from initial negotiations between scientists and policy makersto the observation of simulated projections into the future has revolved around
00125.p65 03/12/2003, 12:13 PM22

Indicators of Socio-natural Change23
Table 2. Summary of the characteristics of the four domains comprising the framework, using theexamples from the Argolid Valley, Greece.
Domain Characteristics
Benefits Shortcomings
Perceptual
Empirical
Theoretical
Virtual
Perceptual
• Identification of the “problem”• Identification of a notional indicator
(e.g. aquifer level and salinity)
• Identification of a notional indicator(e.g. aquifer level and salinity)
• Analysis of aquifer dynamics (withintight boundaries)
• Simulation of farmers’ crop choicedecisions (based upon culturalpredispositions and environmentalconstraints)
• Integration of models and processes• Inclusion of additional models to
encompass boundary effects (e.g. landuse, climate change, policy decisions)
• Links policy levers with “stakeholder”responses, and thus environmentaleffects (e.g. aquifer salinisation)
• Ability to observe emergent change inresponse to selected policy levers(exploration of potential futures)
• Interpretation of the socio-naturaldynamics within the context of theoriginal “problem”
• Increased understanding of theconnectivity between policy instru-ments, stakeholder responses andenvironmental change
• Response is reactionary (e.g. digdeeper boreholes, change crop)
• Connection of (aquifer) denudationwith its causes is weak
• Response is reactionary (e.g. buildcanal, aquifer augmentation)
• Does not account for future climaticeffects (leaning on historical data), northe quality of external resources (e.g.canal water too saline)
• Models not integrated and processesnot interacting
• Simplification of the science• Gaps in boundary conditions
• Uncertainties in quantifiable predictiveabilities resulting from degree ofcomplexity
00125.p65 03/12/2003, 12:13 PM23
24 T. Oxley, M. Lemon & P. Jeffrey
a common factor (the indicator), thus over-riding many of the potential sourcesof conflict involved in communicating the meaning of the science to a policyaudience.
References
Bhaskar, R. (1997) A Realist Theory of Science, 2nd edn. Verso, LondonBlatsou, C. (1999) The development and use of decision trees for the Argolid Valley,
Greece. In eds. S.E. van der Leeuw & L. Garenne-Marot. Vol. 1, Part 7Conway, G. (1985) Agroecosystem analysis. Agricultural Administration, 20, 31–55Engelen, G., Winder, N., Oxley, T., Mazzoleni, S. & Mulligan, M. (2000) MODULUS:
A Spatial Modelling Tool for Integrated Environmental Decision Making. FinalReport, the Modulus Project. EU-DGXII Environment (IV) Framework, Climatology& Natural Hazards Programme, (Contract ENV4-CT97-0685)
Giannoulopoulos, P. (2000) Groundwater Flow and Mathematical Models in the plain ofArgos. PhD thesis, Agricultural University of Athens
Green, S. & Lemon, M. (1996) Perceptual Landscapes in Agrarian systems: Degradationprocesses in north-western Epirus and the Argolid Valley, Greece. Ecumene, 3(2),181–199
Hammond, K.R. (1978) Toward increasing competence of thought in public policy for-mation. In Judgement and Decision in Public Policy Formation, ed. K.R. Hammond.AAAS Selected Symposium, Westview Press, Colorado, pp. 11–32
Hadfield, L. (1997) Emergent Techno-Environmental Phenomena. PhD thesis, INTA/IERC, Cranfield University
Hadfield, L. & Seaton, R.A.F. (1999) A co-evolutionary model of change in environmen-tal management. Futures, 31, 577–592
Lemon, M., ed. (1999) Exploring Environmental Change Using an Integrative Method.Gordon and Breach, Amsterdam
Lemon, M. & Blatsou, C. (1999) Perceived Uncertainty and Farming: Establishing aFramework for Crop Choice. In Lemon (1999), Chapter 9
Lemon, M., Jeffrey, P. & Seaton, R. (1998) Deconstructing the orange: The evolution ofan agricultural milieu in southern Greece. Int. J. Sustainable Development, 1(1),9–23
Lemon, M., Seaton, R. & Park, J. (1994) Social enquiry and the measurement of naturalphenomena: The degradation of irrigation water in the Argolid Plain, Greece. Inter-national Journal of Sustainable Development and World Ecology, 2(3), 206–220
Levins, R. (1966) The strategy of model building in population biology. AmericanScientist, 54(4), 421–431
Mata, M. (1999) Bio-physical and socio-economic dynamics in the Marina Baixa. In eds.S.E. van der Leeuw & L. Garenne-Marot. 1999, Vol. 1, Part 4
Mata, M. & Lemon, M. (1998) The Marina Baixa (Alicante Province) Case Study,Chapter 11. In An Integrated Methodology for Projecting the Impact of Climate
00125.p65 03/12/2003, 12:13 PM24
Indicators of Socio-natural Change25
Change and Human Activity on Soil Erosion and Ecosystem Degradation in theMediterranean: A Climatological Gradient and Dynamic Systems Approach, ed.A.C. Imeson. The Ermes II Project EU-DGXII (ENV4-CT95-0181)
Meutzelfeldt, R. (2000) Evaluation of the MODULUS spatial modelling tool for environ-mental decision-making. Institute of Ecology and Resource Management, Universityof Edinburgh
Muetzelfeldt, R. & Taylor, J. (1998) The Agroforestry Modelling Environment. AgroforestryModelling and Research Co-ordination ODA Forestry Research ProgrammeR5652, Annual Report July 1996– June 1997
Oxley, T. (2000) The detection of catastrophic discontinuities in the acid-phosphorusrelationship: A complex systems model. Water, Air & Soil Pollution, 117(1/4),39–59
Oxley, T. & Allen, P. (2000) The dynamic inter-relationship between acid rain andeutrophication in the soil domain. Water, Air & Soil Pollution, 117(1/4), 371–400
Oxley, T., Allen, P. & Robinson, A. (1999) A Policy-Relevant Integrative ModellingFramework for examining socio-natural dynamics: An application to the MarinaBaixa, Spain and the Argolid Valley, Greece. In eds. S.E. van der Leeuw &L. Garenne-Marot. Vol. 1, Part 8
Oxley, T., Jeffrey, P. & Lemon, M. (2002) Policy relevant modelling: Relationships be-tween water, land use and farmer decision processes. Integrated Assessment, 3(1),30–49
Oxley, T. & Lemon, M. (2003) An integrative modelling framework: From social enquiryto policy-relevant decision support tools. Journal of Arid Environments (SpecialIssue), (in press)
Oxley, T., Winder, N., McIntosh, B., Mulligan, M. & Engelen, G. (2003) Integratedmodelling & decision support tools: A Mediterranean example. Environmental Mod-elling & Software (Special Issue), (in press)
Park, J. & Seaton, R.A.F. (1995) Integrative research and sustainable agriculture. Agri-cultural Systems, 50, 81–100
Poulovassilis, A. & Giannoulopoulos, P. (1999) Groundwater modelling in the plain ofArgos. Lab. of Agricultural Hydraulics, Agricultural University of Athens. In eds.S.E. van der Leeuw & L. Garenne-Marot. Vol. 6
Robinson, A.V. (1999) Integrated Systems Modelling of the interaction between WaterResources and Agriculture, PhD thesis, Cranfield University
Stigliani, W.M. (1988) Changes in valued “capacities” of soils and sediments as indicatorsof nonlinear and time-delayed environmental effects. Environmental Monitoring andAssessment, 10(88), 245–307
Stigliani, W.M. (1991) Chemical Time Bombs: Definition, Concepts and Examples.Executive Report 16, International Institute for Applied Systems Analysis,Laxenburg, Austria
Tilzey, M. (2002) Conservation and sustainability. In The Sustainability of Rural Systems,eds. I.R. Bowler, C.R. Bryant & C. Cocklin. Kluwer, Dordrecht
00125.p65 03/12/2003, 12:13 PM25

26 T. Oxley, M. Lemon & P. Jeffrey
ter Meulen, G.R.B., Stigliani, W.M., Salomons, W., Bridges, E.M. & Imeson, A.C., eds.(1992) Chemical Time Bombs. Proceedings of the European State-of-the-Art Con-ference on Delayed Effects of Chemicals in Soils and Sediments, Veldhoven, TheNetherlands, 2–5 September 1992. The Foundation for Ecodevelopment “StichtingMandiaal Alternetief ”, Hoofddorp, The Netherlands
van der Leeuw, S.E., ed. (1998) Understanding the natural and anthropogenic causes ofland degradation and desertification in the Mediterranean basin. The ArchaeomedesProject (Volume: Synthesis). Office for Official Publications of the European Com-munities, Luxembourg, ISBN 92-828-3226-0
van der Leeuw, S.E. & Garenne-Marot, L., eds. (1999) Policy-relevant models of thenatural and anthropogenic dynamics of degradation and desertification and theirspatio-temporal manifestations. Final Report, The Archaeomedes (II) Project forEU-DGXII (ENV4-CT95-0159)
Vickers, G. (1980) Some implications for systems thinking. In Systems Behaviour, 3rdedn. Edited by the Open Systems Group, reprinted from Vickers, G. “Responsibility— Its Sources and Limits”. Intersystems Publications, 1980
Vickers, G. (1983) Human Systems are Different. Harper & Row, LondonWilson, G. & Bryant, R. (1997) Environmental Management: New Directions for the
Twenty-first Century. UCL Press, LondonWinder, N. & van der Leeuw, S.E., eds. (1997) Environmental Perception and Policy
Making: Cultural and Natural Heritage and the preservation of Degradation-SensitiveEnvironments in Southern Europe. Vol. 1 (Perception, Policy and Unforeseen Con-sequences: An Interdisciplinary Synthesis), Final Report for EPPM Project EU-DGXII(EV5V-CT94-0486)
Winder, N., Jeffrey, P. & Lemon, M. (1998) Simulation of crop choice dynamics: Anapplication of nested Master-Equation models. Etudes et Recherches sur les SystemesAgraire et le Development, 31, 175–189
00125.p65 03/12/2003, 12:13 PM26